UNITED STATES
SECURITIES AND EXCHANGE COMMISSION
Washington, D.C. 20549
FORM N-CSR
CERTIFIED SHAREHOLDER REPORT OF REGISTERED
MANAGEMENT INVESTMENT COMPANIES
Investment Company Act file number 811-4008
Fidelity Investment Trust
(Exact name of registrant as specified in charter)
82 Devonshire St., Boston, Massachusetts 02109
(Address of principal executive offices) (Zip code)
Eric D. Roiter, Secretary
82 Devonshire St.
Boston, Massachusetts 02109
(Name and address of agent for service)
Registrant's telephone number, including area code: 617-563-7000
Date of fiscal year end: | October 31 |
Date of reporting period: | October 31, 2005 |
Item 1. Reports to Stockholders
| Fidelity’s Broadly Diversified International Equity Funds |
| Fidelity® Global Balanced Fund Fidelity Diversified International Fund Fidelity Aggressive International Fund Fidelity Overseas Fund Fidelity Worldwide Fund |
![]()
| Annual Report October 31, 2005 |

| Contents | ||||
| Shareholder Expense Example | A-4 | An example of shareholder expenses. | ||
| Global Balanced Fund | A-5 | Performance | ||
| A-6 | Management’s Discussion | |||
| A-7 | Investment Changes | |||
| A-8 | Investments | |||
| A-14 | Financial Statements | |||
| Diversified International Fund | A-16 | Performance | ||
| A-17 | Management’s Discussion | |||
| A-18 | Investment Changes | |||
| A-19 | Investments | |||
| A-26 | Financial Statements | |||
| Aggressive International Fund | A-28 | Performance | ||
| A-29 | Management’s Discussion | |||
| A-30 | Investment Changes | |||
| A-31 | Investments | |||
| A-33 | Financial Statements | |||
| Overseas Fund | A-35 | Performance | ||
| A-36 | Management’s Discussion | |||
| A-37 | Investment Changes | |||
| A-38 | Investments | |||
| A-41 | Financial Statements | |||
| Worldwide Fund | A-43 | Performance | ||
| A-44 | Management’s Discussion | |||
| A-45 | Investment Changes | |||
| A-46 | Investments | |||
| A-51 | Financial Statements | |||
| Notes to Financial Statements | A-53 | Notes to the Financial Statements | ||
| Reports of Independent Registered | A-58 | |||
| Public Accounting Firms | ||||
| Trustees and Officers | A-60 | |||
| Distributions | A-66 | |||
| Board Approval of Investment Advisory | A-67 | |||
| Contracts and Management Fees | ||||
| To view a fund’s proxy voting guidelines and proxy voting record for the 12 month period ended June 30, visit www.fidelity.com/proxyvotingresults or visit the Securities and Exchange Commission’s (SEC) web site at www.sec.gov. You may also call 1-800-544-8544 to request a free copy of the proxy voting guidelines. Standard & Poor’s, S&P and S&P 500 are registered service marks of The McGraw Hill Companies, Inc. and have been licensed for use by Fidelity Distributors Corporation. Other third party marks appearing herein are the property of their respective owners. All other marks appearing herein are registered or unregistered trademarks or service marks of FMR Corp. or an affiliated company. |
| Annual Report |
| A-2 |
| This report and the financial statements contained herein are submitted for the general information of the shareholders of the funds. This report is not authorized for distribution to prospective investors in the funds unless preceded or accompanied by an effective prospectus. A fund files its complete schedule of portfolio holdings with the SEC for the first and third quarters of each fiscal year on Form N Q. Forms N Q are available on the SEC’s web site at http://www.sec.gov. A fund’s Forms N Q may be reviewed and copied at the SEC’s Public Reference Room in Washington, DC. Infor mation regarding the operation of the SEC’s Public Reference Room may be obtained by calling 1-800-SEC-0330. For a complete list of a fund’s portfolio hold- ings, view the most recent quarterly holdings report, semiannual report, or annual report on Fidelity’s web site at http://www.fidelity.com/holdings. NOT FDIC INSURED · MAY LOSE VALUE · NO BANK GUARANTEE |
| Neither the funds nor Fidelity Distributors Corporation is a bank. |
| A-3 |
| Annual Report |
| Shareholder Expense Example |
As a shareholder of a Fund, you incur two types of costs: (1) transaction costs, including redemption fees, and (2) ongoing costs, including manage ment fees and other Fund expenses. This Example is intended to help you understand your ongoing costs (in dollars) of investing in the Funds and to compare these costs with the ongoing costs of investing in other mutual funds.
The Example is based on an investment of $1,000 invested at the beginning of the period and held for the entire period (May 1, 2005 to October 31, 2005).
| Actual Expenses |
The first line of the table below for each fund provides information about actual account values and actual expenses. You may use the information in this line, together with the amount you invested, to estimate the expenses that you paid over the period. Simply divide your account value by $1,000.00 (for example, an $8,600 account value divided by $1,000.00 = 8.6), then multiply the result by the number in the first line for a fund under the heading entitled “Expenses Paid During Period” to estimate the expenses you paid on your account during this period. A small balance maintenance fee of $12.00 that is charged once a year may apply for certain accounts with a value of less than $2,000. This fee is not included in the table below. If it was, the estimate of expenses you paid during the period would be higher, and your ending account value lower, by this amount.
| Hypothetical Example for Comparison Purposes |
The second line of the table below for each fund provides information about hypothetical account values and hypothetical expenses based on a fund’s actual expense ratio and an assumed rate of return of 5% per year before expenses, which is not the Fund’s actual return. The hypothetical account values and expenses may not be used to estimate the actual ending account balance or expenses you paid for the period. You may use this information to compare the ongoing costs of investing in the Fund and other funds. To do so, compare this 5% hypothetical example with the 5% hypothetical examples that appear in the shareholder reports of the other funds. A small balance maintenance fee of $12.00 that is charged once a year may apply for certain accounts with a value of less than $2,000. This fee is not included in the table below. If it was, the estimate of expenses you paid during the period would be higher, and your ending account value lower, by this amount.
Please note that the expenses shown in the table are meant to highlight your ongoing costs only and do not reflect any transaction costs. Therefore, the second line of the table is useful in comparing ongoing costs only, and will not help you determine the relative total costs of owning different funds. In addition, if these transactional costs were included, your costs would have been higher.
| Expenses Paid | ||||||||||||
| Beginning | Ending | During Period* | ||||||||||
| Account Value | Account Value | May 1, 2005 | ||||||||||
| May 1, 2005 | October 31, 2005 | to October 31, 2005 | ||||||||||
| Global Balanced | ||||||||||||
| Actual | $ | 1,000.00 | $ | 1,063.50 | $ | 5.93 | ||||||
| HypotheticalA | $ | 1,000.00 | $ | 1,019.46 | $ | 5.80 | ||||||
| Diversified International | ||||||||||||
| Actual | $ | 1,000.00 | $ | 1,096.10 | $ | 5.81 | ||||||
| HypotheticalA | $ | 1,000.00 | $ | 1,019.66 | $ | 5.60 | ||||||
| Aggressive International | ||||||||||||
| Actual | $ | 1,000.00 | $ | 1,077.70 | $ | 5.03 | ||||||
| HypotheticalA | $ | 1,000.00 | $ | 1,020.37 | $ | 4.89 | ||||||
| Overseas | ||||||||||||
| Actual | $ | 1,000.00 | $ | 1,119.50 | $ | 4.97 | ||||||
| HypotheticalA | $ | 1,000.00 | $ | 1,020.52 | $ | 4.74 | ||||||
| Worldwide | ||||||||||||
| Actual | $ | 1,000.00 | $ | 1,098.60 | $ | 5.55 | ||||||
| HypotheticalA | $ | 1,000.00 | $ | 1,019.91 | $ | 5.35 | ||||||
| A 5% return per year before expenses | ||||||||||||
* Expenses are equal to each Fund’s annualized expense ratio (shown in the table below); multiplied by the average account value over the period, multiplied by 184/365 (to reflect the one half year period).
| Annualized | ||
| Expense Ratio | ||
| Global Balanced | 1.14% | |
| Diversified International | 1.10% | |
| Aggressive International | 96% | |
| Overseas | 93% | |
| Worldwide | 1.05% |
| Annual Report |
| A-4 |
| Global Balanced |
| Performance: The Bottom Line |
Average annual total return reflects the change in the value of an investment, assuming reinvestment of the fund’s dividend income and capital gains (the profits earned upon the sale of securities that have grown in value) and assuming a constant rate of performance each year. The $10,000 table and the fund’s returns do not reflect the deduction of taxes that a shareholder would pay on fund distributions or the redemption of fund shares. During periods of reimbursement by Fidelity a fund’s total returns will be greater than it would be had the reimbursement not occurred. How a fund did yesterday is no guarantee of how it will do tomorrow.
| Average Annual Total Returns | ||||||
| Periods ended | Past 1 | Past 5 | Past 10 | |||
| October 31, 2005 | year | years | years | |||
| Fidelity® Global Balanced Fund | 13.92% | 5.77% | 8.63% | |||
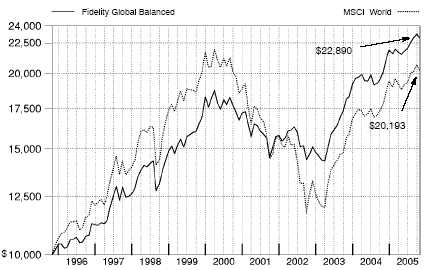
| $10,000 Over 10 Years | ||||||
Let’s say hypothetically that $10,000 was invested in Fidelity® Global Balanced Fund on October 31, 1995. The chart shows how the value of your investment would have changed, and also shows how the Morgan Stanley Capital International World Index performed over the same period.
| A-5 |
| Annual Report |
| Global Balanced |
Management’s Discussion of Fund Performance
Comments from Richard Mace, Portfolio Manager of Fidelity® Global Balanced Fund
Foreign stock markets enjoyed broad based advances during the 12 month period that ended October 31, 2005, encouraged by better than expected corporate earnings and markedly improved economies. For the 12 months overall, the Morgan Stanley Capital InternationalSM Europe, Australasia, Far East (MSCI® EAFE®) Index a performance measure of developed stock markets outside the United States and Canada gained 18.28% . The Japanese stock market climbed to its highest level in more than four years. Positive economic indicators and Prime Minister Koizumi’s decisive election victory attracted record inflows from overseas investors. In response, the Tokyo Stock Exchange Stock Price Index (TOPIX) soared 22.89% . Southeast Asian equities outside of Japan, particularly South Korea, also responded well to the better macroeconomic environment, illustrated by the 19.44% return for the MSCI All Country Far East ex Japan index. European stock markets were up as well, despite investors’ concern about higher energy prices and potential downgrades to economic growth in the region. For the year overall, the MSCI Europe index rose 16.51% . Although robust, returns for U.S. investors in foreign markets were tempered somewhat by the strength of the dollar versus many major currencies.
Fidelity Global Balanced Fund gained 13.92% for the 12 months ending October 31, 2005, while the Fidelity Global Balanced Composite Index a 60%/40% blend of the MSCI World index and the Citigroup® World Government Bond Index returned 7.12% and the LipperSM Global Flexible Portfolio Funds Average rose 11.20% . The robust performance of the portfolio’s equity component led by its U.S. holdings was the biggest contrib uting factor in the fund’s outperformance of its benchmark. With an average of nearly 65% of the fund’s assets in equities, this overweighting relative to the composite index helped strengthen returns for the period. Astute stock selection in the telecommunication services, energy, financials and consumer discretionary sectors boosted performance, with such names as U.K. broadband and media company Telewest Global, Canadian energy producer EnCana and U.S. refiner Valero Energy all contributing nicely. Google, the U.S. Internet search firm, also did well. Conversely, an out of index position in Symantec, the U.S. maker of security software, and an overweighting in eBay, the U.S. online auctions firm, detracted. Performance also was held back by the generally poor showing of the fund’s bond subportfolio, which lost ground as short term interest rates in many areas of the world increased. Some of the stocks mentioned here were no longer held at period end.
Note to shareholders:
Effective January 1, 2006, Derek Young has been named interim Lead Portfolio Manager of Fidelity Global Balanced Fund while the fund’s Portfolio Manager, Richard Mace, is on a leave of absence from the firm.
The views expressed in this statement reflect those of the portfolio manager only through the end of the period of the report as stated on the cover and do not necessarily represent the views of Fidelity or any other person in the Fidelity organization. Any such views are subject to change at any time based upon market or other conditions and Fidelity disclaims any responsibility to update such views. These views may not be relied on as invest ment advice and, because investment decisions for a Fidelity fund are based on numerous factors, may not be relied on as an indication of trading intent on behalf of any Fidelity fund.
| Annual Report |
| A-6 |
| Global Balanced Investment Changes |
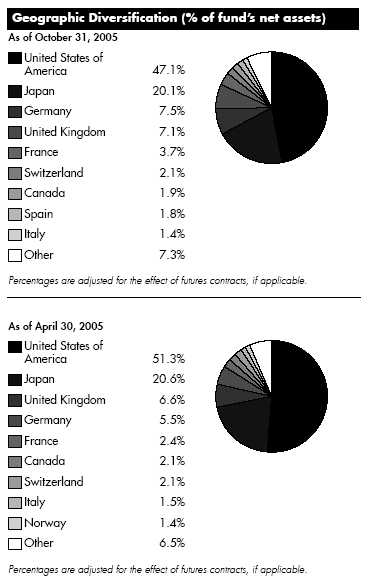
| Asset Allocation | ||||
| % of fund’s | % of fund’s net assets | |||
| net assets | 6 months ago | |||
| Stocks and Equity Futures | 64.5 | 61.9 | ||
| Bonds | 23.3 | 20.9 | ||
| Short Term Investments and Net | ||||
| Other Assets | 12.2 | 17.2 |
| Top Five Stocks as of October 31, 2005 | ||||
| % of fund’s | % of fund’s net assets | |||
| net assets | 6 months ago | |||
| General Electric Co. (United States | ||||
| of America) | 1.1 | 1.2 | ||
| Talisman Energy, Inc. (Canada) | 1.1 | 0.8 | ||
| Intel Corp. (United States of | ||||
| America) | 0.9 | 1.0 | ||
| Exxon Mobil Corp. (United States | ||||
| of America) | 0.9 | 0.9 | ||
| Google, Inc. Class A (sub. vtg.) | ||||
| (United States of America) | 0.8 | 0.5 | ||
| 4.8 | ||||
| Top Five Bond Issuers as of October 31, 2005 | ||||
| (with maturities greater than one | % of fund’s | % of fund’s net assets | ||
| year) | net assets | 6 months ago | ||
| Japan Government | 9.5 | 3.4 | ||
| U.S. Treasury Obligations | 6.1 | 4.5 | ||
| French Government | 1.5 | 0.0 | ||
| Spanish Kingdom | 1.0 | 0.0 | ||
| Kingdom of Norway | 0.7 | 0.8 | ||
| 18.8 | ||||
| Market Sectors as of October 31, 2005 | ||||
| % of fund’s | % of fund’s net assets | |||
| net assets | 6 months ago | |||
| Financials | 12.8 | 10.1 | ||
| Consumer Discretionary | 8.7 | 9.9 | ||
| Information Technology | 7.4 | 7.1 | ||
| Energy | 7.4 | 6.7 | ||
| Health Care | 6.3 | 6.2 | ||
| Consumer Staples | 6.2 | 6.6 | ||
| Industrials | 5.7 | 5.8 | ||
| Materials | 2.4 | 2.5 | ||
| Telecommunication Services | 1.6 | 5.7 | ||
| Utilities | 1.3 | 1.3 | ||
A-7 Annual Report
| Global Balanced Investments October 31, 2005 Showing Percentage of Net Assets |
| Common Stocks 59.8% | ||||||||
| Shares | Value (Note 1) | |||||||
| Australia 0.4% | ||||||||
| BHP Billiton Ltd. | 17,134 | $ | 266,005 | |||||
| Downer EDI Ltd. | 44,202 | 200,956 | ||||||
| Macquarie Airports unit | 89,479 | 200,724 | ||||||
| Vision Group Holdings Ltd. | 51,200 | 172,282 | ||||||
| TOTAL AUSTRALIA | 839,967 | |||||||
| Austria 0.1% | ||||||||
| Oesterreichische Elektrizitaetswirtschafts | ||||||||
| AG (Verbund) | 300 | 95,660 | ||||||
| OMV AG | 2,000 | 107,888 | ||||||
| TOTAL AUSTRIA | 203,548 | |||||||
| Belgium – 0.1% | ||||||||
| InBev SA | 3,700 | 147,920 | ||||||
| Umicore SA | 1,100 | 110,105 | ||||||
| TOTAL BELGIUM | 258,025 | |||||||
| Bermuda 0.4% | ||||||||
| ACE Ltd. | 6,000 | 312,600 | ||||||
| Aspen Insurance Holdings Ltd. | 13,300 | 321,727 | ||||||
| Endurance Specialty Holdings Ltd. | 6,600 | 218,856 | ||||||
| TOTAL BERMUDA | 853,183 | |||||||
| Brazil 0.0% | ||||||||
| Uniao de Bancos Brasileiros SA | ||||||||
| (Unibanco) GDR | 1,650 | 86,295 | ||||||
| Canada 1.9% | ||||||||
| Alcan, Inc. | 700 | 22,055 | ||||||
| EnCana Corp. | 32,600 | 1,490,601 | ||||||
| Newmont Mining Corp. of Canada Ltd. | ||||||||
| (exchangeable shares) | 400 | 17,101 | ||||||
| Novelis, Inc. | 140 | 2,742 | ||||||
| Talisman Energy, Inc. | 47,010 | 2,082,213 | ||||||
| TOTAL CANADA | 3,614,712 | |||||||
| Denmark – 0.3% | ||||||||
| East Asiatic Co. Ltd. | 600 | 45,392 | ||||||
| GN Store Nordic AS | 9,300 | 112,035 | ||||||
| Novo Nordisk AS Series B | 1,350 | 69,172 | ||||||
| Novozymes AS Series B | 2,100 | 109,794 | ||||||
| Sondagsavisen AS (Reg.) (a) | 10,900 | 100,671 | ||||||
| Vestas Wind Systems AS (a) | 7,500 | 162,330 | ||||||
| TOTAL DENMARK | 599,394 | |||||||
| Egypt 0.0% | ||||||||
| Orascom Telecom SAE GDR | 1,800 | 88,290 | ||||||
| Finland – 0.3% | ||||||||
| Neste Oil Oyj | 3,875 | 120,077 | ||||||
| Nokia Corp. sponsored ADR | 24,200 | 407,044 | ||||||
| TOTAL FINLAND | 527,121 | |||||||
| France – 2.2% | ||||||||
| Accor SA | 3,500 | 174,790 | ||||||
| Shares | Value (Note 1) | |||||
| Alstom SA (a) | 2,900 | $ | 139,020 | |||
| BNP Paribas SA | 2,700 | 204,717 | ||||
| Boursorama (a) | 12,300 | 101,001 | ||||
| Carrefour SA | 4,600 | 204,579 | ||||
| CNP Assurances | 1,900 | 132,216 | ||||
| Compagnie Generale de Geophysique | ||||||
| SA (a) | 700 | 61,046 | ||||
| Credit Agricole SA | 4,700 | 137,754 | ||||
| Financiere Marc de Lacharriere SA | ||||||
| (Fimalac) | 2,100 | 114,037 | ||||
| France Telecom SA | 2,100 | 54,579 | ||||
| Gaz de France | 1,500 | 46,122 | ||||
| Groupe Danone | 300 | 30,604 | ||||
| Ipsos SA | 500 | 59,338 | ||||
| L’Air Liquide SA | 1,200 | 218,220 | ||||
| L’Oreal SA | 2,100 | 154,441 | ||||
| Lagardere S.C.A. (Reg.) | 1,500 | 103,122 | ||||
| Laurent Perrier Group | 1,000 | 52,685 | ||||
| Louis Vuitton Moet Hennessy (LVMH) | 1,100 | 89,073 | ||||
| Nexity | 1,800 | 82,189 | ||||
| Orpea (a) | 3,334 | 179,848 | ||||
| Pernod Ricard SA | 865 | 151,286 | ||||
| Safran SA | 4,700 | 93,526 | ||||
| Sanofi Aventis | 6,000 | 481,440 | ||||
| Silicon On Insulator Technologies SA | ||||||
| (SOITEC) (a) | 6,300 | 94,326 | ||||
| Total SA Series B | 3,051 | 768,974 | ||||
| Vallourec SA | 200 | 89,906 | ||||
| Vivendi Universal SA sponsored ADR | 8,200 | 257,644 | ||||
| TOTAL FRANCE | 4,276,483 | |||||
| Germany 2.1% | ||||||
| Adidas Salomon AG | 770 | 129,216 | ||||
| Allianz AG: | ||||||
| (Reg.) | 600 | 84,840 | ||||
| sponsored ADR | 13,600 | 192,304 | ||||
| BASF AG | 3,200 | 230,400 | ||||
| Bayer AG | 5,400 | 187,920 | ||||
| Bijou Brigitte Modische Accessoires AG . | 300 | 62,395 | ||||
| DAB Bank AG | 11,500 | 86,712 | ||||
| DaimlerChrysler AG (Reg.) | 5,400 | 270,270 | ||||
| Deutsche Bank AG (NY Shares) | 800 | 74,880 | ||||
| Deutsche Post AG | 7,400 | 164,996 | ||||
| Deutsche Telekom AG (Reg.) | 7,800 | 138,060 | ||||
| E.ON AG | 4,500 | 407,835 | ||||
| ESCADA AG (a) | 15,200 | 386,285 | ||||
| GFK AG | 2,100 | 69,605 | ||||
| Heidelberger Druckmaschinen AG | 3,900 | 123,891 | ||||
| Hugo Boss AG | 3,700 | 125,965 | ||||
| Hypo Real Estate Holding AG | 2,600 | 125,730 | ||||
| Infineon Technologies AG (a) | 7,600 | 70,984 | ||||
| IWKA AG | 2,900 | 64,313 | ||||
| Metro AG | 2,400 | 109,153 | ||||
| MPC Muenchmeyer Petersen Capital AG | 2,200 | 155,598 | ||||
See accompanying notes which are an integral part of the financial statements.
Annual Report A-8
| Common Stocks continued | ||||||
| Shares | Value (Note 1) | |||||
| Germany – continued | ||||||
| SAP AG sponsored ADR | 7,600 | $ | 326,344 | |||
| SGL Carbon AG (a) | 6,700 | 98,066 | ||||
| Siemens AG (Reg.) | 1,900 | 141,398 | ||||
| Software AG (Bearer) | 1,000 | 45,409 | ||||
| United Internet AG | 2,200 | 71,074 | ||||
| TOTAL GERMANY | 3,943,643 | |||||
| Greece 0.1% | ||||||
| Greek Organization of Football | ||||||
| Prognostics SA | 5,450 | 157,319 | ||||
| Jumbo SA (a) | 6,100 | 66,543 | ||||
| TOTAL GREECE | 223,862 | |||||
| Hong Kong – 0.3% | ||||||
| Cheung Kong Holdings Ltd. | 20,000 | 208,073 | ||||
| China Mobile (Hong Kong) Ltd. | 25,500 | 114,495 | ||||
| Esprit Holdings Ltd. | 17,000 | 119,845 | ||||
| Hong Kong & China Gas Co. Ltd. | 91,000 | 187,820 | ||||
| TOTAL HONG KONG | 630,233 | |||||
| India 0.2% | ||||||
| Crompton Greaves Ltd. | 14,309 | 195,380 | ||||
| State Bank of India | 9,096 | 188,624 | ||||
| TOTAL INDIA | 384,004 | |||||
| Ireland 0.5% | ||||||
| Allied Irish Banks PLC | 11,800 | 248,154 | ||||
| C&C Group PLC | 35,100 | 216,692 | ||||
| DEPFA BANK PLC | 7,100 | 110,645 | ||||
| IAWS Group PLC (Ireland) | 9,300 | 128,206 | ||||
| Irish Life & Permanent PLC | 8,100 | 142,735 | ||||
| Paddy Power PLC (Ireland) | 10,836 | 183,154 | ||||
| TOTAL IRELAND | 1,029,586 | |||||
| Israel 0.3% | ||||||
| Bank Hapoalim BM (Reg.) | 31,400 | 120,266 | ||||
| Nice Systems Ltd. sponsored ADR (a) | 1,200 | 52,404 | ||||
| Teva Pharmaceutical Industries Ltd. | ||||||
| sponsored ADR | 10,700 | 407,884 | ||||
| TOTAL ISRAEL | 580,554 | |||||
| Italy 0.8% | ||||||
| Amplifon Spa | 1,900 | 123,584 | ||||
| Azimut Holdings Spa | 17,500 | 126,246 | ||||
| Banca Intesa Spa | 33,100 | 154,469 | ||||
| Banca Popolare di Milano | 9,900 | 94,348 | ||||
| Banche Popolari Unite S.c.a.r.l. | 7,200 | 152,423 | ||||
| ENI Spa | 3,500 | 93,625 | ||||
| ENI Spa sponsored ADR | 2,500 | 334,375 | ||||
| Geox Spa | 7,800 | 74,091 | ||||
| Telecom Italia Spa | 27,700 | 80,125 | ||||
| Unicredito Italiano Spa | 54,900 | 306,549 | ||||
| TOTAL ITALY | 1,539,835 | |||||
| Shares | Value (Note 1) | |||||
| Japan 10.6% | ||||||
| Aeon Co. Ltd. | 17,100 | $ | 355,413 | |||
| Aioi Insurance Co. Ltd. | 16,000 | 114,037 | ||||
| Astellas Pharma, Inc. | 12,500 | 449,246 | ||||
| Create SD Co. Ltd. | 2,200 | 79,639 | ||||
| Daifuku Co. Ltd. | 11,000 | 145,084 | ||||
| Daimei Telecom Engineering Corp. (a) | 16,000 | 162,118 | ||||
| Daiwa House Industry Co. Ltd. | 8,000 | 107,663 | ||||
| Diamond Lease Co. Ltd. | 19,500 | 910,227 | ||||
| East Japan Railway Co | 58 | 346,580 | ||||
| Fanuc Ltd. | 2,300 | 181,257 | ||||
| First Juken Co. Ltd. | 7,800 | 76,128 | ||||
| Fujitsu Ltd. | 60,000 | 396,982 | ||||
| Fuyo General Lease Co. Ltd. | 5,200 | 196,794 | ||||
| Hirose Electric Co. Ltd. | 1,100 | 126,031 | ||||
| Honda Motor Co. Ltd. | 8,700 | 483,894 | ||||
| Itochushokuhin Co. Ltd. | 9,300 | 317,326 | ||||
| Japan Retail Fund Investment Corp | 14 | 102,086 | ||||
| Japan Tobacco, Inc | 20 | 318,694 | ||||
| JSR Corp. | 7,000 | 165,799 | ||||
| Juroku Bank Ltd. | 40,000 | 333,936 | ||||
| Kamigumi Co. Ltd. | 17,000 | 140,598 | ||||
| Kaneka Corp. | 10,000 | 124,187 | ||||
| KOEI Co. Ltd. (e) | 3,900 | 118,211 | ||||
| Kose Corp. | 1,600 | 58,058 | ||||
| Kuraray Co. Ltd. | 14,500 | 138,506 | ||||
| Kuraya Sanseido, Inc. | 7,600 | 118,339 | ||||
| Kurita Water Industries Ltd. | 5,100 | 85,772 | ||||
| Kyushu Shinwa Holdings, Inc. (a) | 190,000 | 519,956 | ||||
| Mars Engineering Corp. | 2,300 | 70,909 | ||||
| Matsushita Electric Industrial Co. Ltd. | 24,000 | 441,600 | ||||
| Matsuzakaya Co. Ltd. | 17,000 | 124,992 | ||||
| Mercian Corp. | 49,000 | 159,979 | ||||
| Millea Holdings, Inc. | 5 | 90,970 | ||||
| Mitsui & Co. Ltd. | 37,000 | 455,966 | ||||
| Mitsui Fudosan Co. Ltd. | 26,000 | 426,686 | ||||
| Mizuho Financial Group, Inc. | 161 | 1,076,389 | ||||
| Murata Manufacturing Co. Ltd. | 5,000 | 249,846 | ||||
| Nikko Cordial Corp. | 28,000 | 339,478 | ||||
| Nippon Oil Corp. | 115,000 | 978,988 | ||||
| Nippon Steel Corp. | 143,000 | 511,461 | ||||
| NOK Corp. | 8,100 | 244,814 | ||||
| NTT DoCoMo, Inc. | 158 | 273,340 | ||||
| Omron Corp. | 10,300 | 243,961 | ||||
| Parco Co. Ltd. | 13,000 | 126,880 | ||||
| Ricoh Co. Ltd. | 17,000 | 270,743 | ||||
| Sanken Electric Co. Ltd. | 9,000 | 104,052 | ||||
| Sega Sammy Holdings, Inc. | 7,200 | 259,389 | ||||
| Sega Sammy Holdings, Inc. New | 5,900 | 214,088 | ||||
| Shinagawa Refractories Co. Ltd. | 24,000 | 91,451 | ||||
| Sho Bond Corp. | 16,100 | 167,593 | ||||
| Softbank Corp. | 2,100 | 119,121 | ||||
| Sony Corp. | 3,300 | 108,240 | ||||
See accompanying notes which are an integral part of the financial statements.
A-9 Annual Report
| Global Balanced Investments - continued |
| Common Stocks continued | ||||||
| Shares | Value (Note 1) | |||||
| Japan continued | ||||||
| Stanley Electric Co. Ltd. | 32,300 | $ | 498,747 | |||
| Sumitomo Corp. | 37,000 | 413,350 | ||||
| Sumitomo Electric Industries Ltd. | 21,000 | 276,796 | ||||
| Sumitomo Mitsui Financial Group, Inc. . | 72 | 667,179 | ||||
| T&D Holdings, Inc. | 11,550 | 729,182 | ||||
| Takara Holdings, Inc. | 32,000 | 189,831 | ||||
| Takeda Pharamaceutical Co. Ltd. | 6,600 | 363,519 | ||||
| Takefuji Corp. | 5,900 | 414,380 | ||||
| The Sumitomo Warehouse Co. Ltd. (e) | 15,000 | 116,652 | ||||
| Toc Co. Ltd. | 26,000 | 150,860 | ||||
| Tokyo Electric Power Co. | 32,600 | 814,497 | ||||
| Tokyo Tatemono Co. Ltd. | 14,000 | 116,393 | ||||
| Tokyo Tomin Bank Ltd. | 1,900 | 69,931 | ||||
| TonenGeneral Sekiyu KK | 3,000 | 33,619 | ||||
| Toray Industries, Inc. | 22,000 | 122,697 | ||||
| Toyota Motor Corp. | 27,900 | 1,294,699 | ||||
| Trend Micro, Inc. | 2,500 | 78,158 | ||||
| Yokogawa Electric Corp. | 9,000 | 132,890 | ||||
| TOTAL JAPAN | 20,306,877 | |||||
| Korea (South) – 0.5% | ||||||
| Hyundai Engineering & Construction Co. | ||||||
| Ltd. (a) | 2,920 | 90,761 | ||||
| Industrial Bank of Korea | 17,510 | 207,973 | ||||
| Kookmin Bank | 3,650 | 200,330 | ||||
| S Oil Corp. | 2,490 | 186,273 | ||||
| Samsung Engineering Co. Ltd. | 9,070 | 199,818 | ||||
| TOTAL KOREA (SOUTH) | 885,155 | |||||
| Luxembourg 0.1% | ||||||
| SES Global unit | 6,600 | 103,248 | ||||
| Malaysia 0.1% | ||||||
| Commerce Asset Holding BHD | 91,100 | 132,728 | ||||
| Netherlands – 0.7% | ||||||
| ABN AMRO Holding NV | 3,700 | 87,838 | ||||
| ASML Holding NV (NY Shares) (a) | 6,300 | 106,974 | ||||
| DSM NV | 2,800 | 100,527 | ||||
| EADS NV | 5,400 | 187,077 | ||||
| ING Groep NV (Certificaten Van | ||||||
| Aandelen) | 5,400 | 155,844 | ||||
| Koninklijke KPN NV | 4,000 | 38,072 | ||||
| Koninklijke Numico NV (a) | 3,370 | 136,464 | ||||
| Koninklijke Philips Electronics NV | 3,200 | 83,712 | ||||
| OPG Groep NV (A Shares)(Certificaten | ||||||
| Van Aandelen) unit | 1,000 | 69,887 | ||||
| STMicroelectronics NV | 1,900 | 31,293 | ||||
| Trader Classified Media NV (A Shares) . | 3,100 | 47,678 | ||||
| Unilever NV (Certificaten Van Aandelen) | 1,800 | 126,660 | ||||
| VNU NV | 5,500 | 174,916 | ||||
| TOTAL NETHERLANDS | 1,346,942 | |||||
| Netherlands Antilles – 0.6% | ||||||
| Schlumberger Ltd. (NY Shares) | 11,700 | 1,062,009 | ||||
| Shares | Value (Note 1) | |||||
| Norway 0.5% | ||||||
| DnB NOR ASA | 20,400 | $ | 208,515 | |||
| Fred Olsen Energy ASA (a) | 2,400 | 66,216 | ||||
| Norsk Hydro ASA sponsored ADR | 1,300 | 128,856 | ||||
| Schibsted ASA (B Shares) | 2,500 | 72,049 | ||||
| Statoil ASA | 1,500 | 33,546 | ||||
| TANDBERG Television ASA (a) | 14,200 | 176,791 | ||||
| Telenor ASA | 12,300 | 120,051 | ||||
| Yara International ASA | 7,300 | 120,339 | ||||
| TOTAL NORWAY | 926,363 | |||||
| Panama – 0.2% | ||||||
| Carnival Corp. unit | 7,100 | 352,657 | ||||
| Papua New Guinea 0.1% | ||||||
| Oil Search Ltd. | 83,600 | 206,289 | ||||
| Poland – 0.1% | ||||||
| Polski Koncern Naftowy Orlen SA | 5,100 | 90,549 | ||||
| Powszechna Kasa Oszczednosci Bank | ||||||
| SA | 7,300 | 61,383 | ||||
| TVN SA | 3,383 | 57,711 | ||||
| TOTAL POLAND | 209,643 | |||||
| Portugal 0.1% | ||||||
| Media Capital SGPS SA (a) | 17,400 | 139,750 | ||||
| South Africa – 0.1% | ||||||
| Edgars Consolidated Stores Ltd. | 13,800 | 61,288 | ||||
| Nedbank Group Ltd | 9,100 | 115,954 | ||||
| TOTAL SOUTH AFRICA | 177,242 | |||||
| Spain 0.8% | ||||||
| Antena 3 Television SA | 9,200 | 178,882 | ||||
| Banco Bilbao Vizcaya Argentaria SA | 15,800 | 278,554 | ||||
| Banco Espanol de Credito SA (Reg.) | 8,000 | 117,669 | ||||
| Banco Pastor SA (Reg.) | 3,700 | 158,299 | ||||
| Banco Santander Central Hispano SA | 27,800 | 352,782 | ||||
| Gestevision Telecinco SA | 2,800 | 62,129 | ||||
| Telefonica SA sponsored ADR | 8,740 | 419,083 | ||||
| TOTAL SPAIN | 1,567,398 | |||||
| Sweden 0.3% | ||||||
| Eniro AB | 10,200 | 111,461 | ||||
| Gambro AB (A Shares) | 8,900 | 125,761 | ||||
| Kungsleden AB | 3,300 | 86,422 | ||||
| Modern Times Group AB (MTG) | ||||||
| (B Shares) (a) | 2,100 | 80,317 | ||||
| Telefonaktiebolaget LM Ericsson | ||||||
| (B Shares) sponsored ADR | 6,100 | 200,141 | ||||
| TOTAL SWEDEN | 604,102 | |||||
| Switzerland 2.1% | ||||||
| Alcon, Inc. | 3,100 | 411,990 | ||||
| Clariant AG (Reg.) | 5,400 | 72,047 | ||||
| Compagnie Financiere Richemont unit | 7,640 | 290,689 | ||||
| Credit Suisse Group sponsored ADR | 7,800 | 345,618 | ||||
See accompanying notes which are an integral part of the financial statements.
Annual Report A-10
| Common Stocks continued | ||||||
| Shares | Value (Note 1) | |||||
| Switzerland – continued | ||||||
| Nestle SA (Reg.) | 1,827 | $ | 544,210 | |||
| Nobel Biocare Holding AG (Switzerland) | 660 | 152,182 | ||||
| Novartis AG (Reg.) | 13,120 | 706,118 | ||||
| Phonak Holding AG | 3,523 | 146,888 | ||||
| Roche Holding AG (participation | ||||||
| certificate) | 4,170 | 623,001 | ||||
| Societe Generale de Surveillance Holding | ||||||
| SA (SGS) (Reg.) | 243 | 179,071 | ||||
| Syngenta AG (Switzerland) | 1,100 | 117,923 | ||||
| UBS AG (NY Shares) | 4,700 | 402,649 | ||||
| TOTAL SWITZERLAND | 3,992,386 | |||||
| Taiwan 0.2% | ||||||
| Far EasTone Telecommunications Co. Ltd. | 188,000 | 218,530 | ||||
| Holtek Semiconductor, Inc. | 102,000 | 120,388 | ||||
| TOTAL TAIWAN | 338,918 | |||||
| United Kingdom – 6.5% | ||||||
| Anglo American PLC (United Kingdom) . | 5,400 | 159,659 | ||||
| ARM Holdings PLC | 16,000 | 30,806 | ||||
| AstraZeneca PLC: | ||||||
| (United Kingdom) | 8,100 | 363,690 | ||||
| sponsored ADR | 1,600 | 71,840 | ||||
| BAE Systems PLC | 41,310 | 241,719 | ||||
| Barclays PLC | 23,500 | 232,767 | ||||
| Benfield Group PLC | 9,900 | 56,088 | ||||
| BG Group PLC | 23,700 | 208,120 | ||||
| Big Yellow Group PLC | 16,400 | 69,685 | ||||
| Body Shop International PLC | 37,000 | 137,564 | ||||
| BP PLC sponsored ADR | 18,300 | 1,215,120 | ||||
| Brambles Industries PLC | 16,800 | 97,113 | ||||
| British Land Co. PLC | 11,700 | 184,357 | ||||
| BT Group PLC sponsored ADR | 5,000 | 189,050 | ||||
| Cadbury Schweppes PLC | 17,300 | 170,296 | ||||
| Caffe Nero Group PLC (a) | 55,700 | 246,042 | ||||
| Coffeeheaven International PLC (a) | 2,051,700 | 45,769 | ||||
| Corin Group PLC | 19,802 | 116,482 | ||||
| Diageo PLC | 19,200 | 285,264 | ||||
| Dicom Group PLC | 2,900 | 43,231 | ||||
| Easynet Group PLC (a) | 42,500 | 129,420 | ||||
| Eircom Group PLC | 33,000 | 79,118 | ||||
| EMI Group PLC | 18,400 | 69,713 | ||||
| Flomerics Group PLC | 35,700 | 50,564 | ||||
| Gallaher Group PLC | 6,200 | 96,131 | ||||
| GCAP Media PLC | 16,081 | 96,800 | ||||
| GlaxoSmithKline PLC | 29,500 | 766,853 | ||||
| Gyrus Group PLC (a) | 12,700 | 71,839 | ||||
| HBOS PLC | 8,900 | 131,492 | ||||
| Hilton Group PLC | 26,000 | 156,163 | ||||
| HSBC Holdings PLC (United Kingdom) | ||||||
| (Reg.) | 58,679 | 924,311 | ||||
| Informa PLC | 9,900 | 65,597 | ||||
| Intec Telecom Systems PLC (a) | 42,600 | 41,105 | ||||
| Shares | Value (Note 1) | |||||
| Intertek Group PLC | 3,600 | $ | 45,412 | |||
| Inventive Leisure PLC | 47,700 | 135,121 | ||||
| ITE Group PLC | 29,321 | 58,660 | ||||
| ITV PLC | 47,700 | 87,828 | ||||
| Jardine Lloyd Thompson Group PLC | 21,400 | 180,724 | ||||
| Lloyds TSB Group PLC | 15,400 | 125,964 | ||||
| M&C Saatchi | 37,600 | 71,894 | ||||
| Man Group PLC | 3,800 | 103,607 | ||||
| Mothercare PLC | 23,300 | 130,767 | ||||
| Pipex Communications PLC (a) | 199,500 | 32,671 | ||||
| Prudential PLC | 20,900 | 175,391 | ||||
| Reckitt Benckiser PLC | 4,639 | 140,198 | ||||
| Reed Elsevier PLC | 10,700 | 97,750 | ||||
| Reuters Group PLC | 37,200 | 236,605 | ||||
| Rio Tinto PLC (Reg.) | 6,200 | 236,561 | ||||
| Royal Bank of Scotland Group PLC | 12,972 | 359,193 | ||||
| Royal Dutch Shell PLC: | ||||||
| Class A sponsored ADR | 7,800 | 483,912 | ||||
| Class A (Netherlands) | 3,000 | 93,060 | ||||
| Class B | 14,231 | 465,425 | ||||
| SABMiller PLC | 8,500 | 160,420 | ||||
| Sportingbet PLC | 15,100 | 78,731 | ||||
| Standard Chartered PLC (United | ||||||
| Kingdom) | 10,593 | 222,427 | ||||
| SurfControl PLC (a) | 6,100 | 46,142 | ||||
| SVG Capital PLC (a) | 5,400 | 62,812 | ||||
| Taylor Nelson Sofres PLC | 13,100 | 48,241 | ||||
| Tesco PLC | 14,000 | 74,545 | ||||
| Unilever PLC | 6,750 | 68,513 | ||||
| Virgin Mobile Holdings (UK) PLC | 16,500 | 87,637 | ||||
| Vodafone Group PLC sponsored ADR | 38,000 | 997,880 | ||||
| Whatman PLC | 25,000 | 123,932 | ||||
| Wolseley PLC | 7,900 | 160,706 | ||||
| Yell Group PLC | 13,900 | 108,896 | ||||
| TOTAL UNITED KINGDOM | 12,345,393 | |||||
| United States of America – 26.2% | ||||||
| AES Corp. (a) | 32,200 | 511,658 | ||||
| Allergan, Inc. | 6,300 | 562,590 | ||||
| Altria Group, Inc. | 20,000 | 1,501,000 | ||||
| American Express Co. | 9,300 | 462,861 | ||||
| American International Group, Inc. | 15,987 | 1,035,958 | ||||
| Amkor Technology, Inc. (a) | 63,300 | 334,224 | ||||
| Analog Devices, Inc. | 9,500 | 330,410 | ||||
| Apple Computer, Inc. (a) | 8,400 | 483,756 | ||||
| aQuantive, Inc. (a) | 22,000 | 476,300 | ||||
| Aspect Medical Systems, Inc. (a) | 8,400 | 274,008 | ||||
| Badger Meter, Inc. | 6,400 | 211,200 | ||||
| Bank of the Ozarks, Inc. | 6,400 | 224,448 | ||||
| Baxter International, Inc. | 6,700 | 256,141 | ||||
| BEA Systems, Inc. (a) | 22,800 | 201,096 | ||||
| BioMarin Pharmaceutical, Inc. (a) | 16,800 | 141,120 | ||||
| Blue Nile, Inc. (a) | 8,500 | 304,895 | ||||
| Buffalo Wild Wings, Inc. (a) | 6,900 | 189,336 | ||||
See accompanying notes which are an integral part of the financial statements.
A-11 Annual Report
| Global Balanced | ||||||
| Investments - continued | ||||||
| Common Stocks continued | ||||||
| Shares | Value (Note 1) | |||||
| United States of America – continued | ||||||
| C.R. Bard, Inc. | 8,400 | $ | 523,992 | |||
| Caterpillar, Inc. | 8,200 | 431,238 | ||||
| Coca Cola Enterprises, Inc. | 9,100 | 171,990 | ||||
| Colgate Palmolive Co. | 12,200 | 646,112 | ||||
| ConocoPhillips | 8,400 | 549,192 | ||||
| Crown Castle International Corp. (a) | 16,500 | 404,580 | ||||
| CVS Corp. | 13,600 | 331,976 | ||||
| D.R. Horton, Inc. | 27,700 | 850,113 | ||||
| DATATRAK International, Inc. (a) | 25,950 | 258,722 | ||||
| Dell, Inc. (a) | 11,000 | 350,680 | ||||
| E*TRADE Financial Corp. (a) | 47,800 | 886,690 | ||||
| Emdeon Corp. (a) | 11,800 | 108,560 | ||||
| Equity Lifestyle Properties, Inc. | 8,600 | 364,038 | ||||
| Exelon Corp. | 12,600 | 655,578 | ||||
| Exxon Mobil Corp. | 28,900 | 1,622,446 | ||||
| FARO Technologies, Inc. (a) | 8,400 | 174,384 | ||||
| Federated Department Stores, Inc. | 13,700 | 840,769 | ||||
| FedEx Corp. | 4,700 | 432,071 | ||||
| Fluor Corp. | 5,000 | 318,000 | ||||
| Gamestop Corp. Class A (a) | 14,300 | 507,364 | ||||
| Genentech, Inc. (a) | 6,900 | 625,140 | ||||
| General Electric Co. | 62,600 | 2,122,766 | ||||
| General Growth Properties, Inc. | 12,740 | 541,195 | ||||
| Golden West Financial Corp., Delaware | 6,600 | 387,618 | ||||
| Google, Inc. Class A (sub. vtg.) (a) | 4,200 | 1,562,988 | ||||
| Harris Corp. | 14,600 | 600,060 | ||||
| Health Net, Inc. (a) | 6,900 | 323,196 | ||||
| Honeywell International, Inc. | 13,800 | 471,960 | ||||
| Intel Corp. | 69,100 | 1,623,850 | ||||
| JCPenney Co., Inc. | 12,400 | 634,880 | ||||
| Johnson & Johnson | 19,000 | 1,189,780 | ||||
| KB Home | 15,100 | 986,785 | ||||
| Kellogg Co. | 12,600 | 556,542 | ||||
| Lamar Advertising Co. Class A (a) | 6,000 | 267,720 | ||||
| Lehman Brothers Holdings, Inc. | 3,600 | 430,812 | ||||
| Marchex, Inc. Class B (a)(e) | 24,400 | 411,140 | ||||
| MedImmune, Inc. (a) | 17,000 | 594,660 | ||||
| Microsoft Corp. | 54,500 | 1,400,650 | ||||
| Monsanto Co. | 10,200 | 642,702 | ||||
| National Semiconductor Corp. | 22,500 | 509,175 | ||||
| Newmont Mining Corp. | 6,500 | 276,900 | ||||
| Nextel Partners, Inc. Class A (a) | 8,700 | 218,805 | ||||
| Omnicom Group, Inc. | 4,100 | 340,136 | ||||
| optionsXpress Holdings, Inc. | 14,400 | 271,584 | ||||
| PepsiCo, Inc. | 17,590 | 1,039,217 | ||||
| Praxair, Inc. | 8,900 | 439,749 | ||||
| Prudential Financial, Inc. | 6,400 | 465,856 | ||||
| Quicksilver Resources, Inc. (a) | 7,950 | 307,904 | ||||
| Regeneration Technologies, Inc. (a) | 37,400 | 270,402 | ||||
| Robert Half International, Inc. | 8,500 | 313,480 | ||||
| Service Corp. International (SCI) | 29,700 | 248,589 | ||||
| Staples, Inc. | 19,800 | 450,054 | ||||
| Shares | Value (Note 1) | |||||||
| Starbucks Corp. (a) | 24,200 | $ | 684,376 | |||||
| State Street Corp. | 9,200 | 508,116 | ||||||
| Synthes, Inc. | 1,720 | 182,120 | ||||||
| The Boeing Co. | 3,600 | 232,704 | ||||||
| The Coca Cola Co. | 13,600 | 581,808 | ||||||
| The St. Paul Travelers Companies, Inc. | 6,200 | 279,186 | ||||||
| THQ, Inc. (a) | 8,100 | 187,758 | ||||||
| Titanium Metals Corp. (a) | 4,600 | 217,120 | ||||||
| TradeStation Group, Inc. (a) | 68,000 | 678,640 | ||||||
| Trimble Navigation Ltd. (a) | 8,000 | 230,960 | ||||||
| UAP Holding Corp. | 11,500 | 219,650 | ||||||
| UnionBanCal Corp. | 3,500 | 239,680 | ||||||
| UnitedHealth Group, Inc. | 13,200 | 764,148 | ||||||
| Urban Outfitters, Inc. (a) | 18,200 | 515,606 | ||||||
| Valero Energy Corp. | 8,800 | 926,112 | ||||||
| Wachovia Corp. | 13,200 | 666,864 | ||||||
| Walgreen Co. | 18,800 | 854,084 | ||||||
| Walt Disney Co. | 11,600 | 282,692 | ||||||
| Watts Water Technologies, Inc. Class A . | 7,500 | 208,200 | ||||||
| Wells Fargo & Co. | 12,700 | 764,540 | ||||||
| Whole Foods Market, Inc. | 3,200 | 461,216 | ||||||
| Wm. Wrigley Jr. Co. | 8,500 | 590,750 | ||||||
| XM Satellite Radio Holdings, Inc. | ||||||||
| Class A (a) | 8,300 | 239,289 | ||||||
| Yahoo!, Inc. (a) | 30,200 | 1,116,494 | ||||||
| TOTAL UNITED STATES OF AMERICA | 50,087,904 | |||||||
| TOTAL COMMON STOCKS | ||||||||
| (Cost $93,213,155) | 114,463,739 | |||||||
| Government Obligations 23.8% | ||||||||
| Principal | ||||||||
| Amount (d) | ||||||||
| France – 1.5% | ||||||||
| French Government 3.5% | ||||||||
| 1/12/08 | EUR | 2,300,000 | 2,805,375 | |||||
| Germany 3.3% | ||||||||
| German Federal Republic 4.5% | ||||||||
| 8/18/06 | EUR | 5,125,000 | 6,241,891 | |||||
| Italy 0.6% | ||||||||
| Italian Republic 4.25% 8/1/14 | EUR | 900,000 | 1,142,960 | |||||
| Japan 9.5% | ||||||||
| Japan Government: | ||||||||
| 0.1% 6/20/07 | JPY | 1,500,000,000 | 12,863,053 | |||||
| 1.9% 3/20/08 | JPY | 600,000,000 | 5,344,095 | |||||
| TOTAL JAPAN | 18,207,148 | |||||||
| Norway 0.7% | ||||||||
| Kingdom of Norway 6.75% | ||||||||
| 1/15/07 | NOK | 8,500,000 | 1,365,801 | |||||
| Spain 1.0% | ||||||||
| Spanish Kingdom 3% 7/30/07 | EUR | 1,600,000 | 1,930,467 | |||||
See accompanying notes which are an integral part of the financial statements.
Annual Report A-12
| Government Obligations continued | ||||||||||
| Principal | Value | |||||||||
| Amount (d) | (Note 1) | |||||||||
| United Kingdom – 0.6% | ||||||||||
| United Kingdom, Great Britain | ||||||||||
| & Northern Ireland 7.5% | ||||||||||
| 12/7/06 | GBP | 650,000 | $ 1,189,919 | |||||||
| United States of America – 6.6% | ||||||||||
| U.S. Treasury Bills, yield at date | ||||||||||
| of purchase 3.33% to 3.67% | ||||||||||
| 12/15/05 to 1/12/06 (f) | 825,000 | 819,570 | ||||||||
| U.S. Treasury Notes: | ||||||||||
| 3.375% 12/15/08 | 4,000,000 | 3,877,344 | ||||||||
| 3.5% 5/31/07 | 7,950,000 | 7,843,486 | ||||||||
| TOTAL UNITED STATES OF AMERICA | 12,540,400 | |||||||||
| TOTAL GOVERNMENT OBLIGATIONS | ||||||||||
| (Cost $46,416,521) | 45,423,961 | |||||||||
| Money Market Funds 16.2% | ||||||||||
| Shares | ||||||||||
| Fidelity Cash Central Fund, | ||||||||||
| 3.92% (b) | 30,578,519 | 30,578,519 | ||||||||
| Fidelity Securities Lending Cash | ||||||||||
| Central Fund, 3.94% (b)(c) | 478,220 | 478,220 | ||||||||
| TOTAL MONEY MARKET FUNDS | ||||||||||
| (Cost $31,056,739) | 31,056,739 | |||||||||
| TOTAL INVESTMENT PORTFOLIO 99.8% | ||||||||||
| (Cost $170,686,415) | 190,944,439 | |||||||||
| NET OTHER ASSETS 0.2% | 302,279 | |||||||||
| NET ASSETS 100% | $ 191,246,718 | |||||||||
| Futures Contracts | ||||||||||
| Expiration | Underlying | Unrealized | ||||||||
| Date | Face Amount | Appreciation/ | ||||||||
| at Value | (Depreciation) | |||||||||
| Purchased | ||||||||||
| Equity Index Contracts | ||||||||||
| 27 DAX 100 Index | ||||||||||
| Contracts | ||||||||||
| (Germany) | Dec. 2005 | $ 4,070,415 | $ (59,190) | |||||||
| 31 Nasdaq 100 | ||||||||||
| Index Contracts | Dec. 2005 | 4,918,150 | (79,980) | |||||||
| TOTAL EQUITY INDEX | ||||||||||
| CONTRACTS | $ 8,988,565 | $ (139,170) | ||||||||
The face value of futures purchased as a percentage of net assets - 4.7%
| Currency Abbreviations | ||||
| EUR | — | European Monetary Unit | ||
| GBP | — | British pound | ||
| JPY | — | Japanese yen | ||
| NOK | Norwegian krone | |||
| Legend (a) Non-income producing (b) Affiliated fund that is available only to investment companies and other accounts managed by Fidelity Investments. The rate quoted is the annualized seven-day yield of the fund at period end. A complete unaudited listing of the fund’s holdings as of its most recent quarter end is available upon request. (c) Investment made with cash collateral received from securities on loan. (d) Principal amount is stated in United States dollars unless otherwise noted. (e) Security or a portion of the security is on loan at period end. (f) Security or a portion of the security was pledged to cover margin requirements for futures contracts. At the period end, the value of securities pledged amounted to $819,570. |
Other Information
The composition of credit quality ratings as a percentage of net assets is as follows (ratings are unaudited):
| U.S.Government and U.S.Government Agency Obligations | 6.1% | |
| AAA, AA, A | 17.2% | |
| BBB | 0.0% | |
| BB | 0.0% | |
| B | 0.0% | |
| CCC, CC, C | 0.0% | |
| Equities | 64.5% | |
| Short-Term Investments and Net Other Assets | 12.2% | |
| 100.0% |
We have used ratings from Moody’s Investors Services, Inc. Where Moody’s ratings are not available, we have used S&P ratings. Percentages are adjusted for the effect of futures contracts, if applicable.
See accompanying notes which are an integral part of the financial statements.
A-13 Annual Report
| Global Balanced | ||||||||
| Financial Statements | ||||||||
| Statement of Assets and Liabilities | ||||||||
| October 31, 2005 | ||||||||
| Assets | ||||||||
| Investment in securities, at value (in- | ||||||||
| cluding securities loaned of | ||||||||
| $470,041) (cost $170,686,415) | ||||||||
| — See accompanying schedule | $ | 190,944,439 | ||||||
| Foreign currency held at value (cost | ||||||||
| $97,749) | 97,655 | |||||||
| Receivable for investments sold | 1,715,903 | |||||||
| Receivable for fund shares sold | 556,204 | |||||||
| Dividends receivable | 126,022 | |||||||
| Interest receivable | 545,648 | |||||||
| Receivable for daily variation on fu- | ||||||||
| tures contracts | 126,971 | |||||||
| Other affiliated receivables | 1 | |||||||
| Other receivables | 10,611 | |||||||
| Total assets | 194,123,454 | |||||||
| Liabilities | ||||||||
| Payable to custodian bank | $ | 13 | ||||||
| Payable for investments purchased | . | 1,915,692 | ||||||
| Payable for fund shares redeemed | . | 231,949 | ||||||
| Accrued management fee | 113,610 | |||||||
| Other affiliated payables | 49,059 | |||||||
| Other payables and accrued | ||||||||
| expenses | 88,193 | |||||||
| Collateral on securities loaned, at | ||||||||
| value | 478,220 | |||||||
| Total liabilities | 2,876,736 | |||||||
| Net Assets | $ | 191,246,718 | ||||||
| Net Assets consist of: | ||||||||
| Paid in capital | $ | 152,589,429 | ||||||
| Undistributed net investment income | 1,211,763 | |||||||
| Accumulated undistributed net real- | ||||||||
| ized gain (loss) on investments and | ||||||||
| foreign currency transactions | 17,337,431 | |||||||
| Net unrealized appreciation (de- | ||||||||
| preciation) on investments and | ||||||||
| assets and liabilities in foreign | ||||||||
| currencies | 20,108,095 | |||||||
| Net Assets, for 8,712,275 shares | ||||||||
| outstanding | $ | 191,246,718 | ||||||
| Net Asset Value, offering price and | ||||||||
| redemption price per share | ||||||||
| ($191,246,718 ÷ 8,712,275 | ||||||||
| shares) | $ | 21.95 | ||||||
| Statement of Operations | ||||||
| Year ended October 31, 2005 | ||||||
| Investment Income | ||||||
| Dividends | $ | 1,801,097 | ||||
| Special Dividends | 246,900 | |||||
| Interest | 1,502,976 | |||||
| Security lending | 12,483 | |||||
| 3,563,456 | ||||||
| Less foreign taxes withheld | (125,913) | |||||
| Total income | 3,437,543 | |||||
| Expenses | ||||||
| Management fee | $ | 1,273,258 | ||||
| Transfer agent fees | 459,115 | |||||
| Accounting and security lending | ||||||
| fees | 88,293 | |||||
| Independent trustees’ compensation | 893 | |||||
| Custodian fees and expenses | 133,475 | |||||
| Registration fees | 27,352 | |||||
| Audit | 74,368 | |||||
| Legal | 907 | |||||
| Miscellaneous | 2,243 | |||||
| Total expenses before reductions | 2,059,904 | |||||
| Expense reductions | (34,176) | 2,025,728 | ||||
| Net investment income (loss) | 1,411,815 | |||||
| Realized and Unrealized Gain | ||||||
| (Loss) | ||||||
| Net realized gain (loss) on: | ||||||
| Investment securities | 17,510,681 | |||||
| Foreign currency transactions | (2,614) | |||||
| Futures contracts | 242,009 | |||||
| Total net realized gain (loss) | 17,750,076 | |||||
| Change in net unrealized appreci- | ||||||
| ation (depreciation) on: | ||||||
| Investment securities | 2,486,646 | |||||
| Assets and liabilities in foreign | ||||||
| currencies | (34,831) | |||||
| Futures contracts | (139,170) | |||||
| Total change in net unrealized ap- | ||||||
| preciation (depreciation) | 2,312,645 | |||||
| Net gain (loss) | 20,062,721 | |||||
| Net increase (decrease) in net as- | ||||||
| sets resulting from operations | $ | 21,474,536 | ||||
See accompanying notes which are an integral part of the financial statements.
Annual Report A-14
| Statement of Changes in Net Assets | ||||||||||||||||||||
| Year ended | Year ended | |||||||||||||||||||
| October 31, | October 31, | |||||||||||||||||||
| 2005 | 2004 | |||||||||||||||||||
| Increase (Decrease) in Net Assets | ||||||||||||||||||||
| Operations | ||||||||||||||||||||
| Net investment income (loss) | $ | 1,411,815 | $ | 707,428 | ||||||||||||||||
| Net realized gain (loss) | 17,750,076 | 10,231,992 | ||||||||||||||||||
| Change in net unrealized appreciation (depreciation) | 2,312,645 | 1,921,438 | ||||||||||||||||||
| Net increase (decrease) in net assets resulting from operations | 21,474,536 | 12,860,858 | ||||||||||||||||||
| Distributions to shareholders from net investment income | (947,033) | (2,085,080) | ||||||||||||||||||
| Distributions to shareholders from net realized gain | (2,331,147) | — | ||||||||||||||||||
| Total distributions | (3,278,180) | (2,085,080) | ||||||||||||||||||
| Share transactions | ||||||||||||||||||||
| Proceeds from sales of shares | 85,851,097 | 43,116,007 | ||||||||||||||||||
| Reinvestment of distributions | 3,105,549 | 1,937,941 | ||||||||||||||||||
| Cost of shares redeemed | (53,533,775) | (34,092,066) | ||||||||||||||||||
| Net increase (decrease) in net assets resulting from share transactions | 35,422,871 | 10,961,882 | ||||||||||||||||||
| Redemption fees | 8,689 | 17,177 | ||||||||||||||||||
| Total increase (decrease) in net assets | 53,627,916 | 21,754,837 | ||||||||||||||||||
| Net Assets | ||||||||||||||||||||
| Beginning of period | 137,618,802 | 115,863,965 | ||||||||||||||||||
| End of period (including undistributed net investment income of $1,211,763 and undistributed net investment income | ||||||||||||||||||||
| of $1,969,601, respectively) | $ 191,246,718 | $ | 137,618,802 | |||||||||||||||||
| Other Information | ||||||||||||||||||||
| Shares | ||||||||||||||||||||
| Sold | 4,082,256 | 2,259,780 | ||||||||||||||||||
| Issued in reinvestment of distributions | 151,048 | 105,592 | ||||||||||||||||||
| Redeemed | (2,510,378) | (1,790,393) | ||||||||||||||||||
| Net increase (decrease) | 1,722,926 | 574,979 | ||||||||||||||||||
| Financial Highlights | ||||||||||||||||||||
| Years ended October 31, | 2005 | 2004 | 2003 | 2002 | 2001 | |||||||||||||||
| Selected Per Share Data | ||||||||||||||||||||
| Net asset value, beginning of period | $ 19.69 | $ 18.06 | $ | 14.84 | $ | 15.36 | $ | 19.10 | ||||||||||||
| Income from Investment Operations | ||||||||||||||||||||
| Net investment income (loss)B | 17C | .10G | .15 | .17E | .28 | |||||||||||||||
| Net realized and unrealized gain (loss) | 2.54 | 1.85 | 3.29 | (.66)E | (2.46) | |||||||||||||||
| Total from investment operations | 2.71 | 1.95 | 3.44 | (.49) | (2.18) | |||||||||||||||
| Distributions from net investment income | (.13) | (.32) | (.22) | (.03) | (.32) | |||||||||||||||
| Distributions from net realized gain | (.32) | — | — | (1.24) | ||||||||||||||||
| Total distributions | (.45) | (.32) | (.22) | (.03) | (1.56) | |||||||||||||||
| Redemption fees added to paid in capitalB | —F | —F | —F | —F | —F | |||||||||||||||
| Net asset value, end of period | $ 21.95 | $ 19.69 | $ | 18.06 | $ | 14.84 | $ | 15.36 | ||||||||||||
| Total ReturnA | 13.92% | 10.93% | 23.49% | (3.20)% | (12.36)% | |||||||||||||||
| Ratios to Average Net AssetsD | ||||||||||||||||||||
| Expenses before expense reductions | 1.17% | 1.20% | 1.29% | 1.29% | 1.29% | |||||||||||||||
| Expenses net of voluntary waivers, if any | 1.17% | 1.20% | 1.29% | 1.29% | 1.29% | |||||||||||||||
| Expenses net of all reductions | 1.15% | 1.19% | 1.28% | 1.27% | 1.27% | |||||||||||||||
| Net investment income (loss) | 80%C | .54%G | .98% | 1.07%E | 1.69% | |||||||||||||||
| Supplemental Data | ||||||||||||||||||||
| Net assets, end of period (000 omitted) | $ 191,247 | $ 137,619 | $ 115,864 | $ | 88,263 | $ | 88,809 | |||||||||||||
| Portfolio turnover rate | 95% | 94% | 113% | 126% | 102% | |||||||||||||||
| ATotal returns would have been lower had certain expenses not been reduced during the periods shown. BCalculated based on average shares outstanding during the period. CInvestment income per share reflects a special dividend which amounted to $.03 per share. Excluding the special dividend, the ratio of net investment income to average net assets would have been .66%. DExpense ratios reflect operating expenses of the fund. Expenses before reductions do not reflect amounts reimbursed by the investment adviser or reductions from brokerage service arrangements or other expense offset arrangements and do not represent the amount paid by the fund during periods when reimbursements or reductions occur. Expenses net of any voluntary waivers reflect expenses after reimbursement by the investment adviser but prior to reductions from brokerage service arrangements or other expense offset arrangements. Expenses net of all reductions represent the net expenses paid by the fund. EEffective November 1, 2001, the fund adopted the provisions of the AICPA Audit and Accounting Guide for Investment Companies and began amortizing premium and discount on all debt securities. Per share data and ratios for periods prior to adoption have not been restated to reflect this change. FAmount represents less than $.01 per share. GNet investment income per share includes approximately $.05 per share received as a result of a reorganization of an issuer that was in bankruptcy. Excluding this non recurring amount, the ratio of net investment income to average net assets would have been ..26%. |
See accompanying notes which are an integral part of the financial statements.
A-15 Annual Report
| Diversified International Performance: The Bottom Line |
Average annual total return reflects the change in the value of an investment, assuming reinvestment of the fund’s dividend income and capital gains (the profits earned upon the sale of securities that have grown in value) and assuming a constant rate of performance each year. The $10,000 table and the fund’s returns do not reflect the deduction of taxes that a shareholder would pay on fund distributions or the redemption of fund shares. During periods of reimbursement by Fidelity a fund’s total returns will be greater than it would be had the reimbursement not occurred. How a fund did yesterday is no guarantee of how it will do tomorrow.
| Average Annual Total Returns | ||||||
| Periods ended | Past 1 | Past 5 | Past 10 | |||
| October 31, 2005 | year | years | years | |||
| Fidelity Diversified International Fund | 19.01% | 7.96% | 12.47% |
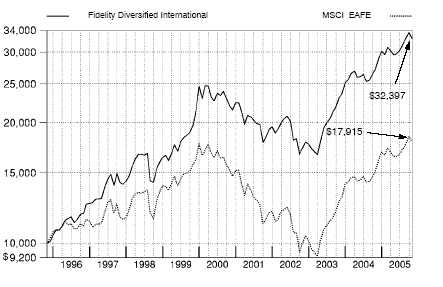
$10,000 Over 10 Years
Let’s say hypothetically that $10,000 was invested in Fidelity Diversified International Fund on October 31, 1995. The chart shows how the value of your investment would have changed, and also shows how the Morgan Stanley Capital International EAFE Index performed over the same period.
Annual Report A-16
| Diversified International |
Management’s Discussion of Fund Performance
Comments from Bill Bower, Portfolio Manager of Fidelity® Diversified International Fund
Foreign stock markets enjoyed broad based advances during the 12 month period that ended October 31, 2005, encouraged by better than expected corporate earnings and markedly improved economies. For the 12 months overall, the Morgan Stanley Capital InternationalSM Europe, Australasia, Far East (MSCI® EAFE®) Index a performance measure of developed stock markets outside the United States and Canada gained 18.28% . The Japanese stock market climbed to its highest level in more than four years. Positive economic indicators and Prime Minister Koizumi’s decisive election victory attracted record inflows from overseas investors. In response, the Tokyo Stock Exchange Stock Price Index (TOPIX) soared 22.89% . Southeast Asian equities outside of Japan, particularly South Korea, also responded well to the better macroeconomic environment, illustrated by the 19.44% return for the MSCI All Country Far East ex Japan index. European stock markets were up as well, despite investors’ concern about higher energy prices and potential downgrades to economic growth in the region. For the year overall, the MSCI Europe index rose 16.51% . Although strong, returns for U.S. investors in foreign markets were reduced by the strength of the dollar versus most major currencies.
For the 12 months that ended October 31, 2005, Fidelity Diversified International Fund returned 19.01%, outperforming the MSCI EAFE index and the 17.75% return of the LipperSM International Funds Average. The fund benefited relative to the index from an underweighting and good stock picking in telecommunication services. Security selection in energy also boosted relative performance, led by the fund’s Canadian energy holdings. Stock selection in financials was strong as well, especially among emerging markets banks. Lastly, favorable currency movements in Canada and some emerging markets actually helped the fund’s relative performance. An underweighting in the Japanese market held back fund performance. Media stocks also were an area of weakness, as was an underweighting and stock selection in materials. In terms of individual holdings, Canadian oil and gas producer EnCana and Swiss pharmaceutical firm Roche were among the fund’s top absolute and relative performers. Out of benchmark positions in emerging markets stocks State Bank of India and South Korea based Kookmin Bank also bolstered returns. Detractors from the fund’s performance included Chinese corn product manufacturer Global Bio Chem Technology Group and Canadian technology hardware firm Research In Motion. Underweighting Japanese bank and index component Mitsubishi UFJ Financial Group also curbed the fund’s relative performance.
The views expressed in this statement reflect those of the portfolio manager only through the end of the period of the report as stated on the cover and do not necessarily represent the views of Fidelity or any other person in the Fidelity organization. Any such views are subject to change at any time based upon market or other conditions and Fidelity disclaims any responsibility to update such views. These views may not be relied on as investment advice and, because investment decisions for a Fidelity fund are based on numerous factors, may not be relied on as an indication of trading intent on behalf of any Fidelity fund.
| A-17 A-17 |
| Annual Report |
| Diversified International Investment Changes |
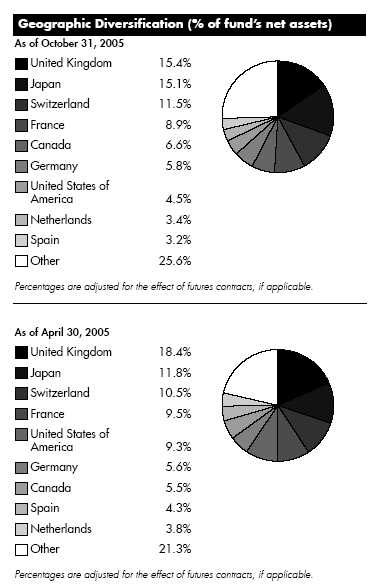
| Asset Allocation | ||||
| % of fund’s | % of fund’s net assets | |||
| net assets | 6 months ago | |||
| Stocks and Equity Futures | 98.8 | 94.7 | ||
| Short Term Investments and Net | ||||
| Other Assets | 1.2 | 5.3 |
| Top Ten Stocks as of October 31, 2005 | ||||
| % of fund’s | % of fund’s net assets | |||
| net assets | 6 months ago | |||
| Roche Holding AG (participation | ||||
| certificate) (Switzerland, | ||||
| Pharmaceuticals) | 2.4 | 2.2 | ||
| Novartis AG sponsored ADR | ||||
| (Switzerland, Pharmaceuticals) | 2.1 | 1.6 | ||
| Total SA sponsored ADR (France, | ||||
| Oil, Gas & Consumable Fuels) | 1.7 | 1.5 | ||
| Vodafone Group PLC sponsored | ||||
| ADR (United Kingdom, Wireless | ||||
| Telecommunication Services) | 1.6 | 1.9 | ||
| BP PLC sponsored ADR (United | ||||
| Kingdom, Oil, Gas & | ||||
| Consumable Fuels) | 1.5 | 1.6 | ||
| Nestle SA (Reg.) (Switzerland, | ||||
| Food Products) | 1.4 | 1.2 | ||
| Sanofi Aventis sponsored ADR | ||||
| (France, Pharmaceuticals) | 1.3 | 1.4 | ||
| Toyota Motor Corp. (Japan, | ||||
| Automobiles) | 1.3 | 0.8 | ||
| UBS AG (NY Shares) | ||||
| (Switzerland, Capital Markets) | 1.2 | 1.1 | ||
| EnCana Corp. (Canada, Oil, Gas | ||||
| & Consumable Fuels) | 1.1 | 0.9 | ||
| 15.6 | ||||
| Market Sectors as of October 31, 2005 | ||||
| % of fund’s | % of fund’s net assets | |||
| net assets | 6 months ago | |||
| Financials | 22.2 | 21.1 | ||
| Industrials | 12.6 | 9.7 | ||
| Consumer Discretionary | 12.1 | 15.3 | ||
| Health Care | 10.8 | 11.7 | ||
| Energy | 10.6 | 7.9 | ||
| Information Technology | 9.1 | 8.0 | ||
| Consumer Staples | 8.3 | 9.0 | ||
| Materials | 6.7 | 5.2 | ||
| Telecommunication Services | 4.1 | 4.8 | ||
| Utilities | 1.5 | 2.0 | ||
Annual Report A-18
| Diversified International Investments October 31, 2005 Showing Percentage of Net Assets |
| Common Stocks 97.3% | ||||||||
| Shares | Value (Note 1) | |||||||
| Australia 2.6% | ||||||||
| AMP Ltd. | 1,000,000 | $ | 5,451,098 | |||||
| Australia & New Zealand Banking | ||||||||
| Group Ltd. | 4,500,000 | 79,242,806 | ||||||
| Australian Gas Light Co. | 2,118,164 | 23,979,597 | ||||||
| BHP Billiton Ltd. sponsored ADR | 2,300,000 | 71,415,000 | ||||||
| Brambles Industries Ltd. (d) | 15,000,000 | 94,777,313 | ||||||
| Computershare Ltd. | 14,500,000 | 71,017,556 | ||||||
| CSL Ltd. | 6,500,000 | 182,264,063 | ||||||
| Macquarie Bank Ltd. | 2,000,000 | 96,713,985 | ||||||
| Macquarie Capital Alliance Group | ||||||||
| unit (a) | 12,499,900 | 17,665,452 | ||||||
| QBE Insurance Group Ltd. | 9,000,000 | 119,789,550 | ||||||
| TOTAL AUSTRALIA | 762,316,420 | |||||||
| Austria 0.6% | ||||||||
| OMV AG | 3,100,000 | 167,225,626 | ||||||
| Belgium – 0.3% | ||||||||
| KBC Groupe SA | 400,000 | 32,606,000 | ||||||
| RHJ International | 1,300,000 | 30,388,313 | ||||||
| Umicore SA | 350,000 | 35,033,469 | ||||||
| TOTAL BELGIUM | 98,027,782 | |||||||
| Bermuda 0.2% | ||||||||
| ChipMOS TECHNOLOGIES | ||||||||
| Bermuda Ltd. (a) | 1,000,000 | 6,100,000 | ||||||
| Clear Media Ltd. (a)(e) | 27,321,500 | 22,908,599 | ||||||
| Noble Group Ltd. | 10,000,000 | 9,091,714 | ||||||
| Peace Mark Holdings Ltd. | 31,040,000 | 7,527,663 | ||||||
| TOTAL BERMUDA | 45,627,976 | |||||||
| Brazil 0.6% | ||||||||
| Banco Nossa Caixa SA | 4,175,800 | 69,170,148 | ||||||
| Companhia Vale do Rio Doce | ||||||||
| sponsored ADR (non vtg.) | 1,000,000 | 41,330,000 | ||||||
| Uniao de Bancos Brasileiros SA | ||||||||
| (Unibanco) GDR | 408,300 | 21,354,090 | ||||||
| Votorantim Celulose e Papel SA | ||||||||
| sponsored ADR (non vtg.) | 3,000,000 | 35,910,000 | ||||||
| TOTAL BRAZIL | 167,764,238 | |||||||
| Canada 6.6% | ||||||||
| ACE Aviation Holdings, Inc. Class A (a) | 2,700,000 | 70,872,142 | ||||||
| Astral Media, Inc. Class A (non vtg.) | 1,500,000 | 39,944,962 | ||||||
| Brascan Corp. Class A (ltd. vtg.) (d) | 2,100,000 | 95,789,162 | ||||||
| Canadian National Railway Co. | 800,000 | 57,917,019 | ||||||
| Canadian Natural Resources Ltd. | 2,800,000 | 114,489,416 | ||||||
| Canadian Western Bank, Edmonton | 400,000 | 11,922,100 | ||||||
| Corus Entertainment, Inc. Class B | ||||||||
| (non vtg.) | 1,000,000 | 26,375,953 | ||||||
| EnCana Corp. | 7,150,000 | 326,926,334 | ||||||
| Finning International, Inc. | 1,500,000 | 49,000,847 | ||||||
| Fording Canadian Coal Trust | 400,000 | 13,574,937 | ||||||
| Goldcorp, Inc. | 3,000,000 | 60,355,631 | ||||||
| ITF Optical Technologies, Inc. | ||||||||
| Series A (h) | 39,827 | 0 | ||||||
| Shares | Value (Note 1) | |||
| Loblaw Companies Ltd. | 400,000 | $ 22,746,825 | ||
| Meridian Gold, Inc. (a) | 525,000 | 9,846,528 | ||
| Metro, Inc. Class A (sub. vtg.) | 700,000 | 19,500,423 | ||
| National Bank of Canada | 2,020,400 | 101,173,968 | ||
| Nexen, Inc. | 650,000 | 26,748,518 | ||
| OZ Optics Ltd. unit (a)(h) | 102,000 | 1,504,500 | ||
| Petro Canada | 2,900,000 | 101,070,279 | ||
| Power Corp. of Canada (sub. vtg.) . | 3,500,000 | 86,625,741 | ||
| Precision Drilling Corp. (a) | 3,350,000 | 154,026,249 | ||
| Research In Motion Ltd. (a) | 800,000 | 49,192,210 | ||
| Rogers Communications, Inc. Class B | ||||
| (non vtg.) | 2,760,000 | 108,904,318 | ||
| Sun Life Financial, Inc. | 2,664,205 | 99,371,914 | ||
| Talisman Energy, Inc. | 3,500,000 | 155,025,402 | ||
| TELUS Corp. (non vtg.) | 1,000,000 | 37,519,052 | ||
| TimberWest Forest Corp. | 5,367,100 | 61,078,598 | ||
| TransCanada Corp. | 1,500,000 | 44,542,760 | ||
| Yellow Pages Income Fund | 500,000 | 5,715,495 | ||
| TOTAL CANADA | 1,951,761,283 | |||
| Cayman Islands 0.4% | ||||
| Apex Silver Mines Ltd. (a)(d)(e) | 2,675,000 | 40,981,000 | ||
| GlobalSantaFe Corp. | 250,000 | 11,137,500 | ||
| Hutchison Telecommunications | ||||
| International Ltd. sponsored ADR . | 3,500,000 | 65,940,000 | ||
| TOTAL CAYMAN ISLANDS | 118,058,500 | |||
| China – 0.6% | ||||
| Beijing Media Corp. Ltd. | ||||
| (H Shares) (e) | 3,450,000 | 4,450,407 | ||
| BYD Co. Ltd. (H Shares) (e) | 10,000,000 | 14,060,706 | ||
| China Construction Bank Corp. | ||||
| (H Shares) | 172,382,000 | 52,256,511 | ||
| Focus Media Holding Ltd. ADR | 180,500 | 4,739,930 | ||
| Global Bio Chem Technology Group | ||||
| Co. Ltd. | 96,171,600 | 38,148,072 | ||
| Shanghai Zhenhua Port Machinery | ||||
| Co. Ltd. (B Shares) | 7,500,000 | 6,030,000 | ||
| Sinopec Zhenhai Refining & | ||||
| Chemical Co. Ltd. (H Shares) | 34,932,000 | 40,780,511 | ||
| Weichai Power Co. Ltd. (H Shares) . | 5,356,000 | 10,225,461 | ||
| Xinao Gas Holdings Ltd. | 2,000,000 | 1,522,168 | ||
| TOTAL CHINA | 172,213,766 | |||
| Czech Republic 0.1% | ||||
| Zentiva NV | 929,500 | 41,195,010 | ||
| Denmark – 1.8% | ||||
| Coloplast AS Series B | 880,000 | 50,461,390 | ||
| Danske Bank AS | 4,000,000 | 125,446,733 | ||
| GN Store Nordic AS | 3,500,000 | 42,163,595 | ||
| Novozymes AS Series B | 1,793,280 | 93,757,803 | ||
| TDC AS | 2,690,600 | 150,612,231 | ||
See accompanying notes which are an integral part of the financial statements.
A-19 Annual Report
| Diversified International | ||||
| Investments - continued | ||||
| Common Stocks continued | ||||
| Shares | Value (Note 1) | |||
| Denmark – continued | ||||
| Trygvesta AS | 439,222 | $ 18,131,158 | ||
| Vestas Wind Systems AS (a)(d) | 2,700,000 | 58,438,742 | ||
| TOTAL DENMARK | 539,011,652 | |||
| Finland – 0.9% | ||||
| Metso Corp. | 3,000,000 | 78,038,625 | ||
| Neste Oil Oyj | 1,200,000 | 37,185,225 | ||
| Nokia Corp. sponsored ADR | 9,500,000 | 159,790,000 | ||
| TOTAL FINLAND | 275,013,850 | |||
| France – 8.9% | ||||
| Alstom SA (a) | 100,000 | 4,793,801 | ||
| AXA SA sponsored ADR | 3,900,000 | 112,944,000 | ||
| bioMerieux SA | 40,000 | 1,970,745 | ||
| BNP Paribas SA | 2,200,000 | 166,806,063 | ||
| CNP Assurances | 936,072 | 65,138,852 | ||
| Dassault Aviation SA | 36,265 | 24,518,585 | ||
| Essilor International SA | 1,000,000 | 82,354,125 | ||
| Financiere Marc de Lacharriere SA | ||||
| (Fimalac) | 1,000,000 | 54,303,375 | ||
| Ipsos SA (d)(e) | 556,666 | 66,063,034 | ||
| JC Decaux SA (a) | 1,000,000 | 20,450,675 | ||
| L’Air Liquide SA | 300,000 | 54,555,113 | ||
| L’Oreal SA | 1,800,000 | 132,377,963 | ||
| Lagardere S.C.A. (Reg.) | 2,300,000 | 158,121,120 | ||
| Neopost SA (e) | 1,626,500 | 156,956,234 | ||
| Pernod Ricard SA | 1,000,000 | 174,897,626 | ||
| Renault SA | 850,000 | 73,618,235 | ||
| Sanofi Aventis sponsored ADR | 9,650,000 | 387,158,000 | ||
| Schneider Electric SA | 200,000 | 16,434,863 | ||
| Total SA sponsored ADR | 4,000,000 | 504,080,000 | ||
| Veolia Environnement (d) | 2,400,000 | 99,918,211 | ||
| Vinci SA | 2,100,000 | 164,132,851 | ||
| Vivendi Universal SA sponsored ADR | 3,400,000 | 106,828,000 | ||
| TOTAL FRANCE | 2,628,421,471 | |||
| Germany 5.5% | ||||
| Adidas Salomon AG | 168,963 | 28,354,190 | ||
| Allianz AG sponsored ADR (d) | 16,000,000 | 226,240,000 | ||
| Bayer AG | 4,850,000 | 168,780,002 | ||
| Bijou Brigitte Modische | ||||
| Accessoires AG | 108,788 | 22,626,068 | ||
| Celesio AG | 900,000 | 77,797,677 | ||
| Continental AG | 600,000 | 45,888,150 | ||
| DaimlerChrysler AG | 250,000 | 12,512,500 | ||
| Deutsche Boerse AG | 800,804 | 75,357,158 | ||
| Deutsche Post AG | 3,000,000 | 66,890,250 | ||
| Deutsche Telekom AG | ||||
| sponsored ADR | 4,000,000 | 70,800,000 | ||
| E.ON AG | 320,700 | 29,065,040 | ||
| E.ON AG sponsored ADR | 5,400,000 | 163,134,000 | ||
| GFK AG | 1,500,000 | 49,718,157 | ||
| Heidelberger Druckmaschinen AG . | 1,000,000 | 31,766,875 | ||
| Shares | Value (Note 1) | |||
| Hypo Real Estate Holding AG | 2,000,000 | $ 96,715,150 | ||
| K&S AG | 1,000,000 | 65,607,588 | ||
| Linde AG | 700,000 | 49,877,590 | ||
| Merck KGaA | 500,000 | 41,356,875 | ||
| MTU Aero Engines Holding AG | 1,250,000 | 36,337,110 | ||
| Muenchener | ||||
| Rueckversicherungs Gesellschaft | ||||
| AG (Reg.) | 100,000 | 11,747,750 | ||
| RWE AG | 1,500,000 | 95,804,100 | ||
| SAP AG sponsored ADR | 2,900,000 | 124,526,000 | ||
| SolarWorld AG | 400,000 | 54,049,240 | ||
| TOTAL GERMANY | 1,644,951,470 | |||
| Greece 0.2% | ||||
| Cosmote Mobile Telecommunications | ||||
| SA | 50,900 | 1,045,821 | ||
| EFG Eurobank Ergasias SA | 500,000 | 15,044,313 | ||
| Greek Organization of Football | ||||
| Prognostics SA | 1,500,000 | 43,298,850 | ||
| TOTAL GREECE | 59,388,984 | |||
| Hong Kong – 1.1% | ||||
| Aeon Credit Service (Asia) Co. Ltd. | 6,902,000 | 5,119,451 | ||
| China Mobile (Hong Kong) Ltd. | ||||
| sponsored ADR | 500,000 | 11,225,000 | ||
| Cosco Pacific Ltd. | 20,000,000 | 32,765,315 | ||
| Li & Fung Ltd. | 3,826,000 | 8,168,148 | ||
| Melco International Development Ltd. | 40,000,000 | 38,441,197 | ||
| Shanghai Industrial Holdings Ltd. | ||||
| Class H | 2,000,000 | 3,560,326 | ||
| Shun Tak Holdings Ltd. | 34,550,000 | 24,958,398 | ||
| Techtronic Industries Co. Ltd. | 40,000,000 | 98,295,946 | ||
| Television Broadcasts Ltd. | 6,648,000 | 36,918,564 | ||
| Wharf Holdings Ltd. | 10,000,000 | 34,119,787 | ||
| Yue Yuen Industrial Holdings Ltd. | 13,000,000 | 32,784,665 | ||
| TOTAL HONG KONG | 326,356,797 | |||
| India 2.6% | ||||
| ABB Ltd. India | 500,000 | 18,627,136 | ||
| Bajaj Auto Ltd. | 1,500,000 | 56,818,283 | ||
| Bharat Forge Ltd. | 1,250,000 | 8,927,779 | ||
| Bharti Televentures Ltd. (a) | 6,000,000 | 43,116,929 | ||
| GAIL India Ltd. | 997,803 | 5,191,586 | ||
| HDFC Bank Ltd. sponsored ADR | 375,000 | 16,571,250 | ||
| Housing Development Finance Corp. | ||||
| Ltd. | 5,000,000 | 107,377,413 | ||
| Infosys Technologies Ltd. | 2,800,000 | 156,677,613 | ||
| Larsen & Toubro Ltd. | 600,000 | 18,621,034 | ||
| Reliance Industries Ltd. | 4,000,000 | 67,672,509 | ||
| Satyam Computer Services Ltd. | 8,500,000 | 113,723,097 | ||
| State Bank of India | 7,200,000 | 149,306,945 | ||
| Suzlon Energy Ltd. (a) | 332,763 | 5,276,069 | ||
| TOTAL INDIA | 767,907,643 | |||
| Ireland 1.9% | ||||
| Allied Irish Banks PLC | 6,000,000 | 126,179,970 | ||
| C&C Group PLC | 4,119,600 | 25,432,608 | ||
See accompanying notes which are an integral part of the financial statements.
Annual Report A-20
| Common Stocks continued | ||||
| Shares | Value (Note 1) | |||
| Ireland – continued | ||||
| CRH PLC | 5,289,383 | $ 132,202,509 | ||
| DEPFA BANK PLC | 4,344,493 | 67,703,493 | ||
| IAWS Group PLC (Ireland) | 3,916,027 | 53,984,880 | ||
| Independent News & Media PLC | ||||
| (Ireland) | 10,307,800 | 27,925,634 | ||
| Ryanair Holdings PLC sponsored | ||||
| ADR (a) | 2,500,000 | 123,925,000 | ||
| TOTAL IRELAND | 557,354,094 | |||
| Israel 0.2% | ||||
| Teva Pharmaceutical Industries Ltd. | ||||
| sponsored ADR | 1,500,000 | 57,180,000 | ||
| Italy 1.7% | ||||
| Banca Intesa Spa | 30,000,000 | 140,002,013 | ||
| ENI Spa sponsored ADR (d) | 1,450,000 | 193,937,500 | ||
| Mediaset Spa | 1,000,000 | 10,980,550 | ||
| Telecom Italia Spa sponsored ADR . | 1,400,000 | 40,642,000 | ||
| Tod’s Spa | 100,000 | 5,704,851 | ||
| Unicredito Italiano Spa | 21,500,000 | 120,051,217 | ||
| TOTAL ITALY | 511,318,131 | |||
| Japan 14.3% | ||||
| Acom Co. Ltd. | 200,000 | 13,042,209 | ||
| Aeon Co. Ltd. | 1,700,000 | 35,333,475 | ||
| Aiful Corp. | 200,000 | 15,016,727 | ||
| Astellas Pharma, Inc. | 1,000,000 | 35,939,687 | ||
| Canon, Inc. sponsored ADR | 3,750,000 | 199,012,500 | ||
| Credit Saison Co. Ltd. | 2,500,000 | 113,664,672 | ||
| Daito Trust Construction Co. | 500,000 | 24,854,675 | ||
| Daiwa Securities Group, Inc. | 9,455,000 | 77,705,889 | ||
| East Japan Railway Co | 20,000 | 119,510,284 | ||
| Fanuc Ltd. | 1,200,000 | 94,569,007 | ||
| Hirose Electric Co. Ltd. | 300,000 | 34,372,197 | ||
| Hitachi Metals Ltd. | 1,000,000 | 10,296,937 | ||
| Honda Motor Co. Ltd. | 1,000,000 | 55,619,998 | ||
| Hoya Corp. | 1,500,000 | 52,740,408 | ||
| Hoya Corp. New | 4,500,000 | 157,052,101 | ||
| Ibiden Co. Ltd. | 1,500,000 | 60,794,362 | ||
| JGC Corp. | 1,000,000 | 16,376,373 | ||
| JSR Corp. | 2,250,000 | 53,292,493 | ||
| Keyence Corp. | 450,000 | 103,818,064 | ||
| Kose Corp. | 330,000 | 11,974,411 | ||
| Kuraray Co. Ltd. | 3,000,000 | 28,656,488 | ||
| Kuraya Sanseido, Inc. (d) | 2,000,000 | 31,141,955 | ||
| Matsushita Electric Industrial Co. Ltd. | 3,467,000 | 63,792,797 | ||
| Millea Holdings, Inc. | 2,000 | 36,387,999 | ||
| Mitsubishi Corp. | 1,000,000 | 19,485,372 | ||
| Mitsubishi Electric Corp. | 4,852,000 | 29,119,252 | ||
| Mitsubishi UFJ Financial Group, Inc. | 8,000 | 101,519,996 | ||
| Mitsui & Co. Ltd. | 9,000,000 | 110,910,739 | ||
| Mitsui O.S.K. Lines Ltd. | 6,085,000 | 43,000,839 | ||
| Mitsui Trust Holdings, Inc. | 6,680,000 | 80,642,768 | ||
| Mizuho Financial Group, Inc. | 25,000 | 167,141,194 | ||
| Shares | Value (Note 1) | |||||
| Murata Manufacturing Co. Ltd. | 1,300,000 | $ | 64,959,901 | |||
| NEOMAX Co. Ltd. | 1,000,000 | 30,310,579 | ||||
| Nikko Cordial Corp. | 8,650,000 | 104,874,604 | ||||
| Nippon Electric Glass Co. Ltd. | 3,000,000 | 57,546,800 | ||||
| Nippon Oil Corp. | 3,000,000 | 25,538,828 | ||||
| Nitto Denko Corp. | 3,500,000 | 212,477,160 | ||||
| Nomura Research Institute Ltd. | 205,000 | 21,268,500 | ||||
| ORIX Corp. | 1,300,000 | 243,965,522 | ||||
| Sega Sammy Holdings, Inc. | 500,000 | 18,013,144 | ||||
| Sega Sammy Holdings, Inc. New | 500,000 | 18,143,047 | ||||
| Seiyu Ltd. (a)(d) | 8,922,000 | 18,312,041 | ||||
| Seven & I Holdings Co. Ltd. (a) | 3,500,000 | 115,180,201 | ||||
| SFCG Co. Ltd. | 48,800 | 11,786,762 | ||||
| Sharp Corp. | 3,100,000 | 42,685,956 | ||||
| Shin Etsu Chemical Co. Ltd. | 1,500,300 | 71,980,368 | ||||
| Sompo Japan Insurance, Inc | 1,310,000 | 19,739,981 | ||||
| Sony Corp. | 250,000 | 8,200,000 | ||||
| Sumitomo Electric Industries Ltd. | 1,000,000 | 13,180,772 | ||||
| Sumitomo Forestry Co. Ltd. | 2,500,000 | 23,187,593 | ||||
| Sumitomo Mitsui Financial Group, | ||||||
| Inc. | 24,000 | 222,393,049 | ||||
| Sumitomo Rubber Industries Ltd. | 2,000,000 | 24,629,511 | ||||
| Sumitomo Trust & Banking Co. Ltd. | 1,000 | 8,539 | ||||
| T&D Holdings, Inc. | 1,500,000 | 94,698,909 | ||||
| Takefuji Corp. | 1,000,000 | 70,233,942 | ||||
| Teijin Ltd | 2,000,000 | 11,951,028 | ||||
| The Keiyo Bank Ltd. | 1,000,000 | 7,525,684 | ||||
| The Sumitomo Warehouse Co. | ||||||
| Ltd. (d) | 1,000,000 | 7,776,829 | ||||
| Toho Titanium Co. Ltd. | 200,000 | 13,423,256 | ||||
| Tokuyama Corp. | 3,000,000 | 29,877,571 | ||||
| Tokyo Electron Ltd. | 1,500,000 | 75,473,342 | ||||
| Toray Industries, Inc. | 2,000,000 | 11,154,293 | ||||
| Toyota Motor Corp. | 682,200 | 31,657,490 | ||||
| Toyota Motor Corp. sponsored ADR | 3,700,000 | 343,397,000 | ||||
| USS Co. Ltd. | 90,330 | 6,226,891 | ||||
| Yahoo! Japan Corp | 86,000 | 91,607,230 | ||||
| Yahoo! Japan Corp. New | 63,000 | 68,198,803 | ||||
| Yamato Transport Co. Ltd. | 900,000 | 14,879,030 | ||||
| TOTAL JAPAN | 4,243,250,024 | |||||
| Korea (South) – 2.7% | ||||||
| AmorePacific Corp. | 255,950 | 76,245,609 | ||||
| Cheil Communications, Inc. | 3,179 | 581,598 | ||||
| CJ Home Shopping | 100,000 | 8,860,150 | ||||
| Hana Bank | 1,000,000 | 35,919,525 | ||||
| Hyundai Department Store Co. Ltd. | 200,000 | 13,275,856 | ||||
| Hyundai Motor Co. | 1,148,596 | 84,274,345 | ||||
| Kookmin Bank sponsored ADR | 2,600,000 | 151,892,000 | ||||
| Korea Electric Power Corp. | ||||||
| sponsored ADR | 1,000,000 | 16,330,000 | ||||
| Korea Exchange Bank (a) | 3,961,310 | 43,635,101 | ||||
| LG Card Co. Ltd. (a) | 500,000 | 18,055,548 | ||||
| LG Household & Health Care Ltd. . | 400,000 | 21,839,071 | ||||
See accompanying notes which are an integral part of the financial statements.
A-21 Annual Report
| Diversified International | ||||||
| Investments - continued | ||||||
| Common Stocks continued | ||||||
| Shares | Value (Note 1) | |||||
| Korea (South) – continued | ||||||
| LG.Philips LCD Co. Ltd. | ||||||
| sponsored ADR (a) | 1,000,000 | $ 19,010,000 | ||||
| Orion Corp. | 100,000 | 19,396,543 | ||||
| Samsung Electronics Co. Ltd. | 300,000 | 158,620,622 | ||||
| Shinhan Financial Group Co. Ltd. | . | 3,949,840 | 131,661,278 | |||
| Woongjin Coway Co. Ltd. | 500,000 | 8,620,686 | ||||
| TOTAL KOREA (SOUTH) | 808,217,932 | |||||
| Luxembourg 0.1% | ||||||
| Tenaris SA sponsored ADR | 400,000 | 43,940,000 | ||||
| Mexico – 0.8% | ||||||
| America Movil SA de CV Series L | ||||||
| sponsored ADR | 3,000,000 | 78,750,000 | ||||
| Cemex SA de CV sponsored ADR | 1,000,000 | 52,070,000 | ||||
| Fomento Economico Mexicano SA de | ||||||
| CV sponsored ADR | 1,700,000 | 115,583,000 | ||||
| TOTAL MEXICO | 246,403,000 | |||||
| Netherlands – 3.4% | ||||||
| Aegon NV | 2,000,000 | 30,088,625 | ||||
| ASML Holding NV (NY Shares) (a) | . | 8,000,000 | 135,840,000 | |||
| EADS NV (d) | 2,500,000 | 86,609,688 | ||||
| Fugro NV (Certificaten Van | ||||||
| Aandelen) unit | 2,123,600 | 57,379,301 | ||||
| ING Groep NV sponsored ADR | 6,500,000 | 187,590,000 | ||||
| Koninklijke Numico NV (a) | 3,413,357 | 138,219,711 | ||||
| OPG Groep NV (A Shares) | ||||||
| (Certificaten Van Aandelen) unit | . | 523,600 | 36,592,899 | |||
| QIAGEN NV (a) | 4,000,000 | 47,600,000 | ||||
| Reed Elsevier NV sponsored ADR (d) | 4,000,000 | 108,040,000 | ||||
| VNU NV | 6,000,000 | 190,817,026 | ||||
| TOTAL NETHERLANDS | 1,018,777,250 | |||||
| Netherlands Antilles – 0.4% | ||||||
| Schlumberger Ltd. (NY Shares) | 1,152,300 | 104,594,271 | ||||
| Norway 1.0% | ||||||
| DnB NOR ASA | 18,500,000 | 189,094,682 | ||||
| Odfjell ASA: | ||||||
| (A Shares) | 1,098,000 | 21,053,720 | ||||
| (B Shares) | 1,200,000 | 20,842,299 | ||||
| Storebrand ASA (A Shares) | 7,051,661 | 64,761,258 | ||||
| TOTAL NORWAY | 295,751,959 | |||||
| Philippines – 0.0% | ||||||
| Philippine Long Distance Telephone | ||||||
| Co. sponsored ADR | 500,000 | 15,075,000 | ||||
| Poland – 0.1% | ||||||
| Polski Koncern Naftowy Orlen SA | 1,000,000 | 17,754,790 | ||||
| Portugal 0.2% | ||||||
| Brisa Auto Estradas de Portugal SA | 5,000,000 | 39,558,750 | ||||
| Portugal Telecom SGPS SA (Reg.) | 1,884,000 | 17,028,675 | ||||
| TOTAL PORTUGAL | 56,587,425 | |||||
| Shares | Value (Note 1) | |||||
| Russia 0.2% | ||||||
| Mobile TeleSystems OJSC | ||||||
| sponsored ADR | 500,000 | $ | 18,495,000 | |||
| Novatek JSC GDR (a)(f) | 1,250,000 | 28,100,000 | ||||
| TOTAL RUSSIA | 46,595,000 | |||||
| Singapore – 0.1% | ||||||
| Want Want Holdings Ltd. | 18,000,000 | 17,370,000 | ||||
| South Africa – 0.8% | ||||||
| African Bank Investments Ltd. | 4,500,000 | 13,419,523 | ||||
| Edgars Consolidated Stores Ltd. | 3,000,000 | 13,323,398 | ||||
| FirstRand Ltd. | 10,000,000 | 23,532,042 | ||||
| JD Group Ltd. | 3,000,000 | 32,078,987 | ||||
| Massmart Holdings Ltd. | 3,000,000 | 23,159,464 | ||||
| MTN Group Ltd. | 1,595,000 | 11,885,246 | ||||
| Nedbank Group Ltd | 2,100,000 | 26,758,569 | ||||
| Sasol Ltd. | 1,750,000 | 55,290,611 | ||||
| Steinhoff International Holdings Ltd. | 10,000,000 | 26,169,896 | ||||
| TOTAL SOUTH AFRICA | 225,617,736 | |||||
| Spain 3.2% | ||||||
| Actividades de Construccion y | ||||||
| Servicios SA (ACS) | 4,200,000 | 120,078,788 | ||||
| Altadis SA (Spain) | 2,976,473 | 126,308,865 | ||||
| Antena 3 Television SA | 2,852,786 | 55,468,787 | ||||
| Banco Bilbao Vizcaya Argentaria SA | ||||||
| sponsored ADR | 7,350,000 | 129,580,500 | ||||
| Compania de Distribucion Integral | ||||||
| Logista SA | 647,820 | 34,332,347 | ||||
| Fomento Construcciones y Contratas | ||||||
| SA (FOCSA) | 943,000 | 51,739,381 | ||||
| Gestevision Telecinco SA | 3,600,011 | 79,880,149 | ||||
| Grupo Ferrovial SA | 1,133,483 | 83,699,786 | ||||
| Inditex SA | 2,000,000 | 59,194,275 | ||||
| Prosegur Comp Securidad SA (Reg.) | 1,000,000 | 24,442,513 | ||||
| Telefonica SA sponsored ADR | 4,000,000 | 191,800,000 | ||||
| Union Fenosa SA | 200,000 | 6,617,100 | ||||
| TOTAL SPAIN | 963,142,491 | |||||
| Sweden 2.5% | ||||||
| Atlas Copco AB (A Shares) | 7,200,000 | 131,582,418 | ||||
| Gambro AB (A Shares) | 3,158,000 | 44,623,848 | ||||
| Hennes & Mauritz AB (H&M) | ||||||
| (B Shares) | 2,200,000 | 71,430,815 | ||||
| Modern Times Group AB (MTG) | ||||||
| (B Shares) (a) | 760,800 | 29,097,801 | ||||
| Skandia Foersaekrings AB | 11,000,000 | 54,851,128 | ||||
| Skandinaviska Enskilda Banken AB | ||||||
| (A Shares) | 2,022,000 | 37,714,641 | ||||
| SKF AB (B Shares) | 8,500,000 | 107,296,946 | ||||
| Telefonaktiebolaget LM Ericsson | ||||||
| (B Shares) sponsored ADR | 8,000,000 | 262,480,000 | ||||
| TOTAL SWEDEN | 739,077,597 | |||||
| Switzerland 11.5% | ||||||
| ABB Ltd. (Reg.) (a) | 32,000,000 | 244,750,417 | ||||
See accompanying notes which are an integral part of the financial statements.
Annual Report A-22
| Common Stocks continued | ||||
| Shares | Value (Note 1) | |||
| Switzerland – continued | ||||
| Actelion Ltd. (Reg.) (a) | 539,663 | $ 60,699,791 | ||
| Alcon, Inc. | 545,000 | 72,430,500 | ||
| Baloise Holdings AG (Reg.) | 300,000 | 15,289,144 | ||
| Compagnie Financiere Richemont | ||||
| unit | 3,500,000 | 133,169,142 | ||
| Credit Suisse Group sponsored ADR | 4,120,000 | 182,557,200 | ||
| Julius Baer Holding AG (Bearer) | 200,000 | 15,514,098 | ||
| Logitech International SA (Reg.) (a) . | 900,000 | 34,103,867 | ||
| Nestle SA (Reg.) | 1,350,000 | 402,125,432 | ||
| Nobel Biocare Holding AG | ||||
| (Switzerland) | 660,000 | 152,181,670 | ||
| Novartis AG sponsored ADR | 11,700,000 | 629,694,000 | ||
| Phonak Holding AG | 1,000,000 | 41,694,140 | ||
| Roche Holding AG (participation | ||||
| certificate) | 4,700,000 | 702,183,613 | ||
| Schindler Holding AG (Reg.) | 128,116 | 50,683,908 | ||
| Societe Generale de Surveillance | ||||
| Holding SA (SGS) (Reg.) | 175,000 | 128,960,943 | ||
| Syngenta AG: | ||||
| sponsored ADR | 2,500,000 | 53,725,000 | ||
| (Switzerland) | 200,000 | 21,440,484 | ||
| Tecan Group AG (e) | 800,000 | 29,756,041 | ||
| The Swatch Group AG (Reg.) | 3,600,000 | 102,346,507 | ||
| UBS AG (NY Shares) | 4,020,000 | 344,393,400 | ||
| TOTAL SWITZERLAND | 3,417,699,297 | |||
| Taiwan 0.6% | ||||
| Cheng Shin Rubber Industry Co. Ltd. | 3,958,000 | 2,854,823 | ||
| High Tech Computer Corp. | 2,000,000 | 21,221,108 | ||
| Taiwan Semiconductor | ||||
| Manufacturing Co. Ltd. | ||||
| sponsored ADR | 3,000,000 | 24,240,000 | ||
| United Microelectronics Corp. | ||||
| sponsored ADR | 40,000,000 | 116,800,000 | ||
| TOTAL TAIWAN | 165,115,931 | |||
| Turkey 0.1% | ||||
| Acibadem Saglik Hizmetleri AS | 2,000,000 | 13,318,535 | ||
| Yapi ve Kredi Bankasi AS (a) | 4,890,692 | 18,238,319 | ||
| TOTAL TURKEY | 31,556,854 | |||
| United Kingdom – 15.2% | ||||
| AMEC PLC | 3,500,000 | 21,130,321 | ||
| AstraZeneca PLC sponsored ADR | 2,350,000 | 105,515,000 | ||
| BAE Systems PLC | 33,000,000 | 193,094,130 | ||
| BG Group PLC | 20,000,000 | 175,628,640 | ||
| Big Yellow Group PLC | 5,000,000 | 21,245,400 | ||
| BP PLC sponsored ADR | 6,900,000 | 458,160,000 | ||
| British American Tobacco PLC | ||||
| sponsored ADR (d) | 4,500,000 | 198,315,000 | ||
| Cadbury Schweppes PLC | ||||
| sponsored ADR | 2,500,000 | 99,225,000 | ||
| Capita Group PLC | 22,000,000 | 151,904,610 | ||
| Enterprise Inns PLC | 6,000,000 | 82,803,947 | ||
| Filtrona PLC (e) | 12,000,000 | 57,309,467 | ||
| Shares | Value (Note 1) | |||||
| GlaxoSmithKline PLC sponsored ADR | 750,000 | $ | 38,992,500 | |||
| Group 4 Securicor PLC (Denmark) . | 12,816,124 | 34,172,214 | ||||
| Hammerson PLC | 863,500 | 13,636,750 | ||||
| Hilton Group PLC | 19,115,500 | 114,812,503 | ||||
| HSBC Holdings PLC sponsored ADR | 3,200,000 | 252,032,000 | ||||
| Imperial Tobacco Group PLC | 1,000,000 | 28,681,290 | ||||
| Inchcape PLC | 977,240 | 35,641,184 | ||||
| Informa PLC | 7,000,000 | 46,381,364 | ||||
| Intertek Group PLC | 4,933,747 | 62,236,536 | ||||
| ITV PLC | 35,000,000 | 64,444,380 | ||||
| Jardine Lloyd Thompson Group PLC | 1,993,488 | 16,835,099 | ||||
| Kesa Electricals PLC | 7,300,000 | 31,018,284 | ||||
| Maiden Group PLC | 1,585,000 | 3,830,413 | ||||
| Meggitt PLC | 10,000,000 | 53,556,113 | ||||
| Prudential PLC | 5,000,000 | 41,959,665 | ||||
| Punch Taverns Ltd. | 5,000,000 | 64,709,948 | ||||
| Rank Group PLC | 5,000,000 | 26,202,660 | ||||
| Reckitt Benckiser PLC | 6,500,000 | 196,440,280 | ||||
| Rio Tinto PLC (Reg.) | 1,792,061 | 68,376,094 | ||||
| Rolls Royce Group PLC | 10,000,000 | 64,621,425 | ||||
| Royal Bank of Scotland Group PLC . | 7,500,000 | 207,673,785 | ||||
| Serco Group PLC | 8,997,000 | 42,250,979 | ||||
| Signet Group PLC | 25,000,000 | 45,035,822 | ||||
| Smiths Group PLC | 7,000,000 | 113,087,494 | ||||
| Standard Chartered PLC (United | ||||||
| Kingdom) | 7,000,000 | 146,982,759 | ||||
| Taylor Nelson Sofres PLC | 6,062,020 | 22,323,607 | ||||
| Tesco PLC | 50,000,000 | 266,231,419 | ||||
| Virgin Mobile Holdings (UK) PLC | 1,000,000 | 5,311,350 | ||||
| Vodafone Group PLC sponsored ADR | 18,500,000 | 485,810,000 | ||||
| William Hill PLC | 3,500,000 | 33,120,693 | ||||
| Wolseley PLC | 2,000,000 | 40,684,941 | ||||
| WPP Group PLC | 8,000,000 | 78,816,043 | ||||
| Xstrata PLC | 5,000,000 | 114,459,593 | ||||
| Yell Group PLC | 11,000,000 | 86,176,654 | ||||
| TOTAL UNITED KINGDOM | 4,510,877,356 | |||||
| United States of America – 3.3% | ||||||
| AES Corp. (a) | 2,200,000 | 34,958,000 | ||||
| Amerada Hess Corp. | 400,000 | 50,040,000 | ||||
| Corning, Inc. (a) | 3,825,000 | 76,844,250 | ||||
| Covance, Inc. (a) | 761,000 | 37,022,650 | ||||
| Dominion Resources, Inc. | 150,000 | 11,412,000 | ||||
| Evergreen Solar, Inc. (a) | 600,000 | 4,950,000 | ||||
| Freeport McMoRan Copper & Gold, | ||||||
| Inc. Class B | 300,000 | 14,826,000 | ||||
| Global Payments, Inc. | 400,000 | 17,140,000 | ||||
| Halliburton Co. | 2,258,800 | 133,495,080 | ||||
| Harte Hanks, Inc. | 200,000 | 5,120,000 | ||||
| Newmont Mining Corp. | 3,000,000 | 127,800,000 | ||||
| Pentair, Inc. | 1,200,000 | 38,988,000 | ||||
| Phelps Dodge Corp. | 600,000 | 72,282,000 | ||||
| Rockwell Automation, Inc. | 1,285,000 | 68,297,750 | ||||
| See accompanying notes which are an integral part of the financial statements. |
| A-23 |
| Annual Report |
| Diversified International | ||||
| Investments - continued | ||||
| Common Stocks continued | ||||
| Shares | Value (Note 1) | |||
| United States of America – continued | ||||
| Shaw Group, Inc. (a) | 1,000,000 | $ 26,800,000 | ||
| Synthes, Inc. | 2,000,000 | 211,767,444 | ||
| Telewest Global, Inc. (a) | 2,200,000 | 50,182,000 | ||
| TOTAL UNITED STATES OF AMERICA | 981,925,174 | |||
| TOTAL COMMON STOCKS | ||||
| (Cost $22,079,820,405) | 28,840,423,780 | |||
| Preferred Stocks 0.7% | ||||
| Convertible Preferred Stocks 0.0% | ||||
| Canada 0.0% | ||||
| MetroPhotonics, Inc. Series 2 (h) | 198,000 | 2 | ||
| Nonconvertible Preferred Stocks 0.7% | ||||
| Germany 0.3% | ||||
| Porsche AG (non vtg.) | 140,000 | 100,946,738 | ||
| Italy 0.2% | ||||
| Banca Intesa Spa (Risp) | 11,000,000 | 47,641,921 | ||
| United Kingdom – 0.2% | ||||
| European Capital Ltd. preference | ||||
| shares (h) | 4,900,000 | 58,738,750 | ||
| Rolls Royce Group PLC Series B | 334,000,000 | 600,200 | ||
| TOTAL UNITED KINGDOM | 59,338,950 | |||
| TOTAL NONCONVERTIBLE PREFERRED STOCKS | 207,927,609 | |||
| TOTAL PREFERRED STOCKS | ||||
| (Cost $189,161,283) | 207,927,611 | |||
| Government Obligations 0.0% | ||||
| Principal | ||||
| Amount | ||||
| United States of America – 0.0% | ||||
| U.S. Treasury Bills, yield at date | ||||
| of purchase 3.38% to 3.73% | ||||
| 12/8/05 to 1/12/06 (g) | ||||
| (Cost $10,159,682) | $10,200,000 | 10,158,617 | ||
| Money Market Funds 3.1% | ||||||||||
| Shares | Value (Note 1) | |||||||||
| Fidelity Cash Central Fund, | ||||||||||
| 3.92% (b) | 642,079,533 | $ | 642,079,533 | |||||||
| Fidelity Securities Lending | ||||||||||
| Cash Central Fund, | ||||||||||
| 3.94% (b)(c) | 260,759,373 | 260,759,373 | ||||||||
| TOTAL MONEY MARKET FUNDS | ||||||||||
| (Cost $902,838,906) | 902,838,906 | |||||||||
| TOTAL INVESTMENT | ||||||||||
| PORTFOLIO 101.1% | ||||||||||
| (Cost $23,181,980,276) | 29,961,348,914 | |||||||||
| NET OTHER ASSETS (1.1)% | (324,155,935) | |||||||||
| NET ASSETS 100% | $ | 29,637,192,979 | ||||||||
| Futures Contracts | ||||||||||
| Expiration | Underlying Face | Unrealized | ||||||||
| Date | Amount at | Appreciation/ | ||||||||
| Value | (Depreciation) | |||||||||
| Purchased | ||||||||||
| Equity Index Contracts | ||||||||||
| 2,685 Nikkei 225 | ||||||||||
| Index Contracts | ||||||||||
| (Japan) (Chicago | ||||||||||
| Mercantile Exchange) | Dec. 2005 | $183,721,125 | $ 8,393,944 | |||||||
| 425 Nikkei 225 Index | ||||||||||
| Contracts (Japan) | ||||||||||
| (Osaka Stock | ||||||||||
| Exchange) | Dec. 2005 | 50,760,079 | 668,242 | |||||||
| TOTAL EQUITY INDEX | ||||||||||
| CONTRACTS | $234,481,204 | $ 9,062,186 | ||||||||
The face value of futures purchased as a percentage of net assets 0.8%
| Legend (a) Non-income producing (b) Affiliated fund that is available only to investment companies and other accounts managed by Fidelity Investments. The rate quoted is the annualized seven-day yield of the fund at period end. A complete unaudited listing of the fund’s holdings as of its most recent quarter end is available upon request. (c) Investment made with cash collateral received from securities on loan. (d) Security or a portion of the security is on loan at period end. (e) Affiliated company (f) Security exempt from registration under Rule 144A of the Securities Act of 1933. These securities may be resold in transactions exempt from registration, normally to qualified institutional buyers. At the period end, the value of these securities amounted to $28,100,000 or 0.1% of net assets. |
See accompanying notes which are an integral part of the financial statements.
Annual Report A-24
| (g) Security or a portion of the security was pledged to cover margin requirements for futures contracts. At the period end, the value of securities pledged amounted to $10,158,617. (h) Restricted securities – Investment in securities not registered under the Securities Act of 1933 (excluding 144A issues). At the end of the period, the value of restricted securities (excluding 144A issues) amounted to $60,243,252 or 0.2% of net assets. |
Additional information on each holding is as follows:
| Security | Acquisition Date | Acquisition Cost | ||||
| European Capital Ltd. preference | 8/22/05 - | |||||
| shares | 8/29/05 | $ | 59,927,350 | |||
| ITF Optical Technologies, Inc. | ||||||
| Series A | 10/11/00 | $ | 1,999,935 | |||
| MetroPhotonics, Inc. Series 2 | 9/29/00 | $ | 1,980,000 | |||
| OZ Optics Ltd. unit | 8/18/00 | $ | 1,505,520 |
Other Information
An affiliated company is a company in which the fund has ownership of at least 5% of the voting securities. Companies which are affiliates of the fund at period-end are noted in the fund’s Schedule of Investments. Transactions during the period with companies which are or were affiliates are as follows:
| Value, | Value, | |||||||||||||||
| beginning of | Sales | Dividend | end of | |||||||||||||
| Affiliates | period | Purchases | Proceeds | Income | period | |||||||||||
| Apex Silver Mines Ltd | $ 35,081,200 | $ 14,068,356 | $ | $ | $ | 40,981,000 | ||||||||||
| Beijing Media Corp. Ltd. (H Shares) | 7,035,187 | 4,450,407 | ||||||||||||||
| Big Yellow Group PLC | — | 25,082,879 | 6,939,789 | 182,717 | — | |||||||||||
| BYD Co. Ltd. (H Shares) | 27,497,039 | 4,678,849 | 4,874,061 | 681,319 | 14,060,706 | |||||||||||
| Clear Media Ltd | 26,325,687 | — | — | — | 22,908,599 | |||||||||||
| Filtrona PLC | — | 50,586,847 | — | 451,607 | 57,309,467 | |||||||||||
| INFICON Holding AG | 9,662,513 | — | 19,181,150 | — | — | |||||||||||
| Ipsos SA | 22,409,769 | 32,607,606 | — | 509,086 | 66,063,034 | |||||||||||
| Neopost SA | 82,366,279 | 37,494,562 | — | 5,655,922 | 156,956,234 | |||||||||||
| Tecan Group AG | 15,117,843 | 3,551,943 | — | 250,958 | 29,756,041 | |||||||||||
| Total | $ 218,460,330 | $ 175,106,229 | $ | 30,995,000 | $ | 7,731,609 | $ | 392,485,488 |
See accompanying notes which are an integral part of the financial statements.
A-25 Annual Report
| Diversified International | ||||||
| Financial Statements | ||||||
| Statement of Assets and Liabilities | ||||||
| October 31, 2005 | ||||||
| Assets | ||||||
| Investment in securities, at value (in- | ||||||
| cluding securities loaned of | ||||||
| $253,102,204) (cost | ||||||
| $23,181,980,276) — See | ||||||
| accompanying schedule | $ | 29,961,348,914 | ||||
| Cash | 7,377 | |||||
| Foreign currency held at value (cost | ||||||
| $53,277,535) | 53,073,223 | |||||
| Receivable for investments sold | 209,112,151 | |||||
| Receivable for fund shares sold | 55,518,753 | |||||
| Dividends receivable | 32,388,207 | |||||
| Interest receivable | 1,741,118 | |||||
| Receivable for daily variation on | ||||||
| futures contracts | 4,491,161 | |||||
| Other affiliated receivables | 35,596 | |||||
| Other receivables | 1,990,632 | |||||
| Total assets | 30,319,707,132 | |||||
| Liabilities | ||||||
| Payable for investments purchased $ | 357,028,139 | |||||
| Payable for fund shares redeemed | 31,847,674 | |||||
| Accrued management fee | 19,869,669 | |||||
| Other affiliated payables | 6,170,164 | |||||
| Other payables and accrued | ||||||
| expenses | 6,839,134 | |||||
| Collateral on securities loaned, at | ||||||
| value | 260,759,373 | |||||
| Total liabilities | 682,514,153 | |||||
| Net Assets | $ | 29,637,192,979 | ||||
| Net Assets consist of: | ||||||
| Paid in capital | $ | 22,061,535,108 | ||||
| Undistributed net investment income | 239,713,275 | |||||
| Accumulated undistributed net real- | ||||||
| ized gain (loss) on investments | ||||||
| and foreign currency transactions | 552,652,185 | |||||
| Net unrealized appreciation (de- | ||||||
| preciation) on investments and | ||||||
| assets and liabilities in foreign | ||||||
| currencies | 6,783,292,411 | |||||
| Net Assets, for 962,100,530 | ||||||
| shares outstanding | $ | 29,637,192,979 | ||||
| Net Asset Value, offering price and | ||||||
| redemption price per share | ||||||
| ($29,637,192,979 ÷ | ||||||
| 962,100,530 shares) | $ | 30.80 | ||||
| Statement of Operations | ||||||
| Year ended October 31, 2005 | ||||||
| Investment Income | ||||||
| Dividends (including $7,731,609 | ||||||
| received from affiliated issuers) | . | $ | 552,991,760 | |||
| Interest | 23,112,304 | |||||
| Security lending | 17,132,673 | |||||
| 593,236,737 | ||||||
| Less foreign taxes withheld | (56,640,029) | |||||
| Total income | 536,596,708 | |||||
| Expenses | ||||||
| Management fee | ||||||
| Basic fee | $ | 185,577,878 | ||||
| Performance adjustment | 25,036,859 | |||||
| Transfer agent fees | 62,341,047 | |||||
| Accounting and security lending | ||||||
| fees | 2,417,215 | |||||
| Independent trustees’ compensation | 115,732 | |||||
| Appreciation in deferred trustee | ||||||
| compensation account | 24,051 | |||||
| Custodian fees and expenses | 6,440,744 | |||||
| Registration fees | 1,132,160 | |||||
| Audit | 253,205 | |||||
| Legal | 47,483 | |||||
| Miscellaneous | 301,481 | |||||
| Total expenses before reductions . | 283,687,855 | |||||
| Expense reductions | (9,372,820) | 274,315,035 | ||||
| Net investment income (loss) | 262,281,673 | |||||
| Realized and Unrealized Gain | ||||||
| (Loss) | ||||||
| Net realized gain (loss) on: | ||||||
| Investment securities (net of for- | ||||||
| eign taxes of $765) (Including | ||||||
| realized gain (loss) of | ||||||
| $5,958,096 from affiliated | ||||||
| issuers) | 836,974,254 | |||||
| Foreign currency transactions | (3,687,998) | |||||
| Total net realized gain (loss) | 833,286,256 | |||||
| Change in net unrealized appreci- | ||||||
| ation (depreciation) on: | ||||||
| Investment securities (net of de- | ||||||
| crease in deferred foreign | ||||||
| taxes of $997,206) | 3,060,630,075 | |||||
| Assets and liabilities in foreign | ||||||
| currencies | (1,261,775) | |||||
| Futures contracts | 9,062,186 | |||||
| Total change in net unrealized ap- | ||||||
| preciation (depreciation) | 3,068,430,486 | |||||
| Net gain (loss) | 3,901,716,742 | |||||
| Net increase (decrease) in net as- | ||||||
| sets resulting from operations | $ | 4,163,998,415 | ||||
See accompanying notes which are an integral part of the financial statements.
Annual Report A-26
| Statement of Changes in Net Assets | ||||||||||||||||||||||||||||
| Year ended | Year ended | |||||||||||||||||||||||||||
| October 31, | October 31, | |||||||||||||||||||||||||||
| 2005 | 2004 | |||||||||||||||||||||||||||
| Increase (Decrease) in Net Assets | ||||||||||||||||||||||||||||
| Operations | ||||||||||||||||||||||||||||
| Net investment income (loss) | $ 262,281,673 | $ | 106,665,095 | |||||||||||||||||||||||||
| Net realized gain (loss) | 833,286,256 | 680,780,914 | ||||||||||||||||||||||||||
| Change in net unrealized appreciation (depreciation) | 3,068,430,486 | 1,619,684,046 | ||||||||||||||||||||||||||
| Net increase (decrease) in net assets resulting from operations | 4,163,998,415 | 2,407,130,055 | ||||||||||||||||||||||||||
| Distributions to shareholders from net investment income | (119,489,325) | (162,070,361) | ||||||||||||||||||||||||||
| Distributions to shareholders from net realized gain | (47,795,646) | — | ||||||||||||||||||||||||||
| Total distributions | (167,284,971) | (162,070,361) | ||||||||||||||||||||||||||
| Share transactions | ||||||||||||||||||||||||||||
| Proceeds from sales of shares | 10,151,395,231 | 9,058,506,235 | ||||||||||||||||||||||||||
| Reinvestment of distributions | 158,992,781 | 153,854,160 | ||||||||||||||||||||||||||
| Cost of shares redeemed | (4,573,060,649) | (3,099,431189) | ||||||||||||||||||||||||||
| Net increase (decrease) in net assets resulting from share transactions | 5,737,327,363 | 6,112,929,206 | ||||||||||||||||||||||||||
| Redemption fees | 1,089,152 | 1,687,773 | ||||||||||||||||||||||||||
| Total increase (decrease) in net assets | 9,735,129,959 | 8,359,676,673 | ||||||||||||||||||||||||||
| Net Assets | ||||||||||||||||||||||||||||
| Beginning of period | 19,902,063,020 | 11,542,386,347 | ||||||||||||||||||||||||||
| End of period (including undistributed net investment income of $239,713,275 and undistributed net investment | ||||||||||||||||||||||||||||
| income of $85,476,474, respectively) | $ 29,637,192,979 | $ 19,902,063,020 | ||||||||||||||||||||||||||
| Other Information | ||||||||||||||||||||||||||||
| Shares | ||||||||||||||||||||||||||||
| Sold | 350,205,116 | 366,041,656 | ||||||||||||||||||||||||||
| Issued in reinvestment of distributions | 5,838,883 | 6,640,238 | ||||||||||||||||||||||||||
| Redeemed | (157,193,752) | (125,764,850) | ||||||||||||||||||||||||||
| Net increase (decrease) | 198,850,247 | 246,917,044 | ||||||||||||||||||||||||||
| Financial Highlights | ||||||||||||||||||||||||||||
| Years ended October 31, | 2005 | 2004 | 2003 | 2002 | 2001 | |||||||||||||||||||||||
| Selected Per Share Data | ||||||||||||||||||||||||||||
| Net asset value, beginning of period | $ | 26.08 | $ | 22.35 | $ 16.90 | $ | 18.06 | $ | 22.98 | |||||||||||||||||||
| Income from Investment Operations | ||||||||||||||||||||||||||||
| Net investment income (loss)B | 30 | .16 | .18 | .14 | .22 | |||||||||||||||||||||||
| Net realized and unrealized gain (loss) | 4.63 | 3.87 | 5.40 | (1.29) | (3.78) | |||||||||||||||||||||||
| Total from investment operations | 4.93 | 4.03 | 5.58 | (1.15) | (3.56) | |||||||||||||||||||||||
| Distributions from net investment income | (.15) | (.30) | (.13) | (.01) | (.55) | |||||||||||||||||||||||
| Distributions from net realized gain | (.06) | — | — | — | (.81) | |||||||||||||||||||||||
| Total distributions | (.21) | (.30) | (.13) | (.01) | (1.36) | |||||||||||||||||||||||
| Redemption fees added to paid in capitalB | —D | —D | —D | —D | —D | |||||||||||||||||||||||
| Net asset value, end of period | $ | 30.80 | $ | 26.08 | $ 22.35 | $ | 16.90 | $ | 18.06 | |||||||||||||||||||
| Total ReturnA | 19.01% | 18.20% | 33.26% | (6.37)% | (16.45)% | |||||||||||||||||||||||
| Ratios to Average Net AssetsC | ||||||||||||||||||||||||||||
| Expenses before expense reductions | 1.10% | 1.15% | 1.24% | 1.22% | 1.21% | |||||||||||||||||||||||
| Expenses net of voluntary waivers, if any | 1.10% | 1.15% | 1.24% | 1.22% | 1.21% | |||||||||||||||||||||||
| Expenses net of all reductions | 1.07% | 1.12% | 1.22% | 1.19% | 1.16% | |||||||||||||||||||||||
| Net investment income (loss) | 1.02% | .66% | .96% | .77% | 1.08% | |||||||||||||||||||||||
| Supplemental Data | ||||||||||||||||||||||||||||
| Net assets, end of period (000 omitted) | $ | 29,637,193 | $ | 19,902,063 | $11,542,386 | $6,735,472 | $5,843,745 | |||||||||||||||||||||
| Portfolio turnover rate | 41% | 55% | 51% | 55% | 86% | |||||||||||||||||||||||
| ATotal returns would have been lower had certain expenses not been reduced during the periods shown. BCalculated based on average shares outstanding during the period. CExpense ratios reflect operating expenses of the fund. Expenses before reductions do not reflect amounts reimbursed by the investment adviser or reductions from brokerage service arrangements or other expense offset arrangements and do not represent the amount paid by the fund during periods when reim bursements or reductions occur. Expenses net of any voluntary waivers reflect expenses after reimbursement by the investment adviser but prior to reductions from brokerage service arrangements or other expense offset arrangements. Expenses net of all reductions represent the net expenses paid by the fund. DAmount represents less than $.01 per share. |
See accompanying notes which are an integral part of the financial statements.
A-27 Annual Report
| Aggressive International Performance: The Bottom Line |
Average annual total return reflects the change in the value of an investment, assuming reinvestment of the fund’s dividend income and capital gains (the profits earned upon the sale of securities that have grown in value) and assuming a constant rate of performance each year. The $10,000 table and the fund’s returns do not reflect the deduction of taxes that a shareholder would pay on fund distributions or the redemption of fund shares. During periods of reimbursement by Fidelity a fund’s total returns will be greater than it would be had the reimbursement not occurred. How a fund did yesterday is no guarantee of how it will do tomorrow.
| Average Annual Total Returns | ||||||
| Periods ended | Past 1 | Past 5 | Past 10 | |||
| October 31, 2005 | year | years | years | |||
| Fidelity Aggressive International Fund | 13.37% | 4.06% | 7.14% | |||
| $10,000 Over 10 Years | ||||||
Let’s say hypothetically that $10,000 was invested in Fidelity Aggressive International Fund on October 31, 1995. The chart shows how the value of your investment would have changed, and also shows how the Morgan Stanley Capital International All Country World ex USA Index performed over the same period.
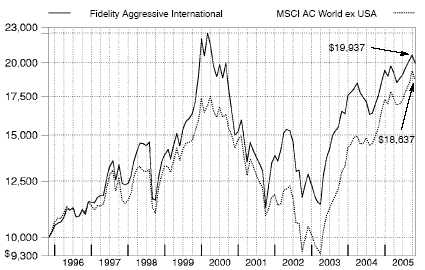
| Annual Report |
| A-28 |
| Aggressive International |
Management’s Discussion of Fund Performance
Comments from Richard Mace, Portfolio Manager of Fidelity® Aggressive International Fund
Foreign stock markets enjoyed broad based advances during the 12 month period that ended October 31, 2005, encouraged by better than expected corporate earnings and markedly improved economies. For the 12 months overall, the Morgan Stanley Capital InternationalSM Europe, Australasia, Far East (MSCI® EAFE®) Index a performance measure of developed stock markets outside the United States and Canada gained 18.28% . The Japanese stock market climbed to its highest level in more than four years. Positive economic indicators and Prime Minister Koizumi’s decisive election victory attracted record inflows from overseas investors. In response, the Tokyo Stock Exchange Stock Price Index (TOPIX) soared 22.89% . Southeast Asian equities outside of Japan, particularly South Korea, also responded well to the better macroeconomic environment, illustrated by the 19.44% return for the MSCI All Country Far East ex Japan index. European stock markets were up as well, despite investors’ concern about higher energy prices and potential downgrades to economic growth in the region. For the year overall, the MSCI Europe index rose 16.51% . Although robust, returns for U.S. investors in foreign markets were tempered somewhat by the strength of the dollar versus many major currencies.
For the 12 months ending October 31, 2005, Fidelity Aggressive International Fund returned 13.37%, while the Morgan Stanley Capital International All Country World (MSCI ACWI) ex USA Index rose 20.24% and the LipperSM International Funds Average gained 17.75% . Disappointing stock selection and an overweighting in the information technology sector especially in the lagging semiconductors group detracted the most from performance relative to the index. Taiwan based United Microelectronics and Tokyo Electron, a Japanese maker of semiconductor production equipment, both had disappointing results during most of the period, as did chip maker Taiwan Semiconductor Manufacturing. Consumer related holdings also hurt, mainly as a result of inopportune stock picking. Japanese satellite TV company SKY Perfect Communications and the U.K. based Reuters news organization were weak performers, as was Global Bio Chem Technology Group, a Chinese maker of corn based biochemical products for the food and beverage industry. On the plus side, astute stock picking in the financials and energy groups helped the fund’s solid overall performance, with names such as State Bank of India, Canadian Natural Resources and EnCana, a Canadian natural gas and oil producer, making strong contributions. Several stocks mentioned here were no longer held by the fund at period end.
Note to shareholders:
Effective January 1, 2006, an interim portfolio management team led by Michael Jenkins and composed of William Bower, Penelope Dobkin and William Kennedy has been named to manage Fidelity Aggressive International Fund while the fund’s Portfolio Manager, Richard Mace, is on a leave of absence from the firm.
The views expressed in this statement reflect those of the portfolio manager only through the end of the period of the report as stated on the cover and do not necessarily represent the views of Fidelity or any other person in the Fidelity organization. Any such views are subject to change at any time based upon market or other conditions and Fidelity disclaims any responsibility to update such views. These views may not be relied on as invest ment advice and, because investment decisions for a Fidelity fund are based on numerous factors, may not be relied on as an indication of trading intent on behalf of any Fidelity fund.
| A-29 A-29 |
| Annual Report |
| Aggressive International Investment Changes |
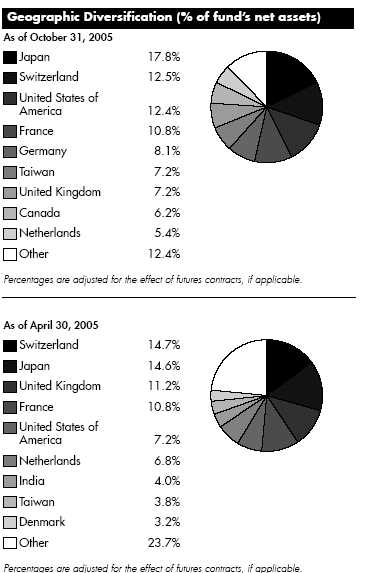
| Asset Allocation | ||||
| % of fund’s | % of fund’s net assets | |||
| net assets | 6 months ago | |||
| Stocks | 94.6 | 94.8 | ||
| Short Term Investments and Net | ||||
| Other Assets | 5.4 | 5.2 |
| Top Ten Stocks as of October 31, 2005 | ||||
| % of fund’s | % of fund’s net assets | |||
| net assets | 6 months ago | |||
| Pernod Ricard SA (France, | ||||
| Beverages) | 4.8 | 1.2 | ||
| Total SA Series B (France, Oil, | ||||
| Gas & Consumable Fuels) | 4.5 | 2.6 | ||
| Sumitomo Mitsui Financial Group, | ||||
| Inc. (Japan, Commercial Banks) | 4.4 | 2.9 | ||
| Credit Suisse Group (Reg.) | ||||
| (Switzerland, Capital Markets) | 4.3 | 2.8 | ||
| Tokyo Electron Ltd. (Japan, | ||||
| Semiconductors & | ||||
| Semiconductor Equipment) | 4.2 | 0.0 | ||
| Nikko Cordial Corp. (Japan, | ||||
| Capital Markets) | 4.0 | 0.0 | ||
| ASML Holding NV (NY Shares) | ||||
| (Netherlands, Semiconductors & | ||||
| Semiconductor Equipment) | 3.9 | 3.5 | ||
| Novartis AG (Reg.) (Switzerland, | ||||
| Pharmaceuticals) | 3.8 | 0.6 | ||
| EnCana Corp. (Canada, Oil, Gas | ||||
| & Consumable Fuels) | 3.8 | 1.3 | ||
| Allianz AG (Reg.) (Germany, | ||||
| Insurance) | 3.7 | 1.4 | ||
| 41.4 | ||||
| Market Sectors as of October 31, 2005 | ||||
| % of fund’s | % of fund’s net assets | |||
| net assets | 6 months ago | |||
| Financials | 24.0 | 23.6 | ||
| Information Technology | 22.3 | 10.6 | ||
| Energy | 16.2 | 10.4 | ||
| Health Care | 9.2 | 10.2 | ||
| Industrials | 5.3 | 8.1 | ||
| Consumer Staples | 4.8 | 4.1 | ||
| Materials | 4.7 | 4.5 | ||
| Telecommunication Services | 3.7 | 7.7 | ||
| Utilities | 3.5 | 1.3 | ||
| Consumer Discretionary | 0.9 | 14.3 | ||
Annual Report A-30
| Aggressive International | ||||||
| Investments October 31, 2005 | ||||||
| Showing Percentage of Net Assets | ||||||
| Common Stocks 94.6% | ||||||
| Shares | Value (Note 1) | |||||
| Australia 1.6% | ||||||
| BHP Billiton Ltd. sponsored ADR | 356,500 | $ 11,069,325 | ||||
| Austria 0.9% | ||||||
| OMV AG | 114,000 | 6,149,588 | ||||
| Canada 6.2% | ||||||
| EnCana Corp. | 574,480 | 26,267,502 | ||||
| Research In Motion Ltd. (a) | 142,400 | 8,756,213 | ||||
| Talisman Energy, Inc. | 189,200 | 8,380,230 | ||||
| TOTAL CANADA | 43,403,945 | |||||
| China – 0.5% | ||||||
| Weichai Power Co. Ltd. (H Shares) | 1,934,000 | 3,692,316 | ||||
| Finland – 0.8% | ||||||
| Nokia Corp. sponsored ADR | 308,500 | 5,188,970 | ||||
| France – 10.8% | ||||||
| BNP Paribas SA | 137,200 | 10,402,633 | ||||
| Pernod Ricard SA | 192,100 | 33,597,832 | ||||
| Total SA Series B | 124,593 | 31,402,420 | ||||
| TOTAL FRANCE | 75,402,885 | |||||
| Germany 8.1% | ||||||
| Allianz AG (Reg.) | 181,300 | 25,635,819 | ||||
| Deutsche Telekom AG (Reg.) | 351,900 | 6,228,630 | ||||
| E.ON AG | 272,800 | 24,723,863 | ||||
| TOTAL GERMANY | 56,588,312 | |||||
| India 3.2% | ||||||
| Cipla Ltd. | 455,177 | 3,639,295 | ||||
| Satyam Computer Services Ltd. | 770,552 | 10,309,360 | ||||
| State Bank of India | 398,704 | 8,267,955 | ||||
| TOTAL INDIA | 22,216,610 | |||||
| Ireland 1.6% | ||||||
| Ryanair Holdings PLC sponsored ADR (a) | 228,600 | 11,331,702 | ||||
| Italy 0.7% | ||||||
| Banca Intesa Spa | 1,096,300 | 5,116,140 | ||||
| Japan 17.8% | ||||||
| Credit Saison Co. Ltd. | 228,600 | 10,393,498 | ||||
| Nikko Cordial Corp. | 2,285,000 | 27,703,869 | ||||
| Nitto Denko Corp. | 146,600 | 8,899,758 | ||||
| Sumitomo Mitsui Financial Group, Inc. . | 3,352 | 31,060,896 | ||||
| Tokyo Electron Ltd. | 577,000 | 29,032,079 | ||||
| Yahoo! Japan Corp | 7,922 | 8,438,517 | ||||
| Yahoo! Japan Corp. New | 7,922 | 8,575,729 | ||||
| TOTAL JAPAN | 124,104,346 | |||||
| Korea (South) – 1.2% | ||||||
| Shinhan Financial Group Co. Ltd. | 239,820 | 7,993,997 | ||||
| Shares | Value (Note 1) | |||
| Netherlands – 5.4% | ||||
| ASML Holding NV (NY Shares) (a) | 1,583,200 | $ 26,882,736 | ||
| ING Groep NV (Certificaten Van | ||||
| Aandelen) | 362,200 | 10,453,093 | ||
| TOTAL NETHERLANDS | 37,335,829 | |||
| Norway 0.8% | ||||
| Statoil ASA | 248,200 | 5,550,738 | ||
| Singapore – 1.1% | ||||
| STATS ChipPAC Ltd. sponsored | ||||
| ADR (a)(d) | 1,335,200 | 7,490,472 | ||
| Switzerland 12.5% | ||||
| ABB Ltd. sponsored ADR (a) | 854,700 | 6,658,113 | ||
| Credit Suisse Group (Reg.) | 673,437 | 29,839,995 | ||
| Novartis AG (Reg.) | 491,863 | 26,472,066 | ||
| Roche Holding AG (participation | ||||
| certificate) | 160,685 | 24,006,462 | ||
| TOTAL SWITZERLAND | 86,976,636 | |||
| Taiwan 7.2% | ||||
| Advanced Semiconductor Engineering, | ||||
| Inc. | 25,428,000 | 15,498,640 | ||
| AU Optronics Corp. sponsored ADR | 1,303,250 | 16,616,438 | ||
| United Microelectronics Corp. sponsored | ||||
| ADR (d) | 6,202,535 | 18,111,402 | ||
| TOTAL TAIWAN | 50,226,480 | |||
| United Kingdom – 7.2% | ||||
| BP PLC | 1,346,600 | 14,902,362 | ||
| Prudential PLC | 9,904 | 83,114 | ||
| Smiths Group PLC | 960,700 | 15,520,451 | ||
| Vodafone Group PLC | 7,350,300 | 19,301,904 | ||
| TOTAL UNITED KINGDOM | 49,807,831 | |||
| United States of America – 7.0% | ||||
| Halliburton Co. | 324,600 | 19,183,860 | ||
| Lyondell Chemical Co. | 481,900 | 12,914,920 | ||
| NTL, Inc. (a) | 101,600 | 6,230,112 | ||
| Synthes, Inc. | 98,441 | 10,423,299 | ||
| TOTAL UNITED STATES OF AMERICA | 48,752,191 | |||
| TOTAL COMMON STOCKS | ||||
| (Cost $624,865,285) | 658,398,313 | |||
See accompanying notes which are an integral part of the financial statements.
A-31 Annual Report
| Aggressive International | ||||||
| Investments - continued | ||||||
| Money Market Funds 8.1% | ||||||
| Shares | Value (Note 1) | |||||
| Fidelity Cash Central Fund, | ||||||
| 3.92% (b) | 37,455,928 | $ | 37,455,928 | |||
| Fidelity Securities Lending Cash | ||||||
| Central Fund, 3.94% (b)(c) | 18,519,250 | 18,519,250 | ||||
| TOTAL MONEY MARKET FUNDS | ||||||
| (Cost $55,975,178) | 55,975,178 | |||||
| TOTAL INVESTMENT PORTFOLIO | 102.7% | |||||
| (Cost $680,840,463) | 714,373,491 | |||||
| NET OTHER ASSETS (2.7)% | (18,659,173) | |||||
| NET ASSETS 100% | $ | 695,714,318 | ||||
| Legend (a) Non-income producing (b) Affiliated fund that is available only to investment companies and other accounts managed by Fidelity Investments. The rate quoted is the annualized seven-day yield of the fund at period end. A complete unaudited listing of the fund’s holdings as of its most recent quarter end is available upon request. (c) Investment made with cash collateral received from securities on loan. (d) Security or a portion of the security is on loan at period end. |
See accompanying notes which are an integral part of the financial statements.
Annual Report A-32
| Aggressive International | ||||||||
| Financial Statements | ||||||||
| Statement of Assets and Liabilities | ||||||||
| October 31, 2005 | ||||||||
| Assets | ||||||||
| Investment in securities, at value (in- | ||||||||
| cluding securities loaned of | ||||||||
| $18,026,670) (cost | ||||||||
| $680,840,463) — See accompa- | ||||||||
| nying schedule | $ | 714,373,491 | ||||||
| Cash | 1,266,542 | |||||||
| Receivable for investments sold | 1,548,335 | |||||||
| Receivable for fund shares sold | 987,766 | |||||||
| Dividends receivable | 994,886 | |||||||
| Interest receivable | 107,024 | |||||||
| Other affiliated receivables | 20 | |||||||
| Other receivables | 526,794 | |||||||
| Total assets | 719,804,858 | |||||||
| Liabilities | ||||||||
| Payable for investments purchased | . $ | 3,244,389 | ||||||
| Payable for fund shares redeemed | . | 1,718,704 | ||||||
| Accrued management fee | 322,319 | |||||||
| Other affiliated payables | 192,094 | |||||||
| Other payables and accrued | ||||||||
| expenses | 93,784 | |||||||
| Collateral on securities loaned, at | ||||||||
| value | 18,519,250 | |||||||
| Total liabilities | 24,090,540 | |||||||
| Net Assets | $ | 695,714,318 | ||||||
| Net Assets consist of: | ||||||||
| Paid in capital | �� | $ | 587,771,857 | |||||
| Undistributed net investment income | 7,917,620 | |||||||
| Accumulated undistributed net real- | ||||||||
| ized gain (loss) on investments and | ||||||||
| foreign currency transactions | 66,513,183 | |||||||
| Net unrealized appreciation (de- | ||||||||
| preciation) on investments and | ||||||||
| assets and liabilities in foreign | ||||||||
| currencies | 33,511,658 | |||||||
| Net Assets, for 40,460,580 shares | ||||||||
| outstanding | $ | 695,714,318 | ||||||
| Net Asset Value, offering price and | ||||||||
| redemption price per share | ||||||||
| ($695,714,318 ÷ 40,460,580 | ||||||||
| shares) | $ | 17.19 | ||||||
| Statement of Operations | ||||||
| Year ended October 31, 2005 | ||||||
| Investment Income | ||||||
| Dividends | $ | 14,451,241 | ||||
| Interest | 1,056,604 | |||||
| Security lending | 557,792 | |||||
| 16,065,637 | ||||||
| Less foreign taxes withheld | (1,771,298) | |||||
| Total income | 14,294,339 | |||||
| Expenses | ||||||
| Management fee | ||||||
| Basic fee | $ | 5,057,891 | ||||
| Performance adjustment | (939,636) | |||||
| Transfer agent fees | 1,889,161 | |||||
| Accounting and security lending | ||||||
| fees | 336,275 | |||||
| Independent trustees’ compensation | 3,312 | |||||
| Custodian fees and expenses | 311,014 | |||||
| Registration fees | 40,070 | |||||
| Audit | 81,892 | |||||
| Legal | 2,066 | |||||
| Interest | 2,109 | |||||
| Miscellaneous | 29,512 | |||||
| Total expenses before reductions | 6,813,666 | |||||
| Expense reductions | (948,018) | 5,865,648 | ||||
| Net investment income (loss) | 8,428,691 | |||||
| Realized and Unrealized Gain | ||||||
| (Loss) | ||||||
| Net realized gain (loss) on: | ||||||
| Investment securities | 113,030,095 | |||||
| Foreign currency transactions | (314,887) | |||||
| Futures contracts | 182,807 | |||||
| Total net realized gain (loss) | 112,898,015 | |||||
| Change in net unrealized appreci- | ||||||
| ation (depreciation) on: | ||||||
| Investment securities | (31,419,268) | |||||
| Assets and liabilities in foreign | ||||||
| currencies | (61,372) | |||||
| Total change in net unrealized ap- | ||||||
| preciation (depreciation) | (31,480,640) | |||||
| Net gain (loss) | 81,417,375 | |||||
| Net increase (decrease) in net as- | ||||||
| sets resulting from operations | $ | 89,846,066 | ||||
See accompanying notes which are an integral part of the financial statements.
A-33 Annual Report
| Aggressive International | ||||||||||||||||||||
| Financial Statements - continued | ||||||||||||||||||||
| Statement of Changes in Net Assets | ||||||||||||||||||||
| Year ended | Year ended | |||||||||||||||||||
| October 31, | October 31, | |||||||||||||||||||
| 2005 | 2004 | |||||||||||||||||||
| Increase (Decrease) in Net Assets | ||||||||||||||||||||
| Operations | ||||||||||||||||||||
| Net investment income (loss) | $ | 8,428,691 | $ | 1,806,113 | ||||||||||||||||
| Net realized gain (loss) | 112,898,015 | 38,196,116 | ||||||||||||||||||
| Change in net unrealized appreciation (depreciation) | (31,480,640) | (10,890,917) | ||||||||||||||||||
| Net increase (decrease) in net assets resulting from operations | 89,846,066 | 29,111,312 | ||||||||||||||||||
| Distributions to shareholders from net investment income | (2,242,652) | (3,891,060) | ||||||||||||||||||
| Share transactions | ||||||||||||||||||||
| Proceeds from sales of shares | 249,436,853 | 403,776,314 | ||||||||||||||||||
| Reinvestment of distributions | 2,093,978 | 3,653,262 | ||||||||||||||||||
| Cost of shares redeemed | (364,612,526) | (266,445,863) | ||||||||||||||||||
| Net increase (decrease) in net assets resulting from share transactions | (113,081,695) | 140,983,713 | ||||||||||||||||||
| Redemption fees | 48,960 | 86,557 | ||||||||||||||||||
| Total increase (decrease) in net assets | (25,429,321) | 166,290,522 | ||||||||||||||||||
| Net Assets | ||||||||||||||||||||
| Beginning of period | 721,143,639 | 554,853,117 | ||||||||||||||||||
| End of period (including undistributed net investment income of $7,917,620 and undistributed net investment income | ||||||||||||||||||||
| of $1,698,988, respectively) | $ 695,714,318 | $ | 721,143,639 | |||||||||||||||||
| Other Information | ||||||||||||||||||||
| Shares | ||||||||||||||||||||
| Sold | 15,019,784 | 26,581,892 | ||||||||||||||||||
| Issued in reinvestment of distributions | 132,029 | 252,472 | ||||||||||||||||||
| Redeemed | (22,112,916) | (18,045,512) | ||||||||||||||||||
| Net increase (decrease) | (6,961,103) | 8,788,852 | ||||||||||||||||||
| Financial Highlights | ||||||||||||||||||||
| Years ended October 31, | 2005 | 2004 | 2003 | 2002 | 2001 | |||||||||||||||
| Selected Per Share Data | ||||||||||||||||||||
| Net asset value, beginning of period | $ 15.21 | $ 14.36 | $ | 10.78 | $ | 10.78 | $ | 15.08 | ||||||||||||
| Income from Investment Operations | ||||||||||||||||||||
| Net investment income (loss)B | 20 | .04 | .06 | .02 | .04 | |||||||||||||||
| Net realized and unrealized gain (loss) | 1.83 | .91 | 3.53 | .04 | (3.63) | |||||||||||||||
| Total from investment operations | 2.03 | .95 | 3.59 | .06 | (3.59) | |||||||||||||||
| Distributions from net investment income | (.05) | (.10) | (.01) | (.06) | (.02) | |||||||||||||||
| Distributions from net realized gain | — | — | — | — | (.70) | |||||||||||||||
| Total distributions | (.05) | (.10) | (.01) | (.06) | (.72) | |||||||||||||||
| Redemption fees added to paid in capitalB | —D | —D | —D | —D | .01 | |||||||||||||||
| Net asset value, end of period | $ 17.19 | $ 15.21 | $ | 14.36 | $ | 10.78 | $ | 10.78 | ||||||||||||
| Total ReturnA | 13.37% | 6.65% | 33.33% | .50% | (24.71)% | |||||||||||||||
| Ratios to Average Net AssetsC | ||||||||||||||||||||
| Expenses before expense reductions | 97% | 1.24% | 1.23% | 1.54% | 1.16% | |||||||||||||||
| Expenses net of voluntary waivers, if any | 97% | 1.24% | 1.23% | 1.54% | 1.16% | |||||||||||||||
| Expenses net of all reductions | 84% | 1.16% | 1.16% | 1.40% | 1.02% | |||||||||||||||
| Net investment income (loss) | 1.20% | .27% | .50% | .13% | .35% | |||||||||||||||
| Supplemental Data | ||||||||||||||||||||
| Net assets, end of period (000 omitted) | $ 695,714 | $ 721,144 | $ 554,853 | $ 298,478 | $ | 203,107 | ||||||||||||||
| Portfolio turnover rate | 185% | 161% | 212% | 188% | 242% | |||||||||||||||
| ATotal returns would have been lower had certain expenses not been reduced during the periods shown. BCalculated based on average shares outstanding during the period. CExpense ratios reflect operating expenses of the fund. Expenses before reductions do not reflect amounts reimbursed by the investment adviser or reductions from brokerage service arrangements or other expense offset arrangements and do not represent the amount paid by the fund during periods when reim bursements or reductions occur. Expenses net of any voluntary waivers reflect expenses after reimbursement by the investment adviser but prior to reductions from brokerage service arrangements or other expense offset arrangements. Expenses net of all reductions represent the net expenses paid by the fund. DAmount represents less than $.01 per share. |
See accompanying notes which are an integral part of the financial statements.
Annual Report A-34
| Overseas |
| Performance: The Bottom Line |
Average annual total return reflects the change in the value of an investment, assuming reinvestment of the fund’s dividend income and capital gains (the profits earned upon the sale of securities that have grown in value) and assuming a constant rate of performance each year. The $10,000 table and the fund’s returns do not reflect the deduction of taxes that a shareholder would pay on fund distributions or the redemption of fund shares. During periods of reimbursement by Fidelity a fund’s total returns will be greater than it would be had the reimbursement not occurred. How a fund did yesterday is no guarantee of how it will do tomorrow.
| Average Annual Total Returns | ||||||
| Periods ended | Past 1 | Past 5 | Past 10 | |||
| October 31, 2005 | year | years | years | |||
| Fidelity Overseas Fund | 17.90% | 1.53% | 6.79% | |||
| $10,000 Over 10 Years | ||||||
Let’s say hypothetically that $10,000 was invested in Fidelity Overseas Fund on October 31, 1995. The chart shows how the value of your investment would have changed, and also shows how the Morgan Stanley Capital International EAFE Index performed over the same period.
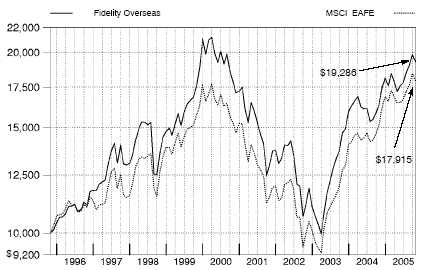
| A-35 |
| Annual Report |
| Overseas |
Management’s Discussion of Fund Performance
Comments from Richard Mace, Portfolio Manager of Fidelity® Overseas Fund
Foreign stock markets enjoyed broad based advances during the 12 month period that ended October 31, 2005, encouraged by better than expected corporate earnings and markedly improved economies. For the 12 months overall, the Morgan Stanley Capital InternationalSM Europe, Australasia, Far East (MSCI® EAFE®) Index a performance measure of developed stock markets outside the United States and Canada gained 18.28% . The Japanese stock market climbed to its highest level in more than four years. Positive economic indicators and Prime Minister Koizumi’s decisive election victory attracted record inflows from overseas investors. In response, the Tokyo Stock Exchange Stock Price Index (TOPIX) soared 22.89% . Southeast Asian equities outside of Japan, particularly South Korea, also responded well to the better macroeconomic environment, illustrated by the 19.44% return for the MSCI All Country Far East ex Japan index. European stock markets were up as well, despite investors’ concern about higher energy prices and potential downgrades to economic growth in the region. For the year overall, the MSCI Europe index rose 16.51% . Although robust, returns for U.S. investors in overseas markets were tempered somewhat by the strength of the dollar versus many major currencies.
Fidelity Overseas Fund’s return of 17.90%, while solid, was slightly behind that of its benchmark, the MSCI EAFE index, for the 12 months ending October 31, 2005. During the same period, the LipperSM International Funds Average returned 17.75% . The fund’s aggressive positioning in the still weak information technology sector particularly within the semiconductor industry was the main reason the fund lagged its index. Semiconductors and semiconductor equipment was the worst performing component of the technology sector, driven lower by excess inventories and investors’ somewhat pessimistic earnings expectations. Four of the biggest detractors were semiconductor related stocks, including Taiwan based United Microelectronics, Tokyo Electron, Germany’s Infineon Technologies and Singapore based STATS ChipPAC. Alcatel, the French telecommunications equipment maker, also had disappointing performance. On the upside, we recovered considerable ground through favorable stock selection in the financials sector, particularly among banks, insurance companies and diversified financials. The biggest contributors were Japanese securities firm Nikko Cordial, two Japanese banks Sumitomo Mitsui Financial and Mizuho Financial and German financial services giant, Allianz. Although robust, returns for U.S. investors in overseas markets were tempered somewhat by the strength of the dollar versus many major currencies. Some of the stocks men tioned here were no longer in the fund at period end.
Note to shareholders:
Effective January 1, 2006, Ian Hart has been named Portfolio Manager of Fidelity Overseas Fund, succeeding Richard Mace.
The views expressed in this statement reflect those of the portfolio manager only through the end of the period of the report as stated on the cover and do not necessarily represent the views of Fidelity or any other person in the Fidelity organization. Any such views are subject to change at any time based upon market or other conditions and Fidelity disclaims any responsibility to update such views. These views may not be relied on as invest ment advice and, because investment decisions for a Fidelity fund are based on numerous factors, may not be relied on as an indication of trading intent on behalf of any Fidelity fund.
| Annual Report |
| A-36 |
| Overseas Investment Changes |
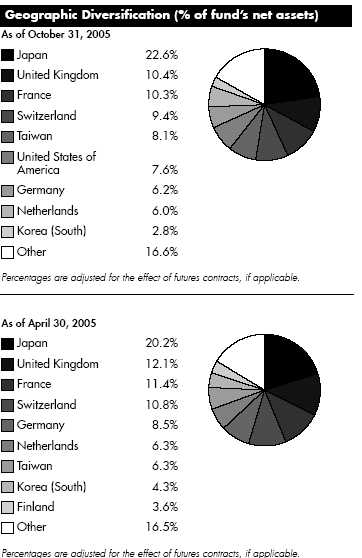
| Asset Allocation | ||||
| % of fund’s | % of fund’s net assets | |||
| net assets | 6 months ago | |||
| Stocks | 97.3 | 98.7 | ||
| Short Term Investments and Net | ||||
| Other Assets | 2.7 | 1.3 |
| Top Ten Stocks as of October 31, 2005 | ||||
| % of fund’s | % of fund’s net assets | |||
| net assets | 6 months ago | |||
| Total SA Series B (France, Oil, | ||||
| Gas & Consumable Fuels) | 3.4 | 4.5 | ||
| United Microelectronics Corp. | ||||
| (Taiwan, Semiconductors & | ||||
| Semiconductor Equipment) | 2.9 | 2.5 | ||
| ASML Holding NV (Netherlands, | ||||
| Semiconductors & | ||||
| Semiconductor Equipment) | 2.9 | 3.3 | ||
| Nikko Cordial Corp. (Japan, | ||||
| Capital Markets) | 2.6 | 1.7 | ||
| Tokyo Electron Ltd. (Japan, | ||||
| Semiconductors & | ||||
| Semiconductor Equipment) | 2.4 | 1.5 | ||
| Allianz AG (Reg.) (Germany, | ||||
| Insurance) | 2.4 | 4.0 | ||
| Toyota Motor Corp. (Japan, | ||||
| Automobiles) | 2.3 | 1.2 | ||
| Novartis AG (Reg.) (Switzerland, | ||||
| Pharmaceuticals) | 2.3 | 1.7 | ||
| Sumitomo Mitsui Financial Group, | ||||
| Inc. (Japan, Commercial Banks) | 2.0 | 1.9 | ||
| Roche Holding AG (participation | ||||
| certificate) (Switzerland, | ||||
| Pharmaceuticals) | 2.0 | 1.8 | ||
| 25.2 | ||||
| Market Sectors as of October 31, 2005 | ||||
| % of fund’s | % of fund’s net assets | |||
| net assets | 6 months ago | |||
| Financials | 25.2 | 28.3 | ||
| Information Technology | 23.4 | 25.1 | ||
| Energy | 10.6 | 9.7 | ||
| Consumer Discretionary | 9.6 | 10.0 | ||
| Health Care | 8.0 | 7.3 | ||
| Materials | 6.1 | 5.1 | ||
| Consumer Staples | 5.7 | 3.7 | ||
| Telecommunication Services | 4.7 | 6.1 | ||
| Industrials | 2.9 | 2.9 | ||
| Utilities | 1.1 | 0.5 | ||
A-37 Annual Report
| Overseas | ||||||||
| Investments October 31, 2005 | ||||||||
| Showing Percentage of Net Assets | ||||||||
| Common Stocks 97.2% | ||||||||
| Shares | Value (Note 1) | |||||||
| Austria 0.4% | ||||||||
| OMV AG | 370,600 | $ | 19,991,554 | |||||
| Canada 2.6% | ||||||||
| Alcan, Inc. | 527,900 | 16,632,649 | ||||||
| EnCana Corp. | 1,134,800 | 51,887,553 | ||||||
| Inmet Mining Corp. (a) | 494,700 | 8,272,926 | ||||||
| Research In Motion Ltd. (a) | 295,900 | 18,194,969 | ||||||
| Talisman Energy, Inc. | 680,900 | 30,159,085 | ||||||
| TOTAL CANADA | 125,147,182 | |||||||
| Cayman Islands 0.5% | ||||||||
| GlobalSantaFe Corp. | 577,700 | 25,736,535 | ||||||
| Denmark – 0.3% | ||||||||
| TDC AS | 261,200 | 14,621,242 | ||||||
| Finland – 1.4% | ||||||||
| Neste Oil Oyj | 310,300 | 9,615,479 | ||||||
| Nokia Corp. | 3,491,410 | 58,725,506 | ||||||
| TOTAL FINLAND | 68,340,985 | |||||||
| France – 10.3% | ||||||||
| Accor SA | 486,309 | 24,286,235 | ||||||
| AXA SA | 1,226,960 | 35,532,764 | ||||||
| BNP Paribas SA | 451,498 | 34,233,002 | ||||||
| France Telecom SA | 597,483 | 15,528,585 | ||||||
| L’Air Liquide SA | 37,000 | 6,728,464 | ||||||
| L’Oreal SA | 306,516 | 22,542,202 | ||||||
| Lagardere S.C.A. (Reg.) | 289,400 | 19,895,762 | ||||||
| Louis Vuitton Moet Hennessy (LVMH) . | 187,700 | 15,199,113 | ||||||
| Pernod Ricard SA | 287,700 | 50,318,047 | ||||||
| Renault SA | 191,000 | 16,542,450 | ||||||
| Sanofi Aventis sponsored ADR | 886,800 | 35,578,416 | ||||||
| Total SA Series B | 633,569 | 159,684,734 | ||||||
| Vinci SA | 147,600 | 11,536,195 | ||||||
| Vivendi Universal SA sponsored ADR . | 1,262,100 | 39,655,182 | ||||||
| TOTAL FRANCE | 487,261,151 | |||||||
| Germany 6.2% | ||||||||
| Allianz AG (Reg.) | 800,700 | 113,218,976 | ||||||
| BASF AG | 201,878 | 14,535,215 | ||||||
| Bayer AG | 97,000 | 3,375,600 | ||||||
| DaimlerChrysler AG | 199,000 | 9,959,950 | ||||||
| Deutsche Bank AG (NY Shares) | 189,800 | 17,765,280 | ||||||
| Deutsche Telekom AG sponsored ADR | 1,698,400 | 30,061,680 | ||||||
| E.ON AG | 544,191 | 49,320,028 | ||||||
| GFK AG | 127,360 | 4,221,403 | ||||||
| Hypo Real Estate Holding AG | 292,100 | 14,125,248 | ||||||
| Muenchener | ||||||||
| Rueckversicherungs Gesellschaft AG | ||||||||
| (Reg.) | 164,000 | 19,266,310 | ||||||
| SAP AG sponsored ADR | 363,700 | 15,617,278 | ||||||
| TOTAL GERMANY | 291,466,968 | |||||||
| Hong Kong – 1.6% | ||||||||
| ASM Pacific Technology Ltd. | 6,580,000 | 30,429,561 | ||||||
| Shares | Value (Note 1) | |||||
| Esprit Holdings Ltd. | 1,671,500 | $ | 11,783,578 | |||
| Hong Kong Exchanges & Clearing Ltd. | 3,853,500 | 12,874,660 | ||||
| Hutchison Whampoa Ltd. | 917,300 | 8,685,365 | ||||
| Wharf Holdings Ltd. | 3,014,000 | 10,283,704 | ||||
| TOTAL HONG KONG | 74,056,868 | |||||
| India 2.1% | ||||||
| Cipla Ltd. | 829,396 | 6,631,303 | ||||
| Housing Development Finance Corp. | ||||||
| Ltd. | 1,442,205 | 30,972,048 | ||||
| Infosys Technologies Ltd. | 587,405 | 32,869,005 | ||||
| Satyam Computer Services Ltd. | 1,749,836 | 23,411,385 | ||||
| State Bank of India | 162,962 | 3,379,355 | ||||
| TOTAL INDIA | 97,263,096 | |||||
| Ireland 0.4% | ||||||
| Allied Irish Banks PLC | 450,500 | 9,474,013 | ||||
| Ryanair Holdings PLC sponsored | ||||||
| ADR (a) | 235,300 | 11,663,821 | ||||
| TOTAL IRELAND | 21,137,834 | |||||
| Italy 2.1% | ||||||
| Banca Intesa Spa | 4,463,100 | 20,828,100 | ||||
| ENI Spa | 1,729,942 | 46,275,946 | ||||
| Mediaset Spa | 369,300 | 4,055,117 | ||||
| Telecom Italia Spa | 2,223,700 | 6,432,239 | ||||
| Unicredito Italiano Spa | 3,503,700 | 19,563,881 | ||||
| TOTAL ITALY | 97,155,283 | |||||
| Japan 22.6% | ||||||
| Advantest Corp. | 592,300 | 42,881,918 | ||||
| Aeon Co. Ltd. | 2,874,000 | 59,734,357 | ||||
| Astellas Pharma, Inc. | 368,100 | 13,229,399 | ||||
| Canon, Inc. | 427,300 | 22,676,810 | ||||
| Credit Saison Co. Ltd. | 298,300 | 13,562,469 | ||||
| Dainippon Screen Manufacturing Co. | ||||||
| Ltd. | 840,000 | 5,172,197 | ||||
| Daiwa Securities Group, Inc. | 6,342,000 | 52,121,708 | ||||
| JAFCO Co. Ltd. | 635,900 | 38,328,715 | ||||
| Millea Holdings, Inc. | 925 | 16,829,449 | ||||
| Mitsubishi Estate Co. Ltd. | 1,348,000 | 19,997,396 | ||||
| Mitsui & Co. Ltd. | 1,368,000 | 16,858,432 | ||||
| Mitsui Fudosan Co. Ltd. | 1,464,000 | 24,025,724 | ||||
| Mizuho Financial Group, Inc. | 8,378 | 56,012,357 | ||||
| Murata Manufacturing Co. Ltd. | 74,000 | 3,697,717 | ||||
| Nikko Cordial Corp. | 10,162,500 | 123,212,504 | ||||
| Nikon Corp. (d) | 2,069,000 | 26,590,137 | ||||
| Nippon Electric Glass Co. Ltd. | 735,000 | 14,098,966 | ||||
| Nitto Denko Corp. | 838,300 | 50,891,315 | ||||
| ORIX Corp. | 44,600 | 8,369,894 | ||||
| Sega Sammy Holdings, Inc. | 86,000 | 3,098,261 | ||||
| Sega Sammy Holdings, Inc. New | 233,000 | 8,454,660 | ||||
| Sompo Japan Insurance, Inc | 2,294,000 | 34,567,570 | ||||
| Sumitomo Mitsui Financial Group, Inc. | 10,317 | 95,601,212 | ||||
| T&D Holdings, Inc. | 194,700 | 12,291,918 | ||||
See accompanying notes which are an integral part of the financial statements.
Annual Report A-38
| Common Stocks continued | ||||
| Shares | Value (Note 1) | |||
| Japan continued | ||||
| Takefuji Corp. | 241,210 | $ 16,941,129 | ||
| Tokuyama Corp. | 823,000 | 8,196,414 | ||
| Tokyo Electron Ltd. | 2,310,100 | 116,233,978 | ||
| Toyota Motor Corp. | 2,350,500 | 109,074,948 | ||
| USS Co. Ltd. | 67,830 | 4,675,855 | ||
| Yahoo! Japan Corp | 25,194 | 26,836,658 | ||
| Yahoo! Japan Corp. New | 25,194 | 27,273,026 | ||
| TOTAL JAPAN | 1,071,537,093 | |||
| Korea (South) – 2.8% | ||||
| Hyundai Motor Co. | 156,886 | 11,510,979 | ||
| Kookmin Bank | 682,470 | 37,457,389 | ||
| LG Electronics, Inc. | 365,880 | 23,726,116 | ||
| LG.Philips LCD Co. Ltd. sponsored | ||||
| ADR (a) | 535,100 | 10,172,251 | ||
| Samsung Electronics Co. Ltd. | 44,520 | 23,539,300 | ||
| Shinhan Financial Group Co. Ltd. | 568,892 | 18,963,059 | ||
| Shinsegae Co. Ltd. | 26,145 | 9,366,117 | ||
| TOTAL KOREA (SOUTH) | 134,735,211 | |||
| Netherlands – 6.0% | ||||
| Aegon NV | 1,758,800 | 26,459,937 | ||
| ASML Holding NV (a) | 7,976,805 | 135,446,102 | ||
| EADS NV (d) | 349,400 | 12,104,570 | ||
| ING Groep NV (Certificaten Van | ||||
| Aandelen) | 1,626,564 | 46,942,641 | ||
| Koninklijke Philips Electronics NV (NY | ||||
| Shares) | 537,100 | 14,050,536 | ||
| Unilever NV (NY Shares) | 189,000 | 13,288,590 | ||
| VNU NV | 1,112,639 | 35,385,077 | ||
| TOTAL NETHERLANDS | 283,677,453 | |||
| Netherlands Antilles – 0.2% | ||||
| Schlumberger Ltd. (NY Shares) | 79,200 | 7,188,984 | ||
| Norway 0.3% | ||||
| Statoil ASA | 662,300 | 14,811,658 | ||
| Philippines – 0.2% | ||||
| Philippine Long Distance Telephone Co. | ||||
| sponsored ADR | 245,900 | 7,413,885 | ||
| Singapore – 1.2% | ||||
| STATS ChipPAC Ltd. (a) | 64,425,000 | 35,372,229 | ||
| United Test & Assembly Center Ltd. (a) | 64,920,000 | 23,379,402 | ||
| TOTAL SINGAPORE | 58,751,631 | |||
| Spain 1.8% | ||||
| Altadis SA (Spain) | 156,200 | 6,628,464 | ||
| Banco Bilbao Vizcaya Argentaria SA . | 919,300 | 16,207,263 | ||
| Banco Santander Central Hispano SA | 1,573,500 | 19,967,721 | ||
| Gestevision Telecinco SA | 91,800 | 2,036,938 | ||
| Telefonica SA | 2,540,374 | 40,603,634 | ||
| TOTAL SPAIN | 85,444,020 | |||
| Shares | Value (Note 1) | |||||
| Sweden 1.4% | ||||||
| Gambro AB (A Shares) | 966,800 | $ | 13,661,285 | |||
| Hennes & Mauritz AB (H&M) | ||||||
| (B Shares) | 98,950 | 3,212,763 | ||||
| Telefonaktiebolaget LM Ericsson | ||||||
| (B Shares) sponsored ADR | 1,482,500 | 48,640,825 | ||||
| TOTAL SWEDEN | 65,514,873 | |||||
| Switzerland 9.4% | ||||||
| ABB Ltd. (Reg.) (a) | 4,203,981 | 32,153,941 | ||||
| Actelion Ltd. (Reg.) (a) | 166,745 | 18,755,013 | ||||
| Compagnie Financiere Richemont unit | 602,090 | 22,908,517 | ||||
| Credit Suisse Group (Reg.) | 1,129,634 | 50,054,086 | ||||
| Nestle SA (Reg.) | 196,295 | 58,470,527 | ||||
| Novartis AG (Reg.) | 2,026,238 | 109,052,124 | ||||
| Roche Holding AG (participation | ||||||
| certificate) | 628,645 | 93,920,046 | ||||
| The Swatch Group AG (Reg.) | 250,929 | 7,133,807 | ||||
| UBS AG (Reg.) | 614,620 | 52,654,495 | ||||
| TOTAL SWITZERLAND | 445,102,556 | |||||
| Taiwan 8.1% | ||||||
| Advanced Semiconductor Engineering, | ||||||
| Inc. | 53,336,705 | 32,509,295 | ||||
| Advanced Semiconductor Engineering, | ||||||
| Inc. sponsored ADR | 660,200 | 2,020,212 | ||||
| ASE Test Ltd. (a) | 2,748,500 | 15,171,720 | ||||
| AU Optronics Corp. | 14,460,040 | 18,273,571 | ||||
| AU Optronics Corp. sponsored ADR . | 744,900 | 9,497,475 | ||||
| Chi Mei Optoelectronics Corp. | 14,057,674 | 14,119,894 | ||||
| Chi Mei Optoelectronics Corp. GDR (e) | 863,016 | 8,630,160 | ||||
| Hon Hai Precision Industry Co. Ltd. | ||||||
| (Foxconn) | 2,529,648 | 10,932,416 | ||||
| King Yuan Electronics Co. Ltd. | 27,614,595 | 16,543,325 | ||||
| Siliconware Precision Industries Co. | ||||||
| Ltd. | 50,998,752 | 45,752,424 | ||||
| Sunplus Technology Co. Ltd. | 16,652,038 | 14,517,149 | ||||
| Taiwan Semiconductor Manufacturing | ||||||
| Co. Ltd. | 27,180,226 | 42,125,442 | ||||
| United Microelectronics Corp. | 216,280,262 | 114,742,670 | ||||
| United Microelectronics Corp. | ||||||
| sponsored ADR (d) | 7,673,387 | 22,406,290 | ||||
| Yageo Corp. (a) | 52,150,000 | 15,854,135 | ||||
| TOTAL TAIWAN | 383,096,178 | |||||
| United Kingdom – 10.4% | ||||||
| Admiral Group PLC | 1,016,300 | 7,862,977 | ||||
| AstraZeneca PLC (United Kingdom) | 337,900 | 15,171,708 | ||||
| BAE Systems PLC | 2,089,200 | 12,224,614 | ||||
| BHP Billiton PLC | 3,401,775 | 50,018,296 | ||||
| BP PLC | 7,337,960 | 81,206,694 | ||||
| British American Tobacco PLC | 315,100 | 6,943,229 | ||||
| GlaxoSmithKline PLC | 1,233,000 | 32,051,840 | ||||
| HSBC Holdings PLC (United Kingdom) | ||||||
| (Reg.) | 2,940,305 | 46,315,669 | ||||
| ITV PLC | 8,564,797 | 15,770,087 | ||||
See accompanying notes which are an integral part of the financial statements.
A-39 Annual Report
| Overseas | ||||||
| Investments - continued | ||||||
| Common Stocks continued | ||||||
| Shares | Value (Note 1) | |||||
| United Kingdom – continued | ||||||
| O2 PLC | 4,991,600 | $ 18,182,906 | ||||
| Reckitt Benckiser PLC | 324,100 | 9,794,815 | ||||
| Rio Tinto PLC (Reg.) | 666,938 | 25,447,022 | ||||
| Royal Bank of Scotland Group PLC | 575,000 | 15,921,657 | ||||
| Smiths Group PLC | 1,004,100 | 16,221,593 | ||||
| Tesco PLC | 5,997,935 | 31,936,775 | ||||
| Vodafone Group PLC | 33,396,659 | 87,699,702 | ||||
| WPP Group PLC | 407,200 | 4,011,737 | ||||
| Xstrata PLC | 751,600 | 17,205,566 | ||||
| TOTAL UNITED KINGDOM | 493,986,887 | |||||
| United States of America – 4.9% | ||||||
| Advanced Energy Industries, Inc. (a) | 839,800 | 9,027,850 | ||||
| Amkor Technology, Inc. (a) | 1,084,900 | 5,728,272 | ||||
| Baker Hughes, Inc. | 113,400 | 6,232,464 | ||||
| BJ Services Co. | 208,800 | 7,255,800 | ||||
| Diamond Offshore Drilling, Inc. | 113,000 | 6,379,980 | ||||
| Freeport McMoRan Copper & Gold, | ||||||
| Inc. Class B | 329,900 | 16,303,658 | ||||
| Halliburton Co. | 254,000 | 15,011,400 | ||||
| Honeywell International, Inc. | 595,400 | 20,362,680 | ||||
| Lyondell Chemical Co. | 2,465,800 | 66,083,440 | ||||
| Nabors Industries Ltd. (a) | 97,600 | 6,698,288 | ||||
| NTL, Inc. (a) | 330,600 | 20,272,392 | ||||
| Synthes, Inc. | 359,136 | 38,026,656 | ||||
| Transocean, Inc. (a) | 113,000 | 6,496,370 | ||||
| Weatherford International Ltd. (a) | 97,600 | 6,109,760 | ||||
| TOTAL UNITED STATES OF AMERICA | 229,989,010 | |||||
| TOTAL COMMON STOCKS | ||||||
| (Cost $4,039,037,249) | 4,603,428,137 | |||||
| Nonconvertible Preferred Stocks 0.1% | ||||||
| Italy 0.1% | ||||||
| Telecom Italia Spa (Risp) | ||||||
| (Cost $6,315,858) | 2,655,700 | 6,421,161 | ||||
| Money Market Funds 3.1% | ||||||
| Shares | Value (Note 1) | |||||
| Fidelity Cash Central Fund, | ||||||
| 3.92% (b) | 126,892,116 | 126,892,116 | ||||
| Fidelity Securities Lending Cash | ||||||
| Central Fund, 3.94% (b)(c) | 17,379,408 | 17,379,408 | ||||
| TOTAL MONEY MARKET FUNDS | ||||||
| (Cost $144,271,524) | 144,271,524 | |||||
| TOTAL INVESTMENT PORTFOLIO 100.4% | ||||||
| (Cost $4,189,624,631) | 4,754,120,822 | |||||
| NET OTHER ASSETS (0.4)% | (20,324,009) | |||||
| NET ASSETS 100% | $ 4,733,796,813 | |||||
| Legend (a) Non-income producing (b) Affiliated fund that is available only to investment companies and other accounts managed by Fidelity Investments. The rate quoted is the annualized seven-day yield of the fund at period end. A complete unaudited listing of the fund’s holdings as of its most recent quarter end is available upon request. (c) Investment made with cash collateral received from securities on loan. (d) Security or a portion of the security is on loan at period end. (e) Security exempt from registration under Rule 144A of the Securities Act of 1933. These securities may be resold in transactions exempt from registration, normally to qualified institutional buyers. At the period end, the value of these securities amounted to $8,630,160 or 0.2% of net assets. |
Income Tax Information
At October 31, 2005, the fund had a capital loss carryforward of approximately $28,516,772 all of which will expire on October 31, 2010.
See accompanying notes which are an integral part of the financial statements.
Annual Report A-40
| Overseas | ||||||||
| Financial Statements | ||||||||
| Statement of Assets and Liabilities | ||||||||
| October 31, 2005 | ||||||||
| Assets | ||||||||
| Investment in securities, at value (in- | ||||||||
| cluding securities loaned of | ||||||||
| $16,921,086) (cost | ||||||||
| $4,189,624,631) — See accom- | ||||||||
| panying schedule | $ | 4,754,120,822 | ||||||
| Foreign currency held at value | ||||||||
| (cost $2) | 5 | |||||||
| Receivable for investments sold | 92,343,548 | |||||||
| Receivable for fund shares sold | 6,380,676 | |||||||
| Dividends receivable | 6,617,223 | |||||||
| Interest receivable | 517,507 | |||||||
| Other affiliated receivables | 39,330 | |||||||
| Other receivables | 629,524 | |||||||
| Total assets | 4,860,648,635 | |||||||
| Liabilities | ||||||||
| Payable for investments purchased | . $ | 100,727,054 | ||||||
| Payable for fund shares redeemed | . | 4,329,762 | ||||||
| Accrued management fee | 2,439,806 | |||||||
| Other affiliated payables | 1,292,534 | |||||||
| Other payables and accrued | ||||||||
| expenses | 683,258 | |||||||
| Collateral on securities loaned, at | ||||||||
| value | 17,379,408 | |||||||
| Total liabilities | 126,851,822 | |||||||
| Net Assets | $ | 4,733,796,813 | ||||||
| Net Assets consist of: | ||||||||
| Paid in capital | $ | 4,157,154,864 | ||||||
| Undistributed net investment income | 46,450,091 | |||||||
| Accumulated undistributed net real- | ||||||||
| ized gain (loss) on investments and | ||||||||
| foreign currency transactions | (34,025,729) | |||||||
| Net unrealized appreciation (de- | ||||||||
| preciation) on investments and | ||||||||
| assets and liabilities in foreign | ||||||||
| currencies | 564,217,587 | |||||||
| Net Assets, for 125,732,173 shares | ||||||||
| outstanding | $ | 4,733,796,813 | ||||||
| Net Asset Value, offering price and | ||||||||
| redemption price per share | ||||||||
| ($4,733,796,813 ÷ | ||||||||
| 125,732,173 shares) | $ | 37.65 | ||||||
| Statement of Operations | ||||||
| Year ended October 31, 2005 | ||||||
| Investment Income | ||||||
| Dividends | $ | 98,404,271 | ||||
| Interest | 3,068,307 | |||||
| Security lending | 3,277,370 | |||||
| 104,749,948 | ||||||
| Less foreign taxes withheld | (13,279,762) | |||||
| Total income | 91,470,186 | |||||
| Expenses | ||||||
| Management fee | ||||||
| Basic fee | $ | 33,497,148 | ||||
| Performance adjustment | (6,509,998) | |||||
| Transfer agent fees | 12,367,514 | |||||
| Accounting and security lending | ||||||
| fees | 1,519,571 | |||||
| Independent trustees’ compensation | 21,501 | |||||
| Appreciation in deferred trustee | ||||||
| compensation account | 15,081 | |||||
| Custodian fees and expenses | 1,861,715 | |||||
| Registration fees | 44,459 | |||||
| Audit | 130,341 | |||||
| Legal | 9,956 | |||||
| Interest | 9,129 | |||||
| Miscellaneous | 8,566 | |||||
| Total expenses before reductions | 42,974,983 | |||||
| Expense reductions | (2,899,427) | 40,075,556 | ||||
| Net investment income (loss) | 51,394,630 | |||||
| Realized and Unrealized Gain | ||||||
| (Loss) | ||||||
| Net realized gain (loss) on: | ||||||
| Investment securities (net of for- | ||||||
| eign taxes of $14,362) | 401,941,476 | |||||
| Foreign currency transactions | (558,862) | |||||
| Total net realized gain (loss) | 401,382,614 | |||||
| Change in net unrealized appreci- | ||||||
| ation (depreciation) on: | ||||||
| Investment securities (net of de- | ||||||
| crease in deferred foreign taxes | ||||||
| of $1,369,919) | 289,477,381 | |||||
| Assets and liabilities in foreign | ||||||
| currencies | (183,757) | |||||
| Total change in net unrealized ap- | ||||||
| preciation (depreciation) | 289,293,624 | |||||
| Net gain (loss) | 690,676,238 | |||||
| Net increase (decrease) in net as- | ||||||
| sets resulting from operations | $ | 742,070,868 | ||||
See accompanying notes which are an integral part of the financial statements.
A-41 Annual Report
| Overseas | ||||||||||||||||||||
| Financial Statements - continued | ||||||||||||||||||||
| Statement of Changes in Net Assets | ||||||||||||||||||||
| Year ended | Year ended | |||||||||||||||||||
| October 31, | October 31, | |||||||||||||||||||
| 2005 | 2004 | |||||||||||||||||||
| Increase (Decrease) in Net Assets | ||||||||||||||||||||
| Operations | ||||||||||||||||||||
| Net investment income (loss) | $ | 51,394,630 | $ | 22,336,646 | ||||||||||||||||
| Net realized gain (loss) | 401,382,614 | 339,924,402 | ||||||||||||||||||
| Change in net unrealized appreciation (depreciation) | 289,293,624 | 48,284,538 | ||||||||||||||||||
| Net increase (decrease) in net assets resulting from operations | 742,070,868 | 410,545,586 | ||||||||||||||||||
| Distributions to shareholders from net investment income | (24,791,518) | (36,930,253) | ||||||||||||||||||
| Distributions to shareholders from net realized gain | (14,353,048) | — | ||||||||||||||||||
| Total distributions | (39,144,566) | (36,930,253) | ||||||||||||||||||
| Share transactions | ||||||||||||||||||||
| Proceeds from sales of shares | 977,608,152 | 1,084,706,957 | ||||||||||||||||||
| Reinvestment of distributions | 38,479,891 | 36,240,273 | ||||||||||||||||||
| Cost of shares redeemed | (1,167,494,600) | (813,113,012) | ||||||||||||||||||
| Net increase (decrease) in net assets resulting from share transactions | (151,406,557) | 307,834,218 | ||||||||||||||||||
| Redemption fees | 173,736 | 259,688 | ||||||||||||||||||
| Total increase (decrease) in net assets | 551,693,481 | 681,709,239 | ||||||||||||||||||
| Net Assets | ||||||||||||||||||||
| Beginning of period | 4,182,103,332 | 3,500,394,093 | ||||||||||||||||||
| End of period (including undistributed net investment income of $46,450,091 and undistributed net investment in- | ||||||||||||||||||||
| come of $19,416,090, respectively) | $ 4,733,796,813 | $ 4,182,103,332 | ||||||||||||||||||
| Other Information | ||||||||||||||||||||
| Shares | ||||||||||||||||||||
| Sold | 27,631,957 | 34,493,299 | ||||||||||||||||||
| Issued in reinvestment of distributions | 1,105,744 | 1,212,455 | ||||||||||||||||||
| Redeemed | (32,826,166) | (25,819,606) | ||||||||||||||||||
| Net increase (decrease) | (4,088,465) | 9,886,148 | ||||||||||||||||||
| Financial Highlights | ||||||||||||||||||||
| Years ended October 31, | 2005 | 2004 | 2003 | 2002 | 2001 | |||||||||||||||
| Selected Per Share Data | ||||||||||||||||||||
| Net asset value, beginning of period | $ 32.21 | $ | 29.19 | $ 22.34 | $ | 25.98 | $ | 40.72 | ||||||||||||
| Income from Investment Operations | ||||||||||||||||||||
| Net investment income (loss)B | 39 | .17E | .18 | .11 | .20 | |||||||||||||||
| Net realized and unrealized gain (loss) | 5.35 | 3.15 | 6.76 | (3.75) | (9.96) | |||||||||||||||
| Total from investment operations | 5.74 | 3.32 | 6.94 | (3.64) | (9.76) | |||||||||||||||
| Distributions from net investment income | (.19) | (.30) | (.09) | — | (.86) | |||||||||||||||
| Distributions from net realized gain | (.11) | — | — | (4.12) | ||||||||||||||||
| Total distributions | (.30) | (.30) | (.09) | (4.98) | ||||||||||||||||
| Redemption fees added to paid in capitalB | —D | —D | —D | —D | —D | |||||||||||||||
| Net asset value, end of period | $ 37.65 | $ | 32.21 | $ 29.19 | $ | 22.34 | $ | 25.98 | ||||||||||||
| Total ReturnA | 17.90% | 11.45% | 31.18% | (14.01)% | (27.21)% | |||||||||||||||
| Ratios to Average Net AssetsC | ||||||||||||||||||||
| Expenses before expense reductions | 93% | 1.05% | 1.04% | 1.21% | 1.18% | |||||||||||||||
| Expenses net of voluntary waivers, if any | 93% | 1.05% | 1.04% | 1.21% | 1.18% | |||||||||||||||
| Expenses net of all reductions | 86% | 1.01% | 1.00% | 1.16% | 1.12% | |||||||||||||||
| Net investment income (loss) | 1.11% | .55%E | .75% | .42% | .63% | |||||||||||||||
| Supplemental Data | ||||||||||||||||||||
| Net assets, end of period (000 omitted) | $4,733,797 | $4,182,103 | $3,500,394 | $2,862,101 | $3,392,740 | |||||||||||||||
| Portfolio turnover rate | 87% | 79% | 104% | 72% | 95% | |||||||||||||||
| ATotal returns would have been lower had certain expenses not been reduced during the periods shown. BCalculated based on average shares outstanding during the period. CExpense ratios reflect operating expenses of the fund. Expenses before reductions do not reflect amounts reimbursed by the investment adviser or reductions from brokerage service arrangements or other expense offset arrangements and do not represent the amount paid by the fund during periods when reim bursements or reductions occur. Expenses net of any voluntary waivers reflect expenses after reimbursement by the investment adviser but prior to reductions from brokerage service arrangements or other expense offset arrangements. Expenses net of all reductions represent the net expenses paid by the fund. DAmount represents less than $.01 per share. ENet investment income per share includes approximately $.01 per share received as a result of a reorganization of an issuer that was in bankruptcy. Excluding this non recurring amount, the ratio of net investment income to average net assets would have been .52%. See accompanying notes which are an integral part of the financial statements. |
| Annual Report |
| A-42 |
| Worldwide |
| Performance: The Bottom Line |
Average annual total return reflects the change in the value of an investment, assuming reinvestment of the fund’s dividend income and capital gains (the profits earned upon the sale of securities that have grown in value) and assuming a constant rate of performance each year. The $10,000 table and the fund’s returns do not reflect the deduction of taxes that a shareholder would pay on fund distributions or the redemption of fund shares. During periods of reimbursement by Fidelity a fund’s total returns will be greater than it would be had the reimbursement not occurred. How a fund did yesterday is no guarantee of how it will do tomorrow.
| Average Annual Total Returns | ||||||
| Periods ended | Past 1 | Past 5 | Past 10 | |||
| October 31, 2005 | year | years | years | |||
| Fidelity Worldwide Fund | 14.71% | 3.46% | 8.01% | |||
| $10,000 Over 10 Years | ||||||
Let’s say hypothetically that $10,000 was invested in Fidelity Worldwide Fund on October 31, 1995. The chart shows how the value of your investment would have changed, and also shows how the Morgan Stanley Capital International World Index performed over the same period.
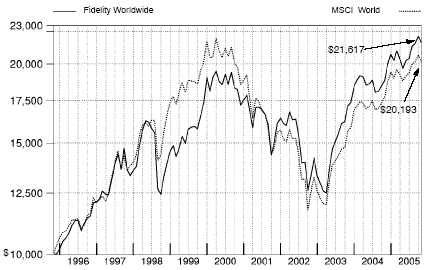
| A-43 |
| Annual Report |
| Worldwide |
Management’s Discussion of Fund Performance
Comments from Richard Mace, Lead Portfolio Manager of Fidelity® Worldwide Fund
Foreign stock markets enjoyed broad based advances during the 12 month period that ended October 31, 2005, encouraged by better than expected corporate earnings and markedly improved economies. For the 12 months overall, the Morgan Stanley Capital InternationalSM Europe, Australasia, Far East (MSCI® EAFE®) Index a performance measure of developed stock markets outside the United States and Canada gained 18.28% . The Japanese stock market climbed to its highest level in more than four years. Positive economic indicators and Prime Minister Koizumi’s decisive election victory attracted record inflows from overseas investors. In response, the Tokyo Stock Exchange Stock Price Index (TOPIX) soared 22.89% . Southeast Asian equities outside of Japan, particularly South Korea, also responded well to the better macroeconomic environment, illustrated by the 19.44% return for the MSCI All Country Far East ex Japan index. European stock markets were up as well, despite investors’ concern about higher energy prices and potential downgrades to economic growth in the region. For the year overall, the MSCI Europe index rose 16.51% . Although robust, returns for U.S. investors in foreign markets were tempered somewhat by the strength of the dollar versus many major currencies.
For the 12 months ending October 31, 2005, Fidelity Worldwide Fund returned 14.71%, outpacing both the MSCI World index, which rose 13.66%, and the LipperSM Global Funds Average, which gained 14.09% . Both the U.S. and non U.S. equity subportfolios outperformed their respective components in the benchmark. The fund’s solid overall return was driven largely by good stock picking in the financials and energy sectors, although we gave back some of that performance as a result of an aggressive positioning in the still lagging technology arena. Among foreign holdings that helped performance were such Japanese financial services stocks as Nikko Cordial and Sumitomo Mitsui, as well as Canadian oil and natural gas producer EnCana. U.S. energy services holdings Halliburton and National Oilwell Varco also boosted performance, as did independent refiner Valero Energy. Conversely, the fund gave back some of its relative gains as a result of an overweighting in Asian semiconductor stocks, with names such as Taiwan’s United Microelec tronics and Japan’s Tokyo Electron delivering disappointing results. Among U.S. equities, the lackluster performers were industrial conglomerate Tyco International and containerboard producer Smurfit Stone Container.
Note to shareholders:
Effective January 1, 2006, Jeffrey Feingold has been named Lead Portfolio Manager of Fidelity Worldwide Fund, succeeding Richard Mace. Feingold also will manage the U.S. equity portion of the fund. William Kennedy will select the fund’s non U.S. investments.
The views expressed in this statement reflect those of the portfolio managers only through the end of the period of the report as stated on the cover and do not necessarily represent the views of Fidelity or any other person in the Fidelity organization. Any such views are subject to change at any time based upon market or other conditions and Fidelity disclaims any responsibility to update such views. These views may not be relied on as invest ment advice and, because investment decisions for a Fidelity fund are based on numerous factors, may not be relied on as an indication of trading intent on behalf of any Fidelity fund.
| Annual Report |
| A-44 |
| Worldwide Investment Changes |
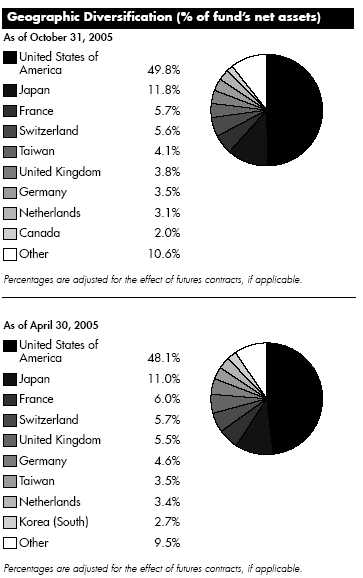
| Asset Allocation | ||||
| % of fund’s | % of fund’s net assets | |||
| net assets | 6 months ago | |||
| Stocks | 97.3 | 97.6 | ||
| Short Term Investments and Net | ||||
| Other Assets | 2.7 | 2.4 |
| Top Ten Stocks as of October 31, 2005 | ||||
| % of fund’s | % of fund’s net assets | |||
| net assets | 6 months ago | |||
| General Electric Co. (United States | ||||
| of America, Industrial | ||||
| Conglomerates) | 2.2 | 2.4 | ||
| Total SA Series B (France, Oil, | ||||
| Gas & Consumable Fuels) | 2.1 | 2.2 | ||
| American International Group, | ||||
| Inc. (United States of America, | ||||
| Insurance) | 2.1 | 1.4 | ||
| ASML Holding NV (NY Shares) | ||||
| (Netherlands, Semiconductors & | ||||
| Semiconductor Equipment) | 1.6 | 1.9 | ||
| Honeywell International, Inc. | ||||
| (United States of America, | ||||
| Aerospace & Defense) | 1.6 | 1.3 | ||
| Allianz AG (Reg.) (Germany, | ||||
| Insurance) | 1.5 | 2.5 | ||
| United Mircoelectronics Corp. | ||||
| (Taiwan, Semiconductors & | ||||
| Semiconductor Equipment) | 1.5 | 1.4 | ||
| Nikko Cordial Corp. (Japan, | ||||
| Capital Markets) | 1.4 | 1.0 | ||
| Microsoft Corp. (United States of | ||||
| America, Software) | 1.4 | 1.6 | ||
| Roche Holding AG (participation | ||||
| certificate) (Switzerland, | ||||
| Pharmaceuticals) | 1.3 | 1.0 | ||
| 16.7 | ||||
| Market Sectors as of October 31, 2005 | ||||
| % of fund’s | % of fund’s net assets | |||
| net assets | 6 months ago | |||
| Information Technology | 20.9 | 21.3 | ||
| Financials | 20.5 | 20.2 | ||
| Health Care | 11.6 | 11.9 | ||
| Energy | 10.1 | 9.0 | ||
| Consumer Discretionary | 9.4 | 8.8 | ||
| Industrials | 8.4 | 9.9 | ||
| Consumer Staples | 7.0 | 6.5 | ||
| Materials | 5.6 | 5.7 | ||
| Telecommunication Services | 2.8 | 3.7 | ||
| Utilities | 1.0 | 0.6 | ||
A-45 Annual Report
| Worldwide | ||||||||
| Investments October 31, 2005 | ||||||||
| Showing Percentage of Net Assets | ||||||||
| Common Stocks 97.2% | ||||||||
| Shares | Value (Note 1) | |||||||
| Austria 0.3% | ||||||||
| OMV AG | 75,200 | $ | 4,056,570 | |||||
| Bermuda 1.1% | ||||||||
| ACE Ltd. | 135,000 | 7,033,500 | ||||||
| Aspen Insurance Holdings Ltd. | 25,000 | 604,750 | ||||||
| Endurance Specialty Holdings Ltd. | 15,000 | 497,400 | ||||||
| Foster Wheeler Ltd. (a) | 17,000 | 480,760 | ||||||
| Lazard Ltd. Class A | 28,600 | 739,310 | ||||||
| Montpelier Re Holdings Ltd. | 25,000 | 502,500 | ||||||
| PartnerRe Ltd. | 40,000 | 2,548,800 | ||||||
| Platinum Underwriters Holdings Ltd. | 13,000 | 370,370 | ||||||
| TOTAL BERMUDA | 12,777,390 | |||||||
| Canada 2.0% | ||||||||
| Alcan, Inc. | 104,400 | 3,289,351 | ||||||
| Cognos, Inc. (a) | 15,000 | 559,356 | ||||||
| EnCana Corp. | 168,200 | 7,690,771 | ||||||
| Inmet Mining Corp. (a) | 193,400 | 3,234,251 | ||||||
| NOVA Chemicals Corp. (d) | 50,000 | 1,781,118 | ||||||
| Research In Motion Ltd. (a) | 88,800 | 5,460,335 | ||||||
| Talisman Energy, Inc. | 42,400 | 1,878,022 | ||||||
| TOTAL CANADA | 23,893,204 | |||||||
| Cayman Islands 0.3% | ||||||||
| GlobalSantaFe Corp. | 45,000 | 2,004,750 | ||||||
| Noble Corp. | 20,000 | 1,287,600 | ||||||
| TOTAL CAYMAN ISLANDS | 3,292,350 | |||||||
| China – 0.0% | ||||||||
| China Mengniu Dairy Co. Ltd. | 100,000 | 78,688 | ||||||
| Denmark – 0.2% | ||||||||
| TDC AS | 45,800 | 2,563,755 | ||||||
| Finland – 0.8% | ||||||||
| Neste Oil Oyj | 68,000 | 2,107,163 | ||||||
| Nokia Corp. sponsored ADR | 423,000 | 7,114,860 | ||||||
| TOTAL FINLAND | 9,222,023 | |||||||
| France – 5.7% | ||||||||
| Accor SA | 74,734 | 3,732,210 | ||||||
| AXA SA | 129,240 | 3,742,791 | ||||||
| BNP Paribas SA | 40,220 | 3,049,518 | ||||||
| L’Air Liquide SA | 2,800 | 509,181 | ||||||
| L’Oreal SA | 63,168 | 4,645,584 | ||||||
| Lagardere S.C.A. (Reg.) | 45,300 | 3,114,299 | ||||||
| Louis Vuitton Moet Hennessy (LVMH) | 24,800 | 2,008,194 | ||||||
| Pernod Ricard SA | 41,700 | 7,293,231 | ||||||
| Renault SA | 22,200 | 1,922,735 | ||||||
| Sanofi Aventis sponsored ADR | 91,600 | 3,674,992 | ||||||
| Total SA Series B | 100,524 | 25,336,070 | ||||||
| Vinci SA | 25,900 | 2,024,305 | ||||||
| Vivendi Universal SA sponsored ADR | 219,500 | 6,896,690 | ||||||
| TOTAL FRANCE | 67,949,800 | |||||||
| Shares | Value (Note 1) | |||||
| Germany 3.5% | ||||||
| Allianz AG (Reg.) | 127,000 | $ | 17,957,799 | |||
| BASF AG | 21,976 | 1,582,272 | ||||
| Bayer AG | 14,700 | 511,560 | ||||
| DaimlerChrysler AG | 26,500 | 1,326,325 | ||||
| Deutsche Bank AG (NY Shares) | 16,800 | 1,572,480 | ||||
| Deutsche Telekom AG sponsored ADR . | 134,100 | 2,373,570 | ||||
| E.ON AG | 81,900 | 7,422,597 | ||||
| GFK AG | 32,577 | 1,079,779 | ||||
| Hypo Real Estate Holding AG | 51,200 | 2,475,908 | ||||
| Muenchener Rueckversicherungs | ||||||
| Gesellschaft AG (Reg.) | 25,300 | 2,972,181 | ||||
| SAP AG sponsored ADR | 39,700 | 1,704,718 | ||||
| TOTAL GERMANY | 40,979,189 | |||||
| Hong Kong – 0.7% | ||||||
| ASM Pacific Technology Ltd. | 867,500 | 4,011,800 | ||||
| Esprit Holdings Ltd. | 173,500 | 1,223,123 | ||||
| Hong Kong Exchanges & Clearing Ltd. | 412,500 | 1,378,175 | ||||
| Wharf Holdings Ltd. | 457,000 | 1,559,274 | ||||
| TOTAL HONG KONG | 8,172,372 | |||||
| India 0.9% | ||||||
| Housing Development Finance Corp. | ||||||
| Ltd. | 136,990 | 2,941,926 | ||||
| Infosys Technologies Ltd. | 76,795 | 4,297,163 | ||||
| Satyam Computer Services Ltd. | 198,255 | 2,652,491 | ||||
| State Bank of India | 24,900 | 516,353 | ||||
| TOTAL INDIA | 10,407,933 | |||||
| Ireland 0.2% | ||||||
| Allied Irish Banks PLC | 31,600 | 664,548 | ||||
| Ryanair Holdings PLC sponsored ADR (a) | 45,700 | 2,265,349 | ||||
| TOTAL IRELAND | 2,929,897 | |||||
| Israel 0.3% | ||||||
| Teva Pharmaceutical Industries Ltd. | ||||||
| sponsored ADR | 80,000 | 3,049,600 | ||||
| Italy 0.9% | ||||||
| Banca Intesa Spa | 822,800 | 3,839,789 | ||||
| ENI Spa (d) | 156,351 | 4,182,389 | ||||
| Mediaset Spa | 47,000 | 516,086 | ||||
| Telecom Italia Spa | 168,500 | 487,400 | ||||
| Unicredito Italiano Spa | 265,500 | 1,482,493 | ||||
| TOTAL ITALY | 10,508,157 | |||||
| Japan 11.8% | ||||||
| Advantest Corp. | 59,500 | 4,307,740 | ||||
| Aeon Co. Ltd. | 437,100 | 9,084,860 | ||||
| Canon, Inc. | 43,600 | 2,313,852 | ||||
| Credit Saison Co. Ltd. | 46,400 | 2,109,616 | ||||
| Daiwa Securities Group, Inc. | 913,000 | 7,503,488 | ||||
| JAFCO Co. Ltd. | 36,200 | 2,181,946 | ||||
| Millea Holdings, Inc. | 196 | 3,566,024 | ||||
| Mitsubishi Estate Co. Ltd. | 215,000 | 3,189,496 | ||||
See accompanying notes which are an integral part of the financial statements.
Annual Report A-46
| Common Stocks continued | ||||||
| Shares | Value (Note 1) | |||||
| Japan continued | ||||||
| Mitsui & Co. Ltd. | 163,000 | $ | 2,008,717 | |||
| Mitsui Fudosan Co. Ltd. | 263,000 | 4,316,097 | ||||
| Mizuho Financial Group, Inc. | 1,121 | 7,494,611 | ||||
| Murata Manufacturing Co. Ltd. | 23,400 | 1,169,278 | ||||
| Nikko Cordial Corp. | 1,387,000 | 16,816,309 | ||||
| Nikon Corp. | 109,000 | 1,400,834 | ||||
| Nippon Electric Glass Co. Ltd. | 77,000 | 1,477,035 | ||||
| Nitto Denko Corp. | 110,800 | 6,726,420 | ||||
| Sega Sammy Holdings, Inc. | 17,100 | 616,050 | ||||
| Sega Sammy Holdings, Inc. New | 46,300 | 1,680,046 | ||||
| Sompo Japan Insurance, Inc | 470,000 | 7,082,283 | ||||
| Sumitomo Mitsui Financial Group, Inc. | 1,206 | 11,175,251 | ||||
| T&D Holdings, Inc. | 38,800 | 2,449,545 | ||||
| Takefuji Corp. | 39,210 | 2,753,873 | ||||
| Tokuyama Corp. | 207,000 | 2,061,552 | ||||
| Tokyo Electron Ltd. | 292,300 | 14,707,239 | ||||
| Toyota Motor Corp. | 233,100 | 10,817,005 | ||||
| USS Co. Ltd. | 13,300 | 916,834 | ||||
| Yahoo! Japan Corp | 4,170 | 4,441,885 | ||||
| Yahoo! Japan Corp. New | 4,170 | 4,514,111 | ||||
| TOTAL JAPAN | 138,881,997 | |||||
| Korea (South) – 1.8% | ||||||
| Hyundai Motor Co. | 35,531 | 2,606,967 | ||||
| Kookmin Bank | 102,080 | 5,602,664 | ||||
| LG Electronics, Inc. | 36,296 | 2,353,676 | ||||
| LG.Philips LCD Co. Ltd. sponsored | ||||||
| ADR (a) | 79,100 | 1,503,691 | ||||
| Samsung Electronics Co. Ltd. | 7,158 | 3,784,688 | ||||
| Shinhan Financial Group Co. Ltd. | 117,586 | 3,919,532 | ||||
| Shinsegae Co. Ltd. | 5,152 | 1,845,639 | ||||
| TOTAL KOREA (SOUTH) | 21,616,857 | |||||
| Marshall Islands 0.1% | ||||||
| OMI Corp. | 50,000 | 904,000 | ||||
| Netherlands – 3.1% | ||||||
| Aegon NV | 269,700 | 4,057,451 | ||||
| ASML Holding NV (NY Shares) (a) | 1,126,214 | 19,123,114 | ||||
| EADS NV | 40,800 | 1,413,470 | ||||
| ING Groep NV (Certificaten Van | ||||||
| Aandelen) | 220,500 | 6,363,631 | ||||
| Koninklijke Philips Electronics NV (NY | ||||||
| Shares) | 54,200 | 1,417,872 | ||||
| VNU NV | 118,055 | 3,754,484 | ||||
| TOTAL NETHERLANDS | 36,130,022 | |||||
| Netherlands Antilles – 0.4% | ||||||
| Schlumberger Ltd. (NY Shares) | 50,000 | 4,538,500 | ||||
| Norway 0.1% | ||||||
| Statoil ASA | 69,400 | 1,552,060 | ||||
| Panama – 0.0% | ||||||
| Carnival Corp. unit | 11,000 | 546,370 | ||||
| Shares | Value (Note 1) | |||||||
| Philippines – 0.1% | ||||||||
| Philippine Long Distance Telephone Co. | ||||||||
| sponsored ADR | 29,200 | $ | 880,380 | |||||
| Singapore – 0.6% | ||||||||
| STATS ChipPAC Ltd. (a) | 9,521,000 | 5,227,458 | ||||||
| United Test & Assembly Center Ltd. (a) | . | 3,828,000 | 1,378,564 | |||||
| TOTAL SINGAPORE | 6,606,022 | |||||||
| Spain 0.5% | ||||||||
| Altadis SA (Spain) | 11,800 | 500,742 | ||||||
| Banco Bilbao Vizcaya Argentaria SA | 63,800 | 1,124,794 | ||||||
| Banco Santander Central Hispano SA | . | 119,200 | 1,512,648 | |||||
| Gestevision Telecinco SA | 22,800 | 505,906 | ||||||
| Telefonica SA | 172,000 | 2,749,133 | ||||||
| TOTAL SPAIN | 6,393,223 | |||||||
| Sweden 1.2% | ||||||||
| Gambro AB (A Shares) | 223,800 | 3,162,387 | ||||||
| Hennes & Mauritz AB (H&M) (B Shares) | 14,950 | 485,405 | ||||||
| Telefonaktiebolaget LM Ericsson (B | ||||||||
| Shares) sponsored ADR | 310,200 | 10,177,662 | ||||||
| TOTAL SWEDEN | 13,825,454 | |||||||
| Switzerland 5.6% | ||||||||
| ABB Ltd. (Reg.) (a) | 600,000 | 4,589,070 | ||||||
| Actelion Ltd. (Reg.) (a) | 65,809 | 7,402,013 | ||||||
| Alcon, Inc. | 10,000 | 1,329,000 | ||||||
| Compagnie Financiere Richemont unit | . | 100,381 | 3,819,329 | |||||
| Credit Suisse Group (Reg.) | 220,486 | 9,769,735 | ||||||
| Nestle SA (Reg.) | 36,256 | 10,799,600 | ||||||
| Novartis AG sponsored ADR | 143,000 | 7,696,260 | ||||||
| Roche Holding AG (participation | ||||||||
| certificate) | 101,440 | 15,155,214 | ||||||
| The Swatch Group AG (Reg.) | 54,993 | 1,563,428 | ||||||
| UBS AG (NY Shares) | 53,920 | 4,619,326 | ||||||
| TOTAL SWITZERLAND | 66,742,975 | |||||||
| Taiwan 4.1% | ||||||||
| Advanced Semiconductor Engineering, | ||||||||
| Inc. | 6,696,783 | 4,081,761 | ||||||
| ASE Test Ltd. (a) | 298,700 | 1,648,824 | ||||||
| AU Optronics Corp. | 2,408,330 | 3,043,476 | ||||||
| AU Optronics Corp. sponsored ADR | 67,100 | 855,525 | ||||||
| Chi Mei Optoelectronics Corp. | 1,865,298 | 1,873,554 | ||||||
| Chi Mei Optoelectronics Corp. GDR (e) | 107,877 | 1,078,770 | ||||||
| Hon Hai Precision Industry Co. Ltd. | ||||||||
| (Foxconn) | 352,512 | 1,523,456 | ||||||
| King Yuan Electronics Co. Ltd. | 1,269,245 | 760,378 | ||||||
| Siliconware Precision Industries Co. Ltd. | 4,953,209 | 4,443,664 | ||||||
| Sunplus Technology Co. Ltd. | 1,122,072 | 978,216 | ||||||
| Taiwan Semiconductor Manufacturing | ||||||||
| Co. Ltd. | 4,911,886 | 7,612,717 | ||||||
| United Microelectronics Corp. | 23,521,266 | 12,478,683 | ||||||
See accompanying notes which are an integral part of the financial statements.
A-47 Annual Report
| Worldwide | ||||||
| Investments - continued | ||||||
| Common Stocks continued | ||||||
| Shares | Value (Note 1) | |||||
| Taiwan continued | ||||||
| United Microelectronics Corp. | ||||||
| sponsored ADR | 1,801,187 | $ | 5,259,466 | |||
| Yageo Corp. (a) | 9,346,000 | 2,841,280 | ||||
| TOTAL TAIWAN | 48,479,770 | |||||
| United Kingdom – 3.8% | ||||||
| AstraZeneca PLC sponsored ADR | 30,600 | 1,373,940 | ||||
| BAE Systems PLC | 406,900 | 2,380,909 | ||||
| BHP Billiton PLC | 524,970 | 7,718,942 | ||||
| BP PLC | 719,875 | 7,966,610 | ||||
| British American Tobacco PLC | 23,900 | 526,637 | ||||
| GlaxoSmithKline PLC sponsored ADR | 50,000 | 2,599,500 | ||||
| HSBC Holdings PLC (United Kingdom) | ||||||
| (Reg.) | 96,000 | 1,512,191 | ||||
| ITV PLC | 1,115,149 | 2,053,288 | ||||
| O2 PLC | 875,200 | 3,188,092 | ||||
| Reckitt Benckiser PLC | 24,200 | 731,362 | ||||
| Rio Tinto PLC (Reg.) | 51,162 | 1,952,086 | ||||
| Royal Bank of Scotland Group PLC | 112,600 | 3,117,876 | ||||
| Smiths Group PLC | 186,700 | 3,016,205 | ||||
| Tesco PLC | 260,600 | 1,387,598 | ||||
| Vodafone Group PLC sponsored ADR | 123,200 | 3,235,232 | ||||
| WPP Group PLC | 41,100 | 404,917 | ||||
| Xstrata PLC | 86,200 | 1,973,283 | ||||
| TOTAL UNITED KINGDOM | 45,138,668 | |||||
| United States of America – 47.1% | ||||||
| 3M Co. | 20,000 | 1,519,600 | ||||
| AES Corp. (a) | 60,000 | 953,400 | ||||
| Agilent Technologies, Inc. (a) | 158,000 | 5,057,580 | ||||
| AirTran Holdings, Inc. (a) | 80,000 | 1,196,800 | ||||
| Akamai Technologies, Inc. (a) | 30,000 | 520,200 | ||||
| Alcoa, Inc. | 30,000 | 728,700 | ||||
| Alkermes, Inc. (a) | 45,000 | 733,050 | ||||
| Allergan, Inc. | 13,000 | 1,160,900 | ||||
| ALLTEL Corp. | 15,000 | 927,900 | ||||
| Alnylam Pharmaceuticals, Inc. (a) | 85,000 | 816,850 | ||||
| Altera Corp. (a) | 30,000 | 499,500 | ||||
| Altria Group, Inc. | 80,000 | 6,004,000 | ||||
| Amerada Hess Corp. | 20,000 | 2,502,000 | ||||
| American International Group, Inc. | 390,000 | 25,272,000 | ||||
| American Tower Corp. Class A (a) | 135,000 | 3,219,750 | ||||
| Amgen, Inc. (a) | 70,000 | 5,303,200 | ||||
| Amkor Technology, Inc. (a) | 5,000 | 26,400 | ||||
| Amphenol Corp. Class A | 20,000 | 799,400 | ||||
| Analog Devices, Inc. | 57,200 | 1,989,416 | ||||
| Anteon International Corp. (a) | 25,000 | 1,130,000 | ||||
| Apartment Investment & Management | ||||||
| Co. Class A | 10,000 | 384,000 | ||||
| Apollo Group, Inc. Class A (a) | 35,000 | 2,205,700 | ||||
| Applied Materials, Inc. | 30,000 | 491,400 | ||||
| Avnet, Inc. (a) | 15,000 | 345,750 | ||||
| Bank of America Corp. | 125,000 | 5,467,500 | ||||
| Shares | Value (Note 1) | |||||
| Baxter International, Inc. | 265,000 | $ | 10,130,950 | |||
| BEA Systems, Inc. (a) | 110,000 | 970,200 | ||||
| Bear Stearns Companies, Inc. | 5,000 | 529,000 | ||||
| Biogen Idec, Inc. (a) | 35,000 | 1,422,050 | ||||
| BioMarin Pharmaceutical, Inc. (a) | 140,000 | 1,176,000 | ||||
| BJ Services Co. | 85,800 | 2,981,550 | ||||
| C.R. Bard, Inc. | 15,000 | 935,700 | ||||
| Cabot Microelectronics Corp. (a)(d) | 25,000 | 735,000 | ||||
| CBOT Holdings, Inc. Class A | 400 | 42,600 | ||||
| Cephalon, Inc. (a) | 120,000 | 5,470,800 | ||||
| Ceridian Corp. (a) | 60,000 | 1,314,600 | ||||
| Charles Schwab Corp. | 100,000 | 1,520,000 | ||||
| Chemtura Corp. | 25,000 | 267,500 | ||||
| Chevron Corp. | 70,000 | 3,994,900 | ||||
| Cisco Systems, Inc. (a) | 50,000 | 872,500 | ||||
| Citigroup, Inc. | 15,000 | 686,700 | ||||
| Clear Channel Communications, Inc. | 40,000 | 1,216,800 | ||||
| CMS Energy Corp. (a) | 80,000 | 1,192,800 | ||||
| Coca Cola Enterprises, Inc. | 40,000 | 756,000 | ||||
| Coldwater Creek, Inc. (a) | 40,000 | 1,079,600 | ||||
| Colgate Palmolive Co. | 140,000 | 7,414,400 | ||||
| Comverse Technology, Inc. (a) | 65,000 | 1,631,500 | ||||
| ConocoPhillips | 20,000 | 1,307,600 | ||||
| Covad Communications Group, Inc. (a) | 995,300 | 885,817 | ||||
| Crown Holdings, Inc. (a) | 40,000 | 648,800 | ||||
| CVS Corp. | 25,000 | 610,250 | ||||
| D.R. Horton, Inc. | 20,000 | 613,800 | ||||
| Dade Behring Holdings, Inc. | 16,000 | 576,160 | ||||
| Deere & Co. | 20,000 | 1,213,600 | ||||
| Dell, Inc. (a) | 133,400 | 4,252,792 | ||||
| Digital River, Inc. (a) | 12,000 | 336,120 | ||||
| Dionex Corp. (a) | 10,000 | 484,300 | ||||
| Doral Financial Corp. | 60,000 | 513,600 | ||||
| Dycom Industries, Inc. (a) | 50,000 | 996,500 | ||||
| E.I. du Pont de Nemours & Co. | 130,000 | 5,419,700 | ||||
| Eastman Kodak Co. | 200,200 | 4,384,380 | ||||
| eBay, Inc. (a) | 160,000 | 6,336,000 | ||||
| Ecolab, Inc. | 55,000 | 1,819,400 | ||||
| EGL, Inc. (a) | 35,000 | 981,050 | ||||
| El Paso Corp. | 85,000 | 1,008,100 | ||||
| Eli Lilly & Co. | 20,000 | 995,800 | ||||
| EMC Corp. (a) | 125,000 | 1,745,000 | ||||
| Encore Acquisition Co. (a) | 20,000 | 686,200 | ||||
| Entergy Corp. | 3,000 | 212,160 | ||||
| Equity Residential (SBI) | 25,000 | 981,250 | ||||
| Expedia, Inc., Delaware (a) | 22,050 | 414,320 | ||||
| Extreme Networks, Inc. (a) | 75,000 | 362,250 | ||||
| Exxon Mobil Corp. | 133,400 | 7,489,076 | ||||
| Fannie Mae | 60,000 | 2,851,200 | ||||
| First Data Corp. | 30,000 | 1,213,500 | ||||
| Fluor Corp. | 40,000 | 2,544,000 | ||||
| Freddie Mac | 20,000 | 1,227,000 | ||||
| Freeport McMoRan Copper & Gold, | ||||||
| Inc. Class B | 37,000 | 1,828,540 |
See accompanying notes which are an integral part of the financial statements.
Annual Report A-48
| Common Stocks continued | ||||||
| Shares | Value (Note 1) | |||||
| United States of America – continued | ||||||
| Freescale Semiconductor, Inc. Class A (a) | 120,000 | $ | 2,842,800 | |||
| Genentech, Inc. (a) | 24,000 | 2,174,400 | ||||
| General Electric Co. | 760,000 | 25,771,601 | ||||
| General Growth Properties, Inc. | 6,000 | 254,880 | ||||
| Georgia Gulf Corp. | 25,000 | 727,500 | ||||
| Google, Inc. Class A (sub. vtg.) (a) | 15,300 | 5,693,742 | ||||
| Grant Prideco, Inc. (a) | 60,000 | 2,333,400 | ||||
| Halliburton Co. | 169,900 | 10,041,090 | ||||
| Hartford Financial Services Group, Inc. | 65,000 | 5,183,750 | ||||
| Hercules Offshore, Inc. | 12,000 | 261,240 | ||||
| Hewlett Packard Co. | 210,000 | 5,888,400 | ||||
| Hexcel Corp. (a) | 40,000 | 632,800 | ||||
| Hilb Rogal & Hobbs Co. | 40,000 | 1,498,000 | ||||
| Home Depot, Inc. | 183,000 | 7,510,320 | ||||
| Honeywell International, Inc. | 550,000 | 18,810,000 | ||||
| IAC/InterActiveCorp (a) | 22,050 | 564,480 | ||||
| ImClone Systems, Inc. (a) | 40,000 | 1,388,000 | ||||
| Intel Corp. | 435,000 | 10,222,500 | ||||
| International Business Machines Corp. | 20,000 | 1,637,600 | ||||
| Interstate Bakeries Corp. (a) | 50,000 | 480,000 | ||||
| Investors Financial Services Corp. | 28,100 | 1,072,858 | ||||
| ITT Industries, Inc. | 12,000 | 1,219,200 | ||||
| Jabil Circuit, Inc. (a) | 25,000 | 746,250 | ||||
| Jacobs Engineering Group, Inc. (a) | 25,000 | 1,593,750 | ||||
| JetBlue Airways Corp. (a) | 12,000 | 223,320 | ||||
| Johnson & Johnson | 79,100 | 4,953,242 | ||||
| JPMorgan Chase & Co. | 181,100 | 6,631,882 | ||||
| K&F Industries Holdings, Inc. | 10,900 | 170,476 | ||||
| KB Home | 5,000 | 326,750 | ||||
| Kroger Co. (a) | 175,000 | 3,482,500 | ||||
| Lam Research Corp. (a) | 35,000 | 1,180,900 | ||||
| Lamar Advertising Co. Class A (a) | 99,100 | 4,421,842 | ||||
| Leap Wireless International, Inc. (a) | 15,000 | 495,150 | ||||
| Leapfrog Enterprises, Inc. Class A (a)(d) | 65,000 | 975,000 | ||||
| Lear Corp. | 3,000 | 91,380 | ||||
| Lehman Brothers Holdings, Inc. | 15,000 | 1,795,050 | ||||
| Lennox International, Inc. | 40,000 | 1,115,600 | ||||
| Lexmark International, Inc. Class A (a) . | 10,000 | 415,200 | ||||
| Lyondell Chemical Co. | 145,000 | 3,886,000 | ||||
| Maidenform Brands, Inc. | 4,500 | 56,655 | ||||
| Martin Marietta Materials, Inc. | 17,000 | 1,341,470 | ||||
| Masco Corp. | 20,000 | 570,000 | ||||
| MasTec, Inc. (a) | 60,000 | 611,400 | ||||
| Maxim Integrated Products, Inc. | 65,000 | 2,254,200 | ||||
| Maxtor Corp. (a) | 140,000 | 490,000 | ||||
| McDonald’s Corp. | 50,000 | 1,580,000 | ||||
| McKesson Corp. | 18,000 | 817,740 | ||||
| MedImmune, Inc. (a) | 80,000 | 2,798,400 | ||||
| Medtronic, Inc. | 125,000 | 7,082,500 | ||||
| Merck & Co., Inc. | 30,000 | 846,600 | ||||
| Merrill Lynch & Co., Inc. | 47,000 | 3,042,780 | ||||
| Micron Technology, Inc. (a) | 70,000 | 909,300 |
| Shares | Value (Note 1) | |||||
| Microsoft Corp. | 650,000 | $ | 16,705,000 | |||
| Monsanto Co. | 10,000 | 630,100 | ||||
| Morgan Stanley | 65,000 | 3,536,650 | ||||
| Motorola, Inc. | 87,500 | 1,939,000 | ||||
| National Financial Partners Corp. | 12,000 | 542,760 | ||||
| National Oilwell Varco, Inc. (a) | 130,904 | 8,177,573 | ||||
| National Semiconductor Corp. | 50,000 | 1,131,500 | ||||
| NAVTEQ Corp. (a) | 35,000 | 1,369,200 | ||||
| Newmont Mining Corp. | 90,000 | 3,834,000 | ||||
| News Corp.: | ||||||
| Class A | 40,800 | 581,400 | ||||
| Class B | 254,900 | 3,838,794 | ||||
| Norfolk Southern Corp. | 85,800 | 3,449,160 | ||||
| NTL, Inc. (a) | 100,000 | 6,132,000 | ||||
| Nuveen Investments, Inc. Class A | 15,000 | 607,050 | ||||
| Occidental Petroleum Corp. | 28,600 | 2,255,968 | ||||
| OfficeMax, Inc. | 45,000 | 1,260,900 | ||||
| Oracle Corp. (a) | 162,000 | 2,054,160 | ||||
| Owens Illinois, Inc. (a) | 105,000 | 1,999,200 | ||||
| Packaging Corp. of America | 30,000 | 608,700 | ||||
| Palm, Inc. (a) | 30,000 | 770,700 | ||||
| PepsiCo, Inc. | 57,200 | 3,379,376 | ||||
| PerkinElmer, Inc. | 95,000 | 2,096,650 | ||||
| Pfizer, Inc. | 340,000 | 7,391,600 | ||||
| PG&E Corp. | 30,000 | 1,091,400 | ||||
| PMC Sierra, Inc. (a) | 106,668 | 757,343 | ||||
| Praxair, Inc. | 47,000 | 2,322,270 | ||||
| Pride International, Inc. (a) | 100,000 | 2,807,000 | ||||
| Procter & Gamble Co. | 55,000 | 3,079,450 | ||||
| Psychiatric Solutions, Inc. (a) | 22,000 | 1,203,400 | ||||
| QUALCOMM, Inc. | 5,000 | 198,800 | ||||
| Quicksilver Resources, Inc. (a) | 15,000 | 580,950 | ||||
| Raytheon Co. | 25,000 | 923,750 | ||||
| Red Robin Gourmet Burgers, Inc. (a) | 15,000 | 723,450 | ||||
| Robert Half International, Inc. | 75,000 | 2,766,000 | ||||
| Rockwell Automation, Inc. | 30,000 | 1,594,500 | ||||
| Rockwood Holdings, Inc. | 65,000 | 1,304,550 | ||||
| Rohm & Haas Co. | 15,000 | 652,950 | ||||
| Ruth’s Chris Steak House, Inc. | 2,300 | 41,078 | ||||
| Safeway, Inc. | 130,000 | 3,023,800 | ||||
| SBC Communications, Inc. | 170,000 | 4,054,500 | ||||
| Schering Plough Corp. | 210,000 | 4,271,400 | ||||
| Serologicals Corp. (a) | 15,000 | 292,200 | ||||
| Service Corp. International (SCI) | 190,000 | 1,590,300 | ||||
| Sierra Health Services, Inc. (a) | 12,000 | 900,000 | ||||
| Smith International, Inc. | 50,000 | 1,620,000 | ||||
| Smurfit Stone Container Corp. (a) | 214,500 | 2,265,120 | ||||
| Southwest Airlines Co. | 100,000 | 1,601,000 | ||||
| Sovereign Bancorp, Inc. | 40,000 | 862,800 | ||||
| Sprint Nextel Corp. | 249,995 | 5,827,383 | ||||
| SPX Corp. | 2,000 | 86,040 | ||||
| Staples, Inc. | 25,000 | 568,250 | ||||
| State Street Corp. | 60,000 | 3,313,800 | ||||
| Symantec Corp. (a) | 125,000 | 2,981,250 |
See accompanying notes which are an integral part of the financial statements.
A-49 Annual Report
| Worldwide | ||||||
| Investments - continued | ||||||
| Common Stocks continued | ||||||
| Shares | Value (Note 1) | |||||
| United States of America – continued | ||||||
| Symbol Technologies, Inc. | 110,000 | $ | 913,000 | |||
| Synthes, Inc. | 70,972 | 7,514,780 | ||||
| The Boeing Co. | 20,000 | 1,292,800 | ||||
| The Chubb Corp. | 10,000 | 929,700 | ||||
| The Coca Cola Co. | 135,000 | 5,775,300 | ||||
| The Reader’s Digest Association, Inc. | ||||||
| (non vtg.) | 35,000 | 536,200 | ||||
| Thermo Electron Corp. (a) | 95,000 | 2,868,050 | ||||
| Time Warner, Inc. | 100,000 | 1,783,000 | ||||
| Toll Brothers, Inc. (a) | 10,000 | 369,100 | ||||
| TradeStation Group, Inc. (a) | 75,000 | 748,500 | ||||
| Trimble Navigation Ltd. (a) | 35,000 | 1,010,450 | ||||
| TXU Corp. | 15,000 | 1,511,250 | ||||
| Tyco International Ltd. | 335,000 | 8,840,650 | ||||
| Tyson Foods, Inc. Class A | 80,000 | 1,424,000 | ||||
| United Technologies Corp. | 30,000 | 1,538,400 | ||||
| UnitedHealth Group, Inc. | 93,000 | 5,383,770 | ||||
| Univision Communications, Inc. | ||||||
| Class A (a) | 180,300 | 4,713,042 | ||||
| US Airways Group, Inc. (a) | 23,000 | 567,640 | ||||
| Valero Energy Corp. | 30,000 | 3,157,200 | ||||
| Varian, Inc. (a) | 10,000 | 367,700 | ||||
| Verizon Communications, Inc. | 20,000 | 630,200 | ||||
| Viacom, Inc. Class B (non vtg.) | 20,000 | 619,400 | ||||
| Vishay Intertechnology, Inc. (a) | 120,000 | 1,360,800 | ||||
| W.R. Berkley Corp. | 25,000 | 1,092,500 | ||||
| Wachovia Corp. | 60,000 | 3,031,200 | ||||
| Wal Mart Stores, Inc. | 180,000 | 8,515,800 | ||||
| Walgreen Co. | 25,000 | 1,135,750 | ||||
| Walt Disney Co. | 104,900 | 2,556,413 | ||||
| Waters Corp. (a) | 80,000 | 2,896,000 | ||||
| Watsco, Inc. | 25,000 | 1,420,750 | ||||
| Watts Water Technologies, Inc. Class A | 15,000 | 416,400 | ||||
| Weatherford International Ltd. (a) | 40,000 | 2,504,000 | ||||
| WebMD Health Corp. Class A | 17,200 | 449,264 | ||||
| WESCO International, Inc. (a) | 55,000 | 2,186,250 | ||||
| Wyeth | 155,000 | 6,906,800 | ||||
| Xerox Corp. (a) | 90,000 | 1,221,300 | ||||
| XL Capital Ltd. Class A | 15,000 | 960,900 | ||||
| XTO Energy, Inc. | 30,000 | 1,303,800 | ||||
| Yahoo!, Inc. (a) | 135,000 | 4,990,950 | ||||
| Zebra Technologies Corp. Class A (a) | 30,000 | 1,293,300 | ||||
| TOTAL UNITED STATES OF AMERICA | 555,980,793 | |||||
| TOTAL COMMON STOCKS | ||||||
| (Cost $995,582,485) | 1,148,098,019 | |||||
| Nonconvertible Preferred Stocks 0.1% | ||||||
| Shares | Value (Note 1) | |||||
| Italy 0.1% | ||||||
| Telecom Italia Spa (Risp) | ||||||
| (Cost $478,499) | 201,200 | $ | 486,477 | |||
| Money Market Funds 2.9% | ||||||
| Fidelity Cash Central Fund, | ||||||
| 3.92% (b) | 27,129,155 | 27,129,155 | ||||
| Fidelity Securities Lending Cash | ||||||
| Central Fund, 3.94% (b)(c) | 7,379,430 | 7,379,430 | ||||
| TOTAL MONEY MARKET FUNDS | ||||||
| (Cost $34,508,585) | 34,508,585 | |||||
| TOTAL INVESTMENT PORTFOLIO 100.2% | ||||||
| (Cost $1,030,569,569) | 1,183,093,081 | |||||
| NET OTHER ASSETS (0.2)% | (2,049,166) | |||||
| NET ASSETS 100% | $ 1,181,043,915 | |||||
| Legend (a) Non-income producing (b) Affiliated fund that is available only to investment companies and other accounts managed by Fidelity Investments. The rate quoted is the annualized seven-day yield of the fund at period end. A complete unaudited listing of the fund’s holdings as of its most recent quarter end is available upon request. (c) Investment made with cash collateral received from securities on loan. (d) Security or a portion of the security is on loan at period end. (e) Security exempt from registration under Rule 144A of the Securities Act of 1933. These securities may be resold in transactions exempt from registration, normally to qualified institutional buyers. At the period end, the value of these securities amounted to $1,078,770 or 0.1% of net assets. |
See accompanying notes which are an integral part of the financial statements.
Annual Report A-50
| Worldwide | ||||||||
| Financial Statements | ||||||||
| Statement of Assets and Liabilities | ||||||||
| October 31, 2005 | ||||||||
| Assets | ||||||||
| Investment in securities, at value (in- | ||||||||
| cluding securities loaned of | ||||||||
| $7,168,067) (cost | ||||||||
| $1,030,569,569) — See accom- | ||||||||
| panying schedule | $ | 1,183,093,081 | ||||||
| Foreign currency held at value | ||||||||
| (cost $6) | 6 | |||||||
| Receivable for investments sold | 19,270,794 | |||||||
| Receivable for fund shares sold | 831,410 | |||||||
| Dividends receivable | 1,080,073 | |||||||
| Interest receivable | 25,476 | |||||||
| Other affiliated receivables | 86 | |||||||
| Other receivables | 141,394 | |||||||
| Total assets | 1,204,442,320 | |||||||
| Liabilities | ||||||||
| Payable for investments purchased | . $ | 13,839,515 | ||||||
| Payable for fund shares redeemed | . | 1,037,361 | ||||||
| Accrued management fee | 716,520 | |||||||
| Other affiliated payables | 299,781 | |||||||
| Other payables and accrued | ||||||||
| expenses | 125,798 | |||||||
| Collateral on securities loaned, at | ||||||||
| value | 7,379,430 | |||||||
| Total liabilities | 23,398,405 | |||||||
| Net Assets | $ | 1,181,043,915 | ||||||
| Net Assets consist of: | ||||||||
| Paid in capital | $ | 956,972,494 | ||||||
| Undistributed net investment income | 5,779,821 | |||||||
| Accumulated undistributed net real- | ||||||||
| ized gain (loss) on investments and | ||||||||
| foreign currency transactions | 65,792,983 | |||||||
| Net unrealized appreciation (de- | ||||||||
| preciation) on investments and | ||||||||
| assets and liabilities in foreign | ||||||||
| currencies | 152,498,617 | |||||||
| Net Assets, for 61,994,316 shares | ||||||||
| outstanding | $ | 1,181,043,915 | ||||||
| Net Asset Value, offering price and | ||||||||
| redemption price per share | ||||||||
| ($1,181,043,915 ÷ 61,994,316 | ||||||||
| shares) | $ | 19.05 | ||||||
| Statement of Operations | ||||||
| Year ended October 31, 2005 | ||||||
| Investment Income | ||||||
| Dividends | $ | 19,734,288 | ||||
| Special Dividends | 2,550,000 | |||||
| Interest | 293,084 | |||||
| Security lending | 442,967 | |||||
| 23,020,339 | ||||||
| Less foreign taxes withheld | (1,708,741) | |||||
| Total income | 21,311,598 | |||||
| Expenses | ||||||
| Management fee | ||||||
| Basic fee | $ | 8,363,083 | ||||
| Performance adjustment | 42,119 | |||||
| Transfer agent fees | 3,009,325 | |||||
| Accounting and security lending | ||||||
| fees | 516,763 | |||||
| Independent trustees’ compensation | 5,653 | |||||
| Custodian fees and expenses | 282,255 | |||||
| Registration fees | 31,221 | |||||
| Audit | 80,578 | |||||
| Legal | 3,737 | |||||
| Interest | 3,425 | |||||
| Miscellaneous | 14,095 | |||||
| Total expenses before reductions | 12,352,254 | |||||
| Expense reductions | (596,886) | 11,755,368 | ||||
| Net investment income (loss) | 9,556,230 | |||||
| Realized and Unrealized Gain | ||||||
| (Loss) | ||||||
| Net realized gain (loss) on: | ||||||
| Investment securities (net of for- | ||||||
| eign taxes of $30,342) | 88,552,040 | |||||
| Foreign currency transactions | 188,909 | |||||
| Total net realized gain (loss) | 88,740,949 | |||||
| Change in net unrealized appreci- | ||||||
| ation (depreciation) on: | ||||||
| Investment securities (net of de- | ||||||
| crease in deferred foreign taxes | ||||||
| of $107,734) | 57,811,050 | |||||
| Assets and liabilities in foreign | ||||||
| currencies | 15,986 | |||||
| Total change in net unrealized ap- | ||||||
| preciation (depreciation) | 57,827,036 | |||||
| Net gain (loss) | 146,567,985 | |||||
| Net increase (decrease) in net as- | ||||||
| sets resulting from operations | $ | 156,124,215 | ||||
See accompanying notes which are an integral part of the financial statements.
A-51 Annual Report
| Worldwide | ||||||||||||||||||
| Financial Statements - continued | ||||||||||||||||||
| Statement of Changes in Net Assets | ||||||||||||||||||
| Year ended | Year ended | |||||||||||||||||
| October 31, | October 31, | |||||||||||||||||
| 2005 | 2004 | |||||||||||||||||
| Increase (Decrease) in Net Assets | ||||||||||||||||||
| Operations | ||||||||||||||||||
| Net investment income (loss) | $ | 9,556,230 | $ | 2,870,466 | ||||||||||||||
| Net realized gain (loss) | 88,740,949 | 59,169,947 | ||||||||||||||||
| Change in net unrealized appreciation (depreciation) | 57,827,036 | 23,149,862 | ||||||||||||||||
| Net increase (decrease) in net assets resulting from operations | 156,124,215 | 85,190,275 | ||||||||||||||||
| Distributions to shareholders from net investment income | (6,368,718) | (4,009,737) | ||||||||||||||||
| Distributions to shareholders from net realized gain | (1,273,744) | — | ||||||||||||||||
| Total distributions | (7,642,462) | (4,009,737) | ||||||||||||||||
| Share transactions | ||||||||||||||||||
| Proceeds from sales of shares | 207,137,584 | 336,194,112 | ||||||||||||||||
| Reinvestment of distributions | 7,416,065 | 3,842,365 | ||||||||||||||||
| Cost of shares redeemed | (246,181,366) | (206,186,102) | ||||||||||||||||
| Net increase (decrease) in net assets resulting from share transactions | (31,627,717) | 133,850,375 | ||||||||||||||||
| Redemption fees | 27,535 | 44,363 | ||||||||||||||||
| Total increase (decrease) in net assets | 116,881,571 | 215,075,276 | ||||||||||||||||
| Net Assets | ||||||||||||||||||
| Beginning of period | 1,064,162,344 | 849,087,068 | ||||||||||||||||
| End of period (including undistributed net investment income of $5,779,821 and undistributed net investment income | ||||||||||||||||||
| of $2,469,918, respectively) | $ 1,181,043,915 | $ 1,064,162,344 | ||||||||||||||||
| Other Information | ||||||||||||||||||
| Shares | ||||||||||||||||||
| Sold | 11,450,556 | 20,486,089 | ||||||||||||||||
| Issued in reinvestment of distributions | 421,368 | 243,496 | ||||||||||||||||
| Redeemed | (13,517,553) | (12,574,086) | ||||||||||||||||
| Net increase (decrease) | (1,645,629) | 8,155,499 | ||||||||||||||||
| Financial Highlights | ||||||||||||||||||
| Years ended October 31, | 2005 | 2004 | 2003 | 2002 | 2001 | |||||||||||||
| Selected Per Share Data | ||||||||||||||||||
| Net asset value, beginning of period | $ 16.72 | $ 15.30 | $ | 11.91 | $ | 13.48 | $ | 19.07 | ||||||||||
| Income from Investment Operations | ||||||||||||||||||
| Net investment income (loss)B | 15C | .05F | .04 | .03 | .04 | |||||||||||||
| Net realized and unrealized gain (loss) | 2.30 | 1.44 | 3.37 | (1.60) | (2.98) | |||||||||||||
| Total from investment operations | 2.45 | 1.49 | 3.41 | (1.57) | (2.94) | |||||||||||||
| Distributions from net investment income | (.10) | (.07) | (.02) | — | (.40) | |||||||||||||
| Distributions from net realized gain | (.02) | — | — | (2.25) | ||||||||||||||
| Total distributions | (.12) | (.07) | (.02) | (2.65) | ||||||||||||||
| Redemption fees added to paid in capitalB | —E | —E | —E | —E | —E | |||||||||||||
| Net asset value, end of period | $ 19.05 | $ 16.72 | $ | 15.30 | $ | 11.91 | $ | 13.48 | ||||||||||
| Total ReturnA | 14.71% | 9.77% | 28.68% | (11.65)% | (17.21)% | |||||||||||||
| Ratios to Average Net AssetsD | ||||||||||||||||||
| Expenses before expense reductions | 1.07% | 1.23% | 1.31% | 1.24% | 1.12% | |||||||||||||
| Expenses net of voluntary waivers, if any | 1.07% | 1.23% | 1.31% | 1.24% | 1.12% | |||||||||||||
| Expenses net of all reductions | 1.01% | 1.19% | 1.28% | 1.20% | 1.05% | |||||||||||||
| Net investment income (loss) | 82%C | .29%F | .28% | .19% | .29% | |||||||||||||
| Supplemental Data | ||||||||||||||||||
| Net assets, end of period (000 omitted) | $1,181,044 | $1,064,162 | $ 849,087 | $ 647,789 | $ 742,294 | |||||||||||||
| Portfolio turnover rate | 93% | 95% | 106% | 120% | 152% | |||||||||||||
| ATotal returns would have been lower had certain expenses not been reduced during the periods shown. BCalculated based on average shares outstanding during the period. CInvestment income per share reflects a special dividend which amounted to $.04 per share. Excluding the special dividend, the ratio of net investment income to average net assets would have been .60%. DExpense ratios reflect operating expenses of the fund. Expenses before reductions do not reflect amounts reimbursed by the investment adviser or reductions from brokerage service arrangements or other expense offset arrangements and do not represent the amount paid by the fund during periods when reimbursements or reductions occur. Expenses net of any voluntary waivers reflect expenses after reimbursement by the investment adviser but prior to reductions from brokerage service arrangements or other expense offset arrangements. Expenses net of all reductions represent the net expenses paid by the fund. EAmount represents less than $.01 per share. FNet investment income per share includes approximately $.01 per share received as a result of a reorganization of an issuer that was in bankruptcy. Excluding this non recurring amount, the ratio of net investment income to average net assets would have been .25%. See accompanying notes which are an integral part of the financial statements. |
| Annual Report |
| A-52 |
| Notes to Financial Statements For the period ended October 31, 2005 |
| 1. Significant Accounting Policies. |
Fidelity Global Balanced Fund, Fidelity Diversified International Fund, Fidelity Aggressive International Fund, Fidelity Overseas Fund and Fidelity Worldwide Fund (the funds) are funds of Fidelity Investment Trust (the trust). The trust is registered under the Investment Company Act of 1940, as amended (the 1940 Act), as an open end management investment company organized as a Massachusetts business trust. Each fund is authorized to issue an unlimited number of shares. Effective the close of business on October 25, 2004, the Diversified International Fund was closed to most new accounts. Certain fund’s investments in emerging markets can be subject to social, economic, regulatory, and political uncertainties and can be ex tremely volatile. The funds may invest in affiliated money market central funds (Money Market Central Funds) which are open end investment companies available to investment companies and other accounts managed by Fidelity Management & Research Company (FMR), and its affiliates. The financial statements have been prepared in conformity with accounting principles generally accepted in the United States of America, which require management to make certain estimates and assumptions at the date of the financial statements. The following summarizes the significant accounting policies of the funds:
Security Valuation. Investments are valued and net asset value (NAV) per share is calculated (NAV calculation) as of the close of business of the New York Stock Exchange (NYSE), normally 4:00 p.m. Eastern time. Wherever possible, each fund uses independent pricing services approved by the Board of Trustees to value their investments.
Equity securities, including restricted securities, for which market quotations are readily available, are valued at the last reported sale price or official closing price as reported by an independent pricing service on the primary market or exchange on which they are traded. In the event there were no sales during the day or closing prices are not available, securities are valued at the last quoted bid price. Debt securities, including restricted securities, for which quotations are readily available, are valued by independent pricing services or by dealers who make markets in such securities. Pricing services consider yield or price of bonds of comparable quality, coupon, maturity and type as well as dealer supplied prices. Investments in open end mutual funds, are valued at their closing net asset value each business day. Short term securities with remaining maturities of sixty days or less for which quotations are not readily available are valued at amortized cost, which approximates value.
When current market prices or quotations are not readily available or do not accurately reflect fair value, valuations may be determined in accordance with procedures adopted by the Board of Trustees. For example, when developments occur between the close of a market and the close of the NYSE that may materially affect the value of some or all of the securities, or when trading in a security is halted, those securities may be fair valued. Factors used in the determination of fair value may include monitoring news to identify significant market or security specific events such as changes in the value of U.S. securities market, reviewing developments in foreign markets and evaluating the performance of ADRs, futures contracts and exchange traded funds. Because each fund’s utilization of fair value pricing depends on market activity, the frequency with which fair value pricing is used can not be predicted and may be utilized to a significant extent. The value of securities used for NAV calculation under fair value pricing may differ from published prices for the same securities.
Foreign Currency. Certain funds may use foreign currency contracts to facilitate transactions in foreign denominated securities. Losses from these transactions may arise from changes in the value of the foreign currency or if the counterparties do not perform under the contracts’ terms.
Foreign denominated assets, including investment securities, and liabilities are translated into U.S. dollars at the exchange rate at period end. Pur chases and sales of investment securities, income and dividends received and expenses denominated in foreign currencies are translated into U.S. dollars at the exchange rate in effect on the transaction date.
The effects of exchange rate fluctuations on investments are included with the net realized and unrealized gain (loss) on investment securities. Other foreign currency transactions resulting in realized and unrealized gain (loss) are disclosed separately.
Investment Transactions and Income. Security transactions are accounted for as of trade date. Gains and losses on securities sold are determined on the basis of identified cost and may include proceeds received from litigation. Dividend income is recorded on the ex dividend date, except for certain dividends from foreign securities where the ex dividend date may have passed, which are recorded as soon as the funds are informed of the ex dividend date. Non cash dividends included in dividend income, if any, are recorded at the fair market value of the securities received. Distributions received on securities that represent a return of capital or capital gain are recorded as a reduction of cost of investments and/or as a realized gain. The funds estimate the components of distributions received that may be considered return of capital distributions or capital gain distributions. Large, non recurring dividends recognized by the funds are presented separately on the Statement of Operations as “Special Dividends” and the impact of these dividends is presented in the Financial Highlights. Interest income is accrued as earned. Interest income includes coupon interest and amortiza tion of premium and accretion of discount on debt securities. Investment income is recorded net of foreign taxes withheld where recovery of such taxes is uncertain.
Expenses. Most expenses of the trust can be directly attributed to a fund. Expenses which cannot be directly attributed are apportioned among each fund in the trust.
| A-53 |
| Annual Report |
Notes to Financial Statements continued
1. Significant Accounting Policies continued
Deferred Trustee Compensation. Under a Deferred Compensation Plan (the Plan) for Overseas and Diversified International, independent Trustees must defer receipt of a portion of, and may elect to defer receipt of an additional portion of, their annual compensation. Deferred amounts are treated as though equivalent dollar amounts had been invested in shares of each applicable fund or are invested in a cross section of other Fidelity funds, and are marked to market. Deferred amounts remain in the fund until distributed in accordance with the Plan.
Income Tax Information and Distributions to Shareholders. Each year, each fund intends to qualify as a regulated investment company by distributing all of its taxable income and realized gains under Subchapter M of the Internal Revenue Code. As a result, no provision for income taxes is required in the accompanying financial statements. Foreign taxes are provided for based on each fund’s understanding of the tax rules and rates that exist in the foreign markets in which it invests.
Distributions are recorded on the ex dividend date. Income and capital gain distributions are determined in accordance with income tax regulations, which may differ from generally accepted accounting principles. In addition, certain funds will claim a portion of the payment made to redeeming shareholders as a distribution for income tax purposes.
Capital accounts within the financial statements are adjusted for permanent book tax differences. These adjustments have no impact on net assets or the results of operations. Temporary book tax differences will reverse in a subsequent period.
Book tax differences are primarily due to futures transactions, foreign currency transactions, certain foreign taxes, passive foreign investment companies (PFIC), prior period premium and discount on debt securities, market discount, capital loss carryforwards and losses deferred due to wash sales.
The tax basis components of distributable earnings and the federal tax cost as of period end were as follows for each fund:
| Cost for Federal | Net Unrealized | |||||||||
| Income Tax | Unrealized | Unrealized | Appreciation/ | |||||||
| Purposes | Appreciation | Depreciation | (Depreciation) | |||||||
| Global Balanced | $ 171,078,396 | $ 23,355,911 | $ (3,489,868) | $ | 19,866,043 | |||||
| Diversified International | 23,403,784,562 | 6,991,854,836 | (434,290,484) | 6,557,564,352 | ||||||
| Aggressive International | 681,501,646 | 60,892,376 | (28,020,531) | 32,871,845 | ||||||
| Overseas | 4,226,363,733 | 694,786,890 | (167,029,801) | 527,757,089 | ||||||
| Worldwide | 1,035,764,734 | 182,657,614 | (35,329,267) | 147,328,347 | ||||||
| Undistributed | ||||||||||
| Undistributed | Long-term Capital | Capital Loss | ||||||||
| Ordinary Income | Gain | Carryforward | ||||||||
| Global Balanced | $ 5,338,365 | $ 10,714,351 | $ | — | ||||||
| Diversified International | 280,636,329 | 647,258,145 | — | |||||||
| Aggressive International | 7,141,351 | 60,566,975 | — | |||||||
| Overseas | 65,881,417 | — | (28,516,772) | |||||||
| Worldwide | 9,540,133 | 59,686,062 | — | |||||||
| The tax character of distributions paid was as follows: | ||||||||||||
| October 31, 2005 | ||||||||||||
| Ordinary | Long-term | Return of | ||||||||||
| Income | Capital Gains | Capital | Total | |||||||||
| Global Balanced | $ 2,039,758 | $ | 1,238,422 | $ | — | $ 3,278,180 | ||||||
| Diversified International | 167,284,971 | — | — | 167,284,971 | ||||||||
| Aggressive International | 2,242,652 | — | — | 2,242,652 | ||||||||
| Overseas | 39,144,566 | — | — | 39,144,566 | ||||||||
| Worldwide | 7,642,462 | — | — | 7,642,462 | ||||||||
| October 31, 2004 | �� | |||||||||||
| Ordinary | Long-term | Return of | ||||||||||
| Income | Capital Gains | Capital | Total | |||||||||
| Global Balanced | $ 2,085,080 | $ | — | $ | — | $ 2,085,080 | ||||||
| Diversified International | 162,070,361 | — | — | 162,070,361 | ||||||||
| Aggressive International | 3,891,060 | — | — | 3,891,060 | ||||||||
| Overseas | 36,930,253 | — | — | 36,930,253 | ||||||||
| Worldwide | 4,009,737 | — | — | 4,009,737 | ||||||||
Annual Report A-54
1. Significant Accounting Policies continued
Short Term Trading (Redemption) Fees. Shares held in the funds less than 30 days are subject to a redemption fee equal to 1% of the proceeds of the redeemed shares. All redemption fees, including any estimated redemption fees paid by FMR, are retained by the funds and accounted for as an addi tion to paid in capital.
2. Operating Policies.
Repurchase Agreements. FMR has received an Exemptive Order from the Securities and Exchange Commission (the SEC) which permits certain funds and other affiliated entities of FMR to transfer uninvested cash balances into joint trading accounts which are then invested in repurchase agreements. Certain funds may also invest directly with institutions in repurchase agreements. Repurchase agreements are collateralized by government or non government securities. Collateral is held in segregated accounts with custodian banks and may be obtained in the event of a default of the counterparty. Each applicable fund monitors, on a daily basis, the value of the collateral to ensure it is at least equal to the principal amount of the repurchase agreement (including accrued interest). In the event of a default by the counterparty, realization of the collateral proceeds could be delayed, during which time the value of the collateral may decline.
Futures Contracts. Certain funds may use futures contracts to manage their exposure to the stock market. Buying futures tends to increase a fund’s exposure to the underlying instrument, while selling futures tends to decrease a fund’s exposure to the underlying instrument or hedge other fund investments. Futures contracts involve, to varying degrees, risk of loss in excess of any futures variation margin reflected in each applicable fund’s Statement of Assets and Liabilities. The underlying face amount at value of any open futures contracts at period end is shown in each applicable fund’s Schedule of Investments under the caption “Futures Contracts.” This amount reflects each contract’s exposure to the underlying instrument at period end. Losses may arise from changes in the value of the underlying instruments or if the counterparties do not perform under the contracts’ terms. Gains (losses) are realized upon the expiration or closing of the futures contracts. Futures contracts are valued at the settlement price established each day by the board of trade or exchange on which they are traded.
Restricted Securities. Certain funds may invest in securities that are subject to legal or contractual restrictions on resale. These securities generally may be resold in transactions exempt from registration or to the public if the securities are registered. Disposal of these securities may involve time consuming negotiations and expense, and prompt sale at an acceptable price may be difficult. Information regarding restricted securities is included at the end of each applicable fund’s Schedule of Investments.
3. Purchases and Sales of Investments.
Purchases and sales of securities, other than short term securities and U.S. government securities, are noted in the table below.
| Purchases ($) | Sales ($) | |||||||
| Global Balanced | 143,713,491 | 136,959,986 | ||||||
| Diversified International | 16,660,906,853 | 10,268,110,162 | ||||||
| Aggressive International | 1,221,707,737 | 1,307,807,281 | ||||||
| Overseas | 3,897,064,716 | 3,900,317,592 | ||||||
| Worldwide | 1,058,267,059 | 1,087,763,695 |
4. Fees and Other Transactions with Affiliates.
Management Fee. FMR and its affiliates provide the funds with investment management related services for which the funds pay a monthly manage ment fee. The management fee is the sum of an individual fund fee rate and a group fee rate. The individual fund fee rate is applied to each fund’s average net assets. The group fee rate is based upon the average net assets of all the mutual funds advised by FMR. The group fee rate decreases as assets under management increase and increases as assets under management decrease. In addition, the management fee for Diversified Inter national, Aggressive International, Overseas and Worldwide is subject to a performance adjustment (up to a maximum ±.20% of each applicable fund’s average net assets over a 36 month performance period). The upward or downward adjustment to the management fee is based on each fund’s relative investment performance as compared to an appropriate benchmark index. For the period, each fund’s annual management fee rate expressed as a percentage of each fund’s average net assets, including the performance adjustment, if applicable, was as follows:
| Individual Rate | Group Rate | Total | ||||
| Global Balanced | 45% | .27% | .72% | |||
| Diversified International | 45% | .27% | .82% | |||
| Aggressive International | 45% | .27% | .59% | |||
| Overseas | 45% | .27% | .58% | |||
| Worldwide | 45% | .27% | .73% |
A-55 Annual Report
Notes to Financial Statements continued
4. Fees and Other Transactions with Affiliates continued
Transfer Agent Fees. Fidelity Service Company, Inc. (FSC), an affiliate of FMR, is the funds’ transfer, dividend disbursing and shareholder servicing agent. FSC receives account fees and asset based fees that vary according to account size and type of account. FSC pays for typesetting, printing and mailing of shareholder reports, except proxy statements. For the period, the transfer agent fees were equivalent to the following annual rates expressed as a percentage of average net assets:
| Global Balanced | 26% | |
| Diversified International | 24% | |
| Aggressive International | 27% | |
| Overseas | 27% | |
| Worldwide | 26% |
Accounting and Security Lending Fees. FSC maintains each fund’s accounting records. The accounting fee is based on the level of average net assets for the month. Under a separate contract, FSC administers the security lending program. The security lending fee is based on the number and duration of lending transactions.
Affiliated Central Funds. Certain funds may invest in Money Market Central Funds which seek preservation of capital and current income and are managed by Fidelity Investments Money Management, Inc. (FIMM) an affiliate of FMR.
The Money Market Central Funds do not pay a management fee. Income distributions earned by the funds are recorded as income in the accompanying financial statements. Distributions from the Money Market Central Funds are noted in the table below:
| Income Distributions | ||
| Global Balanced | $ 814,029 | |
| Diversified International | 37,873,996 | |
| Aggressive International | 1,806,074 | |
| Overseas | 6,178,486 | |
| Worldwide | 669,071 |
Brokerage Commissions. Certain funds placed a portion of their portfolio transactions with brokerage firms which are affiliates of the investment adviser. The commissions paid to these affiliated firms were as follows:
| Amount | ||
| Global Balanced | $ 6,805 | |
| Diversified International | 102,884 | |
| Aggressive International | 1,536 | |
| Overseas | 3,570 | |
| Worldwide | 45,926 |
Interfund Lending Program. Pursuant to an Exemptive Order issued by the SEC, the funds, along with other registered investment companies having management contracts with FMR, may participate in an interfund lending program. This program provides an alternative credit facility allowing the funds to borrow from, or lend money to, other participating affiliated funds. At period end, there were no interfund loans outstanding. Each applica ble fund’s activity in this program during the period for which loans were outstanding was as follows:
| Weighted | Interest Earned | |||||||||
| Borrower or | Average Daily | Average | (included in | Interest | ||||||
| Lender | Loan Balance | Interest Rate | interest income) | Expense | ||||||
| Aggressive International | Borrower | $ 5,215,000 | 3.64% | — | $ 2,109 | |||||
| Overseas | Borrower | $ 15,525,833 | 3.03% | — | $ 7,839 | |||||
| Worldwide | Borrower | $ 6,524,167 | 3.15% | — | $ 3,425 |
5. Committed Line of Credit.
Certain funds participate with other funds managed by FMR in a $4.2 billion credit facility (the “line of credit”) to be utilized for temporary or emer gency purposes to fund shareholder redemptions or for other short term liquidity purposes. The participating funds have agreed to pay commitment fees on their pro rata portion of the line of credit. During the period, there were no borrowings on this line of credit.
Annual Report A-56
| 6. Security Lending. |
Certain funds lend portfolio securities from time to time in order to earn additional income. Each applicable fund receives collateral (in the form of U.S. Treasury obligations, letters of credit and/or cash) against the loaned securities and maintains collateral in an amount not less than 100% of the market value of the loaned securities during the period of the loan. The market value of the loaned securities is determined at the close of business of the funds and any additional required collateral is delivered to the funds on the next business day. If the borrower defaults on its obligation to return the securities loaned because of insolvency or other reasons, a fund could experience delays and costs in recovering the securities loaned or in gaining access to the collateral. Cash collateral is invested in the Fidelity Securities Lending Cash Central Fund. The value of loaned securities and cash collateral at period end are disclosed on each applicable fund’s Statement of Assets and Liabilities.
| 7. Bank Borrowings. |
Each fund is permitted to have bank borrowings for temporary or emergency purposes to fund shareholder redemptions. Each fund has established borrowing arrangements with certain banks. The interest rate on the borrowings is the bank’s base rate, as revised from time to time. At period end, there were no bank borrowings outstanding. Each applicable fund’s activity in this program during the period for which loans were outstanding was as follows:
| Average Daily | Weighted Average | |||
| Loan Balance | Interest Rate | |||
| Overseas | $ 16,529,000 | 2.81% | ||
| 8. Expense Reductions. | ||||
Many of the brokers with whom FMR places trades on behalf of certain funds provided services to these funds in addition to trade execution. These services included payments of expenses on behalf of each applicable fund. In addition, through arrangements with each applicable fund’s custodian and transfer agent, credits realized as a result of uninvested cash balances were used to reduce each applicable fund’s expenses. All of the applicable expense reductions are noted in the table below.
| Transfer | ||||||||||
| Brokerage | Custody | Agent | ||||||||
| Service | expense | expense | ||||||||
| Arrangements | reduction | reduction | ||||||||
| Global Balanced | $ 31,331 | $ | 214 | $ | 2,631 | |||||
| Diversified International | 8,556,417 | 11,309 | 805,094 | |||||||
| Aggressive International | 945,771 | 607 | 1,640 | |||||||
| Overseas | 2,716,377 | — | 183,050 | |||||||
| Worldwide | 568,897 | — | 27,989 | |||||||
| 9. Other. | ||||||||||
The funds’ organizational documents provide former and current trustees and officers with a limited indemnification against liabilities arising in connection with the performance of their duties to the funds. In the normal course of business, the funds may also enter into contracts that provide general indemnifications. The funds’ maximum exposure under these arrangements is unknown as this would be dependent on future claims that may be made against the funds. The risk of material loss from such claims is considered remote.
| A-57 |
| Annual Report |
Report of Independent Registered Public Accounting Firm
To the Trustees of Fidelity Investment Trust and Shareholders of Fidelity Diversified International Fund, Fidelity Aggressive International Fund and Fidelity Worldwide Fund:
We have audited the accompanying statements of assets and liabilities of Fidelity Diversified International Fund, Fidelity Aggressive International Fund and Fidelity Worldwide Fund (the Funds), funds of Fidelity Investment Trust (the Trust) including the schedules of investments, as of Octo ber 31, 2005, and the related statements of operations for the year then ended, the statements of changes in net assets for each of the two years in the period then ended, and the financial highlights for each of the five years in the period then ended. These financial statements and financial highlights are the responsibility of the Funds’ management. Our responsibility is to express an opinion on these financial statements and financial highlights based on our audits.
We conducted our audits in accordance with standards of the Public Company Accounting Oversight Board (United States). Those standards require that we plan and perform the audit to obtain reasonable assurance about whether the financial statements and financial highlights are free of material misstatement. The Funds are not required to have, nor were we engaged to perform, an audit of their internal control over financial reporting. Our audits included consideration of internal control over financial reporting as a basis for designing audit procedures that are appropriate in the circum stances, but not for the purpose of expressing an opinion on the effectiveness of the Funds’ internal control over financial reporting. Accordingly, we express no such opinion. An audit also includes examining, on a test basis, evidence supporting the amounts and disclosures in the financial state ments, assessing the accounting principles used and significant estimates made by management, as well as evaluating the overall financial statement presentation. Our procedures included confirmation of securities owned as of October 31, 2005, by correspondence with the custodians and brokers; where replies were not received from brokers, we performed other auditing procedures. We believe that our audits provide a reasonable basis for our opinion.
In our opinion, the financial statements and financial highlights referred to above present fairly, in all material respects, the financial position of Fidelity Diversified International Fund, Fidelity Aggressive International Fund and Fidelity Worldwide Fund as of October 31, 2005, the results of their operations for the year then ended, the changes in their net assets for each of the two years in the period then ended, and their financial highlights for each of the five years in the period then ended, in conformity with accounting principles generally accepted in the United States of America.
/s/ Deloitte & Touche LLP
DELOITTE & TOUCHE LLP
Boston, Massachusetts
December 21, 2005
| Annual Report |
| A-58 |
Report of Independent Registered Public Accounting Firm
To the Trustees of Fidelity Investment Trust and the Shareholders of Fidelity Global Balanced Fund and Fidelity Overseas Fund:
In our opinion, the accompanying statements of assets and liabilities, including the schedules of investments, and the related statements of operations and of changes in net and the financial highlights present fairly, in all material respects, the financial position of Fidelity Global Balanced Fund and Fidelity Overseas Fund (funds of Fidelity Investment Trust) at October 31, 2005 and the results of their operations, the changes in their net assets and the financial highlights for the periods indicated, in conformity with accounting principles generally accepted in the United States of America. These financial statements and financial highlights (hereafter referred to as “financial statements”) are the responsibility of the Fidelity Investment Trust’s management; our responsibility is to express an opinion on these financial statements based on our audits. We conducted our audits of these financial statements in accordance with the standards of the Public Company Accounting Oversight Board (United States). Those standards require that we plan and perform the audit to obtain reasonable assurance about whether the financial statements are free of material misstatement. An audit in cludes examining, on a test basis, evidence supporting the amounts and disclosures in the financial statements, assessing the accounting principles used and significant estimates made by management, and evaluating the overall financial statement presentation. We believe that our audits, which included confirmation of securities at October 31, 2005 by correspondence with the custodian and brokers, provide a reasonable basis for our opinion.
| /s/ PricewaterhouseCoopers LLP PricewaterhouseCoopers LLP Boston, Massachusetts December 20, 2005 |
| A-59 |
| Annual Report |
| Trustees and Officers |
The Trustees, Members of the Advisory Board, and executive officers of the trust and funds, as applicable, are listed below. The Board of Trustees governs each fund and is responsible for protecting the interests of shareholders. The Trustees are experienced executives who meet periodically throughout the year to oversee each fund’s activities, review contractual arrangements with companies that provide services to each fund, and review each fund’s performance. Except for William O. McCoy, Stephen P. Jonas, and Kenneth L. Wolfe, each of the Trustees oversees 322 funds advised by FMR or an affiliate. Mr. McCoy oversees 324 funds advised by FMR or an affiliate. Mr. Jonas and Mr. Wolfe oversee 319 funds advised by FMR or an affiliate.
The Trustees hold office without limit in time except that (a) any Trustee may resign; (b) any Trustee may be removed by written instrument, signed by at least two thirds of the number of Trustees prior to such removal; (c) any Trustee who requests to be retired or who has become incapac itated by illness or injury may be retired by written instrument signed by a majority of the other Trustees; and (d) any Trustee may be removed at any special meeting of shareholders by a two thirds vote of the outstanding voting securities of the trust. Each Trustee who is not an interested person (as defined in the 1940 Act) (Independent Trustee), shall retire not later than the last day of the calendar year in which his or her 72nd birthday occurs. The Independent Trustees may waive this mandatory retirement age policy with respect to individual Trustees. The executive officers and Advisory Board Members hold office without limit in time, except that any officer and Advisory Board Member may resign or may be removed by a vote of a majority of the Trustees at any regular meeting or any special meeting of the Trustees. Except as indicated, each individual has held the office shown or other offices in the same company for the past five years.
The funds’ Statement of Additional Information (SAI) includes more information about the Trustees. To request a free copy, call Fidelity at 1-800-544-8544.
| Interested Trustees*: |
Correspondence intended for each Trustee who is an interested person may be sent to Fidelity Investments, 82 Devonshire Street, Boston, Massachusetts 02109.
| Name, Age; Principal Occupation Edward C. Johnson 3d (75)** |
Year of Election or Appointment: 1984
Mr. Johnson is Chairman of the Board of Trustees. Mr. Johnson serves as Chief Executive Officer, Chairman, and a Director of FMR Corp.; a Director and Chairman of the Board and of the Executive Committee of FMR; Chairman and a Director of Fidelity Man agement & Research (Far East) Inc.; Chairman and a Director of Fidelity Investments Money Management, Inc.; and Chairman (2001 present) and a Director (2000 present) of FMR Co., Inc.
| Abigail P. Johnson (43)** |
Year of Election or Appointment: 2001
Ms. Johnson serves as President of Fidelity Employer Services Company (FESCO) (2005 present). She is President and a Director of Fidelity Investments Money Management, Inc. (2001 present), FMR Co., Inc. (2001 present), and a Director of FMR Corp. Pre viously, Ms. Johnson served as President and a Director of FMR (2001 2005), Senior Vice President of the Fidelity funds (2001 2005), and managed a number of Fidelity funds.
| Stephen P. Jonas (52) |
Year of Election or Appointment: 2005
Mr. Jonas is Senior Vice President of Global Balanced (2005 present), Diversified International (2005 present), Aggressive Interna tional (2005 present), Overseas (2005 present), and Worldwide (2005 present). He also serves as Senior Vice President of other Fidelity funds (2005 present). Mr. Jonas is Executive Director of FMR (2005 present). Previously, Mr. Jonas served as President of Fidelity Enterprise Operations and Risk Services (2004 2005), Chief Administrative Officer (2002 2004), and Chief Financial Offi cer of FMR Co. (1998 2000). Mr. Jonas has been with Fidelity Investments since 1987 and has held various financial and man agement positions including Chief Financial Officer of FMR. In addition, he serves on the Boards of Boston Ballet (2003 present) and Simmons College (2003 present).
| Robert L. Reynolds (53) |
Year of Election or Appointment: 2003
Mr. Reynolds is a Director (2003 present) and Chief Operating Officer (2002 present) of FMR Corp. He also serves on the Board at Fidelity Investments Canada, Ltd. (2000 present). Previously, Mr. Reynolds served as President of Fidelity Investments Institutional Retirement Group (1996 2000).
* Trustees have been determined to be “Interested Trustees” by virtue of, among other things, their affiliation with the trust or various entities under common control with FMR.
** Edward C. Johnson 3d, Trustee, is Abigail P. Johnson’s father.
| Annual Report |
| A-60 |
| Independent Trustees: |
Correspondence intended for each Independent Trustee (that is, the Trustees other than the Interested Trustees) may be sent to Fidelity Invest ments, P.O. Box 55235, Boston, Massachusetts 02205 5235.
| Name, Age; Principal Occupation Dennis J. Dirks (57) |
Year of Election or Appointment: 2005
Prior to his retirement in May 2003, Mr. Dirks was Chief Operating Officer and a member of the Board of The Depository Trust & Clearing Corporation (DTCC) (1999 2003). He also served as President, Chief Operating Officer, and Board member of The De pository Trust Company (DTC) (1999 2003) and President and Board member of the National Securities Clearing Corporation (NSCC) (1999 2003). In addition, Mr. Dirks served as Chief Executive Officer and Board member of the Government Securities Clearing Corporation (2001 2003) and Chief Executive Officer and Board member of the Mortgage Backed Securities Clearing Corporation (2001 2003). Mr. Dirks also serves as a Trustee of Manhattan College (2005 present).
| Robert M. Gates (62) |
Year of Election or Appointment: 1997
Dr. Gates is Vice Chairman of the Independent Trustees (2005 present). Dr. Gates is President of Texas A&M University (2002 present). He was Director of the Central Intelligence Agency (CIA) from 1991 to 1993. From 1989 to 1991, Dr. Gates served as Assistant to the President of the United States and Deputy National Security Advisor. Dr. Gates is a Director of NACCO Industries, Inc. (mining and manufacturing), Parker Drilling Co., Inc. (drilling and rental tools for the energy industry, 2001 present), and Brinker International (restaurant management, 2003 present). Previously, Dr. Gates served as a Director of LucasVarity PLC (automotive components and diesel engines), a Director of TRW Inc. (automotive, space, defense, and information technology), and Dean of the George Bush School of Government and Public Service at Texas A&M University (1999 2001). Dr. Gates also is a Trustee of the Forum for International Policy.
| George H. Heilmeier (69) |
Year of Election or Appointment: 2004
Dr. Heilmeier is Chairman Emeritus of Telcordia Technologies (communication software and systems), where prior to his retirement, he served as company Chairman and Chief Executive Officer. He currently serves on the Boards of Directors of The Mitre Corpo ration (systems engineering and information technology support for the government), and HRL Laboratories (private research and development, 2004 present). He is Chairman of the General Motors Science & Technology Advisory Board and a Life Fellow of the Institute of Electrical and Electronics Engineers (IEEE) (2000 present). Dr. Heilmeier is a member of the Defense Science Board and the National Security Agency Advisory Board. He is also a member of the National Academy of Engineering, the American Academy of Arts and Sciences, and the Board of Overseers of the School of Engineering and Applied Science of the University of Pennsylvania. Previously, Dr. Heilmeier served as a Director of TRW Inc. (automotive, space, defense, and information technology, 1992 2002), Compaq (1994 2002), Automatic Data Processing, Inc. (ADP) (technology based business outsourcing, 1995 2002), INET Technologies Inc. (telecommunications network surveillance, 2001 2004), and Teletech Holdings (customer management ser vices). He is the recipient of the 2005 Kyoto Prize in Advanced Technology for his invention of the liquid display.
| Marie L. Knowles (59) |
Year of Election or Appointment: 2001
Prior to Ms. Knowles’ retirement in June 2000, she served as Executive Vice President and Chief Financial Officer of Atlantic Rich field Company (ARCO) (diversified energy, 1996 2000). From 1993 to 1996, she was a Senior Vice President of ARCO and President of ARCO Transportation Company. She served as a Director of ARCO from 1996 to 1998. She currently serves as a Director of Phelps Dodge Corporation (copper mining and manufacturing) and McKesson Corporation (healthcare service, 2002 present). Ms. Knowles is a Trustee of the Brookings Institution and the Catalina Island Conservancy and also serves as a member of the Advisory Board for the School of Engineering of the University of Southern California.
| Ned C. Lautenbach (61) |
Year of Election or Appointment: 2000
Mr. Lautenbach has been a partner of Clayton, Dubilier & Rice, Inc. (private equity investment firm) since September 1998. Pre viously, Mr. Lautenbach was with the International Business Machines Corporation (IBM) from 1968 until his retirement in 1998. Mr. Lautenbach serves as a Director of Italtel Holding S.p.A. (telecommunications (Milan, Italy), 2004 present) and Eaton Corpora tion (diversified industrial) as well as the Philharmonic Center for the Arts in Naples, Florida. He also is a member of the Board of Trustees of Fairfield University (2005 present), as well as a member of the Council on Foreign Relations.
| A-61 |
| Annual Report |
| Trustees and Officers - continued |
| Name, Age; Principal Occupation Marvin L. Mann (72) |
Year of Election or Appointment: 1993
Mr. Mann is Chairman of the Independent Trustees (2001 present). He is Chairman Emeritus of Lexmark International, Inc. (com puter peripherals), where he served as CEO until April 1998, retired as Chairman May 1999, and remains a member of the Board. Prior to 1991, he held the positions of Vice President of International Business Machines Corporation (IBM) and President and General Manager of various IBM divisions and subsidiaries. He is a member of the Executive Committee of the Independent Director’s Council of the Investment Company Institute. In addition, Mr. Mann is a member of the President’s Cabinet at the Univer sity of Alabama and the Board of Visitors of the Culverhouse College of Commerce and Business Administration at the University of Alabama.
| William O. McCoy (72) |
Year of Election or Appointment: 1997
Prior to his retirement in December 1994, Mr. McCoy was Vice Chairman of the Board of BellSouth Corporation (telecommunica tions) and President of BellSouth Enterprises. He is currently a Director of Liberty Corporation (holding company), Duke Realty Cor poration (real estate), and Progress Energy, Inc. (electric utility). He is also a partner of Franklin Street Partners (private investment management firm) and a member of the Research Triangle Foundation Board. In addition, Mr. McCoy served as the Interim Chan cellor (1999 2000) and a member of the Board of Visitors for the University of North Carolina at Chapel Hill and currently serves on the Board of Directors of the University of North Carolina Health Care System and the Board of Visitors of the Kenan Flagler Business School (University of North Carolina at Chapel Hill). He also served as Vice President of Finance for the University of North Carolina (16 school system).
| Cornelia M. Small (61) |
Year of Election or Appointment: 2005
Ms. Small is a member (2000 present) and Chairperson (2002 present) of the Investment Committee, and a member
(2002 present) of the Board of Trustees of Smith College. Previously, she served as Chief Investment Officer (1999 2000), Director of Global Equity Investments (1996 1999), and a member of the Board of Directors of Scudder, Stevens & Clark (1990 1997) and Scudder Kemper Investments (1997 1998). In addition, Ms. Small served as Co Chair (2000 2003) of the Annual Fund for the Fletcher School of Law and Diplomacy.
| William S. Stavropoulos (66) |
Year of Election or Appointment: 2001
Mr. Stavropoulos is Chairman of the Board (2000 present) and a Member of the Board of Directors of The Dow Chemical Com pany. Since joining The Dow Chemical Company in 1967, Mr. Stavropoulos served in numerous senior management positions, including President (1993 2000; 2002 2003), CEO (1995 2000; 2002 2004), and Chairman of the Executive Committee (2000 2004). Currently, he is a Director of NCR Corporation (data warehousing and technology solutions), BellSouth Corporation (telecommunications), Chemical Financial Corporation, Maersk Inc. (industrial conglomerate, 2002 present), and Metalmark Capi tal (private equity investment firm, 2005 present). He also serves as a member of the Board of Trustees of the American Enterprise Institute for Public Policy Research. In addition, Mr. Stavropoulos is a member of The Business Council, J.P. Morgan International Council and the University of Notre Dame Advisory Council for the College of Science.
| Kenneth L. Wolfe (66) |
Year of Election or Appointment: 2005
Mr. Wolfe also serves as a Trustee (2005 present) or Member of the Advisory Board (2004 present) of other investment companies advised by FMR. Prior to his retirement in 2001, Mr. Wolfe was Chairman and Chief Executive Officer of Hershey Foods Corpora tion (1993 2001). He currently serves as a member of the boards of Adelphia Communications Corporation (2003 present), Bausch & Lomb, Inc., and Revlon Inc. (2004 present).
| Advisory Board Members and Executive Officers: |
Correspondence intended for Mr. Gamper may be sent to Fidelity Investments, P.O. Box 55235, Boston, Massachusetts 02205 5235. Correspondence intended for each executive officer and Mr. Lynch may be sent to Fidelity Investments, 82 Devonshire Street, Boston, Massachusetts 02109.
| Name, Age; Principal Occupation Albert R. Gamper, Jr. (63) |
Year of Election or Appointment: 2005
Member of the Advisory Board of Fidelity Investment Trust. Prior to his retirement in December 2004, Mr. Gamper served as Chairman of the Board of CIT Group Inc. (commercial finance). During his tenure with CIT Group Inc. Mr. Gamper served in nu merous senior management positions, including Chairman (1987 1989; 1999 2001; 2002 2004), Chief Executive Officer (1987 2004), and President (1989 2002). He currently serves as a member of the Board of Directors of Public Service Enterprise Group (utilities, 2001 present), Chairman of the Board of Governors, Rutgers University (2004 present), and Chairman of the Board of Saint Barnabas Health Care System.
| Annual Report |
| A-62 |
| Name, Age; Principal Occupation Peter S. Lynch (61) |
Year of Election or Appointment: 2003
Member of the Advisory Board of Fidelity Investment Trust. Vice Chairman and a Director of FMR, and Vice Chairman (2001 present) and a Director (2000 present) of FMR Co., Inc. Previously, Mr. Lynch served as a Trustee of the Fidelity funds (1990 2003). In addition, he serves as a Trustee of Boston College, Massachusetts Eye & Ear Infirmary, Historic Deerfield, John F. Kennedy Library, and the Museum of Fine Arts of Boston.
| Dwight D. Churchill (51) |
Year of Election or Appointment: 2005
Vice President of Global Balanced, Diversified International, Aggressive International, Overseas, and Worldwide. Mr. Churchill also serves as Vice President of certain Equity Funds (2005 present) and certain High Income Funds (2005 present). Previously, he served as Head of Fidelity’s Fixed Income Division (2000 2005), Vice President of Fidelity’s Money Market Funds (2000 2005), Vice President of Fidelity’s Bond Funds, and Senior Vice President of FIMM (2000) and FMR. Mr. Churchill joined Fidelity in 1993 as Vice President and Group Leader of Taxable Fixed Income Investments.
| Richard R. Mace, Jr. (43) |
Year of Election or Appointment: 1996, 2001, or 2005
Vice President of Aggressive International (2005), Global Balanced (1996), Overseas (1996), and Worldwide (2001). Mr. Mace is also Vice President of other funds advised by FMR. Prior to assuming his current responsibilities, Mr. Mace has worked as a research analyst and portfolio manager.
| William Bower (38) |
Year of Election or Appointment: 2001
Vice President of Diversified International. Prior to assuming his current responsibilities, Mr. Bower has worked as a research ana lyst and manager.
| Eric D. Roiter (56) |
Year of Election or Appointment: 1998
Secretary of Global Balanced, Diversified International, Aggressive International, Overseas, and Worldwide. He also serves as Secretary of other Fidelity funds; Vice President, General Counsel, and Secretary of FMR Co., Inc. (2001 present) and FMR; Assis tant Secretary of Fidelity Management & Research (U.K.) Inc. (2001 present), Fidelity Management & Research (Far East) Inc. (2001 present), and Fidelity Investments Money Management, Inc. (2001 present). Mr. Roiter is an Adjunct Member, Faculty of Law, at Boston College Law School (2003 present). Previously, Mr. Roiter served as Vice President and Secretary of Fidelity Distrib utors Corporation (FDC) (1998 2005).
| Stuart Fross (46) |
Year of Election or Appointment: 2003
Assistant Secretary of Global Balanced, Diversified International, Aggressive International, Overseas, and Worldwide. Mr. Fross also serves as Assistant Secretary of other Fidelity funds (2003 present), Vice President and Secretary of FDC (2005 present), and is an employee of FMR.
| Christine Reynolds (47) |
Year of Election or Appointment: 2004
President, Treasurer, and Anti Money Laundering (AML) officer of Global Balanced, Diversified International, Aggressive Interna tional, Overseas, and Worldwide. Ms. Reynolds also serves as President, Treasurer, and AML officer of other Fidelity funds (2004) and is a Vice President (2003) and an employee (2002) of FMR. Before joining Fidelity Investments, Ms. Reynolds worked at Price waterhouseCoopers LLP (PwC) (1980 2002), where she was most recently an audit partner with PwC’s investment management practice.
| Paul M. Murphy (58) |
Year of Election or Appointment: 2005
Chief Financial Officer of Global Balanced, Diversified International, Aggressive International, Overseas, and Worldwide. Mr. Murphy also serves as Chief Financial Officer of other Fidelity funds (2005 present). He also serves as Senior Vice President of Fidelity Pricing and Cash Management Services Group (FPCMS).
| Kenneth A. Rathgeber (58) |
Year of Election or Appointment: 2004
Chief Compliance Officer of Global Balanced, Diversified International, Aggressive International, Overseas, and Worldwide. Mr. Rathgeber also serves as Chief Compliance Officer of other Fidelity funds (2004) and Executive Vice President of Risk Oversight for Fidelity Investments (2002). Previously, he served as Executive Vice President and Chief Operating Officer for Fidelity Invest ments Institutional Services Company, Inc. (1998 2002).
| A-63 |
| Annual Report |
| Trustees and Officers - continued |
| Name, Age; Principal Occupation John R. Hebble (47) |
Year of Election or Appointment: 2003
Deputy Treasurer of Global Balanced, Diversified International, Aggressive International, Overseas, and Worldwide. Mr. Hebble also serves as Deputy Treasurer of other Fidelity funds (2003), and is an employee of FMR. Before joining Fidelity Investments, Mr. Hebble worked at Deutsche Asset Management where he served as Director of Fund Accounting (2002 2003) and Assistant Treas urer of the Scudder Funds (1998 2003).
| Bryan A. Mehrmann (44) |
Year of Election or Appointment: 2005
Deputy Treasurer of Global Balanced, Diversified International, Aggressive International, Overseas, and Worldwide. Mr. Mehrmann also serves as Deputy Treasurer of other Fidelity funds (2005 present) and is an employee of FMR. Previously, Mr. Mehrmann served as Vice President of Fidelity Investments Institutional Services Group (FIIS)/Fidelity Investments Institutional Operations Corporation, Inc. (FIIOC) Client Services (1998 2004).
| Kimberley H. Monasterio (41) |
Year of Election or Appointment: 2004
Deputy Treasurer of Global Balanced, Diversified International, Aggressive International, Overseas, and Worldwide. Ms. Mon asterio also serves as Deputy Treasurer of other Fidelity funds (2004) and is an employee of FMR (2004). Before joining Fidelity Investments, Ms. Monasterio served as Treasurer (2000 2004) and Chief Financial Officer (2002 2004) of the Franklin Templeton Funds and Senior Vice President of Franklin Templeton Services, LLC (2000 2004).
| Kenneth B. Robins (36) |
Year of Election or Appointment: 2005
Deputy Treasurer of Global Balanced, Diversified International, Aggressive International, Overseas, and Worldwide. Mr. Robins also serves as Deputy Treasurer of other Fidelity funds (2005 present) and is an employee of FMR (2004 present). Before joining Fidelity Investments, Mr. Robins worked at KPMG LLP, where he was a partner in KPMG’s department of professional practice (2002 2004) and a Senior Manager (1999 2000). In addition, Mr. Robins served as Assistant Chief Accountant, United States Securities and Exchange Commission (2000 2002).
| Robert G. Byrnes (38) |
Year of Election or Appointment: 2005
Assistant Treasurer of Global Balanced, Diversified International, Aggressive International, Overseas, and Worldwide. Mr. Byrnes also serves as Assistant Treasurer of other Fidelity funds (2005 present) and is an employee of FMR (2005 present). Previously, Mr. Byrnes served as Vice President of FPCMS (2003 2005). Before joining Fidelity Investments, Mr. Byrnes worked at Deutsche Asset Management where he served as Vice President of the Investment Operations Group (2000 2003).
| John H. Costello (59) |
Year of Election or Appointment: 1984, 1990, 1991, 1993, or 1994
Assistant Treasurer of Global Balanced (1993), Diversified International (1991), Aggressive International (1994), Overseas (1984), and Worldwide (1990). Mr. Costello also serves as Assistant Treasurer of other Fidelity funds and is an employee of FMR.
| Peter L. Lydecker (51) |
Year of Election or Appointment: 2004
Assistant Treasurer of Global Balanced, Diversified International, Aggressive International, Overseas, and Worldwide. Mr. Lydecker also serves as Assistant Treasurer of other Fidelity funds (2004) and is an employee of FMR.
| Mark Osterheld (50) |
Year of Election or Appointment: 2002
Assistant Treasurer of Global Balanced, Diversified International, Aggressive International, Overseas, and Worldwide. Mr. Oster held also serves as Assistant Treasurer of other Fidelity funds (2002) and is an employee of FMR.
| Gary W. Ryan (47) |
Year of Election or Appointment: 2005
Assistant Treasurer of Global Balanced, Diversified International, Aggressive International, Overseas, and Worldwide. Mr. Ryan also serves as Assistant Treasurer of other Fidelity funds (2005 present) and is an employee of FMR (2005 present). Previously, Mr. Ryan served as Vice President of Fund Reporting in FPCMS (1999 2005).
| Annual Report |
| A-64 |
| Name, Age; Principal Occupation Salvatore Schiavone (39) |
Year of Election or Appointment: 2005
Assistant Treasurer of Global Balanced, Diversified International, Aggressive International, Overseas, and Worldwide. Mr. Schia vone also serves as Assistant Treasurer of other Fidelity funds (2005 present) and is an employee of FMR (2005 present). Before joining Fidelity Investments, Mr. Schiavone worked at Deutsche Asset Management, where he most recently served as Assistant Treasurer (2003 2005) of the Scudder Funds and Vice President and Head of Fund Reporting (1996 2003).
| A-65 |
| Annual Report |
| Distributions |
The Board of Trustees of each fund voted to pay to shareholders of record at the opening of business on record date, the following distributions per share derived from capital gains realized from sales of portfolio securities, and dividends derived from net investment income:
| Pay Date | Record Date | Dividends | Capital Gains | |||||
| Fidelity Global Balanced Fund | 12/12/05 | 12/09/05 | $0.14 | $1.67 | ||||
| Fidelity Diversified International Fund | 12/12/05 | 12/09/05 | $0.28 | $0.73 | ||||
| Fidelity Aggressive International Fund | 12/12/05 | 12/09/05 | $0.23 | $1.77 | ||||
| Fidelity Overseas Fund | 12/05/05 | 12/02/05 | $0.41 | $0.16 | ||||
| Fidelity Worldwide Fund | 12/12/05 | 12/09/05 | $0.10 | $1.04 |
The funds hereby designate as capital gain dividends the amounts noted below for the taxable year indicated or for dividends for the taxable year ended 2005, if subsequently determined to be different, the net capital gain of such year; and for dividends for the taxable year ended 2004, if subse quently determined to be different, the excess of: (a) the net capital gain of such year, over (b) amounts previously designated as capital gain dividends with respect to such year.
| October 31, 2005 | October 31, 2004 | |||||
| Fidelity Global Balanced Fund | $ 10,768,692 | $ | 1,184,081 | |||
| Fidelity Diversified International Fund | $ 647,258,145 | $ | — | |||
| Fidelity Aggressive International Fund | $ 63,094,707 | $ | — | |||
| Fidelity Worldwide Fund | $ 59,686,062 | $ | — |
A percentage of the dividends distributed during the fiscal year for the following funds qualifies for the dividends received deduction for corporate shareholders:
| Fidelity Global Balanced Fund | 36% | |
| Fidelity Worldwide Fund | 100% |
A percentage of the dividends distributed during the fiscal year for the following funds may be taken into account as a dividend for purposes of the maximum rate under section 1(h)(11) of the Internal Revenue Code.
| Fidelity Global Balanced Fund | 67% | |
| Fidelity Diversified International Fund | 100% | |
| Fidelity Aggressive International Fund | 100% | |
| Fidelity Overseas Fund | 100% | |
| Fidelity Worldwide Fund | 100% |
The amounts per share which represent income derived from sources within, and taxes paid to, foreign countries or possessions of the United States are as follows:
| Pay Date | Income | Taxes | ||||||||
| Fidelity Global Balanced Fund | 12/06/04 | $ | 0.148 | $ | 0.011 | |||||
| Fidelity Diversified International Fund | 12/13/04 | $ | 0.170 | $ | 0.036 | |||||
| Fidelity Aggressive International Fund | 12/13/04 | $ | 0.068 | $ | 0.018 | |||||
| Fidelity Overseas Fund | 12/06/04 | $ | 0.283 | $ | 0.039 |
| Annual Report |
| A-66 |
Board Approval of Investment Advisory Contracts and Management Fees
| Broadly Diversified International Equity Funds |
Each year, typically in July, the Board of Trustees, including the independent Trustees (together, the Board), votes on the renewal of the management contract and sub advisory agreements (together, the Advisory Contracts) for each fund. The Board, assisted by the advice of fund counsel and independent Trustees’ counsel, requests and considers a broad range of information throughout the year.
The Board meets regularly each month except August and takes into account throughout the year matters bearing on Advisory Contracts. The Board, acting directly and through its separate committees, considers at each of its meetings factors that are relevant to the annual renewal of each fund’s Advisory Contracts, including the services and support provided to each fund and its shareholders by Fidelity. At the time of the renewal, the Board had 11 standing committees, each composed of independent Trustees with varying backgrounds, to which the Board has assigned specific subject matter responsibilities in order to enhance effective decision making by the Board. Each committee has adopted a written charter outlining the structure and purposes of the committee. One such committee, the Equity Contract Committee, meets periodically during the first six months of each year and as necessary to consider matters specifically related to the annual renewal of Advisory Contracts. The committee requests and receives information on, and makes recommendations to the independent Trustees concerning, the approval and annual review of the Advisory Contracts.
At its July 2005 meeting, the Board of Trustees, including the independent Trustees, unanimously determined to renew the Advisory Contracts for each fund. In reaching its determination, the Board considered all factors it believed relevant, including (1) the nature, extent, and quality of the services to be provided to each fund and its shareholders by Fidelity (including the investment performance of each fund); (2) the competitiveness of the man agement fee and total expenses of each fund; (3) the total costs of the services to be provided by and the profits to be realized by the investment adviser and its affiliates from the relationship with each fund; (4) the extent to which economies of scale would be realized as each fund grows; and (5) whether fee levels reflect these economies of scale, if any, for the benefit of fund shareholders.
In determining whether to renew the Advisory Contracts for each fund, the Board ultimately reached a determination, with the assistance of fund counsel and independent Trustees’ counsel, that the renewal of the Advisory Contracts and the compensation to be received by Fidelity under the management contracts is consistent with Fidelity’s fiduciary duty under applicable law. In addition to evaluating the specific factors noted above, the Board, in reaching its determination, is aware that shareholders in each fund have a broad range of investment choices available to them, including a wide choice among mutual funds offered by competitors to Fidelity, and that each fund’s shareholders, with the opportunity to review and weigh the disclosure provided by the fund in its prospectus and other public disclosures, have chosen to invest in that fund, managed by Fidelity.
Nature, Extent, and Quality of Services Provided by Fidelity. The Board considered staffing within the investment adviser, FMR, and the sub advisers (together, the Investment Advisers), including the backgrounds of the funds’ portfolio managers and the funds’ investment objectives and disciplines. The independent Trustees also had discussions with senior management of Fidelity’s investment operations and investment groups. The Board considered the structure of the portfolio manager compensation program and whether this structure provides appropriate incentives.
Fidelity Resources Dedicated to Investment Management and Support Services. The Board reviewed the size, education, and experience of the Invest ment Advisers’ investment staff, their use of technology, and the Investment Advisers’ approach to recruiting, training, and retaining portfolio managers and other research, advisory, and management personnel. The Board considered Fidelity’s extensive global research capabilities that enable the Investment Advisers to aggregate data from various sources in an effort to produce positive investment results. The Board noted that Fidelity’s analysts have access to a variety of technological tools that enable them to perform both fundamental and quantitative analysis and to specialize in various disciplines. The Board also considered that Fidelity’s portfolio managers and analysts have access to daily portfolio attribution that allows for monitor ing of a fund’s portfolio, as well as an electronic communication system that provides immediate real time access to research concerning issuers and credit enhancers.
Shareholder and Administrative Services. The Board considered the nature, extent, quality, and cost of administrative, distribution, and shareholder services performed by the Investment Advisers and their affiliates under the Advisory Contracts and under separate agreements covering transfer agency, pricing and bookkeeping, and securities lending services for each fund. The Board also considered the nature and extent of the Investment Advisers’ supervision of third party service providers, principally custodians and subcustodians. The Board reviewed the allocation of fund brokerage, including allocations to brokers affiliated with the Investment Advisers, the use of brokerage commissions to pay fund expenses, and the use of “soft” commission dollars to pay for research services. The Board also considered that Fidelity voluntarily decided in 2004 to stop using “soft” commission dollars to pay for market data and, instead, to pay for that data out of its own resources. The Board also considered the resources devoted to, and the record of compliance with, each fund’s compliance policies and procedures.
The Board noted that the growth of fund assets across the complex allows Fidelity to reinvest in the development of services designed to enhance the value or convenience of the Fidelity funds as investment vehicles. These services include 24 hour access to account information and market informa tion through phone representatives and over the Internet, and investor education materials and asset allocation tools.
Investment in a Large Fund Family. The Board considered the benefits to shareholders of investing in a Fidelity fund, including the benefits of investing in a fund that is part of a large family of funds offering a variety of investment disciplines and providing for a large variety of mutual fund investor services. For example, fund shareholders are offered the privilege of exchanging shares of a fund for shares of other Fidelity funds, as set forth in the
| A-67 |
| Annual Report |
Board Approval of Investment Advisory Contracts and Management Fees - continued
fund’s prospectus, without paying an additional sales charge. The Board noted that, since the last Advisory Contract renewals in July 2004, Fidelity has taken a number of actions that benefited particular funds, including (i) voluntarily deciding in 2004 to stop using “soft” commission dollars to pay for market data and, instead, to pay for that data out of its own resources, (ii) contractually agreeing to impose management fee reductions and expense limitations on its five Spartan stock index funds and its stock index fund available through variable insurance products, (iii) contractually agreeing to eliminate the management fees on the Fidelity Freedom Funds and the Fidelity Advisor Freedom Funds, (iv) contractually agreeing to reduce the management fees on most of its investment grade taxable bond funds, and (v) contractually agreeing to impose expense limitations on its retail and Spartan investment grade taxable bond funds.
Investment Performance and Compliance. The Board considered whether each fund has operated within its investment objective, as well as its record of compliance with its investment restrictions. It also reviewed each fund’s absolute investment performance, as well as each fund’s relative investment performance measured against (i) a broad based securities market index (or a proprietary custom index, in the case of Global Balanced Fund), and (ii) a peer group of mutual funds deemed appropriate by the Board over multiple periods. For each fund, the following charts considered by the Board show, over the one , three , and five year periods ended December 31, 2004, the fund’s returns, the returns of a broad based securities market index (or a proprietary custom index, in the case of Global Balanced Fund)(“benchmark”), and a range of returns of a peer group of mutual funds identified by Lipper Inc. as having an investment objective similar to that of the fund. The box within each chart shows the 25th percentile return (bottom of box) and the 75th percentile return (top of box) of the Lipper peer group. Returns shown above the box are in the first quartile and returns shown below the box are in the fourth quartile. The percentage beaten number noted below each chart corresponds to the percentile box and represents the percentage of funds in the Lipper peer group whose performance was equal to or lower than that of the fund. For Global Balanced Fund, the proprietary custom index is an index developed by FMR that represents the fund’s general investment categories in both equity and bond securities.
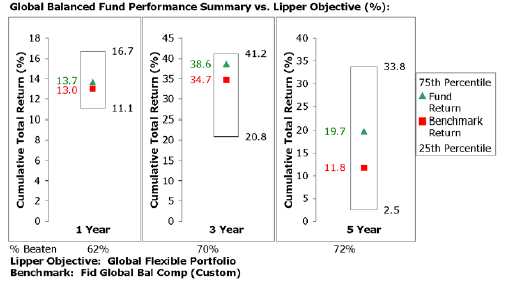
The Board reviewed the fund’s relative investment performance against its Lipper peer group and stated that the performance of the fund was in the second quartile for the one , three , and five year periods. The Board also stated that the relative investment performance of the fund has compared favorably to its benchmark over time.
| Annual Report |
| A-68 |
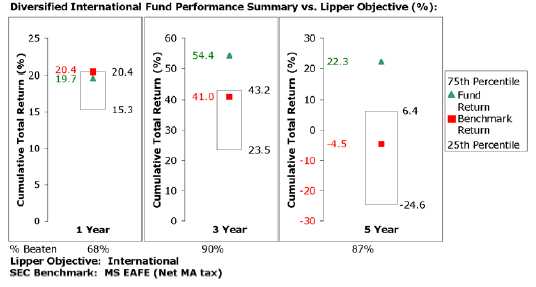
The Board reviewed the fund’s relative investment performance against its Lipper peer group and stated that the performance of the fund was in the second quartile for the one year period and the first quartile for the three and five year periods. The Board also stated that the relative investment performance of the fund has compared favorably to its benchmark over time, although the fund’s one year cumulative total return was lower than its benchmark.
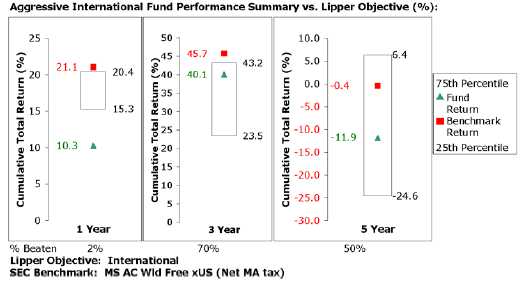
The Board reviewed the fund’s relative investment performance against its Lipper peer group and stated that the performance of the fund was in the fourth quartile for the one year period and the second quartile for the three and five year periods. The Board also stated that the relative investment performance of the fund was lower than its benchmark over time.
| A-69 |
| Annual Report |
Board Approval of Investment Advisory Contracts and Management Fees - continued
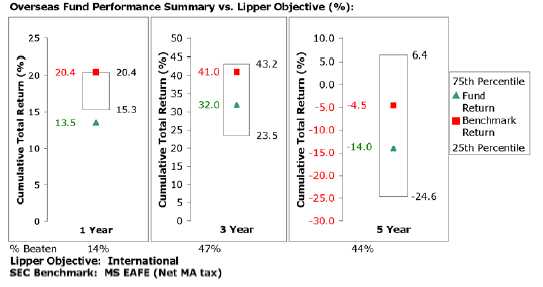
The Board reviewed the fund’s relative investment performance against its Lipper peer group and stated that the performance of the fund was in the fourth quartile for the one year period and the third quartile for the three and five year periods. The Board also stated that the relative investment performance of the fund was lower than its benchmark over time. The Board discussed with FMR actions to be taken by FMR to improve the fund’s disappointing performance.
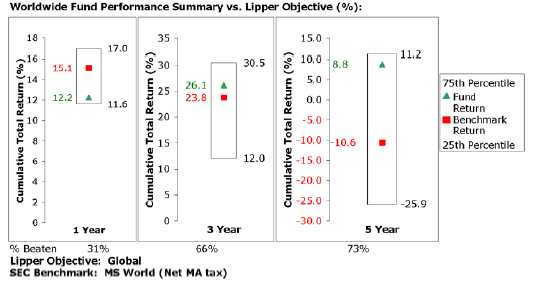
The Board reviewed the fund’s relative investment performance against its Lipper peer group and stated that the performance of the fund was in the third quartile for the one year period and the second quartile for the three and five year periods. The Board also stated that the relative investment performance of the fund has compared favorably to its benchmark over time, although the fund’s one year cumulative total return was lower than its benchmark.
The Board also considered that each fund’s (except Global Balanced Fund’s) management fee is subject to upward or downward adjustment depending upon whether, and to what extent, the fund’s investment performance for the performance period exceeds, or is exceeded by, the record (over the same period) of a Board approved performance adjustment index. The Board realizes that the performance adjustment provides FMR with a strong economic incentive to seek to achieve superior performance for each fund’s shareholders and helps to more closely align the interests of FMR and each fund’s shareholders.
The Board has had thorough discussions with FMR throughout the year about the Board’s and FMR’s concerns about equity research, equity fund performance, and compliance with internal policies governing gifts and entertainment. FMR has taken steps that it believes will refocus and
| Annual Report |
| A-70 |
strengthen equity research and equity portfolio management and compliance. The Board noted with favor FMR’s recent reorganization of its senior management team and FMR’s plans to dedicate additional resources to investment research, and participated in the process that led to those changes.
Based on its review, and giving particular weight to the nature and quality of the resources dedicated by the Investment Advisers to maintain and improve relative performance, the Board concluded that the nature, extent, and quality of the services provided by Fidelity will benefit each fund’s shareholders, particularly in light of the Board’s view that each fund’s shareholders benefit from investing in a fund that is part of a large family of funds offering a variety of investment disciplines and services.
Competitiveness of Management Fee and Total Fund Expenses. The Board considered each fund’s management fee and total expenses compared to “mapped groups” of competitive funds and classes. Fidelity creates “mapped groups” by combining similar Lipper investment objective categories that have comparable management fee characteristics. Combining Lipper investment objective categories aids the Board’s management fee and total expense comparisons by broadening the competitive group used for comparison and by reducing the number of universes to which various Fidelity funds are compared.
The Board considered two proprietary management fee comparisons for the 12 month periods shown in the charts below. The group of Lipper funds used by the Board for management fee comparisons is referred to below as the “Total Mapped Group” and, for the reasons explained above, is broader than the Lipper peer group used by the Board for performance comparisons. The Total Mapped Group comparison focuses on a fund’s standing relative to the total universe of comparable funds available to investors, in terms of gross management fees before expense reimbursements or caps. “TMG %” represents the percentage of funds in the Total Mapped Group that had management fees that were lower than a fund’s. For example, a TMG % of 45% would mean that 55% of the funds in the Total Mapped Group had higher management fees than a fund. The “Asset Size Peer Group” (ASPG) compari son focuses on a fund’s standing relative to non Fidelity funds similar in size to the fund within the Total Mapped Group. The ASPG represents at least 15% of the funds in the Total Mapped Group with comparable asset size and management fee characteristics, subject to a minimum of 50 funds (or all funds in the Total Mapped Group if fewer than 50). Additional information, such as the ASPG quartile (“quadrant”) in which a fund’s management fee ranked and the impact of a fund’s performance adjustment (if applicable), is also included in the charts and considered by the Board.
![]()
A-71 Annual Report
Board Approval of Investment Advisory Contracts and Management Fees - - continued
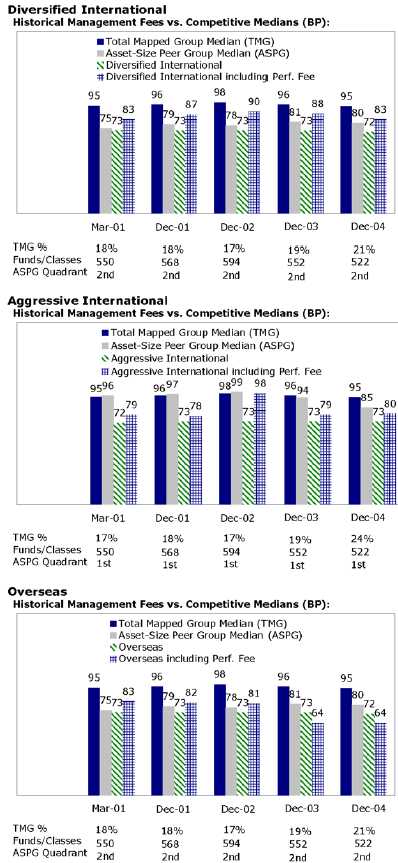
Annual Report A-72
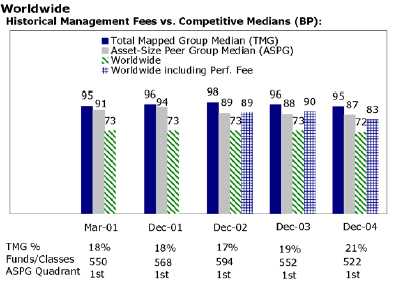
The Board noted that each fund’s management fee ranked below the median of its Total Mapped Group and below the median of its ASPG for 2004. The Board also noted the effect of a fund’s performance adjustment, if applicable, on the fund’s management fee ranking.
Based on its review, the Board concluded that each fund’s management fee was fair and reasonable in light of the services that the fund receives and the other factors considered.
In its review of each fund’s total expenses, the Board considered the fund’s management fee as well as other fund expenses, such as transfer agent fees, pricing and bookkeeping fees, and custodial, legal, and audit fees. The Board also noted the effects of any waivers and reimbursements on fees and expenses, as well as Aggressive International Fund’s, Diversified International Fund’s, and Worldwide Fund’s positive performance adjustment, and Overseas Fund’s negative performance adjustment. As part of its review, the Board also considered current and historical total expenses of each fund compared to competitive fund median expenses. Each fund is compared to those funds and classes in the Total Mapped Group (used by the Board for management fee comparisons) that have a similar sales load structure.
The Board noted that each fund’s (except Global Balanced Fund’s) total expenses ranked below its competitive median for 2004.
The Board noted that Global Balanced Fund’s total expenses ranked above its competitive median for 2004.
In its review of total expenses, the Board also considered Fidelity fee structures and other information on clients that FMR and its affiliates service in other competitive markets, such as other mutual funds advised or subadvised by FMR or its affiliates, pension plan clients, and other institutional clients.
Based on its review, the Board concluded that each fund’s total expenses were reasonable, although in the case of Global Balanced Fund above the median of the universe presented for comparison, in light of the services that the fund and its shareholders receive and the other factors considered.
Costs of the Services and Profitability. The Board considered the revenues earned and the expenses incurred by Fidelity in conducting the busi ness of developing, marketing, distributing, managing, administering and servicing each fund and its shareholders. The Board also considered the level of Fidelity’s profits in respect of all the Fidelity funds.
On an annual basis, FMR presents to the Board Fidelity’s profitability for each fund. Fidelity calculates the profitability for each fund, as well as aggre gate profitability for groups of Fidelity funds and all Fidelity funds, using a series of detailed revenue and cost allocation methodologies which originate with the audited books and records of Fidelity. The Audit Committee of the Board reviews any significant changes from the prior year’s methodologies.
PricewaterhouseCoopers LLP (PwC), independent registered accounting firm and auditor to Fidelity and certain Fidelity funds, has been engaged annually by the Board as part of the Board’s assessment of the results of Fidelity’s profitability analysis. PwC’s engagement includes the review and assessment of Fidelity’s methodologies used in determining the revenues and expenses attributable to Fidelity’s mutual fund business, and completion of agreed upon procedures surrounding the mathematical accuracy of fund profitability and its conformity to allocation methodologies. After consider ing PwC’s reports issued under the engagement and information provided by Fidelity, the Board believes that while other allocation methods may also be reasonable, Fidelity’s profitability methodologies are reasonable in all material respects.
| A-73 |
| Annual Report |
Board Approval of Investment Advisory Contracts and Management Fees - continued
The Board has also reviewed Fidelity’s non fund businesses and any fall out benefits related to the mutual fund business as well as cases where Fidelity’s affiliates may benefit from or be related to the funds’ business. In addition, a special committee of the Board reviewed services provided to Fidelity by its affiliates and determined that the fees that Fidelity paid for such services were reasonable.
The Board considered the costs of the services provided by and the profits realized by Fidelity in connection with the operation of each fund and determined that the amount of profit is a fair entrepreneurial profit for the management of each fund.
Economies of Scale. The Board considered whether there have been economies of scale in respect of the management of the Fidelity funds, whether the Fidelity funds (including each fund) have appropriately benefited from any such economies of scale, and whether there is potential for realization of any further economies of scale. The Board considered the extent to which each fund will benefit from economies of scale through increased services to the fund, through waivers or reimbursements, or through fee or expense reductions, including reductions that occur through operation of the transfer agent agreement. The transfer agent fee varies in part based on the number of accounts in each fund. If the number of accounts decreases or the average account size increases, the overall transfer agent fee rate decreases.
The Board recognized that each fund’s management contract incorporates a “group fee” structure, which provides for lower fee rates as total fund assets under FMR’s management increase, and for higher fee rates as total fund assets under FMR’s management decrease. The Board considered that the group fee is designed to deliver the benefits of economies of scale to fund shareholders when total fund assets increase, even if assets of any particu lar fund are unchanged or have declined, because some portion of Fidelity’s costs are attributable to services provided to all Fidelity funds, and all funds benefit if those costs can be allocated among more assets. The Board also considered that although Diversified International Fund is partially closed to new investors, it continues to incur investment management expenses, and marketing and distribution expenses related to the retention of existing shareholders and assets. The Board further noted that Diversified International Fund may continue to realize benefits from the group fee structure, even though assets may not be expected to grow significantly at the fund level. The Board concluded that, given the group fee structure, fund shareholders will achieve a certain level of economies of scale as assets under FMR’s management increase at the fund complex level, regardless of whether Fidelity achieves any such economies of scale.
The Board further concluded that any potential economies of scale are being shared between fund shareholders and Fidelity in an appropriate manner.
Additional Information Requested by the Board. In order to develop fully the factual basis for consideration of the Advisory Contracts, the Board requested additional information regarding (i) equity fund transfer agency fees; (ii) Fidelity’s fund profitability methodology and the impact of various changes in the methodology over time; (iii) benefits to shareholders from economies of scale; (iv) composition and characteristics of various fund and industry data used in comparisons; (v) compensation of portfolio managers and research analysts; and (vi) the impact of partially closing Diversified International Fund to new investors.
Based on its evaluation of all of the conclusions noted above, and after considering all material factors, the Board ultimately concluded that the exist ing advisory fee structures are fair and reasonable, and that each fund’s existing Advisory Contracts should be renewed.
| Annual Report |
| A-74 |
| Investment Adviser Fidelity Management & Research Company Boston, MA Investment Sub Advisers FMR Co., Inc. Fidelity Management & Research (U.K.) Inc. Fidelity Management & Research (Far East) Inc. Fidelity International Investment Advisors Fidelity International Investment Advisors (U.K.) Limited Fidelity Investments Japan Limited General Distributor Fidelity Distributors Corporation Boston, MA Transfer and Service Agent Fidelity Service Company, Inc. Boston, MA Custodians Brown Brothers Harriman & Co. Boston, MA Global Balanced Fund JPMorgan Chase Bank New York, NY Aggressive International Fund, Diversified International Fund, Overseas Fund, Worldwide Fund Corporate Headquarters 82 Devonshire Street Boston, MA 02109 1-800-544-8888 |
| The Fidelity Telephone Connection | ||||||||
| Mutual Fund 24-Hour Service | ||||||||
| Exchanges/Redemptions | ||||||||
| and Account Assistance | 1-800-544-6666 | |||||||
| Product Information | 1-800-544-6666 | |||||||
| Retirement Accounts | 1-800-544-4774 | |||||||
| (8 a.m. - 9 p.m.) | ||||||||
| TDD Service | 1-800-544-0118 | |||||||
| for the deaf and hearing impaired | ||||||||
| (9 a.m. - 9 p.m. Eastern time) | ||||||||
| Fidelity Automated Service | ||||||||
| Telephone (FAST®) (automated phone logo) | 1- 800- 544-5555 | |||||||
| (automated phone logo) Automated line for quickest service | ||||||||

| IBD UANNPRO 1205 1.784774.102 |
| Fidelity’s Targeted International Equity Funds® |
| Fidelity® Canada Fund Fidelity China Region Fund Fidelity Emerging Markets Fund Fidelity Europe Fund Fidelity Europe Capital Appreciation Fund |
| Fidelity Japan Fund Fidelity Japan Smaller Companies Fund Fidelity Latin America Fund Fidelity Nordic Fund Fidelity Pacific Basin Fund Fidelity Southeast Asia Fund |

Annual Report
October 31, 2005

| Contents | ||||
| Shareholder Expense Example | A-4 | An example of Shareholder Expenses | ||
| Canada Fund | A-6 | Performance | ||
| A-7 | Management’s Discussion | |||
| A-8 | Investment Changes | |||
| A-9 | Investments | |||
| A-12 | Financial Statements | |||
| China Region Fund | A-14 | Performance | ||
| A-15 | Management’s Discussion | |||
| A-16 | Investment Changes | |||
| A-17 | Investments | |||
| A-20 | Financial Statements | |||
| Emerging Markets Fund | A-22 | Performance | ||
| A-23 | Management’s Discussion | |||
| A-24 | Investment Changes | |||
| A-25 | Investments | |||
| A-29 | Financial Statements | |||
| Europe Fund | A-31 | Performance | ||
| A-32 | Management’s Discussion | |||
| A-33 | Investment Changes | |||
| A-34 | Investments | |||
| A-36 | Financial Statements | |||
| Europe Capital Appreciation Fund | A-38 | Performance | ||
| A-39 | Management’s Discussion | |||
| A-40 | Investment Changes | |||
| A-41 | Investments | |||
| A-43 | Financial Statements | |||
| Japan Fund | A-45 | Performance | ||
| A-46 | Management’s Discussion | |||
| A-47 | Investment Changes | |||
| A-48 | Investments | |||
| A-51 | Financial Statements | |||
| Japan Smaller Companies Fund | A-53 | Performance | ||
| A-54 | Management’s Discussion | |||
| A-55 | Investment Changes | |||
| A-56 | Investments | |||
| A-60 | Financial Statements | |||
| Latin America Fund | A-62 | Performance | ||
| A-63 | Management’s Discussion | |||
| A-64 | Investment Changes | |||
| A-65 | Investments | |||
| A-67 | Financial Statements | |||
| Annual Report |
| A-2 |
| Nordic Fund | A-69 | Performance | ||
| A-70 | Management’s Discussion | |||
| A-71 | Investment Changes | |||
| A-72 | Investments | |||
| A-74 | Financial Statements | |||
| Pacific Basin Fund | A-76 | Performance | ||
| A-77 | Management’s Discussion | |||
| A-78 | Investment Changes | |||
| A-79 | Investments | |||
| A-83 | Financial Statements | |||
| Southeast Asia Fund | A-85 | Performance | ||
| A-86 | Management’s Discussion | |||
| A-87 | Investment Changes | |||
| A-88 | Investments | |||
| A-91 | Financial Statements | |||
| Notes to Financial Statements | A-93 | Notes to Financial Statements | ||
| Reports of Independent Registered | A-100 | |||
| Public Accounting Firms | ||||
| Trustees and Officers | A-102 | |||
| Distributions | A-108 | |||
| Board Approval of Investment | A-110 | |||
| Advisory Contracts and | ||||
| Management Fees |
| To view a fund’s proxy voting guidelines and proxy voting record for the 12 month period ended June 30, visit www.fidelity.com/proxyvotingresults or visit the Securities and Exchange Commission’s (SEC) web site at www.sec.gov. You may also call 1-800-544-8544 to request a free copy of the proxy voting guidelines. Standard & Poor’s, S&P and S&P 500 are registered service marks of The McGraw Hill Companies, Inc. and have been licensed for use by Fidelity Distributors Corporation. Other third party marks appearing herein are the property of their respective owners. All other marks appearing herein are registered or unregistered trademarks or service marks of FMR Corp. or an affiliated company. |
| This report and the financial statements contained herein are submitted for the general information of the shareholders of the funds. This report is not authorized for distribution to prospective investors in the funds unless preceded or accompanied by an effective prospectus. A fund files its complete schedule of portfolio holdings with the SEC for the first and third quarters of each fiscal year on Form N Q. Forms N Q are available on the SEC’s web site at http://www.sec.gov. A fund’s Forms N Q may be reviewed and copied at the SEC’s Public Reference Room in Washington, DC. Informa tion regarding the operation of the SEC’s Public Reference Room may be obtained by calling 1-800-SEC-0330. For a complete list of a fund’s portfolio holdings, view each fund’s most recent quarterly holdings report, semiannual report, or annual report on Fidelity’s web site at http://www.fidelity.com/holdings. NOT FDIC INSURED · MAY LOSE VALUE · NO BANK GUARANTEE |
| Neither the funds nor Fidelity Distributors Corporation is a bank. |
| A-3 |
| Annual Report |
| Shareholder Expense Example |
As a shareholder of a Fund, you incur two types of costs: (1) transaction costs and redemption fees, and (2) ongoing costs, including management fees and other Fund expenses. This Example is intended to help you understand your ongoing costs (in dollars) of investing in the Funds and to compare these costs with the ongoing costs of investing in other mutual funds.
The Example is based on an investment of $1,000 invested at the beginning of the period and held for the entire period (May 1, 2005 to October 31, 2005).
| Actual Expenses |
The first line of the table below for each fund provides information about actual account values and actual expenses. You may use the information in this line, together with the amount you invested, to estimate the expenses that you paid over the period. Simply divide your account value by $1,000.00 (for example, an $8,600 account value divided by $1,000.00 = 8.6), then multiply the result by the number in the first line for a fund under the heading entitled “Expenses Paid During Period” to estimate the expenses you paid on your account during this period. A small balance maintenance fee of $12.00 that is charged once a year may apply for certain accounts with a value of less than $2,000. This fee is not included in the table below. If it was, the estimate of expenses you paid during the period would be higher, and your ending account value lower, by this amount.
| Hypothetical Example for Comparison Purposes |
The second line of the table below for each fund provides information about hypothetical account values and hypothetical expenses based on a fund’s actual expense ratio and an assumed rate of return of 5% per year before expenses, which is not the Fund’s actual return. The hypothetical account values and expenses may not be used to estimate the actual ending account balance or expenses you paid for the period. You may use this information to compare the ongoing costs of investing in the Fund and other funds. To do so, compare this 5% hypothetical example with the 5% hypothetical examples that appear in the shareholder reports of the other funds. A small balance maintenance fee of $12.00 that is charged once a year may apply for certain accounts with a value of less than $2,000. This fee is not included in the table below. If it was, the estimate of expenses you paid during the period would be higher, and your ending account value lower, by this amount.
Please note that the expenses shown in the table are meant to highlight your ongoing costs only and do not reflect any transaction costs. Therefore, the second line of the table is useful in comparing ongoing costs only, and will not help you determine the relative total costs of owning different funds. In addition, if these transactional costs were included, your costs would have been higher.
| Expenses Paid | ||||||||||||
| Beginning | Ending | During Period* | ||||||||||
| Account Value | Account Value | May 1, 2005 | ||||||||||
| May 1, 2005 | October 31, 2005 | to October 31, 2005 | ||||||||||
| Canada | ||||||||||||
| Actual | $ | 1,000.00 | $ | 1,169.40 | $ | 5.69 | ||||||
| HypotheticalA | $ | 1,000.00 | $ | 1,019.96 | $ | 5.30 | ||||||
| China Region | ||||||||||||
| Actual | $ | 1,000.00 | $ | 1,033.20 | $ | 6.00 | ||||||
| HypotheticalA | $ | 1,000.00 | $ | 1,019.31 | $ | 5.96 | ||||||
| Emerging Markets | ||||||||||||
| Actual | $ | 1,000.00 | $ | 1,217.80 | $ | 6.37 | ||||||
| HypotheticalA | $ | 1,000.00 | $ | 1,019.46 | $ | 5.80 | ||||||
| Europe | ||||||||||||
| Actual | $ | 1,000.00 | $ | 1,093.60 | $ | 6.28 | ||||||
| HypotheticalA | $ | 1,000.00 | $ | 1,019.21 | $ | 6.06 | ||||||
| Europe Capital Appreciation | ||||||||||||
| Actual | $ | 1,000.00 | $ | 1,095.60 | $ | 4.81 | ||||||
| HypotheticalA | $ | 1,000.00 | $ | 1,020.62 | $ | 4.63 | ||||||
| Japan | ||||||||||||
| Actual | $ | 1,000.00 | $ | 1,205.80 | $ | 5.89 | ||||||
| HypotheticalA | $ | 1,000.00 | $ | 1,019.86 | $ | 5.40 | ||||||
| Japan Smaller Companies | ||||||||||||
| Actual | $ | 1,000.00 | $ | 1,100.40 | $ | 5.40 | ||||||
| HypotheticalA | $ | 1,000.00 | $ | 1,020.06 | $ | 5.19 | ||||||
| Latin America | ||||||||||||
| Actual | $ | 1,000.00 | $ | 1,395.30 | $ | 6.52 | ||||||
| HypotheticalA | $ | 1,000.00 | $ | 1,019.76 | $ | 5.50 | ||||||
| Nordic | ||||||||||||
| Actual | $ | 1,000.00 | $ | 1,121.50 | $ | 6.15 | ||||||
| HypotheticalA | $ | 1,000.00 | $ | 1,019.41 | $ | 5.85 | ||||||
| Pacific Basin | ||||||||||||
| Actual | $ | 1,000.00 | $ | 1,149.20 | $ | 6.01 | ||||||
| HypotheticalA | $ | 1,000.00 | $ | 1,019.61 | $ | 5.65 | ||||||
| Annual Report |
| A-4 |
| Expenses Paid | ||||||||||||
| Beginning | Ending | During Period* | ||||||||||
| Account Value | Account Value | May 1, 2005 | ||||||||||
| May 1, 2005 | October 31, 2005 | to October 31, 2005 | ||||||||||
| Southeast Asia | ||||||||||||
| Actual | $ | 1,000.00 | $ | 1,105.90 | $ | 6.48 | ||||||
| HypotheticalA | $ | 1,000.00 | $ | 1,019.06 | $ | 6.21 | ||||||
| A 5% return per year before expenses | ||||||||||||
* Expenses are equal to each Fund’s annualized expense ratio (shown in the table below); multiplied by the average account value over the period, multiplied by 184/365 (to reflect the one half year period).
| Annualized | ||
| Expense Ratio | ||
| Canada | 1.04% | |
| China Region | 1.17% | |
| Emerging Markets | 1.14% | |
| Europe | 1.19% | |
| Europe Capital Appreciation | 91% | |
| Japan | 1.06% | |
| Japan Smaller Companies | 1.02% | |
| Latin America | 1.08% | |
| Nordic | 1.15% | |
| Pacific Basin | 1.11% | |
| Southeast Asia | 1.22% |
| A-5 A-5 |
| Annual Report |
| Canada |
| Performance: The Bottom Line |
Average annual total return reflects the change in the value of an investment, assuming reinvestment of the fund’s dividend income and capital gains (the profits earned upon the sale of securities that have grown in value) and assuming a constant rate of performance each year. The $10,000 table and the fund’s returns do not reflect the deduction of taxes that a shareholder would pay on fund distributions or the redemption of fund shares. During periods of reimbursement by Fidelity, a fund’s total returns will be greater than it would be had the reimbursement not occurred. How a fund did yesterday is no guarantee of how it will do tomorrow.
| Average Annual Total Returns | ||||||
| Periods ended | Past 1 | Past 5 | Past 10 | |||
| October 31, 2005 | year | years | years | |||
| Fidelity® Canada Fund | 23.11% | 13.26% | 12.97% | |||
| $10,000 Over 10 Years | ||||||
Let’s say hypothetically that $10,000 was invested in Fidelity® Canada Fund on October 31, 1995. The chart shows how the value of your investment would have changed, and also shows how the S&P/TSX Composite Index performed over the same period.
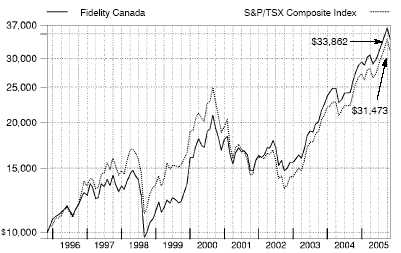
| Annual Report |
| A-6 |
| Canada |
Management’s Discussion of Fund Performance
Comments from Maxime Lemieux, Portfolio Manager of Fidelity® Canada Fund
Foreign stock markets enjoyed broad based advances during the 12 month period that ended October 31, 2005, encouraged by better than expected corporate earnings and markedly improved economies. For the 12 months overall, the Morgan Stanley Capital InternationalSM Europe, Australasia, Far East (MSCI® EAFE®) Index a performance measure of developed stock markets outside the United States and Canada gained 18.28% . The Japanese stock market climbed to its highest level in more than four years. Positive economic indicators and Prime Minister Koizumi’s decisive election victory attracted record inflows from overseas investors. In response, the Tokyo Stock Exchange Stock Price Index (TOPIX) soared 22.89% . Southeast Asian equities outside of Japan, particularly South Korea, also responded well to the better macroeconomic environment, illustrated by the 19.44% return for the MSCI All Country Far East ex Japan index. European stock markets were up as well, despite investors’ concern about higher energy prices and potential downgrades to economic growth in the region. For the year overall, the MSCI Europe index rose 16.51% . Canada was a beneficiary of record high oil prices. Unbeknownst to many, Canada is the largest supplier of oil to the United States, a factor that contributed heavily to the 23.19% gain for the S&P/TSX Composite Index. While the U.S. dollar strengthened versus most major currencies, it weakened against the Canadian dollar, which boosted returns for U.S. investors in Canada.
For the 12 months ending October 31, 2005, Fidelity Canada Fund returned 23.11%, virtually matching the return of its benchmark, the S&P/TSX Composite Index. The fund’s slight underperformance relative to the index came mostly as a result of its underweighting in the energy sector. The positioning there was decreased toward the end of the period as energy demand started to recede a bit and prices fell from their previous record highs. But even as prices came down modestly, there still was a lot of valuation support for energy stocks, and the underweighting in that sector took a small toll on the fund’s overall performance. Not owning oil sands producer and major index component Suncor Energy, for example, was the biggest drag on the fund’s relative return. Meanwhile, some stocks outside of the energy sector that I overweighted, including Research In Motion, maker of the popular BlackBerry handheld communications device which saw sales growth slow also hurt. What worked better was astute stock picking in the materials and telecommunication services sectors, as well as in the insurance and capital goods industries. Names such as ING Canada, the multi line insurer, and telecom giant Roger Communications, provided the biggest boosts relative to the index.
Note to shareholders:
Fidelity Canada Fund may invest up to 35% of its total assets in any industry that represents more than 20% of the Canadian market. As of October 31, 2005, the fund did not have more than 25% of its total assets invested in any one industry.
The views expressed in this statement reflect those of the portfolio manager only through the end of the period of the report as stated on the cover and do not necessarily represent the views of Fidelity or any other person in the Fidelity organization. Any such views are subject to change at any time based upon market or other conditions and Fidelity disclaims any responsibility to update such views. These views may not be relied on as invest ment advice and, because investment decisions for a Fidelity fund are based on numerous factors, may not be relied on as an indication of trading intent on behalf of any Fidelity fund.
| A-7 A-7 |
| Annual Report |
| Canada Investment Changes |
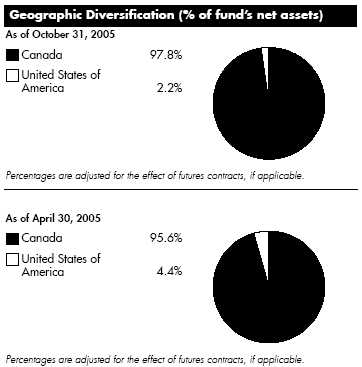
| Asset Allocation | ||||
| % of fund’s | % of fund’s net assets | |||
| net assets | 6 months ago | |||
| Stocks and Equity Futures | 94.9 | 93.1 | ||
| Short Term Investments and | ||||
| Net Other Assets | 5.1 | 6.9 |
| Top Ten Stocks as of October 31, 2005 | ||||
| % of fund’s | % of fund’s net assets | |||
| net assets | 6 months ago | |||
| EnCana Corp. (Oil, Gas & | ||||
| Consumable Fuels) | 5.2 | 4.4 | ||
| Royal Bank of Canada | ||||
| (Commercial Banks) | 4.9 | 2.3 | ||
| Manulife Financial Corp. | ||||
| (Insurance) | 3.5 | 3.6 | ||
| Canadian National Railway Co. | ||||
| (Road & Rail) | 3.4 | 3.2 | ||
| Toronto Dominion Bank | ||||
| (Commercial Banks) | 3.4 | 4.9 | ||
| ING Canada, Inc. (Insurance) | 3.2 | 2.0 | ||
| Rogers Communications, Inc. | ||||
| Class B (non vtg.) (Media) | 3.1 | 2.9 | ||
| TELUS Corp. (non vtg.) (Diversified | ||||
| Telecommunication Services) | 3.0 | 2.1 | ||
| Canadian Natural Resources Ltd. | ||||
| (Oil, Gas & Consumable Fuels) | 2.8 | 2.3 | ||
| TransCanada Corp. (Oil, Gas & | ||||
| Consumable Fuels) | 2.4 | 0.8 | ||
| 34.9 | ||||
| Market Sectors as of October 31, 2005 | ||||
| % of fund’s | % of fund’s net assets | |||
| net assets | 6 months ago | |||
| Financials | 27.4 | 28.7 | ||
| Energy | 22.0 | 17.2 | ||
| Consumer Discretionary | 10.8 | 10.4 | ||
| Industrials | 8.8 | 9.2 | ||
| Materials | 8.3 | 9.6 | ||
| Information Technology | 6.2 | 5.2 | ||
| Telecommunication Services | 4.6 | 4.9 | ||
| Consumer Staples | 4.5 | 6.6 | ||
| Utilities | 0.9 | 0.9 | ||
| Health Care | 0.0 | 0.4 | ||
Annual Report A-8
| Canada Investments October 31, 2005 Showing Percentage of Net Assets |
| Common Stocks 93.5% | ||||||
| Shares | Value (Note 1) | |||||
| CONSUMER DISCRETIONARY 10.8% | ||||||
| Hotels, Restaurants & Leisure 0.8% | ||||||
| Great Canadian Gaming Corp. (a) | 1,105,000 | $ 13,005,504 | ||||
| Leisure Equipment & Products 0.3% | ||||||
| Mega Bloks, Inc. (a) | 169,100 | 3,344,772 | ||||
| Mega Bloks, Inc. (a)(g) | 48,100 | 856,270 | ||||
| 4,201,042 | ||||||
| Media 7.4% | ||||||
| Aeroplan Income Fund | 212,000 | 2,181,033 | ||||
| Aeroplan Income Fund (a)(e) | 31,800 | 327,155 | ||||
| Alliance Atlantis Communications, Inc. | ||||||
| Class B (non vtg.) (a) | 478,000 | 11,939,882 | ||||
| Astral Media, Inc. Class A (non vtg.) | 270,000 | 7,190,093 | ||||
| Chum Ltd. Class B (non vtg.) | 96,100 | 2,441,152 | ||||
| Corus Entertainment, Inc. Class B | ||||||
| (non vtg.) | 345,000 | 9,099,704 | ||||
| Quebecor, Inc. Class B (sub. vtg.) | 370,000 | 7,904,403 | ||||
| Rogers Communications, Inc. Class B | ||||||
| (non vtg.) | 1,355,000 | 53,465,707 | ||||
| Thomson Corp. | 360,000 | 12,223,539 | ||||
| Yellow Pages Income Fund | 1,860,300 | 21,265,072 | ||||
| 128,037,740 | ||||||
| Multiline Retail – 0.8% | ||||||
| Canadian Tire Corp. Ltd. Class A | ||||||
| (non vtg.) | 265,000 | 13,757,113 | ||||
| Specialty Retail 0.5% | ||||||
| RONA, Inc. (a) | 465,000 | 8,638,527 | ||||
| Textiles, Apparel & Luxury Goods 1.0% | ||||||
| Gildan Activewear, Inc. Class A (a) | 500,000 | 17,485,182 | ||||
| TOTAL CONSUMER DISCRETIONARY | 185,125,108 | |||||
| CONSUMER STAPLES 4.5% | ||||||
| Food & Staples Retailing – 4.5% | ||||||
| Alimentation Couche Tard, Inc. Class B | ||||||
| (sub. vtg.) (a) | 1,150,800 | 20,852,769 | ||||
| Jean Coutu Group, Inc. Class A (sub. | ||||||
| vtg.) | 724,500 | 8,827,735 | ||||
| Loblaw Companies Ltd. | 160,000 | 9,098,730 | ||||
| Metro, Inc. Class A (sub. vtg.) | 420,000 | 11,700,254 | ||||
| Shoppers Drug Mart Corp. | 815,000 | 27,113,760 | ||||
| 77,593,248 | ||||||
| ENERGY 22.0% | ||||||
| Energy Equipment & Services – 1.6% | ||||||
| CCS Income Trust (d) | 392,000 | 9,788,383 | ||||
| CHC Helicopter Corp. Class A (sub. vtg.) | 500,000 | 10,410,669 | ||||
| Pason Systems, Inc. | 175,000 | 3,511,854 | ||||
| Savanna Energy Services Corp. (a) | 170,000 | 3,490,686 | ||||
| 27,201,592 | ||||||
| Oil, Gas & Consumable Fuels 20.4% | ||||||
| AltaGas Income Trust | 175,000 | 3,777,096 | ||||
| Shares | Value (Note 1) | |||
| Cameco Corp. | 570,000 | $ 27,409,229 | ||
| Canadian Natural Resources Ltd. | 1,200,000 | 49,066,892 | ||
| EnCana Corp. | 1,946,632 | 89,007,729 | ||
| Highpine Oil & Gas Ltd. | 300,000 | 5,461,473 | ||
| Husky Energy, Inc. | 115,000 | 5,306,943 | ||
| Imperial Oil Ltd. | 405,200 | 35,407,824 | ||
| OPTI Canada, Inc. (a) | 480,300 | 14,913,295 | ||
| Penn West Energy Trust (d) | 525,000 | 13,891,829 | ||
| Petro Canada | 850,000 | 29,624,047 | ||
| Quicksilver Resources, Inc. (a) | 90,000 | 3,485,700 | ||
| Talisman Energy, Inc. | 755,000 | 33,441,194 | ||
| TransCanada Corp. | 1,400,000 | 41,573,243 | ||
| 352,366,494 | ||||
| TOTAL ENERGY | 379,568,086 | |||
| FINANCIALS 27.4% | ||||
| Capital Markets 0.6% | ||||
| Addenda Capital, Inc. | 165,000 | 4,261,219 | ||
| C.I. Fund Management, Inc. | 350,000 | 6,371,719 | ||
| 10,632,938 | ||||
| Commercial Banks – 14.0% | ||||
| Bank of Montreal, Quebec | 565,300 | 27,671,459 | ||
| Bank of Nova Scotia | 450,500 | 16,398,810 | ||
| Canadian Imperial Bank of Commerce | 600,000 | 36,680,779 | ||
| National Bank of Canada | 350,000 | 17,526,672 | ||
| Royal Bank of Canada | 1,200,400 | 84,698,842 | ||
| Toronto Dominion Bank | 1,250,100 | 58,958,992 | ||
| 241,935,554 | ||||
| Diversified Financial Services – 3.7% | ||||
| Brascan Corp. Class A (ltd. vtg.) | 810,000 | 36,947,248 | ||
| Power Corp. of Canada (sub. vtg.) | 770,000 | 19,057,663 | ||
| TSX Group, Inc. | 258,100 | 7,928,762 | ||
| 63,933,673 | ||||
| Insurance – 9.1% | ||||
| Industrial Alliance Life Insurance Co. | 545,000 | 13,382,727 | ||
| ING Canada, Inc | 1,480,000 | 55,515,665 | ||
| ING Canada, Inc. (e)�� | 31,000 | 1,162,828 | ||
| Manulife Financial Corp. | 1,147,300 | 59,715,945 | ||
| Sun Life Financial, Inc. | 705,101 | 26,299,491 | ||
| 156,076,656 | ||||
| TOTAL FINANCIALS | 472,578,821 | |||
| INDUSTRIALS – 8.8% | ||||
| Aerospace & Defense – 0.8% | ||||
| CAE, Inc. | 2,015,700 | 13,756,598 | ||
| Airlines – 1.0% | ||||
| ACE Aviation Holdings, Inc. Class A (a) . | 545,400 | 14,316,173 | ||
| WestJet Airlines Ltd. (a) | 257,500 | 2,352,604 | ||
| 16,668,777 | ||||
See accompanying notes which are an integral part of the financial statements.
A-9 A-9 Annual Report
| Canada | ||||
| Investments - continued | ||||
| Common Stocks continued | ||||
| Shares | Value (Note 1) | |||
| INDUSTRIALS – continued | ||||
| Commercial Services & Supplies 0.0% | ||||
| Garda World Security Corp. (a) | 60,000 | $ 716,342 | ||
| Construction & Engineering – 1.3% | ||||
| SNC Lavalin Group, Inc. | 350,000 | 22,078,747 | ||
| Electrical Equipment 0.1% | ||||
| Hydrogenics Corp. (a) | 350,000 | 1,069,856 | ||
| Road & Rail 4.7% | ||||
| ATS Andlauer Income Fund | 220,500 | 1,652,350 | ||
| Canadian National Railway Co. | 815,050 | 59,006,583 | ||
| Canadian Pacific Railway Ltd. | 360,000 | 14,799,323 | ||
| Mullen Group Income Fund | 75,000 | 1,486,029 | ||
| TransForce Income Fund | 345,858 | 4,407,420 | ||
| 81,351,705 | ||||
| Trading Companies & Distributors – 0.9% | ||||
| Finning International, Inc. | 445,700 | 14,559,785 | ||
| Russel Metals, Inc. (e) | 25,000 | 405,045 | ||
| 14,964,830 | ||||
| TOTAL INDUSTRIALS | 150,606,855 | |||
| INFORMATION TECHNOLOGY 6.2% | ||||
| Communications Equipment – 3.0% | ||||
| Nortel Networks Corp. (a) | 3,050,000 | 9,912,500 | ||
| Research In Motion Ltd. (a) | 675,900 | 41,561,269 | ||
| 51,473,769 | ||||
| Internet Software & Services 0.1% | ||||
| Emergis, Inc. (a) | 875,000 | 2,778,366 | ||
| IT Services 1.0% | ||||
| CGI Group, Inc. Class A (sub. vtg.) (a) | 2,380,000 | 17,129,551 | ||
| Semiconductors & Semiconductor Equipment – 0.7% | ||||
| ATI Technologies, Inc. (a) | 631,600 | 9,091,617 | ||
| Tundra Semiconductor Corp. Ltd. (a) | 200,000 | 2,328,535 | ||
| Tundra Semiconductor Corp. Ltd. (a)(e) . | 4,300 | 50,064 | ||
| 11,470,216 | ||||
| Software 1.4% | ||||
| Cognos, Inc. (a) | 340,000 | 12,678,747 | ||
| MacDonald Dettwiler & Associates | ||||
| Ltd. (a) | 175,000 | 5,088,484 | ||
| NAVTEQ Corp. (a) | 120,300 | 4,706,136 | ||
| Workbrain Corp. (a) | 156,100 | 1,875,579 | ||
| 24,348,946 | ||||
| TOTAL INFORMATION TECHNOLOGY | 107,200,848 | |||
| MATERIALS 8.3% | ||||
| Chemicals 1.1% | ||||
| Potash Corp. of Saskatchewan | 235,000 | 19,265,622 | ||
| Shares | Value (Note 1) | |||||||
| Metals & Mining – 7.1% | ||||||||
| Aber Diamond Corp. | 145,000 | $ 4,542,760 | ||||||
| Alcan, Inc. | 550,000 | 17,328,959 | ||||||
| Eldorado Gold Corp. (a) | 1,952,000 | 5,966,740 | ||||||
| Falconbridge Ltd. | 400,708 | 11,244,253 | ||||||
| Gabriel Resources Ltd. (a) | 1,360,000 | 2,706,181 | ||||||
| Gabriel Resources Ltd. (a)(e) | 60,000 | 119,390 | ||||||
| Goldcorp, Inc. | 1,007,975 | 20,278,989 | ||||||
| Inco Ltd. | 130,000 | 5,213,209 | ||||||
| IPSCO, Inc. | 60,000 | 4,275,191 | ||||||
| Placer Dome, Inc. | 1,320,000 | 26,075,868 | ||||||
| Teck Cominco Ltd. Class B (sub. vtg.) | 562,500 | 23,700,254 | ||||||
| 121,451,794 | ||||||||
| Paper & Forest Products 0.1% | ||||||||
| Canfor Corp. (a) | 185,000 | 1,901,693 | ||||||
| TOTAL MATERIALS | 142,619,109 | |||||||
| TELECOMMUNICATION SERVICES 4.6% | ||||||||
| Diversified Telecommunication Services – 4.6% | ||||||||
| BCE, Inc. | 1,110,000 | 27,406,943 | ||||||
| TELUS Corp. (non vtg.) | 1,400,000 | 52,526,672 | ||||||
| 79,933,615 | ||||||||
| UTILITIES 0.9% | ||||||||
| Electric Utilities – 0.9% | ||||||||
| Fortis, Inc. | 860,000 | 16,020,322 | ||||||
| TOTAL COMMON STOCKS | ||||||||
| (Cost $1,346,761,754) | 1,611,246,012 | |||||||
| Government Obligations 3.4% | ||||||||
| Principal | ||||||||
| Amount | ||||||||
| Canadian Government Treasury | ||||||||
| Bills 2.6293% to 3.0193% | ||||||||
| 11/17/05 to 1/26/06 (f) | ||||||||
| (Cost $57,494,463) | CAD | $ | 68,400,000 | 57,735,970 | ||||
See accompanying notes which are an integral part of the financial statements.
Annual Report A-10
| Money Market Funds 4.2% | ||||||||
| Shares | Value (Note 1) | |||||||
| Fidelity Cash Central Fund, | ||||||||
| 3.92% (b) | 53,565,998 | $ | 53,565,998 | |||||
| Fidelity Securities Lending Cash | ||||||||
| Central Fund, 3.94% (b)(c) | 18,844,300 | 18,844,300 | ||||||
| TOTAL MONEY MARKET FUNDS | ||||||||
| (Cost $72,410,298) | 72,410,298 | |||||||
| TOTAL INVESTMENT PORTFOLIO 101.1% | ||||||||
| (Cost $1,476,666,515) | 1,741,392,280 | |||||||
| NET OTHER ASSETS (1.1)% | (18,875,905) | |||||||
| NET ASSETS 100% | $ 1,722,516,375 | |||||||
| Futures Contracts | ||||||||
| Expiration | Underlying | Unrealized | ||||||
| Date | Face Amount | Appreciation | ||||||
| at Value | (Depreciation) | |||||||
| Purchased | ||||||||
| Equity Index Contracts | ||||||||
| 240 STP/TSX 60 Index | ||||||||
| Contracts (Canada) | Dec. 2005 | $ 24,044,729 | $ | (1,423,861) | ||||
The face value of futures purchased as a percentage of net assets - 1.4%
| Currency Abbreviations |
| CAD — Canadian dollar |
| Legend (a) Non-income producing (b) Affiliated fund that is available only to investment companies and other accounts managed by Fidelity Investments. The rate quoted is the annualized seven-day yield of the fund at period end. A complete unaudited listing of the fund’s holdings as of its most recent quarter end is available upon request. (c) Investment made with cash collateral received from securities on loan. (d) Security or a portion of the security is on loan at period end. (e) Security exempt from registration under Rule 144A of the Securities Act of 1933. These securities may be resold in transactions exempt from registration, normally to qualified institutional buyers. At the period end, the value of these securities amounted to $2,064,482 or 0.1% of net assets. (f) Security or a portion of the security was pledged to cover margin requirements for futures contracts. At the period end, the value of securities pledged amounted to $1,688,186. (g) Restricted securities – Investment in securities not registered under the Securities Act of 1933 (excluding 144A issues). At the end of the period, the value of restricted securities (excluding 144A issues) amounted to $856,270 or 0.0% of net assets. |
Additional information on each holding is as follows:
| Security | Acquisition Date | Acquisition Cost | ||||
| Mega Bloks, Inc. | 6/29/05 | $ | 871,129 |
Income Tax Information
At October 31, 2005, the fund had a capital loss carryforward of approximately $11,571,042 all of which will expire on October 31, 2009.
See accompanying notes which are an integral part of the financial statements.
A-11 A-11 Annual Report
| Canada Financial Statements |
| Statement of Assets and Liabilities | ||||||
| October 31, 2005 | ||||||
| Assets | ||||||
| Investment in securities, at value | ||||||
| (including securities loaned of | ||||||
| $17,758,043) (cost | ||||||
| $1,476,666,515) — See ac- | ||||||
| companying schedule | $1,741,392,280 | |||||
| Cash | 10,640 | |||||
| Receivable for investments sold | 3,807,558 | |||||
| Receivable for fund shares sold | 10,364,945 | |||||
| Dividends receivable | 2,081,302 | |||||
| Interest receivable | 249,989 | |||||
| Receivable for daily variation on | ||||||
| futures contracts | 179,578 | |||||
| Other affiliated receivables | 7,497 | |||||
| Other receivables | 122,991 | |||||
| Total assets | 1,758,216,780 | |||||
| Liabilities | ||||||
| Payable for investments purchased | $ | 13,052,464 | ||||
| Payable for fund shares redeemed | 2,225,648 | |||||
| Accrued management fee | 966,178 | |||||
| Other affiliated payables | 386,936 | |||||
| Other payables and accrued | ||||||
| expenses | 224,879 | |||||
| Collateral on securities loaned, at | ||||||
| value | 18,844,300 | |||||
| Total liabilities | 35,700,405 | |||||
| Net Assets | $ 1,722,516,375 | |||||
| Net Assets consist of: | ||||||
| Paid in capital | $1,467,314,587 | |||||
| Undistributed net investment | ||||||
| income | 4,865,446 | |||||
| Accumulated undistributed net | ||||||
| realized gain (loss) on invest- | ||||||
| ments and foreign currency | ||||||
| transactions | (12,956,968) | |||||
| Net unrealized appreciation (de- | ||||||
| preciation) on investments and | ||||||
| assets and liabilities in foreign | ||||||
| currencies | 263,293,310 | |||||
| Net Assets, for 44,010,299 | ||||||
| shares outstanding | $ 1,722,516,375 | |||||
| Net Asset Value, offering price | ||||||
| and redemption price per share | ||||||
| ($1,722,516,375 ÷ | ||||||
| 44,010,299 shares) | $ | 39.14 | ||||
| Statement of Operations | ||||||
| Year ended October 31, 2005 | ||||||
| Investment Income | ||||||
| Dividends | $ | 16,011,712 | ||||
| Interest | 1,908,752 | |||||
| Security lending | 821,884 | |||||
| 18,742,348 | ||||||
| Less foreign taxes withheld | (2,402,050) | |||||
| Total income | 16,340,298 | |||||
| Expenses | ||||||
| Management fee | ||||||
| Basic fee | $ | 7,376,663 | ||||
| Performance adjustment | 61,139 | |||||
| Transfer agent fees | 2,601,562 | |||||
| Accounting and security lending | ||||||
| fees | 461,983 | |||||
| Independent trustees’ | ||||||
| compensation | 4,352 | |||||
| Custodian fees and expenses | 220,089 | |||||
| Registration fees | 236,338 | |||||
| Audit | 62,304 | |||||
| Legal | 2,199 | |||||
| Miscellaneous | 8,357 | |||||
| Total expenses before reductions | 11,034,986 | |||||
| Expense reductions | (330,331) | 10,704,655 | ||||
| Net investment income (loss) | 5,635,643 | |||||
| Realized and Unrealized Gain | ||||||
| (Loss) | ||||||
| Net realized gain (loss) on: | ||||||
| Investment securities | 6,331,253 | |||||
| Foreign currency transactions | (1,029,443) | |||||
| Futures contracts | (401,967) | |||||
| Total net realized gain (loss) | 4,899,843 | |||||
| Change in net unrealized appreci- | ||||||
| ation (depreciation) on: | ||||||
| Investment securities | 167,585,265 | |||||
| Assets and liabilities in foreign | ||||||
| currencies | (4,034) | |||||
| Futures contracts | (1,423,861) | |||||
| Total change in net unrealized ap- | ||||||
| preciation (depreciation) | 166,157,370 | |||||
| Net gain (loss) | 171,057,213 | |||||
| Net increase (decrease) in net as- | ||||||
| sets resulting from operations . | $ | 176,692,856 | ||||
See accompanying notes which are an integral part of the financial statements.
Annual Report A-12
| Statement of Changes in Net Assets | ||||||||||||||||||||
| Year ended | Year ended | |||||||||||||||||||
| October 31, | October 31, | |||||||||||||||||||
| 2005 | 2004 | |||||||||||||||||||
| Increase (Decrease) in Net Assets | ||||||||||||||||||||
| Operations | ||||||||||||||||||||
| Net investment income (loss) | $ | 5,635,643 | $ | 978,546 | ||||||||||||||||
| Net realized gain (loss) | 4,899,843 | 3,284,925 | ||||||||||||||||||
| Change in net unrealized appreciation (depreciation) | 166,157,370 | 58,584,424 | ||||||||||||||||||
| Net increase (decrease) in net assets resulting from operations | 176,692,856 | 62,847,895 | ||||||||||||||||||
| Distributions to shareholders from net investment income | (1,384,456) | (959,083) | ||||||||||||||||||
| Share transactions | ||||||||||||||||||||
| Proceeds from sales of shares | 1,409,653,307 | 305,089,295 | ||||||||||||||||||
| Reinvestment of distributions | 1,331,051 | 926,386 | ||||||||||||||||||
| Cost of shares redeemed | (277,969,085) | (122,097,358) | ||||||||||||||||||
| Net increase (decrease) in net assets resulting from share transactions | 1,133,015,273 | 183,918,323 | ||||||||||||||||||
| Redemption fees | 874,168 | 306,230 | ||||||||||||||||||
| Total increase (decrease) in net assets | 1,309,197,841 | 246,113,365 | ||||||||||||||||||
| Net Assets | ||||||||||||||||||||
| Beginning of period | 413,318,534 | 167,205,169 | ||||||||||||||||||
| End of period (including undistributed net investment income of $4,865,446 and undistributed net investment | ||||||||||||||||||||
| income of $613,311, respectively) | $ 1,722,516,375 | $ | 413,318,534 | |||||||||||||||||
| Other Information | ||||||||||||||||||||
| Shares | ||||||||||||||||||||
| Sold | 38,729,389 | 10,724,172 | ||||||||||||||||||
| Issued in reinvestment of distributions | 40,068 | 35,372 | ||||||||||||||||||
| Redeemed | (7,727,493) | (4,444,814) | ||||||||||||||||||
| Net increase (decrease) | 31,041,964 | 6,314,730 | ||||||||||||||||||
| Financial Highlights | ||||||||||||||||||||
| Years ended October 31, | 2005 | 2004 | 2003 | 2002 | 2001 | |||||||||||||||
| Selected Per Share Data | ||||||||||||||||||||
| Net asset value, beginning of period | $ 31.87 | $ | 25.13 | $ 17.52 | $ | 17.23 | $ | 22.27 | ||||||||||||
| Income from Investment Operations | ||||||||||||||||||||
| Net investment income (loss)D | 20 | .10 | .05 | .02 | .02 | |||||||||||||||
| Net realized and unrealized gain (loss) | 7.12 | 6.74 | 7.58 | .28 | (4.04) | |||||||||||||||
| Total from investment operations | 7.32 | 6.84 | 7.63 | .30 | (4.02) | |||||||||||||||
| Distributions from net investment income | (.08) | (.13) | (.04) | (.03) | (1.04) | |||||||||||||||
| Redemption fees added to paid in capitalD | 03 | .03 | .02 | .02 | .02 | |||||||||||||||
| Net asset value, end of period | $ 39.14 | $ | 31.87 | $ 25.13 | $ | 17.52 | $ | 17.23 | ||||||||||||
| Total ReturnA,B,C | 23.11% | 27.45% | 43.75% | 1.85% | (18.87)% | |||||||||||||||
| Ratios to Average Net AssetsE | ||||||||||||||||||||
| Expenses before expense reductions | 1.08% | 1.20% | 1.42% | 1.52% | 1.33% | |||||||||||||||
| Expenses net of voluntary waivers, if any | 1.08% | 1.20% | 1.42% | 1.52% | 1.33% | |||||||||||||||
| Expenses net of all reductions | 1.04% | 1.15% | 1.37% | 1.46% | 1.20% | |||||||||||||||
| Net investment income (loss) | 55% | .34% | .26% | .12% | .11% | |||||||||||||||
| Supplemental Data | ||||||||||||||||||||
| Net assets, end of period (000 omitted) | $1,722,516 | $ 413,319 | $ 167,205 | $ | 77,251 | $ | 81,213 | |||||||||||||
| Portfolio turnover rate | 24% | 47% | 52% | 98% | 93% | |||||||||||||||
| ATotal returns would have been lower had certain expenses not been reduced during the periods shown. BTotal returns do not include the effect of the former sales charges. CTotal returns do not include the effect of the former contingent deferred sales charge. DCalculated based on average shares outstanding during the period. EExpense ratios reflect operating expenses of the fund. Expenses before reductions do not reflect amounts reimbursed by the investment adviser or reductions from brokerage service arrangements or other expense offset arrangements and do not represent the amount paid by the fund during periods when reimbursements or reductions occur. Expenses net of any voluntary waivers reflect expenses after reimburse ment by the investment adviser but prior to reductions from brokerage service arrangements or other expense offset arrangements. Expenses net of all reductions represent the net expenses paid by the fund. |
| See accompanying notes which are an integral part of the financial statements. |
| A-13 |
| Annual Report |
| China Region |
| Performance: The Bottom Line |
Average annual total return reflects the change in the value of an investment, assuming reinvestment of the fund’s dividend income and capital gains (the profits earned upon the sale of securities that have grown in value) and assuming a constant rate of performance each year. The $10,000 table and the fund’s returns do not reflect the deduction of taxes that a shareholder would pay on fund distributions or the redemption of fund shares. During periods of reimbursement by Fidelity, a fund’s total returns will be greater than it would be had the reimbursement not occurred. How a fund did yesterday is no guarantee of how it will do tomorrow.
| Average Annual Total Returns | ||||||
| Periods ended | Past 1 | Past 5 | Life of | |||
| October 31, 2005 | year | years | FundA | |||
| Fidelity China Region Fund | 13.44% | 5.52% | 7.62% | |||
| A From November 1, 1995. | ||||||
| $10,000 Over Life of Fund | ||||||
Let’s say hypothetically that $10,000 was invested in Fidelity China Region Fund on November 1, 1995, when the fund started. The chart shows how the value of your investment would have changed, and also shows how the Hang Seng Index performed over the same period.
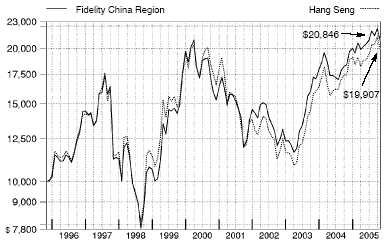
| Annual Report |
| A-14 |
| China Region |
Management’s Discussion of Fund Performance
Comments from K.C. Lee, interim Portfolio Manager of Fidelity® China Region Fund
Foreign stock markets enjoyed broad based advances during the 12 month period that ended October 31, 2005, encouraged by better than expected corporate earnings and markedly improved economies. For the 12 months overall, the Morgan Stanley Capital InternationalSM Europe, Australasia, Far East (MSCI® EAFE®) Index a performance measure of developed stock markets outside the United States and Canada gained 18.28% . The Japanese stock market climbed to its highest level in more than four years. Positive economic indicators and Prime Minister Koizumi’s decisive election victory attracted record inflows from overseas investors. In response, the Tokyo Stock Exchange Stock Price Index (TOPIX) soared 22.89% . Southeast Asian equities outside of Japan, particularly South Korea, also responded well to the better macroeconomic environment, illustrated by the 19.44% return for the MSCI All Country Far East ex Japan index. European stock markets were up as well, despite investors’ concern about higher energy prices and potential downgrades to economic growth in the region. For the year overall, the MSCI Europe index rose 16.51% .
For the 12 months ending October 31, 2005, the fund returned 13.44%, outperforming the 7.08% return of the Fidelity China Region Fund Linked Index, a measure of performance in the Hong Kong, Taiwanese and Chinese markets. The fund also handily surpassed the 7.55% return of the LipperSM China Region Funds Average, representing its peer group. However, the fund trailed the 14.27% gain of the Hang Seng Index, representing stocks listed in Hong Kong. Our holdings in the information technology and consumer discretionary sectors made significant contributions relative to the Linked index, as these sectors benefited, respectively, from the global turnaround in the technology cycle and the region’s ongoing economic recovery. Geographically, stock selection in Taiwan and China had the most positive impact versus the Linked index. Also beneficial was an overweighting in Hong Kong, the strongest performing market in the benchmark. Among individual holdings, an overweighted exposure to pocket PC manufacturer High Tech Computer and leading PC motherboard manufacturer ASUSTeK Computer benefited absolute and relative performance. Both Taiwanese companies achieved market share gains in their respective technology spaces. A substantial underweighting in the Hong Kong listed stock of multinational bank HSBC Holdings also had a positive impact on relative performance, as the stock, which by itself represented almost one third of the Linked index, significantly underperformed. The bank suffered from a loss in loan market share in Hong Kong, as well as from a flat yield curve and concerns over a rising interest rate environment. On the other hand, the shares of Taiwanese bank Chinatrust Financial Holdings performed poorly, as did an out of index position in the Hong Kong listed stock of Bermuda incorporated consumer electronics company Skyworth Digital Holdings, whose share price lost more than half of its value while we owned it during the period. I sold Skyworth before period end.
| Notes to shareholders: |
Fidelity China Region Fund may invest up to 35% of its total assets in any industry that represents more than 20% of the Hong Kong, Taiwanese and Chinese market. As of October 31, 2005, the fund did not have more than 25% of its total assets invested in any one industry.
The leave of absence for the fund’s portfolio manager, Ignatius Lee, has been extended.
The views expressed in this statement reflect those of the portfolio manager only through the end of the period of the report as stated on the cover and do not necessarily represent the views of Fidelity or any other person in the Fidelity organization. Any such views are subject to change at any time based upon market or other conditions and Fidelity disclaims any responsibility to update such views. These views may not be relied on as invest ment advice and, because investment decisions for a Fidelity fund are based on numerous factors, may not be relied on as an indication of trading intent on behalf of any Fidelity fund.
| A-15 A-15 |
| Annual Report |
| China Region Investment Changes |
| Geographic Diversification (% of fund’s net assets) | ||
| As of October 31, 2005 | ||
| Hong Kong | 44.8% | |
| Taiwan | 24.8% | |
| United Kingdom | 13.1% | |
| China | 8.1% | |
| United States of | ||
| America | 3.3% | |
| Cayman Islands | 3.0% | |
| Korea (South) | 2.1% | |
| Australia | 0.4% | |
| Singapore | 0.2% | |
| Other | 0.2% | |
| Percentages are adjusted for the effect of futures contracts, if applicable. | ||
| As of April 30, 2005 | ||
| Hong Kong | 45.9% | |
| Taiwan | 20.3% | |
| United Kingdom | 14.1% | |
| China | 9.9% | |
| United States of | ||
| America | 3.9% | |
| Cayman Islands | 2.5% | |
| Korea (South) | 2.2% | |
| Bermuda | 0.5% | |
| Australia | 0.4% | |
| Other | 0.3% | |
| Percentages are adjusted for the effect of futures contracts, if applicable. | ||
| Asset Allocation | ||||
| % of fund’s | % of fund’s net assets | |||
| net assets | 6 months ago | |||
| Stocks | 96.7 | 96.1 | ||
| Short Term Investments and | ||||
| Net Other Assets | 3.3 | 3.9 |
| Top Ten Stocks as of October 31, 2005 | ||||
| % of fund’s | % of fund’s net assets | |||
| net assets | 6 months ago | |||
| HSBC Holdings PLC (Hong Kong) | ||||
| (Reg.) (Commercial Banks) | 9.8 | 11.1 | ||
| Cheung Kong Holdings Ltd. (Real | ||||
| Estate) | 5.0 | 4.3 | ||
| Hutchison Whampoa Ltd. | ||||
| (Industrial Conglomerates) | 5.0 | 3.1 | ||
| Taiwan Semiconductor | ||||
| Manufacturing Co. Ltd. | ||||
| (Semiconductors & | ||||
| Semiconductor Equipment) | 4.2 | 2.3 | ||
| Hong Kong & China Gas Co. Ltd. | ||||
| (Gas Utilities) | 3.9 | 3.7 | ||
| Standard Chartered PLC | ||||
| (Commercial Banks) | 3.3 | 3.0 | ||
| Li & Fung Ltd. (Distributors) | 3.3 | 1.8 | ||
| Hon Hai Precision Industry Co. | ||||
| Ltd. (Foxconn) (Electronic | ||||
| Equipment & Instruments) | 3.1 | 2.3 | ||
| PetroChina Co. Ltd. (H Shares) | ||||
| (Oil, Gas & Consumable Fuels) | 3.0 | 2.6 | ||
| Dairy Farm International Holdings | ||||
| Ltd. (Food & Staples Retailing) | 2.9 | 2.3 | ||
| 43.5 | ||||
| Market Sectors as of October 31, 2005 | ||||
| % of fund’s | % of fund’s net assets | |||
| net assets | 6 months ago | |||
| Financials | 32.3 | 40.8 | ||
| Information Technology | 21.0 | 13.9 | ||
| Consumer Discretionary | 13.5 | 13.6 | ||
| Industrials | 8.4 | 7.4 | ||
| Energy | 5.8 | 5.9 | ||
| Telecommunication Services | 5.6 | 3.1 | ||
| Utilities | 5.4 | 5.2 | ||
| Consumer Staples | 3.6 | 3.0 | ||
| Materials | 1.1 | 3.2 | ||
Annual Report A-16
| China Region | ||||
| Investments October 31, 2005 | ||||
| Showing Percentage of Net Assets | ||||
| Common Stocks 96.7% | ||||
| Shares | Value (Note 1) | |||
| CONSUMER DISCRETIONARY 13.5% | ||||
| Auto Components – 0.9% | ||||
| Tong Yang Industry Co. Ltd. | 2,760,736 | $ 3,414,767 | ||
| Automobiles – 1.8% | ||||
| Hyundai Motor Co. | 78,270 | 5,742,796 | ||
| Kia Motors Corp. | 79,470 | 1,427,262 | ||
| 7,170,058 | ||||
| Distributors 3.4% | ||||
| Integrated Distribution Services Group | ||||
| Ltd. (IDS) | 494,000 | 484,307 | ||
| Li & Fung Ltd. | 6,106,000 | 13,035,732 | ||
| 13,520,039 | ||||
| Hotels, Restaurants & Leisure 3.0% | ||||
| Cafe de Coral Holdings Ltd. | 3,660,000 | 4,131,139 | ||
| Hong Kong & Shanghai Hotels Ltd. | 2,575,996 | 2,575,298 | ||
| Mandarin Oriental International Ltd. | 1,235,000 | 926,250 | ||
| Regal Hotel International Holdings Ltd. . | 1,930,000 | 129,462 | ||
| Shangri La Asia Ltd. | 3,038,000 | 4,252,048 | ||
| 12,014,197 | ||||
| Household Durables 0.7% | ||||
| Basso Industry Corp. Ltd. | 429,420 | 998,309 | ||
| Inventec Appliances Corp. | 61,000 | 238,171 | ||
| Merry Electronics Co. Ltd. | 371,988 | 820,444 | ||
| Skyworth Digital Holdings Ltd. | 4,622,275 | 691,663 | ||
| 2,748,587 | ||||
| Leisure Equipment & Products 1.2% | ||||
| Asia Optical Co., Inc. | 679,790 | 3,920,521 | ||
| Li Ning Co. Ltd. | 1,192,000 | 722,695 | ||
| 4,643,216 | ||||
| Media 0.9% | ||||
| Hong Kong Economic Time Holdings Ltd. | 4,572,000 | 955,437 | ||
| Television Broadcasts Ltd. | 462,000 | 2,565,640 | ||
| 3,521,077 | ||||
| Specialty Retail 1.6% | ||||
| Esprit Holdings Ltd. | 890,500 | 6,277,760 | ||
| Textiles, Apparel & Luxury Goods 0.0% | ||||
| Xinyu Hengdeli Holdings Ltd. | 638,000 | 153,902 | ||
| TOTAL CONSUMER DISCRETIONARY | 53,463,603 | |||
| CONSUMER STAPLES 3.6% | ||||
| Beverages 0.2% | ||||
| Dynasty Fine Wines Group Ltd. | 2,366,000 | 824,061 | ||
| Food & Staples Retailing – 3.0% | ||||
| Convenience Retail Asia Ltd. | 962,200 | 319,612 | ||
| Dairy Farm International Holdings Ltd. . | 3,317,400 | 11,345,508 | ||
| 11,665,120 | ||||
| Shares | Value (Note 1) | |||||||
| Food Products – 0.4% | ||||||||
| China Mengniu Dairy Co. Ltd. | 2,163,000 | $ | 1,702,029 | |||||
| TOTAL CONSUMER STAPLES | 14,191,210 | |||||||
| ENERGY 5.8% | ||||||||
| Energy Equipment & Services – 0.1% | ||||||||
| Enric Energy Equipment Holdings Ltd. | 2,644,000 | 610,513 | ||||||
| Oil, Gas & Consumable Fuels 5.7% | ||||||||
| China Petroleum & Chemical Corp. | ||||||||
| (H Shares) | 6,108,000 | 2,458,470 | ||||||
| China Shenhua Energy Co. Ltd. | ||||||||
| (H Shares) | 1,709,500 | 1,874,428 | ||||||
| CNOOC Ltd. | 6,070,500 | 3,988,319 | ||||||
| Formosa Petrochemical Corp. | 708,158 | 1,295,945 | ||||||
| PetroChina Co. Ltd. (H Shares) | 15,410,000 | 11,824,100 | ||||||
| S Oil Corp. | 14,940 | 1,117,637 | ||||||
| 22,558,899 | ||||||||
| TOTAL ENERGY | 23,169,412 | |||||||
| FINANCIALS 32.3% | ||||||||
| Commercial Banks – 18.6% | ||||||||
| BOC Hong Kong Holdings Ltd. | 2,948,000 | 5,495,105 | ||||||
| Chinatrust Financial Holding Co. Ltd. | 6,019,967 | 4,674,013 | ||||||
| Hang Seng Bank Ltd. | 481,300 | 6,239,683 | ||||||
| HSBC Holdings PLC (Hong Kong) (Reg.) | . | 2,464,052 | 38,813,746 | |||||
| Mega Financial Holding Co. Ltd. | 1,479,000 | 967,589 | ||||||
| Standard Chartered PLC: | ||||||||
| (Hong Kong) | 395,370 | 8,221,468 | ||||||
| (United Kingdom) | 238,841 | 5,015,073 | ||||||
| Wing Hang Bank Ltd. | 271,500 | 1,854,456 | ||||||
| Wing Lung Bank Ltd. | 378,000 | 2,706,234 | ||||||
| 73,987,367 | ||||||||
| Diversified Financial Services – 1.7% | ||||||||
| First Pacific Co. Ltd. | 9,982,000 | 3,251,319 | ||||||
| Guoco Group Ltd. | 103,366 | 1,028,046 | ||||||
| Jardine Matheson Holdings Ltd. | 150,000 | 2,370,000 | ||||||
| 6,649,365 | ||||||||
| Insurance – 1.9% | ||||||||
| AXA Asia Pacific Holdings Ltd. | 451,550 | 1,597,068 | ||||||
| Cathay Financial Holding Co. Ltd. | 898,000 | 1,579,125 | ||||||
| China Life Insurance Co. Ltd. (H | ||||||||
| Shares) (a) | 6,148,000 | 4,480,876 | ||||||
| 7,657,069 | ||||||||
| Real Estate 10.1% | ||||||||
| Cheung Kong Holdings Ltd. | 1,913,000 | 19,902,149 | ||||||
| Fortune (REIT) | 1,179,000 | 851,692 | ||||||
| Henderson Land Development Co. Ltd. | . | 355,000 | 1,582,184 | |||||
| Hong Kong Land Holdings Ltd. | 593,000 | 1,695,980 | ||||||
| Hysan Development Co. Ltd. | 1,490,000 | 3,229,061 | ||||||
| Shun Tak Holdings Ltd. | 1,735,000 | 1,253,338 | ||||||
| Sun Hung Kai Properties Ltd. | 898,021 | 8,491,240 | ||||||
See accompanying notes which are an integral part of the financial statements.
A-17 A-17 Annual Report
| China Region | ||||||||
| Investments - continued | ||||||||
| Common Stocks continued | ||||||||
| Shares | Value (Note 1) | |||||||
| FINANCIALS – continued | ||||||||
| Real Estate continued | ||||||||
| Swire Pacific Ltd. (A Shares) | 52,000 | $ | 466,196 | |||||
| Wharf Holdings Ltd. | 762,685 | 2,602,265 | ||||||
| 40,074,105 | ||||||||
| TOTAL FINANCIALS | 128,367,906 | |||||||
| INDUSTRIALS – 8.4% | ||||||||
| Electrical Equipment 0.3% | ||||||||
| Cheng Uei Precision Industries Co. Ltd. | . | 409,100 | 1,158,354 | |||||
| Industrial Conglomerates 5.0% | ||||||||
| Hutchison Whampoa Ltd. | 2,090,500 | 19,793,695 | ||||||
| Machinery – 0.7% | ||||||||
| Kinik Co. | 756,350 | 1,496,852 | ||||||
| Weichai Power Co. Ltd. (H Shares) | 664,000 | 1,267,682 | ||||||
| 2,764,534 | ||||||||
| Transportation Infrastructure – 2.4% | ||||||||
| Cosco Pacific Ltd. | 2,738,000 | 4,485,572 | ||||||
| Hopewell Holdings Ltd. | 1,123,000 | 2,737,929 | ||||||
| Jiangsu Expressway Co. Ltd. (H Shares) | . | 4,850,000 | 2,565,111 | |||||
| 9,788,612 | ||||||||
| TOTAL INDUSTRIALS | 33,505,195 | |||||||
| INFORMATION TECHNOLOGY 21.0% | ||||||||
| Communications Equipment – 1.5% | ||||||||
| AAC Acoustic Technology Holdings, Inc. | 2,016,000 | 1,014,228 | ||||||
| Foxconn International Holdings Ltd. | 3,543,000 | 3,793,411 | ||||||
| ZTE Corp. (H Shares) | 470,400 | 1,389,580 | ||||||
| 6,197,219 | ||||||||
| Computers & Peripherals 3.9% | ||||||||
| Acer, Inc. | 2,208,200 | 4,468,855 | ||||||
| ASUSTeK Computer, Inc. | 2,463,410 | 6,446,430 | ||||||
| High Tech Computer Corp. | 423,840 | 4,497,177 | ||||||
| 15,412,462 | ||||||||
| Electronic Equipment & Instruments – 5.8% | ||||||||
| AU Optronics Corp. | 3,154,733 | 3,986,727 | ||||||
| Hon Hai Precision Industry Co. Ltd. | ||||||||
| (Foxconn) | 2,862,961 | 12,372,900 | ||||||
| Kingboard Chemical Holdings Ltd. | 2,673,800 | 5,656,573 | ||||||
| Phoenix Precision Technology Corp. | 764,000 | 964,350 | ||||||
| 22,980,550 | ||||||||
| Semiconductors & Semiconductor Equipment – 9.8% | ||||||||
| Advanced Semiconductor Engineering, | ||||||||
| Inc. | 5,453,690 | 3,324,083 | ||||||
| Holtek Semiconductor, Inc. | 560,000 | 660,954 | ||||||
| Siliconware Precision Industries Co. Ltd. | 3,840,218 | 3,445,168 | ||||||
| Solomon Systech Ltd. | 15,600,000 | 5,735,220 | ||||||
| Shares | Value (Note 1) | |||
| Taiwan Semiconductor Manufacturing | ||||
| Co. Ltd. | 10,707,714 | $ 16,595,417 | ||
| Topco Scientific Co. Ltd. | 225,788 | 549,808 | ||
| United Microelectronics Corp. | 15,943,538 | 8,458,489 | ||
| 38,769,139 | ||||
| TOTAL INFORMATION TECHNOLOGY | 83,359,370 | |||
| MATERIALS 1.1% | ||||
| Chemicals 0.9% | ||||
| Formosa Chemicals & Fibre Corp. | 2,249,500 | 3,600,380 | ||
| Metals & Mining – 0.2% | ||||
| China Steel Corp. | 1,202,442 | 947,934 | ||
| TOTAL MATERIALS | 4,548,314 | |||
| TELECOMMUNICATION SERVICES 5.6% | ||||
| Diversified Telecommunication Services – 2.0% | ||||
| China Telecom Corp. Ltd. (H Shares) | 12,230,000 | 3,989,434 | ||
| Chunghwa Telecom Co. Ltd. sponsored | ||||
| ADR | 108,000 | 1,870,560 | ||
| PCCW Ltd. | 3,537,400 | 2,167,497 | ||
| 8,027,491 | ||||
| Wireless Telecommunication Services – 3.6% | ||||
| China Mobile (Hong Kong) Ltd. | 1,886,000 | 8,468,140 | ||
| Far EasTone Telecommunications Co. Ltd. | 4,863,685 | 5,653,509 | ||
| 14,121,649 | ||||
| TOTAL TELECOMMUNICATION SERVICES | 22,149,140 | |||
| UTILITIES 5.4% | ||||
| Electric Utilities – 1.5% | ||||
| Cheung Kong Infrastructure Holdings Ltd. | ||||
| 1,878,000 | 5,838,392 | |||
| Gas Utilities 3.9% | ||||
| Hong Kong & China Gas Co. Ltd. | 7,453,400 | 15,383,496 | ||
| TOTAL UTILITIES | 21,221,888 | |||
| TOTAL COMMON STOCKS | ||||
| (Cost $334,071,696) | 383,976,038 | |||
See accompanying notes which are an integral part of the financial statements.
Annual Report A-18
| Money Market Funds 3.4% | ||||||
| Shares | Value (Note 1) | |||||
| Fidelity Cash Central Fund, 3.92% | ||||||
| (b) | ||||||
| (Cost $13,493,687) | 13,493,687 | $ | 13,493,687 | |||
| TOTAL INVESTMENT PORTFOLIO 100.1% | ||||||
| (Cost $347,565,383) | 397,469,725 | |||||
| NET OTHER ASSETS (0.1)% | (564,740) | |||||
| NET ASSETS 100% | $ | 396,904,985 | ||||
| Legend (a) Non-income producing (b) Affiliated fund that is available only to investment companies and other accounts managed by Fidelity Investments. The rate quoted is the annualized seven-day yield of the fund at period end. A complete unaudited listing of the fund’s holdings as of its most recent quarter end is available upon request. |
Income Tax Information
At October 31, 2005, the fund had a capital loss carryforward of approximately $9,093,376 of which $1,077,556 and $8,015,820 will expire on October 31, 2009 and 2010, respectively.
See accompanying notes which are an integral part of the financial statements.
A-19 A-19 Annual Report
| China Region | ||||||
| Financial Statements | ||||||
| Statement of Assets and Liabilities | ||||||
| October 31, 2005 | ||||||
| Assets | ||||||
| Investment in securities, at value | ||||||
| (cost $347,565,383) — See ac- | ||||||
| companying schedule | $ | 397,469,725 | ||||
| Cash | 10,478 | |||||
| Receivable for fund shares sold | 845,051 | |||||
| Dividends receivable | 35,395 | |||||
| Interest receivable | 62,731 | |||||
| Other affiliated receivables | 753 | |||||
| Other receivables | 12,128 | |||||
| Total assets | 398,436,261 | |||||
| Liabilities | ||||||
| Payable for investments purchased $ | 21,301 | |||||
| Payable for fund shares redeemed | 1,015,130 | |||||
| Accrued management fee | 245,197 | |||||
| Transfer agent fee payable | 93,715 | |||||
| Other affiliated payables | 17,139 | |||||
| Other payables and accrued | ||||||
| expenses | 138,794 | |||||
| Total liabilities | 1,531,276 | |||||
| Net Assets | $ | 396,904,985 | ||||
| Net Assets consist of: | ||||||
| Paid in capital | $ | 350,272,192 | ||||
| Undistributed net investment | ||||||
| income | 6,428,926 | |||||
| Accumulated undistributed net | ||||||
| realized gain (loss) on invest- | ||||||
| ments and foreign currency | ||||||
| transactions | (9,700,518) | |||||
| Net unrealized appreciation (de- | ||||||
| preciation) on investments and | ||||||
| assets and liabilities in foreign | ||||||
| currencies | 49,904,385 | |||||
| Net Assets, for 22,376,433 | ||||||
| shares outstanding | $ | 396,904,985 | ||||
| Net Asset Value, offering price | ||||||
| and redemption price per share | ||||||
| ($396,904,985 ÷ 22,376,433 | ||||||
| shares) | $ | 17.74 | ||||
| Statement of Operations | ||||||
| Year ended October 31, 2005 | ||||||
| Investment Income | ||||||
| Dividends | $ | 12,099,906 | ||||
| Interest | 354,306 | |||||
| 12,454,212 | ||||||
| Less foreign taxes withheld | (1,071,273) | |||||
| Total income | 11,382,939 | |||||
| Expenses | ||||||
| Management fee | $ | 2,591,666 | ||||
| Transfer agent fees | 977,255 | |||||
| Accounting fees and expenses | 179,569 | |||||
| Independent trustees’ | ||||||
| compensation | 1,635 | |||||
| Custodian fees and expenses | 325,213 | |||||
| Registration fees | 42,761 | |||||
| Audit | 59,632 | |||||
| Legal | 951 | |||||
| Miscellaneous | 9,335 | |||||
| Total expenses before reductions | 4,188,017 | |||||
| Expense reductions | (149,477) | 4,038,540 | ||||
| Net investment income (loss) | 7,344,399 | |||||
| Realized and Unrealized Gain | ||||||
| (Loss) | ||||||
| Net realized gain (loss) on: | ||||||
| Investment securities | 12,951,409 | |||||
| Foreign currency transactions | (104,027) | |||||
| Total net realized gain (loss) | 12,847,382 | |||||
| Change in net unrealized appreci- | ||||||
| ation (depreciation) on: | ||||||
| Investment securities | 18,637,650 | |||||
| Assets and liabilities in foreign | ||||||
| currencies | (20,843) | |||||
| Total change in net unrealized ap- | ||||||
| preciation (depreciation) | 18,616,807 | |||||
| Net gain (loss) | 31,464,189 | |||||
| Net increase (decrease) in net as- | ||||||
| sets resulting from operations . | $ | 38,808,588 | ||||
See accompanying notes which are an integral part of the financial statements.
Annual Report A-20
| Statement of Changes in Net Assets | ||||||||||||||||||||
| Year ended | Year ended | |||||||||||||||||||
| October 31, | October 31, | |||||||||||||||||||
| 2005 | 2004 | |||||||||||||||||||
| Increase (Decrease) in Net Assets | ||||||||||||||||||||
| Operations | ||||||||||||||||||||
| Net investment income (loss) | $ | 7,344,399 | $ | 4,955,750 | ||||||||||||||||
| Net realized gain (loss) | 12,847,382 | 27,929,705 | ||||||||||||||||||
| Change in net unrealized appreciation (depreciation) | 18,616,807 | (21,880,393) | ||||||||||||||||||
| Net increase (decrease) in net assets resulting from operations | 38,808,588 | 11,005,062 | ||||||||||||||||||
| Distributions to shareholders from net investment income | (4,953,877) | (4,174,789) | ||||||||||||||||||
| Share transactions | ||||||||||||||||||||
| Proceeds from sales of shares | 167,800,419 | 206,037,339 | ||||||||||||||||||
| Reinvestment of distributions | 4,707,630 | 3,973,983 | ||||||||||||||||||
| Cost of shares redeemed | (105,619,907) | (152,913,710) | ||||||||||||||||||
| Net increase (decrease) in net assets resulting from share transactions | 66,888,142 | 57,097,612 | ||||||||||||||||||
| Redemption fees | 158,224 | 421,910 | ||||||||||||||||||
| Total increase (decrease) in net assets | 100,901,077 | 64,349,795 | ||||||||||||||||||
| Net Assets | ||||||||||||||||||||
| Beginning of period | 296,003,908 | 231,654,113 | ||||||||||||||||||
| End of period (including undistributed net investment income of $6,428,926 and undistributed net investment | ||||||||||||||||||||
| income of $4,701,276, respectively) | $ 396,904,985 | $ | 296,003,908 | |||||||||||||||||
| Other Information | ||||||||||||||||||||
| Shares | ||||||||||||||||||||
| Sold | 9,516,821 | 12,991,397 | ||||||||||||||||||
| Issued in reinvestment of distributions | 279,550 | 266,174 | ||||||||||||||||||
| Redeemed | (6,064,944) | (9,912,893) | ||||||||||||||||||
| Net increase (decrease) | 3,731,427 | 3,344,678 | ||||||||||||||||||
| Financial Highlights | ||||||||||||||||||||
| Years ended October 31, | 2005 | 2004 | 2003 | 2002 | 2001 | |||||||||||||||
| Selected Per Share Data | ||||||||||||||||||||
| Net asset value, beginning of period | $ 15.88 | $ | 15.14 | $ 11.16 | $ | 11.27 | $ | 14.96 | ||||||||||||
| Income from Investment Operations | ||||||||||||||||||||
| Net investment income (loss)C | 36 | .25 | .25 | .19 | .14 | |||||||||||||||
| Net realized and unrealized gain (loss) | 1.75 | .73 | 3.91 | (.15) | (3.29) | |||||||||||||||
| Total from investment operations | 2.11 | .98 | 4.16 | .04 | (3.15) | |||||||||||||||
| Distributions from net investment income | (.26) | (.26) | (.19) | (.16) | (.56) | |||||||||||||||
| Redemption fees added to paid in capitalC | 01 | .02 | .01 | .01 | .02 | |||||||||||||||
| Net asset value, end of period | $ 17.74 | $ | 15.88 | $ 15.14 | $ | 11.16 | $ | 11.27 | ||||||||||||
| Total ReturnA,B | 13.44% | 6.71% | 37.91% | .23% | (21.82)% | |||||||||||||||
| Ratios to Average Net AssetsD | ||||||||||||||||||||
| Expenses before expense reductions | 1.16% | 1.22% | 1.30% | 1.32% | 1.32% | |||||||||||||||
| Expenses net of voluntary waivers, if any | 1.16% | 1.22% | 1.30% | 1.32% | 1.32% | |||||||||||||||
| Expenses net of all reductions | 1.12% | 1.22% | 1.30% | 1.31% | 1.30% | |||||||||||||||
| Net investment income (loss) | 2.04% | 1.64% | 2.07% | 1.52% | 1.03% | |||||||||||||||
| Supplemental Data | ||||||||||||||||||||
| Net assets, end of period (000 omitted) | $ 396,905 | $ | 296,004 | $ 231,654 | $ | 110,359 | $ | 116,754 | ||||||||||||
| Portfolio turnover rate | 44% | 101% | 39% | 53% | 75% | |||||||||||||||
| ATotal returns would have been lower had certain expenses not been reduced during the periods shown. BTotal returns do not include the effect of the former sales charges. CCalculated based on average shares outstanding during the period. DExpense ratios reflect operating expenses of the fund. Expenses before reductions do not reflect amounts reimbursed by the investment adviser or reductions from brokerage service arrangements or other expense offset arrangements and not represent the amount paid by the fund during periods when reimbursements or reductions occur. Expenses net of any voluntary waivers reflect expenses after reimbursement by the investment adviser but prior to reductions from brokerage service arrangements or other expense offset arrangements. Expenses net of all reductions represent the net expenses paid by the fund. |
| See accompanying notes which are an integral part of the financial statements. |
| A-21 |
| Annual Report |
| Emerging Markets |
| Performance: The Bottom Line |
Average annual total return reflects the change in the value of an investment, assuming reinvestment of the fund’s dividend income and capital gains (the profits earned upon the sale of securities that have grown in value) and assuming a constant rate of performance each year. The $10,000 table and the fund’s returns do not reflect the deduction of taxes that a shareholder would pay on fund distributions or the redemption of fund shares. During periods of reimbursement by Fidelity, a fund’s total returns will be greater than it would be had the reimbursement not occurred. How a fund did yesterday is no guarantee of how it will do tomorrow.
| Average Annual Total Returns | ||||||
| Periods ended | Past 1 | Past 5 | Past 10 | |||
| October 31, 2005 | year | years | years | |||
| Fidelity Emerging Markets Fund | 40.25% | 13.30% | 1.30% | |||
| $10,000 Over 10 Years | ||||||
Let’s say hypothetically that $10,000 was invested in Fidelity Emerging Markets Fund on October 31, 1995. The chart shows how the value of your investment would have changed, and also shows how the MSCI Emerging Markets Index performed over the same period.
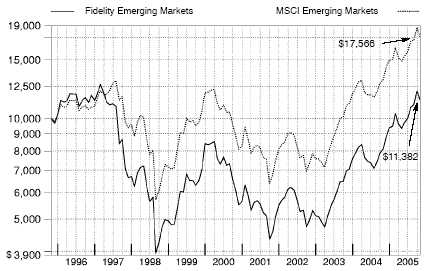
| Annual Report |
| A-22 |
| Emerging Markets |
Management’s Discussion of Fund Performance
Comments from Robert von Rekowsky, Portfolio Manager of Fidelity® Emerging Markets Fund
Emerging markets stocks posted strong gains for the year ending October 31, 2005, as the Morgan Stanley Capital InternationalSM (MSCI®) Emerging Markets Index soared 34.34% . The lofty return was largely driven by the skyrocketing prices of oil and other commodities. Many emerging markets are commodity exporters particularly in Latin America which helped the economies and fiscal health of these countries. As such, the Latin American region generally outperformed other emerging markets. Still, neither of the top two performers were in the Western Hemisphere. Egypt and Jordan topped the index, despite making up less than 1.00% of the index combined on average during the period. Stocks in the Far East posted strong absolute returns, but mostly trailed other emerging markets because they are primarily exporters of technology, which saw diminished demand. South Korea, the largest component of the index during the past year, rose more than 46%. However, Taiwan, the second largest constituent, was a significant drag, gaining only 4%. Brazil, the largest Latin American component, was up more than 75%.
During the past year, the fund posted a return of 40.25%, outpacing the MSCI Emerging Markets index and the LipperSM Emerging Markets Funds Average, which returned 32.14% . Despite increasing oil prices, concerns about rising U.S. interest rates and uncertainty regarding global growth, emerging markets equities performed quite well. I believe the improved economic backdrop in many emerging countries contributed to this performance. Good stock picking and the resulting country weightings fueled the fund’s outperformance versus the index. In terms of individual holdings, Samsung Electronics by far the largest position in the fund was a strong contributor in absolute terms. Samsung is the low cost leader in most of its businesses and has made great strides in building its brand name. America Movil, a mobile phone company headquartered in Mexico, was another contributor both on an absolute basis and relative to the index. The company benefited from subscriber additions in South and Central America, where mobile phone penetration was low. Egyptian mobile phone company Orascom Telecom, as well as Brazilian bank Banco Bradesco, also boosted returns. On a less favorable note, profitability concerns hurt Harmony Gold, a South African mining company. China International Marine Containers the world’s largest manufacturer of shipping containers was another notable detractor. Investor concerns about weakening global shipping demand put pressure on its shares.
The views expressed in this statement reflect those of the portfolio manager only through the end of the period of the report as stated on the cover and do not necessarily represent the views of Fidelity or any other person in the Fidelity organization. Any such views are subject to change at any time based upon market or other conditions and Fidelity disclaims any responsibility to update such views. These views may not be relied on as invest ment advice and, because investment decisions for a Fidelity fund are based on numerous factors, may not be relied on as an indication of trading intent on behalf of any Fidelity fund.
| A-23 A-23 |
| Annual Report |
| Emerging Markets Investment Changes |
| Geographic Diversification (% of fund’s net assets) | ||
| As of October 31, 2005 | ||
| Korea (South) | 21.9% | |
| Brazil | 13.4% | |
| South Africa | 10.1% | |
| Taiwan | 9.0% | |
| Mexico | 7.4% | |
| Russia | 7.0% | |
| Israel | 4.6% | |
| Turkey | 4.4% | |
| India | 3.5% | |
| Other | 18.7% | |
| Percentages are adjusted for the effect of futures contracts, if applicable. | ||
| As of April 30, 2005 | ||
| Korea (South) | 21.9% | |
| South Africa | 12.0% | |
| Brazil | 10.3% | |
| Taiwan | 8.9% | |
| Mexico | 7.1% | |
| Israel | 4.8% | |
| Russia | 4.7% | |
| Turkey | 3.8% | |
| India | 3.5% | |
| Other | 23.0% | |
| Percentages are adjusted for the effect of futures contracts, if applicable. | ||
| Asset Allocation | ||||
| % of fund’s | % of fund’s net assets | |||
| net assets | 6 months ago | |||
| Stocks | 98.2 | 98.4 | ||
| Short Term Investments and | ||||
| Net Other Assets | 1.8 | 1.6 |
| Top Ten Stocks as of October 31, 2005 | ||||
| % of fund’s | % of fund’s net assets | |||
| net assets | 6 months ago | |||
| Samsung Electronics Co. Ltd. | ||||
| (Korea (South), Semiconductors | ||||
| & Semiconductor Equipment) | 5.6 | 6.4 | ||
| America Movil SA de CV Series L | ||||
| sponsored ADR (Mexico, | ||||
| Wireless Telecommunication | ||||
| Services) | 3.2 | 2.7 | ||
| Petroleo Brasileiro SA Petrobras | ||||
| (PN) (Brazil, Oil, Gas & | ||||
| Consumable Fuels) | 3.0 | 2.1 | ||
| Lukoil Oil Co. sponsored ADR | ||||
| (Russia, Oil, Gas & Consumable | ||||
| Fuels) | 2.9 | 1.2 | ||
| Companhia Vale do Rio Doce | ||||
| (PN A) sponsored ADR | ||||
| (non vtg.) (Brazil, Metals & | ||||
| Mining) | 2.5 | 2.0 | ||
| Banco Bradesco SA (PN) (Brazil, | ||||
| Commercial Banks) | 1.8 | 1.2 | ||
| Sasol Ltd. (South Africa, Oil, Gas | ||||
| & Consumable Fuels) | 1.7 | 1.3 | ||
| Cemex SA de CV sponsored ADR | ||||
| (Mexico, Construction Materials) | 1.6 | 1.3 | ||
| Hyundai Motor Co. (Korea | ||||
| (South), Automobiles) | 1.5 | 1.4 | ||
| Taiwan Semiconductor | ||||
| Manufacturing Co. Ltd. (Taiwan, | ||||
| Semiconductors & | ||||
| Semiconductor Equipment) | 1.5 | 2.0 | ||
| 25.3 | ||||
| Market Sectors as of October 31, 2005 | ||||
| % of fund’s | % of fund’s net assets | |||
| net assets | 6 months ago | |||
| Financials | 20.5 | 21.2 | ||
| Information Technology | 17.1 | 15.2 | ||
| Energy | 14.8 | 11.0 | ||
| Materials | 10.7 | 10.6 | ||
| Telecommunication Services | 10.5 | 12.0 | ||
| Consumer Discretionary | 10.5 | 12.5 | ||
| Industrials | 6.2 | 9.1 | ||
| Consumer Staples | 3.0 | 3.3 | ||
| Utilities | 2.9 | 1.2 | ||
| Health Care | 2.0 | 2.3 | ||
Annual Report A-24
| Emerging Markets | ||||||
| Investments October 31, 2005 | ||||||
| Showing Percentage of Net Assets | ||||||
| Common Stocks 97.8% | ||||||
| Shares | Value (Note 1) | |||||
| Argentina – 0.4% | ||||||
| Inversiones y Representaciones SA | ||||||
| sponsored GDR (a) | 317,900 | $ 3,678,103 | ||||
| Nortel Inversora SA (PN B) sponsored | ||||||
| ADR (a) | 180,900 | 1,810,809 | ||||
| TOTAL ARGENTINA | 5,488,912 | |||||
| Austria 0.5% | ||||||
| Raiffeisen International Bank Holding | ||||||
| AG | 120,400 | 7,577,299 | ||||
| Bermuda 1.1% | ||||||
| Aquarius Platinum Ltd. (Australia) | 641,800 | 4,799,059 | ||||
| Central European Media Enterprises Ltd. | ||||||
| Class A (a) | 189,600 | 8,814,504 | ||||
| Sinochem Hong Kong Holding Ltd. (a) . | 10,328,900 | 1,665,500 | ||||
| TOTAL BERMUDA | 15,279,063 | |||||
| Brazil 13.4% | ||||||
| AES Tiete SA (PN) | 208,062,300 | 4,573,712 | ||||
| Banco Bradesco SA: | ||||||
| (PN) | 449,500 | 23,135,736 | ||||
| (PN) sponsored ADR (non vtg.) (d) | 30,200 | 1,567,078 | ||||
| Banco Itau Holding Financeira SA (PN) | 718,200 | 17,130,528 | ||||
| Banco Nossa Caixa SA | 36,100 | 597,979 | ||||
| Companhia Energetica de Minas Gerais | ||||||
| (CEMIG) (PN) sponsored ADR | ||||||
| (non vtg.) (d) | 279,900 | 10,188,360 | ||||
| Companhia Vale do Rio Doce: | ||||||
| (PN A) sponsored ADR (non vtg.) (a) | 934,700 | 34,490,430 | ||||
| sponsored ADR (non vtg.) | 27,600 | 1,140,708 | ||||
| Diagnosticos da America SA | 311,600 | 5,078,479 | ||||
| Itausa Investimentos Itau SA (PN) | 729,400 | 2,183,212 | ||||
| Lojas Renner SA | 225,900 | 6,019,185 | ||||
| Natura Cosmeticos SA | 112,300 | 4,537,782 | ||||
| NET Servicos de Communicacao SA | ||||||
| sponsored ADR | 840,100 | 3,368,801 | ||||
| Petroleo Brasileiro SA Petrobras: | ||||||
| (PN) | 894,700 | 12,714,451 | ||||
| (PN) sponsored ADR (non vtg.) | 497,700 | 28,553,049 | ||||
| sponsored ADR (non vtg.) | 173,200 | 11,067,480 | ||||
| Telesp Celular Participacoes SA (PN) (a) | 292,300 | 1,026,775 | ||||
| Uniao de Bancos Brasileiros SA | ||||||
| (Unibanco): | ||||||
| unit | 502,600 | 5,271,966 | ||||
| GDR | 142,000 | 7,426,600 | ||||
| Usinas Siderurgicas de Minas Gerais SA | ||||||
| (Usiminas) (PN A) | 344,200 | 6,939,639 | ||||
| TOTAL BRAZIL | 187,011,950 | |||||
| British Virgin Islands – 0.1% | ||||||
| Titanium Resources Group Ltd. | 1,364,400 | 1,316,503 | ||||
| Cayman Islands 0.5% | ||||||
| Foxconn International Holdings Ltd. | 6,563,500 | 7,027,393 | ||||
| China – 2.1% | ||||||
| Anhui Expressway Co. Ltd. (H Shares) . | 3,578,000 | 1,811,593 | ||||
| Shares | Value (Note 1) | |||
| Beijing Capital International Airport Co. | ||||
| Ltd. (H Shares) | 4,877,800 | $ 1,966,322 | ||
| China Construction Bank Corp. | ||||
| (H Shares) | 11,763,000 | 3,565,879 | ||
| China International Marine Containers | ||||
| Co. Ltd. (B Shares) | 2,088,206 | 1,737,455 | ||
| China Petroleum & Chemical Corp. | ||||
| (H Shares) | 26,787,100 | 10,781,807 | ||
| China Shenhua Energy Co. Ltd. (H | ||||
| Shares) | 3,662,400 | 4,015,738 | ||
| Xinao Gas Holdings Ltd. (d) | 6,504,000 | 4,950,091 | ||
| TOTAL CHINA | 28,828,885 | |||
| Czech Republic 0.7% | ||||
| Ceske Energeticke Zavody AS | 345,300 | 9,064,832 | ||
| Egypt 1.7% | ||||
| Commercial International Bank Ltd. | ||||
| sponsored GDR | 301,200 | 2,831,280 | ||
| Eastern Tobacco Co. | 119,400 | 4,749,865 | ||
| Misr International Bank Sae GDR | 230,200 | 863,250 | ||
| Orascom Construction Industries SAE | ||||
| GDR | 99,234 | 6,817,376 | ||
| Orascom Telecom SAE GDR | 185,803 | 9,113,637 | ||
| TOTAL EGYPT | 24,375,408 | |||
| Hong Kong – 2.4% | ||||
| Chaoda Modern Agriculture (Holdings) | ||||
| Ltd. | 15,333,500 | 5,785,592 | ||
| China Mobile (Hong Kong) Ltd. | 3,843,900 | 17,259,112 | ||
| China Overseas Land & Investment Ltd. | 13,860,200 | 4,246,330 | ||
| Kerry Properties Ltd. | 2,427,000 | 6,073,683 | ||
| TOTAL HONG KONG | 33,364,717 | |||
| Hungary – 0.9% | ||||
| OTP Bank Rt. | 363,600 | 12,997,521 | ||
| India 3.5% | ||||
| Apollo Hospitals Enterprise Ltd. | ||||
| GDR (a)(e) | 54,800 | 523,196 | ||
| Bharat Forge Ltd. | 278,269 | 1,987,459 | ||
| Bharti Televentures Ltd. (a) | 339,812 | 2,441,942 | ||
| Crompton Greaves Ltd. | 277,058 | 3,783,037 | ||
| Gujarat Ambuja Cement Ltd. | 2,010,452 | 3,097,979 | ||
| ITC Ltd. | 1,500 | 4,000 | ||
| Jaiprakash Associates Ltd. | 314,929 | 1,954,768 | ||
| Larsen & Toubro Ltd. | 176,502 | 5,477,750 | ||
| Oil & Natural Gas Corp. Ltd. | 365,583 | 7,535,942 | ||
| Reliance Industries Ltd. | 744,722 | 12,599,302 | ||
| State Bank of India | 432,374 | 8,966,172 | ||
| Suzlon Energy Ltd. (a) | 15,861 | 251,481 | ||
| TOTAL INDIA | 48,623,028 | |||
| Indonesia – 0.7% | ||||
| PT Aneka Tambang Tbk | 11,991,700 | 3,050,500 | ||
| PT Bank Central Asia Tbk | 19,243,600 | 6,130,968 | ||
| TOTAL INDONESIA | 9,181,468 | |||
See accompanying notes which are an integral part of the financial statements.
A-25 Annual Report
| Emerging Markets | ||||||||
| Investments - continued | ||||||||
| Common Stocks continued | ||||||||
| Shares | Value (Note 1) | |||||||
| Israel 4.6% | ||||||||
| Bank Hapoalim BM (Reg.) | 2,311,445 | $ | 8,853,116 | |||||
| ECI Telecom Ltd. (a) | 330,700 | 2,513,320 | ||||||
| ECtel Ltd. (a) | 122,700 | 618,408 | ||||||
| Israel Chemicals Ltd. | 2,243,700 | 8,516,311 | ||||||
| Ituran Location & Control Ltd. | 170,400 | 2,215,200 | ||||||
| M Systems Flash Disk Pioneers Ltd. (a) | . | 194,500 | 6,163,705 | |||||
| Nice Systems Ltd. sponsored ADR (a) | 98,200 | 4,288,394 | ||||||
| Orckit Communications Ltd. (a) | 219,200 | 4,688,688 | ||||||
| Partner Communications Co. Ltd. ADR | . | 423,800 | 3,449,732 | |||||
| RADWARE Ltd. (a) | 279,300 | 5,141,913 | ||||||
| Teva Pharmaceutical Industries Ltd. | ||||||||
| sponsored ADR | 473,200 | 18,038,384 | ||||||
| TOTAL ISRAEL | 64,487,171 | |||||||
| Korea (South) – 21.5% | ||||||||
| Asiana Airlines, Inc. (a) | 563,858 | 2,368,311 | ||||||
| CJ Home Shopping | 70,219 | 6,221,508 | ||||||
| Core Logic, Inc. | 51,543 | 1,804,498 | ||||||
| Daegu Bank Co. Ltd. | 694,920 | 8,287,117 | ||||||
| Daelim Industrial Co. | 188,330 | 10,967,873 | ||||||
| Daewoo Shipbuilding & Marine | ||||||||
| Engineering Co. Ltd. | 513,450 | 10,229,651 | ||||||
| Dongbu Insurance Co. Ltd. | 272,230 | 3,402,874 | ||||||
| Hanil Cement Co. Ltd. | 70,380 | 4,570,653 | ||||||
| Hanwha Corp. | 147,440 | 2,753,907 | ||||||
| Hynix Semiconductor, Inc. (a) | 125,930 | 2,297,860 | ||||||
| Hyundai Department Store Co. Ltd. | 90,440 | 6,003,342 | ||||||
| Hyundai Heavy Industries Co. Ltd. | 40,500 | 2,634,051 | ||||||
| Hyundai Mipo Dockyard Co. Ltd. | 90,500 | 5,591,233 | ||||||
| Hyundai Motor Co. | 288,480 | 21,166,244 | ||||||
| Hyundai Securities Co. Ltd. (a) | 560,970 | 5,163,716 | ||||||
| Industrial Bank of Korea | 620,510 | 7,370,039 | ||||||
| Kia Motors Corp. | 425,130 | 7,635,234 | ||||||
| Korea Exchange Bank (a) | 105,670 | 1,163,989 | ||||||
| Korea Gas Corp. | 112,530 | 3,880,343 | ||||||
| Korea Investment Holdings Co. Ltd. | 223,170 | 5,728,883 | ||||||
| Korean Air Co. Ltd. | 179,360 | 3,350,114 | ||||||
| Kumho Tire Co., Inc. | 106,660 | 1,578,445 | ||||||
| Kyeryong Construction Industrial Co. Ltd. | 138,840 | 3,411,154 | ||||||
| LG Electronics, Inc. | 182,830 | 11,855,925 | ||||||
| LG Engineering & Construction Co. Ltd. | 203,450 | 8,720,674 | ||||||
| MegaStudy Co. Ltd. | 66,832 | 2,647,033 | ||||||
| NHN Corp. (a) | 45,819 | 7,614,553 | ||||||
| POSCO | 60,890 | 12,335,469 | ||||||
| Pusan Bank | 402,500 | 4,183,068 | ||||||
| Pyung Hwa Industrial Co. Ltd. | 314,269 | 1,959,665 | ||||||
| Samchully Co. Ltd. | 45,040 | 4,875,017 | ||||||
| Samsung Electronics Co. Ltd. | 148,365 | 78,445,825 | ||||||
| Samsung Heavy Industries Ltd. | 539,640 | 6,848,876 | ||||||
| Shinhan Financial Group Co. Ltd. | 331,790 | 11,059,662 | ||||||
| SK Corp. | 188,850 | 9,677,654 | ||||||
| Woongjin Coway Co. Ltd. | 126,110 | 2,174,309 | ||||||
| Shares | Value (Note 1) | |||
| Wooree Lighting Co. Ltd. | 419,649 | $ 2,214,813 | ||
| Woori Finance Holdings Co. Ltd. | 428,040 | 6,580,497 | ||
| TOTAL KOREA (SOUTH) | 298,774,079 | |||
| Lebanon 0.3% | ||||
| Solidere GDR (a) | 263,400 | 3,687,600 | ||
| Luxembourg 1.2% | ||||
| Evraz Group SA GDR | 236,300 | 4,017,100 | ||
| Orco Property Group | 52,100 | 3,316,354 | ||
| Tenaris SA sponsored ADR | 88,100 | 9,677,785 | ||
| TOTAL LUXEMBOURG | 17,011,239 | |||
| Mexico – 7.4% | ||||
| America Movil SA de CV Series L | ||||
| sponsored ADR | 1,697,900 | 44,569,875 | ||
| Cemex SA de CV sponsored ADR | 411,200 | 21,411,184 | ||
| Grupo Financiero Banorte SA de CV | ||||
| Series O | 641,090 | 5,465,848 | ||
| Grupo Mexico SA de CV Series B | 4,325,401 | 8,345,225 | ||
| Sare Holding SA de CV Series B (a) | 2,104,700 | 2,165,972 | ||
| Urbi, Desarrollos Urbanos, SA de CV (a) | 1,160,200 | 7,422,010 | ||
| Wal Mart de Mexico SA de CV Series V | 2,668,137 | 13,028,998 | ||
| TOTAL MEXICO | 102,409,112 | |||
| Oman 0.2% | ||||
| BankMuscat SAOG sponsored | ||||
| GDR (a)(e) | 134,300 | 3,357,500 | ||
| Philippines – 0.7% | ||||
| Philippine Long Distance Telephone Co. | 302,450 | 9,224,395 | ||
| Poland – 0.3% | ||||
| Globe Trade Centre SA (a) | 46,700 | 1,977,527 | ||
| Grupa Lotos SA | 165,600 | 2,028,583 | ||
| TOTAL POLAND | 4,006,110 | |||
| Russia 7.0% | ||||
| Lukoil Oil Co. sponsored ADR | 718,440 | 40,124,874 | ||
| Mobile TeleSystems OJSC sponsored | ||||
| ADR | 299,700 | 11,085,903 | ||
| Novatek JSC GDR (a)(e) | 298,100 | 6,701,288 | ||
| OAO Gazprom sponsored ADR | 225,858 | 13,495,016 | ||
| RBC Information Systems Jsc (a) | 289,900 | 1,574,157 | ||
| Sberbank RF GDR (a) | 62,800 | 5,584,774 | ||
| Seventh Continent (a) | 152,300 | 3,236,375 | ||
| Sibneft sponsored ADR (a) | 120,893 | 2,176,074 | ||
| Sistema JSFC sponsored GDR (e) | 261,200 | 5,850,880 | ||
| Vimpel Communications sponsored | ||||
| ADR (a) | 154,900 | 6,196,000 | ||
| VSMPO Avisma Corp. (a) | 12,100 | 1,893,650 | ||
| TOTAL RUSSIA | 97,918,991 | |||
| Singapore – 0.1% | ||||
| Boustead Singapore Ltd. | 2,372,000 | 1,344,346 | ||
| South Africa – 10.1% | ||||
| Absa Group Ltd. | 424,518 | 5,630,716 | ||
See accompanying notes which are an integral part of the financial statements.
Annual Report A-26
| Common Stocks continued | ||||||
| Shares | Value (Note 1) | |||||
| South Africa – continued | ||||||
| Aflease Gold & Uranium Resources | ||||||
| Ltd. (a) | 2,240,589 | $ | 1,619,502 | |||
| African Bank Investments Ltd. | 3,693,126 | 11,013,331 | ||||
| Aspen Pharmacare Holdings PLC | 290,900 | 1,343,949 | ||||
| Aveng Ltd. | 1,650,829 | 4,145,524 | ||||
| Edgars Consolidated Stores Ltd. | 1,828,090 | 8,118,790 | ||||
| Foschini Ltd. | 399,200 | 2,543,338 | ||||
| Impala Platinum Holdings Ltd. | 102,866 | 11,268,503 | ||||
| JD Group Ltd. | 653,400 | 6,986,803 | ||||
| Lewis Group Ltd. | 466,378 | 2,790,622 | ||||
| Massmart Holdings Ltd. | 500,100 | 3,860,683 | ||||
| MTN Group Ltd. | 2,767,100 | 20,619,225 | ||||
| Naspers Ltd. Class N sponsored ADR | 561,900 | 8,170,026 | ||||
| Sasol Ltd. | 745,675 | 23,559,329 | ||||
| Standard Bank Group Ltd. | 1,582,000 | 16,315,112 | ||||
| Steinhoff International Holdings Ltd. | 2,581,800 | 6,756,544 | ||||
| Sun International Ltd. | 172,700 | 1,956,066 | ||||
| Telkom SA Ltd. | 216,414 | 4,087,999 | ||||
| TOTAL SOUTH AFRICA | 140,786,062 | |||||
| Taiwan 9.0% | ||||||
| Acer, Inc. | 3,203,860 | 6,483,826 | ||||
| ASUSTeK Computer, Inc. | 1,058,000 | 2,768,651 | ||||
| China Motor Co. Ltd. | 2,472,500 | 2,310,266 | ||||
| Chinatrust Financial Holding Co. Ltd. . | 8,763,312 | 6,803,996 | ||||
| Chipbond Technology Corp. | 4,300,035 | 5,575,057 | ||||
| Compal Electronics, Inc. | 6,258,000 | 5,520,969 | ||||
| Delta Electronics, Inc. | 3,787,614 | 6,378,260 | ||||
| Far EasTone Telecommunications Co. Ltd. | 5,278,500 | 6,135,687 | ||||
| First Financial Holding Co. Ltd. | 8,035,850 | 5,388,928 | ||||
| High Tech Computer Corp. | 924,200 | 9,806,274 | ||||
| Hon Hai Precision Industry Co. Ltd. | ||||||
| (Foxconn) | 4,139,187 | 17,888,384 | ||||
| MediaTek, Inc. | 1,011,600 | 8,728,617 | ||||
| Motech Industries, Inc. | 173,599 | 1,893,723 | ||||
| Novatek Microelectronics Corp. | 1,708,855 | 7,461,582 | ||||
| Siliconware Precision Industries Co. Ltd. | 5,996,000 | 5,379,181 | ||||
| Taiwan Semiconductor Manufacturing | ||||||
| Co. Ltd. | 13,533,343 | 20,974,736 | ||||
| United Microelectronics Corp. | 9,667,402 | 5,128,825 | ||||
| XAC Automation Corp. | 463,050 | 360,901 | ||||
| TOTAL TAIWAN | 124,987,863 | |||||
| Thailand – 1.1% | ||||||
| Minor International PCL (For. Reg.) | 6,267,900 | 860,722 | ||||
| Shares | Value (Note 1) | |||||
| Siam Cement PCL (For. Reg.) | 1,592,100 | $ | 8,979,475 | |||
| Siam Commercial Bank PCL (For. Reg.) . | 5,303,000 | 6,144,354 | ||||
| TOTAL THAILAND | 15,984,551 | |||||
| Turkey 4.4% | ||||||
| Acibadem Saglik Hizmetleri AS | 416,000 | 2,770,255 | ||||
| Akbank T. A. S. | 1,764,300 | 10,965,683 | ||||
| Alarko Gayrimenkul Yatirim Ortakligi | ||||||
| AS (a) | 83,300 | 3,821,384 | ||||
| Arcelik AS | 224,900 | 1,339,582 | ||||
| Aygaz AS | 567,000 | 1,644,573 | ||||
| Boyner Buyuk Magazacilik AS (a) | 691,000 | 1,973,555 | ||||
| Denizbank AS | 250,600 | 1,399,948 | ||||
| Dogan Yayin Holding AS | 2,259,139 | 5,716,800 | ||||
| Dogus Otomotiv Servis ve Ticaret AS | 246,400 | 900,641 | ||||
| Enka Insaat ve Sanayi AS | 358,407 | 3,951,361 | ||||
| Eregli Demir ve Celik Fabrikalari TAS | 110,000 | 594,155 | ||||
| Finansbank AS | 2,801,743 | 8,499,553 | ||||
| Koytas Tekstil Sanayi ve Ticaret AS (a) . | 26,770 | 0 | ||||
| Tupras-Turkiye Petrol Rafinerileri AS | 321,900 | 5,501,953 | ||||
| Turk Traktor ve Ziraat Makinalari AS | 285,100 | 1,508,298 | ||||
| Turkiye Is Bankasi AS Series C unit | 1,044,582 | 7,226,668 | ||||
| Yapi ve Kredi Bankasi AS (a) | 876,529 | 3,268,743 | ||||
| TOTAL TURKEY | 61,083,152 | |||||
| Ukraine – 0.2% | ||||||
| Stirol sponsored ADR (a) | 14,760 | 1,910,903 | ||||
| Ukrnafta Open JSC sponsored ADR (a) | 5,800 | 1,226,117 | ||||
| TOTAL UKRAINE | 3,137,020 | |||||
| United Arab Emirates 0.2% | ||||||
| Investcom LLC GDR | 188,600 | 2,547,986 | ||||
| United Kingdom – 0.4% | ||||||
| Kazakhmys PLC | 349,200 | 3,338,502 | ||||
| Oxus Gold PLC (a) | 2,591,352 | 2,844,473 | ||||
| TOTAL UNITED KINGDOM | 6,182,975 | |||||
| United States of America – 1.1% | ||||||
| Central European Distribution | ||||||
| Corp. (a)(d) | 200,796 | 7,993,689 | ||||
| CTC Media, Inc. (f) | 93,240 | 1,400,073 | ||||
| DSP Group, Inc. (a) | 123,200 | 3,028,256 | ||||
| Zoran Corp. (a) | 202,000 | 2,965,360 | ||||
| TOTAL UNITED STATES OF AMERICA | 15,387,378 | |||||
| TOTAL COMMON STOCKS | ||||||
| (Cost $1,092,193,368) | 1,362,454,509 | |||||
| Nonconvertible Preferred Stocks 0.4% | ||||||
| Korea (South) – 0.4% | ||||||
| Samsung Electronics Co. Ltd. | ||||||
| (Cost $4,162,435) | 12,920 | 5,259,576 | ||||
See accompanying notes which are an integral part of the financial statements.
A-27 Annual Report
| Emerging Markets | ||||||
| Investments - continued | ||||||
| Money Market Funds 2.3% | ||||||
| Shares | Value (Note 1) | |||||
| Fidelity Cash Central Fund, | ||||||
| 3.92% (b) | 26,530,998 | $ 26,530,998 | ||||
| Fidelity Securities Lending Cash | ||||||
| Central Fund, 3.94% (b)(c) | 5,232,450 | 5,232,450 | ||||
| TOTAL MONEY MARKET FUNDS | ||||||
| (Cost $31,763,448) | 31,763,448 | |||||
| TOTAL INVESTMENT PORTFOLIO 100.5% | ||||||
| (Cost $1,128,119,251) | 1,399,477,533 | |||||
| NET OTHER ASSETS (0.5)% | (7,254,256) | |||||
| NET ASSETS 100% | $ 1,392,223,277 | |||||
| Legend (a) Non-income producing (b) Affiliated fund that is available only to investment companies and other accounts managed by Fidelity Investments. The rate quoted is the annualized seven-day yield of the fund at period end. A complete unaudited listing of the fund’s holdings as of its most recent quarter end is available upon request. (c) Investment made with cash collateral received from securities on loan. (d) Security or a portion of the security is on loan at period end. (e) Security exempt from registration under Rule 144A of the Securities Act of 1933. These securities may be resold in transactions exempt from registration, normally to qualified institutional buyers. At the period end, the value of these securities amounted to $16,432,864 or 1.2% of net assets. (f) Restricted securities – Investment in securities not registered under the Securities Act of 1933 (excluding 144A issues). At the end of the period, the value of restricted securities (excluding 144A issues) amounted to $1,400,073 or 0.1% of net assets. |
Additional information on each holding is as follows:
| Security | Acquisition Date | Acquisition Cost | ||||
| CTC Media, Inc. | 1/26/05 | $ | 1,400,073 |
Income Tax Information
At September 30, 2005, the fund had a capital loss carryforward of approximately $360,364,607 of which $261,779,690, $46,041,026, $40,040,568 and $12,503,323 will expire on September 30, 2007, 2008, 2010 and 2011, respectively.
See accompanying notes which are an integral part of the financial statements.
Annual Report A-28
| Emerging Markets | ||||||||
| Financial Statements | ||||||||
| Statement of Assets and Liabilities | ||||||||
| October 31, 2005 | ||||||||
| Assets | ||||||||
| Investment in securities, at value | ||||||||
| (including securities loaned of | ||||||||
| $5,254,482) (cost | ||||||||
| $1,128,119,251) — See ac- | ||||||||
| companying schedule | $ | 1,399,477,533 | ||||||
| Receivable for investments sold | . | 12,551,406 | ||||||
| Receivable for fund shares sold | . | 7,325,820 | ||||||
| Dividends receivable | 1,903,867 | |||||||
| Interest receivable | 96,472 | |||||||
| Other affiliated receivables | 3,373 | |||||||
| Other receivables | 177,774 | |||||||
| Total assets | 1,421,536,245 | |||||||
| Liabilities | ||||||||
| Payable to custodian bank | $ | 308,230 | ||||||
| Payable for investments | ||||||||
| purchased | 19,904,568 | |||||||
| Payable for fund shares | ||||||||
| redeemed | 1,715,808 | |||||||
| Accrued management fee | 827,618 | |||||||
| Other affiliated payables | 317,257 | |||||||
| Other payables and accrued | ||||||||
| expenses | 1,007,037 | |||||||
| Collateral on securities loaned, at | ||||||||
| value | 5,232,450 | |||||||
| Total liabilities | 29,312,968 | |||||||
| Net Assets | $ | 1,392,223,277 | ||||||
| Net Assets consist of: | ||||||||
| Paid in capital | $ | 1,477,133,479 | ||||||
| Undistributed net investment | ||||||||
| income | 11,812,415 | |||||||
| Accumulated undistributed net | ||||||||
| realized gain (loss) on invest- | ||||||||
| ments and foreign currency | ||||||||
| transactions | (367,360,677) | |||||||
| Net unrealized appreciation (de- | ||||||||
| preciation) on investments and | ||||||||
| assets and liabilities in foreign | ||||||||
| currencies | 270,638,060 | |||||||
| Net Assets, for 88,616,579 | ||||||||
| shares outstanding | $ | 1,392,223,277 | ||||||
| Net Asset Value, offering price | ||||||||
| and redemption price per | ||||||||
| share ($1,392,223,277 ÷ | ||||||||
| 88,616,579 shares) | $ | 15.71 | ||||||
| Statement of Operations | ||||||
| Year ended October 31, 2005 | ||||||
| Investment Income | ||||||
| Dividends | $ 27,997,556 | |||||
| Interest | 685,678 | |||||
| Security lending | 180,118 | |||||
| 28,863,352 | ||||||
| Less foreign taxes withheld | (3,201,921) | |||||
| Total income | 25,661,431 | |||||
| Expenses | ||||||
| Management fee | $ | 7,101,790 | ||||
| Transfer agent fees | 2,493,871 | |||||
| Accounting and security lending | ||||||
| fees | 445,846 | |||||
| Independent trustees’ | ||||||
| compensation | 4,747 | |||||
| Custodian fees and expenses | 1,160,617 | |||||
| Registration fees | 80,031 | |||||
| Audit | 147,280 | |||||
| Legal | 4,079 | |||||
| Miscellaneous | 32,937 | |||||
| Total expenses before | ||||||
| reductions | 11,471,198 | |||||
| Expense reductions | (929,530) | 10,541,668 | ||||
| Net investment income (loss) | 15,119,763 | |||||
| Realized and Unrealized Gain | ||||||
| (Loss) | ||||||
| Net realized gain (loss) on: | ||||||
| Investment securities (net of for- | ||||||
| eign taxes of $121,407) | 69,141,674 | |||||
| Foreign currency transactions . | (819,139) | |||||
| Total net realized gain (loss) | 68,322,535 | |||||
| Change in net unrealized ap- | ||||||
| preciation (depreciation) on: | ||||||
| Investment securities (net of in- | ||||||
| crease in deferred foreign | ||||||
| taxes of $700,913) | 203,769,635 | |||||
| Assets and liabilities in foreign | ||||||
| currencies | (45,546) | |||||
| Total change in net unrealized | ||||||
| appreciation (depreciation) | 203,724,089 | |||||
| Net gain (loss) | 272,046,624 | |||||
| Net increase (decrease) in net | ||||||
| assets resulting from | ||||||
| operations | $ 287,166,387 | |||||
See accompanying notes which are an integral part of the financial statements.
A-29 Annual Report
| Emerging Markets | ||||||||||||||||||||||||
| Financial Statements - continued | ||||||||||||||||||||||||
| Statement of Changes in Net Assets | ||||||||||||||||||||||||
| Year ended | Year ended | |||||||||||||||||||||||
| October 31, | October 31, | |||||||||||||||||||||||
| 2005 | 2004 | |||||||||||||||||||||||
| Increase (Decrease) in Net Assets | ||||||||||||||||||||||||
| Operations | ||||||||||||||||||||||||
| Net investment income (loss) | $ | 15,119,763 | $ | 7,186,891 | ||||||||||||||||||||
| Net realized gain (loss) | 68,322,535 | 72,957,810 | ||||||||||||||||||||||
| Change in net unrealized appreciation (depreciation) | 203,724,089 | (19,559,671) | ||||||||||||||||||||||
| Net increase (decrease) in net assets resulting from operations | 287,166,387 | 60,585,030 | ||||||||||||||||||||||
| Distributions to shareholders from net investment income | (5,999,282) | (5,261,351) | ||||||||||||||||||||||
| Share transactions | ||||||||||||||||||||||||
| Proceeds from sales of shares | 816,361,551 | 349,686,058 | ||||||||||||||||||||||
| Reinvestment of distributions | 5,785,646 | 4,973,151 | ||||||||||||||||||||||
| Cost of shares redeemed | (316,571,716) | (237,151,194) | ||||||||||||||||||||||
| Net increase (decrease) in net assets resulting from share transactions | 505,575,481 | 117,508,015 | ||||||||||||||||||||||
| Redemption fees | 930,289 | 790,209 | ||||||||||||||||||||||
| Total increase (decrease) in net assets | 787,672,875 | 173,621,903 | ||||||||||||||||||||||
| Net Assets | ||||||||||||||||||||||||
| Beginning of period | 604,550,402 | 430,928,499 | ||||||||||||||||||||||
| End of period (including undistributed net investment income of $11,812,415 and undistributed net investment | ||||||||||||||||||||||||
| income of $3,365,820, respectively) | $ 1,392,223,277 | $ | 604,550,402 | |||||||||||||||||||||
| Other Information | ||||||||||||||||||||||||
| Shares | ||||||||||||||||||||||||
| Sold | 57,501,628 | 31,618,832 | ||||||||||||||||||||||
| Issued in reinvestment of distributions | 485,074 | 482,623 | ||||||||||||||||||||||
| Redeemed | (22,850,332) | (22,532,170) | ||||||||||||||||||||||
| Net increase (decrease) | 35,136,370 | 9,569,285 | ||||||||||||||||||||||
| Financial Highlights | ||||||||||||||||||||||||
| Years ended October 31, | 2005 | 2004 | 2003 | 2002 | 2001 | |||||||||||||||||||
| Selected Per Share Data | ||||||||||||||||||||||||
| Net asset value, beginning of period | $ | 11.30 | $ | 9.81 | $ | 7.03 | $ | 6.52 | $ | 8.71 | ||||||||||||||
| Income from Investment Operations | ||||||||||||||||||||||||
| Net investment income (loss)C | 21 | .14 | .10 | .06D | .06 | |||||||||||||||||||
| Net realized and unrealized gain (loss) | 4.30 | 1.46 | 2.73 | .47 | (2.22) | |||||||||||||||||||
| Total from investment operations | 4.51 | 1.60 | 2.83 | .53 | (2.16) | |||||||||||||||||||
| Distributions from net investment income | (.11) | (.12) | (.05) | (.03) | (.03) | |||||||||||||||||||
| Redemption fees added to paid in capitalC | 01 | .01 | F | .01 | F | |||||||||||||||||||
| Net asset value, end of period | $ | 15.71 | $ | 11.30 | $ | 9.81 | $ | 7.03 | $ | 6.52 | ||||||||||||||
| Total ReturnA,B | 40.25% | 16.48% | 40.50% | 8.25% | (24.87)% | |||||||||||||||||||
| Ratios to Average Net AssetsE | ||||||||||||||||||||||||
| Expenses before expense reductions | 1.16% | 1.23% | 1.36% | 1.44% | 1.54% | |||||||||||||||||||
| Expenses net of voluntary waivers, if any | 1.16% | 1.23% | 1.36% | 1.44% | 1.54% | |||||||||||||||||||
| Expenses net of all reductions | 1.07% | 1.18% | 1.36% | 1.39% | 1.45% | |||||||||||||||||||
| Net investment income (loss) | 1.53% | 1.27% | 1.31% | .73% | .78% | |||||||||||||||||||
| Supplemental Data | ||||||||||||||||||||||||
| Net assets, end of period (000 omitted) | $ | 1,392,223 | $ | 604,550 | $ | 430,928 | $ | 263,729 | $ | 204,164 | ||||||||||||||
| Portfolio turnover rate | 68% | 112% | 105% | 120% | 113% | |||||||||||||||||||
| ATotal returns would have been lower had certain expenses not been reduced during the periods shown. BTotal returns do not include the effect of the former sales charges. CCalculated based on average shares outstanding during the period. DInvestment income per share reflects a special dividend which amounted to $.01 per share. EExpense ratios reflect operating expenses of the fund. Expenses before reductions do not reflect amounts reimbursed by the investment adviser or reductions from brokerage service arrangements or other expense offset arrangements and do not represent the amount paid by the fund during periods when reimbursements or reductions occur. Expenses net of any voluntary waivers reflect expenses after reimbursement by the investment adviser but prior to reductions from brokerage service arrangements or other expense offset arrangements. Expenses net of all reductions represent the net expenses paid by the fund. FAmount represents less than $.01 per share. |
See accompanying notes which are an integral part of the financial statements.
Annual Report A-30
| Europe |
| Performance: The Bottom Line |
Average annual total return reflects the change in the value of an investment, assuming reinvestment of the fund’s dividend income and capital gains (the profits earned upon the sale of securities that have grown in value) and assuming a constant rate of performance each year. The $10,000 table and the fund’s returns do not reflect the deduction of taxes that a shareholder would pay on fund distributions or the redemption of fund shares. During periods of reimbursement by Fidelity, a fund’s total returns will be greater than it would be had the reimbursement not occurred. How a fund did yesterday is no guarantee of how it will do tomorrow.
| Average Annual Total Returns | ||||||
| Periods ended | Past 1 | Past 5 | Past 10 | |||
| October 31, 2005 | year | years | years | |||
| Fidelity Europe Fund | 23.12% | 4.78% | 10.15% | |||
| $10,000 Over 10 Years | ||||||
Let’s say hypothetically that $10,000 was invested in Fidelity Europe Fund on October 31, 1995. The chart shows how the value of your investment would have changed, and also shows how the MSCI Europe Index performed over the same period.
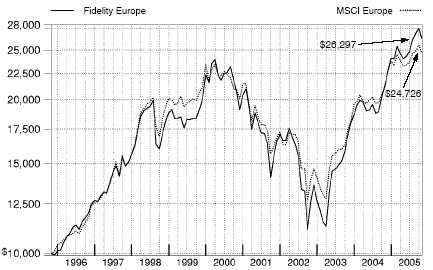
| A-31 |
| Annual Report |
| Europe Management’s Discussion of Fund Performance |
Comments from Frederic Gautier, who became Portfolio Manager of Fidelity® Europe Fund on August 11, 2005
Foreign stock markets enjoyed broad based advances during the 12 month period that ended October 31, 2005, encouraged by better than expected corporate earnings and markedly improved economies. For the 12 months overall, the Morgan Stanley Capital InternationalSM Europe, Australasia, Far East (MSCI® EAFE®) Index a performance measure of developed stock markets outside the United States and Canada gained 18.28% . The Japanese stock market climbed to its highest level in more than four years. Positive economic indicators and Prime Minister Koizumi’s decisive election victory attracted record inflows from overseas investors. In response, the Tokyo Stock Exchange Stock Price Index (TOPIX) soared 22.89% . Southeast Asian equities outside of Japan, particularly South Korea, also responded well to the better macroeconomic environment, illustrated by the 19.44% return for the MSCI All Country Far East ex Japan index. European stock markets were up as well, despite investors’ concern about higher energy prices and potential downgrades to economic growth in the region. For the year overall, the MSCI Europe index rose 16.51% . Although robust, returns for U.S. investors in foreign markets were tempered by the strength of the dollar versus many major currencies.
Fidelity Europe Fund performed very well for the 12 months ending October 31, 2005, registering a gain of 23.12% . That result outpaced both the MSCI Europe index and the LipperSM European Region Funds Average, which was up 18.34% . Good security selection particularly in financials and telecommunication services led the way versus the index, followed by some favorable regional allocation decisions. Specifically, country selection in Europe helped, as did out of benchmark stakes in some strong performing emerging markets. Among the chief contributors to the fund’s outperfor mance were Turkiye Garanti Bankasi, a large Turkish bank; Transneft, Russia’s oil infrastructure provider; Polski Koncern Naftowy, a Polish oil refiner; and MTN Group, a South African telecommunications company. Two securities exchanges Netherlands based Euronext and Germany’s Deutsche Boerse also contributed. Conversely, weak stock picking overall in Germany and France and in technology and utilities on a sector basis curbed our relative gains. Stocks that detracted from performance included Premiere AG, a German pay per view television operator; Air France KLM; Synthes, a U.S. incorporated Swiss medical device company that delayed the introduction of an anticipated new product; and Belgacom, a Belgian telecommunication services company. The fund sold its holdings of Premiere AG, Air France KLM and Belgacom, and reduced its position in Synthes.
The views expressed in this statement reflect those of the portfolio manager only through the end of the period of the report as stated on the cover and do not necessarily represent the views of Fidelity or any other person in the Fidelity organization. Any such views are subject to change at any time based upon market or other conditions and Fidelity disclaims any responsibility to update such views. These views may not be relied on as invest ment advice and, because investment decisions for a Fidelity fund are based on numerous factors, may not be relied on as an indication of trading intent on behalf of any Fidelity fund.
Annual Report A-32
| Europe Investment Changes |
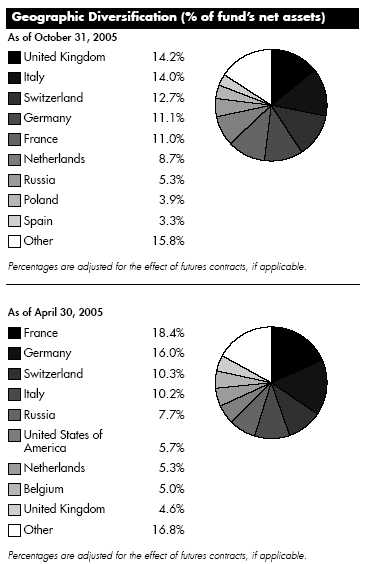
| Asset Allocation | ||||
| % of fund’s | % of fund’s net assets | |||
| net assets | 6 months ago | |||
| Stocks | 98.9 | 96.4 | ||
| Short Term Investments and | ||||
| Net Other Assets | 1.1 | 3.6 |
| Top Ten Stocks as of October 31, 2005 | ||||
| % of fund’s | % of fund’s net assets | |||
| net assets | 6 months ago | |||
| Sanofi Aventis (France, | ||||
| Pharmaceuticals) | 3.8 | 4.1 | ||
| Compagnie Financiere Richemont | ||||
| unit (Switzerland, Textiles, | ||||
| Apparel & Luxury Goods) | 3.7 | 3.1 | ||
| Vodafone Group PLC (United | ||||
| Kingdom, Wireless | ||||
| Telecommunication Services) | 3.6 | 0.0 | ||
| Total SA Series B (France, Oil, | ||||
| Gas & Consumable Fuels) | 3.4 | 3.0 | ||
| ENI Spa (Italy, Oil, Gas & | ||||
| Consumable Fuels) | 3.4 | 0.0 | ||
| SAP AG (Germany, Software) | 3.3 | 3.2 | ||
| Roche Holding AG (participation | ||||
| certificate) (Switzerland, | ||||
| Pharmaceuticals) | 3.2 | 2.8 | ||
| Polski Koncern Naftowy Orlen SA | ||||
| (Poland, Oil, Gas & | ||||
| Consumable Fuels) | 3.1 | 2.4 | ||
| Antena 3 Television SA (Spain, | ||||
| Media) | 3.0 | 4.4 | ||
| Royal Bank of Scotland Group PLC | ||||
| (United Kingdom, Commercial | ||||
| Banks) | 2.9 | 0.0 | ||
| 33.4 | ||||
| Market Sectors as of October 31, 2005 | ||||
| % of fund’s | % of fund’s net assets | |||
| net assets | 6 months ago | |||
| Financials | 32.6 | 29.7 | ||
| Consumer Discretionary | 14.5 | 15.8 | ||
| Health Care | 13.1 | 12.4 | ||
| Energy | 12.2 | 8.3 | ||
| Telecommunication Services | 7.0 | 8.9 | ||
| Information Technology | 6.8 | 7.4 | ||
| Industrials | 5.2 | 11.6 | ||
| Utilities | 4.1 | 0.0 | ||
| Consumer Staples | 2.1 | 2.3 | ||
| Materials | 1.3 | 0.0 | ||
A-33 Annual Report
| Europe | ||||||
| Investments October 31, 2005 | ||||||
| Showing Percentage of Net Assets | ||||||
| Common Stocks 96.8% | ||||||
| Shares | Value (Note 1) | |||||
| Belgium – 1.7% | ||||||
| KBC Groupe SA | 544,100 | $ 44,352,312 | ||||
| Denmark – 0.4% | ||||||
| Dampskibsselskabet TORM AS (d) | 200,000 | 10,617,195 | ||||
| Finland – 1.3% | ||||||
| Fortum Oyj | 1,869,200 | 33,095,191 | ||||
| France – 11.0% | ||||||
| CNP Assurances | 75,000 | 5,219,058 | ||||
| Dassault Systemes SA | 1,078,806 | 55,711,862 | ||||
| Renault SA | 410,600 | 35,561,938 | ||||
| Sanofi Aventis | 1,197,748 | 96,107,299 | ||||
| Total SA Series B | 346,800 | 87,407,474 | ||||
| TOTAL FRANCE | 280,007,631 | |||||
| Germany 11.1% | ||||||
| Deutsche Boerse AG | 679,000 | 63,895,173 | ||||
| Deutsche Post AG | 2,725,100 | 60,760,874 | ||||
| E.ON AG | 500,000 | 45,314,998 | ||||
| Hypo Real Estate Holding AG | 563,400 | 27,244,658 | ||||
| SAP AG | 491,500 | 84,420,043 | ||||
| TOTAL GERMANY | 281,635,746 | |||||
| Greece 1.1% | ||||||
| Alpha Bank AE | 1,000,000 | 28,674,100 | ||||
| Ireland 1.5% | ||||||
| Allied Irish Banks PLC | 1,829,200 | 38,468,067 | ||||
| Italy 11.9% | ||||||
| Banca Popolare di Milano | 4,491,680 | 42,805,991 | ||||
| ENI Spa (d) | 3,208,500 | 85,827,370 | ||||
| Mediaset Spa | 2,759,800 | 30,304,122 | ||||
| Mediobanca Spa | 2,072,098 | 36,687,609 | ||||
| Pirelli & C. Real Estate Spa | 1,045,757 | 57,226,895 | ||||
| Unicredito Italiano Spa | 8,933,000 | 49,879,885 | ||||
| TOTAL ITALY | 302,731,872 | |||||
| Luxembourg 1.1% | ||||||
| SES Global unit | 1,692,700 | 26,764,147 | ||||
| Netherlands – 8.7% | ||||||
| Efes Breweries International NV unit | 77,800 | 2,460,814 | ||||
| Euronext NV | 644,644 | 27,394,590 | ||||
| ING Groep NV (Certificaten Van | ||||||
| Aandelen) | 1,808,900 | 52,204,858 | ||||
| Koninklijke Philips Electronics NV | 1,100,000 | 28,775,997 | ||||
| Rodamco Europe NV | 654,352 | 52,084,456 | ||||
| VNU NV | 1,823,400 | 57,989,294 | ||||
| TOTAL NETHERLANDS | 220,910,009 | |||||
| Shares | Value (Note 1) | |||
| Poland – 3.9% | ||||
| Polski Koncern Naftowy Orlen SA | 4,494,930 | $ 79,806,540 | ||
| Powszechna Kasa Oszczednosci | ||||
| Bank SA | 2,297,959 | 19,322,553 | ||
| TOTAL POLAND | 99,129,093 | |||
| Russia 5.3% | ||||
| Mobile TeleSystems OJSC GDR (Reg. S) . | 1,382,164 | 51,126,246 | ||
| Surgutneftegaz JSC sponsored ADR | 989,257 | 46,940,245 | ||
| Transneft warrants (UBS Warrant | ||||
| Programme) 11/1/05 (a) | 22,724 | 36,712,484 | ||
| TOTAL RUSSIA | 134,778,975 | |||
| South Africa – 3.0% | ||||
| FirstRand Ltd. | 9,832,748 | 23,138,464 | ||
| JD Group Ltd. | 1,686,500 | 18,033,737 | ||
| MTN Group Ltd. | 4,560,048 | 33,979,493 | ||
| TOTAL SOUTH AFRICA | 75,151,694 | |||
| Spain 3.3% | ||||
| Antena 3 Television SA | 3,965,220 | 77,098,648 | ||
| Banco Bilbao Vizcaya Argentaria SA | 450,000 | 7,933,502 | ||
| TOTAL SPAIN | 85,032,150 | |||
| Sweden 1.3% | ||||
| Telefonaktiebolaget LM Ericsson (B | ||||
| Shares) | 10,000,000 | 32,810,006 | ||
| Switzerland 12.7% | ||||
| Compagnie Financiere Richemont unit | 2,454,715 | 93,397,798 | ||
| Credit Suisse Group (Reg.) | 1,077,366 | 47,738,090 | ||
| Novartis AG (Reg.) | 1,052,245 | 56,631,823 | ||
| Roche Holding AG (participation | ||||
| certificate) | 552,440 | 82,534,960 | ||
| Societe Generale de Surveillance Holding | ||||
| SA (SGS) (Reg.) | 60,377 | 44,492,999 | ||
| TOTAL SWITZERLAND | 324,795,670 | |||
| Turkey 1.5% | ||||
| Turkiye Garanti Bankasi AS | 13,030,478 | 38,758,803 | ||
| United Kingdom – 14.2% | ||||
| AstraZeneca PLC (United Kingdom) | 1,167,000 | 52,398,292 | ||
| Aviva PLC | 450,000 | 5,314,006 | ||
| BAE Systems PLC | 5,000,000 | 29,256,686 | ||
| British American Tobacco PLC | 250,000 | 5,508,751 | ||
| British Energy Group PLC (a) | 3,159,860 | 24,839,021 | ||
| Royal Bank of Scotland Group PLC | 2,700,500 | 74,776,408 | ||
| Tesco PLC | 8,622,200 | 45,910,011 | ||
| Vodafone Group PLC | 34,444,400 | 90,451,072 | ||
| Xstrata PLC | 1,420,600 | 32,520,259 | ||
| TOTAL UNITED KINGDOM | 360,974,506 | |||
| United States of America – 1.8% | ||||
| Synthes, Inc. | 435,675 | 46,130,890 | ||
| TOTAL COMMON STOCKS | ||||
| (Cost $2,158,671,672) | 2,464,818,057 | |||
See accompanying notes which are an integral part of the financial statements.
Annual Report A-34
| Nonconvertible Preferred Stocks 2.1% | ||||
| Shares | Value (Note 1) | |||
| Italy 2.1% | ||||
| Banca Intesa Spa (Risp) | ||||
| (Cost $25,647,939) | 12,288,997 | $ 53,224,675 | ||
| Money Market Funds 0.2% | ||||
| Fidelity Securities Lending Cash | ||||
| Central Fund, 3.94% (b)(c) | ||||
| (Cost $5,908,150) | 5,908,150 | 5,908,150 | ||
| TOTAL INVESTMENT PORTFOLIO 99.1% | ||||
| (Cost $2,190,227,761) | 2,523,950,882 | |||
| NET OTHER ASSETS 0.9% | 23,860,840 | |||
| NET ASSETS 100% | $ 2,547,811,722 | |||
| Legend (a) Non-income producing (b) Affiliated fund that is available only to investment companies and other accounts managed by Fidelity Investments. The rate quoted is the annualized seven-day yield of the fund at period end. A complete unaudited listing of the fund’s holdings as of its most recent quarter end is available upon request. (c) Investment made with cash collateral received from securities on loan. (d) Security or a portion of the security is on loan at period end. |
See accompanying notes which are an integral part of the financial statements.
A-35 Annual Report
| Europe | ||||||||
| Financial Statements | ||||||||
| Statement of Assets and Liabilities | ||||||||
| October 31, 2005 | ||||||||
| Assets | ||||||||
| Investment in securities, at value (in- | ||||||||
| cluding securities loaned of | ||||||||
| $5,628,479) (cost | ||||||||
| $2,190,227,761) — See accom- | ||||||||
| panying schedule | $ | 2,523,950,882 | ||||||
| Foreign currency held at value (cost | ||||||||
| $11,233) | 11,119 | |||||||
| Receivable for investments sold | 60,119,901 | |||||||
| Receivable for fund shares sold | 2,766,089 | |||||||
| Dividends receivable | 3,093,914 | |||||||
| Interest receivable | 83,931 | |||||||
| Other affiliated receivables | 39 | |||||||
| Other receivables | 530,167 | |||||||
| Total assets | 2,590,556,042 | |||||||
| Liabilities | ||||||||
| Payable to custodian bank | $ | 1,028,052 | ||||||
| Payable for investments purchased | . | 30,487,816 | ||||||
| Payable for fund shares redeemed | . | 2,532,710 | ||||||
| Accrued management fee | 1,830,050 | |||||||
| Other affiliated payables | 626,727 | |||||||
| Other payables and accrued | ||||||||
| expenses | 330,815 | |||||||
| Collateral on securities loaned, at | ||||||||
| value | 5,908,150 | |||||||
| Total liabilities | 42,744,320 | |||||||
| Net Assets | $ | 2,547,811,722 | ||||||
| Net Assets consist of: | ||||||||
| Paid in capital | $ | 1,904,995,805 | ||||||
| Undistributed net investment income | 22,161,696 | |||||||
| Accumulated undistributed net real- | ||||||||
| ized gain (loss) on investments and | ||||||||
| foreign currency transactions | 286,937,853 | |||||||
| Net unrealized appreciation (de- | ||||||||
| preciation) on investments and as- | ||||||||
| sets and liabilities in foreign | ||||||||
| currencies | 333,716,368 | |||||||
| Net Assets, for 68,378,761 shares | ||||||||
| outstanding | $ | 2,547,811,722 | ||||||
| Net Asset Value, offering price and | ||||||||
| redemption price per share | ||||||||
| ($2,547,811,722 ÷ 68,378,761 | ||||||||
| shares) | $ | 37.26 | ||||||
| Statement of Operations | ||||||
| Year ended October 31, 2005 | ||||||
| Investment Income | ||||||
| Dividends | $ | 50,989,277 | ||||
| Interest | 1,874,508 | |||||
| Security lending | 2,307,728 | |||||
| 55,171,513 | ||||||
| Less foreign taxes withheld | (6,774,717) | |||||
| Total income | 48,396,796 | |||||
| Expenses | ||||||
| Management fee | ||||||
| Basic fee | $ | 17,319,034 | ||||
| Performance adjustment | 1,926,594 | |||||
| Transfer agent fees | 5,900,840 | |||||
| Accounting and security lending | ||||||
| fees | 1,022,972 | |||||
| Independent trustees’ compensation | 11,760 | |||||
| Custodian fees and expenses | 1,318,227 | |||||
| Registration fees | 92,832 | |||||
| Audit | 74,968 | |||||
| Legal | 6,903 | |||||
| Interest | 3,518 | |||||
| Miscellaneous | 23,845 | |||||
| Total expenses before reductions | 27,701,493 | |||||
| Expense reductions | (2,042,650) | 25,658,843 | ||||
| Net investment income (loss) | 22,737,953 | |||||
| Realized and Unrealized Gain | ||||||
| (Loss) | ||||||
| Net realized gain (loss) on: | ||||||
| Investment securities | 389,132,633 | |||||
| Foreign currency transactions | (978,840) | |||||
| Total net realized gain (loss) | 388,153,793 | |||||
| Change in net unrealized appreci- | ||||||
| ation (depreciation) on: | ||||||
| Investment securities | 46,608,246 | |||||
| Assets and liabilities in foreign | ||||||
| currencies | (103,719) | |||||
| Total change in net unrealized ap- | ||||||
| preciation (depreciation) | 46,504,527 | |||||
| Net gain (loss) | 434,658,320 | |||||
| Net increase (decrease) in net as- | ||||||
| sets resulting from operations | $ | 457,396,273 | ||||
See accompanying notes which are an integral part of the financial statements.
Annual Report A-36
| Statement of Changes in Net Assets | ||||||||||||||||||||||
| Year ended | Year ended | |||||||||||||||||||||
| October 31, | October 31, | |||||||||||||||||||||
| 2005 | 2004 | |||||||||||||||||||||
| Increase (Decrease) in Net Assets | ||||||||||||||||||||||
| Operations | ||||||||||||||||||||||
| Net investment income (loss) | $ | 22,737,953 | $ | 5,035,844 | ||||||||||||||||||
| Net realized gain (loss) | 388,153,793 | 289,718,773 | ||||||||||||||||||||
| Change in net unrealized appreciation (depreciation) | 46,504,527 | 61,249,846 | ||||||||||||||||||||
| Net increase (decrease) in net assets resulting from operations | 457,396,273 | 356,004,463 | ||||||||||||||||||||
| Distributions to shareholders from net investment income | (5,654,760) | (15,656,206) | ||||||||||||||||||||
| Distributions to shareholders from net realized gain | (5,026,446) | — | ||||||||||||||||||||
| Total distributions | (10,681,206) | (15,656,206) | ||||||||||||||||||||
| Share transactions | ||||||||||||||||||||||
| Proceeds from sales of shares | 673,749,170 | 423,185,947 | ||||||||||||||||||||
| Reinvestment of distributions | 10,481,613 | 15,242,825 | ||||||||||||||||||||
| Cost of shares redeemed | (428,684,899) | (216,598,289) | ||||||||||||||||||||
| Net increase (decrease) in net assets resulting from share transactions | 255,545,884 | 221,830,483 | ||||||||||||||||||||
| Redemption fees | 110,346 | 70,412 | ||||||||||||||||||||
| Total increase (decrease) in net assets | 702,371,297 | 562,249,152 | ||||||||||||||||||||
| Net Assets | ||||||||||||||||||||||
| Beginning of period | 1,845,440,425 | 1,283,191,273 | ||||||||||||||||||||
| End of period (including undistributed net investment income of $22,161,696 and undistributed net investment income | ||||||||||||||||||||||
| of $5,169,708, respectively) | $ 2,547,811,722 | $ 1,845,440,425 | ||||||||||||||||||||
| Other Information | ||||||||||||||||||||||
| Shares | ||||||||||||||||||||||
| Sold | 19,400,306 | 15,357,591 | ||||||||||||||||||||
| Issued in reinvestment of distributions | 318,978 | 579,135 | ||||||||||||||||||||
| Redeemed | (12,015,269) | (7,925,889) | ||||||||||||||||||||
| Net increase (decrease) | 7,704,015 | 8,010,837 | ||||||||||||||||||||
| Financial Highlights | ||||||||||||||||||||||
| Years ended October 31, | 2005 | 2004 | 2003 | 2002 | 2001 | |||||||||||||||||
| Selected Per Share Data | ||||||||||||||||||||||
| Net asset value, beginning of period | $ | 30.42 | $ | 24.37 | $ 18.31 | $ | 22.68 | $ | 34.88 | |||||||||||||
| Income from Investment Operations | ||||||||||||||||||||||
| Net investment income (loss)D | 33 | .09 | .29 | .12E | .12 | |||||||||||||||||
| Net realized and unrealized gain (loss) | 6.68 | 6.25 | 5.91 | (4.25) | (8.11) | |||||||||||||||||
| Total from investment operations | 7.01 | 6.34 | 6.20 | (4.13) | (7.99) | |||||||||||||||||
| Distributions from net investment income | (.09) | (.29) | (.14) | (.24) | (.12) | |||||||||||||||||
| Distributions from net realized gain | (.08) | — | — | (4.09) | ||||||||||||||||||
| Total distributions | (.17) | (.29) | (.14) | (.24) | (4.21) | |||||||||||||||||
| Redemption fees added to paid in capitalD,G | — | — | — | — | — | |||||||||||||||||
| Net asset value, end of period | $ | 37.26 | $ | 30.42 | $ 24.37 | $ | 18.31 | $ | 22.68 | |||||||||||||
| Total ReturnA,B,C | 23.12% | 26.20% | 34.09% | (18.49)% | (25.64)% | |||||||||||||||||
| Ratios to Average Net AssetsF | ||||||||||||||||||||||
| Expenses before expense reductions | 1.15% | 1.11% | 1.03% | 1.20% | 1.06% | |||||||||||||||||
| Expenses net of voluntary waivers, if any | 1.15% | 1.11% | 1.03% | 1.20% | 1.06% | |||||||||||||||||
| Expenses net of all reductions | 1.07% | 1.05% | .98% | 1.13% | .99% | |||||||||||||||||
| Net investment income (loss) | 95% | .32% | 1.44% | .52% | .45% | |||||||||||||||||
| Supplemental Data | ||||||||||||||||||||||
| Net assets, end of period (000 omitted) | $ | 2,547,812 | $ | 1,845,440 | $1,283,191 | $ | 875,995 | $ | 1,059,368 | |||||||||||||
| Portfolio turnover rate | 99% | 106% | 162% | 127% | 123% | |||||||||||||||||
| ATotal returns would have been lower had certain expenses not been reduced during the periods shown. BTotal returns do not include the effect of the former sales charges. CTotal returns do not include the effect of the former contingent deferred sales charge. DCalculated based on average shares outstanding during the period. EInvestment income per share reflects a special dividend which amounted to $.05 per share. FExpense ratios reflect operating expenses of the fund. Expenses before reductions do not reflect amounts reimbursed by the investment adviser or reductions from brokerage service arrangements or other expense offset arrangements and do not represent the amount paid by the fund during periods when reimburse ments or reductions occur. Expenses net of any voluntary waivers reflect expenses after reimbursement by the investment adviser but prior to reductions from brokerage service arrangements or other expense offset arrangements. Expenses net of all reductions represent the net expenses paid by the fund. GAmount represents less than $.01 per share. |
See accompanying notes which are an integral part of the financial statements.
A-37 Annual Report
| Europe Capital Appreciation Performance: The Bottom Line |
Average annual total return reflects the change in the value of an investment, assuming reinvestment of the fund’s dividend income and capital gains (the profits earned upon the sale of securities that have grown in value) and assuming a constant rate of performance each year. The $10,000 table and the fund’s returns do not reflect the deduction of taxes that a shareholder would pay on fund distributions or the redemption of fund shares. During periods of reimbursement by Fidelity, a fund’s total returns will be greater than it would be had the reimbursement not occurred. How a fund did yesterday is no guarantee of how it will do tomorrow.
| Average Annual Total Returns | ||||||
| Periods ended | Past 1 | Past 5 | Past 10 | |||
| October 31, 2005 | year | years | years | |||
| Fidelity Europe Capital Appreciation Fund | 19.24% | 5.49% | 11.13% | |||
| $10,000 Over 10 Years | ||||||
Let’s say hypothetically that $10,000 was invested in Fidelity Europe Capital Appreciation Fund on October 31, 1995. The chart shows how the value of your investment would have changed, and also shows how the MSCI Europe Index performed over the same period.
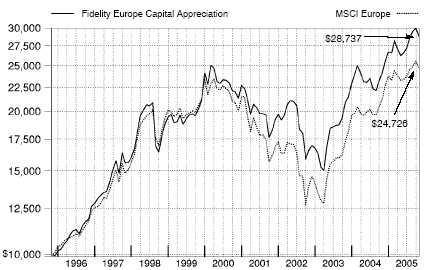
| Annual Report |
| A-38 |
| Europe Capital Appreciation |
Management’s Discussion of Fund Performance
Comments from Ian Hart, Portfolio Manager of Fidelity® Europe Capital Appreciation Fund
Foreign stock markets enjoyed broad based advances during the 12 month period that ended October 31, 2005, encouraged by better than expected corporate earnings and markedly improved economies. For the 12 months overall, the Morgan Stanley Capital InternationalSM Europe, Australasia, Far East (MSCI® EAFE®) Index a performance measure of developed stock markets outside the United States and Canada gained 18.28% . The Japanese stock market climbed to its highest level in more than four years. Positive economic indicators and Prime Minister Koizumi’s decisive election victory attracted record inflows from overseas investors. In response, the Tokyo Stock Exchange Stock Price Index (TOPIX) soared 22.89% . Southeast Asian equities outside of Japan, particularly South Korea, also responded well to the better macroeconomic environment, illustrated by the 19.44% return for the MSCI All Country Far East ex Japan index. European stock markets were up as well, despite investors’ concern about higher energy prices and potential downgrades to economic growth in the region. For the year overall, the MSCI Europe index rose 16.51% . Although robust, returns for U.S. investors in foreign markets were tempered somewhat by the strength of the dollar versus many major currencies.
Fidelity Europe Capital Appreciation Fund gained 19.24% for the 12 months ending October 31, 2005, topping the MSCI Europe index and the LipperSM European Region Funds Average, which increased 18.34% . The fund’s outperformance versus the index was mainly attributable to astute security selection, with strong performing picks even coming from generally weak market sectors. For example, the fund’s top contributor both on an absolute and relative basis was TANDBERG Television, a Norwegian technology company that provides infrastructure for the cable and TV indus tries, which performed well despite a lackluster environment for tech stocks. Similarly, within the lagging financials sector, several individual holdings did well, including Turkiye Garanti Bankasi, a Turkish bank; Banca Italease, an Italian leasing company; Amlin, a British specialty insurance underwriter; and Deutsche Boerse, the German stock exchange. Conversely, performance was held back by the fund’s big underweighting in index component Roche Holdings, the Swiss pharmaceutical company, which did well during the period, as well as by some smaller names among them, Italian broadband company FASTWEB and Turkish electrical utility Akenerji where stories in which I had conviction hadn’t yet materialized.
Note to shareholders:
Effective January 1, 2006, Darren Maupin has been named Portfolio Manager of Fidelity Europe Capital Appreciation Fund, succeeding Ian Hart.
The views expressed in this statement reflect those of the portfolio manager only through the end of the period of the report as stated on the cover and do not necessarily represent the views of Fidelity or any other person in the Fidelity organization. Any such views are subject to change at any time based upon market or other conditions and Fidelity disclaims any responsibility to update such views. These views may not be relied on as invest ment advice and, because investment decisions for a Fidelity fund are based on numerous factors, may not be relied on as an indication of trading intent on behalf of any Fidelity fund.
| A-39 A-39 |
| Annual Report |
| Europe Capital Appreciation Investment Changes |
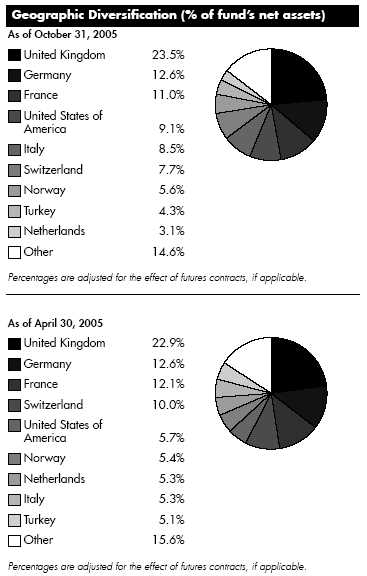
| Asset Allocation | ||||
| % of fund’s | % of fund’s net assets | |||
| net assets | 6 months ago | |||
| Stocks | 92.9 | 96.4 | ||
| Short Term Investments and | ||||
| Net Other Assets | 7.1 | 3.6 |
| Top Ten Stocks as of October 31, 2005 | ||||
| % of fund’s | % of fund’s net assets | |||
| net assets | 6 months ago | |||
| Total SA sponsored ADR (France, | ||||
| Oil, Gas & Consumable Fuels) | 5.1 | 4.4 | ||
| ENI Spa (Italy, Oil, Gas & | ||||
| Consumable Fuels) | 3.7 | 2.6 | ||
| Novartis AG (Switzerland, | ||||
| Pharmaceuticals) | 3.4 | 2.8 | ||
| BASF AG (Germany, Chemicals) | 3.4 | 1.5 | ||
| Vodafone Group PLC (United | ||||
| Kingdom, Wireless | ||||
| Telecommunication Services) | 3.0 | 4.2 | ||
| GlaxoSmithKline PLC (United | ||||
| Kingdom, Pharmaceuticals) | 2.7 | 2.8 | ||
| BAE Systems PLC (United | ||||
| Kingdom, Aerospace & | ||||
| Defense) | 2.1 | 0.9 | ||
| Pernod Ricard SA (France, | ||||
| Beverages) | 2.1 | 1.3 | ||
| Statoil ASA (Norway, Oil, Gas & | ||||
| Consumable Fuels) | 2.0 | 1.5 | ||
| Bayer AG (Germany, Chemicals) | 1.9 | 1.8 | ||
| 29.4 | ||||
| Market Sectors as of October 31, 2005 | ||||
| % of fund’s | % of fund’s net assets | |||
| net assets | 6 months ago | |||
| Financials | 20.2 | 21.2 | ||
| Energy | 18.6 | 16.0 | ||
| Consumer Discretionary | 11.4 | 11.5 | ||
| Telecommunication Services | 10.7 | 13.4 | ||
| Health Care | 10.6 | 11.2 | ||
| Materials | 7.3 | 8.1 | ||
| Industrials | 5.2 | 5.5 | ||
| Utilities | 3.6 | 2.3 | ||
| Consumer Staples | 2.9 | 1.8 | ||
| Information Technology | 2.4 | 5.4 | ||
Annual Report A-40
| Europe Capital Appreciation | ||||||||
| Investments October 31, 2005 | ||||||||
| Showing Percentage of Net Assets | ||||||||
| Common Stocks 92.2% | ||||||||
| Shares | Value (Note 1) | |||||||
| Austria 1.0% | ||||||||
| OMV AG | 95,300 | $ | 5,140,839 | |||||
| Canada 0.9% | ||||||||
| Eldorado Gold Corp. (a) | 893,200 | 2,730,273 | ||||||
| Hydrogenics Corp. (a) | 617,900 | 1,888,754 | ||||||
| TOTAL CANADA | 4,619,027 | |||||||
| Finland – 1.2% | ||||||||
| Metso Corp. | 226,500 | 5,891,916 | ||||||
| France – 11.0% | ||||||||
| AXA SA | 153,400 | 4,442,464 | ||||||
| Lagardere S.C.A. (Reg.) | 67,300 | 4,626,761 | ||||||
| Pernod Ricard SA | 58,484 | 10,228,713 | ||||||
| Renault SA | 50,900 | 4,408,433 | ||||||
| Sanofi Aventis sponsored ADR | 128,373 | 5,150,325 | ||||||
| Total SA sponsored ADR | 200,300 | 25,241,807 | ||||||
| TOTAL FRANCE | 54,098,503 | |||||||
| Germany 11.9% | ||||||||
| Allianz AG (Reg.) | 46,800 | 6,617,520 | ||||||
| BASF AG | 231,534 | 16,670,447 | ||||||
| Bayer AG | 275,700 | 9,594,360 | ||||||
| Bilfinger & Berger Bau AG | 54,400 | 2,354,153 | ||||||
| DAB Bank AG | 230,754 | 1,739,917 | ||||||
| Deutsche Boerse AG | 33,910 | 3,190,995 | ||||||
| E.ON AG | 102,100 | 9,253,323 | ||||||
| MAN AG | 100,800 | 4,679,901 | ||||||
| SAP AG | 26,200 | 4,500,112 | ||||||
| TOTAL GERMANY | 58,600,728 | |||||||
| Greece 0.6% | ||||||||
| Greek Organization of Football | ||||||||
| Prognostics SA | 93,700 | 2,704,735 | ||||||
| Ireland 0.8% | ||||||||
| C&C Group PLC | 626,200 | 3,865,885 | ||||||
| Israel 0.2% | ||||||||
| Emblaze Ltd. (a) | 362,900 | 775,814 | ||||||
| Italy 8.5% | ||||||||
| Banca Intesa Spa | 949,403 | 4,430,611 | ||||||
| Banca Italease Spa | 305,500 | 6,463,384 | ||||||
| ENI Spa | 620,281 | 16,592,516 | ||||||
| ENI Spa sponsored ADR (d) | 12,300 | 1,645,125 | ||||||
| FASTWEB Spa (a) | 128,780 | 5,858,532 | ||||||
| Unicredito Italiano Spa | 1,215,000 | 6,784,290 | ||||||
| TOTAL ITALY | 41,774,458 | |||||||
| Luxembourg 1.1% | ||||||||
| Millicom International Cellular SA unit (a) | 292,810 | 5,608,647 | ||||||
| Netherlands – 3.1% | ||||||||
| Completel Europe NV (a) | 93,655 | 4,361,648 | ||||||
| Shares | Value (Note 1) | |||||
| ING Groep NV (Certificaten Van | ||||||
| Aandelen) | 186,598 | $ | 5,385,219 | |||
| Koninklijke Philips Electronics NV (NY | ||||||
| Shares) | 218,577 | 5,717,974 | ||||
| TOTAL NETHERLANDS | 15,464,841 | |||||
| Norway 5.6% | ||||||
| Ocean RIG ASA (a)(d) | 354,300 | 3,948,163 | ||||
| Petroleum Geo Services ASA (a) | 299,450 | 7,594,413 | ||||
| Statoil ASA | 444,000 | 9,929,603 | ||||
| TANDBERG ASA | 182,700 | 1,797,233 | ||||
| TANDBERG Television ASA (a) | 338,100 | 4,209,361 | ||||
| TOTAL NORWAY | 27,478,773 | |||||
| Poland – 2.1% | ||||||
| Polski Koncern Naftowy Orlen SA | 373,401 | 6,629,656 | ||||
| Powszechna Kasa Oszczednosci Bank | ||||||
| SA | 469,000 | 3,943,620 | ||||
| TOTAL POLAND | 10,573,276 | |||||
| Russia 0.8% | ||||||
| Mobile TeleSystems OJSC sponsored | ||||||
| ADR | 104,800 | 3,876,552 | ||||
| South Africa – 1.9% | ||||||
| Steinhoff International Holdings Ltd. | 3,513,669 | 9,195,235 | ||||
| Spain 2.1% | ||||||
| Banco Bilbao Vizcaya Argentaria SA | 167,300 | 2,949,500 | ||||
| Telefonica SA sponsored ADR | 157,036 | 7,529,876 | ||||
| TOTAL SPAIN | 10,479,376 | |||||
| Sweden 1.9% | ||||||
| Modern Times Group AB (MTG) (B | ||||||
| Shares) (a) | 59,200 | 2,264,182 | ||||
| OMX AB (a)(d) | 204,700 | 2,500,402 | ||||
| Skandia Foersaekrings AB | 884,700 | 4,411,527 | ||||
| TOTAL SWEDEN | 9,176,111 | |||||
| Switzerland 7.7% | ||||||
| Actelion Ltd. (Reg.) (a) | 21,598 | 2,429,283 | ||||
| Baloise Holdings AG (Reg.) | 39,552 | 2,015,721 | ||||
| Credit Suisse Group (Reg.) | 131,690 | 5,835,184 | ||||
| Novartis AG: | ||||||
| (Reg.) | 266,662 | 14,351,748 | ||||
| sponsored ADR | 46,400 | 2,497,248 | ||||
| Phonak Holding AG | 81,282 | 3,388,983 | ||||
| Syngenta AG (Switzerland) | 69,053 | 7,402,649 | ||||
| TOTAL SWITZERLAND | 37,920,816 | |||||
| Turkey 4.3% | ||||||
| Akenerji Elektrik Uretimi Otoproduktor | ||||||
| Grubu AS (a) | 1,125,996 | 4,332,356 | ||||
| Turkcell Iletisim Hizmet AS sponsored | ||||||
| ADR | 456,759 | 6,020,084 | ||||
See accompanying notes which are an integral part of the financial statements.
A-41 Annual Report
| Europe Capital Appreciation | ||||||
| Investments - continued | ||||||
| Common Stocks continued | ||||||
| Shares | Value (Note 1) | |||||
| Turkey – continued | ||||||
| Turkiye Garanti Bankasi AS | 1,057,169 | $ | 3,144,520 | |||
| Yapi ve Kredi Bankasi AS (a) | 2,123,000 | 7,917,070 | ||||
| TOTAL TURKEY | 21,414,030 | |||||
| United Kingdom – 23.5% | ||||||
| Amlin PLC | 1,078,469 | 4,234,040 | ||||
| AstraZeneca PLC sponsored ADR | 195,700 | 8,786,930 | ||||
| Axis Shield PLC (a) | 385,175 | 2,161,728 | ||||
| BAE Systems PLC | 1,779,300 | 10,411,284 | ||||
| Barratt Developments PLC | 148,400 | 1,987,589 | ||||
| BG Group PLC | 872,900 | 7,665,312 | ||||
| BowLeven PLC | 156,100 | 1,015,650 | ||||
| British Land Co. PLC | 309,100 | 4,870,490 | ||||
| BT Group PLC | 1,298,200 | 4,908,505 | ||||
| Chaucer Holdings PLC | 6,068,000 | 5,720,696 | ||||
| Expro International Group PLC | 167,900 | 1,449,135 | ||||
| George Wimpey PLC | 546,700 | 3,958,732 | ||||
| GlaxoSmithKline PLC | 351,800 | 9,145,042 | ||||
| GlaxoSmithKline PLC sponsored ADR | 88,900 | 4,621,911 | ||||
| Hilton Group PLC | 709,600 | 4,262,036 | ||||
| ITV PLC | 3,093,759 | 5,696,439 | ||||
| Prudential PLC | 578,900 | 4,858,090 | ||||
| Standard Chartered PLC (United | ||||||
| Kingdom) | 372,300 | 7,817,383 | ||||
| Vodafone Group PLC | 3,190,800 | 8,379,048 | ||||
| Vodafone Group PLC sponsored ADR | 247,100 | 6,488,846 | ||||
| William Hill PLC | 566,353 | 5,359,430 | ||||
| Wilson Bowden PLC | 103,500 | 2,059,635 | ||||
| TOTAL UNITED KINGDOM | 115,857,951 | |||||
| United States of America – 2.0% | ||||||
| AES Corp. (a) | 249,400 | 3,962,966 | ||||
| Forest Oil Corp. (a) | 129,300 | 5,647,824 | ||||
| TOTAL UNITED STATES OF AMERICA | 9,610,790 | |||||
| TOTAL COMMON STOCKS | ||||||
| (Cost $418,132,904) | 454,128,303 | |||||
| Nonconvertible Preferred Stocks 0.7% | ||||||
| Germany 0.7% | ||||||
| Porsche AG (non vtg.) | ||||||
| (Cost $3,076,636) | 5,132 | 3,700,419 | ||||
| Money Market Funds 8.8% | ||||||
| Shares | Value (Note 1) | |||||
| Fidelity Cash Central Fund, | ||||||
| 3.92% (b) | 37,104,989 | $ | 37,104,989 | |||
| Fidelity Securities Lending Cash | ||||||
| Central Fund, 3.94% (b)(c) | 6,323,290 | 6,323,290 | ||||
| TOTAL MONEY MARKET FUNDS | ||||||
| (Cost $43,428,279) | 43,428,279 | |||||
| TOTAL INVESTMENT PORTFOLIO 101.7% | ||||||
| (Cost $464,637,819) | 501,257,001 | |||||
| NET OTHER ASSETS (1.7)% | (8,469,437) | |||||
| NET ASSETS 100% | $ | 492,787,564 | ||||
| Legend (a) Non-income producing (b) Affiliated fund that is available only to investment companies and other accounts managed by Fidelity Investments. The rate quoted is the annualized seven-day yield of the fund at period end. A complete unaudited listing of the fund’s holdings as of its most recent quarter end is available upon request. (c) Investment made with cash collateral received from securities on loan. (d) Security or a portion of the security is on loan at period end. |
See accompanying notes which are an integral part of the financial statements.
Annual Report A-42
| Europe Capital Appreciation | ||||||||
| Financial Statements | ||||||||
| Statement of Assets and Liabilities | ||||||||
| October 31, 2005 | ||||||||
| Assets | ||||||||
| Investment in securities, at value (in- | ||||||||
| cluding securities loaned of | ||||||||
| $6,116,641) (cost $464,637,819) | ||||||||
| — See accompanying schedule | $ | 501,257,001 | ||||||
| Receivable for investments sold | 5,451,430 | |||||||
| Receivable for fund shares sold | 795,088 | |||||||
| Dividends receivable | 497,389 | |||||||
| Interest receivable | 47,098 | |||||||
| Other affiliated receivables | 2 | |||||||
| Other receivables | 51,668 | |||||||
| Total assets | 508,099,676 | |||||||
| Liabilities | ||||||||
| Payable for investments purchased | . $ | 8,125,695 | ||||||
| Payable for fund shares redeemed | . | 395,079 | ||||||
| Accrued management fee | 268,799 | |||||||
| Other affiliated payables | 113,686 | |||||||
| Other payables and accrued | ||||||||
| expenses | 85,563 | |||||||
| Collateral on securities loaned, at | ||||||||
| value | 6,323,290 | |||||||
| Total liabilities | 15,312,112 | |||||||
| Net Assets | $ | 492,787,564 | ||||||
| Net Assets consist of: | ||||||||
| Paid in capital | $ | 387,230,517 | ||||||
| Undistributed net investment income | 6,919,085 | |||||||
| Accumulated undistributed net real- | ||||||||
| ized gain (loss) on investments and | ||||||||
| foreign currency transactions | 62,018,463 | |||||||
| Net unrealized appreciation (de- | ||||||||
| preciation) on investments and as- | ||||||||
| sets and liabilities in foreign | ||||||||
| currencies | 36,619,499 | |||||||
| Net Assets, for 21,287,550 shares | ||||||||
| outstanding | $ | 492,787,564 | ||||||
| Net Asset Value, offering price and | ||||||||
| redemption price per share | ||||||||
| ($492,787,564 ÷ 21,287,550 | ||||||||
| shares) | $ | 23.15 | ||||||
| Statement of Operations | ||||||
| Year ended October 31, 2005 | ||||||
| Investment Income | ||||||
| Dividends | $ | 12,064,802 | ||||
| Interest | 402,406 | |||||
| Security lending | 649,695 | |||||
| 13,116,903 | ||||||
| Less foreign taxes withheld | (1,233,536) | |||||
| Total income | 11,883,367 | |||||
| Expenses | ||||||
| Management fee | ||||||
| Basic fee | $ | 3,425,137 | ||||
| Performance adjustment | (562,038) | |||||
| Transfer agent fees | 1,070,502 | |||||
| Accounting and security lending | ||||||
| fees | 243,812 | |||||
| Independent trustees’ compensation | 2,306 | |||||
| Custodian fees and expenses | 247,370 | |||||
| Registration fees | 22,207 | |||||
| Audit | 53,602 | |||||
| Legal | 947 | |||||
| Miscellaneous | 10,034 | |||||
| Total expenses before reductions | 4,513,879 | |||||
| Expense reductions | (524,160) | 3,989,719 | ||||
| Net investment income (loss) | 7,893,648 | |||||
| Realized and Unrealized Gain | ||||||
| (Loss) | ||||||
| Net realized gain (loss) on: | ||||||
| Investment securities | 80,958,962 | |||||
| Foreign currency transactions | (217,028) | |||||
| Total net realized gain (loss) | 80,741,934 | |||||
| Change in net unrealized appreci- | ||||||
| ation (depreciation) on: | ||||||
| Investment securities | (10,241,880) | |||||
| Assets and liabilities in foreign | ||||||
| currencies | (7,152) | |||||
| Total change in net unrealized ap- | ||||||
| preciation (depreciation) | (10,249,032) | |||||
| Net gain (loss) | 70,492,902 | |||||
| Net increase (decrease) in net as- | ||||||
| sets resulting from operations | $ | 78,386,550 | ||||
See accompanying notes which are an integral part of the financial statements.
A-43 Annual Report
| Europe Capital Appreciation | ||||||||||||||||||||||
| Financial Statements - continued | ||||||||||||||||||||||
| Statement of Changes in Net Assets | ||||||||||||||||||||||
| Year ended | Year ended | |||||||||||||||||||||
| October 31, | October 31, | |||||||||||||||||||||
| 2005 | 2004 | |||||||||||||||||||||
| Increase (Decrease) in Net Assets | ||||||||||||||||||||||
| Operations | ||||||||||||||||||||||
| Net investment income (loss) | $ | 7,893,648 | $ | 2,887,463 | ||||||||||||||||||
| Net realized gain (loss) | 80,741,934 | 67,679,530 | ||||||||||||||||||||
| Change in net unrealized appreciation (depreciation) | (10,249,032) | (16,298,996) | ||||||||||||||||||||
| Net increase (decrease) in net assets resulting from operations | 78,386,550 | 54,267,997 | ||||||||||||||||||||
| Distributions to shareholders from net investment income | (3,546,592) | (4,908,750) | ||||||||||||||||||||
| Distributions to shareholders from net realized gain | (1,251,738) | — | ||||||||||||||||||||
| Total distributions | (4,798,330) | (4,908,750) | ||||||||||||||||||||
| Share transactions | ||||||||||||||||||||||
| Proceeds from sales of shares | 110,398,063 | 89,528,778 | ||||||||||||||||||||
| Reinvestment of distributions | 4,494,786 | 4,561,606 | ||||||||||||||||||||
| Cost of shares redeemed | (103,075,461) | (130,168,755) | ||||||||||||||||||||
| Net increase (decrease) in net assets resulting from share transactions | 11,817,388 | (36,078,371) | ||||||||||||||||||||
| Redemption fees | 20,064 | 65,769 | ||||||||||||||||||||
| Total increase (decrease) in net assets | 85,425,672 | 13,346,645 | ||||||||||||||||||||
| Net Assets | ||||||||||||||||||||||
| Beginning of period | 407,361,892 | 394,015,247 | ||||||||||||||||||||
| End of period (including undistributed net investment income of $6,919,085 and undistributed net investment income | ||||||||||||||||||||||
| of $3,982,510, respectively) | $ | 492,787,564 | $ | 407,361,892 | ||||||||||||||||||
| Other Information | ||||||||||||||||||||||
| Shares | ||||||||||||||||||||||
| Sold | 4,991,864 | 4,555,418 | ||||||||||||||||||||
| Issued in reinvestment of distributions | 217,455 | 254,554 | ||||||||||||||||||||
| Redeemed | (4,674,623) | (6,880,267) | ||||||||||||||||||||
| Net increase (decrease) | 534,696 | (2,070,295) | ||||||||||||||||||||
| Financial Highlights | ||||||||||||||||||||||
| Years ended October 31, | 2005 | 2004 | 2003 | 2002 | 2001 | |||||||||||||||||
| Selected Per Share Data | ||||||||||||||||||||||
| Net asset value, beginning of period | $ | 19.63 | $ | 17.26 | $ 13.85 | $ | 15.43 | $ | 19.58 | |||||||||||||
| Income from Investment Operations | ||||||||||||||||||||||
| Net investment income (loss)C | 37 | .13F | .14 | .19 | .16 | |||||||||||||||||
| Net realized and unrealized gain (loss) | 3.38 | 2.46 | 3.46 | (1.60) | (3.33) | |||||||||||||||||
| Total from investment operations | 3.75 | 2.59 | 3.60 | (1.41) | (3.17) | |||||||||||||||||
| Distributions from net investment income | (.17) | (.22) | (.19) | (.17) | (.11) | |||||||||||||||||
| Distributions from net realized gain | (.06) | — | — | — | (.87) | |||||||||||||||||
| Total distributions | (.23) | (.22) | (.19) | (.17) | (.98) | |||||||||||||||||
| Redemption fees added to paid in capitalC,E | — | — | — | — | — | |||||||||||||||||
| Net asset value, end of period | $ | 23.15 | $ | 19.63 | $ 17.26 | $ | 13.85 | $ | 15.43 | |||||||||||||
| Total ReturnA,B | 19.24% | 15.13% | 26.36% | (9.29)% | (16.97)% | |||||||||||||||||
| Ratios to Average Net AssetsD | ||||||||||||||||||||||
| Expenses before expense reductions | 95% | 1.22% | 1.39% | 1.37% | 1.26% | |||||||||||||||||
| Expenses net of voluntary waivers, if any | 95% | 1.22% | 1.39% | 1.37% | 1.26% | |||||||||||||||||
| Expenses net of all reductions | 84% | 1.15% | 1.32% | 1.32% | 1.21% | |||||||||||||||||
| Net investment income (loss) | 1.66% | .69%F | .94% | 1.18% | .90% | |||||||||||||||||
| Supplemental Data | ||||||||||||||||||||||
| Net assets, end of period (000 omitted) | $ | 492,788 | $ | 407,362 | $ 394,015 | $ | 424,006 | $ | 406,771 | |||||||||||||
| Portfolio turnover rate | 133% | 119% | 184% | 121% | 67% | |||||||||||||||||
| ATotal returns would have been lower had certain expenses not been reduced during the periods shown. BTotal returns do not include the effect of the former sales charges. CCalculated based on average shares outstanding during the period. DExpense ratios reflect operating expenses of the fund. Expenses before reductions do not reflect amounts reimbursed by the investment adviser or reductions from brokerage service arrangements or other expense offset arrangements and do not represent the amount paid by the fund during periods when reimbursements or reductions occur. Expenses net of any voluntary waivers reflect expenses after reimbursement by the investment adviser but prior to reductions from brokerage service arrangements or other expense offset arrangements. Expenses net of all reductions represent the net expenses paid by the fund. EAmount represents less than $.01 per share. FNet investment income per share includes approximately $.01 per share received as a result of a reorganization of an issuer that was in bankruptcy. Excluding this non recurring amount, the ratio of net investment income to average net assets would have been .65%. |
See accompanying notes which are an integral part of the financial statements.
Annual Report A-44
| Japan |
| Performance: The Bottom Line |
Average annual total return reflects the change in the value of an investment, assuming reinvestment of the fund’s dividend income and capital gains (the profits earned upon the sale of securities that have grown in value) and assuming a constant rate of performance each year. The $10,000 table and the fund’s returns do not reflect the deduction of taxes that a shareholder would pay on fund distributions or the redemption of fund shares. During periods of reimbursement by Fidelity, a fund’s total returns will be greater than it would be had the reimbursement not occurred. How a fund did yesterday is no guarantee of how it will do tomorrow.
| Average Annual Total Returns | ||||||
| Periods ended | Past 1 | Past 5 | Past 10 | |||
| October 31, 2005 | year | years | years | |||
| Fidelity Japan Fund | 28.98% | 1.52% | 5.01% | |||
| $10,000 Over 10 Years | ||||||
Let’s say hypothetically that $10,000 was invested in Fidelity Japan Fund on October 31, 1995. The chart shows how the value of your invest ment would have changed, and also shows how the TOPIX performed over the same period.
![]()
| A-45 |
| Annual Report |
| Japan |
Management’s Discussion of Fund Performance
Comments from Yoko Ishibashi, Portfolio Manager of Fidelity® Japan Fund
Foreign stock markets enjoyed broad based advances during the 12 month period that ended October 31, 2005, encouraged by better than expected corporate earnings and markedly improved economies. For the 12 months overall, the Morgan Stanley Capital InternationalSM Europe, Australasia, Far East (MSCI® EAFE®) Index a performance measure of developed stock markets outside the United States and Canada gained 18.28% . The Japanese stock market climbed to its highest level in more than four years. Positive economic indicators and Prime Minister Koizumi’s decisive election victory attracted record inflows from overseas investors. In response, the Tokyo Stock Exchange Stock Price Index (TOPIX) soared 22.89% . Southeast Asian equities outside of Japan, particularly South Korea, also responded well to the better macroeconomic environment, illustrated by the 19.44% return for the MSCI All Country Far East ex Japan index. European stock markets were up as well, despite investors’ concern about higher energy prices and potential downgrades to economic growth in the region. For the year overall, the MSCI Europe index rose 16.51% .
During the past 12 months, the fund posted a return of 28.98%, well ahead of the TOPIX and the 25.18% return of the LipperSM Japanese Funds Average. The consumer discretionary and materials sectors were particularly beneficial to performance. Yamada Denki was the top contributor both in absolute terms and relative to the index. The consumer electronics retailer benefited from negotiating more favorable terms with suppliers due to its increased market share, growth in its fee based revenues for ancillary services such as installation, and providing its employees with effective sales training. The stocks of Toho Titanium and Sumitomo Titanium two of the world’s major suppliers of this metal both turned in outstanding performances. Strong demand for aircraft — an important end market for titanium — and plans for increasing the amount of the metal in new models drove these stocks much higher during the period. On the other hand, stock selection in the pharmaceuticals and biotechnology group provided a modest hindrance to relative performance. One holding from that industry that weighed down performance was Sankyo, which struggled due to the market’s unfavorable reaction to the terms of the company’s merger with rival Daiichi Pharmaceutical. A lack of exposure to the strongly performing stock of Mitsubishi Tokyo Financial Group also detracted from performance versus the benchmark. However, despite not owning this stock, the fund had roughly a market weighting in banks overall, and I overweighted several banks that performed even better than Mitsubishi Tokyo, so the net effect of the fund’s banking exposure was positive. Lastly, the fund’s absolute performance was muted by the depreciation of the Japanese yen versus the U.S. dollar during the period.
The views expressed in this statement reflect those of the portfolio manager only through the end of the period of the report as stated on the cover and do not necessarily represent the views of Fidelity or any other person in the Fidelity organization. Any such views are subject to change at any time based upon market or other conditions and Fidelity disclaims any responsibility to update such views. These views may not be relied on as invest ment advice and, because investment decisions for a Fidelity fund are based on numerous factors, may not be relied on as an indication of trading intent on behalf of any Fidelity fund.
| Annual Report |
| A-46 |
| Japan Investment Changes |
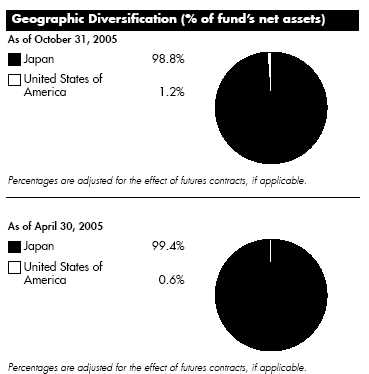
| Asset Allocation | ||||
| % of fund’s | % of fund’s net assets | |||
| net assets | 6 months ago | |||
| Stocks | 98.8 | 99.4 | ||
| Short Term Investments and | ||||
| Net Other Assets | 1.2 | 0.6 |
| Top Ten Stocks as of October 31, 2005 | ||||
| % of fund’s | % of fund’s net assets | |||
| net assets | 6 months ago | |||
| Sumitomo Mitsui Financial Group, | ||||
| Inc. (Commercial Banks) | 4.3 | 3.5 | ||
| Mizuho Financial Group, Inc. | ||||
| (Commercial Banks) | 3.8 | 3.2 | ||
| Yamada Denki Co. Ltd. (Specialty | ||||
| Retail) | 3.7 | 2.0 | ||
| Toyota Motor Corp. (Automobiles) | 3.1 | 2.8 | ||
| JGC Corp. (Construction & | ||||
| Engineering) | 3.0 | 2.5 | ||
| Matsushita Electric Industrial Co. | ||||
| Ltd. (Household Durables) | 2.8 | 1.1 | ||
| Seven & I Holdings Co. Ltd. (Food | ||||
| & Staples Retailing) | 2.7 | 0.0 | ||
| Sumitomo Metal Industries Ltd. | ||||
| (Metals & Mining) | 2.6 | 0.3 | ||
| Nippon Oil Corp. (Oil, Gas & | ||||
| Consumable Fuels) | 2.6 | 2.6 | ||
| The Daimaru, Inc. (Multiline Retail) | 2.6 | 2.3 | ||
| 31.2 | ||||
| Market Sectors as of October 31, 2005 | ||||
| % of fund’s | % of fund’s net assets | |||
| net assets | 6 months ago | |||
| Consumer Discretionary | 26.0 | 29.3 | ||
| Financials | 20.8 | 18.3 | ||
| Information Technology | 13.9 | 16.1 | ||
| Materials | 12.1 | 9.3 | ||
| Industrials | 8.7 | 10.0 | ||
| Energy | 7.2 | 5.3 | ||
| Consumer Staples | 5.5 | 5.6 | ||
| Health Care | 4.6 | 5.5 | ||
A-47 Annual Report
| Japan | ||||||
| Investments October 31, 2005 | ||||||
| Showing Percentage of Net Assets | ||||||
| Common Stocks 98.8% | ||||||
| Shares | Value (Note 1) | |||||
| CONSUMER DISCRETIONARY 26.0% | ||||||
| Auto Components – 0.6% | ||||||
| Riken Corp. | 634,000 | $ 4,205,757 | ||||
| Stanley Electric Co. Ltd. | 51,600 | 796,759 | ||||
| Tokai Rika Co. Ltd. | 82,700 | 1,890,757 | ||||
| 6,893,273 | ||||||
| Automobiles – 5.5% | ||||||
| Mazda Motor Corp. (d) | 5,432,000 | 25,684,942 | ||||
| Toyota Motor Corp. | 710,100 | 32,952,189 | ||||
| 58,637,131 | ||||||
| Diversified Consumer Services 0.4% | ||||||
| Benesse Corp. | 126,800 | 4,513,228 | ||||
| Household Durables 5.8% | ||||||
| Casio Computer Co. Ltd. | 1,479,400 | 22,420,735 | ||||
| Matsushita Electric Industrial Co. Ltd. | 1,635,000 | 30,083,999 | ||||
| Sekisui Chemical Co. Ltd. | 136,000 | 863,315 | ||||
| Sony Corp. | 154,300 | 5,061,040 | ||||
| Sumitomo Forestry Co. Ltd. | 431,000 | 3,997,541 | ||||
| 62,426,630 | ||||||
| Internet & Catalog Retail 0.3% | ||||||
| Rakuten, Inc. (d) | 4,775 | 3,117,963 | ||||
| Leisure Equipment & Products 1.3% | ||||||
| Sega Sammy Holdings, Inc. | 78,900 | 2,842,474 | ||||
| Sega Sammy Holdings, Inc. New | 301,900 | 10,954,772 | ||||
| 13,797,246 | ||||||
| Media 0.7% | ||||||
| cyber communications, Inc. (a)(d) | 2,283 | 5,812,720 | ||||
| Usen Corp. | 91,510 | 2,104,066 | ||||
| 7,916,786 | ||||||
| Multiline Retail – 2.6% | ||||||
| The Daimaru, Inc. | 2,283,000 | 27,916,875 | ||||
| Specialty Retail 6.6% | ||||||
| FT Communications Co. Ltd. (d) | 479 | 1,244,466 | ||||
| Otsuka Kagu Ltd. | 559,500 | 16,280,418 | ||||
| United Arrows Ltd. (d) | 247,300 | 13,235,452 | ||||
| Yamada Denki Co. Ltd. | 452,300 | 39,835,817 | ||||
| 70,596,153 | ||||||
| Textiles, Apparel & Luxury Goods 2.2% | ||||||
| Gunze Ltd. | 507,000 | 2,669,548 | ||||
| Onward Kashiyama Co. Ltd. | 951,000 | 15,236,262 | ||||
| Sanyo Shokai Ltd. | 909,000 | 6,077,254 | ||||
| 23,983,064 | ||||||
| TOTAL CONSUMER DISCRETIONARY | 279,798,349 | |||||
| Shares | Value (Note 1) | |||||
| CONSUMER STAPLES 5.5% | ||||||
| Food & Staples Retailing – 3.8% | ||||||
| Aeon Co. Ltd. | 590,900 | $ 12,281,500 | ||||
| Seven & I Holdings Co. Ltd. (a) | 866,100 | 28,502,163 | ||||
| 40,783,663 | ||||||
| Food Products – 0.7% | ||||||
| Hokuto Corp. (d) | 170,900 | 2,773,562 | ||||
| Kibun Food Chemifa Co. Ltd. | 213,900 | 5,186,746 | ||||
| 7,960,308 | ||||||
| Household Products – 0.7% | ||||||
| Kao Corp. | 56,000 | 1,345,790 | ||||
| Uni Charm Corp. | 126,800 | 5,765,072 | ||||
| 7,110,862 | ||||||
| Personal Products 0.3% | ||||||
| Fancl Corp. | 65,500 | 3,221,928 | ||||
| TOTAL CONSUMER STAPLES | 59,076,761 | |||||
| ENERGY 7.2% | ||||||
| Oil, Gas & Consumable Fuels 7.2% | ||||||
| INPEX Corp. | 2,457 | 17,362,870 | ||||
| Nippon Mining Holdings, Inc. | 2,462,000 | 18,187,092 | ||||
| Nippon Oil Corp. | 3,297,000 | 28,067,172 | ||||
| Teikoku Oil Co. Ltd. | 1,381,000 | 13,311,133 | ||||
| 76,928,267 | ||||||
| FINANCIALS 20.8% | ||||||
| Capital Markets 2.3% | ||||||
| Nikko Cordial Corp. | 1,120,000 | 13,579,139 | ||||
| Nomura Holdings, Inc. | 505,100 | 7,823,999 | ||||
| SMBC Friend Securities Co. Ltd. | 486,000 | 2,950,397 | ||||
| 24,353,535 | ||||||
| Commercial Banks – 10.8% | ||||||
| Juroku Bank Ltd. | 444,000 | 3,706,690 | ||||
| Mitsui Trust Holdings, Inc. | 823,000 | 9,935,479 | ||||
| Mizuho Financial Group, Inc. | 6,108 | 40,835,936 | ||||
| Nishi Nippon City Bank Ltd. | 300 | 1,751 | ||||
| Ogaki Kyoritsu Bank Ltd. | 380,000 | 2,412,203 | ||||
| Sumitomo Mitsui Financial Group, Inc. | . | 5,029 | 46,600,610 | |||
| The Keiyo Bank Ltd. | 1,120,000 | 8,428,766 | ||||
| Tokyo Tomin Bank Ltd. | 105,700 | 3,890,363 | ||||
| 115,811,798 | ||||||
| Consumer Finance – 3.1% | ||||||
| Credit Saison Co. Ltd. | 257,800 | 11,721,101 | ||||
| Nissin Co. Ltd. | 5,883,200 | 8,559,514 | ||||
| Nissin Co. Ltd. New | 4,741,400 | 6,816,177 | ||||
| OMC Card, Inc. (d) | 359,300 | 6,045,834 | ||||
| SFCG Co. Ltd. (d) | 1,420 | 342,975 | ||||
| 33,485,601 | ||||||
See accompanying notes which are an integral part of the financial statements.
Annual Report A-48
| Common Stocks continued | ||||
| Shares | Value (Note 1) | |||
| FINANCIALS – continued | ||||
| Insurance – 2.7% | ||||
| Sompo Japan Insurance, Inc | 1,162,000 | $ 17,509,815 | ||
| T&D Holdings, Inc. | 179,650 | 11,341,773 | ||
| 28,851,588 | ||||
| Real Estate 1.9% | ||||
| Mitsui Fudosan Co. Ltd. | 592,000 | 9,715,320 | ||
| Sumitomo Realty & Development Co. Ltd. | 676,000 | 10,947,488 | ||
| 20,662,808 | ||||
| TOTAL FINANCIALS | 223,165,330 | |||
| HEALTH CARE 4.6% | ||||
| Health Care Equipment & Supplies 0.9% | ||||
| Hogy Medical Co. (d) | 114,100 | 6,254,830 | ||
| Terumo Corp. | 101,400 | 3,082,274 | ||
| 9,337,104 | ||||
| Pharmaceuticals 3.7% | ||||
| Astellas Pharma, Inc. | 433,300 | 15,572,666 | ||
| Daiichi Sankyo Co. Ltd. (a) | 578,900 | 10,578,210 | ||
| Takeda Pharamaceutical Co. Ltd. | 245,200 | 13,505,286 | ||
| 39,656,162 | ||||
| TOTAL HEALTH CARE | 48,993,266 | |||
| INDUSTRIALS – 8.7% | ||||
| Building Products – 0.0% | ||||
| Toto Ltd. (d) | 18,000 | 138,580 | ||
| Construction & Engineering – 3.4% | ||||
| Chiyoda Corp. | 127,000 | 2,194,183 | ||
| JGC Corp. | 1,980,000 | 32,425,218 | ||
| Meisei Industrial Co. Ltd. (a) | 309,000 | 1,704,606 | ||
| 36,324,007 | ||||
| Machinery – 4.9% | ||||
| Koyo Seiko Co. Ltd. (d) | 972,000 | 15,640,051 | ||
| Mitsui Engineering & Shipbuilding | ||||
| Co. (d) | 7,903,000 | 19,026,678 | ||
| Miura Co. Ltd. | 65,400 | 1,526,380 | ||
| Nabtesco Corp. | 634,000 | 5,342,300 | ||
| Nikkiso Co. Ltd. | 951,000 | 6,127,448 | ||
| Shinmaywa Industries Ltd. | 803,000 | 4,819,200 | ||
| 52,482,057 | ||||
| Road & Rail 0.1% | ||||
| East Japan Railway Co | 315 | 1,882,287 | ||
| Transportation Infrastructure – 0.3% | ||||
| Mitsui Soko Co. Ltd. | 550,000 | 3,072,194 | ||
| TOTAL INDUSTRIALS | 93,899,125 | |||
| Shares | Value (Note 1) | |||
| INFORMATION TECHNOLOGY 13.9% | ||||
| Computers & Peripherals 0.8% | ||||
| Fujitsu Ltd. | 1,289,000 | $ 8,528,496 | ||
| Electronic Equipment & Instruments – 6.8% | ||||
| Hoya Corp. | 149,700 | 5,263,493 | ||
| Hoya Corp. New | 226,500 | 7,904,956 | ||
| Ibiden Co. Ltd. | 153,700 | 6,229,396 | ||
| Nidec Corp. | 49,200 | 2,893,084 | ||
| Nidec Corp. New | 39,600 | 2,328,580 | ||
| Nihon Dempa Kogyo Co. Ltd. | 152,200 | 4,402,378 | ||
| Nippon Electric Glass Co. Ltd. | 73,000 | 1,400,305 | ||
| Yamatake Corp. | 846,600 | 16,129,731 | ||
| Yaskawa Electric Corp. (a)(d) | 3,347,000 | 26,173,973 | ||
| Yokogawa Electric Corp. | 66,800 | 986,341 | ||
| 73,712,237 | ||||
| Internet Software & Services 4.3% | ||||
| Index Corp. New (d) | 3,043 | 3,425,875 | ||
| livedoor Co. Ltd. (a) | 1,328,299 | 4,888,898 | ||
| Softbank Corp. (d) | 236,700 | 13,426,591 | ||
| Telewave, Inc. (d) | 1,075 | 6,284,033 | ||
| Yahoo! Japan Corp | 11,144 | 11,870,593 | ||
| Yahoo! Japan Corp. New | 5,490 | 5,943,039 | ||
| 45,839,029 | ||||
| IT Services 2.0% | ||||
| ITOCHU TECHNO SCIENCE Corp. | ||||
| (CTC) (d) | 44,500 | 1,703,368 | ||
| NTT Data Corp. (d) | 2,769 | 9,663,939 | ||
| Otsuka Corp. | 112,000 | 9,912,772 | ||
| 21,280,079 | ||||
| Office Electronics – 0.0% | ||||
| Canon, Inc. | 11,700 | 620,919 | ||
| TOTAL INFORMATION TECHNOLOGY | 149,980,760 | |||
| MATERIALS 12.1% | ||||
| Chemicals 5.3% | ||||
| JSR Corp. | 88,800 | 2,103,277 | ||
| Mitsubishi Gas Chemical Co., Inc. | 2,174,000 | 14,854,661 | ||
| Nitto Denko Corp. | 35,900 | 2,179,409 | ||
| Teijin Ltd | 4,079,000 | 24,374,122 | ||
| Toho Tenax Co. Ltd. (a)(d) | 1,775,000 | 7,163,256 | ||
| Tokuyama Corp. (d) | 655,000 | 6,523,270 | ||
| 57,197,995 | ||||
| Metals & Mining – 6.8% | ||||
| Sumitomo Light Metal Industries Ltd. | 2,177,000 | 4,505,910 | ||
| Sumitomo Metal Industries Ltd. | 8,189,000 | 28,367,238 | ||
| Sumitomo Metal Mining Co. Ltd. | 2,959,000 | 27,009,203 | ||
| Sumitomo Titanium Corp. (d) | 16,400 | 1,903,158 | ||
See accompanying notes which are an integral part of the financial statements.
A-49 Annual Report
| Japan | ||||
| Investments - continued | ||||
| Common Stocks continued | ||||
| Shares | Value (Note 1) | |||
| MATERIALS – continued | ||||
| Metals & Mining – continued | ||||
| Sumitomo Titanium Corp. New (d) | 13,200 | $ 1,486,084 | ||
| Toho Titanium Co. Ltd. (d) | 152,200 | 10,215,098 | ||
| 73,486,691 | ||||
| TOTAL MATERIALS | 130,684,686 | |||
| TOTAL COMMON STOCKS | ||||
| (Cost $868,552,608) | 1,062,526,544 | |||
| Money Market Funds 9.7% | ||||
| Fidelity Cash Central Fund, | ||||
| 3.92% (b) | 17,709,504 | 17,709,504 | ||
| Fidelity Securities Lending Cash | ||||
| Central Fund, 3.94% (b)(c) | 86,487,371 | 86,487,371 | ||
| TOTAL MONEY MARKET FUNDS | ||||
| (Cost $104,196,875) | 104,196,875 | |||
| TOTAL INVESTMENT PORTFOLIO 108.5% | ||||
| (Cost $972,749,483) | 1,166,723,419 | |||
| NET OTHER ASSETS (8.5)% | (91,577,975) | |||
| NET ASSETS 100% | $ 1,075,145,444 | |||
| Legend (a) Non-income producing (b) Affiliated fund that is available only to investment companies and other accounts managed by Fidelity Investments. The rate quoted is the annualized seven-day yield of the fund at period end. A complete unaudited listing of the fund’s holdings as of its most recent quarter end is available upon request. (c) Investment made with cash collateral received from securities on loan. (d) Security or a portion of the security is on loan at period end. |
Income Tax Information
At October 31, 2005, the fund had a capital loss carryforward of approximately $37,999,714 of which $25,588,401 and $12,411,313 will expire on October 31, 2010 and 2011, respectively.
See accompanying notes which are an integral part of the financial statements.
Annual Report A-50
| Japan | ||||
| Financial Statements | ||||
| Statement of Assets and Liabilities | ||||
| October 31, 2005 | ||||
| Assets | ||||
| Investment in securities, at value | ||||
| (including securities loaned of | ||||
| $82,117,061) (cost | ||||
| $972,749,483) — See accom- | ||||
| panying schedule | $1,166,723,419 | |||
| Receivable for investments sold | 9,711,744 | |||
| Receivable for fund shares sold | 7,102,112 | |||
| Dividends receivable | 2,291,676 | |||
| Interest receivable | 66,577 | |||
| Other affiliated receivables | 3,869 | |||
| Other receivables | 128,593 | |||
| Total assets | 1,186,027,990 | |||
| Liabilities | ||||
| Payable for investments purchased $ | 23,012,613 | |||
| Payable for fund shares redeemed | 449,877 | |||
| Accrued management fee | 590,452 | |||
| Other affiliated payables | 220,214 | |||
| Other payables and accrued | ||||
| expenses | 122,019 | |||
| Collateral on securities loaned, at | ||||
| value | 86,487,371 | |||
| Total liabilities | 110,882,546 | |||
| Net Assets | $ 1,075,145,444 | |||
| Net Assets consist of: | ||||
| Paid in capital | $ 917,492,162 | |||
| Undistributed net investment in- | ||||
| come | 1,531,765 | |||
| Accumulated undistributed net | ||||
| realized gain (loss) on invest- | ||||
| ments and foreign currency | ||||
| transactions | (37,745,538) | |||
| Net unrealized appreciation (de- | ||||
| preciation) on investments and | ||||
| assets and liabilities in foreign | ||||
| currencies | 193,867,055 | |||
| Net Assets, for 71,690,451 | ||||
| shares outstanding | $ 1,075,145,444 | |||
| Net Asset Value, offering price | ||||
| and redemption price per share | ||||
| ($1,075,145,444 ÷ | ||||
| 71,690,451 shares) | $ 15.00 | |||
| Statement of Operations | ||||||
| Year ended October 31, 2005 | ||||||
| Investment Income | ||||||
| Dividends | $ | 8,230,995 | ||||
| Interest | 270,968 | |||||
| Security lending | 1,319,153 | |||||
| 9,821,116 | ||||||
| Less foreign taxes withheld | (576,170) | |||||
| Total income | 9,244,946 | |||||
| Expenses | ||||||
| Management fee | ||||||
| Basic fee | $ | 5,447,556 | ||||
| Performance adjustment | (220,812) | |||||
| Transfer agent fees | 1,812,198 | |||||
| Accounting and security lending | ||||||
| fees | 371,810 | |||||
| Independent trustees’ | ||||||
| compensation | 3,546 | |||||
| Custodian fees and expenses | 260,405 | |||||
| Registration fees | 54,508 | |||||
| Audit | 61,256 | |||||
| Legal | 1,453 | |||||
| Miscellaneous | 11,359 | |||||
| Total expenses before reductions | 7,803,279 | |||||
| Expense reductions | (91,116) | 7,712,163 | ||||
| Net investment income (loss) | 1,532,783 | |||||
| Realized and Unrealized Gain | ||||||
| (Loss) | ||||||
| Net realized gain (loss) on: | ||||||
| Investment securities | 36,250,620 | |||||
| Foreign currency transactions | (195,886) | |||||
| Total net realized gain (loss) | 36,054,734 | |||||
| Change in net unrealized appreci- | ||||||
| ation (depreciation) on: | ||||||
| Investment securities | 164,127,129 | |||||
| Assets and liabilities in foreign | ||||||
| currencies | (183,641) | |||||
| Total change in net unrealized | ||||||
| appreciation (depreciation) | 163,943,488 | |||||
| Net gain (loss) | 199,998,222 | |||||
| Net increase (decrease) in net as- | ||||||
| sets resulting from operations . | $ | 201,531,005 | ||||
See accompanying notes which are an integral part of the financial statements.
A-51 Annual Report
| Japan | ||||||||||||||||||||||
| Financial Statements - continued | ||||||||||||||||||||||
| Statement of Changes in Net Assets | ||||||||||||||||||||||
| Year ended | Year ended | |||||||||||||||||||||
| October 31, | October 31, | |||||||||||||||||||||
| 2005 | 2004 | |||||||||||||||||||||
| Increase (Decrease) in Net Assets | ||||||||||||||||||||||
| Operations | ||||||||||||||||||||||
| Net investment income (loss) | $ | 1,532,783 | $ | (269,566) | ||||||||||||||||||
| Net realized gain (loss) | 36,054,734 | 78,492,003 | ||||||||||||||||||||
| Change in net unrealized appreciation (depreciation) | 163,943,488 | (67,333,484) | ||||||||||||||||||||
| Net increase (decrease) in net assets resulting from operations | 201,531,005 | 10,888,953 | ||||||||||||||||||||
| Distributions to shareholders from net investment income | — | (461,710) | ||||||||||||||||||||
| Share transactions | ||||||||||||||||||||||
| Proceeds from sales of shares | 367,814,312 | 285,965,451 | ||||||||||||||||||||
| Reinvestment of distributions | — | 397,157 | ||||||||||||||||||||
| Cost of shares redeemed | (141,878,515) | (179,346,914) | ||||||||||||||||||||
| Net increase (decrease) in net assets resulting from share transactions | 225,935,797 | 107,015,694 | ||||||||||||||||||||
| Redemption fees | 225,720 | 658,140 | ||||||||||||||||||||
| Total increase (decrease) in net assets | 427,692,522 | 118,101,077 | ||||||||||||||||||||
| Net Assets | ||||||||||||||||||||||
| Beginning of period | 647,452,922 | 529,351,845 | ||||||||||||||||||||
| End of period (including undistributed net investment income of $1,531,765 and accumulated net investment loss of | ||||||||||||||||||||||
| $826,233, respectively) | $ 1,075,145,444 | $ | 647,452,922 | |||||||||||||||||||
| Other Information | ||||||||||||||||||||||
| Shares | ||||||||||||||||||||||
| Sold | 27,168,421 | 23,920,101 | ||||||||||||||||||||
| Issued in reinvestment of distributions | — | 35,942 | ||||||||||||||||||||
| Redeemed | (11,129,707) | (15,630,288) | ||||||||||||||||||||
| Net increase (decrease) | 16,038,714 | 8,325,755 | ||||||||||||||||||||
| Financial Highlights | ||||||||||||||||||||||
| Years ended October 31, | 2005 | 2004 | 2003 | 2002 | 2001 | |||||||||||||||||
| Selected Per Share Data | ||||||||||||||||||||||
| Net asset value, beginning of period | $ | 11.63 | $ 11.19 | $ | 8.25 | $ | 9.67 | $ | 20.43 | |||||||||||||
| Income from Investment Operations | ||||||||||||||||||||||
| Net investment income (loss)C | 03 | (.01) | —E | (.07) | (.07) | |||||||||||||||||
| Net realized and unrealized gain (loss) | 3.34 | .45 | 2.93 | (1.37) | (6.64) | |||||||||||||||||
| Total from investment operations | 3.37 | .44 | 2.93 | (1.44) | (6.71) | |||||||||||||||||
| Distributions from net investment income | — | (.01) | — | — | — | |||||||||||||||||
| Distributions from net realized gain | — | — | — | (4.07) | ||||||||||||||||||
| Total distributions | — | (.01) | — | (4.07) | ||||||||||||||||||
| Redemption fees added to paid in capitalC | —E | .01 | .01 | .02 | .02 | |||||||||||||||||
| Net asset value, end of period | $ | 15.00 | $ 11.63 | $ | 11.19 | $ | 8.25 | $ | 9.67 | |||||||||||||
| Total ReturnA,B | 28.98% | 4.03% | 35.64% | (14.68)% | (40.35)% | |||||||||||||||||
| Ratios to Average Net AssetsD | ||||||||||||||||||||||
| Expenses before expense reductions | 1.03% | 1.04% | 1.03% | 1.50% | 1.42% | |||||||||||||||||
| Expenses net of voluntary waivers, if any | 1.03% | 1.04% | 1.03% | 1.50% | 1.42% | |||||||||||||||||
| Expenses net of all reductions | 1.02% | 1.04% | 1.03% | 1.50% | 1.40% | |||||||||||||||||
| Net investment income (loss) | 20% | (.04)% | (.04)% | (.77)% | (.57)% | |||||||||||||||||
| Supplemental Data | ||||||||||||||||||||||
| Net assets, end of period (000 omitted) | $ | 1,075,145 | $ 647,453 | $ | 529,352 | $ | 283,293 | $ | 322,936 | |||||||||||||
| Portfolio turnover rate | 74% | 99% | 86% | 66% | 75% | |||||||||||||||||
| ATotal returns would have been lower had certain expenses not been reduced during the periods shown. BTotal returns do not include the effect of the former sales charges. CCalculated based on average shares outstanding during the period. DExpense ratios reflect operating expenses of the fund. Expenses before reductions do not reflect amounts reimbursed by the investment adviser or reductions from brokerage service arrangements or other expense offset arrangements and do not represent the amount paid by the fund during periods when reimbursements or reductions occur. Expenses net of any voluntary waivers reflect expenses after reimbursement by the investment adviser but prior to reductions from brokerage service arrangements or other expense offset arrangements. Expenses net of all reductions represent the net expenses paid by the fund. EAmount represents less than $.01 per share. |
See accompanying notes which are an integral part of the financial statements.
Annual Report A-52
| Japan Smaller Companies Performance: The Bottom Line |
Average annual total return reflects the change in the value of an investment, assuming reinvestment of the fund’s dividend income and capital gains (the profits earned upon the sale of securities that have grown in value) and assuming a constant rate of performance each year. The $10,000 table and the fund’s returns do not reflect the deduction of taxes that a shareholder would pay on fund distributions or the redemption of fund shares. During periods of reimbursement by Fidelity, a fund’s total returns will be greater than it would be had the reimbursement not occurred. How a fund did yesterday is no guarantee of how it will do tomorrow.
| Average Annual Total Returns | ||||||
| Periods ended | Past 1 | Past 5 | Life of | |||
| October 31, 2005 | year | years | FundA | |||
| Fidelity Japan Smaller Companies Fund | 23.69% | 8.80% | 8.21% | |||
| A From November 1, 1995. | ||||||
| $10,000 Over Life of Fund | ||||||
Let’s say hypothetically that $10,000 was invested in Fidelity Japan Smaller Companies Fund on November 1, 1995, when the fund started. The chart shows how the value of your investment would have changed, and also shows how the Russell/Nomura Small Cap Index performed over the same period.
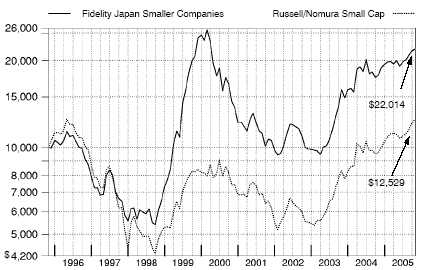
| A-53 |
| Annual Report |
| Japan Smaller Companies |
Management’s Discussion of Fund Performance
Comments from Kenichi Mizushita, Portfolio Manager of Fidelity® Japan Smaller Companies Fund
Foreign stock markets enjoyed broad based advances during the 12 month period that ended October 31, 2005, encouraged by better than expected corporate earnings and markedly improved economies. For the 12 months overall, the Morgan Stanley Capital InternationalSM Europe, Australasia, Far East (MSCI® EAFE®) Index a performance measure of developed stock markets outside the United States and Canada gained 18.28% . The Japanese stock market climbed to its highest level in more than four years. Positive economic indicators and Prime Minister Koizumi’s decisive election victory attracted record inflows from overseas investors. In response, the Tokyo Stock Exchange Stock Price Index (TOPIX) soared 22.89% . Southeast Asian equities outside of Japan, particularly South Korea, also responded well to the better macroeconomic environment, illustrated by the 19.44% return for the MSCI All Country Far East ex Japan index. European stock markets were up as well, despite investors’ concern about higher energy prices and potential downgrades to economic growth in the region. For the year overall, the MSCI Europe index rose 16.51% . Although robust, returns for U.S. investors in foreign markets were tempered by the strength of the dollar versus many major currencies.
The fund returned 23.69% during the 12 month period, trailing the Russell/Nomura Small CapTM Index, which was up 30.29%, and the LipperSM Japa nese Funds Average, which rose 25.18% . An overweighting in information technology (IT), which returned less than the benchmark, and an under weighting in the financials sector, which returned more than the benchmark, detracted from performance relative to the index. Poor stock selection in the consumer discretionary and industrials sectors also were factors in the fund’s relative shortfall. Conversely, good stock picking in materials, health care and energy helped boost performance. Stocks that detracted from results included communication and information equipment distributor Nexus, which disappointed investors with a net loss for the first half of fiscal 2005. Japan’s leading used car auctioneer, USS, saw its share price fall amid investor concerns about its results for the 2004/05 financial year. On the plus side, Telewave, a vendor of IT equipment for small companies, was well positioned to benefit from increasing capital spending on IT infrastructure. Electronic parts maker Ibiden’s stock performance was driven by stronger than expected earnings growth.
The views expressed in this statement reflect those of the portfolio manager only through the end of the period of the report as stated on the cover and do not necessarily represent the views of Fidelity or any other person in the Fidelity organization. Any such views are subject to change at any time based upon market or other conditions and Fidelity disclaims any responsibility to update such views. These views may not be relied on as invest ment advice and, because investment decisions for a Fidelity fund are based on numerous factors, may not be relied on as an indication of trading intent on behalf of any Fidelity fund.
| Annual Report |
| A-54 |
| Japan Smaller Companies Investment Changes |
| Asset Allocation | ||||
| % of fund’s | % of fund’s net assets | |||
| net assets | 6 months ago | |||
| Stocks | 96.3 | 97.9 | ||
| Short Term Investments and | ||||
| Net Other Assets | 3.7 | 2.1 |
| Top Ten Stocks as of October 31, 2005 | ||||
| % of fund’s | % of fund’s net assets | |||
| net assets | 6 months ago | |||
| Ibiden Co. Ltd. (Electronic | ||||
| Equipment & Instruments) | 2.2 | 0.8 | ||
| Rex Holdings Co. Ltd. (Hotels, | ||||
| Restaurants & Leisure) | 2.2 | 2.2 | ||
| Hikari Tsushin, Inc. (Specialty | ||||
| Retail) | 2.0 | 2.5 | ||
| Telewave, Inc. (Internet Software & | ||||
| Services) | 1.9 | 1.8 | ||
| USS Co. Ltd. (Specialty Retail) | 1.8 | 2.7 | ||
| Yamada Denki Co. Ltd. (Specialty | ||||
| Retail) | 1.7 | 1.1 | ||
| Nippon Electric Glass Co. Ltd. | ||||
| (Electronic Equipment & | ||||
| Instruments) | 1.7 | 2.3 | ||
| livedoor Co. Ltd. (Internet | ||||
| Software & Services) | 1.5 | 0.9 | ||
| Usen Corp. (Media) | 1.5 | 1.7 | ||
| Teikoku Oil Co. Ltd. (Oil, Gas & | ||||
| Consumable Fuels) | 1.4 | 1.3 | ||
| 17.9 | ||||
| Market Sectors as of October 31, 2005 | ||||
| % of fund’s | % of fund’s net assets | |||
| net assets | 6 months ago | |||
| Information Technology | 23.1 | 25.5 | ||
| Consumer Discretionary | 22.5 | 23.9 | ||
| Industrials | 21.0 | 21.2 | ||
| Financials | 11.4 | 7.1 | ||
| Materials | 9.6 | 10.0 | ||
| Consumer Staples | 3.5 | 4.4 | ||
| Health Care | 3.0 | 3.9 | ||
| Energy | 1.8 | 1.6 | ||
| Telecommunication Services | 0.4 | 0.3 | ||
A-55 Annual Report
| Japan Smaller Companies | ||||||
| Investments October 31, 2005 | ||||||
| Showing Percentage of Net Assets | ||||||
| Common Stocks 96.3% | ||||||
| Shares | Value (Note 1) | |||||
| CONSUMER DISCRETIONARY 22.5% | ||||||
| Auto Components – 3.7% | ||||||
| Aisin Seiki Co. Ltd. | 460,200 | $ 13,869,220 | ||||
| Alpha Corp. (d) | 76,000 | 2,856,469 | ||||
| Daido Metal Co. Ltd. | 400,000 | 4,087,598 | ||||
| Fine Sinter Co. Ltd. | 458,000 | 1,963,346 | ||||
| Fuji Kiko Co. Ltd. (d) | 1,114,000 | 4,100,155 | ||||
| NHK Spring Co. Ltd. (d) | 1,252,000 | 9,866,700 | ||||
| Nissin Kogyo Co. Ltd. | 63,700 | 2,857,560 | ||||
| NOK Corp. | 327,300 | 9,892,308 | ||||
| Teikoku Piston Ring Co. Ltd. (d) | 204,300 | 3,128,073 | ||||
| 52,621,429 | ||||||
| Diversified Consumer Services 2.3% | ||||||
| Best Bridal, Inc. | 255 | 4,394,601 | ||||
| Studio Alice Co. Ltd. (d) | 372,000 | 8,037,846 | ||||
| Take & Give Needs Co. Ltd. (a) | 14,000 | 19,641,255 | ||||
| 32,073,702 | ||||||
| Hotels, Restaurants & Leisure 3.5% | ||||||
| Create Restaurants, Inc. | 12,300 | 623,142 | ||||
| H.I.S. Co. Ltd. | 257,800 | 5,525,662 | ||||
| Rex Holdings Co. Ltd. | 4,608 | 30,368,498 | ||||
| Tascosystem Co. Ltd. (a)(d) | 500 | 489,299 | ||||
| Tenpo Ryutsuu Net, Inc. (d) | 59 | 194,672 | ||||
| Zensho Co. Ltd. (d) | 360,500 | 6,081,636 | ||||
| Zensho Co. Ltd. New (a)(d) | 360,500 | 6,081,636 | ||||
| 49,364,545 | ||||||
| Household Durables 0.0% | ||||||
| Hitachi Koki Co. Ltd. | 21,000 | 286,435 | ||||
| Internet & Catalog Retail 0.2% | ||||||
| Prime Network, Inc. | 2,108 | 2,647,066 | ||||
| Leisure Equipment & Products 0.4% | ||||||
| Endo Manufacturing Co. Ltd. | 346,000 | 3,490,826 | ||||
| Kimoto Co. Ltd. | 165,700 | 1,657,413 | ||||
| 5,148,239 | ||||||
| Media 3.6% | ||||||
| Cyber Agent Ltd. (d) | 2,804 | 5,050,886 | ||||
| Cyber Agent Ltd. New (d) | 2,804 | 5,050,886 | ||||
| cyber communications, Inc. (a)(d) | 1,168 | 2,973,832 | ||||
| Gendai Agency, Inc. | 469 | 1,811,481 | ||||
| Opt, Inc. (a)(d) | 2,424 | 9,257,578 | ||||
| Usen Corp. (d) | 932,550 | 21,441,879 | ||||
| Zenrin Co. Ltd. | 203,000 | 5,449,842 | ||||
| 51,036,384 | ||||||
| Specialty Retail 8.3% | ||||||
| Arc Land Sakamoto Co. Ltd. | 432,000 | 7,594,619 | ||||
| Culture Convenience Club Co. Ltd. (d) | 302,400 | 8,773,094 | ||||
| FT Communications Co. Ltd. (d) | 565 | 1,467,898 | ||||
| Hikari Tsushin, Inc. (d) | 450,000 | 28,955,263 | ||||
| Meganesuper Co. Ltd. | 281,200 | 3,842,806 | ||||
| Nihon Optical Co. Ltd. | 93,000 | 877,881 | ||||
| Nishimatsuya Chain Co. Ltd. | 427,900 | 16,305,013 | ||||
| Shares | Value (Note 1) | |||
| USS Co. Ltd. | 365,860 | $ 25,220,529 | ||
| Yamada Denki Co. Ltd. | 275,800 | 24,290,777 | ||
| 117,327,880 | ||||
| Textiles, Apparel & Luxury Goods 0.5% | ||||
| Seiren Co. Ltd. (d) | 536,000 | 6,498,588 | ||
| Workman Co. Ltd. | 300 | 9,093 | ||
| 6,507,681 | ||||
| TOTAL CONSUMER DISCRETIONARY | 317,013,361 | |||
| CONSUMER STAPLES 3.5% | ||||
| Food & Staples Retailing – 2.0% | ||||
| Cosmos Pharmaceutical Corp. | 200,000 | 7,811,469 | ||
| Itochushokuhin Co. Ltd. (d) | 50,200 | 1,712,877 | ||
| Kirindo Co. Ltd. (d) | 97,900 | 1,033,505 | ||
| Kraft, Inc. | 85,500 | 1,806,684 | ||
| Nihon Chouzai Co. Ltd. | 150,200 | 4,630,694 | ||
| Plant Co. Ltd. | 29,700 | 262,865 | ||
| Valor Co. Ltd. (d) | 341,160 | 10,340,757 | ||
| 27,598,851 | ||||
| Food Products – 1.3% | ||||
| Frente Co. Ltd. | 90,100 | 3,901,405 | ||
| Hokuto Corp. (d) | 320,000 | 5,193,328 | ||
| Kibun Food Chemifa Co. Ltd. | 350,000 | 8,486,962 | ||
| Warabeya Nichiyo Co. Ltd. (d) | 65,000 | 936,684 | ||
| 18,518,379 | ||||
| Personal Products 0.2% | ||||
| Fancl Corp. | 63,600 | 3,128,467 | ||
| TOTAL CONSUMER STAPLES | 49,245,697 | |||
| ENERGY 1.8% | ||||
| Energy Equipment & Services – 0.2% | ||||
| Modec, Inc. (d) | 79,100 | 2,233,162 | ||
| Oil, Gas & Consumable Fuels 1.6% | ||||
| Japan Petroleum Exploration Co. Ltd. (d) | 50,200 | 2,499,757 | ||
| Teikoku Oil Co. Ltd. | 2,109,000 | 20,328,154 | ||
| 22,827,911 | ||||
| TOTAL ENERGY | 25,061,073 | |||
| FINANCIALS 11.4% | ||||
| Capital Markets 3.2% | ||||
| E*TRADE Securities Co. Ltd. (d) | 3,473 | 18,256,590 | ||
| Matsui Securities Co. Ltd. (d) | 519,000 | 5,780,089 | ||
| SBI Holdings, Inc. (d) | 30,000 | 14,990,746 | ||
| SMBC Friend Securities Co. Ltd. | 1,083,000 | 6,574,650 | ||
| 45,602,075 | ||||
| Commercial Banks – 4.9% | ||||
| Bank of Yokohama Ltd. | 1,361,000 | 11,126,442 | ||
| Chiba Bank Ltd. | 872,000 | 7,785,766 | ||
| Hachijuni Bank Ltd. | 341,000 | 2,873,382 | ||
See accompanying notes which are an integral part of the financial statements.
Annual Report A-56
| Common Stocks continued | ||||||
| Shares | Value (Note 1) | |||||
| FINANCIALS – continued | ||||||
| Commercial Banks – continued | ||||||
| Higashi Nippon Bank Ltd. | 242,000 | $ 1,527,809 | ||||
| Hokuhoku Financial Group, Inc. | 750,000 | 3,111,164 | ||||
| Joyo Bank Ltd. | 652,000 | 4,370,335 | ||||
| Juroku Bank Ltd. | 582,000 | 4,858,769 | ||||
| Kyushu Shinwa Holdings, Inc. (a) | 22,000 | 60,205 | ||||
| Mitsui Trust Holdings, Inc. | 1,222,000 | 14,752,315 | ||||
| The Keiyo Bank Ltd. | 1,405,000 | 10,573,586 | ||||
| Tokyo Tomin Bank Ltd. (d) | 206,300 | 7,593,017 | ||||
| 68,632,790 | ||||||
| Consumer Finance – 0.3% | ||||||
| Credit Saison Co. Ltd. | 82,100 | 3,732,748 | ||||
| Real Estate 3.0% | ||||||
| Apamanshop Network Co. Ltd. (d) | 2,869 | 3,925,671 | ||||
| Kenedix, Inc. | 3,248 | 13,332,775 | ||||
| KK daVinci Advisors (a)(d) | 3,320 | 15,669,703 | ||||
| Urban Corp. | 94,500 | 5,876,009 | ||||
| Yasuragi Co. Ltd. (a) | 102,200 | 3,451,769 | ||||
| 42,255,927 | ||||||
| TOTAL FINANCIALS | 160,223,540 | |||||
| HEALTH CARE 3.0% | ||||||
| Health Care Equipment & Supplies 2.1% | ||||||
| Asahi Intecc Co. Ltd. (d) | 84,600 | 2,022,114 | ||||
| Hogy Medical Co. | 320,700 | 17,580,404 | ||||
| Nakanishi, Inc. (d) | 40,800 | 5,370,688 | ||||
| Sysmex Corp. | 58,200 | 2,318,499 | ||||
| Sysmex Corp. New | 58,200 | 2,318,499 | ||||
| 29,610,204 | ||||||
| Health Care Providers & Services 0.4% | ||||||
| Soiken, Inc. (d) | 176 | 595,958 | ||||
| Tokai Corp. | 298,700 | 5,095,979 | ||||
| 5,691,937 | ||||||
| Pharmaceuticals 0.5% | ||||||
| Sawai Pharmaceutical Co. Ltd. (d) | 188,100 | 7,232,658 | ||||
| TOTAL HEALTH CARE | 42,534,799 | |||||
| INDUSTRIALS – 21.0% | ||||||
| Air Freight & Logistics – 0.8% | ||||||
| Kintetsu World Express, Inc. (d) | 253,800 | 5,494,875 | ||||
| Yusen Air & Sea Service Co. Ltd. | 153,500 | 5,888,956 | ||||
| 11,383,831 | ||||||
| Building Products – 0.4% | ||||||
| Comany, Inc. | 157,700 | 2,813,359 | ||||
| Wavelock Holdings Co. Ltd. (d) | 282,500 | 2,899,099 | ||||
| 5,712,458 | ||||||
| Commercial Services & Supplies 5.5% | ||||||
| ARRK Corp. (d) | 328,700 | 18,246,683 | ||||
| Shares | Value (Note 1) | |||||||
| Career Design Center Co. Ltd. (d) | 1,300 | $ | 3,884,084 | |||||
| Career Design Center Co. Ltd. New (a) | . | 1,300 | 3,884,084 | |||||
| Certo Corp. | 76,500 | 2,451,260 | ||||||
| Fullcast Co. Ltd. | 1,049 | 2,707,185 | ||||||
| Gakujo Co. Ltd. | 24,700 | 776,479 | ||||||
| Gakujo Co. Ltd. New (a) | 24,700 | 776,479 | ||||||
| Ichinen Co. Ltd. | 696,000 | 5,020,887 | ||||||
| Intelligence Ltd. (d) | 2,975 | 5,899,954 | ||||||
| J Bridge Corp. (a)(d) | 674,300 | 10,762,290 | ||||||
| Nac Co. Ltd. (d) | 170,000 | 2,695,650 | ||||||
| Nisca Corp. | 10,000 | 165,409 | ||||||
| Prestige International, Inc. (a) | 2,457 | 5,745,067 | ||||||
| Relo Holdings Corp. (d) | 301,600 | 4,492,478 | ||||||
| TFP Consulting Group Co. Ltd. (d) | 496 | 1,640,859 | ||||||
| TFP Consulting Group Co. Ltd. New (d) | . | 496 | 1,640,859 | |||||
| The First Energy Service Co. Ltd. (d) | 352 | 1,228,496 | ||||||
| The First Energy Service Co. Ltd. New (d) | 1,408 | 4,913,986 | ||||||
| 76,932,189 | ||||||||
| Construction & Engineering – 3.6% | ||||||||
| Chiyoda Corp. | 809,000 | 13,977,117 | ||||||
| COMSYS Holdings Corp. (d) | 867,000 | 9,798,414 | ||||||
| Kyowa Exeo Corp. (d) | 857,000 | 8,119,407 | ||||||
| Token Corp. (d) | 409,900 | 19,452,914 | ||||||
| 51,347,852 | ||||||||
| Electrical Equipment 1.1% | ||||||||
| Chiyoda Integre Co. Ltd. | 272,000 | 6,901,805 | ||||||
| Endo Lighting Corp. | 523,000 | 6,114,510 | ||||||
| Iwabuchi Corp | 247,000 | 1,677,024 | ||||||
| Sansha Electric Manufacturing Co. Ltd. | . | 114,000 | 545,954 | |||||
| 15,239,293 | ||||||||
| Machinery – 5.8% | ||||||||
| Daifuku Co. Ltd. | 250,000 | 3,297,358 | ||||||
| Fuji Seiko Ltd. | 88,000 | 663,022 | ||||||
| Hitachi Construction Machinery Co. Ltd. | 100,800 | 1,920,478 | ||||||
| Koyo Seiko Co. Ltd. | 841,000 | 13,532,184 | ||||||
| Micron Machinery Co. Ltd. | 100,000 | 3,542,008 | ||||||
| NGK Insulators Ltd. | 409,000 | 4,891,513 | ||||||
| Nihon Ceratec Co. Ltd. (d) | 681 | 2,819,040 | ||||||
| Nihon Trim Co. Ltd. (d) | 62,700 | 3,377,413 | ||||||
| Nitta Corp. | 555,300 | 7,516,451 | ||||||
| NTN Corp. | 892,000 | 6,064,021 | ||||||
| Obara Corp. (d) | 81,000 | 2,342,921 | ||||||
| Obara Corp. New (d) | 40,500 | 1,171,461 | ||||||
| OSG Corp. | 654,800 | 11,301,658 | ||||||
| Sumitomo Heavy Industries Ltd. | 1,000,000 | 7,014,734 | ||||||
| THK Co. Ltd. | 535,000 | 12,092,622 | ||||||
| 81,546,884 | ||||||||
| Marine – 0.6% | ||||||||
| Mitsui O.S.K. Lines Ltd. | 1,136,000 | 8,027,766 | ||||||
See accompanying notes which are an integral part of the financial statements.
A-57 Annual Report
| Japan Smaller Companies | ||||||
| Investments - continued | ||||||
| Common Stocks continued | ||||||
| Shares | Value (Note 1) | |||||
| INDUSTRIALS – continued | ||||||
| Road & Rail 0.8% | ||||||
| Hamakyorex Co. Ltd. (d) | 228,000 | $ 8,253,484 | ||||
| Zero Co. Ltd. | 97,300 | 2,949,219 | ||||
| 11,202,703 | ||||||
| Trading Companies & Distributors – 2.4% | ||||||
| Itochu Corp. | 2,408,000 | 16,516,113 | ||||
| Marubeni Corp. | 3,550,000 | 16,663,024 | ||||
| Parker Corp. | 51,000 | 525,585 | ||||
| 33,704,722 | ||||||
| TOTAL INDUSTRIALS | 295,097,698 | |||||
| INFORMATION TECHNOLOGY 23.1% | ||||||
| Communications Equipment – 0.4% | ||||||
| Allied Telesis Holdings KK (d) | 400,000 | 2,324,388 | ||||
| NextCom KK (d) | 550 | 666,833 | ||||
| NextCom KK New | 1,650 | 1,971,920 | ||||
| Tamura Taiko Holdings, Inc. | 156,000 | 1,047,014 | ||||
| 6,010,155 | ||||||
| Computers & Peripherals 1.1% | ||||||
| Meiko Electronics Co. Ltd. (d) | 370,900 | 15,963,915 | ||||
| Electronic Equipment & Instruments – 8.8% | ||||||
| A&D Co. Ltd. | 127,400 | 1,892,168 | ||||
| Excel Co. Ltd. | 166,400 | 3,710,708 | ||||
| Forval Corp. | 390,000 | 4,161,036 | ||||
| Hamamatsu Photonics KK (d) | 546,000 | 12,695,889 | ||||
| Honda Tsushin Kogyo Co. Ltd. | 276,600 | 1,985,788 | ||||
| Ibiden Co. Ltd. (d) | 768,800 | 31,159,145 | ||||
| Iriso Electronics Co. Ltd. | 11,800 | 337,227 | ||||
| KAGA ELECTRONICS Co. Ltd. | 517,500 | 13,377,682 | ||||
| Nagano Keiki Co. Ltd. | 289,300 | 4,168,962 | ||||
| Nippon Electric Glass Co. Ltd. | 1,213,000 | 23,268,089 | ||||
| Optoelectronics Co. Ltd. (d) | 91,200 | 2,385,217 | ||||
| Shibaura Electronics Co. Ltd. | 111,800 | 1,122,151 | ||||
| SK Electronics Co. Ltd. (d) | 2,500 | 5,953,864 | ||||
| Sunx Ltd. | 456,900 | 7,612,940 | ||||
| Tietech Co. Ltd. (d) | 324,000 | 2,690,852 | ||||
| Yokogawa Electric Corp. | 441,800 | 6,523,434 | ||||
| 123,045,152 | ||||||
| Internet Software & Services 6.9% | ||||||
| BB Net Corp. (d) | 8,000 | 2,982,561 | ||||
| Club iT Corp. (a) | 247,900 | 5,238,326 | ||||
| Excite Japan Co. Ltd | 1,100 | 6,687,380 | ||||
| I CF, Inc. (a)(d) | 4,859 | 9,678,341 | ||||
| Index Corp. New (d) | 12,700 | 14,297,933 | ||||
| livedoor Co. Ltd. (a)(d) | 5,843,780 | 21,508,443 | ||||
| Sammy NetWorks Co. Ltd. | 760 | 9,543,502 | ||||
| Telewave, Inc. (d) | 4,550 | 26,597,533 | ||||
| 96,534,019 | ||||||
| Shares | Value (Note 1) | |||
| IT Services 1.4% | ||||
| Cyber Firm, Inc. (a) | 595 | $ 1,906,535 | ||
| Future System Consulting Corp. (d) | 122 | 238,778 | ||
| Otsuka Corp. (d) | 202,800 | 17,949,197 | ||
| 20,094,510 | ||||
| Office Electronics – 1.1% | ||||
| Canon Fintech, Inc. | 439,900 | 8,876,384 | ||
| Riso Kagaku Corp. | 136,500 | 3,032,119 | ||
| Riso Kagaku Corp. New | 136,500 | 3,032,119 | ||
| 14,940,622 | ||||
| Semiconductors & Semiconductor Equipment – 0.3% | ||||
| Elpida Memory, Inc. | 20,000 | 507,486 | ||
| Yamaichi Electronics Co. Ltd. | 293,400 | 3,646,181 | ||
| 4,153,667 | ||||
| Software 3.1% | ||||
| Access Co. Ltd. (d) | 1,100 | 4,820,248 | ||
| Advanced Media, Inc. Japan (d) | 521 | 3,532,854 | ||
| Intelligent Wave, Inc. | 3,373 | 11,187,713 | ||
| Sumisho Computer Service Corp. | 343,000 | 6,208,213 | ||
| VIC Tokai Corp. | 283,200 | 3,666,576 | ||
| Works Applications Co. Ltd. (a)(d) | 16,010 | 14,835,470 | ||
| 44,251,074 | ||||
| TOTAL INFORMATION TECHNOLOGY | 324,993,114 | |||
| MATERIALS 9.6% | ||||
| Chemicals 3.0% | ||||
| C. Uyemura & Co. Ltd. | 247,000 | 10,460,008 | ||
| JSP Corp. (d) | 351,300 | 3,148,797 | ||
| Lintec Corp. (d) | 584,900 | 9,948,310 | ||
| Osaka Organic Chemical Industry Ltd. . | 378,600 | 2,878,733 | ||
| Soken Chemical & Engineer Co. Ltd. | 72,800 | 2,162,478 | ||
| Taiyo Kagaku (d) | 356,800 | 4,634,921 | ||
| Tohcello Co. Ltd. (d) | 709,500 | 4,552,991 | ||
| Zeon Corp. | 385,000 | 4,567,804 | ||
| 42,354,042 | ||||
| Construction Materials – 0.4% | ||||
| Taiheiyo Cement Corp. | 1,369,000 | 4,955,710 | ||
| Containers & Packaging – 0.4% | ||||
| Fuji Seal International, Inc. (d) | 179,400 | 5,406,645 | ||
| Metals & Mining – 5.8% | ||||
| Aichi Steel Corp. (d) | 2,400,000 | 16,897,715 | ||
| Daido Steel Co. Ltd. | 1,451,000 | 10,052,720 | ||
| Hitachi Metals Ltd. | 129,000 | 1,328,305 | ||
| Kobe Steel Ltd. | 4,232,000 | 12,497,589 | ||
| Sumitomo Metal Industries Ltd. | 5,474,000 | 18,962,298 | ||
| Sumitomo Metal Mining Co. Ltd. | 1,463,000 | 13,353,992 | ||
See accompanying notes which are an integral part of the financial statements.
Annual Report A-58
| Common Stocks continued | ||||||
| Shares | Value (Note 1) | |||||
| MATERIALS – continued | ||||||
| Metals & Mining – continued | ||||||
| Sumitomo Titanium Corp. (d) | 38,800 | $ 4,502,593 | ||||
| Sumitomo Titanium Corp. New (d) | 38,800 | 4,368,187 | ||||
| 81,963,399 | ||||||
| TOTAL MATERIALS | 134,679,796 | |||||
| TELECOMMUNICATION SERVICES 0.4% | ||||||
| Diversified Telecommunication Services – 0.4% | ||||||
| Mitsui & Associates Telepark Corp. (d) | 1,323 | 5,843,273 | ||||
| TOTAL COMMON STOCKS | ||||||
| (Cost $959,398,517) | 1,354,692,351 | |||||
| Money Market Funds 19.0% | ||||||
| Fidelity Cash Central Fund, | ||||||
| 3.92% (b) | 40,187,808 | 40,187,808 | ||||
| Fidelity Securities Lending Cash | ||||||
| Central Fund, 3.94% (b)(c) | 226,827,880 | 226,827,880 | ||||
| TOTAL MONEY MARKET FUNDS | ||||||
| (Cost $267,015,688) | 267,015,688 | |||||
| TOTAL INVESTMENT PORTFOLIO 115.3% | ||||||
| (Cost $1,226,414,205) | 1,621,708,039 | |||||
| NET OTHER ASSETS (15.3)% | (215,035,106) | |||||
| NET ASSETS 100% | $ 1,406,672,933 | |||||
| Legend (a) Non-income producing (b) Affiliated fund that is available only to investment companies and other accounts managed by Fidelity Investments. The rate quoted is the annualized seven-day yield of the fund at period end. A complete unaudited listing of the fund’s holdings as of its most recent quarter end is available upon request. (c) Includes investment made with cash collateral received from securities on loan. (d) Security or a portion of the security is on loan at period end. |
Other Information
An affiliated company is a company in which the fund had ownership of at least 5% of the voting securities. Companies which are affiliates of the fund at period-end are noted in the fund’s Schedule of Investments. Transactions during the period with companies which are or were affiliates are as follows:
| Value, | Value, | |||||||||||||
| Affiliates | beginning of | Sales | Dividend | end of | ||||||||||
| period | Purchases | Proceeds | Income | period | ||||||||||
| Career Design Center Co. Ltd. | $ | $ 6,190,901 | $ 3,760,303 | $ | 26,945 | $ | ||||||||
| Chiyoda Integre Co. Ltd. | 14,601,757 | — | 11,304,132 | 121,044 | — | |||||||||
| I CF, Inc. | — | 16,287,616 | 107,189 | — | — | |||||||||
| Total | $14,601,757 | $22,478,517 | $15,171,624 | $ | 147,989 | $ — |
See accompanying notes which are an integral part of the financial statements.
A-59 Annual Report
| Japan Smaller Companies | ||||
| Financial Statements | ||||
| Statement of Assets and Liabilities | ||||
| October 31, 2005 | ||||
| Assets | ||||
| Investment in securities, at value | ||||
| (including securities loaned of | ||||
| $215,419,688) (cost | ||||
| $1,226,414,205) — See accom- | ||||
| panying schedule | $1,621,708,039 | |||
| Receivable for investments sold | 16,954,352 | |||
| Receivable for fund shares sold | 6,014,035 | |||
| Dividends receivable | 2,473,433 | |||
| Interest receivable | 152,414 | |||
| Other affiliated receivables | 962 | |||
| Other receivables | 426,367 | |||
| Total assets | 1,647,729,602 | |||
| Liabilities | ||||
| Payable for investments purchased $ | 11,587,607 | |||
| Payable for fund shares redeemed | 1,408,359 | |||
| Accrued management fee | 804,044 | |||
| Other affiliated payables | 259,462 | |||
| Other payables and accrued | ||||
| expenses | 169,317 | |||
| Collateral on securities loaned, at | ||||
| value | 226,827,880 | |||
| Total liabilities | 241,056,669 | |||
| Net Assets | $ 1,406,672,933 | |||
| Net Assets consist of: | ||||
| Paid in capital | $ 906,502,843 | |||
| Undistributed net investment | ||||
| income | 2,487,857 | |||
| Accumulated undistributed net | ||||
| realized gain (loss) on invest- | ||||
| ments and foreign currency | ||||
| transactions | 102,469,150 | |||
| Net unrealized appreciation (de- | ||||
| preciation) on investments and | ||||
| assets and liabilities in foreign | ||||
| currencies | 395,213,083 | |||
| Net Assets, for 98,710,753 shares | ||||
| outstanding | $ 1,406,672,933 | |||
| Net Asset Value, offering price | ||||
| and redemption price per share | ||||
| ($1,406,672,933 ÷ | ||||
| 98,710,753 shares) | $ 14.25 | |||
| Statement of Operations | ||||||
| Year ended October 31, 2005 | ||||||
| Investment Income | ||||||
| Dividends (including $147,989 | ||||||
| received from affiliated issuers) | $ | 10,617,287 | ||||
| Interest | 974,123 | |||||
| Security lending | 4,820,804 | |||||
| 16,412,214 | ||||||
| Less foreign taxes withheld | (743,334) | |||||
| Total income | 15,668,880 | |||||
| Expenses | ||||||
| Management fee | $ | 9,177,074 | ||||
| Transfer agent fees | 2,477,247 | |||||
| Accounting and security lending | ||||||
| fees | 609,024 | |||||
| Independent trustees’ | ||||||
| compensation | 6,002 | |||||
| Custodian fees and expenses | 522,282 | |||||
| Registration fees | 38,835 | |||||
| Audit | 56,252 | |||||
| Legal | 3,619 | |||||
| Miscellaneous | 27,484 | |||||
| Total expenses before reductions | 12,917,819 | |||||
| Expense reductions | (82,008) | 12,835,811 | ||||
| Net investment income (loss) | 2,833,069 | |||||
| Realized and Unrealized Gain | ||||||
| (Loss) | ||||||
| Net realized gain (loss) on: | ||||||
| Investment securities (Including | ||||||
| realized gain (loss) of | ||||||
| $5,200,792 from affiliated | ||||||
| issuers) | 104,874,686 | |||||
| Foreign currency transactions | (70,042) | |||||
| Total net realized gain (loss) | 104,804,644 | |||||
| Change in net unrealized appreci- | ||||||
| ation (depreciation) on: | ||||||
| Investment securities | 160,528,922 | |||||
| Assets and liabilities in foreign | ||||||
| currencies | (238,602) | |||||
| Total change in net unrealized | ||||||
| appreciation (depreciation) | 160,290,320 | |||||
| Net gain (loss) | 265,094,964 | |||||
| Net increase (decrease) in net as- | ||||||
| sets resulting from operations . | $ | 267,928,033 | ||||
See accompanying notes which are an integral part of the financial statements.
Annual Report A-60
| Statement of Changes in Net Assets | ||||||||||||||||||||||
| Year ended | Year ended | |||||||||||||||||||||
| October 31, | October 31, | |||||||||||||||||||||
| 2005 | 2004 | |||||||||||||||||||||
| Increase (Decrease) in Net Assets | ||||||||||||||||||||||
| Operations | ||||||||||||||||||||||
| Net investment income (loss) | $ | 2,833,069 | $ | 1,253,664 | ||||||||||||||||||
| Net realized gain (loss) | 104,804,644 | 77,654,004 | ||||||||||||||||||||
| Change in net unrealized appreciation (depreciation) | 160,290,320 | (20,395,531) | ||||||||||||||||||||
| Net increase (decrease) in net assets resulting from operations | 267,928,033 | 58,512,137 | ||||||||||||||||||||
| Distributions to shareholders from net investment income | (1,062,984) | (1,684,858) | ||||||||||||||||||||
| Distributions to shareholders from net realized gain | (5,323,788) | — | ||||||||||||||||||||
| Total distributions | (6,386,772) | (1,684,858) | ||||||||||||||||||||
| Share transactions | ||||||||||||||||||||||
| Proceeds from sales of shares | 408,744,851 | 1,097,920,415 | ||||||||||||||||||||
| Reinvestment of distributions | 5,778,163 | 1,313,116 | ||||||||||||||||||||
| Cost of shares redeemed | (549,007,259) | (812,920,279) | ||||||||||||||||||||
| Net increase (decrease) in net assets resulting from share transactions | (134,484,245) | 286,313,252 | ||||||||||||||||||||
| Redemption fees | 524,593 | 4,222,862 | ||||||||||||||||||||
| Total increase (decrease) in net assets | 127,581,609 | 347,363,393 | ||||||||||||||||||||
| Net Assets | ||||||||||||||||||||||
| Beginning of period | 1,279,091,324 | 931,727,931 | ||||||||||||||||||||
| End of period (including undistributed net investment income of $2,487,857 and undistributed net investment | ||||||||||||||||||||||
| income of $832,961, respectively) | $ 1,406,672,933 | $ 1,279,091,324 | ||||||||||||||||||||
| Other Information | ||||||||||||||||||||||
| Shares | ||||||||||||||||||||||
| Sold | 31,449,513 | 94,304,368 | ||||||||||||||||||||
| Issued in reinvestment of distributions | 493,860 | 136,641 | ||||||||||||||||||||
| Redeemed | (43,664,409) | (74,002,513) | ||||||||||||||||||||
| Net increase (decrease) | (11,721,036) | 20,438,496 | ||||||||||||||||||||
| Financial Highlights | ||||||||||||||||||||||
| Years ended October 31, | 2005 | 2004 | 2003 | 2002 | 2001 | |||||||||||||||||
| Selected Per Share Data | ||||||||||||||||||||||
| Net asset value, beginning of period | $ | 11.58 | $ | 10.35 | $ 6.52 | $ | 6.97 | $ | 14.25 | |||||||||||||
| Income from Investment Operations | ||||||||||||||||||||||
| Net investment income (loss)C | 03 | .01 | .01 | —E | (.03) | |||||||||||||||||
| Net realized and unrealized gain (loss) | 2.69 | 1.20 | 3.81 | (.47) | (2.80) | |||||||||||||||||
| Total from investment operations | 2.72 | 1.21 | 3.82 | (.47) | (2.83) | |||||||||||||||||
| Distributions from net investment income | (.01) | (.02) | — | — | — | |||||||||||||||||
| Distributions from net realized gain | (.05) | — | — | (4.46) | ||||||||||||||||||
| Total distributions | (.06) | (.02) | — | (4.46) | ||||||||||||||||||
| Redemption fees added to paid in capitalC | 01 | .04 | .01 | .02 | .01 | |||||||||||||||||
| Net asset value, end of period | $ | 14.25 | $ | 11.58 | $ 10.35 | $ | 6.52 | $ | 6.97 | |||||||||||||
| Total ReturnA,B | 23.69% | 12.12% | 58.74% | (6.46)% | (25.96)% | |||||||||||||||||
| Ratios to Average Net AssetsD | ||||||||||||||||||||||
| Expenses before expense reductions | 1.02% | 1.04% | 1.12% | 1.19% | 1.21% | |||||||||||||||||
| Expenses net of voluntary waivers, if any | 1.02% | 1.04% | 1.12% | 1.19% | 1.21% | |||||||||||||||||
| Expenses net of all reductions | 1.01% | 1.04% | 1.12% | 1.19% | 1.19% | |||||||||||||||||
| Net investment income (loss) | 22% | .11% | .19% | (.06)% | (.40)% | |||||||||||||||||
| Supplemental Data | ||||||||||||||||||||||
| Net assets, end of period (000 omitted) | $ | 1,406,673 | $ | 1,279,091 | $ 931,728 | $ | 408,611 | $ | 339,130 | |||||||||||||
| Portfolio turnover rate | 65% | 57% | 43% | 50% | 52% | |||||||||||||||||
| ATotal returns would have been lower had certain expenses not been reduced during the periods shown. BTotal returns do not include the effect of the former sales charges. CCalculated based on average shares outstanding during the period. DExpense ratios reflect operating expenses of the fund. Expenses before reductions do not reflect amounts reimbursed by the investment adviser or reductions from brokerage service arrangements or other expense offset arrangements and do not represent the amount paid by the fund during periods when reimbursements or reductions occur. Expenses net of any voluntary waivers reflect expenses after reimbursement by the investment adviser but prior to reductions from brokerage service arrangements or other expense offset arrangements. Expenses net of all reductions represent the net expenses paid by the fund. EAmount represents less than $.01 per share. |
See accompanying notes which are an integral part of the financial statements.
A-61 Annual Report
| Latin America Performance: The Bottom Line |
Average annual total return reflects the change in the value of an investment, assuming reinvestment of the fund’s dividend income and capital gains (the profits earned upon the sale of securities that have grown in value) and assuming a constant rate of performance each year. The $10,000 table and the fund’s returns do not reflect the deduction of taxes that a shareholder would pay on fund distributions or the redemption of fund shares. During periods of reimbursement by Fidelity, a fund’s total returns will be greater than it would be had the reimbursement not occurred. How a fund did yesterday is no guarantee of how it will do tomorrow.
| Average Annual Total Returns | ||||||
| Periods ended | Past 1 | Past 5 | Past 10 | |||
| October 31, 2005 | year | years | years | |||
| Fidelity Latin America Fund | 64.94% | 18.02% | 13.38% |
$10,000 Over 10 Years
Let’s say hypothetically that $10,000 was invested in Fidelity Latin America Fund on October 31, 1995. The chart shows how the value of your investment would have changed, and also shows how the MSCI EM Latin America Index performed over the same period.

Annual Report A-62
| Latin America |
Management’s Discussion of Fund Performance
Comments from Adam Kutas and Brent Bottamini, Co Portfolio Managers of Fidelity® Latin America Fund
Emerging markets stocks posted strong gains for the 12 months ending October 31, 2005, as the Morgan Stanley Capital InternationalSM (MSCI®) Emerging Markets Index soared 34.34% . The lofty return was largely driven by the skyrocketing prices of oil and other commodities. Many emerging markets are commodity exporters particularly in Latin America which helped the economies and fiscal health of these countries. As such, the Latin American region generally outperformed other emerging markets. Still, neither of the top two performers were in the Western Hemisphere. Egypt and Jordan topped the index, despite making up less than 1.00% of the index combined on average during the period. Stocks in the Far East posted strong absolute returns, but mostly trailed other emerging markets because they are primarily exporters of technology, which saw diminished demand. South Korea, the largest component of the index during the past year, rose more than 46%. However, Taiwan, the second largest constituent, was a significant drag, gaining only 4%. Brazil, the largest Latin American component, was up more than 75%.
During the past year, Fidelity Latin America Fund returned 64.94%, compared to 61.55% for the MSCI Emerging Markets Latin America index and 64.64% for the LipperSM Latin American Funds Average. Versus the index, the fund benefited primarily from security selection in telecommunication services, an overweighting and stock selection in financials, and an underweighting and stock selection in industrials. On a country basis, our underweighting in the Chilean market and overweighting in Mexico contributed as well. Conversely, the fund lost some ground due to stock selection in the materials group, and holding a modest stake in cash. The appreciation of local currencies versus the dollar helped bolster the fund’s absolute return. The top performers in absolute terms included Mexican wireless company America Movil, Mexican cement producer Cemex, Brazilian energy giant Petrobras and Brazilian mining company Vale do Rio Doce. Several Brazilian bank holdings, such as Unibanco, helped relative to the index. Slight negative performance came from Chile’s Lan Airlines and Peruvian gold producer Buenaventura. Holding a smaller position than the index in Vale do Rio Doce held back the fund’s relative performance.
Note to shareholders:
Fidelity Latin America Fund may invest up to 35% of its total assets in any industry that represents more than 20% of the Latin American market. As of October 31, 2005, the fund did not have more than 25% of its assets invested in any one industry.
The views expressed in this statement reflect those of the portfolio managers only through the end of the period of the report as stated on the cover and do not necessarily represent the views of Fidelity or any other person in the Fidelity organization. Any such views are subject to change at any time based upon market or other conditions and Fidelity disclaims any responsibility to update such views. These views may not be relied on as invest ment advice and, because investment decisions for a Fidelity fund are based on numerous factors, may not be relied on as an indication of trading intent on behalf of any Fidelity fund.
| A-63 A-63 |
| Annual Report |
| Latin America Investment Changes |
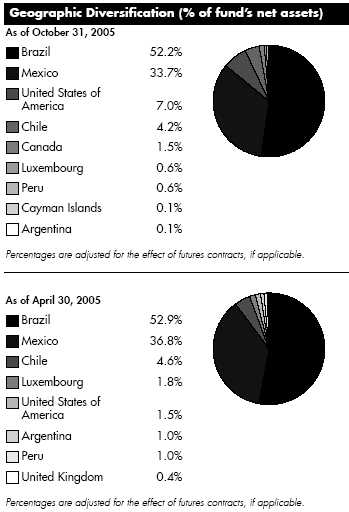
| Asset Allocation | ||||
| % of fund’s | % of fund’s net assets | |||
| net assets | 6 months ago | |||
| Stocks and Investment Companies | 95.3 | 98.5 | ||
| Short Term Investments and | ||||
| Net Other Assets | 4.7 | 1.5 |
| Top Ten Stocks as of October 31, 2005 | ||||
| % of fund’s | % of fund’s net assets | |||
| net assets | 6 months ago | |||
| America Movil SA de CV Series L | ||||
| sponsored ADR (Mexico, | ||||
| Wireless Telecommunication | ||||
| Services) | 8.9 | 8.1 | ||
| Petroleo Brasileiro SA Petrobras | ||||
| (PN) (Brazil, Oil, Gas & | ||||
| Consumable Fuels) | 5.8 | 8.3 | ||
| Cemex SA de CV sponsored ADR | ||||
| (Mexico, Construction Materials) | 5.5 | 5.3 | ||
| Banco Bradesco SA (PN) (Brazil, | ||||
| Commercial Banks) | 5.1 | 3.6 | ||
| Banco Itau Holding Financeira SA | ||||
| (Brazil, Commercial Banks) | 4.9 | 4.6 | ||
| Telefonos de Mexico SA de CV | ||||
| Series L sponsored ADR | ||||
| (Mexico, Diversified | ||||
| Telecommunication Services) | 4.4 | 6.3 | ||
| Petroleo Brasileiro SA Petrobras | ||||
| sponsored ADR (non vtg.) | ||||
| (Brazil, Oil, Gas & Consumable | ||||
| Fuels) | 4.3 | 3.1 | ||
| Companhia Vale do Rio Doce | ||||
| (PN A) (Brazil, Metals & Mining) | 3.7 | 3.6 | ||
| Uniao de Bancos Brasileiros SA | ||||
| (Unibanco) (Brazil, Commercial | ||||
| Banks) | 3.6 | 1.8 | ||
| Companhia Vale do Rio Doce | ||||
| sponsored ADR (non vtg.) | ||||
| (Brazil, Metals & Mining) | 3.5 | 3.6 | ||
| 49.7 | ||||
| Market Sectors as of October 31, 2005 | ||||
| % of fund’s | % of fund’s net assets | |||
| net assets | 6 months ago | |||
| Materials | 28.8 | 25.7 | ||
| Telecommunication Services | 16.5 | 20.7 | ||
| Financials | 13.9 | 13.9 | ||
| Energy | 10.7 | 13.2 | ||
| Consumer Staples | 9.4 | 10.8 | ||
| Consumer Discretionary | 6.6 | 5.2 | ||
| Utilities | 4.5 | 5.9 | ||
| Industrials | 3.0 | 2.5 | ||
| Health Care | 0.5 | 0.6 | ||
Annual Report A-64
| Latin America | ||||||||
| Investments October 31, 2005 | ||||||||
| Showing Percentage of Net Assets | ||||||||
| Common Stocks 93.9% | ||||||||
| Shares | Value (Note 1) | |||||||
| Argentina – 0.1% | ||||||||
| Cresud S.A.C.I.F.y A. sponsored | ||||||||
| ADR (d) | 77,400 | $ | 850,626 | |||||
| Brazil 52.2% | ||||||||
| AES Tiete SA (PN) | 217,900,000 | 4,789,968 | ||||||
| Aracruz Celulose SA (PN B) sponsored | ||||||||
| ADR | 262,700 | 10,061,410 | ||||||
| Banco Bradesco SA: | ||||||||
| (PN) | 619,777 | 31,899,882 | ||||||
| (PN) sponsored ADR (non vtg.) (d) | 733,650 | 38,069,099 | ||||||
| Banco Itau Holding Financeira SA: | ||||||||
| (PN) | 2,159,040 | 51,497,486 | ||||||
| sponsored ADR (non vtg.) (d) | 679,200 | 16,273,632 | ||||||
| Banco Nossa Caixa SA | 189,000 | 3,130,695 | ||||||
| Braskem SA (PN A) | 735,500 | 6,333,309 | ||||||
| Centrais Electricas Brasileiras SA | ||||||||
| (Electrobras) (PN B) | 812,614,100 | 14,037,965 | ||||||
| Companhia de Bebidas das Americas | ||||||||
| (AmBev): | ||||||||
| (PN) sponsored ADR | 668,126 | 23,718,473 | ||||||
| sponsored ADR | 74,145 | 2,070,870 | ||||||
| Companhia de Concessoes Rodoviarias | 118,200 | 3,148,956 | ||||||
| Companhia de Saneamento Basico do | ||||||||
| Estado de Sao Paulo (SABESP) | ||||||||
| sponsored ADR (a)(d) | 271,800 | 4,362,390 | ||||||
| Companhia Energetica de Minas Gerais | ||||||||
| (CEMIG) (PN) sponsored ADR | ||||||||
| (non vtg.) | 231,700 | 8,433,880 | ||||||
| Companhia Paranaense de | ||||||||
| Energia Copel (PN B) sponsored ADR | 265,500 | 1,959,390 | ||||||
| Companhia Siderurgica de Tubarao | ||||||||
| (CST) (PN) | 69,505,700 | 4,293,871 | ||||||
| Companhia Siderurgica Nacional SA | ||||||||
| (CSN) sponsored ADR (d) | 1,627,600 | 31,249,920 | ||||||
| Companhia Vale do Rio Doce: | ||||||||
| (PN A) | 214,000 | 7,848,948 | ||||||
| (PN A) sponsored ADR (non vtg.) (a) | 1,187,000 | 43,800,300 | ||||||
| sponsored ADR (non vtg.) | 1,187,700 | 49,087,641 | ||||||
| Cyrela Brazil Realty SA | 918,000 | 7,276,978 | ||||||
| Diagnosticos da America SA | 411,500 | 6,706,657 | ||||||
| Embraer – Empresa Brasileira de | ||||||||
| Aeronautica SA sponsored ADR | 195,400 | 7,579,566 | ||||||
| Embratel Participacoes SA sponsored | ||||||||
| ADR (a)(d) | 1,119,800 | 13,661,560 | ||||||
| Empresa Nacional de Comercio Redito | ||||||||
| e Participacoes SA (PN) (a) | 11,465,310 | 76,374 | ||||||
| Energias do Brasil SA | 462,000 | 4,675,806 | ||||||
| Gerdau SA | 170,550 | 1,775,332 | ||||||
| Gerdau SA sponsored ADR (d) | 1,458,330 | 19,789,538 | ||||||
| Lojas Renner SA | 354,600 | 9,448,441 | ||||||
| Natura Cosmeticos SA | 83,100 | 3,357,878 | ||||||
| Petroleo Brasileiro SA Petrobras: | ||||||||
| (PN) | 2,198,680 | 31,245,119 | ||||||
| (PN) sponsored ADR (non vtg.) | 850,000 | 48,764,500 | ||||||
| sponsored ADR (non vtg.) | 941,200 | 60,142,680 | ||||||
| Tam SA (PN) (a) | 1,213,600 | 15,117,453 | ||||||
| Shares | Value (Note 1) | |||
| Tele Norte Leste Participacoes SA | 223,100 | $ 5,338,231 | ||
| Tele Norte Leste Participacoes SA | ||||
| sponsored ADR (non vtg.) (d) | 1,373,800 | 24,316,260 | ||
| Uniao de Bancos Brasileiros SA | ||||
| (Unibanco): | ||||
| unit | 215,600 | 2,261,512 | ||
| GDR | 918,600 | 48,042,780 | ||
| Usinas Siderurgicas de Minas Gerais | ||||
| SA (Usiminas) (PN A) | 1,921,700 | 38,744,640 | ||
| Votorantim Celulose e Papel SA: | ||||
| (PN) (non vtg.) | 96,565 | 1,161,713 | ||
| sponsored ADR (non vtg.) (d) | 1,381,150 | 16,532,366 | ||
| TOTAL BRAZIL | 722,083,469 | |||
| Canada 1.5% | ||||
| Gerdau AmeriSteel Corp. | 1,931,900 | 9,176,934 | ||
| Glamis Gold Ltd. (a) | 271,400 | 5,671,594 | ||
| Meridian Gold, Inc. (a) | 349,200 | 6,549,348 | ||
| TOTAL CANADA | 21,397,876 | |||
| Cayman Islands 0.1% | ||||
| Apex Silver Mines Ltd. (a) | 107,300 | 1,643,836 | ||
| Chile 4.2% | ||||
| Compania Acero del Pacifico SA | 1,125,024 | 14,269,604 | ||
| Empresa Nacional de Electricidad SA | ||||
| sponsored ADR | 465,400 | 13,859,612 | ||
| Enersis SA sponsored ADR | 1,113,800 | 12,173,834 | ||
| Lan Airlines SA sponsored ADR (d) | 493,500 | 15,900,570 | ||
| Vina Concha y Toro SA sponsored ADR | 84,550 | 2,365,709 | ||
| TOTAL CHILE | 58,569,329 | |||
| Luxembourg 0.6% | ||||
| Tenaris SA sponsored ADR | 74,869 | 8,224,360 | ||
| Mexico – 33.7% | ||||
| Alsea SA de CV | 1,054,400 | 2,641,377 | ||
| America Movil SA de CV Series L | ||||
| sponsored ADR | 4,710,100 | 123,640,123 | ||
| Cemex SA de CV sponsored ADR | 1,463,457 | 76,202,206 | ||
| Consorcio ARA SA de CV | 1,350,100 | 4,983,078 | ||
| Corporacion Geo SA de CV Series B (a) | 4,354,400 | 13,467,716 | ||
| Fomento Economico Mexicano SA de | ||||
| CV sponsored ADR | 532,365 | 36,195,496 | ||
| Grupo Continental SA Series I | 2,997,800 | 4,961,128 | ||
| Grupo Mexico SA de CV Series B | 13,734,422 | 26,498,546 | ||
| Grupo Modelo SA de CV Series C | 3,948,100 | 12,119,562 | ||
| Grupo Televisa SA de CV (CPO) | ||||
| sponsored ADR | 536,800 | 39,240,080 | ||
| Industrias Penoles SA de CV | 1,835,000 | 8,026,636 | ||
| Sare Holding SA de CV Series B (a) | 4,882,100 | 5,024,227 | ||
| Telefonos de Mexico SA de CV Series L | ||||
| sponsored ADR | 3,057,400 | 61,698,332 | ||
| Urbi, Desarrollos Urbanos, SA de | ||||
| CV (a) | 1,286,400 | 8,229,334 | ||
| Wal Mart de Mexico SA de CV Series V | 8,781,393 | 42,881,139 | ||
| TOTAL MEXICO | 465,808,980 | |||
See accompanying notes which are an integral part of the financial statements.
A-65 A-65 Annual Report
| Latin America | ||||
| Investments - continued | ||||
| Common Stocks continued | ||||
| Shares | Value (Note 1) | |||
| Peru 0.6% | ||||
| Compania de Minas Buenaventura SA | ||||
| sponsored ADR | 293,300 | $ 7,558,341 | ||
| United States of America – 0.9% | ||||
| Southern Copper Corp. | 231,200 | 12,748,368 | ||
| TOTAL COMMON STOCKS | ||||
| (Cost $937,514,022) | 1,298,885,185 | |||
| Investment Companies 1.4% | ||||
| United States of America – 1.4% | ||||
| iShares S&P Latin America 40 Index | ||||
| Fund (d) | ||||
| (Cost $17,758,423) | 171,800 | 19,817,130 | ||
| Money Market Funds 11.3% | ||||
| Fidelity Cash Central Fund, | ||||
| 3.92% (b) | 57,501,213 | 57,501,213 | ||
| Fidelity Securities Lending Cash | ||||
| Central Fund, 3.94% (b)(c) | 98,626,327 | 98,626,327 | ||
| TOTAL MONEY MARKET FUNDS | ||||
| (Cost $156,127,540) | 156,127,540 | |||
| TOTAL INVESTMENT PORTFOLIO 106.6% | ||||
| (Cost $1,111,399,985) | 1,474,829,855 | |||
| NET OTHER ASSETS (6.6)% | (90,747,097) | |||
| NET ASSETS 100% | $ 1,384,082,758 | |||
| Legend (a) Non-income producing (b) Affiliated fund that is available only to investment companies and other accounts managed by Fidelity Investments. The rate quoted is the annualized seven-day yield of the fund at period end. A complete unaudited listing of the fund’s holdings as of its most recent quarter end is available upon request. (c) Investment made with cash collateral received from securities on loan. (d) Security or a portion of the security is on loan at period end. |
See accompanying notes which are an integral part of the financial statements.
Annual Report A-66
| Latin America | ||||
| Financial Statements | ||||
| Statement of Assets and Liabilities | ||||
| October 31, 2005 | ||||
| Assets | ||||
| Investment in securities, at value | ||||
| (including securities loaned of | ||||
| $99,581,058) (cost | ||||
| $1,111,399,985) — See accom- | ||||
| panying schedule | $1,474,829,855 | |||
| Foreign currency held at value | ||||
| (cost $153,439) | 153,989 | |||
| Receivable for investments sold | 14,516,074 | |||
| Receivable for fund shares sold | 11,504,815 | |||
| Dividends receivable | 3,852,331 | |||
| Interest receivable | 112,339 | |||
| Other affiliated receivables | 2,323 | |||
| Other receivables | 263,616 | |||
| Total assets | 1,505,235,342 | |||
| Liabilities | ||||
| Payable for investments purchased $ | 19,923,624 | |||
| Payable for fund shares redeemed | 1,318,753 | |||
| Accrued management fee | 793,863 | |||
| Other affiliated payables | 276,623 | |||
| Other payables and accrued | ||||
| expenses | 213,394 | |||
| Collateral on securities loaned, at | ||||
| value | 98,626,327 | |||
| Total liabilities | 121,152,584 | |||
| Net Assets | $ 1,384,082,758 | |||
| Net Assets consist of: | ||||
| Paid in capital | $ 985,828,111 | |||
| Undistributed net investment | ||||
| income | 16,852,142 | |||
| Accumulated undistributed net | ||||
| realized gain (loss) on invest- | ||||
| ments and foreign currency | ||||
| transactions | 17,945,649 | |||
| Net unrealized appreciation (de- | ||||
| preciation) on investments and | ||||
| assets and liabilities in foreign | ||||
| currencies | 363,456,856 | |||
| Net Assets, for 47,071,770 shares | ||||
| outstanding | $ 1,384,082,758 | |||
| Net Asset Value, offering price | ||||
| and redemption price per share | ||||
| ($1,384,082,758 ÷ | ||||
| 47,071,770 shares) | $ 29.40 | |||
| Statement of Operations | ||||||
| Year ended October 31, 2005 | ||||||
| Investment Income | ||||||
| Dividends | $ | 26,728,679 | ||||
| Interest | 711,175 | |||||
| Security lending | 517,421 | |||||
| 27,957,275 | ||||||
| Less foreign taxes withheld | (1,987,092) | |||||
| Total income | 25,970,183 | |||||
| Expenses | ||||||
| Management fee | $ | 5,466,515 | ||||
| Transfer agent fees | 1,772,464 | |||||
| Accounting and security lending | ||||||
| fees | 358,815 | |||||
| Independent trustees’ | ||||||
| compensation | 3,810 | |||||
| Custodian fees and expenses | 417,925 | |||||
| Registration fees | 120,738 | |||||
| Audit | 74,944 | |||||
| Legal | 1,029 | |||||
| Interest | 5,470 | |||||
| Miscellaneous | 115,000 | |||||
| Total expenses before reductions | 8,336,710 | |||||
| Expense reductions | (463,991) | 7,872,719 | ||||
| Net investment income (loss) | 18,097,464 | |||||
| Realized and Unrealized Gain | ||||||
| (Loss) | ||||||
| Net realized gain (loss) on: | ||||||
| Investment securities | 81,483,358 | |||||
| Foreign currency transactions | (564,206) | |||||
| Total net realized gain (loss) | 80,919,152 | |||||
| Change in net unrealized appreci- | ||||||
| ation (depreciation) on: | ||||||
| Investment securities | 247,555,531 | |||||
| Assets and liabilities in foreign | ||||||
| currencies | 32,708 | |||||
| Total change in net unrealized | ||||||
| appreciation (depreciation) | 247,588,239 | |||||
| Net gain (loss) | 328,507,391 | |||||
| Net increase (decrease) in net as- | ||||||
| sets resulting from operations . | $ | 346,604,855 | ||||
See accompanying notes which are an integral part of the financial statements.
A-67 Annual Report
| Latin America | ||||||||||||||||||||||
| Financial Statements - continued | ||||||||||||||||||||||
| Statement of Changes in Net Assets | ||||||||||||||||||||||
| Year ended | Year ended | |||||||||||||||||||||
| October 31, | October 31, | |||||||||||||||||||||
| 2005 | 2004 | |||||||||||||||||||||
| Increase (Decrease) in Net Assets | ||||||||||||||||||||||
| Operations | ||||||||||||||||||||||
| Net investment income (loss) | $ | 18,097,464 | $ | 7,432,184 | ||||||||||||||||||
| Net realized gain (loss) | 80,919,152 | 21,419,141 | ||||||||||||||||||||
| Change in net unrealized appreciation (depreciation) | 247,588,239 | 53,156,255 | ||||||||||||||||||||
| Net increase (decrease) in net assets resulting from operations | 346,604,855 | 82,007,580 | ||||||||||||||||||||
| Distributions to shareholders from net investment income | (6,575,674) | (3,905,133) | ||||||||||||||||||||
| Share transactions | ||||||||||||||||||||||
| Proceeds from sales of shares | 1,044,234,301 | 169,215,930 | ||||||||||||||||||||
| Reinvestment of distributions | 6,298,102 | 3,746,651 | ||||||||||||||||||||
| Cost of shares redeemed | (365,491,989) | (113,691,284) | ||||||||||||||||||||
| Net increase (decrease) in net assets resulting from share transactions | 685,040,414 | 59,271,297 | ||||||||||||||||||||
| Redemption fees | 1,678,494 | 442,226 | ||||||||||||||||||||
| Total increase (decrease) in net assets | 1,026,748,089 | 137,815,970 | ||||||||||||||||||||
| Net Assets | ||||||||||||||||||||||
| Beginning of period | 357,334,669 | 219,518,699 | ||||||||||||||||||||
| End of period (including undistributed net investment income of $16,852,142 and undistributed net investment | ||||||||||||||||||||||
| income of $5,894,558, respectively) | $ 1,384,082,758 | $ | 357,334,669 | |||||||||||||||||||
| Other Information | ||||||||||||||||||||||
| Shares | ||||||||||||||||||||||
| Sold | 42,509,771 | 10,428,289 | ||||||||||||||||||||
| Issued in reinvestment of distributions | 323,696 | 264,221 | ||||||||||||||||||||
| Redeemed | (15,505,564) | (7,355,849) | ||||||||||||||||||||
| Net increase (decrease) | 27,327,903 | 3,336,661 | ||||||||||||||||||||
| Financial Highlights | ||||||||||||||||||||||
| Years ended October 31, | 2005 | 2004 | 2003 | 2002 | 2001 | |||||||||||||||||
| Selected Per Share Data | ||||||||||||||||||||||
| Net asset value, beginning of period | $ | 18.10 | $ | 13.38 | $ 8.92 | $ | 10.40 | $ | 13.87 | |||||||||||||
| Income from Investment Operations | ||||||||||||||||||||||
| Net investment income (loss)C | 57 | .40 | .20 | .17 | .27D | |||||||||||||||||
| Net realized and unrealized gain (loss) | 10.98 | 4.53 | 4.42 | (1.41) | (3.68) | |||||||||||||||||
| Total from investment operations | 11.55 | 4.93 | 4.62 | (1.24) | (3.41) | |||||||||||||||||
| Distributions from net investment income | (.30) | (.23) | (.17) | (.25) | (.07) | |||||||||||||||||
| Redemption fees added to paid in capitalC | 05 | .02 | .01 | .01 | .01 | |||||||||||||||||
| Net asset value, end of period | $ | 29.40 | $ | 18.10 | $ 13.38 | $ | 8.92 | $ | 10.40 | |||||||||||||
| Total ReturnA,B | 64.94% | 37.47% | 52.83% | (12.37)% | (24.61)% | |||||||||||||||||
| Ratios to Average Net AssetsE | ||||||||||||||||||||||
| Expenses before expense reductions | 1.10% | 1.19% | 1.31% | 1.44% | 1.41% | |||||||||||||||||
| Expenses net of voluntary waivers, if any | 1.10% | 1.19% | 1.31% | 1.44% | 1.41% | |||||||||||||||||
| Expenses net of all reductions | 1.04% | 1.16% | 1.31% | 1.41% | 1.35% | |||||||||||||||||
| Net investment income (loss) | 2.38% | 2.56% | 1.89% | 1.57% | 2.14% | |||||||||||||||||
| Supplemental Data | ||||||||||||||||||||||
| Net assets, end of period (000 omitted) | $ | 1,384,083 | $ | 357,335 | $ 219,519 | $ | 140,399 | $ | 184,457 | |||||||||||||
| Portfolio turnover rate | 40% | 25% | 28% | 128% | 96% | |||||||||||||||||
| ATotal returns would have been lower had certain expenses not been reduced during the periods shown. BTotal returns do not include the effect of the former sales charges. CCalculated based on average shares outstanding during the period. DInvestment income per share reflects a special dividend which amounted to $.07 per share. EExpense ratios reflect operating expenses of the fund. Expenses before reductions do not reflect amounts reimbursed by the investment adviser or reductions from brokerage service arrangements or other expense offset arrangements and do not represent the amount paid by the fund during periods when reimbursements or reductions occur. Expenses net of any voluntary waivers reflect expenses after reimbursement by the investment adviser but prior to reductions from brokerage service arrangements or other expense offset arrangements. Expenses net of all reductions represent the net expenses paid by the fund. |
See accompanying notes which are an integral part of the financial statements.
Annual Report A-68
| Nordic |
| Performance: The Bottom Line |
Average annual total return reflects the change in the value of an investment, assuming reinvestment of the fund’s dividend income and capital gains (the profits earned upon the sale of securities that have grown in value) and assuming a constant rate of performance each year. The $10,000 table and the fund’s returns do not reflect the deduction of taxes that a shareholder would pay on fund distributions or the redemption of fund shares. During periods of reimbursement by Fidelity, a fund’s total returns will be greater than it would be had the reimbursement not occurred. How a fund did yesterday is no guarantee of how it will do tomorrow.
| Average Annual Total Returns | ||||||
| Periods ended | Past 1 | Past 5 | Life of | |||
| October 31, 2005 | year | years | FundA | |||
| Fidelity Nordic Fund | 27.56% | 3.35% | 13.64% | |||
| A From November 1, 1995. | ||||||
| $10,000 Over Life of Fund | ||||||
Let’s say hypothetically that $10,000 was invested in Fidelity Nordic Fund on November 1, 1995, when the fund started. The chart shows how the value of your investment would have changed, and also shows how the FTSE World Nordic Index performed over the same period.
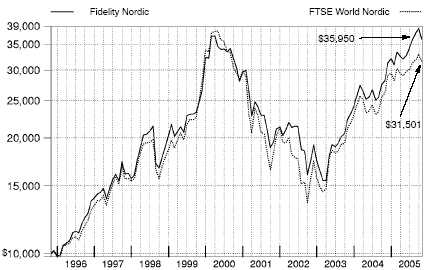
| A-69 |
| Annual Report |
| Nordic |
Management’s Discussion of Fund Performance
Comments from Trygve Toraasen, Portfolio Manager of Fidelity® Nordic Fund
Foreign stock markets enjoyed broad based advances during the 12 month period that ended October 31, 2005, encouraged by better than expected corporate earnings and markedly improved economies. For the 12 months overall, the Morgan Stanley Capital InternationalSM Europe, Australasia, Far East (MSCI® EAFE®) Index a performance measure of developed stock markets outside the United States and Canada gained 18.28% . The Japanese stock market climbed to its highest level in more than four years. Positive economic indicators and Prime Minister Koizumi’s decisive election victory attracted record inflows from overseas investors. In response, the Tokyo Stock Exchange Stock Price Index (TOPIX) soared 22.89% . Southeast Asian equities outside of Japan, particularly South Korea, also responded well to the better macroeconomic environment, illustrated by the 19.44% return for the MSCI All Country Far East ex Japan index. European stock markets were up as well, despite investors’ concern about higher energy prices and potential downgrades to economic growth in the region. For the year overall, the MSCI Europe index rose 16.51% .
For the year ending October 31, 2005, Fidelity Nordic Fund returned 27.56%, outperforming both the Financial Times Stock Exchange (FTSE) World Nordic Index, which rose 20.07%, and the LipperSM European Region Funds Average, which gained 18.34% . Returns for U.S. investors in Nordic markets, although robust, were tempered by the strength of the U.S. dollar versus local currencies. Strong global growth provided a favorable backdrop for Nordic equities, especially for Norway’s energy related industries and Sweden’s heavy industrial companies. My early overweighting of energy stocks relative to the index and good overall security selection contributed to the fund’s outperformance. However, we had weak results in Denmark, which limited our upside. Energy investments that boosted returns included three Norwegian companies: Ocean RIG, which owns sophisticated deep water drilling rigs, as well as Fred Olsen Energy and Stolt Offshore, two engineering companies that provide services to drilling rigs. Hansabank, a Baltic banking company, appreciated as Swedbank purchased those shares it did not already own. I sold the Fred Olsen and Stolt positions. On the downside, two Swedish retailers detracted from performance. Food retailer Axfood was pressured by new, low cost competition, while Mekonomen an auto parts retailer had difficulty executing a restructuring program. I sold the Axfood holding. In addition, I did not own any shares of TDC, a Danish telecommunication services company and major index component that did very well.
Note to shareholders:
Fidelity Nordic Fund may invest up to 35% of its total assets in any industry that represents more than 20% of the Nordic market. As of October 31, 2005, the fund did not have more than 25% of its total assets in any one industry.
The views expressed in this statement reflect those of the portfolio manager only through the end of the period of the report as stated on the cover and do not necessarily represent the views of Fidelity or any other person in the Fidelity organization. Any such views are subject to change at any time based upon market or other conditions and Fidelity disclaims any responsibility to update such views. These views may not be relied on as invest ment advice and, because investment decisions for a Fidelity fund are based on numerous factors, may not be relied on as an indication of trading intent on behalf of any Fidelity fund.
| Annual Report |
| A-70 |
| Nordic Investment Changes |
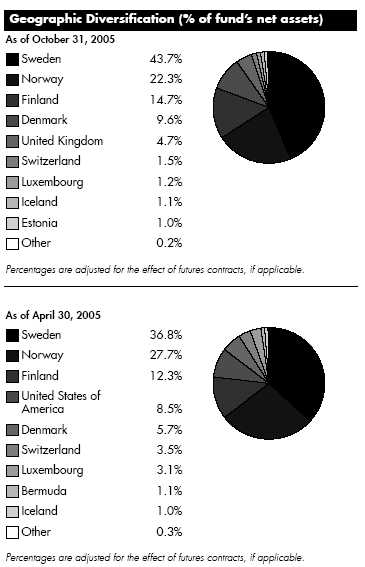
| Asset Allocation | ||||
| % of fund’s | % of fund’s net assets | |||
| net assets | 6 months ago | |||
| Stocks | 100.2 | 91.5 | ||
| Short Term Investments and | ||||
| Net Other Assets | (0.2) | 8.5 |
| Top Ten Stocks as of October 31, 2005 | ||||
| % of fund’s | % of fund’s net assets | |||
| net assets | 6 months ago | |||
| Telefonaktiebolaget LM Ericsson (B | ||||
| Shares) (Sweden, | ||||
| Communications Equipment) | 9.7 | 10.1 | ||
| Nokia Corp. (Finland, | ||||
| Communications Equipment) | 9.5 | 9.2 | ||
| Nordea Bank AB (Sweden, | ||||
| Commercial Banks) | 5.3 | 3.3 | ||
| Danske Bank AS (Denmark, | ||||
| Commercial Banks) | 4.0 | 1.0 | ||
| AstraZeneca PLC (Sweden) | ||||
| (United Kingdom, | ||||
| Pharmaceuticals) | 3.8 | 0.0 | ||
| Norsk Hydro ASA (Norway, Oil, | ||||
| Gas & Consumable Fuels) | 3.1 | 4.4 | ||
| Svenska Handelsbanken AB (A | ||||
| Shares) (Sweden, Commercial | ||||
| Banks) | 3.0 | 2.9 | ||
| Investor AB (B Shares) (Sweden, | ||||
| Diversified Financial Services) | 2.7 | 0.0 | ||
| DnB NOR ASA (Norway, | ||||
| Commercial Banks) | 2.7 | 3.9 | ||
| TANDBERG ASA (Norway, | ||||
| Communications Equipment) | 2.7 | 3.1 | ||
| 46.5 | ||||
| Market Sectors as of October 31, 2005 | ||||
| % of fund’s | % of fund’s net assets | |||
| net assets | 6 months ago | |||
| Financials | 24.9 | 16.0 | ||
| Information Technology | 22.9 | 23.5 | ||
| Health Care | 13.3 | 9.4 | ||
| Industrials | 12.5 | 12.4 | ||
| Energy | 12.2 | 14.8 | ||
| Consumer Discretionary | 7.7 | 11.4 | ||
| Consumer Staples | 3.6 | 2.2 | ||
| Utilities | 1.5 | 0.0 | ||
| Telecommunication Services | 0.8 | 0.9 | ||
| Materials | 0.8 | 0.9 | ||
A-71 Annual Report
| Nordic | ||||||||
| Investments October 31, 2005 | ||||||||
| Showing Percentage of Net Assets | ||||||||
| Common Stocks 100.2% | ||||||||
| Shares | Value (Note 1) | |||||||
| Bermuda 0.4% | ||||||||
| SeaDrill Ltd. (a)(e) | 119,983 | $ | 737,676 | |||||
| Denmark – 9.6% | ||||||||
| Bang & Olufsen AS Series B | 5,550 | 530,418 | ||||||
| Coloplast AS Series B | 14,650 | 840,067 | ||||||
| Danske Bank AS | 239,420 | 7,508,614 | ||||||
| GN Store Nordic AS | 115,100 | 1,386,580 | ||||||
| H. Lundbeck AS | 59,600 | 1,392,892 | ||||||
| Novo Nordisk AS Series B | 57,695 | 2,956,223 | ||||||
| Novozymes AS Series B | 29,200 | 1,526,659 | ||||||
| Rockwool International AS Series B | 5,600 | 439,851 | ||||||
| Vestas Wind Systems AS (a)(d) | 65,400 | 1,415,516 | ||||||
| TOTAL DENMARK | 17,996,820 | |||||||
| Estonia 1.0% | ||||||||
| Tallinna Vesi AS | 109,562 | 1,880,752 | ||||||
| Finland – 14.7% | ||||||||
| Fortum Oyj | 48,600 | 860,489 | ||||||
| Kesko Oyj | 28,600 | 786,481 | ||||||
| Marimekko Oyj | 36,500 | 702,258 | ||||||
| Metso Corp. | 73,300 | 1,906,744 | ||||||
| Neste Oil Oyj | 72,000 | 2,231,114 | ||||||
| Nokia Corp. | 1,062,395 | 17,869,481 | ||||||
| Nokian Tyres Ltd. | 162,900 | 2,538,593 | ||||||
| TietoEnator Oyj | 21,160 | 672,187 | ||||||
| TOTAL FINLAND | 27,567,347 | |||||||
| Iceland 1.1% | ||||||||
| Ossur Hf (a) | 1,345,670 | 2,011,267 | ||||||
| Luxembourg 1.2% | ||||||||
| Millicom International Cellular SA unit (a) | 42,160 | 807,556 | ||||||
| Oriflame Cosmetics SA unit | 36,300 | 936,960 | ||||||
| Transcom WorldWide SA Series B (a) | 63,500 | 448,641 | ||||||
| TOTAL LUXEMBOURG | 2,193,157 | |||||||
| Norway 22.3% | ||||||||
| Aker Kvaerner ASA (a) | 55,100 | 2,862,558 | ||||||
| Awilco Offshore ASA | 107,200 | 499,256 | ||||||
| DnB NOR ASA | 501,600 | 5,127,021 | ||||||
| Farstad Shipping ASA | 55,800 | 741,884 | ||||||
| Havila Shipping ASA | 57,300 | 413,941 | ||||||
| Leroy Seafood Group ASA (d) | 121,300 | 988,149 | ||||||
| Norsk Hydro ASA | 58,200 | 5,768,784 | ||||||
| Norwegian Air Shuttle AS (a)(d) | 109,600 | 1,069,720 | ||||||
| Ocean RIG ASA (a) | 163,800 | 1,825,315 | ||||||
| Orkla ASA (A Shares) | 70,135 | 2,457,851 | ||||||
| Otrum Electronics ASA (a) | 94,000 | 424,777 | ||||||
| Rocksource ASA (a) | 1,289,200 | 269,492 | ||||||
| Schibsted ASA (B Shares) | 74,200 | 2,138,411 | ||||||
| Sevan Marine ASA (a)(d) | 225,400 | 925,020 | ||||||
| Shares | Value (Note 1) | |||
| Solstad Offshore ASA | 91,600 | $ 1,267,138 | ||
| Statoil ASA | 197,054 | 4,406,910 | ||
| Steen & Stroem ASA | 4,800 | 147,556 | ||
| Storebrand ASA (A Shares) | 415,700 | 3,817,718 | ||
| TANDBERG ASA | 507,500 | 4,992,315 | ||
| TANDBERG Television ASA (a) | 83,000 | 1,033,354 | ||
| Telenor ASA | 83,300 | 813,026 | ||
| TOTAL NORWAY | 41,990,196 | |||
| Sweden 43.7% | ||||
| AarhusKarlshamn AB (a) | 9,400 | 179,463 | ||
| ABB Ltd. (Sweden) (a) | 129,500 | 988,140 | ||
| Assa Abloy AB (B Shares) | 125,602 | 1,798,472 | ||
| Atlas Copco AB (A Shares) | 76,400 | 1,396,236 | ||
| Capio AB (a) | 105,000 | 1,813,403 | ||
| Cherryforetagen AB (B Shares) (a) | 35,000 | 118,256 | ||
| Elekta AB (B Shares) | 117,900 | 1,799,254 | ||
| Forenings Sparbanken AB (A Shares) | 164,200 | 4,052,641 | ||
| Getinge AB (B Shares) | 66,760 | 834,338 | ||
| Hennes & Mauritz AB (H&M) (B Shares) . | 144,440 | 4,689,758 | ||
| Hexagon AB (B Shares) (d) | 83,200 | 1,959,417 | ||
| Intrum Justitia AB (a) | 256,700 | 2,192,488 | ||
| Investor AB (B Shares) | 351,000 | 5,180,210 | ||
| Lundin Petroleum AB (a) | 85,600 | 865,510 | ||
| Meda AB: | ||||
| (A Shares) | 60,650 | 788,449 | ||
| (A Shares) rights 11/24/05 (a) | 121,300 | 220,918 | ||
| Mekonomen AB | 126,600 | 1,478,833 | ||
| Modern Times Group AB (MTG) | ||||
| (B Shares) (a) | 43,300 | 1,656,066 | ||
| NCC AB Series B | 49,800 | 900,729 | ||
| NeoNet AB (a) | 112,000 | 150,523 | ||
| Nordea Bank AB | 1,018,600 | 9,979,313 | ||
| Peab AB | 27,600 | 317,200 | ||
| Pergo AB (a) | 109,500 | 550,144 | ||
| Sandvik AB | 65,500 | 3,150,957 | ||
| Securitas AB (B Shares) | 131,500 | 1,998,543 | ||
| Skandia Foersaekrings AB | 296,900 | 1,480,482 | ||
| Skandinaviska Enskilda Banken AB | ||||
| (A Shares) | 211,400 | 3,943,064 | ||
| Skanska AB (B Shares) | 51,500 | 721,248 | ||
| SKF AB (B Shares) | 115,900 | 1,463,025 | ||
| Studsvik AB (a) | 1,800 | 38,661 | ||
| Svenska Handelsbanken AB (A Shares) . | 245,716 | 5,601,604 | ||
| Swedish Match Co. | 141,000 | 1,602,766 | ||
| Telefonaktiebolaget LM Ericsson | ||||
| (B Shares) | 5,544,200 | 18,190,520 | ||
| Uniflex AB | 11,580 | 73,452 | ||
| Wihlborgs Fastigheter AB (a) | 3,260 | 70,019 | ||
| TOTAL SWEDEN | 82,244,102 | |||
| Switzerland 1.5% | ||||
| Nobel Biocare Holding AG (Switzerland) | 12,448 | 2,870,239 | ||
See accompanying notes which are an integral part of the financial statements.
Annual Report A-72
| Common Stocks continued | ||||
| Shares | Value (Note 1) | |||
| United Kingdom – 4.7% | ||||
| AstraZeneca PLC (Sweden) | 158,500 | $ 7,107,222 | ||
| Axis Shield PLC (a) | 172,300 | 967,004 | ||
| Group 4 Securicor PLC (Denmark) | 184,418 | 491,722 | ||
| Unibet Group PLC unit | 14,000 | 291,903 | ||
| TOTAL UNITED KINGDOM | 8,857,851 | |||
| TOTAL COMMON STOCKS | ||||
| (Cost $162,758,913) | 188,349,407 | |||
| Money Market Funds 2.2% | ||||
| Fidelity Cash Central Fund, | ||||
| 3.92% (b) | 985,223 | 985,223 | ||
| Fidelity Securities Lending Cash | ||||
| Central Fund, 3.94% (b)(c) | 3,246,365 | 3,246,365 | ||
| TOTAL MONEY MARKET FUNDS | ||||
| (Cost $4,231,588) | 4,231,588 | |||
| TOTAL INVESTMENT PORTFOLIO 102.4% | ||||
| (Cost $166,990,501) | 192,580,995 | |||
| NET OTHER ASSETS (2.4)% | (4,569,735) | |||
| NET ASSETS 100% | $ | 188,011,260 | ||
| Legend (a) Non-income producing (b) Affiliated fund that is available only to investment companies and other accounts managed by Fidelity Investments. The rate quoted is the annualized seven-day yield of the fund at period end. A complete unaudited listing of the fund’s holdings as of its most recent quarter end is available upon request. (c) Investment made with cash collateral received from securities on loan. (d) Security or a portion of the security is on loan at period end. (e) Restricted securities – Investment in securities not registered under the Securities Act of 1933 (excluding 144A issues). At the end of the period, the value of restricted securities (excluding 144A issues) amounted to $737,676 or 0.4% of net assets. |
Additional information on each holding is as follows:
| Security | Acquisition Date | Acquisition Cost | ||
| SeaDrill Ltd. | 6/6/05 – 6/8/05 | $ | 414,412 |
See accompanying notes which are an integral part of the financial statements.
A-73 Annual Report
| Nordic | ||||||||
| Financial Statements | ||||||||
| Statement of Assets and Liabilities | ||||||||
| October 31, 2005 | ||||||||
| Assets | ||||||||
| Investment in securities, at value | ||||||||
| (including securities loaned of | ||||||||
| $3,099,579) (cost | ||||||||
| $166,990,501) — See accom- | ||||||||
| panying schedule | $ | 192,580,995 | ||||||
| Receivable for investments sold | 248,390 | |||||||
| Receivable for fund shares sold | 411,606 | |||||||
| Dividends receivable | 11,994 | |||||||
| Interest receivable | 7,562 | |||||||
| Other affiliated receivables | 674 | |||||||
| Other receivables | 12,935 | |||||||
| Total assets | 193,274,156 | |||||||
| Liabilities | ||||||||
| Payable to custodian bank | $ | 28,801 | ||||||
| Payable for investments purchased | 1,165,939 | |||||||
| Payable for fund shares redeemed | 585,831 | |||||||
| Accrued management fee | 115,908 | |||||||
| Other affiliated payables | 51,680 | |||||||
| Other payables and accrued | ||||||||
| expenses | 68,372 | |||||||
| Collateral on securities loaned, at | ||||||||
| value | 3,246,365 | |||||||
| Total liabilities | 5,262,896 | |||||||
| Net Assets | $ | 188,011,260 | ||||||
| Net Assets consist of: | ||||||||
| Paid in capital | $ | 144,560,534 | ||||||
| Undistributed net investment | ||||||||
| income | 3,006,975 | |||||||
| Accumulated undistributed net | ||||||||
| realized gain (loss) on invest- | ||||||||
| ments and foreign currency | ||||||||
| transactions | 14,853,888 | |||||||
| Net unrealized appreciation (de- | ||||||||
| preciation) on investments and | ||||||||
| assets and liabilities in foreign | ||||||||
| currencies | 25,589,863 | |||||||
| Net Assets, for 6,080,204 shares | ||||||||
| outstanding | $ | 188,011,260 | ||||||
| Net Asset Value, offering price | ||||||||
| and redemption price per share | ||||||||
| ($188,011,260 ÷ 6,080,204 | ||||||||
| shares) | $ | 30.92 | ||||||
| Statement of Operations | ||||||
| Year ended October 31, 2005 | ||||||
| Investment Income | ||||||
| Dividends | $ | 5,186,952 | ||||
| Interest | 121,282 | |||||
| Security lending | 344,517 | |||||
| 5,652,751 | ||||||
| Less foreign taxes withheld | (649,695) | |||||
| Total income | 5,003,056 | |||||
| Expenses | ||||||
| Management fee | $ | 1,193,314 | ||||
| Transfer agent fees | 457,715 | |||||
| Accounting and security lending | ||||||
| fees | 84,938 | |||||
| Independent trustees’ | ||||||
| compensation | 735 | |||||
| Custodian fees and expenses | 120,389 | |||||
| Registration fees | 24,370 | |||||
| Audit | 49,688 | |||||
| Legal | 415 | |||||
| Miscellaneous | 2,241 | |||||
| Total expenses before reductions | 1,933,805 | |||||
| Expense reductions | (57,767) | 1,876,038 | ||||
| Net investment income (loss) | 3,127,018 | |||||
| Realized and Unrealized Gain | ||||||
| (Loss) | ||||||
| Net realized gain (loss) on: | ||||||
| Investment securities | 22,652,297 | |||||
| Foreign currency transactions | (44,986) | |||||
| Total net realized gain (loss) | 22,607,311 | |||||
| Change in net unrealized appreci- | ||||||
| ation (depreciation) on: | ||||||
| Investment securities | 8,542,457 | |||||
| Assets and liabilities in foreign | ||||||
| currencies | (2,915) | |||||
| Total change in net unrealized | ||||||
| appreciation (depreciation) | 8,539,542 | |||||
| Net gain (loss) | 31,146,853 | |||||
| Net increase (decrease) in net as- | ||||||
| sets resulting from operations . | $ | 34,273,871 | ||||
See accompanying notes which are an integral part of the financial statements.
Annual Report A-74
| Statement of Changes in Net Assets | ||||||||||||||||||||||||
| Year ended | Year ended | |||||||||||||||||||||||
| October 31, | October 31, | |||||||||||||||||||||||
| 2005 | 2004 | |||||||||||||||||||||||
| Increase (Decrease) in Net Assets | ||||||||||||||||||||||||
| Operations | ||||||||||||||||||||||||
| Net investment income (loss) | $ | 3,127,018 | $ | 1,181,777 | ||||||||||||||||||||
| Net realized gain (loss) | 22,607,311 | 18,349,102 | ||||||||||||||||||||||
| Change in net unrealized appreciation (depreciation) | 8,539,542 | 918,272 | ||||||||||||||||||||||
| Net increase (decrease) in net assets resulting from operations | 34,273,871 | 20,449,151 | ||||||||||||||||||||||
| Distributions to shareholders from net investment income | (1,181,664) | (633,291) | ||||||||||||||||||||||
| Share transactions | ||||||||||||||||||||||||
| Proceeds from sales of shares | 95,465,404 | 51,430,152 | ||||||||||||||||||||||
| Reinvestment of distributions | 1,146,167 | 613,718 | ||||||||||||||||||||||
| Cost of shares redeemed | (58,327,971) | (36,891,811) | ||||||||||||||||||||||
| Net increase (decrease) in net assets resulting from share transactions | 38,283,600 | 15,152,059 | ||||||||||||||||||||||
| Redemption fees | 142,810 | 187,429 | ||||||||||||||||||||||
| Total increase (decrease) in net assets | 71,518,617 | 35,155,348 | ||||||||||||||||||||||
| Net Assets | ||||||||||||||||||||||||
| Beginning of period | 116,492,643 | 81,337,295 | ||||||||||||||||||||||
| End of period (including undistributed net investment income of $3,006,975 and undistributed net investment in- | ||||||||||||||||||||||||
| come of $1,106,605, respectively) | $ 188,011,260 | $ | 116,492,643 | |||||||||||||||||||||
| Other Information | ||||||||||||||||||||||||
| Shares | ||||||||||||||||||||||||
| Sold | 3,292,109 | 2,222,711 | ||||||||||||||||||||||
| Issued in reinvestment of distributions | 43,024 | 29,807 | ||||||||||||||||||||||
| Redeemed | (2,021,076) | (1,659,315) | ||||||||||||||||||||||
| Net increase (decrease) | 1,314,057 | 593,203 | ||||||||||||||||||||||
| Financial Highlights | ||||||||||||||||||||||||
| Years ended October 31, | 2005 | 2004 | 2003 | 2002 | 2001 | |||||||||||||||||||
| Selected Per Share Data | ||||||||||||||||||||||||
| Net asset value, beginning of period | $ | 24.44 | $ | 19.49 | $ | 15.36 | $ | 17.31 | $ | 27.19 | ||||||||||||||
| Income from Investment Operations | ||||||||||||||||||||||||
| Net investment income (loss)C | 55 | .26 | .11 | .10 | .07 | |||||||||||||||||||
| Net realized and unrealized gain (loss) | 6.12 | 4.80 | 4.14 | (1.99) | (9.71) | |||||||||||||||||||
| Total from investment operations | 6.67 | 5.06 | 4.25 | (1.89) | (9.64) | |||||||||||||||||||
| Distributions from net investment income | (.22) | (.15) | (.12) | (.06) | (.03) | |||||||||||||||||||
| Distributions from net realized gain | — | — | — | — | (.22) | |||||||||||||||||||
| Total distributions | (.22) | (.15) | (.12) | (.06) | (.25) | |||||||||||||||||||
| Redemption fees added to paid in capitalC | 03 | .04 | E | —E | .01 | |||||||||||||||||||
| Net asset value, end of period | $ | 30.92 | $ | 24.44 | $ | 19.49 | $ | 15.36 | $ | 17.31 | ||||||||||||||
| Total ReturnA,B | 27.56% | 26.31% | 27.87% | (10.97)% | (35.72)% | |||||||||||||||||||
| Ratios to Average Net AssetsD | ||||||||||||||||||||||||
| Expenses before expense reductions | 1.17% | 1.28% | 1.43% | 1.35% | 1.26% | |||||||||||||||||||
| Expenses net of voluntary waivers, if any | 1.17% | 1.28% | 1.43% | 1.35% | 1.26% | |||||||||||||||||||
| Expenses net of all reductions | 1.13% | 1.24% | 1.40% | 1.30% | 1.20% | |||||||||||||||||||
| Net investment income (loss) | 1.89% | 1.16% | .67% | .57% | .34% | |||||||||||||||||||
| Supplemental Data | ||||||||||||||||||||||||
| Net assets, end of period (000 omitted) | $ | 188,011 | $ | 116,493 | $ | 81,337 | $ | 73,992 | $ | 98,434 | ||||||||||||||
| Portfolio turnover rate | 76% | 90% | 96% | 106% | 88% | |||||||||||||||||||
| ATotal returns would have been lower had certain expenses not been reduced during the periods shown. BTotal returns do not include the effect of the former sales charges. CCalculated based on average shares outstanding during the period. DExpense ratios reflect operating expenses of the fund. Expenses before reductions do not reflect amounts reimbursed by the investment adviser or reductions from brokerage service arrangements or other expense offset arrangements and do not represent the amount paid by the fund during periods when reimbursements or reductions occur. Expenses net of any voluntary waivers reflect expenses after reimbursement by the investment adviser but prior to reductions from brokerage service arrangements or other expense offset arrangements. Expenses net of all reductions represent the net expenses paid by the fund. EAmount represents less than $.01 per share. |
See accompanying notes which are an integral part of the financial statements.
A-75 Annual Report
| Pacific Basin |
| Performance: The Bottom Line |
Average annual total return reflects the change in the value of an investment, assuming reinvestment of the fund’s dividend income and capital gains (the profits earned upon the sale of securities that have grown in value) and assuming a constant rate of performance each year. The $10,000 table and the fund’s returns do not reflect the deduction of taxes that a shareholder would pay on fund distributions or the redemption of fund shares. During periods of reimbursement by Fidelity, a fund’s total returns will be greater than it would be had the reimbursement not occurred. How a fund did yesterday is no guarantee of how it will do tomorrow.
| Average Annual Total Returns | ||||||
| Periods ended | Past 1 | Past 5 | Past 10 | |||
| October 31, 2005 | year | years | years | |||
| Fidelity Pacific Basin Fund | 26.62% | 3.89% | 5.56% | |||
| $10,000 Over 10 Years | ||||||
Let’s say hypothetically that $10,000 was invested in Fidelity Pacific Basin Fund on October 31, 1995. The chart shows how the value of your investment would have changed, and also shows how the MSCI All Country Pacific Index performed over the same period.
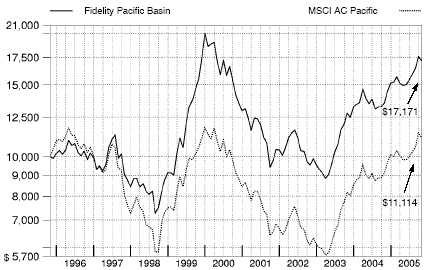
| Annual Report |
| A-76 |
| Pacific Basin |
Management’s Discussion of Fund Performance
Comments from Dale Nicholls, Portfolio Manager of Fidelity® Pacific Basin Fund
Foreign stock markets enjoyed broad based advances during the 12 month period that ended October 31, 2005, encouraged by better than expected corporate earnings and markedly improved economies. For the 12 months overall, the Morgan Stanley Capital InternationalSM Europe, Australasia, Far East (MSCI® EAFE®) Index a performance measure of developed stock markets outside the United States and Canada gained 18.28% . The Japanese stock market climbed to its highest level in more than four years. Positive economic indicators and Prime Minister Koizumi’s decisive election victory attracted record inflows from overseas investors. In response, the Tokyo Stock Exchange Stock Price Index (TOPIX) soared 22.89% . Southeast Asian equities outside of Japan, particularly South Korea, also responded well to the better macroeconomic environment, illustrated by the 19.44% return for the MSCI All Country Far East ex Japan index. European stock markets were up as well, despite investors’ concern about higher energy prices and potential downgrades to economic growth in the region. For the year overall, the MSCI Europe index rose 16.51% .
For the 12 months ending October 31, 2005, the fund returned 26.62%, topping the 21.74% return of the MSCI All Country Pacific index, as well as the 24.72% return of the LipperSM Pacific Region Funds Average. On a country basis, solid stock picking outside of the index in India and South Korea —combined with favorable currency movements in those markets — drove the fund’s results. From a sector standpoint, my picks in information technol ogy — particularly software and services — aided performance. India based Geodesic Information Systems was the top contributor relative to the index and in absolute terms. The company continued to benefit from strong sales of its instant messaging application. Another Indian holding that performed extremely well was Crompton Greaves, a supplier of transformers and related equipment to the power industry. On the other hand, the materials and consumer staples sectors had a negative impact on performance — mostly due to poor stock selection. Geographically, there were only a few modest negative influences, China and Japan being the most notable. Singapore based Accord Customer Care Solutions — the biggest detractor in absolute and relative terms — dropped sharply when it lost a key customer for its wireless handset repair services, and I sold the stock. Chinese agricultural products holding Global Bio Chem Technology Group also struggled, due in part to a decline in the market price of lysine, an ingredient it supplies to livestock feed makers. In absolute terms, the fund’s return was limited by the depreciation of the Japanese yen versus the U.S. dollar, while in relative terms the fund benefited from the yen’s weakness because of its underweighting in Japan.
The views expressed in this statement reflect those of the portfolio manager only through the end of the period of the report as stated on the cover and do not necessarily represent the views of Fidelity or any other person in the Fidelity organization. Any such views are subject to change at any time based upon market or other conditions and Fidelity disclaims any responsibility to update such views. These views may not be relied on as invest ment advice and, because investment decisions for a Fidelity fund are based on numerous factors, may not be relied on as an indication of trading intent on behalf of any Fidelity fund.
| A-77 A-77 |
| Annual Report |
| Pacific Basin Investment Changes |
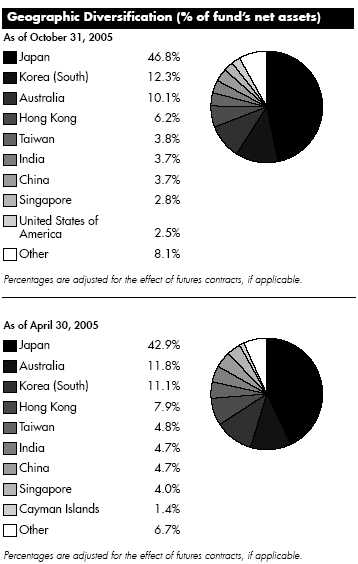
| Asset Allocation | ||||
| % of fund’s | % of fund’s net assets | |||
| net assets | 6 months ago | |||
| Stocks | 97.7 | 99.0 | ||
| Short Term Investments and | ||||
| Net Other Assets | 2.3 | 1.0 |
| Top Ten Stocks as of October 31, 2005 | ||||
| % of fund’s | % of fund’s net assets | |||
| net assets | 6 months ago | |||
| Toyota Motor Corp. (Japan, | ||||
| Automobiles) | 2.8 | 2.6 | ||
| Sumitomo Mitsui Financial Group, | ||||
| Inc. (Japan, Commercial Banks) | 1.9 | 1.1 | ||
| BHP Billiton Ltd. (Australia, Metals | ||||
| & Mining) | 1.8 | 1.8 | ||
| Nippon Electric Glass Co. Ltd. | ||||
| (Japan, Electronic Equipment & | ||||
| Instruments) | 1.5 | 1.7 | ||
| Esprit Holdings Ltd. (Hong Kong, | ||||
| Specialty Retail) | 1.2 | 1.6 | ||
| Softbank Corp. (Japan, Internet | ||||
| Software & Services) | 1.2 | 0.6 | ||
| Sompo Japan Insurance, Inc. | ||||
| (Japan, Insurance) | 1.2 | 0.0 | ||
| Hyundai Motor Co. (Korea | ||||
| (South), Automobiles) | 1.1 | 1.1 | ||
| Mizuho Financial Group, Inc. | ||||
| (Japan, Commercial Banks) | 1.1 | 0.6 | ||
| NHN Corp. (Korea (South), | ||||
| Internet Software & Services) | 1.1 | 0.2 | ||
| 14.9 | ||||
| Market Sectors as of October 31, 2005 | ||||
| % of fund’s | % of fund’s net assets | |||
| net assets | 6 months ago | |||
| Consumer Discretionary | 22.0 | 24.1 | ||
| Financials | 20.8 | 17.5 | ||
| Information Technology | 18.9 | 16.4 | ||
| Industrials | 16.2 | 20.5 | ||
| Materials | 4.9 | 5.9 | ||
| Health Care | 4.7 | 4.5 | ||
| Consumer Staples | 4.1 | 3.7 | ||
| Energy | 2.5 | 2.9 | ||
| Telecommunication Services | 2.5 | 3.1 | ||
| Utilities | 1.1 | 0.4 | ||
Annual Report A-78
| Pacific Basin | ||||||||
| Investments October 31, 2005 | ||||||||
| Showing Percentage of Net Assets | ||||||||
| Common Stocks 97.7% | ||||||||
| Shares | Value (Note 1) | |||||||
| Australia 10.1% | ||||||||
| ABC Learning Centres Ltd. | 414,467 | $ | 2,014,465 | |||||
| AMP Ltd. | 326,199 | 1,778,143 | ||||||
| BHP Billiton Ltd. | 764,530 | 11,869,330 | ||||||
| Billabong International Ltd. | 269,567 | 2,608,299 | ||||||
| Bradken Ltd. | 1,132,139 | 3,174,589 | ||||||
| Cochlear Ltd. | 52,300 | 1,485,296 | ||||||
| Computershare Ltd. | 939,100 | 4,599,489 | ||||||
| ConnectEast Group unit | 4,190,868 | 2,271,948 | ||||||
| Downer EDI Ltd. | 824,355 | 3,747,782 | ||||||
| Macquarie Airports unit | 796,870 | 1,787,579 | ||||||
| Macquarie Bank Ltd. | 103,898 | 5,024,195 | ||||||
| Macquarie Communications | ||||||||
| Infrastructure Group unit | 539,300 | 2,318,754 | ||||||
| Macquarie Infrastructure Group unit | 2,116,213 | 5,427,626 | ||||||
| Newcrest Mining Ltd. | 225,554 | 3,069,576 | ||||||
| PMP Ltd. (a) | 1,041,700 | 1,226,817 | ||||||
| QBE Insurance Group Ltd. | 260,135 | 3,462,384 | ||||||
| Seek Ltd. | 1,169,800 | 2,484,199 | ||||||
| Sonic Healthcare Ltd. | 220,899 | 2,408,284 | ||||||
| United Group Ltd. | 385,894 | 3,029,798 | ||||||
| WorleyParsons Ltd. (d) | 266,900 | 1,955,830 | ||||||
| TOTAL AUSTRALIA | 65,744,383 | |||||||
| Bermuda 0.7% | ||||||||
| Asia Aluminum Holdings Ltd. | 9,088,000 | 738,566 | ||||||
| China Lotsynergy Holding Ltd. (a) | 4,760,000 | 1,565,769 | ||||||
| Ports Design Ltd. | 1,516,000 | 1,417,809 | ||||||
| Skyworth Digital Holdings Ltd. | 3,418,000 | 511,459 | ||||||
| TOTAL BERMUDA | 4,233,603 | |||||||
| Cayman Islands 2.3% | ||||||||
| AAC Acoustic Technology Holdings, Inc. | 1,164,000 | 585,596 | ||||||
| Foxconn International Holdings Ltd. | 1,890,000 | 2,023,581 | ||||||
| FU JI Food & Catering Services Holdings | ||||||||
| Ltd. | 1,060,000 | 1,203,287 | ||||||
| Hutchison Telecommunications | ||||||||
| International Ltd. | 1,796,000 | 2,270,456 | ||||||
| Kingboard Chemical Holdings Ltd. | 1,199,400 | 2,537,398 | ||||||
| KongZhong Corp. sponsored ADR (a) | 204,800 | 2,596,864 | ||||||
| Norstar Founders Group Ltd. | 4,304,000 | 1,165,929 | ||||||
| SinoCom Software Group Ltd. | 2,528,000 | 1,891,410 | ||||||
| Xinyu Hengdeli Holdings Ltd. | 2,416,000 | 582,800 | ||||||
| TOTAL CAYMAN ISLANDS | 14,857,321 | |||||||
| China – 3.7% | ||||||||
| Beijing Media Corp. Ltd. (H Shares) | 887,000 | 1,144,206 | ||||||
| China Construction Bank Corp. (H | ||||||||
| Shares) | 4,012,000 | 1,216,212 | ||||||
| China Mengniu Dairy Co. Ltd. | 1,702,000 | 1,339,276 | ||||||
| China Sun Bio chem Technology Group | ||||||||
| Co. Ltd. | 4,500,000 | 1,168,935 | ||||||
| Chitaly Holdings Ltd. | 2,700,000 | 1,419,293 | ||||||
| Global Bio Chem Technology Group Co. | ||||||||
| Ltd. | 4,060,000 | 1,610,467 | ||||||
| Shares | Value (Note 1) | |||||
| Li Ning Co. Ltd. | 3,044,000 | $ | 1,845,539 | |||
| PetroChina Co. Ltd. (H Shares) | 3,586,000 | 2,751,540 | ||||
| Ping An Insurance (Group) Co. of China, | ||||||
| Ltd. (H Shares) | 1,111,500 | 1,799,425 | ||||
| Shanghai Electric (Group) Corp. | ||||||
| (H Shares) | 6,406,000 | 2,024,574 | ||||
| Tong Ren Tang Technologies Co. Ltd. | ||||||
| (H Shares) | 567,000 | 1,002,038 | ||||
| Vision Grande Group Holdings Ltd. | 1,886,000 | 1,228,609 | ||||
| Weichai Power Co. Ltd. (H Shares) | 666,000 | 1,271,501 | ||||
| Wumart Stores, Inc. (H Shares) | 85,000 | 175,436 | ||||
| Xinao Gas Holdings Ltd. | 2,442,000 | 1,858,567 | ||||
| Yantai Changyu Pioneer Wine Co. | ||||||
| (B Shares) | 1,135,700 | 1,904,529 | ||||
| TOTAL CHINA | 23,760,147 | |||||
| Hong Kong – 6.2% | ||||||
| ASM Pacific Technology Ltd. | 296,000 | 1,368,868 | ||||
| China Overseas Land & Investment Ltd. . | 6,722,000 | 2,059,410 | ||||
| CNOOC Ltd. | 4,853,000 | 3,188,421 | ||||
| Esprit Holdings Ltd. | 1,098,500 | 7,744,098 | ||||
| Hanny Holdings Ltd. | 2,670,759 | 1,498,665 | ||||
| Hengan International Group Co. Ltd. | 522,000 | 484,823 | ||||
| Hong Kong & China Gas Co. Ltd. | 1,165,000 | 2,404,510 | ||||
| Hutchison Whampoa Ltd. | 399,000 | 3,777,892 | ||||
| Lung Kee (Bermuda) Holdings | 698,000 | 522,233 | ||||
| PYI Corp. Ltd. | 14,648,000 | 2,796,538 | ||||
| Shanghai Industrial Holdings Ltd. Class H | 692,000 | 1,231,873 | ||||
| Shun Tak Holdings Ltd. | 3,136,000 | 2,265,399 | ||||
| Solomon Systech Ltd. | 5,296,000 | 1,947,034 | ||||
| Techtronic Industries Co. Ltd. | 1,827,500 | 4,490,896 | ||||
| Television Broadcasts Ltd. | 419,000 | 2,326,847 | ||||
| Wharf Holdings Ltd. | 660,000 | 2,251,906 | ||||
| TOTAL HONG KONG | 40,359,413 | |||||
| India 3.7% | ||||||
| Bajaj Auto Ltd. | 30,383 | 1,150,873 | ||||
| Cipla Ltd. | 161,176 | 1,288,657 | ||||
| Crompton Greaves Ltd. | 83,173 | 1,135,670 | ||||
| Financial Technology (India) Ltd. | 108,228 | 2,353,065 | ||||
| Geodesic Information Systems Ltd. | 840,529 | 4,074,897 | ||||
| Housing Development Finance Corp. Ltd. | 63,800 | 1,370,136 | ||||
| IVRCL Infrastructures & Projects Ltd. | 120,891 | 1,734,774 | ||||
| Max India Ltd. (a) | 218,465 | 2,859,628 | ||||
| Pfizer Ltd. | 85,600 | 1,470,793 | ||||
| Praj Industries Ltd. | 214,484 | 413,311 | ||||
| Shree Renuka Sugars Ltd. | 95,728 | 552,873 | ||||
| State Bank of India | 208,783 | 4,329,549 | ||||
| Suzlon Energy Ltd. (a) | 87,270 | 1,383,695 | ||||
| TOTAL INDIA | 24,117,921 | |||||
| Indonesia – 1.4% | ||||||
| PT Mitra Adiperkasa Tbk | 29,415,000 | 2,905,908 | ||||
| PT Perusahaan Gas Negara Tbk Series B | 4,862,000 | 2,593,712 | ||||
See accompanying notes which are an integral part of the financial statements.
A-79 A-79 Annual Report
| Pacific Basin | ||||||
| Investments - continued | ||||||
| Common Stocks continued | ||||||
| Shares | Value (Note 1) | |||||
| Indonesia – continued | ||||||
| PT Semen Gresik Tbk | 559,500 | $ | 1,033,605 | |||
| PT Telkomunikasi Indonesia Tbk Series B | 5,140,000 | 2,538,903 | ||||
| TOTAL INDONESIA | 9,072,128 | |||||
| Japan 46.8% | ||||||
| Aeon Co. Ltd. | 70,800 | 1,471,535 | ||||
| Aisin Seiki Co. Ltd. | 86,800 | 2,615,924 | ||||
| Aruze Corp. (d) | 105,900 | 1,925,934 | ||||
| Asahi Breweries Ltd. | 184,700 | 2,314,524 | ||||
| Asics Corp. (d) | 293,000 | 2,527,279 | ||||
| Astellas Pharma, Inc. | 122,800 | 4,413,394 | ||||
| Bandai Visual Co. Ltd. | 473 | 1,589,348 | ||||
| Casio Computer Co. Ltd. | 153,000 | 2,318,759 | ||||
| Chiyoda Corp. | 188,000 | 3,248,082 | ||||
| Chugai Pharmaceutical Co. Ltd. | 124,100 | 2,729,805 | ||||
| Commuture Corp. (d) | 234,000 | 2,087,273 | ||||
| Cosmo Oil Co. Ltd. (d) | 393,000 | 1,912,736 | ||||
| Credit Saison Co. Ltd. | 68,700 | 3,123,505 | ||||
| Cyber Agent Ltd. (d) | 530 | 954,697 | ||||
| Cyber Agent Ltd. New (d) | 530 | 954,697 | ||||
| Daikin Industries Ltd. | 93,500 | 2,445,371 | ||||
| Dip Corp. (a)(d) | 481 | 749,797 | ||||
| Doshisha Co. Ltd. | 28,500 | 505,970 | ||||
| E*TRADE Securities Co. Ltd. (d) | 499 | 2,623,103 | ||||
| East Japan Railway Co | 698 | 4,170,909 | ||||
| Eisai Co. Ltd. | 61,900 | 2,433,732 | ||||
| Fuji Television Network, Inc. | 755 | 1,686,914 | ||||
| Fujitsu Ltd. | 671,000 | 4,439,582 | ||||
| Hamakyorex Co. Ltd. (d) | 173,200 | 6,269,752 | ||||
| Hikari Tsushin, Inc. | 34,900 | 2,245,642 | ||||
| Hitachi Koki Co. Ltd. | 144,000 | 1,964,126 | ||||
| Hitachi Metals Ltd. | 29,000 | 298,611 | ||||
| Hokuhoku Financial Group, Inc. | 831,000 | 3,447,170 | ||||
| Hokuto Corp. (d) | 40,500 | 657,281 | ||||
| Hoya Corp. | 29,400 | 1,033,712 | ||||
| Hoya Corp. New | 88,200 | 3,078,221 | ||||
| Index Corp. New (d) | 1,336 | 1,504,098 | ||||
| Intelligent Wave, Inc. | 1,398 | 4,636,947 | ||||
| Ise Chemical Corp. | 333,000 | 1,710,114 | ||||
| JAFCO Co. Ltd. | 37,300 | 2,248,248 | ||||
| Japan Logistics Fund, Inc | 324 | 2,034,273 | ||||
| JSR Corp. | 141,300 | 3,346,769 | ||||
| Kamigumi Co. Ltd. | 236,000 | 1,951,828 | ||||
| Keihanshin Real Estate Co. Ltd. | 4,000 | 28,821 | ||||
| Kitz Corp. | 333,000 | 1,986,962 | ||||
| KK daVinci Advisors (a) | 502 | 2,369,335 | ||||
| KOEI Co. Ltd. (d) | 38,000 | 1,151,802 | ||||
| Konica Minolta Holdings, Inc. | 227,000 | 1,889,189 | ||||
| Koyo Seiko Co. Ltd. | 153,000 | 2,461,860 | ||||
| livedoor Co. Ltd. (a) | 676,108 | 2,488,463 | ||||
| livedoor MARKETING Co. Ltd. (a) | 15,647 | 636,876 | ||||
| Mars Engineering Corp. | 50,200 | 1,547,676 | ||||
| Shares | Value (Note 1) | |||||
| Matsushita Electric Industrial Co. Ltd. | 331,000 | $ | 6,090,400 | |||
| Miraca Holdings, Inc. | 114,500 | 2,568,215 | ||||
| Mitsubishi Corp. | 319,500 | 6,225,576 | ||||
| Mitsui & Co. Ltd. | 525,000 | 6,469,793 | ||||
| Mitsui Trust Holdings, Inc. | 505,000 | 6,096,497 | ||||
| Mizuho Financial Group, Inc. | 1,111 | 7,427,755 | ||||
| Monex Beans Holdings, Inc. (d) | 1,911 | 2,019,048 | ||||
| Nabtesco Corp. | 239,000 | 2,013,896 | ||||
| Nidec Corp. | 19,500 | 1,146,649 | ||||
| Nidec Corp. New | 19,500 | 1,146,649 | ||||
| Nikko Cordial Corp. | 239,500 | 2,903,753 | ||||
| Nippon Chemi con Corp. | 439,000 | 2,672,674 | ||||
| Nippon Electric Glass Co. Ltd. | 519,000 | 9,955,596 | ||||
| Nippon Mining Holdings, Inc. | 464,500 | 3,431,318 | ||||
| Nishi Nippon City Bank Ltd. | 427,000 | 2,492,378 | ||||
| Nissin Co. Ltd. | 1,381,800 | 2,010,392 | ||||
| Nissin Co. Ltd. New | 1,381,800 | 1,986,458 | ||||
| Nitto Denko Corp. | 82,300 | 4,996,249 | ||||
| Nittoku Engineering Co. Ltd. | 140,500 | 1,186,334 | ||||
| NOK Corp. | 76,600 | 2,315,157 | ||||
| Oricon, Inc. (d) | 584 | 758,631 | ||||
| ORIX Corp. | 34,600 | 6,493,236 | ||||
| Parco Co. Ltd. | 163,000 | 1,590,881 | ||||
| Saint Marc Co. Ltd. | 25,900 | 1,312,145 | ||||
| Sanken Electric Co. Ltd. | 131,000 | 1,514,533 | ||||
| Sankyo Co. Ltd. (Gunma) | 31,400 | 1,661,487 | ||||
| Sega Sammy Holdings, Inc. | 67,100 | 2,417,364 | ||||
| Sega Sammy Holdings, Inc. New | 67,100 | 2,434,797 | ||||
| SFCG Co. Ltd. (d) | 15,610 | 3,770,315 | ||||
| Softbank Corp. (d) | 133,100 | 7,549,976 | ||||
| Sompo Japan Insurance, Inc | 496,000 | 7,474,069 | ||||
| Sony Corp. | 78,600 | 2,578,080 | ||||
| Stanley Electric Co. Ltd. | 309,500 | 4,779,013 | ||||
| Sumitomo Electric Industries Ltd. | 273,700 | 3,607,577 | ||||
| Sumitomo Forestry Co. Ltd. | 325,000 | 3,014,387 | ||||
| Sumitomo Mitsui Financial Group, Inc. . | 1,329 | 12,315,015 | ||||
| Sumitomo Realty & Development Co. Ltd. | 289,000 | 4,680,213 | ||||
| Sumitomo Rubber Industries Ltd. | 39,000 | 480,275 | ||||
| Sysmex Corp. | 21,900 | 872,425 | ||||
| Sysmex Corp. New | 21,900 | 872,425 | ||||
| T&D Holdings, Inc. | 86,000 | 5,429,404 | ||||
| Takara Holdings, Inc. (d) | 280,000 | 1,661,020 | ||||
| Takeda Pharamaceutical Co. Ltd. | 75,500 | 4,158,438 | ||||
| Teijin Ltd | 554,000 | 3,310,435 | ||||
| Telewave, Inc. | 291 | 1,701,073 | ||||
| Terumo Corp. | 80,800 | 2,456,092 | ||||
| The Sumitomo Warehouse Co. Ltd. (d) | 131,000 | 1,018,765 | ||||
| Toc Co. Ltd. | 35,000 | 203,081 | ||||
| Tokyo Tomin Bank Ltd. (d) | 65,400 | 2,407,093 | ||||
| Toyota Motor Corp. | 398,200 | 18,478,469 | ||||
| Trend Micro, Inc. | 58,000 | 1,813,265 | ||||
| Tsutsumi Jewelry Co. Ltd. | 54,400 | 1,630,051 | ||||
| UCS Co. Ltd. | 23,700 | 903,082 | ||||
| Uni Charm Corp. | 38,000 | 1,727,703 | ||||
See accompanying notes which are an integral part of the financial statements.
Annual Report A-80
| Common Stocks continued | ||||||
| Shares | Value (Note 1) | |||||
| Japan continued | ||||||
| Urban Corp. | 21,100 | $ | 1,311,998 | |||
| USS Co. Ltd. | 33,060 | 2,278,988 | ||||
| Valor Co. Ltd. | 1,200 | 36,373 | ||||
| Yahoo! Japan Corp | 591 | 629,533 | ||||
| Yahoo! Japan Corp. New | 591 | 639,770 | ||||
| Yaskawa Electric Corp. (a) | 325,000 | 2,541,542 | ||||
| TOTAL JAPAN | 303,898,452 | |||||
| Korea (South) – 12.3% | ||||||
| Binggrea Co. Ltd. | 38,230 | 1,585,592 | ||||
| CDNetworks Co. Ltd. | 33,133 | 555,390 | ||||
| Core Logic, Inc. | 54,100 | 1,894,017 | ||||
| Doosan Heavy Industries & Construction | ||||||
| Co. Ltd. | 127,390 | 2,757,675 | ||||
| GS Holdings Corp. | 40,951 | 937,479 | ||||
| Hyundai Engineering & Construction Co. | ||||||
| Ltd. (a) | 56,400 | 1,753,045 | ||||
| Hyundai Mipo Dockyard Co. Ltd. | 22,070 | 1,363,520 | ||||
| Hyundai Motor Co. | 101,540 | 7,450,154 | ||||
| INSUN ENT Co. Ltd. | 51,900 | 695,977 | ||||
| Keangnam Enterprises (a) | 79,530 | 761,781 | ||||
| KH Vatec Co. Ltd. | 63,933 | 1,408,485 | ||||
| Kia Motors Corp. | 204,180 | 3,667,024 | ||||
| kiwoom.com Securities Co. Ltd. | 84,549 | 1,611,613 | ||||
| Kookmin Bank | 57,800 | 3,172,355 | ||||
| Korea Investment Holdings Co. Ltd. | 59,080 | 1,516,612 | ||||
| Kumho Electric Co. Ltd. | 38,179 | 2,260,020 | ||||
| Kumho Electric Co. Ltd. rights | ||||||
| 11/23/05 (a) | 3,452 | 58,856 | ||||
| LG Electronics, Inc. | 30,000 | 1,945,401 | ||||
| LG Household & Health Care Ltd. | 43,570 | 2,378,821 | ||||
| Lightron Fiber Optic Devices, Inc. | 106,600 | 636,128 | ||||
| NCsoft Corp. (a) | 20,960 | 1,957,470 | ||||
| NHN Corp. (a) | 43,836 | 7,285,003 | ||||
| Orion Corp. | 26,990 | 5,235,127 | ||||
| Phoenix PDE Co. Ltd. | 335,533 | 1,613,386 | ||||
| S.M.Entertainment Co. Ltd. | 168,780 | 2,271,416 | ||||
| S1 Corp. | 34,900 | 1,512,667 | ||||
| Samsung Electronics Co. Ltd. | 13,240 | 7,000,457 | ||||
| SFA Engineering Corp. | 158,200 | 3,773,159 | ||||
| Shinhan Financial Group Co. Ltd. | 57,802 | 1,926,733 | ||||
| TSM Tech Co. Ltd. | 163,400 | 1,799,903 | ||||
| Woori Finance Holdings Co. Ltd. | 133,280 | 2,048,988 | ||||
| YBM Sisa.com, Inc. | 77,162 | 1,448,635 | ||||
| Yedang Entertainment Co. Ltd. (a) | 208,825 | 3,240,387 | ||||
| TOTAL KOREA (SOUTH) | 79,523,276 | |||||
| Malaysia 1.1% | ||||||
| Commerce Asset Holding BHD | 1,191,700 | 1,736,252 | ||||
| IOI Corp. BHD | 376,700 | 1,307,224 | ||||
| Shares | Value (Note 1) | |||||
| Public Bank BHD (For. Reg.) | 1,177,656 | $ | 2,058,948 | |||
| Southern Bank BHD (For. Reg.) | 1,733,400 | 1,744,879 | ||||
| TOTAL MALAYSIA | 6,847,303 | |||||
| Philippines – 0.9% | ||||||
| Philippine Long Distance Telephone Co. | 92,000 | 2,805,900 | ||||
| Philippine Long Distance Telephone Co. | ||||||
| sponsored ADR (d) | 102,200 | 3,081,330 | ||||
| TOTAL PHILIPPINES | 5,887,230 | |||||
| Singapore – 2.8% | ||||||
| Ascendas Real Estate Investment Trust | ||||||
| (A REIT) | 1,444,550 | 1,714,169 | ||||
| CapitaLand Ltd. | 1,113,000 | 2,089,524 | ||||
| Citiraya Industries Ltd. (a) | 1,791,000 | 11 | ||||
| GES International Ltd. | 2,930,000 | 1,608,702 | ||||
| HTL International Holdings Ltd. | 3,177,000 | 2,363,267 | ||||
| Keppel Corp. Ltd. | 468,000 | 3,205,006 | ||||
| Mapletree Logistics Trust (REIT) | 1,308,000 | 795,371 | ||||
| Osim International Ltd. | 1,065,000 | 974,555 | ||||
| Pertama Holdings Ltd. | 6,739,000 | 1,472,049 | ||||
| Raffles Education Corp. Ltd. | 4,076,000 | 2,598,861 | ||||
| Singapore Exchange Ltd. | 949,000 | 1,512,708 | ||||
| TOTAL SINGAPORE | 18,334,223 | |||||
| Taiwan 3.8% | ||||||
| Acer, Inc. | 1,085,440 | 2,196,664 | ||||
| Advanced Semiconductor Engineering, | ||||||
| Inc. | 2,843,460 | 1,733,119 | ||||
| Asia Optical Co., Inc. | 267,045 | 1,540,116 | ||||
| Cheng Shin Rubber Industry Co. Ltd. | 1,781,000 | 1,284,598 | ||||
| Chipbond Technology Corp. | 1,431,231 | 1,855,611 | ||||
| Far EasTone Telecommunications Co. Ltd. | 1,380,700 | 1,604,915 | ||||
| Formosa Petrochemical Corp. | 664,694 | 1,216,405 | ||||
| Holtek Semiconductor, Inc. | 1,098,258 | 1,296,247 | ||||
| Hon Hai Precision Industry Co. Ltd. | ||||||
| (Foxconn) | 296,071 | 1,279,534 | ||||
| Kinik Co. | 36,900 | 73,027 | ||||
| MediaTek, Inc. | 180,400 | 1,556,586 | ||||
| Optimax Technology Corp. | 576,850 | 736,719 | ||||
| Phoenix Precision Technology Corp. | 1,358,000 | 1,714,120 | ||||
| Pihsiang Machinery Manufacturing Co. | 431,270 | 625,988 | ||||
| Springsoft, Inc. | 1,049,981 | 1,545,954 | ||||
| Taiwan Secom Co. | 904,260 | 1,222,246 | ||||
| Tong Yang Industry Co. Ltd. | 1,491,000 | 1,844,225 | ||||
| Yageo Corp. (a) | 4,407,000 | 1,339,773 | ||||
| TOTAL TAIWAN | 24,665,847 | |||||
| Thailand – 1.7% | ||||||
| Advanced Info Service PCL (For. Reg.) | 1,045,500 | 2,563,757 | ||||
| Asia Credit PCL (For. Reg.) (a) | 10,787,400 | 1,521,029 | ||||
| Bangkok Bank Ltd. PCL (For. Reg.) | 705,200 | 1,781,157 | ||||
| Bumrungrad Hospital PCL (For. Reg.) | 773,700 | 507,515 | ||||
| Khon Kaen Sugar Industry PCL (For. | ||||||
| Reg.) (a) | 3,528,800 | 605,728 | ||||
See accompanying notes which are an integral part of the financial statements.
A-81 A-81 Annual Report
| Pacific Basin | ||||
| Investments - continued | ||||
| Common Stocks continued | ||||
| Shares | Value (Note 1) | |||
| Thailand – continued | ||||
| Sino Thai Engineering & Construction | ||||
| PCL (For. Reg.) | 4,031,300 | $ 1,156,601 | ||
| Thai Oil PCL (For. Reg.) | 992,000 | 1,714,958 | ||
| Total Access Communication PCL (a) | 172,000 | 543,520 | ||
| True Corp. PCL (a) | 4,760,100 | 863,775 | ||
| True Corp. PCL (For. Reg.) rights | ||||
| 4/30/08 (a) | 206,113 | 0 | ||
| TOTAL THAILAND | 11,258,040 | |||
| United States of America – 0.2% | ||||
| ResMed, Inc. CHESS Depositary | ||||
| Interests (a) | 414,302 | 1,595,441 | ||
| TOTAL COMMON STOCKS | ||||
| (Cost $530,151,371) | 634,154,728 | |||
| Money Market Funds 5.3% | ||||
| Fidelity Cash Central Fund, | ||||
| 3.92% (b) | 11,221,461 | 11,221,461 | ||
| Fidelity Securities Lending Cash | ||||
| Central Fund, 3.94% (b)(c) | 22,968,194 | 22,968,194 | ||
| TOTAL MONEY MARKET FUNDS | ||||
| (Cost $34,189,655) | 34,189,655 | |||
| TOTAL INVESTMENT PORTFOLIO 103.0% | ||||
| (Cost $564,341,026) | 668,344,383 | |||
| NET OTHER ASSETS (3.0)% | (19,494,458) | |||
| NET ASSETS 100% | $ 648,849,925 | |||
| Legend (a) Non-income producing (b) Affiliated fund that is available only to investment companies and other accounts managed by Fidelity Investments. The rate quoted is the annualized seven-day yield of the fund at period end. A complete unaudited listing of the fund’s holdings as of its most recent quarter end is available upon request. (c) Investment made with cash collateral received from securities on loan. (d) Security or a portion of the security is on loan at period end. |
See accompanying notes which are an integral part of the financial statements.
Annual Report A-82
| Pacific Basin | ||||||
| Financial Statements | ||||||
| Statement of Assets and Liabilities | ||||||
| October 31, 2005 | ||||||
| Assets | ||||||
| Investment in securities, at value | ||||||
| (including securities loaned of | ||||||
| $21,877,440) (cost | ||||||
| $564,341,026) — See accom- | ||||||
| panying schedule | $ | 668,344,383 | ||||
| Foreign currency held at value | ||||||
| (cost $2,043,589) | 2,043,751 | |||||
| Receivable for investments sold | 4,307,548 | |||||
| Receivable for fund shares sold | 5,633,629 | |||||
| Dividends receivable | 843,005 | |||||
| Interest receivable | 39,386 | |||||
| Other affiliated receivables | 38 | |||||
| Other receivables | 52,914 | |||||
| Total assets | 681,264,654 | |||||
| Liabilities | ||||||
| Payable for investments purchased $ | 7,748,422 | |||||
| Payable for fund shares redeemed | 335,795 | |||||
| Accrued management fee | 351,683 | |||||
| Other affiliated payables | 151,628 | |||||
| Other payables and accrued | ||||||
| expenses | 859,007 | |||||
| Collateral on securities loaned, at | ||||||
| value | 22,968,194 | |||||
| Total liabilities | 32,414,729 | |||||
| Net Assets | $ | 648,849,925 | ||||
| Net Assets consist of: | ||||||
| Paid in capital | $ | 538,968,897 | ||||
| Undistributed net investment | ||||||
| income | 5,234,889 | |||||
| Accumulated undistributed net | ||||||
| realized gain (loss) on invest- | ||||||
| ments and foreign currency | ||||||
| transactions | 1,408,452 | |||||
| Net unrealized appreciation (de- | ||||||
| preciation) on investments and | ||||||
| assets and liabilities in foreign | ||||||
| currencies | 103,237,687 | |||||
| Net Assets, for 28,944,341 shares | ||||||
| outstanding | $ | 648,849,925 | ||||
| Net Asset Value, offering price | ||||||
| and redemption price per share | ||||||
| ($648,849,925 ÷ 28,944,341 | ||||||
| shares) | $ | 22.42 | ||||
| Statement of Operations | ||||||
| Year ended October 31, 2005 | ||||||
| Investment Income | ||||||
| Dividends | $ | 10,725,230 | ||||
| Special Dividends | 1,319,113 | |||||
| Interest | 109,250 | |||||
| Security lending | 263,063 | |||||
| 12,416,656 | ||||||
| Less foreign taxes withheld | (1,086,166) | |||||
| Total income | 11,330,490 | |||||
| Expenses | ||||||
| Management fee | ||||||
| Basic fee | $ | 3,816,017 | ||||
| Performance adjustment | (240,414) | |||||
| Transfer agent fees | 1,394,350 | |||||
| Accounting and security lending | ||||||
| fees | 265,782 | |||||
| Independent trustees’ | ||||||
| compensation | 2,618 | |||||
| Custodian fees and expenses | 455,694 | |||||
| Registration fees | 9,099 | |||||
| Audit | 87,342 | |||||
| Legal | 1,405 | |||||
| Miscellaneous | 6,708 | |||||
| Total expenses before reductions | 5,798,601 | |||||
| Expense reductions | (237,152) | 5,561,449 | ||||
| Net investment income (loss) | 5,769,041 | |||||
| Realized and Unrealized Gain | ||||||
| (Loss) | ||||||
| Net realized gain (loss) on: | ||||||
| Investment securities (net of for- | ||||||
| eign taxes of $1,155,104) | 49,214,165 | |||||
| Foreign currency transactions | (308,068) | |||||
| Total net realized gain (loss) | 48,906,097 | |||||
| Change in net unrealized appreci- | ||||||
| ation (depreciation) on: | ||||||
| Investment securities (net of in- | ||||||
| crease in deferred foreign | ||||||
| taxes of $587,827) | 65,206,002 | |||||
| Assets and liabilities in foreign | ||||||
| currencies | (83,641) | |||||
| Total change in net unrealized | ||||||
| appreciation (depreciation) | 65,122,361 | |||||
| Net gain (loss) | 114,028,458 | |||||
| Net increase (decrease) in net as- | ||||||
| sets resulting from operations . | $ | 119,797,499 | ||||
See accompanying notes which are an integral part of the financial statements.
A-83 Annual Report
| Pacific Basin | ||||||||||||||||||||||
| Financial Statements - continued | ||||||||||||||||||||||
| Statement of Changes in Net Assets | ||||||||||||||||||||||
| Year ended | Year ended | |||||||||||||||||||||
| October 31, | October 31, | |||||||||||||||||||||
| 2005 | 2004 | |||||||||||||||||||||
| Increase (Decrease) in Net Assets | ||||||||||||||||||||||
| Operations | ||||||||||||||||||||||
| Net investment income (loss) | $ | 5,769,041 | $ | 1,889,777 | ||||||||||||||||||
| Net realized gain (loss) | 48,906,097 | 37,378,041 | ||||||||||||||||||||
| Change in net unrealized appreciation (depreciation) | 65,122,361 | (19,720,916) | ||||||||||||||||||||
| Net increase (decrease) in net assets resulting from operations | 119,797,499 | 19,546,902 | ||||||||||||||||||||
| Distributions to shareholders from net investment income | (1,990,052) | (3,891,845) | ||||||||||||||||||||
| Distributions to shareholders from net realized gain | (3,233,832) | — | ||||||||||||||||||||
| Total distributions | (5,223,884) | (3,891,845) | ||||||||||||||||||||
| Share transactions | ||||||||||||||||||||||
| Proceeds from sales of shares | 203,333,895 | 173,753,484 | ||||||||||||||||||||
| Reinvestment of distributions | 4,800,773 | 3,503,557 | ||||||||||||||||||||
| Cost of shares redeemed | (119,138,687) | (167,584,200) | ||||||||||||||||||||
| Net increase (decrease) in net assets resulting from share transactions | 88,995,981 | 9,672,841 | ||||||||||||||||||||
| Redemption fees | 153,147 | 548,652 | ||||||||||||||||||||
| Total increase (decrease) in net assets | 203,722,743 | 25,876,550 | ||||||||||||||||||||
| Net Assets | ||||||||||||||||||||||
| Beginning of period | 445,127,182 | 419,250,632 | ||||||||||||||||||||
| End of period (including undistributed net investment income of $5,234,889 and undistributed net investment | ||||||||||||||||||||||
| income of $1,854,449, respectively) | $ 648,849,925 | $ | 445,127,182 | |||||||||||||||||||
| Other Information | ||||||||||||||||||||||
| Shares | ||||||||||||||||||||||
| Sold | 9,742,425 | 9,569,285 | ||||||||||||||||||||
| Issued in reinvestment of distributions | 262,912 | 207,801 | ||||||||||||||||||||
| Redeemed | (5,917,502) | (9,495,851) | ||||||||||||||||||||
| Net increase (decrease) | 4,087,835 | 281,235 | ||||||||||||||||||||
| Financial Highlights | ||||||||||||||||||||||
| Years ended October 31, | 2005 | 2004 | 2003 | 2002 | 2001 | |||||||||||||||||
| Selected Per Share Data | ||||||||||||||||||||||
| Net asset value, beginning of period | $ | 17.91 | $ | 17.06 | $ 12.73 | $ | 13.09 | $ | 20.32 | |||||||||||||
| Income from Investment Operations | ||||||||||||||||||||||
| Net investment income (loss)D | 22E | .07 | .06 | (.02) | (.02) | |||||||||||||||||
| Net realized and unrealized gain (loss) | 4.49 | .92 | 4.26 | (.36) | (5.91) | |||||||||||||||||
| Total from investment operations | 4.71 | .99 | 4.32 | (.38) | (5.93) | |||||||||||||||||
| Distributions from net investment income | (.08) | (.16) | — | — | (1.10) | |||||||||||||||||
| Distributions from net realized gain | (.13) | — | — | — | (.23) | |||||||||||||||||
| Total distributions | (.21) | (.16) | — | (1.33) | ||||||||||||||||||
| Redemption fees added to paid in capitalD | 01 | .02 | .01 | .02 | .03 | |||||||||||||||||
| Net asset value, end of period | $ | 22.42 | $ | 17.91 | $ 17.06 | $ | 12.73 | $ | 13.09 | |||||||||||||
| Total ReturnA,B,C | 26.62% | 5.98% | 34.01% | (2.75)% | (30.79)% | |||||||||||||||||
| Ratios to Average Net AssetsF | ||||||||||||||||||||||
| Expenses before expense reductions | 1.10% | 1.20% | 1.17% | 1.51% | 1.48% | |||||||||||||||||
| Expenses net of voluntary waivers, if any | 1.10% | 1.20% | 1.17% | 1.51% | 1.48% | |||||||||||||||||
| Expenses net of all reductions | 1.05% | 1.19% | 1.17% | 1.50% | 1.45% | |||||||||||||||||
| Net investment income (loss) | 1.09%E | .42% | .41% | (.15)% | (.11)% | |||||||||||||||||
| Supplemental Data | ||||||||||||||||||||||
| Net assets, end of period (000 omitted) | $ | 648,850 | $ | 445,127 | $ 419,251 | $ | 306,206 | $ | 303,672 | |||||||||||||
| Portfolio turnover rate | 78% | 145% | 97% | 98% | 123% | |||||||||||||||||
| ATotal returns would have been lower had certain expenses not been reduced during the periods shown. BTotal returns do not include the effect of the former sales charges. CTotal returns do not include the effect of the former contingent deferred sales charge. DCalculated based on average shares outstanding during the period. EInvestment income per share reflects a special dividend which amounted to $.05 per share. Excluding the special dividend, the ratio of net investment income to average net assets would have been .84%. FExpense ratios reflect operating expenses of the fund. Expenses before reductions do not reflect amounts reimbursed by the investment adviser or reductions from brokerage service arrangements or other expense offset arrangements and do not represent the amount paid by the fund during periods when reimbursements or reductions occur. Expenses net of any voluntary waivers reflect expenses after reimbursement by the investment adviser but prior to reductions from brokerage service arrangements or other expense offset arrangements. Expenses net of all reductions represent the net expenses paid by the fund. |
See accompanying notes which are an integral part of the financial statements.
Annual Report A-84
| Southeast Asia |
| Performance: The Bottom Line |
Average annual total return reflects the change in the value of an investment, assuming reinvestment of the fund’s dividend income and capital gains (the profits earned upon the sale of securities that have grown in value) and assuming a constant rate of performance each year. The $10,000 table and the fund’s returns do not reflect the deduction of taxes that a shareholder would pay on fund distributions or the redemption of fund shares. During periods of reimbursement by Fidelity, a fund’s total returns will be greater than it would be had the reimbursement not occurred. How a fund did yesterday is no guarantee of how it will do tomorrow.
| Average Annual Total Returns | ||||||
| Periods ended | Past 1 | Past 5 | Past 10 | |||
| October 31, 2005 | year | years | years | |||
| Fidelity Southeast Asia Fund | 26.84% | 10.38% | 3.97% | |||
| $10,000 Over 10 Years | ||||||
Let’s say hypothetically that $10,000 was invested in Fidelity Southeast Asia Fund on October 31, 1995. The chart shows how the value of your investment would have changed, and also shows how the MSCI AC Far East ex Japan Index performed over the same period.
![]()
| A-85 |
| Annual Report |
| Southeast Asia |
Management’s Discussion of Fund Performance
Comments from Allan Liu, Portfolio Manager of Fidelity® Southeast Asia Fund
Foreign stock markets enjoyed broad based advances during the 12 month period that ended October 31, 2005, encouraged by better than expected corporate earnings and markedly improved economies. For the 12 months overall, the Morgan Stanley Capital InternationalSM Europe, Australasia, Far East (MSCI® EAFE®) Index a performance measure of developed stock markets outside the United States and Canada gained 18.28% . The Japanese stock market climbed to its highest level in more than four years. Positive economic indicators and Prime Minister Koizumi’s decisive election victory attracted record inflows from overseas investors. In response, the Tokyo Stock Exchange Stock Price Index (TOPIX) soared 22.89% . Southeast Asian equities outside of Japan, particularly South Korea, also responded well to the better macroeconomic environment, illustrated by the 19.44% return for the MSCI All Country Far East ex Japan index. European stock markets were up as well, despite investors’ concern about higher energy prices and potential downgrades to economic growth in the region. For the year overall, the MSCI Europe index rose 16.51% .
For the 12 months ending October 31, 2005, the fund returned 26.84%, beating both the MSCI All Country Far East ex Japan index and the 25.23% return of the LipperSM Pacific Region ex Japan Funds Average. Stock selection added to relative performance across a broad range of countries, includ ing Taiwan, Singapore, South Korea, Indonesia and China. On a sector basis, financials, information technology and consumer discretionary had the most positive impact. One leading financial holding was Shinhan Financial Group, a well managed bank that benefited from substantial reductions in loan loss provisions amid South Korea’s gradual economic recovery. The fund carried a significant overweighting and the stock strongly outperformed the index, so Shinhan benefited both absolute and relative performance. Within technology, the fund benefited from one out of index position —Foxconn International Holdings, a Hong Kong listed cellular handset contract manufacturer whose stock price more than doubled on strong demand from customers such as Nokia and Motorola. On the other hand, a significant underweighting in index component China Mobile — one of China’s three cellular service providers — hurt relative performance, as the stock posted a strong gain. I was uncomfortable with the regulatory uncertainty surrounding the country’s launch of 3G (third generation) cellular service. Another notable detractor was Taiwanese shipping holding Yang Ming Marine Transport. While its valuation appeared attractive, fears of excess shipping capacity sidetracked the stock. Several stocks mentioned in this report were no longer held at period end.
The views expressed in this statement reflect those of the portfolio manager only through the end of the period of the report as stated on the cover and do not necessarily represent the views of Fidelity or any other person in the Fidelity organization. Any such views are subject to change at any time based upon market or other conditions and Fidelity disclaims any responsibility to update such views. These views may not be relied on as invest ment advice and, because investment decisions for a Fidelity fund are based on numerous factors, may not be relied on as an indication of trading intent on behalf of any Fidelity fund.
| Annual Report |
| A-86 |
| Southeast Asia Investment Changes |
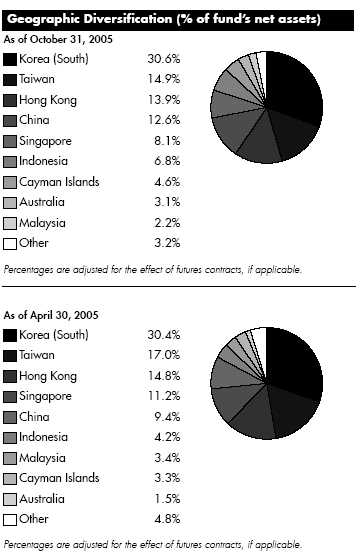
| Asset Allocation | ||||
| % of fund’s | % of fund’s net assets | |||
| net assets | 6 months ago | |||
| Stocks | 98.9 | 98.9 | ||
| Bonds | 0.2 | 0.0 | ||
| Short Term Investments and | ||||
| Net Other Assets | 0.9 | 1.1 |
| Top Ten Stocks as of October 31, 2005 | ||||
| % of fund’s | % of fund’s net assets | |||
| net assets | 6 months ago | |||
| Samsung Electronics Co. Ltd. | ||||
| (Korea (South), Semiconductors | ||||
| & Semiconductor Equipment) | 6.4 | 7.4 | ||
| Shinhan Financial Group Co. Ltd. | ||||
| (Korea (South), Commercial | ||||
| Banks) | 3.4 | 3.2 | ||
| Hutchison Whampoa Ltd. (Hong | ||||
| Kong, Industrial Conglomerates) | 2.5 | 1.6 | ||
| Kookmin Bank (Korea (South), | ||||
| Commercial Banks) | 2.2 | 2.1 | ||
| PT Perusahaan Gas Negara Tbk | ||||
| Series B (Indonesia, Gas | ||||
| Utilities) | 2.2 | 1.1 | ||
| Hyundai Motor Co. (Korea | ||||
| (South), Automobiles) | 2.1 | 1.6 | ||
| Esprit Holdings Ltd. (Hong Kong, | ||||
| Specialty Retail) | 1.8 | 2.2 | ||
| Far EasTone Telecommunications | ||||
| Co. Ltd. (Taiwan, Wireless | ||||
| Telecommunication Services) | 1.6 | 1.5 | ||
| PetroChina Co. Ltd. (H Shares) | ||||
| (China, Oil, Gas & Consumable | ||||
| Fuels) | 1.6 | 1.7 | ||
| Shanghai Electric (Group) Corp. | ||||
| (H Shares) (China, Electrical | ||||
| Equipment) | 1.5 | 0.2 | ||
| 25.3 | ||||
| Market Sectors as of October 31, 2005 | ||||
| % of fund’s | % of fund’s net assets | |||
| net assets | 6 months ago | |||
| Information Technology | 23.5 | 24.1 | ||
| Financials | 20.8 | 22.0 | ||
| Industrials | 16.7 | 16.1 | ||
| Consumer Discretionary | 14.2 | 14.6 | ||
| Energy | 8.9 | 8.7 | ||
| Telecommunication Services | 4.7 | 3.4 | ||
| Utilities | 3.9 | 2.7 | ||
| Consumer Staples | 3.1 | 3.2 | ||
| Materials | 2.6 | 3.8 | ||
| Health Care | 0.5 | 0.3 | ||
A-87 Annual Report
| Southeast Asia | ||||||
| Investments October 31, 2005 | ||||||
| Showing Percentage of Net Assets | ||||||
| Common Stocks 94.6% | ||||||
| Shares | Value (Note 1) | |||||
| Australia 3.1% | ||||||
| BHP Billiton Ltd. | 330,000 | $ 5,123,251 | ||||
| Caltex Australia Ltd. | 460,000 | 6,989,369 | ||||
| ConnectEast Group unit | 5,425,606 | 2,941,323 | ||||
| Energy Resources of Australia Ltd. (d) | 120,000 | 1,184,436 | ||||
| Paladin Resources Ltd. (a) | 2,000,000 | 2,961,090 | ||||
| Rio Tinto Ltd. (d) | 41,000 | 1,726,338 | ||||
| Seek Ltd. | 1,499,500 | 3,184,353 | ||||
| TOTAL AUSTRALIA | 24,110,160 | |||||
| Cayman Islands 4.6% | ||||||
| AAC Acoustic Technology Holdings, Inc. | 11,436,000 | 5,753,331 | ||||
| China Shineway Pharmaceutical Group | ||||||
| Ltd. | 1,000,000 | 419,241 | ||||
| Dynasty Fine Wines Group Ltd. | 13,040,000 | 4,541,737 | ||||
| Foxconn International Holdings Ltd. | 7,390,000 | 7,912,308 | ||||
| International Entertainment Co. (a) | 120,000 | 82,816 | ||||
| Kingboard Chemical Holdings Ltd. | 5,140,500 | 10,875,015 | ||||
| Kingboard Chemical Holdings Ltd. | ||||||
| warrants 12/31/06 (a) | 175,000 | 46,278 | ||||
| New World China Land Ltd. | 7,000,000 | 2,257,453 | ||||
| The9 Computer Technology Consulting | ||||||
| Co. Ltd. sponsored ADR (d) | 170,000 | 3,202,800 | ||||
| Tom Online, Inc. (a) | 4,000,000 | 861,702 | ||||
| TOTAL CAYMAN ISLANDS | 35,952,681 | |||||
| China – 12.6% | ||||||
| Aluminum Corp. of China Ltd. (H Shares) | 6,400,000 | 3,859,599 | ||||
| Angang New Steel Co. Ltd. (H Shares) | 2,200,000 | 1,191,935 | ||||
| Anhui Conch Cement Co. Ltd. (H Shares) | 2,400,000 | 2,507,708 | ||||
| Anhui Expressway Co. Ltd. (H Shares) | 7,000,000 | 3,544,201 | ||||
| Beijing Capital Land Ltd. (H Shares) | 9,800,000 | 2,338,721 | ||||
| Beijing Datang Power Generation Co. | ||||||
| Ltd. | 4,720,000 | 3,348,770 | ||||
| China Mengniu Dairy Co. Ltd. | 6,400,000 | 5,036,055 | ||||
| China Petroleum & Chemical Corp. | ||||||
| (H Shares) | 18,400,000 | 7,405,999 | ||||
| China Resources Land Ltd. | 19,640,000 | 5,383,702 | ||||
| China Telecom Corp. Ltd. (H Shares) | 13,400,000 | 4,371,089 | ||||
| Dongfang Electrical Machinery Co. Ltd. | ||||||
| (H Shares) | 3,700,000 | 2,887,605 | ||||
| Enric Energy Equipment Holdings Ltd. | 256,000 | 59,112 | ||||
| Focus Media Holding Ltd. ADR | 142,000 | 3,728,920 | ||||
| Guangzhou R&F Properties Co. Ltd. | ||||||
| (H Shares) | 1,080,000 | 2,981,386 | ||||
| Harbin Power Equipment Co. Ltd. | ||||||
| (H Shares) | 2,000,000 | 928,781 | ||||
| Li Ning Co. Ltd. | 6,580,000 | 3,989,371 | ||||
| PetroChina Co. Ltd. (H Shares) | 16,038,000 | 12,305,965 | ||||
| Ping An Insurance (Group) Co. of China, | ||||||
| Ltd. (H Shares) | 2,050,000 | 3,318,778 | ||||
| Shanghai Electric (Group) Corp. | ||||||
| (H Shares) | 37,400,000 | 11,820,023 | ||||
| Shanghai Forte Land Co. Ltd. (H Shares) | 13,500,000 | 4,135,976 | ||||
| Sina Corp. (a) | 239,000 | 6,058,650 | ||||
| Shares | Value (Note 1) | |||||
| Sinopec Zhenhai Refining & Chemical | ||||||
| Co. Ltd. (H Shares) | 3,300,000 | $ | 3,852,504 | |||
| Tianjin Capital Environmental Protection | ||||||
| Co. Ltd. (H Shares) | 9,000,000 | 1,938,830 | ||||
| Xinao Gas Holdings Ltd. | 2,500,000 | 1,902,710 | ||||
| TOTAL CHINA | 98,896,390 | |||||
| Hong Kong – 13.9% | ||||||
| Cheung Kong Holdings Ltd. | 811,000 | 8,437,346 | ||||
| China Mobile (Hong Kong) Ltd. | 878,000 | 3,942,220 | ||||
| China Resources Enterprise Ltd. | 2,240,000 | 3,308,523 | ||||
| China Unicom Ltd. | 4,200,000 | 3,223,643 | ||||
| CNOOC Ltd. | 10,600,000 | 6,964,200 | ||||
| Cross Harbour Holdings Ltd. | 2,500,000 | 1,822,087 | ||||
| Esprit Holdings Ltd. | 1,996,000 | 14,071,207 | ||||
| Hong Kong & China Gas Co. Ltd. | 4,080,000 | 8,420,944 | ||||
| Hong Kong Exchanges & Clearing Ltd. . | 740,000 | 2,472,362 | ||||
| Hong Kong Land Holdings Ltd. | 3,600,000 | 10,296,000 | ||||
| Hutchison Whampoa Ltd. | 2,092,000 | 19,807,897 | ||||
| MTR Corp. Ltd. | 1,400,000 | 2,645,735 | ||||
| PYI Corp. Ltd. | 4,000,000 | 763,664 | ||||
| Swire Pacific Ltd. (A Shares) | 844,000 | 7,566,724 | ||||
| Techtronic Industries Co. Ltd. | 3,460,000 | 8,502,599 | ||||
| Television Broadcasts Ltd. | 883,000 | 4,903,594 | ||||
| YGM Trading Ltd. | 1,370,000 | 1,740,754 | ||||
| TOTAL HONG KONG | 108,889,499 | |||||
| Indonesia – 6.6% | ||||||
| PT Bakrie & Brothers Tbk (a) | 347,576,000 | 3,777,074 | ||||
| PT Ciputra Development Tbk (a) | 18,000,000 | 489,011 | ||||
| PT Citra Marga Nusaphala Persada Tbk | 8,000,000 | 616,450 | ||||
| PT Energi Mega Persada Tbk | 49,000,000 | 3,630,533 | ||||
| PT Gadjah Tunggal Tbk (a) | 17,000,000 | 890,098 | ||||
| PT Hexindo Adiperkasa Tbk | 20,300,000 | 2,165,872 | ||||
| PT Indosat Tbk | 745,500 | 359,034 | ||||
| PT Jakarta International Hotel & | ||||||
| Development Tbk (a) | 52,000,000 | 2,363,057 | ||||
| PT Medco Energi International Tbk | 18,200,000 | 6,337,872 | ||||
| PT Mitra Adiperkasa Tbk | 1,029,000 | 101,655 | ||||
| PT Pabrik Kertas Tjiwi Kimia Tbk (a) | 10,700,000 | 2,748,338 | ||||
| PT Perusahaan Gas Negara Tbk Series B | 32,400,000 | 17,284,298 | ||||
| PT Perushahaan Perkebunan London | ||||||
| Sumatra Tbk (a) | 6,600,000 | 1,874,540 | ||||
| PT Telkomunikasi Indonesia Tbk Series B | 6,995,500 | 3,455,427 | ||||
| PT United Tractors Tbk | 15,860,500 | 5,797,378 | ||||
| TOTAL INDONESIA | 51,890,637 | |||||
| Korea (South) – 26.3% | ||||||
| AmorePacific Corp. | 20,000 | 5,957,852 | ||||
| Cheil Communications, Inc. | 7,578 | 1,386,396 | ||||
| Daewoo Heavy Industries & Machinery | ||||||
| Ltd. | 355,790 | 4,413,294 | ||||
| Daishin Securities Co. Ltd. | 325,720 | 4,711,082 | ||||
| Hyundai Department Store Co. Ltd. | 91,810 | 6,094,282 | ||||
See accompanying notes which are an integral part of the financial statements.
Annual Report A-88
| Common Stocks continued | ||||
| Shares | Value (Note 1) | |||
| Korea (South) – continued | ||||
| Hyundai Heavy Industries Co. Ltd. | 155,000 | $ 10,080,934 | ||
| Hyundai Industrial Development & | ||||
| Construction Co. | 161,000 | 5,860,151 | ||
| Hyundai Mipo Dockyard Co. Ltd. | 112,000 | 6,919,537 | ||
| Hyundai Mobis | 72,000 | 5,724,136 | ||
| Hyundai Motor Co. | 68,948 | 5,058,826 | ||
| Kookmin Bank | 317,000 | 17,398,556 | ||
| Korea Investment Holdings Co. Ltd. | 270,000 | 6,931,032 | ||
| LG Engineering & Construction Co. Ltd. | 109,000 | 4,672,172 | ||
| LG Investment & Securities Co. Ltd. | 175,000 | 2,304,836 | ||
| LG.Philips LCD Co. Ltd. sponsored | ||||
| ADR (a) | 123,000 | 2,338,230 | ||
| NCsoft Corp. (a) | 53,000 | 4,949,711 | ||
| NHN Corp. (a) | 43,566 | 7,240,132 | ||
| S Oil Corp. | 98,000 | 7,331,223 | ||
| Samsung Electronics Co. Ltd. | 91,074 | 48,154,038 | ||
| Samsung Electronics Co. Ltd. GDR | 8,200 | 2,189,400 | ||
| Samsung Securities Co. Ltd. | 96,000 | 3,641,378 | ||
| Shinhan Financial Group Co. Ltd. | 799,670 | 26,655,655 | ||
| Shinsegae Co. Ltd. | 20,700 | 7,415,514 | ||
| SK Telecom Co. Ltd. sponsored ADR | 54,000 | 1,091,340 | ||
| Woori Finance Holdings Co. Ltd. | 495,000 | 7,609,911 | ||
| TOTAL KOREA (SOUTH) | 206,129,618 | |||
| Malaysia 2.2% | ||||
| Bintulu Port Holdings BHD | 700,000 | 871,523 | ||
| Bursa Malaysia BHD | 2,500,000 | 3,006,622 | ||
| DRB Hicom BHD | 1,004,500 | 396,478 | ||
| KLCC Property Holdings BHD | 3,400,000 | 1,918,411 | ||
| Lion Corp. BHD (a) | 3,000,000 | 476,821 | ||
| Lion Industries Corp. BHD | 2,500,000 | 539,735 | ||
| Malaysian International Shipping Corp. | ||||
| BHD (For. Reg.) | 920,000 | 2,315,232 | ||
| Pantai Holdings BHD | 364,900 | 177,859 | ||
| Public Bank BHD (For. Reg.) | 2,650,625 | 4,634,205 | ||
| RHB Capital BHD | 3,850,000 | 2,488,477 | ||
| Southern Bank BHD (For. Reg.) | 107,300 | 108,011 | ||
| TOTAL MALAYSIA | 16,933,374 | |||
| Philippines – 0.5% | ||||
| Philippine Long Distance Telephone Co. | 124,000 | 3,781,865 | ||
| Singapore – 8.1% | ||||
| Ascendas Real Estate Investment Trust | ||||
| (A REIT) | 4,187,000 | 4,968,486 | ||
| City Developments Ltd. | 740,000 | 3,844,496 | ||
| Cosco Investment (Singapore) Ltd. | 6,900,000 | 8,961,833 | ||
| CSE Global Ltd. | 5,100,000 | 2,182,897 | ||
| Global Voice Group Ltd. (a) | 32,000,000 | 3,306,078 | ||
| Hotel Properties Ltd. | 1,840,000 | 1,575,110 | ||
| Jaya Holdings Ltd. | 1,900,000 | 1,503,085 | ||
| Jurong Technologies Industrial Corp. Ltd. | 1,885,000 | 2,170,056 | ||
| Keppel Corp. Ltd. | 1,460,000 | 9,998,524 | ||
| Shares | Value (Note 1) | |||||
| Overseas Union Enterprises Ltd. | 190,000 | $ | 1,110,488 | |||
| Parkway Holdings Ltd. | 1,176,000 | 1,374,667 | ||||
| Raffles Holdings Ltd. | 5,300,000 | 3,316,705 | ||||
| Sembcorp Marine Ltd. | 2,887,000 | 4,670,059 | ||||
| Singapore Exchange Ltd. | 366,000 | 583,405 | ||||
| Singapore Land Ltd. | 790,000 | 2,401,925 | ||||
| Singapore Petroleum Co. Ltd. | 2,916,000 | 8,297,736 | ||||
| The Ascott Group Ltd. | 9,100,000 | 3,545,769 | ||||
| TOTAL SINGAPORE | 63,811,319 | |||||
| Taiwan 14.9% | ||||||
| Acer, Inc. | 3,949,600 | 7,993,021 | ||||
| Ambassador Hotel | 1,950,000 | 1,354,187 | ||||
| Asia Optical Co., Inc. | 785,267 | 4,528,834 | ||||
| AU Optronics Corp. | 4,667,900 | 5,898,960 | ||||
| Catcher Technology Co. Ltd. | 414,000 | 2,455,509 | ||||
| Cathay Financial Holding Co. Ltd. | 2,750,000 | 4,835,849 | ||||
| Cheng Uei Precision Industries Co. Ltd. . | 950,000 | 2,689,895 | ||||
| Chinatrust Financial Holding Co. Ltd. | 4,560,447 | 3,540,815 | ||||
| Compeq Manufacturing Co. Ltd. (a) | 11,700,000 | 4,916,919 | ||||
| EVA Airways Corp. | 6,194,626 | 2,400,195 | ||||
| Far East Department Stores Co. Ltd. | 10,600,000 | 5,260,272 | ||||
| Far EasTone Telecommunications Co. Ltd. | 11,000,000 | 12,786,314 | ||||
| Formosa Petrochemical Corp. | 1,643,183 | 3,007,062 | ||||
| Formosa Petrochemical Corp. warrants | ||||||
| (UBS Warrant Programme) | ||||||
| 11/18/05 (a) | 1,993,022 | 3,647,438 | ||||
| Foxconn Technology Co. Ltd. | 982,300 | 3,820,698 | ||||
| Hon Hai Precision Industry Co. Ltd. | ||||||
| (Foxconn) | 2,540,188 | 10,977,967 | ||||
| Ichia Technologies, Inc. | 1,900,000 | 1,500,678 | ||||
| Inventec Co. Ltd. | 7,136,000 | 3,381,739 | ||||
| King Yuan Electronics Co. Ltd. | 4,805,720 | 2,879,006 | ||||
| Les Enphants Co. Ltd. | 1,500,000 | 842,734 | ||||
| MediaTek, Inc. | 800,000 | 6,902,821 | ||||
| Nien Made Enterprise Co. Ltd. | 881,078 | 940,125 | ||||
| Phoenix Precision Technology Corp. | 6,000,000 | 7,573,432 | ||||
| Silitech Technology Corp. | 820,000 | 2,896,145 | ||||
| Taiwan Cellular Co. Ltd. | 3,100,000 | 2,587,068 | ||||
| Taiwan Semiconductor Manufacturing | ||||||
| Co. Ltd. | 3,891,637 | 6,031,478 | ||||
| United Microelectronics Corp. | 2,857,263 | 1,515,857 | ||||
| TOTAL TAIWAN | 117,165,018 | |||||
| Thailand – 0.9% | ||||||
| Advanced Info Service PCL (For. Reg.) | 910,000 | 2,231,486 | ||||
| Airports of Thailand PCL (For. Reg.) | 1,400,000 | 1,733,693 | ||||
| Bangkok Dusit Medical Service PCL Class | ||||||
| F (For. Reg.) | 2,600,000 | 1,332,516 | ||||
| Central Pattana PCL (For. Reg.) | 4,904,500 | 1,443,207 | ||||
| True Corp. PCL (a) | 100 | 18 | ||||
| TOTAL THAILAND | 6,740,920 | |||||
See accompanying notes which are an integral part of the financial statements.
A-89 Annual Report
| Southeast Asia | ||||||||||
| Investments - continued | ||||||||||
| Common Stocks continued | ||||||||||
| Shares | Value (Note 1) | |||||||||
| United Kingdom – 0.9% | ||||||||||
| HSBC Holdings PLC (Hong Kong) (Reg.) . | 460,855 | $ 7,259,388 | ||||||||
| TOTAL COMMON STOCKS | ||||||||||
| (Cost $629,252,702) | 741,560,869 | |||||||||
| Nonconvertible Preferred Stocks 4.3% | ||||||||||
| Korea (South) – 4.3% | ||||||||||
| Hyundai Motor Co. | 105,000 | 5,179,596 | ||||||||
| Hyundai Motor Co. | 330,730 | 16,758,247 | ||||||||
| Samsung Electronics Co. Ltd. | 29,000 | 11,805,551 | ||||||||
| TOTAL NONCONVERTIBLE PREFERRED STOCKS | ||||||||||
| (Cost $19,235,941) | 33,743,394 | |||||||||
| Government Obligations 0.2% | ||||||||||
| Principal | ||||||||||
| Amount | ||||||||||
| Indonesia – 0.2% | ||||||||||
| Indonesian Republic 12.125% | ||||||||||
| 2/15/06 | ||||||||||
| (Cost $1,608,191) | IDR | 16,277,000,000 | 1,602,467 | |||||||
| Money Market Funds 1.2% | ||||||||||
| Shares | ||||||||||
| Fidelity Cash Central Fund, | ||||||||||
| 3.92% (b) | 7,596,494 | 7,596,494 | ||||||||
| Fidelity Securities Lending Cash | ||||||||||
| Central Fund, 3.94% (b)(c) | 1,710,800 | 1,710,800 | ||||||||
| TOTAL MONEY MARKET FUNDS | ||||||||||
| (Cost $9,307,294) | 9,307,294 | |||||||||
| TOTAL INVESTMENT PORTFOLIO 100.3% | ||||||||||
| (Cost $659,404,128) | 786,214,024 | |||||||||
| NET OTHER ASSETS (0.3)% | (2,449,195) | |||||||||
| NET ASSETS 100% | $ 783,764,829 | |||||||||
| Currency Abbreviations |
| IDR — Indonesian rupiah |
| Legend (a) Non-income producing (b) Affiliated fund that is available only to investment companies and other accounts managed by Fidelity Investments. The rate quoted is the annualized seven-day yield of the fund at period end. A complete unaudited listing of the fund’s holdings as of its most recent quarter end is available upon request. (c) Includes investment made with cash collateral received from securities on loan. (d) Security or a portion of the security is on loan at period end. |
See accompanying notes which are an integral part of the financial statements.
Annual Report A-90
| Southeast Asia | ||||||
| Financial Statements | ||||||
| Statement of Assets and Liabilities | ||||||
| October 31, 2005 | ||||||
| Assets | ||||||
| Investment in securities, at value | ||||||
| (including securities loaned of | ||||||
| $1,636,754) (cost | ||||||
| $659,404,128) — See accom- | ||||||
| panying schedule | $ | 786,214,024 | ||||
| Foreign currency held at value | ||||||
| (cost $910,862) | 912,177 | |||||
| Receivable for investments sold | 7,543,921 | |||||
| Receivable for fund shares sold | 1,413,130 | |||||
| Dividends receivable | 139,394 | |||||
| Interest receivable | 83,189 | |||||
| Other affiliated receivables | 1,897 | |||||
| Other receivables | 134,859 | |||||
| Total assets | 796,442,591 | |||||
| Liabilities | ||||||
| Payable for investments purchased $ | 7,008,349 | |||||
| Payable for fund shares redeemed | 2,990,197 | |||||
| Accrued management fee | 557,608 | |||||
| Other affiliated payables | 191,097 | |||||
| Other payables and accrued | ||||||
| expenses | 219,711 | |||||
| Collateral on securities loaned, at | ||||||
| value | 1,710,800 | |||||
| Total liabilities | 12,677,762 | |||||
| Net Assets | $ | 783,764,829 | ||||
| Net Assets consist of: | ||||||
| Paid in capital | $ | 627,526,435 | ||||
| Undistributed net investment | ||||||
| income | 8,443,957 | |||||
| Accumulated undistributed net | ||||||
| realized gain (loss) on invest- | ||||||
| ments and foreign currency | ||||||
| transactions | 20,977,387 | |||||
| Net unrealized appreciation (de- | ||||||
| preciation) on investments and | ||||||
| assets and liabilities in foreign | ||||||
| currencies | 126,817,050 | |||||
| Net Assets, for 41,901,752 shares | ||||||
| outstanding | $ | 783,764,829 | ||||
| Net Asset Value, offering price | ||||||
| and redemption price per share | ||||||
| ($783,764,829 ÷ 41,901,752 | ||||||
| shares) | $ | 18.70 | ||||
| Statement of Operations | ||||||
| Year ended October 31, 2005 | ||||||
| Investment Income | ||||||
| Dividends | $ | 19,894,215 | ||||
| Interest | 326,258 | |||||
| Security lending | 148,768 | |||||
| 20,369,241 | ||||||
| Less foreign taxes withheld | (2,806,702) | |||||
| Total income | 17,562,539 | |||||
| Expenses | ||||||
| Management fee | ||||||
| Basic fee | $ | 4,509,815 | ||||
| Performance adjustment | 205,757 | |||||
| Transfer agent fees | 1,545,022 | |||||
| Accounting and security lending | ||||||
| fees | 300,817 | |||||
| Independent trustees’ | ||||||
| compensation | 3,052 | |||||
| Custodian fees and expenses | 798,079 | |||||
| Registration fees | 49,301 | |||||
| Audit | 89,534 | |||||
| Legal | 1,552 | |||||
| Miscellaneous | 9,270 | |||||
| Total expenses before reductions | 7,512,199 | |||||
| Expense reductions | (657,750) | 6,854,449 | ||||
| Net investment income (loss) | 10,708,090 | |||||
| Realized and Unrealized Gain | ||||||
| (Loss) | ||||||
| Net realized gain (loss) on: | ||||||
| Investment securities | 64,558,085 | |||||
| Foreign currency transactions | (825,318) | |||||
| Total net realized gain (loss) | 63,732,767 | |||||
| Change in net unrealized appreci- | ||||||
| ation (depreciation) on: | ||||||
| Investment securities | 54,504,872 | |||||
| Assets and liabilities in foreign | ||||||
| currencies | (19,907) | |||||
| Total change in net unrealized | ||||||
| appreciation (depreciation) | 54,484,965 | |||||
| Net gain (loss) | 118,217,732 | |||||
| Net increase (decrease) in net as- | ||||||
| sets resulting from operations . | $ | 128,925,822 | ||||
See accompanying notes which are an integral part of the financial statements.
A-91 Annual Report
| Southeast Asia | ||||||||||||||||||||||
| Financial Statements - continued | ||||||||||||||||||||||
| Statement of Changes in Net Assets | ||||||||||||||||||||||
| Year ended | Year ended | |||||||||||||||||||||
| October 31, | October 31, | |||||||||||||||||||||
| 2005 | 2004 | |||||||||||||||||||||
| Increase (Decrease) in Net Assets | ||||||||||||||||||||||
| Operations | ||||||||||||||||||||||
| Net investment income (loss) | $ | 10,708,090 | $ | 5,201,331 | ||||||||||||||||||
| Net realized gain (loss) | 63,732,767 | 56,124,758 | ||||||||||||||||||||
| Change in net unrealized appreciation (depreciation) | 54,484,965 | (34,410,743) | ||||||||||||||||||||
| Net increase (decrease) in net assets resulting from operations | 128,925,822 | 26,915,346 | ||||||||||||||||||||
| Distributions to shareholders from net investment income | (4,393,636) | (3,836,810) | ||||||||||||||||||||
| Share transactions | ||||||||||||||||||||||
| Proceeds from sales of shares | 334,452,814 | 224,915,681 | ||||||||||||||||||||
| Reinvestment of distributions | 4,237,758 | 3,688,981 | ||||||||||||||||||||
| Cost of shares redeemed | (144,703,410) | (182,949,102) | ||||||||||||||||||||
| Net increase (decrease) in net assets resulting from share transactions | 193,987,162 | 45,655,560 | ||||||||||||||||||||
| Redemption fees | 371,624 | 585,457 | ||||||||||||||||||||
| Total increase (decrease) in net assets | 318,890,972 | 69,319,553 | ||||||||||||||||||||
| Net Assets | ||||||||||||||||||||||
| Beginning of period | 464,873,857 | 395,554,304 | ||||||||||||||||||||
| End of period (including undistributed net investment income of $8,443,957 and undistributed net investment | ||||||||||||||||||||||
| income of $1,979,507, respectively) | $ | 783,764,829 | $ | 464,873,857 | ||||||||||||||||||
| Other Information | ||||||||||||||||||||||
| Shares | ||||||||||||||||||||||
| Sold | 18,599,917 | 14,904,527 | ||||||||||||||||||||
| Issued in reinvestment of distributions | 261,752 | 264,130 | ||||||||||||||||||||
| Redeemed | (8,212,035) | (12,752,681) | ||||||||||||||||||||
| Net increase (decrease) | 10,649,634 | 2,415,976 | ||||||||||||||||||||
| Financial Highlights | ||||||||||||||||||||||
| Years ended October 31, | 2005 | 2004 | 2003 | 2002 | 2001 | |||||||||||||||||
| Selected Per Share Data | ||||||||||||||||||||||
| Net asset value, beginning of period | $ 14.87 | $ | 13.72 | $ 9.96 | $ | 9.10 | $ | 11.74 | ||||||||||||||
| Income from Investment Operations | ||||||||||||||||||||||
| Net investment income (loss)C | 30 | .16 | .15 | .06 | .03 | |||||||||||||||||
| Net realized and unrealized gain (loss) | 3.66 | 1.10 | 3.68 | .81 | (2.68) | |||||||||||||||||
| Total from investment operations | 3.96 | 1.26 | 3.83 | .87 | (2.65) | |||||||||||||||||
| Distributions from net investment income | (.14) | (.13) | (.08) | (.03) | — | |||||||||||||||||
| Redemption fees added to paid in capitalC | 01 | .02 | .01 | .02 | .01 | |||||||||||||||||
| Net asset value, end of period | $ 18.70 | $ | 14.87 | $ 13.72 | $ | 9.96 | $ | 9.10 | ||||||||||||||
| Total ReturnA,B | 26.84% | 9.39% | 38.81% | 9.75% | (22.49)% | |||||||||||||||||
| Ratios to Average Net AssetsD | ||||||||||||||||||||||
| Expenses before expense reductions | 1.20% | 1.21% | 1.32% | 1.54% | 1.55% | |||||||||||||||||
| Expenses net of voluntary waivers, if any | 1.20% | 1.21% | 1.32% | 1.54% | 1.55% | |||||||||||||||||
| Expenses net of all reductions | 1.09% | 1.20% | 1.32% | 1.50% | 1.52% | |||||||||||||||||
| Net investment income (loss) | 1.71% | 1.11% | 1.35% | .54% | .24% | |||||||||||||||||
| Supplemental Data | ||||||||||||||||||||||
| Net assets, end of period (000 omitted) | $ 783,765 | $ | 464,874 | $ 395,554 | $ 245,651 | $ | 206,012 | |||||||||||||||
| Portfolio turnover rate | 109% | 131% | 115% | 131% | 91% | |||||||||||||||||
| ATotal returns would have been lower had certain expenses not been reduced during the periods shown. BTotal returns do not include the effect of the former sales charges. CCalculated based on average shares outstanding during the period. DExpense ratios reflect operating expenses of the fund. Expenses before reductions do not reflect amounts reimbursed by the investment adviser or reductions from brokerage service arrangements or other expense offset arrangements and do not represent the amount paid by the fund during periods when reimbursements or reductions occur. Expenses net of any voluntary waivers reflect expenses after reimbursement by the investment adviser but prior to reductions from brokerage service arrangements or other expense offset arrangements. Expenses net of all reductions represent the net expenses paid by the fund. |
See accompanying notes which are an integral part of the financial statements.
Annual Report A-92
| Notes to Financial Statements For the period ended October 31, 2005 |
| 1. Significant Accounting Policies. |
Fidelity Canada Fund, Fidelity China Region Fund, Fidelity Emerging Markets Fund, Fidelity Europe Fund, Fidelity Europe Capital Appreciation Fund, Fidelity Japan Fund, Fidelity Japan Smaller Companies Fund, Fidelity Latin America Fund, Fidelity Nordic Fund, Fidelity Pacific Basin Fund, and Fidelity Southeast Asia Fund (the funds) are funds of Fidelity Investment Trust (the trust). The trust is registered under the Investment Company Act of 1940, as amended (the 1940 Act), as an open end management investment company organized as a Massachusetts business trust. The funds are non diversified with the exception of Fidelity Canada Fund, Fidelity Emerging Markets Fund, Fidelity Europe Fund, Fidelity Europe Capital Appreciation Fund, Fidelity Japan Fund, Fidelity Japan Smaller Companies Fund, Fidelity Nordic Fund, Fidelity Pacific Basin Fund, and Fidelity Southeast Asia Fund. Each fund is authorized to issue an unlimited number of shares. Certain funds’ investments in emerging markets can be subject to social, economic, regulatory, and political uncertainties and can be extremely volatile. The funds may invest in affiliated money market central funds (Money Market Central Funds), which are open end investment companies available to investment companies and other accounts managed by Fidelity Man agement & Research Company (FMR) and its affiliates. The financial statements have been prepared in conformity with accounting principles generally accepted in the United States of America, which require management to make certain estimates and assumptions at the date of the financial statements. The following summarizes the significant accounting policies of the funds:
Security Valuation. Investments are valued and net asset value (NAV) per share is calculated (NAV calculation) as of the close of business of the New York Stock Exchange (NYSE), normally 4:00 p.m. Eastern time. Wherever possible, each fund uses independent pricing services approved by the Board of Trustees to value their investments.
Equity securities, including restricted securities, for which market quotations are readily available, are valued at the last reported sale price or official closing price as reported by an independent pricing service on the primary market or exchange on which they are traded. In the event there were no sales during the day or closing prices are not available, securities are valued at the last quoted bid price. Debt securities, including restricted securities, for which quotations are readily available, are valued by independent pricing services or by dealers who make markets in such securities. Pricing services consider yield or price of bonds of comparable quality, coupon, maturity and type as well as dealer supplied prices. Investments in open end mutual funds, are valued at their closing net asset value each business day. Short term securities with remaining maturities of sixty days or less for which quotations are not readily available are valued at amortized cost, which approximates value.
When current market prices or quotations are not readily available or do not accurately reflect fair value, valuations may be determined in accordance with procedures adopted by the Board of Trustees. For example, when developments occur between the close of a market and the close of the NYSE that may materially affect the value of some or all of the securities, or when trading in a security is halted, those securities may be fair valued. Factors used in the determination of fair value may include monitoring news to identify significant market or security specific events such as changes in the value of U.S. securities market, reviewing developments in foreign markets and evaluating the performance of ADRs, futures contracts and exchange traded funds. Because each fund’s utilization of fair value pricing depends on market activity, the frequency with which fair value pricing is used can not be predicted and may be utilized to a significant extent. The value of securities used for NAV calculation under fair value pricing may differ from published prices for the same securities.
Foreign Currency. Certain funds may use foreign currency contracts to facilitate transactions in foreign denominated securities. Losses from these transactions may arise from changes in the value of the foreign currency or if the counterparties do not perform under the contracts’ terms.
Foreign denominated assets, including investment securities, and liabilities are translated into U.S. dollars at the exchange rate at period end. Pur chases and sales of investment securities, income and dividends received and expenses denominated in foreign currencies are translated into U.S. dollars at the exchange rate in effect on the transaction date.
The effects of exchange rate fluctuations on investments are included with the net realized and unrealized gain (loss) on investment securities. Other foreign currency transactions resulting in realized and unrealized gain (loss) are disclosed separately.
Investment Transactions and Income. Security transactions are accounted for as of trade date. Gains and losses on securities sold are determined on the basis of identified cost and may include proceeds received from litigation. Dividend income is recorded on the ex dividend date, except for certain dividends from foreign securities where the ex dividend date may have passed, which are recorded as soon as the funds are informed of the ex dividend date. Non cash dividends included in dividend income, if any, are recorded at the fair market value of the securities received. Distributions received on securities that represent a return of capital or capital gain are recorded as a reduction of cost of investments and/or as a realized gain. The funds estimate the components of distributions received that may be considered return of capital distributions or capital gain distributions. Large, non recurring dividends recognized by the funds are presented separately on the Statement of Operations as “Special Dividends” and the impact of these dividends is presented in the Financial Highlights. Interest income is accrued as earned. Interest income includes coupon interest and amortiza tion of premium and accretion of discount on debt securities.
Expenses. Most expenses of the trust can be directly attributed to a fund. Expenses which cannot be directly attributed are apportioned among each fund in the trust.
| A-93 |
| Annual Report |
Notes to Financial Statements continued
1. Significant Accounting Policies continued
Income Tax Information and Distributions to Shareholders. Each year, each fund intends to qualify as a regulated investment company by distributing all of its taxable income and realized gains under Subchapter M of the Internal Revenue Code. As a result, no provision for income taxes is required in the accompanying financial statements. Foreign taxes are provided for based on each fund’s understanding of the tax rules and rates that exist in the foreign markets in which it invests.
Distributions are recorded on the ex dividend date. Income and capital gain distributions are determined in accordance with income tax regulations, which may differ from generally accepted accounting principles. In addition, certain funds will claim a portion of the payment made to redeeming shareholders as a distribution for income tax purposes.
Capital accounts within the financial statements are adjusted for permanent book tax differences. These adjustments have no impact on net assets or the results of operations. Temporary book tax differences will reverse in a subsequent period.
Book tax differences are primarily due to short term capital gains, foreign currency transactions, certain foreign taxes, passive foreign investment companies (PFIC), market discount, deferred trustees compensation, capital loss carryforwards and losses deferred due to wash sales.
| The tax basis components of distributable earnings and the federal tax cost as of period end were as follows for each fund: | ||||||||||
| Net Unrealized | ||||||||||
| Cost for Federal | Unrealized | Unrealized | Appreciation/ | |||||||
| Income Tax Purposes | Appreciation | Depreciation | (Depreciation) | |||||||
| Canada | $ 1,479,654,570 | $ 303,065,863 | $ (41,328,153) | $ 261,737,710 | ||||||
| China Region | 348,172,547 | 62,083,465 | (12,786,287) | 49,297,178 | ||||||
| Emerging MarketsA | 1,076,930,137 | 361,342,326 | (13,706,091) | 347,636,235 | ||||||
| Europe | 2,202,471,215 | 368,965,160 | (47,485,493) | 321,479,667 | ||||||
| Europe Capital Appreciation | 464,815,963 | 50,589,083 | (14,148,045) | 36,441,038 | ||||||
| Japan | 973,135,001 | 207,877,525 | (14,289,107) | 193,588,418 | ||||||
| Japan Smaller Companies | 1,226,904,133 | 441,417,453 | (46,613,547) | 394,803,906 | ||||||
| Latin America | 1,115,022,062 | 372,544,506 | (12,736,713) | 359,807,793 | ||||||
| Nordic | 168,254,729 | 30,122,674 | (5,796,408) | 24,326,266 | ||||||
| Pacific Basin | 573,596,466 | 120,943,171 | (26,195,254) | 94,747,917 | ||||||
| Southeast Asia | 659,864,304 | 149,113,575 | (22,763,855) | 126,349,720 | ||||||
| Undistributed | ||||||||||
| Undistributed | Long-term Capital | Capital Loss | ||||||||
| Ordinary Income | Gain | Carryforward | ||||||||
| Canada | $ 5,035,829 | $ | — | $ (11,571,042) | ||||||
| China Region | 4,461,676 | — | (9,093,376) | |||||||
| Emerging MarketsA | 13,424,079 | — | (360,364,607) | |||||||
| Europe | 122,670,013 | 170,211,359 | — | |||||||
| Europe Capital Appreciation | 20,027,881 | 39,426,083 | — | |||||||
| Japan | 2,064,832 | — | (37,999,714) | |||||||
| Japan Smaller Companies | 2,104,315 | 87,003,058 | — | |||||||
| Latin America | 16,230,261 | 20,796,001 | — | |||||||
| Nordic | 2,023,551 | 14,568,697 | — | |||||||
| Pacific Basin | 9,752,515 | 4,820,271 | — | |||||||
| Southeast Asia | 7,193,514 | 18,267,520 | — | |||||||
| A Tax information based on the fund’s tax year end of September 30, 2005. | ||||||||||
| Annual Report |
| A-94 |
| 1. Significant Accounting Policies continued | ||||||||||||||||
| Income Tax Information and Distributions to Shareholders continued | ||||||||||||||||
| The tax character of distributions paid was as follows: | ||||||||||||||||
| October 31, 2005 | Long-term | |||||||||||||||
| Ordinary Income | Capital Gains | Return of Capital | Total | |||||||||||||
| Canada | $ | 1,384,456 | $ | — | $ | — | $ | 1,384,456 | ||||||||
| China Region | 4,953,877 | — | — | 4,953,877 | ||||||||||||
| Emerging Markets | 5,999,282 | — | — | 5,999,282 | ||||||||||||
| Europe | 10,681,206 | — | — | 10,681,206 | ||||||||||||
| Europe Capital Appreciation | 4,798,330 | — | — | 4,798,330 | ||||||||||||
| Japan | — | — | — | — | ||||||||||||
| Japan Smaller Companies | 2,127,742 | 4,259,030 | — | 6,386,772 | ||||||||||||
| Latin America | 6,575,674 | — | — | 6,575,674 | ||||||||||||
| Nordic | 1,181,664 | — | — | 1,181,664 | ||||||||||||
| Pacific Basin | 5,223,884 | — | — | 5,223,884 | ||||||||||||
| Southeast Asia | 4,393,636 | — | — | 4,393,636 | ||||||||||||
| October 31, 2004 | ||||||||||||||||
| Canada | $ | 959,083 | $ | — | $ | — | $ | 959,083 | ||||||||
| China Region | 4,174,789 | — | — | 4,174,789 | ||||||||||||
| Emerging Markets | 5,261,351 | — | — | 5,261,351 | ||||||||||||
| Europe | 15,656,206 | — | — | 15,656,206 | ||||||||||||
| Europe Capital Appreciation | 4,908,750 | — | — | 4,908,750 | ||||||||||||
| Japan | 461,710 | — | — | 461,710 | ||||||||||||
| Japan Smaller Companies | 1,684,858 | — | — | 1,684,858 | ||||||||||||
| Latin America | 3,905,133 | — | — | 3,905,133 | ||||||||||||
| Nordic | 633,291 | — | — | 633,291 | ||||||||||||
| Pacific Basin | 3,891,845 | — | — | 3,891,845 | ||||||||||||
| Southeast Asia | 3,836,810 | — | — | 3,836,810 | ||||||||||||
Short Term Trading (Redemption) Fees. Shares held in Canada, China Region, Emerging Markets, Japan, Japan Smaller Companies, Latin America, Nordic, Pacific Basin and Southeast Asia less than 90 days are subject to a redemption fee equal to 1.50% of the proceeds of the redeemed shares. Shares held in Europe and Europe Capital Appreciation less than 30 days are subject to a redemption fee equal to 1.00% of the proceeds of the re deemed shares. All redemption fees, including any estimated redemption fees paid by FMR, are retained by the funds and accounted for as an addition to paid in capital.
| 2. Operating Policies. |
Repurchase Agreements. FMR has received an Exemptive Order from the Securities and Exchange Commission (the SEC) which permits certain funds and other affiliated entities of FMR to transfer uninvested cash balances into joint trading accounts which are then invested in repurchase agreements. Certain funds may also invest directly with institutions in repurchase agreements. Repurchase agreements are collateralized by government or non government securities. Collateral is held in segregated accounts with custodian banks and may be obtained in the event of a default of the counterparty. Each applicable fund monitors, on a daily basis, the value of the collateral to ensure it is at least equal to the principal amount of the repurchase agreement (including accrued interest). In the event of a default by the counterparty, realization of the collateral proceeds could be delayed, during which time the value of the collateral may decline.
Futures Contracts. Certain funds may use futures contracts to manage their exposure to the stock market. Buying futures tends to increase a fund’s exposure to the underlying instrument, while selling futures tends to decrease a fund’s exposure to the underlying instrument or hedge other fund investments. Futures contracts involve, to varying degrees, risk of loss in excess of any futures variation margin reflected in each applicable fund’s Statement of Assets and Liabilities. The underlying face amount at value of any open futures contracts at period end is shown in each applicable fund’s Schedule of Investments under the caption ”Futures Contracts.” This amount reflects each contract’s exposure to the underlying instrument at period end. Losses may arise from changes in the value of the underlying instruments or if the counterparties do not perform under the contracts’ terms. Gains (losses) are realized upon the expiration or closing of the futures contracts. Futures contracts are valued at the settlement price established each day by the board of trade or exchange on which they are traded.
| A-95 |
| Annual Report |
Notes to Financial Statements continued
2. Operating Policies continued
Restricted Securities. Certain funds may invest in securities that are subject to legal or contractual restrictions on resale. These securities generally may be resold in transactions exempt from registration or to the public if the securities are registered. Disposal of these securities may involve time consuming negotiations and expense, and prompt sale at an acceptable price may be difficult. Information regarding restricted securities is included at the end of each applicable fund’s Schedule of Investments.
| 3. Purchases and Sales of Investments. | ||||
| Purchases and sales of securities, other than short term securities and U.S. government securities, are noted in the table below. | ||||
| Purchases ($) | Sales ($) | |||
| Canada | 1,279,581,599 | 233,875,930 | ||
| China Region | 214,034,243 | 151,906,448 | ||
| Emerging Markets | 1,166,696,625 | 657,224,537 | ||
| Europe | 2,538,316,359 | 2,245,951,764 | ||
| Europe Capital Appreciation | 612,103,500 | 604,209,323 | ||
| Japan | 784,074,946 | 561,127,121 | ||
| Japan Smaller Companies | 802,024,707 | 927,193,439 | ||
| Latin America | 940,849,203 | 297,729,731 | ||
| Nordic | 164,378,607 | 121,679,726 | ||
| Pacific Basin | 493,340,865 | 413,049,693 | ||
| Southeast Asia | 870,100,099 | 672,386,840 | ||
| 4. Fees and Other Transactions with Affiliates. | ||||
Management Fee. FMR and its affiliates provide the funds with investment management related services for which the funds pay a monthly manage ment fee. The management fee is the sum of an individual fund fee rate and a group fee rate. The individual fund fee rate is applied to each fund’s average net assets. The group fee rate is based upon the average net assets of all the mutual funds advised by FMR. The group fee rate decreases as assets under management increase and increases as assets under management decrease. In addition, the management fee for Canada, Europe, Europe Capital Appreciation, Japan, Pacific Basin, and Southeast Asia is subject to a performance adjustment (up to a maximum ±.20% of each applicable fund’s average net assets over a 36 month performance period). The upward or downward adjustment to the management fee is based on each fund’s relative investment performance as compared to an appropriate benchmark index. For the period, each fund’s annual management fee rate expressed as a percentage of each fund’s average net assets, including the performance adjustment, if applicable was as follows:
| Individual Rate | Group Rate | Total | ||||
| Canada | 45% | .27% | .73% | |||
| China Region | 45% | .27% | .72% | |||
| Emerging Markets | 45% | .27% | .72% | |||
| Europe | 45% | .27% | .80% | |||
| Europe Capital Appreciation | 45% | .27% | .60% | |||
| Japan | 45% | .27% | .69% | |||
| Japan Smaller Companies | 45% | .27% | .72% | |||
| Latin America | 45% | .27% | .72% | |||
| Nordic | 45% | .27% | .72% | |||
| Pacific Basin | 45% | .27% | .68% | |||
| Southeast Asia | 45% | .27% | .75% |
Sales Load. Shares of Canada, Europe, and Pacific Basin purchased prior to October 12, 1990, were subject to a 1% deferred sales charge upon re demption. Effective July 1, 2005, the deferred sales charge was eliminated. For the period, sales charge amounts retained by Fidelity Distributors Corporation (FDC), an affiliate of FMR, were as follows:
| Retained | ||||
| by FDC | ||||
| Canada | $ 741 | |||
| Europe | 12,271 | |||
| Pacific Basin | 4,050 | |||
| Annual Report |
| A-96 |
4. Fees and Other Transactions with Affiliates continued
Transfer Agent Fees. Fidelity Service Company, Inc. (FSC), an affiliate of FMR, is the funds’ transfer, dividend disbursing and shareholder servicing agent. FSC receives account fees and asset based fees that vary according to account size and type of account. FSC pays for typesetting, printing and mailing of shareholder reports, except proxy statements. For the period, the transfer agent fees were equivalent to the following annual rates expressed as a percentage of average net assets:
| Canada | 25% | |
| China Region | 27% | |
| Emerging Markets | 25% | |
| Europe | 25% | |
| Europe Capital Appreciation | 23% | |
| Japan | 24% | |
| Japan Smaller Companies | 19% | |
| Latin America | 23% | |
| Nordic | 28% | |
| Pacific Basin | 26% | |
| Southeast Asia | 25% |
Accounting and Security Lending Fees. FSC maintains each fund’s accounting records. The accounting fee is based on the level of average net assets for the month. Under a separate contract, FSC administers the security lending program. The security lending fee is based on the number and duration of lending transactions.
Affiliated Central Funds. Certain funds may invest in Money Market Central Funds which seek preservation of capital and current income and are managed by Fidelity Investments Money Management, Inc. (FIMM), an affiliate of FMR.
The Money Market Central Funds do not pay a management fee. Income distributions earned by the funds are recorded as income in the accompanying financial statements. Distributions from the Money Market Central Funds are noted in the table below:
| Income | ||
| Distributions | ||
| Canada | $ 1,510,545 | |
| China Region | 347,977 | |
| Emerging Markets | 934,132 | |
| Europe | 4,568,418 | |
| Europe Capital Appreciation | 1,220,021 | |
| Japan | 2,731,843 | |
| Japan Smaller Companies | 7,504,337 | |
| Latin America | 1,963,660 | |
| Nordic | 407,924 | |
| Pacific Basin | 752,175 | |
| Southeast Asia | 426,463 |
Brokerage Commissions. Certain funds placed a portion of their portfolio transactions with brokerage firms which are affiliates of the investment adviser. The commissions paid to these affiliated firms were as follows:
| Amount | ||
| Canada | $ 15,747 | |
| Emerging Markets | 1,548 | |
| Europe Capital Appreciation | 5,890 | |
| Latin America | 8,630 | |
| Nordic | 17 | |
| Pacific Basin | 125 | |
| Southeast Asia | 6 |
| A-97 |
| Annual Report |
| Notes to Financial Statements continued 4. Fees and Other Transactions with Affiliates continued |
Interfund Lending Program. Pursuant to an Exemptive Order issued by the SEC, the funds, along with other registered investment companies having management contracts with FMR, may participate in an interfund lending program. This program provides an alternative credit facility allowing the funds to borrow from, or lend money to, other participating affiliated funds. At period end, there were no interfund loans outstanding. Each applica ble fund’s activity in this program during the period for which loans were outstanding was as follows:
| Weighted | Interest Earned | |||||||||||
| Borrower or | Average Daily | Average | (included in | Interest | ||||||||
| Lender | Loan Balance | Interest Rate | interest income) | Expense | ||||||||
| Europe | Borrower | $ 5,961,250 | 2.88% | $ — | $ | 1,909 | ||||||
| Latin America | Borrower | 7,540,778 | 2.90% | — | 5,470 | |||||||
| 5. Committed Line of Credit. | ||||||||||||
Certain funds participate with other funds managed by FMR in a $4.2 billion credit facility (the “line of credit”) to be utilized for temporary or emergency purposes to fund shareholder redemptions or for other short term liquidity purposes. The participating funds have agreed to pay commit ment fees on their pro rata portion of the line of credit. During the period, there were no borrowings on this line of credit.
| 6. Security Lending. |
Certain funds lend portfolio securities from time to time in order to earn additional income. Each applicable fund receives collateral (in the form of U.S. Treasury obligations, letters of credit and/or cash) against the loaned securities and maintains collateral in an amount not less than 100% of the market value of the loaned securities during the period of the loan. The market value of the loaned securities is determined at the close of business of the funds and any additional required collateral is delivered to the funds on the next business day. If the borrower defaults on its obligation to return the securities loaned because of insolvency or other reasons, a fund could experience delays and costs in recovering the securities loaned or in gaining access to the collateral. Cash collateral is invested in the Fidelity Securities Lending Cash Central Fund. The value of loaned securities and cash collateral at period end are disclosed on each applicable fund’s Statement of Assets and Liabilities. Security lending income represents the income earned on investing cash collateral, less fees and expenses associated with the loan, plus any premium payments that may be received on the loan of certain types of securities.
| 7. Bank Borrowings. |
Each fund is permitted to have bank borrowings for temporary or emergency purposes to fund shareholder redemptions. Each fund has established borrowing arrangements with certain banks. The interest rate on the borrowings is the bank’s base rate, as revised from time to time. At period end, there were no bank borrowings outstanding. Each applicable fund’s activity in this program during the period for which loans were outstanding was as follows:
| Average Daily | Weighted Average | |||
| Loan Balance | Interest Rate | |||
| Europe | $ 5,879,250 | 2.46% |
| Annual Report |
| A-98 |
| 8. Expense Reductions. |
Many of the brokers with whom FMR places trades on behalf of certain funds provided services to these funds in addition to trade execution. These services included payments of expenses on behalf of each applicable fund. In addition, through arrangements with each applicable fund’s custodian and transfer agent, credits realized as a result of uninvested cash balances were used to reduce each applicable fund’s expenses. All of the applicable expense reductions are noted in the table below.
| Transfer | ||||||||||
| Brokerage | Custody | Agent | ||||||||
| Service | expense | expense | ||||||||
| Arrangements | reduction | reduction | ||||||||
| Canada | $ 310,759 | $ | 5,099 | $ | 14,473 | |||||
| China Region | 145,891 | 1,152 | 2,434 | |||||||
| Emerging Markets | 911,696 | 4,304 | 13,530 | |||||||
| Europe | 1,977,827 | — | 64,823 | |||||||
| Europe Capital Appreciation | 521,225 | 1,002 | 1,933 | |||||||
| Japan | 71,041 | — | 20,075 | |||||||
| Japan Smaller Companies | 73,286 | 56 | 8,666 | |||||||
| Latin America | 453,473 | 3,696 | 6,822 | |||||||
| Nordic | 55,999 | — | 1,768 | |||||||
| Pacific Basin | 228,717 | — | 8,435 | |||||||
| Southeast Asia | 647,792 | — | 9,958 | |||||||
| 9. Other. | ||||||||||
The funds’ organizational documents provide former and current trustees and officers with a limited indemnification against liabilities arising in connection with the performance of their duties to the funds. In the normal course of business, the funds may also enter into contracts that provide general indemnifications. The funds’ maximum exposure under these arrangements is unknown as this would be dependent on future claims that may be made against the funds. The risk of material loss from such claims is considered remote.
At the end of the period, Fidelity Freedom Fund 2020 was the owner of record of approximately 17% and 12% of the total outstanding shares of Europe and Japan, respectively. Fidelity Freedom Fund 2030 was the owner of record of approximately 13% of the total outstanding shares of Europe. The Fidelity Freedom Funds were the owners of record, in the aggregate, of approximately 49%, 33% and 22% of the total outstanding shares of Europe, Japan and Southeast Asia, respectively.
| A-99 |
| Annual Report |
Report of Independent Registered Public Accounting Firm
| To the Trustees of Fidelity Investment Trust and the Shareholders of: Fidelity Canada Fund, Fidelity China Region Fund, Fidelity Emerging Markets Fund, Fidelity Europe Fund, Fidelity Japan Fund, Fidelity Japan Smaller Companies Fund, Fidelity Latin America Fund, Fidelity Nordic Fund, Fidelity Pacific Basin Fund, Fidelity Southeast Asia Fund |
In our opinion, the accompanying statements of assets and liabilities, including the schedules of investments, and the related statements of operations and of changes in net assets and the financial highlights present fairly, in all material respects, the financial position of Fidelity Canada Fund, Fidelity China Region Fund, Fidelity Emerging Markets Fund, Fidelity Europe Fund, Fidelity Japan Fund, Fidelity Japan Smaller Companies Fund, Fidelity Latin America Fund, Fidelity Nordic Fund, Fidelity Pacific Basin Fund and Fidelity Southeast Asia Fund (funds of Fidelity Investment Trust) at October 31, 2005 and the results of their operations, the changes in their net assets and the financial highlights for the periods indicated, in conformity with accounting principles generally accepted in the United States of America. These financial statements and financial highlights (hereafter referred to as “financial statements”) are the responsibility of the Fidelity Investment Trust’s management; our responsibility is to express an opinion on these financial statements based on our audits. We conducted our audits of these financial statements in accordance with the standards of the Public Company Accounting Oversight Board (United States). Those standards require that we plan and perform the audit to obtain reasonable assurance about whether the financial statements are free of material misstatement. An audit includes examining, on a test basis, evidence supporting the amounts and disclosures in the financial statements, assessing the accounting principles used and significant estimates made by management, and evaluating the overall financial statement presentation. We believe that our audits, which included confirmation of securities at October 31, 2005 by correspondence with the custodian and brokers, provide a reasonable basis for our opinion.
| /s/ PricewaterhouseCoopers LLP PricewaterhouseCoopers LLP Boston, Massachusetts December 20, 2005 |
| Annual Report |
| A-100 |
Report of Independent Registered Public Accounting Firm
To the Trustees of Fidelity Investment Trust and Shareholders of Fidelity Europe Capital Appreciation Fund:
We have audited the accompanying statement of assets and liabilities of Fidelity Europe Capital Appreciation Fund (the Fund), a fund of Fidelity Investment Trust including the schedule of investments, as of October 31, 2005, and the related statement of operations for the year then ended, the statement of changes in net assets for each of the two years in the period then ended, and the financial highlights for each of the five years in the period then ended. These financial statements and financial highlights are the responsibility of the Fund’s management. Our responsibility is to express an opinion on these financial statements and financial highlights based on our audits.
We conducted our audits in accordance with standards of the Public Company Accounting Oversight Board (United States). Those standards require that we plan and perform the audit to obtain reasonable assurance about whether the financial statements and financial highlights are free of material misstatement. The Fund is not required to have, nor were we engaged to perform, an audit of its internal control over financial reporting. Our audits included consideration of internal control over financial reporting as a basis for designing audit procedures that are appropriate in the circumstances, but not for the purpose of expressing an opinion on the effectiveness of the Fund’s internal control over financial reporting. Accordingly, we express no such opinion. An audit also includes examining, on a test basis, evidence supporting the amounts and disclosures in the financial statements, assessing the accounting principles used and significant estimates made by management, as well as evaluating the overall financial statement presentation. Our procedures included confirmation of securities owned as of October 31, 2005, by correspondence with the custodians and brokers; where replies were not received from brokers, we performed other auditing procedures. We believe that our audits provide a reasonable basis for our opinion.
In our opinion, the financial statements and financial highlights referred to above present fairly, in all material respects, the financial position of Fidelity Europe Capital Appreciation Fund as of October 31, 2005, the results of its operations for the year then ended, the changes in its net assets for each of the two years in the period then ended, and its financial highlights for each of the five years in the period then ended, in conformity with accounting principles generally accepted in the United States of America.
| /s/ Deloitte & Touche LLP DELOITTE & TOUCHE LLP Boston, Massachusetts December 20, 2005 |
| A-101 |
| Annual Report |
| Trustees and Officers |
The Trustees, Members of the Advisory Board, and executive officers of the trust and funds, as applicable, are listed below. The Board of Trustees governs each fund and is responsible for protecting the interests of shareholders. The Trustees are experienced executives who meet periodically throughout the year to oversee each fund’s activities, review contractual arrangements with companies that provide services to each fund, and review each fund’s performance. Except for William O. McCoy, Stephen P. Jonas, and Kenneth L. Wolfe, each of the Trustees oversees 322 funds advised by FMR or an affiliate. Mr. McCoy oversees 324 funds advised by FMR or an affiliate. Mr. Jonas and Mr. Wolfe oversee 319 funds advised by FMR or an affiliate.
The Trustees hold office without limit in time except that (a) any Trustee may resign; (b) any Trustee may be removed by written instrument, signed by at least two thirds of the number of Trustees prior to such removal; (c) any Trustee who requests to be retired or who has become incapac itated by illness or injury may be retired by written instrument signed by a majority of the other Trustees; and (d) any Trustee may be removed at any special meeting of shareholders by a two thirds vote of the outstanding voting securities of the trust. Each Trustee who is not an interested person (as defined in the 1940 Act) (Independent Trustee), shall retire not later than the last day of the calendar year in which his or her 72nd birthday occurs. The Independent Trustees may waive this mandatory retirement age policy with respect to individual Trustees. The executive officers and Advisory Board Members hold office without limit in time, except that any officer and Advisory Board Member may resign or may be removed by a vote of a majority of the Trustees at any regular meeting or any special meeting of the Trustees. Except as indicated, each individual has held the office shown or other offices in the same company for the past five years.
The funds’ Statement of Additional Information (SAI) includes more information about the Trustees. To request a free copy, call Fidelity at 1-800-544-8544.
| Interested Trustees*: |
Correspondence intended for each Trustee who is an interested person may be sent to Fidelity Investments, 82 Devonshire Street, Boston, Massachusetts 02109.
| Name, Age; Principal Occupation Edward C. Johnson 3d (75)** |
Year of Election or Appointment: 1984
Mr. Johnson is Chairman of the Board of Trustees. Mr. Johnson serves as Chief Executive Officer, Chairman, and a Director of FMR Corp.; a Director and Chairman of the Board and of the Executive Committee of FMR; Chairman and a Director of Fidelity Man agement & Research (Far East) Inc.; Chairman and a Director of Fidelity Investments Money Management, Inc.; and Chairman (2001 present) and a Director (2000 present) of FMR Co., Inc.
| Abigail P. Johnson (43)** |
Year of Election or Appointment: 2001
Ms. Johnson serves as President of Fidelity Employer Services Company (FESCO) (2005 present). She is President and a Director of Fidelity Investments Money Management, Inc. (2001 present), FMR Co., Inc. (2001 present), and a Director of FMR Corp. Pre viously, Ms. Johnson served as President and a Director of FMR (2001 2005), Senior Vice President of the Fidelity funds (2001 2005), and managed a number of Fidelity funds.
| Stephen P. Jonas (52) |
Year of Election or Appointment: 2005
Mr. Jonas is Senior Vice President of Canada (2005 present), China Region (2005 present), Emerging Markets (2005 present), Europe (2005 present), Europe Capital Appreciation (2005 present), Japan (2005 present), Japan Smaller Companies (2005 present), Latin America (2005 present), Nordic (2005 present), Pacific Basin (2005 present), and Southeast Asia (2005 present). He also serves as Senior Vice President of other Fidelity funds (2005 present). Mr. Jonas is Executive Director of FMR (2005 present). Previously, Mr. Jonas served as President of Fidelity Enterprise Operations and Risk Services (2004 2005), Chief Administrative Officer (2002 2004), and Chief Financial Officer of FMR Co. (1998 2000). Mr. Jonas has been with Fidelity Investments since 1987 and has held various financial and management positions including Chief Financial Officer of FMR. In addition, he serves on the Boards of Boston Ballet (2003 present) and Simmons College (2003 present).
| Robert L. Reynolds (53) |
Year of Election or Appointment: 2003
Mr. Reynolds is a Director (2003 present) and Chief Operating Officer (2002 present) of FMR Corp. He also serves on the Board at Fidelity Investments Canada, Ltd. (2000 present). Previously, Mr. Reynolds served as President of Fidelity Investments Institutional Retirement Group (1996 2000).
* Trustees have been determined to be “Interested Trustees” by virtue of, among other things, their affiliation with the trust or various entities under common control with FMR.
** Edward C. Johnson 3d, Trustee, is Abigail P. Johnson’s father.
| Annual Report |
| A-102 |
| Independent Trustees: |
Correspondence intended for each Independent Trustee (that is, the Trustees other than the Interested Trustees) may be sent to Fidelity Investments, P.O. Box 55235, Boston, Massachusetts 02205 5235.
| Name, Age; Principal Occupation Dennis J. Dirks (57) |
Year of Election or Appointment: 2005
Prior to his retirement in May 2003, Mr. Dirks was Chief Operating Officer and a member of the Board of The Depository Trust & Clearing Corporation (DTCC) (1999 2003). He also served as President, Chief Operating Officer, and Board member of The De pository Trust Company (DTC) (1999 2003) and President and Board member of the National Securities Clearing Corporation (NSCC) (1999 2003). In addition, Mr. Dirks served as Chief Executive Officer and Board member of the Government Securities Clearing Corporation (2001 2003) and Chief Executive Officer and Board member of the Mortgage Backed Securities Clearing Corporation (2001 2003). Mr. Dirks also serves as a Trustee of Manhattan College (2005 present).
| Robert M. Gates (62) |
Year of Election or Appointment: 1997
Dr. Gates is Vice Chairman of the Independent Trustees (2005 present). Dr. Gates is President of Texas A&M University (2002 present). He was Director of the Central Intelligence Agency (CIA) from 1991 to 1993. From 1989 to 1991, Dr. Gates served as Assistant to the President of the United States and Deputy National Security Advisor. Dr. Gates is a Director of NACCO Industries, Inc. (mining and manufacturing), Parker Drilling Co., Inc. (drilling and rental tools for the energy industry, 2001 present), and Brinker International (restaurant management, 2003 present). Previously, Dr. Gates served as a Director of LucasVarity PLC (automotive components and diesel engines), a Director of TRW Inc. (automotive, space, defense, and information technology), and Dean of the George Bush School of Government and Public Service at Texas A&M University (1999 2001). Dr. Gates also is a Trustee of the Forum for International Policy.
| George H. Heilmeier (69) |
Year of Election or Appointment: 2004
Dr. Heilmeier is Chairman Emeritus of Telcordia Technologies (communication software and systems), where prior to his retirement, he served as company Chairman and Chief Executive Officer. He currently serves on the Boards of Directors of The Mitre Corpo ration (systems engineering and information technology support for the government), and HRL Laboratories (private research and development, 2004 present). He is Chairman of the General Motors Science & Technology Advisory Board and a Life Fellow of the Institute of Electrical and Electronics Engineers (IEEE) (2000 present). Dr. Heilmeier is a member of the Defense Science Board and the National Security Agency Advisory Board. He is also a member of the National Academy of Engineering, the American Academy of Arts and Sciences, and the Board of Overseers of the School of Engineering and Applied Science of the University of Pennsylvania. Previously, Dr. Heilmeier served as a Director of TRW Inc. (automotive, space, defense, and information technology, 1992 2002), Compaq (1994 2002), Automatic Data Processing, Inc. (ADP) (technology based business outsourcing, 1995 2002), INET Technologies Inc. (telecommunications network surveillance, 2001 2004), and Teletech Holdings (customer management ser vices). He is the recipient of the 2005 Kyoto Prize in Advanced Technology for his invention of the liquid display.
| Marie L. Knowles (59) |
Year of Election or Appointment: 2001
Prior to Ms. Knowles’ retirement in June 2000, she served as Executive Vice President and Chief Financial Officer of Atlantic Rich field Company (ARCO) (diversified energy, 1996 2000). From 1993 to 1996, she was a Senior Vice President of ARCO and President of ARCO Transportation Company. She served as a Director of ARCO from 1996 to 1998. She currently serves as a Director of Phelps Dodge Corporation (copper mining and manufacturing) and McKesson Corporation (healthcare service, 2002 present). Ms. Knowles is a Trustee of the Brookings Institution and the Catalina Island Conservancy and also serves as a member of the Advisory Board for the School of Engineering of the University of Southern California.
| Ned C. Lautenbach (61) |
Year of Election or Appointment: 2000
Mr. Lautenbach has been a partner of Clayton, Dubilier & Rice, Inc. (private equity investment firm) since September 1998. Pre viously, Mr. Lautenbach was with the International Business Machines Corporation (IBM) from 1968 until his retirement in 1998. Mr. Lautenbach serves as a Director of Italtel Holding S.p.A. (telecommunications (Milan, Italy), 2004 present) and Eaton Corpora tion (diversified industrial) as well as the Philharmonic Center for the Arts in Naples, Florida. He also is a member of the Board of Trustees of Fairfield University (2005 present), as well as a member of the Council on Foreign Relations.
| A-103 |
| Annual Report |
| Trustees and Officers - continued |
| Name, Age; Principal Occupation Marvin L. Mann (72) |
Year of Election or Appointment: 1993
Mr. Mann is Chairman of the Independent Trustees (2001 present). He is Chairman Emeritus of Lexmark International, Inc. (com puter peripherals), where he served as CEO until April 1998, retired as Chairman May 1999, and remains a member of the Board. Prior to 1991, he held the positions of Vice President of International Business Machines Corporation (IBM) and President and General Manager of various IBM divisions and subsidiaries. He is a member of the Executive Committee of the Independent Director’s Council of the Investment Company Institute. In addition, Mr. Mann is a member of the President’s Cabinet at the Univer sity of Alabama and the Board of Visitors of the Culverhouse College of Commerce and Business Administration at the University of Alabama.
| William O. McCoy (72) |
Year of Election or Appointment: 1997
Prior to his retirement in December 1994, Mr. McCoy was Vice Chairman of the Board of BellSouth Corporation (telecommunica tions) and President of BellSouth Enterprises. He is currently a Director of Liberty Corporation (holding company), Duke Realty Cor poration (real estate), and Progress Energy, Inc. (electric utility). He is also a partner of Franklin Street Partners (private investment management firm) and a member of the Research Triangle Foundation Board. In addition, Mr. McCoy served as the Interim Chan cellor (1999 2000) and a member of the Board of Visitors for the University of North Carolina at Chapel Hill and currently serves on the Board of Directors of the University of North Carolina Health Care System and the Board of Visitors of the Kenan Flagler Business School (University of North Carolina at Chapel Hill). He also served as Vice President of Finance for the University of North Carolina (16 school system).
| Cornelia M. Small (61) |
Year of Election or Appointment: 2005
Ms. Small is a member (2000 present) and Chairperson (2002 present) of the Investment Committee, and a member
(2002 present) of the Board of Trustees of Smith College. Previously, she served as Chief Investment Officer (1999 2000), Director of Global Equity Investments (1996 1999), and a member of the Board of Directors of Scudder, Stevens & Clark (1990 1997) and Scudder Kemper Investments (1997 1998). In addition, Ms. Small served as Co Chair (2000 2003) of the Annual Fund for the Fletcher School of Law and Diplomacy.
| William S. Stavropoulos (66) |
Year of Election or Appointment: 2001
Mr. Stavropoulos is Chairman of the Board (2000 present) and a Member of the Board of Directors of The Dow Chemical Company. Since joining The Dow Chemical Company in 1967, Mr. Stavropoulos served in numerous senior management posi tions, including President (1993 2000; 2002 2003), CEO (1995 2000; 2002 2004), and Chairman of the Executive Committee (2000 2004). Currently, he is a Director of NCR Corporation (data warehousing and technology solutions), BellSouth Corporation (telecommunications), Chemical Financial Corporation, Maersk Inc. (industrial conglomerate, 2002 present), and Metalmark Capi tal (private equity investment firm, 2005 present). He also serves as a member of the Board of Trustees of the American Enterprise Institute for Public Policy Research. In addition, Mr. Stavropoulos is a member of The Business Council, J.P. Morgan International Council and the University of Notre Dame Advisory Council for the College of Science.
| Kenneth L. Wolfe (66) |
Year of Election or Appointment: 2005
Mr. Wolfe also serves as a Trustee (2005 present) or Member of the Advisory Board (2004 present) of other investment companies advised by FMR. Prior to his retirement in 2001, Mr. Wolfe was Chairman and Chief Executive Officer of Hershey Foods Corpora tion (1993 2001). He currently serves as a member of the boards of Adelphia Communications Corporation (2003 present), Bausch & Lomb, Inc., and Revlon Inc. (2004 present).
| Advisory Board Members and Executive Officers: |
Correspondence intended for Mr. Gamper may be sent to Fidelity Investments, P.O. Box 55235, Boston, Massachusetts 02205 5235. Correspondence intended for each executive officer and Mr. Lynch may be sent to Fidelity Investments, 82 Devonshire Street, Boston, Massachusetts 02109.
| Name, Age; Principal Occupation Albert R. Gamper, Jr. (63) |
Year of Election or Appointment: 2005
Member of the Advisory Board of Fidelity Investment Trust. Prior to his retirement in December 2004, Mr. Gamper served as Chairman of the Board of CIT Group Inc. (commercial finance). During his tenure with CIT Group Inc. Mr. Gamper served in nu merous senior management positions, including Chairman (1987 1989; 1999 2001; 2002 2004), Chief Executive Officer (1987 2004), and President (1989 2002). He currently serves as a member of the Board of Directors of Public Service Enterprise Group (utilities, 2001 present), Chairman of the Board of Governors, Rutgers University (2004 present), and Chairman of the Board of Saint Barnabas Health Care System.
| Annual Report |
| A-104 |
| Name, Age; Principal Occupation Peter S. Lynch (61) |
Year of Election or Appointment: 2003
Member of the Advisory Board of Fidelity Investment Trust. Vice Chairman and a Director of FMR, and Vice Chairman (2001 present) and a Director (2000 present) of FMR Co., Inc. Previously, Mr. Lynch served as a Trustee of the Fidelity funds (1990 2003). In addition, he serves as a Trustee of Boston College, Massachusetts Eye & Ear Infirmary, Historic Deerfield, John F. Kennedy Library, and the Museum of Fine Arts of Boston.
| Dwight D. Churchill (51) |
Year of Election or Appointment: 2005
Vice President of Canada, China Region, Emerging Markets, Europe, Europe Capital Appreciation, Japan, Japan Smaller Compa nies, Latin America, Nordic, Pacific Basin, and Southeast Asia. Mr. Churchill also serves as Vice President of certain Equity Funds (2005 present) and certain High Income Funds (2005 present). Previously, he served as Head of Fidelity’s Fixed Income Division (2000 2005), Vice President of Fidelity’s Money Market Funds (2000 2005), Vice President of Fidelity’s Bond Funds, and Senior Vice President of FIMM (2000) and FMR. Mr. Churchill joined Fidelity in 1993 as Vice President and Group Leader of Taxable Fixed Income Investments.
| Maxime Lemieux (31) |
Year of Election or Appointment: 2002
Vice President of Canada. Prior to his current responsibilities, Mr. Lemieux has worked as a reseach analyst and manager.
| Allan Liu (44) |
Year of Election or Appointment: 1995
Vice President of Southeast Asia. Prior to his current responsibilities, Mr. Liu has worked as a research analyst and manager.
| Robert von Rekowsky (39) |
Year of Election or Appointment: 2005
Vice President of Fidelity Emerging Markets. Mr. von Rekowsky also serves as Vice President of other funds advised by FMR. Prior to his current responsibilities, Mr. von Rekowsky has worked as a research analyst and manager.
| Eric D. Roiter (56) |
Year of Election or Appointment: 1998
Secretary of Canada, China Region, Emerging Markets, Europe, Europe Capital Appreciation, Japan, Japan Smaller Companies, Latin America, Nordic, Pacific Basin, and Southeast Asia. He also serves as Secretary of other Fidelity funds; Vice President, Gen eral Counsel, and Secretary of FMR Co., Inc. (2001 present) and FMR; Assistant Secretary of Fidelity Management & Research (U.K.) Inc. (2001 present), Fidelity Management & Research (Far East) Inc. (2001 present), and Fidelity Investments Money Man agement, Inc. (2001 present). Mr. Roiter is an Adjunct Member, Faculty of Law, at Boston College Law School (2003 present). Pre viously, Mr. Roiter served as Vice President and Secretary of Fidelity Distributors Corporation (FDC) (1998 2005).
| Stuart Fross (46) |
Year of Election or Appointment: 2003
Assistant Secretary of Canada, China Region, Emerging Markets, Europe, Europe Capital Appreciation, Japan, Japan Smaller Companies, Latin America, Nordic, Pacific Basin, and Southeast Asia. Mr. Fross also serves as Assistant Secretary of other Fidelity funds (2003 present), Vice President and Secretary of FDC (2005 present), and is an employee of FMR.
| Christine Reynolds (47) |
Year of Election or Appointment: 2004
President, Treasurer, and Anti Money Laundering (AML) officer of Canada, China Region, Emerging Markets, Europe, Europe Capital Appreciation, Japan, Japan Smaller Companies, Latin America, Nordic, Pacific Basin, and Southeast Asia. Ms. Reynolds also serves as President, Treasurer, and AML officer of other Fidelity funds (2004) and is a Vice President (2003) and an employee (2002) of FMR. Before joining Fidelity Investments, Ms. Reynolds worked at PricewaterhouseCoopers LLP (PwC) (1980 2002), where she was most recently an audit partner with PwC’s investment management practice.
| Paul M. Murphy (58) |
Year of Election or Appointment: 2005
Chief Financial Officer of Canada, China Region, Emerging Markets, Europe, Europe Capital Appreciation, Japan, Japan Smaller Companies, Latin America, Nordic, Pacific Basin, and Southeast Asia. Mr. Murphy also serves as Chief Financial Officer of other Fidelity funds (2005 present). He also serves as Senior Vice President of Fidelity Pricing and Cash Management Services Group (FPCMS).
| A-105 |
| Annual Report |
| Trustees and Officers - continued |
| Name, Age; Principal Occupation Kenneth A. Rathgeber (58) |
Year of Election or Appointment: 2004
Chief Compliance Officer of Canada, China Region, Emerging Markets, Europe, Europe Capital Appreciation, Japan, Japan Smaller Companies, Latin America, Nordic, Pacific Basin, and Southeast Asia. Mr. Rathgeber also serves as Chief Compliance Officer of other Fidelity funds (2004) and Executive Vice President of Risk Oversight for Fidelity Investments (2002). Previously, he served as Executive Vice President and Chief Operating Officer for Fidelity Investments Institutional Services Company, Inc. (1998 2002).
| John R. Hebble (47) |
Year of Election or Appointment: 2003
Deputy Treasurer of Canada, China Region, Emerging Markets, Europe, Europe Capital Appreciation, Japan, Japan Smaller Com panies, Latin America, Nordic, Pacific Basin, and Southeast Asia. Mr. Hebble also serves as Deputy Treasurer of other Fidelity funds (2003), and is an employee of FMR. Before joining Fidelity Investments, Mr. Hebble worked at Deutsche Asset Management where he served as Director of Fund Accounting (2002 2003) and Assistant Treasurer of the Scudder Funds (1998 2003).
| Bryan A. Mehrmann (44) |
Year of Election or Appointment: 2005
Deputy Treasurer of Canada, China Region, Emerging Markets, Europe, Europe Capital Appreciation, Japan, Japan Smaller Com panies, Latin America, Nordic, Pacific Basin, and Southeast Asia. Mr. Mehrmann also serves as Deputy Treasurer of other Fidelity funds (2005 present) and is an employee of FMR. Previously, Mr. Mehrmann served as Vice President of Fidelity Investments Institu tional Services Group (FIIS)/Fidelity Investments Institutional Operations Corporation, Inc. (FIIOC) Client Services (1998 2004).
| Kimberley H. Monasterio (41) |
Year of Election or Appointment: 2004
Deputy Treasurer of Canada, China Region, Emerging Markets, Europe, Europe Capital Appreciation, Japan, Japan Smaller Com panies, Latin America, Nordic, Pacific Basin, and Southeast Asia. Ms. Monasterio also serves as Deputy Treasurer of other Fidelity funds (2004) and is an employee of FMR (2004). Before joining Fidelity Investments, Ms. Monasterio served as Treasurer (2000 2004) and Chief Financial Officer (2002 2004) of the Franklin Templeton Funds and Senior Vice President of Franklin Tem pleton Services, LLC (2000 2004).
| Kenneth B. Robins (36) |
Year of Election or Appointment: 2005
Deputy Treasurer of Canada, China Region, Emerging Markets, Europe, Europe Capital Appreciation, Japan, Japan Smaller Com panies, Latin America, Nordic, Pacific Basin, and Southeast Asia. Mr. Robins also serves as Deputy Treasurer of other Fidelity funds (2005 present) and is an employee of FMR (2004 present). Before joining Fidelity Investments, Mr. Robins worked at KPMG LLP, where he was a partner in KPMG’s department of professional practice (2002 2004) and a Senior Manager (1999 2000). In addition, Mr. Robins served as Assistant Chief Accountant, United States Securities and Exchange Commission (2000 2002).
| Robert G. Byrnes (38) |
Year of Election or Appointment: 2005
Assistant Treasurer of Canada, China Region, Emerging Markets, Europe, Europe Capital Appreciation, Japan, Japan Smaller Companies, Latin America, Nordic, Pacific Basin, and Southeast Asia. Mr. Byrnes also serves as Assistant Treasurer of other Fidelity funds (2005 present) and is an employee of FMR (2005 present). Previously, Mr. Byrnes served as Vice President of FPCMS (2003 2005). Before joining Fidelity Investments, Mr. Byrnes worked at Deutsche Asset Management where he served as Vice President of the Investment Operations Group (2000 2003).
| John H. Costello (59) |
Year of Election or Appointment: 1986, 1987, 1990, 1992, 1993, or 1995
Assistant Treasurer of Canada (1987), China Region (1995), Emerging Markets (1990), Europe (1986), Europe Capital Appreci ation (1993), Japan (1992), Japan Smaller Companies (1995), Latin America (1993), Nordic (1995), Pacific Basin (1986), and Southeast Asia (1993). Mr. Costello also serves as Assistant Treasurer of other Fidelity funds and is an employee of FMR.
| Peter L. Lydecker (51) |
Year of Election or Appointment: 2004
Assistant Treasurer of Canada, China Region, Emerging Markets, Europe, Europe Capital Appreciation, Japan, Japan Smaller Companies, Latin America, Nordic, Pacific Basin, and Southeast Asia. Mr. Lydecker also serves as Assistant Treasurer of other Fidelity funds (2004) and is an employee of FMR.
| Annual Report |
| A-106 |
| Name, Age; Principal Occupation Mark Osterheld (50) |
Year of Election or Appointment: 2002
Assistant Treasurer of Canada, China Region, Emerging Markets, Europe, Europe Capital Appreciation, Japan, Japan Smaller Companies, Latin America, Nordic, Pacific Basin, and Southeast Asia. Mr. Osterheld also serves as Assistant Treasurer of other Fidelity funds (2002) and is an employee of FMR.
| Gary W. Ryan (47) |
Year of Election or Appointment: 2005
Assistant Treasurer of Canada, China Region, Emerging Markets, Europe, Europe Capital Appreciation, Japan, Japan Smaller Companies, Latin America, Nordic, Pacific Basin, and Southeast Asia. Mr. Ryan also serves as Assistant Treasurer of other Fidelity funds (2005 present) and is an employee of FMR (2005 present). Previously, Mr. Ryan served as Vice President of Fund Reporting in FPCMS (1999 2005).
| Salvatore Schiavone (39) |
Year of Election or Appointment: 2005
Assistant Treasurer of Canada, China Region, Emerging Markets, Europe, Europe Capital Appreciation, Japan, Japan Smaller Companies, Latin America, Nordic, Pacific Basin, and Southeast Asia. Mr. Schiavone also serves as Assistant Treasurer of other Fidelity funds (2005 present) and is an employee of FMR (2005 present). Before joining Fidelity Investments, Mr. Schiavone worked at Deutsche Asset Management, where he most recently served as Assistant Treasurer (2003 2005) of the Scudder Funds and Vice President and Head of Fund Reporting (1996 2003).
| A-107 |
| Annual Report |
| Distributions |
The Board of Trustees of each fund voted to pay to shareholders of record at the opening of business on record date, the following distributions per share derived from capital gains realized from sales of portfolio securities, and dividends derived from net investment income:
| Fund | Pay Date | Record Date | Dividends | Capital Gains | ||||
| Canada | 12/05/05 | 12/02/05 | $.16 | $.01 | ||||
| China Region | 12/05/05 | 12/02/05 | $.22 | — | ||||
| Emerging Markets | 12/12/05 | 12/09/05 | $.20 | — | ||||
| Europe | 12/12/05 | 12/09/05 | $.30 | $3.97 | ||||
| Europe Capital Appreciation | 12/12/05 | 12/09/05 | $.30 | $2.62 | ||||
| Japan | 12/05/05 | 12/02/05 | $.02 | $.01 | ||||
| Japan Smaller Companies | 12/12/05 | 12/09/05 | $.02 | $.83 | ||||
| Latin America | 12/12/05 | 12/09/05 | $.35 | $.38 | ||||
| Nordic | 12/12/05 | 12/09/05 | $.35 | $2.49 | ||||
| Pacific Basin | 12/12/05 | 12/09/05 | $.18 | $.32 | ||||
| Southeast Asia | 12/12/05 | 12/09/05 | $.25 | $.43 |
The funds hereby designate as capital gain dividends the amounts noted below for the taxable year indicated or for dividends for the taxable year ended 2005, if subsequently determined to be different, the net capital gain of such year; and for dividends for the taxable year ended 2004, if subsequently determined to be different, the excess of: (a) the net capital gain of such year, over (b) amounts previously designated as capital gain dividends with respect to such year.
| Fund | October 31, 2005 | October 31, 2004 | ||||||
| Canada | $ | — | $ | — | ||||
| China Region | — | — | ||||||
| Emerging Markets | — | — | ||||||
| Europe | 170,211,359 | — | ||||||
| Europe Capital Appreciation | 39,471,638 | — | ||||||
| Japan | — | — | ||||||
| Japan Smaller Companies | 102,762,033 | 3,981,793 | ||||||
| Latin America | 21,594,712 | — | ||||||
| Nordic | 16,117,488 | — | ||||||
| Pacific Basin | 4,820,271 | — | ||||||
| Southeast Asia | 20,553,148 | — | ||||||
A percentage of the dividends distributed in December during the fiscal year for the following funds may be taken into account as a dividend for purposes of the maximum rate under section 1(h)(11) of the Internal Revenue Code.
| Fund | Pay Date | Percentage | ||
| Canada | 12/06/04 | 100% | ||
| China Region | 12/06/04 | 69% | ||
| Emerging Markets | 12/13/04 | 100%, | ||
| 12/30/04 | 74% | |||
| Europe | 12/06/04 | 100% | ||
| Europe Capital Appreciation | 12/13/04 | 100% | ||
| Japan Smaller Companies | 12/13/04 | 100% | ||
| Latin America | 12/13/04 | 100%, | ||
| 12/30/04 | 86% | |||
| Nordic | 12/13/04 | 100% | ||
| Pacific Basin | 12/13/04 | 100% | ||
| Southeast Asia | 12/06/04 | 100% |
| Annual Report |
| A 108 |
The amounts per share which represent income derived from sources within, and taxes paid to, foreign countries or possessions of the United States are as follows:
| Fund | Pay Date | Income | Taxes | |||
| Canada | 12/06/04 | $.091 | $.011 | |||
| China Region | 12/06/04 | $.289 | $.029 | |||
| Emerging Markets | 12/13/04 | $.139 | $.044 | |||
| Europe | 12/06/04 | $.192 | $.031 | |||
| Europe Capital Appreciation | 12/13/04 | $.234 | $.023 | |||
| Japan Smaller Companies | 12/13/04 | $.025 | $.005 | |||
| Latin America | 12/13/04 | $.269 | $.046 | |||
| Nordic | 12/13/04 | $.262 | $.042 | |||
| Pacific Basin | 12/13/04 | $.166 | $.021 | |||
| Southeast Asia | 12/06/04 | $.236 | $.096 |
The funds will notify shareholders in January 2006 of amounts for use in preparing 2005 income tax returns.
| A 109 |
| Annual Report |
Board Approval of Investment Advisory Contracts and Management Fees
| Targeted International Equity Funds |
Each year, typically in July, the Board of Trustees, including the independent Trustees (together, the Board), votes on the renewal of the management contract and sub advisory agreements (together, the Advisory Contracts) for each fund. The Board, assisted by the advice of fund counsel and independent Trustees’ counsel, requests and considers a broad range of information throughout the year.
The Board meets regularly each month except August and takes into account throughout the year matters bearing on Advisory Contracts. The Board, acting directly and through its separate committees, considers at each of its meetings factors that are relevant to the annual renewal of each fund’s Advisory Contracts, including the services and support provided to each fund and its shareholders by Fidelity. At the time of the renewal, the Board had 11 standing committees, each composed of independent Trustees with varying backgrounds, to which the Board has assigned specific subject matter responsibilities in order to enhance effective decision making by the Board. Each committee has adopted a written charter outlining the structure and purposes of the committee. One such committee, the Equity Contract Committee, meets periodically during the first six months of each year and as necessary to consider matters specifically related to the annual renewal of Advisory Contracts. The committee requests and receives information on, and makes recommendations to the independent Trustees concerning, the approval and annual review of the Advisory Contracts.
At its July 2005 meeting, the Board of Trustees, including the independent Trustees, unanimously determined to renew the Advisory Contracts for each fund. In reaching its determination, the Board considered all factors it believed relevant, including (1) the nature, extent, and quality of the services to be provided to each fund and its shareholders by Fidelity (including the investment performance of each fund); (2) the competitiveness of the man agement fee and total expenses of each fund; (3) the total costs of the services to be provided by and the profits to be realized by the investment adviser and its affiliates from the relationship with each fund; (4) the extent to which economies of scale would be realized as each fund grows; and (5) whether fee levels reflect these economies of scale, if any, for the benefit of fund shareholders.
In determining whether to renew the Advisory Contracts for each fund, the Board ultimately reached a determination, with the assistance of fund counsel and independent Trustees’ counsel, that the renewal of the Advisory Contracts and the compensation to be received by Fidelity under the management contracts is consistent with Fidelity’s fiduciary duty under applicable law. In addition to evaluating the specific factors noted above, the Board, in reaching its determination, is aware that shareholders in each fund have a broad range of investment choices available to them, including a wide choice among mutual funds offered by competitors to Fidelity, and that each fund’s shareholders, with the opportunity to review and weigh the disclosure provided by the fund in its prospectus and other public disclosures, have chosen to invest in that fund, managed by Fidelity.
Nature, Extent, and Quality of Services Provided by Fidelity. The Board considered staffing within the investment adviser, FMR, and the sub advisers (together, the Investment Advisers), including the backgrounds of the funds’ portfolio managers and the funds’ investment objectives and disciplines. The independent Trustees also had discussions with senior management of Fidelity’s investment operations and investment groups. The Board considered the structure of the portfolio manager compensation program and whether this structure provides appropriate incentives.
Fidelity Resources Dedicated to Investment Management and Support Services. The Board reviewed the size, education, and experience of the Invest ment Advisers’ investment staff, their use of technology, and the Investment Advisers’ approach to recruiting, training, and retaining portfolio managers and other research, advisory, and management personnel. The Board considered Fidelity’s extensive global research capabilities that enable the Investment Advisers to aggregate data from various sources in an effort to produce positive investment results. The Board noted that Fidelity’s analysts have access to a variety of technological tools that enable them to perform both fundamental and quantitative analysis and to specialize in various disciplines. The Board also considered that Fidelity’s portfolio managers and analysts have access to daily portfolio attribution that allows for monitor ing of a fund’s portfolio, as well as an electronic communication system that provides immediate real time access to research concerning issuers and credit enhancers.
Shareholder and Administrative Services. The Board considered the nature, extent, quality, and cost of administrative, distribution, and shareholder services performed by the Investment Advisers and their affiliates under the Advisory Contracts and under separate agreements covering transfer agency, pricing and bookkeeping, and securities lending services for each fund. The Board also considered the nature and extent of the Investment Advisers’ supervision of third party service providers, principally custodians and subcustodians. The Board reviewed the allocation of fund brokerage, including allocations to brokers affiliated with the Investment Advisers, the use of brokerage commissions to pay fund expenses, and the use of “soft” commission dollars to pay for research services. The Board also considered that Fidelity voluntarily decided in 2004 to stop using “soft” commission dollars to pay for market data and, instead, to pay for that data out of its own resources. The Board also considered the resources devoted to, and the record of compliance with, each fund’s compliance policies and procedures.
The Board noted that the growth of fund assets across the complex allows Fidelity to reinvest in the development of services designed to enhance the value or convenience of the Fidelity funds as investment vehicles. These services include 24 hour access to account information and market informa tion through phone representatives and over the Internet, and investor education materials and asset allocation tools.
Investment in a Large Fund Family. The Board considered the benefits to shareholders of investing in a Fidelity fund, including the benefits of investing in a fund that is part of a large family of funds offering a variety of investment disciplines and providing for a large variety of mutual fund investor services. For example, fund shareholders are offered the privilege of exchanging shares of a fund for shares of other Fidelity funds, as set forth in the
| Annual Report |
| A-110 |
fund’s prospectus, without paying an additional sales charge. The Board noted that, since the last Advisory Contract renewals in July 2004, Fidelity has taken a number of actions that benefited particular funds, including (i) voluntarily deciding in 2004 to stop using “soft” commission dollars to pay for market data and, instead, to pay for that data out of its own resources, (ii) contractually agreeing to impose management fee reductions and expense limitations on its five Spartan stock index funds and its stock index fund available through variable insurance products, (iii) contractually agreeing to eliminate the management fees on the Fidelity Freedom Funds and the Fidelity Advisor Freedom Funds, (iv) contractually agreeing to reduce the management fees on most of its investment grade taxable bond funds, and (v) contractually agreeing to impose expense limitations on its retail and Spartan investment grade taxable bond funds.
Investment Performance and Compliance. The Board considered whether each fund has operated within its investment objective, as well as its record of compliance with its investment restrictions. It also reviewed each fund’s absolute investment performance, as well as each fund’s relative investment performance measured against (i) a broad based securities market index (or a proprietary custom index, in the case of China Region Fund), and (ii) a peer group of mutual funds over multiple periods. For each fund, the following charts considered by the Board show, over the one , three , and five year periods ended December 31, 2004, the fund’s returns, the returns of a broad based securities market index (or a proprietary custom index, in the case of China Region Fund) (“benchmark”), and a range of returns of a peer group of mutual funds identified by Lipper Inc. as having an investment objec tive similar to that of the fund. The box within each chart shows the 25th percentile return (bottom of box) and the 75th percentile return (top of box) of the Lipper peer group. Returns shown above the box are in the first quartile and returns shown below the box are in the fourth quartile. The percent age beaten number noted below each chart corresponds to the percentile box and represents the percentage of funds in the Lipper peer group whose performance was equal to or lower than that of the fund. For China Region Fund, the proprietary custom index is an index developed by FMR that represents the performance of the Hang Seng Index until September 1, 2000 and the Morgan Stanley Capital International Golden Dragon Plus Index beginning September 1, 2000.
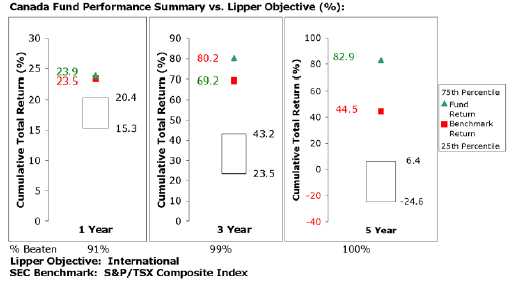
The Board reviewed the fund’s relative investment performance against its Lipper peer group and stated that the performance of the fund was in the first quartile for the one , three , and five year periods. The Board noted that FMR does not consider that Lipper peer group to be a meaningful compar ison for the fund, however, because unlike many of its Lipper peers, the fund focuses its investments on securities of Canadian issuers. The Board also stated that the relative investment performance of the fund has compared favorably to its benchmark over time.
| A-111 |
| Annual Report |
Board Approval of Investment Advisory Contracts and Management Fees - continued
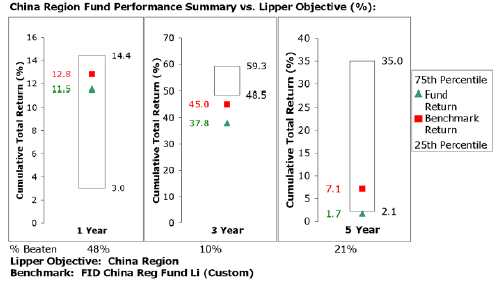
The Board reviewed the fund’s relative investment performance against its Lipper peer group and stated that the performance of the fund was in the third quartile for the one year period and the fourth quartile for the three and five year periods. The Board also stated that the relative investment performance of the fund was lower than its benchmark over time. The Board discussed with FMR actions to be taken by FMR to improve the fund’s disappointing performance.
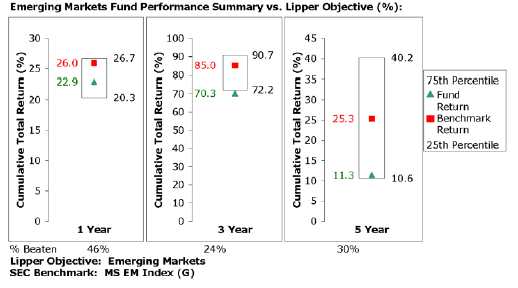
The Board reviewed the fund’s relative investment performance against its Lipper peer group and stated that the performance of the fund was in the third quartile for the one and five year periods and the fourth quartile for the three year period. The Board also stated that the relative investment performance of the fund was lower than its benchmark over time. The Board discussed with FMR actions to be taken by FMR to improve the fund’s disappointing performance.
| Annual Report |
| A-112 |
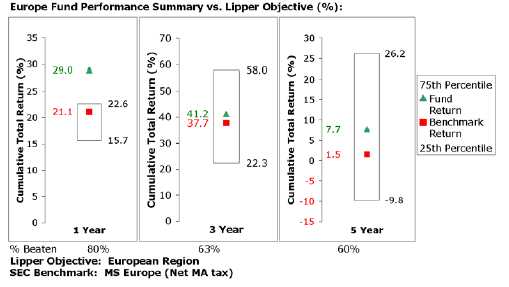
The Board reviewed the fund’s relative investment performance against its Lipper peer group and stated that the performance of the fund was in the first quartile for the one year period and the second quartile for the three and five year periods. The Board also stated that the relative investment performance of the fund has compared favorably to its benchmark over time.
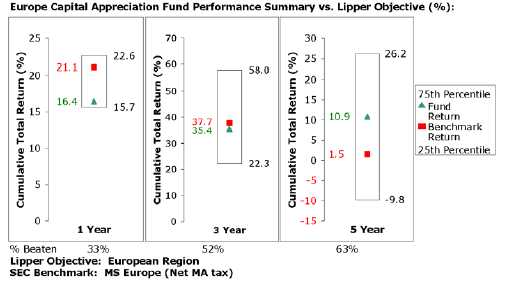
The Board reviewed the fund’s relative investment performance against its Lipper peer group and stated that the performance of the fund was in the third quartile for the one year period and the second quartile for the three and five year periods. The Board also stated that the relative investment performance of the fund was lower than its benchmark for certain periods, although the five year cumulative total return of the fund compared favor ably to its benchmark.
| A-113 |
| Annual Report |
Board Approval of Investment Advisory Contracts and Management Fees - continued
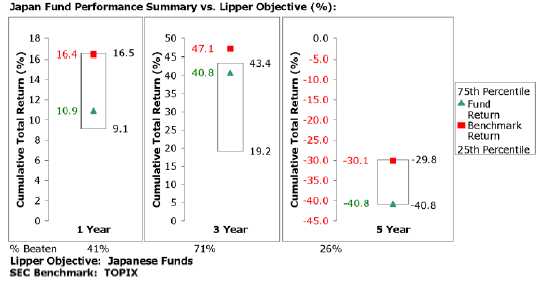
The Board reviewed the fund’s relative investment performance against its Lipper peer group and stated that the performance of the fund was in the third quartile for the one and five year periods and the second quartile for the three year period. The Board also stated that the relative investment performance of the fund was lower than its benchmark over time.
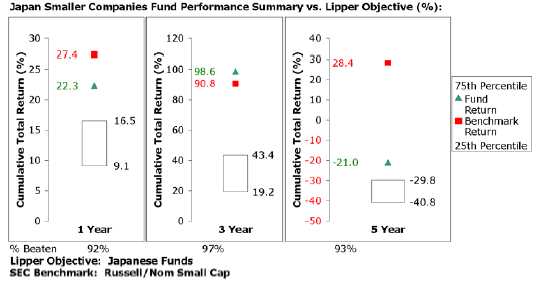
The Board reviewed the fund’s relative investment performance against its Lipper peer group and stated that the performance of the fund was in the first quartile for the one , three , and five year periods. The Board noted that FMR does not consider that Lipper peer group to be a meaningful compar ison for the fund, however, because the fund’s investment strategy of investing in securities of companies with smaller market capitalizations is more specialized than that of the other funds in the peer group. The Board also stated that the relative investment performance of the fund was lower than its benchmark for certain periods, although the fund’s three year cumulative total return compared favorably to its benchmark.
| Annual Report |
| A-114 |
![]()
The Board reviewed the fund’s relative investment performance against its Lipper peer group and stated that the performance of the fund was in the second quartile for the one , three , and five year periods. The Board also stated that the relative investment performance of the fund was lower than its benchmark for certain periods, although the one year cumulative total return of the fund compared favorably to its benchmark.
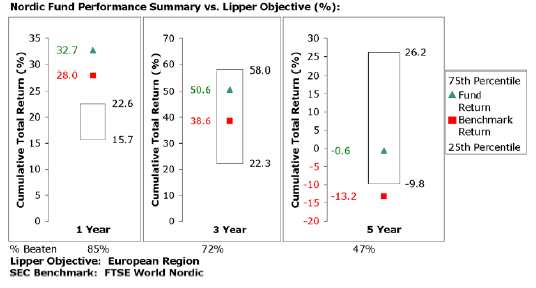
The Board reviewed the fund’s relative investment performance against its Lipper peer group and stated that the performance of the fund was in the first quartile for the one year period, the second quartile for the three year period, and the third quartile for the five year period. The Board noted that FMR does not consider that Lipper peer group to be a meaningful comparison for the fund, however, because unlike many of its Lipper peers, the fund focuses its investments on securities of issuers in Norway, Sweden, Finland, and Denmark. The Board also stated that the relative investment perfor mance of the fund has compared favorably to its benchmark over time.
| A-115 |
| Annual Report |
Board Approval of Investment Advisory Contracts and Management Fees - continued
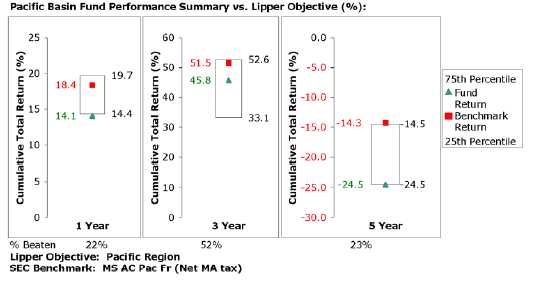
The Board reviewed the fund’s relative investment performance against its Lipper peer group and stated that the performance of the fund was in the fourth quartile for the one and five year periods and the second quartile for the three year period. The Board also stated that the relative investment performance of the fund was lower than its benchmark over time.
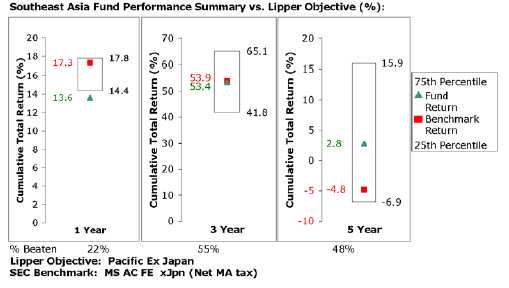
The Board reviewed the fund’s relative investment performance against its Lipper peer group and stated that the performance of the fund was in the fourth quartile for the one year period, the second quartile for the three year period, and the third quartile for the five year period. The Board also stated that the relative investment performance of the fund was lower than its benchmark for certain periods, although the five year cumulative total return compared favorably to its benchmark.
The Board also considered that each of Canada Fund’s, Europe Fund’s, Europe Capital Appreciation Fund’s, Japan Fund’s, Pacific Basin Fund’s, and Southeast Asia Fund’s management fee is subject to upward or downward adjustment depending upon whether, and to what extent, the fund’s invest ment performance for the performance period exceeds, or is exceeded by, the record (over the same period) of a Board approved performance adjust ment index. The Board realizes that the performance adjustment provides FMR with a strong economic incentive to seek to achieve superior performance for each fund’s shareholders and helps to more closely align the interests of FMR and each fund’s shareholders.
The Board has had thorough discussions with FMR throughout the year about the Board’s and FMR’s concerns about equity research, equity fund performance, and compliance with internal policies governing gifts and entertainment. FMR has taken steps that it believes will refocus and strengthen equity research and equity portfolio management and compliance. The Board noted with favor FMR’s recent reorganization of its senior management team and FMR’s plans to dedicate additional resources to investment research, and participated in the process that led to those changes.
| Annual Report |
| A-116 |
Based on its review, and giving particular weight to the nature and quality of the resources dedicated by the Investment Advisers to maintain and improve relative performance, the Board concluded that the nature, extent, and quality of the services provided by Fidelity will benefit each fund’s shareholders, particularly in light of the Board’s view that each fund’s shareholders benefit from investing in a fund that is part of a large family of funds offering a variety of investment disciplines and services.
Competitiveness of Management Fee and Total Fund Expenses. The Board considered each fund’s management fee and total expenses compared to “mapped groups” of competitive funds and classes. Fidelity creates “mapped groups” by combining similar Lipper investment objective categories that have comparable management fee characteristics. Combining Lipper investment objective categories aids the Board’s management fee and total expense comparisons by broadening the competitive group used for comparison and by reducing the number of universes to which various Fidelity funds are compared.
The Board considered two proprietary management fee comparisons for the 12 month periods shown in the charts below. The group of Lipper funds used by the Board for management fee comparisons is referred to below as the “Total Mapped Group” and, for the reasons explained above, is broader than the Lipper peer group used by the Board for performance comparisons. The Total Mapped Group comparison focuses on a fund’s standing relative to the total universe of comparable funds available to investors, in terms of gross management fees before expense reimbursements or caps. “TMG %” represents the percentage of funds in the Total Mapped Group that had management fees that were lower than a fund’s. For example, a TMG % of 24% would mean that 76% of the funds in the Total Mapped Group had higher management fees than a fund. The “Asset Size Peer Group” (ASPG) compari son focuses on a fund’s standing relative to non Fidelity funds similar in size to the fund within the Total Mapped Group. The ASPG represents at least 15% of the funds in the Total Mapped Group with comparable asset size and management fee characteristics, subject to a minimum of 50 funds (or all funds in the Total Mapped Group if fewer than 50). Additional information, such as the ASPG quartile (“quadrant”) in which a fund’s management fee ranked and the impact of a fund’s performance adjustment (if applicable), is also included in the charts and considered by the Board.
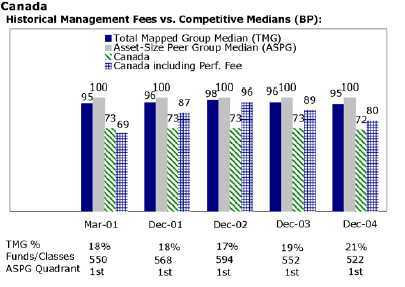
| A-117 |
| Annual Report |
Board Approval of Investment Advisory Contracts and Management Fees - - continued
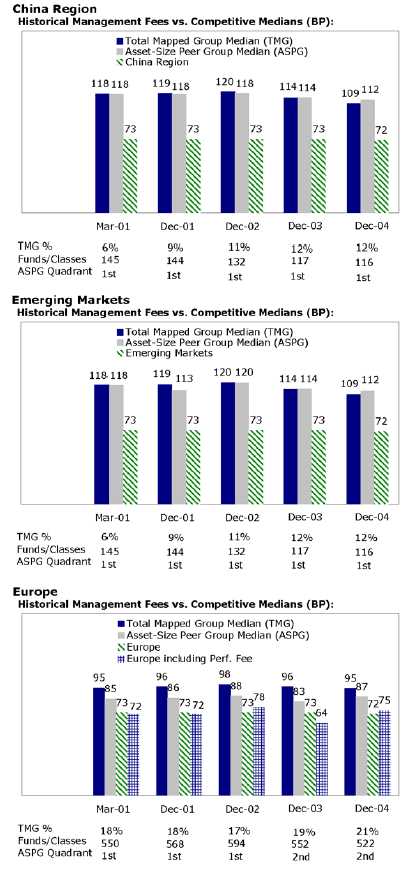
Annual Report A-118
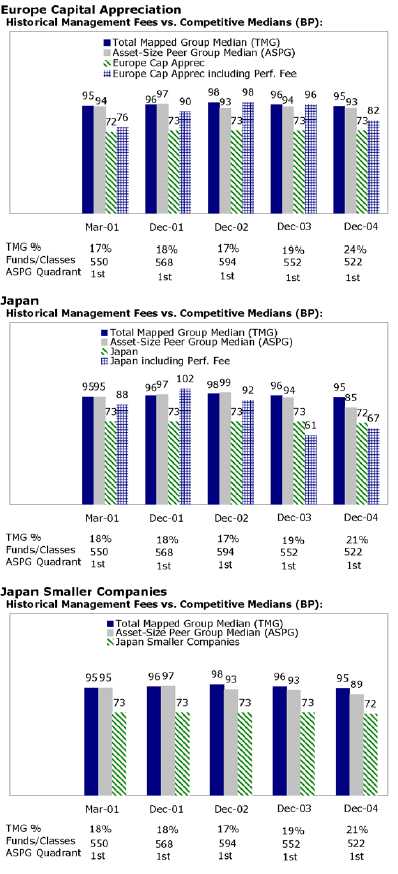
A-119 Annual Report
Board Approval of Investment Advisory Contracts and Management Fees - - continued
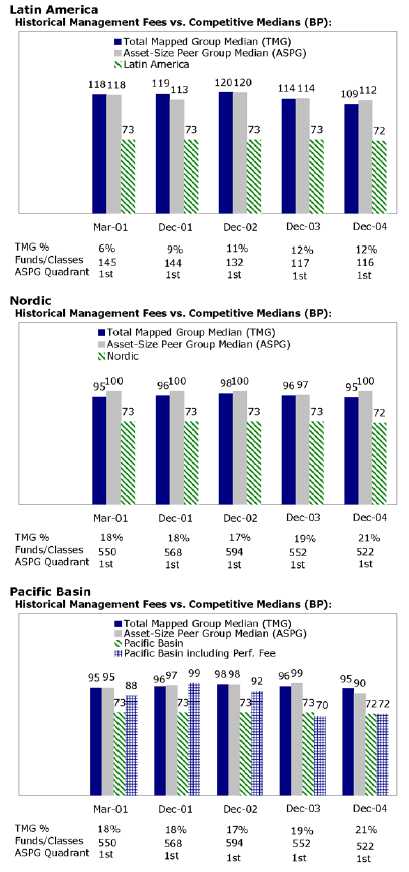
Annual Report A-120
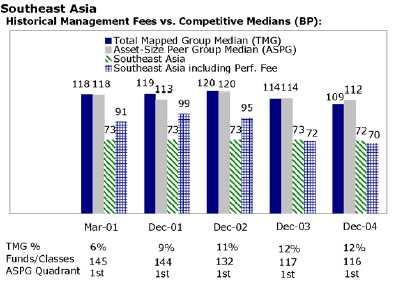
The Board noted that each fund’s management fee ranked below the median of its Total Mapped Group and below the median of its ASPG for 2004. The Board also noted the effect of a fund’s performance adjustment, if applicable, on the fund’s management fee ranking.
Based on its review, the Board concluded that each fund’s management fee was fair and reasonable in light of the services that the fund receives and the other factors considered.
In its review of each fund’s total expenses, the Board considered the fund’s management fee as well as other fund expenses, such as transfer agent fees, pricing and bookkeeping fees, and custodial, legal, and audit fees. The Board also noted the effects of any waivers and reimbursements on fees and expenses, as well as Canada Fund’s, Europe Fund’s, and Europe Capital Appreciation Fund’s positive performance adjustment, and Japan Fund’s, Pacific Basin Fund’s and Southeast Asia Fund’s negative performance adjustment. As part of its review, the Board also considered current and historical total expenses of each fund compared to competitive fund median expenses. Each fund is compared to those funds and classes in the Total Mapped Group (used by the Board for management fee comparisons) that have a similar sales load structure.
The Board noted that each fund’s total expenses ranked below its competitive median for 2004.
In its review of total expenses, the Board also considered Fidelity fee structures and other information on clients that FMR and its affiliates service in other competitive markets, such as other mutual funds advised or subadvised by FMR or its affiliates, pension plan clients, and other institutional clients.
Based on its review, the Board concluded that each fund’s total expenses were reasonable in light of the services that the fund and its shareholders receive and the other factors considered.
Costs of the Services and Profitability. The Board considered the revenues earned and the expenses incurred by Fidelity in conducting the busi ness of developing, marketing, distributing, managing, administering and servicing each fund and its shareholders. The Board also considered the level of Fidelity’s profits in respect of all the Fidelity funds.
On an annual basis, FMR presents to the Board Fidelity’s profitability for each fund. Fidelity calculates the profitability for each fund, as well as aggre gate profitability for groups of Fidelity funds and all Fidelity funds, using a series of detailed revenue and cost allocation methodologies which originate with the audited books and records of Fidelity. The Audit Committee of the Board reviews any significant changes from the prior year’s methodologies.
PricewaterhouseCoopers LLP (PwC), independent registered accounting firm and auditor to Fidelity and certain Fidelity funds, has been engaged annually by the Board as part of the Board’s assessment of the results of Fidelity’s profitability analysis. PwC’s engagement includes the review and assessment of Fidelity’s methodologies used in determining the revenues and expenses attributable to Fidelity’s mutual fund business, and completion of agreed upon procedures surrounding the mathematical accuracy of fund profitability and its conformity to allocation methodologies. After consider ing PwC’s reports issued under the engagement and information provided by Fidelity, the Board believes that while other allocation methods may also be reasonable, Fidelity’s profitability methodologies are reasonable in all material respects.
The Board has also reviewed Fidelity’s non fund businesses and any fall out benefits related to the mutual fund business as well as cases where Fidelity’s affiliates may benefit from or be related to the funds’ business. In addition, a special committee of the Board reviewed services provided to Fidelity by its affiliates and determined that the fees that Fidelity paid for such services were reasonable.
| A-121 |
| Annual Report |
Board Approval of Investment Advisory Contracts and Management Fees - continued
The Board considered the costs of the services provided by and the profits realized by Fidelity in connection with the operation of each fund and determined that the amount of profit is a fair entrepreneurial profit for the management of each fund.
Economies of Scale. The Board considered whether there have been economies of scale in respect of the management of the Fidelity funds, whether the Fidelity funds (including each fund) have appropriately benefited from any such economies of scale, and whether there is potential for realization of any further economies of scale. The Board considered the extent to which each fund will benefit from economies of scale through increased services to the fund, through waivers or reimbursements, or through fee or expense reductions, including reductions that occur through operation of the transfer agent agreement. The transfer agent fee varies in part based on the number of accounts in each fund. If the number of accounts decreases or the average account size increases, the overall transfer agent fee rate decreases.
The Board recognized that each fund’s management contract incorporates a “group fee” structure, which provides for lower fee rates as total fund assets under FMR’s management increase, and for higher fee rates as total fund assets under FMR’s management decrease. The Board considered that the group fee is designed to deliver the benefits of economies of scale to fund shareholders when total fund assets increase, even if assets of any particu lar fund are unchanged or have declined, because some portion of Fidelity’s costs are attributable to services provided to all Fidelity funds, and all funds benefit if those costs can be allocated among more assets. The Board concluded that, given the group fee structure, fund shareholders will achieve a certain level of economies of scale as assets under FMR’s management increase at the fund complex level, regardless of whether Fidelity achieves any such economies of scale.
The Board further concluded that any potential economies of scale are being shared between fund shareholders and Fidelity in an appropriate manner.
Additional Information Requested by the Board. In order to develop fully the factual basis for consideration of the Advisory Contracts, the Board requested additional information regarding (i) equity fund transfer agency fees; (ii) Fidelity’s fund profitability methodology and the impact of various changes in the methodology over time; (iii) benefits to shareholders from economies of scale; (iv) composition and characteristics of various fund and industry data used in comparisons; and (v) compensation of portfolio managers and research analysts.
Based on its evaluation of all of the conclusions noted above, and after considering all material factors, the Board ultimately concluded that the exist ing advisory fee structures are fair and reasonable, and that each fund’s existing Advisory Contracts should be renewed.
| Annual Report |
| A-122 |
| A-123 |
| Annual Report |
| Annual Report |
| A-124 |
| Investment Adviser Fidelity Management & Research Company Boston, MA Investment Sub Advisers FMR Co., Inc. Fidelity Management & Research (U.K.) Inc. Fidelity Management & Research (Far East) Inc. Fidelity Investments Japan Limited Fidelity International Investment Advisors Fidelity International Investment Advisors (U.K.) Limited Fidelity Gestion (FIGEST) Europe Fund General Distributor Fidelity Distributors Corporation Boston, MA Transfer and Service Agent Fidelity Service Company, Inc. Boston, MA Custodians JPMorgan Chase Bank New York, NY Emerging Markets Fund, Europe Fund, Europe Capital Appreciation Fund, Japan Fund, Pacific Basin Fund, Southeast Asia Fund Brown Brothers Harriman & Co. Boston, MA Canada Fund, China Region Fund, Japan Smaller Companies Fund, Latin America Fund, Nordic Fund Fidelity’s International Equity Funds Aggressive International Fund Canada Fund China Region Fund Diversified International Fund Emerging Markets Fund Europe Fund Europe Capital Appreciation Fund Global Balanced Fund International Discovery Fund International Small Cap Fund Japan Fund Japan Smaller Companies Fund Latin America Fund Nordic Fund Overseas Fund Pacific Basin Fund Southeast Asia Fund Worldwide Fund |
| Corporate Headquarters 82 Devonshire Street Boston, MA 02109 www.fidelity.com |
| The Fidelity Telephone Connection | ||||||||
| Mutual Fund 24-Hour Service | ||||||||
| Exchanges/Redemptions | ||||||||
| and Account Assistance | 1-800-544-6666 | |||||||
| Product Information | 1-800-544-6666 | |||||||
| Retirement Accounts | 1-800-544-4774 | |||||||
| (8 a.m. - 9 p.m.) | ||||||||
| TDD Service | 1-800-544-0118 | |||||||
| for the deaf and hearing impaired | ||||||||
| (9 a.m. 9 p.m. Eastern time) | ||||||||
| Fidelity Automated Service | ||||||||
| Telephone (FAST®) (automated phone logo) | 1-800-544-5555 | |||||||
| (automated phone logo) Automated line for quickest service | ||||||||
Please carefully consider the funds’ investment objectives, risks, charges and expenses before investing. For this and other information, call 1-800-544-6666 for a free prospectus. Read it carefully before you invest or send money.

| TIF UANNPRO 1205 1.784781.102 |
| Fidelity® International Small Cap Fund |
| Annual Report October 31, 2005 |


| Contents | ||||
| Chairman’s Message | 4 | Ned Johnson’s message to shareholders. | ||
| Performance | 5 | How the fund has done over time. | ||
| Management’s Discussion | 6 | The managers’ review of fund | ||
| performance, strategy and outlook. | ||||
| Shareholder Expense | 7 | An example of shareholder expenses. | ||
| Example | ||||
| Investment Changes | 9 | A summary of major shifts in the fund’s | ||
| investments over the past six months. | ||||
| Investments | 11 | A complete list of the fund’s investments | ||
| with their market values. | ||||
| Financial Statements | 34 | Statements of assets and liabilities, | ||
| operations, and changes in net assets, | ||||
| as well as financial highlights. | ||||
| Notes | 44 | Notes to the financial statements. | ||
| Report of Independent | 54 | |||
| Registered Public | ||||
| Accounting Firm | ||||
| Trustees and Officers | 55 | |||
| Distributions | 65 | |||
| Board Approval of | 66 | |||
| Investment Advisory | ||||
| Contracts and | ||||
| Management Fees | ||||
| To view a fund’s proxy voting guidelines and proxy voting record for the 12 month period ended June 30, visit www.fidelity.com/proxyvotingresults or visit the Securities and Exchange Commis sion’s (SEC) web site at www.sec.gov. You may also call 1-800-544-8544 to request a free copy of the proxy voting guidelines. Standard & Poor’s, S&P and S&P 500 are registered service marks of The McGraw Hill Companies, Inc. and have been licensed for use by Fidelity Distributors Corporation. Other third party marks appearing herein are the property of their respective owners. All other marks appearing herein are registered or unregistered trademarks or service marks of FMR Corp. or an affiliated company. |
| Annual Report |
| 2 |
| This report and the financial statements contained herein are submitted for the general informa tion of the shareholders of the fund. This report is not authorized for distribution to prospective investors in the fund unless preceded or accompanied by an effective prospectus. A fund files its complete schedule of portfolio holdings with the SEC for the first and third quarters of each fiscal year on Form N Q. Forms N Q are available on the SEC’s web site at http://www.sec.gov. A fund’s Forms N Q may be reviewed and copied at the SEC’s Public Reference Room in Washington, DC. Information regarding the operation of the SEC’s Public Reference Room may be obtained by calling 1-800-SEC-0330. For a complete list of a fund’s portfolio hold ings, view the most recent quarterly holdings report, semiannual report, or annual report on Fidelity’s web site at http://www.fidelity.com/holdings. NOT FDIC INSURED · MAY LOSE VALUE · NO BANK GUARANTEE Neither the fund nor Fidelity Distributors Corporation is a bank. |
3 Annual Report
Chairman’s Message
(photograph of Edward C. Johnson 3d)
Dear Shareholder:
During the past year or so, much has been reported about the mutual fund industry, and much of it has been more critical than I believe is warranted. Allegations that some companies have been less than forthright with their shareholders have cast a shadow on the entire industry. I continue to find these reports disturbing, and assert that they do not create an accurate picture of the industry overall. Therefore, I would like to remind every one where Fidelity stands on these issues. I will say two things specifically regarding allegations that some mutual fund companies were in violation of the Securities and Exchange Commission’s forward pricing rules or were involved in so called “market timing” activities.
First, Fidelity has no agreements that permit customers who buy fund shares after 4 p.m. to obtain the 4 p.m. price. This is not a new policy. This is not to say that some one could not deceive the company through fraudulent acts. However, we are extremely diligent in preventing fraud from occurring in this manner and in every other. But I underscore again that Fidelity has no so called “agreements” that sanction illegal practices.
Second, Fidelity continues to stand on record, as we have for years, in opposition to predatory short term trading that adversely affects shareholders in a mutual fund. Back in the 1980s, we initiated a fee which is returned to the fund and, therefore, to investors to discourage this activity. Further, we took the lead several years ago in developing a Fair Value Pricing Policy to prevent market timing on foreign securities in our funds. I am confident we will find other ways to make it more difficult for predatory traders to operate. However, this will only be achieved through close cooperation among regulators, legislators and the industry.
Yes, there have been unfortunate instances of unethical and illegal activity within the mutual fund industry from time to time. That is true of any industry. When this occurs, confessed or convicted offenders should be dealt with appropriately. But we are still concerned about the risk of over regulation and the quick application of simplistic solutions to intricate problems. Every system can be improved, and we support and applaud well thought out improvements by regulators, legislators and industry representatives that achieve the common goal of building and protecting the value of investors’ holdings.
For nearly 60 years, Fidelity has worked very hard to improve its products and service to justify your trust. When our family founded this company in 1946, we had only a few hundred customers. Today, we serve more than 18 million customers including individual investors and participants in retirement plans across America.
Let me close by saying that we do not take your trust in us for granted, and we realize that we must always work to improve all aspects of our service to you. In turn, we urge you to continue your active participation with your financial matters, so that your interests can be well served.
Best regards,
/s/ Edward C. Johnson 3d
Edward C. Johnson 3d
Annual Report 4
Performance: The Bottom Line
Average annual total return reflects the change in the value of an investment, assuming reinvestment of International Small Cap’s dividend income and capital gains (the profits earned upon the sale of securities that have grown in value) and assuming a constant rate of performance each year. The $10,000 table and the fund’s returns do not reflect the deduction of taxes that a shareholder would pay on fund distributions or the redemp tion of fund shares. During periods of reimbursement by Fidelity, a fund’s total return will be greater than it would be had the reimbursement not occurred. How a fund did yesterday is no guarantee of how it will do tomorrow.
| Average Annual Total Returns | ||||
| Periods ended October 31, 2005 | Past 1 | Life of | ||
| year | FundA | |||
| International Small Cap | 30.67% | 39.85% | ||
| A From September 18, 2002. | ||||
$10,000 Over Life of Fund
Let’s say hypothetically that $10,000 was invested in International Small Cap on Septem ber 18, 2002, when the fund started. The chart shows how the value of your investment would have changed, and also shows how the MSCI® EAFE® Small Cap Index performed over the same period.
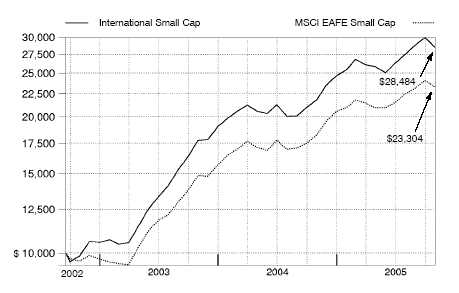
5 Annual Report
5
Management’s Discussion of Fund Performance
Comments from Tokuya Sano, Ben Paton and Wilson Wong, Co Portfolio Manag ers of Fidelity® International Small Cap Fund. Wilson Wong became a co manager on July 1, 2005.
Foreign stock markets enjoyed broad based advances for the year ending October 31, 2005, encouraged by better than expected corporate earnings and markedly improved economies. For the 12 months overall, the Morgan Stanley Capital InternationalSM Europe, Australasia, Far East (MSCI® EAFE®) Index a performance measure of developed stock markets outside the United States and Canada gained 18.28% . The Japanese stock market climbed to its highest level in more than four years. Positive economic indicators and Prime Minister Koizumi’s decisive election victory attracted record inflows from overseas investors. In response, the Tokyo Stock Exchange Stock Price Index (TOPIX) soared 22.89% . Southeast Asian equities outside of Japan, particularly South Korea, also responded well to the better macroeconomic environment, illustrated by the 19.44% return for the MSCI All Country Far East ex Japan index. European stock markets were up as well, despite investors’ concern about higher energy prices and potential downgrades to eco nomic growth in the region. For the year overall, the MSCI Europe index rose 16.51% . Although robust, returns for U.S. investors in foreign markets were tempered by the strength of the dollar versus many major currencies.
During the past year, International Small Cap’s return was 30.67%, besting the 27.83% and 25.87% returns of the MSCI Small Cap index and the LipperSM International Small Cap Funds Average, respectively. From a geographical perspective, Western Europe was the strongest contributor versus the index, with stock selection in Germany alone adding almost four percentage points to the fund’s return. On a sector basis, fund performance was helped the most by our picks in telecommunication services and information technology, while its holdings in materials and health care underperformed. Among individual holdings, the most positive contributors were Egyptian wireless stock Orascom and German fiber board manufacturer Pfleiderer, both of which were sold for valuation reasons. In the Asian portfolio, the fund was helped by its investments in Yamada Denki and Ibiden both Japanese holdings. Overall, though, stock selection in Japan had a negative impact on relative performance. From a sector standpoint, our picks in materials and health care could have been better. Detractors included U.K. energy holding BowLeven, along with cellular handset aftermarket services provider Accord Customer Care Solutions, a Singapore based holding we sold, and flexible printed circuit board maker NOK, a Japanese stock we trimmed substantially.
The views expressed in this statement reflect those of the portfolio managers only through the end of the period of the report as stated on the cover and do not necessarily represent the views of Fidelity or any other person in the Fidelity organization. Any such views are subject to change at any time based upon market or other conditions and Fidelity disclaims any responsibility to update such views. These views may not be relied on as investment advice and, because investment decisions for a Fidelity fund are based on numerous factors, may not be relied on as an indication of trading intent on behalf of any Fidelity fund.
| Annual Report |
| 6 6 |
Shareholder Expense Example
As a shareholder of the Fund, you incur two types of costs: (1) transaction costs, including sales charges (loads) on purchase payments or redemption proceeds, redemption fees, and (2) ongoing costs, including management fees, distribution and/or service (12b 1) fees and other Fund expenses. This Example is intended to help you understand your ongoing costs (in dollars) of investing in the Fund and to compare these costs with the ongoing costs of investing in other mutual funds.
The Example is based on an investment of $1,000 invested at the beginning of the period and held for the entire period (May 1, 2005 to October 31, 2005).
| Actual Expenses |
The first line of the table below for each class of the Fund provides information about actual account values and actual expenses. You may use the information in this line, together with the amount you invested, to estimate the expenses that you paid over the period. Simply divide your account value by $1,000.00 (for example, an $8,600 account value divided by $1,000.00 = 8.6), then multiply the result by the number in the first line for a class of the Fund under the heading entitled “Expenses Paid During Period” to estimate the expenses you paid on your account during this period. A small balance maintenance fee of $12.00 that is charged once a year may apply for certain accounts with a value of less than $2,000. This fee is not included in the table below. If it was, the esti mate of expenses you paid during the period would be higher, and your ending account value lower, by this amount.
Hypothetical Example for Comparison Purposes
The second line of the table below for each class of the Fund provides information about hypothetical account values and hypothetical expenses based on a Class’ actual expense ratio and an assumed rate of return of 5% per year before expenses, which is not the Class’ actual return. The hypothetical account values and expenses may not be used to estimate the actual ending account balance or expenses you paid for the period. You may use this information to compare the ongoing costs of investing in the Fund and other funds. To do so, compare this 5% hypothetical example with the 5% hypothetical examples that appear in the shareholder reports of the other funds. A small balance maintenance fee of $12.00 that is charged once a year may apply for certain accounts with a value of less than $2,000. This fee is not included in the table below. If it was, the estimate of expenses you paid during the period would be higher, and your ending account value lower, by this amount.
7 Annual Report
Shareholder Expense Example continued
Please note that the expenses shown in the table are meant to highlight your ongoing costs only and do not reflect any transaction costs. Therefore, the second line of the table is useful in comparing ongoing costs only, and will not help you determine the relative total costs of owning different funds. In addition, if these transactional costs were included, your costs would have been higher.
| Expenses Paid | ||||||||||||
| Beginning | Ending | During Period* | ||||||||||
| Account Value | Account Value | May 1, 2005 | ||||||||||
| May 1, 2005 | October 31, 2005 | to October 31, 2005 | ||||||||||
| Class A | ||||||||||||
| Actual | $ | 1,000.00 | $ | 1,099.70 | $ | 8.73 | ||||||
| HypotheticalA | $ | 1,000.00 | $ | 1,016.89 | $ | 8.39 | ||||||
| Class T | ||||||||||||
| Actual | $ | 1,000.00 | $ | 1,098.40 | $ | 10.05 | ||||||
| HypotheticalA | $ | 1,000.00 | $ | 1,015.63 | $ | 9.65 | ||||||
| Class B | ||||||||||||
| Actual | $ | 1,000.00 | $ | 1,096.10 | $ | 12.68 | ||||||
| HypotheticalA | $ | 1,000.00 | $ | 1,013.11 | $ | 12.18 | ||||||
| Class C | ||||||||||||
| Actual | $ | 1,000.00 | $ | 1,095.80 | $ | 12.68 | ||||||
| HypotheticalA | $ | 1,000.00 | $ | 1,013.11 | $ | 12.18 | ||||||
| International Small Cap | ||||||||||||
| Actual | $ | 1,000.00 | $ | 1,102.00 | $ | 6.73 | ||||||
| HypotheticalA | $ | 1,000.00 | $ | 1,018.80 | $ | 6.46 | ||||||
| Institutional Class | ||||||||||||
| Actual | $ | 1,000.00 | $ | 1,101.70 | $ | 6.89 | ||||||
| HypotheticalA | $ | 1,000.00 | $ | 1,018.65 | $ | 6.61 | ||||||
| A 5% return per year before expenses | ||||||||||||
* Expenses are equal to each Class’ annualized expense ratio (shown in the table below); multiplied by the average account value over the period, multiplied by 184/365 (to reflect the one half year period).
| Annualized | ||
| Expense Ratio | ||
| Class A | 1.65% | |
| Class T | 1.90% | |
| Class B | 2.40% | |
| Class C | 2.40% | |
| International Small Cap | 1.27% | |
| Institutional Class | 1.30% |
| Annual Report |
| 8 |
Investment Changes
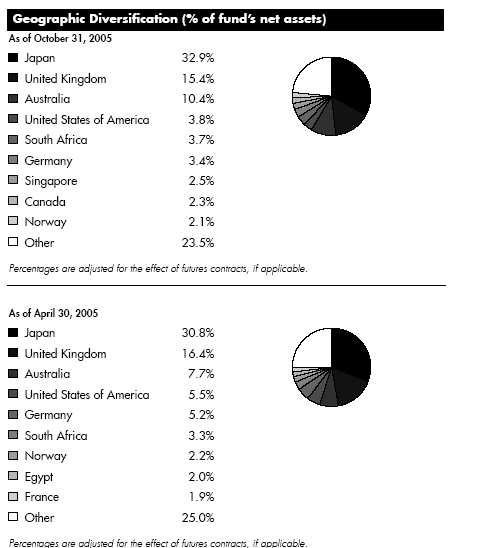
| Asset Allocation | ||||
| % of fund’s | % of fund’s net assets | |||
| net assets | 6 months ago | |||
| Stocks and Investment Companies | 97.8 | 96.6 | ||
| Bonds | 0.1 | 0.0 | ||
| Short Term Investments and Net Other Assets | 2.1 | 3.4 |
9 Annual Report
| Investment Changes continued | ||||||
| Top Ten Stocks as of October 31, 2005 | ||||||
| % of fund’s | % of fund’s net assets | |||||
| net assets | 6 months ago | |||||
| Steinhoff International Holdings Ltd. (South | ||||||
| Africa, Household Durables) | 1.5 | 1.3 | ||||
| Hikari Tsushin, Inc. (Japan, Specialty Retail) | 1.5 | 1.3 | ||||
| Yamada Denki Co. Ltd. (Japan, Specialty Retail) | 1.3 | 0.0 | ||||
| K&S AG (Germany, Chemicals) | 1.3 | 1.1 | ||||
| Nissin Kogyo Co. Ltd. (Japan, Auto Components) | 1.2 | 0.9 | ||||
| Stolt Nielsen SA (Luxembourg, Marine) | 1.0 | 0.9 | ||||
| Banca Italease Spa (Italy, Diversified Financial | ||||||
| Services) | 1.0 | 0.0 | ||||
| Neste Oil Oyj (Finland, Oil, Gas & Consumable | ||||||
| Fuels) | 0.9 | 0.4 | ||||
| Ibiden Co. Ltd. (Japan, Electronic Equipment & | ||||||
| Instruments) | 0.9 | 0.5 | ||||
| Kura Corp. Ltd. (Japan, Food & Staples Retailing) | 0.9 | 0.4 | ||||
| 11.5 | ||||||
| Market Sectors as of October 31, 2005 | ||||||
| % of fund’s | % of fund’s net assets | |||||
| net assets | 6 months ago | |||||
| Consumer Discretionary | 18.7 | 22.5 | ||||
| Industrials | 15.5 | 14.9 | ||||
| Materials | 14.8 | 14.1 | ||||
| Energy | 13.0 | 7.8 | ||||
| Information Technology | 12.9 | 13.0 | ||||
| Financials | 9.5 | 9.8 | ||||
| Health Care | 5.8 | 6.4 | ||||
| Consumer Staples | 4.3 | 2.9 | ||||
| Telecommunication Services | 2.8 | 4.8 | ||||
| Utilities | 0.6 | 0.3 | ||||
| Annual Report | 10 | |||||
| Investments October 31, 2005 | ||||||
| Showing Percentage of Net Assets | ||||||
| Common Stocks 97.4% | ||||||
| Shares | Value (Note 1) | |||||
| (000s) | ||||||
| Australia – 10.4% | ||||||
| ABC Learning Centres Ltd. | 1,308,951 | $ | 6,362 | |||
| Adelaide Bank Ltd. | 102,800 | 957 | ||||
| Austar United Communications Ltd. (a) | 913,300 | 816 | ||||
| Austbrokers Holdings Ltd. | 455,000 | 680 | ||||
| Australian Agricultural Co. Ltd. | 877,210 | 1,194 | ||||
| Australian Stock Exchange Ltd. | 604,239 | 12,999 | ||||
| Australian Worldwide Exploration Ltd. (a)(d) | 998,700 | 1,523 | ||||
| Billabong International Ltd. | 546,600 | 5,289 | ||||
| Bradken Ltd. | 2,426,442 | 6,804 | ||||
| Caltex Australia Ltd. | 397,800 | 6,044 | ||||
| Centamin Egypt Ltd. (a) | 7,820,178 | 2,319 | ||||
| Challenger Financial Services Group Ltd. | 849,959 | 2,313 | ||||
| Coates Hire Ltd. | 392,300 | 1,361 | ||||
| Cochlear Ltd. | 179,000 | 5,084 | ||||
| Computershare Ltd. | 1,370,972 | 6,715 | ||||
| ConnectEast Group unit | 3,264,583 | 1,770 | ||||
| CSL Ltd. | 66,200 | 1,856 | ||||
| CSR Ltd. | 3,282,600 | 7,167 | ||||
| Dominos Pizza Australia New Zealand Ltd. | 1,839,000 | 4,057 | ||||
| Downer EDI Ltd. | 1,777,883 | 8,083 | ||||
| Dwyka Diamonds Ltd. (a) | 7,024,086 | 3,793 | ||||
| Elixir Petroleum Ltd. (a) | 3,666,540 | 1,639 | ||||
| Elkedra Diamonds NL (a) | 3,000,000 | 983 | ||||
| Elkedra Diamonds NL warrants 8/31/07 (a) | 3,000,000 | 352 | ||||
| Energy Developments Ltd. | 452,327 | 1,539 | ||||
| Energy Resources of Australia Ltd. | 144,800 | 1,429 | ||||
| Fox Resources Ltd. (a)(e) | 4,514,836 | 844 | ||||
| Fox Resources Ltd. warrants 6/30/07 (a) | 342,636 | 6 | ||||
| Hardman Resources Ltd.: | ||||||
| (Australia) (a) | 2,002,781 | 3,025 | ||||
| (United Kingdom) (a) | 480,653 | 721 | ||||
| Healthscope Ltd. | 294,400 | 1,255 | ||||
| Iluka Resources Ltd. | 840,900 | 4,867 | ||||
| International Ferro Metals (e) | 26,337,500 | 15,854 | ||||
| Jubilee Mines NL | 252,600 | 1,224 | ||||
| Macquarie Airports unit | 922,500 | 2,069 | ||||
| Macquarie Bank Ltd. | 34,700 | 1,678 | ||||
| Macquarie Communications Infrastructure Group unit | 1,331,700 | 5,726 | ||||
| Macquarie Infrastructure Group unit | 1,404,600 | 3,602 | ||||
| Mayne Group Ltd. | 84,600 | 330 | ||||
| Mineral Deposits Ltd. (a) | 4,920,000 | 3,403 | ||||
| Mortgage Choice Ltd. | 3,927,808 | 4,464 | ||||
See accompanying notes which are an integral part of the financial statements.
11 Annual Report
| Investments continued | ||||||
| Common Stocks continued | ||||||
| Shares | Value (Note 1) | |||||
| (000s) | ||||||
| Australia – continued | ||||||
| Novera Energy Ltd. (a) | 856,600 | $ | 993 | |||
| Oxiana Ltd. (a) | 3,612,500 | 3,620 | ||||
| Paladin Resources Ltd. (a) | 4,294,500 | 6,358 | ||||
| Perpetual Trustees Australia Ltd. | 21,200 | 994 | ||||
| Primary Health Care Ltd. | 104,800 | 823 | ||||
| Publishing & Broadcasting Ltd. | 277,900 | 3,350 | ||||
| QBE Insurance Group Ltd. | 424,723 | 5,653 | ||||
| Rinker Group Ltd. | 248,000 | 2,793 | ||||
| Roc Oil Co. Ltd. (a) | 6,508,592 | 11,754 | ||||
| Seek Ltd. | 2,933,202 | 6,229 | ||||
| Select Managed Funds Ltd. | 84,200 | 315 | ||||
| SFE Corp. Ltd. | 336,800 | 3,135 | ||||
| Sigma Co. Ltd. | 490,500 | 4,390 | ||||
| Sphere Investments Ltd. (a)(e) | 5,250,000 | 2,552 | ||||
| Stockland New (a) | 408 | 2 | ||||
| Sylvania Resources Ltd. (a)(e) | 6,480,000 | 2,738 | ||||
| Tap Oil Nl (a) | 391,700 | 712 | ||||
| Transfield Services Ltd. | 133,800 | 743 | ||||
| Transurban Group unit | 115,600 | 553 | ||||
| UNiTAB Ltd. | 292,600 | 2,779 | ||||
| United Group Ltd. | 959,121 | 7,530 | ||||
| Virotec International Ltd.: | ||||||
| (Australia) (a) | 1,852,832 | 1,039 | ||||
| (United Kingdom) (a) | 5,185,500 | 3,053 | ||||
| Vision Group Holdings Ltd. | 484,300 | 1,630 | ||||
| WorleyParsons Ltd. (d) | 936,800 | 6,865 | ||||
| Zinifex Ltd. | 2,191,500 | 7,964 | ||||
| TOTAL AUSTRALIA | 230,763 | |||||
| Austria – 0.3% | ||||||
| OMV AG | 112,300 | 6,058 | ||||
| Belgium – 0.6% | ||||||
| Euronav NV | 57,000 | 1,756 | ||||
| Melexis NV | 93,199 | 1,162 | ||||
| Omega Pharma SA | 84,500 | 4,366 | ||||
| Punch International NV (a) | 29,700 | 2,585 | ||||
| Recticel SA | 384,144 | 3,560 | ||||
| TOTAL BELGIUM | 13,429 | |||||
See accompanying notes which are an integral part of the financial statements.
| Annual Report |
| 12 |
| Common Stocks continued | ||||||
| Shares | Value (Note 1) | |||||
| (000s) | ||||||
| Bermuda – 1.2% | ||||||
| Aquarius Platinum Ltd.: | ||||||
| (Australia) | 184,902 | $ | 1,383 | |||
| (United Kingdom) | 694,305 | 5,224 | ||||
| China Lotsynergy Holding Ltd. (a) | 7,190,000 | 2,365 | ||||
| Jinhui Shipping & Transportation Ltd. (d) | 164,000 | 575 | ||||
| Petra Diamonds Ltd. (a) | 2,123,906 | 2,331 | ||||
| Ports Design Ltd. | 2,983,000 | 2,790 | ||||
| RC Group (Holdings) Ltd. (f) | 2,493,279 | 1,677 | ||||
| SeaDrill Ltd. (a)(g) | 375,000 | 2,306 | ||||
| Tanzanite One Ltd. | 2,221,701 | 4,936 | ||||
| Xceldiam Ltd. (f) | 3,318,255 | 2,643 | ||||
| Xceldiam Ltd. warrants 11/16/07 (a)(f) | 1,965,127 | 0 | ||||
| TOTAL BERMUDA | 26,230 | |||||
| Brazil – 0.2% | ||||||
| Petroleo Brasileiro SA Petrobras sponsored ADR (non-vtg.) | 86,900 | 5,553 | ||||
| British Virgin Islands – 0.3% | ||||||
| Albidon Ltd. unit (a) | 1,000,000 | 505 | ||||
| BDI Mining Corp. (a)(e) | 7,717,890 | 4,646 | ||||
| Titanium Resources Group Ltd. | 1,890,000 | 1,824 | ||||
| TOTAL BRITISH VIRGIN ISLANDS | 6,975 | |||||
| Canada 2.3% | ||||||
| Adastra Minerals, Inc. (a) | 893,900 | 934 | ||||
| Altius Minerals Corp. (a) | 400,000 | 1,399 | ||||
| Artumas Group, Inc. | 203,500 | 907 | ||||
| Azure Dynamics Corp. Class A (a) | 1,425,700 | 1,461 | ||||
| Bankers Petroleum Ltd. (a) | 3,467,000 | 3,523 | ||||
| Banro Corp. (a) | 393,900 | 2,835 | ||||
| Brazilian Diamonds Ltd. (a) | 1,300,000 | 325 | ||||
| First Quantum Minerals Ltd. | 163,200 | 3,828 | ||||
| Grove Energy Ltd. (a) | 3,049,240 | 1,417 | ||||
| La Mancha Resources, Inc. (a) | 561,000 | 656 | ||||
| Oilexco, Inc. (a) | 5,534,400 | 18,745 | ||||
| Starfield Resources, Inc. (a)(e) | 11,046,531 | 3,741 | ||||
| StrataGold Corp. (a) | 2,229,000 | 1,095 | ||||
| Uruguay Mineral Exploration, Inc. (a) | 245,200 | 851 | ||||
| Valkyries Petroleum Corp. (a) | 430,000 | 2,130 | ||||
| Visual Defence, Inc. | 3,180,000 | 1,379 | ||||
| Western Canadian Coal Corp. (a) | 1,378,718 | 4,786 | ||||
See accompanying notes which are an integral part of the financial statements.
13 Annual Report
| Investments continued | ||||||
| Common Stocks continued | ||||||
| Shares | Value (Note 1) | |||||
| (000s) | ||||||
| Canada – continued | ||||||
| Western Canadian Coal Corp.: | ||||||
| warrants 2/9/06 (a) | 84,359 | $ | 21 | |||
| (United Kingdom) (a) | 548,286 | 1,893 | ||||
| TOTAL CANADA | 51,926 | |||||
| Cayman Islands – 0.6% | ||||||
| AAC Acoustic Technology Holdings, Inc. | 4,450,000 | 2,239 | ||||
| Foxconn International Holdings Ltd. | 2,172,000 | 2,326 | ||||
| Hutchison Telecommunications International Ltd. | 174,000 | 220 | ||||
| Kingboard Chemical Holdings Ltd. | 2,812,180 | 5,949 | ||||
| Mosvold Drilling Ltd. (a) | 586,800 | 992 | ||||
| Sincere Watch (Hong Kong) Ltd. | 6,984,000 | 901 | ||||
| SinoCom Software Group Ltd. | 134,000 | 100 | ||||
| TOTAL CAYMAN ISLANDS | 12,727 | |||||
| China – 0.2% | ||||||
| Shanghai Electric (Group) Corp. (H Shares) | 6,592,000 | 2,083 | ||||
| Sina Corp. (a) | 32,400 | 821 | ||||
| Xinao Gas Holdings Ltd. | 2,674,000 | 2,035 | ||||
| TOTAL CHINA | 4,939 | |||||
| Czech Republic – 0.2% | ||||||
| Komercni Banka AS unit | 84,634 | 3,946 | ||||
| Denmark – 0.2% | ||||||
| Rockwool International AS Series A | 43,700 | 3,401 | ||||
| Estonia – 0.1% | ||||||
| Tallinna Vesi AS | 168,000 | 2,884 | ||||
| Finland – 1.7% | ||||||
| Aldata Solutions Oyj (a) | 2,065,976 | 4,507 | ||||
| Capman Oyj (B Shares) | 426,937 | 1,505 | ||||
| Inion OY | 1,957,900 | 3,466 | ||||
| Neste Oil Oyj | 649,600 | 20,130 | ||||
| Nokian Tyres Ltd. | 473,590 | 7,380 | ||||
| TOTAL FINLAND | 36,988 | |||||
| France – 1.3% | ||||||
| Altamir et Compagnie SA (a) | 6,100 | 1,082 | ||||
| Bourbon SA | 15,638 | 1,264 | ||||
| BVRP Software SA (a) | 144,796 | 3,388 | ||||
| Constructions Industrielles dela Mediterranee SA | 11,500 | 1,017 | ||||
| Damartex SA | 21,485 | 773 | ||||
See accompanying notes which are an integral part of the financial statements.
| Annual Report |
| 14 |
| Common Stocks continued | ||||||
| Shares | Value (Note 1) | |||||
| (000s) | ||||||
| France – continued | ||||||
| Groupe Open SA (d) | 52,500 | $ | 694 | |||
| Groupe Open SA warrants 10/21/06 (a) | 14,809 | 8 | ||||
| Guerbet SA | 8,400 | 1,133 | ||||
| Ipsos SA | 16,003 | 1,899 | ||||
| Lagardere S.C.A. (Reg.) | 21,700 | 1,492 | ||||
| Maisons France Confort | 31,494 | 1,582 | ||||
| Orpea (a) | 25,207 | 1,360 | ||||
| Sechilienne-Sidec | 6,446 | 2,836 | ||||
| Signaux Girod | 14,128 | 1,153 | ||||
| Silicon On Insulator Technologies SA (SOITEC) (a)(d) | 236,300 | 3,538 | ||||
| Sucriere de Pithivier Le Vieil | 5,000 | 3,452 | ||||
| Tessi SA | 24,066 | 1,202 | ||||
| The Lisi Group | 22,500 | 1,308 | ||||
| TOTAL FRANCE | 29,181 | |||||
| Germany – 3.0% | ||||||
| Advanced Photonics Technologies AG (a) | 48,552 | 91 | ||||
| Articon-Integralis AG (Reg.) (a) | 495,185 | 1,983 | ||||
| Deutz AG (a)(d) | 1,676,400 | 7,596 | ||||
| ElringKlinger AG | 18,284 | 677 | ||||
| Fresenius AG (d) | 25,586 | 3,300 | ||||
| Grenkeleasing AG | 25,918 | 1,352 | ||||
| Hawesko Holding AG | 21,800 | 915 | ||||
| K&S AG | 439,200 | 28,815 | ||||
| Kontron AG (a) | 154,264 | 1,128 | ||||
| Merck KGaA | 48,441 | 4,007 | ||||
| Parsytec AG (a) | 188,871 | 498 | ||||
| Pfleiderer AG (a) | 114,359 | 2,084 | ||||
| PSI AG (a)(e) | 689,200 | 3,396 | ||||
| Pulsion Medical Systems AG (a) | 98,511 | 543 | ||||
| SGL Carbon AG (a) | 250,100 | 3,661 | ||||
| Suedzucker AG (Bearer) (d) | 243,275 | 5,124 | ||||
| United Internet AG | 40,352 | 1,304 | ||||
| TOTAL GERMANY | 66,474 | |||||
| Gibraltar 0.2% | ||||||
| PartyGaming PLC | 2,216,200 | 3,423 | ||||
| Greece – 1.3% | ||||||
| Alfa-Beta Vassilopoulos SA (Reg.) (a) | 108,600 | 1,432 | ||||
| Autohellas SA | 238,800 | 945 | ||||
| Fourlis Holdings SA | 252,000 | 2,229 | ||||
| Greek Organization of Football Prognostics SA | 76,842 | 2,218 | ||||
See accompanying notes which are an integral part of the financial statements.
15 Annual Report
| Investments continued | ||||||
| Common Stocks continued | ||||||
| Shares | Value (Note 1) | |||||
| (000s) | ||||||
| Greece – continued | ||||||
| Hyatt Regency SA (Reg.) | 309,882 | $ | 3,796 | |||
| Intralot SA | 110,700 | 1,651 | ||||
| Motor Oil (HELLAS) Corinth Refineries SA | 155,420 | 3,354 | ||||
| Sarantis SA (Reg.) | 1,633,418 | 12,101 | ||||
| TOTAL GREECE | 27,726 | |||||
| Hong Kong – 0.8% | ||||||
| Cafe de Coral Holdings Ltd. | 538,000 | 607 | ||||
| Chen Hsong Holdings Ltd. | 1,060,000 | 475 | ||||
| Convenience Retail Asia Ltd. | 432,000 | 143 | ||||
| Fong’s Industries Co. Ltd. | 500,000 | 339 | ||||
| Hong Kong & Shanghai Hotels Ltd. | 2,229,500 | 2,229 | ||||
| Hong Kong Aircraft & Engineering Co. | 152,400 | 1,108 | ||||
| Integrated Distribution Services Group Ltd. (IDS) | 2,488,000 | 2,439 | ||||
| JCG Holdings Ltd. | 880,000 | 874 | ||||
| Linmark Group Ltd. | 2,218,000 | 672 | ||||
| Lung Kee (Bermuda) Holdings | 978,000 | 732 | ||||
| Midland Holdings Ltd. | 1,794,000 | 868 | ||||
| Shanghai Industrial Holdings Ltd. Class H | 339,000 | 603 | ||||
| Shun Tak Holdings Ltd. | 1,376,000 | 994 | ||||
| Solomon Systech Ltd. | 7,070,000 | 2,599 | ||||
| Tingyi (Cayman Island) Holding Corp. | 100,000 | 34 | ||||
| Tom.com Ltd. (a) | 4,332,000 | 771 | ||||
| Vtech Holdings Ltd. | 455,000 | 1,937 | ||||
| TOTAL HONG KONG | 17,424 | |||||
| Hungary – 0.4% | ||||||
| MOL Magyar Olay es Gazipari RT Series A (For. Reg.) | 44,200 | 4,061 | ||||
| OTP Bank Rt. | 127,473 | 4,557 | ||||
| TOTAL HUNGARY | 8,618 | |||||
| India – 0.7% | ||||||
| Balkrishna Industries Ltd. | 37,161 | 854 | ||||
| Bharti Televentures Ltd. (a) | 445,504 | 3,201 | ||||
| Cipla Ltd. | 8,214 | 66 | ||||
| Financial Technology (India) Ltd. | 86,718 | 1,885 | ||||
| State Bank of India | 355,858 | 7,379 | ||||
| Suzlon Energy Ltd. (a) | 181,848 | 2,883 | ||||
| TOTAL INDIA | 16,268 | |||||
| Ireland – 0.9% | ||||||
| Adwalker PLC (a)(e) | 9,125,000 | 1,292 | ||||
See accompanying notes which are an integral part of the financial statements.
| Annual Report |
| 16 |
| Common Stocks continued | ||||||
| Shares | Value (Note 1) | |||||
| (000s) | ||||||
| Ireland – continued | ||||||
| Aminex PLC (a) | 3,160,919 | $ | 1,259 | |||
| IAWS Group PLC (Ireland) | 38,059 | 525 | ||||
| Kenmare Resources PLC (a) | 4,741,500 | 3,001 | ||||
| Kenmare Resources PLC warrants 7/23/09 (a) | 1,712,500 | 637 | ||||
| Minco PLC (a) | 1,818,181 | 531 | ||||
| Minco PLC warrants 12/3/05 (a) | 909,090 | 64 | ||||
| Paddy Power PLC (Ireland) | 241,011 | 4,074 | ||||
| Petroceltic International PLC (a) | 12,421,734 | 2,529 | ||||
| Providence Resources PLC (a) | 28,529,700 | 1,300 | ||||
| Trinity Biotech PLC sponsored ADR (a)(d) | 227,325 | 1,523 | ||||
| Vimio PLC | 944,000 | 2,657 | ||||
| TOTAL IRELAND | 19,392 | |||||
| Israel – 0.4% | ||||||
| Advanced Vision Technology Ltd. (a) | 165,400 | 1,884 | ||||
| Leadcom Integrated Solutions (e) | 5,160,100 | 4,705 | ||||
| Metal-Tech Ltd. | 830,000 | 2,645 | ||||
| TOTAL ISRAEL | 9,234 | |||||
| Italy 2.0% | ||||||
| Amplifon Spa | 38,350 | 2,494 | ||||
| Banca Italease Spa | 1,051,300 | 22,242 | ||||
| Bastogi Spa (a)(d) | 3,714,300 | 1,205 | ||||
| Brembo Spa | 218,769 | 1,520 | ||||
| Cassa Di Risparmio Di Firenze | 2,942,982 | 8,777 | ||||
| Lottomatica Spa New | 112,000 | 4,068 | ||||
| Saipem Spa | 79,800 | 1,141 | ||||
| Teleunit Spa (a)(e) | 9,675,858 | 3,683 | ||||
| TOTAL ITALY | 45,130 | |||||
| Japan 32.9% | ||||||
| Able, Inc. (d) | 30,500 | 1,094 | ||||
| Adtec Plasma Technology Co. Ltd. | 10 | 43 | ||||
| Advance Create Co. Ltd. | 833 | 1,984 | ||||
| Advanced Media, Inc. Japan | 314 | 2,129 | ||||
| Aeon Fantasy Co. Ltd. | 70,600 | 1,755 | ||||
| Aichi Steel Corp. (d) | 2,156,000 | 15,180 | ||||
| Ain Pharmaciez, Inc. | 68,800 | 1,451 | ||||
| All About, Inc. | 77 | 536 | ||||
| Ariake Japan Co. Ltd. (d) | 180,300 | 4,075 | ||||
| ARRK Corp. | 46,700 | 2,592 | ||||
| Asahi Denka Co. Ltd. (d) | 233,000 | 2,892 | ||||
See accompanying notes which are an integral part of the financial statements.
17 Annual Report
| Investments continued | ||||||
| Common Stocks continued | ||||||
| Shares | Value (Note 1) | |||||
| (000s) | ||||||
| Japan – continued | ||||||
| ASICS Trading Co. Ltd. | 54,900 | $ | 755 | |||
| Asset Managers Co. Ltd. (d) | 633 | 3,059 | ||||
| Axell Corp. (d) | 660 | 2,481 | ||||
| Bando Chemical Industries Ltd. | 249,000 | 1,095 | ||||
| Central Glass Co. Ltd. | 267,000 | 1,494 | ||||
| Chiyoda Corp. | 96,000 | 1,659 | ||||
| Chugoku Marine Paints Ltd. | 432,000 | 2,159 | ||||
| CMIC Co. Ltd. (d) | 1,950 | 697 | ||||
| COMSYS Holdings Corp. | 188,000 | 2,125 | ||||
| Create Restaurants, Inc. | 110,200 | 5,583 | ||||
| Create SD Co. Ltd. | 44,700 | 1,618 | ||||
| Credit Saison Co. Ltd. | 15,600 | 709 | ||||
| Cyber Agent Ltd. New | 566 | 1,020 | ||||
| cyber communications, Inc. (a)(d) | 870 | 2,215 | ||||
| Cyber Firm, Inc. (a) | 315 | 1,009 | ||||
| Daifuku Co. Ltd. | 316,000 | 4,168 | ||||
| Daihatsu Diesel Manufacturing Co. Ltd. | 370,000 | 1,698 | ||||
| Daiwabo Information System Ltd. (d) | 450,000 | 7,506 | ||||
| DC Co. Ltd. | 206,000 | 787 | ||||
| Dip Corp. (a)(d) | 133 | 207 | ||||
| Doshisha Co. Ltd. | 79,650 | 1,414 | ||||
| E*TRADE Securities Co. Ltd. (d) | 488 | 2,565 | ||||
| Enshu Ltd. (a)(d) | 1,118,000 | 3,670 | ||||
| EPS Co. Ltd. (d) | 604 | 1,794 | ||||
| Excite Japan Co. Ltd | 277 | 1,684 | ||||
| Faith, Inc. (d) | 330 | 151 | ||||
| Faith, Inc. New (a) | 1,320 | 602 | ||||
| FCC Co. Ltd. (d) | 58,000 | 2,391 | ||||
| Finance All Corp. (d) | 2,636 | 2,488 | ||||
| FinTech Global, Inc. (d) | 49 | 188 | ||||
| FinTech Global, Inc. New | 98 | 377 | ||||
| Forval Corp. | 79,300 | 846 | ||||
| FT Communications Co. Ltd. (d) | 689 | 1,790 | ||||
| Fuji Seal International, Inc. | 60 | 2 | ||||
| Fujikura Ltd. | 1,304,000 | 8,447 | ||||
| Furukawa Co. Ltd. (a)(d) | 3,058,000 | 6,621 | ||||
| Gourmet Navigator, Inc. (d) | 395 | 1,115 | ||||
| Hamamatsu Photonics KK (d) | 158,000 | 3,674 | ||||
| Haseko Corp. (a) | 330,500 | 1,145 | ||||
| Hikari Tsushin, Inc. | 508,000 | 32,687 | ||||
| Hiroshima Bank Ltd. | 446,000 | 2,916 | ||||
| Hitachi Construction Machinery Co. Ltd. | 129,000 | 2,458 | ||||
See accompanying notes which are an integral part of the financial statements.
| Annual Report |
| 18 |
| Common Stocks continued | ||||||
| Shares | Value (Note 1) | |||||
| (000s) | ||||||
| Japan – continued | ||||||
| Hitachi Metals Ltd. | 761,000 | $ | 7,836 | |||
| Hogy Medical Co. | 29,000 | 1,590 | ||||
| Hokuto Corp. (d) | 276,800 | 4,492 | ||||
| I-CF, Inc. (a)(d) | 1,333 | 2,655 | ||||
| Ibiden Co. Ltd. | 467,600 | 18,952 | ||||
| Index Corp. New (d) | 11,216 | 12,627 | ||||
| Innotech Corp. Japan | 329,800 | 2,485 | ||||
| Intelligent Wave, Inc. (d) | 543 | 1,801 | ||||
| Iriso Electronics Co. Ltd. | 43,500 | 1,243 | ||||
| Ishihara Chemical Co. Ltd. | 49,000 | 883 | ||||
| Itochu Corp. | 668,000 | 4,582 | ||||
| Itochushokuhin Co. Ltd. | 1,500 | 51 | ||||
| J Bridge Corp. (a)(d) | 182,800 | 2,918 | ||||
| Japan Communications, Inc. (d) | 402 | 473 | ||||
| Japan Digital Contents Trust, Inc. (a)(d) | 214 | 239 | ||||
| Japan Digital Contents Trust, Inc. New (a) | 214 | 234 | ||||
| Jastec Co. Ltd. | 119,600 | 2,362 | ||||
| JFE Holdings, Inc. | 67,400 | 2,095 | ||||
| Juroku Bank Ltd. | 175,000 | 1,461 | ||||
| KAGA ELECTRONICS Co. Ltd. | 97,800 | 2,528 | ||||
| Kakaku.com, Inc. New (d) | 140 | 485 | ||||
| Kawasaki Heavy Industries Ltd. (d) | 999,000 | 2,613 | ||||
| Kenedix, Inc. | 3,176 | 13,037 | ||||
| Kibun Food Chemifa Co. Ltd. | 136,200 | 3,303 | ||||
| KK daVinci Advisors (a) | 617 | 2,912 | ||||
| Kobe Steel Ltd. | 1,718,000 | 5,073 | ||||
| Kura Corp. Ltd. (e) | 2,946 | 18,905 | ||||
| Kurita Water Industries Ltd. | 215,000 | 3,616 | ||||
| Link Theory Holdings Co. Ltd. | 284 | 1,355 | ||||
| livedoor Co. Ltd. (a)(d) | 1,599,232 | 5,886 | ||||
| Lopro Corp. (d) | 140,100 | 808 | ||||
| LTT Bio-Pharma Co. Ltd. | 112 | 225 | ||||
| Mars Engineering Corp. | 94,700 | 2,920 | ||||
| Maruei Department Store Co. Ltd. | 376,000 | 1,078 | ||||
| Meganesuper Co. Ltd. | 18,320 | 250 | ||||
| Misumi Group, Inc. | 60,800 | 2,396 | ||||
| Mitsubishi Materials Corp. | 957,000 | 3,299 | ||||
| Mitsui & Co. Ltd. | 296,000 | 3,648 | ||||
| Mitsui O.S.K. Lines Ltd. | 617,000 | 4,360 | ||||
| Mitsui Trust Holdings, Inc. | 381,000 | 4,600 | ||||
| Moshi Moshi Hotline, Inc. | 14,750 | 1,401 | ||||
| Nachi-Fujikoshi Corp. (d) | 1,689,000 | 7,738 | ||||
See accompanying notes which are an integral part of the financial statements.
19 Annual Report
| Investments continued | ||||||
| Common Stocks continued | ||||||
| Shares | Value (Note 1) | |||||
| (000s) | ||||||
| Japan – continued | ||||||
| NEOMAX Co. Ltd. | 176,000 | $ | 5,335 | |||
| Net One Systems Co. Ltd. | 3,971 | 7,634 | ||||
| NextCom KK (d) | 736 | 892 | ||||
| NextCom KK New | 2,208 | 2,639 | ||||
| NGK Insulators Ltd. | 207,000 | 2,476 | ||||
| NGK Spark Plug Co. Ltd. | 313,000 | 5,039 | ||||
| NHK Spring Co. Ltd. | 186,000 | 1,466 | ||||
| Nidec Corp. | 18,500 | 1,088 | ||||
| Nidec Corp. New | 18,500 | 1,088 | ||||
| Nidec Tosok Corp. (d) | 173,400 | 2,035 | ||||
| Nihon Ceratec Co. Ltd. (d) | 290 | 1,200 | ||||
| Nihon Chouzai Co. Ltd. | 38,900 | 1,199 | ||||
| Nihon Dempa Kogyo Co. Ltd. (d) | 476,700 | 13,789 | ||||
| Nihon Micro Coating Co. Ltd. (a) | 150,600 | 1,038 | ||||
| Nihon Trim Co. Ltd. (d) | 176,300 | 9,497 | ||||
| Nihon Unicom Corp. | 99,200 | 1,133 | ||||
| Nikko Cordial Corp. | 204,500 | 2,479 | ||||
| Nippon Denko Co. Ltd. (d) | 186,000 | 641 | ||||
| Nippon Denwa Shisetsu | 25,000 | 94 | ||||
| Nippon Electric Glass Co. Ltd. | 87,000 | 1,669 | ||||
| Nippon Mining Holdings, Inc. | 105,500 | 779 | ||||
| Nippon Oil Corp. | 465,000 | 3,959 | ||||
| Nippon Seiki Co. Ltd. (d) | 464,000 | 8,029 | ||||
| Nippon Suisan Kaisha Co. Ltd. (d) | 854,000 | 3,432 | ||||
| Nissei Corp. | 128,000 | 1,643 | ||||
| Nissin Co. Ltd. | 267,080 | 389 | ||||
| Nissin Co. Ltd. New | 267,080 | 384 | ||||
| Nissin Kogyo Co. Ltd. | 614,200 | 27,553 | ||||
| Nissin Servicer Co. Ltd. | 2,001 | 1,872 | ||||
| Nissin Servicer Co. Ltd. New | 2,001 | 1,872 | ||||
| Nitta Corp. | 102,000 | 1,381 | ||||
| NOK Corp. | 187,800 | 5,676 | ||||
| Ogaki Kyoritsu Bank Ltd. | 359,000 | 2,279 | ||||
| Ohara, Inc. (a) | 52,400 | 2,201 | ||||
| Orient Corp. (a) | 785,000 | 3,358 | ||||
| Otaki Gas Co. Ltd. | 16,000 | 80 | ||||
| Otsuka Corp. | 164,500 | 14,559 | ||||
| Pacific Metals Co. Ltd. (d) | 1,545,000 | 6,743 | ||||
| Parker Corp. | 49,000 | 505 | ||||
| Pigeon Corp. (d) | 253,900 | 3,344 | ||||
| Resona Holdings, Inc. (a) | 1,103 | 3,200 | ||||
| Rex Holdings Co. Ltd. (d) | 791 | 5,213 | ||||
See accompanying notes which are an integral part of the financial statements.
| Annual Report |
| 20 |
| Common Stocks continued | ||||||
| Shares | Value (Note 1) | |||||
| (000s) | ||||||
| Japan – continued | ||||||
| Rohto Pharmaceutical Co. Ltd. New | 134,000 | $ | 1,193 | |||
| Saint Marc Co. Ltd. (d) | 75,500 | 3,825 | ||||
| Sammy NetWorks Co. Ltd. (d) | 1,229 | 15,433 | ||||
| SBI Holdings, Inc. (d) | 11,860 | 5,926 | ||||
| Sega Sammy Holdings, Inc. | 7,400 | 267 | ||||
| Sega Sammy Holdings, Inc. New | 76,500 | 2,776 | ||||
| Seikagaku Corp. | 196,300 | 2,120 | ||||
| Sekisui Chemical Co. Ltd. | 172,000 | 1,092 | ||||
| Sekisui Plastics Co. Ltd. | 335,000 | 1,155 | ||||
| Shinohara Systems of Construction Co. Ltd. | 831 | 3,483 | ||||
| Showa Denko KK | 715,000 | 2,291 | ||||
| Showa Shell Sekiyu KK (d) | 595,200 | 7,423 | ||||
| Silex Technology, Inc. | 269 | 745 | ||||
| Simplex Investment Advisors, Inc. (d) | 60 | 488 | ||||
| Softbrain Co. Ltd. (d) | 449 | 817 | ||||
| Software Research Association (SRA) (d) | 28,700 | 483 | ||||
| Sumitomo Corp. | 1,185,000 | 13,238 | ||||
| Sumitomo Metal Mining Co. Ltd. | 1,604,000 | 14,641 | ||||
| Sumitomo Precision Products Co. Ltd. | 374,000 | 1,960 | ||||
| Sumitomo Rubber Industries Ltd. | 589,000 | 7,253 | ||||
| Sumitomo Titanium Corp. (d) | 10,600 | 1,230 | ||||
| Sumitomo Titanium Corp. New (d) | 20,600 | 2,319 | ||||
| Sun Frontier Fudousan Co. Ltd. | 1,278 | 6,132 | ||||
| Sunx Ltd. | 140,100 | 2,334 | ||||
| Taisei Corp. | 366,000 | 1,626 | ||||
| Taiyo Kagaku (d) | 85,500 | 1,111 | ||||
| Take & Give Needs Co. Ltd. (a) | 2,817 | 3,952 | ||||
| Tamron Co. Ltd. (d) | 84,000 | 1,157 | ||||
| Teijin Ltd | 842,000 | 5,031 | ||||
| Teikoku Oil Co. Ltd. | 420,000 | 4,048 | ||||
| Telewave, Inc. (d) | 652 | 3,811 | ||||
| The First Energy Service Co. Ltd. (d) | 39 | 136 | ||||
| The First Energy Service Co. Ltd. New (d) | 156 | 544 | ||||
| The Keiyo Bank Ltd. | 185,000 | 1,392 | ||||
| Toc Co. Ltd. | 104,000 | 603 | ||||
| Token Corp. | 82,100 | 3,896 | ||||
| Tokuyama Corp. | 644,000 | 6,414 | ||||
| Tokyo Seimitsu Co. Ltd. (d) | 67,100 | 3,086 | ||||
| TonenGeneral Sekiyu KK | 134,000 | 1,502 | ||||
| Toray Industries, Inc. | 2,627,000 | 14,651 | ||||
| Tosoh Corp. | 982,000 | 4,363 | ||||
| Toyo Ink Manufacturing Co. Ltd. (d) | 1,994,000 | 8,582 | ||||
See accompanying notes which are an integral part of the financial statements.
21 Annual Report
| Investments continued | ||||||
| Common Stocks continued | ||||||
| Shares | Value (Note 1) | |||||
| (000s) | ||||||
| Japan – continued | ||||||
| Toyo Suisan Kaisha Ltd. | 60,000 | $ | 1,044 | |||
| Trancom Co. Ltd. | 101,700 | 2,127 | ||||
| Trans Cosmos, Inc. (d) | 78,600�� | 3,989 | ||||
| Trend Micro, Inc. | 39,500 | 1,235 | ||||
| Turbolinux, Inc. | 170 | 467 | ||||
| Tyo Productions, Inc. | 128,000 | 593 | ||||
| Usen Corp. | 718,550 | 16,521 | ||||
| Warabeya Nichiyo Co. Ltd. (d) | 140,700 | 2,028 | ||||
| Works Applications Co. Ltd. (a)(d) | 7,314 | 6,777 | ||||
| Yachiyo Industry Co. Ltd. | 121,000 | 2,022 | ||||
| Yahagi Construction Co. Ltd. | 299,000 | 1,489 | ||||
| Yamada Denki Co. Ltd. | 331,500 | 29,196 | ||||
| Yamaichi Electronics Co. Ltd. | 105,900 | 1,316 | ||||
| Yaskawa Electric Corp. (a)(d) | 930,000 | 7,273 | ||||
| Yasuragi Co. Ltd. (a) | 115,900 | 3,914 | ||||
| Yorozu Corp. | 138,300 | 1,304 | ||||
| Yoshimoto Kogyo Co. Ltd. (d) | 102,000 | 1,806 | ||||
| Zensho Co. Ltd. (d) | 83,900 | 1,415 | ||||
| Zensho Co. Ltd. New (a)(d) | 83,900 | 1,415 | ||||
| TOTAL JAPAN | 727,557 | |||||
| Korea (South) 0.4% | ||||||
| Doosan Heavy Industries & Construction Co. Ltd. | 154,920 | 3,354 | ||||
| Hyundai Engineering & Construction Co. Ltd. (a) | 24,740 | 769 | ||||
| LG Household & Health Care Ltd. | 30,080 | 1,642 | ||||
| NHN Corp. (a) | 24,661 | 4,098 | ||||
| TOTAL KOREA (SOUTH) | 9,863 | |||||
| Luxembourg 1.0% | ||||||
| Stolt-Nielsen SA | 653,190 | 22,991 | ||||
| Netherlands – 0.2% | ||||||
| Axalto Holding NV (a) | 82,100 | 2,235 | ||||
| Bateman Engineering NV | 480,200 | 2,011 | ||||
| TOTAL NETHERLANDS | 4,246 | |||||
| New Zealand – 0.8% | ||||||
| Auckland International Airport Ltd. | 3,469,725 | 4,759 | ||||
| Fisher & Paykel Healthcare Corp. | 2,225,596 | 5,404 | ||||
| Fletcher Building Ltd. | 464,190 | 2,550 | ||||
| Sky City Entertainment Group Ltd. | 1,663,489 | 5,285 | ||||
| TOTAL NEW ZEALAND | 17,998 | |||||
See accompanying notes which are an integral part of the financial statements.
| Annual Report |
| 22 |
| Common Stocks continued | ||||||
| Shares | Value (Note 1) | |||||
| (000s) | ||||||
| Norway 2.1% | ||||||
| ABG Sundal Collier ASA | 1,168,000 | $ | 1,382 | |||
| Aker Kvaerner ASA (a) | 32,000 | 1,662 | ||||
| Camillo Eitzen & Co. ASA | 605,200 | 6,046 | ||||
| Deep Ocean ASA (a) | 421,247 | 1,036 | ||||
| Mamut ASA (a) | 733,600 | 1,353 | ||||
| Odfjell ASA (A Shares) | 85,700 | 1,643 | ||||
| P4 Radio Hele Norge ASA | 141,400 | 565 | ||||
| Pertra Midt-Norges AS (g) | 60,000 | 922 | ||||
| Petroleum Geo-Services ASA (a) | 116,250 | 2,948 | ||||
| Profdoc ASA (a) | 113,200 | 1,583 | ||||
| Schibsted ASA (B Shares) | 54,100 | 1,559 | ||||
| Solstad Offshore ASA | 114,000 | 1,577 | ||||
| Songa Offshore ASA (a) | 985,408 | 4,317 | ||||
| Songa Offshore ASA warrants 5/20/08 (a)(g) | 177,778 | 519 | ||||
| Statoil ASA | 222,900 | 4,985 | ||||
| Stepstone ASA (a)(e) | 4,710,000 | 5,719 | ||||
| TANDBERG ASA | 334,300 | 3,289 | ||||
| TANDBERG Television ASA (a) | 395,400 | 4,923 | ||||
| TOTAL NORWAY | 46,028 | |||||
| Papua New Guinea – 0.1% | ||||||
| Oil Search Ltd. | 517,100 | 1,276 | ||||
| Poland – 1.2% | ||||||
| Pfleiderer Grajewo SA | 440,800 | 3,680 | ||||
| Polski Koncern Naftowy Orlen SA unit | 526,600 | 18,894 | ||||
| Powszechna Kasa Oszczednosci Bank SA | 103,000 | 866 | ||||
| TVN SA | 149,254 | 2,546 | ||||
| TOTAL POLAND | 25,986 | |||||
| Portugal 0.2% | ||||||
| Impresa SGPS (a) | 984,753 | 5,489 | ||||
| Russia – 1.5% | ||||||
| Mobile TeleSystems OJSC: | ||||||
| GDR (Reg. S) | 74,000 | 2,738 | ||||
| sponsored ADR | 81,300 | 3,007 | ||||
| Sibirtelecom Open Joint Stock Co. sponsored ADR (a) | 104,700 | 5,209 | ||||
| Sistema JSFC sponsored GDR | 314,200 | 7,038 | ||||
| Uralsvyazinform sponsored ADR | 614,100 | 4,286 | ||||
| Vimpel Communications sponsored ADR (a) | 68,100 | 2,724 | ||||
| VolgaTelecom sponsored ADR | 1,000,400 | 7,303 | ||||
| TOTAL RUSSIA | 32,305 | |||||
| See accompanying notes which are an integral part of the financial statements. | ||||||
| 23 | Annual Report | |||||
| Investments continued | ||||||
| Common Stocks continued | ||||||
| Shares | Value (Note 1) | |||||
| (000s) | ||||||
| Singapore – 2.5% | ||||||
| Cosco Investment (Singapore) Ltd. | 2,638,000 | $ | 3,426 | |||
| CSE Global Ltd. | 996,000 | 426 | ||||
| GES International Ltd. | 4,344,000 | 2,385 | ||||
| Guocoland Ltd. | 446,000 | 411 | ||||
| Hong Leong Finance Ltd. | 310,000 | 652 | ||||
| HTL International Holdings Ltd. | 1,422,500 | 1,058 | ||||
| Jurong Technologies Industrial Corp. Ltd. | 1,686,000 | 1,941 | ||||
| Keppel Land Ltd. | 930,000 | 2,097 | ||||
| Olam International Ltd. | 2,539,000 | 1,919 | ||||
| Osim International Ltd. | 800,000 | 732 | ||||
| Parkway Holdings Ltd. | 4,538,000 | 5,305 | ||||
| SembCorp Industries Ltd. | 3,425,000 | 5,439 | ||||
| SembCorp Logistics Ltd. | 596,000 | 602 | ||||
| Sembcorp Marine Ltd. | 2,860,000 | 4,626 | ||||
| SIA Engineering Co. Ltd. | 2,847,000 | 4,185 | ||||
| Singapore Exchange Ltd. | 4,407,000 | 7,025 | ||||
| Singapore Petroleum Co. Ltd. | 1,501,000 | 4,271 | ||||
| Singapore Post Ltd. | 10,718,000 | 7,213 | ||||
| United Overseas Land Ltd. | 803,000 | 1,109 | ||||
| TOTAL SINGAPORE | 54,822 | |||||
| South Africa 3.7% | ||||||
| Aflease Gold & Uranium Resources Ltd. (a) | 2,643,000 | 1,910 | ||||
| African Bank Investments Ltd. | 3,710,751 | 11,066 | ||||
| Discovery Holdings Ltd. (a) | 2,751,919 | 9,002 | ||||
| FirstRand Ltd. | 952,000 | 2,240 | ||||
| Foschini Ltd. | 488,000 | 3,109 | ||||
| Gold Reef Casino Resorts Ltd. | 697,000 | 1,433 | ||||
| JD Group Ltd. | 188,100 | 2,011 | ||||
| MTN Group Ltd. | 1,176,702 | 8,768 | ||||
| Nedbank Group Ltd | 154,000 | 1,962 | ||||
| Steinhoff International Holdings Ltd. | 12,684,632 | 33,194 | ||||
| VenFin Ltd. | 904,500 | 4,920 | ||||
| Wilson Bayly Holmes Ovcon Ltd. | 446,856 | 2,684 | ||||
| TOTAL SOUTH AFRICA | 82,299 | |||||
| Spain – 0.3% | ||||||
| Antena 3 Television SA | 274,232 | 5,332 | ||||
| Construcciones y Auxiliar de Ferrocarriles | 9,500 | 991 | ||||
| TOTAL SPAIN | 6,323 | |||||
See accompanying notes which are an integral part of the financial statements.
| Annual Report |
| 24 |
| Common Stocks continued | ||||||
| Shares | Value (Note 1) | |||||
| (000s) | ||||||
| Sweden – 1.9% | ||||||
| Consafe Offshore AB (A Shares) (a) | 1,103,172 | $ | 14,921 | |||
| Eniro AB (d) | 153,028 | 1,672 | ||||
| Gambro AB (A Shares) | 405,000 | 5,723 | ||||
| Hexagon AB (B Shares) (d) | 213,129 | 5,019 | ||||
| Intrum Justitia AB (a) | 375,200 | 3,205 | ||||
| Modern Times Group AB (MTG) (B Shares) (a) | 210,550 | 8,053 | ||||
| Observer AB | 1,180,035 | 3,987 | ||||
| VBG AB (B Shares) | 6,710 | 198 | ||||
| TOTAL SWEDEN | 42,778 | |||||
| Switzerland – 0.8% | ||||||
| Actelion Ltd. (Reg.) (a) | 18,108 | 2,037 | ||||
| Amazys Holding AG | 54,100 | 3,273 | ||||
| Barry Callebaut AG | 2,861 | 802 | ||||
| Bucher Holding AG | 31,439 | 2,512 | ||||
| Escor Casino & Entertainment SA | 19,770 | 395 | ||||
| Mobilezone Holding AG (a) | 462,199 | 1,757 | ||||
| Pargesa Holding SA | 14,130 | 1,091 | ||||
| Roche Holding AG (participation certificate) | 23,767 | 3,551 | ||||
| Sulzer AG (Reg.) | 2,648 | 1,274 | ||||
| Swissquote Group Holding SA (a) | 18,811 | 1,878 | ||||
| TOTAL SWITZERLAND | 18,570 | |||||
| Thailand – 0.1% | ||||||
| Bumrungrad Hospital PCL (For. Reg.) | 2,330,500 | 1,529 | ||||
| Turkey 1.4% | ||||||
| Atakule Gayrimenkul Yatirim Ortakligi AS | 1,033,000 | 871 | ||||
| Dogan Gazetecilik AS (a) | 3,601,955 | 7,622 | ||||
| Efes Sinai Yatirim Holding AS Class B (a) | 871,100 | 8,766 | ||||
| Enka Insaat ve Sanayi AS | 360,950 | 3,979 | ||||
| Tupras Turkiye Petrol Rafinerileri AS | 525,600 | 8,984 | ||||
| TOTAL TURKEY | 30,222 | |||||
| United Arab Emirates – 0.0% | ||||||
| Investcom LLC GDR | 45,600 | 616 | ||||
| United Kingdom – 15.3% | ||||||
| Abcam PLC | 417,239 | 1,234 | ||||
| Accuma Group PLC | 418,063 | 1,303 | ||||
| Advanced Technology (UK) PLC (a)(e) | 7,355,000 | 0 | ||||
| AeroBox PLC (a) | 5,694,657 | 706 | ||||
| Afren PLC (e) | 13,078,000 | 12,040 | ||||
See accompanying notes which are an integral part of the financial statements.
25 Annual Report
| Investments continued | ||||||
| Common Stocks continued | ||||||
| Shares | Value (Note 1) | |||||
| (000s) | ||||||
| United Kingdom – continued | ||||||
| African Copper PLC | 1,742,884 | $ | 1,450 | |||
| Air Partner PLC | 45,000 | 480 | ||||
| Alba PLC | 749,800 | 4,912 | ||||
| Alliance Pharma PLC (a)(e) | 9,049,400 | 2,924 | ||||
| Alterian PLC (a) | 1,486,000 | 3,026 | ||||
| Amlin PLC | 157,014 | 616 | ||||
| Andor Technology Ltd. | 444,444 | 803 | ||||
| Anglo Asian Mining PLC | 2,605,500 | 3,414 | ||||
| Appian Technology PLC (a) | 1,916,178 | 153 | ||||
| Appian Technology PLC warrants 2/28/08 (a)(g) | 479,045 | 0 | ||||
| Ascent Resources PLC (a)(e) | 12,000,000 | 2,603 | ||||
| Ascent Resources PLC warrants 6/2/07 (a) | 6,000,000 | 770 | ||||
| Asia Energy PLC (a) | 1,390,951 | 12,375 | ||||
| Atrium Underwriting PLC | 257,060 | 917 | ||||
| BG Group PLC | 441,600 | 3,878 | ||||
| Bioprogress PLC (a) | 4,376,349 | 2,479 | ||||
| Block Shield Corp. PLC (a) | 900,000 | 1,984 | ||||
| Body Shop International PLC | 800,000 | 2,974 | ||||
| BowLeven PLC | 1,407,600 | 9,158 | ||||
| British Energy Group PLC (a) | 274,800 | 2,160 | ||||
| Burren Energy PLC | 64,302 | 911 | ||||
| Caffe Nero Group PLC (a) | 282,978 | 1,250 | ||||
| Cambrian Mining PLC (a)(e) | 6,039,800 | 15,024 | ||||
| Cambrian Mining PLC warrants 1/25/06 (a) | 350,000 | 0 | ||||
| Cardpoint PLC (a) | 345,300 | 688 | ||||
| Central African Mining & Exploration Co. PLC (a) | 16,622,700 | 3,237 | ||||
| Centurion Electronics PLC (e) | 1,751,839 | 574 | ||||
| Ceres Power Holding PLC | 776,700 | 1,856 | ||||
| Chaco Resources PLC (f) | 9,500,000 | 1,009 | ||||
| Chaucer Holdings PLC | 5,079,800 | 4,789 | ||||
| Clapham House Group PLC (a) | 725,650 | 1,856 | ||||
| Cobra Biomanufacturing PLC (a) | 701,900 | 587 | ||||
| Coffeeheaven International PLC (a)(f) | 8,115,909 | 1,580 | ||||
| Corac Group PLC (a)(e) | 4,849,104 | 2,146 | ||||
| Corin Group PLC | 1,210,314 | 7,119 | ||||
| CSS Stellar PLC (a) | 598,908 | 414 | ||||
| CustomVis PLC (a) | 1,558,936 | 155 | ||||
| DA Group PLC (a)(e) | 1,875,165 | 2,490 | ||||
| Daniel Stewart Securities PLC (a) | 3,029,000 | 831 | ||||
| Dat Group PLC (e) | 1,806,000 | 1,263 | ||||
| Domino’s Pizza UK & IRL PLC | 383,626 | 2,004 | ||||
| Dream Direct Group PLC (a) | 145,000 | 245 | ||||
See accompanying notes which are an integral part of the financial statements.
| Annual Report |
| 26 |
| Common Stocks continued | ||||||
| Shares | Value (Note 1) | |||||
| (000s) | ||||||
| United Kingdom – continued | ||||||
| Eclipse Energy Co. Ltd. (g) | 102,000 | $ | 1,354 | |||
| Eureka Mining PLC (a) | 381,700 | 730 | ||||
| Europa Oil & Gas Holdings PLC | 1,000,000 | 549 | ||||
| Europa Oil & Gas Holdings PLC warrants 11/11/07 (a) | 500,000 | 86 | ||||
| European Diamonds PLC (a) | 499,300 | 194 | ||||
| Faroe Petroleum PLC (a) | 1,288,906 | 2,852 | ||||
| Firestone Diamonds PLC (a) | 687,000 | 1,745 | ||||
| Flomerics Group PLC | 449,658 | 637 | ||||
| Forum Energy PLC | 1,127,270 | 2,505 | ||||
| Freeport PLC | 256,276 | 1,894 | ||||
| Future PLC | 1,717,169 | 1,718 | ||||
| Gaming Corp. PLC (a) | 9,702,913 | 2,018 | ||||
| GMA Resources PLC (a)(e) | 12,545,265 | 1,527 | ||||
| GMA Resources PLC (a)(e)(f) | 12,100,818 | 1,499 | ||||
| Goals Soccer Centres PLC | 827,000 | 2,116 | ||||
| Golden Prospect PLC | 2,246,871 | 1,790 | ||||
| Goldshield Group PLC | 416,400 | 2,643 | ||||
| GTL Resources PLC (a) | 13,669,072 | 381 | ||||
| Gyrus Group PLC (a) | 434,400 | 2,457 | ||||
| Hardide Ltd. (e) | 12,401,000 | 2,909 | ||||
| Healthcare Enterprise Group PLC (a)(e) | 9,818,379 | 10,604 | ||||
| Highbury House Communications PLC (a) | 713,914 | 22 | ||||
| Hydrodec Group PLC (a) | 6,231,100 | 2,730 | ||||
| ID Data PLC (a)(e) | 84,350,500 | 1,344 | ||||
| Ideal Shopping Direct PLC | 235,339 | 1,419 | ||||
| Imperial College Innovations Ltd. (g) | 19,300 | 2,734 | ||||
| Inchcape PLC | 30,122 | 1,099 | ||||
| Intertek Group PLC | 116,310 | 1,467 | ||||
| IPSA Group PLC (e) | 4,074,075 | 2,128 | ||||
| ITE Group PLC | 4,436,717 | 8,876 | ||||
| ITM Power PLC (a) | 4,339,800 | 8,452 | ||||
| Jubilee Platinum PLC (a)(e) | 4,286,043 | 3,339 | ||||
| Lambert Howarth Group PLC (e) | 1,568,784 | 6,291 | ||||
| Landround PLC (e) | 298,600 | 582 | ||||
| Lawrence PLC | 1,073,124 | 6,431 | ||||
| LTG Technologies PLC (a) | 11,517,168 | 2,294 | ||||
| Manpower Software PLC (a) | 258,824 | 121 | ||||
| Meridian Petroleum PLC (a) | 2,747,000 | 377 | ||||
| Metals Exploration PLC (a)(e) | 2,820,077 | 624 | ||||
| Metals Exploration PLC warrants 9/14/07 (a) | 1,410,039 | 0 | ||||
| Mice Group PLC | 4,432,324 | 2,472 | ||||
| Michelmersh Brick Holdings PLC (a) | 578,900 | 1,010 | ||||
See accompanying notes which are an integral part of the financial statements.
27 Annual Report
| Investments continued | ||||||
| Common Stocks continued | ||||||
| Shares | Value (Note 1) | |||||
| (000s) | ||||||
| United Kingdom – continued | ||||||
| Monstermob Group PLC (a) | 226,461 | $ | 1,520 | |||
| NDS Group PLC sponsored ADR (a) | 105,154 | 3,849 | ||||
| NETeller PLC (a) | 263,100 | 3,209 | ||||
| NeuTec Pharma PLC (a) | 174,136 | 1,372 | ||||
| NeutraHealth PLC (a)(e) | 7,328,100 | 1,719 | ||||
| Oil Quest Resources PLC (a)(e) | 2,362,285 | 596 | ||||
| Oystertec PLC (a) | 7,009,687 | 1,365 | ||||
| P&MM Group PLC (a)(e) | 2,035,000 | 3,423 | ||||
| Phytopharm PLC (a) | 678,720 | 565 | ||||
| Pilat Media Global PLC (a)(e) | 2,880,000 | 2,244 | ||||
| Platinum Mining Corp. of India PLC (e) | 12,520,800 | 3,602 | ||||
| PlusNet Technologies Ltd. (a)(e) | 1,567,355 | 7,340 | ||||
| Premier Oil PLC (a) | 159,291 | 2,045 | ||||
| Primary Health Properties PLC | 80,000 | 494 | ||||
| Proteome Sciences PLC (a) | 623,042 | 750 | ||||
| Punch Graphix PLC | 92,458 | 209 | ||||
| Pureprofile Media PLC (g) | 680,000 | 602 | ||||
| Pureprofile Media PLC warrants 7/31/06 (a)(g) | 680,000 | 0 | ||||
| QA PLC (a) | 13,554,656 | 252 | ||||
| Rambler Metals & Mining PLC | 1,300,000 | 886 | ||||
| Retail Decisions PLC (f) | 7,007,400 | 2,605 | ||||
| Rheochem PLC (e) | 8,728,300 | 1,854 | ||||
| Rheochem PLC warrants 12/21/07 (a) | 4,364,150 | 0 | ||||
| Richmond Foods PLC | 81,813 | 742 | ||||
| Royalblue Group PLC | 45,073 | 519 | ||||
| Scapa Group PLC | 3,660,400 | 1,507 | ||||
| SDL PLC (a) | 1,450,000 | 4,005 | ||||
| Serabi Mining PLC | 2,612,400 | 1,237 | ||||
| Sibir Energy PLC (a) | 116,280 | 620 | ||||
| Sinclair Pharma PLC (a) | 1,786,758 | 4,160 | ||||
| Sondex PLC | 260,100 | 1,002 | ||||
| SPI Lasers PLC | 658,000 | 1,782 | ||||
| Spice Holdings PLC | 771,200 | 2,901 | ||||
| Sportingbet PLC | 345,100 | 1,799 | ||||
| Stem Cell Sciences PLC | 716,649 | 1,098 | ||||
| Sterling Energy PLC (a) | 8,837,667 | 2,660 | ||||
| SubSea Resources PLC (e) | 8,644,100 | 4,362 | ||||
| SubSea Resources PLC warrants 11/4/09 (a) | 1,805,625 | 360 | ||||
| Synergy Healthcare PLC | 314,553 | 2,345 | ||||
| Taghmen Energy PLC (a)(e) | 4,745,755 | 5,671 | ||||
| Taghmen Energy PLC warrants 4/30/07 (a) | 2,279,573 | 1,142 | ||||
| Tanfield Group PLC (a) | 8,653,000 | 2,911 | ||||
See accompanying notes which are an integral part of the financial statements.
| Annual Report |
| 28 |
| Common Stocks continued | ||||||
| Shares | Value (Note 1) | |||||
| (000s) | ||||||
| United Kingdom – continued | ||||||
| Teesland PLC | 1,380,000 | $ | 2,003 | |||
| Tikit Group PLC (e) | 720,362 | 2,436 | ||||
| TMO Biotec (g) | 10,000 | 531 | ||||
| Toledo Mining Corp. PLC (a) | 480,000 | 982 | ||||
| Triple Plate Junction PLC (a) | 3,638,000 | 1,353 | ||||
| Triple Plate Junction PLC warrants 12/31/05 (a) | 1,818,750 | 0 | ||||
| Tristel PLC | 561,318 | 601 | ||||
| UK Coal PLC | 1,087,069 | 2,762 | ||||
| ukbetting PLC (a) | 2,517,419 | 2,630 | ||||
| Unibet Group PLC unit | 474,256 | 9,888 | ||||
| Whatman PLC | 280,100 | 1,389 | ||||
| White Nile Ltd. (a) | 200,000 | 351 | ||||
| William Ransom & Son PLC | 3,629,500 | 2,988 | ||||
| Windsor PLC | 700,000 | 598 | ||||
| Wolfson Microelectronics PLC (a) | 685,250 | 3,015 | ||||
| World Gaming PLC (a) | 1,332,300 | 3,951 | ||||
| ZincOx Resources PLC (a) | 970,000 | 2,619 | ||||
| TOTAL UNITED KINGDOM | 337,828 | |||||
| United States of America – 1.7% | ||||||
| 121Media, Inc. (e) | 603,205 | 1,832 | ||||
| Central European Distribution Corp. (a) | 49,300 | 1,963 | ||||
| Chindex International, Inc. (a)(d) | 138,900 | 511 | ||||
| Cyberscan Technology, Inc. | 158,400 | 1,725 | ||||
| Frontera Resources Corp. | 2,300,000 | 5,131 | ||||
| Frontier Mining Ltd. (a)(e) | 6,115,691 | 2,220 | ||||
| GeoGlobal Resources, Inc. (a)(d) | 351,900 | 2,235 | ||||
| Marathon Oil Corp. | 39,900 | 2,400 | ||||
| Private Media Group, Inc. (a)(d) | 283,400 | 621 | ||||
| Solar Integrated Technologies, Inc. (a) | 1,643,073 | 4,727 | ||||
| Trico Marine Services, Inc. (a) | 67,200 | 1,713 | ||||
| Uranco, Inc. (a)(g) | 1,333,332 | 1,000 | ||||
| Uranco, Inc. warrants 7/26/08 (a)(g) | 666,666 | 0 | ||||
| UTEK Corp. (Reg. S) | 34,942 | 414 | ||||
| Valero Energy Corp. | 41,400 | 4,357 | ||||
| XL TechGroup, Inc. | 1,442,680 | 6,769 | ||||
| TOTAL UNITED STATES OF AMERICA | 37,618 | |||||
| TOTAL COMMON STOCKS | ||||||
| (Cost $1,812,433) | 2,155,033 | |||||
See accompanying notes which are an integral part of the financial statements.
29 Annual Report
| Investments continued | ||||||||
| Nonconvertible Preferred Stocks 0.4% | ||||||||
| Shares | Value (Note 1) | |||||||
| (000s) | ||||||||
| Germany – 0.4% | ||||||||
| Fresenius AG | ||||||||
| (Cost $3,683) | 57,705 | $ | 8,107 | |||||
| Investment Companies 0.0% | ||||||||
| United Kingdom – 0.0% | ||||||||
| Black Sea Property Fund Ltd. | ||||||||
| (Cost $1,166) | 3,036,200 | 1,223 | ||||||
| Corporate Bonds 0.1% | ||||||||
| Principal | ||||||||
| Amount (000s) | ||||||||
| Convertible Bonds 0.1% | ||||||||
| United Kingdom – 0.1% | ||||||||
| BioCare Solutions Ltd. 1% 12/31/06 (g) | GBP | $ | 54,768 | 970 | ||||
| Nonconvertible Bonds – 0.0% | ||||||||
| Norway 0.0% | ||||||||
| Songa Offshore ASA 9% 9/8/10 (g) | 600 | 582 | ||||||
| TOTAL CORPORATE BONDS | ||||||||
| (Cost $1,574) | 1,552 | |||||||
| Money Market Funds 6.9% | ||||||||
| Shares | ||||||||
| Fidelity Cash Central Fund, 3.92% (b) | 36,414,099 | 36,414 | ||||||
| Fidelity Securities Lending Cash Central Fund, 3.94% (b)(c) 115,371,226 | 115,371 | |||||||
| TOTAL MONEY MARKET FUNDS | ||||||||
| (Cost $151,785) | 151,785 | |||||||
| TOTAL INVESTMENT PORTFOLIO 104.8% | ||||||||
| (Cost $1,970,641) | 2,317,700 | |||||||
| NET OTHER ASSETS – (4.8)% | (105,340) | |||||||
| NET ASSETS 100% | $ | 2,212,360 | ||||||
| See accompanying notes which are an integral part of the financial statements. | ||||||||
| Annual Report | 30 | |||||||
| Currency Abbreviations GBP — British pound |
| Legend (a) Non-income producing (b) Affiliated fund that is available only to investment companies and other accounts managed by Fidelity Investments. The rate quoted is the annualized seven-day yield of the fund at period end. A complete unaudited listing of the fund’s holdings as of its most recent quarter end is available upon request. (c) Investment made with cash collateral received from securities on loan. (d) Security or a portion of the security is on loan at period end. (e) Affiliated company (f) Security purchased on a delayed delivery or when-issued basis. (g) Restricted securities – Investment in securities not registered under the Securities Act of 1933 (excluding 144A issues). At the end of the period, the value of restricted securities (excluding 144A issues) amounted to $11,520,000 or 0.5% of net assets. |
Additional information on each holding is as follows:
| Acquisition | Acquisition | |||||
| Security | Date | Cost (000s) | ||||
| Appian | ||||||
| Technology PLC | ||||||
| warrants | ||||||
| 2/28/08 | 2/18/05 | $ | — | |||
| BioCare Solutions | ||||||
| Ltd. 1% | ||||||
| 12/31/06 | 8/3/05 | $ | 974 | |||
| Eclipse Energy | ||||||
| Co. Ltd. | 4/28/05 | $ | 1,459 | |||
| Imperial College | ||||||
| Innovations Ltd. | 4/27/05 | $ | 2,942 | |||
| Pertra Midt | ||||||
| Norges AS | 6/28/05 | $ | 911 | |||
| Pureprofile Media | ||||||
| PLC | 5/3/05 | $ | 644 | |||
| Pureprofile Media | ||||||
| PLC warrants | ||||||
| 7/31/06 | 5/3/05 | $ | — | |||
| SeaDrill Ltd. | 8/23/05 | $ | 3,384 | |||
| Songa Offshore | ||||||
| ASA warrants | ||||||
| 5/20/08 | 6/8/05 | $ | — | |||
| Songa Offshore | ||||||
| ASA 9% 9/8/10 | 6/8/05 | $ | 600 | |||
| TMO Biotec | 10/27/05 | $ | 535 | |||
| Uranco, Inc. | 8/24/05 | $ | 1,000 | |||
| Uranco, Inc. | ||||||
| warrants | ||||||
| 7/26/08 | 8/24/05 | $ | — | |||
See accompanying notes which are an integral part of the financial statements.
31 Annual Report
Investments continued
Other Information
An affiliated company is a company in which the fund has ownership of at least 5% of the voting securities. Companies which are affiliates of the fund at period-end are noted in the fund’s Schedule of Investments. Transactions during the period with companies which are or were affiliates are as follows:
| Value, | Value, | |||||||||||||||||||||||
| Affiliates | beginning | Purchases | Sales | Dividend | end of | |||||||||||||||||||
| (Amounts in thousands) | of period | Proceeds | Income | period | ||||||||||||||||||||
| 121Media, Inc | $ | — | $ | 2,700 | $ | — | $ | — | $ | 1,832 | ||||||||||||||
| Advanced Technology (UK) PLC | 558 | — | — | — | — | |||||||||||||||||||
| Adwalker PLC | — | 1,291 | — | — | 1,292 | |||||||||||||||||||
| Afren PLC | — | 3,214 | 328 | — | 12,040 | |||||||||||||||||||
| Alliance Pharma PLC | 1,812 | 835 | 295 | — | 2,924 | |||||||||||||||||||
| Ascent Resources PLC | — | 994 | — | — | 2,603 | |||||||||||||||||||
| Aztec Resources Ltd. | — | 5,036 | 4,111 | — | — | |||||||||||||||||||
| BDI Mining Corp. | — | 4,713 | — | — | 4,646 | |||||||||||||||||||
| Cambrian Mining PLC | — | 17,979 | — | — | 15,024 | |||||||||||||||||||
| Centurion Electronics PLC | — | 1,979 | — | 15 | 574 | |||||||||||||||||||
| Corac Group PLC | 2,460 | 92 | — | — | 2,146 | |||||||||||||||||||
| DA Group PLC | — | 2,300 | 618 | — | 2,490 | |||||||||||||||||||
| Dat Group PLC | — | 1,746 | — | — | 1,263 | |||||||||||||||||||
| Fox Resources Ltd. | 487 | 1,126 | — | — | 844 | |||||||||||||||||||
| Frontier Mining Ltd. | 1,443 | 774 | — | — | 2,220 | |||||||||||||||||||
| GMA Resources PLC | 1,955 | 1,011 | — | — | 3,026 | |||||||||||||||||||
| Hardide Ltd. | 919 | 992 | — | — | 2,909 | |||||||||||||||||||
| Healthcare Enterprise Group PLC | 1,062 | 10,275 | 1,111 | — | 10,604 | |||||||||||||||||||
| HudBay Minerals, Inc. (formerly | ||||||||||||||||||||||||
| Ontzinc Corp.) | 1,841 | — | 1,328 | — | — | |||||||||||||||||||
| ID Data PLC | — | 1,500 | — | — | 1,344 | |||||||||||||||||||
| International Ferro Metals | — | 16,293 | — | — | 15,854 | |||||||||||||||||||
| IPSA Group PLC | — | 2,006 | — | — | 2,128 | |||||||||||||||||||
| Jubilee Platinum PLC | 1,823 | 728 | 463 | — | 3,339 | |||||||||||||||||||
| Kura Corp. Ltd. | 2,689 | 7,354 | 246 | 17 | 18,905 | |||||||||||||||||||
| Lambert Howarth Group PLC | 6,551 | 1,164 | — | 276 | 6,291 | |||||||||||||||||||
| Landround PLC | 345 | 958 | — | 16 | 582 | |||||||||||||||||||
| Leadcom Integrated Solutions | — | 3,139 | — | — | 4,705 | |||||||||||||||||||
| Metals Exploration PLC | — | 414 | — | — | 624 | |||||||||||||||||||
| NeutraHealth PLC | — | 1,375 | — | — | 1,719 | |||||||||||||||||||
| Oil Quest Resources PLC | 167 | 874 | — | — | 596 | |||||||||||||||||||
| P&MM Group PLC | 2,300 | — | — | — | 3,423 | |||||||||||||||||||
| Pilat Media Global PLC | 2,196 | — | — | — | 2,244 | |||||||||||||||||||
| Platinum Mining Corp. of India PLC | — | 4,947 | 3,602 | |||||||||||||||||||||
| PlusNet Technologies Ltd. | 2,347 | 2,232 | — | — | 7,340 | |||||||||||||||||||
| PSI AG | 992 | 2,473 | — | — | 3,396 | |||||||||||||||||||
| Rheochem PLC | — | 2,692 | — | — | 1,854 | |||||||||||||||||||
| Sphere Investments Ltd | — | 2,806 | — | — | 2,552 | |||||||||||||||||||
| Starfield Resources, Inc. | — | 4,728 | — | — | 3,741 | |||||||||||||||||||
See accompanying notes which are an integral part of the financial statements.
| Annual Report |
| 32 |
| Value, | Value, | |||||||||||||||
| Affiliates | beginning | Purchases | Sales | Dividend | end of | |||||||||||
| (Amounts in thousands) | of period | Proceeds | Income | period | ||||||||||||
| Stepstone ASA | $ | — | $ 5,430 | $ | — | $ | — | $ 5,719 | ||||||||
| SubSea Resources PLC | 2,654 | 560 | — | — | 4,362 | |||||||||||
| Sylvania Resources Ltd. | — | 2,450 | — | — | 2,738 | |||||||||||
| Taghmen Energy PLC | 1,482 | 2,386 | — | — | 5,671 | |||||||||||
| Tanfield Group PLC | — | 3,135 | 212 | — | — | |||||||||||
| Teleunit Spa | 2,572 | 1,019 | — | — | 3,683 | |||||||||||
| Tikit Group PLC | 2,155 | — | 349 | 32 | 2,436 | |||||||||||
| William Ransom & Son PLC | 2,393 | 686 | — | 93 | — | |||||||||||
| Total | $ | 43,203 | $ 128,406 | $ | 9,061 | $ | 449 | $ 175,285 | ||||||||
See accompanying notes which are an integral part of the financial statements.
33 Annual Report
| Financial Statements | ||||||||
| Statement of Assets and Liabilities | ||||||||
| Amounts in thousands (except per share amounts) | October 31, 2005 | |||||||
| Assets | ||||||||
| Investment in securities, at value (including securities | ||||||||
| loaned of $109,541) (cost $1,970,641) See | ||||||||
| accompanying schedule | $ | 2,317,700 | ||||||
| Cash | 893 | |||||||
| Foreign currency held at value (cost $5,825) | 5,813 | |||||||
| Receivable for investments sold | 30,832 | |||||||
| Receivable for fund shares sold | 4,525 | |||||||
| Dividends receivable | 2,621 | |||||||
| Interest receivable | 141 | |||||||
| Receivable from investment adviser for expense | ||||||||
| reductions | 24 | |||||||
| Other affiliated receivables | 11 | |||||||
| Other receivables | 128 | |||||||
| Total assets | 2,362,688 | |||||||
| Liabilities | ||||||||
| Payable for investments purchased | ||||||||
| Regular delivery | $ | 18,168 | ||||||
| Delayed delivery | 11,013 | |||||||
| Payable for fund shares redeemed | 2,790 | |||||||
| Accrued management fee | 1,791 | |||||||
| Distribution fees payable | 57 | |||||||
| Other affiliated payables | 488 | |||||||
| Other payables and accrued expenses | 650 | |||||||
| Collateral on securities loaned, at value | 115,371 | |||||||
| Total liabilities | 150,328 | |||||||
| Net Assets | $ | 2,212,360 | ||||||
| Net Assets consist of: | ||||||||
| Paid in capital | $ | 1,615,845 | ||||||
| Undistributed net investment income | 10,862 | |||||||
| Accumulated undistributed net realized gain (loss) on | ||||||||
| investments and foreign currency transactions | 238,932 | |||||||
| Net unrealized appreciation (depreciation) on | ||||||||
| investments and assets and liabilities in foreign | ||||||||
| currencies | 346,721 | |||||||
| Net Assets | $ | 2,212,360 | ||||||
See accompanying notes which are an integral part of the financial statements.
| Annual Report |
| 34 |
| Statement of Assets and Liabilities | ||||
| Amounts in thousands (except per share amounts) | October 31, 2005 | |||
| Calculation of Maximum Offering Price | ||||
| Class A: | ||||
| Net Asset Value and redemption price per share | ||||
| ($34,838 ÷ 1,305.2 shares) | $ | 26.69 | ||
| Maximum offering price per share (100/94.25 of | ||||
| $26.69) | $ | 28.32 | ||
| Class T: | ||||
| Net Asset Value and redemption price per share | ||||
| ($41,647 ÷ 1,567.2 shares) | $ | 26.57 | ||
| Maximum offering price per share (100/96.50 of | ||||
| $26.57) | $ | 27.53 | ||
| Class B: | ||||
| Net Asset Value and offering price per share | ||||
| ($12,783 ÷ 487.2 shares)A | $ | 26.24 | ||
| Class C: | ||||
| Net Asset Value and offering price per share | ||||
| ($25,202 ÷ 958 shares)A | $ | 26.31 | ||
| International Small Cap: | ||||
| Net Asset Value, offering price and redemption | ||||
| price per share ($2,090,458 ÷ 77,754 shares) | $ | 26.89 | ||
| Institutional Class: | ||||
| Net Asset Value, offering price and redemption | ||||
| price per share ($7,432 ÷ 276.7 shares) | $ | 26.86 | ||
| A Redemption price per share is equal to net asset value less any applicable contingent deferred sales charge. | ||||
See accompanying notes which are an integral part of the financial statements.
35 Annual Report
| Financial Statements continued | ||||||
| Statement of Operations | ||||||
| Amounts in thousands | Year ended October 31, 2005 | |||||
| Investment Income | ||||||
| Dividends (including $449 received from affiliated | ||||||
| issuers) | $ | 33,339 | ||||
| Interest | 1,852 | |||||
| Security lending | 2,630 | |||||
| 37,821 | ||||||
| Less foreign taxes withheld | (1,995) | |||||
| Total income | 35,826 | |||||
| Expenses | ||||||
| Management fee | ||||||
| Basic fee | $ | 16,972 | ||||
| Performance adjustment | 1,557 | |||||
| Transfer agent fees | 4,209 | |||||
| Distribution fees | 534 | |||||
| Accounting and security lending fees | 939 | |||||
| Independent trustees’ compensation | 9 | |||||
| Custodian fees and expenses | 1,029 | |||||
| Registration fees | 264 | |||||
| Audit | 60 | |||||
| Legal | 13 | |||||
| Miscellaneous | 24 | |||||
| Total expenses before reductions | 25,610 | |||||
| Expense reductions | (646) | 24,964 | ||||
| Net investment income (loss) | 10,862 | |||||
| Realized and Unrealized Gain (Loss) | ||||||
| Net realized gain (loss) on: | ||||||
| Investment securities (net of foreign taxes of $1,158) | ||||||
| (Including realized gain (loss) of $(47) from affili- | ||||||
| ated issuers) | 242,909 | |||||
| Foreign currency transactions | (671) | |||||
| Total net realized gain (loss) | 242,238 | |||||
| Change in net unrealized appreciation (depreciation) on: | ||||||
| Investment securities (net of increase in deferred for- | ||||||
| eign taxes of $297) | 169,298 | |||||
| Assets and liabilities in foreign currencies | (50) | |||||
| Total change in net unrealized appreciation | ||||||
| (depreciation) | 169,248 | |||||
| Net gain (loss) | 411,486 | |||||
| Net increase (decrease) in net assets resulting from | ||||||
| operations | $ | 422,348 | ||||
See accompanying notes which are an integral part of the financial statements.
| Annual Report |
| 36 |
| Statement of Changes in Net Assets | ||||||||
| Year ended | Year ended | |||||||
| October 31, | October 31, | |||||||
| Amounts in thousands | 2005 | 2004 | ||||||
| Increase (Decrease) in Net Assets | ||||||||
| Operations | ||||||||
| Net investment income (loss) | $ | 10,862 | $ | 4,864 | ||||
| Net realized gain (loss) | 242,238 | 55,700 | ||||||
| Change in net unrealized appreciation (depreciation) . | 169,248 | 104,988 | ||||||
| Net increase (decrease) in net assets resulting | ||||||||
| from operations | 422,348 | 165,552 | ||||||
| Distributions to shareholders from net investment income . | (3,406) | (741) | ||||||
| Distributions to shareholders from net realized gain | (45,235) | (11,573) | ||||||
| Total distributions | (48,641) | (12,314) | ||||||
| Share transactions - net increase (decrease) | 701,403 | 422,160 | ||||||
| Redemption fees | 1,213 | 1,900 | ||||||
| Total increase (decrease) in net assets | 1,076,323 | 577,298 | ||||||
| Net Assets | ||||||||
| Beginning of period | 1,136,037 | 558,739 | ||||||
| End of period (including undistributed net investment | ||||||||
| income of $10,862 and undistributed net investment | ||||||||
| income of $5,018, respectively) | $ | 2,212,360 | $ | 1,136,037 | ||||
See accompanying notes which are an integral part of the financial statements.
37 Annual Report
| Financial Highlights Class A | ||||||||||||
| Years ended October 31, | 2005 | 2004 | 2003G | |||||||||
| Selected Per Share Data | ||||||||||||
| Net asset value, beginning of period | $ | 21.25 | $ | 17.69 | $ | 12.35 | ||||||
| Income from Investment Operations�� | ||||||||||||
| Net investment income (loss)E | 05 | .02 | .02F | |||||||||
| Net realized and unrealized gain (loss) | 6.16 | 3.83 | 5.30 | |||||||||
| Total from investment operations | 6.21 | 3.85 | 5.32 | |||||||||
| Distributions from net investment income | (.02) | (.02) | — | |||||||||
| Distributions from net realized gain | (.77) | (.31) | — | |||||||||
| Total distributions | (.79) | (.33) | — | |||||||||
| Redemption fees added to paid in capitalE | 02 | .04 | .02 | |||||||||
| Net asset value, end of period | $ | 26.69 | $ | 21.25 | $ | 17.71 | ||||||
| Total ReturnB,C,D | 30.16% | 22.36% | 43.24% | |||||||||
| Ratios to Average Net AssetsH | ||||||||||||
| Expenses before expense reductions | 1.66% | 1.71% | 1.77%A | |||||||||
| Expenses net of voluntary waivers, if any | 1.66% | 1.71% | 1.77%A | |||||||||
| Expenses net of all reductions | 1.63% | 1.69% | 1.74%A | |||||||||
| Net investment income (loss) | 21% | .09% | .28%A | |||||||||
| Supplemental Data | ||||||||||||
| Net assets, end of period (in millions) | $ | 35 | $ | 13 | $ | 5 | ||||||
| Portfolio turnover rate | 79% | 77% | 84%A |
| A Annualized B Total returns for periods of less than one year are not annualized. C Total returns would have been lower had certain expenses not been reduced during the periods shown. D Total returns do not include the effect of the sales charges. E Calculated based on average shares outstanding during the period. F Investment income per share reflects a special dividend which amounted to $.01 per share. G For the period May 27, 2003 (commencement of sale of shares) to October 31, 2003. H Expense ratios reflect operating expenses of the class. Expenses before reductions do not reflect amounts reimbursed by the investment adviser or reductions from brokerage service arrangements or other expense offset arrangements and do not represent the amount paid by the class during periods when reimbursements or reductions occur. Expense ratios before reductions for start up periods may not be representative of longer term operating periods. Expenses net of any voluntary waivers reflect expenses after reimbursement by the investment adviser but prior to reductions from brokerage service arrangements or other expense offset arrangements. Expenses net of all reductions represent the net expenses paid by the class. |
See accompanying notes which are an integral part of the financial statements.
| Annual Report |
| 38 |
| Financial Highlights Class T | ||||||||||||
| Years ended October 31, | 2005 | 2004 | 2003G | |||||||||
| Selected Per Share Data | ||||||||||||
| Net asset value, beginning of period | $ | 21.20 | $ | 17.68 | $ | 12.35 | ||||||
| Income from Investment Operations | ||||||||||||
| Net investment income (loss)E | (.01) | (.03) | —F,I | |||||||||
| Net realized and unrealized gain (loss) | 6.12 | 3.83 | 5.31 | |||||||||
| Total from investment operations | 6.11 | 3.80 | 5.31 | |||||||||
| Distributions from net investment income | — | (.01) | — | |||||||||
| Distributions from net realized gain | (.76) | (.31) | — | |||||||||
| Total distributions | (.76) | (.32) | — | |||||||||
| Redemption fees added to paid in capitalE | 02 | .04 | .02 | |||||||||
| Net asset value, end of period | $ | 26.57 | $ | 21.20 | $ | 17.65 | ||||||
| Total ReturnB,C,D | 29.72% | 22.07% | 43.16% | |||||||||
| Ratios to Average Net AssetsH | ||||||||||||
| Expenses before expense reductions | 1.92% | 1.94% | 2.12%A | |||||||||
| Expenses net of voluntary waivers, if any | 1.91% | 1.94% | 2.12%A | |||||||||
| Expenses net of all reductions | 1.88% | 1.92% | 2.09%A | |||||||||
| Net investment income (loss) | (.04)% | (.14)% | (.07)%A | |||||||||
| Supplemental Data | ||||||||||||
| Net assets, end of period (in millions) | $ | 42 | $ | 15 | $ | 4 | ||||||
| Portfolio turnover rate | 79% | 77% | 84%A |
| A Annualized B Total returns for periods of less than one year are not annualized. C Total returns would have been lower had certain expenses not been reduced during the periods shown. D Total returns do not include the effect of the sales charges. E Calculated based on average shares outstanding during the period. F Investment income per share reflects a special dividend which amounted to $.01 per share. G For the period May 27, 2003 (commencement of sale of shares) to October 31, 2003. H Expense ratios reflect operating expenses of the class. Expenses before reductions do not reflect amounts reimbursed by the investment adviser or reductions from brokerage service arrangements or other expense offset arrangements and do not represent the amount paid by the class during periods when reimbursements or reductions occur. Expense ratios before reductions for start up periods may not be representative of longer term operating periods. Expenses net of any voluntary waivers reflect expenses after reimbursement by the investment adviser but prior to reductions from brokerage service arrangements or other expense offset arrangements. Expenses net of all reductions represent the net expenses paid by the class. I Amount represents less than $.01 per share. |
See accompanying notes which are an integral part of the financial statements.
39 Annual Report
| Financial Highlights Class B | ||||||||||||
| Years ended October 31, | 2005 | 2004 | 2003G | |||||||||
| Selected Per Share Data | ||||||||||||
| Net asset value, beginning of period | $ | 20.99 | $ | 17.62 | $ | 12.35 | ||||||
| Income from Investment Operations | ||||||||||||
| Net investment income (loss)E | (.14) | (.16) | (.05)F | |||||||||
| Net realized and unrealized gain (loss) | 6.08 | 3.80 | 5.30 | |||||||||
| Total from investment operations | 5.94 | 3.64 | 5.25 | |||||||||
| Distributions from net realized gain | (.71) | (.31) | — | |||||||||
| Redemption fees added to paid in capitalE | 02 | .04 | .02 | |||||||||
| Net asset value, end of period | $ | 26.24 | $ | 20.99 | $ | 17.52 | ||||||
| Total ReturnB,C,D | 29.13% | 21.21% | 42.67% | |||||||||
| Ratios to Average Net AssetsH | ||||||||||||
| Expenses before expense reductions | 2.49% | 2.63% | 2.76%A | |||||||||
| Expenses net of voluntary waivers, if any | 2.43% | 2.63% | 2.76%A | |||||||||
| Expenses net of all reductions | 2.40% | 2.60% | 2.73%A | |||||||||
| Net investment income (loss) | (.56)% | (.83)% | (.71)%A | |||||||||
| Supplemental Data | ||||||||||||
| Net assets, end of period (in millions) | $ | 13 | $ | 5 | $ | 1 | ||||||
| Portfolio turnover rate | 79% | 77% | 84%A |
| A Annualized B Total returns for periods of less than one year are not annualized. C Total returns would have been lower had certain expenses not been reduced during the periods shown. D Total returns do not include the effect of the contingent deferred sales charge. E Calculated based on average shares outstanding during the period. F Investment income per share reflects special dividend which amounted to $.01 per share. G For the period May 27, 2003 (commencement of sale of shares) to October 31, 2003. H Expense ratios reflect operating expenses of the class. Expenses before reductions do not reflect amounts reimbursed by the investment adviser or reductions from brokerage service arrangements or other expense offset arrangements and do not represent the amount paid by the class during periods when reimbursements or reductions occur. Expense ratios before reductions for start up periods may not be representative of longer term operating periods. Expenses net of any voluntary waivers reflect expenses after reimbursement by the investment adviser but prior to reductions from brokerage service arrangements or other expense offset arrangements. Expenses net of all reductions represent the net expenses paid by the class. |
See accompanying notes which are an integral part of the financial statements.
| Annual Report |
| 40 |
| Financial Highlights Class C | ||||||||||||
| Years ended October 31, | 2005 | 2004 | 2003G | |||||||||
| Selected Per Share Data | ||||||||||||
| Net asset value, beginning of period | $ | 21.04 | $ | 17.64 | $ | 12.35 | ||||||
| Income from Investment Operations | ||||||||||||
| Net investment income (loss)E | (.13) | (.12) | (.04)F | |||||||||
| Net realized and unrealized gain (loss) | 6.10 | 3.80 | 5.31 | |||||||||
| Total from investment operations | 5.97 | 3.68 | 5.27 | |||||||||
| Distributions from net investment income | — | (.01) | — | |||||||||
| Distributions from net realized gain | (.72) | (.31) | — | |||||||||
| Total distributions | (.72) | (.32) | — | |||||||||
| Redemption fees added to paid in capitalE | 02 | .04 | .02 | |||||||||
| Net asset value, end of period | $ | 26.31 | $ | 21.04 | $ | 17.73 | ||||||
| Total ReturnB,C,D | 29.22% | 21.43% | 42.83% | |||||||||
| Ratios to Average Net AssetsH | ||||||||||||
| Expenses before expense reductions | 2.41% | 2.43% | 2.57%A | |||||||||
| Expenses net of voluntary waivers, if any | 2.41% | 2.43% | 2.57%A | |||||||||
| Expenses net of all reductions | 2.38% | 2.40% | 2.55%A | |||||||||
| Net investment income (loss) | (.54)% | (.62)% | (.52)%A | |||||||||
| Supplemental Data | ||||||||||||
| Net assets, end of period (in millions) | $ | 25 | $ | 9 | $ | 1 | ||||||
| Portfolio turnover rate | 79% | 77% | 84%A |
| A Annualized B Total returns for periods of less than one year are not annualized. C Total returns would have been lower had certain expenses not been reduced during the periods shown. D Total returns do not include the effect of the contingent deferred sales charge. E Calculated based on average shares outstanding during the period. F Investment income per share reflects a special dividend which amounted to $.01 per share. G For the period May 27, 2003 (commencement of sale of shares) to October 31, 2003. H Expense ratios reflect operating expenses of the class. Expenses before reductions do not reflect amounts reimbursed by the investment adviser or reductions from brokerage service arrangements or other expense offset arrangements and do not represent the amount paid by the class during periods when reimbursements or reductions occur. Expense ratios before reductions for start up periods may not be representative of longer term operating periods. Expenses net of any voluntary waivers reflect expenses after reimbursement by the investment adviser but prior to reductions from brokerage service arrangements or other expense offset arrangements. Expenses net of all reductions represent the net expenses paid by the class. |
See accompanying notes which are an integral part of the financial statements.
41 Annual Report
| Financial Highlights International Small Cap | ||||||||||||||||
| Years ended October 31, | 2005 | 2004 | 2003 | 2002F | ||||||||||||
| Selected Per Share Data | ||||||||||||||||
| Net asset value, beginning of period | $ | 21.36 | $ | 17.71 | $ | 9.87 | $ | 10.00 | ||||||||
| Income from Investment Operations | ||||||||||||||||
| Net investment income (loss)D | 15 | .10 | .07E | (.01) | ||||||||||||
| Net realized and unrealized gain (loss) | 6.19 | 3.84 | 7.75 | (.12) | ||||||||||||
| Total from investment operations | 6.34 | 3.94 | 7.82 | (.13) | ||||||||||||
| Distributions from net investment income | (.06) | (.02) | — | — | ||||||||||||
| Distributions from net realized gain | (.77) | (.31) | (.02) | — | ||||||||||||
| Total distributions | (.83) | (.33) | (.02) | — | ||||||||||||
| Redemption fees added to paid in capitalD | 02 | .04 | .04 | H | ||||||||||||
| Net asset value, end of period | $ | 26.89 | $ | 21.36 | $ | 17.71 | $ | 9.87 | ||||||||
| Total ReturnB,C | 30.67% | 22.84% | 79.78% | (1.30)% | ||||||||||||
| Ratios to Average Net AssetsG | ||||||||||||||||
| Expenses before expense reductions | 1.28% | 1.30% | 1.54% | 13.70%A | ||||||||||||
| Expenses net of voluntary waivers, if any | 1.28% | 1.30% | 1.54% | 1.80%A | ||||||||||||
| Expenses net of all reductions | 1.25% | 1.28% | 1.51% | 1.80%A | ||||||||||||
| Net investment income (loss) | 59% | .50% | .46% | (.56)%A | ||||||||||||
| Supplemental Data | ||||||||||||||||
| Net assets, end of period (in millions) | $ | 2,090 | $ | 1,091 | $ | 547 | $ | 3 | ||||||||
| Portfolio turnover rate | 79% | 77% | 84% | 85%A | ||||||||||||
| A Annualized B Total returns for periods of less than one year are not annualized. C Total returns would have been lower had certain expenses not been reduced during the periods shown. D Calculated based on average shares outstanding during the period. E Investment income per share reflects a special dividend which amounted to $.03 per share. F For the period September 18, 2002 (commencement of operations) to October 31, 2002. G Expense ratios reflect operating expenses of the class. Expenses before reductions do not reflect amounts reimbursed by the investment adviser or reductions from brokerage service arrangements or other expense offset arrangements and do not represent the amount paid by the class during periods when reimbursements or reductions occur. Expense ratios before reductions for start up periods may not be representative of longer term operating periods. Expenses net of any voluntary waivers reflect expenses after reimbursement by the investment adviser but prior to reductions from brokerage service arrangements or other expense offset arrangements. Expenses net of all reductions represent the net expenses paid by the class. H Amount represents less than $.01 per share. |
See accompanying notes which are an integral part of the financial statements.
| Annual Report |
| 42 |
| Financial Highlights Institutional Class | ||||||||||||
| Years ended October 31, | 2005 | 2004 | 2003F | |||||||||
| Selected Per Share Data | ||||||||||||
| Net asset value, beginning of period | $ | 21.36 | $ | 17.72 | $ | 12.35 | ||||||
| Income from Investment Operations | ||||||||||||
| Net investment income (loss)D | 14 | .10 | .04E | |||||||||
| Net realized and unrealized gain (loss) | 6.18 | 3.84 | 5.31 | |||||||||
| Total from investment operations | 6.32 | 3.94 | 5.35 | |||||||||
| Distributions from net investment income | (.07) | (.03) | — | |||||||||
| Distributions from net realized gain | (.77) | (.31) | — | |||||||||
| Total distributions | (.84) | (.34) | — | |||||||||
| Redemption fees added to paid in capitalD | 02 | .04 | .02 | |||||||||
| Net asset value, end of period | $ | 26.86 | $ | 21.36 | $ | 17.72 | ||||||
| Total ReturnB,C | 30.59% | 22.84% | 43.48% | |||||||||
| Ratios to Average Net AssetsG | ||||||||||||
| Expenses before expense reductions | 1.30% | 1.32% | 1.51%A | |||||||||
| Expenses net of voluntary waivers, if any | 1.30% | 1.32% | 1.51%A | |||||||||
| Expenses net of all reductions | 1.27% | 1.29% | 1.48%A | |||||||||
| Net investment income (loss) | 57% | .49% | .54%A | |||||||||
| Supplemental Data | ||||||||||||
| Net assets, end of period (in millions) | $ | 7 | $ | 3 | $ | .4 | ||||||
| Portfolio turnover rate | 79% | 77% | 84%A |
| A Annualized B Total returns for periods of less than one year are not annualized. C Total returns would have been lower had certain expenses not been reduced during the periods shown. D Calculated based on average shares outstanding during the period. E Investment income per share reflects a special dividend which amounted to $.01 per share. F For the period May 27, 2003 (commencement of sale of shares) to October 31, 2003. G Expense ratios reflect operating expenses of the class. Expenses before reductions do not reflect amounts reimbursed by the investment adviser or reductions from brokerage service arrangements or other expense offset arrangements and do not represent the amount paid by the class during periods when reimbursements or reductions occur. Expense ratios before reductions for start up periods may not be representative of longer term operating periods. Expenses net of any voluntary waivers reflect expenses after reimbursement by the investment adviser but prior to reductions from brokerage service arrangements or other expense offset arrangements. Expenses net of all reductions represent the net expenses paid by the class. |
See accompanying notes which are an integral part of the financial statements.
43 Annual Report
Notes to Financial Statements
| For the period ended October 31, 2005 (Amounts in thousands except ratios) |
1. Significant Accounting Policies.
Fidelity International Small Cap Fund (the fund) is a fund of Fidelity Investment Trust (the trust) and is authorized to issue an unlimited number of shares. Effective the close of business on May 5, 2005, the fund was closed to most new accounts. The trust is registered under the Investment Company Act of 1940, as amended (the 1940 Act), as an open end management investment company organized as a Massachusetts business trust.
The fund offers Class A, Class T, Class B, Class C, International Small Cap (the original class) and Institutional Class shares, each of which has equal rights as to assets and voting privileges. Each class has exclusive voting rights with respect to matters that affect that class. Class B shares will automatically convert to Class A shares after a holding period of seven years from the initial date of purchase. Investment income, realized and unrealized capital gains and losses, the common expenses of the fund, and certain fund level expense reductions, if any, are allocated on a pro rata basis to each class based on the relative net assets of each class to the total net assets of the fund. Each class differs with respect to transfer agent and distribution and service plan fees incurred. Certain expense reductions also differ by class.
The fund may invest in affiliated money market central funds (Money Market Central Funds) which are open end investment companies available to investment companies and other accounts managed by Fidelity Management & Research Company (FMR) and its affiliates. The financial statements have been prepared in conformity with accounting principles generally accepted in the United States of America, which require manage ment to make certain estimates and assumptions at the date of the financial statements. The following summarizes the significant accounting policies of the fund: Security Valuation. Investments are valued and net asset value (NAV) per share is calculated (NAV calculation) as of the close of business of the New York Stock Exchange (NYSE), normally 4:00 p.m. Eastern time. Wherever possible, the fund uses independent pricing services approved by the Board of Trustees to value its investments.
Equity securities, including restricted securities, for which market quotations are readily available, are valued at the last reported sale price or official closing price as reported by an independent pricing service on the primary market or exchange on which they are traded. In the event there were no sales during the day or closing prices are not available, securities are valued at the last quoted bid price. Debt securities, including restricted securities, for which quotations are readily available, are valued by independent pricing services or by dealers who make markets in such securities. Pricing services consider yield or price of bonds of comparable quality, coupon, maturity and type as well as dealer supplied prices. Investments in open end mutual funds are valued at their closing net asset value each business day. Short term securities with remaining maturities of sixty
| Annual Report |
| 44 |
1. Significant Accounting Policies continued
Security Valuation continued days or less for which quotations are not readily available are valued at amortized cost, which approximates value.
When current market prices or quotations are not readily available or do not accurately reflect fair value, valuations may be determined in accordance with procedures adopted by the Board of Trustees. For example, when developments occur between the close of a market and the close of the NYSE that may materially affect the value of some or all of the securities, or when trading in a security is halted, those securities may be fair valued. Factors used in the determination of fair value may include monitoring news to identify significant market or security specific events such as changes in the value of U.S. securi ties market, reviewing developments in foreign markets and evaluating the performance of ADRs, futures contracts and exchange traded funds. Because the fund’s utilization of fair value pricing depends on market activity, the frequency with which fair value pricing is used can not be predicted and may be utilized to a significant extent. The value of securities used for NAV calculation under fair value pricing may differ from published prices for the same securities.
Foreign Currency. The fund uses foreign currency contracts to facilitate transactions in foreign denominated securities. Losses from these transactions may arise from changes in the value of the foreign currency or if the counterparties do not perform under the contracts’ terms.
Foreign denominated assets, including investment securities, and liabilities are trans lated into U.S. dollars at the exchange rate at period end. Purchases and sales of invest ment securities, income and dividends received and expenses denominated in foreign currencies are translated into U.S. dollars at the exchange rate in effect on the transac tion date.
The effects of exchange rate fluctuations on investments are included with the net realized and unrealized gain (loss) on investment securities. Other foreign currency transactions resulting in realized and unrealized gain (loss) are disclosed separately.
Investment Transactions and Income. Security transactions are accounted for as of trade date. Gains and losses on securities sold are determined on the basis of identified cost. Dividend income is recorded on the ex dividend date, except for certain dividends from foreign securities where the ex dividend date may have passed, which are recorded as soon as the fund is informed of the ex dividend date. Non cash dividends included in dividend income, if any, are recorded at the fair market value of the securities received. Interest income is accrued as earned. Interest income includes coupon interest and amortization of premium and accretion of discount on debt securities. Investment
45 Annual Report
Notes to Financial Statements continued
(Amounts in thousands except ratios)
1. Significant Accounting Policies continued
Investment Transactions and Income continued income is recorded net of foreign taxes withheld where recovery of such taxes is uncertain.
Expenses. Most expenses of the trust can be directly attributed to a fund. Expenses which cannot be directly attributed are apportioned among each fund in the trust.
Income Tax Information and Distributions to Shareholders. Each year, the fund intends to qualify as a regulated investment company by distributing all of its taxable income and realized gains under Subchapter M of the Internal Revenue Code. As a result, no provision for income taxes is required in the accompanying financial statements. Foreign taxes are provided for based on the fund’s understanding of the tax rules and rates that exist in the foreign markets in which it invests.
Distributions are recorded on the ex dividend date. Income dividends and capital gain distributions are declared separately for each class. Income and capital gain distribu tions are determined in accordance with income tax regulations, which may differ from generally accepted accounting principles. In addition, the fund will claim a portion of the payment made to redeeming shareholders as a distribution for income tax purposes.
Capital accounts within the financial statements are adjusted for permanent book tax differences. These adjustments have no impact on net assets or the results of operations. Temporary book tax differences will reverse in a subsequent period.
Book tax differences are primarily due to foreign currency transactions, passive foreign investment companies (PFIC) and losses deferred due to wash sales.
The tax basis components of distributable earnings and the federal tax cost as of period end were as follows:
| Unrealized appreciation | $ | 441,522 | ||
| Unrealized depreciation | (115,753) | |||
| Net unrealized appreciation (depreciation) | 325,769 | |||
| Undistributed ordinary income | 65,222 | |||
| Undistributed long term capital gain | 178,759 | |||
| Cost for federal income tax purposes | $ | 1,991,931 | ||
The tax character of distributions paid was as follows:
| October 31, 2005 | October 31, 2004 | |||||||
| Ordinary Income | $ | 30,409 | $ | 12,314 | ||||
| Long term Capital Gains | 18,232 | — | ||||||
| Total | $ | 48,641 | $ | 12,314 |
Annual Report 46
1. Significant Accounting Policies continued
Short Term Trading (Redemption) Fees. Shares held in the fund less than 90 days are subject to a redemption fee equal to 2.00% of the proceeds of the redeemed shares. All redemption fees, including any estimated redemption fees paid by FMR, are retained by the fund and accounted for as an addition to paid in capital.
| 2. Operating Policies. |
Repurchase Agreements. FMR has received an Exemptive Order from the Securities and Exchange Commission (the SEC) which permits the fund and other affiliated entities of FMR to transfer uninvested cash balances into joint trading accounts which are then invested in repurchase agreements. The fund may also invest directly with institutions in repurchase agreements. Repurchase agreements are collateralized by government or non government securities. Collateral is held in segregated accounts with custodian banks and may be obtained in the event of a default of the counterparty. The fund monitors, on a daily basis, the value of the collateral to ensure it is at least equal to the principal amount of the repurchase agreement (including accrued interest). In the event of a default by the counterparty, realization of the collateral proceeds could be delayed, during which time the value of the collateral may decline.
Delayed Delivery Transactions and When Issued Securities. The fund may purchase securities on a delayed delivery or when issued basis. Payment and delivery may take place after the customary settlement period for that security. The price of the underlying securities and the date when the securities will be delivered and paid for are fixed at the time the transaction is negotiated. The value of the securities purchased on a delayed delivery or when issued basis are identified as such in the fund’s Schedule of Investments. The fund may receive compensation for interest forgone in the purchase of a delayed delivery or when issued security. With respect to purchase commitments, the fund identifies securities as segregated in its records with a value at least equal to the amount of the commitment. Losses may arise due to changes in the value of the underly ing securities or if the counterparty does not perform under the contract’s terms, or if the issuer does not issue the securities due to political, economic, or other factors.
Restricted Securities. The fund may invest in securities that are subject to legal or contractual restrictions on resale. These securities generally may be resold in transac tions exempt from registration or to the public if the securities are registered. Disposal of these securities may involve time consuming negotiations and expense, and prompt sale at an acceptable price may be difficult. Information regarding restricted securities is included at the end of the fund’s Schedule of Investments.
47 Annual Report
Notes to Financial Statements continued
(Amounts in thousands except ratios)
3. Purchases and Sales of Investments.
Purchases and sales of securities, other than short term securities and U.S. government securities, aggregated $2,126,837 and $1,470,923, respectively.
4. Fees and Other Transactions with Affiliates.
Management Fee. FMR and its affiliates provide the fund with investment manage ment related services for which the fund pays a monthly management fee. The manage ment fee is the sum of an individual fund fee rate that is based on an annual rate of .60% of the fund’s average net assets and a group fee rate that averaged .27% during the period. The group fee rate is based upon the average net assets of all the mutual funds advised by FMR. The group fee rate decreases as assets under management increase and increases as assets under management decrease. In addition, the management fee is subject to a performance adjustment (up to a maximum of .20% of the fund’s average net assets over a 36 month performance period). The upward or downward adjustment to the management fee is based on the investment performance of the asset weighted return of all classes as compared to an appropriate benchmark index. For the period, the total annual management fee rate, including the performance adjustment, was .95% of the fund’s average net assets.
Distribution and Service Plan. In accordance with Rule 12b 1 of the 1940 Act, the fund has adopted separate Distribution and Service Plans for each class of shares. Certain classes pay Fidelity Distributors Corporation (FDC), an affiliate of FMR, separate Distribution and Service Fees, each of which is based on an annual percentage of each class’ average net assets. In addition, FDC may pay financial intermediaries for selling shares of the fund and providing shareholder support services. For the period, the Distribution and Service Fee rates and the total amounts paid to and retained by FDC were as follows:
| Distribution | Service | Paid to | Retained | |||||||||
| Fee | Fee | FDC | by FDC | |||||||||
| Class A | 0% | .25% | $ | 67 | $ | — | ||||||
| Class T | 25% | .25% | 164 | 2 | ||||||||
| Class B | 75% | .25% | 110 | 83 | ||||||||
| Class C | 75% | .25% | 193 | 80 | ||||||||
| $ | 534 | $ | 165 |
Sales Load. FDC receives a front end sales charge of up to 5.75% for selling Class A shares, and 3.50% for selling Class T shares, some of which is paid to financial intermedi aries for selling shares of the fund. FDC receives the proceeds of contingent deferred sales charges levied on Class A, Class T, Class B, and Class C redemptions. These charges depend on the holding period. The deferred sales charges range from 5% to 1% for Class B, 1% for Class C, and .25% for certain purchases of Class A and Class T shares.
| Annual Report |
| 48 |
| 4. Fees and Other Transactions with Affiliates continued | ||||
Sales Load - continued | ||||
| For the period, sales charge amounts retained by FDC were as follows: | ||||
| Retained | ||||
| by FDC | ||||
| Class A | $ | 65 | ||
| Class T | 22 | |||
| Class B* | 24 | |||
| Class C* | 7 | |||
| $ | 118 | |||
* When Class B and Class C shares are initially sold, FDC pays commissions from its own resources to financial intermediaries through which the sales are made.
Transfer Agent Fees. Fidelity Investments Institutional Operations Company, Inc. (FIIOC), an affiliate of FMR, is the transfer, dividend disbursing and shareholder servic ing agent for each class of the fund, except for International Small Cap. Fidelity Service Company, Inc. (FSC), an affiliate of FMR, , is the transfer agent for International Small Cap shares. FIIOC and FSC receive account fees and asset based fees that vary according to the account size and type of account of the shareholders of the respective classes of the fund. FIIOC and FSC pay for typesetting, printing and mailing of shareholder reports, except proxy statements. For the period the total transfer agent fees paid by each class to FIIOC or FSC, were as follows:
| % of | ||||||
| Average | ||||||
| Amount | Net Assets | |||||
| Class A | $ | 93 | .34 | |||
| Class T | 116 | .35 | ||||
| Class B | 47 | .42 | ||||
| Class C | 66 | .34 | ||||
| International Small Cap | 3,874 | .21 | ||||
| Institutional Class | 13 | .23 | ||||
| $ | 4,209 | |||||
Accounting and Security Lending Fees. FSC maintains the fund’s accounting rec ords. The accounting fee is based on the level of average net assets for the month. Under a separate contract, FSC administers the security lending program. The security lending fee is based on the number and duration of lending transactions.
Affiliated Central Funds. The fund may invest in Money Market Central Funds which seek preservation of capital and current income and are managed by Fidelity Invest ments Money Management, Inc. (FIMM), an affiliate of FMR.
49 Annual Report
| Notes to Financial Statements continued (Amounts in thousands except ratios) 4. Fees and Other Transactions with Affiliates continued Affiliated Central Funds continued |
The Central Funds do not pay a management fee. Income distributions earned by the fund are recorded as income in the accompanying financial statements and totaled $5,350 for the period.
Brokerage Commissions. The fund placed a portion of its portfolio transactions with brokerage firms which are affiliates of the investment adviser. The commissions paid to these affiliated firms were $1 for the period.
| 5. Committed Line of Credit. |
The fund participates with other funds managed by FMR in a $4.2 billion credit facility (the “line of credit”) to be utilized for temporary or emergency purposes to fund share holder redemptions or for other short term liquidity purposes. The fund has agreed to pay commitment fees on its pro rata portion of the line of credit. During the period, there were no borrowings on this line of credit.
| 6. Security Lending. |
The fund lends portfolio securities from time to time in order to earn additional income. The fund receives collateral (in the form of U.S. Treasury obligations, letters of credit and/or cash) against the loaned securities and maintains collateral in an amount not less than 100% of the market value of the loaned securities during the period of the loan. The market value of the loaned securities is determined at the close of business of the fund and any additional required collateral is delivered to the fund on the next business day. If the borrower defaults on its obligation to return the securities loaned because of insol vency or other reasons, a fund could experience delays and costs in recovering the securities loaned or in gaining access to the collateral. Cash collateral is invested in the Fidelity Securities Lending Cash Central Fund. The value of loaned securities and cash collateral at period end are disclosed on the fund’s Statement of Assets and Liabilities. Security lending income represents the income earned on investing cash collateral, less fees and expenses associated with the loan, plus any premium payments that may be received on the loan of certain types of securities.
| 7. Expense Reductions. |
FMR voluntarily agreed to reimburse each class to the extent annual operating expenses exceeded certain levels of average net assets as noted in the table below. Some expenses, for example interest expense, are excluded from this reimbursement.
| Annual Report |
| 50 |
| 7. Expense Reductions - continued | ||||||
| The following classes were in reimbursement during the period: | ||||||
| Expense | Reimbursement | |||||
| Limitations | from adviser | |||||
| Class A | 2.05% — 1.65%* | $ | 1 | |||
| Class T | 2.30% — 1.90%* | 4 | ||||
| Class B | 2.80% — 2.40%* | 7 | ||||
| $ | 12 | |||||
| * Expense limitation in effect at period end. | ||||||
Many of the brokers with whom FMR places trades on behalf of the fund provided services to the fund in addition to trade execution. These services included payments of certain expenses on behalf of the fund totaling $625 for the period.In addition, through arrangements with the each class’ transfer agent, credits realized as a result of unin vested cash balances were used to reduce the fund’s expenses. During the period, credits reduced each class’ transfer agent expense as noted in the table below.
| Transfer Agent | ||||
| expense reduction | ||||
| International Small Cap | $ | 9 | ||
| 8. Other. | ||||
The fund’s organizational documents provide former and current trustees and officers with a limited indemnification against liabilities arising in connection with the perfor mance of their duties to the fund. In the normal course of business, the fund may also enter into contracts that provide general indemnifications. The fund’s maximum expo sure under these arrangements is unknown as this would be dependent on future claims that may be made against the fund. The risk of material loss from such claims is consid ered remote.
51 Annual Report
| Notes to Financial Statements continued | ||||||||
| (Amounts in thousands except ratios) | ||||||||
| 9. Distributions to Shareholders. | ||||||||
| Distributions to shareholders of each class were as follows: | ||||||||
| Years ended October 31, | 2005 | 2004 | ||||||
| From net investment income | ||||||||
| Class A | $ | 14 | $ | 3 | ||||
| Class T | — | 3 | ||||||
| Class C | — | 2 | ||||||
| International Small Cap | 3,381 | 732 | ||||||
| Institutional Class | 11 | 1 | ||||||
| Total | $ | 3,406 | $ | 741 | ||||
| From net realized gain | ||||||||
| Class A | $ | 542 | $ | 50 | ||||
| Class T | 602 | 92 | ||||||
| Class B | 221 | 28 | ||||||
| Class C | 359 | 42 | ||||||
| International Small Cap | 43,388 | 11,351 | ||||||
| Institutional Class | 123 | 10 | ||||||
| Total | $ | 45,235 | $ | 11,573 | ||||
| Annual Report |
| 52 |
| 10. Share Transactions. | ||||||||||||
| Transactions for each class of shares were as follows: | ||||||||||||
| Shares | Dollars | |||||||||||
| Years ended October 31, | 2005 | 2004 | 2005 | 2004 | ||||||||
| Class A | ||||||||||||
| Shares sold | 915 | 655 | $ | 22,252 | $ | 12,873 | ||||||
| Reinvestment of distributions | 20 | 3 | 427 | 47 | ||||||||
| Shares redeemed | (255) | (313) | (6,421) | (5,811) | ||||||||
| Net increase (decrease) | 680 | 345 | $ | 16,258 | $ | 7,109 | ||||||
| Class T | ||||||||||||
| Shares sold | 1,286 | 729 | $ | 31,179 | $ | 14,389 | ||||||
| Reinvestment of distributions | 24 | 5 | 531 | 85 | ||||||||
| Shares redeemed | (457) | (246) | (11,453) | (4,796) | ||||||||
| Net increase (decrease) | 853 | 488 | $ | 20,257 | $ | 9,678 | ||||||
| Class B | ||||||||||||
| Shares sold | 415 | 254 | $ | 9,882 | $ | 4,981 | ||||||
| Reinvestment of distributions | 9 | 1 | 199 | 26 | ||||||||
| Shares redeemed | (178) | (72) | (4,336) | (1,405) | ||||||||
| Net increase (decrease) | 246 | 183 | $ | 5,745 | $ | 3,602 | ||||||
| Class C | ||||||||||||
| Shares sold | 680 | 413 | $ | 16,301 | $ | 8,031 | ||||||
| Reinvestment of distributions | 13 | 2 | 272 | 40 | ||||||||
| Shares redeemed | (147) | (81) | (3,591) | (1,590) | ||||||||
| Net increase (decrease) | 546 | 334 | $ | 12,982 | $ | 6,481 | ||||||
| International Small Cap | ||||||||||||
| Shares sold | 51,579 | 48,248 | $ | 1,266,283 | $ | 942,555 | ||||||
| Reinvestment of distributions | 2,008 | 632 | 43,867 | 11,253 | ||||||||
| Shares redeemed | (26,924) | (28,670) | (667,826) | (560,464) | ||||||||
| Net increase (decrease) | 26,663 | 20,210 | $ | 642,324 | $ | 393,344 | ||||||
| Institutional Class | ||||||||||||
| Shares sold | 259 | 181 | $ | 6,323 | $ | 3,602 | ||||||
| Reinvestment of distributions | 3 | 59 | 5 | |||||||||
| Shares redeemed | (105) | (84) | (2,545) | (1,661) | ||||||||
| Net increase (decrease) | 157 | 97 | $ | 3,837 | $ | 1,946 | ||||||
53 Annual Report
Report of Independent Registered Public Accounting Firm
To the Trustees of Fidelity Investment Trust and Shareholders of Fidelity Interna tional Small Cap Fund:
We have audited the accompanying statement of assets and liabilities of Fidelity Interna tional Small Cap Fund (the Fund), a fund of Fidelity Investment Trust, including the schedule of investments, as of October 31, 2005, and the related statement of operations for the year then ended, the statement of changes in net assets for each of the two years in the period then ended, and the financial highlights for each of the four years in the period then ended. These financial statements and financial highlights are the responsibility of the Fund’s management. Our responsibility is to express an opinion on these financial statements and financial highlights based on our audits.
We conducted our audits in accordance with standards of the Public Company Accounting Oversight Board (United States). Those standards require that we plan and perform the audit to obtain reasonable assurance about whether the financial statements and financial highlights are free of material misstatement. The Fund is not required to have, nor were we engaged to perform, an audit of its internal control over financial reporting. Our audits included consideration of internal control over financial reporting as a basis for designing audit procedures that are appropriate in the circumstances, but not for the purpose of expressing an opinion on the effectiveness of the Fund’s internal control over financial reporting. Accordingly, we express no such opinion. An audit also includes examining, on a test basis, evidence supporting the amounts and disclosures in the financial statements, assessing the accounting principles used and significant estimates made by management, as well as evaluating the overall financial statement presentation. Our procedures in cluded confirmation of securities owned as of October 31, 2005, by correspondence with the custodians and brokers; where replies were not received from brokers, we performed other auditing procedures. We believe that our audits provide a reasonable basis for our opinion.
In our opinion, the financial statements and financial highlights referred to above present fairly, in all material respects, the financial position of Fidelity International Small Cap Fund as of October 31, 2005, the results of its operations for the year then ended, the changes in its net assets for each of the two years in the period then ended, and its financial highlights for each of the four years in the period then ended, in conformity with accounting principles generally accepted in the United States of America.
| /s/ Deloitte & Touche LLP DELOITTE & TOUCHE LLP Boston, Massachusetts December 21, 2005 Annual Report 54 |
Trustees and Officers
The Trustees, Members of the Advisory Board, and executive officers of the trust and fund, as applicable, are listed below. The Board of Trustees governs the fund and is responsible for protecting the interests of shareholders. The Trustees are experienced executives who meet periodically throughout the year to oversee the fund’s activities, review contractual arrangements with companies that provide services to the fund, and review the fund’s performance. Except for William O. McCoy, Stephen P. Jonas, and Kenneth L. Wolfe, each of the Trustees oversees 322 funds advised by FMR or an affiliate. Mr. McCoy oversees 324 funds advised by FMR or an affiliate. Mr. Jonas and Mr. Wolfe oversee 319 funds advised by FMR or an affiliate.
The Trustees hold office without limit in time except that (a) any Trustee may resign; (b) any Trustee may be removed by written instrument, signed by at least two thirds of the number of Trustees prior to such removal; (c) any Trustee who requests to be retired or who has become incapacitated by illness or injury may be retired by written instru ment signed by a majority of the other Trustees; and (d) any Trustee may be removed at any special meeting of shareholders by a two thirds vote of the outstanding voting securities of the trust. Each Trustee who is not an interested person (as defined in the 1940 Act) (Independent Trustee), shall retire not later than the last day of the calendar year in which his or her 72nd birthday occurs. The Independent Trustees may waive this mandatory retirement age policy with respect to individual Trustees. The executive officers and Advisory Board Members hold office without limit in time, except that any officer and Advisory Board Member may resign or may be removed by a vote of a majority of the Trustees at any regular meeting or any special meeting of the Trustees. Except as indicated, each individual has held the office shown or other offices in the same company for the past five years.
The fund’s Statement of Additional Information (SAI) includes more information about the Trustees. To request a free copy, call Fidelity at 1-800-544-8544.
| Interested Trustees*: |
Correspondence intended for each Trustee who is an interested person may be sent to Fidelity Investments, 82 Devonshire Street, Boston, Massachusetts 02109.
| Name, Age; Principal Occupation Edward C. Johnson 3d (75)** |
Year of Election or Appointment: 1984
Mr. Johnson is Chairman of the Board of Trustees. Mr. Johnson serves as Chief Executive Officer, Chairman, and a Director of FMR Corp.; a Di rector and Chairman of the Board and of the Executive Committee of FMR; Chairman and a Director of Fidelity Management & Research (Far East) Inc.; Chairman and a Director of Fidelity Investments Money Man agement, Inc.; and Chairman (2001 present) and a Director (2000 present) of FMR Co., Inc.
55 Annual Report
Trustees and Officers - continued
| Name, Age; Principal Occupation Abigail P. Johnson (43)** |
Year of Election or Appointment: 2001
Ms. Johnson serves as President of Fidelity Employer Services Company (FESCO) (2005 present). She is President and a Director of Fidelity In vestments Money Management, Inc. (2001 present), FMR Co., Inc. (2001 present), and a Director of FMR Corp. Previously, Ms. Johnson served as President and a Director of FMR (2001 2005), Senior Vice President of the Fidelity funds (2001 2005), and managed a number of Fidelity funds.
| Stephen P. Jonas (52) |
Year of Election or Appointment: 2005
Mr. Jonas is Senior Vice President of International Small Cap
(2005 present). He also serves as Senior Vice President of other Fidelity funds (2005 present). Mr. Jonas is Executive Director of FMR
(2005 present). Previously, Mr. Jonas served as President of Fidelity En terprise Operations and Risk Services (2004 2005), Chief Administra tive Officer (2002 2004), and Chief Financial Officer of FMR Co. (1998 2000). Mr. Jonas has been with Fidelity Investments since 1987 and has held various financial and management positions including Chief Financial Officer of FMR. In addition, he serves on the Boards of Boston Ballet (2003 present) and Simmons College (2003 present).
| Robert L. Reynolds (53) |
Year of Election or Appointment: 2003
Mr. Reynolds is a Director (2003 present) and Chief Operating Officer (2002 present) of FMR Corp. He also serves on the Board at Fidelity Investments Canada, Ltd. (2000 present). Previously, Mr. Reynolds served as President of Fidelity Investments Institutional Retirement Group (1996 2000).
* Trustees have been determined to be “Interested Trustees” by virtue of, among other things, their affiliation with the trust or various entities under common control with FMR.
** Edward C. Johnson 3d, Trustee, is Abigail P. Johnson’s father.
| Annual Report |
| 56 |
| Independent Trustees: |
Correspondence intended for each Independent Trustee (that is, the Trustees other than the Interested Trustees) may be sent to Fidelity Investments, P.O. Box 55235, Boston, Massachusetts 02205 5235.
| Name, Age; Principal Occupation Dennis J. Dirks (57) |
Year of Election or Appointment: 2005
Prior to his retirement in May 2003, Mr. Dirks was Chief Operating Officer and a member of the Board of The Depository Trust & Clearing Corporation (DTCC) (1999 2003). He also served as President, Chief Operating Officer, and Board member of The Depository Trust Company (DTC) (1999 2003) and President and Board member of the National Securities Clearing Corporation (NSCC) (1999 2003). In addi tion, Mr. Dirks served as Chief Executive Officer and Board member of the Government Securities Clearing Corporation (2001 2003) and Chief Executive Officer and Board member of the Mortgage Backed Securities Clearing Corporation (2001 2003). Mr. Dirks also serves as a Trustee of Manhattan College (2005 present).
| Robert M. Gates (62) |
Year of Election or Appointment: 1997
Dr. Gates is Vice Chairman of the Independent Trustees (2005 present). Dr. Gates is President of Texas A&M University (2002 present). He was Director of the Central Intelligence Agency (CIA) from 1991 to 1993. From 1989 to 1991, Dr. Gates served as Assistant to the President of the United States and Deputy National Security Advisor. Dr. Gates is a Director of NACCO Industries, Inc. (mining and manufacturing), Parker Drilling Co., Inc. (drilling and rental tools for the energy industry, 2001 present), and Brinker International (restaurant management, 2003 present). Previously, Dr. Gates served as a Director of LucasVarity PLC (automotive components and diesel engines), a Director of TRW Inc. (automotive, space, defense, and information technology), and Dean of the George Bush School of Government and Public Service at Texas A&M University (1999 2001). Dr. Gates also is a Trustee of the Forum for International Policy.
57 Annual Report
Trustees and Officers - continued
| Name, Age; Principal Occupation George H. Heilmeier (69) |
Year of Election or Appointment: 2004
Dr. Heilmeier is Chairman Emeritus of Telcordia Technologies (commu nication software and systems), where prior to his retirement, he served as company Chairman and Chief Executive Officer. He currently serves on the Boards of Directors of The Mitre Corporation (systems engineer ing and information technology support for the government), and HRL Laboratories (private research and development, 2004 present). He is Chairman of the General Motors Science & Technology Advisory Board and a Life Fellow of the Institute of Electrical and Electronics Engineers (IEEE) (2000 present). Dr. Heilmeier is a member of the Defense Science Board and the National Security Agency Advisory Board. He is also a member of the National Academy of Engineering, the American Academy of Arts and Sciences, and the Board of Overseers of the School of Engineering and Applied Science of the University of Pennsyl vania. Previously, Dr. Heilmeier served as a Director of TRW Inc. (auto motive, space, defense, and information technology, 1992 2002), Compaq (1994 2002), Automatic Data Processing, Inc. (ADP) (technology based business outsourcing, 1995 2002), INET Technolo gies Inc. (telecommunications network surveillance, 2001 2004), and Teletech Holdings (customer management services). He is the recipient of the 2005 Kyoto Prize in Advanced Technology for his invention of the liquid display.
| Marie L. Knowles (59) |
Year of Election or Appointment: 2001
Prior to Ms. Knowles’ retirement in June 2000, she served as Executive Vice President and Chief Financial Officer of Atlantic Richfield Company (ARCO) (diversified energy, 1996 2000). From 1993 to 1996, she was a Senior Vice President of ARCO and President of ARCO Transportation Company. She served as a Director of ARCO from 1996 to 1998. She currently serves as a Director of Phelps Dodge Corporation (copper mining and manufacturing) and McKesson Corporation (healthcare ser vice, 2002 present). Ms. Knowles is a Trustee of the Brookings Institution and the Catalina Island Conservancy and also serves as a member of the Advisory Board for the School of Engineering of the University of Southern California.
| Annual Report |
| 58 |
| Name, Age; Principal Occupation Ned C. Lautenbach (61) |
Year of Election or Appointment: 2000
Mr. Lautenbach has been a partner of Clayton, Dubilier & Rice, Inc. (private equity investment firm) since September 1998. Previously, Mr. Lautenbach was with the International Business Machines Corporation (IBM) from 1968 until his retirement in 1998. Mr. Lautenbach serves as a Director of Italtel Holding S.p.A. (telecommunications (Milan, Italy), 2004 present) and Eaton Corporation (diversified industrial) as well as the Philharmonic Center for the Arts in Naples, Florida. He also is a member of the Board of Trustees of Fairfield University (2005 present), as well as a member of the Council on Foreign Relations.
| Marvin L. Mann (72) |
Year of Election or Appointment: 1993
Mr. Mann is Chairman of the Independent Trustees (2001 present). He is Chairman Emeritus of Lexmark International, Inc. (computer peripherals), where he served as CEO until April 1998, retired as Chairman May 1999, and remains a member of the Board. Prior to 1991, he held the positions of Vice President of International Business Machines Corporation (IBM) and President and General Manager of various IBM divisions and subsidiaries. He is a member of the Executive Committee of the Independent Director’s Council of the Investment Com pany Institute. In addition, Mr. Mann is a member of the President’s Cabinet at the University of Alabama and the Board of Visitors of the Culverhouse College of Commerce and Business Administration at the University of Alabama.
| William O. McCoy (72) |
Year of Election or Appointment: 1997
Prior to his retirement in December 1994, Mr. McCoy was Vice Chair man of the Board of BellSouth Corporation (telecommunications) and President of BellSouth Enterprises. He is currently a Director of Liberty Corporation (holding company), Duke Realty Corporation (real estate), and Progress Energy, Inc. (electric utility). He is also a partner of Frank lin Street Partners (private investment management firm) and a member of the Research Triangle Foundation Board. In addition, Mr. McCoy served as the Interim Chancellor (1999 2000) and a member of the Board of Visitors for the University of North Carolina at Chapel Hill and currently serves on the Board of Directors of the University of North Carolina Health Care System and the Board of Visitors of the Kenan Flagler Business School (University of North Carolina at Chapel Hill). He also served as Vice President of Finance for the University of North Car olina (16 school system).
59 Annual Report
Trustees and Officers - continued
| Name, Age; Principal Occupation Cornelia M. Small (61) |
Year of Election or Appointment: 2005
Ms. Small is a member (2000 present) and Chairperson (2002 present) of the Investment Committee, and a member (2002 present) of the Board of Trustees of Smith College. Previously, she served as Chief In vestment Officer (1999 2000), Director of Global Equity Investments (1996 1999), and a member of the Board of Directors of Scudder, Stevens & Clark (1990 1997) and Scudder Kemper Investments (1997 1998). In addition, Ms. Small served as Co Chair (2000 2003) of the Annual Fund for the Fletcher School of Law and Diplomacy.
| William S. Stavropoulos (66) |
Year of Election or Appointment: 2001
Mr. Stavropoulos is Chairman of the Board (2000 present) and a Mem ber of the Board of Directors of The Dow Chemical Company. Since joining The Dow Chemical Company in 1967, Mr. Stavropoulos served in numerous senior management positions, including President (1993 2000; 2002 2003), CEO (1995 2000; 2002 2004), and Chair man of the Executive Committee (2000 2004). Currently, he is a Direc tor of NCR Corporation (data warehousing and technology solutions), BellSouth Corporation (telecommunications), Chemical Financial Corpo ration, Maersk Inc. (industrial conglomerate, 2002 present), and Metal mark Capital (private equity investment firm, 2005 present). He also serves as a member of the Board of Trustees of the American Enterprise Institute for Public Policy Research. In addition, Mr. Stavropoulos is a member of The Business Council, J.P. Morgan International Council and the University of Notre Dame Advisory Council for the College of Science.
| Kenneth L. Wolfe (66) |
Year of Election or Appointment: 2005
Mr. Wolfe also serves as a Trustee (2005 present) or Member of the Advisory Board (2004 present) of other investment companies advised by FMR. Prior to his retirement in 2001, Mr. Wolfe was Chairman and Chief Executive Officer of Hershey Foods Corporation (1993 2001). He currently serves as a member of the boards of Adelphia Communica tions Corporation (2003 present), Bausch & Lomb, Inc., and Revlon Inc. (2004 present).
| Annual Report |
| 60 |
Advisory Board Members and Executive Officers:
Correspondence intended for Mr. Gamper may be sent to Fidelity Investments, P.O. Box 55235, Boston, Massachusetts 02205 5235. Correspondence intended for each executive officer and Mr. Lynch may be sent to Fidelity Investments, 82 Devonshire Street, Boston, Massachusetts 02109.
| Name, Age; Principal Occupation Albert R. Gamper, Jr. (63) |
Year of Election or Appointment: 2005
Member of the Advisory Board of Fidelity Investment Trust. Prior to his retirement in December 2004, Mr. Gamper served as Chairman of the Board of CIT Group Inc. (commercial finance). During his tenure with CIT Group Inc. Mr. Gamper served in numerous senior management positions, including Chairman (1987 1989; 1999 2001; 2002 2004), Chief Executive Officer (1987 2004), and President (1989 2002). He currently serves as a member of the Board of Directors of Public Service Enterprise Group (utilities, 2001 present), Chairman of the Board of Governors, Rutgers University (2004 present), and Chairman of the Board of Saint Barnabas Health Care System.
| Peter S. Lynch (61) |
Year of Election or Appointment: 2003
Member of the Advisory Board of Fidelity Investment Trust. Vice Chair man and a Director of FMR, and Vice Chairman (2001 present) and a Director (2000 present) of FMR Co., Inc. Previously, Mr. Lynch served as a Trustee of the Fidelity funds (1990 2003). In addition, he serves as a Trustee of Boston College, Massachusetts Eye & Ear Infirmary, Historic Deerfield, John F. Kennedy Library, and the Museum of Fine Arts of Boston.
| Dwight D. Churchill (51) |
Year of Election or Appointment: 2005
Vice President of International Small Cap. Mr. Churchill also serves as Vice President of certain Equity Funds (2005 present) and certain High Income Funds (2005 present). Previously, he served as Head of Fidelity’s Fixed Income Division (2000 2005), Vice President of Fidelity’s Money Market Funds (2000 2005), Vice President of Fidelity’s Bond Funds, and Senior Vice President of FIMM (2000) and FMR. Mr. Churchill joined Fidelity in 1993 as Vice President and Group Leader of Taxable Fixed Income Investments.
61 Annual Report
Trustees and Officers - continued
| Name, Age; Principal Occupation Eric D. Roiter (56) |
Year of Election or Appointment: 2002
Secretary of International Small Cap. He also serves as Secretary of other Fidelity funds; Vice President, General Counsel, and Secretary of FMR Co., Inc. (2001 present) and FMR; Assistant Secretary of Fidelity Management & Research (U.K.) Inc. (2001 present), Fidelity Manage ment & Research (Far East) Inc. (2001 present), and Fidelity Investments Money Management, Inc. (2001 present). Mr. Roiter is an Adjunct Member, Faculty of Law, at Boston College Law School (2003 present). Previously, Mr. Roiter served as Vice President and Secretary of Fidelity Distributors Corporation (FDC) (1998 2005).
| Stuart Fross (46) |
Year of Election or Appointment: 2003
Assistant Secretary of International Small Cap. Mr. Fross also serves as Assistant Secretary of other Fidelity funds (2003 present), Vice President and Secretary of FDC (2005 present), and is an employee of FMR.
| Christine Reynolds (47) |
Year of Election or Appointment: 2004
President, Treasurer, and Anti Money Laundering (AML) officer of Inter national Small Cap. Ms. Reynolds also serves as President, Treasurer, and AML officer of other Fidelity funds (2004) and is a Vice President (2003) and an employee (2002) of FMR. Before joining Fidelity Invest ments, Ms. Reynolds worked at PricewaterhouseCoopers LLP (PwC) (1980 2002), where she was most recently an audit partner with PwC’s investment management practice.
| Paul M. Murphy (58) |
Year of Election or Appointment: 2005
Chief Financial Officer of International Small Cap. Mr. Murphy also serves as Chief Financial Officer of other Fidelity funds (2005 present). He also serves as Senior Vice President of Fidelity Pricing and Cash Management Services Group (FPCMS).
| Annual Report |
| 62 |
| Name, Age; Principal Occupation Kenneth A. Rathgeber (58) |
Year of Election or Appointment: 2004
Chief Compliance Officer of International Small Cap. Mr. Rathgeber also serves as Chief Compliance Officer of other Fidelity funds (2004) and Executive Vice President of Risk Oversight for Fidelity Investments (2002). Previously, he served as Executive Vice President and Chief Op erating Officer for Fidelity Investments Institutional Services Company, Inc. (1998 2002).
| John R. Hebble (47) |
Year of Election or Appointment: 2003
Deputy Treasurer of International Small Cap. Mr. Hebble also serves as Deputy Treasurer of other Fidelity funds (2003), and is an employee of FMR. Before joining Fidelity Investments, Mr. Hebble worked at Deutsche Asset Management where he served as Director of Fund Accounting (2002 2003) and Assistant Treasurer of the Scudder Funds (1998 2003).
| Bryan A. Mehrmann (44) |
Year of Election or Appointment: 2005
Deputy Treasurer of International Small Cap. Mr. Mehrmann also serves as Deputy Treasurer of other Fidelity funds (2005 present) and is an employee of FMR. Previously, Mr. Mehrmann served as Vice President of Fidelity Investments Institutional Services Group (FIIS)/Fidelity Investments Institutional Operations Corporation, Inc. (FIIOC) Client Services (1998 2004).
| Kimberley H. Monasterio (41) |
Year of Election or Appointment: 2004
Deputy Treasurer of International Small Cap. Ms. Monasterio also serves as Deputy Treasurer of other Fidelity funds (2004) and is an employee of FMR (2004). Before joining Fidelity Investments, Ms. Monasterio served as Treasurer (2000 2004) and Chief Financial Officer (2002 2004) of the Franklin Templeton Funds and Senior Vice President of Franklin Templeton Services, LLC (2000 2004).
| Kenneth B. Robins (36) |
Year of Election or Appointment: 2005
Deputy Treasurer of International Small Cap. Mr. Robins also serves as Deputy Treasurer of other Fidelity funds (2005 present) and is an em ployee of FMR (2004 present). Before joining Fidelity Investments, Mr. Robins worked at KPMG LLP, where he was a partner in KPMG’s de partment of professional practice (2002 2004) and a Senior Manager (1999 2000). In addition, Mr. Robins served as Assistant Chief Accoun tant, United States Securities and Exchange Commission (2000 2002).
63 Annual Report
Trustees and Officers - continued
| Name, Age; Principal Occupation Robert G. Byrnes (38) |
Year of Election or Appointment: 2005
Assistant Treasurer of International Small Cap. Mr. Byrnes also serves as Assistant Treasurer of other Fidelity funds (2005 present) and is an em ployee of FMR (2005 present). Previously, Mr. Byrnes served as Vice President of FPCMS (2003 2005). Before joining Fidelity Investments, Mr. Byrnes worked at Deutsche Asset Management where he served as Vice President of the Investment Operations Group (2000 2003).
| John H. Costello (59) |
Year of Election or Appointment: 2002
Assistant Treasurer of International Small Cap. Mr. Costello also serves as Assistant Treasurer of other Fidelity funds and is an employee of FMR.
| Peter L. Lydecker (51) |
Year of Election or Appointment: 2004
Assistant Treasurer of International Small Cap. Mr. Lydecker also serves as Assistant Treasurer of other Fidelity funds (2004) and is an employee of FMR.
| Mark Osterheld (50) |
Year of Election or Appointment: 2002
Assistant Treasurer of International Small Cap. Mr. Osterheld also serves as Assistant Treasurer of other Fidelity funds (2002) and is an employee of FMR.
| Gary W. Ryan (47) |
Year of Election or Appointment: 2005
Assistant Treasurer of International Small Cap. Mr. Ryan also serves as Assistant Treasurer of other Fidelity funds (2005 present) and is an em ployee of FMR (2005 present). Previously, Mr. Ryan served as Vice Pres ident of Fund Reporting in FPCMS (1999 2005).
| Salvatore Schiavone (39) |
Year of Election or Appointment: 2005
Assistant Treasurer of International Small Cap. Mr. Schiavone also serves as Assistant Treasurer of other Fidelity funds (2005 present) and is an employee of FMR (2005 present). Before joining Fidelity Invest ments, Mr. Schiavone worked at Deutsche Asset Management, where he most recently served as Assistant Treasurer (2003 2005) of the Scudder Funds and Vice President and Head of Fund Reporting (1996 2003).
| Annual Report |
| 64 |
| Distributions |
The Board of Trustees of Fidelity International Small Cap Fund voted to pay to shareholders of record at the opening of business on record date, the following distributions per share derived from capital gains realized from sales of portfolio securities, and dividends derived from net investment income:
| Pay Date | Record Date | Dividends | Capital Gains | |||||
| International | ||||||||
| Small Cap | 12/12/05 | 12/09/05 | $.14 | $2.89 |
The fund hereby designates as capital gain dividends: For dividends with respect to the taxable year ended October 31, 2005, $178,942,337, or, if subsequently determined to be different, the net capital gain of such year, and for dividends with respect to the taxable year ended October 31, 2004, $18,049,009, or, if subsequently determined to be different, the excess of: (a) the net capital gain of such year, over (b) amounts previously designated as capital gain dividends with respect to such year.
International Small Cap designates 43% of the dividends distributed during the fiscal year as amounts which may be taken into account as a dividend for purposes of the maximum rate under section 1(h)(11) of the Internal Revenue Code.
The amounts per share which represent income derived from sources within, and taxes paid to, foreign countries or possessions of the United States are as follows:
| Pay Date | Income | Taxes | ||||
| International | ||||||
| Small Cap | 12/13/04 | $.142 | $.019 |
The fund will notify shareholders in January 2006 of amounts for use in preparing 2005 income tax returns.
65 Annual Report
Board Approval of Investment Advisory Contracts and Management Fees
Fidelity International Small Cap Fund
Each year, typically in July, the Board of Trustees, including the independent Trustees (together, the Board), votes on the renewal of the management contract and sub advisory agreements (together, the Advisory Contracts) for the fund. The Board, assisted by the advice of fund counsel and independent Trustees’ counsel, requests and considers a broad range of information throughout the year.
The Board meets regularly each month except August and takes into account throughout the year matters bearing on Advisory Contracts. The Board, acting directly and through its separate committees, considers at each of its meetings factors that are relevant to the annual renewal of the fund’s Advisory Contracts, including the services and support provided to the fund and its shareholders by Fidelity. At the time of the renewal, the Board had 11 standing committees, each composed of independent Trustees with varying backgrounds, to which the Board has assigned specific subject matter responsibilities in order to enhance effective decision making by the Board. Each committee has adopted a written charter outlining the structure and purposes of the committee. One such com mittee, the Equity Contract Committee, meets periodically during the first six months of each year and as necessary to consider matters specifically related to the annual renewal of Advisory Contracts. The committee requests and receives information on, and makes recommendations to the independent Trustees concerning, the approval and annual review of the Advisory Contracts.
At its July 2005 meeting, the Board of Trustees, including the independent Trustees, unanimously determined to renew the Advisory Contracts for the fund. In reaching its determination, the Board considered all factors it believed relevant, including (1) the nature, extent, and quality of the services to be provided to the fund and its shareholders by Fidelity (including the investment performance of the fund); (2) the competitiveness of the management fee and total expenses of the fund; (3) the total costs of the services to be provided by and the profits to be realized by the investment adviser and its affiliates from the relationship with the fund; (4) the extent to which economies of scale would be realized as the fund grows; and (5) whether fee levels reflect these economies of scale, if any, for the benefit of fund shareholders.
In determining whether to renew the Advisory Contracts for the fund, the Board ulti mately reached a determination, with the assistance of fund counsel and independent Trustees’ counsel, that the renewal of the Advisory Contracts and the compensation to be received by Fidelity under the management contract is consistent with Fidelity’s fidu ciary duty under applicable law. In addition to evaluating the specific factors noted above, the Board, in reaching its determination, is aware that shareholders in the fund have a broad range of investment choices available to them, including a wide choice among mutual funds offered by competitors to Fidelity, and that the fund’s shareholders, with the opportunity to review and weigh the disclosure provided by the fund in its
| Annual Report |
| 66 |
prospectus and other public disclosures, have chosen to invest in this fund, managed by Fidelity.
Nature, Extent, and Quality of Services Provided by Fidelity. The Board consid ered staffing within the investment adviser, FMR, and the sub advisers (together, the Investment Advisers), including the backgrounds of the fund’s portfolio managers and the fund’s investment objective and discipline. The independent Trustees also had discussions with senior management of Fidelity’s investment operations and investment groups. The Board considered the structure of the portfolio manager compensation program and whether this structure provides appropriate incentives.
Fidelity Resources Dedicated to Investment Management and Support Services. The Board reviewed the size, education, and experience of the Investment Advisers’ invest ment staff, their use of technology, and the Investment Advisers’ approach to recruiting, training, and retaining portfolio managers and other research, advisory, and manage ment personnel. The Board considered Fidelity’s extensive global research capabilities that enable the Investment Advisers to aggregate data from various sources in an effort to produce positive investment results. The Board noted that Fidelity’s analysts have access to a variety of technological tools that enable them to perform both fundamental and quantitative analysis and to specialize in various disciplines. The Board also considered that Fidelity’s portfolio managers and analysts have access to daily portfolio attribution that allows for monitoring of a fund’s portfolio, as well as an electronic communication system that provides immediate real time access to research concerning issuers and credit enhancers.
Shareholder and Administrative Services. The Board considered the nature, extent, quality, and cost of administrative, distribution, and shareholder services performed by the Investment Advisers and their affiliates under the Advisory Contracts and under separate agreements covering transfer agency, pricing and bookkeeping, and securities lending services for the fund. The Board also considered the nature and extent of the Investment Advisers’ supervision of third party service providers, principally custodians and subcustodians. The Board reviewed the allocation of fund brokerage, including allocations to brokers affiliated with the Investment Advisers, the use of brokerage commissions to pay fund expenses, and the use of “soft” commission dollars to pay for research services. The Board also considered that Fidelity voluntarily decided in 2004 to stop using “soft” commission dollars to pay for market data and, instead, to pay for that data out of its own resources. The Board also considered the resources devoted to, and the record of compliance with, the fund’s compliance policies and procedures.
The Board noted that the growth of fund assets across the complex allows Fidelity to reinvest in the development of services designed to enhance the value or convenience of the Fidelity funds as investment vehicles. These services include 24 hour access to
67 Annual Report
Board Approval of Investment Advisory Contracts and Management Fees continued
account information and market information through phone representatives and over the Internet, and investor education materials and asset allocation tools.
Investment in a Large Fund Family. The Board considered the benefits to shareholders of investing in a Fidelity fund, including the benefits of investing in a fund that is part of a large family of funds offering a variety of investment disciplines and providing for a large variety of mutual fund investor services. For example, fund shareholders are offered the privilege of exchanging shares of the fund for shares of other Fidelity funds, as set forth in the fund’s prospectus, without paying an additional sales charge. The Board noted that, since the last Advisory Contract renewals in July 2004, Fidelity has taken a number of actions that benefited particular funds, including (i) voluntarily deciding in 2004 to stop using “soft” commission dollars to pay for market data and, instead, to pay for that data out of its own resources, (ii) contractually agreeing to impose management fee reductions and expense limitations on its five Spartan stock index funds and its stock index fund available through variable insurance products, (iii) contractually agreeing to eliminate the management fees on the Fidelity Freedom Funds and the Fidelity Advisor Freedom Funds, (iv) contractually agreeing to reduce the management fees on most of its investment grade taxable bond funds, and (v) contractually agreeing to impose expense limitations on its retail and Spartan investment grade taxable bond funds.
Investment Performance and Compliance. The Board considered whether the fund has operated within its investment objective, as well as its record of compliance with its investment restrictions. It also reviewed the fund’s absolute investment performance for each class, as well as the fund’s relative investment performance for each class measured against (i) a broad based securities market index, and (ii) a peer group of mutual funds deemed appropriate by the Board over multiple periods. Because the fund had been in existence less than three calendar years, the following chart considered by the Board shows, for the one year period ended December 31, 2004, the returns of Class C and the retail class of the fund, the return of a broad based securities market index (“bench mark”), and a range of returns of a peer group of mutual funds identified by Lipper Inc. as having an investment objective similar to that of the fund. The returns of Class C and the retail class represent the performance of classes with the highest and lowest 12b 1 fees, respectively (not necessarily with the highest and lowest total expenses). The box within the chart shows the 25th percentile return (bottom of box) and the 75th percen tile return (top of box) of the Lipper peer group. Returns shown above the box are in the first quartile and returns shown below the box are in the fourth quartile. The percentage beaten numbers noted below the chart correspond to the percentile box and represent the percentage of funds in the Lipper peer group whose performance was equal to or lower than that of the class indicated.
| Annual Report |
| 68 |

The Board reviewed the fund’s relative investment performance against its Lipper peer group and stated that the performance of the retail class of the fund was in the second quartile for the one year period. The Board also stated that the relative investment performance of the fund was lower than its benchmark for the one year period. The Board considered that the variations in performance among the fund’s classes reflect the variations in class expenses, which result in lower performance for higher expense classes. The Board stated that it is difficult to evaluate in any comprehensive fashion the performance of the fund, in light of its relatively recent launch.
The Board also considered that the fund’s management fee is subject to upward or downward adjustment depending upon whether, and to what extent, the fund’s invest ment performance for the performance period exceeds, or is exceeded by, the record (over the same period) of a Board approved performance adjustment index. The Board realizes that the performance adjustment provides FMR with a strong economic incen tive to seek to achieve superior performance for the fund’s shareholders and helps to more closely align the interests of FMR and the fund’s shareholders.
The Board has had thorough discussions with FMR throughout the year about the Board’s and FMR’s concerns about equity research, equity fund performance, and compliance with internal policies governing gifts and entertainment. FMR has taken steps that it believes will refocus and strengthen equity research and equity portfolio management and compliance. The Board noted with favor FMR’s recent reorganization of its senior management team and FMR’s plans to dedicate additional resources to investment research, and participated in the process that led to those changes.
69 Annual Report
Board Approval of Investment Advisory Contracts and Management Fees continued
Based on its review, and giving particular weight to the nature and quality of the resources dedicated by the Investment Advisers to maintain and improve relative performance, the Board concluded that the nature, extent, and quality of the services provided by Fidelity will benefit the fund’s shareholders, particularly in light of the Board’s view that the fund’s shareholders benefit from investing in a fund that is part of a large family of funds offering a variety of investment disciplines and services.
Competitiveness of Management Fee and Total Fund Expenses. The Board considered the fund’s management fee and total expenses compared to “mapped groups” of competitive funds and classes. Fidelity creates “mapped groups” by combining similar Lipper investment objective categories that have comparable management fee charac teristics. Combining Lipper investment objective categories aids the Board’s manage ment fee and total expense comparisons by broadening the competitive group used for comparison and by reducing the number of universes to which various Fidelity funds are compared.
The Board considered two proprietary management fee comparisons for the 12 month (or shorter) periods shown in the chart below. The group of Lipper funds used by the Board for management fee comparisons is referred to below as the “Total Mapped Group” and, for the reasons explained above, is broader than the Lipper peer group used by the Board for performance comparisons. The Total Mapped Group comparison focuses on a fund’s standing relative to the total universe of comparable funds available to investors, in terms of gross management fees before expense reimbursements or caps. “TMG %” represents the percentage of funds in the Total Mapped Group that had management fees that were lower than the fund’s. For example, a TMG % of 42% means that 58% of the funds in the Total Mapped Group had higher management fees than the fund. The “Asset Size Peer Group” (ASPG) comparison focuses on a fund’s standing relative to non Fidelity funds similar in size to the fund within the Total Mapped Group. The ASPG represents at least 15% of the funds in the Total Mapped Group with comparable asset size and management fee characteristics, subject to a minimum of 50 funds (or all funds in the Total Mapped Group if fewer than 50). Additional information, such as the ASPG quartile (“quadrant”) in which the fund’s management fee ranked and the impact of the fund’s performance adjustment, is also included in the chart and considered by the Board.
| Annual Report |
| 70 |

The Board noted that the fund’s management fee ranked below the median of its Total Mapped Group and below the median of its ASPG for 2004. The Board also noted the effect of the fund’s positive performance adjustment on the fund’s management fee ranking.
Based on its review, the Board concluded that the fund’s management fee was fair and reasonable in light of the services that the fund receives and the other factors considered.
In its review of each class’s total expenses, the Board considered the fund’s management fee as well as other fund or class expenses, as applicable, such as transfer agent fees, pricing and bookkeeping fees, fund paid 12b 1 fees, and custodial, legal, and audit fees. The Board also noted the effects of any waivers and reimbursements on fees and expenses, as well as the fund’s positive performance adjustment. As part of its review, the Board also considered current and historical total expenses of each class of the fund compared to competitive fund median expenses. Each class of the fund is compared to those funds and classes in the Total Mapped Group (used by the Board for management fee comparisons) that have a similar sales load structure.
The Board noted that the total expenses of Fidelity International Small Cap Fund (retail class) ranked below its competitive median for 2004, and the total expenses of each of Class A, Class B, Class C, Class T and Institutional Class ranked above its competitive median for 2004. The Board considered that the Advisor classes were above median due in part to the fund’s higher management fee associated with the fund’s small cap invest ment discipline. The Board noted that the fund offers multiple classes, each of which has a different sales load and 12b 1 fee structure, and that the multiple structures are
71 Annual Report
Board Approval of Investment Advisory Contracts and Management Fees continued
intended to offer a range of pricing options for the intermediary market. The Board also noted that the total expenses of the classes vary primarily by the level of their 12b 1 fees, although differences in transfer agent fees may also cause expenses to vary from class to class.
Furthermore, the Board considered that on December 16, 2004, it had approved changes (effective January 1, 2005) in the transfer agent and service agreements for the fund that established maximum transfer agent fees and eliminated the minimum pricing and bookkeeping fee to prevent small funds or funds with small average account sizes from having relatively high fees in basis points (the “small fund fee reductions”). The Board considered that, if the small fund fee reductions had been in effect in 2004, the total expenses of Class A would have ranked below the median.
In its review of total expenses, the Board also considered Fidelity fee structures and other information on clients that FMR and its affiliates service in other competitive markets, such as other mutual funds advised or subadvised by FMR or its affiliates, pension plan clients, and other institutional clients.
Based on its review, the Board concluded that the total expenses for each class of the fund were reasonable, although in some cases above the median of the universe presented for comparison, in light of the services that the fund and its shareholders receive and the other factors considered.
Costs of the Services and Profitability. The Board considered the revenues earned and the expenses incurred by Fidelity in conducting the business of developing, market ing, distributing, managing, administering and servicing the fund and its shareholders. The Board also considered the level of Fidelity’s profits in respect of all the Fidelity funds.
On an annual basis, FMR presents to the Board Fidelity’s profitability for the fund. Fidelity calculates the profitability for each fund, as well as aggregate profitability for groups of Fidelity funds and all Fidelity funds, using a series of detailed revenue and cost allocation methodologies which originate with the audited books and records of Fidelity. The Audit Committee of the Board reviews any significant changes from the prior year’s methodologies.
PricewaterhouseCoopers LLP (PwC), independent registered accounting firm and auditor to Fidelity and certain Fidelity funds, has been engaged annually by the Board as part of the Board’s assessment of the results of Fidelity’s profitability analysis. PwC’s engagement includes the review and assessment of Fidelity’s methodologies used in determining the revenues and expenses attributable to Fidelity’s mutual fund business, and completion of agreed upon procedures surrounding the mathematical accuracy of fund profitability and its conformity to allocation methodologies. After considering PwC’s reports issued under the engagement and information provided by Fidelity, the Board
| Annual Report |
| 72 |
believes that while other allocation methods may also be reasonable, Fidelity’s profitability methodologies are reasonable in all material respects.
The Board has also reviewed Fidelity’s non fund businesses and any fall out benefits related to the mutual fund business as well as cases where Fidelity’s affiliates may benefit from or be related to the fund’s business. In addition, a special committee of the Board reviewed services provided to Fidelity by its affiliates and determined that the fees that Fidelity paid for such services were reasonable.
The Board considered the costs of the services provided by and the profits realized by Fidelity in connection with the operation of the fund and determined that the amount of profit is a fair entrepreneurial profit for the management of the fund.
Economies of Scale. The Board considered whether there have been economies of scale in respect of the management of the Fidelity funds, whether the Fidelity funds (including the fund) have appropriately benefited from any such economies of scale, and whether there is potential for realization of any further economies of scale. The Board considered the extent to which the fund will benefit from economies of scale through increased services to the fund, through waivers or reimbursements, or through fee or expense reductions, including reductions that occur through operation of the transfer agent agreement. The transfer agent fee varies in part based on the number of accounts in the fund. If the number of accounts decreases or the average account size increases, the overall transfer agent fee rate decreases.
The Board recognized that the fund’s management contract incorporates a “group fee” structure, which provides for lower fee rates as total fund assets under FMR’s manage ment increase, and for higher fee rates as total fund assets under FMR’s management decrease. The Board considered that the group fee is designed to deliver the benefits of economies of scale to fund shareholders when total fund assets increase, even if assets of any particular fund are unchanged or have declined, because some portion of Fidelity’s costs are attributable to services provided to all Fidelity funds, and all funds benefit if those costs can be allocated among more assets. The Board concluded that, given the group fee structure, fund shareholders will achieve a certain level of economies of scale as assets under FMR’s management increase at the fund complex level, regardless of whether Fidelity achieves any such economies of scale.
The Board further concluded that any potential economies of scale are being shared between fund shareholders and Fidelity in an appropriate manner.
Additional Information Requested by the Board. In order to develop fully the factual basis for consideration of the Advisory Contracts, the Board requested additional information regarding (i) equity fund transfer agency fees; (ii) Fidelity’s fund profitability methodology and the impact of various changes in the methodology over time; (iii) benefits to shareholders from economies of scale; (iv) composition and
73 Annual Report
Board Approval of Investment Advisory Contracts and Management Fees continued
characteristics of various fund and industry data used in comparisons; and (v) compensation of portfolio managers and research analysts.
Based on its evaluation of all of the conclusions noted above, and after considering all material factors, the Board ultimately concluded that the existing advisory fee structures are fair and reasonable, and that the fund’s existing Advisory Contracts should be renewed.
| Annual Report |
| 74 |
Managing Your Investments
Fidelity offers several ways to conveniently manage your personal investments via your telephone or PC. You can access your account information, conduct trades and research your investments 24 hours a day.
By Phone
Fidelity Automated Service Telephone provides a single toll free number to access account balances, positions, quotes and trading. It’s easy to navigate the service, and on your first call, the system will help you create a personal identification number (PIN) for security.


By PC
Fidelity’s web site on the Internet provides a wide range of information, including daily financial news, fund performance, interactive planning tools and news about Fidelity products and services.

* When you call the quotes line, please remember that a fund’s yield and return will vary and, except for money market funds, share price will also vary. This means that you may have a gain or loss when you sell your shares. There is no assurance that money market funds will be able to maintain a stable $1 share price; an investment in a money market fund is not insured or guar anteed by the U.S. government. Total returns are historical and include changes in share price, reinvestment of dividends and capital gains, and the effects of any sales charges.
75 Annual Report
To Visit Fidelity
| For directions and hours, please call 1 800 544 9797. Arizona 7001 West Ray Road Chandler, AZ 7373 N. Scottsdale Road Scottsdale, AZ California 815 East Birch Street Brea, CA 1411 Chapin Avenue Burlingame, CA 851 East Hamilton Avenue Campbell, CA 19200 Von Karman Avenue Irvine, CA 601 Larkspur Landing Circle Larkspur, CA 10100 Santa Monica Blvd. Los Angeles, CA 27101 Puerta Real Mission Viejo, CA 73 575 El Paseo Palm Desert, CA 251 University Avenue Palo Alto, CA 123 South Lake Avenue Pasadena, CA 16995 Bernardo Ctr. Drive Rancho Bernardo, CA 1740 Arden Way Sacramento, CA 7676 Hazard Center Drive San Diego, CA 8 Montgomery Street San Francisco, CA 3793 State Street Santa Barbara, CA 21701 Hawthorne Boulevard Torrance, CA 2001 North Main Street Walnut Creek, CA 6300 Canoga Avenue Woodland Hills, CA |
| Colorado 1625 Broadway Denver, CO 9185 East Westview Road Littleton, CO Connecticut 48 West Putnam Avenue Greenwich, CT 265 Church Street New Haven, CT 300 Atlantic Street Stamford, CT 29 South Main Street West Hartford, CT Delaware 222 Delaware Avenue Wilmington, DE Florida 4400 N. Federal Highway Boca Raton, FL 121 Alhambra Plaza Coral Gables, FL 2948 N. Federal Highway Ft. Lauderdale, FL 1907 West State Road 434 Longwood, FL 8880 Tamiami Trail, North Naples, FL 3550 Tamiami Trail, South Sarasota, FL 1502 N. Westshore Blvd. Tampa, FL 2465 State Road 7 Wellington, FL 3501 PGA Boulevard West Palm Beach, FL Georgia 3445 Peachtree Road, N.E Atlanta, GA 1000 Abernathy Road Atlanta, GA Illinois One North LaSalle Street Chicago, IL 875 North Michigan Ave. Chicago, IL 1415 West 22nd Street Oak Brook, IL |
| 1700 East Golf Road Schaumburg, IL 3232 Lake Avenue Wilmette, IL Indiana 4729 East 82nd Street Indianapolis, IN Kansas 5400 College Boulevard Overland Park, KS Maine Three Canal Plaza Portland, ME Maryland 7315 Wisconsin Avenue Bethesda, MD One W. Pennsylvania Ave. Towson, MD Massachusetts 801 Boylston Street Boston, MA 155 Congress Street Boston, MA 300 Granite Street Braintree, MA 44 Mall Road Burlington, MA 405 Cochituate Road Framingham, MA 416 Belmont Street Worcester, MA Michigan 500 E. Eisenhower Pkwy. Ann Arbor, MI 280 Old N. Woodward Ave. Birmingham, MI 43420 Grand River Avenue Novi, MI 29155 Northwestern Hwy. Southfield, MI Minnesota 7600 France Avenue South Edina, MN Missouri 8885 Ladue Road Ladue, MO |
Annual Report 76
| Nevada 2225 Village Walk Drive Henderson, NV New Jersey 150 Essex Street Millburn, NJ 56 South Street Morristown, NJ 396 Route 17, North Paramus, NJ 3518 Route 1 North Princeton, NJ 530 Highway 35 Shrewsbury, NJ New York 1055 Franklin Avenue Garden City, NY 37 West Jericho Turnpike Huntington Station, NY 1271 Avenue of the Americas New York, NY 61 Broadway New York, NY 350 Park Avenue New York, NY 200 Fifth Avenue New York, NY 733 Third Avenue New York, NY 11 Penn Plaza New York, NY 2070 Broadway New York, NY 1075 Northern Blvd. Roslyn, NY North Carolina 4611 Sharon Road Charlotte, NC Ohio 3805 Edwards Road Cincinnati, OH 1324 Polaris Parkway Columbus, OH 28699 Chagrin Boulevard Woodmere Village, OH Oregon 16850 SW 72nd Avenue Tigard, OR |
| Pennsylvania 600 West DeKalb Pike King of Prussia, PA 1735 Market Street Philadelphia, PA 12001 Perry Highway Wexford, PA Rhode Island 47 Providence Place Providence, RI Tennessee 6150 Poplar Avenue Memphis, TN Texas 10000 Research Boulevard Austin, TX 4001 Northwest Parkway Dallas, TX 12532 Memorial Drive Houston, TX 2701 Drexel Drive Houston, TX 6500 N. MacArthur Blvd. Irving, TX 6005 West Park Boulevard Plano, TX 14100 San Pedro San Antonio, TX 1576 East Southlake Blvd. Southlake, TX 19740 IH 45 North Spring, TX Utah 215 South State Street Salt Lake City, UT Virginia 1861 International Drive McLean, VA Washington 411 108th Avenue, N.E. Bellevue, WA 1518 6th Avenue Seattle, WA Washington, DC 1900 K Street, N.W. Washington, DC Wisconsin 595 North Barker Road Brookfield, WI |
Fidelity Brokerage Services, Inc., 100 Summer St., Boston, MA 02110 Member NYSE/SIPC
77 Annual Report
77
To Write Fidelity
We’ll give your correspondence immediate attention and send you written confirmation upon completion of your request.

| (such as changing name, address, bank, etc.) Fidelity Investments P.O. Box 770001 Cincinnati, OH 45277-0002 |

| Buying shares Fidelity Investments P.O. Box 770001 Cincinnati, OH 45277-0003 Overnight Express Fidelity Investments Attn: Distribution Services 100 Crosby Parkway KC1H Covington, KY 41015 Selling shares Fidelity Investments P.O. Box 770001 Cincinnati, OH 45277-0035 Overnight Express Fidelity Investments Attn: Distribution Services 100 Crosby Parkway KC1H Covington, KY 41015 General Correspondence Fidelity Investments P.O. Box 500 Merrimack, NH 03054-0500 |

| Buying shares Fidelity Investments P.O. Box 770001 Cincinnati, OH 45277-0003 Selling shares Fidelity Investments P.O. Box 770001 Cincinnati, OH 45277-0035 Overnight Express Fidelity Investments Attn: Distribution Services 100 Crosby Parkway KC1H Covington, KY 41015 General Correspondence Fidelity Investments P.O. Box 500 Merrimack, NH 03054-0500 |
Annual Report 78
79 Annual Report
| Investment Adviser Fidelity Management & Research Company Boston, MA Investment Sub Advisers FMR Co., Inc. Fidelity Management & Research (U.K.) Inc. Fidelity Management & Research (Far East) Inc. Fidelity International Investment Advisors Fidelity Investments Japan Limited Fidelity International Investment Advisors (U.K.) Limited General Distributor Fidelity Distributors Corporation Boston, MA Transfer and Service Agent Fidelity Service Company, Inc. Boston, MA Custodian Mellon Bank Pittsburgh, PA |
| The Fidelity Telephone Connection | ||
| Mutual Fund 24-Hour Service | ||
| Exchanges/Redemptions | ||
| and Account Assistance | 1-800-544-6666 | |
| Product Information | 1-800-544-8888 | |
| Retirement Accounts | 1-800-544-4774 | |
| (8 a.m. - 9 p.m.) | ||
| TDD Service | 1 800 544 0118 | |
| for the deaf and hearing impaired | ||
| (9 a.m. - 9 p.m. Eastern time) | ||
| Fidelity Automated Service | ||
| Telephone (FAST®) (automated phone logo) | 1-800-544-5555 | |
| (automated phone logo) Automated line for quickest service | ||
| ISC UANN-1205 1.793584.102 |


| Fidelity Advisor International Small Cap Fund - Class A, Class T, Class B and Class C |
| Annual Report October 31, 2005 |

| Class A, Class T, Class B, and Class C are classes of Fidelity® International Small Cap Fund |
| Contents | ||||
| Chairman’s Message | 4 | Ned Johnson’s message to shareholders. | ||
| Performance | 5 | How the fund has done over time. | ||
| Management’s Discussion | 7 | The managers’ review of fund | ||
| performance, strategy and outlook. | ||||
| Shareholder Expense | 8 | An example of shareholder expenses. | ||
| Example | ||||
| Investment Changes | 10 | A summary of major shifts in the fund’s | ||
| investments over the past six months. | ||||
| Investments | 12 | A complete list of the fund’s investments | ||
| with their market values. | ||||
| Financial Statements | 35 | Statements of assets and liabilities, | ||
| operations, and changes in net assets, | ||||
| as well as financial highlights. | ||||
| Notes | 45 | Notes to the financial statements. | ||
| Report of Independent | 55 | |||
| Registered Public | ||||
| Accounting Firm | ||||
| Trustees and Officers | 56 | |||
| Distributions | 66 | |||
| Board Approval of | 67 | |||
| Investment Advisory | ||||
| Contracts and | ||||
| Management Fees | ||||
| To view a fund’s proxy voting guidelines and proxy voting record for the 12 month period ended June 30, visit www.fidelity.com/proxyvotingresults or visit the Securities and Exchange Commis sion’s (SEC) web site at www.sec.gov. You may also call 1-877-208-0098 to request a free copy of the proxy voting guidelines. Standard & Poor’s, S&P and S&P 500 are registered service marks of The McGraw Hill Com panies, Inc. and have been licensed for use by Fidelity Distributors Corporation. Other third party marks appearing herein are the property of their respective owners. All other marks appearing herein are registered or unregistered trademarks or service marks of FMR Corp. or an affiliated company. |
| Annual Report |
| 2 |
| This report and the financial statements contained herein are submitted for the general informa tion of the shareholders of the fund. This report is not authorized for distribution to prospective investors in the fund unless preceded or accompanied by an effective prospectus. A fund files its complete schedule of portfolio holdings with the SEC for the first and third quarters of each fiscal year on Form N Q. Forms N Q are available on the SEC’s web site at http://www.sec.gov. A fund’s Forms N Q may be reviewed and copied at the SEC’s Public Reference Room in Washington, DC. Information regarding the operation of the SEC’s Public Reference Room may be obtained by calling 1-800-SEC-0330. For a complete list of a fund’s portfolio hold ings, view the most recent quarterly holdings report, semiannual report, or annual report on Fidelity’s web site at http://www.advisor.fidelity.com. NOT FDIC INSURED · MAY LOSE VALUE · NO BANK GUARANTEE Neither the fund nor Fidelity Distributors Corporation is a bank. |
3 Annual Report
Chairman’s Message
(photograph of Edward C. Johnson 3d)
Dear Shareholder:
During the past year or so, much has been reported about the mutual fund industry, and much of it has been more critical than I believe is warranted. Allegations that some companies have been less than forthright with their shareholders have cast a shadow on the entire industry. I continue to find these reports disturbing, and assert that they do not create an accurate picture of the industry overall. Therefore, I would like to remind every one where Fidelity stands on these issues. I will say two things specifically regarding allegations that some mutual fund companies were in violation of the Securities and Exchange Commission’s forward pricing rules or were involved in so called “market timing” activities.
First, Fidelity has no agreements that per mit customers who buy fund shares after 4 p.m. to obtain the 4 p.m. price. This is not a new policy. This is not to say that some one could not deceive the company through fraudulent acts. However, we are extremely diligent in preventing fraud from occurring in this manner and in every other. But I underscore again that Fidelity has no so called “agreements” that sanction illegal practices.
Second, Fidelity continues to stand on record, as we have for years, in opposition to predatory short term trading that adversely affects shareholders in a mutual fund. Back in the 1980s, we initiated a fee which is returned to the fund and, therefore, to investors to discourage this activity. Further, we took the lead several years ago in developing a Fair Value Pricing Policy to prevent market timing on foreign securities in our funds. I am confident we will find other ways to make it more difficult for predatory traders to operate. However, this will only be achieved through close cooperation among regulators, legislators and the industry.
Yes, there have been unfortunate instances of unethical and illegal activity within the mutual fund industry from time to time. That is true of any industry. When this occurs, confessed or convicted offenders should be dealt with appropriately. But we are still concerned about the risk of over regulation and the quick application of simplistic solutions to intricate problems. Every system can be improved, and we support and applaud well thought out improvements by regulators, legislators and industry representatives that achieve the common goal of building and protecting the value of investors’ holdings.
For nearly 60 years, Fidelity has worked very hard to improve its products and service to justify your trust. When our family founded this company in 1946, we had only a few hundred customers. Today, we serve more than 18 million customers in cluding individual investors and participants in retirement plans across America.
Let me close by saying that we do not take your trust in us for granted, and we realize that we must always work to improve all aspects of our service to you. In turn, we urge you to continue your active par ticipation with your financial matters, so that your interests can be well served.
Best regards,
/s/ Edward C. Johnson 3rd
Edward C. Johnson 3d
Annual Report 4
| Fidelity Advisor International Small Cap Fund Class A, T, B, and C Performance: The Bottom Line |
Average annual total return reflects the change in the value of an investment, assuming reinvestment of the class’ dividend income and capital gains (the profits earned upon the sale of securities that have grown in value) and assuming a constant rate of performance each year. The $10,000 table and the fund’s returns do not reflect the deduction of taxes that a shareholder would pay on fund distributions or the redemption of fund shares. During periods of reimbursement by Fidelity, a fund’s total return will be greater than it would be had the reimbursement not occurred. How a fund did yesterday is no guarantee of how it will do tomorrow.
| Average Annual Total Returns | ||||
| Periods ended October 31, 2005 | Past 1 | Life of | ||
| year | FundA | |||
| Class A (incl. 5.75% sales charge)B | 22.67% | 36.82% | ||
| Class T (incl. 3.50% sales charge)C | 25.18% | 37.58% | ||
| Class B (incl. contingent deferred sales charge)D | 24.13% | 38.01% | ||
| Class C (incl. contingent deferred sales charge)E | 28.22% | 38.65% |
| A From September 18, 2002. B Class A shares bear a 0.25% 12b 1 fee. The initial offering of Class A shares took place on May 27, 2003. Returns prior to May 27, 2003 are those of International Small Cap, the original class of the fund, which has no 12b 1 fee. Had Class A shares’ 12b 1 fee been reflected, returns prior to May 27, 2003 would have been lower. C Class T shares bear a 0.50% 12b 1 fee. The initial offering of Class T shares took place on May 27, 2003. Returns prior to May 27, 2003 are those of International Small Cap, the original class of the fund, which has no 12b 1 fee. Had Class T shares’ 12b 1 fee been reflected, returns prior to May 27, 2003 would have been lower. D Class B shares bear a 1.00% 12b 1 fee. The initial offering of Class B shares took place on May 27, 2003. Returns prior to May 27, 2003 are those of International Small Cap, the original class of the fund, which has no 12b 1 fee. Had Class B shares’ 12b 1 fee been reflected, returns prior to May 27, 2003 would have been lower. Class B shares’ contingent deferred sales charge included in the past one year, and life of fund total return figures are 5% and 3%, respectively. E Class C shares bear a 1.00% 12b 1 fee. The initial offering of Class C shares took place on May 27, 2003. Returns prior to May 27, 2003 are those of International Small Cap, the original class of the fund, which has no 12b 1 fee. Had Class C shares’ 12b 1 fee been reflected, returns prior to May 27, 2003 would have been lower. Class C shares’ contingent deferred sales charge included in the past one year, and life of fund total return figures are 1% and 0%, respectively. |
5 Annual Report
$10,000 Over Life of Fund
Let’s say hypothetically that $10,000 was invested in Fidelity Advisor International Small Cap Fund Class T on September 18, 2002, when the fund started, and the current 3.50% sales charge was paid. The chart shows how the value of your investment would have changed, and also shows how the MSCI® EAFE® Small Cap Index performed over the same period.
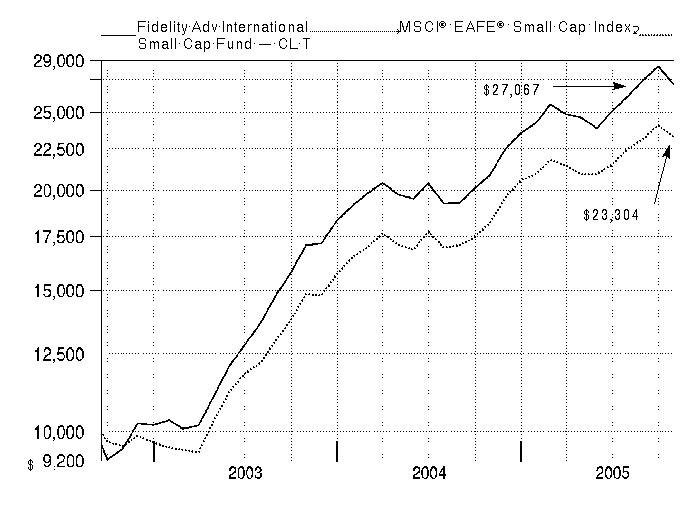
Annual Report 6
Management’s Discussion of Fund Performance
Comments from Tokuya Sano, Ben Paton and Wilson Wong, Co Portfolio Manag ers of Fidelity Advisor International Small Cap Fund. Wilson Wong became a co manager on July 1, 2005.
Foreign stock markets enjoyed broad based advances for the year ending October 31, 2005, encouraged by better than expected corporate earnings and markedly improved economies. For the 12 months overall, the Morgan Stanley Capital InternationalSM Europe, Australasia, Far East (MSCI® EAFE®) Index a performance measure of developed stock markets outside the United States and Canada gained 18.28% . The Japanese stock market climbed to its highest level in more than four years. Positive economic indicators and Prime Minister Koizumi’s decisive election victory attracted record inflows from overseas investors. In response, the Tokyo Stock Exchange Stock Price Index (TOPIX) soared 22.89% . Southeast Asian equities outside of Japan, particularly South Korea, also responded well to the better macroeconomic environment, illustrated by the 19.44% return for the MSCI All Country Far East ex Japan index. European stock markets were up as well, despite investors’ concern about higher energy prices and potential downgrades to eco nomic growth in the region. For the year overall, the MSCI Europe index rose 16.51% . Although robust, returns for U.S. investors in foreign markets were tempered by the strength of the dollar versus many major currencies.
During the past year, the fund’s Class A, Class T, Class B and Class C shares returned 30.16%, 29.72%, 29.13% and 29.22%, respectively, besting the 27.83% gain of the MSCI Small Cap Index and the 25.87% return LipperSM International Small Cap Funds Average. From a geographical perspective, Western Europe was the strongest contributor versus the index, with stock selection in Germany alone adding almost four percentage points to the fund’s return. On a sector basis, fund performance was helped the most by our picks in telecom munication services and information technology, while its holdings in materials and health care underperformed. Among individual holdings, the most positive contributors were Egyptian wireless stock Orascom and German fiberboard manufacturer Pfleiderer, both of which were sold for valuation reasons. In the Asian portfolio, the fund was helped by its investments in Yamada Denki and Ibiden both Japanese holdings. Overall, though, stock selection in Japan hurt relative performance. From a sector standpoint, our picks in materials and health care could have been better. Detractors included U.K. energy holding BowLeven, along with cellular handset aftermarket services provider Accord Customer Care Solutions, a Singapore based holding we sold, and flexible printed circuit board maker NOK, a Japanese stock we trimmed substantially.
The views expressed in this statement reflect those of the portfolio managers only through the end of the period of the report as stated on the cover and do not necessarily represent the views of Fidelity or any other person in the Fidelity organization. Any such views are subject to change at any time based upon market or other conditions and Fidelity disclaims any responsibility to update such views. These views may not be relied on as investment advice and, because investment decisions for a Fidelity fund are based on numerous factors, may not be relied on as an indication of trading intent on behalf of any Fidelity fund.
| 7 Annual Report 7 |
Shareholder Expense Example
As a shareholder of the Fund, you incur two types of costs: (1) transaction costs, including sales charges (loads) on purchase payments or redemption proceeds, redemption fees, and (2) ongoing costs, including management fees, distribution and/or service (12b 1) fees and other Fund expenses. This Example is intended to help you understand your ongoing costs (in dollars) of investing in the Fund and to compare these costs with the ongoing costs of investing in other mutual funds.
The Example is based on an investment of $1,000 invested at the beginning of the period and held for the entire period (May 1, 2005 to October 31, 2005).
| Actual Expenses |
The first line of the table below for each class of the Fund provides information about actual account values and actual expenses. You may use the information in this line, together with the amount you invested, to estimate the expenses that you paid over the period. Simply divide your account value by $1,000.00 (for example, an $8,600 account value divided by $1,000.00 = 8.6), then multiply the result by the number in the first line for a class of the Fund under the heading entitled “Expenses Paid During Period” to estimate the expenses you paid on your account during this period. A small balance maintenance fee of $12.00 that is charged once a year may apply for certain accounts with a value of less than $2,000. This fee is not included in the table below. If it was, the esti mate of expenses you paid during the period would be higher, and your ending account value lower, by this amount.
Hypothetical Example for Comparison Purposes
The second line of the table below for each class of the Fund provides information about hypothetical account values and hypothetical expenses based on a Class’ actual expense ratio and an assumed rate of return of 5% per year before expenses, which is not the Class’ actual return. The hypothetical account values and expenses may not be used to estimate the actual ending account balance or expenses you paid for the period. You may use this information to compare the ongoing costs of investing in the Fund and other funds. To do so, compare this 5% hypothetical example with the 5% hypothetical examples that appear in the shareholder reports of the other funds. A small balance maintenance fee of $12.00 that is charged once a year may apply for certain accounts with a value of less than $2,000. This fee is not included in the table below. If it was, the estimate of expenses you paid during the period would be higher, and your ending account value lower, by this amount.
| Annual Report |
| 8 |
Please note that the expenses shown in the table are meant to highlight your ongoing costs only and do not reflect any transaction costs. Therefore, the second line of the table is useful in comparing ongoing costs only, and will not help you determine the relative total costs of owning different funds. In addition, if these transactional costs were included, your costs would have been higher.
| Expenses Paid | ||||||||||||
| Beginning | Ending | During Period* | ||||||||||
| Account Value | Account Value | May 1, 2005 | ||||||||||
| May 1, 2005 | October 31, 2005 | to October 31, 2005 | ||||||||||
| Class A | ||||||||||||
| Actual | $ | 1,000.00 | $ | 1,099.70 | $ | 8.73 | ||||||
| HypotheticalA | $ | 1,000.00 | $ | 1,016.89 | $ | 8.39 | ||||||
| Class T | ||||||||||||
| Actual | $ | 1,000.00 | $ | 1,098.40 | $ | 10.05 | ||||||
| HypotheticalA | $ | 1,000.00 | $ | 1,015.63 | $ | 9.65 | ||||||
| Class B | ||||||||||||
| Actual | $ | 1,000.00 | $ | 1,096.10 | $ | 12.68 | ||||||
| HypotheticalA | $ | 1,000.00 | $ | 1,013.11 | $ | 12.18 | ||||||
| Class C | ||||||||||||
| Actual | $ | 1,000.00 | $ | 1,095.80 | $ | 12.68 | ||||||
| HypotheticalA | $ | 1,000.00 | $ | 1,013.11 | $ | 12.18 | ||||||
| International Small Cap | ||||||||||||
| Actual | $ | 1,000.00 | $ | 1,102.00 | $ | 6.73 | ||||||
| HypotheticalA | $ | 1,000.00 | $ | 1,018.80 | $ | 6.46 | ||||||
| Institutional Class | ||||||||||||
| Actual | $ | 1,000.00 | $ | 1,101.70 | $ | 6.89 | ||||||
| HypotheticalA | $ | 1,000.00 | $ | 1,018.65 | $ | 6.61 | ||||||
| A 5% return per year before expenses | ||||||||||||
* Expenses are equal to each Class’ annualized expense ratio (shown in the table below); multiplied by the average account value over the period, multiplied by 184/365 (to reflect the one half year period).
| Annualized | ||
| Expense Ratio | ||
| Class A | 1.65% | |
| Class T | 1.90% | |
| Class B | 2.40% | |
| Class C | 2.40% | |
| International Small Cap | 1.27% | |
| Institutional Class | 1.30% |
9 Annual Report
Investment Changes
| Asset Allocation | ||||
| % of fund’s | % of fund’s net assets | |||
| net assets | 6 months ago | |||
| Stocks and Investment Companies | 97.8 | 96.6 | ||
| Bonds | 0.1 | 0.0 | ||
| Short Term Investments and Net Other Assets | 2.1 | 3.4 |
Annual Report 10
| Top Ten Stocks as of October 31, 2005 | ||||
| % of fund’s | % of fund’s net assets | |||
| net assets | 6 months ago | |||
| Steinhoff International Holdings Ltd. (South | ||||
| Africa, Household Durables) | 1.5 | 1.3 | ||
| Hikari Tsushin, Inc. (Japan, Specialty Retail) | 1.5 | 1.3 | ||
| Yamada Denki Co. Ltd. (Japan, Specialty Retail) | 1.3 | 0.0 | ||
| K&S AG (Germany, Chemicals) | 1.3 | 1.1 | ||
| Nissin Kogyo Co. Ltd. (Japan, Auto Components) | 1.2 | 0.9 | ||
| Stolt Nielsen SA (Luxembourg, Marine) | 1.0 | 0.9 | ||
| Banca Italease Spa (Italy, Diversified Financial | ||||
| Services) | 1.0 | 0.0 | ||
| Neste Oil Oyj (Finland, Oil, Gas & Consumable | ||||
| Fuels) | 0.9 | 0.4 | ||
| Ibiden Co. Ltd. (Japan, Electronic Equipment & | ||||
| Instruments) | 0.9 | 0.5 | ||
| Kura Corp. Ltd. (Japan, Food & Staples Retailing) | 0.9 | 0.4 | ||
| 11.5 | ||||
| Market Sectors as of October 31, 2005 | ||||
| % of fund’s | % of fund’s net assets | |||
| net assets | 6 months ago | |||
| Consumer Discretionary | 18.7 | 22.5 | ||
| Industrials | 15.5 | 14.9 | ||
| Materials | 14.8 | 14.1 | ||
| Energy | 13.0 | 7.8 | ||
| Information Technology | 12.9 | 13.0 | ||
| Financials | 9.5 | 9.8 | ||
| Health Care | 5.8 | 6.4 | ||
| Consumer Staples | 4.3 | 2.9 | ||
| Telecommunication Services | 2.8 | 4.8 | ||
| Utilities | 0.6 | 0.3 |
11 Annual Report
| Investments October 31, 2005 | ||||||
| Showing Percentage of Net Assets | ||||||
| Common Stocks 97.4% | ||||||
| Shares | Value (Note 1) | |||||
| (000s) | ||||||
| Australia – 10.4% | ||||||
| ABC Learning Centres Ltd. | 1,308,951 | $ | 6,362 | |||
| Adelaide Bank Ltd. | 102,800 | 957 | ||||
| Austar United Communications Ltd. (a) | 913,300 | 816 | ||||
| Austbrokers Holdings Ltd. | 455,000 | 680 | ||||
| Australian Agricultural Co. Ltd. | 877,210 | 1,194 | ||||
| Australian Stock Exchange Ltd. | 604,239 | 12,999 | ||||
| Australian Worldwide Exploration Ltd. (a)(d) | 998,700 | 1,523 | ||||
| Billabong International Ltd. | 546,600 | 5,289 | ||||
| Bradken Ltd. | 2,426,442 | 6,804 | ||||
| Caltex Australia Ltd. | 397,800 | 6,044 | ||||
| Centamin Egypt Ltd. (a) | 7,820,178 | 2,319 | ||||
| Challenger Financial Services Group Ltd. | 849,959 | 2,313 | ||||
| Coates Hire Ltd. | 392,300 | 1,361 | ||||
| Cochlear Ltd. | 179,000 | 5,084 | ||||
| Computershare Ltd. | 1,370,972 | 6,715 | ||||
| ConnectEast Group unit | 3,264,583 | 1,770 | ||||
| CSL Ltd. | 66,200 | 1,856 | ||||
| CSR Ltd. | 3,282,600 | 7,167 | ||||
| Dominos Pizza Australia New Zealand Ltd. | 1,839,000 | 4,057 | ||||
| Downer EDI Ltd. | 1,777,883 | 8,083 | ||||
| Dwyka Diamonds Ltd. (a) | 7,024,086 | 3,793 | ||||
| Elixir Petroleum Ltd. (a) | 3,666,540 | 1,639 | ||||
| Elkedra Diamonds NL (a) | 3,000,000 | 983 | ||||
| Elkedra Diamonds NL warrants 8/31/07 (a) | 3,000,000 | 352 | ||||
| Energy Developments Ltd. | 452,327 | 1,539 | ||||
| Energy Resources of Australia Ltd. | 144,800 | 1,429 | ||||
| Fox Resources Ltd. (a)(e) | 4,514,836 | 844 | ||||
| Fox Resources Ltd. warrants 6/30/07 (a) | 342,636 | 6 | ||||
| Hardman Resources Ltd.: | ||||||
| (Australia) (a) | 2,002,781 | 3,025 | ||||
| (United Kingdom) (a) | 480,653 | 721 | ||||
| Healthscope Ltd. | 294,400 | 1,255 | ||||
| Iluka Resources Ltd. | 840,900 | 4,867 | ||||
| International Ferro Metals (e) | 26,337,500 | 15,854 | ||||
| Jubilee Mines NL | 252,600 | 1,224 | ||||
| Macquarie Airports unit | 922,500 | 2,069 | ||||
| Macquarie Bank Ltd. | 34,700 | 1,678 | ||||
| Macquarie Communications Infrastructure Group unit | 1,331,700 | 5,726 | ||||
| Macquarie Infrastructure Group unit | 1,404,600 | 3,602 | ||||
| Mayne Group Ltd. | 84,600 | 330 | ||||
| Mineral Deposits Ltd. (a) | 4,920,000 | 3,403 | ||||
| Mortgage Choice Ltd. | 3,927,808 | 4,464 | ||||
See accompanying notes which are an integral part of the financial statements.
| Annual Report |
| 12 |
| Common Stocks continued | ||||||
| Shares | Value (Note 1) | |||||
| (000s) | ||||||
| Australia – continued | ||||||
| Novera Energy Ltd. (a) | 856,600 | $ | 993 | |||
| Oxiana Ltd. (a) | 3,612,500 | 3,620 | ||||
| Paladin Resources Ltd. (a) | 4,294,500 | 6,358 | ||||
| Perpetual Trustees Australia Ltd. | 21,200 | 994 | ||||
| Primary Health Care Ltd. | 104,800 | 823 | ||||
| Publishing & Broadcasting Ltd. | 277,900 | 3,350 | ||||
| QBE Insurance Group Ltd. | 424,723 | 5,653 | ||||
| Rinker Group Ltd. | 248,000 | 2,793 | ||||
| Roc Oil Co. Ltd. (a) | 6,508,592 | 11,754 | ||||
| Seek Ltd. | 2,933,202 | 6,229 | ||||
| Select Managed Funds Ltd. | 84,200 | 315 | ||||
| SFE Corp. Ltd. | 336,800 | 3,135 | ||||
| Sigma Co. Ltd. | 490,500 | 4,390 | ||||
| Sphere Investments Ltd. (a)(e) | 5,250,000 | 2,552 | ||||
| Stockland New (a) | 408 | 2 | ||||
| Sylvania Resources Ltd. (a)(e) | 6,480,000 | 2,738 | ||||
| Tap Oil Nl (a) | 391,700 | 712 | ||||
| Transfield Services Ltd. | 133,800 | 743 | ||||
| Transurban Group unit | 115,600 | 553 | ||||
| UNiTAB Ltd. | 292,600 | 2,779 | ||||
| United Group Ltd. | 959,121 | 7,530 | ||||
| Virotec International Ltd.: | ||||||
| (Australia) (a) | 1,852,832 | 1,039 | ||||
| (United Kingdom) (a) | 5,185,500 | 3,053 | ||||
| Vision Group Holdings Ltd. | 484,300 | 1,630 | ||||
| WorleyParsons Ltd. (d) | 936,800 | 6,865 | ||||
| Zinifex Ltd. | 2,191,500 | 7,964 | ||||
| TOTAL AUSTRALIA | 230,763 | |||||
| Austria – 0.3% | ||||||
| OMV AG | 112,300 | 6,058 | ||||
| Belgium – 0.6% | ||||||
| Euronav NV | 57,000 | 1,756 | ||||
| Melexis NV | 93,199 | 1,162 | ||||
| Omega Pharma SA | 84,500 | 4,366 | ||||
| Punch International NV (a) | 29,700 | 2,585 | ||||
| Recticel SA | 384,144 | 3,560 | ||||
| TOTAL BELGIUM | 13,429 | |||||
See accompanying notes which are an integral part of the financial statements.
13 Annual Report
| Investments continued | ||||||
| Common Stocks continued | ||||||
| Shares | Value (Note 1) | |||||
| (000s) | ||||||
| Bermuda – 1.2% | ||||||
| Aquarius Platinum Ltd.: | ||||||
| (Australia) | 184,902 | $ | 1,383 | |||
| (United Kingdom) | 694,305 | 5,224 | ||||
| China Lotsynergy Holding Ltd. (a) | 7,190,000 | 2,365 | ||||
| Jinhui Shipping & Transportation Ltd. (d) | 164,000 | 575 | ||||
| Petra Diamonds Ltd. (a) | 2,123,906 | 2,331 | ||||
| Ports Design Ltd. | 2,983,000 | 2,790 | ||||
| RC Group (Holdings) Ltd. (f) | 2,493,279 | 1,677 | ||||
| SeaDrill Ltd. (a)(g) | 375,000 | 2,306 | ||||
| Tanzanite One Ltd. | 2,221,701 | 4,936 | ||||
| Xceldiam Ltd. (f) | 3,318,255 | 2,643 | ||||
| Xceldiam Ltd. warrants 11/16/07 (a)(f) | 1,965,127 | 0 | ||||
| TOTAL BERMUDA | 26,230 | |||||
| Brazil – 0.2% | ||||||
| Petroleo Brasileiro SA Petrobras sponsored ADR (non-vtg.) | 86,900 | 5,553 | ||||
| British Virgin Islands – 0.3% | ||||||
| Albidon Ltd. unit (a) | 1,000,000 | 505 | ||||
| BDI Mining Corp. (a)(e) | 7,717,890 | 4,646 | ||||
| Titanium Resources Group Ltd. | 1,890,000 | 1,824 | ||||
| TOTAL BRITISH VIRGIN ISLANDS | 6,975 | |||||
| Canada 2.3% | ||||||
| Adastra Minerals, Inc. (a) | 893,900 | 934 | ||||
| Altius Minerals Corp. (a) | 400,000 | 1,399 | ||||
| Artumas Group, Inc. | 203,500 | 907 | ||||
| Azure Dynamics Corp. Class A (a) | 1,425,700 | 1,461 | ||||
| Bankers Petroleum Ltd. (a) | 3,467,000 | 3,523 | ||||
| Banro Corp. (a) | 393,900 | 2,835 | ||||
| Brazilian Diamonds Ltd. (a) | 1,300,000 | 325 | ||||
| First Quantum Minerals Ltd. | 163,200 | 3,828 | ||||
| Grove Energy Ltd. (a) | 3,049,240 | 1,417 | ||||
| La Mancha Resources, Inc. (a) | 561,000 | 656 | ||||
| Oilexco, Inc. (a) | 5,534,400 | 18,745 | ||||
| Starfield Resources, Inc. (a)(e) | 11,046,531 | 3,741 | ||||
| StrataGold Corp. (a) | 2,229,000 | 1,095 | ||||
| Uruguay Mineral Exploration, Inc. (a) | 245,200 | 851 | ||||
| Valkyries Petroleum Corp. (a) | 430,000 | 2,130 | ||||
| Visual Defence, Inc. | 3,180,000 | 1,379 | ||||
| Western Canadian Coal Corp. (a) | 1,378,718 | 4,786 | ||||
See accompanying notes which are an integral part of the financial statements.
| Annual Report |
| 14 |
| Common Stocks continued | ||||||
| Shares | Value (Note 1) | |||||
| (000s) | ||||||
| Canada – continued | ||||||
| Western Canadian Coal Corp.: | ||||||
| warrants 2/9/06 (a) | 84,359 | $ | 21 | |||
| (United Kingdom) (a) | 548,286 | 1,893 | ||||
| TOTAL CANADA | 51,926 | |||||
| Cayman Islands – 0.6% | ||||||
| AAC Acoustic Technology Holdings, Inc. | 4,450,000 | 2,239 | ||||
| Foxconn International Holdings Ltd. | 2,172,000 | 2,326 | ||||
| Hutchison Telecommunications International Ltd. | 174,000 | 220 | ||||
| Kingboard Chemical Holdings Ltd. | 2,812,180 | 5,949 | ||||
| Mosvold Drilling Ltd. (a) | 586,800 | 992 | ||||
| Sincere Watch (Hong Kong) Ltd. | 6,984,000 | 901 | ||||
| SinoCom Software Group Ltd. | 134,000 | 100 | ||||
| TOTAL CAYMAN ISLANDS | 12,727 | |||||
| China – 0.2% | ||||||
| Shanghai Electric (Group) Corp. (H Shares) | 6,592,000 | 2,083 | ||||
| Sina Corp. (a) | 32,400 | 821 | ||||
| Xinao Gas Holdings Ltd. | 2,674,000 | 2,035 | ||||
| TOTAL CHINA | 4,939 | |||||
| Czech Republic – 0.2% | ||||||
| Komercni Banka AS unit | 84,634 | 3,946 | ||||
| Denmark – 0.2% | ||||||
| Rockwool International AS Series A | 43,700 | 3,401 | ||||
| Estonia – 0.1% | ||||||
| Tallinna Vesi AS | 168,000 | 2,884 | ||||
| Finland – 1.7% | ||||||
| Aldata Solutions Oyj (a) | 2,065,976 | 4,507 | ||||
| Capman Oyj (B Shares) | 426,937 | 1,505 | ||||
| Inion OY | 1,957,900 | 3,466 | ||||
| Neste Oil Oyj | 649,600 | 20,130 | ||||
| Nokian Tyres Ltd. | 473,590 | 7,380 | ||||
| TOTAL FINLAND | 36,988 | |||||
| France – 1.3% | ||||||
| Altamir et Compagnie SA (a) | 6,100 | 1,082 | ||||
| Bourbon SA | 15,638 | 1,264 | ||||
| BVRP Software SA (a) | 144,796 | 3,388 | ||||
| Constructions Industrielles dela Mediterranee SA | 11,500 | 1,017 | ||||
| Damartex SA | 21,485 | 773 | ||||
See accompanying notes which are an integral part of the financial statements.
15 Annual Report
| Investments continued | ||||||
| Common Stocks continued | ||||||
| Shares | Value (Note 1) | |||||
| (000s) | ||||||
| France – continued | ||||||
| Groupe Open SA (d) | 52,500 | $ | 694 | |||
| Groupe Open SA warrants 10/21/06 (a) | 14,809 | 8 | ||||
| Guerbet SA | 8,400 | 1,133 | ||||
| Ipsos SA | 16,003 | 1,899 | ||||
| Lagardere S.C.A. (Reg.) | 21,700 | 1,492 | ||||
| Maisons France Confort | 31,494 | 1,582 | ||||
| Orpea (a) | 25,207 | 1,360 | ||||
| Sechilienne-Sidec | 6,446 | 2,836 | ||||
| Signaux Girod | 14,128 | 1,153 | ||||
| Silicon On Insulator Technologies SA (SOITEC) (a)(d) | 236,300 | 3,538 | ||||
| Sucriere de Pithivier Le Vieil | 5,000 | 3,452 | ||||
| Tessi SA | 24,066 | 1,202 | ||||
| The Lisi Group | 22,500 | 1,308 | ||||
| TOTAL FRANCE | 29,181 | |||||
| Germany – 3.0% | ||||||
| Advanced Photonics Technologies AG (a) | 48,552 | 91 | ||||
| Articon-Integralis AG (Reg.) (a) | 495,185 | 1,983 | ||||
| Deutz AG (a)(d) | 1,676,400 | 7,596 | ||||
| ElringKlinger AG | 18,284 | 677 | ||||
| Fresenius AG (d) | 25,586 | 3,300 | ||||
| Grenkeleasing AG | 25,918 | 1,352 | ||||
| Hawesko Holding AG | 21,800 | 915 | ||||
| K&S AG | 439,200 | 28,815 | ||||
| Kontron AG (a) | 154,264 | 1,128 | ||||
| Merck KGaA | 48,441 | 4,007 | ||||
| Parsytec AG (a) | 188,871 | 498 | ||||
| Pfleiderer AG (a) | 114,359 | 2,084 | ||||
| PSI AG (a)(e) | 689,200 | 3,396 | ||||
| Pulsion Medical Systems AG (a) | 98,511 | 543 | ||||
| SGL Carbon AG (a) | 250,100 | 3,661 | ||||
| Suedzucker AG (Bearer) (d) | 243,275 | 5,124 | ||||
| United Internet AG | 40,352 | 1,304 | ||||
| TOTAL GERMANY | 66,474 | |||||
| Gibraltar 0.2% | ||||||
| PartyGaming PLC | 2,216,200 | 3,423 | ||||
| Greece – 1.3% | ||||||
| Alfa-Beta Vassilopoulos SA (Reg.) (a) | 108,600 | 1,432 | ||||
| Autohellas SA | 238,800 | 945 | ||||
| Fourlis Holdings SA | 252,000 | 2,229 | ||||
| Greek Organization of Football Prognostics SA | 76,842 | 2,218 | ||||
See accompanying notes which are an integral part of the financial statements.
| Annual Report |
| 16 |
| Common Stocks continued | ||||||
| Shares | Value (Note 1) | |||||
| (000s) | ||||||
| Greece – continued | ||||||
| Hyatt Regency SA (Reg.) | 309,882 | $ | 3,796 | |||
| Intralot SA | 110,700 | 1,651 | ||||
| Motor Oil (HELLAS) Corinth Refineries SA | 155,420 | 3,354 | ||||
| Sarantis SA (Reg.) | 1,633,418 | 12,101 | ||||
| TOTAL GREECE | 27,726 | |||||
| Hong Kong – 0.8% | ||||||
| Cafe de Coral Holdings Ltd. | 538,000 | 607 | ||||
| Chen Hsong Holdings Ltd. | 1,060,000 | 475 | ||||
| Convenience Retail Asia Ltd. | 432,000 | 143 | ||||
| Fong’s Industries Co. Ltd. | 500,000 | 339 | ||||
| Hong Kong & Shanghai Hotels Ltd. | 2,229,500 | 2,229 | ||||
| Hong Kong Aircraft & Engineering Co. | 152,400 | 1,108 | ||||
| Integrated Distribution Services Group Ltd. (IDS) | 2,488,000 | 2,439 | ||||
| JCG Holdings Ltd. | 880,000 | 874 | ||||
| Linmark Group Ltd. | 2,218,000 | 672 | ||||
| Lung Kee (Bermuda) Holdings | 978,000 | 732 | ||||
| Midland Holdings Ltd. | 1,794,000 | 868 | ||||
| Shanghai Industrial Holdings Ltd. Class H | 339,000 | 603 | ||||
| Shun Tak Holdings Ltd. | 1,376,000 | 994 | ||||
| Solomon Systech Ltd. | 7,070,000 | 2,599 | ||||
| Tingyi (Cayman Island) Holding Corp. | 100,000 | 34 | ||||
| Tom.com Ltd. (a) | 4,332,000 | 771 | ||||
| Vtech Holdings Ltd. | 455,000 | 1,937 | ||||
| TOTAL HONG KONG | 17,424 | |||||
| Hungary – 0.4% | ||||||
| MOL Magyar Olay es Gazipari RT Series A (For. Reg.) | 44,200 | 4,061 | ||||
| OTP Bank Rt. | 127,473 | 4,557 | ||||
| TOTAL HUNGARY | 8,618 | |||||
| India – 0.7% | ||||||
| Balkrishna Industries Ltd. | 37,161 | 854 | ||||
| Bharti Televentures Ltd. (a) | 445,504 | 3,201 | ||||
| Cipla Ltd. | 8,214 | 66 | ||||
| Financial Technology (India) Ltd. | 86,718 | 1,885 | ||||
| State Bank of India | 355,858 | 7,379 | ||||
| Suzlon Energy Ltd. (a) | 181,848 | 2,883 | ||||
| TOTAL INDIA | 16,268 | |||||
| Ireland – 0.9% | ||||||
| Adwalker PLC (a)(e) | 9,125,000 | 1,292 | ||||
See accompanying notes which are an integral part of the financial statements.
17 Annual Report
| Investments continued | ||||||
| Common Stocks continued | ||||||
| Shares | Value (Note 1) | |||||
| (000s) | ||||||
| Ireland – continued | ||||||
| Aminex PLC (a) | 3,160,919 | $ | 1,259 | |||
| IAWS Group PLC (Ireland) | 38,059 | 525 | ||||
| Kenmare Resources PLC (a) | 4,741,500 | 3,001 | ||||
| Kenmare Resources PLC warrants 7/23/09 (a) | 1,712,500 | 637 | ||||
| Minco PLC (a) | 1,818,181 | 531 | ||||
| Minco PLC warrants 12/3/05 (a) | 909,090 | 64 | ||||
| Paddy Power PLC (Ireland) | 241,011 | 4,074 | ||||
| Petroceltic International PLC (a) | 12,421,734 | 2,529 | ||||
| Providence Resources PLC (a) | 28,529,700 | 1,300 | ||||
| Trinity Biotech PLC sponsored ADR (a)(d) | 227,325 | 1,523 | ||||
| Vimio PLC | 944,000 | 2,657 | ||||
| TOTAL IRELAND | 19,392 | |||||
| Israel – 0.4% | ||||||
| Advanced Vision Technology Ltd. (a) | 165,400 | 1,884 | ||||
| Leadcom Integrated Solutions (e) | 5,160,100 | 4,705 | ||||
| Metal-Tech Ltd. | 830,000 | 2,645 | ||||
| TOTAL ISRAEL | 9,234 | |||||
| Italy 2.0% | ||||||
| Amplifon Spa | 38,350 | 2,494 | ||||
| Banca Italease Spa | 1,051,300 | 22,242 | ||||
| Bastogi Spa (a)(d) | 3,714,300 | 1,205 | ||||
| Brembo Spa | 218,769 | 1,520 | ||||
| Cassa Di Risparmio Di Firenze | 2,942,982 | 8,777 | ||||
| Lottomatica Spa New | 112,000 | 4,068 | ||||
| Saipem Spa | 79,800 | 1,141 | ||||
| Teleunit Spa (a)(e) | 9,675,858 | 3,683 | ||||
| TOTAL ITALY | 45,130 | |||||
| Japan 32.9% | ||||||
| Able, Inc. (d) | 30,500 | 1,094 | ||||
| Adtec Plasma Technology Co. Ltd. | 10 | 43 | ||||
| Advance Create Co. Ltd. | 833 | 1,984 | ||||
| Advanced Media, Inc. Japan | 314 | 2,129 | ||||
| Aeon Fantasy Co. Ltd. | 70,600 | 1,755 | ||||
| Aichi Steel Corp. (d) | 2,156,000 | 15,180 | ||||
| Ain Pharmaciez, Inc. | 68,800 | 1,451 | ||||
| All About, Inc. | 77 | 536 | ||||
| Ariake Japan Co. Ltd. (d) | 180,300 | 4,075 | ||||
| ARRK Corp. | 46,700 | 2,592 | ||||
| Asahi Denka Co. Ltd. (d) | 233,000 | 2,892 | ||||
See accompanying notes which are an integral part of the financial statements.
| Annual Report |
| 18 |
| Common Stocks continued | ||||||
| Shares | Value (Note 1) | |||||
| (000s) | ||||||
| Japan – continued | ||||||
| ASICS Trading Co. Ltd. | 54,900 | $ | 755 | |||
| Asset Managers Co. Ltd. (d) | 633 | 3,059 | ||||
| Axell Corp. (d) | 660 | 2,481 | ||||
| Bando Chemical Industries Ltd. | 249,000 | 1,095 | ||||
| Central Glass Co. Ltd. | 267,000 | 1,494 | ||||
| Chiyoda Corp. | 96,000 | 1,659 | ||||
| Chugoku Marine Paints Ltd. | 432,000 | 2,159 | ||||
| CMIC Co. Ltd. (d) | 1,950 | 697 | ||||
| COMSYS Holdings Corp. | 188,000 | 2,125 | ||||
| Create Restaurants, Inc. | 110,200 | 5,583 | ||||
| Create SD Co. Ltd. | 44,700 | 1,618 | ||||
| Credit Saison Co. Ltd. | 15,600 | 709 | ||||
| Cyber Agent Ltd. New | 566 | 1,020 | ||||
| cyber communications, Inc. (a)(d) | 870 | 2,215 | ||||
| Cyber Firm, Inc. (a) | 315 | 1,009 | ||||
| Daifuku Co. Ltd. | 316,000 | 4,168 | ||||
| Daihatsu Diesel Manufacturing Co. Ltd. | 370,000 | 1,698 | ||||
| Daiwabo Information System Ltd. (d) | 450,000 | 7,506 | ||||
| DC Co. Ltd. | 206,000 | 787 | ||||
| Dip Corp. (a)(d) | 133 | 207 | ||||
| Doshisha Co. Ltd. | 79,650 | 1,414 | ||||
| E*TRADE Securities Co. Ltd. (d) | 488 | 2,565 | ||||
| Enshu Ltd. (a)(d) | 1,118,000 | 3,670 | ||||
| EPS Co. Ltd. (d) | 604 | 1,794 | ||||
| Excite Japan Co. Ltd | 277 | 1,684 | ||||
| Faith, Inc. (d) | 330 | 151 | ||||
| Faith, Inc. New (a) | 1,320 | 602 | ||||
| FCC Co. Ltd. (d) | 58,000 | 2,391 | ||||
| Finance All Corp. (d) | 2,636 | 2,488 | ||||
| FinTech Global, Inc. (d) | 49 | 188 | ||||
| FinTech Global, Inc. New | 98 | 377 | ||||
| Forval Corp. | 79,300 | 846 | ||||
| FT Communications Co. Ltd. (d) | 689 | 1,790 | ||||
| Fuji Seal International, Inc. | 60 | 2 | ||||
| Fujikura Ltd. | 1,304,000 | 8,447 | ||||
| Furukawa Co. Ltd. (a)(d) | 3,058,000 | 6,621 | ||||
| Gourmet Navigator, Inc. (d) | 395 | 1,115 | ||||
| Hamamatsu Photonics KK (d) | 158,000 | 3,674 | ||||
| Haseko Corp. (a) | 330,500 | 1,145 | ||||
| Hikari Tsushin, Inc. | 508,000 | 32,687 | ||||
| Hiroshima Bank Ltd. | 446,000 | 2,916 | ||||
| Hitachi Construction Machinery Co. Ltd. | 129,000 | 2,458 | ||||
See accompanying notes which are an integral part of the financial statements.
19 Annual Report
| Investments continued | ||||||
| Common Stocks continued | ||||||
| Shares | Value (Note 1) | |||||
| (000s) | ||||||
| Japan – continued | ||||||
| Hitachi Metals Ltd. | 761,000 | $ | 7,836 | |||
| Hogy Medical Co. | 29,000 | 1,590 | ||||
| Hokuto Corp. (d) | 276,800 | 4,492 | ||||
| I-CF, Inc. (a)(d) | 1,333 | 2,655 | ||||
| Ibiden Co. Ltd. | 467,600 | 18,952 | ||||
| Index Corp. New (d) | 11,216 | 12,627 | ||||
| Innotech Corp. Japan | 329,800 | 2,485 | ||||
| Intelligent Wave, Inc. (d) | 543 | 1,801 | ||||
| Iriso Electronics Co. Ltd. | 43,500 | 1,243 | ||||
| Ishihara Chemical Co. Ltd. | 49,000 | 883 | ||||
| Itochu Corp. | 668,000 | 4,582 | ||||
| Itochushokuhin Co. Ltd. | 1,500 | 51 | ||||
| J Bridge Corp. (a)(d) | 182,800 | 2,918 | ||||
| Japan Communications, Inc. (d) | 402 | 473 | ||||
| Japan Digital Contents Trust, Inc. (a)(d) | 214 | 239 | ||||
| Japan Digital Contents Trust, Inc. New (a) | 214 | 234 | ||||
| Jastec Co. Ltd. | 119,600 | 2,362 | ||||
| JFE Holdings, Inc. | 67,400 | 2,095 | ||||
| Juroku Bank Ltd. | 175,000 | 1,461 | ||||
| KAGA ELECTRONICS Co. Ltd. | 97,800 | 2,528 | ||||
| Kakaku.com, Inc. New (d) | 140 | 485 | ||||
| Kawasaki Heavy Industries Ltd. (d) | 999,000 | 2,613 | ||||
| Kenedix, Inc. | 3,176 | 13,037 | ||||
| Kibun Food Chemifa Co. Ltd. | 136,200 | 3,303 | ||||
| KK daVinci Advisors (a) | 617 | 2,912 | ||||
| Kobe Steel Ltd. | 1,718,000 | 5,073 | ||||
| Kura Corp. Ltd. (e) | 2,946 | 18,905 | ||||
| Kurita Water Industries Ltd. | 215,000 | 3,616 | ||||
| Link Theory Holdings Co. Ltd. | 284 | 1,355 | ||||
| livedoor Co. Ltd. (a)(d) | 1,599,232 | 5,886 | ||||
| Lopro Corp. (d) | 140,100 | 808 | ||||
| LTT Bio-Pharma Co. Ltd. | 112 | 225 | ||||
| Mars Engineering Corp. | 94,700 | 2,920 | ||||
| Maruei Department Store Co. Ltd. | 376,000 | 1,078 | ||||
| Meganesuper Co. Ltd. | 18,320 | 250 | ||||
| Misumi Group, Inc. | 60,800 | 2,396 | ||||
| Mitsubishi Materials Corp. | 957,000 | 3,299 | ||||
| Mitsui & Co. Ltd. | 296,000 | 3,648 | ||||
| Mitsui O.S.K. Lines Ltd. | 617,000 | 4,360 | ||||
| Mitsui Trust Holdings, Inc. | 381,000 | 4,600 | ||||
| Moshi Moshi Hotline, Inc. | 14,750 | 1,401 | ||||
| Nachi-Fujikoshi Corp. (d) | 1,689,000 | 7,738 | ||||
See accompanying notes which are an integral part of the financial statements.
| Annual Report |
| 20 |
| Common Stocks continued | ||||||
| Shares | Value (Note 1) | |||||
| (000s) | ||||||
| Japan – continued | ||||||
| NEOMAX Co. Ltd. | 176,000 | $ | 5,335 | |||
| Net One Systems Co. Ltd. | 3,971 | 7,634 | ||||
| NextCom KK (d) | 736 | 892 | ||||
| NextCom KK New | 2,208 | 2,639 | ||||
| NGK Insulators Ltd. | 207,000 | 2,476 | ||||
| NGK Spark Plug Co. Ltd. | 313,000 | 5,039 | ||||
| NHK Spring Co. Ltd. | 186,000 | 1,466 | ||||
| Nidec Corp. | 18,500 | 1,088 | ||||
| Nidec Corp. New | 18,500 | 1,088 | ||||
| Nidec Tosok Corp. (d) | 173,400 | 2,035 | ||||
| Nihon Ceratec Co. Ltd. (d) | 290 | 1,200 | ||||
| Nihon Chouzai Co. Ltd. | 38,900 | 1,199 | ||||
| Nihon Dempa Kogyo Co. Ltd. (d) | 476,700 | 13,789 | ||||
| Nihon Micro Coating Co. Ltd. (a) | 150,600 | 1,038 | ||||
| Nihon Trim Co. Ltd. (d) | 176,300 | 9,497 | ||||
| Nihon Unicom Corp. | 99,200 | 1,133 | ||||
| Nikko Cordial Corp. | 204,500 | 2,479 | ||||
| Nippon Denko Co. Ltd. (d) | 186,000 | 641 | ||||
| Nippon Denwa Shisetsu | 25,000 | 94 | ||||
| Nippon Electric Glass Co. Ltd. | 87,000 | 1,669 | ||||
| Nippon Mining Holdings, Inc. | 105,500 | 779 | ||||
| Nippon Oil Corp. | 465,000 | 3,959 | ||||
| Nippon Seiki Co. Ltd. (d) | 464,000 | 8,029 | ||||
| Nippon Suisan Kaisha Co. Ltd. (d) | 854,000 | 3,432 | ||||
| Nissei Corp. | 128,000 | 1,643 | ||||
| Nissin Co. Ltd. | 267,080 | 389 | ||||
| Nissin Co. Ltd. New | 267,080 | 384 | ||||
| Nissin Kogyo Co. Ltd. | 614,200 | 27,553 | ||||
| Nissin Servicer Co. Ltd. | 2,001 | 1,872 | ||||
| Nissin Servicer Co. Ltd. New | 2,001 | 1,872 | ||||
| Nitta Corp. | 102,000 | 1,381 | ||||
| NOK Corp. | 187,800 | 5,676 | ||||
| Ogaki Kyoritsu Bank Ltd. | 359,000 | 2,279 | ||||
| Ohara, Inc. (a) | 52,400 | 2,201 | ||||
| Orient Corp. (a) | 785,000 | 3,358 | ||||
| Otaki Gas Co. Ltd. | 16,000 | 80 | ||||
| Otsuka Corp. | 164,500 | 14,559 | ||||
| Pacific Metals Co. Ltd. (d) | 1,545,000 | 6,743 | ||||
| Parker Corp. | 49,000 | 505 | ||||
| Pigeon Corp. (d) | 253,900 | 3,344 | ||||
| Resona Holdings, Inc. (a) | 1,103 | 3,200 | ||||
| Rex Holdings Co. Ltd. (d) | 791 | 5,213 | ||||
See accompanying notes which are an integral part of the financial statements.
21 Annual Report
| Investments continued | ||||||
| Common Stocks continued | ||||||
| Shares | Value (Note 1) | |||||
| (000s) | ||||||
| Japan – continued | ||||||
| Rohto Pharmaceutical Co. Ltd. New | 134,000 | $ | 1,193 | |||
| Saint Marc Co. Ltd. (d) | 75,500 | 3,825 | ||||
| Sammy NetWorks Co. Ltd. (d) | 1,229 | 15,433 | ||||
| SBI Holdings, Inc. (d) | 11,860 | 5,926 | ||||
| Sega Sammy Holdings, Inc. | 7,400 | 267 | ||||
| Sega Sammy Holdings, Inc. New | 76,500 | 2,776 | ||||
| Seikagaku Corp. | 196,300 | 2,120 | ||||
| Sekisui Chemical Co. Ltd. | 172,000 | 1,092 | ||||
| Sekisui Plastics Co. Ltd. | 335,000 | 1,155 | ||||
| Shinohara Systems of Construction Co. Ltd. | 831 | 3,483 | ||||
| Showa Denko KK | 715,000 | 2,291 | ||||
| Showa Shell Sekiyu KK (d) | 595,200 | 7,423 | ||||
| Silex Technology, Inc. | 269 | 745 | ||||
| Simplex Investment Advisors, Inc. (d) | 60 | 488 | ||||
| Softbrain Co. Ltd. (d) | 449 | 817 | ||||
| Software Research Association (SRA) (d) | 28,700 | 483 | ||||
| Sumitomo Corp. | 1,185,000 | 13,238 | ||||
| Sumitomo Metal Mining Co. Ltd. | 1,604,000 | 14,641 | ||||
| Sumitomo Precision Products Co. Ltd. | 374,000 | 1,960 | ||||
| Sumitomo Rubber Industries Ltd. | 589,000 | 7,253 | ||||
| Sumitomo Titanium Corp. (d) | 10,600 | 1,230 | ||||
| Sumitomo Titanium Corp. New (d) | 20,600 | 2,319 | ||||
| Sun Frontier Fudousan Co. Ltd. | 1,278 | 6,132 | ||||
| Sunx Ltd. | 140,100 | 2,334 | ||||
| Taisei Corp. | 366,000 | 1,626 | ||||
| Taiyo Kagaku (d) | 85,500 | 1,111 | ||||
| Take & Give Needs Co. Ltd. (a) | 2,817 | 3,952 | ||||
| Tamron Co. Ltd. (d) | 84,000 | 1,157 | ||||
| Teijin Ltd | 842,000 | 5,031 | ||||
| Teikoku Oil Co. Ltd. | 420,000 | 4,048 | ||||
| Telewave, Inc. (d) | 652 | 3,811 | ||||
| The First Energy Service Co. Ltd. (d) | 39 | 136 | ||||
| The First Energy Service Co. Ltd. New (d) | 156 | 544 | ||||
| The Keiyo Bank Ltd. | 185,000 | 1,392 | ||||
| Toc Co. Ltd. | 104,000 | 603 | ||||
| Token Corp. | 82,100 | 3,896 | ||||
| Tokuyama Corp. | 644,000 | 6,414 | ||||
| Tokyo Seimitsu Co. Ltd. (d) | 67,100 | 3,086 | ||||
| TonenGeneral Sekiyu KK | 134,000 | 1,502 | ||||
| Toray Industries, Inc. | 2,627,000 | 14,651 | ||||
| Tosoh Corp. | 982,000 | 4,363 | ||||
| Toyo Ink Manufacturing Co. Ltd. (d) | 1,994,000 | 8,582 | ||||
See accompanying notes which are an integral part of the financial statements.
| Annual Report |
| 22 |
| Common Stocks continued | ||||||
| Shares | Value (Note 1) | |||||
| (000s) | ||||||
| Japan – continued | ||||||
| Toyo Suisan Kaisha Ltd. | 60,000 | $ | 1,044 | |||
| Trancom Co. Ltd. | 101,700 | 2,127 | ||||
| Trans Cosmos, Inc. (d) | 78,600 | 3,989 | ||||
| Trend Micro, Inc. | 39,500 | 1,235 | ||||
| Turbolinux, Inc. | 170 | 467 | ||||
| Tyo Productions, Inc. | 128,000 | 593 | ||||
| Usen Corp. | 718,550 | 16,521 | ||||
| Warabeya Nichiyo Co. Ltd. (d) | 140,700 | 2,028 | ||||
| Works Applications Co. Ltd. (a)(d) | 7,314 | 6,777 | ||||
| Yachiyo Industry Co. Ltd. | 121,000 | 2,022 | ||||
| Yahagi Construction Co. Ltd. | 299,000 | 1,489 | ||||
| Yamada Denki Co. Ltd. | 331,500 | 29,196 | ||||
| Yamaichi Electronics Co. Ltd. | 105,900 | 1,316 | ||||
| Yaskawa Electric Corp. (a)(d) | 930,000 | 7,273 | ||||
| Yasuragi Co. Ltd. (a) | 115,900 | 3,914 | ||||
| Yorozu Corp. | 138,300 | 1,304 | ||||
| Yoshimoto Kogyo Co. Ltd. (d) | 102,000 | 1,806 | ||||
| Zensho Co. Ltd. (d) | 83,900 | 1,415 | ||||
| Zensho Co. Ltd. New (a)(d) | 83,900 | 1,415 | ||||
| TOTAL JAPAN | 727,557 | |||||
| Korea (South) 0.4% | ||||||
| Doosan Heavy Industries & Construction Co. Ltd. | 154,920 | 3,354 | ||||
| Hyundai Engineering & Construction Co. Ltd. (a) | 24,740 | 769 | ||||
| LG Household & Health Care Ltd. | 30,080 | 1,642 | ||||
| NHN Corp. (a) | 24,661 | 4,098 | ||||
| TOTAL KOREA (SOUTH) | 9,863 | |||||
| Luxembourg 1.0% | ||||||
| Stolt-Nielsen SA | 653,190 | 22,991 | ||||
| Netherlands – 0.2% | ||||||
| Axalto Holding NV (a) | 82,100 | 2,235 | ||||
| Bateman Engineering NV | 480,200 | 2,011 | ||||
| TOTAL NETHERLANDS | 4,246 | |||||
| New Zealand – 0.8% | ||||||
| Auckland International Airport Ltd. | 3,469,725 | 4,759 | ||||
| Fisher & Paykel Healthcare Corp. | 2,225,596 | 5,404 | ||||
| Fletcher Building Ltd. | 464,190 | 2,550 | ||||
| Sky City Entertainment Group Ltd. | 1,663,489 | 5,285 | ||||
| TOTAL NEW ZEALAND | 17,998 | |||||
See accompanying notes which are an integral part of the financial statements.
23 Annual Report
| Investments continued | ||||||||
| Common Stocks continued | ||||||||
| Shares | Value (Note 1) | |||||||
| (000s) | ||||||||
| Norway 2.1% | ||||||||
| ABG Sundal Collier ASA | 1,168,000 | $ | 1,382 | |||||
| Aker Kvaerner ASA (a) | 32,000 | 1,662 | ||||||
| Camillo Eitzen & Co. ASA | 605,200 | 6,046 | ||||||
| Deep Ocean ASA (a) | 421,247 | 1,036 | ||||||
| Mamut ASA (a) | 733,600 | 1,353 | ||||||
| Odfjell ASA (A Shares) | 85,700 | 1,643 | ||||||
| P4 Radio Hele Norge ASA | 141,400 | 565 | ||||||
| Pertra Midt-Norges AS (g) | 60,000 | 922 | ||||||
| Petroleum Geo-Services ASA (a) | 116,250 | 2,948 | ||||||
| Profdoc ASA (a) | 113,200 | 1,583 | ||||||
| Schibsted ASA (B Shares) | 54,100 | 1,559 | ||||||
| Solstad Offshore ASA | 114,000 | 1,577 | ||||||
| Songa Offshore ASA (a) | 985,408 | 4,317 | ||||||
| Songa Offshore ASA warrants 5/20/08 (a)(g) | 177,778 | 519 | ||||||
| Statoil ASA | 222,900 | 4,985 | ||||||
| Stepstone ASA (a)(e) | 4,710,000 | 5,719 | ||||||
| TANDBERG ASA | 334,300 | 3,289 | ||||||
| TANDBERG Television ASA (a) | 395,400 | 4,923 | ||||||
| TOTAL NORWAY | 46,028 | |||||||
| Papua New Guinea – 0.1% | ||||||||
| Oil Search Ltd. | 517,100 | 1,276 | ||||||
| Poland – 1.2% | ||||||||
| Pfleiderer Grajewo SA | 440,800 | 3,680 | ||||||
| Polski Koncern Naftowy Orlen SA unit | 526,600 | 18,894 | ||||||
| Powszechna Kasa Oszczednosci Bank SA | 103,000 | �� | 866 | |||||
| TVN SA | 149,254 | 2,546 | ||||||
| TOTAL POLAND | 25,986 | |||||||
| Portugal 0.2% | ||||||||
| Impresa SGPS (a) | 984,753 | 5,489 | ||||||
| Russia – 1.5% | ||||||||
| Mobile TeleSystems OJSC: | ||||||||
| GDR (Reg. S) | 74,000 | 2,738 | ||||||
| sponsored ADR | 81,300 | 3,007 | ||||||
| Sibirtelecom Open Joint Stock Co. sponsored ADR (a) | 104,700 | 5,209 | ||||||
| Sistema JSFC sponsored GDR | 314,200 | 7,038 | ||||||
| Uralsvyazinform sponsored ADR | 614,100 | 4,286 | ||||||
| Vimpel Communications sponsored ADR (a) | 68,100 | 2,724 | ||||||
| VolgaTelecom sponsored ADR | 1,000,400 | 7,303 | ||||||
| TOTAL RUSSIA | 32,305 | |||||||
| See accompanying notes which are an integral part of the financial statements. | ||||||||
| Annual Report | 24 | |||||||
| Common Stocks continued | ||||||
| Shares | Value (Note 1) | |||||
| (000s) | ||||||
| Singapore – 2.5% | ||||||
| Cosco Investment (Singapore) Ltd. | 2,638,000 | $ | 3,426 | |||
| CSE Global Ltd. | 996,000 | 426 | ||||
| GES International Ltd. | 4,344,000 | 2,385 | ||||
| Guocoland Ltd. | 446,000 | 411 | ||||
| Hong Leong Finance Ltd. | 310,000 | 652 | ||||
| HTL International Holdings Ltd. | 1,422,500 | 1,058 | ||||
| Jurong Technologies Industrial Corp. Ltd. | 1,686,000 | 1,941 | ||||
| Keppel Land Ltd. | 930,000 | 2,097 | ||||
| Olam International Ltd. | 2,539,000 | 1,919 | ||||
| Osim International Ltd. | 800,000 | 732 | ||||
| Parkway Holdings Ltd. | 4,538,000 | 5,305 | ||||
| SembCorp Industries Ltd. | 3,425,000 | 5,439 | ||||
| SembCorp Logistics Ltd. | 596,000 | 602 | ||||
| Sembcorp Marine Ltd. | 2,860,000 | 4,626 | ||||
| SIA Engineering Co. Ltd. | 2,847,000 | 4,185 | ||||
| Singapore Exchange Ltd. | 4,407,000 | 7,025 | ||||
| Singapore Petroleum Co. Ltd. | 1,501,000 | 4,271 | ||||
| Singapore Post Ltd. | 10,718,000 | 7,213 | ||||
| United Overseas Land Ltd. | 803,000 | 1,109 | ||||
| TOTAL SINGAPORE | 54,822 | |||||
| South Africa 3.7% | ||||||
| Aflease Gold & Uranium Resources Ltd. (a) | 2,643,000 | 1,910 | ||||
| African Bank Investments Ltd. | 3,710,751 | 11,066 | ||||
| Discovery Holdings Ltd. (a) | 2,751,919 | 9,002 | ||||
| FirstRand Ltd. | 952,000 | 2,240 | ||||
| Foschini Ltd. | 488,000 | 3,109 | ||||
| Gold Reef Casino Resorts Ltd. | 697,000 | 1,433 | ||||
| JD Group Ltd. | 188,100 | 2,011 | ||||
| MTN Group Ltd. | 1,176,702 | 8,768 | ||||
| Nedbank Group Ltd | 154,000 | 1,962 | ||||
| Steinhoff International Holdings Ltd. | 12,684,632 | 33,194 | ||||
| VenFin Ltd. | 904,500 | 4,920 | ||||
| Wilson Bayly Holmes Ovcon Ltd. | 446,856 | 2,684 | ||||
| TOTAL SOUTH AFRICA | 82,299 | |||||
| Spain – 0.3% | ||||||
| Antena 3 Television SA | 274,232 | 5,332 | ||||
| Construcciones y Auxiliar de Ferrocarriles | 9,500 | 991 | ||||
| TOTAL SPAIN | 6,323 | |||||
See accompanying notes which are an integral part of the financial statements.
25 Annual Report
| Investments continued | ||||||
| Common Stocks continued | ||||||
| Shares | Value (Note 1) | |||||
| (000s) | ||||||
| Sweden – 1.9% | ||||||
| Consafe Offshore AB (A Shares) (a) | 1,103,172 | $ | 14,921 | |||
| Eniro AB (d) | 153,028 | 1,672 | ||||
| Gambro AB (A Shares) | 405,000 | 5,723 | ||||
| Hexagon AB (B Shares) (d) | 213,129 | 5,019 | ||||
| Intrum Justitia AB (a) | 375,200 | 3,205 | ||||
| Modern Times Group AB (MTG) (B Shares) (a) | 210,550 | 8,053 | ||||
| Observer AB | 1,180,035 | 3,987 | ||||
| VBG AB (B Shares) | 6,710 | 198 | ||||
| TOTAL SWEDEN | 42,778 | |||||
| Switzerland – 0.8% | ||||||
| Actelion Ltd. (Reg.) (a) | 18,108 | 2,037 | ||||
| Amazys Holding AG | 54,100 | 3,273 | ||||
| Barry Callebaut AG | 2,861 | 802 | ||||
| Bucher Holding AG | 31,439 | 2,512 | ||||
| Escor Casino & Entertainment SA | 19,770 | 395 | ||||
| Mobilezone Holding AG (a) | 462,199 | 1,757 | ||||
| Pargesa Holding SA | 14,130 | 1,091 | ||||
| Roche Holding AG (participation certificate) | 23,767 | 3,551 | ||||
| Sulzer AG (Reg.) | 2,648 | 1,274 | ||||
| Swissquote Group Holding SA (a) | 18,811 | 1,878 | ||||
| TOTAL SWITZERLAND | 18,570 | |||||
| Thailand – 0.1% | ||||||
| Bumrungrad Hospital PCL (For. Reg.) | 2,330,500 | 1,529 | ||||
| Turkey 1.4% | ||||||
| Atakule Gayrimenkul Yatirim Ortakligi AS | 1,033,000 | 871 | ||||
| Dogan Gazetecilik AS (a) | 3,601,955 | 7,622 | ||||
| Efes Sinai Yatirim Holding AS Class B (a) | 871,100 | 8,766 | ||||
| Enka Insaat ve Sanayi AS | 360,950 | 3,979 | ||||
| Tupras Turkiye Petrol Rafinerileri AS | 525,600 | 8,984 | ||||
| TOTAL TURKEY | 30,222 | |||||
| United Arab Emirates – 0.0% | ||||||
| Investcom LLC GDR | 45,600 | 616 | ||||
| United Kingdom – 15.3% | ||||||
| Abcam PLC | 417,239 | 1,234 | ||||
| Accuma Group PLC | 418,063 | 1,303 | ||||
| Advanced Technology (UK) PLC (a)(e) | 7,355,000 | 0 | ||||
| AeroBox PLC (a) | 5,694,657 | 706 | ||||
| Afren PLC (e) | 13,078,000 | 12,040 | ||||
See accompanying notes which are an integral part of the financial statements.
| Annual Report |
| 26 |
| Common Stocks continued | ||||||
| Shares | Value (Note 1) | |||||
| (000s) | ||||||
| United Kingdom – continued | ||||||
| African Copper PLC | 1,742,884 | $ | 1,450 | |||
| Air Partner PLC | 45,000 | 480 | ||||
| Alba PLC | 749,800 | 4,912 | ||||
| Alliance Pharma PLC (a)(e) | 9,049,400 | 2,924 | ||||
| Alterian PLC (a) | 1,486,000 | 3,026 | ||||
| Amlin PLC | 157,014 | 616 | ||||
| Andor Technology Ltd. | 444,444 | 803 | ||||
| Anglo Asian Mining PLC | 2,605,500 | 3,414 | ||||
| Appian Technology PLC (a) | 1,916,178 | 153 | ||||
| Appian Technology PLC warrants 2/28/08 (a)(g) | 479,045 | 0 | ||||
| Ascent Resources PLC (a)(e) | 12,000,000 | 2,603 | ||||
| Ascent Resources PLC warrants 6/2/07 (a) | 6,000,000 | 770 | ||||
| Asia Energy PLC (a) | 1,390,951 | 12,375 | ||||
| Atrium Underwriting PLC | 257,060 | 917 | ||||
| BG Group PLC | 441,600 | 3,878 | ||||
| Bioprogress PLC (a) | 4,376,349 | 2,479 | ||||
| Block Shield Corp. PLC (a) | 900,000 | 1,984 | ||||
| Body Shop International PLC | 800,000 | 2,974 | ||||
| BowLeven PLC | 1,407,600 | 9,158 | ||||
| British Energy Group PLC (a) | 274,800 | 2,160 | ||||
| Burren Energy PLC | 64,302 | 911 | ||||
| Caffe Nero Group PLC (a) | 282,978 | 1,250 | ||||
| Cambrian Mining PLC (a)(e) | 6,039,800 | 15,024 | ||||
| Cambrian Mining PLC warrants 1/25/06 (a) | 350,000 | 0 | ||||
| Cardpoint PLC (a) | 345,300 | 688 | ||||
| Central African Mining & Exploration Co. PLC (a) | 16,622,700 | 3,237 | ||||
| Centurion Electronics PLC (e) | 1,751,839 | 574 | ||||
| Ceres Power Holding PLC | 776,700 | 1,856 | ||||
| Chaco Resources PLC (f) | 9,500,000 | 1,009 | ||||
| Chaucer Holdings PLC | 5,079,800 | 4,789 | ||||
| Clapham House Group PLC (a) | 725,650 | 1,856 | ||||
| Cobra Biomanufacturing PLC (a) | 701,900 | 587 | ||||
| Coffeeheaven International PLC (a)(f) | 8,115,909 | 1,580 | ||||
| Corac Group PLC (a)(e) | 4,849,104 | 2,146 | ||||
| Corin Group PLC | 1,210,314 | 7,119 | ||||
| CSS Stellar PLC (a) | 598,908 | 414 | ||||
| CustomVis PLC (a) | 1,558,936 | 155 | ||||
| DA Group PLC (a)(e) | 1,875,165 | 2,490 | ||||
| Daniel Stewart Securities PLC (a) | 3,029,000 | 831 | ||||
| Dat Group PLC (e) | 1,806,000 | 1,263 | ||||
| Domino’s Pizza UK & IRL PLC | 383,626 | 2,004 | ||||
| Dream Direct Group PLC (a) | 145,000 | 245 | ||||
See accompanying notes which are an integral part of the financial statements.
27 Annual Report
| Investments continued | ||||||
| Common Stocks continued | ||||||
| Shares | Value (Note 1) | |||||
| (000s) | ||||||
| United Kingdom – continued | ||||||
| Eclipse Energy Co. Ltd. (g) | 102,000 | $ | 1,354 | |||
| Eureka Mining PLC (a) | 381,700 | 730 | ||||
| Europa Oil & Gas Holdings PLC | 1,000,000 | 549 | ||||
| Europa Oil & Gas Holdings PLC warrants 11/11/07 (a) | 500,000 | 86 | ||||
| European Diamonds PLC (a) | 499,300 | 194 | ||||
| Faroe Petroleum PLC (a) | 1,288,906 | 2,852 | ||||
| Firestone Diamonds PLC (a) | 687,000 | 1,745 | ||||
| Flomerics Group PLC | 449,658 | 637 | ||||
| Forum Energy PLC | 1,127,270 | 2,505 | ||||
| Freeport PLC | 256,276 | 1,894 | ||||
| Future PLC | 1,717,169 | 1,718 | ||||
| Gaming Corp. PLC (a) | 9,702,913 | 2,018 | ||||
| GMA Resources PLC (a)(e) | 12,545,265 | 1,527 | ||||
| GMA Resources PLC (a)(e)(f) | 12,100,818 | 1,499 | ||||
| Goals Soccer Centres PLC | 827,000 | 2,116 | ||||
| Golden Prospect PLC | 2,246,871 | 1,790 | ||||
| Goldshield Group PLC | 416,400 | 2,643 | ||||
| GTL Resources PLC (a) | 13,669,072 | 381 | ||||
| Gyrus Group PLC (a) | 434,400 | 2,457 | ||||
| Hardide Ltd. (e) | 12,401,000 | 2,909 | ||||
| Healthcare Enterprise Group PLC (a)(e) | 9,818,379 | 10,604 | ||||
| Highbury House Communications PLC (a) | 713,914 | 22 | ||||
| Hydrodec Group PLC (a) | 6,231,100 | 2,730 | ||||
| ID Data PLC (a)(e) | 84,350,500 | 1,344 | ||||
| Ideal Shopping Direct PLC | 235,339 | 1,419 | ||||
| Imperial College Innovations Ltd. (g) | 19,300 | 2,734 | ||||
| Inchcape PLC | 30,122 | 1,099 | ||||
| Intertek Group PLC | 116,310 | 1,467 | ||||
| IPSA Group PLC (e) | 4,074,075 | 2,128 | ||||
| ITE Group PLC | 4,436,717 | 8,876 | ||||
| ITM Power PLC (a) | 4,339,800 | 8,452 | ||||
| Jubilee Platinum PLC (a)(e) | 4,286,043 | 3,339 | ||||
| Lambert Howarth Group PLC (e) | 1,568,784 | 6,291 | ||||
| Landround PLC (e) | 298,600 | 582 | ||||
| Lawrence PLC | 1,073,124 | 6,431 | ||||
| LTG Technologies PLC (a) | 11,517,168 | 2,294 | ||||
| Manpower Software PLC (a) | 258,824 | 121 | ||||
| Meridian Petroleum PLC (a) | 2,747,000 | 377 | ||||
| Metals Exploration PLC (a)(e) | 2,820,077 | 624 | ||||
| Metals Exploration PLC warrants 9/14/07 (a) | 1,410,039 | 0 | ||||
| Mice Group PLC | 4,432,324 | 2,472 | ||||
| Michelmersh Brick Holdings PLC (a) | 578,900 | 1,010 | ||||
See accompanying notes which are an integral part of the financial statements.
| Annual Report |
| 28 |
| Common Stocks continued | ||||||
| Shares | Value (Note 1) | |||||
| (000s) | ||||||
| United Kingdom – continued | ||||||
| Monstermob Group PLC (a) | 226,461 | $ | 1,520 | |||
| NDS Group PLC sponsored ADR (a) | 105,154 | 3,849 | ||||
| NETeller PLC (a) | 263,100 | 3,209 | ||||
| NeuTec Pharma PLC (a) | 174,136 | 1,372 | ||||
| NeutraHealth PLC (a)(e) | 7,328,100 | 1,719 | ||||
| Oil Quest Resources PLC (a)(e) | 2,362,285 | 596 | ||||
| Oystertec PLC (a) | 7,009,687 | 1,365 | ||||
| P&MM Group PLC (a)(e) | 2,035,000 | 3,423 | ||||
| Phytopharm PLC (a) | 678,720 | 565 | ||||
| Pilat Media Global PLC (a)(e) | 2,880,000 | 2,244 | ||||
| Platinum Mining Corp. of India PLC (e) | 12,520,800 | 3,602 | ||||
| PlusNet Technologies Ltd. (a)(e) | 1,567,355 | 7,340 | ||||
| Premier Oil PLC (a) | 159,291 | 2,045 | ||||
| Primary Health Properties PLC | 80,000 | 494 | ||||
| Proteome Sciences PLC (a) | 623,042 | 750 | ||||
| Punch Graphix PLC | 92,458 | 209 | ||||
| Pureprofile Media PLC (g) | 680,000 | 602 | ||||
| Pureprofile Media PLC warrants 7/31/06 (a)(g) | 680,000 | 0 | ||||
| QA PLC (a) | 13,554,656 | 252 | ||||
| Rambler Metals & Mining PLC | 1,300,000 | 886 | ||||
| Retail Decisions PLC (f) | 7,007,400 | 2,605 | ||||
| Rheochem PLC (e) | 8,728,300 | 1,854 | ||||
| Rheochem PLC warrants 12/21/07 (a) | 4,364,150 | 0 | ||||
| Richmond Foods PLC | 81,813 | 742 | ||||
| Royalblue Group PLC | 45,073 | 519 | ||||
| Scapa Group PLC | 3,660,400 | 1,507 | ||||
| SDL PLC (a) | 1,450,000 | 4,005 | ||||
| Serabi Mining PLC | 2,612,400 | 1,237 | ||||
| Sibir Energy PLC (a) | 116,280 | 620 | ||||
| Sinclair Pharma PLC (a) | 1,786,758 | 4,160 | ||||
| Sondex PLC | 260,100 | 1,002 | ||||
| SPI Lasers PLC | 658,000 | 1,782 | ||||
| Spice Holdings PLC | 771,200 | 2,901 | ||||
| Sportingbet PLC | 345,100 | 1,799 | ||||
| Stem Cell Sciences PLC | 716,649 | 1,098 | ||||
| Sterling Energy PLC (a) | 8,837,667 | 2,660 | ||||
| SubSea Resources PLC (e) | 8,644,100 | 4,362 | ||||
| SubSea Resources PLC warrants 11/4/09 (a) | 1,805,625 | 360 | ||||
| Synergy Healthcare PLC | 314,553 | 2,345 | ||||
| Taghmen Energy PLC (a)(e) | 4,745,755 | 5,671 | ||||
| Taghmen Energy PLC warrants 4/30/07 (a) | 2,279,573 | 1,142 | ||||
| Tanfield Group PLC (a) | 8,653,000 | 2,911 | ||||
See accompanying notes which are an integral part of the financial statements.
29 Annual Report
| Investments continued | ||||||
| Common Stocks continued | ||||||
| Shares | Value (Note 1) | |||||
| (000s) | ||||||
| United Kingdom – continued | ||||||
| Teesland PLC | 1,380,000 | $ | 2,003 | |||
| Tikit Group PLC (e) | 720,362 | 2,436 | ||||
| TMO Biotec (g) | 10,000 | 531 | ||||
| Toledo Mining Corp. PLC (a) | 480,000 | 982 | ||||
| Triple Plate Junction PLC (a) | 3,638,000 | 1,353 | ||||
| Triple Plate Junction PLC warrants 12/31/05 (a) | 1,818,750 | 0 | ||||
| Tristel PLC | 561,318 | 601 | ||||
| UK Coal PLC | 1,087,069 | 2,762 | ||||
| ukbetting PLC (a) | 2,517,419 | 2,630 | ||||
| Unibet Group PLC unit | 474,256 | 9,888 | ||||
| Whatman PLC | 280,100 | 1,389 | ||||
| White Nile Ltd. (a) | 200,000 | 351 | ||||
| William Ransom & Son PLC | 3,629,500 | 2,988 | ||||
| Windsor PLC | 700,000 | 598 | ||||
| Wolfson Microelectronics PLC (a) | 685,250 | 3,015 | ||||
| World Gaming PLC (a) | 1,332,300 | 3,951 | ||||
| ZincOx Resources PLC (a) | 970,000 | 2,619 | ||||
| TOTAL UNITED KINGDOM | 337,828 | |||||
| United States of America – 1.7% | ||||||
| 121Media, Inc. (e) | 603,205 | 1,832 | ||||
| Central European Distribution Corp. (a) | 49,300 | 1,963 | ||||
| Chindex International, Inc. (a)(d) | 138,900 | 511 | ||||
| Cyberscan Technology, Inc. | 158,400 | 1,725 | ||||
| Frontera Resources Corp. | 2,300,000 | 5,131 | ||||
| Frontier Mining Ltd. (a)(e) | 6,115,691 | 2,220 | ||||
| GeoGlobal Resources, Inc. (a)(d) | 351,900 | 2,235 | ||||
| Marathon Oil Corp. | 39,900 | 2,400 | ||||
| Private Media Group, Inc. (a)(d) | 283,400 | 621 | ||||
| Solar Integrated Technologies, Inc. (a) | 1,643,073 | 4,727 | ||||
| Trico Marine Services, Inc. (a) | 67,200 | 1,713 | ||||
| Uranco, Inc. (a)(g) | 1,333,332 | 1,000 | ||||
| Uranco, Inc. warrants 7/26/08 (a)(g) | 666,666 | 0 | ||||
| UTEK Corp. (Reg. S) | 34,942 | 414 | ||||
| Valero Energy Corp. | 41,400 | 4,357 | ||||
| XL TechGroup, Inc. | 1,442,680 | 6,769 | ||||
| TOTAL UNITED STATES OF AMERICA | 37,618 | |||||
| TOTAL COMMON STOCKS | ||||||
| (Cost $1,812,433) | 2,155,033 | |||||
See accompanying notes which are an integral part of the financial statements.
| Annual Report |
| 30 |
| Nonconvertible Preferred Stocks 0.4% | ||||||||
| Shares | Value (Note 1) | |||||||
| (000s) | ||||||||
| Germany – 0.4% | ||||||||
| Fresenius AG | ||||||||
| (Cost $3,683) | 57,705 | $ | 8,107 | |||||
| Investment Companies 0.0% | ||||||||
| United Kingdom – 0.0% | ||||||||
| Black Sea Property Fund Ltd. | ||||||||
| (Cost $1,166) | 3,036,200 | 1,223 | ||||||
| Corporate Bonds 0.1% | ||||||||
| Principal | ||||||||
| Amount (000s) | ||||||||
| Convertible Bonds 0.1% | ||||||||
| United Kingdom – 0.1% | ||||||||
| BioCare Solutions Ltd. 1% 12/31/06 (g) | GBP | $ | 54,768 | 970 | ||||
| Nonconvertible Bonds – 0.0% | ||||||||
| Norway 0.0% | ||||||||
| Songa Offshore ASA 9% 9/8/10 (g) | 600 | 582 | ||||||
| TOTAL CORPORATE BONDS | ||||||||
| (Cost $1,574) | 1,552 | |||||||
| Money Market Funds 6.9% | ||||||||
| Shares | ||||||||
| Fidelity Cash Central Fund, 3.92% (b) | 36,414,099 | 36,414 | ||||||
| Fidelity Securities Lending Cash Central Fund, 3.94% (b)(c) | 115,371,226 | 115,371 | ||||||
| TOTAL MONEY MARKET FUNDS | ||||||||
| (Cost $151,785) | 151,785 | |||||||
| TOTAL INVESTMENT PORTFOLIO 104.8% | ||||||||
| (Cost $1,970,641) | 2,317,700 | |||||||
| NET OTHER ASSETS – (4.8)% | (105,340) | |||||||
| NET ASSETS 100% | $ | 2,212,360 | ||||||
See accompanying notes which are an integral part of the financial statements.
31 Annual Report
Investments continued
| Currency Abbreviations |
| GBP — British pound |
| Legend (a) Non-income producing (b) Affiliated fund that is available only to investment companies and other accounts managed by Fidelity Investments. The rate quoted is the annualized seven-day yield of the fund at period end. A complete unaudited listing of the fund’s holdings as of its most recent quarter end is available upon request. (c) Investment made with cash collateral received from securities on loan. (d) Security or a portion of the security is on loan at period end. (e) Affiliated company (f) Security purchased on a delayed delivery or when-issued basis. (g) Restricted securities – Investment in securities not registered under the Securities Act of 1933 (excluding 144A issues). At the end of the period, the value of restricted securities (excluding 144A issues) amounted to $11,520,000 or 0.5% of net assets. |
Additional information on each holding is as follows:
| Acquisition | Acquisition | |||||
| Security | Date | Cost (000s) | ||||
| Appian | ||||||
| Technology PLC | ||||||
| warrants | ||||||
| 2/28/08 | 2/18/05 | $ | — | |||
| BioCare Solutions | ||||||
| Ltd. 1% | ||||||
| 12/31/06 | 8/3/05 | $ | 974 | |||
| Eclipse Energy | ||||||
| Co. Ltd. | 4/28/05 | $ | 1,459 | |||
| Imperial College | ||||||
| Innovations Ltd. | 4/27/05 | $ | 2,942 | |||
| Pertra Midt | ||||||
| Norges AS | 6/28/05 | $ | 911 | |||
| Pureprofile Media | ||||||
| PLC | 5/3/05 | $ | 644 | |||
| Pureprofile Media | ||||||
| PLC warrants | ||||||
| 7/31/06 | 5/3/05 | $ | — | |||
| SeaDrill Ltd. | 8/23/05 | $ | 3,384 | |||
| Songa Offshore | ||||||
| ASA warrants | ||||||
| 5/20/08 | 6/8/05 | $ | — | |||
| Songa Offshore | ||||||
| ASA 9% 9/8/10 | 6/8/05 | $ | 600 | |||
| TMO Biotec | 10/27/05 | $ | 535 | |||
| Uranco, Inc. | 8/24/05 | $ | 1,000 | |||
| Uranco, Inc. | ||||||
| warrants | ||||||
| 7/26/08 | 8/24/05 | $ | — | |||
See accompanying notes which are an integral part of the financial statements.
Annual Report 32
| Other Information |
An affiliated company is a company in which the fund has ownership of at least 5% of the voting securities. Companies which are affiliates of the fund at period-end are noted in the fund’s Schedule of Investments. Transactions during the period with companies which are or were affiliates are as follows:
| Value, | Value, | |||||||||||||||||||||||
| Affiliates | beginning | Purchases | Sales | Dividend | end of | |||||||||||||||||||
| (Amounts in thousands) | of period | Proceeds | Income | period | ||||||||||||||||||||
| 121Media, Inc | $ | — | $ | 2,700 | $ | — | $ | — | $ | 1,832 | ||||||||||||||
| Advanced Technology (UK) PLC | 558 | |||||||||||||||||||||||
| Adwalker PLC | — | 1,291 | — | — | 1,292 | |||||||||||||||||||
| Afren PLC | — | 3,214 | 328 | — | 12,040 | |||||||||||||||||||
| Alliance Pharma PLC | 1,812 | 835 | 295 | — | 2,924 | |||||||||||||||||||
| Ascent Resources PLC | — | 994 | — | — | 2,603 | |||||||||||||||||||
| Aztec Resources Ltd. | — | 5,036 | 4,111 | — | — | |||||||||||||||||||
| BDI Mining Corp. | — | 4,713 | — | — | 4,646 | |||||||||||||||||||
| Cambrian Mining PLC | — | 17,979 | — | — | 15,024 | |||||||||||||||||||
| Centurion Electronics PLC | — | 1,979 | — | 15 | 574 | |||||||||||||||||||
| Corac Group PLC | 2,460 | 92 | — | — | 2,146 | |||||||||||||||||||
| DA Group PLC | — | 2,300 | 618 | — | 2,490 | |||||||||||||||||||
| Dat Group PLC | — | 1,746 | — | — | 1,263 | |||||||||||||||||||
| Fox Resources Ltd. | 487 | 1,126 | — | — | 844 | |||||||||||||||||||
| Frontier Mining Ltd. | 1,443 | 774 | — | — | 2,220 | |||||||||||||||||||
| GMA Resources PLC | 1,955 | 1,011 | — | — | 3,026 | |||||||||||||||||||
| Hardide Ltd. | 919 | 992 | — | — | 2,909 | |||||||||||||||||||
| Healthcare Enterprise Group PLC | 1,062 | 10,275 | 1,111 | 10,604 | ||||||||||||||||||||
| HudBay Minerals, Inc. (formerly | ||||||||||||||||||||||||
| Ontzinc Corp.) | 1,841 | 1,328 | ||||||||||||||||||||||
| ID Data PLC | — | 1,500 | — | — | 1,344 | |||||||||||||||||||
| International Ferro Metals | — | 16,293 | — | — | 15,854 | |||||||||||||||||||
| IPSA Group PLC | — | 2,006 | — | — | 2,128 | |||||||||||||||||||
| Jubilee Platinum PLC | 1,823 | 728 | 463 | — | 3,339 | |||||||||||||||||||
| Kura Corp. Ltd. | 2,689 | 7,354 | 246 | 17 | 18,905 | |||||||||||||||||||
| Lambert Howarth Group PLC | 6,551 | 1,164 | — | 276 | 6,291 | |||||||||||||||||||
| Landround PLC | 345 | 958 | — | 16 | 582 | |||||||||||||||||||
| Leadcom Integrated Solutions | — | 3,139 | — | — | 4,705 | |||||||||||||||||||
| Metals Exploration PLC | — | 414 | — | — | 624 | |||||||||||||||||||
| NeutraHealth PLC | — | 1,375 | — | — | 1,719 | |||||||||||||||||||
| Oil Quest Resources PLC | 167 | 874 | — | — | 596 | |||||||||||||||||||
| P&MM Group PLC | 2,300 | — | — | — | 3,423 | |||||||||||||||||||
| Pilat Media Global PLC | 2,196 | — | — | — | 2,244 | |||||||||||||||||||
| Platinum Mining Corp. of India PLC | 4,947 | 3,602 | ||||||||||||||||||||||
| PlusNet Technologies Ltd. | 2,347 | 2,232 | — | — | 7,340 | |||||||||||||||||||
| PSI AG | 992 | 2,473 | — | — | 3,396 | |||||||||||||||||||
| Rheochem PLC | — | 2,692 | — | — | 1,854 | |||||||||||||||||||
| Sphere Investments Ltd | — | 2,806 | — | — | 2,552 | |||||||||||||||||||
| Starfield Resources, Inc. | — | 4,728 | — | — | 3,741 | |||||||||||||||||||
See accompanying notes which are an integral part of the financial statements.
33 Annual Report
| Investments continued | ||||||||||||||||||
| Value, | Value, | |||||||||||||||||
| Affiliates | beginning | Purchases | Sales | Dividend | end of | |||||||||||||
| (Amounts in thousands) | of period | proceeds | Income | period | ||||||||||||||
| Stepstone ASA | $ | — | $ 5,430 | $ | — | $ | — | $ 5,719 | ||||||||||
| SubSea Resources PLC | 2,654 | 560 | — | — | 4,362 | |||||||||||||
| Sylvania Resources Ltd. | — | 2,450 | — | — | 2,738 | |||||||||||||
| Taghmen Energy PLC | 1,482 | 2,386 | — | — | 5,671 | |||||||||||||
| Tanfield Group PLC | — | 3,135 | 212 | — | — | |||||||||||||
| Teleunit Spa | 2,572 | 1,019 | — | — | 3,683 | |||||||||||||
| Tikit Group PLC | 2,155 | — | 349 | 32 | 2,436 | |||||||||||||
| William Ransom & Son PLC | 2,393 | 686 | — | 93 | — | |||||||||||||
| Total | $ | 43,203 | $ 128,406 | $ | 9,061 | $ | 449 | $ 175,285 | ||||||||||
See accompanying notes which are an integral part of the financial statements.
| Annual Report |
| 34 |
| Financial Statements | ||||||||
| Statement of Assets and Liabilities | ||||||||
| Amounts in thousands (except per share amounts) | October 31, 2005 | |||||||
| Assets | ||||||||
| Investment in securities, at value (including securities | ||||||||
| loaned of $109,541) (cost $1,970,641) See | ||||||||
| accompanying schedule | $ | 2,317,700 | ||||||
| Cash | 893 | |||||||
| Foreign currency held at value (cost $5,825) | 5,813 | |||||||
| Receivable for investments sold | 30,832 | |||||||
| Receivable for fund shares sold | 4,525 | |||||||
| Dividends receivable | 2,621 | |||||||
| Interest receivable | 141 | |||||||
| Receivable from investment adviser for expense | ||||||||
| reductions | 24 | |||||||
| Other affiliated receivables | 11 | |||||||
| Other receivables | 128 | |||||||
| Total assets | 2,362,688 | |||||||
| Liabilities | ||||||||
| Payable for investments purchased | ||||||||
| Regular delivery | $ | 18,168 | ||||||
| Delayed delivery | 11,013 | |||||||
| Payable for fund shares redeemed | 2,790 | |||||||
| Accrued management fee | 1,791 | |||||||
| Distribution fees payable | 57 | |||||||
| Other affiliated payables | 488 | |||||||
| Other payables and accrued expenses | 650 | |||||||
| Collateral on securities loaned, at value | 115,371 | |||||||
| Total liabilities | 150,328 | |||||||
| Net Assets | $ | 2,212,360 | ||||||
| Net Assets consist of: | ||||||||
| Paid in capital | $ | 1,615,845 | ||||||
| Undistributed net investment income | 10,862 | |||||||
| Accumulated undistributed net realized gain (loss) on | ||||||||
| investments and foreign currency transactions | 238,932 | |||||||
| Net unrealized appreciation (depreciation) on | ||||||||
| investments and assets and liabilities in foreign | ||||||||
| currencies | 346,721 | |||||||
| Net Assets | $ | 2,212,360 | ||||||
See accompanying notes which are an integral part of the financial statements.
35 Annual Report
| Financial Statements continued | ||||
| Statement of Assets and Liabilities | ||||
| Amounts in thousands (except per share amounts) | October 31, 2005 | |||
| Calculation of Maximum Offering Price | ||||
| Class A: | ||||
| Net Asset Value and redemption price per share | ||||
| ($34,838 ÷ 1,305.2 shares) | $ | 26.69 | ||
| Maximum offering price per share (100/94.25 of | ||||
| $26.69) | $ | 28.32 | ||
| Class T: | ||||
| Net Asset Value and redemption price per share | ||||
| ($41,647 ÷ 1,567.2 shares) | $ | 26.57 | ||
| Maximum offering price per share (100/96.50 of | ||||
| $26.57) | $ | 27.53 | ||
| Class B: | ||||
| Net Asset Value and offering price per share | ||||
| ($12,783 ÷ 487.2 shares)A | $ | 26.24 | ||
| Class C: | ||||
| Net Asset Value and offering price per share | ||||
| ($25,202 ÷ 958 shares)A | $ | 26.31 | ||
| International Small Cap: | ||||
| Net Asset Value, offering price and redemption | ||||
| price per share ($2,090,458 ÷ 77,754 shares) | $ | 26.89 | ||
| Institutional Class: | ||||
| Net Asset Value, offering price and redemption | ||||
| price per share ($7,432 ÷ 276.7 shares) | $ | 26.86 | ||
| A Redemption price per share is equal to net asset value less any applicable contingent deferred sales charge. | ||||
See accompanying notes which are an integral part of the financial statements.
Annual Report 36
| Statement of Operations | ||||||
| Amounts in thousands | Year ended October 31, 2005 | |||||
| Investment Income | ||||||
| Dividends (including $449 received from affiliated | ||||||
| issuers) | $ | 33,339 | ||||
| Interest | 1,852 | |||||
| Security lending | 2,630 | |||||
| 37,821 | ||||||
| Less foreign taxes withheld | (1,995) | |||||
| Total income | 35,826 | |||||
| Expenses | ||||||
| Management fee | ||||||
| Basic fee | $ | 16,972 | ||||
| Performance adjustment | 1,557 | |||||
| Transfer agent fees | 4,209 | |||||
| Distribution fees | 534 | |||||
| Accounting and security lending fees | 939 | |||||
| Independent trustees’ compensation | 9 | |||||
| Custodian fees and expenses | 1,029 | |||||
| Registration fees | 264 | |||||
| Audit | 60 | |||||
| Legal | 13 | |||||
| Miscellaneous | 24 | |||||
| Total expenses before reductions | 25,610 | |||||
| Expense reductions | (646) | 24,964 | ||||
| Net investment income (loss) | 10,862 | |||||
| Realized and Unrealized Gain (Loss) | ||||||
| Net realized gain (loss) on: | ||||||
| Investment securities (net of foreign taxes of $1,158) | ||||||
| (Including realized gain (loss) of $(47) from affili- | ||||||
| ated issuers) | 242,909 | |||||
| Foreign currency transactions | (671) | |||||
| Total net realized gain (loss) | 242,238 | |||||
| Change in net unrealized appreciation (depreciation) on: | ||||||
| Investment securities (net of increase in deferred for- | ||||||
| eign taxes of $297) | 169,298 | |||||
| Assets and liabilities in foreign currencies | (50) | |||||
| Total change in net unrealized appreciation | ||||||
| (depreciation) | 169,248 | |||||
| Net gain (loss) | 411,486 | |||||
| Net increase (decrease) in net assets resulting from | ||||||
| operations | $ | 422,348 | ||||
See accompanying notes which are an integral part of the financial statements.
37 Annual Report
| Financial Statements continued | ||||||||
| Statement of Changes in Net Assets | ||||||||
| Year ended | Year ended | |||||||
| October 31, | October 31, | |||||||
| Amounts in thousands | 2005 | 2004 | ||||||
| Increase (Decrease) in Net Assets | ||||||||
| Operations | ||||||||
| Net investment income (loss) | $ | 10,862 | $ | 4,864 | ||||
| Net realized gain (loss) | 242,238 | 55,700 | ||||||
| Change in net unrealized appreciation (depreciation) . | 169,248 | 104,988 | ||||||
| Net increase (decrease) in net assets resulting | ||||||||
| from operations | 422,348 | 165,552 | ||||||
| Distributions to shareholders from net investment income . | (3,406) | (741) | ||||||
| Distributions to shareholders from net realized gain | (45,235) | (11,573) | ||||||
| Total distributions | (48,641) | (12,314) | ||||||
| Share transactions - net increase (decrease) | 701,403 | 422,160 | ||||||
| Redemption fees | 1,213 | 1,900 | ||||||
| Total increase (decrease) in net assets | 1,076,323 | 577,298 | ||||||
| Net Assets | ||||||||
| Beginning of period | 1,136,037 | 558,739 | ||||||
| End of period (including undistributed net investment | ||||||||
| income of $10,862 and undistributed net investment | ||||||||
| income of $5,018, respectively) | $ | 2,212,360 | $ | 1,136,037 | ||||
See accompanying notes which are an integral part of the financial statements.
| Annual Report |
| 38 |
| Financial Highlights Class A | ||||||||||||
| Years ended October 31, | 2005 | 2004 | 2003G | |||||||||
| Selected Per Share Data | ||||||||||||
| Net asset value, beginning of period | $ | 21.25 | $ | 17.69 | $ | 12.35 | ||||||
| Income from Investment Operations | ||||||||||||
| Net investment income (loss)E | 05 | .02 | .02F | |||||||||
| Net realized and unrealized gain (loss) | 6.16 | 3.83 | 5.30 | |||||||||
| Total from investment operations | 6.21 | 3.85 | 5.32 | |||||||||
| Distributions from net investment income | (.02) | (.02) | — | |||||||||
| Distributions from net realized gain | (.77) | (.31) | — | |||||||||
| Total distributions | (.79) | (.33) | — | |||||||||
| Redemption fees added to paid in capitalE | 02 | .04 | .02 | |||||||||
| Net asset value, end of period | $ | 26.69 | $ | 21.25 | $ | 17.71 | ||||||
| Total ReturnB,C,D | 30.16% | 22.36% | 43.24% | |||||||||
| Ratios to Average Net AssetsH | ||||||||||||
| Expenses before expense reductions | 1.66% | 1.71% | 1.77%A | |||||||||
| Expenses net of voluntary waivers, if any | 1.66% | 1.71% | 1.77%A | |||||||||
| Expenses net of all reductions | 1.63% | 1.69% | 1.74%A | |||||||||
| Net investment income (loss) | 21% | .09% | .28%A | |||||||||
| Supplemental Data | ||||||||||||
| Net assets, end of period (in millions) | $ | 35 | $ | 13 | $ | 5 | ||||||
| Portfolio turnover rate | 79% | 77% | 84%A | |||||||||
| A Annualized B Total returns for periods of less than one year are not annualized. C Total returns would have been lower had certain expenses not been reduced during the periods shown. D Total returns do not include the effect of the sales charges. E Calculated based on average shares outstanding during the period. F Investment income per share reflects a special dividend which amounted to $.01 per share. G For the period May 27, 2003 (commencement of sale of shares) to October 31, 2003. H Expense ratios reflect operating expenses of the class. Expenses before reductions do not reflect amounts reimbursed by the investment adviser or reductions from brokerage service arrangements or other expense offset arrangements and do not represent the amount paid by the class during periods when reimbursements or reductions occur. Expense ratios before reductions for start up periods may not be representative of longer term operating periods. Expenses net of any voluntary waivers reflect expenses after reimbursement by the investment adviser but prior to reductions from brokerage service arrangements or other expense offset arrangements. Expenses net of all reductions represent the net expenses paid by the class. |
See accompanying notes which are an integral part of the financial statements.
39 Annual Report
| Financial Highlights Class T | ||||||||||||
| Years ended October 31, | 2005 | 2004 | 2003G | |||||||||
| Selected Per Share Data | ||||||||||||
| Net asset value, beginning of period | $ | 21.20 | $ | 17.68 | $ | 12.35 | ||||||
| Income from Investment Operations | ||||||||||||
| Net investment income (loss)E | (.01) | (.03) | —F,I | |||||||||
| Net realized and unrealized gain (loss) | 6.12 | 3.83 | 5.31 | |||||||||
| Total from investment operations | 6.11 | 3.80 | 5.31 | |||||||||
| Distributions from net investment income | — | (.01) | — | |||||||||
| Distributions from net realized gain | (.76) | (.31) | — | |||||||||
| Total distributions | (.76) | (.32) | — | |||||||||
| Redemption fees added to paid in capitalE | 02 | .04 | .02 | |||||||||
| Net asset value, end of period | $ | 26.57 | $ | 21.20 | $ | 17.65 | ||||||
| Total ReturnB,C,D | 29.72% | 22.07% | 43.16% | |||||||||
| Ratios to Average Net AssetsH | ||||||||||||
| Expenses before expense reductions | 1.92% | 1.94% | 2.12%A | |||||||||
| Expenses net of voluntary waivers, if any | 1.91% | 1.94% | 2.12%A | |||||||||
| Expenses net of all reductions | 1.88% | 1.92% | 2.09%A | |||||||||
| Net investment income (loss) | (.04)% | (.14)% | (.07)%A | |||||||||
| Supplemental Data | ||||||||||||
| Net assets, end of period (in millions) | $ | 42 | $ | 15 | $ | 4 | ||||||
| Portfolio turnover rate | 79% | 77% | 84%A | |||||||||
| A Annualized B Total returns for periods of less than one year are not annualized. C Total returns would have been lower had certain expenses not been reduced during the periods shown. D Total returns do not include the effect of the sales charges. E Calculated based on average shares outstanding during the period. F Investment income per share reflects a special dividend which amounted to $.01 per share. G For the period May 27, 2003 (commencement of sale of shares) to October 31, 2003. H Expense ratios reflect operating expenses of the class. Expenses before reductions do not reflect amounts reimbursed by the investment adviser or reductions from brokerage service arrangements or other expense offset arrangements and do not represent the amount paid by the class during periods when reimbursements or reductions occur. Expense ratios before reductions for start up periods may not be representative of longer term operating periods. Expenses net of any voluntary waivers reflect expenses after reimbursement by the investment adviser but prior to reductions from brokerage service arrangements or other expense offset arrangements. Expenses net of all reductions represent the net expenses paid by the class. I Amount represents less than $.01 per share. |
See accompanying notes which are an integral part of the financial statements.
| Annual Report |
| 40 |
| Financial Highlights Class B | ||||||||||||
| Years ended October 31, | 2005 | 2004 | 2003G | |||||||||
| Selected Per Share Data | ||||||||||||
| Net asset value, beginning of period | $ | 20.99 | $ | 17.62 | $ | 12.35 | ||||||
| Income from Investment Operations | ||||||||||||
| Net investment income (loss)E | (.14) | (.16) | (.05)F | |||||||||
| Net realized and unrealized gain (loss) | 6.08 | 3.80 | 5.30 | |||||||||
| Total from investment operations | 5.94 | 3.64 | 5.25 | |||||||||
| Distributions from net realized gain | (.71) | (.31) | — | |||||||||
| Redemption fees added to paid in capitalE | 02 | .04 | .02 | |||||||||
| Net asset value, end of period | $ | 26.24 | $ | 20.99 | $ | 17.52 | ||||||
| Total ReturnB,C,D | 29.13% | 21.21% | 42.67% | |||||||||
| Ratios to Average Net AssetsH | ||||||||||||
| Expenses before expense reductions | 2.49% | 2.63% | 2.76%A | |||||||||
| Expenses net of voluntary waivers, if any | 2.43% | 2.63% | 2.76%A | |||||||||
| Expenses net of all reductions | 2.40% | 2.60% | 2.73%A | |||||||||
| Net investment income (loss) | (.56)% | (.83)% | (.71)%A | |||||||||
| Supplemental Data | ||||||||||||
| Net assets, end of period (in millions) | $ | 13 | $ | 5 | $ | 1 | ||||||
| Portfolio turnover rate | 79% | 77% | 84%A | |||||||||
| A Annualized B Total returns for periods of less than one year are not annualized. C Total returns would have been lower had certain expenses not been reduced during the periods shown. D Total returns do not include the effect of the contingent deferred sales charge. E Calculated based on average shares outstanding during the period. F Investment income per share reflects special dividend which amounted to $.01 per share. G For the period May 27, 2003 (commencement of sale of shares) to October 31, 2003. H Expense ratios reflect operating expenses of the class. Expenses before reductions do not reflect amounts reimbursed by the investment adviser or reductions from brokerage service arrangements or other expense offset arrangements and do not represent the amount paid by the class during periods when reimbursements or reductions occur. Expense ratios before reductions for start up periods may not be representative of longer term operating periods. Expenses net of any voluntary waivers reflect expenses after reimbursement by the investment adviser but prior to reductions from brokerage service arrangements or other expense offset arrangements. Expenses net of all reductions represent the net expenses paid by the class. |
See accompanying notes which are an integral part of the financial statements.
41 Annual Report
| Financial Highlights Class C | ||||||||||||
| Years ended October 31, | 2005 | 2004 | 2003G | |||||||||
| Selected Per Share Data | ||||||||||||
| Net asset value, beginning of period | $ | 21.04 | $ | 17.64 | $ | 12.35 | ||||||
| Income from Investment Operations | ||||||||||||
| Net investment income (loss)E | (.13) | (.12) | (.04)F | |||||||||
| Net realized and unrealized gain (loss) | 6.10 | 3.80 | 5.31 | |||||||||
| Total from investment operations | 5.97 | 3.68 | 5.27 | |||||||||
| Distributions from net investment income | — | (.01) | — | |||||||||
| Distributions from net realized gain | (.72) | (.31) | — | |||||||||
| Total distributions | (.72) | (.32) | — | |||||||||
| Redemption fees added to paid in capitalE | 02 | .04 | .02 | |||||||||
| Net asset value, end of period | $ | 26.31 | $ | 21.04 | $ | 17.73 | ||||||
| Total ReturnB,C,D | 29.22% | 21.43% | 42.83% | |||||||||
| Ratios to Average Net AssetsH | ||||||||||||
| Expenses before expense reductions | 2.41% | 2.43% | 2.57%A | |||||||||
| Expenses net of voluntary waivers, if any | 2.41% | 2.43% | 2.57%A | |||||||||
| Expenses net of all reductions | 2.38% | 2.40% | 2.55%A | |||||||||
| Net investment income (loss) | (.54)% | (.62)% | (.52)%A | |||||||||
| Supplemental Data | ||||||||||||
| Net assets, end of period (in millions) | $ | 25 | $ | 9 | $ | 1 | ||||||
| Portfolio turnover rate | 79% | 77% | 84%A | |||||||||
| A Annualized B Total returns for periods of less than one year are not annualized. C Total returns would have been lower had certain expenses not been reduced during the periods shown. D Total returns do not include the effect of the contingent deferred sales charge. E Calculated based on average shares outstanding during the period. F Investment income per share reflects a special dividend which amounted to $.01 per share. G For the period May 27, 2003 (commencement of sale of shares) to October 31, 2003. H Expense ratios reflect operating expenses of the class. Expenses before reductions do not reflect amounts reimbursed by the investment adviser or reductions from brokerage service arrangements or other expense offset arrangements and do not represent the amount paid by the class during periods when reimbursements or reductions occur. Expense ratios before reductions for start up periods may not be representative of longer term operating periods. Expenses net of any voluntary waivers reflect expenses after reimbursement by the investment adviser but prior to reductions from brokerage service arrangements or other expense offset arrangements. Expenses net of all reductions represent the net expenses paid by the class. |
See accompanying notes which are an integral part of the financial statements.
| Annual Report |
| 42 |
| Financial Highlights International Small Cap | ||||||||||||||||
| Years ended October 31, | 2005 | 2004 | 2003 | 2002F | ||||||||||||
| Selected Per Share Data | ||||||||||||||||
| Net asset value, beginning of period | $ | 21.36 | $ | 17.71 | $ | 9.87 | $ | 10.00 | ||||||||
| Income from Investment Operations | ||||||||||||||||
| Net investment income (loss)D | 15 | .10 | .07E | (.01) | ||||||||||||
| Net realized and unrealized gain (loss) | 6.19 | 3.84 | 7.75 | (.12) | ||||||||||||
| Total from investment operations | 6.34 | 3.94 | 7.82 | (.13) | ||||||||||||
| Distributions from net investment income | (.06) | (.02) | — | — | ||||||||||||
| Distributions from net realized gain | (.77) | (.31) | (.02) | — | ||||||||||||
| Total distributions | (.83) | (.33) | (.02) | — | ||||||||||||
| Redemption fees added to paid in capitalD | 02 | .04 | .04 | H | ||||||||||||
| Net asset value, end of period | $ | 26.89 | $ | 21.36 | $ | 17.71 | $ | 9.87 | ||||||||
| Total ReturnB,C | 30.67% | 22.84% | 79.78% | (1.30)% | ||||||||||||
| Ratios to Average Net AssetsG | ||||||||||||||||
| Expenses before expense reductions | 1.28% | 1.30% | 1.54% | 13.70%A | ||||||||||||
| Expenses net of voluntary waivers, if any | 1.28% | 1.30% | 1.54% | 1.80%A | ||||||||||||
| Expenses net of all reductions | 1.25% | 1.28% | 1.51% | 1.80%A | ||||||||||||
| Net investment income (loss) | 59% | .50% | .46% | (.56)%A | ||||||||||||
| Supplemental Data | ||||||||||||||||
| Net assets, end of period (in millions) | $ | 2,090 | $ | 1,091 | $ | 547 | $ | 3 | ||||||||
| Portfolio turnover rate | 79% | 77% | 84% | 85%A | ||||||||||||
| A Annualized B Total returns for periods of less than one year are not annualized. C Total returns would have been lower had certain expenses not been reduced during the periods shown. D Calculated based on average shares outstanding during the period. E Investment income per share reflects a special dividend which amounted to $.03 per share. F For the period September 18, 2002 (commencement of operations) to October 31, 2002. G Expense ratios reflect operating expenses of the class. Expenses before reductions do not reflect amounts reimbursed by the investment adviser or reductions from brokerage service arrangements or other expense offset arrangements and do not represent the amount paid by the class during periods when reimbursements or reductions occur. Expense ratios before reductions for start up periods may not be representative of longer term operating periods. Expenses net of any voluntary waivers reflect expenses after reimbursement by the investment adviser but prior to reductions from brokerage service arrangements or other expense offset arrangements. Expenses net of all reductions represent the net expenses paid by the class. H Amount represents less than $.01 per share. |
See accompanying notes which are an integral part of the financial statements.
43 Annual Report
| Financial Highlights Institutional Class | ||||||||||||
| Years ended October 31, | 2005 | 2004 | 2003F | |||||||||
| Selected Per Share Data | ||||||||||||
| Net asset value, beginning of period | $ | 21.36 | $ | 17.72 | $ | 12.35 | ||||||
| Income from Investment Operations | ||||||||||||
| Net investment income (loss)D | 14 | .10 | .04E | |||||||||
| Net realized and unrealized gain (loss) | 6.18 | 3.84 | 5.31 | |||||||||
| Total from investment operations | 6.32 | 3.94 | 5.35 | |||||||||
| Distributions from net investment income | (.07) | (.03) | — | |||||||||
| Distributions from net realized gain | (.77) | (.31) | — | |||||||||
| Total distributions | (.84) | (.34) | — | |||||||||
| Redemption fees added to paid in capitalD | 02 | .04 | .02 | |||||||||
| Net asset value, end of period | $ | 26.86 | $ | 21.36 | $ | 17.72 | ||||||
| Total ReturnB,C | 30.59% | 22.84% | 43.48% | |||||||||
| Ratios to Average Net AssetsG | ||||||||||||
| Expenses before expense reductions | 1.30% | 1.32% | 1.51%A | |||||||||
| Expenses net of voluntary waivers, if any | 1.30% | 1.32% | 1.51%A | |||||||||
| Expenses net of all reductions | 1.27% | 1.29% | 1.48%A | |||||||||
| Net investment income (loss) | 57% | .49% | .54%A | |||||||||
| Supplemental Data | ||||||||||||
| Net assets, end of period (in millions) | $ | 7 | $ | 3 | $ | .4 | ||||||
| Portfolio turnover rate | 79% | 77% | 84%A |
| A Annualized B Total returns for periods of less than one year are not annualized. C Total returns would have been lower had certain expenses not been reduced during the periods shown. D Calculated based on average shares outstanding during the period. E Investment income per share reflects a special dividend which amounted to $.01 per share. F For the period May 27, 2003 (commencement of sale of shares) to October 31, 2003. G Expense ratios reflect operating expenses of the class. Expenses before reductions do not reflect amounts reimbursed by the investment adviser or reductions from brokerage service arrangements or other expense offset arrangements and do not represent the amount paid by the class during periods when reimbursements or reductions occur. Expense ratios before reductions for start up periods may not be representative of longer term operating periods. Expenses net of any voluntary waivers reflect expenses after reimbursement by the investment adviser but prior to reductions from brokerage service arrangements or other expense offset arrangements. Expenses net of all reductions represent the net expenses paid by the class. |
See accompanying notes which are an integral part of the financial statements.
| Annual Report |
| 44 |
Notes to Financial Statements
| For the period ended October 31, 2005 (Amounts in thousands except ratios) |
1. Significant Accounting Policies.
Fidelity International Small Cap Fund (the fund) is a fund of Fidelity Investment Trust (the trust) and is authorized to issue an unlimited number of shares. Effective the close of business on May 5, 2005, the fund was closed to most new accounts. The trust is registered under the Investment Company Act of 1940, as amended (the 1940 Act), as an open end management investment company organized as a Massachusetts business trust.
The fund offers Class A, Class T, Class B, Class C, International Small Cap (the original class) and Institutional Class shares, each of which has equal rights as to assets and voting privileges. Each class has exclusive voting rights with respect to matters that affect that class. Class B shares will automatically convert to Class A shares after a holding period of seven years from the initial date of purchase. Investment income, realized and unrealized capital gains and losses, the common expenses of the fund, and certain fund level expense reductions, if any, are allocated on a pro rata basis to each class based on the relative net assets of each class to the total net assets of the fund. Each class differs with respect to transfer agent and distribution and service plan fees incurred. Certain expense reductions also differ by class.
The fund may invest in affiliated money market central funds (Money Market Central Funds) which are open end investment companies available to investment companies and other accounts managed by Fidelity Management & Research Company (FMR) and its affiliates. The financial statements have been prepared in conformity with accounting principles generally accepted in the United States of America, which require manage ment to make certain estimates and assumptions at the date of the financial statements. The following summarizes the significant accounting policies of the fund: Security Valuation. Investments are valued and net asset value (NAV) per share is calculated (NAV calculation) as of the close of business of the New York Stock Exchange (NYSE), normally 4:00 p.m. Eastern time. Wherever possible, the fund uses independent pricing services approved by the Board of Trustees to value its investments.
Equity securities, including restricted securities, for which market quotations are readily available, are valued at the last reported sale price or official closing price as reported by an independent pricing service on the primary market or exchange on which they are traded. In the event there were no sales during the day or closing prices are not available, securities are valued at the last quoted bid price. Debt securities, including restricted securities, for which quotations are readily available, are valued by independent pricing services or by dealers who make markets in such securities. Pricing services consider yield or price of bonds of comparable quality, coupon, maturity and type as well as dealer supplied prices. Investments in open end mutual funds are valued at their closing net asset value each business day. Short term securities with remaining maturities of sixty
45 Annual Report
| Notes to Financial Statements continued (Amounts in thousands except ratios) |
1. Significant Accounting Policies continued
Security Valuation continued days or less for which quotations are not readily available are valued at amortized cost, which approximates value.
When current market prices or quotations are not readily available or do not accurately reflect fair value, valuations may be determined in accordance with procedures adopted by the Board of Trustees. For example, when developments occur between the close of a market and the close of the NYSE that may materially affect the value of some or all of the securities, or when trading in a security is halted, those securities may be fair valued. Factors used in the determination of fair value may include monitoring news to identify significant market or security specific events such as changes in the value of U.S. securi ties market, reviewing developments in foreign markets and evaluating the performance of ADRs, futures contracts and exchange traded funds. Because the fund’s utilization of fair value pricing depends on market activity, the frequency with which fair value pricing is used can not be predicted and may be utilized to a significant extent. The value of securities used for NAV calculation under fair value pricing may differ from published prices for the same securities.
Foreign Currency. The fund uses foreign currency contracts to facilitate transactions in foreign denominated securities. Losses from these transactions may arise from changes in the value of the foreign currency or if the counterparties do not perform under the contracts’ terms.
Foreign denominated assets, including investment securities, and liabilities are trans lated into U.S. dollars at the exchange rate at period end. Purchases and sales of invest ment securities, income and dividends received and expenses denominated in foreign currencies are translated into U.S. dollars at the exchange rate in effect on the transac tion date.
The effects of exchange rate fluctuations on investments are included with the net realized and unrealized gain (loss) on investment securities. Other foreign currency transactions resulting in realized and unrealized gain (loss) are disclosed separately. Investment Transactions and Income. Security transactions are accounted for as of trade date. Gains and losses on securities sold are determined on the basis of identified cost. Dividend income is recorded on the ex dividend date, except for certain dividends from foreign securities where the ex dividend date may have passed, which are recorded as soon as the fund is informed of the ex dividend date. Non cash dividends included in dividend income, if any, are recorded at the fair market value of the securities received. Interest income is accrued as earned. Interest income includes coupon interest and amortization of premium and accretion of discount on debt securities. Investment
| Annual Report |
| 46 |
1. Significant Accounting Policies continued
Investment Transactions and Income continued income is recorded net of foreign taxes withheld where recovery of such taxes is uncertain.
Expenses. Most expenses of the trust can be directly attributed to a fund. Expenses which cannot be directly attributed are apportioned among each fund in the trust.
Income Tax Information and Distributions to Shareholders. Each year, the fund intends to qualify as a regulated investment company by distributing all of its taxable income and realized gains under Subchapter M of the Internal Revenue Code. As a result, no provision for income taxes is required in the accompanying financial statements. Foreign taxes are provided for based on the fund’s understanding of the tax rules and rates that exist in the foreign markets in which it invests.
Distributions are recorded on the ex dividend date. Income dividends and capital gain distributions are declared separately for each class. Income and capital gain distribu tions are determined in accordance with income tax regulations, which may differ from generally accepted accounting principles. In addition, the fund will claim a portion of the payment made to redeeming shareholders as a distribution for income tax purposes.
Capital accounts within the financial statements are adjusted for permanent book tax differences. These adjustments have no impact on net assets or the results of operations. Temporary book tax differences will reverse in a subsequent period.
Book tax differences are primarily due to foreign currency transactions, passive foreign investment companies (PFIC) and losses deferred due to wash sales.
The tax basis components of distributable earnings and the federal tax cost as of period end were as follows:
| Unrealized appreciation | $ | 441,522 | ||
| Unrealized depreciation | (115,753) | |||
| Net unrealized appreciation (depreciation) | 325,769 | |||
| Undistributed ordinary income | 65,222 | |||
| Undistributed long term capital gain | 178,759 | |||
| Cost for federal income tax purposes | $ | 1,991,931 | ||
The tax character of distributions paid was as follows:
| October 31, 2005 | October 31, 2004 | |||||||
| Ordinary Income | $ | 30,409 | $ | 12,314 | ||||
| Long term Capital Gains | 18,232 | — | ||||||
| Total | $ | 48,641 | $ | 12,314 |
47 Annual Report
| Notes to Financial Statements continued (Amounts in thousands except ratios) 1. Significant Accounting Policies continued |
Short Term Trading (Redemption) Fees. Shares held in the fund less than 90 days are subject to a redemption fee equal to 2.00% of the proceeds of the redeemed shares. All redemption fees, including any estimated redemption fees paid by FMR, are retained by the fund and accounted for as an addition to paid in capital.
| 2. Operating Policies. |
Repurchase Agreements. FMR has received an Exemptive Order from the Securities and Exchange Commission (the SEC) which permits the fund and other affiliated entities of FMR to transfer uninvested cash balances into joint trading accounts which are then invested in repurchase agreements. The fund may also invest directly with institutions in repurchase agreements. Repurchase agreements are collateralized by government or non government securities. Collateral is held in segregated accounts with custodian banks and may be obtained in the event of a default of the counterparty. The fund monitors, on a daily basis, the value of the collateral to ensure it is at least equal to the principal amount of the repurchase agreement (including accrued interest). In the event of a default by the counterparty, realization of the collateral proceeds could be delayed, during which time the value of the collateral may decline.
Delayed Delivery Transactions and When Issued Securities. The fund may purchase securities on a delayed delivery or when issued basis. Payment and delivery may take place after the customary settlement period for that security. The price of the underlying securities and the date when the securities will be delivered and paid for are fixed at the time the transaction is negotiated. The value of the securities purchased on a delayed delivery or when issued basis are identified as such in the fund’s Schedule of Investments. The fund may receive compensation for interest forgone in the purchase of a delayed delivery or when issued security. With respect to purchase commitments, the fund identifies securities as segregated in its records with a value at least equal to the amount of the commitment. Losses may arise due to changes in the value of the underly ing securities or if the counterparty does not perform under the contract’s terms, or if the issuer does not issue the securities due to political, economic, or other factors.
Restricted Securities. The fund may invest in securities that are subject to legal or contractual restrictions on resale. These securities generally may be resold in transac tions exempt from registration or to the public if the securities are registered. Disposal of these securities may involve time consuming negotiations and expense, and prompt sale at an acceptable price may be difficult. Information regarding restricted securities is included at the end of the fund’s Schedule of Investments.
| Annual Report |
| 48 |
3. Purchases and Sales of Investments.
Purchases and sales of securities, other than short term securities and U.S. government securities, aggregated $2,126,837 and $1,470,923, respectively.
4. Fees and Other Transactions with Affiliates.
Management Fee. FMR and its affiliates provide the fund with investment manage ment related services for which the fund pays a monthly management fee. The manage ment fee is the sum of an individual fund fee rate that is based on an annual rate of .60% of the fund’s average net assets and a group fee rate that averaged .27% during the period. The group fee rate is based upon the average net assets of all the mutual funds advised by FMR. The group fee rate decreases as assets under management increase and increases as assets under management decrease. In addition, the management fee is subject to a performance adjustment (up to a maximum of .20% of the fund’s average net assets over a 36 month performance period). The upward or downward adjustment to the management fee is based on the investment performance of the asset weighted return of all classes as compared to an appropriate benchmark index. For the period, the total annual management fee rate, including the performance adjustment, was .95% of the fund’s average net assets.
Distribution and Service Plan. In accordance with Rule 12b 1 of the 1940 Act, the fund has adopted separate Distribution and Service Plans for each class of shares. Certain classes pay Fidelity Distributors Corporation (FDC), an affiliate of FMR, separate Distribution and Service Fees, each of which is based on an annual percentage of each class’ average net assets. In addition, FDC may pay financial intermediaries for selling shares of the fund and providing shareholder support services. For the period, the Distribution and Service Fee rates and the total amounts paid to and retained by FDC were as follows:
| Distribution | Service | Paid to | Retained | |||||||||
| Fee | Fee | FDC | by FDC | |||||||||
| Class A | 0% | .25% | $ | 67 | $ | — | ||||||
| Class T | 25% | .25% | 164 | 2 | ||||||||
| Class B | 75% | .25% | 110 | 83 | ||||||||
| Class C | 75% | .25% | 193 | 80 | ||||||||
| $ | 534 | $ | 165 |
Sales Load. FDC receives a front end sales charge of up to 5.75% for selling Class A shares, and 3.50% for selling Class T shares, some of which is paid to financial intermedi aries for selling shares of the fund. FDC receives the proceeds of contingent deferred sales charges levied on Class A, Class T, Class B, and Class C redemptions. These charges depend on the holding period. The deferred sales charges range from 5% to 1% for Class B, 1% for Class C, and .25% for certain purchases of Class A and Class T shares.
49 Annual Report
| Notes to Financial Statements continued (Amounts in thousands except ratios) |
4. Fees and Other Transactions with Affiliates continued
Sales Load - continued
For the period, sales charge amounts retained by FDC were as follows:
| Retained | ||||
| by FDC | ||||
| Class A | $ | 65 | ||
| Class T | 22 | |||
| Class B* | 24 | |||
| Class C* | 7 | |||
| $ | 118 |
* When Class B and Class C shares are initially sold, FDC pays commissions from its own resources to financial intermediaries through which the sales are made.
Transfer Agent Fees. Fidelity Investments Institutional Operations Company, Inc. (FIIOC), an affiliate of FMR, is the transfer, dividend disbursing and shareholder servic ing agent for each class of the fund, except for International Small Cap. Fidelity Service Company, Inc. (FSC), an affiliate of FMR, , is the transfer agent for International Small Cap shares. FIIOC and FSC receive account fees and asset based fees that vary according to the account size and type of account of the shareholders of the respective classes of the fund. FIIOC and FSC pay for typesetting, printing and mailing of shareholder reports, except proxy statements. For the period the total transfer agent fees paid by each class to FIIOC or FSC, were as follows:
| % of | ||||||
| Average | ||||||
| Amount | Net Assets | |||||
| Class A | $ | 93 | .34 | |||
| Class T | 116 | .35 | ||||
| Class B | 47 | .42 | ||||
| Class C | 66 | .34 | ||||
| International Small Cap | 3,874 | .21 | ||||
| Institutional Class | 13 | .23 | ||||
| $ | 4,209 | |||||
Accounting and Security Lending Fees. FSC maintains the fund’s accounting rec ords. The accounting fee is based on the level of average net assets for the month. Under a separate contract, FSC administers the security lending program. The security lending fee is based on the number and duration of lending transactions.
Affiliated Central Funds. The fund may invest in Money Market Central Funds which seek preservation of capital and current income and are managed by Fidelity Invest ments Money Management, Inc. (FIMM), an affiliate of FMR.
Annual Report 50
| 4. Fees and Other Transactions with Affiliates continued Affiliated Central Funds continued |
The Central Funds do not pay a management fee. Income distributions earned by the fund are recorded as income in the accompanying financial statements and totaled $5,350 for the period.
Brokerage Commissions. The fund placed a portion of its portfolio transactions with brokerage firms which are affiliates of the investment adviser. The commissions paid to these affiliated firms were $1 for the period.
| 5. Committed Line of Credit. |
The fund participates with other funds managed by FMR in a $4.2 billion credit facility (the “line of credit”) to be utilized for temporary or emergency purposes to fund share holder redemptions or for other short term liquidity purposes. The fund has agreed to pay commitment fees on its pro rata portion of the line of credit. During the period, there were no borrowings on this line of credit.
| 6. Security Lending. |
The fund lends portfolio securities from time to time in order to earn additional income. The fund receives collateral (in the form of U.S. Treasury obligations, letters of credit and/or cash) against the loaned securities and maintains collateral in an amount not less than 100% of the market value of the loaned securities during the period of the loan. The market value of the loaned securities is determined at the close of business of the fund and any additional required collateral is delivered to the fund on the next business day. If the borrower defaults on its obligation to return the securities loaned because of insol vency or other reasons, a fund could experience delays and costs in recovering the securities loaned or in gaining access to the collateral. Cash collateral is invested in the Fidelity Securities Lending Cash Central Fund. The value of loaned securities and cash collateral at period end are disclosed on the fund’s Statement of Assets and Liabilities. Security lending income represents the income earned on investing cash collateral, less fees and expenses associated with the loan, plus any premium payments that may be received on the loan of certain types of securities.
| 7. Expense Reductions. |
FMR voluntarily agreed to reimburse each class to the extent annual operating expenses exceeded certain levels of average net assets as noted in the table below. Some expenses, for example interest expense, are excluded from this reimbursement.
51 Annual Report
Notes to Financial Statements continued
(Amounts in thousands except ratios)
7. Expense Reductions - continued
The following classes were in reimbursement during the period:
| Expense | Reimbursement | |||||
| Limitations | from adviser | |||||
| Class A | 2.05% — 1.65%* | $ | 1 | |||
| Class T | 2.30% — 1.90%* | 4 | ||||
| Class B | 2.80% — 2.40%* | 7 | ||||
| $ | 12 |
* Expense limitation in effect at period end.
Many of the brokers with whom FMR places trades on behalf of the fund provided services to the fund in addition to trade execution. These services included payments of certain expenses on behalf of the fund totaling $625 for the period.In addition, through arrangements with the each class’ transfer agent, credits realized as a result of unin vested cash balances were used to reduce the fund’s expenses. During the period, credits reduced each class’ transfer agent expense as noted in the table below.
| Transfer Agent | ||||
| expense reduction | ||||
| International Small Cap | $ | 9 | ||
8. Other.
The fund’s organizational documents provide former and current trustees and officers with a limited indemnification against liabilities arising in connection with the perfor mance of their duties to the fund. In the normal course of business, the fund may also enter into contracts that provide general indemnifications. The fund’s maximum expo sure under these arrangements is unknown as this would be dependent on future claims that may be made against the fund. The risk of material loss from such claims is consid ered remote.
Annual Report 52
| 9. Distributions to Shareholders. | ||||||||
| Distributions to shareholders of each class were as follows: | ||||||||
| Years ended October 31, | 2005 | 2004 | ||||||
| From net investment income | ||||||||
| Class A | $ | 14 | $ | 3 | ||||
| Class T | — | 3 | ||||||
| Class C | — | 2 | ||||||
| International Small Cap | 3,381 | 732 | ||||||
| Institutional Class | 11 | 1 | ||||||
| Total | $ | 3,406 | $ | 741 | ||||
| From net realized gain | ||||||||
| Class A | $ | 542 | $ | 50 | ||||
| Class T | 602 | 92 | ||||||
| Class B | 221 | 28 | ||||||
| Class C | 359 | 42 | ||||||
| International Small Cap | 43,388 | 11,351 | ||||||
| Institutional Class | 123 | 10 | ||||||
| Total | $ | 45,235 | $ | 11,573 | ||||
53 Annual Report
| Notes to Financial Statements continued | ||||||||||||
| (Amounts in thousands except ratios) | ||||||||||||
| 10. Share Transactions. | ||||||||||||
| Transactions for each class of shares were as follows: | ||||||||||||
| Shares | Dollars | |||||||||||
| Years ended October 31, | 2005 | 2004 | 2005 | 2004 | ||||||||
| Class A | ||||||||||||
| Shares sold | 915 | 655 | $ | 22,252 | $ | 12,873 | ||||||
| Reinvestment of distributions | 20 | 3 | 427 | 47 | ||||||||
| Shares redeemed | (255) | (313) | (6,421) | (5,811) | ||||||||
| Net increase (decrease) | 680 | 345 | $ | 16,258 | $ | 7,109 | ||||||
| Class T | ||||||||||||
| Shares sold | 1,286 | 729 | $ | 31,179 | $ | 14,389 | ||||||
| Reinvestment of distributions | 24 | 5 | 531 | 85 | ||||||||
| Shares redeemed | (457) | (246) | (11,453) | (4,796) | ||||||||
| Net increase (decrease) | 853 | 488 | $ | 20,257 | $ | 9,678 | ||||||
| Class B | ||||||||||||
| Shares sold | 415 | 254 | $ | 9,882 | $ | 4,981 | ||||||
| Reinvestment of distributions | 9 | 1 | 199 | 26 | ||||||||
| Shares redeemed | (178) | (72) | (4,336) | (1,405) | ||||||||
| Net increase (decrease) | 246 | 183 | $ | 5,745 | $ | 3,602 | ||||||
| Class C | ||||||||||||
| Shares sold | 680 | 413 | $ | 16,301 | $ | 8,031 | ||||||
| Reinvestment of distributions | 13 | 2 | 272 | 40 | ||||||||
| Shares redeemed | (147) | (81) | (3,591) | (1,590) | ||||||||
| Net increase (decrease) | 546 | 334 | $ | 12,982 | $ | 6,481 | ||||||
| International Small Cap | ||||||||||||
| Shares sold | 51,579 | 48,248 | $ | 1,266,283 | $ | 942,555 | ||||||
| Reinvestment of distributions | 2,008 | 632 | 43,867 | 11,253 | ||||||||
| Shares redeemed | (26,924) | (28,670) | (667,826) | (560,464) | ||||||||
| Net increase (decrease) | 26,663 | 20,210 | $ | 642,324 | $ | 393,344 | ||||||
| Institutional Class | ||||||||||||
| Shares sold | 259 | 181 | $ | 6,323 | $ | 3,602 | ||||||
| Reinvestment of distributions | 3 | 59 | 5 | |||||||||
| Shares redeemed | (105) | (84) | (2,545) | (1,661) | ||||||||
| Net increase (decrease) | 157 | 97 | $ | 3,837 | $ | 1,946 | ||||||
| Annual Report |
| 54 |
Report of Independent Registered Public Accounting Firm
To the Trustees of Fidelity Investment Trust and Shareholders of Fidelity International Small Cap Fund:
We have audited the accompanying statement of assets and liabilities of Fidelity Interna tional Small Cap Fund (the Fund), a fund of Fidelity Investment Trust, including the schedule of investments, as of October 31, 2005, and the related statement of operations for the year then ended, the statement of changes in net assets for each of the two years in the period then ended, and the financial highlights for each of the four years in the period then ended. These financial statements and financial highlights are the responsibility of the Fund’s management. Our responsibility is to express an opinion on these financial statements and financial highlights based on our audits.
We conducted our audits in accordance with standards of the Public Company Accounting Oversight Board (United States). Those standards require that we plan and perform the audit to obtain reasonable assurance about whether the financial statements and financial highlights are free of material misstatement. The Fund is not required to have, nor were we engaged to perform, an audit of its internal control over financial reporting. Our audits included consideration of internal control over financial reporting as a basis for designing audit procedures that are appropriate in the circumstances, but not for the purpose of expressing an opinion on the effectiveness of the Fund’s internal control over financial reporting. Accordingly, we express no such opinion. An audit also includes examining, on a test basis, evidence supporting the amounts and disclosures in the financial statements, assessing the accounting principles used and significant estimates made by management, as well as evaluating the overall financial statement presentation. Our procedures in cluded confirmation of securities owned as of October 31, 2005, by correspondence with the custodians and brokers; where replies were not received from brokers, we performed other auditing procedures. We believe that our audits provide a reasonable basis for our opinion.
In our opinion, the financial statements and financial highlights referred to above present fairly, in all material respects, the financial position of Fidelity International Small Cap Fund as of October 31, 2005, the results of its operations for the year then ended, the changes in its net assets for each of the two years in the period then ended, and its financial highlights for each of the four years in the period then ended, in conformity with accounting principles generally accepted in the United States of America.
| /s/ Deloitte & Touche LLP DELOITTE & TOUCHE LLP Boston, Massachusetts December 21, 2005 |
55 Annual Report
Trustees and Officers
The Trustees, Members of the Advisory Board, and executive officers of the trust and fund, as applicable, are listed below. The Board of Trustees governs the fund and is responsible for protecting the interests of shareholders. The Trustees are experienced executives who meet periodically throughout the year to oversee the fund’s activities, review contractual arrangements with companies that provide services to the fund, and review the fund’s performance. Except for William O. McCoy, Stephen P. Jonas, and Kenneth L. Wolfe, each of the Trustees oversees 322 funds advised by FMR or an affiliate. Mr. McCoy oversees 324 funds advised by FMR or an affiliate. Mr. Jonas and Mr. Wolfe oversee 319 funds advised by FMR or an affiliate.
The Trustees hold office without limit in time except that (a) any Trustee may resign; (b) any Trustee may be removed by written instrument, signed by at least two thirds of the number of Trustees prior to such removal; (c) any Trustee who requests to be retired or who has become incapacitated by illness or injury may be retired by written instru ment signed by a majority of the other Trustees; and (d) any Trustee may be removed at any special meeting of shareholders by a two thirds vote of the outstanding voting securities of the trust. Each Trustee who is not an interested person (as defined in the 1940 Act) (Independent Trustee), shall retire not later than the last day of the calendar year in which his or her 72nd birthday occurs. The Independent Trustees may waive this mandatory retirement age policy with respect to individual Trustees. The executive officers and Advisory Board Members hold office without limit in time, except that any officer and Advisory Board Member may resign or may be removed by a vote of a majority of the Trustees at any regular meeting or any special meeting of the Trustees. Except as indicated, each individual has held the office shown or other offices in the same company for the past five years.
The fund’s Statement of Additional Information (SAI) includes more information about the Trustees. To request a free copy, call Fidelity at 1-877-208-0098.
| Interested Trustees*: |
Correspondence intended for each Trustee who is an interested person may be sent to Fidelity Investments, 82 Devonshire Street, Boston, Massachusetts 02109.
| Name, Age; Principal Occupation Edward C. Johnson 3d (75)** |
Year of Election or Appointment: 1984
Mr. Johnson is Chairman of the Board of Trustees. Mr. Johnson serves as Chief Executive Officer, Chairman, and a Director of FMR Corp.; a Di rector and Chairman of the Board and of the Executive Committee of FMR; Chairman and a Director of Fidelity Management & Research (Far East) Inc.; Chairman and a Director of Fidelity Investments Money Man agement, Inc.; and Chairman (2001 present) and a Director (2000 present) of FMR Co., Inc.
| Annual Report |
| 56 |
| Name, Age; Principal Occupation Abigail P. Johnson (43)** |
Year of Election or Appointment: 2001
Ms. Johnson serves as President of Fidelity Employer Services Company (FESCO) (2005 present). She is President and a Director of Fidelity In vestments Money Management, Inc. (2001 present), FMR Co., Inc. (2001 present), and a Director of FMR Corp. Previously, Ms. Johnson served as President and a Director of FMR (2001 2005), Senior Vice President of the Fidelity funds (2001 2005), and managed a number of Fidelity funds.
| Stephen P. Jonas (52) |
Year of Election or Appointment: 2005
Mr. Jonas is Senior Vice President of the fund (2005 present). He also serves as Senior Vice President of other Fidelity funds (2005 present). Mr. Jonas is Executive Director of FMR (2005 present). Previously, Mr. Jonas served as President of Fidelity Enterprise Operations and Risk Services (2004 2005), Chief Administrative Officer (2002 2004), and Chief Financial Officer of FMR Co. (1998 2000). Mr. Jonas has been with Fidelity Investments since 1987 and has held various financial and management positions including Chief Financial Officer of FMR. In addi tion, he serves on the Boards of Boston Ballet (2003 present) and Sim mons College (2003 present).
| Robert L. Reynolds (53) |
Year of Election or Appointment: 2003
Mr. Reynolds is a Director (2003 present) and Chief Operating Officer (2002 present) of FMR Corp. He also serves on the Board at Fidelity Investments Canada, Ltd. (2000 present). Previously, Mr. Reynolds served as President of Fidelity Investments Institutional Retirement Group (1996 2000).
* Trustees have been determined to be “Interested Trustees” by virtue of, among other things, their affiliation with the trust or various entities under common control with FMR.
** Edward C. Johnson 3d, Trustee, is Abigail P. Johnson’s father.
57 Annual Report
Trustees and Officers - continued
Independent Trustees:
Correspondence intended for each Independent Trustee (that is, the Trustees other than the Interested Trustees) may be sent to Fidelity Investments, P.O. Box 55235, Boston, Massachusetts 02205 5235.
| Name, Age; Principal Occupation Dennis J. Dirks (57) |
Year of Election or Appointment: 2005
Prior to his retirement in May 2003, Mr. Dirks was Chief Operating Officer and a member of the Board of The Depository Trust & Clearing Corporation (DTCC) (1999 2003). He also served as President, Chief Operating Officer, and Board member of The Depository Trust Com pany (DTC) (1999 2003) and President and Board member of the National Securities Clearing Corporation (NSCC) (1999 2003). In addi tion, Mr. Dirks served as Chief Executive Officer and Board member of the Government Securities Clearing Corporation (2001 2003) and Chief Executive Officer and Board member of the Mortgage Backed Securities Clearing Corporation (2001 2003). Mr. Dirks also serves as a Trustee of Manhattan College (2005 present).
| Robert M. Gates (62) |
Year of Election or Appointment: 1997
Dr. Gates is Vice Chairman of the Independent Trustees (2005 present). Dr. Gates is President of Texas A&M University (2002 present). He was Director of the Central Intelligence Agency (CIA) from 1991 to 1993. From 1989 to 1991, Dr. Gates served as Assistant to the President of the United States and Deputy National Security Advisor. Dr. Gates is a Director of NACCO Industries, Inc. (mining and manufacturing), Parker Drilling Co., Inc. (drilling and rental tools for the energy industry, 2001 present), and Brinker International (restaurant management, 2003 present). Previously, Dr. Gates served as a Director of LucasVarity PLC (automotive components and diesel engines), a Director of TRW Inc. (automotive, space, defense, and information technology), and Dean of the George Bush School of Government and Public Service at Texas A&M University (1999 2001). Dr. Gates also is a Trustee of the Forum for International Policy.
| Annual Report |
| 58 |
| Name, Age; Principal Occupation George H. Heilmeier (69) |
Year of Election or Appointment: 2004
Dr. Heilmeier is Chairman Emeritus of Telcordia Technologies (commu nication software and systems), where prior to his retirement, he served as company Chairman and Chief Executive Officer. He currently serves on the Boards of Directors of The Mitre Corporation (systems engineer ing and information technology support for the government), and HRL Laboratories (private research and development, 2004 present). He is Chairman of the General Motors Science & Technology Advisory Board and a Life Fellow of the Institute of Electrical and Electronics Engineers (IEEE) (2000 present). Dr. Heilmeier is a member of the Defense Science Board and the National Security Agency Advisory Board. He is also a member of the National Academy of Engineering, the American Acad emy of Arts and Sciences, and the Board of Overseers of the School of Engineering and Applied Science of the University of Pennsylvania. Pre viously, Dr. Heilmeier served as a Director of TRW Inc. (automotive, space, defense, and information technology, 1992 2002), Compaq (1994 2002), Automatic Data Processing, Inc. (ADP) (technology based business outsourcing, 1995 2002), INET Technologies Inc. (telecommu nications network surveillance, 2001 2004), and Teletech Holdings (cus tomer management services). He is the recipient of the 2005 Kyoto Prize in Advanced Technology for his invention of the liquid display.
| Marie L. Knowles (59) |
Year of Election or Appointment: 2001
Prior to Ms. Knowles’ retirement in June 2000, she served as Executive Vice President and Chief Financial Officer of Atlantic Richfield Company (ARCO) (diversified energy, 1996 2000). From 1993 to 1996, she was a Senior Vice President of ARCO and President of ARCO Transportation Company. She served as a Director of ARCO from 1996 to 1998. She currently serves as a Director of Phelps Dodge Corporation (copper mining and manufacturing) and McKesson Corporation (healthcare ser vice, 2002 present). Ms. Knowles is a Trustee of the Brookings Institution and the Catalina Island Conservancy and also serves as a member of the Advisory Board for the School of Engineering of the University of Southern California.
59 Annual Report
Trustees and Officers - continued
| Name, Age; Principal Occupation Ned C. Lautenbach (61) |
Year of Election or Appointment: 2000
Mr. Lautenbach has been a partner of Clayton, Dubilier & Rice, Inc. (private equity investment firm) since September 1998. Previously, Mr. Lautenbach was with the International Business Machines Corporation (IBM) from 1968 until his retirement in 1998. Mr. Lautenbach serves as a Director of Italtel Holding S.p.A. (telecommunications (Milan, Italy), 2004 present) and Eaton Corporation (diversified industrial) as well as the Philharmonic Center for the Arts in Naples, Florida. He also is a member of the Board of Trustees of Fairfield University (2005 present), as well as a member of the Council on Foreign Relations.
| Marvin L. Mann (72) |
Year of Election or Appointment: 1993
Mr. Mann is Chairman of the Independent Trustees (2001 present). He is Chairman Emeritus of Lexmark International, Inc. (computer peripherals), where he served as CEO until April 1998, retired as Chairman May 1999, and remains a member of the Board. Prior to 1991, he held the positions of Vice President of International Business Machines Corporation (IBM) and President and General Manager of various IBM divisions and subsidiaries. He is a member of the Executive Committee of the Independent Director’s Council of the Investment Com pany Institute. In addition, Mr. Mann is a member of the President’s Cabinet at the University of Alabama and the Board of Visitors of the Culverhouse College of Commerce and Business Administration at the University of Alabama.
| William O. McCoy (72) |
Year of Election or Appointment: 1997
Prior to his retirement in December 1994, Mr. McCoy was Vice Chair man of the Board of BellSouth Corporation (telecommunications) and President of BellSouth Enterprises. He is currently a Director of Liberty Corporation (holding company), Duke Realty Corporation (real estate), and Progress Energy, Inc. (electric utility). He is also a partner of Frank lin Street Partners (private investment management firm) and a member of the Research Triangle Foundation Board. In addition, Mr. McCoy served as the Interim Chancellor (1999 2000) and a member of the Board of Visitors for the University of North Carolina at Chapel Hill and currently serves on the Board of Directors of the University of North Carolina Health Care System and the Board of Visitors of the Kenan Flagler Business School (University of North Carolina at Chapel Hill). He also served as Vice President of Finance for the University of North Car olina (16 school system).
| Annual Report |
| 60 |
| Name, Age; Principal Occupation Cornelia M. Small (61) |
Year of Election or Appointment: 2005
Ms. Small is a member (2000 present) and Chairperson (2002 present) of the Investment Committee, and a member (2002 present) of the Board of Trustees of Smith College. Previously, she served as Chief In vestment Officer (1999 2000), Director of Global Equity Investments (1996 1999), and a member of the Board of Directors of Scudder, Stevens & Clark (1990 1997) and Scudder Kemper Investments (1997 1998). In addition, Ms. Small served as Co Chair (2000 2003) of the Annual Fund for the Fletcher School of Law and Diplomacy.
| William S. Stavropoulos (66) |
Year of Election or Appointment: 2001
Mr. Stavropoulos is Chairman of the Board (2000 present) and a Mem ber of the Board of Directors of The Dow Chemical Company. Since joining The Dow Chemical Company in 1967, Mr. Stavropoulos served in numerous senior management positions, including President (1993 2000; 2002 2003), CEO (1995 2000; 2002 2004), and Chair man of the Executive Committee (2000 2004). Currently, he is a Direc tor of NCR Corporation (data warehousing and technology solutions), BellSouth Corporation (telecommunications), Chemical Financial Corpo ration, Maersk Inc. (industrial conglomerate, 2002 present), and Metal mark Capital (private equity investment firm, 2005 present). He also serves as a member of the Board of Trustees of the American Enterprise Institute for Public Policy Research. In addition, Mr. Stavropoulos is a member of The Business Council, J.P. Morgan International Council and the University of Notre Dame Advisory Council for the College of Science.
| Kenneth L. Wolfe (66) |
Year of Election or Appointment: 2005
Mr. Wolfe also serves as a Trustee (2005 present) or Member of the Advisory Board (2004 present) of other investment companies advised by FMR. Prior to his retirement in 2001, Mr. Wolfe was Chairman and Chief Executive Officer of Hershey Foods Corporation (1993 2001). He currently serves as a member of the boards of Adelphia Communica tions Corporation (2003 present), Bausch & Lomb, Inc., and Revlon Inc. (2004 present).
61 Annual Report
Trustees and Officers - continued
Advisory Board Members and Executive Officers:
Correspondence intended for Mr. Gamper may be sent to Fidelity Investments, P.O. Box 55235, Boston, Massachusetts 02205 5235. Correspondence intended for each executive officer and Mr. Lynch may be sent to Fidelity Investments, 82 Devonshire Street, Boston, Massachusetts 02109.
| Name, Age; Principal Occupation Albert R. Gamper, Jr. (63) |
Year of Election or Appointment: 2005
Member of the Advisory Board of Fidelity Investment Trust. Prior to his retirement in December 2004, Mr. Gamper served as Chairman of the Board of CIT Group Inc. (commercial finance). During his tenure with CIT Group Inc. Mr. Gamper served in numerous senior management positions, including Chairman (1987 1989; 1999 2001; 2002 2004), Chief Executive Officer (1987 2004), and President (1989 2002). He currently serves as a member of the Board of Directors of Public Service Enterprise Group (utilities, 2001 present), Chairman of the Board of Governors, Rutgers University (2004 present), and Chairman of the Board of Saint Barnabas Health Care System.
| Peter S. Lynch (61) |
Year of Election or Appointment: 2003
Member of the Advisory Board of Fidelity Investment Trust. Vice Chair man and a Director of FMR, and Vice Chairman (2001 present) and a Director (2000 present) of FMR Co., Inc. Previously, Mr. Lynch served as a Trustee of the Fidelity funds (1990 2003). In addition, he serves as a Trustee of Boston College, Massachusetts Eye & Ear Infirmary, Historic Deerfield, John F. Kennedy Library, and the Museum of Fine Arts of Boston.
| Dwight D. Churchill (51) |
Year of Election or Appointment: 2005
Vice President of the fund. Mr. Churchill also serves as Vice President of certain Equity Funds (2005 present) and certain High Income Funds (2005 present). Previously, he served as Head of Fidelity’s Fixed Income Division (2000 2005), Vice President of Fidelity’s Money Market Funds (2000 2005), Vice President of Fidelity’s Bond Funds, and Senior Vice President of FIMM (2000) and FMR. Mr. Churchill joined Fidelity in 1993 as Vice President and Group Leader of Taxable Fixed Income Investments.
| Annual Report |
| 62 |
| Name, Age; Principal Occupation Eric D. Roiter (56) |
Year of Election or Appointment: 2003
Secretary of the fund. He also serves as Secretary of other Fidelity funds; Vice President, General Counsel, and Secretary of FMR Co., Inc. (2001 present) and FMR; Assistant Secretary of Fidelity Management & Research (U.K.) Inc. (2001 present), Fidelity Management & Research (Far East) Inc. (2001 present), and Fidelity Investments Money Manage ment, Inc. (2001 present). Mr. Roiter is an Adjunct Member, Faculty of Law, at Boston College Law School (2003 present). Previously, Mr. Roiter served as Vice President and Secretary of Fidelity Distributors Corpora tion (FDC) (1998 2005).
| Stuart Fross (46) |
Year of Election or Appointment: 2003
Assistant Secretary of the fund. Mr. Fross also serves as Assistant Secre tary of other Fidelity funds (2003 present), Vice President and Secretary of FDC (2005 present), and is an employee of FMR.
| Christine Reynolds (47) |
Year of Election or Appointment: 2004
President, Treasurer, and Anti Money Laundering (AML) officer of the fund. Ms. Reynolds also serves as President, Treasurer, and AML officer of other Fidelity funds (2004) and is a Vice President (2003) and an employee (2002) of FMR. Before joining Fidelity Investments, Ms. Reynolds worked at PricewaterhouseCoopers LLP (PwC) (1980 2002), where she was most recently an audit partner with PwC’s investment management practice.
| Paul M. Murphy (58) |
Year of Election or Appointment: 2005
Chief Financial Officer of the fund. Mr. Murphy also serves as Chief Financial Officer of other Fidelity funds (2005 present). He also serves as Senior Vice President of Fidelity Pricing and Cash Management Ser vices Group (FPCMS).
| Kenneth A. Rathgeber (58) |
Year of Election or Appointment: 2004
Chief Compliance Officer of the fund. Mr. Rathgeber also serves as Chief Compliance Officer of other Fidelity funds (2004) and Executive Vice President of Risk Oversight for Fidelity Investments (2002). Pre viously, he served as Executive Vice President and Chief Operating Officer for Fidelity Investments Institutional Services Company, Inc. (1998 2002).
63 Annual Report
Trustees and Officers - continued
| Name, Age; Principal Occupation John R. Hebble (47) |
Year of Election or Appointment: 2003
Deputy Treasurer of the fund. Mr. Hebble also serves as Deputy Treasurer of other Fidelity funds (2003), and is an employee of FMR. Before joining Fidelity Investments, Mr. Hebble worked at Deutsche Asset Management where he served as Director of Fund Accounting (2002 2003) and Assistant Treasurer of the Scudder Funds (1998 2003).
| Bryan A. Mehrmann (44) |
Year of Election or Appointment: 2005
Deputy Treasurer of the fund. Mr. Mehrmann also serves as Deputy Treasurer of other Fidelity funds (2005 present) and is an employee of FMR. Previously, Mr. Mehrmann served as Vice President of Fidelity In vestments Institutional Services Group (FIIS)/Fidelity Investments Institu tional Operations Corporation, Inc. (FIIOC) Client Services (1998 2004).
| Kimberley H. Monasterio (41) |
Year of Election or Appointment: 2004
Deputy Treasurer of the fund. Ms. Monasterio also serves as Deputy Treasurer of other Fidelity funds (2004) and is an employee of FMR (2004). Before joining Fidelity Investments, Ms. Monasterio served as Treasurer (2000 2004) and Chief Financial Officer (2002 2004) of the Franklin Templeton Funds and Senior Vice President of Franklin Temple ton Services, LLC (2000 2004).
| Kenneth B. Robins (36) |
Year of Election or Appointment: 2005
Deputy Treasurer of the fund. Mr. Robins also serves as Deputy Treasurer of other Fidelity funds (2005 present) and is an employee of FMR (2004 present). Before joining Fidelity Investments, Mr. Robins worked at KPMG LLP, where he was a partner in KPMG’s department of profes sional practice (2002 2004) and a Senior Manager (1999 2000). In addition, Mr. Robins served as Assistant Chief Accountant, United States Securities and Exchange Commission (2000 2002).
| Robert G. Byrnes (38) |
Year of Election or Appointment: 2005
Assistant Treasurer of the fund. Mr. Byrnes also serves as Assistant Trea surer of other Fidelity funds (2005 present) and is an employee of FMR (2005 present). Previously, Mr. Byrnes served as Vice President of FPCMS (2003 2005). Before joining Fidelity Investments, Mr. Byrnes worked at Deutsche Asset Management where he served as Vice Presi dent of the Investment Operations Group (2000 2003).
| Annual Report |
| 64 |
| Name, Age; Principal Occupation John H. Costello (59) |
Year of Election or Appointment: 2003
Assistant Treasurer of the fund. Mr. Costello also serves as Assistant Treasurer of other Fidelity funds and is an employee of FMR.
| Peter L. Lydecker (51) |
Year of Election or Appointment: 2004
Assistant Treasurer of the fund. Mr. Lydecker also serves as Assistant Treasurer of other Fidelity funds (2004) and is an employee of FMR.
| Mark Osterheld (50) |
Year of Election or Appointment: 2003
Assistant Treasurer of the fund. Mr. Osterheld also serves as Assistant Treasurer of other Fidelity funds (2002) and is an employee of FMR.
| Gary W. Ryan (47) |
Year of Election or Appointment: 2005
Assistant Treasurer of the fund. Mr. Ryan also serves as Assistant Trea surer of other Fidelity funds (2005 present) and is an employee of FMR (2005 present). Previously, Mr. Ryan served as Vice President of Fund Reporting in FPCMS (1999 2005).
| Salvatore Schiavone (39) |
Year of Election or Appointment: 2005
Assistant Treasurer of the fund. Mr. Schiavone also serves as Assistant Treasurer of other Fidelity funds (2005 present) and is an employee of FMR (2005 present). Before joining Fidelity Investments, Mr. Schiavone worked at Deutsche Asset Management, where he most recently served as Assistant Treasurer (2003 2005) of the Scudder Funds and Vice Pres ident and Head of Fund Reporting (1996 2003).
65 Annual Report
| Distributions |
The Board of Trustees of Fidelity International Small Cap Fund voted to pay to shareholders of record at the opening of business on record date, the following distributions per share derived from capital gains realized from sales of portfolio securities, and dividends derived from net investment income:
| Pay Date | Record Date | Dividends | Capital Gains | |||||
| Class A | 12/12/05 | 12/09/05 | $.048 | $2.89 | ||||
| Class T | 12/12/05 | 12/09/05 | $— | $2.88 | ||||
| Class B | 12/12/05 | 12/09/05 | $— | $2.726 | ||||
| Class C | 12/12/05 | 12/09/05 | $— | $2.752 |
The fund hereby designates as capital gain dividends: For dividends with respect to the taxable year ended October 31, 2005, $178,942,337, or, if subsequently determined to be different, the net capital gain of such year, and for dividends with respect to the taxable year ended October 31, 2004, $18,049,009, or, if subsequently determined to be different, the excess of: (a) the net capital gain of such year, over (b) amounts previously designated as capital gain dividends with respect to such year.
Class A designates 46%; Class T designates 49%; Class B designates 55%; and Class C designates 54% of each dividend distributed respectively during the fiscal year as amounts which may be taken into account as a dividend for purposes of the maximum rate under section 1(h)(11) of the Internal Revenue Code.
The amounts per share which represent income derived from sources within, and taxes paid to, foreign countries or possessions of the United States are as follows:
| Pay Date | Income | Taxes | ||||
| Class A | 12/13/04 | $.132 | $.019 | |||
| Class T | 12/13/04 | $.124 | $.019 | |||
| Class B | 12/13/04 | $.110 | $.019 | |||
| Class C | 12/13/04 | $.113 | $.019 |
The fund will notify shareholders in January 2006 of amounts for use in preparing 2005 income tax returns.
| Annual Report |
| 66 |
Board Approval of Investment Advisory Contracts and Management Fees
Fidelity International Small Cap Fund
Each year, typically in July, the Board of Trustees, including the independent Trustees (together, the Board), votes on the renewal of the management contract and sub advisory agreements (together, the Advisory Contracts) for the fund. The Board, assisted by the advice of fund counsel and independent Trustees’ counsel, requests and considers a broad range of information throughout the year.
The Board meets regularly each month except August and takes into account throughout the year matters bearing on Advisory Contracts. The Board, acting directly and through its separate committees, considers at each of its meetings factors that are relevant to the annual renewal of the fund’s Advisory Contracts, including the services and support provided to the fund and its shareholders by Fidelity. At the time of the renewal, the Board had 11 standing committees, each composed of independent Trustees with varying backgrounds, to which the Board has assigned specific subject matter responsibilities in order to enhance effective decision making by the Board. Each committee has adopted a written charter outlining the structure and purposes of the committee. One such com mittee, the Equity Contract Committee, meets periodically during the first six months of each year and as necessary to consider matters specifically related to the annual renewal of Advisory Contracts. The committee requests and receives information on, and makes recommendations to the independent Trustees concerning, the approval and annual review of the Advisory Contracts.
At its July 2005 meeting, the Board of Trustees, including the independent Trustees, unanimously determined to renew the Advisory Contracts for the fund. In reaching its determination, the Board considered all factors it believed relevant, including (1) the nature, extent, and quality of the services to be provided to the fund and its shareholders by Fidelity (including the investment performance of the fund); (2) the competitiveness of the management fee and total expenses of the fund; (3) the total costs of the services to be provided by and the profits to be realized by the investment adviser and its affiliates from the relationship with the fund; (4) the extent to which economies of scale would be realized as the fund grows; and (5) whether fee levels reflect these economies of scale, if any, for the benefit of fund shareholders.
In determining whether to renew the Advisory Contracts for the fund, the Board ulti mately reached a determination, with the assistance of fund counsel and independent Trustees’ counsel, that the renewal of the Advisory Contracts and the compensation to be received by Fidelity under the management contract is consistent with Fidelity’s fidu ciary duty under applicable law. In addition to evaluating the specific factors noted above, the Board, in reaching its determination, is aware that shareholders in the fund have a broad range of investment choices available to them, including a wide choice among mutual funds offered by competitors to Fidelity, and that the fund’s shareholders, with the opportunity to review and weigh the disclosure provided by the fund in its
67 Annual Report
Board Approval of Investment Advisory Contracts and Management Fees continued
prospectus and other public disclosures, have chosen to invest in this fund, managed by Fidelity.
Nature, Extent, and Quality of Services Provided by Fidelity. The Board consid ered staffing within the investment adviser, FMR, and the sub advisers (together, the Investment Advisers), including the backgrounds of the fund’s portfolio managers and the fund’s investment objective and discipline. The independent Trustees also had discussions with senior management of Fidelity’s investment operations and investment groups. The Board considered the structure of the portfolio manager compensation program and whether this structure provides appropriate incentives.
Fidelity Resources Dedicated to Investment Management and Support Services. The Board reviewed the size, education, and experience of the Investment Advisers’ invest ment staff, their use of technology, and the Investment Advisers’ approach to recruiting, training, and retaining portfolio managers and other research, advisory, and manage ment personnel. The Board considered Fidelity’s extensive global research capabilities that enable the Investment Advisers to aggregate data from various sources in an effort to produce positive investment results. The Board noted that Fidelity’s analysts have access to a variety of technological tools that enable them to perform both fundamental and quantitative analysis and to specialize in various disciplines. The Board also considered that Fidelity’s portfolio managers and analysts have access to daily portfolio attribution that allows for monitoring of a fund’s portfolio, as well as an electronic communication system that provides immediate real time access to research concerning issuers and credit enhancers.
Shareholder and Administrative Services. The Board considered the nature, extent, quality, and cost of administrative, distribution, and shareholder services performed by the Investment Advisers and their affiliates under the Advisory Contracts and under separate agreements covering transfer agency, pricing and bookkeeping, and securities lending services for the fund. The Board also considered the nature and extent of the Investment Advisers’ supervision of third party service providers, principally custodians and subcustodians. The Board reviewed the allocation of fund brokerage, including allocations to brokers affiliated with the Investment Advisers, the use of brokerage commissions to pay fund expenses, and the use of “soft” commission dollars to pay for research services. The Board also considered that Fidelity voluntarily decided in 2004 to stop using “soft” commission dollars to pay for market data and, instead, to pay for that data out of its own resources. The Board also considered the resources devoted to, and the record of compliance with, the fund’s compliance policies and procedures.
The Board noted that the growth of fund assets across the complex allows Fidelity to reinvest in the development of services designed to enhance the value or convenience of the Fidelity funds as investment vehicles. These services include 24 hour access to
| Annual Report |
| 68 |
account information and market information through phone representatives and over the Internet, and investor education materials and asset allocation tools.
Investment in a Large Fund Family. The Board considered the benefits to shareholders of investing in a Fidelity fund, including the benefits of investing in a fund that is part of a large family of funds offering a variety of investment disciplines and providing for a large variety of mutual fund investor services. For example, fund shareholders are offered the privilege of exchanging shares of the fund for shares of other Fidelity funds, as set forth in the fund’s prospectus, without paying an additional sales charge. The Board noted that, since the last Advisory Contract renewals in July 2004, Fidelity has taken a number of actions that benefited particular funds, including (i) voluntarily deciding in 2004 to stop using “soft” commission dollars to pay for market data and, instead, to pay for that data out of its own resources, (ii) contractually agreeing to impose management fee reductions and expense limitations on its five Spartan stock index funds and its stock index fund available through variable insurance products, (iii) contractually agreeing to eliminate the management fees on the Fidelity Freedom Funds and the Fidelity Advisor Freedom Funds, (iv) contractually agreeing to reduce the management fees on most of its investment grade taxable bond funds, and (v) contractually agreeing to impose expense limitations on its retail and Spartan investment grade taxable bond funds.
Investment Performance and Compliance. The Board considered whether the fund has operated within its investment objective, as well as its record of compliance with its investment restrictions. It also reviewed the fund’s absolute investment performance for each class, as well as the fund’s relative investment performance for each class measured against (i) a broad based securities market index, and (ii) a peer group of mutual funds deemed appropriate by the Board over multiple periods. Because the fund had been in existence less than three calendar years, the following chart considered by the Board shows, for the one year period ended December 31, 2004, the returns of Class C and the retail class of the fund, the return of a broad based securities market index (“bench mark”), and a range of returns of a peer group of mutual funds identified by Lipper Inc. as having an investment objective similar to that of the fund. The returns of Class C and the retail class represent the performance of classes with the highest and lowest 12b 1 fees, respectively (not necessarily with the highest and lowest total expenses). The box within the chart shows the 25th percentile return (bottom of box) and the 75th percen tile return (top of box) of the Lipper peer group. Returns shown above the box are in the first quartile and returns shown below the box are in the fourth quartile. The percentage beaten numbers noted below the chart correspond to the percentile box and represent the percentage of funds in the Lipper peer group whose performance was equal to or lower than that of the class indicated.
69 Annual Report
Board Approval of Investment Advisory Contracts and Management Fees continued
The Board reviewed the fund’s relative investment performance against its Lipper peer group and stated that the performance of the retail class of the fund was in the second quartile for the one year period. The Board also stated that the relative investment performance of the fund was lower than its benchmark for the one year period. The Board considered that the variations in performance among the fund’s classes reflect the variations in class expenses, which result in lower performance for higher expense classes. The Board stated that it is difficult to evaluate in any comprehensive fashion the performance of the fund, in light of its relatively recent launch.
The Board also considered that the fund’s management fee is subject to upward or downward adjustment depending upon whether, and to what extent, the fund’s invest ment performance for the performance period exceeds, or is exceeded by, the record (over the same period) of a Board approved performance adjustment index. The Board realizes that the performance adjustment provides FMR with a strong economic incen tive to seek to achieve superior performance for the fund’s shareholders and helps to more closely align the interests of FMR and the fund’s shareholders.
The Board has had thorough discussions with FMR throughout the year about the Board’s and FMR’s concerns about equity research, equity fund performance, and compliance with internal policies governing gifts and entertainment. FMR has taken steps that it believes will refocus and strengthen equity research and equity portfolio management and compliance. The Board noted with favor FMR’s recent reorganization of its senior management team and FMR’s plans to dedicate additional resources to investment research, and participated in the process that led to those changes.
| Annual Report |
| 70 |
Based on its review, and giving particular weight to the nature and quality of the resources dedicated by the Investment Advisers to maintain and improve relative performance, the Board concluded that the nature, extent, and quality of the services provided by Fidelity will benefit the fund’s shareholders, particularly in light of the Board’s view that the fund’s shareholders benefit from investing in a fund that is part of a large family of funds offering a variety of investment disciplines and services.
Competitiveness of Management Fee and Total Fund Expenses. The Board considered the fund’s management fee and total expenses compared to “mapped groups” of competitive funds and classes. Fidelity creates “mapped groups” by combining similar Lipper investment objective categories that have comparable management fee charac teristics. Combining Lipper investment objective categories aids the Board’s manage ment fee and total expense comparisons by broadening the competitive group used for comparison and by reducing the number of universes to which various Fidelity funds are compared.
The Board considered two proprietary management fee comparisons for the 12 month (or shorter) periods shown in the chart below. The group of Lipper funds used by the Board for management fee comparisons is referred to below as the “Total Mapped Group” and, for the reasons explained above, is broader than the Lipper peer group used by the Board for performance comparisons. The Total Mapped Group comparison focuses on a fund’s standing relative to the total universe of comparable funds available to investors, in terms of gross management fees before expense reimbursements or caps. “TMG %” represents the percentage of funds in the Total Mapped Group that had management fees that were lower than the fund’s. For example, a TMG % of 42% means that 58% of the funds in the Total Mapped Group had higher management fees than the fund. The “Asset Size Peer Group” (ASPG) comparison focuses on a fund’s standing relative to non Fidelity funds similar in size to the fund within the Total Mapped Group. The ASPG represents at least 15% of the funds in the Total Mapped Group with comparable asset size and management fee characteristics, subject to a minimum of 50 funds (or all funds in the Total Mapped Group if fewer than 50). Additional information, such as the ASPG quartile (“quadrant”) in which the fund’s management fee ranked and the impact of the fund’s performance adjustment, is also included in the chart and considered by the Board.
71 Annual Report
Board Approval of Investment Advisory Contracts and Management Fees continued
The Board noted that the fund’s management fee ranked below the median of its Total Mapped Group and below the median of its ASPG for 2004. The Board also noted the effect of the fund’s positive performance adjustment on the fund’s management fee ranking.
Based on its review, the Board concluded that the fund’s management fee was fair and reasonable in light of the services that the fund receives and the other factors considered.
In its review of each class’s total expenses, the Board considered the fund’s management fee as well as other fund or class expenses, as applicable, such as transfer agent fees, pricing and bookkeeping fees, fund paid 12b 1 fees, and custodial, legal, and audit fees. The Board also noted the effects of any waivers and reimbursements on fees and expenses, as well as the fund’s positive performance adjustment. As part of its review, the Board also considered current and historical total expenses of each class of the fund compared to competitive fund median expenses. Each class of the fund is compared to those funds and classes in the Total Mapped Group (used by the Board for management fee comparisons) that have a similar sales load structure.
The Board noted that the total expenses of Fidelity International Small Cap Fund (retail class) ranked below its competitive median for 2004, and the total expenses of each of Class A, Class B, Class C, Class T and Institutional Class ranked above its competitive median for 2004. The Board considered that the Advisor classes were above median due in part to the fund’s higher management fee associated with the fund’s small cap invest ment discipline. The Board noted that the fund offers multiple classes, each of which has a different sales load and 12b 1 fee structure, and that the multiple structures are
| Annual Report |
| 72 |
intended to offer a range of pricing options for the intermediary market. The Board also noted that the total expenses of the classes vary primarily by the level of their 12b 1 fees, although differences in transfer agent fees may also cause expenses to vary from class to class.
Furthermore, the Board considered that on December 16, 2004, it had approved changes (effective January 1, 2005) in the transfer agent and service agreements for the fund that established maximum transfer agent fees and eliminated the minimum pricing and bookkeeping fee to prevent small funds or funds with small average account sizes from having relatively high fees in basis points (the “small fund fee reductions”). The Board considered that, if the small fund fee reductions had been in effect in 2004, the total expenses of Class A would have ranked below the median.
In its review of total expenses, the Board also considered Fidelity fee structures and other information on clients that FMR and its affiliates service in other competitive markets, such as other mutual funds advised or subadvised by FMR or its affiliates, pension plan clients, and other institutional clients.
Based on its review, the Board concluded that the total expenses for each class of the fund were reasonable, although in some cases above the median of the universe presented for comparison, in light of the services that the fund and its shareholders receive and the other factors considered.
Costs of the Services and Profitability. The Board considered the revenues earned and the expenses incurred by Fidelity in conducting the business of developing, market ing, distributing, managing, administering and servicing the fund and its shareholders. The Board also considered the level of Fidelity’s profits in respect of all the Fidelity funds.
On an annual basis, FMR presents to the Board Fidelity’s profitability for the fund. Fidelity calculates the profitability for each fund, as well as aggregate profitability for groups of Fidelity funds and all Fidelity funds, using a series of detailed revenue and cost allocation methodologies which originate with the audited books and records of Fidelity. The Audit Committee of the Board reviews any significant changes from the prior year’s methodologies.
PricewaterhouseCoopers LLP (PwC), independent registered accounting firm and auditor to Fidelity and certain Fidelity funds, has been engaged annually by the Board as part of the Board’s assessment of the results of Fidelity’s profitability analysis. PwC’s engagement includes the review and assessment of Fidelity’s methodologies used in determining the revenues and expenses attributable to Fidelity’s mutual fund business, and completion of agreed upon procedures surrounding the mathematical accuracy of fund profitability and its conformity to allocation methodologies. After considering PwC’s reports issued under the engagement and information provided by Fidelity, the Board
73 Annual Report
Board Approval of Investment Advisory Contracts and Management Fees continued
believes that while other allocation methods may also be reasonable, Fidelity’s profitabil ity methodologies are reasonable in all material respects.
The Board has also reviewed Fidelity’s non fund businesses and any fall out benefits related to the mutual fund business as well as cases where Fidelity’s affiliates may benefit from or be related to the fund’s business. In addition, a special committee of the Board reviewed services provided to Fidelity by its affiliates and determined that the fees that Fidelity paid for such services were reasonable.
The Board considered the costs of the services provided by and the profits realized by Fidelity in connection with the operation of the fund and determined that the amount of profit is a fair entrepreneurial profit for the management of the fund.
Economies of Scale. The Board considered whether there have been economies of scale in respect of the management of the Fidelity funds, whether the Fidelity funds (including the fund) have appropriately benefited from any such economies of scale, and whether there is potential for realization of any further economies of scale. The Board considered the extent to which the fund will benefit from economies of scale through increased services to the fund, through waivers or reimbursements, or through fee or expense reductions, including reductions that occur through operation of the transfer agent agreement. The transfer agent fee varies in part based on the number of accounts in the fund. If the number of accounts decreases or the average account size increases, the overall transfer agent fee rate decreases.
The Board recognized that the fund’s management contract incorporates a “group fee” structure, which provides for lower fee rates as total fund assets under FMR’s manage ment increase, and for higher fee rates as total fund assets under FMR’s management decrease. The Board considered that the group fee is designed to deliver the benefits of economies of scale to fund shareholders when total fund assets increase, even if assets of any particular fund are unchanged or have declined, because some portion of Fidelity’s costs are attributable to services provided to all Fidelity funds, and all funds benefit if those costs can be allocated among more assets. The Board concluded that, given the group fee structure, fund shareholders will achieve a certain level of economies of scale as assets under FMR’s management increase at the fund complex level, regardless of whether Fidelity achieves any such economies of scale.
The Board further concluded that any potential economies of scale are being shared between fund shareholders and Fidelity in an appropriate manner.
Additional Information Requested by the Board. In order to develop fully the factual basis for consideration of the Advisory Contracts, the Board requested additional information regarding (i) equity fund transfer agency fees; (ii) Fidelity’s fund profitability methodology and the impact of various changes in the methodology over time; (iii) benefits to shareholders from economies of scale; (iv) composition and
| Annual Report |
| 74 |
characteristics of various fund and industry data used in comparisons; and (v) com pensation of portfolio managers and research analysts.
Based on its evaluation of all of the conclusions noted above, and after considering all material factors, the Board ultimately concluded that the existing advisory fee structures are fair and reasonable, and that the fund’s existing Advisory Contracts should be renewed.
75 Annual Report
| Annual Report |
| 76 |
77 Annual Report
| Investment Adviser Fidelity Management & Research Company Boston, MA Investment Sub Advisers FMR Co., Inc. Fidelity Management & Research (U.K.) Inc. Fidelity Management & Research (Far East) Inc. Fidelity International Investment Advisors Fidelity Investments Japan Limited Fidelity International Investment Advisors (U.K.) Limited General Distributor Fidelity Distributors Corporation Boston, MA Transfer and Service Agents Fidelity Investments Institutional Operations Company, Inc. Boston, MA Fidelity Service Company, Inc. Boston, MA Custodian Mellon Bank Pittsburgh, PA |
| AISC UANN-1205 1.793568.102 |

| Fidelity Advisor International Small Cap Fund - Institutional Class |
| Annual Report October 31, 2005 |

Institutional Class is a class of Fidelity® International Small Cap Fund
| Contents | ||||
| Chairman’s Message | 4 | Ned Johnson’s message to shareholders. | ||
| Performance | 5 | How the fund has done over time. | ||
| Management’s Discussion | 6 | The managers’ review of fund | ||
| performance, strategy and outlook. | ||||
| Shareholder Expense | 7 | An example of shareholder expenses. | ||
| Example | ||||
| Investment Changes | 9 | A summary of major shifts in the fund’s | ||
| investments over the past six months. | ||||
| Investments | 11 | A complete list of the fund’s investments | ||
| with their market values. | ||||
| Financial Statements | 34 | Statements of assets and liabilities, | ||
| operations, and changes in net assets, | ||||
| as well as financial highlights. | ||||
| Notes | 44 | Notes to the financial statements. | ||
| Report of Independent | 54 | |||
| Registered Public | ||||
| Accounting Firm | ||||
| Trustees and Officers | 55 | |||
| Distributions | 65 | |||
| Board Approval of | 66 | |||
| Investment Advisory | ||||
| Contracts and | ||||
| Management Fees | ||||
| To view a fund’s proxy voting guidelines and proxy voting record for the 12 month period ended June 30, visit www.fidelity.com/proxyvotingresults or visit the Securities and Exchange Commis sion’s (SEC) web site at www.sec.gov. You may also call 1-877-208-0098 to request a free copy of the proxy voting guidelines. Standard & Poor’s, S&P and S&P 500 are registered service marks of The McGraw Hill Companies, Inc. and have been licensed for use by Fidelity Distributors Corporation. Other third party marks appearing herein are the property of their respective owners. All other marks appearing herein are registered or unregistered trademarks or service marks of FMR Corp. or an affiliated company. |
| Annual Report |
| 2 |
| This report and the financial statements contained herein are submitted for the general informa tion of the shareholders of the fund. This report is not authorized for distribution to prospective investors in the fund unless preceded or accompanied by an effective prospectus. A fund files its complete schedule of portfolio holdings with the SEC for the first and third quar ters of each fiscal year on Form N Q. Forms N Q are available on the SEC’s web site at http://www.sec.gov. A fund’s Forms N Q may be reviewed and copied at the SEC’s Public Reference Room in Washington, DC. Information regarding the operation of the SEC’s Public Reference Room may be obtained by calling 1-800-SEC-0330. For a complete list of a fund’s portfolio hold ings, view the most recent quarterly holdings report, semiannual report, or annual report on Fidelity’s web site at http://www.advisor.fidelity.com. NOT FDIC INSURED · MAY LOSE VALUE · NO BANK GUARANTEE Neither the fund nor Fidelity Distributors Corporation is a bank. |
3 Annual Report
Chairman’s Message
(photograph of Edward C. Johnson 3d)
Dear Shareholder:
During the past year or so, much has been reported about the mutual fund industry, and much of it has been more critical than I believe is warranted. Allegations that some companies have been less than forthright with their shareholders have cast a shadow on the entire industry. I continue to find these reports disturbing, and assert that they do not create an accurate picture of the industry overall. Therefore, I would like to remind every one where Fidelity stands on these issues. I will say two things specifically regarding allegations that some mutual fund companies were in violation of the Securities and Exchange Commission’s forward pricing rules or were involved in so called “market timing” activities.
First, Fidelity has no agreements that permit customers who buy fund shares after 4 p.m. to obtain the 4 p.m. price. This is not a new policy. This is not to say that some one could not deceive the company through fraudulent acts. However, we are extremely diligent in preventing fraud from occurring in this manner and in every other. But I underscore again that Fidelity has no so called “agreements” that sanction illegal practices.
Second, Fidelity continues to stand on record, as we have for years, in opposition to predatory short term trading that adversely affects shareholders in a mutual fund. Back in the 1980s, we initiated a fee which is returned to the fund and, therefore, to investors to discourage this activity. Further, we took the lead several years ago in developing a Fair Value Pricing Policy to prevent market timing on foreign securities in our funds. I am confident we will find other ways to make it more difficult for predatory traders to operate. However, this will only be achieved through close cooperation among regulators, legislators and the industry.
Yes, there have been unfortunate instances of unethical and illegal activity within the mutual fund industry from time to time. That is true of any industry. When this occurs, confessed or convicted offenders should be dealt with appropriately. But we are still concerned about the risk of over regulation and the quick application of simplistic solutions to intricate problems. Every system can be improved, and we support and applaud well thought out improvements by regulators, legislators and industry representatives that achieve the common goal of building and protecting the value of investors’ holdings.
For nearly 60 years, Fidelity has worked very hard to improve its products and service to justify your trust. When our family founded this company in 1946, we had only a few hundred customers. Today, we serve more than 18 million customers in cluding individual investors and participants in retirement plans across America.
Let me close by saying that we do not take your trust in us for granted, and we realize that we must always work to improve all aspects of our service to you. In turn, we urge you to continue your active participation with your financial matters, so that your interests can be well served.
Best regards,
/s/ Edward C. Johnson 3d
Edward C. Johnson 3d
Annual Report 4
| Fidelity Advisor International Small Cap Fund Institutional Class Performance: The Bottom Line |
Average annual total return reflects the change in the value of an investment, assuming reinvestment of the class’ dividend income and capital gains (the profits earned upon the sale of securities that have grown in value) and assuming a constant rate of performance each year. The $10,000 table and the fund’s returns do not reflect the deduction of taxes that a shareholder would pay on fund distributions or the redemption of fund shares. During periods of reimbursement by Fidelity, a fund’s total return will be greater than it would be had the reimbursement not occurred. How a fund did yesterday is no guaran tee of how it will do tomorrow.
| Average Annual Total Returns | ||||
| Periods ended October 31, 2005 | Past 1 | Life of | ||
| year | FundA | |||
| Institutional ClassB | 30.59% | 39.84% |
| A From September 18, 2002. B The initial offering of Institutional Class shares took place on May 27, 2003. Returns prior to May 27, 2003 are those of International Small Cap, the original class of the fund. |
$10,000 Over Life of Fund
Let’s say hypothetically that $10,000 was invested in Fidelity Advisor International Small Cap Fund — Institutional Class on September 18, 2002, when the fund started. The chart shows how the value of your investment would have changed, and also shows how the MSCI® EAFE® Small Cap Index performed over the same period.
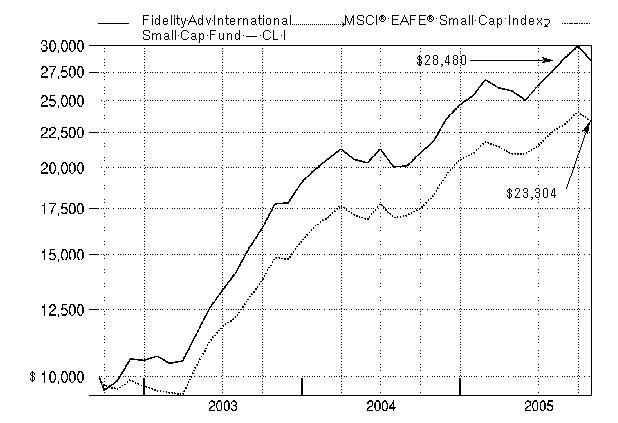
5 Annual Report
5
Management’s Discussion of Fund Performance
Comments from Tokuya Sano, Ben Paton and Wilson Wong, Co Portfolio Managers of Fidelity Advisor International Small Cap Fund. Wilson Wong became a co manager on July 1, 2005.
Foreign stock markets enjoyed broad based advances for the year ending October 31, 2005, encouraged by better than expected corporate earnings and markedly improved economies. For the 12 months overall, the Morgan Stanley Capital InternationalSM Europe, Australasia, Far East (MSCI® EAFE®) Index a performance measure of developed stock markets outside the United States and Canada gained 18.28% . The Japanese stock market climbed to its highest level in more than four years. Positive economic indicators and Prime Minister Koizumi’s decisive election victory attracted record inflows from overseas investors. In response, the Tokyo Stock Exchange Stock Price Index (TOPIX) soared 22.89% . Southeast Asian equities outside of Japan, particularly South Korea, also responded well to the better macroeconomic environment, illustrated by the 19.44% return for the MSCI All Country Far East ex Japan index. European stock markets were up as well, despite investors’ concern about higher energy prices and potential downgrades to eco nomic growth in the region. For the year overall, the MSCI Europe index rose 16.51% . Although robust, returns for U.S. investors in foreign markets were tempered by the strength of the dollar versus many major currencies.
During the past year, the fund’s Institutional Class shares returned was 30.59%, besting the 27.83% gain of the MSCI Small Cap Index and the 25.87% return LipperSM International Small Cap Funds Average. From a geographical perspective, Western Europe was the strongest contributor versus the index, with stock selection in Germany alone adding almost four percentage points to the fund’s return. On a sector basis, fund performance was helped the most by our picks in telecommunication services and information technology, while its holdings in materials and health care underperformed. Among individual holdings, the most positive contributors were Egyptian wireless stock Orascom and German fiber board manufacturer Pfleiderer, both of which were sold for valuation reasons. In the Asian portfolio, the fund was helped by its investments in Yamada Denki and Ibiden both Japanese holdings. Overall, though, stock selection in Japan hurt relative performance. From a sector standpoint, our picks in materials and health care could have been better. Detractors included U.K. energy holding BowLeven, along with cellular handset aftermar ket services provider Accord Customer Care Solutions, a Singapore based holding we sold, and flexible printed circuit board maker NOK, a Japanese stock we trimmed substantially.
The views expressed in this statement reflect those of the portfolio managers only through the end of the period of the report as stated on the cover and do not necessarily represent the views of Fidelity or any other person in the Fidelity organization. Any such views are subject to change at any time based upon market or other conditions and Fidelity disclaims any responsibility to update such views. These views may not be relied on as investment advice and, because investment decisions for a Fidelity fund are based on numerous factors, may not be relied on as an indication of trading intent on behalf of any Fidelity fund.
| Annual Report |
| 6 6 |
Shareholder Expense Example
As a shareholder of the Fund, you incur two types of costs: (1) transaction costs, including sales charges (loads) on purchase payments or redemption proceeds, redemption fees, and (2) ongoing costs, including management fees, distribution and/or service (12b 1) fees and other Fund expenses. This Example is intended to help you understand your ongoing costs (in dollars) of investing in the Fund and to compare these costs with the ongoing costs of investing in other mutual funds.
The Example is based on an investment of $1,000 invested at the beginning of the period and held for the entire period (May 1, 2005 to October 31, 2005).
| Actual Expenses |
The first line of the table below for each class of the Fund provides information about actual account values and actual expenses. You may use the information in this line, together with the amount you invested, to estimate the expenses that you paid over the period. Simply divide your account value by $1,000.00 (for example, an $8,600 account value divided by $1,000.00 = 8.6), then multiply the result by the number in the first line for a class of the Fund under the heading entitled “Expenses Paid During Period” to estimate the expenses you paid on your account during this period. A small balance maintenance fee of $12.00 that is charged once a year may apply for certain accounts with a value of less than $2,000. This fee is not included in the table below. If it was, the esti mate of expenses you paid during the period would be higher, and your ending account value lower, by this amount.
Hypothetical Example for Comparison Purposes
The second line of the table below for each class of the Fund provides information about hypothetical account values and hypothetical expenses based on a Class’ actual expense ratio and an assumed rate of return of 5% per year before expenses, which is not the Class’ actual return. The hypothetical account values and expenses may not be used to estimate the actual ending account balance or expenses you paid for the period. You may use this information to compare the ongoing costs of investing in the Fund and other funds. To do so, compare this 5% hypothetical example with the 5% hypothetical examples that appear in the shareholder reports of the other funds. A small balance maintenance fee of $12.00 that is charged once a year may apply for certain accounts with a value of less than $2,000. This fee is not included in the table below. If it was, the estimate of expenses you paid during the period would be higher, and your ending account value lower, by this amount.
7 Annual Report
Shareholder Expense Example continued
Please note that the expenses shown in the table are meant to highlight your ongoing costs only and do not reflect any transaction costs. Therefore, the second line of the table is useful in comparing ongoing costs only, and will not help you determine the relative total costs of owning different funds. In addition, if these transactional costs were included, your costs would have been higher.
| Expenses Paid | ||||||||||||
| Beginning | Ending | During Period* | ||||||||||
| Account Value | Account Value | May 1, 2005 | ||||||||||
| May 1, 2005 | October 31, 2005 | to October 31, 2005 | ||||||||||
| Class A | ||||||||||||
| Actual | $ | 1,000.00 | $ | 1,099.70 | $ | 8.73 | ||||||
| HypotheticalA | $ | 1,000.00 | $ | 1,016.89 | $ | 8.39 | ||||||
| Class T | ||||||||||||
| Actual | $ | 1,000.00 | $ | 1,098.40 | $ | 10.05 | ||||||
| HypotheticalA | $ | 1,000.00 | $ | 1,015.63 | $ | 9.65 | ||||||
| Class B | ||||||||||||
| Actual | $ | 1,000.00 | $ | 1,096.10 | $ | 12.68 | ||||||
| HypotheticalA | $ | 1,000.00 | $ | 1,013.11 | $ | 12.18 | ||||||
| Class C | ||||||||||||
| Actual | $ | 1,000.00 | $ | 1,095.80 | $ | 12.68 | ||||||
| HypotheticalA | $ | 1,000.00 | $ | 1,013.11 | $ | 12.18 | ||||||
| International Small Cap | ||||||||||||
| Actual | $ | 1,000.00 | $ | 1,102.00 | $ | 6.73 | ||||||
| HypotheticalA | $ | 1,000.00 | $ | 1,018.80 | $ | 6.46 | ||||||
| Institutional Class | ||||||||||||
| Actual | $ | 1,000.00 | $ | 1,101.70 | $ | 6.89 | ||||||
| HypotheticalA | $ | 1,000.00 | $ | 1,018.65 | $ | 6.61 | ||||||
| A 5% return per year before expenses | ||||||||||||
* Expenses are equal to each Class’ annualized expense ratio (shown in the table below); multiplied by the average account value over the period, multiplied by 184/365 (to reflect the one half year period).
| Annualized | ||
| Expense Ratio | ||
| Class A | 1.65% | |
| Class T | 1.90% | |
| Class B | 2.40% | |
| Class C | 2.40% | |
| International Small Cap | 1.27% | |
| Institutional Class | 1.30% |
| Annual Report |
| 8 |
Investment Changes
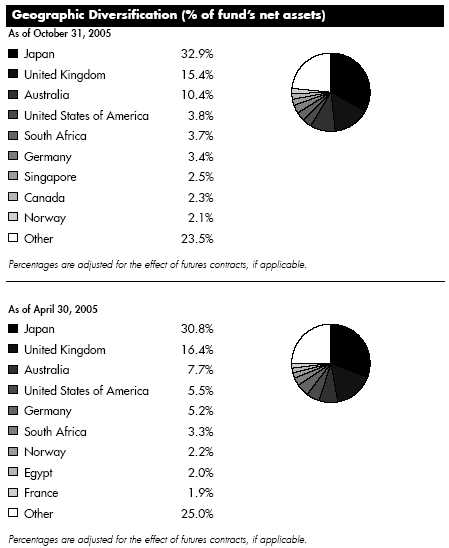
| Asset Allocation | ||||
| % of fund’s | % of fund’s net assets | |||
| net assets | 6 months ago | |||
| Stocks and Investment Companies | 97.8 | 96.6 | ||
| Bonds | 0.1 | 0.0 | ||
| Short Term Investments and Net Other Assets | 2.1 | 3.4 |
9 Annual Report
| Investment Changes continued | ||||||
| Top Ten Stocks as of October 31, 2005 | ||||||
| % of fund’s | % of fund’s net assets | |||||
| net assets | 6 months ago | |||||
| Steinhoff International Holdings Ltd. (South | ||||||
| Africa, Household Durables) | 1.5 | 1.3 | ||||
| Hikari Tsushin, Inc. (Japan, Specialty Retail) | 1.5 | 1.3 | ||||
| Yamada Denki Co. Ltd. (Japan, Specialty Retail) | 1.3 | 0.0 | ||||
| K&S AG (Germany, Chemicals) | 1.3 | 1.1 | ||||
| Nissin Kogyo Co. Ltd. (Japan, Auto Components) | 1.2 | 0.9 | ||||
| Stolt Nielsen SA (Luxembourg, Marine) | 1.0 | 0.9 | ||||
| Banca Italease Spa (Italy, Diversified Financial | ||||||
| Services) | 1.0 | 0.0 | ||||
| Neste Oil Oyj (Finland, Oil, Gas & Consumable | ||||||
| Fuels) | 0.9 | 0.4 | ||||
| Ibiden Co. Ltd. (Japan, Electronic Equipment & | ||||||
| Instruments) | 0.9 | 0.5 | ||||
| Kura Corp. Ltd. (Japan, Food & Staples Retailing) | 0.9 | 0.4 | ||||
| 11.5 | ||||||
| Market Sectors as of October 31, 2005 | ||||||
| % of fund’s | % of fund’s net assets | |||||
| net assets | 6 months ago | |||||
| Consumer Discretionary | 18.7 | 22.5 | ||||
| Industrials | 15.5 | 14.9 | ||||
| Materials | 14.8 | 14.1 | ||||
| Energy | 13.0 | 7.8 | ||||
| Information Technology | 12.9 | 13.0 | ||||
| Financials | 9.5 | 9.8 | ||||
| Health Care | 5.8 | 6.4 | ||||
| Consumer Staples | 4.3 | 2.9 | ||||
| Telecommunication Services | 2.8 | 4.8 | ||||
| Utilities | 0.6 | 0.3 | ||||
| Annual Report | 10 | |||||
| Investments October 31, 2005 | ||||||
| Showing Percentage of Net Assets | ||||||
| Common Stocks 97.4% | ||||||
| Shares | Value (Note 1) | |||||
| (000s) | ||||||
| Australia – 10.4% | ||||||
| ABC Learning Centres Ltd. | 1,308,951 | $ | 6,362 | |||
| Adelaide Bank Ltd. | 102,800 | 957 | ||||
| Austar United Communications Ltd. (a) | 913,300 | 816 | ||||
| Austbrokers Holdings Ltd. | 455,000 | 680 | ||||
| Australian Agricultural Co. Ltd. | 877,210 | 1,194 | ||||
| Australian Stock Exchange Ltd. | 604,239 | 12,999 | ||||
| Australian Worldwide Exploration Ltd. (a)(d) | 998,700 | 1,523 | ||||
| Billabong International Ltd. | 546,600 | 5,289 | ||||
| Bradken Ltd. | 2,426,442 | 6,804 | ||||
| Caltex Australia Ltd. | 397,800 | 6,044 | ||||
| Centamin Egypt Ltd. (a) | 7,820,178 | 2,319 | ||||
| Challenger Financial Services Group Ltd. | 849,959 | 2,313 | ||||
| Coates Hire Ltd. | 392,300 | 1,361 | ||||
| Cochlear Ltd. | 179,000 | 5,084 | ||||
| Computershare Ltd. | 1,370,972 | 6,715 | ||||
| ConnectEast Group unit | 3,264,583 | 1,770 | ||||
| CSL Ltd. | 66,200 | 1,856 | ||||
| CSR Ltd. | 3,282,600 | 7,167 | ||||
| Dominos Pizza Australia New Zealand Ltd. | 1,839,000 | 4,057 | ||||
| Downer EDI Ltd. | 1,777,883 | 8,083 | ||||
| Dwyka Diamonds Ltd. (a) | 7,024,086 | 3,793 | ||||
| Elixir Petroleum Ltd. (a) | 3,666,540 | 1,639 | ||||
| Elkedra Diamonds NL (a) | 3,000,000 | 983 | ||||
| Elkedra Diamonds NL warrants 8/31/07 (a) | 3,000,000 | 352 | ||||
| Energy Developments Ltd. | 452,327 | 1,539 | ||||
| Energy Resources of Australia Ltd. | 144,800 | 1,429 | ||||
| Fox Resources Ltd. (a)(e) | 4,514,836 | 844 | ||||
| Fox Resources Ltd. warrants 6/30/07 (a) | 342,636 | 6 | ||||
| Hardman Resources Ltd.: | ||||||
| (Australia) (a) | 2,002,781 | 3,025 | ||||
| (United Kingdom) (a) | 480,653 | 721 | ||||
| Healthscope Ltd. | 294,400 | 1,255 | ||||
| Iluka Resources Ltd. | 840,900 | 4,867 | ||||
| International Ferro Metals (e) | 26,337,500 | 15,854 | ||||
| Jubilee Mines NL | 252,600 | 1,224 | ||||
| Macquarie Airports unit | 922,500 | 2,069 | ||||
| Macquarie Bank Ltd. | 34,700 | 1,678 | ||||
| Macquarie Communications Infrastructure Group unit | 1,331,700 | 5,726 | ||||
| Macquarie Infrastructure Group unit | 1,404,600 | 3,602 | ||||
| Mayne Group Ltd. | 84,600 | 330 | ||||
| Mineral Deposits Ltd. (a) | 4,920,000 | 3,403 | ||||
| Mortgage Choice Ltd. | 3,927,808 | 4,464 | ||||
See accompanying notes which are an integral part of the financial statements.
11 Annual Report
| Investments continued | ||||||
| Common Stocks continued | ||||||
| Shares | Value (Note 1) | |||||
| (000s) | ||||||
| Australia – continued | ||||||
| Novera Energy Ltd. (a) | 856,600 | $ | 993 | |||
| Oxiana Ltd. (a) | 3,612,500 | 3,620 | ||||
| Paladin Resources Ltd. (a) | 4,294,500 | 6,358 | ||||
| Perpetual Trustees Australia Ltd. | 21,200 | 994 | ||||
| Primary Health Care Ltd. | 104,800 | 823 | ||||
| Publishing & Broadcasting Ltd. | 277,900 | 3,350 | ||||
| QBE Insurance Group Ltd. | 424,723 | 5,653 | ||||
| Rinker Group Ltd. | 248,000 | 2,793 | ||||
| Roc Oil Co. Ltd. (a) | 6,508,592 | 11,754 | ||||
| Seek Ltd. | 2,933,202 | 6,229 | ||||
| Select Managed Funds Ltd. | 84,200 | 315 | ||||
| SFE Corp. Ltd. | 336,800 | 3,135 | ||||
| Sigma Co. Ltd. | 490,500 | 4,390 | ||||
| Sphere Investments Ltd. (a)(e) | 5,250,000 | 2,552 | ||||
| Stockland New (a) | 408 | 2 | ||||
| Sylvania Resources Ltd. (a)(e) | 6,480,000 | 2,738 | ||||
| Tap Oil Nl (a) | 391,700 | 712 | ||||
| Transfield Services Ltd. | 133,800 | 743 | ||||
| Transurban Group unit | 115,600 | 553 | ||||
| UNiTAB Ltd. | 292,600 | 2,779 | ||||
| United Group Ltd. | 959,121 | 7,530 | ||||
| Virotec International Ltd.: | ||||||
| (Australia) (a) | 1,852,832 | 1,039 | ||||
| (United Kingdom) (a) | 5,185,500 | 3,053 | ||||
| Vision Group Holdings Ltd. | 484,300 | 1,630 | ||||
| WorleyParsons Ltd. (d) | 936,800 | 6,865 | ||||
| Zinifex Ltd. | 2,191,500 | 7,964 | ||||
| TOTAL AUSTRALIA | 230,763 | |||||
| Austria – 0.3% | ||||||
| OMV AG | 112,300 | 6,058 | ||||
| Belgium – 0.6% | ||||||
| Euronav NV | 57,000 | 1,756 | ||||
| Melexis NV | 93,199 | 1,162 | ||||
| Omega Pharma SA | 84,500 | 4,366 | ||||
| Punch International NV (a) | 29,700 | 2,585 | ||||
| Recticel SA | 384,144 | 3,560 | ||||
| TOTAL BELGIUM | 13,429 | |||||
See accompanying notes which are an integral part of the financial statements.
| Annual Report |
| 12 |
| Common Stocks continued | ||||||
| Shares | Value (Note 1) | |||||
| (000s) | ||||||
| Bermuda – 1.2% | ||||||
| Aquarius Platinum Ltd.: | ||||||
| (Australia) | 184,902 | $ | 1,383 | |||
| (United Kingdom) | 694,305 | 5,224 | ||||
| China Lotsynergy Holding Ltd. (a) | 7,190,000 | 2,365 | ||||
| Jinhui Shipping & Transportation Ltd. (d) | 164,000 | 575 | ||||
| Petra Diamonds Ltd. (a) | 2,123,906 | 2,331 | ||||
| Ports Design Ltd. | 2,983,000 | 2,790 | ||||
| RC Group (Holdings) Ltd. (f) | 2,493,279 | 1,677 | ||||
| SeaDrill Ltd. (a)(g) | 375,000 | 2,306 | ||||
| Tanzanite One Ltd. | 2,221,701 | 4,936 | ||||
| Xceldiam Ltd. (f) | 3,318,255 | 2,643 | ||||
| Xceldiam Ltd. warrants 11/16/07 (a)(f) | 1,965,127 | 0 | ||||
| TOTAL BERMUDA | 26,230 | |||||
| Brazil – 0.2% | ||||||
| Petroleo Brasileiro SA Petrobras sponsored ADR (non-vtg.) | 86,900 | 5,553 | ||||
| British Virgin Islands – 0.3% | ||||||
| Albidon Ltd. unit (a) | 1,000,000 | 505 | ||||
| BDI Mining Corp. (a)(e) | 7,717,890 | 4,646 | ||||
| Titanium Resources Group Ltd. | 1,890,000 | 1,824 | ||||
| TOTAL BRITISH VIRGIN ISLANDS | 6,975 | |||||
| Canada 2.3% | ||||||
| Adastra Minerals, Inc. (a) | 893,900 | 934 | ||||
| Altius Minerals Corp. (a) | 400,000 | 1,399 | ||||
| Artumas Group, Inc. | 203,500 | 907 | ||||
| Azure Dynamics Corp. Class A (a) | 1,425,700 | 1,461 | ||||
| Bankers Petroleum Ltd. (a) | 3,467,000 | 3,523 | ||||
| Banro Corp. (a) | 393,900 | 2,835 | ||||
| Brazilian Diamonds Ltd. (a) | 1,300,000 | 325 | ||||
| First Quantum Minerals Ltd. | 163,200 | 3,828 | ||||
| Grove Energy Ltd. (a) | 3,049,240 | 1,417 | ||||
| La Mancha Resources, Inc. (a) | 561,000 | 656 | ||||
| Oilexco, Inc. (a) | 5,534,400 | 18,745 | ||||
| Starfield Resources, Inc. (a)(e) | 11,046,531 | 3,741 | ||||
| StrataGold Corp. (a) | 2,229,000 | 1,095 | ||||
| Uruguay Mineral Exploration, Inc. (a) | 245,200 | 851 | ||||
| Valkyries Petroleum Corp. (a) | 430,000 | 2,130 | ||||
| Visual Defence, Inc. | 3,180,000 | 1,379 | ||||
| Western Canadian Coal Corp. (a) | 1,378,718 | 4,786 | ||||
See accompanying notes which are an integral part of the financial statements.
13 Annual Report
| Investments continued | ||||||
| Common Stocks continued | ||||||
| Shares | Value (Note 1) | |||||
| (000s) | ||||||
| Canada – continued | ||||||
| Western Canadian Coal Corp.: | ||||||
| warrants 2/9/06 (a) | 84,359 | $ | 21 | |||
| (United Kingdom) (a) | 548,286 | 1,893 | ||||
| TOTAL CANADA | 51,926 | |||||
| Cayman Islands – 0.6% | ||||||
| AAC Acoustic Technology Holdings, Inc. | 4,450,000 | 2,239 | ||||
| Foxconn International Holdings Ltd. | 2,172,000 | 2,326 | ||||
| Hutchison Telecommunications International Ltd. | 174,000 | 220 | ||||
| Kingboard Chemical Holdings Ltd. | 2,812,180 | 5,949 | ||||
| Mosvold Drilling Ltd. (a) | 586,800 | 992 | ||||
| Sincere Watch (Hong Kong) Ltd. | 6,984,000 | 901 | ||||
| SinoCom Software Group Ltd. | 134,000 | 100 | ||||
| TOTAL CAYMAN ISLANDS | 12,727 | |||||
| China – 0.2% | ||||||
| Shanghai Electric (Group) Corp. (H Shares) | 6,592,000 | 2,083 | ||||
| Sina Corp. (a) | 32,400 | 821 | ||||
| Xinao Gas Holdings Ltd. | 2,674,000 | 2,035 | ||||
| TOTAL CHINA | 4,939 | |||||
| Czech Republic – 0.2% | ||||||
| Komercni Banka AS unit | 84,634 | 3,946 | ||||
| Denmark – 0.2% | ||||||
| Rockwool International AS Series A | 43,700 | 3,401 | ||||
| Estonia – 0.1% | ||||||
| Tallinna Vesi AS | 168,000 | 2,884 | ||||
| Finland – 1.7% | ||||||
| Aldata Solutions Oyj (a) | 2,065,976 | 4,507 | ||||
| Capman Oyj (B Shares) | 426,937 | 1,505 | ||||
| Inion OY | 1,957,900 | 3,466 | ||||
| Neste Oil Oyj | 649,600 | 20,130 | ||||
| Nokian Tyres Ltd. | 473,590 | 7,380 | ||||
| TOTAL FINLAND | 36,988 | |||||
| France – 1.3% | ||||||
| Altamir et Compagnie SA (a) | 6,100 | 1,082 | ||||
| Bourbon SA | 15,638 | 1,264 | ||||
| BVRP Software SA (a) | 144,796 | 3,388 | ||||
| Constructions Industrielles dela Mediterranee SA | 11,500 | 1,017 | ||||
| Damartex SA | 21,485 | 773 | ||||
See accompanying notes which are an integral part of the financial statements.
| Annual Report |
| 14 |
| Common Stocks continued | ||||||
| Shares | Value (Note 1) | |||||
| (000s) | ||||||
| France – continued | ||||||
| Groupe Open SA (d) | 52,500 | $ | 694 | |||
| Groupe Open SA warrants 10/21/06 (a) | 14,809 | 8 | ||||
| Guerbet SA | 8,400 | 1,133 | ||||
| Ipsos SA | 16,003 | 1,899 | ||||
| Lagardere S.C.A. (Reg.) | 21,700 | 1,492 | ||||
| Maisons France Confort | 31,494 | 1,582 | ||||
| Orpea (a) | 25,207 | 1,360 | ||||
| Sechilienne-Sidec | 6,446 | 2,836 | ||||
| Signaux Girod | 14,128 | 1,153 | ||||
| Silicon On Insulator Technologies SA (SOITEC) (a)(d) | 236,300 | 3,538 | ||||
| Sucriere de Pithivier Le Vieil | 5,000 | 3,452 | ||||
| Tessi SA | 24,066 | 1,202 | ||||
| The Lisi Group | 22,500 | 1,308 | ||||
| TOTAL FRANCE | 29,181 | |||||
| Germany – 3.0% | ||||||
| Advanced Photonics Technologies AG (a) | 48,552 | 91 | ||||
| Articon-Integralis AG (Reg.) (a) | 495,185 | 1,983 | ||||
| Deutz AG (a)(d) | 1,676,400 | 7,596 | ||||
| ElringKlinger AG | 18,284 | 677 | ||||
| Fresenius AG (d) | 25,586 | 3,300 | ||||
| Grenkeleasing AG | 25,918 | 1,352 | ||||
| Hawesko Holding AG | 21,800 | 915 | ||||
| K&S AG | 439,200 | 28,815 | ||||
| Kontron AG (a) | 154,264 | 1,128 | ||||
| Merck KGaA | 48,441 | 4,007 | ||||
| Parsytec AG (a) | 188,871 | 498 | ||||
| Pfleiderer AG (a) | 114,359 | 2,084 | ||||
| PSI AG (a)(e) | 689,200 | 3,396 | ||||
| Pulsion Medical Systems AG (a) | 98,511 | 543 | ||||
| SGL Carbon AG (a) | 250,100 | 3,661 | ||||
| Suedzucker AG (Bearer) (d) | 243,275 | 5,124 | ||||
| United Internet AG | 40,352 | 1,304 | ||||
| TOTAL GERMANY | 66,474 | |||||
| Gibraltar 0.2% | ||||||
| PartyGaming PLC | 2,216,200 | 3,423 | ||||
| Greece – 1.3% | ||||||
| Alfa-Beta Vassilopoulos SA (Reg.) (a) | 108,600 | 1,432 | ||||
| Autohellas SA | 238,800 | 945 | ||||
| Fourlis Holdings SA | 252,000 | 2,229 | ||||
| Greek Organization of Football Prognostics SA | 76,842 | 2,218 | ||||
See accompanying notes which are an integral part of the financial statements.
15 Annual Report
| Investments continued | ||||||
| Common Stocks continued | ||||||
| Shares | Value (Note 1) | |||||
| (000s) | ||||||
| Greece – continued | ||||||
| Hyatt Regency SA (Reg.) | 309,882 | $ | 3,796 | |||
| Intralot SA | 110,700 | 1,651 | ||||
| Motor Oil (HELLAS) Corinth Refineries SA | 155,420 | 3,354 | ||||
| Sarantis SA (Reg.) | 1,633,418 | 12,101 | ||||
| TOTAL GREECE | 27,726 | |||||
| Hong Kong – 0.8% | ||||||
| Cafe de Coral Holdings Ltd. | 538,000 | 607 | ||||
| Chen Hsong Holdings Ltd. | 1,060,000 | 475 | ||||
| Convenience Retail Asia Ltd. | 432,000 | 143 | ||||
| Fong’s Industries Co. Ltd. | 500,000 | 339 | ||||
| Hong Kong & Shanghai Hotels Ltd. | 2,229,500 | 2,229 | ||||
| Hong Kong Aircraft & Engineering Co. | 152,400 | 1,108 | ||||
| Integrated Distribution Services Group Ltd. (IDS) | 2,488,000 | 2,439 | ||||
| JCG Holdings Ltd. | 880,000 | 874 | ||||
| Linmark Group Ltd. | 2,218,000 | 672 | ||||
| Lung Kee (Bermuda) Holdings | 978,000 | 732 | ||||
| Midland Holdings Ltd. | 1,794,000 | 868 | ||||
| Shanghai Industrial Holdings Ltd. Class H | 339,000 | 603 | ||||
| Shun Tak Holdings Ltd. | 1,376,000 | 994 | ||||
| Solomon Systech Ltd. | 7,070,000 | 2,599 | ||||
| Tingyi (Cayman Island) Holding Corp. | 100,000 | 34 | ||||
| Tom.com Ltd. (a) | 4,332,000 | 771 | ||||
| Vtech Holdings Ltd. | 455,000 | 1,937 | ||||
| TOTAL HONG KONG | 17,424 | |||||
| Hungary – 0.4% | ||||||
| MOL Magyar Olay es Gazipari RT Series A (For. Reg.) | 44,200 | 4,061 | ||||
| OTP Bank Rt. | 127,473 | 4,557 | ||||
| TOTAL HUNGARY | 8,618 | |||||
| India – 0.7% | ||||||
| Balkrishna Industries Ltd. | 37,161 | 854 | ||||
| Bharti Televentures Ltd. (a) | 445,504 | 3,201 | ||||
| Cipla Ltd. | 8,214 | 66 | ||||
| Financial Technology (India) Ltd. | 86,718 | 1,885 | ||||
| State Bank of India | 355,858 | 7,379 | ||||
| Suzlon Energy Ltd. (a) | 181,848 | 2,883 | ||||
| TOTAL INDIA | 16,268 | |||||
| Ireland – 0.9% | ||||||
| Adwalker PLC (a)(e) | 9,125,000 | 1,292 | ||||
See accompanying notes which are an integral part of the financial statements.
| Annual Report |
| 16 |
| Common Stocks continued | ||||||
| Shares | Value (Note 1) | |||||
| (000s) | ||||||
| Ireland – continued | ||||||
| Aminex PLC (a) | 3,160,919 | $ | 1,259 | |||
| IAWS Group PLC (Ireland) | 38,059 | 525 | ||||
| Kenmare Resources PLC (a) | 4,741,500 | 3,001 | ||||
| Kenmare Resources PLC warrants 7/23/09 (a) | 1,712,500 | 637 | ||||
| Minco PLC (a) | 1,818,181 | 531 | ||||
| Minco PLC warrants 12/3/05 (a) | 909,090 | 64 | ||||
| Paddy Power PLC (Ireland) | 241,011 | 4,074 | ||||
| Petroceltic International PLC (a) | 12,421,734 | 2,529 | ||||
| Providence Resources PLC (a) | 28,529,700 | 1,300 | ||||
| Trinity Biotech PLC sponsored ADR (a)(d) | 227,325 | 1,523 | ||||
| Vimio PLC | 944,000 | 2,657 | ||||
| TOTAL IRELAND | 19,392 | |||||
| Israel – 0.4% | ||||||
| Advanced Vision Technology Ltd. (a) | 165,400 | 1,884 | ||||
| Leadcom Integrated Solutions (e) | 5,160,100 | 4,705 | ||||
| Metal-Tech Ltd. | 830,000 | 2,645 | ||||
| TOTAL ISRAEL | 9,234 | |||||
| Italy 2.0% | ||||||
| Amplifon Spa | 38,350 | 2,494 | ||||
| Banca Italease Spa | 1,051,300 | 22,242 | ||||
| Bastogi Spa (a)(d) | 3,714,300 | 1,205 | ||||
| Brembo Spa | 218,769 | 1,520 | ||||
| Cassa Di Risparmio Di Firenze | 2,942,982 | 8,777 | ||||
| Lottomatica Spa New | 112,000 | 4,068 | ||||
| Saipem Spa | 79,800 | 1,141 | ||||
| Teleunit Spa (a)(e) | 9,675,858 | 3,683 | ||||
| TOTAL ITALY | 45,130 | |||||
| Japan 32.9% | ||||||
| Able, Inc. (d) | 30,500 | 1,094 | ||||
| Adtec Plasma Technology Co. Ltd. | 10 | 43 | ||||
| Advance Create Co. Ltd. | 833 | 1,984 | ||||
| Advanced Media, Inc. Japan | 314 | 2,129 | ||||
| Aeon Fantasy Co. Ltd. | 70,600 | 1,755 | ||||
| Aichi Steel Corp. (d) | 2,156,000 | 15,180 | ||||
| Ain Pharmaciez, Inc. | 68,800 | 1,451 | ||||
| All About, Inc. | 77 | 536 | ||||
| Ariake Japan Co. Ltd. (d) | 180,300 | 4,075 | ||||
| ARRK Corp. | 46,700 | 2,592 | ||||
| Asahi Denka Co. Ltd. (d) | 233,000 | 2,892 | ||||
See accompanying notes which are an integral part of the financial statements.
17 Annual Report
| Investments continued | ||||||
| Common Stocks continued | ||||||
| Shares | Value (Note 1) | |||||
| (000s) | ||||||
| Japan – continued | ||||||
| ASICS Trading Co. Ltd. | 54,900 | $ | 755 | |||
| Asset Managers Co. Ltd. (d) | 633 | 3,059 | ||||
| Axell Corp. (d) | 660 | 2,481 | ||||
| Bando Chemical Industries Ltd. | 249,000 | 1,095 | ||||
| Central Glass Co. Ltd. | 267,000 | 1,494 | ||||
| Chiyoda Corp. | 96,000 | 1,659 | ||||
| Chugoku Marine Paints Ltd. | 432,000 | 2,159 | ||||
| CMIC Co. Ltd. (d) | 1,950 | 697 | ||||
| COMSYS Holdings Corp. | 188,000 | 2,125 | ||||
| Create Restaurants, Inc. | 110,200 | 5,583 | ||||
| Create SD Co. Ltd. | 44,700 | 1,618 | ||||
| Credit Saison Co. Ltd. | 15,600 | 709 | ||||
| Cyber Agent Ltd. New | 566 | 1,020 | ||||
| cyber communications, Inc. (a)(d) | 870 | 2,215 | ||||
| Cyber Firm, Inc. (a) | 315 | 1,009 | ||||
| Daifuku Co. Ltd. | 316,000 | 4,168 | ||||
| Daihatsu Diesel Manufacturing Co. Ltd. | 370,000 | 1,698 | ||||
| Daiwabo Information System Ltd. (d) | 450,000 | 7,506 | ||||
| DC Co. Ltd. | 206,000 | 787 | ||||
| Dip Corp. (a)(d) | 133 | 207 | ||||
| Doshisha Co. Ltd. | 79,650 | 1,414 | ||||
| E*TRADE Securities Co. Ltd. (d) | 488 | 2,565 | ||||
| Enshu Ltd. (a)(d) | 1,118,000 | 3,670 | ||||
| EPS Co. Ltd. (d) | 604 | 1,794 | ||||
| Excite Japan Co. Ltd | 277 | 1,684 | ||||
| Faith, Inc. (d) | 330 | 151 | ||||
| Faith, Inc. New (a) | 1,320 | 602 | ||||
| FCC Co. Ltd. (d) | 58,000 | 2,391 | ||||
| Finance All Corp. (d) | 2,636 | 2,488 | ||||
| FinTech Global, Inc. (d) | 49 | 188 | ||||
| FinTech Global, Inc. New | 98 | 377 | ||||
| Forval Corp. | 79,300 | 846 | ||||
| FT Communications Co. Ltd. (d) | 689 | 1,790 | ||||
| Fuji Seal International, Inc. | 60 | 2 | ||||
| Fujikura Ltd. | 1,304,000 | 8,447 | ||||
| Furukawa Co. Ltd. (a)(d) | 3,058,000 | 6,621 | ||||
| Gourmet Navigator, Inc. (d) | 395 | 1,115 | ||||
| Hamamatsu Photonics KK (d) | 158,000 | 3,674 | ||||
| Haseko Corp. (a) | 330,500 | 1,145 | ||||
| Hikari Tsushin, Inc. | 508,000 | 32,687 | ||||
| Hiroshima Bank Ltd. | 446,000 | 2,916 | ||||
| Hitachi Construction Machinery Co. Ltd. | 129,000 | 2,458 | ||||
See accompanying notes which are an integral part of the financial statements.
| Annual Report |
| 18 |
| Common Stocks continued | ||||||
| Shares | Value (Note 1) | |||||
| (000s) | ||||||
| Japan – continued | ||||||
| Hitachi Metals Ltd. | 761,000 | $ | 7,836 | |||
| Hogy Medical Co. | 29,000 | 1,590 | ||||
| Hokuto Corp. (d) | 276,800 | 4,492 | ||||
| I-CF, Inc. (a)(d) | 1,333 | 2,655 | ||||
| Ibiden Co. Ltd. | 467,600 | 18,952 | ||||
| Index Corp. New (d) | 11,216 | 12,627 | ||||
| Innotech Corp. Japan | 329,800 | 2,485 | ||||
| Intelligent Wave, Inc. (d) | 543 | 1,801 | ||||
| Iriso Electronics Co. Ltd. | 43,500 | 1,243 | ||||
| Ishihara Chemical Co. Ltd. | 49,000 | 883 | ||||
| Itochu Corp. | 668,000 | 4,582 | ||||
| Itochushokuhin Co. Ltd. | 1,500 | 51 | ||||
| J Bridge Corp. (a)(d) | 182,800 | 2,918 | ||||
| Japan Communications, Inc. (d) | 402 | 473 | ||||
| Japan Digital Contents Trust, Inc. (a)(d) | 214 | 239 | ||||
| Japan Digital Contents Trust, Inc. New (a) | 214 | 234 | ||||
| Jastec Co. Ltd. | 119,600 | 2,362 | ||||
| JFE Holdings, Inc. | 67,400 | 2,095 | ||||
| Juroku Bank Ltd. | 175,000 | 1,461 | ||||
| KAGA ELECTRONICS Co. Ltd. | 97,800 | 2,528 | ||||
| Kakaku.com, Inc. New (d) | 140 | 485 | ||||
| Kawasaki Heavy Industries Ltd. (d) | 999,000 | 2,613 | ||||
| Kenedix, Inc. | 3,176 | 13,037 | ||||
| Kibun Food Chemifa Co. Ltd. | 136,200 | 3,303 | ||||
| KK daVinci Advisors (a) | 617 | 2,912 | ||||
| Kobe Steel Ltd. | 1,718,000 | 5,073 | ||||
| Kura Corp. Ltd. (e) | 2,946 | 18,905 | ||||
| Kurita Water Industries Ltd. | 215,000 | 3,616 | ||||
| Link Theory Holdings Co. Ltd. | 284 | 1,355 | ||||
| livedoor Co. Ltd. (a)(d) | 1,599,232 | 5,886 | ||||
| Lopro Corp. (d) | 140,100 | 808 | ||||
| LTT Bio-Pharma Co. Ltd. | 112 | 225 | ||||
| Mars Engineering Corp. | 94,700 | 2,920 | ||||
| Maruei Department Store Co. Ltd. | 376,000 | 1,078 | ||||
| Meganesuper Co. Ltd. | 18,320 | 250 | ||||
| Misumi Group, Inc. | 60,800 | 2,396 | ||||
| Mitsubishi Materials Corp. | 957,000 | 3,299 | ||||
| Mitsui & Co. Ltd. | 296,000 | 3,648 | ||||
| Mitsui O.S.K. Lines Ltd. | 617,000 | 4,360 | ||||
| Mitsui Trust Holdings, Inc. | 381,000 | 4,600 | ||||
| Moshi Moshi Hotline, Inc. | 14,750 | 1,401 | ||||
| Nachi-Fujikoshi Corp. (d) | 1,689,000 | 7,738 | ||||
See accompanying notes which are an integral part of the financial statements.
19 Annual Report
| Investments continued | ||||||
| Common Stocks continued | ||||||
| Shares | Value (Note 1) | |||||
| (000s) | ||||||
| Japan – continued | ||||||
| NEOMAX Co. Ltd. | 176,000 | $ | 5,335 | |||
| Net One Systems Co. Ltd. | 3,971 | 7,634 | ||||
| NextCom KK (d) | 736 | 892 | ||||
| NextCom KK New | 2,208 | 2,639 | ||||
| NGK Insulators Ltd. | 207,000 | 2,476 | ||||
| NGK Spark Plug Co. Ltd. | 313,000 | 5,039 | ||||
| NHK Spring Co. Ltd. | 186,000 | 1,466 | ||||
| Nidec Corp. | 18,500 | 1,088 | ||||
| Nidec Corp. New | 18,500 | 1,088 | ||||
| Nidec Tosok Corp. (d) | 173,400 | 2,035 | ||||
| Nihon Ceratec Co. Ltd. (d) | 290 | 1,200 | ||||
| Nihon Chouzai Co. Ltd. | 38,900 | 1,199 | ||||
| Nihon Dempa Kogyo Co. Ltd. (d) | 476,700 | 13,789 | ||||
| Nihon Micro Coating Co. Ltd. (a) | 150,600 | 1,038 | ||||
| Nihon Trim Co. Ltd. (d) | 176,300 | 9,497 | ||||
| Nihon Unicom Corp. | 99,200 | 1,133 | ||||
| Nikko Cordial Corp. | 204,500 | 2,479 | ||||
| Nippon Denko Co. Ltd. (d) | 186,000 | 641 | ||||
| Nippon Denwa Shisetsu | 25,000 | 94 | ||||
| Nippon Electric Glass Co. Ltd. | 87,000 | 1,669 | ||||
| Nippon Mining Holdings, Inc. | 105,500 | 779 | ||||
| Nippon Oil Corp. | 465,000 | 3,959 | ||||
| Nippon Seiki Co. Ltd. (d) | 464,000 | 8,029 | ||||
| Nippon Suisan Kaisha Co. Ltd. (d) | 854,000 | 3,432 | ||||
| Nissei Corp. | 128,000 | 1,643 | ||||
| Nissin Co. Ltd. | 267,080 | 389 | ||||
| Nissin Co. Ltd. New | 267,080 | 384 | ||||
| Nissin Kogyo Co. Ltd. | 614,200 | 27,553 | ||||
| Nissin Servicer Co. Ltd. | 2,001 | 1,872 | ||||
| Nissin Servicer Co. Ltd. New | 2,001 | 1,872 | ||||
| Nitta Corp. | 102,000 | 1,381 | ||||
| NOK Corp. | 187,800 | 5,676 | ||||
| Ogaki Kyoritsu Bank Ltd. | 359,000 | 2,279 | ||||
| Ohara, Inc. (a) | 52,400 | 2,201 | ||||
| Orient Corp. (a) | 785,000 | 3,358 | ||||
| Otaki Gas Co. Ltd. | 16,000 | 80 | ||||
| Otsuka Corp. | 164,500 | 14,559 | ||||
| Pacific Metals Co. Ltd. (d) | 1,545,000 | 6,743 | ||||
| Parker Corp. | 49,000 | 505 | ||||
| Pigeon Corp. (d) | 253,900 | 3,344 | ||||
| Resona Holdings, Inc. (a) | 1,103 | 3,200 | ||||
| Rex Holdings Co. Ltd. (d) | 791 | 5,213 | ||||
See accompanying notes which are an integral part of the financial statements.
| Annual Report |
| 20 |
| Common Stocks continued | ||||||
| Shares | Value (Note 1) | |||||
| (000s) | ||||||
| Japan – continued | ||||||
| Rohto Pharmaceutical Co. Ltd. New | 134,000 | $ | 1,193 | |||
| Saint Marc Co. Ltd. (d) | 75,500 | 3,825 | ||||
| Sammy NetWorks Co. Ltd. (d) | 1,229 | 15,433 | ||||
| SBI Holdings, Inc. (d) | 11,860 | 5,926 | ||||
| Sega Sammy Holdings, Inc. | 7,400 | 267 | ||||
| Sega Sammy Holdings, Inc. New | 76,500 | 2,776 | ||||
| Seikagaku Corp. | 196,300 | 2,120 | ||||
| Sekisui Chemical Co. Ltd. | 172,000 | 1,092 | ||||
| Sekisui Plastics Co. Ltd. | 335,000 | 1,155 | ||||
| Shinohara Systems of Construction Co. Ltd. | 831 | 3,483 | ||||
| Showa Denko KK | 715,000 | 2,291 | ||||
| Showa Shell Sekiyu KK (d) | 595,200 | 7,423 | ||||
| Silex Technology, Inc. | 269 | 745 | ||||
| Simplex Investment Advisors, Inc. (d) | 60 | 488 | ||||
| Softbrain Co. Ltd. (d) | 449 | 817 | ||||
| Software Research Association (SRA) (d) | 28,700 | 483 | ||||
| Sumitomo Corp. | 1,185,000 | 13,238 | ||||
| Sumitomo Metal Mining Co. Ltd. | 1,604,000 | 14,641 | ||||
| Sumitomo Precision Products Co. Ltd. | 374,000 | 1,960 | ||||
| Sumitomo Rubber Industries Ltd. | 589,000 | 7,253 | ||||
| Sumitomo Titanium Corp. (d) | 10,600 | 1,230 | ||||
| Sumitomo Titanium Corp. New (d) | 20,600 | 2,319 | ||||
| Sun Frontier Fudousan Co. Ltd. | 1,278 | 6,132 | ||||
| Sunx Ltd. | 140,100 | 2,334 | ||||
| Taisei Corp. | 366,000 | 1,626 | ||||
| Taiyo Kagaku (d) | 85,500 | 1,111 | ||||
| Take & Give Needs Co. Ltd. (a) | 2,817 | 3,952 | ||||
| Tamron Co. Ltd. (d) | 84,000 | 1,157 | ||||
| Teijin Ltd | 842,000 | 5,031 | ||||
| Teikoku Oil Co. Ltd. | 420,000 | 4,048 | ||||
| Telewave, Inc. (d) | 652 | 3,811 | ||||
| The First Energy Service Co. Ltd. (d) | 39 | 136 | ||||
| The First Energy Service Co. Ltd. New (d) | 156 | 544 | ||||
| The Keiyo Bank Ltd. | 185,000 | 1,392 | ||||
| Toc Co. Ltd. | 104,000 | 603 | ||||
| Token Corp. | 82,100 | 3,896 | ||||
| Tokuyama Corp. | 644,000 | 6,414 | ||||
| Tokyo Seimitsu Co. Ltd. (d) | 67,100 | 3,086 | ||||
| TonenGeneral Sekiyu KK | 134,000 | 1,502 | ||||
| Toray Industries, Inc. | 2,627,000 | 14,651 | ||||
| Tosoh Corp. | 982,000 | 4,363 | ||||
| Toyo Ink Manufacturing Co. Ltd. (d) | 1,994,000 | 8,582 | ||||
See accompanying notes which are an integral part of the financial statements.
21 Annual Report
| Investments continued | ||||||
| Common Stocks continued | ||||||
| Shares | Value (Note 1) | |||||
| (000s) | ||||||
| Japan – continued | ||||||
| Toyo Suisan Kaisha Ltd. | 60,000 | $ | 1,044 | |||
| Trancom Co. Ltd. | 101,700 | 2,127 | ||||
| Trans Cosmos, Inc. (d) | 78,600 | 3,989 | ||||
| Trend Micro, Inc. | 39,500 | 1,235 | ||||
| Turbolinux, Inc. | 170 | 467 | ||||
| Tyo Productions, Inc. | 128,000 | 593 | ||||
| Usen Corp. | 718,550 | 16,521 | ||||
| Warabeya Nichiyo Co. Ltd. (d) | 140,700 | 2,028 | ||||
| Works Applications Co. Ltd. (a)(d) | 7,314 | 6,777 | ||||
| Yachiyo Industry Co. Ltd. | 121,000 | 2,022 | ||||
| Yahagi Construction Co. Ltd. | 299,000 | 1,489 | ||||
| Yamada Denki Co. Ltd. | 331,500 | 29,196 | ||||
| Yamaichi Electronics Co. Ltd. | 105,900 | 1,316 | ||||
| Yaskawa Electric Corp. (a)(d) | 930,000 | 7,273 | ||||
| Yasuragi Co. Ltd. (a) | 115,900 | 3,914 | ||||
| Yorozu Corp. | 138,300 | 1,304 | ||||
| Yoshimoto Kogyo Co. Ltd. (d) | 102,000 | 1,806 | ||||
| Zensho Co. Ltd. (d) | 83,900 | 1,415 | ||||
| Zensho Co. Ltd. New (a)(d) | 83,900 | 1,415 | ||||
| TOTAL JAPAN | 727,557 | |||||
| Korea (South) 0.4% | ||||||
| Doosan Heavy Industries & Construction Co. Ltd. | 154,920 | 3,354 | ||||
| Hyundai Engineering & Construction Co. Ltd. (a) | 24,740 | 769 | ||||
| LG Household & Health Care Ltd. | 30,080 | 1,642 | ||||
| NHN Corp. (a) | 24,661 | 4,098 | ||||
| TOTAL KOREA (SOUTH) | 9,863 | |||||
| Luxembourg 1.0% | ||||||
| Stolt-Nielsen SA | 653,190 | 22,991 | ||||
| Netherlands – 0.2% | ||||||
| Axalto Holding NV (a) | 82,100 | 2,235 | ||||
| Bateman Engineering NV | 480,200 | 2,011 | ||||
| TOTAL NETHERLANDS | 4,246 | |||||
| New Zealand – 0.8% | ||||||
| Auckland International Airport Ltd. | 3,469,725 | 4,759 | ||||
| Fisher & Paykel Healthcare Corp. | 2,225,596 | 5,404 | ||||
| Fletcher Building Ltd. | 464,190 | 2,550 | ||||
| Sky City Entertainment Group Ltd. | 1,663,489 | 5,285 | ||||
| TOTAL NEW ZEALAND | 17,998 | |||||
See accompanying notes which are an integral part of the financial statements.
| Annual Report |
| 22 |
| Common Stocks continued | ||||||
| Shares | Value (Note 1) | |||||
| (000s) | ||||||
| Norway 2.1% | ||||||
| ABG Sundal Collier ASA | 1,168,000 | $ | 1,382 | |||
| Aker Kvaerner ASA (a) | 32,000 | 1,662 | ||||
| Camillo Eitzen & Co. ASA | 605,200 | 6,046 | ||||
| Deep Ocean ASA (a) | 421,247 | 1,036 | ||||
| Mamut ASA (a) | 733,600 | 1,353 | ||||
| Odfjell ASA (A Shares) | 85,700 | 1,643 | ||||
| P4 Radio Hele Norge ASA | 141,400 | 565 | ||||
| Pertra Midt-Norges AS (g) | 60,000 | 922 | ||||
| Petroleum Geo-Services ASA (a) | 116,250 | 2,948 | ||||
| Profdoc ASA (a) | 113,200 | 1,583 | ||||
| Schibsted ASA (B Shares) | 54,100 | 1,559 | ||||
| Solstad Offshore ASA | 114,000 | 1,577 | ||||
| Songa Offshore ASA (a) | 985,408 | 4,317 | ||||
| Songa Offshore ASA warrants 5/20/08 (a)(g) | 177,778 | 519 | ||||
| Statoil ASA | 222,900 | 4,985 | ||||
| Stepstone ASA (a)(e) | 4,710,000 | 5,719 | ||||
| TANDBERG ASA | 334,300 | 3,289 | ||||
| TANDBERG Television ASA (a) | 395,400 | 4,923 | ||||
| TOTAL NORWAY | 46,028 | |||||
| Papua New Guinea – 0.1% | ||||||
| Oil Search Ltd. | 517,100 | 1,276 | ||||
| Poland – 1.2% | ||||||
| Pfleiderer Grajewo SA | 440,800 | 3,680 | ||||
| Polski Koncern Naftowy Orlen SA unit | 526,600 | 18,894 | ||||
| Powszechna Kasa Oszczednosci Bank SA | 103,000 | 866 | ||||
| TVN SA | 149,254 | 2,546 | ||||
| TOTAL POLAND | 25,986 | |||||
| Portugal 0.2% | ||||||
| Impresa SGPS (a) | 984,753 | 5,489 | ||||
| Russia – 1.5% | ||||||
| Mobile TeleSystems OJSC: | ||||||
| GDR (Reg. S) | 74,000 | 2,738 | ||||
| sponsored ADR | 81,300 | 3,007 | ||||
| Sibirtelecom Open Joint Stock Co. sponsored ADR (a) | 104,700 | 5,209 | ||||
| Sistema JSFC sponsored GDR | 314,200 | 7,038 | ||||
| Uralsvyazinform sponsored ADR | 614,100 | 4,286 | ||||
| Vimpel Communications sponsored ADR (a) | 68,100 | 2,724 | ||||
| VolgaTelecom sponsored ADR | 1,000,400 | 7,303 | ||||
| TOTAL RUSSIA | 32,305 | |||||
| See accompanying notes which are an integral part of the financial statements. | ||||||
| 23 | Annual Report | |||||
| Investments continued | ||||||
| Common Stocks continued | ||||||
| Shares | Value (Note 1) | |||||
| (000s) | ||||||
| Singapore – 2.5% | ||||||
| Cosco Investment (Singapore) Ltd. | 2,638,000 | $ | 3,426 | |||
| CSE Global Ltd. | 996,000 | 426 | ||||
| GES International Ltd. | 4,344,000 | 2,385 | ||||
| Guocoland Ltd. | 446,000 | 411 | ||||
| Hong Leong Finance Ltd. | 310,000 | 652 | ||||
| HTL International Holdings Ltd. | 1,422,500 | 1,058 | ||||
| Jurong Technologies Industrial Corp. Ltd. | 1,686,000 | 1,941 | ||||
| Keppel Land Ltd. | 930,000 | 2,097 | ||||
| Olam International Ltd. | 2,539,000 | 1,919 | ||||
| Osim International Ltd. | 800,000 | 732 | ||||
| Parkway Holdings Ltd. | 4,538,000 | 5,305 | ||||
| SembCorp Industries Ltd. | 3,425,000 | 5,439 | ||||
| SembCorp Logistics Ltd. | 596,000 | 602 | ||||
| Sembcorp Marine Ltd. | 2,860,000 | 4,626 | ||||
| SIA Engineering Co. Ltd. | 2,847,000 | 4,185 | ||||
| Singapore Exchange Ltd. | 4,407,000 | 7,025 | ||||
| Singapore Petroleum Co. Ltd. | 1,501,000 | 4,271 | ||||
| Singapore Post Ltd. | 10,718,000 | 7,213 | ||||
| United Overseas Land Ltd. | 803,000 | 1,109 | ||||
| TOTAL SINGAPORE | 54,822 | |||||
| South Africa 3.7% | ||||||
| Aflease Gold & Uranium Resources Ltd. (a) | 2,643,000 | 1,910 | ||||
| African Bank Investments Ltd. | 3,710,751 | 11,066 | ||||
| Discovery Holdings Ltd. (a) | 2,751,919 | 9,002 | ||||
| FirstRand Ltd. | 952,000 | 2,240 | ||||
| Foschini Ltd. | 488,000 | 3,109 | ||||
| Gold Reef Casino Resorts Ltd. | 697,000 | 1,433 | ||||
| JD Group Ltd. | 188,100 | 2,011 | ||||
| MTN Group Ltd. | 1,176,702 | 8,768 | ||||
| Nedbank Group Ltd | 154,000 | 1,962 | ||||
| Steinhoff International Holdings Ltd. | 12,684,632 | 33,194 | ||||
| VenFin Ltd. | 904,500 | 4,920 | ||||
| Wilson Bayly Holmes Ovcon Ltd. | 446,856 | 2,684 | ||||
| TOTAL SOUTH AFRICA | 82,299 | |||||
| Spain – 0.3% | ||||||
| Antena 3 Television SA | 274,232 | 5,332 | ||||
| Construcciones y Auxiliar de Ferrocarriles | 9,500 | 991 | ||||
| TOTAL SPAIN | 6,323 | |||||
See accompanying notes which are an integral part of the financial statements.
| Annual Report |
| 24 |
| Common Stocks continued | ||||||
| Shares | Value (Note 1) | |||||
| (000s) | ||||||
| Sweden – 1.9% | ||||||
| Consafe Offshore AB (A Shares) (a) | 1,103,172 | $ | 14,921 | |||
| Eniro AB (d) | 153,028 | 1,672 | ||||
| Gambro AB (A Shares) | 405,000 | 5,723 | ||||
| Hexagon AB (B Shares) (d) | 213,129 | 5,019 | ||||
| Intrum Justitia AB (a) | 375,200 | 3,205 | ||||
| Modern Times Group AB (MTG) (B Shares) (a) | 210,550 | 8,053 | ||||
| Observer AB | 1,180,035 | 3,987 | ||||
| VBG AB (B Shares) | 6,710 | 198 | ||||
| TOTAL SWEDEN | 42,778 | |||||
| Switzerland – 0.8% | ||||||
| Actelion Ltd. (Reg.) (a) | 18,108 | 2,037 | ||||
| Amazys Holding AG | 54,100 | 3,273 | ||||
| Barry Callebaut AG | 2,861 | 802 | ||||
| Bucher Holding AG | 31,439 | 2,512 | ||||
| Escor Casino & Entertainment SA | 19,770 | 395 | ||||
| Mobilezone Holding AG (a) | 462,199 | 1,757 | ||||
| Pargesa Holding SA | 14,130 | 1,091 | ||||
| Roche Holding AG (participation certificate) | 23,767 | 3,551 | ||||
| Sulzer AG (Reg.) | 2,648 | 1,274 | ||||
| Swissquote Group Holding SA (a) | 18,811 | 1,878 | ||||
| TOTAL SWITZERLAND | 18,570 | |||||
| Thailand – 0.1% | ||||||
| Bumrungrad Hospital PCL (For. Reg.) | 2,330,500 | 1,529 | ||||
| Turkey 1.4% | ||||||
| Atakule Gayrimenkul Yatirim Ortakligi AS | 1,033,000 | 871 | ||||
| Dogan Gazetecilik AS (a) | 3,601,955 | 7,622 | ||||
| Efes Sinai Yatirim Holding AS Class B (a) | 871,100 | 8,766 | ||||
| Enka Insaat ve Sanayi AS | 360,950 | 3,979 | ||||
| Tupras Turkiye Petrol Rafinerileri AS | 525,600 | 8,984 | ||||
| TOTAL TURKEY | 30,222 | |||||
| United Arab Emirates – 0.0% | ||||||
| Investcom LLC GDR | 45,600 | 616 | ||||
| United Kingdom – 15.3% | ||||||
| Abcam PLC | 417,239 | 1,234 | ||||
| Accuma Group PLC | 418,063 | 1,303 | ||||
| Advanced Technology (UK) PLC (a)(e) | 7,355,000 | 0 | ||||
| AeroBox PLC (a) | 5,694,657 | 706 | ||||
| Afren PLC (e) | 13,078,000 | 12,040 | ||||
See accompanying notes which are an integral part of the financial statements.
25 Annual Report
| Investments continued | ||||||
| Common Stocks continued | ||||||
| Shares | Value (Note 1) | |||||
| (000s) | ||||||
| United Kingdom – continued | ||||||
| African Copper PLC | 1,742,884 | $ | 1,450 | |||
| Air Partner PLC | 45,000 | 480 | ||||
| Alba PLC | 749,800 | 4,912 | ||||
| Alliance Pharma PLC (a)(e) | 9,049,400 | 2,924 | ||||
| Alterian PLC (a) | 1,486,000 | 3,026 | ||||
| Amlin PLC | 157,014 | 616 | ||||
| Andor Technology Ltd. | 444,444 | 803 | ||||
| Anglo Asian Mining PLC | 2,605,500 | 3,414 | ||||
| Appian Technology PLC (a) | 1,916,178 | 153 | ||||
| Appian Technology PLC warrants 2/28/08 (a)(g) | 479,045 | 0 | ||||
| Ascent Resources PLC (a)(e) | 12,000,000 | 2,603 | ||||
| Ascent Resources PLC warrants 6/2/07 (a) | 6,000,000 | 770 | ||||
| Asia Energy PLC (a) | 1,390,951 | 12,375 | ||||
| Atrium Underwriting PLC | 257,060 | 917 | ||||
| BG Group PLC | 441,600 | 3,878 | ||||
| Bioprogress PLC (a) | 4,376,349 | 2,479 | ||||
| Block Shield Corp. PLC (a) | 900,000 | 1,984 | ||||
| Body Shop International PLC | 800,000 | 2,974 | ||||
| BowLeven PLC | 1,407,600 | 9,158 | ||||
| British Energy Group PLC (a) | 274,800 | 2,160 | ||||
| Burren Energy PLC | 64,302 | 911 | ||||
| Caffe Nero Group PLC (a) | 282,978 | 1,250 | ||||
| Cambrian Mining PLC (a)(e) | 6,039,800 | 15,024 | ||||
| Cambrian Mining PLC warrants 1/25/06 (a) | 350,000 | 0 | ||||
| Cardpoint PLC (a) | 345,300 | 688 | ||||
| Central African Mining & Exploration Co. PLC (a) | 16,622,700 | 3,237 | ||||
| Centurion Electronics PLC (e) | 1,751,839 | 574 | ||||
| Ceres Power Holding PLC | 776,700 | 1,856 | ||||
| Chaco Resources PLC (f) | 9,500,000 | 1,009 | ||||
| Chaucer Holdings PLC | 5,079,800 | 4,789 | ||||
| Clapham House Group PLC (a) | 725,650 | 1,856 | ||||
| Cobra Biomanufacturing PLC (a) | 701,900 | 587 | ||||
| Coffeeheaven International PLC (a)(f) | 8,115,909 | 1,580 | ||||
| Corac Group PLC (a)(e) | 4,849,104 | 2,146 | ||||
| Corin Group PLC | 1,210,314 | 7,119 | ||||
| CSS Stellar PLC (a) | 598,908 | 414 | ||||
| CustomVis PLC (a) | 1,558,936 | 155 | ||||
| DA Group PLC (a)(e) | 1,875,165 | 2,490 | ||||
| Daniel Stewart Securities PLC (a) | 3,029,000 | 831 | ||||
| Dat Group PLC (e) | 1,806,000 | 1,263 | ||||
| Domino’s Pizza UK & IRL PLC | 383,626 | 2,004 | ||||
| Dream Direct Group PLC (a) | 145,000 | 245 | ||||
See accompanying notes which are an integral part of the financial statements.
| Annual Report |
| 26 |
| Common Stocks continued | ||||||
| Shares | Value (Note 1) | |||||
| (000s) | ||||||
| United Kingdom – continued | ||||||
| Eclipse Energy Co. Ltd. (g) | 102,000 | $ | 1,354 | |||
| Eureka Mining PLC (a) | 381,700 | 730 | ||||
| Europa Oil & Gas Holdings PLC | 1,000,000 | 549 | ||||
| Europa Oil & Gas Holdings PLC warrants 11/11/07 (a) | 500,000 | 86 | ||||
| European Diamonds PLC (a) | 499,300 | 194 | ||||
| Faroe Petroleum PLC (a) | 1,288,906 | 2,852 | ||||
| Firestone Diamonds PLC (a) | 687,000 | 1,745 | ||||
| Flomerics Group PLC | 449,658 | 637 | ||||
| Forum Energy PLC | 1,127,270 | 2,505 | ||||
| Freeport PLC | 256,276 | 1,894 | ||||
| Future PLC | 1,717,169 | 1,718 | ||||
| Gaming Corp. PLC (a) | 9,702,913 | 2,018 | ||||
| GMA Resources PLC (a)(e) | 12,545,265 | 1,527 | ||||
| GMA Resources PLC (a)(e)(f) | 12,100,818 | 1,499 | ||||
| Goals Soccer Centres PLC | 827,000 | 2,116 | ||||
| Golden Prospect PLC | 2,246,871 | 1,790 | ||||
| Goldshield Group PLC | 416,400 | 2,643 | ||||
| GTL Resources PLC (a) | 13,669,072 | 381 | ||||
| Gyrus Group PLC (a) | 434,400 | 2,457 | ||||
| Hardide Ltd. (e) | 12,401,000 | 2,909 | ||||
| Healthcare Enterprise Group PLC (a)(e) | 9,818,379 | 10,604 | ||||
| Highbury House Communications PLC (a) | 713,914 | 22 | ||||
| Hydrodec Group PLC (a) | 6,231,100 | 2,730 | ||||
| ID Data PLC (a)(e) | 84,350,500 | 1,344 | ||||
| Ideal Shopping Direct PLC | 235,339 | 1,419 | ||||
| Imperial College Innovations Ltd. (g) | 19,300 | 2,734 | ||||
| Inchcape PLC | 30,122 | 1,099 | ||||
| Intertek Group PLC | 116,310 | 1,467 | ||||
| IPSA Group PLC (e) | 4,074,075 | 2,128 | ||||
| ITE Group PLC | 4,436,717 | 8,876 | ||||
| ITM Power PLC (a) | 4,339,800 | 8,452 | ||||
| Jubilee Platinum PLC (a)(e) | 4,286,043 | 3,339 | ||||
| Lambert Howarth Group PLC (e) | 1,568,784 | 6,291 | ||||
| Landround PLC (e) | 298,600 | 582 | ||||
| Lawrence PLC | 1,073,124 | 6,431 | ||||
| LTG Technologies PLC (a) | 11,517,168 | 2,294 | ||||
| Manpower Software PLC (a) | 258,824 | 121 | ||||
| Meridian Petroleum PLC (a) | 2,747,000 | 377 | ||||
| Metals Exploration PLC (a)(e) | 2,820,077 | 624 | ||||
| Metals Exploration PLC warrants 9/14/07 (a) | 1,410,039 | 0 | ||||
| Mice Group PLC | 4,432,324 | 2,472 | ||||
| Michelmersh Brick Holdings PLC (a) | 578,900 | 1,010 | ||||
See accompanying notes which are an integral part of the financial statements.
27 Annual Report
| Investments continued | ||||||
| Common Stocks continued | ||||||
| Shares | Value (Note 1) | |||||
| (000s) | ||||||
| United Kingdom – continued | ||||||
| Monstermob Group PLC (a) | 226,461 | $ | 1,520 | |||
| NDS Group PLC sponsored ADR (a) | 105,154 | 3,849 | ||||
| NETeller PLC (a) | 263,100 | 3,209 | ||||
| NeuTec Pharma PLC (a) | 174,136 | 1,372 | ||||
| NeutraHealth PLC (a)(e) | 7,328,100 | 1,719 | ||||
| Oil Quest Resources PLC (a)(e) | 2,362,285 | 596 | ||||
| Oystertec PLC (a) | 7,009,687 | 1,365 | ||||
| P&MM Group PLC (a)(e) | 2,035,000 | 3,423 | ||||
| Phytopharm PLC (a) | 678,720 | 565 | ||||
| Pilat Media Global PLC (a)(e) | 2,880,000 | 2,244 | ||||
| Platinum Mining Corp. of India PLC (e) | 12,520,800 | 3,602 | ||||
| PlusNet Technologies Ltd. (a)(e) | 1,567,355 | 7,340 | ||||
| Premier Oil PLC (a) | 159,291 | 2,045 | ||||
| Primary Health Properties PLC | 80,000 | 494 | ||||
| Proteome Sciences PLC (a) | 623,042 | 750 | ||||
| Punch Graphix PLC | 92,458 | 209 | ||||
| Pureprofile Media PLC (g) | 680,000 | 602 | ||||
| Pureprofile Media PLC warrants 7/31/06 (a)(g) | 680,000 | 0 | ||||
| QA PLC (a) | 13,554,656 | 252 | ||||
| Rambler Metals & Mining PLC | 1,300,000 | 886 | ||||
| Retail Decisions PLC (f) | 7,007,400 | 2,605 | ||||
| Rheochem PLC (e) | 8,728,300 | 1,854 | ||||
| Rheochem PLC warrants 12/21/07 (a) | 4,364,150 | 0 | ||||
| Richmond Foods PLC | 81,813 | 742 | ||||
| Royalblue Group PLC | 45,073 | 519 | ||||
| Scapa Group PLC | 3,660,400 | 1,507 | ||||
| SDL PLC (a) | 1,450,000 | 4,005 | ||||
| Serabi Mining PLC | 2,612,400 | 1,237 | ||||
| Sibir Energy PLC (a) | 116,280 | 620 | ||||
| Sinclair Pharma PLC (a) | 1,786,758 | 4,160 | ||||
| Sondex PLC | 260,100 | 1,002 | ||||
| SPI Lasers PLC | 658,000 | 1,782 | ||||
| Spice Holdings PLC | 771,200 | 2,901 | ||||
| Sportingbet PLC | 345,100 | 1,799 | ||||
| Stem Cell Sciences PLC | 716,649 | 1,098 | ||||
| Sterling Energy PLC (a) | 8,837,667 | 2,660 | ||||
| SubSea Resources PLC (e) | 8,644,100 | 4,362 | ||||
| SubSea Resources PLC warrants 11/4/09 (a) | 1,805,625 | 360 | ||||
| Synergy Healthcare PLC | 314,553 | 2,345 | ||||
| Taghmen Energy PLC (a)(e) | 4,745,755 | 5,671 | ||||
| Taghmen Energy PLC warrants 4/30/07 (a) | 2,279,573 | 1,142 | ||||
| Tanfield Group PLC (a) | 8,653,000 | 2,911 | ||||
See accompanying notes which are an integral part of the financial statements.
| Annual Report |
| 28 |
| Common Stocks continued | ||||||
| Shares | Value (Note 1) | |||||
| (000s) | ||||||
| United Kingdom – continued | ||||||
| Teesland PLC | 1,380,000 | $ | 2,003 | |||
| Tikit Group PLC (e) | 720,362 | 2,436 | ||||
| TMO Biotec (g) | 10,000 | 531 | ||||
| Toledo Mining Corp. PLC (a) | 480,000 | 982 | ||||
| Triple Plate Junction PLC (a) | 3,638,000 | 1,353 | ||||
| Triple Plate Junction PLC warrants 12/31/05 (a) | 1,818,750 | 0 | ||||
| Tristel PLC | 561,318 | 601 | ||||
| UK Coal PLC | 1,087,069 | 2,762 | ||||
| ukbetting PLC (a) | 2,517,419 | 2,630 | ||||
| Unibet Group PLC unit | 474,256 | 9,888 | ||||
| Whatman PLC | 280,100 | 1,389 | ||||
| White Nile Ltd. (a) | 200,000 | 351 | ||||
| William Ransom & Son PLC | 3,629,500 | 2,988 | ||||
| Windsor PLC | 700,000 | 598 | ||||
| Wolfson Microelectronics PLC (a) | 685,250 | 3,015 | ||||
| World Gaming PLC (a) | 1,332,300 | 3,951 | ||||
| ZincOx Resources PLC (a) | 970,000 | 2,619 | ||||
| TOTAL UNITED KINGDOM | 337,828 | |||||
| United States of America – 1.7% | ||||||
| 121Media, Inc. (e) | 603,205 | 1,832 | ||||
| Central European Distribution Corp. (a) | 49,300 | 1,963 | ||||
| Chindex International, Inc. (a)(d) | 138,900 | 511 | ||||
| Cyberscan Technology, Inc. | 158,400 | 1,725 | ||||
| Frontera Resources Corp. | 2,300,000 | 5,131 | ||||
| Frontier Mining Ltd. (a)(e) | 6,115,691 | 2,220 | ||||
| GeoGlobal Resources, Inc. (a)(d) | 351,900 | 2,235 | ||||
| Marathon Oil Corp. | 39,900 | 2,400 | ||||
| Private Media Group, Inc. (a)(d) | 283,400 | 621 | ||||
| Solar Integrated Technologies, Inc. (a) | 1,643,073 | 4,727 | ||||
| Trico Marine Services, Inc. (a) | 67,200 | 1,713 | ||||
| Uranco, Inc. (a)(g) | 1,333,332 | 1,000 | ||||
| Uranco, Inc. warrants 7/26/08 (a)(g) | 666,666 | 0 | ||||
| UTEK Corp. (Reg. S) | 34,942 | 414 | ||||
| Valero Energy Corp. | 41,400 | 4,357 | ||||
| XL TechGroup, Inc. | 1,442,680 | 6,769 | ||||
| TOTAL UNITED STATES OF AMERICA | 37,618 | |||||
| TOTAL COMMON STOCKS | ||||||
| (Cost $1,812,433) | 2,155,033 | |||||
See accompanying notes which are an integral part of the financial statements.
29 Annual Report
| Investments continued | ||||||||
| Nonconvertible Preferred Stocks 0.4% | ||||||||
| Shares | Value (Note 1) | |||||||
| (000s) | ||||||||
| Germany – 0.4% | ||||||||
| Fresenius AG | ||||||||
| (Cost $3,683) | 57,705 | $ | 8,107 | |||||
| Investment Companies 0.0% | ||||||||
| United Kingdom – 0.0% | ||||||||
| Black Sea Property Fund Ltd. | ||||||||
| (Cost $1,166) | 3,036,200 | 1,223 | ||||||
| Corporate Bonds 0.1% | ||||||||
| Principal | ||||||||
| Amount (000s) | ||||||||
| Convertible Bonds 0.1% | ||||||||
| United Kingdom – 0.1% | ||||||||
| BioCare Solutions Ltd. 1% 12/31/06 (g) | GBP | $ | 54,768 | 970 | ||||
| Nonconvertible Bonds – 0.0% | ||||||||
| Norway 0.0% | ||||||||
| Songa Offshore ASA 9% 9/8/10 (g) | 600 | 582 | ||||||
| TOTAL CORPORATE BONDS | ||||||||
| (Cost $1,574) | 1,552 | |||||||
| Money Market Funds 6.9% | ||||||||
| Shares | ||||||||
| Fidelity Cash Central Fund, 3.92% (b) | 36,414,099 | 36,414 | ||||||
| Fidelity Securities Lending Cash Central Fund, 3.94% (b)(c) 115,371,226 | 115,371 | |||||||
| TOTAL MONEY MARKET FUNDS | ||||||||
| (Cost $151,785) | 151,785 | |||||||
| TOTAL INVESTMENT PORTFOLIO 104.8% | ||||||||
| (Cost $1,970,641) | 2,317,700 | |||||||
| NET OTHER ASSETS – (4.8)% | (105,340) | |||||||
| NET ASSETS 100% | $ | 2,212,360 | ||||||
| See accompanying notes which are an integral part of the financial statements. | ||||||||
| Annual Report | 30 | |||||||
| Currency Abbreviations |
| GBP — British pound |
| Legend (a) Non-income producing (b) Affiliated fund that is available only to investment companies and other accounts managed by Fidelity Investments. The rate quoted is the annualized seven-day yield of the fund at period end. A complete unaudited listing of the fund’s holdings as of its most recent quarter end is available upon request. (c) Investment made with cash collateral received from securities on loan. (d) Security or a portion of the security is on loan at period end. (e) Affiliated company (f) Security purchased on a delayed delivery or when-issued basis. (g) Restricted securities – Investment in securities not registered under the Securities Act of 1933 (excluding 144A issues). At the end of the period, the value of restricted securities (excluding 144A issues) amounted to $11,520,000 or 0.5% of net assets. |
Additional information on each holding is as follows:
| Acquisition | Acquisition | |||||
| Security | Date | Cost (000s) | ||||
| Appian | ||||||
| Technology PLC | ||||||
| warrants | ||||||
| 2/28/08 | 2/18/05 | $ | — | |||
| BioCare Solutions | ||||||
| Ltd. 1% | ||||||
| 12/31/06 | 8/3/05 | $ | 974 | |||
| Eclipse Energy | ||||||
| Co. Ltd. | 4/28/05 | $ | 1,459 | |||
| Imperial College | ||||||
| Innovations Ltd. | 4/27/05 | $ | 2,942 | |||
| Pertra Midt | ||||||
| Norges AS | 6/28/05 | $ | 911 | |||
| Pureprofile Media | ||||||
| PLC | 5/3/05 | $ | 644 | |||
| Pureprofile Media | ||||||
| PLC warrants | ||||||
| 7/31/06 | 5/3/05 | $ | — | |||
| SeaDrill Ltd. | 8/23/05 | $ | 3,384 | |||
| Songa Offshore | ||||||
| ASA warrants | ||||||
| 5/20/08 | 6/8/05 | $ | — | |||
| Songa Offshore | ||||||
| ASA 9% 9/8/10 | 6/8/05 | $ | 600 | |||
| TMO Biotec | 10/27/05 | $ | 535 | |||
| Uranco, Inc. | 8/24/05 | $ | 1,000 | |||
| Uranco, Inc. | ||||||
| warrants | ||||||
| 7/26/08 | 8/24/05 | $ | — | |||
See accompanying notes which are an integral part of the financial statements.
31 Annual Report
Investments continued
Other Information
An affiliated company is a company in which the fund has ownership of at least 5% of the voting securities. Companies which are affiliates of the fund at period-end are noted in the fund’s Schedule of Investments. Transactions during the period with companies which are or were affiliates are as follows:
| Value, | Value, | |||||||||||||||||||||||
| Affiliates | beginning | Purchases | Sales | Dividend | end of | |||||||||||||||||||
| (Amounts in thousands) | of period | Proceeds | Income | period | ||||||||||||||||||||
| 121Media, Inc | $ | — | $ | 2,700 | $ | — | $ | — | $ | 1,832 | ||||||||||||||
| Advanced Technology (UK) PLC | 558 | |||||||||||||||||||||||
| Adwalker PLC | — | 1,291 | — | — | 1,292 | |||||||||||||||||||
| Afren PLC | — | 3,214 | 328 | — | 12,040 | |||||||||||||||||||
| Alliance Pharma PLC | 1,812 | 835 | 295 | — | 2,924 | |||||||||||||||||||
| Ascent Resources PLC | — | 994 | — | — | 2,603 | |||||||||||||||||||
| Aztec Resources Ltd. | — | 5,036 | 4,111 | — | — | |||||||||||||||||||
| BDI Mining Corp. | — | 4,713 | — | — | 4,646 | |||||||||||||||||||
| Cambrian Mining PLC | — | 17,979 | — | — | 15,024 | |||||||||||||||||||
| Centurion Electronics PLC | — | 1,979 | — | 15 | 574 | |||||||||||||||||||
| Corac Group PLC | 2,460 | 92 | — | — | 2,146 | |||||||||||||||||||
| DA Group PLC | — | 2,300 | 618 | — | 2,490 | |||||||||||||||||||
| Dat Group PLC | — | 1,746 | — | — | 1,263 | |||||||||||||||||||
| Fox Resources Ltd. | 487 | 1,126 | — | — | 844 | |||||||||||||||||||
| Frontier Mining Ltd. | 1,443 | 774 | — | — | 2,220 | |||||||||||||||||||
| GMA Resources PLC | 1,955 | 1,011 | — | — | 3,026 | |||||||||||||||||||
| Hardide Ltd. | 919 | 992 | — | — | 2,909 | |||||||||||||||||||
| Healthcare Enterprise Group PLC | 1,062 | 10,275 | 1,111 | 10,604 | ||||||||||||||||||||
| HudBay Minerals, Inc. (formerly | ||||||||||||||||||||||||
| Ontzinc Corp.) | 1,841 | 1,328 | ||||||||||||||||||||||
| ID Data PLC | — | 1,500 | — | — | 1,344 | |||||||||||||||||||
| International Ferro Metals | — | 16,293 | — | — | 15,854 | |||||||||||||||||||
| IPSA Group PLC | — | 2,006 | — | — | 2,128 | |||||||||||||||||||
| Jubilee Platinum PLC | 1,823 | 728 | 463 | — | 3,339 | |||||||||||||||||||
| Kura Corp. Ltd. | 2,689 | 7,354 | 246 | 17 | 18,905 | |||||||||||||||||||
| Lambert Howarth Group PLC | 6,551 | 1,164 | — | 276 | 6,291 | |||||||||||||||||||
| Landround PLC | 345 | 958 | — | 16 | 582 | |||||||||||||||||||
| Leadcom Integrated Solutions | — | 3,139 | — | — | 4,705 | |||||||||||||||||||
| Metals Exploration PLC | — | 414 | — | — | 624 | |||||||||||||||||||
| NeutraHealth PLC | — | 1,375 | — | — | 1,719 | |||||||||||||||||||
| Oil Quest Resources PLC | 167 | 874 | — | — | 596 | |||||||||||||||||||
| P&MM Group PLC | 2,300 | — | — | — | 3,423 | |||||||||||||||||||
| Pilat Media Global PLC | 2,196 | — | — | — | 2,244 | |||||||||||||||||||
| Platinum Mining Corp. of India PLC | 4,947 | 3,602 | ||||||||||||||||||||||
| PlusNet Technologies Ltd. | 2,347 | 2,232 | — | — | 7,340 | |||||||||||||||||||
| PSI AG | 992 | 2,473 | — | — | 3,396 | |||||||||||||||||||
| Rheochem PLC | — | 2,692 | — | — | 1,854 | |||||||||||||||||||
| Sphere Investments Ltd | — | 2,806 | — | — | 2,552 | |||||||||||||||||||
| Starfield Resources, Inc. | — | 4,728 | — | — | 3,741 | |||||||||||||||||||
See accompanying notes which are an integral part of the financial statements.
| Annual Report |
| 32 |
| Value, | Value, | |||||||||||||||
| Affiliates | beginning | Purchases | Sales | Dividend | end of | |||||||||||
| (Amounts in thousands) | of period | Proceeds | Income | period | ||||||||||||
| Stepstone ASA | $ | — | $ 5,430 | $ | — | $ | — | $ 5,719 | ||||||||
| SubSea Resources PLC | 2,654 | 560 | — | — | 4,362 | |||||||||||
| Sylvania Resources Ltd. | — | 2,450 | — | — | 2,738 | |||||||||||
| Taghmen Energy PLC | 1,482 | 2,386 | — | — | 5,671 | |||||||||||
| Tanfield Group PLC | — | 3,135 | 212 | — | — | |||||||||||
| Teleunit Spa | 2,572 | 1,019 | — | — | 3,683 | |||||||||||
| Tikit Group PLC | 2,155 | — | 349 | 32 | 2,436 | |||||||||||
| William Ransom & Son PLC | 2,393 | 686 | — | 93 | — | |||||||||||
| Total | $ | 43,203 | $ 128,406 | $ | 9,061 | $ | 449 | $ 175,285 | ||||||||
See accompanying notes which are an integral part of the financial statements.
33 Annual Report
| Financial Statements | ||||||||
| Statement of Assets and Liabilities | ||||||||
| Amounts in thousands (except per share amounts) | October 31, 2005 | |||||||
| Assets | ||||||||
| Investment in securities, at value (including securities | ||||||||
| loaned of $109,541) (cost $1,970,641) See | ||||||||
| accompanying schedule | $ | 2,317,700 | ||||||
| Cash | 893 | |||||||
| Foreign currency held at value (cost $5,825) | 5,813 | |||||||
| Receivable for investments sold | 30,832 | |||||||
| Receivable for fund shares sold | 4,525 | |||||||
| Dividends receivable | 2,621 | |||||||
| Interest receivable | 141 | |||||||
| Receivable from investment adviser for expense | ||||||||
| reductions | 24 | |||||||
| Other affiliated receivables | 11 | |||||||
| Other receivables | 128 | |||||||
| Total assets | 2,362,688 | |||||||
| Liabilities | ||||||||
| Payable for investments purchased | ||||||||
| Regular delivery | $ | 18,168 | ||||||
| Delayed delivery | 11,013 | |||||||
| Payable for fund shares redeemed | 2,790 | |||||||
| Accrued management fee | 1,791 | |||||||
| Distribution fees payable | 57 | |||||||
| Other affiliated payables | 488 | |||||||
| Other payables and accrued expenses | 650 | |||||||
| Collateral on securities loaned, at value | 115,371 | |||||||
| Total liabilities | 150,328 | |||||||
| Net Assets | $ | 2,212,360 | ||||||
| Net Assets consist of: | ||||||||
| Paid in capital | $ | 1,615,845 | ||||||
| Undistributed net investment income | 10,862 | |||||||
| Accumulated undistributed net realized gain (loss) on | ||||||||
| investments and foreign currency transactions | 238,932 | |||||||
| Net unrealized appreciation (depreciation) on | ||||||||
| investments and assets and liabilities in foreign | ||||||||
| currencies | 346,721 | |||||||
| Net Assets | $ | 2,212,360 | ||||||
See accompanying notes which are an integral part of the financial statements.
| Annual Report |
| 34 |
| Statement of Assets and Liabilities | ||||
| Amounts in thousands (except per share amounts) | October 31, 2005 | |||
| Calculation of Maximum Offering Price | ||||
| Class A: | ||||
| Net Asset Value and redemption price per share | ||||
| ($34,838 ÷ 1,305.2 shares) | $ | 26.69 | ||
| Maximum offering price per share (100/94.25 of | ||||
| $26.69) | $ | 28.32 | ||
| Class T: | ||||
| Net Asset Value and redemption price per share | ||||
| ($41,647 ÷ 1,567.2 shares) | $ | 26.57 | ||
| Maximum offering price per share (100/96.50 of | ||||
| $26.57) | $ | 27.53 | ||
| Class B: | ||||
| Net Asset Value and offering price per share | ||||
| ($12,783 ÷ 487.2 shares)A | $ | 26.24 | ||
| Class C: | ||||
| Net Asset Value and offering price per share | ||||
| ($25,202 ÷ 958 shares)A | $ | 26.31 | ||
| International Small Cap: | ||||
| Net Asset Value, offering price and redemption | ||||
| price per share ($2,090,458 ÷ 77,754 shares) | $ | 26.89 | ||
| Institutional Class: | ||||
| Net Asset Value, offering price and redemption | ||||
| price per share ($7,432 ÷ 276.7 shares) | $ | 26.86 | ||
| A Redemption price per share is equal to net asset value less any applicable contingent deferred sales charge. | ||||
See accompanying notes which are an integral part of the financial statements.
35 Annual Report
| Financial Statements continued | ||||||
| Statement of Operations | ||||||
| Amounts in thousands | Year ended October 31, 2005 | |||||
| Investment Income | ||||||
| Dividends (including $449 received from affiliated | ||||||
| issuers) | $ | 33,339 | ||||
| Interest | 1,852 | |||||
| Security lending | 2,630 | |||||
| 37,821 | ||||||
| Less foreign taxes withheld | (1,995) | |||||
| Total income | 35,826 | |||||
| Expenses | ||||||
| Management fee | ||||||
| Basic fee | $ | 16,972 | ||||
| Performance adjustment | 1,557 | |||||
| Transfer agent fees | 4,209 | |||||
| Distribution fees | 534 | |||||
| Accounting and security lending fees | 939 | |||||
| Independent trustees’ compensation | 9 | |||||
| Custodian fees and expenses | 1,029 | |||||
| Registration fees | 264 | |||||
| Audit | 60 | |||||
| Legal | 13 | |||||
| Miscellaneous | 24 | |||||
| Total expenses before reductions | 25,610 | |||||
| Expense reductions | (646) | 24,964 | ||||
| Net investment income (loss) | 10,862 | |||||
| Realized and Unrealized Gain (Loss) | ||||||
| Net realized gain (loss) on: | ||||||
| Investment securities (net of foreign taxes of $1,158) | ||||||
| (Including realized gain (loss) of $(47) from affili- | ||||||
| ated issuers) | 242,909 | |||||
| Foreign currency transactions | (671) | |||||
| Total net realized gain (loss) | 242,238 | |||||
| Change in net unrealized appreciation (depreciation) on: | ||||||
| Investment securities (net of increase in deferred for- | ||||||
| eign taxes of $297) | 169,298 | |||||
| Assets and liabilities in foreign currencies | (50) | |||||
| Total change in net unrealized appreciation | ||||||
| (depreciation) | 169,248 | |||||
| Net gain (loss) | 411,486 | |||||
| Net increase (decrease) in net assets resulting from | ||||||
| operations | $ | 422,348 | ||||
See accompanying notes which are an integral part of the financial statements.
| Annual Report |
| 36 |
| Statement of Changes in Net Assets | ||||||||
| Year ended | Year ended | |||||||
| October 31, | October 31, | |||||||
| Amounts in thousands | 2005 | 2004 | ||||||
| Increase (Decrease) in Net Assets | ||||||||
| Operations | ||||||||
| Net investment income (loss) | $ | 10,862 | $ | 4,864 | ||||
| Net realized gain (loss) | 242,238 | 55,700 | ||||||
| Change in net unrealized appreciation (depreciation) . | 169,248 | 104,988 | ||||||
| Net increase (decrease) in net assets resulting | ||||||||
| from operations | 422,348 | 165,552 | ||||||
| Distributions to shareholders from net investment income . | (3,406) | (741) | ||||||
| Distributions to shareholders from net realized gain | (45,235) | (11,573) | ||||||
| Total distributions | (48,641) | (12,314) | ||||||
| Share transactions - net increase (decrease) | 701,403 | 422,160 | ||||||
| Redemption fees | 1,213 | 1,900 | ||||||
| Total increase (decrease) in net assets | 1,076,323 | 577,298 | ||||||
| Net Assets | ||||||||
| Beginning of period | 1,136,037 | 558,739 | ||||||
| End of period (including undistributed net investment | ||||||||
| income of $10,862 and undistributed net investment | ||||||||
| income of $5,018, respectively) | $ | 2,212,360 | $ | 1,136,037 | ||||
See accompanying notes which are an integral part of the financial statements.
37 Annual Report
| Financial Highlights Class A | ||||||||||||
| Years ended October 31, | 2005 | 2004 | 2003G | |||||||||
| Selected Per Share Data | ||||||||||||
| Net asset value, beginning of period | $ | 21.25 | $ | 17.69 | $ | 12.35 | ||||||
| Income from Investment Operations | ||||||||||||
| Net investment income (loss)E | 05 | .02 | .02F | |||||||||
| Net realized and unrealized gain (loss) | 6.16 | 3.83 | 5.30 | |||||||||
| Total from investment operations | 6.21 | 3.85 | 5.32 | |||||||||
| Distributions from net investment income | (.02) | (.02) | — | |||||||||
| Distributions from net realized gain | (.77) | (.31) | — | |||||||||
| Total distributions | (.79) | (.33) | — | |||||||||
| Redemption fees added to paid in capitalE | 02 | .04 | .02 | |||||||||
| Net asset value, end of period | $ | 26.69 | $ | 21.25 | $ | 17.71 | ||||||
| Total ReturnB,C,D | 30.16% | 22.36% | 43.24% | |||||||||
| Ratios to Average Net AssetsH | ||||||||||||
| Expenses before expense reductions | 1.66% | 1.71% | 1.77%A | |||||||||
| Expenses net of voluntary waivers, if any | 1.66% | 1.71% | 1.77%A | |||||||||
| Expenses net of all reductions | 1.63% | 1.69% | 1.74%A | |||||||||
| Net investment income (loss) | 21% | .09% | .28%A | |||||||||
| Supplemental Data | ||||||||||||
| Net assets, end of period (in millions) | $ | 35 | $ | 13 | $ | 5 | ||||||
| Portfolio turnover rate | 79% | 77% | 84%A |
| A Annualized B Total returns for periods of less than one year are not annualized. C Total returns would have been lower had certain expenses not been reduced during the periods shown. D Total returns do not include the effect of the sales charges. E Calculated based on average shares outstanding during the period. F Investment income per share reflects a special dividend which amounted to $.01 per share. G For the period May 27, 2003 (commencement of sale of shares) to October 31, 2003. H Expense ratios reflect operating expenses of the class. Expenses before reductions do not reflect amounts reimbursed by the investment adviser or reductions from brokerage service arrangements or other expense offset arrangements and do not represent the amount paid by the class during periods when reimbursements or reductions occur. Expense ratios before reductions for start up periods may not be representative of longer term operating periods. Expenses net of any voluntary waivers reflect expenses after reimbursement by the investment adviser but prior to reductions from brokerage service arrangements or other expense offset arrangements. Expenses net of all reductions represent the net expenses paid by the class. |
See accompanying notes which are an integral part of the financial statements.
| Annual Report |
| 38 |
| Financial Highlights Class T | ||||||||||||
| Years ended October 31, | 2005 | 2004 | 2003G | |||||||||
| Selected Per Share Data | ||||||||||||
| Net asset value, beginning of period | $ | 21.20 | $ | 17.68 | $ | 12.35 | ||||||
| Income from Investment Operations | ||||||||||||
| Net investment income (loss)E | (.01) | (.03) | —F,I | |||||||||
| Net realized and unrealized gain (loss) | 6.12 | 3.83 | 5.31 | |||||||||
| Total from investment operations | 6.11 | 3.80 | 5.31 | |||||||||
| Distributions from net investment income | — | (.01) | — | |||||||||
| Distributions from net realized gain | (.76) | (.31) | — | |||||||||
| Total distributions | (.76) | (.32) | — | |||||||||
| Redemption fees added to paid in capitalE | 02 | .04 | .02 | |||||||||
| Net asset value, end of period | $ | 26.57 | $ | 21.20 | $ | 17.65 | ||||||
| Total ReturnB,C,D | 29.72% | 22.07% | 43.16% | |||||||||
| Ratios to Average Net AssetsH | ||||||||||||
| Expenses before expense reductions | 1.92% | 1.94% | 2.12%A | |||||||||
| Expenses net of voluntary waivers, if any | 1.91% | 1.94% | 2.12%A | |||||||||
| Expenses net of all reductions | 1.88% | 1.92% | 2.09%A | |||||||||
| Net investment income (loss) | (.04)% | (.14)% | (.07)%A | |||||||||
| Supplemental Data | ||||||||||||
| Net assets, end of period (in millions) | $ | 42 | $ | 15 | $ | 4 | ||||||
| Portfolio turnover rate | 79% | 77% | 84%A |
| A Annualized B Total returns for periods of less than one year are not annualized. C Total returns would have been lower had certain expenses not been reduced during the periods shown. D Total returns do not include the effect of the sales charges. E Calculated based on average shares outstanding during the period. F Investment income per share reflects a special dividend which amounted to $.01 per share. G For the period May 27, 2003 (commencement of sale of shares) to October 31, 2003. H Expense ratios reflect operating expenses of the class. Expenses before reductions do not reflect amounts reimbursed by the investment adviser or reductions from brokerage service arrangements or other expense offset arrangements and do not represent the amount paid by the class during periods when reimbursements or reductions occur. Expense ratios before reductions for start up periods may not be representative of longer term operating periods. Expenses net of any voluntary waivers reflect expenses after reimbursement by the investment adviser but prior to reductions from brokerage service arrangements or other expense offset arrangements. Expenses net of all reductions represent the net expenses paid by the class. I Amount represents less than $.01 per share. |
See accompanying notes which are an integral part of the financial statements.
39 Annual Report
| Financial Highlights Class B | ||||||||||||
| Years ended October 31, | 2005 | 2004 | 2003G | |||||||||
| Selected Per Share Data | ||||||||||||
| Net asset value, beginning of period | $ | 20.99 | $ | 17.62 | $ | 12.35 | ||||||
| Income from Investment Operations | ||||||||||||
| Net investment income (loss)E | (.14) | (.16) | (.05)F | |||||||||
| Net realized and unrealized gain (loss) | 6.08 | 3.80 | 5.30 | |||||||||
| Total from investment operations | 5.94 | 3.64 | 5.25 | |||||||||
| Distributions from net realized gain | (.71) | (.31) | — | |||||||||
| Redemption fees added to paid in capitalE | 02 | .04 | .02 | |||||||||
| Net asset value, end of period | $ | 26.24 | $ | 20.99 | $ | 17.52 | ||||||
| Total ReturnB,C,D | 29.13% | 21.21% | 42.67% | |||||||||
| Ratios to Average Net AssetsH | ||||||||||||
| Expenses before expense reductions | 2.49% | 2.63% | 2.76%A | |||||||||
| Expenses net of voluntary waivers, if any | 2.43% | 2.63% | 2.76%A | |||||||||
| Expenses net of all reductions | 2.40% | 2.60% | 2.73%A | |||||||||
| Net investment income (loss) | (.56)% | (.83)% | (.71)%A | |||||||||
| Supplemental Data | ||||||||||||
| Net assets, end of period (in millions) | $ | 13 | $ | 5 | $ | 1 | ||||||
| Portfolio turnover rate | 79% | 77% | 84%A |
| A Annualized B Total returns for periods of less than one year are not annualized. C Total returns would have been lower had certain expenses not been reduced during the periods shown. D Total returns do not include the effect of the contingent deferred sales charge. E Calculated based on average shares outstanding during the period. F Investment income per share reflects special dividend which amounted to $.01 per share. G For the period May 27, 2003 (commencement of sale of shares) to October 31, 2003. H Expense ratios reflect operating expenses of the class. Expenses before reductions do not reflect amounts reimbursed by the investment adviser or reductions from brokerage service arrangements or other expense offset arrangements and do not represent the amount paid by the class during periods when reimbursements or reductions occur. Expense ratios before reductions for start up periods may not be representative of longer term operating periods. Expenses net of any voluntary waivers reflect expenses after reimbursement by the investment adviser but prior to reductions from brokerage service arrangements or other expense offset arrangements. Expenses net of all reductions represent the net expenses paid by the class. |
See accompanying notes which are an integral part of the financial statements.
| Annual Report |
| 40 |
| Financial Highlights Class C | ||||||||||||
| Years ended October 31, | 2005 | 2004 | 2003G | |||||||||
| Selected Per Share Data | ||||||||||||
| Net asset value, beginning of period | $ | 21.04 | $ | 17.64 | $ | 12.35 | ||||||
| Income from Investment Operations | ||||||||||||
| Net investment income (loss)E | (.13) | (.12) | (.04)F | |||||||||
| Net realized and unrealized gain (loss) | 6.10 | 3.80 | 5.31 | |||||||||
| Total from investment operations | 5.97 | 3.68 | 5.27 | |||||||||
| Distributions from net investment income | — | (.01) | — | |||||||||
| Distributions from net realized gain | (.72) | (.31) | — | |||||||||
| Total distributions | (.72) | (.32) | — | |||||||||
| Redemption fees added to paid in capitalE | 02 | .04 | .02 | |||||||||
| Net asset value, end of period | $ | 26.31 | $ | 21.04 | $ | 17.73 | ||||||
| Total ReturnB,C,D | 29.22% | 21.43% | 42.83% | |||||||||
| Ratios to Average Net AssetsH | ||||||||||||
| Expenses before expense reductions | 2.41% | 2.43% | 2.57%A | |||||||||
| Expenses net of voluntary waivers, if any | 2.41% | 2.43% | 2.57%A | |||||||||
| Expenses net of all reductions | 2.38% | 2.40% | 2.55%A | |||||||||
| Net investment income (loss) | (.54)% | (.62)% | (.52)%A | |||||||||
| Supplemental Data | ||||||||||||
| Net assets, end of period (in millions) | $ | 25 | $ | 9 | $ | 1 | ||||||
| Portfolio turnover rate | 79% | 77% | 84%A |
| A Annualized B Total returns for periods of less than one year are not annualized. C Total returns would have been lower had certain expenses not been reduced during the periods shown. D Total returns do not include the effect of the contingent deferred sales charge. E Calculated based on average shares outstanding during the period. F Investment income per share reflects a special dividend which amounted to $.01 per share. G For the period May 27, 2003 (commencement of sale of shares) to October 31, 2003. H Expense ratios reflect operating expenses of the class. Expenses before reductions do not reflect amounts reimbursed by the investment adviser or reductions from brokerage service arrangements or other expense offset arrangements and do not represent the amount paid by the class during periods when reimbursements or reductions occur. Expense ratios before reductions for start up periods may not be representative of longer term operating periods. Expenses net of any voluntary waivers reflect expenses after reimbursement by the investment adviser but prior to reductions from brokerage service arrangements or other expense offset arrangements. Expenses net of all reductions represent the net expenses paid by the class. |
See accompanying notes which are an integral part of the financial statements.
41 Annual Report
| Financial Highlights International Small Cap | ||||||||||||||||
| Years ended October 31, | 2005 | 2004 | 2003 | 2002F | ||||||||||||
| Selected Per Share Data | ||||||||||||||||
| Net asset value, beginning of period | $ | 21.36 | $ | 17.71 | $ | 9.87 | $ | 10.00 | ||||||||
| Income from Investment Operations | ||||||||||||||||
| Net investment income (loss)D | 15 | .10 | .07E | (.01) | ||||||||||||
| Net realized and unrealized gain (loss) | 6.19 | 3.84 | 7.75 | (.12) | ||||||||||||
| Total from investment operations | 6.34 | 3.94 | 7.82 | (.13) | ||||||||||||
| Distributions from net investment income | (.06) | (.02) | — | — | ||||||||||||
| Distributions from net realized gain | (.77) | (.31) | (.02) | — | ||||||||||||
| Total distributions | (.83) | (.33) | (.02) | — | ||||||||||||
| Redemption fees added to paid in capitalD | 02 | .04 | .04 | H | ||||||||||||
| Net asset value, end of period | $ | 26.89 | $ | 21.36 | $ | 17.71 | $ | 9.87 | ||||||||
| Total ReturnB,C | 30.67% | 22.84% | 79.78% | (1.30)% | ||||||||||||
| Ratios to Average Net AssetsG | ||||||||||||||||
| Expenses before expense reductions | 1.28% | 1.30% | 1.54% | 13.70%A | ||||||||||||
| Expenses net of voluntary waivers, if any | 1.28% | 1.30% | 1.54% | 1.80%A | ||||||||||||
| Expenses net of all reductions | 1.25% | 1.28% | 1.51% | 1.80%A | ||||||||||||
| Net investment income (loss) | 59% | .50% | .46% | (.56)%A | ||||||||||||
| Supplemental Data | ||||||||||||||||
| Net assets, end of period (in millions) | $ | 2,090 | $ | 1,091 | $ | 547 | $ | 3 | ||||||||
| Portfolio turnover rate | 79% | 77% | 84% | 85%A | ||||||||||||
| A Annualized B Total returns for periods of less than one year are not annualized. C Total returns would have been lower had certain expenses not been reduced during the periods shown. D Calculated based on average shares outstanding during the period. E Investment income per share reflects a special dividend which amounted to $.03 per share. F For the period September 18, 2002 (commencement of operations) to October 31, 2002. G Expense ratios reflect operating expenses of the class. Expenses before reductions do not reflect amounts reimbursed by the investment adviser or reductions from brokerage service arrangements or other expense offset arrangements and do not represent the amount paid by the class during periods when reimbursements or reductions occur. Expense ratios before reductions for start up periods may not be representative of longer term operating periods. Expenses net of any voluntary waivers reflect expenses after reimbursement by the investment adviser but prior to reductions from brokerage service arrangements or other expense offset arrangements. Expenses net of all reductions represent the net expenses paid by the class. H Amount represents less than $.01 per share. |
See accompanying notes which are an integral part of the financial statements.
| Annual Report |
| 42 |
| Financial Highlights Institutional Class | ||||||||||||
| Years ended October 31, | 2005 | 2004 | 2003F | |||||||||
| Selected Per Share Data | ||||||||||||
| Net asset value, beginning of period | $ | 21.36 | $ | 17.72 | $ | 12.35 | ||||||
| Income from Investment Operations | ||||||||||||
| Net investment income (loss)D | 14 | .10 | .04E | |||||||||
| Net realized and unrealized gain (loss) | 6.18 | 3.84 | 5.31 | |||||||||
| Total from investment operations | 6.32 | 3.94 | 5.35 | |||||||||
| Distributions from net investment income | (.07) | (.03) | — | |||||||||
| Distributions from net realized gain | (.77) | (.31) | — | |||||||||
| Total distributions | (.84) | (.34) | — | |||||||||
| Redemption fees added to paid in capitalD | 02 | .04 | .02 | |||||||||
| Net asset value, end of period | $ | 26.86 | $ | 21.36 | $ | 17.72 | ||||||
| Total ReturnB,C | 30.59% | 22.84% | 43.48% | |||||||||
| Ratios to Average Net AssetsG | ||||||||||||
| Expenses before expense reductions | 1.30% | 1.32% | 1.51%A | |||||||||
| Expenses net of voluntary waivers, if any | 1.30% | 1.32% | 1.51%A | |||||||||
| Expenses net of all reductions | 1.27% | 1.29% | 1.48%A | |||||||||
| Net investment income (loss) | 57% | .49% | .54%A | |||||||||
| Supplemental Data | ||||||||||||
| Net assets, end of period (in millions) | $ | 7 | $ | 3 | $ | .4 | ||||||
| Portfolio turnover rate | 79% | 77% | 84%A |
| A Annualized B Total returns for periods of less than one year are not annualized. C Total returns would have been lower had certain expenses not been reduced during the periods shown. D Calculated based on average shares outstanding during the period. E Investment income per share reflects a special dividend which amounted to $.01 per share. F For the period May 27, 2003 (commencement of sale of shares) to October 31, 2003. G Expense ratios reflect operating expenses of the class. Expenses before reductions do not reflect amounts reimbursed by the investment adviser or reductions from brokerage service arrangements or other expense offset arrangements and do not represent the amount paid by the class during periods when reimbursements or reductions occur. Expense ratios before reductions for start up periods may not be representative of longer term operating periods. Expenses net of any voluntary waivers reflect expenses after reimbursement by the investment adviser but prior to reductions from brokerage service arrangements or other expense offset arrangements. Expenses net of all reductions represent the net expenses paid by the class. |
See accompanying notes which are an integral part of the financial statements.
43 Annual Report
Notes to Financial Statements
| For the period ended October 31, 2005 (Amounts in thousands except ratios) |
1. Significant Accounting Policies.
Fidelity International Small Cap Fund (the fund) is a fund of Fidelity Investment Trust (the trust) and is authorized to issue an unlimited number of shares. Effective the close of business on May 5, 2005, the fund was closed to most new accounts. The trust is registered under the Investment Company Act of 1940, as amended (the 1940 Act), as an open end management investment company organized as a Massachusetts business trust.
The fund offers Class A, Class T, Class B, Class C, International Small Cap (the original class) and Institutional Class shares, each of which has equal rights as to assets and voting privileges. Each class has exclusive voting rights with respect to matters that affect that class. Class B shares will automatically convert to Class A shares after a holding period of seven years from the initial date of purchase. Investment income, realized and unrealized capital gains and losses, the common expenses of the fund, and certain fund level expense reductions, if any, are allocated on a pro rata basis to each class based on the relative net assets of each class to the total net assets of the fund. Each class differs with respect to transfer agent and distribution and service plan fees incurred. Certain expense reductions also differ by class.
The fund may invest in affiliated money market central funds (Money Market Central Funds) which are open end investment companies available to investment companies and other accounts managed by Fidelity Management & Research Company (FMR) and its affiliates. The financial statements have been prepared in conformity with accounting principles generally accepted in the United States of America, which require manage ment to make certain estimates and assumptions at the date of the financial statements. The following summarizes the significant accounting policies of the fund: Security Valuation. Investments are valued and net asset value (NAV) per share is calculated (NAV calculation) as of the close of business of the New York Stock Exchange (NYSE), normally 4:00 p.m. Eastern time. Wherever possible, the fund uses independent pricing services approved by the Board of Trustees to value its investments.
Equity securities, including restricted securities, for which market quotations are readily available, are valued at the last reported sale price or official closing price as reported by an independent pricing service on the primary market or exchange on which they are traded. In the event there were no sales during the day or closing prices are not available, securities are valued at the last quoted bid price. Debt securities, including restricted securities, for which quotations are readily available, are valued by independent pricing services or by dealers who make markets in such securities. Pricing services consider yield or price of bonds of comparable quality, coupon, maturity and type as well as dealer supplied prices. Investments in open end mutual funds are valued at their closing net asset value each business day. Short term securities with remaining maturities of sixty
| Annual Report |
| 44 |
1. Significant Accounting Policies continued
Security Valuation continued days or less for which quotations are not readily available are valued at amortized cost, which approximates value.
When current market prices or quotations are not readily available or do not accurately reflect fair value, valuations may be determined in accordance with procedures adopted by the Board of Trustees. For example, when developments occur between the close of a market and the close of the NYSE that may materially affect the value of some or all of the securities, or when trading in a security is halted, those securities may be fair valued. Factors used in the determination of fair value may include monitoring news to identify significant market or security specific events such as changes in the value of U.S. securi ties market, reviewing developments in foreign markets and evaluating the performance of ADRs, futures contracts and exchange traded funds. Because the fund’s utilization of fair value pricing depends on market activity, the frequency with which fair value pricing is used can not be predicted and may be utilized to a significant extent. The value of securities used for NAV calculation under fair value pricing may differ from published prices for the same securities.
Foreign Currency. The fund uses foreign currency contracts to facilitate transactions in foreign denominated securities. Losses from these transactions may arise from changes in the value of the foreign currency or if the counterparties do not perform under the contracts’ terms.
Foreign denominated assets, including investment securities, and liabilities are trans lated into U.S. dollars at the exchange rate at period end. Purchases and sales of invest ment securities, income and dividends received and expenses denominated in foreign currencies are translated into U.S. dollars at the exchange rate in effect on the transac tion date.
The effects of exchange rate fluctuations on investments are included with the net realized and unrealized gain (loss) on investment securities. Other foreign currency transactions resulting in realized and unrealized gain (loss) are disclosed separately.
Investment Transactions and Income. Security transactions are accounted for as of trade date. Gains and losses on securities sold are determined on the basis of identified cost. Dividend income is recorded on the ex dividend date, except for certain dividends from foreign securities where the ex dividend date may have passed, which are recorded as soon as the fund is informed of the ex dividend date. Non cash dividends included in dividend income, if any, are recorded at the fair market value of the securities received. Interest income is accrued as earned. Interest income includes coupon interest and amortization of premium and accretion of discount on debt securities. Investment
45 Annual Report
Notes to Financial Statements continued
(Amounts in thousands except ratios)
1. Significant Accounting Policies continued
Investment Transactions and Income continued
income is recorded net of foreign taxes withheld where recovery of such taxes is uncertain.
Expenses. Most expenses of the trust can be directly attributed to a fund. Expenses which cannot be directly attributed are apportioned among each fund in the trust.
Income Tax Information and Distributions to Shareholders. Each year, the fund intends to qualify as a regulated investment company by distributing all of its taxable income and realized gains under Subchapter M of the Internal Revenue Code. As a result, no provision for income taxes is required in the accompanying financial statements. Foreign taxes are provided for based on the fund’s understanding of the tax rules and rates that exist in the foreign markets in which it invests.
Distributions are recorded on the ex dividend date. Income dividends and capital gain distributions are declared separately for each class. Income and capital gain distribu tions are determined in accordance with income tax regulations, which may differ from generally accepted accounting principles. In addition, the fund will claim a portion of the payment made to redeeming shareholders as a distribution for income tax purposes.
Capital accounts within the financial statements are adjusted for permanent book tax differences. These adjustments have no impact on net assets or the results of operations. Temporary book tax differences will reverse in a subsequent period.
Book tax differences are primarily due to foreign currency transactions, passive foreign investment companies (PFIC) and losses deferred due to wash sales.
The tax basis components of distributable earnings and the federal tax cost as of period end were as follows:
| Unrealized appreciation | $ | 441,522 | ||
| Unrealized depreciation | (115,753) | |||
| Net unrealized appreciation (depreciation) | 325,769 | |||
| Undistributed ordinary income | 65,222 | |||
| Undistributed long term capital gain | 178,759 | |||
| Cost for federal income tax purposes | $ | 1,991,931 | ||
The tax character of distributions paid was as follows:
| October 31, 2005 | October 31, 2004 | |||||||
| Ordinary Income | $ | 30,409 | $ | 12,314 | ||||
| Long term Capital Gains | 18,232 | — | ||||||
| Total | $ | 48,641 | $ | 12,314 |
Annual Report 46
1. Significant Accounting Policies continued
Short Term Trading (Redemption) Fees. Shares held in the fund less than 90 days are subject to a redemption fee equal to 2.00% of the proceeds of the redeemed shares. All redemption fees, including any estimated redemption fees paid by FMR, are retained by the fund and accounted for as an addition to paid in capital.
| 2. Operating Policies. |
Repurchase Agreements. FMR has received an Exemptive Order from the Securities and Exchange Commission (the SEC) which permits the fund and other affiliated entities of FMR to transfer uninvested cash balances into joint trading accounts which are then invested in repurchase agreements. The fund may also invest directly with institutions in repurchase agreements. Repurchase agreements are collateralized by government or non government securities. Collateral is held in segregated accounts with custodian banks and may be obtained in the event of a default of the counterparty. The fund monitors, on a daily basis, the value of the collateral to ensure it is at least equal to the principal amount of the repurchase agreement (including accrued interest). In the event of a default by the counterparty, realization of the collateral proceeds could be delayed, during which time the value of the collateral may decline.
Delayed Delivery Transactions and When Issued Securities. The fund may purchase securities on a delayed delivery or when issued basis. Payment and delivery may take place after the customary settlement period for that security. The price of the underlying securities and the date when the securities will be delivered and paid for are fixed at the time the transaction is negotiated. The value of the securities purchased on a delayed delivery or when issued basis are identified as such in the fund’s Schedule of Investments. The fund may receive compensation for interest forgone in the purchase of a delayed delivery or when issued security. With respect to purchase commitments, the fund identifies securities as segregated in its records with a value at least equal to the amount of the commitment. Losses may arise due to changes in the value of the underly ing securities or if the counterparty does not perform under the contract’s terms, or if the issuer does not issue the securities due to political, economic, or other factors.
Restricted Securities. The fund may invest in securities that are subject to legal or contractual restrictions on resale. These securities generally may be resold in transac tions exempt from registration or to the public if the securities are registered. Disposal of these securities may involve time consuming negotiations and expense, and prompt sale at an acceptable price may be difficult. Information regarding restricted securities is included at the end of the fund’s Schedule of Investments.
47 Annual Report
Notes to Financial Statements continued
(Amounts in thousands except ratios)
3. Purchases and Sales of Investments.
Purchases and sales of securities, other than short term securities and U.S. government securities, aggregated $2,126,837 and $1,470,923, respectively.
4. Fees and Other Transactions with Affiliates.
Management Fee. FMR and its affiliates provide the fund with investment manage ment related services for which the fund pays a monthly management fee. The manage ment fee is the sum of an individual fund fee rate that is based on an annual rate of .60% of the fund’s average net assets and a group fee rate that averaged .27% during the period. The group fee rate is based upon the average net assets of all the mutual funds advised by FMR. The group fee rate decreases as assets under management increase and increases as assets under management decrease. In addition, the management fee is subject to a performance adjustment (up to a maximum of .20% of the fund’s average net assets over a 36 month performance period). The upward or downward adjustment to the management fee is based on the investment performance of the asset weighted return of all classes as compared to an appropriate benchmark index. For the period, the total annual management fee rate, including the performance adjustment, was .95% of the fund’s average net assets.
Distribution and Service Plan. In accordance with Rule 12b 1 of the 1940 Act, the fund has adopted separate Distribution and Service Plans for each class of shares. Certain classes pay Fidelity Distributors Corporation (FDC), an affiliate of FMR, separate Distribution and Service Fees, each of which is based on an annual percentage of each class’ average net assets. In addition, FDC may pay financial intermediaries for selling shares of the fund and providing shareholder support services. For the period, the Distribution and Service Fee rates and the total amounts paid to and retained by FDC were as follows:
| Distribution | Service | Paid to | Retained | |||||||||
| Fee | Fee | FDC | by FDC | |||||||||
| Class A | 0% | .25% | $ | 67 | $ | — | ||||||
| Class T | 25% | .25% | 164 | 2 | ||||||||
| Class B | 75% | .25% | 110 | 83 | ||||||||
| Class C | 75% | .25% | 193 | 80 | ||||||||
| $ | 534 | $ | 165 |
Sales Load. FDC receives a front end sales charge of up to 5.75% for selling Class A shares, and 3.50% for selling Class T shares, some of which is paid to financial intermedi aries for selling shares of the fund. FDC receives the proceeds of contingent deferred sales charges levied on Class A, Class T, Class B, and Class C redemptions. These charges depend on the holding period. The deferred sales charges range from 5% to 1% for Class B, 1% for Class C, and .25% for certain purchases of Class A and Class T shares.
| Annual Report |
| 48 |
| 4. Fees and Other Transactions with Affiliates continued | ||||
| Sales Load - continued | ||||
| For the period, sales charge amounts retained by FDC were as follows: | ||||
| Retained | ||||
| by FDC | ||||
| Class A | $ | 65 | ||
| Class T | 22 | |||
| Class B* | 24 | |||
| Class C* | 7 | |||
| $ | 118 | |||
* When Class B and Class C shares are initially sold, FDC pays commissions from its own resources to financial intermediaries through which the sales are made.
Transfer Agent Fees. Fidelity Investments Institutional Operations Company, Inc. (FIIOC), an affiliate of FMR, is the transfer, dividend disbursing and shareholder servic ing agent for each class of the fund, except for International Small Cap. Fidelity Service Company, Inc. (FSC), an affiliate of FMR, , is the transfer agent for International Small Cap shares. FIIOC and FSC receive account fees and asset based fees that vary according to the account size and type of account of the shareholders of the respective classes of the fund. FIIOC and FSC pay for typesetting, printing and mailing of shareholder reports, except proxy statements. For the period the total transfer agent fees paid by each class to FIIOC or FSC, were as follows:
| % of | ||||||
| Average | ||||||
| Amount | Net Assets | |||||
| Class A | $ | 93 | .34 | |||
| Class T | 116 | .35 | ||||
| Class B | 47 | .42 | ||||
| Class C | 66 | .34 | ||||
| International Small Cap | 3,874 | .21 | ||||
| Institutional Class | 13 | .23 | ||||
| $ | 4,209 | |||||
Accounting and Security Lending Fees. FSC maintains the fund’s accounting rec ords. The accounting fee is based on the level of average net assets for the month. Under a separate contract, FSC administers the security lending program. The security lending fee is based on the number and duration of lending transactions.
Affiliated Central Funds. The fund may invest in Money Market Central Funds which seek preservation of capital and current income and are managed by Fidelity Invest ments Money Management, Inc. (FIMM), an affiliate of FMR.
49 Annual Report
| Notes to Financial Statements continued | ||
| (Amounts in thousands except ratios) | ||
| 4. Fees and Other Transactions with Affiliates continued | ||
| Affiliated Central Funds continued | ||
The Central Funds do not pay a management fee. Income distributions earned by the fund are recorded as income in the accompanying financial statements and totaled $5,350 for the period.
Brokerage Commissions. The fund placed a portion of its portfolio transactions with brokerage firms which are affiliates of the investment adviser. The commissions paid to these affiliated firms were $1 for the period.
| 5. Committed Line of Credit. |
The fund participates with other funds managed by FMR in a $4.2 billion credit facility (the “line of credit”) to be utilized for temporary or emergency purposes to fund share holder redemptions or for other short term liquidity purposes. The fund has agreed to pay commitment fees on its pro rata portion of the line of credit. During the period, there were no borrowings on this line of credit.
| 6. Security Lending. |
The fund lends portfolio securities from time to time in order to earn additional income. The fund receives collateral (in the form of U.S. Treasury obligations, letters of credit and/or cash) against the loaned securities and maintains collateral in an amount not less than 100% of the market value of the loaned securities during the period of the loan. The market value of the loaned securities is determined at the close of business of the fund and any additional required collateral is delivered to the fund on the next business day. If the borrower defaults on its obligation to return the securities loaned because of insol vency or other reasons, a fund could experience delays and costs in recovering the securities loaned or in gaining access to the collateral. Cash collateral is invested in the Fidelity Securities Lending Cash Central Fund. The value of loaned securities and cash collateral at period end are disclosed on the fund’s Statement of Assets and Liabilities. Security lending income represents the income earned on investing cash collateral, less fees and expenses associated with the loan, plus any premium payments that may be received on the loan of certain types of securities.
| 7. Expense Reductions. |
FMR voluntarily agreed to reimburse each class to the extent annual operating expenses exceeded certain levels of average net assets as noted in the table below. Some expenses, for example interest expense, are excluded from this reimbursement.
| Annual Report |
| 50 |
| 7. Expense Reductions - continued | ||||||
| The following classes were in reimbursement during the period: | ||||||
| Expense | Reimbursement | |||||
| Limitations | from adviser | |||||
| Class A | 2.05% — 1.65%* | $ | 1 | |||
| Class T | 2.30% — 1.90%* | 4 | ||||
| Class B | 2.80% — 2.40%* | 7 | ||||
| $ | 12 | |||||
| * Expense limitation in effect at period end. | ||||||
Many of the brokers with whom FMR places trades on behalf of the fund provided services to the fund in addition to trade execution. These services included payments of certain expenses on behalf of the fund totaling $625 for the period.In addition, through arrangements with the each class’ transfer agent, credits realized as a result of unin vested cash balances were used to reduce the fund’s expenses. During the period, credits reduced each class’ transfer agent expense as noted in the table below.
| Transfer Agent | ||||
| expense reduction | ||||
| International Small Cap | $ | 9 | ||
| 8. Other. | ||||
The fund’s organizational documents provide former and current trustees and officers with a limited indemnification against liabilities arising in connection with the perfor mance of their duties to the fund. In the normal course of business, the fund may also enter into contracts that provide general indemnifications. The fund’s maximum expo sure under these arrangements is unknown as this would be dependent on future claims that may be made against the fund. The risk of material loss from such claims is considered remote.
51 Annual Report
| Notes to Financial Statements continued | ||||||||
| (Amounts in thousands except ratios) | ||||||||
| 9. Distributions to Shareholders. | ||||||||
| Distributions to shareholders of each class were as follows: | ||||||||
| Years ended October 31, | 2005 | 2004 | ||||||
| From net investment income | ||||||||
| Class A | $ | 14 | $ | 3 | ||||
| Class T | — | 3 | ||||||
| Class C | — | 2 | ||||||
| International Small Cap | 3,381 | 732 | ||||||
| Institutional Class | 11 | 1 | ||||||
| Total | $ | 3,406 | $ | 741 | ||||
| From net realized gain | ||||||||
| Class A | $ | 542 | $ | 50 | ||||
| Class T | 602 | 92 | ||||||
| Class B | 221 | 28 | ||||||
| Class C | 359 | 42 | ||||||
| International Small Cap | 43,388 | 11,351 | ||||||
| Institutional Class | 123 | 10 | ||||||
| Total | $ | 45,235 | $ | 11,573 | ||||
| Annual Report |
| 52 |
| 10. Share Transactions. | ||||||||||||
| Transactions for each class of shares were as follows: | ||||||||||||
| Shares | Dollars | |||||||||||
| Years ended October 31, | 2005 | 2004 | 2005 | 2004 | ||||||||
| Class A | ||||||||||||
| Shares sold | 915 | 655 | $ | 22,252 | $ | 12,873 | ||||||
| Reinvestment of distributions | 20 | 3 | 427 | 47 | ||||||||
| Shares redeemed | (255) | (313) | (6,421) | (5,811) | ||||||||
| Net increase (decrease) | 680 | 345 | $ | 16,258 | $ | 7,109 | ||||||
| Class T | ||||||||||||
| Shares sold | 1,286 | 729 | $ | 31,179 | $ | 14,389 | ||||||
| Reinvestment of distributions | 24 | 5 | 531 | 85 | ||||||||
| Shares redeemed | (457) | (246) | (11,453) | (4,796) | ||||||||
| Net increase (decrease) | 853 | 488 | $ | 20,257 | $ | 9,678 | ||||||
| Class B | ||||||||||||
| Shares sold | 415 | 254 | $ | 9,882 | $ | 4,981 | ||||||
| Reinvestment of distributions | 9 | 1 | 199 | 26 | ||||||||
| Shares redeemed | (178) | (72) | (4,336) | (1,405) | ||||||||
| Net increase (decrease) | 246 | 183 | $ | 5,745 | $ | 3,602 | ||||||
| Class C | ||||||||||||
| Shares sold | 680 | 413 | $ | 16,301 | $ | 8,031 | ||||||
| Reinvestment of distributions | 13 | 2 | 272 | 40 | ||||||||
| Shares redeemed | (147) | (81) | (3,591) | (1,590) | ||||||||
| Net increase (decrease) | 546 | 334 | $ | 12,982 | $ | 6,481 | ||||||
| International Small Cap | ||||||||||||
| Shares sold | 51,579 | 48,248 | $ | 1,266,283 | $ | 942,555 | ||||||
| Reinvestment of distributions | 2,008 | 632 | 43,867 | 11,253 | ||||||||
| Shares redeemed | (26,924) | (28,670) | (667,826) | (560,464) | ||||||||
| Net increase (decrease) | 26,663 | 20,210 | $ | 642,324 | $ | 393,344 | ||||||
| Institutional Class | ||||||||||||
| Shares sold | 259 | 181 | $ | 6,323 | $ | 3,602 | ||||||
| Reinvestment of distributions | 3 | 59 | 5 | |||||||||
| Shares redeemed | (105) | (84) | (2,545) | (1,661) | ||||||||
| Net increase (decrease) | 157 | 97 | $ | 3,837 | $ | 1,946 | ||||||
53 Annual Report
Report of Independent Registered Public Accounting Firm
To the Trustees of Fidelity Investment Trust and Shareholders of Fidelity International Small Cap Fund:
We have audited the accompanying statement of assets and liabilities of Fidelity Interna tional Small Cap Fund (the Fund), a fund of Fidelity Investment Trust, including the schedule of investments, as of October 31, 2005, and the related statement of operations for the year then ended, the statement of changes in net assets for each of the two years in the period then ended, and the financial highlights for each of the four years in the period then ended. These financial statements and financial highlights are the responsibility of the Fund’s management. Our responsibility is to express an opinion on these financial statements and financial highlights based on our audits.
We conducted our audits in accordance with standards of the Public Company Accounting Oversight Board (United States). Those standards require that we plan and perform the audit to obtain reasonable assurance about whether the financial statements and financial highlights are free of material misstatement. The Fund is not required to have, nor were we engaged to perform, an audit of its internal control over financial reporting. Our audits included consideration of internal control over financial reporting as a basis for designing audit procedures that are appropriate in the circumstances, but not for the purpose of expressing an opinion on the effectiveness of the Fund’s internal control over financial reporting. Accordingly, we express no such opinion. An audit also includes examining, on a test basis, evidence supporting the amounts and disclosures in the financial statements, assessing the accounting principles used and significant estimates made by management, as well as evaluating the overall financial statement presentation. Our procedures in cluded confirmation of securities owned as of October 31, 2005, by correspondence with the custodians and brokers; where replies were not received from brokers, we performed other auditing procedures. We believe that our audits provide a reasonable basis for our opinion.
In our opinion, the financial statements and financial highlights referred to above present fairly, in all material respects, the financial position of Fidelity International Small Cap Fund as of October 31, 2005, the results of its operations for the year then ended, the changes in its net assets for each of the two years in the period then ended, and its financial highlights for each of the four years in the period then ended, in conformity with accounting principles generally accepted in the United States of America.
| /s/ Deloitte & Touche LLP DELOITTE & TOUCHE LLP Boston, Massachusetts December 21, 2005 |
Annual Report 54
Trustees and Officers
The Trustees, Members of the Advisory Board, and executive officers of the trust and fund, as applicable, are listed below. The Board of Trustees governs the fund and is responsible for protecting the interests of shareholders. The Trustees are experienced executives who meet periodically throughout the year to oversee the fund’s activities, review contractual arrangements with companies that provide services to the fund, and review the fund’s performance. Except for William O. McCoy, Stephen P. Jonas, and Kenneth L. Wolfe, each of the Trustees oversees 322 funds advised by FMR or an affiliate. Mr. McCoy oversees 324 funds advised by FMR or an affiliate. Mr. Jonas and Mr. Wolfe oversee 319 funds advised by FMR or an affiliate.
The Trustees hold office without limit in time except that (a) any Trustee may resign; (b) any Trustee may be removed by written instrument, signed by at least two thirds of the number of Trustees prior to such removal; (c) any Trustee who requests to be retired or who has become incapacitated by illness or injury may be retired by written instru ment signed by a majority of the other Trustees; and (d) any Trustee may be removed at any special meeting of shareholders by a two thirds vote of the outstanding voting securities of the trust. Each Trustee who is not an interested person (as defined in the 1940 Act) (Independent Trustee), shall retire not later than the last day of the calendar year in which his or her 72nd birthday occurs. The Independent Trustees may waive this mandatory retirement age policy with respect to individual Trustees. The executive officers and Advisory Board Members hold office without limit in time, except that any officer and Advisory Board Member may resign or may be removed by a vote of a majority of the Trustees at any regular meeting or any special meeting of the Trustees. Except as indicated, each individual has held the office shown or other offices in the same company for the past five years.
The fund’s Statement of Additional Information (SAI) includes more information about the Trustees. To request a free copy, call Fidelity at 1-877-208-0098.
| Interested Trustees*: |
Correspondence intended for each Trustee who is an interested person may be sent to Fidelity Investments, 82 Devonshire Street, Boston, Massachusetts 02109.
| Name, Age; Principal Occupation Edward C. Johnson 3d (75)** |
Year of Election or Appointment: 1984
Mr. Johnson is Chairman of the Board of Trustees. Mr. Johnson serves as Chief Executive Officer, Chairman, and a Director of FMR Corp.; a Di rector and Chairman of the Board and of the Executive Committee of FMR; Chairman and a Director of Fidelity Management & Research (Far East) Inc.; Chairman and a Director of Fidelity Investments Money Man agement, Inc.; and Chairman (2001 present) and a Director (2000 present) of FMR Co., Inc.
55 Annual Report
Trustees and Officers - continued
| Name, Age; Principal Occupation Abigail P. Johnson (43)** |
Year of Election or Appointment: 2001
Ms. Johnson serves as President of Fidelity Employer Services Company (FESCO) (2005 present). She is President and a Director of Fidelity In vestments Money Management, Inc. (2001 present), FMR Co., Inc. (2001 present), and a Director of FMR Corp. Previously, Ms. Johnson served as President and a Director of FMR (2001 2005), Senior Vice President of the Fidelity funds (2001 2005), and managed a number of Fidelity funds.
| Stephen P. Jonas (52) |
Year of Election or Appointment: 2005
Mr. Jonas is Senior Vice President of the fund (2005 present). He also serves as Senior Vice President of other Fidelity funds (2005 present). Mr. Jonas is Executive Director of FMR (2005 present). Previously, Mr. Jonas served as President of Fidelity Enterprise Operations and Risk Services (2004 2005), Chief Administrative Officer (2002 2004), and Chief Financial Officer of FMR Co. (1998 2000). Mr. Jonas has been with Fidelity Investments since 1987 and has held various financial and management positions including Chief Financial Officer of FMR. In addi tion, he serves on the Boards of Boston Ballet (2003 present) and Sim mons College (2003 present).
| Robert L. Reynolds (53) |
Year of Election or Appointment: 2003
Mr. Reynolds is a Director (2003 present) and Chief Operating Officer (2002 present) of FMR Corp. He also serves on the Board at Fidelity Investments Canada, Ltd. (2000 present). Previously, Mr. Reynolds served as President of Fidelity Investments Institutional Retirement Group (1996 2000).
* Trustees have been determined to be “Interested Trustees” by virtue of, among other things, their affiliation with the trust or various entities under common control with FMR.
** Edward C. Johnson 3d, Trustee, is Abigail P. Johnson’s father.
| Annual Report |
| 56 |
| Independent Trustees: |
Correspondence intended for each Independent Trustee (that is, the Trustees other than the Interested Trustees) may be sent to Fidelity Investments, P.O. Box 55235, Boston, Massachusetts 02205 5235.
| Name, Age; Principal Occupation Dennis J. Dirks (57) |
Year of Election or Appointment: 2005
Prior to his retirement in May 2003, Mr. Dirks was Chief Operating Officer and a member of the Board of The Depository Trust & Clearing Corporation (DTCC) (1999 2003). He also served as President, Chief Operating Officer, and Board member of The Depository Trust Com pany (DTC) (1999 2003) and President and Board member of the National Securities Clearing Corporation (NSCC) (1999 2003). In addi tion, Mr. Dirks served as Chief Executive Officer and Board member of the Government Securities Clearing Corporation (2001 2003) and Chief Executive Officer and Board member of the Mortgage Backed Securities Clearing Corporation (2001 2003). Mr. Dirks also serves as a Trustee of Manhattan College (2005 present).
| Robert M. Gates (62) |
Year of Election or Appointment: 1997
Dr. Gates is Vice Chairman of the Independent Trustees (2005 present). Dr. Gates is President of Texas A&M University (2002 present). He was Director of the Central Intelligence Agency (CIA) from 1991 to 1993. From 1989 to 1991, Dr. Gates served as Assistant to the President of the United States and Deputy National Security Advisor. Dr. Gates is a Director of NACCO Industries, Inc. (mining and manufacturing), Parker Drilling Co., Inc. (drilling and rental tools for the energy industry, 2001 present), and Brinker International (restaurant management, 2003 present). Previously, Dr. Gates served as a Director of LucasVarity PLC (automotive components and diesel engines), a Director of TRW Inc. (automotive, space, defense, and information technology), and Dean of the George Bush School of Government and Public Service at Texas A&M University (1999 2001). Dr. Gates also is a Trustee of the Forum for International Policy.
57 Annual Report
Trustees and Officers - continued
| Name, Age; Principal Occupation George H. Heilmeier (69) |
Year of Election or Appointment: 2004
Dr. Heilmeier is Chairman Emeritus of Telcordia Technologies (commu nication software and systems), where prior to his retirement, he served as company Chairman and Chief Executive Officer. He currently serves on the Boards of Directors of The Mitre Corporation (systems engineer ing and information technology support for the government), and HRL Laboratories (private research and development, 2004 present). He is Chairman of the General Motors Science & Technology Advisory Board and a Life Fellow of the Institute of Electrical and Electronics Engineers (IEEE) (2000 present). Dr. Heilmeier is a member of the Defense Science Board and the National Security Agency Advisory Board. He is also a member of the National Academy of Engineering, the American Acad emy of Arts and Sciences, and the Board of Overseers of the School of Engineering and Applied Science of the University of Pennsylvania. Pre viously, Dr. Heilmeier served as a Director of TRW Inc. (automotive, space, defense, and information technology, 1992 2002), Compaq (1994 2002), Automatic Data Processing, Inc. (ADP) (technology based business outsourcing, 1995 2002), INET Technologies Inc. (telecommu nications network surveillance, 2001 2004), and Teletech Holdings (cus tomer management services). He is the recipient of the 2005 Kyoto Prize in Advanced Technology for his invention of the liquid display.
| Marie L. Knowles (59) |
Year of Election or Appointment: 2001
Prior to Ms. Knowles’ retirement in June 2000, she served as Executive Vice President and Chief Financial Officer of Atlantic Richfield Company (ARCO) (diversified energy, 1996 2000). From 1993 to 1996, she was a Senior Vice President of ARCO and President of ARCO Transportation Company. She served as a Director of ARCO from 1996 to 1998. She currently serves as a Director of Phelps Dodge Corporation (copper mining and manufacturing) and McKesson Corporation (healthcare ser vice, 2002 present). Ms. Knowles is a Trustee of the Brookings Institution and the Catalina Island Conservancy and also serves as a member of the Advisory Board for the School of Engineering of the University of Southern California.
| Annual Report |
| 58 |
| Name, Age; Principal Occupation Ned C. Lautenbach (61) |
Year of Election or Appointment: 2000
Mr. Lautenbach has been a partner of Clayton, Dubilier & Rice, Inc. (private equity investment firm) since September 1998. Previously, Mr. Lautenbach was with the International Business Machines Corporation (IBM) from 1968 until his retirement in 1998. Mr. Lautenbach serves as a Director of Italtel Holding S.p.A. (telecommunications (Milan, Italy), 2004 present) and Eaton Corporation (diversified industrial) as well as the Philharmonic Center for the Arts in Naples, Florida. He also is a member of the Board of Trustees of Fairfield University (2005 present), as well as a member of the Council on Foreign Relations.
| Marvin L. Mann (72) |
Year of Election or Appointment: 1993
Mr. Mann is Chairman of the Independent Trustees (2001 present). He is Chairman Emeritus of Lexmark International, Inc. (computer peripherals), where he served as CEO until April 1998, retired as Chairman May 1999, and remains a member of the Board. Prior to 1991, he held the positions of Vice President of International Business Machines Corporation (IBM) and President and General Manager of various IBM divisions and subsidiaries. He is a member of the Executive Committee of the Independent Director’s Council of the Investment Com pany Institute. In addition, Mr. Mann is a member of the President’s Cabinet at the University of Alabama and the Board of Visitors of the Culverhouse College of Commerce and Business Administration at the University of Alabama.
| William O. McCoy (72) |
Year of Election or Appointment: 1997
Prior to his retirement in December 1994, Mr. McCoy was Vice Chair man of the Board of BellSouth Corporation (telecommunications) and President of BellSouth Enterprises. He is currently a Director of Liberty Corporation (holding company), Duke Realty Corporation (real estate), and Progress Energy, Inc. (electric utility). He is also a partner of Frank lin Street Partners (private investment management firm) and a member of the Research Triangle Foundation Board. In addition, Mr. McCoy served as the Interim Chancellor (1999 2000) and a member of the Board of Visitors for the University of North Carolina at Chapel Hill and currently serves on the Board of Directors of the University of North Carolina Health Care System and the Board of Visitors of the Kenan Flagler Business School (University of North Carolina at Chapel Hill). He also served as Vice President of Finance for the University of North Car olina (16 school system).
59 Annual Report
Trustees and Officers - continued
| Name, Age; Principal Occupation Cornelia M. Small (61) |
Year of Election or Appointment: 2005
Ms. Small is a member (2000 present) and Chairperson (2002 present) of the Investment Committee, and a member (2002 present) of the Board of Trustees of Smith College. Previously, she served as Chief In vestment Officer (1999 2000), Director of Global Equity Investments (1996 1999), and a member of the Board of Directors of Scudder, Stevens & Clark (1990 1997) and Scudder Kemper Investments (1997 1998). In addition, Ms. Small served as Co Chair (2000 2003) of the Annual Fund for the Fletcher School of Law and Diplomacy.
| William S. Stavropoulos (66) |
Year of Election or Appointment: 2001
Mr. Stavropoulos is Chairman of the Board (2000 present) and a Mem ber of the Board of Directors of The Dow Chemical Company. Since joining The Dow Chemical Company in 1967, Mr. Stavropoulos served in numerous senior management positions, including President (1993 2000; 2002 2003), CEO (1995 2000; 2002 2004), and Chair man of the Executive Committee (2000 2004). Currently, he is a Direc tor of NCR Corporation (data warehousing and technology solutions), BellSouth Corporation (telecommunications), Chemical Financial Corpo ration, Maersk Inc. (industrial conglomerate, 2002 present), and Metal mark Capital (private equity investment firm, 2005 present). He also serves as a member of the Board of Trustees of the American Enterprise Institute for Public Policy Research. In addition, Mr. Stavropoulos is a member of The Business Council, J.P. Morgan International Council and the University of Notre Dame Advisory Council for the College of Science.
| Kenneth L. Wolfe (66) |
Year of Election or Appointment: 2005
Mr. Wolfe also serves as a Trustee (2005 present) or Member of the Advisory Board (2004 present) of other investment companies advised by FMR. Prior to his retirement in 2001, Mr. Wolfe was Chairman and Chief Executive Officer of Hershey Foods Corporation (1993 2001). He currently serves as a member of the boards of Adelphia Communica tions Corporation (2003 present), Bausch & Lomb, Inc., and Revlon Inc. (2004 present).
| Annual Report |
| 60 |
Advisory Board Members and Executive Officers:
Correspondence intended for Mr. Gamper may be sent to Fidelity Investments, P.O. Box 55235, Boston, Massachusetts 02205 5235. Correspondence intended for each executive officer and Mr. Lynch may be sent to Fidelity Investments, 82 Devonshire Street, Boston, Massachusetts 02109.
| Name, Age; Principal Occupation Albert R. Gamper, Jr. (63) |
Year of Election or Appointment: 2005
Member of the Advisory Board of Fidelity Investment Trust. Prior to his retirement in December 2004, Mr. Gamper served as Chairman of the Board of CIT Group Inc. (commercial finance). During his tenure with CIT Group Inc. Mr. Gamper served in numerous senior management positions, including Chairman (1987 1989; 1999 2001; 2002 2004), Chief Executive Officer (1987 2004), and President (1989 2002). He currently serves as a member of the Board of Directors of Public Service Enterprise Group (utilities, 2001 present), Chairman of the Board of Governors, Rutgers University (2004 present), and Chairman of the Board of Saint Barnabas Health Care System.
| Peter S. Lynch (61) |
Year of Election or Appointment: 2003
Member of the Advisory Board of Fidelity Investment Trust. Vice Chair man and a Director of FMR, and Vice Chairman (2001 present) and a Director (2000 present) of FMR Co., Inc. Previously, Mr. Lynch served as a Trustee of the Fidelity funds (1990 2003). In addition, he serves as a Trustee of Boston College, Massachusetts Eye & Ear Infirmary, Historic Deerfield, John F. Kennedy Library, and the Museum of Fine Arts of Boston.
| Dwight D. Churchill (51) |
Year of Election or Appointment: 2005
Vice President of the fund. Mr. Churchill also serves as Vice President of certain Equity Funds (2005 present) and certain High Income Funds (2005 present). Previously, he served as Head of Fidelity’s Fixed Income Division (2000 2005), Vice President of Fidelity’s Money Market Funds (2000 2005), Vice President of Fidelity’s Bond Funds, and Senior Vice President of FIMM (2000) and FMR. Mr. Churchill joined Fidelity in 1993 as Vice President and Group Leader of Taxable Fixed Income Investments.
61 Annual Report
Trustees and Officers - continued
| Name, Age; Principal Occupation Eric D. Roiter (56) |
Year of Election or Appointment: 2003
Secretary of the fund. He also serves as Secretary of other Fidelity funds; Vice President, General Counsel, and Secretary of FMR Co., Inc. (2001 present) and FMR; Assistant Secretary of Fidelity Management & Research (U.K.) Inc. (2001 present), Fidelity Management & Research (Far East) Inc. (2001 present), and Fidelity Investments Money Manage ment, Inc. (2001 present). Mr. Roiter is an Adjunct Member, Faculty of Law, at Boston College Law School (2003 present). Previously, Mr. Roiter served as Vice President and Secretary of Fidelity Distributors Corpora tion (FDC) (1998 2005).
| Stuart Fross (46) |
Year of Election or Appointment: 2003
Assistant Secretary of the fund. Mr. Fross also serves as Assistant Secre tary of other Fidelity funds (2003 present), Vice President and Secretary of FDC (2005 present), and is an employee of FMR.
| Christine Reynolds (47) |
Year of Election or Appointment: 2004
President, Treasurer, and Anti Money Laundering (AML) officer of the fund. Ms. Reynolds also serves as President, Treasurer, and AML officer of other Fidelity funds (2004) and is a Vice President (2003) and an employee (2002) of FMR. Before joining Fidelity Investments, Ms. Reynolds worked at PricewaterhouseCoopers LLP (PwC) (1980 2002), where she was most recently an audit partner with PwC’s investment management practice.
| Paul M. Murphy (58) |
Year of Election or Appointment: 2005
Chief Financial Officer of the fund. Mr. Murphy also serves as Chief Financial Officer of other Fidelity funds (2005 present). He also serves as Senior Vice President of Fidelity Pricing and Cash Management Ser vices Group (FPCMS).
| Kenneth A. Rathgeber (58) |
Year of Election or Appointment: 2004
Chief Compliance Officer of the fund. Mr. Rathgeber also serves as Chief Compliance Officer of other Fidelity funds (2004) and Executive Vice President of Risk Oversight for Fidelity Investments (2002). Pre viously, he served as Executive Vice President and Chief Operating Officer for Fidelity Investments Institutional Services Company, Inc. (1998 2002).
| Annual Report |
| 62 |
| Name, Age; Principal Occupation John R. Hebble (47) |
Year of Election or Appointment: 2003
Deputy Treasurer of the fund. Mr. Hebble also serves as Deputy Treasurer of other Fidelity funds (2003), and is an employee of FMR. Before joining Fidelity Investments, Mr. Hebble worked at Deutsche Asset Management where he served as Director of Fund Accounting (2002 2003) and Assistant Treasurer of the Scudder Funds (1998 2003).
| Bryan A. Mehrmann (44) |
Year of Election or Appointment: 2005
Deputy Treasurer of the fund. Mr. Mehrmann also serves as Deputy Treasurer of other Fidelity funds (2005 present) and is an employee of FMR. Previously, Mr. Mehrmann served as Vice President of Fidelity In vestments Institutional Services Group (FIIS)/Fidelity Investments Institu tional Operations Corporation, Inc. (FIIOC) Client Services (1998 2004).
| Kimberley H. Monasterio (41) |
Year of Election or Appointment: 2004
Deputy Treasurer of the fund. Ms. Monasterio also serves as Deputy Treasurer of other Fidelity funds (2004) and is an employee of FMR (2004). Before joining Fidelity Investments, Ms. Monasterio served as Treasurer (2000 2004) and Chief Financial Officer (2002 2004) of the Franklin Templeton Funds and Senior Vice President of Franklin Temple ton Services, LLC (2000 2004).
| Kenneth B. Robins (36) |
Year of Election or Appointment: 2005
Deputy Treasurer of the fund. Mr. Robins also serves as Deputy Treasurer of other Fidelity funds (2005 present) and is an employee of FMR (2004 present). Before joining Fidelity Investments, Mr. Robins worked at KPMG LLP, where he was a partner in KPMG’s department of profes sional practice (2002 2004) and a Senior Manager (1999 2000). In addition, Mr. Robins served as Assistant Chief Accountant, United States Securities and Exchange Commission (2000 2002).
| Robert G. Byrnes (38) |
Year of Election or Appointment: 2005
Assistant Treasurer of the fund. Mr. Byrnes also serves as Assistant Trea surer of other Fidelity funds (2005 present) and is an employee of FMR (2005 present). Previously, Mr. Byrnes served as Vice President of FPCMS (2003 2005). Before joining Fidelity Investments, Mr. Byrnes worked at Deutsche Asset Management where he served as Vice Presi dent of the Investment Operations Group (2000 2003).
63 Annual Report
Trustees and Officers - continued
| Name, Age; Principal Occupation John H. Costello (59) |
Year of Election or Appointment: 2003
Assistant Treasurer of the fund. Mr. Costello also serves as Assistant Treasurer of other Fidelity funds and is an employee of FMR.
| Peter L. Lydecker (51) |
Year of Election or Appointment: 2004
Assistant Treasurer of the fund. Mr. Lydecker also serves as Assistant Treasurer of other Fidelity funds (2004) and is an employee of FMR.
| Mark Osterheld (50) |
Year of Election or Appointment: 2003
Assistant Treasurer of the fund. Mr. Osterheld also serves as Assistant Treasurer of other Fidelity funds (2002) and is an employee of FMR.
| Gary W. Ryan (47) |
Year of Election or Appointment: 2005
Assistant Treasurer of the fund. Mr. Ryan also serves as Assistant Trea surer of other Fidelity funds (2005 present) and is an employee of FMR (2005 present). Previously, Mr. Ryan served as Vice President of Fund Reporting in FPCMS (1999 2005).
| Salvatore Schiavone (39) |
Year of Election or Appointment: 2005
Assistant Treasurer of the fund. Mr. Schiavone also serves as Assistant Treasurer of other Fidelity funds (2005 present) and is an employee of FMR (2005 present). Before joining Fidelity Investments, Mr. Schiavone worked at Deutsche Asset Management, where he most recently served as Assistant Treasurer (2003 2005) of the Scudder Funds and Vice Pres ident and Head of Fund Reporting (1996 2003).
| Annual Report |
| 64 |
| Distributions |
The Board of Trustees of Fidelity International Small Cap Fund voted to pay to shareholders of record at the opening of business on record date, the following distributions per share derived from capital gains realized from sales of portfolio securities, and dividends derived from net investment income:
| Pay Date | Record Date | Dividends | Capital Gains | |||||
| Institutional Class | 12/12/05 | 12/09/05 | $.144 | $2.89 |
The fund hereby designates as capital gain dividends: For dividends with respect to the taxable year ended October 31, 2005, $178,942,337 or, if subsequently determined to be different, the net capital gain of such year, and for dividends with respect to the taxable year ended October 31, 2004, $18,049,009, or, if subsequently determined to be different, the excess of: (a) the net capital gain of such year, over (b) amounts previously designated as capital gain dividends with respect to such year.
Institutional Class designates 42% of the dividends distributed during the fiscal year as amounts which may be taken into account as a dividend for purposes of the maximum rate under section 1(h)(11) of the Internal Revenue Code.
The amounts per share which represent income derived from sources within, and taxes paid to, foreign countries or possessions of the United States are as follows:
| Pay Date | Income | Taxes | ||||
| Institutional Class | 12/13/04 | $.145 | $.019 |
The fund will notify shareholders in January 2006 of amounts for use in preparing 2005 income tax returns.
65 Annual Report
Board Approval of Investment Advisory Contracts and Management Fees
Fidelity International Small Cap Fund
Each year, typically in July, the Board of Trustees, including the independent Trustees (together, the Board), votes on the renewal of the management contract and sub advisory agreements (together, the Advisory Contracts) for the fund. The Board, assisted by the advice of fund counsel and independent Trustees’ counsel, requests and considers a broad range of information throughout the year.
The Board meets regularly each month except August and takes into account throughout the year matters bearing on Advisory Contracts. The Board, acting directly and through its separate committees, considers at each of its meetings factors that are relevant to the annual renewal of the fund’s Advisory Contracts, including the services and support provided to the fund and its shareholders by Fidelity. At the time of the renewal, the Board had 11 standing committees, each composed of independent Trustees with varying backgrounds, to which the Board has assigned specific subject matter responsibilities in order to enhance effective decision making by the Board. Each committee has adopted a written charter outlining the structure and purposes of the committee. One such com mittee, the Equity Contract Committee, meets periodically during the first six months of each year and as necessary to consider matters specifically related to the annual renewal of Advisory Contracts. The committee requests and receives information on, and makes recommendations to the independent Trustees concerning, the approval and annual review of the Advisory Contracts.
At its July 2005 meeting, the Board of Trustees, including the independent Trustees, unanimously determined to renew the Advisory Contracts for the fund. In reaching its determination, the Board considered all factors it believed relevant, including (1) the nature, extent, and quality of the services to be provided to the fund and its shareholders by Fidelity (including the investment performance of the fund); (2) the competitiveness of the management fee and total expenses of the fund; (3) the total costs of the services to be provided by and the profits to be realized by the investment adviser and its affiliates from the relationship with the fund; (4) the extent to which economies of scale would be realized as the fund grows; and (5) whether fee levels reflect these economies of scale, if any, for the benefit of fund shareholders.
In determining whether to renew the Advisory Contracts for the fund, the Board ulti mately reached a determination, with the assistance of fund counsel and independent Trustees’ counsel, that the renewal of the Advisory Contracts and the compensation to be received by Fidelity under the management contract is consistent with Fidelity’s fidu ciary duty under applicable law. In addition to evaluating the specific factors noted above, the Board, in reaching its determination, is aware that shareholders in the fund have a broad range of investment choices available to them, including a wide choice among mutual funds offered by competitors to Fidelity, and that the fund’s shareholders, with the opportunity to review and weigh the disclosure provided by the fund in its
| Annual Report |
| 66 |
prospectus and other public disclosures, have chosen to invest in this fund, managed by Fidelity.
Nature, Extent, and Quality of Services Provided by Fidelity. The Board consid ered staffing within the investment adviser, FMR, and the sub advisers (together, the Investment Advisers), including the backgrounds of the fund’s portfolio managers and the fund’s investment objective and discipline. The independent Trustees also had discussions with senior management of Fidelity’s investment operations and investment groups. The Board considered the structure of the portfolio manager compensation program and whether this structure provides appropriate incentives.
Fidelity Resources Dedicated to Investment Management and Support Services. The Board reviewed the size, education, and experience of the Investment Advisers’ invest ment staff, their use of technology, and the Investment Advisers’ approach to recruiting, training, and retaining portfolio managers and other research, advisory, and manage ment personnel. The Board considered Fidelity’s extensive global research capabilities that enable the Investment Advisers to aggregate data from various sources in an effort to produce positive investment results. The Board noted that Fidelity’s analysts have access to a variety of technological tools that enable them to perform both fundamental and quantitative analysis and to specialize in various disciplines. The Board also considered that Fidelity’s portfolio managers and analysts have access to daily portfolio attribution that allows for monitoring of a fund’s portfolio, as well as an electronic communication system that provides immediate real time access to research concerning issuers and credit enhancers.
Shareholder and Administrative Services. The Board considered the nature, extent, quality, and cost of administrative, distribution, and shareholder services performed by the Investment Advisers and their affiliates under the Advisory Contracts and under separate agreements covering transfer agency, pricing and bookkeeping, and securities lending services for the fund. The Board also considered the nature and extent of the Investment Advisers’ supervision of third party service providers, principally custodians and subcustodians. The Board reviewed the allocation of fund brokerage, including allocations to brokers affiliated with the Investment Advisers, the use of brokerage commissions to pay fund expenses, and the use of “soft” commission dollars to pay for research services. The Board also considered that Fidelity voluntarily decided in 2004 to stop using “soft” commission dollars to pay for market data and, instead, to pay for that data out of its own resources. The Board also considered the resources devoted to, and the record of compliance with, the fund’s compliance policies and procedures.
The Board noted that the growth of fund assets across the complex allows Fidelity to reinvest in the development of services designed to enhance the value or convenience of the Fidelity funds as investment vehicles. These services include 24 hour access to
67 Annual Report
Board Approval of Investment Advisory Contracts and Management Fees continued
account information and market information through phone representatives and over the Internet, and investor education materials and asset allocation tools.
Investment in a Large Fund Family. The Board considered the benefits to shareholders of investing in a Fidelity fund, including the benefits of investing in a fund that is part of a large family of funds offering a variety of investment disciplines and providing for a large variety of mutual fund investor services. For example, fund shareholders are offered the privilege of exchanging shares of the fund for shares of other Fidelity funds, as set forth in the fund’s prospectus, without paying an additional sales charge. The Board noted that, since the last Advisory Contract renewals in July 2004, Fidelity has taken a number of actions that benefited particular funds, including (i) voluntarily deciding in 2004 to stop using “soft” commission dollars to pay for market data and, instead, to pay for that data out of its own resources, (ii) contractually agreeing to impose management fee reductions and expense limitations on its five Spartan stock index funds and its stock index fund available through variable insurance products, (iii) contractually agreeing to eliminate the management fees on the Fidelity Freedom Funds and the Fidelity Advisor Freedom Funds, (iv) contractually agreeing to reduce the management fees on most of its investment grade taxable bond funds, and (v) contractually agreeing to impose expense limitations on its retail and Spartan investment grade taxable bond funds.
Investment Performance and Compliance. The Board considered whether the fund has operated within its investment objective, as well as its record of compliance with its investment restrictions. It also reviewed the fund’s absolute investment performance for each class, as well as the fund’s relative investment performance for each class measured against (i) a broad based securities market index, and (ii) a peer group of mutual funds deemed appropriate by the Board over multiple periods. Because the fund had been in existence less than three calendar years, the following chart considered by the Board shows, for the one year period ended December 31, 2004, the returns of Class C and the retail class of the fund, the return of a broad based securities market index (“bench mark”), and a range of returns of a peer group of mutual funds identified by Lipper Inc. as having an investment objective similar to that of the fund. The returns of Class C and the retail class represent the performance of classes with the highest and lowest 12b 1 fees, respectively (not necessarily with the highest and lowest total expenses). The box within the chart shows the 25th percentile return (bottom of box) and the 75th percen tile return (top of box) of the Lipper peer group. Returns shown above the box are in the first quartile and returns shown below the box are in the fourth quartile. The percentage beaten numbers noted below the chart correspond to the percentile box and represent the percentage of funds in the Lipper peer group whose performance was equal to or lower than that of the class indicated.
| Annual Report |
| 68 |

The Board reviewed the fund’s relative investment performance against its Lipper peer group and stated that the performance of the retail class of the fund was in the second quartile for the one year period. The Board also stated that the relative investment performance of the fund was lower than its benchmark for the one year period. The Board considered that the variations in performance among the fund’s classes reflect the variations in class expenses, which result in lower performance for higher expense classes. The Board stated that it is difficult to evaluate in any comprehensive fashion the performance of the fund, in light of its relatively recent launch.
The Board also considered that the fund’s management fee is subject to upward or downward adjustment depending upon whether, and to what extent, the fund’s invest ment performance for the performance period exceeds, or is exceeded by, the record (over the same period) of a Board approved performance adjustment index. The Board realizes that the performance adjustment provides FMR with a strong economic incen tive to seek to achieve superior performance for the fund’s shareholders and helps to more closely align the interests of FMR and the fund’s shareholders.
The Board has had thorough discussions with FMR throughout the year about the Board’s and FMR’s concerns about equity research, equity fund performance, and compliance with internal policies governing gifts and entertainment. FMR has taken steps that it believes will refocus and strengthen equity research and equity portfolio management and compliance. The Board noted with favor FMR’s recent reorganization of its senior management team and FMR’s plans to dedicate additional resources to investment research, and participated in the process that led to those changes.
69 Annual Report
Board Approval of Investment Advisory Contracts and Management Fees continued
Based on its review, and giving particular weight to the nature and quality of the resources dedicated by the Investment Advisers to maintain and improve relative performance, the Board concluded that the nature, extent, and quality of the services provided by Fidelity will benefit the fund’s shareholders, particularly in light of the Board’s view that the fund’s shareholders benefit from investing in a fund that is part of a large family of funds offering a variety of investment disciplines and services.
Competitiveness of Management Fee and Total Fund Expenses. The Board considered the fund’s management fee and total expenses compared to “mapped groups” of competitive funds and classes. Fidelity creates “mapped groups” by combining similar Lipper investment objective categories that have comparable management fee charac teristics. Combining Lipper investment objective categories aids the Board’s manage ment fee and total expense comparisons by broadening the competitive group used for comparison and by reducing the number of universes to which various Fidelity funds are compared.
The Board considered two proprietary management fee comparisons for the 12 month (or shorter) periods shown in the chart below. The group of Lipper funds used by the Board for management fee comparisons is referred to below as the “Total Mapped Group” and, for the reasons explained above, is broader than the Lipper peer group used by the Board for performance comparisons. The Total Mapped Group comparison focuses on a fund’s standing relative to the total universe of comparable funds available to investors, in terms of gross management fees before expense reimbursements or caps. “TMG %” represents the percentage of funds in the Total Mapped Group that had management fees that were lower than the fund’s. For example, a TMG % of 42% means that 58% of the funds in the Total Mapped Group had higher management fees than the fund. The “Asset Size Peer Group” (ASPG) comparison focuses on a fund’s standing relative to non Fidelity funds similar in size to the fund within the Total Mapped Group. The ASPG represents at least 15% of the funds in the Total Mapped Group with comparable asset size and management fee characteristics, subject to a minimum of 50 funds (or all funds in the Total Mapped Group if fewer than 50). Additional information, such as the ASPG quartile (“quadrant”) in which the fund’s management fee ranked and the impact of the fund’s performance adjustment, is also included in the chart and considered by the Board.
| Annual Report |
| 70 |
![]()
The Board noted that the fund’s management fee ranked below the median of its Total Mapped Group and below the median of its ASPG for 2004. The Board also noted the effect of the fund’s positive performance adjustment on the fund’s management fee ranking.
Based on its review, the Board concluded that the fund’s management fee was fair and reasonable in light of the services that the fund receives and the other factors considered.
In its review of each class’s total expenses, the Board considered the fund’s management fee as well as other fund or class expenses, as applicable, such as transfer agent fees, pricing and bookkeeping fees, fund paid 12b 1 fees, and custodial, legal, and audit fees. The Board also noted the effects of any waivers and reimbursements on fees and expenses, as well as the fund’s positive performance adjustment. As part of its review, the Board also considered current and historical total expenses of each class of the fund compared to competitive fund median expenses. Each class of the fund is compared to those funds and classes in the Total Mapped Group (used by the Board for management fee comparisons) that have a similar sales load structure.
The Board noted that the total expenses of Fidelity International Small Cap Fund (retail class) ranked below its competitive median for 2004, and the total expenses of each of Class A, Class B, Class C, Class T and Institutional Class ranked above its competitive median for 2004. The Board considered that the Advisor classes were above median due in part to the fund’s higher management fee associated with the fund’s small cap invest ment discipline. The Board noted that the fund offers multiple classes, each of which has a different sales load and 12b 1 fee structure, and that the multiple structures are
71 Annual Report
Board Approval of Investment Advisory Contracts and Management Fees continued
intended to offer a range of pricing options for the intermediary market. The Board also noted that the total expenses of the classes vary primarily by the level of their 12b 1 fees, although differences in transfer agent fees may also cause expenses to vary from class to class.
Furthermore, the Board considered that on December 16, 2004, it had approved changes (effective January 1, 2005) in the transfer agent and service agreements for the fund that established maximum transfer agent fees and eliminated the minimum pricing and bookkeeping fee to prevent small funds or funds with small average account sizes from having relatively high fees in basis points (the “small fund fee reductions”). The Board considered that, if the small fund fee reductions had been in effect in 2004, the total expenses of Class A would have ranked below the median.
In its review of total expenses, the Board also considered Fidelity fee structures and other information on clients that FMR and its affiliates service in other competitive markets, such as other mutual funds advised or subadvised by FMR or its affiliates, pension plan clients, and other institutional clients.
Based on its review, the Board concluded that the total expenses for each class of the fund were reasonable, although in some cases above the median of the universe presented for comparison, in light of the services that the fund and its shareholders receive and the other factors considered.
Costs of the Services and Profitability. The Board considered the revenues earned and the expenses incurred by Fidelity in conducting the business of developing, market ing, distributing, managing, administering and servicing the fund and its shareholders. The Board also considered the level of Fidelity’s profits in respect of all the Fidelity funds.
On an annual basis, FMR presents to the Board Fidelity’s profitability for the fund. Fidelity calculates the profitability for each fund, as well as aggregate profitability for groups of Fidelity funds and all Fidelity funds, using a series of detailed revenue and cost allocation methodologies which originate with the audited books and records of Fidelity. The Audit Committee of the Board reviews any significant changes from the prior year’s methodologies.
PricewaterhouseCoopers LLP (PwC), independent registered accounting firm and auditor to Fidelity and certain Fidelity funds, has been engaged annually by the Board as part of the Board’s assessment of the results of Fidelity’s profitability analysis. PwC’s engagement includes the review and assessment of Fidelity’s methodologies used in determining the revenues and expenses attributable to Fidelity’s mutual fund business, and completion of agreed upon procedures surrounding the mathematical accuracy of fund profitability and its conformity to allocation methodologies. After considering PwC’s reports issued under the engagement and information provided by Fidelity, the Board
| Annual Report |
| 72 |
believes that while other allocation methods may also be reasonable, Fidelity’s profitabil ity methodologies are reasonable in all material respects.
The Board has also reviewed Fidelity’s non fund businesses and any fall out benefits related to the mutual fund business as well as cases where Fidelity’s affiliates may benefit from or be related to the fund’s business. In addition, a special committee of the Board reviewed services provided to Fidelity by its affiliates and determined that the fees that Fidelity paid for such services were reasonable.
The Board considered the costs of the services provided by and the profits realized by Fidelity in connection with the operation of the fund and determined that the amount of profit is a fair entrepreneurial profit for the management of the fund.
Economies of Scale. The Board considered whether there have been economies of scale in respect of the management of the Fidelity funds, whether the Fidelity funds (including the fund) have appropriately benefited from any such economies of scale, and whether there is potential for realization of any further economies of scale. The Board considered the extent to which the fund will benefit from economies of scale through increased services to the fund, through waivers or reimbursements, or through fee or expense reductions, including reductions that occur through operation of the transfer agent agreement. The transfer agent fee varies in part based on the number of accounts in the fund. If the number of accounts decreases or the average account size increases, the overall transfer agent fee rate decreases.
The Board recognized that the fund’s management contract incorporates a “group fee” structure, which provides for lower fee rates as total fund assets under FMR’s manage ment increase, and for higher fee rates as total fund assets under FMR’s management decrease. The Board considered that the group fee is designed to deliver the benefits of economies of scale to fund shareholders when total fund assets increase, even if assets of any particular fund are unchanged or have declined, because some portion of Fidelity’s costs are attributable to services provided to all Fidelity funds, and all funds benefit if those costs can be allocated among more assets. The Board concluded that, given the group fee structure, fund shareholders will achieve a certain level of economies of scale as assets under FMR’s management increase at the fund complex level, regardless of whether Fidelity achieves any such economies of scale.
The Board further concluded that any potential economies of scale are being shared between fund shareholders and Fidelity in an appropriate manner.
Additional Information Requested by the Board. In order to develop fully the factual basis for consideration of the Advisory Contracts, the Board requested additional information regarding (i) equity fund transfer agency fees; (ii) Fidelity’s fund profitability methodology and the impact of various changes in the methodology over time; (iii) benefits to shareholders from economies of scale; (iv) composition and
73 Annual Report
Board Approval of Investment Advisory Contracts and Management Fees continued
characteristics of various fund and industry data used in comparisons; and (v) com pensation of portfolio managers and research analysts.
Based on its evaluation of all of the conclusions noted above, and after considering all material factors, the Board ultimately concluded that the existing advisory fee structures are fair and reasonable, and that the fund’s existing Advisory Contracts should be renewed.
| Annual Report |
| 74 |
75 Annual Report
| Annual Report |
| 76 |
77 Annual Report
| Annual Report |
| 78 |
79 Annual Report
| Investment Adviser Fidelity Management & Research Company Boston, MA Investment Sub Advisers FMR Co., Inc. Fidelity Management & Research (U.K.) Inc. Fidelity Management & Research (Far East) Inc. Fidelity International Investment Advisors Fidelity Investments Japan Limited Fidelity International Investment Advisors (U.K.) Limited General Distributor Fidelity Distributors Corporation Boston, MA Transfer and Service Agents Fidelity Investments Institutional Operations Company, Inc. Boston, MA Fidelity Service Company, Inc. Boston, MA Custodian Mellon Bank Pittsburgh, PA |
| AISCI-UANN-1205 1.793572.102 |

| Fidelity® International Discovery Fund |
| Annual Report October 31, 2005 |
![]()

| Contents | ||||
| Chairman’s Message | 4 | Ned Johnson’s message to shareholders. | ||
| Performance | 5 | How the fund has done over time. | ||
| Management’s Discussion | 6 | The manager’s review of fund | ||
| performance, strategy and outlook. | ||||
| Shareholder Expense | 7 | An example of shareholder expenses. | ||
| Example | ||||
| Investment Changes | 9 | A summary of major shifts in the fund’s | ||
| investments over the past six months. | ||||
| Investments | 11 | A complete list of the fund’s investments | ||
| with their market values. | ||||
| Financial Statements | 23 | Statements of assets and liabilities, | ||
| operations, and changes in net assets, | ||||
| as well as financial highlights. | ||||
| Notes | 33 | Notes to the financial statements. | ||
| Report of Independent | 42 | |||
| Registered Public | ||||
| Accounting Firm | ||||
| Trustees and Officers | 43 | |||
| Distributions | 53 | |||
| Board Approval of | 54 | |||
| Investment Advisory | ||||
| Contracts and | ||||
| Management Fees | ||||
| To view a fund’s proxy voting guidelines and proxy voting record for the 12 month period ended June 30, visit www.fidelity.com/proxyvotingresults or visit the Securities and Exchange Commis sion’s (SEC) web site at www.sec.gov. You may also call 1-800-544-8544 to request a free copy of the proxy voting guidelines. Standard & Poor’s, S&P and S&P 500 are registered service marks of The McGraw Hill Companies, Inc. and have been licensed for use by Fidelity Distributors Corporation. Other third party marks appearing herein are the property of their respective owners. All other marks appearing herein are registered or unregistered trademarks or service marks of FMR Corp. or an affiliated company. |
| Annual Report |
| 2 |
| This report and the financial statements contained herein are submitted for the general information of the shareholders of the fund. This report is not authorized for distribution to prospective investors in the fund unless preceded or accompanied by an effective prospectus. A fund files its complete schedule of portfolio holdings with the SEC for the first and third quarters of each fiscal year on Form N Q. Forms N Q are available on the SEC’s web site at http://www.sec.gov. A fund’s Forms N Q may be reviewed and copied at the SEC’s Public Reference Room in Washington, DC. Information regarding the operation of the SEC’s Public Reference Room may be obtained by calling 1-800-SEC-0330. For a complete list of a fund’s portfolio holdings, view the most recent quarterly holdings report, semiannual report, or annual report on Fidelity’s web site at http://www.fidelity.com/holdings. NOT FDIC INSURED · MAY LOSE VALUE · NO BANK GUARANTEE Neither the fund nor Fidelity Distributors Corporation is a bank. |
3 Annual Report
Chairman’s Message
(photograph of Edward C. Johnson 3d)
Dear Shareholder:
During the past year or so, much has been reported about the mutual fund industry, and much of it has been more critical than I believe is warranted. Allegations that some companies have been less than forthright with their shareholders have cast a shadow on the entire industry. I continue to find these reports disturbing, and assert that they do not create an accurate picture of the industry overall. Therefore, I would like to remind every one where Fidelity stands on these issues. I will say two things specifically regarding allegations that some mutual fund companies were in violation of the Securities and Exchange Commission’s forward pricing rules or were involved in so called “market timing” activities.
First, Fidelity has no agreements that permit customers who buy fund shares after 4 p.m. to obtain the 4 p.m. price. This is not a new policy. This is not to say that some one could not deceive the company through fraudulent acts. However, we are extremely diligent in preventing fraud from occurring in this manner and in every other. But I underscore again that Fidelity has no so called “agreements” that sanction illegal practices.
Second, Fidelity continues to stand on record, as we have for years, in opposition to predatory short term trading that adversely affects shareholders in a mutual fund. Back in the 1980s, we initiated a fee which is returned to the fund and, therefore, to investors to discourage this activity. Further, we took the lead several years ago in developing a Fair Value Pricing Policy to prevent market timing on foreign securities in our funds. I am confident we will find other ways to make it more difficult for predatory traders to operate. However, this will only be achieved through close cooperation among regulators, legislators and the industry.
Yes, there have been unfortunate instances of unethical and illegal activity within the mutual fund industry from time to time. That is true of any industry. When this occurs, confessed or convicted offend ers should be dealt with appropriately. But we are still concerned about the risk of over regulation and the quick application of simplistic solutions to intricate problems. Every system can be improved, and we support and applaud well thought out improvements by regulators, legislators and industry representatives that achieve the common goal of building and protecting the value of investors’ holdings.
For nearly 60 years, Fidelity has worked very hard to improve its products and service to justify your trust. When our family founded this company in 1946, we had only a few hundred customers. Today, we serve more than 18 million customers in cluding individual investors and participants in retirement plans across America.
Let me close by saying that we do not take your trust in us for granted, and we realize that we must always work to improve all aspects of our service to you. In turn, we urge you to continue your active par ticipation with your financial matters, so that your interests can be well served.
Best regards,
/s/ Edward C. Johnson 3d
Edward C. Johnson 3d
Annual Report 4
Performance: The Bottom Line
Average annual total return reflects the change in the value of an investment, assuming reinvestment of the fund’s dividend income and capital gains (the profits earned upon the sale of securities that have grown in value) and assuming a constant rate of perfor mance each year. The $10,000 table and the fund’s returns do not reflect the deduction of taxes that a shareholder would pay on fund distributions or the redemption of fund shares. During periods of reimbursement by Fidelity, a fund’s total return will be greater than it would be had the reimbursement not occurred. How a fund did yesterday is no guarantee of how it will do tomorrow.
| Average Annual Total Returns | ||||||
| Periods ended October 31, 2005 | Past 1 | Past 5 | Past 10 | |||
| year | years | years | ||||
| Fidelity® International Discovery Fund | 22.29% | 5.99% | 9.68% | |||
| $10,000 Over 10 Years | ||||||
Let’s say hypothetically that $10,000 was invested in Fidelity® International Discovery Fund on October 31, 1995. The chart shows how the value of your investment would have changed, and also shows how the Morgan Stanley Capital InternationalSM Europe, Australasia, Far East (MSCI® EAFE)® Index performed over the same period.
5 Annual Report
5
Management’s Discussion of Fund Performance
Comments from William Kennedy, Portfolio Manager of Fidelity® International Discovery Fund
Foreign stock markets enjoyed broad based advances during the 12 month period that ended October 31, 2005, encouraged by better than expected corporate earnings and markedly improved economies. For the 12 months overall, the Morgan Stanley Capital InternationalSM Europe, Australasia, Far East (MSCI® EAFE®) Index a performance measure of developed stock markets outside the United States and Canada gained 18.28% . The Japanese stock market climbed to its highest level in more than four years. Positive economic indicators and Prime Minister Koizumi’s decisive election victory attracted record inflows from overseas investors. In response, the Tokyo Stock Exchange Stock Price Index (TOPIX) soared 22.89% . Southeast Asian equities outside of Japan, particularly South Korea, also responded well to the better macroeconomic environment, illustrated by the 19.44% return for the MSCI All Country Far East ex Japan index. Euro pean stock markets were up as well, despite investors’ concern about higher energy prices and potential downgrades to economic growth in the region. For the year overall, the MSCI Europe index rose 16.51% .
For the 12 months ending October 31, 2005, International Discovery returned 22.29%, beating the MSCI EAFE index as well as the 17.75% return for the LipperSM International Funds Average. The fund would have done even better on an absolute basis were it not for currency movements in Europe and Japan that adversely affected U.S. investors. Relative to the index, performance benefited from strong stock picking, especially in financials and telecommunication services, as well as favorable country selection. Weak returns from semiconductor stocks and underweightings in certain index components hurt relative returns. Small and mid cap stocks that were not in the index were among the top relative performers. They included Orascom Telecom, an Egyptian wireless company that benefited from its growth in emerging markets, and Telewest Global, a cable company operating in England that was bought out at a nice premium. I sold both stocks during the period. Banco Bradesco and Banco Itau, Brazilian banks, also rallied nicely, fueled by strong demand for commercial and consumer loans. Underweightings in Mitsubishi UFJ Financial, a Japanese bank, and GlaxoSmithKline, a U.K. based pharmaceutical company, detracted from relative performance as both stocks began to rally. An overweighting in Tokyo Elec tron, a semiconductor equipment stock that declined, further hampered relative returns.
The views expressed in this statement reflect those of the portfolio manager only through the end of the period of the report as stated on the cover and do not necessarily represent the views of Fidelity or any other person in the Fidelity organization. Any such views are subject to change at any time based upon market or other conditions and Fidelity disclaims any responsibility to update such views. These views may not be relied on as investment advice and, because investment decisions for a Fidelity fund are based on numerous factors, may not be relied on as an indication of trading intent on behalf of any Fidelity fund.
| Annual Report |
| 6 6 |
Shareholder Expense Example
As a shareholder of the Fund, you incur two types of costs: (1) transaction costs, including sales charges (loads) on redemptions of shares purchased prior to October 12, 1990, and redemption fees, and (2) ongoing costs, including management fees, distribution and/or service (12b 1) fees and other Fund expenses. This Example is intended to help you understand your ongoing costs (in dollars) of investing in the Fund and to compare these costs with the ongoing costs of investing in other mutual funds.
The Example is based on an investment of $1,000 invested at the beginning of the period and held for the entire period (May 1, 2005 to October 31, 2005).
| Actual Expenses |
The first line of the table below for each class of the Fund provides information about actual account values and actual expenses. You may use the information in this line, together with the amount you invested, to estimate the expenses that you paid over the period. Simply divide your account value by $1,000.00 (for example, an $8,600 account value divided by $1,000.00 = 8.6), then multiply the result by the number in the first line for a class of the Fund under the heading entitled “Expenses Paid During Period” to estimate the expenses you paid on your account during this period. A small balance maintenance fee of $12.00 that is charged once a year may apply for certain accounts with a value of less than $2,000. This fee is not included in the table below. If it was, the esti mate of expenses you paid during the period would be higher, and your ending account value lower, by this amount.
Hypothetical Example for Comparison Purposes
The second line of the table below for each class of the Fund provides information about hypothetical account values and hypothetical expenses based on a Class’ actual expense ratio and an assumed rate of return of 5% per year before expenses, which is not the Class’ actual return. The hypothetical account values and expenses may not be used to estimate the actual ending account balance or expenses you paid for the period. You may use this information to compare the ongoing costs of investing in the Fund and other funds. To do so, compare this 5% hypothetical example with the 5% hypothetical examples that appear in the shareholder reports of the other funds. A small balance maintenance fee of $12.00 that is charged once a year may apply for certain accounts with a value of less than $2,000. This fee is not included in the table below. If it was, the estimate of expenses you paid during the period would be higher, and your ending account value lower, by this amount.
7 Annual Report
Shareholder Expense Example continued
Please note that the expenses shown in the table are meant to highlight your ongoing costs only and do not reflect any transaction costs. Therefore, the second line of the table is useful in comparing ongoing costs only, and will not help you determine the relative total costs of owning different funds. In addition, if these transactional costs were included, your costs would have been higher.
| Expenses Paid | ||||||||||||
| Beginning | Ending | During Period* | ||||||||||
| Account Value | Account Value | May 1, 2005 | ||||||||||
| May 1, 2005 | October 31, 2005 | to October 31, 2005 | ||||||||||
| Class A | ||||||||||||
| Actual | $ | 1,000.00 | $ | 1,105.20 | $ | 7.64 | ||||||
| HypotheticalA | $ | 1,000.00 | $ | 1,017.95 | $ | 7.32 | ||||||
| Class T | ||||||||||||
| Actual | $ | 1,000.00 | $ | 1,103.10 | $ | 9.28 | ||||||
| HypotheticalA | $ | 1,000.00 | $ | 1,016.38 | $ | 8.89 | ||||||
| Class B | ||||||||||||
| Actual | $ | 1,000.00 | $ | 1,100.40 | $ | 11.91 | ||||||
| HypotheticalA | $ | 1,000.00 | $ | 1,013.86 | $ | 11.42 | ||||||
| Class C | ||||||||||||
| Actual | $ | 1,000.00 | $ | 1,101.80 | $ | 10.91 | ||||||
| HypotheticalA | $ | 1,000.00 | $ | 1,014.82 | $ | 10.46 | ||||||
| International Discovery Fund | ||||||||||||
| Actual | $ | 1,000.00 | $ | 1,106.90 | $ | 5.68 | ||||||
| HypotheticalA | $ | 1,000.00 | $ | 1,019.81 | $ | 5.45 | ||||||
| Institutional Class | ||||||||||||
| Actual | $ | 1,000.00 | $ | 1,107.60 | $ | 5.21 | ||||||
| HypotheticalA | $ | 1,000.00 | $ | 1,020.27 | $ | 4.99 | ||||||
| A 5% return per year before expenses | ||||||||||||
* Expenses are equal to each Class’ annualized expense ratio (shown in the table below); multiplied by the average account value over the period, multiplied by 184/365 (to reflect the one half year period).
| Annualized | ||
| Expense Ratio | ||
| Class A | 1.44% | |
| Class T | 1.75% | |
| Class B | 2.25% | |
| Class C | 2.06% | |
| International Discovery Fund | 1.07% | |
| Institutional Class | 98% |
| Annual Report |
| 8 |
Investment Changes
9 Annual Report
| Investment Changes continued | ||||||
| Asset Allocation | ||||||
| % of fund’s | % of fund’s net assets | |||||
| net assets | 6 months ago | |||||
| Stocks and Equity Futures | 99.4 | 98.5 | ||||
| Short Term Investments and Net Other Assets | 0.6 | 1.5 | ||||
| Top Ten Stocks as of October 31, 2005 | ||||||
| % of fund’s | % of fund’s net assets | |||||
| net assets | 6 months ago | |||||
| BP PLC sponsored ADR (United Kingdom, Oil, | ||||||
| Gas & Consumable Fuels) | 2.1 | 1.8 | ||||
| Novartis AG (Reg.) (Switzerland, | ||||||
| Pharmaceuticals) | 1.8 | 1.7 | ||||
| Roche Holding AG (participation certificate) | ||||||
| (Switzerland, Pharmaceuticals) | 1.8 | 1.7 | ||||
| Total SA Series B (France, Oil, Gas & | ||||||
| Consumable Fuels) | 1.7 | 1.6 | ||||
| Vodafone Group PLC (United Kingdom, Wireless | ||||||
| Telecommunication Services) | 1.6 | 1.5 | ||||
| GlaxoSmithKline PLC sponsored ADR (United | ||||||
| Kingdom, Pharmaceuticals) | 1.5 | 0.6 | ||||
| Royal Dutch Shell PLC Class B (United Kingdom, | ||||||
| Oil, Gas & Consumable Fuels) | 1.5 | 0.0 | ||||
| Toyota Motor Corp. (Japan, Automobiles) | 1.4 | 0.6 | ||||
| Nestle SA (Reg.) (Switzerland, Food Products) | 1.2 | 1.0 | ||||
| Allianz AG (Reg.) (Germany, Insurance) | 1.2 | 1.0 | ||||
| 15.8 | ||||||
| Market Sectors as of October 31, 2005 | ||||||
| % of fund’s | % of fund’s net assets | |||||
| net assets | 6 months ago | |||||
| Financials | 24.5 | 24.8 | ||||
| Consumer Discretionary | 15.6 | 20.1 | ||||
| Industrials | 11.0 | 10.3 | ||||
| Health Care | 10.0 | 10.6 | ||||
| Consumer Staples | 8.9 | 5.2 | ||||
| Energy | 8.4 | 7.7 | ||||
| Information Technology | 7.6 | 7.1 | ||||
| Materials | 5.7 | 4.2 | ||||
| Telecommunication Services | 4.4 | 5.6 | ||||
| Utilities | 2.0 | 2.1 | ||||
| Annual Report | 10 | |||||
| Investments October 31, 2005 | ||||||
| Showing Percentage of Net Assets | ||||||
| Common Stocks 96.7% | ||||||
| Shares | Value (Note 1) | |||||
| (000s) | ||||||
| Australia – 4.3% | ||||||
| ABC Learning Centres Ltd. | 1,730,169 | $ | 8,409 | |||
| AMP Ltd. | 699,000 | 3,810 | ||||
| Babcock & Brown Japan Property Trust | 6,743,900 | 7,867 | ||||
| BHP Billiton Ltd. | 2,473,100 | 38,395 | ||||
| Billabong International Ltd. | 925,928 | 8,959 | ||||
| Caltex Australia Ltd. | 272,100 | 4,134 | ||||
| Commonwealth Bank of Australia | 241,000 | 7,006 | ||||
| Computershare Ltd. | 1,432,900 | 7,018 | ||||
| CSL Ltd. | 269,050 | 7,544 | ||||
| Downer EDI Ltd. | 2,523,506 | 11,473 | ||||
| Macquarie Airports unit | 1,991,381 | 4,467 | ||||
| Macquarie Bank Ltd. | 391,000 | 18,908 | ||||
| Macquarie Communications Infrastructure Group unit | 1,632,940 | 7,021 | ||||
| Macquarie Infrastructure Group unit | 1,632,500 | 4,187 | ||||
| QBE Insurance Group Ltd. | 978,567 | 13,025 | ||||
| Seek Ltd. | 2,000,000 | 4,247 | ||||
| Transurban Group unit | 918,000 | 4,393 | ||||
| Westfield Group unit | 676,200 | 8,398 | ||||
| TOTAL AUSTRALIA | 169,261 | |||||
| Austria – 0.6% | ||||||
| Erste Bank der Oesterreichischen Sparkassen AG | 208,400 | 10,842 | ||||
| OMV AG | 259,000 | 13,971 | ||||
| TOTAL AUSTRIA | 24,813 | |||||
| Belgium – 0.3% | ||||||
| InBev SA | 305,000 | 12,193 | ||||
| Bermuda – 0.0% | ||||||
| Catlin Group Ltd. | 224,221 | 1,923 | ||||
| Brazil – 0.6% | ||||||
| Banco Bradesco SA (PN) sponsored ADR (non-vtg.) | 222,300 | 11,535 | ||||
| Banco Itau Holding Financeira SA (PN) | 382,170 | 9,116 | ||||
| Banco Nossa Caixa SA | 103,000 | 1,706 | ||||
| TOTAL BRAZIL | 22,357 | |||||
| Canada 0.5% | ||||||
| EnCana Corp. | 410,000 | 18,747 | ||||
See accompanying notes which are an integral part of the financial statements.
11 Annual Report
| Investments continued | ||||||
| Common Stocks continued | ||||||
| Shares | Value (Note 1) | |||||
| (000s) | ||||||
| Cayman Islands – 0.2% | ||||||
| Foxconn International Holdings Ltd. | 4,277,000 | $ | 4,579 | |||
| Kingboard Chemical Holdings Ltd. | 1,351,000 | 2,858 | ||||
| TOTAL CAYMAN ISLANDS | 7,437 | |||||
| China – 0.4% | ||||||
| China Construction Bank Corp. (H Shares) | 26,650,000 | 8,079 | ||||
| Li Ning Co. Ltd. | 7,030,000 | 4,262 | ||||
| Xinao Gas Holdings Ltd. | 5,392,000 | 4,104 | ||||
| TOTAL CHINA | 16,445 | |||||
| Denmark – 0.9% | ||||||
| GN Store Nordic AS | 1,347,000 | 16,227 | ||||
| Vestas Wind Systems AS (a)(d) | 872,100 | 18,876 | ||||
| TOTAL DENMARK | 35,103 | |||||
| Finland – 2.0% | ||||||
| Citycon Oyj | 576,935 | 2,213 | ||||
| Fortum Oyj | 538,600 | 9,536 | ||||
| Metso Corp. | 400,500 | 10,418 | ||||
| Neste Oil Oyj | 174,750 | 5,415 | ||||
| Nokia Corp. sponsored ADR | 1,907,100 | 32,077 | ||||
| Nokian Tyres Ltd. | 500,300 | 7,797 | ||||
| Sampo Oyj (A Shares) | 695,900 | 10,678 | ||||
| TOTAL FINLAND | 78,134 | |||||
| France – 7.5% | ||||||
| Alstom SA (a) | 206,800 | 9,914 | ||||
| AXA SA | 572,300 | 16,574 | ||||
| BNP Paribas SA | 167,327 | 12,687 | ||||
| Eiffage SA | 64,893 | 5,601 | ||||
| Financiere Marc de Lacharriere SA (Fimalac) | 94,958 | 5,157 | ||||
| Groupe Danone | 73,800 | 7,529 | ||||
| Lagardere S.C.A. (Reg.) | 248,900 | 17,111 | ||||
| Louis Vuitton Moet Hennessy (LVMH) | 102,800 | 8,324 | ||||
| Neopost SA | 251,500 | 24,270 | ||||
| Nexity | 305,200 | 13,936 | ||||
| Orpea (a) | 249,764 | 13,473 | ||||
| Pernod Ricard SA | 158,600 | 27,739 | ||||
| Sanofi-Aventis sponsored ADR | 622,900 | 24,991 | ||||
| Suez SA (France) | 559,900 | 15,169 | ||||
| Total SA Series B | 261,544 | 65,920 | ||||
See accompanying notes which are an integral part of the financial statements.
| Annual Report |
| 12 |
| Common Stocks continued | ||||||
| Shares | Value (Note 1) | |||||
| (000s) | ||||||
| France – continued | ||||||
| Vinci SA | 84,500 | $ | 6,604 | |||
| Vivendi Universal SA sponsored ADR | 662,000 | 20,800 | ||||
| TOTAL FRANCE | 295,799 | |||||
| Germany – 8.4% | ||||||
| Allianz AG (Reg.) | 342,630 | 48,448 | ||||
| BASF AG | 213,900 | 15,401 | ||||
| Bayer AG sponsored ADR | 459,000 | 15,973 | ||||
| Bijou Brigitte Modische Accessoires AG | 12,480 | 2,596 | ||||
| CeWe Color Holding AG | 81,100 | 4,297 | ||||
| Continental AG | 93,400 | 7,143 | ||||
| DaimlerChrysler AG (Reg.) | 373,000 | 18,669 | ||||
| Deutsche Boerse AG | 136,000 | 12,798 | ||||
| Deutsche Telekom AG sponsored ADR | 1,110,800 | 19,661 | ||||
| Deutz AG (a)(d) | 505,500 | 2,291 | ||||
| E.ON AG | 405,800 | 36,778 | ||||
| ESCADA AG (a) | 134,277 | 3,412 | ||||
| GFK AG | 288,897 | 9,576 | ||||
| Hypo Real Estate Holding AG | 347,168 | 16,788 | ||||
| IWKA AG | 234,300 | 5,196 | ||||
| K&S AG | 37,900 | 2,487 | ||||
| Linde AG | 156,800 | 11,173 | ||||
| Merck KGaA | 180,100 | 14,897 | ||||
| MPC Muenchmeyer Petersen Capital AG | 50,500 | 3,572 | ||||
| MTU Aero Engines Holding AG | 337,500 | 9,811 | ||||
| Muenchener Rueckversicherungs Gesellschaft AG (Reg.) | 116,100 | 13,639 | ||||
| Pfleiderer AG (a) | 441,780 | 8,050 | ||||
| RWE AG | 255,519 | 16,320 | ||||
| SAP AG | 108,600 | 18,653 | ||||
| Siemens AG sponsored ADR | 74,400 | 5,537 | ||||
| SolarWorld AG | 81,900 | 11,067 | ||||
| TOTAL GERMANY | 334,233 | |||||
| Greece – 0.5% | ||||||
| EFG Eurobank Ergasias SA | 311,750 | 9,380 | ||||
| Greek Organization of Football Prognostics SA | 359,130 | 10,367 | ||||
| TOTAL GREECE | 19,747 | |||||
| Hong Kong – 2.2% | ||||||
| Chaoda Modern Agriculture (Holdings) Ltd. | 12,600,000 | 4,754 | ||||
| CNOOC Ltd. | 13,257,000 | 8,710 | ||||
| Esprit Holdings Ltd. | 2,846,000 | 20,063 | ||||
See accompanying notes which are an integral part of the financial statements.
13 Annual Report
| Investments continued | ||||||
| Common Stocks continued | ||||||
| Shares | Value (Note 1) | |||||
| (000s) | ||||||
| Hong Kong – continued | ||||||
| Hutchison Whampoa Ltd. | 2,234,000 | $ | 21,152 | |||
| Li & Fung Ltd. | 4,172,000 | 8,907 | ||||
| PYI Corp. Ltd. | 26,305 | 5 | ||||
| Shun Tak Holdings Ltd. | 2,424,000 | 1,751 | ||||
| Techtronic Industries Co. Ltd. | 6,707,500 | 16,483 | ||||
| Wharf Holdings Ltd. | 1,509,000 | 5,149 | ||||
| TOTAL HONG KONG | 86,974 | |||||
| India – 1.4% | ||||||
| Cipla Ltd. | 511,165 | 4,087 | ||||
| Crompton Greaves Ltd. | 252,847 | 3,452 | ||||
| Infosys Technologies Ltd. | 296,842 | 16,610 | ||||
| Pfizer Ltd. | 218,539 | 3,755 | ||||
| State Bank of India | 721,022 | 14,952 | ||||
| Suzlon Energy Ltd. (a) | 714,804 | 11,333 | ||||
| TOTAL INDIA | 54,189 | |||||
| Ireland – 1.2% | ||||||
| Allied Irish Banks PLC | 776,300 | 16,326 | ||||
| C&C Group PLC | 2,043,700 | 12,617 | ||||
| Independent News & Media PLC (Ireland) | 3,153,642 | 8,544 | ||||
| Paddy Power PLC (Ireland) | 623,197 | 10,534 | ||||
| TOTAL IRELAND | 48,021 | |||||
| Israel – 0.7% | ||||||
| Bank Hapoalim BM (Reg.) | 2,497,200 | 9,565 | ||||
| Bank Leumi le-Israel BM | 1,776,100 | 5,796 | ||||
| Teva Pharmaceutical Industries Ltd. sponsored ADR | 290,200 | 11,062 | ||||
| TOTAL ISRAEL | 26,423 | |||||
| Italy 2.1% | ||||||
| Banche Popolari Unite S.c.a.r.l. | 263,700 | 5,583 | ||||
| Cassa Di Risparmio Di Firenze | 2,248,700 | 6,707 | ||||
| ENI Spa | 288,800 | 7,725 | ||||
| ENI Spa sponsored ADR | 149,700 | 20,022 | ||||
| Lottomatica Spa New | 227,400 | 8,260 | ||||
| Mediobanca Spa | 391,500 | 6,932 | ||||
| Pirelli & C. Real Estate Spa | 122,800 | 6,720 | ||||
| Unicredito Italiano Spa | 3,725,500 | 20,802 | ||||
| TOTAL ITALY | 82,751 | |||||
See accompanying notes which are an integral part of the financial statements.
| Annual Report |
| 14 |
| Common Stocks continued | ||||||
| Shares | Value (Note 1) | |||||
| (000s) | ||||||
| Japan 21.7% | ||||||
| Aeon Co. Ltd. | 1,205,600 | $ | 25,058 | |||
| Asics Corp. | 327,000 | 2,821 | ||||
| Astellas Pharma, Inc. | 353,700 | 12,712 | ||||
| Canon, Inc. | 340,100 | 18,049 | ||||
| Credit Saison Co. Ltd. | 593,600 | 26,989 | ||||
| Daihatsu Motor Co. Ltd. | 782,000 | 7,463 | ||||
| Daikin Industries Ltd. | 350,000 | 9,154 | ||||
| E*TRADE Securities Co. Ltd. (d) | 3,361 | 17,668 | ||||
| FamilyMart Co. Ltd. | 281,200 | 8,402 | ||||
| Fullcast Co. Ltd. (d) | 1,334 | 3,443 | ||||
| Hokuto Corp. (d) | 144,400 | 2,343 | ||||
| Honda Motor Co. Ltd. | 200,100 | 11,130 | ||||
| Hoya Corp. | 111,400 | 3,917 | ||||
| Hoya Corp. New | 334,200 | 11,664 | ||||
| Ibiden Co. Ltd. | 269,900 | 10,939 | ||||
| JAFCO Co. Ltd. | 116,400 | 7,016 | ||||
| JGC Corp. | 400,000 | 6,551 | ||||
| JSR Corp. | 659,900 | 15,630 | ||||
| Kose Corp. | 165,200 | 5,994 | ||||
| Koyo Seiko Co. Ltd. | 659,000 | 10,604 | ||||
| Matsushita Electric Industrial Co. Ltd. | 1,492,000 | 27,453 | ||||
| Mitsubishi UFJ Financial Group, Inc. | 974 | 12,360 | ||||
| Mitsui & Co. Ltd. | 2,006,000 | 24,721 | ||||
| Mitsui Fudosan Co. Ltd. | 925,000 | 15,180 | ||||
| Mitsui Trust Holdings, Inc. | 1,921,000 | 23,191 | ||||
| Mizuho Financial Group, Inc. | 4,023 | 26,896 | ||||
| Nidec Corp. | 37,100 | 2,182 | ||||
| Nidec Corp. New | 37,100 | 2,182 | ||||
| Nikko Cordial Corp. | 1,732,500 | 21,005 | ||||
| Nippon Electric Glass Co. Ltd. | 923,000 | 17,705 | ||||
| Nippon Oil Corp. | 1,544,000 | 13,144 | ||||
| Nippon Steel Corp. | 1,972,000 | 7,053 | ||||
| Nishi-Nippon City Bank Ltd. (a) | 1,065,000 | 6,216 | ||||
| Nishimatsuya Chain Co. Ltd. | 70,900 | 2,702 | ||||
| Nitto Denko Corp. | 330,300 | 20,052 | ||||
| Nomura Holdings, Inc. | 557,600 | 8,637 | ||||
| Okumura Holdings, Inc. | 1,568,000 | 9,845 | ||||
| OMC Card, Inc. | 738,000 | 12,418 | ||||
| ORIX Corp. | 140,900 | 26,442 | ||||
| Saint Marc Co. Ltd. | 83,900 | 4,251 | ||||
| Sega Sammy Holdings, Inc. | 359,800 | 12,962 | ||||
| Sega Sammy Holdings, Inc. New | 359,800 | 13,056 | ||||
See accompanying notes which are an integral part of the financial statements.
15 Annual Report
| Investments continued | ||||||
| Common Stocks continued | ||||||
| Shares | Value (Note 1) | |||||
| (000s) | ||||||
| Japan – continued | ||||||
| Seiyu Ltd. (a)(d) | 2,865,000 | $ | 5,880 | |||
| Seven & I Holdings Co. Ltd. (a) | 576,900 | 18,985 | ||||
| SFCG Co. Ltd. | 6,990 | 1,688 | ||||
| SHIMIZU Corp. | 2,038,000 | 13,819 | ||||
| Sompo Japan Insurance, Inc | 1,506,000 | 22,693 | ||||
| Sugi Pharmacy Co. Ltd. | 171,900 | 6,669 | ||||
| Sumitomo Electric Industries Ltd. | 1,487,000 | 19,600 | ||||
| Sumitomo Forestry Co. Ltd. | 448,000 | 4,155 | ||||
| Sumitomo Mitsui Financial Group, Inc. | 3,629 | 33,628 | ||||
| Sumitomo Rubber Industries Ltd. | 677,000 | 8,337 | ||||
| Sumitomo Titanium Corp. (d) | 36,000 | 4,178 | ||||
| Sumitomo Titanium Corp. New | 36,000 | 4,053 | ||||
| T&D Holdings, Inc. | 311,000 | 19,634 | ||||
| Takeda Pharamaceutical Co. Ltd. | 196,000 | 10,795 | ||||
| The Daimaru, Inc. | 316,000 | 3,864 | ||||
| The Sumitomo Warehouse Co. Ltd. (d) | 338,000 | 2,629 | ||||
| THK Co. Ltd. | 387,900 | 8,768 | ||||
| TIS, Inc. | 92,600 | 2,189 | ||||
| Toho Titanium Co. Ltd. | 112,000 | 7,517 | ||||
| Tokuyama Corp. | 1,846,000 | 18,385 | ||||
| Tokyo Electron Ltd. | 195,600 | 9,842 | ||||
| Tokyo Star Bank Ltd. (a) | 296 | 1,041 | ||||
| Tokyo Tomin Bank Ltd. | 284,400 | 10,468 | ||||
| Toyo Ink Manufacturing Co. Ltd. | 829,000 | 3,568 | ||||
| Toyota Motor Corp. | 1,213,800 | 56,326 | ||||
| UCS Co. Ltd. | 1,000 | 38 | ||||
| Urban Corp. (d) | 237,200 | 14,749 | ||||
| USS Co. Ltd. | 82,540 | 5,690 | ||||
| Valor Co. Ltd. | 24,000 | 727 | ||||
| Yahoo! Japan Corp | 3,840 | 4,090 | ||||
| Yahoo! Japan Corp. New | 3,840 | 4,157 | ||||
| Yamada Denki Co. Ltd. | 70,200 | 6,183 | ||||
| TOTAL JAPAN | 861,545 | |||||
| Korea (South) 1.6% | ||||||
| Hyundai Department Store Co. Ltd. | 65,420 | 4,343 | ||||
| Hyundai Mobis | 69,770 | 5,547 | ||||
| LG Household & Health Care Ltd. | 177,780 | 9,706 | ||||
| NHN Corp. (a) | 57,857 | 9,615 | ||||
| Samsung Electronics Co. Ltd. | 18,972 | 10,031 | ||||
See accompanying notes which are an integral part of the financial statements.
| Annual Report |
| 16 |
| Common Stocks continued | ||||||
| Shares | Value (Note 1) | |||||
| (000s) | ||||||
| Korea (South) – continued | ||||||
| Shinhan Financial Group Co. Ltd. | 588,780 | $ | 19,626 | |||
| Shinsegae Co. Ltd. | 15,900 | 5,696 | ||||
| TOTAL KOREA (SOUTH) | 64,564 | |||||
| Luxembourg 0.6% | ||||||
| SES Global unit | 1,048,962 | 16,410 | ||||
| Stolt-Nielsen SA Class B sponsored ADR | 195,300 | 7,005 | ||||
| TOTAL LUXEMBOURG | 23,415 | |||||
| Mexico – 0.1% | ||||||
| Urbi, Desarrollos Urbanos, SA de CV (a) | 604,900 | 3,870 | ||||
| Netherlands – 3.0% | ||||||
| ASML Holding NV (NY Shares) (a) | 928,800 | 15,771 | ||||
| Axalto Holding NV (a) | 180,900 | 4,925 | ||||
| EADS NV (d) | 369,500 | 12,801 | ||||
| ING Groep NV (Certificaten Van Aandelen) | 588,444 | 16,982 | ||||
| Koninklijke Numico NV (a) | 229,000 | 9,273 | ||||
| Koninklijke Wessanen NV | 571,800 | 8,397 | ||||
| Randstad Holdings NV | 198,700 | 7,608 | ||||
| Tele Atlas NV (a) | 132,400 | 3,682 | ||||
| Unilever NV (NY Shares) | 405,900 | 28,539 | ||||
| VNU NV | 388,575 | 12,358 | ||||
| TOTAL NETHERLANDS | 120,336 | |||||
| Norway 1.5% | ||||||
| DnB NOR ASA | 1,648,600 | 16,851 | ||||
| Schibsted ASA (B Shares) | 321,200 | 9,257 | ||||
| TANDBERG ASA (d) | 585,300 | 5,758 | ||||
| TANDBERG Television ASA (a) | 833,500 | 10,377 | ||||
| Telenor ASA | 1,501,000 | 14,650 | ||||
| Yara International ASA | 291,600 | 4,807 | ||||
| TOTAL NORWAY | 61,700 | |||||
| Poland – 0.2% | ||||||
| TVN SA | 487,049 | 8,309 | ||||
| Portugal 0.2% | ||||||
| Media Capital SGPS SA (a) | 1,046,093 | 8,402 | ||||
| Russia – 0.2% | ||||||
| Mobile TeleSystems OJSC sponsored ADR | 146,700 | 5,426 | ||||
| Novatek JSC GDR (a)(e) | 66,900 | 1,504 | ||||
| TOTAL RUSSIA | 6,930 | |||||
See accompanying notes which are an integral part of the financial statements.
17 Annual Report
| Investments continued | ||||||
| Common Stocks continued | ||||||
| Shares | Value (Note 1) | |||||
| (000s) | ||||||
| Singapore – 0.5% | ||||||
| Ascendas Real Estate Investment Trust (A REIT) | 4,630,000 | $ | 5,494 | |||
| HTL International Holdings Ltd. | 5,750,000 | 4,277 | ||||
| Keppel Corp. Ltd. | 1,166,000 | 7,985 | ||||
| STATS ChipPAC Ltd. (a) | 4,624,000 | 2,539 | ||||
| TOTAL SINGAPORE | 20,295 | |||||
| South Africa 1.1% | ||||||
| FirstRand Ltd. | 3,829,000 | 9,010 | ||||
| JD Group Ltd. | 832,000 | 8,897 | ||||
| MTN Group Ltd. | 1,019,800 | 7,599 | ||||
| Nedbank Group Ltd | 404,000 | 5,148 | ||||
| Standard Bank Group Ltd. | 522,700 | 5,391 | ||||
| Steinhoff International Holdings Ltd. | 3,205,100 | 8,388 | ||||
| TOTAL SOUTH AFRICA | 44,433 | |||||
| Spain – 2.5% | ||||||
| Altadis SA (Spain) | 595,900 | 25,287 | ||||
| Antena 3 Television SA | 554,756 | 10,787 | ||||
| Banco Bilbao Vizcaya Argentaria SA | 904,800 | 15,952 | ||||
| Banco Santander Central Hispano SA | 1,324,300 | 16,805 | ||||
| Gestevision Telecinco SA | 76,300 | 1,693 | ||||
| Telefonica SA sponsored ADR | 610,279 | 29,263 | ||||
| TOTAL SPAIN | 99,787 | |||||
| Sweden – 1.4% | ||||||
| Eniro AB (d) | 1,035,700 | 11,318 | ||||
| Gambro AB (A Shares) | 549,550 | 7,765 | ||||
| Hennes & Mauritz AB (H&M) (B Shares) | 456,450 | 14,820 | ||||
| Modern Times Group AB (MTG) (B Shares) (a) | 160,900 | 6,154 | ||||
| Skandia Foersaekrings AB | 836,080 | 4,169 | ||||
| Telefonaktiebolaget LM Ericsson (B Shares) sponsored ADR | 366,300 | 12,018 | ||||
| TOTAL SWEDEN | 56,244 | |||||
| Switzerland – 8.8% | ||||||
| ABB Ltd. sponsored ADR (a) | 2,803,300 | 21,838 | ||||
| Actelion Ltd. (Reg.) (a) | 61,976 | 6,971 | ||||
| Compagnie Financiere Richemont unit | 499,334 | 18,999 | ||||
| Credit Suisse Group (Reg.) | 511,224 | 22,652 | ||||
| Logitech International SA (Reg.) (a) | 246,526 | 9,342 | ||||
| Nestle SA (Reg.) | 165,409 | 49,270 | ||||
| Nobel Biocare Holding AG (Switzerland) | 72,217 | 16,652 | ||||
| Novartis AG (Reg.) | 1,339,631 | 72,099 | ||||
See accompanying notes which are an integral part of the financial statements.
| Annual Report |
| 18 |
| Common Stocks continued | ||||||
| Shares | Value (Note 1) | |||||
| (000s) | ||||||
| Switzerland – continued | ||||||
| Pargesa Holding SA | 116,000 | $ | 8,953 | |||
| Phonak Holding AG | 213,528 | 8,903 | ||||
| Roche Holding AG (participation certificate) | 465,762 | 69,585 | ||||
| Societe Generale de Surveillance Holding SA (SGS) (Reg.) | 10,415 | 7,675 | ||||
| Syngenta AG (Switzerland) | 77,508 | 8,309 | ||||
| The Swatch Group AG (Reg.) | 311,573 | 8,858 | ||||
| UBS AG (NY Shares) | 243,750 | 20,882 | ||||
| TOTAL SWITZERLAND | 350,988 | |||||
| Taiwan 0.6% | ||||||
| Acer, Inc. | 3,086,440 | 6,246 | ||||
| Advanced Semiconductor Engineering, Inc. | 12,166,455 | 7,416 | ||||
| Holtek Semiconductor, Inc. | 2,780,371 | 3,282 | ||||
| Hon Hai Precision Industry Co. Ltd. (Foxconn) | 1,259,742 | 5,444 | ||||
| TOTAL TAIWAN | 22,388 | |||||
| Turkey 0.3% | ||||||
| Tupras Turkiye Petrol Rafinerileri AS | 815,000 | 13,930 | ||||
| United Arab Emirates – 0.4% | ||||||
| Investcom LLC GDR | 1,153,900 | 15,589 | ||||
| United Kingdom – 17.8% | ||||||
| Anglo American PLC (United Kingdom) | 627,100 | 18,541 | ||||
| AstraZeneca PLC sponsored ADR | 266,300 | 11,957 | ||||
| BAE Systems PLC | 4,750,009 | 27,794 | ||||
| Benfield Group PLC | 723,300 | 4,098 | ||||
| BG Group PLC | 1,368,000 | 12,013 | ||||
| BG Group PLC sponsored ADR | 200,000 | 8,904 | ||||
| Big Yellow Group PLC | 1,078,700 | 4,583 | ||||
| Body Shop International PLC | 694,700 | 2,583 | ||||
| BP PLC sponsored ADR | 1,241,500 | 82,433 | ||||
| British American Tobacco PLC sponsored ADR | 375,000 | 16,526 | ||||
| British Land Co. PLC | 627,900 | 9,894 | ||||
| Cadbury Schweppes PLC sponsored ADR | 183,000 | 7,263 | ||||
| Capita Group PLC | 1,106,900 | 7,643 | ||||
| Carnival PLC | 212,200 | 10,780 | ||||
| CLS Holdings PLC (a) | 623,893 | 5,056 | ||||
| Diageo PLC sponsored ADR (d) | 319,100 | 18,964 | ||||
| Enterprise Inns PLC | 505,225 | 6,972 | ||||
| GlaxoSmithKline PLC sponsored ADR | 1,177,000 | 61,192 | ||||
| Hilton Group PLC | 1,670,000 | 10,030 | ||||
See accompanying notes which are an integral part of the financial statements.
19 Annual Report
| Investments continued | ||||||
| Common Stocks continued | ||||||
| Shares | Value (Note 1) | |||||
| (000s) | ||||||
| United Kingdom – continued | ||||||
| HSBC Holdings PLC: | ||||||
| (Hong Kong) (Reg.) | 2,859,677 | $ | 45,046 | |||
| (United Kingdom) (Reg.) | 700,000 | 11,026 | ||||
| Imperial Tobacco Group PLC sponsored ADR | 175,100 | 10,107 | ||||
| Inchcape PLC | 274,800 | 10,022 | ||||
| Informa PLC | 1,379,400 | 9,140 | ||||
| Kazakhmys PLC | 392,800 | 3,755 | ||||
| Man Group PLC | 228,400 | 6,227 | ||||
| NDS Group PLC sponsored ADR (a) | 83,800 | 3,067 | ||||
| Prudential PLC | 1,400,482 | 11,753 | ||||
| Reckitt Benckiser PLC | 221,900 | 6,706 | ||||
| Reuters Group PLC sponsored ADR | 315,700 | 12,003 | ||||
| RHM PLC | 545,700 | 2,502 | ||||
| Rio Tinto PLC sponsored ADR | 119,100 | 18,177 | ||||
| Rolls Royce Group PLC | 1,870,810 | 12,089 | ||||
| Royal Bank of Scotland Group PLC | 707,171 | 19,581 | ||||
| Royal Dutch Shell PLC Class B | 1,861,659 | 60,886 | ||||
| SIG PLC | 536,100 | 6,454 | ||||
| Smiths Group PLC | 881,900 | 14,247 | ||||
| Standard Chartered PLC (United Kingdom) | 5,218 | 110 | ||||
| Tesco PLC | 2,887,000 | 15,372 | ||||
| Virgin Mobile Holdings (UK) PLC | 2,275,000 | 12,083 | ||||
| Vodafone Group PLC | 24,328,312 | 63,886 | ||||
| Whatman PLC | 735,900 | 3,648 | ||||
| William Hill PLC | 1,104,700 | 10,454 | ||||
| Yell Group PLC | 1,122,600 | 8,795 | ||||
| TOTAL UNITED KINGDOM | 704,362 | |||||
| United States of America – 0.4% | ||||||
| Macquarie Infrastructure Co. Trust | 131,000 | 3,930 | ||||
| Synthes, Inc. | 96,588 | 10,227 | ||||
| TOTAL UNITED STATES OF AMERICA | 14,157 | |||||
| TOTAL COMMON STOCKS | ||||||
| (Cost $3,254,009) | 3,835,794 | |||||
See accompanying notes which are an integral part of the financial statements.
| Annual Report |
| 20 |
| Nonconvertible Preferred Stocks 1.4% | ||||||||||
| Shares | Value (Note 1) | |||||||||
| (000s) | ||||||||||
| Germany – 0.7% | ||||||||||
| Fresenius AG | 91,800 | $ | 12,897 | |||||||
| Porsche AG (non-vtg.) | 20,595 | 14,850 | ||||||||
| TOTAL GERMANY | 27,747 | |||||||||
| Italy 0.7% | ||||||||||
| Banca Intesa Spa (Risp) | 4,403,802 | 19,073 | ||||||||
| Telecom Italia Spa (Risp) | 2,851,985 | 6,896 | ||||||||
| TOTAL ITALY | 25,969 | |||||||||
| United Kingdom – 0.0% | ||||||||||
| Rolls Royce Group PLC Series B | 62,485,054 | 112 | ||||||||
| TOTAL NONCONVERTIBLE PREFERRED STOCKS | ||||||||||
| (Cost $43,252) | 53,828 | |||||||||
| Government Obligations 0.1% | ||||||||||
| Principal | ||||||||||
| Amount (000s) | ||||||||||
| United States of America – 0.1% | ||||||||||
| U.S. Treasury Bills, yield at date of purchase 3.4% to | ||||||||||
| 3.7% 11/10/05 to 1/12/06 (f) | ||||||||||
| (Cost $3,537) | $ | 3,550 | 3,537 | |||||||
| Money Market Funds 3.8% | ||||||||||
| Shares | ||||||||||
| Fidelity Cash Central Fund, 3.92% (b) | 87,790,364 | 87,790 | ||||||||
| Fidelity Securities Lending Cash Central Fund, | ||||||||||
| 3.94% (b)(c) | 61,922,662 | 61,923 | ||||||||
| TOTAL MONEY MARKET FUNDS | ||||||||||
| (Cost $149,713) | 149,713 | |||||||||
| TOTAL INVESTMENT PORTFOLIO 102.0% | ||||||||||
| (Cost $3,450,511) | 4,042,872 | |||||||||
| NET OTHER ASSETS – (2.0)% | (78,121) | |||||||||
| NET ASSETS 100% | $ | 3,964,751 | ||||||||
See accompanying notes which are an integral part of the financial statements.
21 Annual Report
| Investments continued | ||||||||
| Futures Contracts | ||||||||
| Expiration | Underlying | Unrealized | ||||||
| Date | Face Amount | Appreciation/ | ||||||
| at Value (000s) | (Depreciation) | |||||||
| (000s) | ||||||||
| Purchased | ||||||||
| Equity Index Contracts | ||||||||
| 734 Nikkei 225 Index Contracts (Japan) | Dec. 2005 | $ 50,224 | $ | 3,471 | ||||
The face value of futures purchased as a percentage of net assets – 1.3%
| Legend (a) Non-income producing (b) Affiliated fund that is available only to investment companies and other accounts managed by Fidelity Investments. The rate quoted is the annualized seven-day yield of the fund at period end. A complete unaudited listing of the fund’s holdings as of its most recent quarter end is available upon request. (c) Investment made with cash collateral received from securities on loan. (d) Security or a portion of the security is on loan at period end. (e) Security exempt from registration under Rule 144A of the Securities Act of 1933 These securities may be resold in transactions exempt from registration, normally to qualified institutional buyers At the period end, the value of these securities amounted to $1,504,000 or 0.0% of net assets. (f) Security or a portion of the security was pledged to cover margin requirements for futures contracts. At the period end, the value of securities pledged amounted to $3,537,000. |
See accompanying notes which are an integral part of the financial statements.
Annual Report 22
| Financial Statements | ||||||||
| Statement of Assets and Liabilities | ||||||||
| Amounts in thousands (except per share amounts) | October 31, 2005 | |||||||
| Assets | ||||||||
| Investment in securities, at value (including securities | ||||||||
| loaned of $59,194) (cost $3,450,511) See | ||||||||
| accompanying schedule | $ | 4,042,872 | ||||||
| Foreign currency held at value (cost $5,466) | 5,473 | |||||||
| Receivable for investments sold | 63,155 | |||||||
| Receivable for fund shares sold | 11,994 | |||||||
| Dividends receivable | 4,355 | |||||||
| Interest receivable | 303 | |||||||
| Receivable for daily variation on futures contracts | 918 | |||||||
| Other affiliated receivables | 1 | |||||||
| Other receivables | 396 | |||||||
| Total assets | 4,129,467 | |||||||
| Liabilities | ||||||||
| Payable for investments purchased | $ | 96,287 | ||||||
| Payable for fund shares redeemed | 2,333 | |||||||
| Accrued management fee | 2,590 | |||||||
| Distribution fees payable | 3 | |||||||
| Other affiliated payables | 875 | |||||||
| Other payables and accrued expenses | 705 | |||||||
| Collateral on securities loaned, at value | 61,923 | |||||||
| Total liabilities | 164,716 | |||||||
| Net Assets | $ | 3,964,751 | ||||||
| Net Assets consist of: | ||||||||
| Paid in capital | $ | 3,137,488 | ||||||
| Undistributed net investment income | 40,185 | |||||||
| Accumulated undistributed net realized gain (loss) on | ||||||||
| investments and foreign currency transactions | 191,747 | |||||||
| Net unrealized appreciation (depreciation) on | ||||||||
| investments and assets and liabilities in foreign | ||||||||
| currencies | 595,331 | |||||||
| Net Assets | $ | 3,964,751 | ||||||
See accompanying notes which are an integral part of the financial statements.
23 Annual Report
| Financial Statements continued | ||||
| Statement of Assets and Liabilities | ||||
| Amounts in thousands (except per share amounts) | October 31, 2005 | |||
| Calculation of Maximum Offering Price | ||||
| Class A: | ||||
| Net Asset Value and redemption price per share | ||||
| ($1,864 ÷ 60.98 shares) | $ | 30.57 | ||
| Maximum offering price per share (100/94.25 of | ||||
| $30.57) | $ | 32.44 | ||
| Class T: | ||||
| Net Asset Value and redemption price per share | ||||
| ($1,859 ÷ 60.961 shares) | $ | 30.49 | ||
| Maximum offering price per share (100/96.50 of | ||||
| $30.49) | $ | 31.60 | ||
| Class B: | ||||
| Net Asset Value and offering price per share | ||||
| ($750 ÷ 24.7 shares)A | $ | 30.36 | ||
| Class C: | ||||
| Net Asset Value and offering price per share | ||||
| ($1,926 ÷ 63.34 shares)A | $ | 30.41 | ||
| International Discovery Fund: | ||||
| Net Asset Value and offering price per share | ||||
| ($3,948,625 ÷ 128,826 shares)A | $ | 30.65 | ||
| Institutional Class: | ||||
| Net Asset Value, offering price and redemption | ||||
| price per share ($9,727 ÷ 317 shares) | $ | 30.68 | ||
| A Redemption price per share is equal to net asset value less any applicable contingent deferred sales charge. | ||||
See accompanying notes which are an integral part of the financial statements.
Annual Report 24
| Statement of Operations | ||||||
| Amounts in thousands | Year ended October 31, 2005 | |||||
| Investment Income | ||||||
| Dividends | $ | 75,520 | ||||
| Interest | 2,236 | |||||
| Security lending | 3,003 | |||||
| 80,759 | ||||||
| Less foreign taxes withheld | (7,662) | |||||
| Total income | 73,097 | |||||
| Expenses | ||||||
| Management fee | ||||||
| Basic fee | $ | 22,337 | ||||
| Performance adjustment | 497 | |||||
| Transfer agent fees | 7,458 | |||||
| Distribution fees | 18 | |||||
| Accounting and security lending fees | 1,279 | |||||
| Independent trustees’ compensation | 14 | |||||
| Custodian fees and expenses | 1,218 | |||||
| Registration fees | 376 | |||||
| Audit | 106 | |||||
| Legal | 15 | |||||
| Interest | 1 | |||||
| Miscellaneous | 30 | |||||
| Total expenses before reductions | 33,349 | |||||
| Expense reductions | (2,029) | 31,320 | ||||
| Net investment income (loss) | 41,777 | |||||
| Realized and Unrealized Gain (Loss) | ||||||
| Net realized gain (loss) on: | ||||||
| Investment securities (net of foreign taxes of $1,279) . | 191,163 | |||||
| Foreign currency transactions | (720) | |||||
| Futures contracts | 3,731 | |||||
| Total net realized gain (loss) | 194,174 | |||||
| Change in net unrealized appreciation (depreciation) on: | ||||||
| Investment securities (net of decrease in deferred for- | ||||||
| eign taxes of $374) | 320,747 | |||||
| Assets and liabilities in foreign currencies | (602) | |||||
| Futures contracts | 4,699 | |||||
| Total change in net unrealized appreciation | ||||||
| (depreciation) | 324,844 | |||||
| Net gain (loss) | 519,018 | |||||
| Net increase (decrease) in net assets resulting from | ||||||
| operations | $ | 560,795 | ||||
See accompanying notes which are an integral part of the financial statements.
25 Annual Report
| Financial Statements continued | ||||||||
| Statement of Changes in Net Assets | ||||||||
| Year ended | Year ended | |||||||
| October 31, | October 31, | |||||||
| Amounts in thousands | 2005 | 2004 | ||||||
| Increase (Decrease) in Net Assets | ||||||||
| Operations | ||||||||
| Net investment income (loss) | $ | 41,777 | $ | 16,421 | ||||
| Net realized gain (loss) | 194,174 | 91,216 | ||||||
| Change in net unrealized appreciation (depreciation) . | 324,844 | 127,395 | ||||||
| Net increase (decrease) in net assets resulting | ||||||||
| from operations | 560,795 | 235,032 | ||||||
| Distributions to shareholders from net investment income . | (12,813) | (10,818) | ||||||
| Distributions to shareholders from net realized gain | (10,250) | — | ||||||
| Total distributions | (23,063) | (10,818) | ||||||
| Share transactions - net increase (decrease) | 1,234,164 | 725,354 | ||||||
| Redemption fees | 193 | 227 | ||||||
| Total increase (decrease) in net assets | 1,772,089 | 949,795 | ||||||
| Net Assets | ||||||||
| Beginning of period | 2,192,662 | 1,242,867 | ||||||
| End of period (including undistributed net investment | ||||||||
| income of $40,185 and undistributed net investment | ||||||||
| income of $15,147, respectively) | $ | 3,964,751 | $ | 2,192,662 | ||||
See accompanying notes which are an integral part of the financial statements.
| Annual Report |
| 26 |
| Financial Highlights Class A | ||||
| Year ended October 31, | 2005F | |||
| Selected Per Share Data | ||||
| Net asset value, beginning of period | $ | 27.41 | ||
| Income from Investment Operations | ||||
| Net investment income (loss)E | 28 | |||
| Net realized and unrealized gain (loss) | 2.88 | |||
| Total from investment operations | 3.16 | |||
| Redemption fees added to paid in capitalE | —H | |||
| Net asset value, end of period | $ | 30.57 | ||
| Total ReturnB,C,D | 11.53% | |||
| Ratios to Average Net AssetsG | ||||
| Expenses before expense reductions | 1.42%A | |||
| Expenses net of voluntary waivers, if any | 1.42%A | |||
| Expenses net of all reductions | 1.36%A | |||
| Net investment income (loss) | 1.15%A | |||
| Supplemental Data | ||||
| Net assets, end of period (000 omitted) | $ | 1,864 | ||
| Portfolio turnover rate | 75% |
| A Annualized B Total returns for periods of less than one year are not annualized. C Total returns would have been lower had certain expenses not been reduced during the periods shown. D Total returns do not include the effect of the sales charges. E Calculated based on average shares outstanding during the period. F For the period January 6, 2005 (commencement of sale of shares) to October 31, 2005. G Expense ratios reflect operating expenses of the class. Expenses before reductions do not reflect amounts reimbursed by the investment adviser or reductions from brokerage service arrangements or other expense offset arrangements and do not represent the amount paid by the class during periods when reimbursements or reductions occur. Expense ratios before reductions for start up periods may not be representative of longer term operating periods. Expenses net of any voluntary waivers reflect expenses after reimbursement by the investment adviser but prior to reductions from brokerage service arrangements or other expense offset arrangements. Expenses net of all reductions represent the net expenses paid by the class. H Amount represents less than $.01 per share. |
See accompanying notes which are an integral part of the financial statements.
27 Annual Report
| Financial Highlights Class T | ||||
| Year ended October 31, | 2005F | |||
| Selected Per Share Data | ||||
| Net asset value, beginning of period | $ | 27.41 | ||
| Income from Investment Operations | ||||
| Net investment income (loss)E | 20 | |||
| Net realized and unrealized gain (loss) | 2.88 | |||
| Total from investment operations | 3.08 | |||
| Redemption fees added to paid in capitalE | —H | |||
| Net asset value, end of period | $ | 30.49 | ||
| Total ReturnB,C,D | 11.24% | |||
| Ratios to Average Net AssetsG | ||||
| Expenses before expense reductions | 1.75%A | |||
| Expenses net of voluntary waivers, if any | 1.75%A | |||
| Expenses net of all reductions | 1.69%A | |||
| Net investment income (loss) | 83%A | |||
| Supplemental Data | ||||
| Net assets, end of period (000 omitted) | $ | 1,859 | ||
| Portfolio turnover rate | 75% |
| A Annualized B Total returns for periods of less than one year are not annualized. C Total returns would have been lower had certain expenses not been reduced during the periods shown. D Total returns do not include the effect of the sales charges. E Calculated based on average shares outstanding during the period. F For the period January 6, 2005 (commencement of sale of shares) to October 31, 2005. G Expense ratios reflect operating expenses of the class. Expenses before reductions do not reflect amounts reimbursed by the investment adviser or reductions from brokerage service arrangements or other expense offset arrangements and do not represent the amount paid by the class during periods when reimbursements or reductions occur. Expense ratios before reductions for start up periods may not be representative of longer term operating periods. Expenses net of any voluntary waivers reflect expenses after reimbursement by the investment adviser but prior to reductions from brokerage service arrangements or other expense offset arrangements. Expenses net of all reductions represent the net expenses paid by the class. H Amount represents less than $.01 per share. |
See accompanying notes which are an integral part of the financial statements.
| Annual Report |
| 28 |
| Financial Highlights Class B | ||||
| Year ended October 31, | 2005F | |||
| Selected Per Share Data | ||||
| Net asset value, beginning of period | $ | 27.41 | ||
| Income from Investment Operations | ||||
| Net investment income (loss)E | 08 | |||
| Net realized and unrealized gain (loss) | 2.87 | |||
| Total from investment operations | 2.95 | |||
| Redemption fees added to paid in capitalE | —H | |||
| Net asset value, end of period | $ | 30.36 | ||
| Total ReturnB,C,D | 10.76% | |||
| Ratios to Average Net AssetsG | ||||
| Expenses before expense reductions | 2.24%A | |||
| Expenses net of voluntary waivers, if any | 2.24%A | |||
| Expenses net of all reductions | 2.18%A | |||
| Net investment income (loss) | 33%A | |||
| Supplemental Data | ||||
| Net assets, end of period (000 omitted) | $ | 750 | ||
| Portfolio turnover rate | 75% |
| A Annualized B Total returns for periods of less than one year are not annualized. C Total returns would have been lower had certain expenses not been reduced during the periods shown. D Total returns do not include the effect of the contingent deferred sales charge. E Calculated based on average shares outstanding during the period. F For the period January 6, 2005 (commencement of sale of shares) to October 31, 2005. G Expense ratios reflect operating expenses of the class. Expenses before reductions do not reflect amounts reimbursed by the investment adviser or reductions from brokerage service arrangements or other expense offset arrangements and do not represent the amount paid by the class during periods when reimbursements or reductions occur. Expense ratios before reductions for start up periods may not be representative of longer term operating periods. Expenses net of any voluntary waivers reflect expenses after reimbursement by the investment adviser but prior to reductions from brokerage service arrangements or other expense offset arrangements. Expenses net of all reductions represent the net expenses paid by the class. H Amount represents less than $.01 per share. |
See accompanying notes which are an integral part of the financial statements.
29 Annual Report
| Financial Highlights Class C | ||||
| Year ended October 31, | 2005F | |||
| Selected Per Share Data | ||||
| Net asset value, beginning of period | $ | 27.41 | ||
| Income from Investment Operations | ||||
| Net investment income (loss)E | 13 | |||
| Net realized and unrealized gain (loss) | 2.87 | |||
| Total from investment operations | 3.00 | |||
| Redemption fees added to paid in capitalE | —H | |||
| Net asset value, end of period | $ | 30.41 | ||
| Total ReturnB,C,D | 10.94% | |||
| Ratios to Average Net AssetsG | ||||
| Expenses before expense reductions | 2.04%A | |||
| Expenses net of voluntary waivers, if any | 2.04%A | |||
| Expenses net of all reductions | 1.98%A | |||
| Net investment income (loss) | 53%A | |||
| Supplemental Data | ||||
| Net assets, end of period (000 omitted) | $ | 1,926 | ||
| Portfolio turnover rate | 75% |
| A Annualized B Total returns for periods of less than one year are not annualized. C Total returns would have been lower had certain expenses not been reduced during the periods shown. D Total returns do not include the effect of the contingent deferred sales charge. E Calculated based on average shares outstanding during the period. F For the period January 6, 2005 (commencement of sale of shares) to October 31, 2005. G Expense ratios reflect operating expenses of the class. Expenses before reductions do not reflect amounts reimbursed by the investment adviser or reductions from brokerage service arrangements or other expense offset arrangements and do not represent the amount paid by the class during periods when reimbursements or reductions occur. Expense ratios before reductions for start up periods may not be representative of longer term operating periods. Expenses net of any voluntary waivers reflect expenses after reimbursement by the investment adviser but prior to reductions from brokerage service arrangements or other expense offset arrangements. Expenses net of all reductions represent the net expenses paid by the class. H Amount represents less than $.01 per share. |
See accompanying notes which are an integral part of the financial statements.
| Annual Report |
| 30 |
| Financial Highlights International Discovery Fund | ||||||||||||||
| Years ended October 31, | 2005 | 2004 | 2003 | 2002 | 2001 | |||||||||
| Selected Per Share Data | ||||||||||||||
| Net asset value, beginning of | ||||||||||||||
| period | $ 25.31 | $ 21.87 | $ 16.66 | $ | 17.61 | $ | 26.70 | |||||||
| Income from Investment | ||||||||||||||
| Operations | ||||||||||||||
| Net investment income (loss)C | 37 | .22 | .19 | .11 | .19D | |||||||||
| Net realized and unrealized | ||||||||||||||
| gain (loss) | 5.24 | 3.40 | 5.11 | (1.06) | (6.11) | |||||||||
| Total from investment operations . | 5.61 | 3.62 | 5.30 | (.95) | (5.92) | |||||||||
| Distributions from net investment | ||||||||||||||
| income | (.15) | (.18) | (.09) | — | (.51) | |||||||||
| Distributions from net realized | ||||||||||||||
| gain | (.12) | — | — | (2.66) | ||||||||||
| Total distributions | (.27) | (.18) | (.09) | (3.17) | ||||||||||
| Redemption fees added to paid in | ||||||||||||||
| capitalC,F | — | — | — | — | — | |||||||||
| Net asset value, end of period | $ 30.65 | $ 25.31 | $ 21.87 | $ | 16.66 | $ | 17.61 | |||||||
| Total ReturnA,B | 22.29% | 16.65% | 31.97% | (5.39)% | (24.91)% | |||||||||
| Ratios to Average Net AssetsE | ||||||||||||||
| Expenses before expense re- | ||||||||||||||
| ductions | 1.08% | 1.10% | 1.14% | 1.14% | 1.14% | |||||||||
| Expenses net of voluntary | ||||||||||||||
| waivers, if any | 1.07% | 1.10% | 1.14% | 1.14% | 1.14% | |||||||||
| Expenses net of all reductions . | 1.01% | 1.06% | 1.11% | 1.12% | 1.09% | |||||||||
| Net investment income (loss) | 1.35% | .92% | 1.08% | .59% | .91% | |||||||||
| Supplemental Data | ||||||||||||||
| Net assets, end of period (in | ||||||||||||||
| millions) | $ 3,949 | $ 2,193 | $ 1,243 | $ | 890 | $ | 882 | |||||||
| Portfolio turnover rate | 75% | 87% | 81% | 63% | 81% | |||||||||
| A Total returns would have been lower had certain expenses not been reduced during the periods shown. B Total returns do not include the effect of the contingent deferred sales charge. C Calculated based on average shares outstanding during the period. D Investment income per share reflects a special dividend which amounted to $.04 per share. E Expense ratios reflect operating expenses of the class. Expenses before reductions do not reflect amounts reimbursed by the investment adviser or reductions from brokerage service arrangements or other expense offset arrangements and do not represent the amount paid by the class during periods when reimbursements or reductions occur. Expenses net of any voluntary waivers reflect expenses after reimbursement by the investment adviser but prior to reductions from brokerage service arrangements or other expense offset arrangements. Expenses net of all reductions repre sent the net expenses paid by the class. F Amount represents less than $.01 per share. |
See accompanying notes which are an integral part of the financial statements.
31 Annual Report
| Financial Highlights Institutional Class | ||||
| Year ended October 31, | 2005E | |||
| Selected Per Share Data | ||||
| Net asset value, beginning of period | $ | 27.41 | ||
| Income from Investment Operations | ||||
| Net investment income (loss)D | 38 | |||
| Net realized and unrealized gain (loss) | 2.89 | |||
| Total from investment operations | 3.27 | |||
| Redemption fees added to paid in capitalD | —G | |||
| Net asset value, end of period | $ | 30.68 | ||
| Total ReturnB,C | 11.93% | |||
| Ratios to Average Net AssetsF | ||||
| Expenses before expense reductions | 97%A | |||
| Expenses net of voluntary waivers, if any | 97%A | |||
| Expenses net of all reductions | 90%A | |||
| Net investment income (loss) | 1.60%A | |||
| Supplemental Data | ||||
| Net assets, end of period (000 omitted) | $ | 9,727 | ||
| Portfolio turnover rate | 75% |
| A Annualized B Total returns for periods of less than one year are not annualized. C Total returns would have been lower had certain expenses not been reduced during the periods shown. D Calculated based on average shares outstanding during the period. E For the period January 6, 2005 (commencement of sale of shares) to October 31, 2005. F Expense ratios reflect operating expenses of the class. Expenses before reductions do not reflect amounts reimbursed by the investment adviser or reductions from brokerage service arrangements or other expense offset arrangements and do not represent the amount paid by the class during periods when reimbursements or reductions occur. Expense ratios before reductions for start up periods may not be representative of longer term operating periods. Expenses net of any voluntary waivers reflect expenses after reimbursement by the investment adviser but prior to reductions from brokerage service arrangements or other expense offset arrangements. Expenses net of all reductions represent the net expenses paid by the class. G Amount represents less than $.01 per share. |
See accompanying notes which are an integral part of the financial statements.
| Annual Report |
| 32 |
Notes to Financial Statements
| For the period ended October 31, 2005 |
1. Significant Accounting Policies.
Fidelity Advisor International Discovery Fund (the fund) is a fund of Fidelity Investment Trust (the trust) and is authorized to issue an unlimited number of shares. The trust is registered under the Investment Company Act of 1940, as amended (the 1940 Act), as an open end management investment company organized as a Massachusetts business trust.
The fund offers Class A, Class T, Class B, Class C, International Discovery Fund and Institutional Class shares, each of which has equal rights as to assets and voting privi leges. Each class has exclusive voting rights with respect to matters that affect that class. The fund commenced sale of Class A, Class T, Class B, Class C and Institutional Class shares on January 6, 2005. Class B shares will automatically convert to Class A shares after a holding period of seven years from the initial date of purchase. Investment income, realized and unrealized capital gains and losses, the common expenses of the fund, and certain fund level expense reductions, if any, are allocated on a pro rata basis to each class based on the relative net assets of each class to the total net assets of the fund. Each class differs with respect to transfer agent and distribution and service plan fees incurred. Certain expense reductions also differ by class.
The fund’s investments in emerging markets can be subject to social, economic, regula tory, and political uncertainties and can be extremely volatile.
The fund may invest in affiliated money market central funds (Money Market Central Funds), which are open end investment companies available to investment companies and other accounts managed by Fidelity Management & Research Company (FMR) and its affiliates. The financial statements have been prepared in conformity with accounting principles generally accepted in the United States of America, which require manage ment to make certain estimates and assumptions at the date of the financial statements. The following summarizes the significant accounting policies of the fund:
Security Valuation. Investments are valued and net asset value (NAV) per share is calculated (NAV calculation) as of the close of business of the New York Stock Exchange (NYSE), normally 4:00 p.m. Eastern time. Wherever possible, the fund uses independent pricing services approved by the Board of Trustees to value its investments.
Equity securities, including restricted securities, for which market quotations are readily available, are valued at the last reported sale price or official closing price as reported by an independent pricing service on the primary market or exchange on which they are traded. In the event there were no sales during the day or closing prices are not available, securities are valued at the last quoted bid price. Investments in open end mutual funds are valued at their closing net asset value each business day. Short term securities with remaining maturities of sixty days or less for which quotations are not readily available are valued at amortized cost, which approximates value.
33 Annual Report
Notes to Financial Statements continued
1. Significant Accounting Policies continued
Security Valuation continued
When current market prices or quotations are not readily available or do not accurately reflect fair value, valuations may be determined in accordance with procedures adopted by the Board of Trustees. For example, when developments occur between the close of a market and the close of the NYSE that may materially affect the value of some or all of the securities, or when trading in a security is halted, those securities may be fair valued. Factors used in the determination of fair value may include monitoring news to identify significant market or security specific events such as changes in the value of U.S. securi ties market, reviewing developments in foreign markets and evaluating the performance of ADRs, futures contracts and exchange traded funds. Because the fund’s utilization of fair value pricing depends on market activity, the frequency with which fair value pricing is used can not be predicted and may be utilized to a significant extent. The value of securities used for NAV calculation under fair value pricing may differ from published prices for the same securities.
Foreign Currency. The fund uses foreign currency contracts to facilitate transactions in foreign denominated securities. Losses from these transactions may arise from changes in the value of the foreign currency or if the counterparties do not perform under the contracts’ terms.
Foreign denominated assets, including investment securities, and liabilities are trans lated into U.S. dollars at the exchange rate at period end. Purchases and sales of invest ment securities, income and dividends received and expenses denominated in foreign currencies are translated into U.S. dollars at the exchange rate in effect on the transac tion date.
The effects of exchange rate fluctuations on investments are included with the net realized and unrealized gain (loss) on investment securities. Other foreign currency transactions resulting in realized and unrealized gain (loss) are disclosed separately. Investment Transactions and Income. Security transactions are accounted for as of trade date. Gains and losses on securities sold are determined on the basis of identified cost. Dividend income is recorded on the ex dividend date, except for certain dividends from foreign securities where the ex dividend date may have passed, which are recorded as soon as the fund is informed of the ex dividend date. Non cash dividends included in dividend income, if any, are recorded at the fair market value of the securities received. Interest income is accrued as earned. Interest income includes coupon interest and amortization of premium and accretion of discount on debt securities. Investment income is recorded net of foreign taxes withheld where recovery of such taxes is uncertain.
Expenses. Most expenses of the trust can be directly attributed to a fund. Expenses which cannot be directly attributed are apportioned among each fund in the trust.
| Annual Report |
| 34 |
1. Significant Accounting Policies continued
Income Tax Information and Distributions to Shareholders. Each year, the fund intends to qualify as a regulated investment company by distributing all of its taxable income and realized gains under Subchapter M of the Internal Revenue Code. As a result, no provision for income taxes is required in the accompanying financial statements. Foreign taxes are provided for based on the fund’s understanding of the tax rules and rates that exist in the foreign markets in which it invests.
Distributions are recorded on the ex dividend date. Income dividends and capital gain distributions are declared separately for each class. Income and capital gain distribu tions are determined in accordance with income tax regulations, which may differ from generally accepted accounting principles. In addition, the fund will claim a portion of the payment made to redeeming shareholders as a distribution for income tax purposes.
Capital accounts within the financial statements are adjusted for permanent book tax differences. These adjustments have no impact on net assets or the results of operations. Temporary book tax differences will reverse in a subsequent period.
Book tax differences are primarily due to futures transactions, foreign currency transac tions, certain foreign taxes, passive foreign investment companies (PFIC), and losses deferred due to wash sales.
The tax basis components of distributable earnings and the federal tax cost as of period end were as follows:
| Unrealized appreciation | $ | 630,155,482 | ||
| Unrealized depreciation | (52,455,112) | |||
| Net unrealized appreciation (depreciation) | 577,700,370 | |||
| Undistributed ordinary income | 100,259,702 | |||
| Undistributed long term capital gain | 124,878,582 | |||
| Cost for federal income tax purposes | $ | 3,465,171,161 | ||
The tax character of distributions paid was as follows:
| October 31, 2005 | October 31, 2004 | |||||||
| Ordinary Income | $ | 12,812,810 | $ | 10,817,689 | ||||
| Long term Capital Gains | 10,250,246 | — | ||||||
| Total | $ | 23,063,056 | $ | 10,817,689 | ||||
35 Annual Report
Notes to Financial Statements continued
1. Significant Accounting Policies continued
Short Term Trading (Redemption) Fees. Shares held in the fund less than 30 days are subject to a redemption fee equal to 1.00% of the proceeds of the redeemed shares. All redemption fees, including any estimated redemption fees paid by FMR, are retained by the fund and accounted for as an addition to paid in capital.
| 2. Operating Policies. |
Repurchase Agreements. FMR has received an Exemptive Order from the Securities and Exchange Commission (the SEC) which permits the fund and other affiliated entities of FMR to transfer uninvested cash balances into joint trading accounts which are then invested in repurchase agreements. The fund may also invest directly with institutions in repurchase agreements. Repurchase agreements are collateralized by government or non government securities. Collateral is held in segregated accounts with custodian banks and may be obtained in the event of a default of the counterparty. The fund monitors, on a daily basis, the value of the collateral to ensure it is at least equal to the principal amount of the repurchase agreement (including accrued interest). In the event of a default by the counterparty, realization of the collateral proceeds could be delayed, during which time the value of the collateral may decline.
Futures Contracts. The fund may use futures contracts to manage its exposure to the stock market. Buying futures tends to increase a fund’s exposure to the underlying instrument, while selling futures tends to decrease a fund’s exposure to the underlying instrument or hedge other fund investments. Futures contracts involve, to varying degrees, risk of loss in excess of any futures variation margin reflected in the Statement of Assets and Liabilities. The underlying face amount at value of any open futures contracts at period end is shown in the Schedule of Investments under the caption “Futures Contracts.” This amount reflects each contract’s exposure to the underlying instrument at period end. Losses may arise from changes in the value of the underlying instruments or if the counterparties do not perform under the contracts’ terms. Gains (losses) are realized upon the expiration or closing of the futures contracts. Futures contracts are valued at the settlement price established each day by the board of trade or exchange on which they are traded.
Restricted Securities. The fund may invest in securities that are subject to legal or contractual restrictions on resale. These securities generally may be resold in transac tions exempt from registration or to the public if the securities are registered. Disposal of these securities may involve time consuming negotiations and expense, and prompt sale at an acceptable price may be difficult. Information regarding restricted securities is included at the end of the fund’s Schedule of Investments.
| Annual Report |
| 36 |
3. Purchases and Sales of Investments.
Purchases and sales of securities, other than short term securities and U.S. government securities, aggregated $3,540,147,268 and $2,247,496,092, respectively.
4. Fees and Other Transactions with Affiliates.
Management Fee. FMR and its affiliates provide the fund with investment manage ment related services for which the fund pays a monthly management fee. The manage ment fee is the sum of an individual fund fee rate that is based on an annual rate of .45% of the fund’s average net assets and a group fee rate that averaged .27% during the period. The group fee rate is based upon the average net assets of all the mutual funds advised by FMR. The group fee rate decreases as assets under management increase and increases as assets under management decrease. In addition, the management fee is subject to a performance adjustment (up to a maximum of .20% of the fund’s average net assets over a 36 month performance period). The upward or downward adjustment to the management fee is based on the investment performance of the asset weighted return of all classes as compared to an appropriate benchmark index. The fund’s perfor mance adjustment took effect in September 2005. Subsequent months will be added until the performance period includes 36 months. For the period, the total annual management fee rate, including the performance adjustment, was .74% of the fund’s average net assets.
Distribution and Service Plan. In accordance with Rule 12b 1 of the 1940 Act, the fund has adopted separate Distribution and Service Plans for each class of shares. Certain classes pay Fidelity Distributors Corporation (FDC), an affiliate of FMR, separate Distribution and Service Fees, each of which is based on an annual percentage of each class’ average net assets. In addition, FDC may pay financial intermediaries for selling shares of the fund and providing shareholder support services. For the period, the Distribution and Service Fee rates and the total amounts paid to and retained by FDC were as follows:
| Distribution | Service | Paid to | Retained | |||||||||
| Fee | Fee | FDC | by FDC | |||||||||
| Class A | 0% | .25% | $ | 1,809 | $ | 198 | ||||||
| Class T | 25% | .25% | 3,154 | 386 | ||||||||
| Class B | 75% | .25% | 3,610 | 2,916 | ||||||||
| Class C | 75% | .25% | 9,858 | 8,621 | ||||||||
| $ | 18,431 | $ | 12,121 | |||||||||
37 Annual Report
| Notes to Financial Statements continued | ||
4. Fees and Other Transactions with Affiliates continued | ||
Sales Load. FDC receives a front end sales charge of up to 5.75% for selling Class A shares, and 3.50% for selling Class T shares, some of which is paid to financial intermedi aries for selling shares of the fund. FDC receives the proceeds of contingent deferred sales charges levied on Class A, Class T, Class B, and Class C redemptions. These charges depend on the holding period. The deferred sales charges range from 5% to 1% for Class B, 1% for Class C, and .25% for certain purchases of Class A and Class T shares.
| For the period, sales charge amounts retained by FDC were as follows: | ||||
| Retained | ||||
| by FDC | ||||
| Class A | $ | 8,161 | ||
| Class T | 1,288 | |||
| Class B* | 74 | |||
| Class C* | — | |||
| $ | 9,523 |
* When Class B and Class C shares are initially sold, FDC pays commissions from its own resources to financial intermediaries through which the sales are made.
Transfer Agent Fees. Fidelity Investments Institutional Operations Company, Inc. (FIIOC), an affiliate of FMR, is the transfer, dividend disbursing and shareholder servic ing agent for each class of the fund, except for International Discovery Fund. Fidelity Service Company, Inc. (FSC), an affiliate of FMR, is the transfer agent for International Discovery Fund shares. FIIOC and FSC receive account fees and asset based fees that vary according to the account size and type of account of the shareholders of the respec tive classes of the fund. FIIOC and FSC pay for typesetting, printing and mailing of shareholder reports, except proxy statements. For the period the total transfer agent fees paid by each class to FIIOC or FSC, were as follows:
| % of | ||||||
| Average | ||||||
| Amount | Net Assets | |||||
| Class A | $ | 2,481 | .34* | |||
| Class T | 2,696 | .42* | ||||
| Class B | 1,516 | .42* | ||||
| Class C | 2,159 | .22* | ||||
| International Discovery Fund | 7,441,106 | .24 | ||||
| Institutional Class | 8,521 | .14* | ||||
| $ | 7,458,479 | |||||
| * Annualized |
Accounting and Security Lending Fees. FSC maintains the fund’s accounting rec ords. The accounting fee is based on the level of average net assets for the month. Under a separate contract, FSC administers the security lending program. The security lending fee is based on the number and duration of lending transactions.
| Annual Report |
| 38 |
4. Fees and Other Transactions with Affiliates continued
Affiliated Central Funds. The fund may invest in Money Market Central Funds which seek preservation of capital and current income and are managed by Fidelity Invest ments Money Management, Inc. (FIMM), an affiliate of FMR.
The Money Market Central Funds do not pay a management fee. Income distributions earned by the fund are recorded as income in the accompanying financial statements and totaled $4,677,957, for the period.
Brokerage Commissions. The fund placed a portion of its portfolio transactions with brokerage firms which are affiliates of the investment adviser. The commissions paid to these affiliated firms were $338 for the period.
| 5. Committed Line of Credit. |
The fund participates with other funds managed by FMR in a $4.2 billion credit facility (the “line of credit”) to be utilized for temporary or emergency purposes to fund share holder redemptions or for other short term liquidity purposes. The fund has agreed to pay commitment fees on its pro rata portion of the line of credit. During the period, there were no borrowings on this line of credit.
| 6. Security Lending. |
The fund lends portfolio securities from time to time in order to earn additional income. The fund receives collateral (in the form of U.S. Treasury obligations, letters of credit and/or cash) against the loaned securities and maintains collateral in an amount not less than 100% of the market value of the loaned securities during the period of the loan. The market value of the loaned securities is determined at the close of business of the fund and any additional required collateral is delivered to the fund on the next business day. If the borrower defaults on its obligation to return the securities loaned because of insol vency or other reasons, a fund could experience delays and costs in recovering the securities loaned or in gaining access to the collateral. Cash collateral is invested in the Fidelity Securities Lending Cash Central Fund. The value of loaned securities and cash collateral at period end are disclosed on the fund’s Statement of Assets and Liabilities. Security lending income represents the income earned on investing cash collateral, less fees and expenses associated with the loan, plus any premium payments that may be received on the loan of certain types of securities.
39 Annual Report
| Notes to Financial Statements continued | ||
7. Bank Borrowings. | ||
The fund is permitted to have bank borrowings for temporary or emergency purposes to fund shareholder redemptions. The fund has established borrowing arrangements with certain banks. The interest rate on the borrowings is the bank’s base rate, as revised from time to time. The average daily loan balance during the period for which loans were outstanding amounted to $5,090,000. The weighted average interest rate was 3.13% . At period end, there were no bank borrowings outstanding.
| 8. Expense Reductions. |
FMR voluntarily agreed to reimburse a portion of Fidelity International Discovery Fund’s operating expenses. During this period, this reimbursement reduced the class expenses by $69,175.
FMR voluntarily agreed to reimburse each class to the extent annual operating expenses exceeded certain levels of average net assets as noted in the table below. Some expenses, for example interest expense, are excluded from this reimbursement.
| The following classes were in reimbursement during the period: | ||||||
| Expense | Reimbursement | |||||
| Limitations | from adviser | |||||
| Class T | 1.75% | $ | 35 | |||
Many of the brokers with whom FMR places trades on behalf of the fund provided services to the fund in addition to trade execution. These services included payments of certain expenses on behalf of the fund totaling $1,888,955 for the period. In addition, through arrangements with the fund’s custodian and each class’ transfer agent, credits realized as a result of uninvested cash balances were used to reduce the fund’s expenses. During the period, these credits reduced the fund’s custody expenses by $4,216. During the period, credits reduced each class’ transfer agent expense as noted in the table below.
| Transfer Agent | ||||
| expense reduction | ||||
| International Discovery Fund | $ | 66,176 | ||
| Institutional Class | 303 | |||
| $ | 66,479 | |||
| 9. Other. | ||||
The fund’s organizational documents provide former and current trustees and officers with a limited indemnification against liabilities arising in connection with the perfor mance of their duties to the fund. In the normal course of business, the fund may also enter into contracts that provide general indemnifications. The fund’s maximum expo sure under these arrangements is unknown as this would be dependent on future claims that may be made against the fund. The risk of material loss from such claims is considered remote.
| Annual Report |
| 40 |
| 10. Distributions to Shareholders. | ||||||||||||
| Distributions to shareholders of each class were as follows: | ||||||||||||
| Years ended October 31, | 2005 | 2004 | ||||||||||
| From net investment income | ||||||||||||
| International Discovery Fund | $ | 12,812,810 | $ | 10,817,689 | ||||||||
| From net realized gain | ||||||||||||
| International Discovery Fund | $ | 10,250,246 | $ | — | ||||||||
| 11. Share Transactions. | ||||||||||||
| Transactions for each class of shares were as follows: | ||||||||||||
| Shares | Dollars | |||||||||||
| Years ended October 31, | 2005A | 2004 | 2005A | 2004 | ||||||||
| Class A | ||||||||||||
| Shares sold | 62,020 | — | $ | 1,786,147 | $ | — | ||||||
| Shares redeemed | (1,044) | — | (30,450) | — | ||||||||
| Net increase (decrease) | 60,976 | — | $ | 1,755,697 | $ | — | ||||||
| Class T | ||||||||||||
| Shares sold | 62,995 | — | $ | 1,829,664 | $ | — | ||||||
| Shares redeemed | (2,034) | — | (58,410) | — | ||||||||
| Net increase (decrease) | 60,961 | — | $ | 1,771,254 | $ | — | ||||||
| Class B | ||||||||||||
| Shares sold | 26,549 | — | $ | 759,109 | $ | — | ||||||
| Shares redeemed | (1,863) | — | (53,496) | — | ||||||||
| Net increase (decrease) | 24,686 | — | $ | 705,613 | $ | — | ||||||
| Class C | ||||||||||||
| Shares sold | 63,361 | — | $ | 1,804,133 | $ | — | ||||||
| Shares redeemed | (17) | — | (530) | — | ||||||||
| Net increase (decrease) | 63,344 | — | $ | 1,803,603 | $ | — | ||||||
| International Discovery Fund | ||||||||||||
| Shares sold | 73,475,478 | 46,698,105 | $ 2,106,762,661 | $ | 1,135,826,685 | |||||||
| Reinvestment of | ||||||||||||
| distributions | 780,847 | 435,617 | 21,434,265 | 9,888,485 | ||||||||
| Shares redeemed | (32,072,087) | (17,322,166) | (909,132,021) | (420,361,799) | ||||||||
| Net increase (decrease) | 42,184,238 | 29,811,556 | $ 1,219,064,905 | $ | 725,353,371 | |||||||
| Institutional Class | ||||||||||||
| Shares sold | 364,765 | — | $ | 10,479,191 | $ | — | ||||||
| Shares redeemed | (47,766) | (1,415,764) | — | |||||||||
| Net increase (decrease) | 316,999 | — | $ | 9,063,427 | $ | — | ||||||
A Share transactions for Class A, T, B, C and Institutional Class are for the period January 6, 2005 (commencement of sale of shares) to October 31, 2005.
41 Annual Report
Report of Independent Registered Public Accounting Firm
To the Trustees of Fidelity Investment Trust and the Shareholders of Fidelity In ternational Discovery Fund:
In our opinion, the accompanying statement of assets and liabilities, including the sched ule of investments, and the related statements of operations and of changes in net assets and the financial highlights present fairly, in all material respects, the financial position of Fidelity International Discovery Fund (a fund of Fidelity Investment Trust) at October 31, 2005 and the results of its operations, the changes in its net assets and the financial highlights for the periods indicated, in conformity with accounting principles generally accepted in the United States of America. These financial statements and financial highlights (hereafter referred to as “financial statements”) are the responsibility of the Fidelity International Discovery Fund’s management; our responsibility is to express an opinion on these financial statements based on our audits. We conducted our audits of these financial statements in accordance with the standards of the Public Company Accounting Oversight Board (United States). Those standards require that we plan and perform the audit to obtain reasonable assurance about whether the financial statements are free of material misstatement. An audit includes examining, on a test basis, evidence supporting the amounts and disclosures in the financial statements, assessing the ac counting principles used and significant estimates made by management, and evaluating the overall financial statement presentation. We believe that our audits, which included confirmation of securities at October 31, 2005 by correspondence with the custodian and brokers, provide a reasonable basis for our opinion.
| /s/ PricewaterhouseCoopers LLP PricewaterhouseCoopers LLP Boston, Massachusetts December 13, 2005 |
| Annual Report |
| 42 |
Trustees and Officers
The Trustees, Members of the Advisory Board, and executive officers of the trust and fund, as applicable, are listed below. The Board of Trustees governs the fund and is responsible for protecting the interests of shareholders. The Trustees are experienced executives who meet periodically throughout the year to oversee the fund’s activities, review contractual arrangements with companies that provide services to the fund, and review the fund’s performance. Except for William O. McCoy, Stephen P. Jonas, and Kenneth L. Wolfe, each of the Trustees oversees 322 funds advised by FMR or an affiliate. Mr. McCoy oversees 324 funds advised by FMR or an affiliate. Mr. Jonas and Mr. Wolfe oversee 319 funds advised by FMR or an affiliate.
The Trustees hold office without limit in time except that (a) any Trustee may resign; (b) any Trustee may be removed by written instrument, signed by at least two thirds of the number of Trustees prior to such removal; (c) any Trustee who requests to be retired or who has become incapacitated by illness or injury may be retired by written instru ment signed by a majority of the other Trustees; and (d) any Trustee may be removed at any special meeting of shareholders by a two thirds vote of the outstanding voting securities of the trust. Each Trustee who is not an interested person (as defined in the 1940 Act) (Independent Trustee), shall retire not later than the last day of the calendar year in which his or her 72nd birthday occurs. The Independent Trustees may waive this mandatory retirement age policy with respect to individual Trustees. The executive officers and Advisory Board Members hold office without limit in time, except that any officer and Advisory Board Member may resign or may be removed by a vote of a majority of the Trustees at any regular meeting or any special meeting of the Trustees. Except as indicated, each individual has held the office shown or other offices in the same company for the past five years.
The fund’s Statement of Additional Information (SAI) includes more information about the Trustees. To request a free copy, call 1-800-544-8544.
| Interested Trustees*: |
Correspondence intended for each Trustee who is an interested person may be sent to Fidelity Investments, 82 Devonshire Street, Boston, Massachusetts 02109.
| Name, Age; Principal Occupation Edward C. Johnson 3d (75)** |
Year of Election or Appointment: 1984
Mr. Johnson is Chairman of the Board of Trustees. Mr. Johnson serves as Chief Executive Officer, Chairman, and a Director of FMR Corp.; a Di rector and Chairman of the Board and of the Executive Committee of FMR; Chairman and a Director of Fidelity Management & Research (Far East) Inc.; Chairman and a Director of Fidelity Investments Money Man agement, Inc.; and Chairman (2001 present) and a Director (2000 present) of FMR Co., Inc.
43 Annual Report
Trustees and Officers - continued
| Name, Age; Principal Occupation Abigail P. Johnson (43)** |
Year of Election or Appointment: 2001
Ms. Johnson serves as President of Fidelity Employer Services Company (FESCO) (2005 present). She is President and a Director of Fidelity In vestments Money Management, Inc. (2001 present), FMR Co., Inc. (2001 present), and a Director of FMR Corp. Previously, Ms. Johnson served as President and a Director of FMR (2001 2005), Senior Vice President of the Fidelity funds (2001 2005), and managed a number of Fidelity funds.
| Stephen P. Jonas (52) |
Year of Election or Appointment: 2005
Mr. Jonas is Senior Vice President of International Discovery
(2005 present). He also serves as Senior Vice President of other Fidelity funds (2005 present). Mr. Jonas is Executive Director of FMR
(2005 present). Previously, Mr. Jonas served as President of Fidelity En terprise Operations and Risk Services (2004 2005), Chief Administra tive Officer (2002 2004), and Chief Financial Officer of FMR Co. (1998 2000). Mr. Jonas has been with Fidelity Investments since 1987 and has held various financial and management positions including Chief Financial Officer of FMR. In addition, he serves on the Boards of Boston Ballet (2003 present) and Simmons College (2003 present).
| Robert L. Reynolds (53) |
Year of Election or Appointment: 2003
Mr. Reynolds is a Director (2003 present) and Chief Operating Officer (2002 present) of FMR Corp. He also serves on the Board at Fidelity Investments Canada, Ltd. (2000 present). Previously, Mr. Reynolds served as President of Fidelity Investments Institutional Retirement Group (1996 2000).
* Trustees have been determined to be “Interested Trustees” by virtue of, among other things, their affiliation with the trust or various entities under common control with FMR.
** Edward C. Johnson 3d, Trustee, is Abigail P. Johnson’s father.
| Annual Report |
| 44 |
| Independent Trustees: |
Correspondence intended for each Independent Trustee (that is, the Trustees other than the Interested Trustees) may be sent to Fidelity Investments, P.O. Box 55235, Boston, Massachusetts 02205 5235.
| Name, Age; Principal Occupation Dennis J. Dirks (57) |
Year of Election or Appointment: 2005
Prior to his retirement in May 2003, Mr. Dirks was Chief Operating Officer and a member of the Board of The Depository Trust & Clearing Corporation (DTCC) (1999 2003). He also served as President, Chief Operating Officer, and Board member of The Depository Trust Company (DTC) (1999 2003) and President and Board member of the National Securities Clearing Corporation (NSCC) (1999 2003). In addi tion, Mr. Dirks served as Chief Executive Officer and Board member of the Government Securities Clearing Corporation (2001 2003) and Chief Executive Officer and Board member of the Mortgage Backed Securities Clearing Corporation (2001 2003). Mr. Dirks also serves as a Trustee of Manhattan College (2005 present).
| Robert M. Gates (62) |
Year of Election or Appointment: 1997
Dr. Gates is Vice Chairman of the Independent Trustees (2005 present). Dr. Gates is President of Texas A&M University (2002 present). He was Director of the Central Intelligence Agency (CIA) from 1991 to 1993. From 1989 to 1991, Dr. Gates served as Assistant to the President of the United States and Deputy National Security Advisor. Dr. Gates is a Director of NACCO Industries, Inc. (mining and manufacturing), Parker Drilling Co., Inc. (drilling and rental tools for the energy industry, 2001 present), and Brinker International (restaurant management, 2003 present). Previously, Dr. Gates served as a Director of LucasVarity PLC (automotive components and diesel engines), a Director of TRW Inc. (automotive, space, defense, and information technology), and Dean of the George Bush School of Government and Public Service at Texas A&M University (1999 2001). Dr. Gates also is a Trustee of the Forum for International Policy.
45 Annual Report
Trustees and Officers - continued
| Name, Age; Principal Occupation George H. Heilmeier (69) |
Year of Election or Appointment:2004
Dr. Heilmeier is Chairman Emeritus of Telcordia Technologies (commu nication software and systems), where prior to his retirement, he served as company Chairman and Chief Executive Officer. He currently serves on the Boards of Directors of The Mitre Corporation (systems engineer ing and information technology support for the government), and HRL Laboratories (private research and development, 2004 present). He is Chairman of the General Motors Science & Technology Advisory Board and a Life Fellow of the Institute of Electrical and Electronics Engineers (IEEE) (2000 present). Dr. Heilmeier is a member of the Defense Science Board and the National Security Agency Advisory Board. He is also a member of the National Academy of Engineering, the American Aca demy of Arts and Sciences, and the Board of Overseers of the School of Engineering and Applied Science of the University of Pennsylvania. Pre viously, Dr. Heilmeier served as a Director of TRW Inc. (automotive, space, defense, and information technology, 1992 2002), Compaq (1994 2002), Automatic Data Processing, Inc. (ADP) (technology based business outsourcing, 1995 2002), INET Technologies Inc. (telecommu nications network surveillance, 2001 2004), and Teletech Holdings (cus tomer management services). He is the recipient of the 2005 Kyoto Prize in Advanced Technology for his invention of the liquid display.
| Marie L. Knowles (59) |
Year of Election or Appointment: 2001
Prior to Ms. Knowles’ retirement in June 2000, she served as Executive Vice President and Chief Financial Officer of Atlantic Richfield Company (ARCO) (diversified energy, 1996 2000). From 1993 to 1996, she was a Senior Vice President of ARCO and President of ARCO Transportation Company. She served as a Director of ARCO from 1996 to 1998. She currently serves as a Director of Phelps Dodge Corporation (copper mining and manufacturing) and McKesson Corporation (healthcare ser vice, 2002 present). Ms. Knowles is a Trustee of the Brookings Institution and the Catalina Island Conservancy and also serves as a member of the Advisory Board for the School of Engineering of the University of Southern California.
| Annual Report |
| 46 |
| Name, Age; Principal Occupation Ned C. Lautenbach (61) |
Year of Election or Appointment: 2000
Mr. Lautenbach has been a partner of Clayton, Dubilier & Rice, Inc. (private equity investment firm) since September 1998. Previously, Mr. Lautenbach was with the International Business Machines Corporation (IBM) from 1968 until his retirement in 1998. Mr. Lautenbach serves as a Director of Italtel Holding S.p.A. (telecommunications (Milan, Italy), 2004 present) and Eaton Corporation (diversified industrial) as well as the Philharmonic Center for the Arts in Naples, Florida. He also is a member of the Board of Trustees of Fairfield University (2005 present), as well as a member of the Council on Foreign Relations.
| Marvin L. Mann (72) |
Year of Election or Appointment: 1993
Mr. Mann is Chairman of the Independent Trustees (2001 present). He is Chairman Emeritus of Lexmark International, Inc. (computer peripherals), where he served as CEO until April 1998, retired as Chairman May 1999, and remains a member of the Board. Prior to 1991, he held the positions of Vice President of International Business Machines Corporation (IBM) and President and General Manager of various IBM divisions and subsidiaries. He is a member of the Executive Committee of the Independent Director’s Council of the Investment Com pany Institute. In addition, Mr. Mann is a member of the President’s Cabinet at the University of Alabama and the Board of Visitors of the Culverhouse College of Commerce and Business Administration at the University of Alabama.
| William O. McCoy (72) |
Year of Election or Appointment: 1997
Prior to his retirement in December 1994, Mr. McCoy was Vice Chair man of the Board of BellSouth Corporation (telecommunications) and President of BellSouth Enterprises. He is currently a Director of Liberty Corporation (holding company), Duke Realty Corporation (real estate), and Progress Energy, Inc. (electric utility). He is also a partner of Frank lin Street Partners (private investment management firm) and a member of the Research Triangle Foundation Board. In addition, Mr. McCoy served as the Interim Chancellor (1999 2000) and a member of the Board of Visitors for the University of North Carolina at Chapel Hill and currently serves on the Board of Directors of the University of North Carolina Health Care System and the Board of Visitors of the Kenan Flagler Business School (University of North Carolina at Chapel Hill). He also served as Vice President of Finance for the University of North Car olina (16 school system).
47 Annual Report
Trustees and Officers - continued
| Name, Age; Principal Occupation Cornelia M. Small (61) |
Year of Election or Appointment: 2005
Ms. Small is a member (2000 present) and Chairperson (2002 present) of the Investment Committee, and a member (2002 present) of the Board of Trustees of Smith College. Previously, she served as Chief In vestment Officer (1999 2000), Director of Global Equity Investments (1996 1999), and a member of the Board of Directors of Scudder, Stevens & Clark (1990 1997) and Scudder Kemper Investments (1997 1998). In addition, Ms. Small served as Co Chair (2000 2003) of the Annual Fund for the Fletcher School of Law and Diplomacy.
| William S. Stavropoulos (66) |
Year of Election or Appointment: 2001
Mr. Stavropoulos is Chairman of the Board (2000 present) and a Mem ber of the Board of Directors of The Dow Chemical Company. Since joining The Dow Chemical Company in 1967, Mr. Stavropoulos served in numerous senior management positions, including President (1993 2000; 2002 2003), CEO (1995 2000; 2002 2004), and Chair man of the Executive Committee (2000 2004). Currently, he is a Direc tor of NCR Corporation (data warehousing and technology solutions), BellSouth Corporation (telecommunications), Chemical Financial Corpo ration, Maersk Inc. (industrial conglomerate, 2002 present), and Metal mark Capital (private equity investment firm, 2005 present). He also serves as a member of the Board of Trustees of the American Enterprise Institute for Public Policy Research. In addition, Mr. Stavropoulos is a member of The Business Council, J.P. Morgan International Council and the University of Notre Dame Advisory Council for the College of Science.
| Kenneth L. Wolfe (66) |
Year of Election or Appointment: 2005
Mr. Wolfe also serves as a Trustee (2005 present) or Member of the Advisory Board (2004 present) of other investment companies advised by FMR. Prior to his retirement in 2001, Mr. Wolfe was Chairman and Chief Executive Officer of Hershey Foods Corporation (1993 2001). He currently serves as a member of the boards of Adelphia Communica tions Corporation (2003 present), Bausch & Lomb, Inc., and Revlon Inc. (2004 present).
| Annual Report |
| 48 |
Advisory Board Members and Executive Officers:
Correspondence intended for Mr. Gamper may be sent to Fidelity Investments, P.O. Box 55235, Boston, Massachusetts 02205 5235. Correspondence intended for each executive officer and Mr. Lynch may be sent to Fidelity Investments, 82 Devonshire Street, Boston, Massachusetts 02109.
| Name, Age; Principal Occupation Albert R. Gamper, Jr. (63) |
Year of Election or Appointment: 2005
Member of the Advisory Board of Fidelity Investment Trust. Prior to his retirement in December 2004, Mr. Gamper served as Chairman of the Board of CIT Group Inc. (commercial finance). During his tenure with CIT Group Inc. Mr. Gamper served in numerous senior management positions, including Chairman (1987 1989; 1999 2001; 2002 2004), Chief Executive Officer (1987 2004), and President (1989 2002). He currently serves as a member of the Board of Directors of Public Service Enterprise Group (utilities, 2001 present), Chairman of the Board of Governors, Rutgers University (2004 present), and Chairman of the Board of Saint Barnabas Health Care System.
| Peter S. Lynch (61) |
Year of Election or Appointment: 2003
Member of the Advisory Board of Fidelity Investment Trust. Vice Chair man and a Director of FMR, and Vice Chairman (2001 present) and a Director (2000 present) of FMR Co., Inc. Previously, Mr. Lynch served as a Trustee of the Fidelity funds (1990 2003). In addition, he serves as a Trustee of Boston College, Massachusetts Eye & Ear Infirmary, Historic Deerfield, John F. Kennedy Library, and the Museum of Fine Arts of Boston.
| Dwight D. Churchill (51) |
Year of Election or Appointment: 2005
Vice President of International Discovery. Mr. Churchill also serves as Vice President of certain Equity funds (2005 present) and certain High Income Funds (2005 present). Previously, he served as Head of Fidelity’s Fixed Income Division (2000 2005), Vice President of Fidelity’s Money Market Funds (2000 2005), Vice President of Fidelity’s Bond Funds, and Senior Vice President of FIMM (2000) and FMR. Mr. Churchill joined Fidelity in 1993 as Vice President and Group Leader of Taxable Fixed Income Investments.
49 Annual Report
Trustees and Officers - continued
| Name, Age; Principal Occupation William Kennedy (37) |
Year of Election or Appointment: (2005)
Vice President of Fidelity International Discovery Fund. Prior to assuming his current responsibilities, Mr. Kennedy worked as a research analyst and manager.
| Eric D. Roiter (56) |
Year of Election or Appointment: 1998
Secretary of International Discovery. He also serves as Secretary of other Fidelity funds; Vice President, General Counsel, and Secretary of FMR Co., Inc. (2001 present) and FMR; Assistant Secretary of Fidelity Management & Research (U.K.) Inc. (2001 present), Fidelity Manage ment & Research (Far East) Inc. (2001 present), and Fidelity Investments Money Management, Inc. (2001 present). Mr. Roiter is an Adjunct Member, Faculty of Law, at Boston College Law School (2003 present). Previously, Mr. Roiter served as Vice President and Secretary of Fidelity Distributors Corporation (FDC) (1998 2005).
| Stuart Fross (46) |
Year of Election or Appointment: 2003
Assistant Secretary of International Discovery. Mr. Fross also serves as Assistant Secretary of other Fidelity funds (2003 present), Vice President and Secretary of FDC (2005 present), and is an employee of FMR.
| Christine Reynolds (47) |
Year of Election or Appointment: 2004
President, Treasurer, and Anti Money Laundering (AML) officer of Inter national Discovery. Ms. Reynolds also serves as President, Treasurer, and AML officer of other Fidelity funds (2004) and is a Vice President (2003) and an employee (2002) of FMR. Before joining Fidelity Invest ments, Ms. Reynolds worked at PricewaterhouseCoopers LLP (PwC) (1980 2002), where she was most recently an audit partner with PwC’s investment management practice.
| Paul M. Murphy (58) |
Year of Election or Appointment: 2005
Chief Financial Officer of International Discovery. Mr. Murphy also serves as Chief Financial Officer of other Fidelity funds (2005 present). He also serves as Senior Vice President of Fidelity Pricing and Cash Management Services Group (FPCMS).
| Annual Report |
| 50 |
| Name, Age; Principal Occupation Kenneth A. Rathgeber (58) |
Year of Election or Appointment: 2004
Chief Compliance Officer of International Discovery. Mr. Rathgeber also serves as Chief Compliance Officer of other Fidelity funds (2004) and Executive Vice President of Risk Oversight for Fidelity Investments (2002). Previously, he served as Executive Vice President and Chief Op erating Officer for Fidelity Investments Institutional Services Company, Inc. (1998 2002).
| John R. Hebble (47) |
Year of Election or Appointment: 2003
Deputy Treasurer of International Discovery. Mr. Hebble also serves as Deputy Treasurer of other Fidelity funds (2003), and is an employee of FMR. Before joining Fidelity Investments, Mr. Hebble worked at Deutsche Asset Management where he served as Director of Fund Accounting (2002 2003) and Assistant Treasurer of the Scudder Funds (1998 2003).
| Bryan A. Mehrmann (44) |
Year of Election or Appointment: 2005
Deputy Treasurer of International Discovery. Mr. Mehrmann also serves as Deputy Treasurer of other Fidelity funds (2005 present) and is an employee of FMR. Previously, Mr. Mehrmann served as Vice President of Fidelity Investments Institutional Services Group (FIIS)/Fidelity Investments Institutional Operations Corporation, Inc. (FIIOC) Client Services (1998 2004).
| Kimberley H. Monasterio (41) |
Year of Election or Appointment: 2004
Deputy Treasurer of International Discovery. Ms. Monasterio also serves as Deputy Treasurer of other Fidelity funds (2004) and is an employee of FMR (2004). Before joining Fidelity Investments, Ms. Monasterio served as Treasurer (2000 2004) and Chief Financial Officer (2002 2004) of the Franklin Templeton Funds and Senior Vice President of Franklin Templeton Services, LLC (2000 2004).
| Kenneth B. Robins (36) |
Year of Election or Appointment:2005
Deputy Treasurer of International Discovery. Mr. Robins also serves as Deputy Treasurer of other Fidelity funds (2005 present) and is an em ployee of FMR (2004 present). Before joining Fidelity Investments, Mr. Robins worked at KPMG LLP, where he was a partner in KPMG’s de partment of professional practice (2002 2004) and a Senior Manager (1999 2000). In addition, Mr. Robins served as Assistant Chief Accoun tant, United States Securities and Exchange Commission (2000 2002).
51 Annual Report
Trustees and Officers - continued
| Name, Age; Principal Occupation Robert G. Byrnes (38) |
Year of Election or Appointment: 2005
Assistant Treasurer of International Discovery. Mr. Byrnes also serves as Assistant Treasurer of other Fidelity funds (2005 present) and is an em ployee of FMR (2005 present). Previously, Mr. Byrnes served as Vice President of FPCMS (2003 2005). Before joining Fidelity Investments, Mr. Byrnes worked at Deutsche Asset Management where he served as Vice President of the Investment Operations Group (2000 2003).
| John H. Costello (59) |
Year of Election or Appointment: 1986
Assistant Treasurer of International Discovery. Mr. Costello also serves as Assistant Treasurer of other Fidelity funds and is an employee of FMR.
| Peter L. Lydecker (51) |
Year of Election or Appointment: 2004
Assistant Treasurer of International Discovery. Mr. Lydecker also serves as Assistant Treasurer of other Fidelity funds (2004) and is an employee of FMR.
| Mark Osterheld (50) |
Year of Election or Appointment: 2002
Assistant Treasurer of International Discovery. Mr. Osterheld also serves as Assistant Treasurer of other Fidelity funds (2002) and is an employee of FMR.
| Gary W. Ryan (47) |
Year of Election or Appointment: 2005
Assistant Treasurer of International Discovery. Mr. Ryan also serves as Assistant Treasurer of other Fidelity funds (2005 present) and is an em ployee of FMR (2005 present). Previously, Mr. Ryan served as Vice Pres ident of Fund Reporting in FPCMS (1999 2005).
| Salvatore Schiavone (39) |
Year of Election or Appointment: 2005
Assistant Treasurer of International Discovery. Mr. Schiavone also serves as Assistant Treasurer of other Fidelity funds (2005 present) and is an employee of FMR (2005 present). Before joining Fidelity Investments, Mr. Schiavone worked at Deutsche Asset Management, where he most recently served as Assistant Treasurer (2003 2005) of the Scudder Funds and Vice President and Head of Fund Reporting (1996 2003).
| Annual Report |
| 52 |
| Distributions |
The Board of Trustees of Fidelity International Discovery Fund voted to pay to shareholders of record at the opening of business on record date, the following distributions per share derived from capital gains realized from sales of portfolio securities, and dividends derived from net investment income:
| Pay Date | Record Date | Dividends | Capital Gains | |||||
| International Dis- | ||||||||
| covery Fund | 12/05/05 | 12/02/05 | $.31 | $1.40 |
The fund hereby designates as capital gain dividends: For dividends with respect to the taxable year ended October 31, 2005, $125,101,084, or, if subsequently determined to be different, the net capital gain of such year, and for dividends with respect to the taxable year ended October 31, 2004, $10,027,744, or, if subsequently determined to be different, the excess of: (a) the net capital gain of such year, over (b) amounts previously designated as capital gain dividends with respect to such year.
The amounts per share which represent income derived from sources within, and taxes paid to, foreign countries or possessions of the United States are as follows:
| Pay Date | Income | Taxes | ||||
| International Discovery Fund | 12/06/04 | $.181 | $.031 |
The fund designates 100% of the dividend distributed in December during the fiscal year as amounts which may be taken into account as a dividend for the purposes of the maximum rate under section 1(h)(11) of the Internal Revenue Code.
The fund will notify shareholders in January 2006 of amounts for use in preparing 2005 income tax returns.
53 Annual Report
Board Approval of Investment Advisory Contracts and Management Fees
Fidelity International Discovery Fund
Each year, typically in July, the Board of Trustees, including the independent Trustees (together, the Board), votes on the renewal of the management contract and sub advisory agreements (together, the Advisory Contracts) for the fund. The Board, assisted by the advice of fund counsel and independent Trustees’ counsel, requests and considers a broad range of information throughout the year.
The Board meets regularly each month except August and takes into account throughout the year matters bearing on Advisory Contracts. The Board, acting directly and through its separate committees, considers at each of its meetings factors that are relevant to the annual renewal of the fund’s Advisory Contracts, including the services and support provided to the fund and its shareholders by Fidelity. At the time of the renewal, the Board had 11 standing committees, each composed of independent Trustees with varying backgrounds, to which the Board has assigned specific subject matter responsibilities in order to enhance effective decision making by the Board. Each committee has adopted a written charter outlining the structure and purposes of the committee. One such com mittee, the Equity Contract Committee, meets periodically during the first six months of each year and as necessary to consider matters specifically related to the annual renewal of Advisory Contracts. The committee requests and receives information on, and makes recommendations to the independent Trustees concerning, the approval and annual review of the Advisory Contracts.
At its July 2005 meeting, the Board of Trustees, including the independent Trustees, unanimously determined to renew the Advisory Contracts for the fund. In reaching its determination, the Board considered all factors it believed relevant, including (1) the nature, extent, and quality of the services to be provided to the fund and its shareholders by Fidelity (including the investment performance of the fund); (2) the competitiveness of the management fee and total expenses of the fund; (3) the total costs of the services to be provided by and the profits to be realized by the investment adviser and its affiliates from the relationship with the fund; (4) the extent to which economies of scale would be realized as the fund grows; and (5) whether fee levels reflect these economies of scale, if any, for the benefit of fund shareholders.
In determining whether to renew the Advisory Contracts for the fund, the Board ulti mately reached a determination, with the assistance of fund counsel and independent Trustees’ counsel, that the renewal of the Advisory Contracts and the compensation to be received by Fidelity under the management contract is consistent with Fidelity’s fidu ciary duty under applicable law. In addition to evaluating the specific factors noted above, the Board, in reaching its determination, is aware that shareholders in the fund have a broad range of investment choices available to them, including a wide choice among mutual funds offered by competitors to Fidelity, and that the fund’s shareholders, with the opportunity to review and weigh the disclosure provided by the fund in its
| Annual Report |
| 54 |
prospectus and other public disclosures, have chosen to invest in this fund, managed by Fidelity.
Nature, Extent, and Quality of Services Provided by Fidelity. The Board consid ered staffing within the investment adviser, FMR, and the sub advisers (together, the Investment Advisers), including the background of the fund’s portfolio manager and the fund’s investment objective and discipline. The independent Trustees also had discus sions with senior management of Fidelity’s investment operations and investment groups. The Board considered the structure of the portfolio manager compensation program and whether this structure provides appropriate incentives.
Fidelity Resources Dedicated to Investment Management and Support Services. The Board reviewed the size, education, and experience of the Investment Advisers’ invest ment staff, their use of technology, and the Investment Advisers’ approach to recruiting, training, and retaining portfolio managers and other research, advisory, and manage ment personnel. The Board considered Fidelity’s extensive global research capabilities that enable the Investment Advisers to aggregate data from various sources in an effort to produce positive investment results. The Board noted that Fidelity’s analysts have access to a variety of technological tools that enable them to perform both fundamental and quantitative analysis and to specialize in various disciplines. The Board also considered that Fidelity’s portfolio managers and analysts have access to daily portfolio attribution that allows for monitoring of a fund’s portfolio, as well as an electronic communication system that provides immediate real time access to research concerning issuers and credit enhancers.
Shareholder and Administrative Services. The Board considered the nature, extent, quality, and cost of administrative, distribution, and shareholder services performed by the Investment Advisers and their affiliates under the Advisory Contracts and under separate agreements covering transfer agency, pricing and bookkeeping, and securities lending services for the fund. The Board also considered the nature and extent of the Investment Advisers’ supervision of third party service providers, principally custodians and subcustodians. The Board reviewed the allocation of fund brokerage, including allocations to brokers affiliated with the Investment Advisers, the use of brokerage commissions to pay fund expenses, and the use of “soft” commission dollars to pay for research services. The Board also considered that Fidelity voluntarily decided in 2004 to stop using “soft” commission dollars to pay for market data and, instead, to pay for that data out of its own resources. The Board also considered the resources devoted to, and the record of compliance with, the fund’s compliance policies and procedures.
The Board noted that the growth of fund assets across the complex allows Fidelity to reinvest in the development of services designed to enhance the value or convenience of the Fidelity funds as investment vehicles. These services include 24 hour access to
55 Annual Report
Board Approval of Investment Advisory Contracts and Management Fees continued
account information and market information through phone representatives and over the Internet, and investor education materials and asset allocation tools.
Investment in a Large Fund Family. The Board considered the benefits to shareholders of investing in a Fidelity fund, including the benefits of investing in a fund that is part of a large family of funds offering a variety of investment disciplines and providing for a large variety of mutual fund investor services. For example, fund shareholders are offered the privilege of exchanging shares of the fund for shares of other Fidelity funds, as set forth in the fund’s prospectus, without paying an additional sales charge. The Board noted that, since the last Advisory Contract renewals in July 2004, Fidelity has taken a number of actions that benefited particular funds, including (i) voluntarily deciding in 2004 to stop using “soft” commission dollars to pay for market data and, instead, to pay for that data out of its own resources, (ii) contractually agreeing to impose management fee reductions and expense limitations on its five Spartan stock index funds and its stock index fund available through variable insurance products, (iii) contractually agreeing to eliminate the management fees on the Fidelity Freedom Funds and the Fidelity Advisor Freedom Funds, (iv) contractually agreeing to reduce the management fees on most of its investment grade taxable bond funds, and (v) contractually agreeing to impose expense limitations on its retail and Spartan investment grade taxable bond funds.
Investment Performance and Compliance. The Board considered whether the fund has operated within its investment objective, as well as its record of compliance with its investment restrictions. It also reviewed the fund’s absolute investment performance, as well as the fund’s relative investment performance measured against (i) a broad based securities market index, and (ii) a peer group of mutual funds deemed appropriate by the Board over multiple periods. The following charts considered by the Board show, over the one , three , and five year periods ended December 31, 2004, the returns of the retail class of the fund, the returns of a broad based securities market index (“benchmark”), and a range of returns of a peer group of mutual funds identified by Lipper Inc. as having an investment objective similar to that of the fund. (The fund did not offer Advisor classes as of December 31, 2004.) The box within each chart shows the 25th percentile return (bottom of box) and the 75th percentile return (top of box) of the Lipper peer group. Returns shown above the box are in the first quartile and returns shown below the box are in the fourth quartile. The percentage beaten numbers noted below each chart correspond to the percentile box and represent the percentage of funds in the Lipper peer group whose performance was equal to or lower than that of the retail class.
| Annual Report |
| 56 |
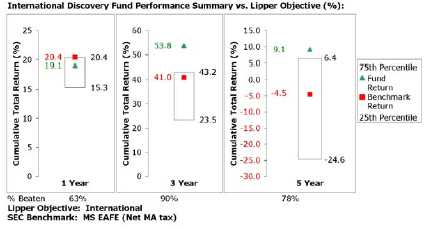
The Board reviewed the fund’s relative investment performance against its Lipper peer group and stated that the performance of the fund was in the second quartile for the one year period and the first quartile for the three and five year periods. The Board also stated that the relative investment performance of the fund has compared favorably to its benchmark over time, although the fund’s one year cumulative total return was lower than its benchmark.
The Board also considered that, beginning September 1, 2005, the fund’s management fee is subject to upward or downward adjustment depending upon whether, and to what extent, the fund’s investment performance for the performance period exceeds, or is exceeded by, the record (over the same period) of a Board approved performance adjustment index. The Board realizes that the performance adjustment provides FMR with a strong economic incentive to seek to achieve superior performance for the fund’s shareholders and helps to more closely align the interests of FMR and the fund’s shareholders.
The Board has had thorough discussions with FMR throughout the year about the Board’s and FMR’s concerns about equity research, equity fund performance, and compliance with internal policies governing gifts and entertainment. FMR has taken steps that it believes will refocus and strengthen equity research and equity portfolio management and compliance. The Board noted with favor FMR’s recent reorganization of its senior management team and FMR’s plans to dedicate additional resources to investment research, and participated in the process that led to those changes.
Based on its review, and giving particular weight to the nature and quality of the resources dedicated by the Investment Advisers to maintain and improve relative
57 Annual Report
Board Approval of Investment Advisory Contracts and Management Fees continued
performance, the Board concluded that the nature, extent, and quality of the services provided by Fidelity will benefit the fund’s shareholders, particularly in light of the Board’s view that the fund’s shareholders benefit from investing in a fund that is part of a large family of funds offering a variety of investment disciplines and services.
Competitiveness of Management Fee and Total Fund Expenses. The Board considered the fund’s management fee and total expenses compared to “mapped groups” of competitive funds and classes. Fidelity creates “mapped groups” by combining similar Lipper investment objective categories that have comparable management fee charac teristics. Combining Lipper investment objective categories aids the Board’s manage ment fee and total expense comparisons by broadening the competitive group used for comparison and by reducing the number of universes to which various Fidelity funds are compared.
The Board considered two proprietary management fee comparisons for the 12 month periods shown in the chart below. The group of Lipper funds used by the Board for management fee comparisons is referred to below as the “Total Mapped Group” and, for the reasons explained above, is broader than the Lipper peer group used by the Board for performance comparisons. The Total Mapped Group comparison focuses on a fund’s standing relative to the total universe of comparable funds available to investors, in terms of gross management fees before expense reimbursements or caps. “TMG %” represents the percentage of funds in the Total Mapped Group that had management fees that were lower than the fund’s. For example, a TMG % of 21% means that 79% of the funds in the Total Mapped Group had higher management fees than the fund. The “Asset Size Peer Group” (ASPG) comparison focuses on a fund’s standing relative to non Fidelity funds similar in size to the fund within the Total Mapped Group. The ASPG represents at least 15% of the funds in the Total Mapped Group with comparable asset size and management fee characteristics, subject to a minimum of 50 funds (or all funds in the Total Mapped Group if fewer than 50). Additional information, such as the ASPG quartile (“quadrant”) in which the fund’s management fee ranked, is also included in the chart and considered by the Board.
| Annual Report |
| 58 |
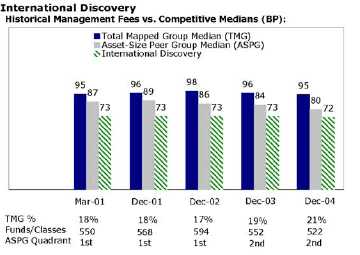
The Board noted that the fund’s management fee ranked below the median of its Total Mapped Group and below the median of its ASPG for 2004.
Based on its review, the Board concluded that the fund’s management fee was fair and reasonable in light of the services that the fund receives and the other factors considered.
In its review of the fund’s total expenses, the Board considered the fund’s management fee as well as other fund expenses, such as transfer agent fees, pricing and bookkeeping fees, and custodial, legal, and audit fees. The Board also noted the effects of any waivers and reimbursements on fees and expenses. As part of its review, the Board also consid ered current and historical total expenses of the fund compared to competitive fund median expenses. The fund is compared to those funds and classes in the Total Mapped Group (used by the Board for management fee comparisons) that have a similar sales load structure.
The Board noted that the fund’s total expenses ranked below its competitive median for 2004.
In its review of total expenses, the Board also considered Fidelity fee structures and other information on clients that FMR and its affiliates service in other competitive markets, such as other mutual funds advised or subadvised by FMR or its affiliates, pension plan clients, and other institutional clients.
Based on its review, the Board concluded that the fund’s total expenses were reasonable in light of the services that the fund and its shareholders receive and the other factors considered.
59 Annual Report
Board Approval of Investment Advisory Contracts and Management Fees continued
Costs of the Services and Profitability. The Board considered the revenues earned and the expenses incurred by Fidelity in conducting the business of developing, market ing, distributing, managing, administering and servicing the fund and its shareholders. The Board also considered the level of Fidelity’s profits in respect of all the Fidelity funds.
On an annual basis, FMR presents to the Board Fidelity’s profitability for the fund. Fidelity calculates the profitability for each fund, as well as aggregate profitability for groups of Fidelity funds and all Fidelity funds, using a series of detailed revenue and cost allocation methodologies which originate with the audited books and records of Fidelity. The Audit Committee of the Board reviews any significant changes from the prior year’s methodologies.
PricewaterhouseCoopers LLP (PwC), independent registered accounting firm and auditor to Fidelity and certain Fidelity funds, has been engaged annually by the Board as part of the Board’s assessment of the results of Fidelity’s profitability analysis. PwC’s engagement includes the review and assessment of Fidelity’s methodologies used in determining the revenues and expenses attributable to Fidelity’s mutual fund business, and completion of agreed upon procedures surrounding the mathematical accuracy of fund profitability and its conformity to allocation methodologies. After considering PwC’s reports issued under the engagement and information provided by Fidelity, the Board believes that while other allocation methods may also be reasonable, Fidelity’s profitabil ity methodologies are reasonable in all material respects.
The Board has also reviewed Fidelity’s non fund businesses and any fall out benefits related to the mutual fund business as well as cases where Fidelity’s affiliates may benefit from or be related to the fund’s business. In addition, a special committee of the Board reviewed services provided to Fidelity by its affiliates and determined that the fees that Fidelity paid for such services were reasonable.
The Board considered the costs of the services provided by and the profits realized by Fidelity in connection with the operation of the fund and determined that the amount of profit is a fair entrepreneurial profit for the management of the fund.
Economies of Scale. The Board considered whether there have been economies of scale in respect of the management of the Fidelity funds, whether the Fidelity funds (including the fund) have appropriately benefited from any such economies of scale, and whether there is potential for realization of any further economies of scale. The Board considered the extent to which the fund will benefit from economies of scale through increased services to the fund, through waivers or reimbursements, or through fee or expense reductions, including reductions that occur through operation of the transfer agent agreement. The transfer agent fee varies in part based on the number of accounts in the fund. If the number of accounts decreases or the average account size increases, the overall transfer agent fee rate decreases.
| Annual Report |
| 60 |
The Board recognized that the fund’s management contract incorporates a “group fee” structure, which provides for lower fee rates as total fund assets under FMR’s manage ment increase, and for higher fee rates as total fund assets under FMR’s management decrease. The Board considered that the group fee is designed to deliver the benefits of economies of scale to fund shareholders when total fund assets increase, even if assets of any particular fund are unchanged or have declined, because some portion of Fidelity’s costs are attributable to services provided to all Fidelity funds, and all funds benefit if those costs can be allocated among more assets. The Board concluded that, given the group fee structure, fund shareholders will achieve a certain level of economies of scale as assets under FMR’s management increase at the fund complex level, regardless of whether Fidelity achieves any such economies of scale.
The Board further concluded that any potential economies of scale are being shared between fund shareholders and Fidelity in an appropriate manner.
Additional Information Requested by the Board. In order to develop fully the factual basis for consideration of the Advisory Contracts, the Board requested additional information regarding (i) equity fund transfer agency fees; (ii) Fidelity’s fund profitability methodology and the impact of various changes in the methodology over time; (iii) benefits to shareholders from economies of scale; (iv) composition and characteristics of various fund and industry data used in comparisons; and (v) com pensation of portfolio managers and research analysts.
Based on its evaluation of all of the conclusions noted above, and after considering all material factors, the Board ultimately concluded that the existing advisory fee structures are fair and reasonable, and that the fund’s existing Advisory Contracts should be renewed.
61 Annual Report
Managing Your Investments
Fidelity offers several ways to conveniently manage your personal investments via your telephone or PC. You can access your account information, conduct trades and research your investments 24 hours a day.
By Phone
Fidelity Automated Service Telephone provides a single toll free number to access account balances, positions, quotes and trading. It’s easy to navigate the service, and on your first call, the system will help you create a personal identification number (PIN) for security.


By PC
Fidelity’s web site on the Internet provides a wide range of information, including daily financial news, fund performance, interactive planning tools and news about Fidelity products and services.

* When you call the quotes line, please remember that a fund’s yield and return will vary and, except for money market funds, share price will also vary. This means that you may have a gain or loss when you sell your shares. There is no assurance that money market funds will be able to maintain a stable $1 share price; an investment in a money market fund is not insured or guar anteed by the U.S. government. Total returns are historical and include changes in share price, reinvestment of dividends and capital gains, and the effects of any sales charges.
Annual Report 62
To Write Fidelity
We’ll give your correspondence immediate attention and send you written confirmation upon completion of your request.

| (such as changing name, address, bank, etc.) Fidelity Investments P.O. Box 770001 Cincinnati, OH 45277-0002 |

| Buying shares Fidelity Investments P.O. Box 770001 Cincinnati, OH 45277-0003 Overnight Express Fidelity Investments Attn: Distribution Services 100 Crosby Parkway KC1H Covington, KY 41015 Selling shares Fidelity Investments P.O. Box 770001 Cincinnati, OH 45277-0035 Overnight Express Fidelity Investments Attn: Distribution Services 100 Crosby Parkway KC1H Covington, KY 41015 General Correspondence Fidelity Investments P.O. Box 500 Merrimack, NH 03054-0500 |

| Buying shares Fidelity Investments P.O. Box 770001 Cincinnati, OH 45277-0003 Selling shares Fidelity Investments P.O. Box 770001 Cincinnati, OH 45277-0035 Overnight Express Fidelity Investments Attn: Distribution Services 100 Crosby Parkway KC1H Covington, KY 41015 General Correspondence Fidelity Investments P.O. Box 500 Merrimack, NH 03054-0500 |
| 63 Annual Report |
| Investment Adviser Fidelity Management & Research Company Boston, MA Investment Sub Advisers FMR Co., Inc. Fidelity Management & Research (U.K.) Inc. Fidelity Management & Research (Far East) Inc. Fidelity International Investment Advisors Fidelity Investments Japan Limited Fidelity International Investment Advisors (U.K.) Limited General Distributor Fidelity Distributors Corporation Boston, MA Transfer and Service Agent Fidelity Service Company, Inc. Boston, MA Custodian JPMorgan Chase Bank New York, NY |
| The Fidelity Telephone Connection | ||
| Mutual Fund 24-Hour Service | ||
| Exchanges/Redemptions | ||
| and Account Assistance | 1-800-544-6666 | |
| Product Information | 1-800-544-8888 | |
| Retirement Accounts | 1-800-544-4774 | |
| (8 a.m. - 9 p.m.) | ||
| TDD Service | 1-800-544-0118 | |
| for the deaf and hearing impaired | ||
| (9 a.m. - 9 p.m. Eastern time) | ||
| Fidelity Automated Service | ||
| Telephone (FAST®) (automated phone logo) | 1-800-544-5555 | |
| (automated phone logo) Automated line for quickest service | ||
| IGI-UANN-1205 1.807257.101 |


| Fidelity Advisor International Discovery Fund - Class A, Class T, Class B and Class C |
| Annual Report October 31, 2005 |

Class A, Class T, Class B, and Class C are classes of Fidelity® International Discovery Fund
| Contents | ||||
| Chairman’s Message | 4 | Ned Johnson’s message to shareholders. | ||
| Performance | 5 | How the fund has done over time. | ||
| Management’s Discussion | 7 | The manager’s review of fund | ||
| performance, strategy and outlook. | ||||
| Shareholder Expense | 8 | An example of shareholder expenses. | ||
| Example | ||||
| Investment Changes | 10 | A summary of major shifts in the fund’s | ||
| investments over the past six months. | ||||
| Investments | 12 | A complete list of the fund’s investments | ||
| with their market values. | ||||
| Financial Statements | 24 | Statements of assets and liabilities, | ||
| operations, and changes in net assets, | ||||
| as well as financial highlights. | ||||
| Notes | 34 | Notes to the financial statements. | ||
| Report of Independent | 43 | |||
| Registered Public | ||||
| Accounting Firm | ||||
| Trustees and Officers | 44 | |||
| Distributions | 54 | |||
| Board Approval of | 55 | |||
| Investment Advisory | ||||
| Contracts and | ||||
| Management Fees | ||||
| To view a fund’s proxy voting guidelines and proxy voting record for the 12 month period ended June 30, visit www.fidelity.com/proxyvotingresults or visit the Securities and Exchange Commis sion’s (SEC) web site at www.sec.gov. You may also call 1-877-208-0098 to request a free copy of the proxy voting guidelines. Standard & Poor’s, S&P and S&P 500 are registered service marks of The McGraw Hill Companies, Inc. and have been licensed for use by Fidelity Distributors Corporation. Other third party marks appearing herein are the property of their respective owners. All other marks appearing herein are registered or unregistered trademarks or service marks of FMR Corp. or an affiliated company. |
| Annual Report |
| 2 |
| This report and the financial statements contained herein are submitted for the general information of the shareholders of the fund. This report is not authorized for distribution to prospective investors in the fund unless preceded or accompanied by an effective prospectus. A fund files its complete schedule of portfolio holdings with the SEC for the first and third quarters of each fiscal year on Form N Q. Forms N Q are available on the SEC’s web site at http://www.sec.gov. A fund’s Forms N Q may be reviewed and copied at the SEC’s Public Refer ence Room in Washington, DC. Information regarding the operation of the SEC’s Public Reference Room may be obtained by calling 1-800-SEC-0330. For a complete list of a fund’s portfolio hold ings, view the most recent quarterly holdings report, semiannual report, or annual report on Fidelity’s web site at http://www.advisor.fidelity.com. NOT FDIC INSURED · MAY LOSE VALUE · NO BANK GUARANTEE Neither the fund nor Fidelity Distributors Corporation is a bank. |
3 Annual Report
Chairman’s Message
(photograph of Edward C. Johnson 3d)
Dear Shareholder:
During the past year or so, much has been reported about the mutual fund industry, and much of it has been more critical than I believe is warranted. Allegations that some companies have been less than forthright with their shareholders have cast a shadow on the entire industry. I continue to find these reports disturbing, and assert that they do not create an accurate picture of the industry overall. Therefore, I would like to remind every one where Fidelity stands on these issues. I will say two things specifically regarding allegations that some mutual fund companies were in violation of the Securities and Exchange Commission’s forward pricing rules or were involved in so called “market timing” activities.
First, Fidelity has no agreements that permit customers who buy fund shares after 4 p.m. to obtain the 4 p.m. price. This is not a new policy. This is not to say that some one could not deceive the company through fraudulent acts. However, we are extremely diligent in preventing fraud from occurring in this manner and in every other. But I underscore again that Fidelity has no so called “agreements” that sanction illegal practices.
Second, Fidelity continues to stand on record, as we have for years, in opposition to predatory short term trading that adversely affects shareholders in a mutual fund. Back in the 1980s, we initiated a fee which is returned to the fund and, therefore, to investors to discourage this activity. Further, we took the lead several years ago in developing a Fair Value Pricing Policy to prevent market timing on foreign securities in our funds. I am confident we will find other ways to make it more difficult for predatory traders to operate. However, this will only be achieved through close cooperation among regulators, legislators and the industry.
Yes, there have been unfortunate instances of unethical and illegal activity within the mutual fund industry from time to time. That is true of any industry. When this occurs, confessed or convicted offenders should be dealt with appropriately. But we are still concerned about the risk of over regulation and the quick application of simplistic solutions to intricate problems. Every system can be improved, and we support and applaud well thought out improvements by regulators, legislators and industry representatives that achieve the common goal of building and protecting the value of investors’ holdings.
For nearly 60 years, Fidelity has worked very hard to improve its products and service to justify your trust. When our family founded this company in 1946, we had only a few hundred customers. Today, we serve more than 18 million customers in cluding individual investors and participants in retirement plans across America.
Let me close by saying that we do not take your trust in us for granted, and we realize that we must always work to improve all aspects of our service to you. In turn, we urge you to continue your active participation with your financial matters, so that your interests can be well served.
Best regards,
/s/ Edward C. Johnson 3d
Edward C. Johnson 3d
Annual Report 4
Fidelity Advisor International Discovery Fund Class A, T, B, and C
Performance: The Bottom Line
Average annual total return reflects the change in the value of an investment, assuming reinvestment of the class’ dividend income and capital gains (the profits earned upon the sale of securities that have grown in value) and assuming a constant rate of performance each year. The $10,000 table and the fund’s returns do not reflect the deduction of taxes that a shareholder would pay on fund distributions or the redemption of fund shares. During periods of reimbursement by Fidelity, a fund’s total return will be greater than it would be had the reimbursement not occurred. How a fund did yesterday is no guarantee of how it will do tomorrow.
| Average Annual Total Returns | ||||||
| Periods ended October 31, 2005 | Past 1 | Past 5 | Past 10 | |||
| year | years | years | ||||
| Class A (incl. 5.75% sales charge)A | 14.96% | 4.68% | 9.00% | |||
| Class T (incl. 3.50% sales charge)B | 17.39% | 5.12% | 9.23% | |||
| Class B (incl. contingent deferred sales charge)C | 16.13% | 5.46% | 9.57% | |||
| Class C (incl. contingent deferred sales charge)D | 20.33% | 5.82% | 9.59% |
| A Class A shares bear a 0.25% 12b 1 fee. The initial offering of Class A shares took place on Janu ary 6, 2005. Returns prior to January 6, 2005 are those of International Discovery, the original class of the fund, which has no 12b 1 fee. Had Class A shares’ 12b 1 fee been reflected, returns prior to January 6, 2005 would have been lower. B Class T shares bear a 0.50% 12b 1 fee. The initial offering of Class T shares took place on Janu ary 6, 2005. Returns prior to January 6, 2005 are those of International Discovery, the original class of the fund, which has no 12b 1 fee. Had Class T shares’ 12b 1 fee been reflected, returns prior to January 6, 2005 would have been lower. C Class B shares bear a 1.00% 12b 1 fee. The initial offering of Class B shares took place on Janu ary 6, 2005. Returns prior to January 6, 2005 are those of International Discovery, the original class of the fund, which has no 12b 1 fee. Had Class B shares’ 12b 1 fee been reflected, returns prior to January 6, 2005 would have been lower. Class B shares’ contingent deferred sales charges in cluded in the past one year, past five year, and past 10 year total return figures are 5%, 2%, and 0% respectively. D Class C shares bear a 1.00% 12b 1 fee. The initial offering of Class C shares took place on Janu ary 6, 2005. Returns prior to January 6, 2005 are those of International Discovery, the original class of the fund, which has no 12b 1 fee. Had Class C shares’ 12b 1 fee been reflected, returns prior to January 6, 2005 would have been lower. Class C shares’ contingent deferred sales charges in cluded in the past one year, past five year, and past 10 year total return figures are 1%, 0%, and 0% respectively. |
| 5 Annual Report |
| Fidelity Advisor International Discovery Fund Class A, T, B, and C Performance continued |
$10,000 Over 10 Years
Let’s say hypothetically that $10,000 was invested in Fidelity Advisor International Discovery Fund Class T on October 31, 1995 and the current 3.50% sales charge was paid. The chart shows how the value of your investment would have changed, and also shows how the Morgan Stanley Capital InternationalSM EAFE Index performed over the same period. The initial offering of Class T took place on January 6, 2005. See the previous page for additional information regarding the performance of Class T.
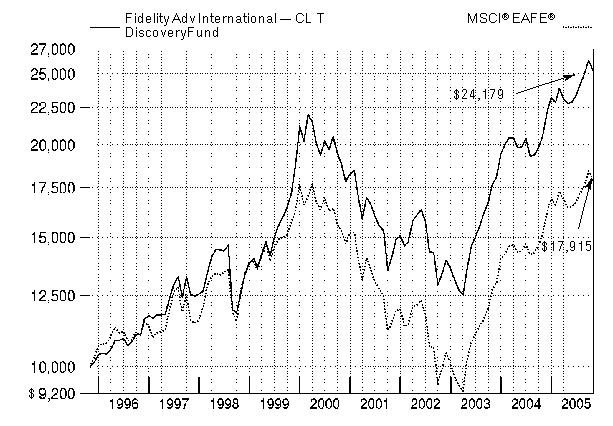
Annual Report 6
Management’s Discussion of Fund Performance
Comments from William Kennedy, Portfolio Manager of Fidelity Advisor International Discovery Fund
Foreign stock markets enjoyed broad based advances during the 12 month period that ended October 31, 2005, encouraged by better than expected corporate earnings and markedly improved economies. For the 12 months overall, the Morgan Stanley Capital InternationalSM Europe, Australasia, Far East (MSCI® EAFE®) Index a performance measure of developed stock markets outside the United States and Canada gained 18.28% . The Japanese stock market climbed to its highest level in more than four years. Positive economic indicators and Prime Minister Koizumi’s decisive election victory attracted record inflows from overseas investors. In response, the Tokyo Stock Exchange Stock Price Index (TOPIX) soared 22.89% . Southeast Asian equities outside of Japan, particularly South Korea, also responded well to the better macroeconomic environment, illustrated by the 19.44% return for the MSCI All Country Far East ex Japan index. Euro pean stock markets were up as well, despite investors’ concern about higher energy prices and potential downgrades to economic growth in the region. For the year overall, the MSCI Europe index rose 16.51% .
For the 12 months ending October 31, 2005, the fund (excluding sales charges) beat the MSCI EAFE index and the 17.75% return for the LipperSM International Funds Average. (For specific performance information on the fund’s Class A, Class T, Class B and Class C shares after sales charges, please see performance section of this report.) The fund would have done even better on an absolute basis were it not for currency movements in Europe and Japan that adversely affected U.S. investors. Relative to the index, performance benefited from strong stock picking, especially in financials and telecommunication services, as well as favorable country selection. Weak returns from semiconductor stocks and underweightings in certain index components hurt relative returns. Small and mid cap stocks that were not in the index were among the top relative performers. They included Orascom Telecom, an Egyptian wireless company that benefited from its growth in emerging markets, and Telewest Global, a cable company operating in England that was bought out at a nice premium. I sold both stocks during the period. Banco Bradesco and Banco Itau, Brazilian banks, also rallied nicely, fueled by strong demand for commercial and consumer loans. Underweightings in Mitsubishi UFJ Financial, a Japanese bank, and GlaxoSmithKline, a U.K. based pharmaceutical company, detracted from relative perfor mance as both stocks began to rally. An overweighting in Tokyo Electron, a semiconductor equipment stock that declined, further hampered relative returns.
The views expressed in this statement reflect those of the portfolio manager only through the end of the period of the report as stated on the cover and do not necessarily represent the views of Fidelity or any other person in the Fidelity organization. Any such views are subject to change at any time based upon market or other conditions and Fidelity disclaims any responsibility to update such views. These views may not be relied on as investment advice and, because investment decisions for a Fidelity fund are based on numerous factors, may not be relied on as an indication of trading intent on behalf of any Fidelity fund.
| 7 Annual Report 7 |
Shareholder Expense Example
As a shareholder of the Fund, you incur two types of costs: (1) transaction costs, including sales charges (loads) on redemptions of shares purchased prior to October 12, 1990, and redemption fees, and (2) ongoing costs, including management fees, distribution and/or service (12b 1) fees and other Fund expenses. This Example is intended to help you understand your ongoing costs (in dollars) of investing in the Fund and to compare these costs with the ongoing costs of investing in other mutual funds.
The Example is based on an investment of $1,000 invested at the beginning of the period and held for the entire period (May 1, 2005 to October 31, 2005).
| Actual Expenses |
The first line of the table below for each class of the Fund provides information about actual account values and actual expenses. You may use the information in this line, together with the amount you invested, to estimate the expenses that you paid over the period. Simply divide your account value by $1,000.00 (for example, an $8,600 account value divided by $1,000.00 = 8.6), then multiply the result by the number in the first line for a class of the Fund under the heading entitled “Expenses Paid During Period” to estimate the expenses you paid on your account during this period. A small balance maintenance fee of $12.00 that is charged once a year may apply for certain accounts with a value of less than $2,000. This fee is not included in the table below. If it was, the esti mate of expenses you paid during the period would be higher, and your ending account value lower, by this amount.
Hypothetical Example for Comparison Purposes
The second line of the table below for each class of the Fund provides information about hypothetical account values and hypothetical expenses based on a Class’ actual expense ratio and an assumed rate of return of 5% per year before expenses, which is not the Class’ actual return. The hypothetical account values and expenses may not be used to estimate the actual ending account balance or expenses you paid for the period. You may use this information to compare the ongoing costs of investing in the Fund and other funds. To do so, compare this 5% hypothetical example with the 5% hypothetical examples that appear in the shareholder reports of the other funds. A small balance maintenance fee of $12.00 that is charged once a year may apply for certain accounts with a value of less than $2,000. This fee is not included in the table below. If it was, the estimate of expenses you paid during the period would be higher, and your ending account value lower, by this amount.
| Annual Report |
| 8 |
Please note that the expenses shown in the table are meant to highlight your ongoing costs only and do not reflect any transaction costs. Therefore, the second line of the table is useful in comparing ongoing costs only, and will not help you determine the relative total costs of owning different funds. In addition, if these transactional costs were included, your costs would have been higher.
| Expenses Paid | ||||||||||||
| Beginning | Ending | During Period* | ||||||||||
| Account Value | Account Value | May 1, 2005 | ||||||||||
| May 1, 2005 | October 31, 2005 | to October 31, 2005 | ||||||||||
| Class A | ||||||||||||
| Actual | $ | 1,000.00 | $ | 1,105.20 | $ | 7.64 | ||||||
| HypotheticalA | $ | 1,000.00 | $ | 1,017.95 | $ | 7.32 | ||||||
| Class T | ||||||||||||
| Actual | $ | 1,000.00 | $ | 1,103.10 | $ | 9.28 | ||||||
| HypotheticalA | $ | 1,000.00 | $ | 1,016.38 | $ | 8.89 | ||||||
| Class B | ||||||||||||
| Actual | $ | 1,000.00 | $ | 1,100.40 | $ | 11.91 | ||||||
| HypotheticalA | $ | 1,000.00 | $ | 1,013.86 | $ | 11.42 | ||||||
| Class C | ||||||||||||
| Actual | $ | 1,000.00 | $ | 1,101.80 | $ | 10.91 | ||||||
| HypotheticalA | $ | 1,000.00 | $ | 1,014.82 | $ | 10.46 | ||||||
| International Discovery Fund | ||||||||||||
| Actual | $ | 1,000.00 | $ | 1,106.90 | $ | 5.68 | ||||||
| HypotheticalA | $ | 1,000.00 | $ | 1,019.81 | $ | 5.45 | ||||||
| Institutional Class | ||||||||||||
| Actual | $ | 1,000.00 | $ | 1,107.60 | $ | 5.21 | ||||||
| HypotheticalA | $ | 1,000.00 | $ | 1,020.27 | $ | 4.99 | ||||||
| A 5% return per year before expenses | ||||||||||||
* Expenses are equal to each Class’ annualized expense ratio (shown in the table below); multiplied by the average account value over the period, multiplied by 184/365 (to reflect the one half year period).
| Annualized | ||
| Expense Ratio | ||
| Class A | 1.44% | |
| Class T | 1.75% | |
| Class B | 2.25% | |
| Class C | 2.06% | |
| International Discovery Fund | 1.07% | |
| Institutional Class | 98% |
9 Annual Report
Investment Changes
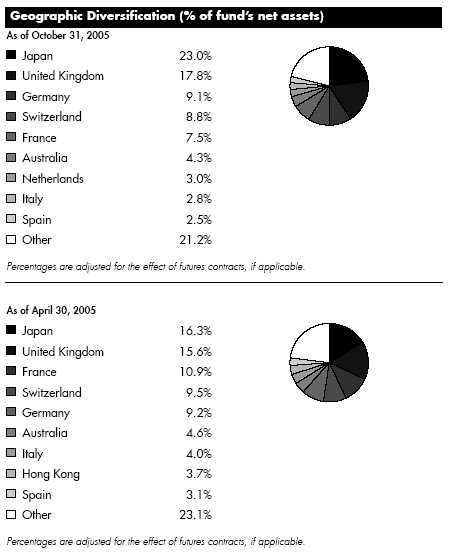
Annual Report 10
| Asset Allocation | ||||
| % of fund’s | % of fund’s net assets | |||
| net assets | 6 months ago | |||
| Stocks and Equity Futures | 99.4 | 98.5 | ||
| Short Term Investments and Net Other Assets | 0.6 | 1.5 | ||
| Top Ten Stocks as of October 31, 2005 | ||||
| % of fund’s | % of fund’s net assets | |||
| net assets | 6 months ago | |||
| BP PLC sponsored ADR (United Kingdom, Oil, | ||||
| Gas & Consumable Fuels) | 2.1 | 1.8 | ||
| Novartis AG (Reg.) (Switzerland, | ||||
| Pharmaceuticals) | 1.8 | 1.7 | ||
| Roche Holding AG (participation certificate) | ||||
| (Switzerland, Pharmaceuticals) | 1.8 | 1.7 | ||
| Total SA Series B (France, Oil, Gas & | ||||
| Consumable Fuels) | 1.7 | 1.6 | ||
| Vodafone Group PLC (United Kingdom, Wireless | ||||
| Telecommunication Services) | 1.6 | 1.5 | ||
| GlaxoSmithKline PLC sponsored ADR (United | ||||
| Kingdom, Pharmaceuticals) | 1.5 | 0.6 | ||
| Royal Dutch Shell PLC Class B (United Kingdom, | ||||
| Oil, Gas & Consumable Fuels) | 1.5 | 0.0 | ||
| Toyota Motor Corp. (Japan, Automobiles) | 1.4 | 0.6 | ||
| Nestle SA (Reg.) (Switzerland, Food Products) | 1.2 | 1.0 | ||
| Allianz AG (Reg.) (Germany, Insurance) | 1.2 | 1.0 | ||
| 15.8 | ||||
| Market Sectors as of October 31, 2005 | ||||
| % of fund’s | % of fund’s net assets | |||
| net assets | 6 months ago | |||
| Financials | 24.5 | 24.8 | ||
| Consumer Discretionary | 15.6 | 20.1 | ||
| Industrials | 11.0 | 10.3 | ||
| Health Care | 10.0 | 10.6 | ||
| Consumer Staples | 8.9 | 5.2 | ||
| Energy | 8.4 | 7.7 | ||
| Information Technology | 7.6 | 7.1 | ||
| Materials | 5.7 | 4.2 | ||
| Telecommunication Services | 4.4 | 5.6 | ||
| Utilities | 2.0 | 2.1 | ||
| 11 | Annual Report | |||
| Investments October 31, 2005 | ||||||
| Showing Percentage of Net Assets | ||||||
| Common Stocks 96.7% | ||||||
| Shares | Value (Note 1) | |||||
| (000s) | ||||||
| Australia – 4.3% | ||||||
| ABC Learning Centres Ltd. | 1,730,169 | $ | 8,409 | |||
| AMP Ltd. | 699,000 | 3,810 | ||||
| Babcock & Brown Japan Property Trust | 6,743,900 | 7,867 | ||||
| BHP Billiton Ltd. | 2,473,100 | 38,395 | ||||
| Billabong International Ltd. | 925,928 | 8,959 | ||||
| Caltex Australia Ltd. | 272,100 | 4,134 | ||||
| Commonwealth Bank of Australia | 241,000 | 7,006 | ||||
| Computershare Ltd. | 1,432,900 | 7,018 | ||||
| CSL Ltd. | 269,050 | 7,544 | ||||
| Downer EDI Ltd. | 2,523,506 | 11,473 | ||||
| Macquarie Airports unit | 1,991,381 | 4,467 | ||||
| Macquarie Bank Ltd. | 391,000 | 18,908 | ||||
| Macquarie Communications Infrastructure Group unit | 1,632,940 | 7,021 | ||||
| Macquarie Infrastructure Group unit | 1,632,500 | 4,187 | ||||
| QBE Insurance Group Ltd. | 978,567 | 13,025 | ||||
| Seek Ltd. | 2,000,000 | 4,247 | ||||
| Transurban Group unit | 918,000 | 4,393 | ||||
| Westfield Group unit | 676,200 | 8,398 | ||||
| TOTAL AUSTRALIA | 169,261 | |||||
| Austria – 0.6% | ||||||
| Erste Bank der Oesterreichischen Sparkassen AG | 208,400 | 10,842 | ||||
| OMV AG | 259,000 | 13,971 | ||||
| TOTAL AUSTRIA | 24,813 | |||||
| Belgium – 0.3% | ||||||
| InBev SA | 305,000 | 12,193 | ||||
| Bermuda – 0.0% | ||||||
| Catlin Group Ltd. | 224,221 | 1,923 | ||||
| Brazil – 0.6% | ||||||
| Banco Bradesco SA (PN) sponsored ADR (non-vtg.) | 222,300 | 11,535 | ||||
| Banco Itau Holding Financeira SA (PN) | 382,170 | 9,116 | ||||
| Banco Nossa Caixa SA | 103,000 | 1,706 | ||||
| TOTAL BRAZIL | 22,357 | |||||
| Canada 0.5% | ||||||
| EnCana Corp. | 410,000 | 18,747 | ||||
See accompanying notes which are an integral part of the financial statements.
| Annual Report |
| 12 |
| Common Stocks continued | ||||||
| Shares | Value (Note 1) | |||||
| (000s) | ||||||
| Cayman Islands – 0.2% | ||||||
| Foxconn International Holdings Ltd. | 4,277,000 | $ | 4,579 | |||
| Kingboard Chemical Holdings Ltd. | 1,351,000 | 2,858 | ||||
| TOTAL CAYMAN ISLANDS | 7,437 | |||||
| China – 0.4% | ||||||
| China Construction Bank Corp. (H Shares) | 26,650,000 | 8,079 | ||||
| Li Ning Co. Ltd. | 7,030,000 | 4,262 | ||||
| Xinao Gas Holdings Ltd. | 5,392,000 | 4,104 | ||||
| TOTAL CHINA | 16,445 | |||||
| Denmark – 0.9% | ||||||
| GN Store Nordic AS | 1,347,000 | 16,227 | ||||
| Vestas Wind Systems AS (a)(d) | 872,100 | 18,876 | ||||
| TOTAL DENMARK | 35,103 | |||||
| Finland – 2.0% | ||||||
| Citycon Oyj | 576,935 | 2,213 | ||||
| Fortum Oyj | 538,600 | 9,536 | ||||
| Metso Corp. | 400,500 | 10,418 | ||||
| Neste Oil Oyj | 174,750 | 5,415 | ||||
| Nokia Corp. sponsored ADR | 1,907,100 | 32,077 | ||||
| Nokian Tyres Ltd. | 500,300 | 7,797 | ||||
| Sampo Oyj (A Shares) | 695,900 | 10,678 | ||||
| TOTAL FINLAND | 78,134 | |||||
| France – 7.5% | ||||||
| Alstom SA (a) | 206,800 | 9,914 | ||||
| AXA SA | 572,300 | 16,574 | ||||
| BNP Paribas SA | 167,327 | 12,687 | ||||
| Eiffage SA | 64,893 | 5,601 | ||||
| Financiere Marc de Lacharriere SA (Fimalac) | 94,958 | 5,157 | ||||
| Groupe Danone | 73,800 | 7,529 | ||||
| Lagardere S.C.A. (Reg.) | 248,900 | 17,111 | ||||
| Louis Vuitton Moet Hennessy (LVMH) | 102,800 | 8,324 | ||||
| Neopost SA | 251,500 | 24,270 | ||||
| Nexity | 305,200 | 13,936 | ||||
| Orpea (a) | 249,764 | 13,473 | ||||
| Pernod Ricard SA | 158,600 | 27,739 | ||||
| Sanofi-Aventis sponsored ADR | 622,900 | 24,991 | ||||
| Suez SA (France) | 559,900 | 15,169 | ||||
| Total SA Series B | 261,544 | 65,920 | ||||
See accompanying notes which are an integral part of the financial statements.
13 Annual Report
| Investments continued | ||||||
| Common Stocks continued | ||||||
| Shares | Value (Note 1) | |||||
| (000s) | ||||||
| France – continued | ||||||
| Vinci SA | 84,500 | $ | 6,604 | |||
| Vivendi Universal SA sponsored ADR | 662,000 | 20,800 | ||||
| TOTAL FRANCE | 295,799 | |||||
| Germany – 8.4% | ||||||
| Allianz AG (Reg.) | 342,630 | 48,448 | ||||
| BASF AG | 213,900 | 15,401 | ||||
| Bayer AG sponsored ADR | 459,000 | 15,973 | ||||
| Bijou Brigitte Modische Accessoires AG | 12,480 | 2,596 | ||||
| CeWe Color Holding AG | 81,100 | 4,297 | ||||
| Continental AG | 93,400 | 7,143 | ||||
| DaimlerChrysler AG (Reg.) | 373,000 | 18,669 | ||||
| Deutsche Boerse AG | 136,000 | 12,798 | ||||
| Deutsche Telekom AG sponsored ADR | 1,110,800 | 19,661 | ||||
| Deutz AG (a)(d) | 505,500 | 2,291 | ||||
| E.ON AG | 405,800 | 36,778 | ||||
| ESCADA AG (a) | 134,277 | 3,412 | ||||
| GFK AG | 288,897 | 9,576 | ||||
| Hypo Real Estate Holding AG | 347,168 | 16,788 | ||||
| IWKA AG | 234,300 | 5,196 | ||||
| K&S AG | 37,900 | 2,487 | ||||
| Linde AG | 156,800 | 11,173 | ||||
| Merck KGaA | 180,100 | 14,897 | ||||
| MPC Muenchmeyer Petersen Capital AG | 50,500 | 3,572 | ||||
| MTU Aero Engines Holding AG | 337,500 | 9,811 | ||||
| Muenchener Rueckversicherungs Gesellschaft AG (Reg.) | 116,100 | 13,639 | ||||
| Pfleiderer AG (a) | 441,780 | 8,050 | ||||
| RWE AG | 255,519 | 16,320 | ||||
| SAP AG | 108,600 | 18,653 | ||||
| Siemens AG sponsored ADR | 74,400 | 5,537 | ||||
| SolarWorld AG | 81,900 | 11,067 | ||||
| TOTAL GERMANY | 334,233 | |||||
| Greece – 0.5% | ||||||
| EFG Eurobank Ergasias SA | 311,750 | 9,380 | ||||
| Greek Organization of Football Prognostics SA | 359,130 | 10,367 | ||||
| TOTAL GREECE | 19,747 | |||||
| Hong Kong – 2.2% | ||||||
| Chaoda Modern Agriculture (Holdings) Ltd. | 12,600,000 | 4,754 | ||||
| CNOOC Ltd. | 13,257,000 | 8,710 | ||||
| Esprit Holdings Ltd. | 2,846,000 | 20,063 | ||||
See accompanying notes which are an integral part of the financial statements.
| Annual Report |
| 14 |
| Common Stocks continued | ||||||
| Shares | Value (Note 1) | |||||
| (000s) | ||||||
| Hong Kong – continued | ||||||
| Hutchison Whampoa Ltd. | 2,234,000 | $ | 21,152 | |||
| Li & Fung Ltd. | 4,172,000 | 8,907 | ||||
| PYI Corp. Ltd. | 26,305 | 5 | ||||
| Shun Tak Holdings Ltd. | 2,424,000 | 1,751 | ||||
| Techtronic Industries Co. Ltd. | 6,707,500 | 16,483 | ||||
| Wharf Holdings Ltd. | 1,509,000 | 5,149 | ||||
| TOTAL HONG KONG | 86,974 | |||||
| India – 1.4% | ||||||
| Cipla Ltd. | 511,165 | 4,087 | ||||
| Crompton Greaves Ltd. | 252,847 | 3,452 | ||||
| Infosys Technologies Ltd. | 296,842 | 16,610 | ||||
| Pfizer Ltd. | 218,539 | 3,755 | ||||
| State Bank of India | 721,022 | 14,952 | ||||
| Suzlon Energy Ltd. (a) | 714,804 | 11,333 | ||||
| TOTAL INDIA | 54,189 | |||||
| Ireland – 1.2% | ||||||
| Allied Irish Banks PLC | 776,300 | 16,326 | ||||
| C&C Group PLC | 2,043,700 | 12,617 | ||||
| Independent News & Media PLC (Ireland) | 3,153,642 | 8,544 | ||||
| Paddy Power PLC (Ireland) | 623,197 | 10,534 | ||||
| TOTAL IRELAND | 48,021 | |||||
| Israel ��� 0.7% | ||||||
| Bank Hapoalim BM (Reg.) | 2,497,200 | 9,565 | ||||
| Bank Leumi le-Israel BM | 1,776,100 | 5,796 | ||||
| Teva Pharmaceutical Industries Ltd. sponsored ADR | 290,200 | 11,062 | ||||
| TOTAL ISRAEL | 26,423 | |||||
| Italy 2.1% | ||||||
| Banche Popolari Unite S.c.a.r.l. | 263,700 | 5,583 | ||||
| Cassa Di Risparmio Di Firenze | 2,248,700 | 6,707 | ||||
| ENI Spa | 288,800 | 7,725 | ||||
| ENI Spa sponsored ADR | 149,700 | 20,022 | ||||
| Lottomatica Spa New | 227,400 | 8,260 | ||||
| Mediobanca Spa | 391,500 | 6,932 | ||||
| Pirelli & C. Real Estate Spa | 122,800 | 6,720 | ||||
| Unicredito Italiano Spa | 3,725,500 | 20,802 | ||||
| TOTAL ITALY | 82,751 | |||||
See accompanying notes which are an integral part of the financial statements.
15 Annual Report
| Investments continued | ||||||
| Common Stocks continued | ||||||
| Shares | Value (Note 1) | |||||
| (000s) | ||||||
| Japan 21.7% | ||||||
| Aeon Co. Ltd. | 1,205,600 | $ | 25,058 | |||
| Asics Corp. | 327,000 | 2,821 | ||||
| Astellas Pharma, Inc. | 353,700 | 12,712 | ||||
| Canon, Inc. | 340,100 | 18,049 | ||||
| Credit Saison Co. Ltd. | 593,600 | 26,989 | ||||
| Daihatsu Motor Co. Ltd. | 782,000 | 7,463 | ||||
| Daikin Industries Ltd. | 350,000 | 9,154 | ||||
| E*TRADE Securities Co. Ltd. (d) | 3,361 | 17,668 | ||||
| FamilyMart Co. Ltd. | 281,200 | 8,402 | ||||
| Fullcast Co. Ltd. (d) | 1,334 | 3,443 | ||||
| Hokuto Corp. (d) | 144,400 | 2,343 | ||||
| Honda Motor Co. Ltd. | 200,100 | 11,130 | ||||
| Hoya Corp. | 111,400 | 3,917 | ||||
| Hoya Corp. New | 334,200 | 11,664 | ||||
| Ibiden Co. Ltd. | 269,900 | 10,939 | ||||
| JAFCO Co. Ltd. | 116,400 | 7,016 | ||||
| JGC Corp. | 400,000 | 6,551 | ||||
| JSR Corp. | 659,900 | 15,630 | ||||
| Kose Corp. | 165,200 | 5,994 | ||||
| Koyo Seiko Co. Ltd. | 659,000 | 10,604 | ||||
| Matsushita Electric Industrial Co. Ltd. | 1,492,000 | 27,453 | ||||
| Mitsubishi UFJ Financial Group, Inc. | 974 | 12,360 | ||||
| Mitsui & Co. Ltd. | 2,006,000 | 24,721 | ||||
| Mitsui Fudosan Co. Ltd. | 925,000 | 15,180 | ||||
| Mitsui Trust Holdings, Inc. | 1,921,000 | 23,191 | ||||
| Mizuho Financial Group, Inc. | 4,023 | 26,896 | ||||
| Nidec Corp. | 37,100 | 2,182 | ||||
| Nidec Corp. New | 37,100 | 2,182 | ||||
| Nikko Cordial Corp. | 1,732,500 | 21,005 | ||||
| Nippon Electric Glass Co. Ltd. | 923,000 | 17,705 | ||||
| Nippon Oil Corp. | 1,544,000 | 13,144 | ||||
| Nippon Steel Corp. | 1,972,000 | 7,053 | ||||
| Nishi-Nippon City Bank Ltd. (a) | 1,065,000 | 6,216 | ||||
| Nishimatsuya Chain Co. Ltd. | 70,900 | 2,702 | ||||
| Nitto Denko Corp. | 330,300 | 20,052 | ||||
| Nomura Holdings, Inc. | 557,600 | 8,637 | ||||
| Okumura Holdings, Inc. | 1,568,000 | 9,845 | ||||
| OMC Card, Inc. | 738,000 | 12,418 | ||||
| ORIX Corp. | 140,900 | 26,442 | ||||
| Saint Marc Co. Ltd. | 83,900 | 4,251 | ||||
| Sega Sammy Holdings, Inc. | 359,800 | 12,962 | ||||
| Sega Sammy Holdings, Inc. New | 359,800 | 13,056 | ||||
See accompanying notes which are an integral part of the financial statements.
| Annual Report |
| 16 |
| Common Stocks continued | ||||||
| Shares | Value (Note 1) | |||||
| (000s) | ||||||
| Japan – continued | ||||||
| Seiyu Ltd. (a)(d) | 2,865,000 | $ | 5,880 | |||
| Seven & I Holdings Co. Ltd. (a) | 576,900 | 18,985 | ||||
| SFCG Co. Ltd. | 6,990 | 1,688 | ||||
| SHIMIZU Corp. | 2,038,000 | 13,819 | ||||
| Sompo Japan Insurance, Inc | 1,506,000 | 22,693 | ||||
| Sugi Pharmacy Co. Ltd. | 171,900 | 6,669 | ||||
| Sumitomo Electric Industries Ltd. | 1,487,000 | 19,600 | ||||
| Sumitomo Forestry Co. Ltd. | 448,000 | 4,155 | ||||
| Sumitomo Mitsui Financial Group, Inc. | 3,629 | 33,628 | ||||
| Sumitomo Rubber Industries Ltd. | 677,000 | 8,337 | ||||
| Sumitomo Titanium Corp. (d) | 36,000 | 4,178 | ||||
| Sumitomo Titanium Corp. New | 36,000 | 4,053 | ||||
| T&D Holdings, Inc. | 311,000 | 19,634 | ||||
| Takeda Pharamaceutical Co. Ltd. | 196,000 | 10,795 | ||||
| The Daimaru, Inc. | 316,000 | 3,864 | ||||
| The Sumitomo Warehouse Co. Ltd. (d) | 338,000 | 2,629 | ||||
| THK Co. Ltd. | 387,900 | 8,768 | ||||
| TIS, Inc. | 92,600 | 2,189 | ||||
| Toho Titanium Co. Ltd. | 112,000 | 7,517 | ||||
| Tokuyama Corp. | 1,846,000 | 18,385 | ||||
| Tokyo Electron Ltd. | 195,600 | 9,842 | ||||
| Tokyo Star Bank Ltd. (a) | 296 | 1,041 | ||||
| Tokyo Tomin Bank Ltd. | 284,400 | 10,468 | ||||
| Toyo Ink Manufacturing Co. Ltd. | 829,000 | 3,568 | ||||
| Toyota Motor Corp. | 1,213,800 | 56,326 | ||||
| UCS Co. Ltd. | 1,000 | 38 | ||||
| Urban Corp. (d) | 237,200 | 14,749 | ||||
| USS Co. Ltd. | 82,540 | 5,690 | ||||
| Valor Co. Ltd. | 24,000 | 727 | ||||
| Yahoo! Japan Corp | 3,840 | 4,090 | ||||
| Yahoo! Japan Corp. New | 3,840 | 4,157 | ||||
| Yamada Denki Co. Ltd. | 70,200 | 6,183 | ||||
| TOTAL JAPAN | 861,545 | |||||
| Korea (South) 1.6% | ||||||
| Hyundai Department Store Co. Ltd. | 65,420 | 4,343 | ||||
| Hyundai Mobis | 69,770 | 5,547 | ||||
| LG Household & Health Care Ltd. | 177,780 | 9,706 | ||||
| NHN Corp. (a) | 57,857 | 9,615 | ||||
| Samsung Electronics Co. Ltd. | 18,972 | 10,031 | ||||
See accompanying notes which are an integral part of the financial statements.
17 Annual Report
| Investments continued | ||||||
| Common Stocks continued | ||||||
| Shares | Value (Note 1) | |||||
| (000s) | ||||||
| Korea (South) – continued | ||||||
| Shinhan Financial Group Co. Ltd. | 588,780 | $ | 19,626 | |||
| Shinsegae Co. Ltd. | 15,900 | 5,696 | ||||
| TOTAL KOREA (SOUTH) | 64,564 | |||||
| Luxembourg 0.6% | ||||||
| SES Global unit | 1,048,962 | 16,410 | ||||
| Stolt-Nielsen SA Class B sponsored ADR | 195,300 | 7,005 | ||||
| TOTAL LUXEMBOURG | 23,415 | |||||
| Mexico – 0.1% | ||||||
| Urbi, Desarrollos Urbanos, SA de CV (a) | 604,900 | 3,870 | ||||
| Netherlands – 3.0% | ||||||
| ASML Holding NV (NY Shares) (a) | 928,800 | 15,771 | ||||
| Axalto Holding NV (a) | 180,900 | 4,925 | ||||
| EADS NV (d) | 369,500 | 12,801 | ||||
| ING Groep NV (Certificaten Van Aandelen) | 588,444 | 16,982 | ||||
| Koninklijke Numico NV (a) | 229,000 | 9,273 | ||||
| Koninklijke Wessanen NV | 571,800 | 8,397 | ||||
| Randstad Holdings NV | 198,700 | 7,608 | ||||
| Tele Atlas NV (a) | 132,400 | 3,682 | ||||
| Unilever NV (NY Shares) | 405,900 | 28,539 | ||||
| VNU NV | 388,575 | 12,358 | ||||
| TOTAL NETHERLANDS | 120,336 | |||||
| Norway 1.5% | ||||||
| DnB NOR ASA | 1,648,600 | 16,851 | ||||
| Schibsted ASA (B Shares) | 321,200 | 9,257 | ||||
| TANDBERG ASA (d) | 585,300 | 5,758 | ||||
| TANDBERG Television ASA (a) | 833,500 | 10,377 | ||||
| Telenor ASA | 1,501,000 | 14,650 | ||||
| Yara International ASA | 291,600 | 4,807 | ||||
| TOTAL NORWAY | 61,700 | |||||
| Poland – 0.2% | ||||||
| TVN SA | 487,049 | 8,309 | ||||
| Portugal 0.2% | ||||||
| Media Capital SGPS SA (a) | 1,046,093 | 8,402 | ||||
| Russia – 0.2% | ||||||
| Mobile TeleSystems OJSC sponsored ADR | 146,700 | 5,426 | ||||
| Novatek JSC GDR (a)(e) | 66,900 | 1,504 | ||||
| TOTAL RUSSIA | 6,930 | |||||
See accompanying notes which are an integral part of the financial statements.
| Annual Report |
| 18 |
| Common Stocks continued | ||||||
| Shares | Value (Note 1) | |||||
| (000s) | ||||||
| Singapore – 0.5% | ||||||
| Ascendas Real Estate Investment Trust (A REIT) | 4,630,000 | $ | 5,494 | |||
| HTL International Holdings Ltd. | 5,750,000 | 4,277 | ||||
| Keppel Corp. Ltd. | 1,166,000 | 7,985 | ||||
| STATS ChipPAC Ltd. (a) | 4,624,000 | 2,539 | ||||
| TOTAL SINGAPORE | 20,295 | |||||
| South Africa 1.1% | ||||||
| FirstRand Ltd. | 3,829,000 | 9,010 | ||||
| JD Group Ltd. | 832,000 | 8,897 | ||||
| MTN Group Ltd. | 1,019,800 | 7,599 | ||||
| Nedbank Group Ltd | 404,000 | 5,148 | ||||
| Standard Bank Group Ltd. | 522,700 | 5,391 | ||||
| Steinhoff International Holdings Ltd. | 3,205,100 | 8,388 | ||||
| TOTAL SOUTH AFRICA | 44,433 | |||||
| Spain – 2.5% | ||||||
| Altadis SA (Spain) | 595,900 | 25,287 | ||||
| Antena 3 Television SA | 554,756 | 10,787 | ||||
| Banco Bilbao Vizcaya Argentaria SA | 904,800 | 15,952 | ||||
| Banco Santander Central Hispano SA | 1,324,300 | 16,805 | ||||
| Gestevision Telecinco SA | 76,300 | 1,693 | ||||
| Telefonica SA sponsored ADR | 610,279 | 29,263 | ||||
| TOTAL SPAIN | 99,787 | |||||
| Sweden – 1.4% | ||||||
| Eniro AB (d) | 1,035,700 | 11,318 | ||||
| Gambro AB (A Shares) | 549,550 | 7,765 | ||||
| Hennes & Mauritz AB (H&M) (B Shares) | 456,450 | 14,820 | ||||
| Modern Times Group AB (MTG) (B Shares) (a) | 160,900 | 6,154 | ||||
| Skandia Foersaekrings AB | 836,080 | 4,169 | ||||
| Telefonaktiebolaget LM Ericsson (B Shares) sponsored ADR | 366,300 | 12,018 | ||||
| TOTAL SWEDEN | 56,244 | |||||
| Switzerland – 8.8% | ||||||
| ABB Ltd. sponsored ADR (a) | 2,803,300 | 21,838 | ||||
| Actelion Ltd. (Reg.) (a) | 61,976 | 6,971 | ||||
| Compagnie Financiere Richemont unit | 499,334 | 18,999 | ||||
| Credit Suisse Group (Reg.) | 511,224 | 22,652 | ||||
| Logitech International SA (Reg.) (a) | 246,526 | 9,342 | ||||
| Nestle SA (Reg.) | 165,409 | 49,270 | ||||
| Nobel Biocare Holding AG (Switzerland) | 72,217 | 16,652 | ||||
| Novartis AG (Reg.) | 1,339,631 | 72,099 | ||||
See accompanying notes which are an integral part of the financial statements.
19 Annual Report
| Investments continued | ||||||
| Common Stocks continued | ||||||
| Shares | Value (Note 1) | |||||
| (000s) | ||||||
| Switzerland – continued | ||||||
| Pargesa Holding SA | 116,000 | $ | 8,953 | |||
| Phonak Holding AG | 213,528 | 8,903 | ||||
| Roche Holding AG (participation certificate) | 465,762 | 69,585 | ||||
| Societe Generale de Surveillance Holding SA (SGS) (Reg.) | 10,415 | 7,675 | ||||
| Syngenta AG (Switzerland) | 77,508 | 8,309 | ||||
| The Swatch Group AG (Reg.) | 311,573 | 8,858 | ||||
| UBS AG (NY Shares) | 243,750 | 20,882 | ||||
| TOTAL SWITZERLAND | 350,988 | |||||
| Taiwan 0.6% | ||||||
| Acer, Inc. | 3,086,440 | 6,246 | ||||
| Advanced Semiconductor Engineering, Inc. | 12,166,455 | 7,416 | ||||
| Holtek Semiconductor, Inc. | 2,780,371 | 3,282 | ||||
| Hon Hai Precision Industry Co. Ltd. (Foxconn) | 1,259,742 | 5,444 | ||||
| TOTAL TAIWAN | 22,388 | |||||
| Turkey 0.3% | ||||||
| Tupras Turkiye Petrol Rafinerileri AS | 815,000 | 13,930 | ||||
| United Arab Emirates – 0.4% | ||||||
| Investcom LLC GDR | 1,153,900 | 15,589 | ||||
| United Kingdom – 17.8% | ||||||
| Anglo American PLC (United Kingdom) | 627,100 | 18,541 | ||||
| AstraZeneca PLC sponsored ADR | 266,300 | 11,957 | ||||
| BAE Systems PLC | 4,750,009 | 27,794 | ||||
| Benfield Group PLC | 723,300 | 4,098 | ||||
| BG Group PLC | 1,368,000 | 12,013 | ||||
| BG Group PLC sponsored ADR | 200,000 | 8,904 | ||||
| Big Yellow Group PLC | 1,078,700 | 4,583 | ||||
| Body Shop International PLC | 694,700 | 2,583 | ||||
| BP PLC sponsored ADR | 1,241,500 | 82,433 | ||||
| British American Tobacco PLC sponsored ADR | 375,000 | 16,526 | ||||
| British Land Co. PLC | 627,900 | 9,894 | ||||
| Cadbury Schweppes PLC sponsored ADR | 183,000 | 7,263 | ||||
| Capita Group PLC | 1,106,900 | 7,643 | ||||
| Carnival PLC | 212,200 | 10,780 | ||||
| CLS Holdings PLC (a) | 623,893 | 5,056 | ||||
| Diageo PLC sponsored ADR (d) | 319,100 | 18,964 | ||||
| Enterprise Inns PLC | 505,225 | 6,972 | ||||
| GlaxoSmithKline PLC sponsored ADR | 1,177,000 | 61,192 | ||||
| Hilton Group PLC | 1,670,000 | 10,030 | ||||
See accompanying notes which are an integral part of the financial statements.
| Annual Report |
| 20 |
| Common Stocks continued | ||||||
| Shares | Value (Note 1) | |||||
| (000s) | ||||||
| United Kingdom – continued | ||||||
| HSBC Holdings PLC: | ||||||
| (Hong Kong) (Reg.) | 2,859,677 | $ | 45,046 | |||
| (United Kingdom) (Reg.) | 700,000 | 11,026 | ||||
| Imperial Tobacco Group PLC sponsored ADR | 175,100 | 10,107 | ||||
| Inchcape PLC | 274,800 | 10,022 | ||||
| Informa PLC | 1,379,400 | 9,140 | ||||
| Kazakhmys PLC | 392,800 | 3,755 | ||||
| Man Group PLC | 228,400 | 6,227 | ||||
| NDS Group PLC sponsored ADR (a) | 83,800 | 3,067 | ||||
| Prudential PLC | 1,400,482 | 11,753 | ||||
| Reckitt Benckiser PLC | 221,900 | 6,706 | ||||
| Reuters Group PLC sponsored ADR | 315,700 | 12,003 | ||||
| RHM PLC | 545,700 | 2,502 | ||||
| Rio Tinto PLC sponsored ADR | 119,100 | 18,177 | ||||
| Rolls Royce Group PLC | 1,870,810 | 12,089 | ||||
| Royal Bank of Scotland Group PLC | 707,171 | 19,581 | ||||
| Royal Dutch Shell PLC Class B | 1,861,659 | 60,886 | ||||
| SIG PLC | 536,100 | 6,454 | ||||
| Smiths Group PLC | 881,900 | 14,247 | ||||
| Standard Chartered PLC (United Kingdom) | 5,218 | 110 | ||||
| Tesco PLC | 2,887,000 | 15,372 | ||||
| Virgin Mobile Holdings (UK) PLC | 2,275,000 | 12,083 | ||||
| Vodafone Group PLC | 24,328,312 | 63,886 | ||||
| Whatman PLC | 735,900 | 3,648 | ||||
| William Hill PLC | 1,104,700 | 10,454 | ||||
| Yell Group PLC | 1,122,600 | 8,795 | ||||
| TOTAL UNITED KINGDOM | 704,362 | |||||
| United States of America – 0.4% | ||||||
| Macquarie Infrastructure Co. Trust | 131,000 | 3,930 | ||||
| Synthes, Inc. | 96,588 | 10,227 | ||||
| TOTAL UNITED STATES OF AMERICA | 14,157 | |||||
| TOTAL COMMON STOCKS | ||||||
| (Cost $3,254,009) | 3,835,794 | |||||
See accompanying notes which are an integral part of the financial statements.
21 Annual Report
| Investments continued | ||||||||||
| Nonconvertible Preferred Stocks 1.4% | ||||||||||
| Shares | Value (Note 1) | |||||||||
| (000s) | ||||||||||
| Germany – 0.7% | ||||||||||
| Fresenius AG | 91,800 | $ | 12,897 | |||||||
| Porsche AG (non-vtg.) | 20,595 | 14,850 | ||||||||
| TOTAL GERMANY | 27,747 | |||||||||
| Italy 0.7% | ||||||||||
| Banca Intesa Spa (Risp) | 4,403,802 | 19,073 | ||||||||
| Telecom Italia Spa (Risp) | 2,851,985 | 6,896 | ||||||||
| TOTAL ITALY | 25,969 | |||||||||
| United Kingdom – 0.0% | ||||||||||
| Rolls Royce Group PLC Series B | 62,485,054 | 112 | ||||||||
| TOTAL NONCONVERTIBLE PREFERRED STOCKS | ||||||||||
| (Cost $43,252) | 53,828 | |||||||||
| Government Obligations 0.1% | ||||||||||
| Principal | ||||||||||
| Amount (000s) | ||||||||||
| United States of America – 0.1% | ||||||||||
| U.S. Treasury Bills, yield at date of purchase 3.4% to | ||||||||||
| 3.7% 11/10/05 to 1/12/06 (f) | ||||||||||
| (Cost $3,537) | $ | 3,550 | 3,537 | |||||||
| Money Market Funds 3.8% | ||||||||||
| Shares | ||||||||||
| Fidelity Cash Central Fund, 3.92% (b) | 87,790,364 | 87,790 | ||||||||
| Fidelity Securities Lending Cash Central Fund, | ||||||||||
| 3.94% (b)(c) | 61,922,662 | 61,923 | ||||||||
| TOTAL MONEY MARKET FUNDS | ||||||||||
| (Cost $149,713) | 149,713 | |||||||||
| TOTAL INVESTMENT PORTFOLIO 102.0% | ||||||||||
| (Cost $3,450,511) | 4,042,872 | |||||||||
| NET OTHER ASSETS – (2.0)% | (78,121) | |||||||||
| NET ASSETS 100% | $ | 3,964,751 | ||||||||
See accompanying notes which are an integral part of the financial statements.
| Annual Report |
| 22 |
| Futures Contracts | ||||||||
| Expiration | Underlying | Unrealized | ||||||
| Date | Face Amount | Appreciation/ | ||||||
| at Value (000s) | (Depreciation) | |||||||
| (000s) | ||||||||
| Purchased | ||||||||
| Equity Index Contracts | ||||||||
| 734 Nikkei 225 Index Contracts (Japan) | Dec. 2005 | $ 50,224 | $ | 3,471 | ||||
The face value of futures purchased as a percentage of net assets – 1.3%
| Legend (a) Non-income producing (b) Affiliated fund that is available only to investment companies and other accounts managed by Fidelity Investments. The rate quoted is the annualized seven-day yield of the fund at period end. A complete unaudited listing of the fund’s holdings as of its most recent quarter end is available upon request. (c) Investment made with cash collateral received from securities on loan. (d) Security or a portion of the security is on loan at period end. (e) Security exempt from registration under Rule 144A of the Securities Act of 1933. These securities may be resold in transactions exempt from registration, normally to qualified institutional buyers. At the period end, the value of these securities amounted to $1,504,000 or 0.0% of net assets. (f) Security or a portion of the security was pledged to cover margin requirements for futures contracts. At the period end, the value of securities pledged amounted to $3,537,000. |
See accompanying notes which are an integral part of the financial statements.
23 Annual Report
| Financial Statements | ||||||||
| Statement of Assets and Liabilities | ||||||||
| Amounts in thousands (except per share amounts) | October 31, 2005 | |||||||
| Assets | ||||||||
| Investment in securities, at value (including securities | ||||||||
| loaned of $59,194) (cost $3,450,511) See | ||||||||
| accompanying schedule | $ | 4,042,872 | ||||||
| Foreign currency held at value (cost $5,466) | 5,473 | |||||||
| Receivable for investments sold | 63,155 | |||||||
| Receivable for fund shares sold | 11,994 | |||||||
| Dividends receivable | 4,355 | |||||||
| Interest receivable | 303 | |||||||
| Receivable for daily variation on futures contracts | 918 | |||||||
| Other affiliated receivables | 1 | |||||||
| Other receivables | 396 | |||||||
| Total assets | 4,129,467 | |||||||
| Liabilities | ||||||||
| Payable for investments purchased | $ | 96,287 | ||||||
| Payable for fund shares redeemed | 2,333 | |||||||
| Accrued management fee | 2,590 | |||||||
| Distribution fees payable | 3 | |||||||
| Other affiliated payables | 875 | |||||||
| Other payables and accrued expenses | 705 | |||||||
| Collateral on securities loaned, at value | 61,923 | |||||||
| Total liabilities | 164,716 | |||||||
| Net Assets | $ | 3,964,751 | ||||||
| Net Assets consist of: | ||||||||
| Paid in capital | $ | 3,137,488 | ||||||
| Undistributed net investment income | 40,185 | |||||||
| Accumulated undistributed net realized gain (loss) on | ||||||||
| investments and foreign currency transactions | 191,747 | |||||||
| Net unrealized appreciation (depreciation) on | ||||||||
| investments and assets and liabilities in foreign | ||||||||
| currencies | 595,331 | |||||||
| Net Assets | $ | 3,964,751 | ||||||
See accompanying notes which are an integral part of the financial statements.
| Annual Report |
| 24 |
| Statement of Assets and Liabilities | ||||
| Amounts in thousands (except per share amounts) | October 31, 2005 | |||
| Calculation of Maximum Offering Price | ||||
| Class A: | ||||
| Net Asset Value and redemption price per share | ||||
| ($1,864 ÷ 60.98 shares) | $ | 30.57 | ||
| Maximum offering price per share (100/94.25 of | ||||
| $30.57) | $ | 32.44 | ||
| Class T: | ||||
| Net Asset Value and redemption price per share | ||||
| ($1,859 ÷ 60.961 shares) | $ | 30.49 | ||
| Maximum offering price per share (100/96.50 of | ||||
| $30.49) | $ | 31.60 | ||
| Class B: | ||||
| Net Asset Value and offering price per share | ||||
| ($750 ÷ 24.7 shares)A | $ | 30.36 | ||
| Class C: | ||||
| Net Asset Value and offering price per share | ||||
| ($1,926 ÷ 63.34 shares)A | $ | 30.41 | ||
| International Discovery Fund: | ||||
| Net Asset Value and offering price per share | ||||
| ($3,948,625 ÷ 128,826 shares)A | $ | 30.65 | ||
| Institutional Class: | ||||
| Net Asset Value, offering price and redemption | ||||
| price per share ($9,727 ÷ 317 shares) | $ | 30.68 | ||
| A Redemption price per share is equal to net asset value less any applicable contingent deferred sales charge. | ||||
See accompanying notes which are an integral part of the financial statements.
25 Annual Report
| Financial Statements continued | ||||||
| Statement of Operations | ||||||
| Amounts in thousands | Year ended October 31, 2005 | |||||
| Investment Income | ||||||
| Dividends | $ | 75,520 | ||||
| Interest | 2,236 | |||||
| Security lending | 3,003 | |||||
| 80,759 | ||||||
| Less foreign taxes withheld | (7,662) | |||||
| Total income | 73,097 | |||||
| Expenses | ||||||
| Management fee | ||||||
| Basic fee | $ | 22,337 | ||||
| Performance adjustment | 497 | |||||
| Transfer agent fees | 7,458 | |||||
| Distribution fees | 18 | |||||
| Accounting and security lending fees | 1,279 | |||||
| Independent trustees’ compensation | 14 | |||||
| Custodian fees and expenses | 1,218 | |||||
| Registration fees | 376 | |||||
| Audit | 106 | |||||
| Legal | 15 | |||||
| Interest | 1 | |||||
| Miscellaneous | 30 | |||||
| Total expenses before reductions | 33,349 | |||||
| Expense reductions | (2,029) | 31,320 | ||||
| Net investment income (loss) | 41,777 | |||||
| Realized and Unrealized Gain (Loss) | ||||||
| Net realized gain (loss) on: | ||||||
| Investment securities (net of foreign taxes of $1,279) . | 191,163 | |||||
| Foreign currency transactions | (720) | |||||
| Futures contracts | 3,731 | |||||
| Total net realized gain (loss) | 194,174 | |||||
| Change in net unrealized appreciation (depreciation) on: | ||||||
| Investment securities (net of decrease in deferred for- | ||||||
| eign taxes of $374) | 320,747 | |||||
| Assets and liabilities in foreign currencies | (602) | |||||
| Futures contracts | 4,699 | |||||
| Total change in net unrealized appreciation | ||||||
| (depreciation) | 324,844 | |||||
| Net gain (loss) | 519,018 | |||||
| Net increase (decrease) in net assets resulting from | ||||||
| operations | $ | 560,795 | ||||
See accompanying notes which are an integral part of the financial statements.
| Annual Report |
| 26 |
| Statement of Changes in Net Assets | ||||||||
| Year ended | Year ended | |||||||
| October 31, | October 31, | |||||||
| Amounts in thousands | 2005 | 2004 | ||||||
| Increase (Decrease) in Net Assets | ||||||||
| Operations | ||||||||
| Net investment income (loss) | $ | 41,777 | $ | 16,421 | ||||
| Net realized gain (loss) | 194,174 | 91,216 | ||||||
| Change in net unrealized appreciation (depreciation) . | 324,844 | 127,395 | ||||||
| Net increase (decrease) in net assets resulting | ||||||||
| from operations | 560,795 | 235,032 | ||||||
| Distributions to shareholders from net investment income . | (12,813) | (10,818) | ||||||
| Distributions to shareholders from net realized gain | (10,250) | — | ||||||
| Total distributions | (23,063) | (10,818) | ||||||
| Share transactions - net increase (decrease) | 1,234,164 | 725,354 | ||||||
| Redemption fees | 193 | 227 | ||||||
| Total increase (decrease) in net assets | 1,772,089 | 949,795 | ||||||
| Net Assets | ||||||||
| Beginning of period | 2,192,662 | 1,242,867 | ||||||
| End of period (including undistributed net investment | ||||||||
| income of $40,185 and undistributed net investment | ||||||||
| income of $15,147, respectively) | $ | 3,964,751 | $ | 2,192,662 | ||||
See accompanying notes which are an integral part of the financial statements.
27 Annual Report
| Financial Highlights Class A | ||||
| Year ended October 31, | 2005F | |||
| Selected Per Share Data | ||||
| Net asset value, beginning of period | $ | 27.41 | ||
| Income from Investment Operations | ||||
| Net investment income (loss)E | 28 | |||
| Net realized and unrealized gain (loss) | 2.88 | |||
| Total from investment operations | 3.16 | |||
| Redemption fees added to paid in capitalE | —H | |||
| Net asset value, end of period | $ | 30.57 | ||
| Total ReturnB,C,D | 11.53% | |||
| Ratios to Average Net AssetsG | ||||
| Expenses before expense reductions | 1.42%A | |||
| Expenses net of voluntary waivers, if any | 1.42%A | |||
| Expenses net of all reductions | 1.36%A | |||
| Net investment income (loss) | 1.15%A | |||
| Supplemental Data | ||||
| Net assets, end of period (000 omitted) | $ | 1,864 | ||
| Portfolio turnover rate | 75% |
| A Annualized B Total returns for periods of less than one year are not annualized. C Total returns would have been lower had certain expenses not been reduced during the periods shown. D Total returns do not include the effect of the sales charges. E Calculated based on average shares outstanding during the period. F For the period January 6, 2005 (commencement of sale of shares) to October 31, 2005. G Expense ratios reflect operating expenses of the class. Expenses before reductions do not reflect amounts reimbursed by the investment adviser or reductions from brokerage service arrangements or other expense offset arrangements and do not represent the amount paid by the class during periods when reimbursements or reductions occur. Expense ratios before reductions for start up periods may not be representative of longer term operating periods. Expenses net of any voluntary waivers reflect expenses after reimbursement by the investment adviser but prior to reductions from brokerage service arrangements or other expense offset arrangements. Expenses net of all reductions represent the net expenses paid by the class. H Amount represents less than $.01 per share. |
See accompanying notes which are an integral part of the financial statements.
| Annual Report |
| 28 |
| Financial Highlights Class T | ||||
| Year ended October 31, | 2005F | |||
| Selected Per Share Data | ||||
| Net asset value, beginning of period | $ | 27.41 | ||
| Income from Investment Operations | ||||
| Net investment income (loss)E | 20 | |||
| Net realized and unrealized gain (loss) | 2.88 | |||
| Total from investment operations | 3.08 | |||
| Redemption fees added to paid in capitalE | —H | |||
| Net asset value, end of period | $ | 30.49 | ||
| Total ReturnB,C,D | 11.24% | |||
| Ratios to Average Net AssetsG | ||||
| Expenses before expense reductions | 1.75%A | |||
| Expenses net of voluntary waivers, if any | 1.75%A | |||
| Expenses net of all reductions | 1.69%A | |||
| Net investment income (loss) | 83%A | |||
| Supplemental Data | ||||
| Net assets, end of period (000 omitted) | $ | 1,859 | ||
| Portfolio turnover rate | 75% |
| A Annualized B Total returns for periods of less than one year are not annualized. C Total returns would have been lower had certain expenses not been reduced during the periods shown. D Total returns do not include the effect of the sales charges. E Calculated based on average shares outstanding during the period. F For the period January 6, 2005 (commencement of sale of shares) to October 31, 2005. G Expense ratios reflect operating expenses of the class. Expenses before reductions do not reflect amounts reimbursed by the investment adviser or reductions from brokerage service arrangements or other expense offset arrangements and do not represent the amount paid by the class during periods when reimbursements or reductions occur. Expense ratios before reductions for start up periods may not be representative of longer term operating periods. Expenses net of any voluntary waivers reflect expenses after reimbursement by the investment adviser but prior to reductions from brokerage service arrangements or other expense offset arrangements. Expenses net of all reductions represent the net expenses paid by the class. H Amount represents less than $.01 per share. |
See accompanying notes which are an integral part of the financial statements.
29 Annual Report
| Financial Highlights Class B | ||||
| Year ended October 31, | 2005F | |||
| Selected Per Share Data | ||||
| Net asset value, beginning of period | $ | 27.41 | ||
| Income from Investment Operations | ||||
| Net investment income (loss)E | 08 | |||
| Net realized and unrealized gain (loss) | 2.87 | |||
| Total from investment operations | 2.95 | |||
| Redemption fees added to paid in capitalE | —H | |||
| Net asset value, end of period | $ | 30.36 | ||
| Total ReturnB,C,D | 10.76% | |||
| Ratios to Average Net AssetsG | ||||
| Expenses before expense reductions | 2.24%A | |||
| Expenses net of voluntary waivers, if any | 2.24%A | |||
| Expenses net of all reductions | 2.18%A | |||
| Net investment income (loss) | 33%A | |||
| Supplemental Data | ||||
| Net assets, end of period (000 omitted) | $ | 750 | ||
| Portfolio turnover rate | 75% |
| A Annualized B Total returns for periods of less than one year are not annualized. C Total returns would have been lower had certain expenses not been reduced during the periods shown. D Total returns do not include the effect of the contingent deferred sales charge. E Calculated based on average shares outstanding during the period. F For the period January 6, 2005 (commencement of sale of shares) to October 31, 2005. G Expense ratios reflect operating expenses of the class. Expenses before reductions do not reflect amounts reimbursed by the investment adviser or reductions from brokerage service arrangements or other expense offset arrangements and do not represent the amount paid by the class during periods when reimbursements or reductions occur. Expense ratios before reductions for start up periods may not be representative of longer term operating periods. Expenses net of any voluntary waivers reflect expenses after reimbursement by the investment adviser but prior to reductions from brokerage service arrangements or other expense offset arrangements. Expenses net of all reductions represent the net expenses paid by the class. H Amount represents less than $.01 per share. |
See accompanying notes which are an integral part of the financial statements.
| Annual Report |
| 30 |
| Financial Highlights Class C | ||||
| Year ended October 31, | 2005F | |||
| Selected Per Share Data | ||||
| Net asset value, beginning of period | $ | 27.41 | ||
| Income from Investment Operations | ||||
| Net investment income (loss)E | 13 | |||
| Net realized and unrealized gain (loss) | 2.87 | |||
| Total from investment operations | 3.00 | |||
| Redemption fees added to paid in capitalE | —H | |||
| Net asset value, end of period | $ | 30.41 | ||
| Total ReturnB,C,D | 10.94% | |||
| Ratios to Average Net AssetsG | ||||
| Expenses before expense reductions | 2.04%A | |||
| Expenses net of voluntary waivers, if any | 2.04%A | |||
| Expenses net of all reductions | 1.98%A | |||
| Net investment income (loss) | 53%A | |||
| Supplemental Data | ||||
| Net assets, end of period (000 omitted) | $ | 1,926 | ||
| Portfolio turnover rate | 75% |
| A Annualized B Total returns for periods of less than one year are not annualized. C Total returns would have been lower had certain expenses not been reduced during the periods shown. D Total returns do not include the effect of the contingent deferred sales charge. E Calculated based on average shares outstanding during the period. F For the period January 6, 2005 (commencement of sale of shares) to October 31, 2005. G Expense ratios reflect operating expenses of the class. Expenses before reductions do not reflect amounts reimbursed by the investment adviser or reductions from brokerage service arrangements or other expense offset arrangements and do not represent the amount paid by the class during periods when reimbursements or reductions occur. Expense ratios before reductions for start up periods may not be representative of longer term operating periods. Expenses net of any voluntary waivers reflect expenses after reimbursement by the investment adviser but prior to reductions from brokerage service arrangements or other expense offset arrangements. Expenses net of all reductions represent the net expenses paid by the class. H Amount represents less than $.01 per share. |
See accompanying notes which are an integral part of the financial statements.
31 Annual Report
| Financial Highlights International Discovery Fund | ||||||||||||||
| Years ended October 31, | 2005 | 2004 | 2003 | 2002 | 2001 | |||||||||
| Selected Per Share Data | ||||||||||||||
| Net asset value, beginning of | ||||||||||||||
| period | $ 25.31 | $ 21.87 | $ 16.66 | $ | 17.61 | $ | 26.70 | |||||||
| Income from Investment | ||||||||||||||
| Operations | ||||||||||||||
| Net investment income (loss)C | 37 | .22 | .19 | .11 | .19D | |||||||||
| Net realized and unrealized | ||||||||||||||
| gain (loss) | 5.24 | 3.40 | 5.11 | (1.06) | (6.11) | |||||||||
| Total from investment operations . | 5.61 | 3.62 | 5.30 | (.95) | (5.92) | |||||||||
| Distributions from net investment | ||||||||||||||
| income | (.15) | (.18) | (.09) | — | (.51) | |||||||||
| Distributions from net realized | ||||||||||||||
| gain | (.12) | — | — | (2.66) | ||||||||||
| Total distributions | (.27) | (.18) | (.09) | (3.17) | ||||||||||
| Redemption fees added to paid in | ||||||||||||||
| capitalC,F | — | — | — | — | — | |||||||||
| Net asset value, end of period | $ 30.65 | $ 25.31 | $ 21.87 | $ | 16.66 | $ | 17.61 | |||||||
| Total ReturnA,B | 22.29% | 16.65% | 31.97% | (5.39)% | (24.91)% | |||||||||
| Ratios to Average Net AssetsE | ||||||||||||||
| Expenses before expense re- | ||||||||||||||
| ductions | 1.08% | 1.10% | 1.14% | 1.14% | 1.14% | |||||||||
| Expenses net of voluntary | ||||||||||||||
| waivers, if any | 1.07% | 1.10% | 1.14% | 1.14% | 1.14% | |||||||||
| Expenses net of all reductions . | 1.01% | 1.06% | 1.11% | 1.12% | 1.09% | |||||||||
| Net investment income (loss) | 1.35% | .92% | 1.08% | .59% | .91% | |||||||||
| Supplemental Data | ||||||||||||||
| Net assets, end of period (in | ||||||||||||||
| millions) | $ 3,949 | $ 2,193 | $ 1,243 | $ | 890 | $ | 882 | |||||||
| Portfolio turnover rate | 75% | 87% | 81% | 63% | 81% | |||||||||
| A Total returns would have been lower had certain expenses not been reduced during the periods shown. B Total returns do not include the effect of the contingent deferred sales charge. C Calculated based on average shares outstanding during the period. D Investment income per share reflects a special dividend which amounted to $.04 per share. E Expense ratios reflect operating expenses of the class. Expenses before reductions do not reflect amounts reimbursed by the investment adviser or reductions from brokerage service arrangements or other expense offset arrangements and do not represent the amount paid by the class during periods when reimbursements or reductions occur. Expenses net of any voluntary waivers reflect expenses after reimbursement by the investment adviser but prior to reductions from brokerage service arrangements or other expense offset arrangements. Expenses net of all reductions repre sent the net expenses paid by the class. F Amount represents less than $.01 per share. |
See accompanying notes which are an integral part of the financial statements.
| Annual Report |
| 32 |
| Financial Highlights Institutional Class | ||||
| Year ended October 31, | 2005E | |||
| Selected Per Share Data | ||||
| Net asset value, beginning of period | $ | 27.41 | ||
| Income from Investment Operations | ||||
| Net investment income (loss)D | 38 | |||
| Net realized and unrealized gain (loss) | 2.89 | |||
| Total from investment operations | 3.27 | |||
| Redemption fees added to paid in capitalD | —G | |||
| Net asset value, end of period | $ | 30.68 | ||
| Total ReturnB,C | 11.93% | |||
| Ratios to Average Net AssetsF | ||||
| Expenses before expense reductions | 97%A | |||
| Expenses net of voluntary waivers, if any | 97%A | |||
| Expenses net of all reductions | 90%A | |||
| Net investment income (loss) | 1.60%A | |||
| Supplemental Data | ||||
| Net assets, end of period (000 omitted) | $ | 9,727 | ||
| Portfolio turnover rate | 75% |
| A Annualized B Total returns for periods of less than one year are not annualized. C Total returns would have been lower had certain expenses not been reduced during the periods shown. D Calculated based on average shares outstanding during the period. E For the period January 6, 2005 (commencement of sale of shares) to October 31, 2005. F Expense ratios reflect operating expenses of the class. Expenses before reductions do not reflect amounts reimbursed by the investment adviser or reductions from brokerage service arrangements or other expense offset arrangements and do not represent the amount paid by the class during periods when reimbursements or reductions occur. Expense ratios before reductions for start up periods may not be representative of longer term operating periods. Expenses net of any voluntary waivers reflect expenses after reimbursement by the investment adviser but prior to reductions from brokerage service arrangements or other expense offset arrangements. Expenses net of all reductions represent the net expenses paid by the class. G Amount represents less than $.01 per share. |
See accompanying notes which are an integral part of the financial statements.
33 Annual Report
Notes to Financial Statements
| For the period ended October 31, 2005 |
1. Significant Accounting Policies.
Fidelity Advisor International Discovery Fund (the fund) is a fund of Fidelity Investment Trust (the trust) and is authorized to issue an unlimited number of shares. The trust is registered under the Investment Company Act of 1940, as amended (the 1940 Act), as an open end management investment company organized as a Massachusetts business trust.
The fund offers Class A, Class T, Class B, Class C, International Discovery Fund and Institutional Class shares, each of which has equal rights as to assets and voting privi leges. Each class has exclusive voting rights with respect to matters that affect that class. The fund commenced sale of Class A, Class T, Class B, Class C and Institutional Class shares on January 6, 2005. Class B shares will automatically convert to Class A shares after a holding period of seven years from the initial date of purchase. Investment income, realized and unrealized capital gains and losses, the common expenses of the fund, and certain fund level expense reductions, if any, are allocated on a pro rata basis to each class based on the relative net assets of each class to the total net assets of the fund. Each class differs with respect to transfer agent and distribution and service plan fees incurred. Certain expense reductions also differ by class.
The fund’s investments in emerging markets can be subject to social, economic, regula tory, and political uncertainties and can be extremely volatile.
The fund may invest in affiliated money market central funds (Money Market Central Funds), which are open end investment companies available to investment companies and other accounts managed by Fidelity Management & Research Company (FMR) and its affiliates. The financial statements have been prepared in conformity with accounting principles generally accepted in the United States of America, which require manage ment to make certain estimates and assumptions at the date of the financial statements. The following summarizes the significant accounting policies of the fund:
Security Valuation. Investments are valued and net asset value (NAV) per share is calculated (NAV calculation) as of the close of business of the New York Stock Exchange (NYSE), normally 4:00 p.m. Eastern time. Wherever possible, the fund uses independent pricing services approved by the Board of Trustees to value its investments.
Equity securities, including restricted securities, for which market quotations are readily available, are valued at the last reported sale price or official closing price as reported by an independent pricing service on the primary market or exchange on which they are traded. In the event there were no sales during the day or closing prices are not available, securities are valued at the last quoted bid price. Investments in open end mutual funds are valued at their closing net asset value each business day. Short term securities with remaining maturities of sixty days or less for which quotations are not readily available are valued at amortized cost, which approximates value.
| Annual Report |
| 34 |
1. Significant Accounting Policies continued
Security Valuation continued
When current market prices or quotations are not readily available or do not accurately reflect fair value, valuations may be determined in accordance with procedures adopted by the Board of Trustees. For example, when developments occur between the close of a market and the close of the NYSE that may materially affect the value of some or all of the securities, or when trading in a security is halted, those securities may be fair valued. Factors used in the determination of fair value may include monitoring news to identify significant market or security specific events such as changes in the value of U.S. securi ties market, reviewing developments in foreign markets and evaluating the performance of ADRs, futures contracts and exchange traded funds. Because the fund’s utilization of fair value pricing depends on market activity, the frequency with which fair value pricing is used can not be predicted and may be utilized to a significant extent. The value of securities used for NAV calculation under fair value pricing may differ from published prices for the same securities.
Foreign Currency. The fund uses foreign currency contracts to facilitate transactions in foreign denominated securities. Losses from these transactions may arise from changes in the value of the foreign currency or if the counterparties do not perform under the contracts’ terms.
Foreign denominated assets, including investment securities, and liabilities are trans lated into U.S. dollars at the exchange rate at period end. Purchases and sales of invest ment securities, income and dividends received and expenses denominated in foreign currencies are translated into U.S. dollars at the exchange rate in effect on the transac tion date.
The effects of exchange rate fluctuations on investments are included with the net realized and unrealized gain (loss) on investment securities. Other foreign currency transactions resulting in realized and unrealized gain (loss) are disclosed separately.
Investment Transactions and Income. Security transactions are accounted for as of trade date. Gains and losses on securities sold are determined on the basis of identified cost. Dividend income is recorded on the ex dividend date, except for certain dividends from foreign securities where the ex dividend date may have passed, which are recorded as soon as the fund is informed of the ex dividend date. Non cash dividends included in dividend income, if any, are recorded at the fair market value of the securities received. Interest income is accrued as earned. Interest income includes coupon interest and amortization of premium and accretion of discount on debt securities. Investment income is recorded net of foreign taxes withheld where recovery of such taxes is uncertain.
Expenses. Most expenses of the trust can be directly attributed to a fund. Expenses which cannot be directly attributed are apportioned among each fund in the trust.
35 Annual Report
Notes to Financial Statements continued
1. Significant Accounting Policies continued
Income Tax Information and Distributions to Shareholders. Each year, the fund intends to qualify as a regulated investment company by distributing all of its taxable income and realized gains under Subchapter M of the Internal Revenue Code. As a result, no provision for income taxes is required in the accompanying financial statements. Foreign taxes are provided for based on the fund’s understanding of the tax rules and rates that exist in the foreign markets in which it invests.
Distributions are recorded on the ex dividend date. Income dividends and capital gain distributions are declared separately for each class. Income and capital gain distribu tions are determined in accordance with income tax regulations, which may differ from generally accepted accounting principles. In addition, the fund will claim a portion of the payment made to redeeming shareholders as a distribution for income tax purposes.
Capital accounts within the financial statements are adjusted for permanent book tax differences. These adjustments have no impact on net assets or the results of operations. Temporary book tax differences will reverse in a subsequent period.
Book tax differences are primarily due to futures transactions, foreign currency transac tions, certain foreign taxes, passive foreign investment companies (PFIC), and losses deferred due to wash sales.
The tax basis components of distributable earnings and the federal tax cost as of period end were as follows:
| Unrealized appreciation | $ | 630,155,482 | ||
| Unrealized depreciation | (52,455,112) | |||
| Net unrealized appreciation (depreciation) | 577,700,370 | |||
| Undistributed ordinary income | 100,259,702 | |||
| Undistributed long term capital gain | 124,878,582 | |||
| Cost for federal income tax purposes | $ | 3,465,171,161 | ||
The tax character of distributions paid was as follows:
| October 31, 2005 | October 31, 2004 | |||||||
| Ordinary Income | $ | 12,812,810 | $ | 10,817,689 | ||||
| Long term Capital Gains | 10,250,246 | — | ||||||
| Total | $ | 23,063,056 | $ | 10,817,689 | ||||
| Annual Report |
| 36 |
1. Significant Accounting Policies continued
Short Term Trading (Redemption) Fees. Shares held in the fund less than 30 days are subject to a redemption fee equal to 1.00% of the proceeds of the redeemed shares. All redemption fees, including any estimated redemption fees paid by FMR, are retained by the fund and accounted for as an addition to paid in capital.
| 2. Operating Policies. |
Repurchase Agreements. FMR has received an Exemptive Order from the Securities and Exchange Commission (the SEC) which permits the fund and other affiliated entities of FMR to transfer uninvested cash balances into joint trading accounts which are then invested in repurchase agreements. The fund may also invest directly with institutions in repurchase agreements. Repurchase agreements are collateralized by government or non government securities. Collateral is held in segregated accounts with custodian banks and may be obtained in the event of a default of the counterparty. The fund monitors, on a daily basis, the value of the collateral to ensure it is at least equal to the principal amount of the repurchase agreement (including accrued interest). In the event of a default by the counterparty, realization of the collateral proceeds could be delayed, during which time the value of the collateral may decline.
Futures Contracts. The fund may use futures contracts to manage its exposure to the stock market. Buying futures tends to increase a fund’s exposure to the underlying instrument, while selling futures tends to decrease a fund’s exposure to the underlying instrument or hedge other fund investments. Futures contracts involve, to varying degrees, risk of loss in excess of any futures variation margin reflected in the Statement of Assets and Liabilities. The underlying face amount at value of any open futures contracts at period end is shown in the Schedule of Investments under the caption “Futures Contracts.” This amount reflects each contract’s exposure to the underlying instrument at period end. Losses may arise from changes in the value of the underlying instruments or if the counterparties do not perform under the contracts’ terms. Gains (losses) are realized upon the expiration or closing of the futures contracts. Futures contracts are valued at the settlement price established each day by the board of trade or exchange on which they are traded.
Restricted Securities. The fund may invest in securities that are subject to legal or contractual restrictions on resale. These securities generally may be resold in transac tions exempt from registration or to the public if the securities are registered. Disposal of these securities may involve time consuming negotiations and expense, and prompt sale at an acceptable price may be difficult. Information regarding restricted securities is included at the end of the fund’s Schedule of Investments.
37 Annual Report
Notes to Financial Statements continued
3. Purchases and Sales of Investments.
Purchases and sales of securities, other than short term securities and U.S. government securities, aggregated $3,540,147,268 and $2,247,496,092, respectively.
4. Fees and Other Transactions with Affiliates.
Management Fee. FMR and its affiliates provide the fund with investment manage ment related services for which the fund pays a monthly management fee. The manage ment fee is the sum of an individual fund fee rate that is based on an annual rate of .45% of the fund’s average net assets and a group fee rate that averaged .27% during the period. The group fee rate is based upon the average net assets of all the mutual funds advised by FMR. The group fee rate decreases as assets under management increase and increases as assets under management decrease. In addition, the management fee is subject to a performance adjustment (up to a maximum of .20% of the fund’s average net assets over a 36 month performance period). The upward or downward adjustment to the management fee is based on the investment performance of the asset weighted return of all classes as compared to an appropriate benchmark index. The fund’s perfor mance adjustment took effect in September 2005. Subsequent months will be added until the performance period includes 36 months. For the period, the total annual management fee rate, including the performance adjustment, was .74% of the fund’s average net assets.
Distribution and Service Plan. In accordance with Rule 12b 1 of the 1940 Act, the fund has adopted separate Distribution and Service Plans for each class of shares. Certain classes pay Fidelity Distributors Corporation (FDC), an affiliate of FMR, separate Distribution and Service Fees, each of which is based on an annual percentage of each class’ average net assets. In addition, FDC may pay financial intermediaries for selling shares of the fund and providing shareholder support services. For the period, the Distribution and Service Fee rates and the total amounts paid to and retained by FDC were as follows:
| Distribution | Service | Paid to | Retained | |||||||||
| Fee | Fee | FDC | by FDC | |||||||||
| Class A | 0% | .25% | $ | 1,809 | $ | 198 | ||||||
| Class T | 25% | .25% | 3,154 | 386 | ||||||||
| Class B | 75% | .25% | 3,610 | 2,916 | ||||||||
| Class C | 75% | .25% | 9,858 | 8,621 | ||||||||
| $ | 18,431 | $ | 12,121 | |||||||||
| Annual Report |
| 38 |
4. Fees and Other Transactions with Affiliates continued
Sales Load. FDC receives a front end sales charge of up to 5.75% for selling Class A shares, and 3.50% for selling Class T shares, some of which is paid to financial intermedi aries for selling shares of the fund. FDC receives the proceeds of contingent deferred sales charges levied on Class A, Class T, Class B, and Class C redemptions. These charges depend on the holding period. The deferred sales charges range from 5% to 1% for Class B, 1% for Class C, and .25% for certain purchases of Class A and Class T shares.
| For the period, sales charge amounts retained by FDC were as follows: | ||||
| Retained | ||||
| by FDC | ||||
| Class A | $ | 8,161 | ||
| Class T | 1,288 | |||
| Class B* | 74 | |||
| Class C* | — | |||
| $ | 9,523 |
* When Class B and Class C shares are initially sold, FDC pays commissions from its own resources to financial intermediaries through which the sales are made.
Transfer Agent Fees. Fidelity Investments Institutional Operations Company, Inc. (FIIOC), an affiliate of FMR, is the transfer, dividend disbursing and shareholder servic ing agent for each class of the fund, except for International Discovery Fund. Fidelity Service Company, Inc. (FSC), an affiliate of FMR, is the transfer agent for International Discovery Fund shares. FIIOC and FSC receive account fees and asset based fees that vary according to the account size and type of account of the shareholders of the respec tive classes of the fund. FIIOC and FSC pay for typesetting, printing and mailing of shareholder reports, except proxy statements. For the period the total transfer agent fees paid by each class to FIIOC or FSC, were as follows:
| % of | ||||||
| Average | ||||||
| Amount | Net Assets | |||||
| Class A | $ | 2,481 | .34* | |||
| Class T | 2,696 | .42* | ||||
| Class B | 1,516 | .42* | ||||
| Class C | 2,159 | .22* | ||||
| International Discovery Fund | 7,441,106 | .24 | ||||
| Institutional Class | 8,521 | .14* | ||||
| $ | 7,458,479 | |||||
| * Annualized |
Accounting and Security Lending Fees. FSC maintains the fund’s accounting rec ords. The accounting fee is based on the level of average net assets for the month. Under a separate contract, FSC administers the security lending program. The security lending fee is based on the number and duration of lending transactions.
39 Annual Report
| Notes to Financial Statements continued | ||
4. Fees and Other Transactions with Affiliates continued | ||
Affiliated Central Funds. The fund may invest in Money Market Central Funds which seek preservation of capital and current income and are managed by Fidelity Invest ments Money Management, Inc. (FIMM), an affiliate of FMR.
The Money Market Central Funds do not pay a management fee. Income distributions earned by the fund are recorded as income in the accompanying financial statements and totaled $4,677,957, for the period.
Brokerage Commissions. The fund placed a portion of its portfolio transactions with brokerage firms which are affiliates of the investment adviser. The commissions paid to these affiliated firms were $338 for the period.
| 5. Committed Line of Credit. |
The fund participates with other funds managed by FMR in a $4.2 billion credit facility (the “line of credit”) to be utilized for temporary or emergency purposes to fund share holder redemptions or for other short term liquidity purposes. The fund has agreed to pay commitment fees on its pro rata portion of the line of credit. During the period, there were no borrowings on this line of credit.
| 6. Security Lending. |
The fund lends portfolio securities from time to time in order to earn additional income. The fund receives collateral (in the form of U.S. Treasury obligations, letters of credit and/or cash) against the loaned securities and maintains collateral in an amount not less than 100% of the market value of the loaned securities during the period of the loan. The market value of the loaned securities is determined at the close of business of the fund and any additional required collateral is delivered to the fund on the next business day. If the borrower defaults on its obligation to return the securities loaned because of insol vency or other reasons, a fund could experience delays and costs in recovering the securities loaned or in gaining access to the collateral. Cash collateral is invested in the Fidelity Securities Lending Cash Central Fund. The value of loaned securities and cash collateral at period end are disclosed on the fund’s Statement of Assets and Liabilities. Security lending income represents the income earned on investing cash collateral, less fees and expenses associated with the loan, plus any premium payments that may be received on the loan of certain types of securities.
| Annual Report |
| 40 |
| 7. Bank Borrowings. |
The fund is permitted to have bank borrowings for temporary or emergency purposes to fund shareholder redemptions. The fund has established borrowing arrangements with certain banks. The interest rate on the borrowings is the bank’s base rate, as revised from time to time. The average daily loan balance during the period for which loans were outstanding amounted to $5,090,000. The weighted average interest rate was 3.13% . At period end, there were no bank borrowings outstanding.
| 8. Expense Reductions. |
FMR voluntarily agreed to reimburse a portion of Fidelity International Discovery Fund’s operating expenses. During this period, this reimbursement reduced the class expenses by $69,175.
FMR voluntarily agreed to reimburse each class to the extent annual operating expenses exceeded certain levels of average net assets as noted in the table below. Some expenses, for example interest expense, are excluded from this reimbursement.
| The following classes were in reimbursement during the period: | ||||||
| Expense | Reimbursement | |||||
| Limitations | from adviser | |||||
| Class T | 1.75% | $ | 35 | |||
Many of the brokers with whom FMR places trades on behalf of the fund provided services to the fund in addition to trade execution. These services included payments of certain expenses on behalf of the fund totaling $1,888,955 for the period. In addition, through arrangements with the fund’s custodian and each class’ transfer agent, credits realized as a result of uninvested cash balances were used to reduce the fund’s expenses. During the period, these credits reduced the fund’s custody expenses by $4,216. During the period, credits reduced each class’ transfer agent expense as noted in the table below.
| Transfer Agent | ||||
| expense reduction | ||||
| International Discovery Fund | $ | 66,176 | ||
| Institutional Class | 303 | |||
| $ | 66,479 | |||
| 9. Other. | ||||
The fund’s organizational documents provide former and current trustees and officers with a limited indemnification against liabilities arising in connection with the perfor mance of their duties to the fund. In the normal course of business, the fund may also enter into contracts that provide general indemnifications. The fund’s maximum expo sure under these arrangements is unknown as this would be dependent on future claims that may be made against the fund. The risk of material loss from such claims is consid ered remote.
41 Annual Report
| Notes to Financial Statements continued | ||||||||||||
| 10. Distributions to Shareholders. | ||||||||||||
| Distributions to shareholders of each class were as follows: | ||||||||||||
| Years ended October 31, | 2005 | 2004 | ||||||||||
| From net investment income | ||||||||||||
| International Discovery Fund | $ | 12,812,810 | $ | 10,817,689 | ||||||||
| From net realized gain | ||||||||||||
| International Discovery Fund | $ | 10,250,246 | $ | — | ||||||||
| 11. Share Transactions. | ||||||||||||
| Transactions for each class of shares were as follows: | ||||||||||||
| Shares | Dollars | |||||||||||
| Years ended October 31, | 2005A | 2004 | 2005A | 2004 | ||||||||
| Class A | ||||||||||||
| Shares sold | 62,020 | — | $ | 1,786,147 | $ | — | ||||||
| Shares redeemed | (1,044) | — | (30,450) | — | ||||||||
| Net increase (decrease) | 60,976 | — | $ | 1,755,697 | $ | — | ||||||
| Class T | ||||||||||||
| Shares sold | 62,995 | — | $ | 1,829,664 | $ | — | ||||||
| Shares redeemed | (2,034) | — | (58,410) | — | ||||||||
| Net increase (decrease) | 60,961 | — | $ | 1,771,254 | $ | — | ||||||
| Class B | ||||||||||||
| Shares sold | 26,549 | — | $ | 759,109 | $ | — | ||||||
| Shares redeemed | (1,863) | — | (53,496) | — | ||||||||
| Net increase (decrease) | 24,686 | — | $ | 705,613 | $ | — | ||||||
| Class C | ||||||||||||
| Shares sold | 63,361 | — | $ | 1,804,133 | $ | — | ||||||
| Shares redeemed | (17) | — | (530) | — | ||||||||
| Net increase (decrease) | 63,344 | — | $ | 1,803,603 | $ | — | ||||||
| International Discovery | ||||||||||||
| Fund | ||||||||||||
| Shares sold | 73,475,478 | 46,698,105 | $ 2,106,762,661 | $ | 1,135,826,685 | |||||||
| Reinvestment of | ||||||||||||
| distributions | 780,847 | 435,617 | 21,434,265 | 9,888,485 | ||||||||
| Shares redeemed | (32,072,087) | (17,322,166) | (909,132,021) | (420,361,799) | ||||||||
| Net increase (decrease) | 42,184,238 | 29,811,556 | $ 1,219,064,905 | $ | 725,353,371 | |||||||
| Institutional Class | ||||||||||||
| Shares sold | 364,765 | — | $ | 10,479,191 | $ | — | ||||||
| Shares redeemed | (47,766) | — | (1,415,764) | — | ||||||||
| Net increase (decrease) | 316,999 | — | $ | 9,063,427 | $ | — | ||||||
A Share transactions for Class A, T, B, C and Institutional Class are for the period January 6, 2005 (commencement of sale of shares) to October 31, 2005.
| Annual Report |
| 42 |
Report of Independent Registered Public Accounting Firm
To the Trustees of Fidelity Investment Trust and the Shareholders of Fidelity In ternational Discovery Fund:
In our opinion, the accompanying statement of assets and liabilities, including the sched ule of investments, and the related statements of operations and of changes in net assets and the financial highlights present fairly, in all material respects, the financial position of Fidelity International Discovery Fund (a fund of Fidelity Investment Trust) at October 31, 2005 and the results of its operations, the changes in its net assets and the financial highlights for the periods indicated, in conformity with accounting principles generally accepted in the United States of America. These financial statements and financial highlights (hereafter referred to as “financial statements”) are the responsibility of the Fidelity International Discovery Fund’s management; our responsibility is to express an opinion on these financial statements based on our audits. We conducted our audits of these financial statements in accordance with the standards of the Public Company Accounting Oversight Board (United States). Those standards require that we plan and perform the audit to obtain reasonable assurance about whether the financial statements are free of material misstatement. An audit includes examining, on a test basis, evidence supporting the amounts and disclosures in the financial statements, assessing the ac counting principles used and significant estimates made by management, and evaluating the overall financial statement presentation. We believe that our audits, which included confirmation of securities at October 31, 2005 by correspondence with the custodian and brokers, provide a reasonable basis for our opinion.
| /s/ PricewaterhouseCoopers LLP PricewaterhouseCoopers LLP Boston, Massachusetts December 13, 2005 |
43 Annual Report
Trustees and Officers
The Trustees, Members of the Advisory Board, and executive officers of the trust and fund, as applicable, are listed below. The Board of Trustees governs the fund and is responsible for protecting the interests of shareholders. The Trustees are experienced executives who meet periodically throughout the year to oversee the fund’s activities, review contractual arrangements with companies that provide services to the fund, and review the fund’s performance. Except for William O. McCoy, Stephen P. Jonas, and Kenneth L. Wolfe, each of the Trustees oversees 322 funds advised by FMR or an affiliate. Mr. McCoy oversees 324 funds advised by FMR or an affiliate. Mr. Jonas and Mr. Wolfe oversee 319 funds advised by FMR or an affiliate.
The Trustees hold office without limit in time except that (a) any Trustee may resign; (b) any Trustee may be removed by written instrument, signed by at least two thirds of the number of Trustees prior to such removal; (c) any Trustee who requests to be retired or who has become incapacitated by illness or injury may be retired by written instru ment signed by a majority of the other Trustees; and (d) any Trustee may be removed at any special meeting of shareholders by a two thirds vote of the outstanding voting securities of the trust. Each Trustee who is not an interested person (as defined in the 1940 Act) (Independent Trustee), shall retire not later than the last day of the calendar year in which his or her 72nd birthday occurs. The Independent Trustees may waive this mandatory retirement age policy with respect to individual Trustees. The executive officers and Advisory Board Members hold office without limit in time, except that any officer and Advisory Board Member may resign or may be removed by a vote of a majority of the Trustees at any regular meeting or any special meeting of the Trustees. Except as indicated, each individual has held the office shown or other offices in the same company for the past five years.
The fund’s Statement of Additional Information (SAI) includes more information about the Trustees. To request a free copy, call Fidelity at 1-877-208-0098.
| Interested Trustees*: |
Correspondence intended for each Trustee who is an interested person may be sent to Fidelity Investments, 82 Devonshire Street, Boston, Massachusetts 02109.
| Name, Age; Principal Occupation Edward C. Johnson 3d (75)** |
Year of Election or Appointment: 1984
Mr. Johnson is Chairman of the Board of Trustees. Mr. Johnson serves as Chief Executive Officer, Chairman, and a Director of FMR Corp.; a Di rector and Chairman of the Board and of the Executive Committee of FMR; Chairman and a Director of Fidelity Management & Research (Far East) Inc.; Chairman and a Director of Fidelity Investments Money Man agement, Inc.; and Chairman (2001 present) and a Director (2000 present) of FMR Co., Inc.
| Annual Report |
| 44 |
| Name, Age; Principal Occupation Abigail P. Johnson (43)** |
Year of Election or Appointment: 2001
Ms. Johnson serves as President of Fidelity Employer Services Company (FESCO) (2005 present). She is President and a Director of Fidelity In vestments Money Management, Inc. (2001 present), FMR Co., Inc. (2001 present), and a Director of FMR Corp. Previously, Ms. Johnson served as President and a Director of FMR (2001 2005), Senior Vice President of the Fidelity funds (2001 2005), and managed a number of Fidelity funds.
| Stephen P. Jonas (52) |
Year of Election or Appointment: 2005
Mr. Jonas is Senior Vice President of the fund (2005 present). He also serves as Senior Vice President of other Fidelity funds (2005 present). Mr. Jonas is Executive Director of FMR (2005 present). Previously, Mr. Jonas served as President of Fidelity Enterprise Operations and Risk Services (2004 2005), Chief Administrative Officer (2002 2004), and Chief Financial Officer of FMR Co. (1998 2000). Mr. Jonas has been with Fidelity Investments since 1987 and has held various financial and management positions including Chief Financial Officer of FMR. In addi tion, he serves on the Boards of Boston Ballet (2003 present) and Sim mons College (2003 present).
| Robert L. Reynolds (53) |
Year of Election or Appointment: 2003
Mr. Reynolds is a Director (2003 present) and Chief Operating Officer (2002 present) of FMR Corp. He also serves on the Board at Fidelity Investments Canada, Ltd. (2000 present). Previously, Mr. Reynolds served as President of Fidelity Investments Institutional Retirement Group (1996 2000).
* Trustees have been determined to be “Interested Trustees” by virtue of, among other things, their affiliation with the trust or various entities under common control with FMR.
** Edward C. Johnson 3d, Trustee, is Abigail P. Johnson’s father.
45 Annual Report
Trustees and Officers - continued
Independent Trustees:
Correspondence intended for each Independent Trustee (that is, the Trustees other than the Interested Trustees) may be sent to Fidelity Investments, P.O. Box 55235, Boston, Massachusetts 02205 5235.
| Name, Age; Principal Occupation Dennis J. Dirks (57) |
Year of Election or Appointment: 2005
Prior to his retirement in May 2003, Mr. Dirks was Chief Operating Officer and a member of the Board of The Depository Trust & Clearing Corporation (DTCC) (1999 2003). He also served as President, Chief Operating Officer, and Board member of The Depository Trust Company (DTC) (1999 2003) and President and Board member of the National Securities Clearing Corporation (NSCC) (1999 2003). In addi tion, Mr. Dirks served as Chief Executive Officer and Board member of the Government Securities Clearing Corporation (2001 2003) and Chief Executive Officer and Board member of the Mortgage Backed Securities Clearing Corporation (2001 2003). Mr. Dirks also serves as a Trustee of Manhattan College (2005 present).
| Robert M. Gates (62) |
Year of Election or Appointment: 1997
Dr. Gates is Vice Chairman of the Independent Trustees (2005 present). Dr. Gates is President of Texas A&M University (2002 present). He was Director of the Central Intelligence Agency (CIA) from 1991 to 1993. From 1989 to 1991, Dr. Gates served as Assistant to the President of the United States and Deputy National Security Advisor. Dr. Gates is a Director of NACCO Industries, Inc. (mining and manufacturing), Parker Drilling Co., Inc. (drilling and rental tools for the energy industry, 2001 present), and Brinker International (restaurant management, 2003 present). Previously, Dr. Gates served as a Director of LucasVarity PLC (automotive components and diesel engines), a Director of TRW Inc. (automotive, space, defense, and information technology), and Dean of the George Bush School of Government and Public Service at Texas A&M University (1999 2001). Dr. Gates also is a Trustee of the Forum for International Policy.
| Annual Report |
| 46 |
| Name, Age; Principal Occupation George H. Heilmeier (69) |
Year of Election or Appointment: 2004
Dr. Heilmeier is Chairman Emeritus of Telcordia Technologies (commu nication software and systems), where prior to his retirement, he served as company Chairman and Chief Executive Officer. He currently serves on the Boards of Directors of The Mitre Corporation (systems engineer ing and information technology support for the government), and HRL Laboratories (private research and development, 2004 present). He is Chairman of the General Motors Science & Technology Advisory Board and a Life Fellow of the Institute of Electrical and Electronics Engineers (IEEE) (2000 present). Dr. Heilmeier is a member of the Defense Science Board and the National Security Agency Advisory Board. He is also a member of the National Academy of Engineering, the American Aca demy of Arts and Sciences, and the Board of Overseers of the School of Engineering and Applied Science of the University of Pennsylvania. Pre viously, Dr. Heilmeier served as a Director of TRW Inc. (automotive, space, defense, and information technology, 1992 2002), Compaq (1994 2002), Automatic Data Processing, Inc. (ADP) (technology based business outsourcing, 1995 2002), INET Technologies Inc. (telecommu nications network surveillance, 2001 2004), and Teletech Holdings (cus tomer management services). He is the recipient of the 2005 Kyoto Prize in Advanced Technology for his invention of the liquid display.
| Marie L. Knowles (59) |
Year of Election or Appointment: 2001
Prior to Ms. Knowles’ retirement in June 2000, she served as Executive Vice President and Chief Financial Officer of Atlantic Richfield Company (ARCO) (diversified energy, 1996 2000). From 1993 to 1996, she was a Senior Vice President of ARCO and President of ARCO Transportation Company. She served as a Director of ARCO from 1996 to 1998. She currently serves as a Director of Phelps Dodge Corporation (copper mining and manufacturing) and McKesson Corporation (healthcare ser vice, 2002 present). Ms. Knowles is a Trustee of the Brookings Institution and the Catalina Island Conservancy and also serves as a member of the Advisory Board for the School of Engineering of the University of Southern California.
47 Annual Report
Trustees and Officers - continued
| Name, Age; Principal Occupation Ned C. Lautenbach (61) |
Year of Election or Appointment: 2000
Mr. Lautenbach has been a partner of Clayton, Dubilier & Rice, Inc. (private equity investment firm) since September 1998. Previously, Mr. Lautenbach was with the International Business Machines Corporation (IBM) from 1968 until his retirement in 1998. Mr. Lautenbach serves as a Director of Italtel Holding S.p.A. (telecommunications (Milan, Italy), 2004 present) and Eaton Corporation (diversified industrial) as well as the Philharmonic Center for the Arts in Naples, Florida. He also is a member of the Board of Trustees of Fairfield University (2005 present), as well as a member of the Council on Foreign Relations.
| Marvin L. Mann (72) |
Year of Election or Appointment: 1993
Mr. Mann is Chairman of the Independent Trustees (2001 present). He is Chairman Emeritus of Lexmark International, Inc. (computer peripherals), where he served as CEO until April 1998, retired as Chairman May 1999, and remains a member of the Board. Prior to 1991, he held the positions of Vice President of International Business Machines Corporation (IBM) and President and General Manager of various IBM divisions and subsidiaries. He is a member of the Executive Committee of the Independent Director’s Council of the Investment Com pany Institute. In addition, Mr. Mann is a member of the President’s Cabinet at the University of Alabama and the Board of Visitors of the Culverhouse College of Commerce and Business Administration at the University of Alabama.
| William O. McCoy (72) |
Year of Election or Appointment: 1997
Prior to his retirement in December 1994, Mr. McCoy was Vice Chair man of the Board of BellSouth Corporation (telecommunications) and President of BellSouth Enterprises. He is currently a Director of Liberty Corporation (holding company), Duke Realty Corporation (real estate), and Progress Energy, Inc. (electric utility). He is also a partner of Frank lin Street Partners (private investment management firm) and a member of the Research Triangle Foundation Board. In addition, Mr. McCoy served as the Interim Chancellor (1999 2000) and a member of the Board of Visitors for the University of North Carolina at Chapel Hill and currently serves on the Board of Directors of the University of North Carolina Health Care System and the Board of Visitors of the Kenan Flagler Business School (University of North Carolina at Chapel Hill). He also served as Vice President of Finance for the University of North Car olina (16 school system).
| Annual Report |
| 48 |
| Name, Age; Principal Occupation Cornelia M. Small (61) |
Year of Election or Appointment: 2005
Ms. Small is a member (2000 present) and Chairperson (2002 present) of the Investment Committee, and a member (2002 present) of the Board of Trustees of Smith College. Previously, she served as Chief In vestment Officer (1999 2000), Director of Global Equity Investments (1996 1999), and a member of the Board of Directors of Scudder, Stevens & Clark (1990 1997) and Scudder Kemper Investments (1997 1998). In addition, Ms. Small served as Co Chair (2000 2003) of the Annual Fund for the Fletcher School of Law and Diplomacy.
| William S. Stavropoulos (66) |
Year of Election or Appointment: 2001
Mr. Stavropoulos is Chairman of the Board (2000 present) and a Mem ber of the Board of Directors of The Dow Chemical Company. Since joining The Dow Chemical Company in 1967, Mr. Stavropoulos served in numerous senior management positions, including President (1993 2000; 2002 2003), CEO (1995 2000; 2002 2004), and Chair man of the Executive Committee (2000 2004). Currently, he is a Direc tor of NCR Corporation (data warehousing and technology solutions), BellSouth Corporation (telecommunications), Chemical Financial Corpo ration, Maersk Inc. (industrial conglomerate, 2002 present), and Metal mark Capital (private equity investment firm, 2005 present). He also serves as a member of the Board of Trustees of the American Enterprise Institute for Public Policy Research. In addition, Mr. Stavropoulos is a member of The Business Council, J.P. Morgan International Council and the University of Notre Dame Advisory Council for the College of Science.
| Kenneth L. Wolfe (66) |
Year of Election or Appointment: 2005
Mr. Wolfe also serves as a Trustee (2005 present) or Member of the Advisory Board (2004 present) of other investment companies advised by FMR. Prior to his retirement in 2001, Mr. Wolfe was Chairman and Chief Executive Officer of Hershey Foods Corporation (1993 2001). He currently serves as a member of the boards of Adelphia Communica tions Corporation (2003 present), Bausch & Lomb, Inc., and Revlon Inc. (2004 present).
49 Annual Report
Trustees and Officers - continued
Advisory Board Members and Executive Officers:
Correspondence intended for Mr. Gamper may be sent to Fidelity Investments, P.O. Box 55235, Boston, Massachusetts 02205 5235. Correspondence intended for each executive officer and Mr. Lynch may be sent to Fidelity Investments, 82 Devonshire Street, Boston, Massachusetts 02109.
| Name, Age; Principal Occupation Albert R. Gamper, Jr. (63) |
Year of Election or Appointment: 2005
Member of the Advisory Board of Fidelity Investment Trust. Prior to his retirement in December 2004, Mr. Gamper served as Chairman of the Board of CIT Group Inc. (commercial finance). During his tenure with CIT Group Inc. Mr. Gamper served in numerous senior management positions, including Chairman (1987 1989; 1999 2001; 2002 2004), Chief Executive Officer (1987 2004), and President (1989 2002). He currently serves as a member of the Board of Directors of Public Service Enterprise Group (utilities, 2001 present), Chairman of the Board of Governors, Rutgers University (2004 present), and Chairman of the Board of Saint Barnabas Health Care System.
| Peter S. Lynch (61) |
Year of Election or Appointment: 2003
Member of the Advisory Board of Fidelity Investment Trust. Vice Chair man and a Director of FMR, and Vice Chairman (2001 present) and a Director (2000 present) of FMR Co., Inc. Previously, Mr. Lynch served as a Trustee of the Fidelity funds (1990 2003). In addition, he serves as a Trustee of Boston College, Massachusetts Eye & Ear Infirmary, Historic Deerfield, John F. Kennedy Library, and the Museum of Fine Arts of Boston.
| Dwight D. Churchill (51) |
Year of Election or Appointment: 2005
Vice President of the fund. Mr. Churchill also serves as Vice President of certain Equity Funds (2005 present) and certain High Income Funds (2005 present). Previously, he served as Head of Fidelity’s Fixed Income Division (2000 2005), Vice President of Fidelity’s Money Market Funds (2000 2005), Vice President of Fidelity’s Bond Funds, and Senior Vice President of FIMM (2000) and FMR. Mr. Churchill joined Fidelity in 1993 as Vice President and Group Leader of Taxable Fixed Income Investments.
| William Kennedy (37) |
Year of Election or Appointment: 2005
Vice President of the fund. Prior to assuming his current responsibilities, Mr. Kennedy worked as a research analyst and manager.
| Annual Report |
| 50 |
| Name, Age; Principal Occupation Eric D. Roiter (56) |
Year of Election or Appointment: 1998
Secretary of the fund. He also serves as Secretary of other Fidelity funds; Vice President, General Counsel, and Secretary of FMR Co., Inc. (2001 present) and FMR; Assistant Secretary of Fidelity Management & Research (U.K.) Inc. (2001 present), Fidelity Management & Research (Far East) Inc. (2001 present), and Fidelity Investments Money Manage ment, Inc. (2001 present). Mr. Roiter is an Adjunct Member, Faculty of Law, at Boston College Law School (2003 present). Previously, Mr. Roiter served as Vice President and Secretary of Fidelity Distributors Corpora tion (FDC) (1998 2005).
| Stuart Fross (46) |
Year of Election or Appointment: 2003
Assistant Secretary of the fund. Mr. Fross also serves as Assistant Secre tary of other Fidelity funds (2003 present), Vice President and Secretary of FDC (2005 present), and is an employee of FMR.
| Christine Reynolds (47) |
Year of Election or Appointment: 2004
President, Treasurer, and Anti Money Laundering (AML) officer of the fund. Ms. Reynolds also serves as President, Treasurer, and AML officer of other Fidelity funds (2004) and is a Vice President (2003) and an employee (2002) of FMR. Before joining Fidelity Investments, Ms. Reynolds worked at PricewaterhouseCoopers LLP (PwC) (1980 2002), where she was most recently an audit partner with PwC’s investment management practice.
| Paul M. Murphy (58) |
Year of Election or Appointment: 2005
Chief Financial Officer of the fund. Mr. Murphy also serves as Chief Financial Officer of other Fidelity funds (2005 present). He also serves as Senior Vice President of Fidelity Pricing and Cash Management Ser vices Group (FPCMS).
| Kenneth A. Rathgeber (58) |
Year of Election or Appointment: 2004
Chief Compliance Officer of the fund. Mr. Rathgeber also serves as Chief Compliance Officer of other Fidelity funds (2004) and Executive Vice President of Risk Oversight for Fidelity Investments (2002). Pre viously, he served as Executive Vice President and Chief Operating Officer for Fidelity Investments Institutional Services Company, Inc. (1998 2002).
51 Annual Report
Trustees and Officers - continued
| Name, Age; Principal Occupation John R. Hebble (47) |
Year of Election or Appointment: 2003
Deputy Treasurer of the fund. Mr. Hebble also serves as Deputy Treasurer of other Fidelity funds (2003), and is an employee of FMR. Before joining Fidelity Investments, Mr. Hebble worked at Deutsche Asset Management where he served as Director of Fund Accounting (2002 2003) and Assistant Treasurer of the Scudder Funds (1998 2003).
| Bryan A. Mehrmann (44) |
Year of Election or Appointment: 2005
Deputy Treasurer of the fund. Mr. Mehrmann also serves as Deputy Treasurer of other Fidelity funds (2005 present) and is an employee of FMR. Previously, Mr. Mehrmann served as Vice President of Fidelity In vestments Institutional Services Group (FIIS)/Fidelity Investments Institu tional Operations Corporation, Inc. (FIIOC) Client Services (1998 2004).
| Kimberley H. Monasterio (41) |
Year of Election or Appointment: 2004
Deputy Treasurer of the fund. Ms. Monasterio also serves as Deputy Treasurer of other Fidelity funds (2004) and is an employee of FMR (2004). Before joining Fidelity Investments, Ms. Monasterio served as Treasurer (2000 2004) and Chief Financial Officer (2002 2004) of the Franklin Templeton Funds and Senior Vice President of Franklin Temple ton Services, LLC (2000 2004).
| Kenneth B. Robins (36) |
Year of Election or Appointment: 2005
Deputy Treasurer of the fund. Mr. Robins also serves as Deputy Treasurer of other Fidelity funds (2005 present) and is an employee of FMR (2004 present). Before joining Fidelity Investments, Mr. Robins worked at KPMG LLP, where he was a partner in KPMG’s department of profes sional practice (2002 2004) and a Senior Manager (1999 2000). In addition, Mr. Robins served as Assistant Chief Accountant, United States Securities and Exchange Commission (2000 2002).
| Robert G. Byrnes (38) |
Year of Election or Appointment: 2005
Assistant Treasurer of the fund. Mr. Byrnes also serves as Assistant Trea surer of other Fidelity funds (2005 present) and is an employee of FMR (2005 present). Previously, Mr. Byrnes served as Vice President of FPCMS (2003 2005). Before joining Fidelity Investments, Mr. Byrnes worked at Deutsche Asset Management where he served as Vice Presi dent of the Investment Operations Group (2000 2003).
| Annual Report |
| 52 |
| Name, Age; Principal Occupation John H. Costello (59) |
Year of Election or Appointment: 1986
Assistant Treasurer of the fund. Mr. Costello also serves as Assistant Treasurer of other Fidelity funds and is an employee of FMR.
| Peter L. Lydecker (51) |
Year of Election or Appointment: 2004
Assistant Treasurer of the fund. Mr. Lydecker also serves as Assistant Treasurer of other Fidelity funds (2004) and is an employee of FMR.
| Mark Osterheld (50) |
Year of Election or Appointment: 2002
Assistant Treasurer of the fund. Mr. Osterheld also serves as Assistant Treasurer of other Fidelity funds (2002) and is an employee of FMR.
| Gary W. Ryan (47) |
Year of Election or Appointment: 2005
Assistant Treasurer of the fund. Mr. Ryan also serves as Assistant Trea surer of other Fidelity funds (2005 present) and is an employee of FMR (2005 present). Previously, Mr. Ryan served as Vice President of Fund Reporting in FPCMS (1999 2005).
| Salvatore Schiavone (39) |
Year of Election or Appointment: 2005
Assistant Treasurer of the fund. Mr. Schiavone also serves as Assistant Treasurer of other Fidelity funds (2005 present) and is an employee of FMR (2005 present). Before joining Fidelity Investments, Mr. Schiavone worked at Deutsche Asset Management, where he most recently served as Assistant Treasurer (2003 2005) of the Scudder Funds and Vice Pres ident and Head of Fund Reporting (1996 2003).
53 Annual Report
| Distributions |
The Board of Trustees of Fidelity International Discovery Fund voted to pay to shareholders of record at the opening of business on record date, the following distributions per share derived from capital gains realized from sales of portfolio securities, and dividends derived from net investment income:
| Pay Date | Record Date | Dividends | Capital Gains | |||||
| Class A | 12/05/05 | 12/02/05 | $.31 | $1.40 | ||||
| Class T | 12/05/05 | 12/02/05 | $.24 | $1.40 | ||||
| Class B | 12/05/05 | 12/02/05 | $.11 | $1.40 | ||||
| Class C | 12/05/05 | 12/02/05 | $.12 | $1.40 |
The fund hereby designates as capital gain dividends: For dividends with respect to the taxable year ended October, 31 2005, $125,101,084, or, if subsequently determined to be different, the net capital gain of such year.
The fund will notify shareholders in January 2006 of amounts for use in preparing 2005 income tax returns.
| Annual Report |
| 54 |
Board Approval of Investment Advisory Contracts and Management Fees
Fidelity International Discovery Fund
Each year, typically in July, the Board of Trustees, including the independent Trustees (together, the Board), votes on the renewal of the management contract and sub advisory agreements (together, the Advisory Contracts) for the fund. The Board, assisted by the advice of fund counsel and independent Trustees’ counsel, requests and considers a broad range of information throughout the year.
The Board meets regularly each month except August and takes into account throughout the year matters bearing on Advisory Contracts. The Board, acting directly and through its separate committees, considers at each of its meetings factors that are relevant to the annual renewal of the fund’s Advisory Contracts, including the services and support provided to the fund and its shareholders by Fidelity. At the time of the renewal, the Board had 11 standing committees, each composed of independent Trustees with varying backgrounds, to which the Board has assigned specific subject matter responsibilities in order to enhance effective decision making by the Board. Each committee has adopted a written charter outlining the structure and purposes of the committee. One such com mittee, the Equity Contract Committee, meets periodically during the first six months of each year and as necessary to consider matters specifically related to the annual renewal of Advisory Contracts. The committee requests and receives information on, and makes recommendations to the independent Trustees concerning, the approval and annual review of the Advisory Contracts.
At its July 2005 meeting, the Board of Trustees, including the independent Trustees, unanimously determined to renew the Advisory Contracts for the fund. In reaching its determination, the Board considered all factors it believed relevant, including (1) the nature, extent, and quality of the services to be provided to the fund and its shareholders by Fidelity (including the investment performance of the fund); (2) the competitiveness of the management fee and total expenses of the fund; (3) the total costs of the services to be provided by and the profits to be realized by the investment adviser and its affiliates from the relationship with the fund; (4) the extent to which economies of scale would be realized as the fund grows; and (5) whether fee levels reflect these economies of scale, if any, for the benefit of fund shareholders.
In determining whether to renew the Advisory Contracts for the fund, the Board ulti mately reached a determination, with the assistance of fund counsel and independent Trustees’ counsel, that the renewal of the Advisory Contracts and the compensation to be received by Fidelity under the management contract is consistent with Fidelity’s fidu ciary duty under applicable law. In addition to evaluating the specific factors noted above, the Board, in reaching its determination, is aware that shareholders in the fund have a broad range of investment choices available to them, including a wide choice among mutual funds offered by competitors to Fidelity, and that the fund’s shareholders, with the opportunity to review and weigh the disclosure provided by the fund in its
55 Annual Report
Board Approval of Investment Advisory Contracts and Management Fees continued
prospectus and other public disclosures, have chosen to invest in this fund, managed by Fidelity.
Nature, Extent, and Quality of Services Provided by Fidelity. The Board consid ered staffing within the investment adviser, FMR, and the sub advisers (together, the Investment Advisers), including the background of the fund’s portfolio manager and the fund’s investment objective and discipline. The independent Trustees also had discus sions with senior management of Fidelity’s investment operations and investment groups. The Board considered the structure of the portfolio manager compensation program and whether this structure provides appropriate incentives.
Fidelity Resources Dedicated to Investment Management and Support Services. The Board reviewed the size, education, and experience of the Investment Advisers’ invest ment staff, their use of technology, and the Investment Advisers’ approach to recruiting, training, and retaining portfolio managers and other research, advisory, and manage ment personnel. The Board considered Fidelity’s extensive global research capabilities that enable the Investment Advisers to aggregate data from various sources in an effort to produce positive investment results. The Board noted that Fidelity’s analysts have access to a variety of technological tools that enable them to perform both fundamental and quantitative analysis and to specialize in various disciplines. The Board also considered that Fidelity’s portfolio managers and analysts have access to daily portfolio attribution that allows for monitoring of a fund’s portfolio, as well as an electronic communication system that provides immediate real time access to research concerning issuers and credit enhancers.
Shareholder and Administrative Services. The Board considered the nature, extent, quality, and cost of administrative, distribution, and shareholder services performed by the Investment Advisers and their affiliates under the Advisory Contracts and under separate agreements covering transfer agency, pricing and bookkeeping, and securities lending services for the fund. The Board also considered the nature and extent of the Investment Advisers’ supervision of third party service providers, principally custodians and subcustodians. The Board reviewed the allocation of fund brokerage, including allocations to brokers affiliated with the Investment Advisers, the use of brokerage commissions to pay fund expenses, and the use of “soft” commission dollars to pay for research services. The Board also considered that Fidelity voluntarily decided in 2004 to stop using “soft” commission dollars to pay for market data and, instead, to pay for that data out of its own resources. The Board also considered the resources devoted to, and the record of compliance with, the fund’s compliance policies and procedures.
The Board noted that the growth of fund assets across the complex allows Fidelity to reinvest in the development of services designed to enhance the value or convenience of the Fidelity funds as investment vehicles. These services include 24 hour access to
| Annual Report |
| 56 |
account information and market information through phone representatives and over the Internet, and investor education materials and asset allocation tools.
Investment in a Large Fund Family. The Board considered the benefits to shareholders of investing in a Fidelity fund, including the benefits of investing in a fund that is part of a large family of funds offering a variety of investment disciplines and providing for a large variety of mutual fund investor services. For example, fund shareholders are offered the privilege of exchanging shares of the fund for shares of other Fidelity funds, as set forth in the fund’s prospectus, without paying an additional sales charge. The Board noted that, since the last Advisory Contract renewals in July 2004, Fidelity has taken a number of actions that benefited particular funds, including (i) voluntarily deciding in 2004 to stop using “soft” commission dollars to pay for market data and, instead, to pay for that data out of its own resources, (ii) contractually agreeing to impose management fee reductions and expense limitations on its five Spartan stock index funds and its stock index fund available through variable insurance products, (iii) contractually agreeing to eliminate the management fees on the Fidelity Freedom Funds and the Fidelity Advisor Freedom Funds, (iv) contractually agreeing to reduce the management fees on most of its investment grade taxable bond funds, and (v) contractually agreeing to impose expense limitations on its retail and Spartan investment grade taxable bond funds.
Investment Performance and Compliance. The Board considered whether the fund has operated within its investment objective, as well as its record of compliance with its investment restrictions. It also reviewed the fund’s absolute investment performance, as well as the fund’s relative investment performance measured against (i) a broad based securities market index, and (ii) a peer group of mutual funds deemed appropriate by the Board over multiple periods. The following charts considered by the Board show, over the one , three , and five year periods ended December 31, 2004, the returns of the retail class of the fund, the returns of a broad based securities market index (“benchmark”), and a range of returns of a peer group of mutual funds identified by Lipper Inc. as having an investment objective similar to that of the fund. (The fund did not offer Advisor classes as of December 31, 2004.) The box within each chart shows the 25th percentile return (bottom of box) and the 75th percentile return (top of box) of the Lipper peer group. Returns shown above the box are in the first quartile and returns shown below the box are in the fourth quartile. The percentage beaten numbers noted below each chart correspond to the percentile box and represent the percentage of funds in the Lipper peer group whose performance was equal to or lower than that of the retail class.
57 Annual Report
Board Approval of Investment Advisory Contracts and Management Fees continued

The Board reviewed the fund’s relative investment performance against its Lipper peer group and stated that the performance of the fund was in the second quartile for the one year period and the first quartile for the three and five year periods. The Board also stated that the relative investment performance of the fund has compared favorably to its benchmark over time, although the fund’s one year cumulative total return was lower than its benchmark.
The Board also considered that, beginning September 1, 2005, the fund’s management fee is subject to upward or downward adjustment depending upon whether, and to what extent, the fund’s investment performance for the performance period exceeds, or is exceeded by, the record (over the same period) of a Board approved performance adjustment index. The Board realizes that the performance adjustment provides FMR with a strong economic incentive to seek to achieve superior performance for the fund’s shareholders and helps to more closely align the interests of FMR and the fund’s shareholders.
The Board has had thorough discussions with FMR throughout the year about the Board’s and FMR’s concerns about equity research, equity fund performance, and compliance with internal policies governing gifts and entertainment. FMR has taken steps that it believes will refocus and strengthen equity research and equity portfolio management and compliance. The Board noted with favor FMR’s recent reorganization of its senior management team and FMR’s plans to dedicate additional resources to investment research, and participated in the process that led to those changes.
Based on its review, and giving particular weight to the nature and quality of the resources dedicated by the Investment Advisers to maintain and improve relative
| Annual Report |
| 58 |
performance, the Board concluded that the nature, extent, and quality of the services provided by Fidelity will benefit the fund’s shareholders, particularly in light of the Board’s view that the fund’s shareholders benefit from investing in a fund that is part of a large family of funds offering a variety of investment disciplines and services.
Competitiveness of Management Fee and Total Fund Expenses. The Board considered the fund’s management fee and total expenses compared to “mapped groups” of competitive funds and classes. Fidelity creates “mapped groups” by combining similar Lipper investment objective categories that have comparable management fee charac teristics. Combining Lipper investment objective categories aids the Board’s manage ment fee and total expense comparisons by broadening the competitive group used for comparison and by reducing the number of universes to which various Fidelity funds are compared.
The Board considered two proprietary management fee comparisons for the 12 month periods shown in the chart below. The group of Lipper funds used by the Board for management fee comparisons is referred to below as the “Total Mapped Group” and, for the reasons explained above, is broader than the Lipper peer group used by the Board for performance comparisons. The Total Mapped Group comparison focuses on a fund’s standing relative to the total universe of comparable funds available to investors, in terms of gross management fees before expense reimbursements or caps. “TMG %” represents the percentage of funds in the Total Mapped Group that had management fees that were lower than the fund’s. For example, a TMG % of 21% means that 79% of the funds in the Total Mapped Group had higher management fees than the fund. The “Asset Size Peer Group” (ASPG) comparison focuses on a fund’s standing relative to non Fidelity funds similar in size to the fund within the Total Mapped Group. The ASPG represents at least 15% of the funds in the Total Mapped Group with comparable asset size and management fee characteristics, subject to a minimum of 50 funds (or all funds in the Total Mapped Group if fewer than 50). Additional information, such as the ASPG quartile (“quadrant”) in which the fund’s management fee ranked, is also included in the chart and considered by the Board.
59 Annual Report
Board Approval of Investment Advisory Contracts and Management Fees continued

The Board noted that the fund’s management fee ranked below the median of its Total Mapped Group and below the median of its ASPG for 2004.
Based on its review, the Board concluded that the fund’s management fee was fair and reasonable in light of the services that the fund receives and the other factors considered.
In its review of the fund’s total expenses, the Board considered the fund’s management fee as well as other fund expenses, such as transfer agent fees, pricing and bookkeeping fees, and custodial, legal, and audit fees. The Board also noted the effects of any waivers and reimbursements on fees and expenses. As part of its review, the Board also consid ered current and historical total expenses of the fund compared to competitive fund median expenses. The fund is compared to those funds and classes in the Total Mapped Group (used by the Board for management fee comparisons) that have a similar sales load structure.
The Board noted that the fund’s total expenses ranked below its competitive median for 2004.
In its review of total expenses, the Board also considered Fidelity fee structures and other information on clients that FMR and its affiliates service in other competitive markets, such as other mutual funds advised or subadvised by FMR or its affiliates, pension plan clients, and other institutional clients.
Based on its review, the Board concluded that the fund’s total expenses were reasonable in light of the services that the fund and its shareholders receive and the other factors considered.
| Annual Report |
| 60 |
Costs of the Services and Profitability. The Board considered the revenues earned and the expenses incurred by Fidelity in conducting the business of developing, market ing, distributing, managing, administering and servicing the fund and its shareholders. The Board also considered the level of Fidelity’s profits in respect of all the Fidelity funds.
On an annual basis, FMR presents to the Board Fidelity’s profitability for the fund. Fidelity calculates the profitability for each fund, as well as aggregate profitability for groups of Fidelity funds and all Fidelity funds, using a series of detailed revenue and cost allocation methodologies which originate with the audited books and records of Fidelity. The Audit Committee of the Board reviews any significant changes from the prior year’s methodologies.
PricewaterhouseCoopers LLP (PwC), independent registered accounting firm and auditor to Fidelity and certain Fidelity funds, has been engaged annually by the Board as part of the Board’s assessment of the results of Fidelity’s profitability analysis. PwC’s engagement includes the review and assessment of Fidelity’s methodologies used in determining the revenues and expenses attributable to Fidelity’s mutual fund business, and completion of agreed upon procedures surrounding the mathematical accuracy of fund profitability and its conformity to allocation methodologies. After considering PwC’s reports issued under the engagement and information provided by Fidelity, the Board believes that while other allocation methods may also be reasonable, Fidelity’s profitabil ity methodologies are reasonable in all material respects.
The Board has also reviewed Fidelity’s non fund businesses and any fall out benefits related to the mutual fund business as well as cases where Fidelity’s affiliates may benefit from or be related to the fund’s business. In addition, a special committee of the Board reviewed services provided to Fidelity by its affiliates and determined that the fees that Fidelity paid for such services were reasonable.
The Board considered the costs of the services provided by and the profits realized by Fidelity in connection with the operation of the fund and determined that the amount of profit is a fair entrepreneurial profit for the management of the fund.
Economies of Scale. The Board considered whether there have been economies of scale in respect of the management of the Fidelity funds, whether the Fidelity funds (including the fund) have appropriately benefited from any such economies of scale, and whether there is potential for realization of any further economies of scale. The Board considered the extent to which the fund will benefit from economies of scale through increased services to the fund, through waivers or reimbursements, or through fee or expense reductions, including reductions that occur through operation of the transfer agent agreement. The transfer agent fee varies in part based on the number of accounts in the fund. If the number of accounts decreases or the average account size increases, the overall transfer agent fee rate decreases.
61 Annual Report
Board Approval of Investment Advisory Contracts and Management Fees continued
The Board recognized that the fund’s management contract incorporates a “group fee” structure, which provides for lower fee rates as total fund assets under FMR’s manage ment increase, and for higher fee rates as total fund assets under FMR’s management decrease. The Board considered that the group fee is designed to deliver the benefits of economies of scale to fund shareholders when total fund assets increase, even if assets of any particular fund are unchanged or have declined, because some portion of Fidelity’s costs are attributable to services provided to all Fidelity funds, and all funds benefit if those costs can be allocated among more assets. The Board concluded that, given the group fee structure, fund shareholders will achieve a certain level of economies of scale as assets under FMR’s management increase at the fund complex level, regardless of whether Fidelity achieves any such economies of scale.
The Board further concluded that any potential economies of scale are being shared between fund shareholders and Fidelity in an appropriate manner.
Additional Information Requested by the Board. In order to develop fully the factual basis for consideration of the Advisory Contracts, the Board requested additional information regarding (i) equity fund transfer agency fees; (ii) Fidelity’s fund profitability methodology and the impact of various changes in the methodology over time; (iii) benefits to shareholders from economies of scale; (iv) composition and characteristics of various fund and industry data used in comparisons; and (v) com pensation of portfolio managers and research analysts.
Based on its evaluation of all of the conclusions noted above, and after considering all material factors, the Board ultimately concluded that the existing advisory fee structures are fair and reasonable, and that the fund’s existing Advisory Contracts should be renewed.
| Annual Report |
| 62 |
63 Annual Report
| Annual Report |
| 64 |
65 Annual Report
| Annual Report |
| 66 |
67 Annual Report
| Annual Report |
| 68 |
69 Annual Report
| Investment Adviser Fidelity Management & Research Company Boston, MA Investment Sub Advisers FMR Co., Inc. Fidelity Management & Research (U.K.) Inc. Fidelity Management & Research (Far East) Inc. Fidelity International Investment Advisors Fidelity Investments Japan Limited Fidelity International Investment Advisors (U.K.) Limited General Distributor Fidelity Distributors Corporation Boston, MA Transfer and Service Agents Fidelity Investments Institutional Operations Company, Inc. Boston, MA Fidelity Service Company, Inc. Boston, MA Custodian JPMorgan Chase Bank New York, NY |
| AID-UANN-1205 1.806656.100 |


| Fidelity Advisor International Discovery Fund - Institutional Class |
| Annual Report October 31, 2005 |

Institutional Class is a class of Fidelity® International Discovery Fund
| Contents | ||||
| Chairman’s Message | 4 | Ned Johnson’s message to shareholders. | ||
| Performance | 5 | How the fund has done over time. | ||
| Management’s Discussion | 6 | The manager’s review of fund | ||
| performance, strategy and outlook. | ||||
| Shareholder Expense | 7 | An example of shareholder expenses. | ||
| Example | ||||
| Investment Changes | 9 | A summary of major shifts in the fund’s | ||
| investments over the past six months. | ||||
| Investments | 11 | A complete list of the fund’s investments | ||
| with their market values. | ||||
| Financial Statements | 23 | Statements of assets and liabilities, | ||
| operations, and changes in net assets, | ||||
| as well as financial highlights. | ||||
| Notes | 33 | Notes to the financial statements. | ||
| Report of Independent | 42 | |||
| Registered Public | ||||
| Accounting Firm | ||||
| Trustees and Officers | 43 | |||
| Distributions | 53 | |||
| Board Approval of | 54 | |||
| Investment Advisory | ||||
| Contracts and | ||||
| Management Fees | ||||
| To view a fund’s proxy voting guidelines and proxy voting record for the 12 month period ended June 30, visit www.fidelity.com/proxyvotingresults or visit the Securities and Exchange Commis sion’s (SEC) web site at www.sec.gov. You may also call 1-877-208-0098 to request a free copy of the proxy voting guidelines. Standard & Poor’s, S&P and S&P 500 are registered service marks of The McGraw Hill Companies, Inc. and have been licensed for use by Fidelity Distributors Corporation. Other third party marks appearing herein are the property of their respective owners. All other marks appearing herein are registered or unregistered trademarks or service marks of FMR Corp. or an affiliated company. |
| Annual Report |
| 2 |
| This report and the financial statements contained herein are submitted for the general information of the shareholders of the fund. This report is not authorized for distribution to prospective investors in the fund unless preceded or accompanied by an effective prospectus. A fund files its complete schedule of portfolio holdings with the SEC for the first and third quarters of each fiscal year on Form N Q. Forms N Q are available on the SEC’s web site at http://www.sec.gov. A fund’s Forms N Q may be reviewed and copied at the SEC’s Public Refer ence Room in Washington, DC. Information regarding the operation of the SEC’s Public Reference Room may be obtained by calling 1-800-SEC-0330. For a complete list of a fund’s portfolio hold ings, view the fund’s most recent quarterly holdings report, semiannual report, or annual report on Fidelity’s web site at http://www.advisor.fidelity.com. NOT FDIC INSURED · MAY LOSE VALUE · NO BANK GUARANTEE Neither the fund nor Fidelity Distributors Corporation is a bank. |
3 Annual Report
Chairman’s Message
(photograph of Edward C. Johnson 3d)
Dear Shareholder:
During the past year or so, much has been reported about the mutual fund industry, and much of it has been more critical than I believe is warranted. Allegations that some companies have been less than forthright with their shareholders have cast a shadow on the entire industry. I continue to find these reports disturbing, and assert that they do not create an accurate picture of the industry overall. Therefore, I would like to remind every one where Fidelity stands on these issues. I will say two things specifically regarding allegations that some mutual fund companies were in violation of the Securities and Exchange Commission’s forward pricing rules or were involved in so called “market timing” activities.
First, Fidelity has no agreements that permit customers who buy fund shares after 4 p.m. to obtain the 4 p.m. price. This is not a new policy. This is not to say that some one could not deceive the company through fraudulent acts. However, we are extremely diligent in preventing fraud from occurring in this manner and in every other. But I underscore again that Fidelity has no so called “agreements” that sanction illegal practices.
Second, Fidelity continues to stand on record, as we have for years, in opposition to predatory short term trading that adversely affects shareholders in a mutual fund. Back in the 1980s, we initiated a fee which is returned to the fund and, therefore, to investors to discourage this activity. Further, we took the lead several years ago in developing a Fair Value Pricing Policy to prevent market timing on foreign securities in our funds. I am confi dent we will find other ways to make it more difficult for predatory traders to operate. However, this will only be achieved through close cooperation among regulators, legislators and the industry.
Yes, there have been unfortunate instances of unethical and illegal activity within the mutual fund industry from time to time. That is true of any industry. When this occurs, confessed or convicted offenders should be dealt with appropriately. But we are still concerned about the risk of over regulation and the quick application of simplistic solutions to intricate problems. Every system can be improved, and we support and applaud well thought out improvements by regulators, legislators and industry representatives that achieve the common goal of building and protecting the value of investors’ holdings.
For nearly 60 years, Fidelity has worked very hard to improve its products and service to justify your trust. When our family founded this company in 1946, we had only a few hundred customers. Today, we serve more than 18 million customers including individual investors and participants in retirement plans across America.
Let me close by saying that we do not take your trust in us for granted, and we realize that we must always work to improve all aspects of our service to you. In turn, we urge you to continue your active participation with your financial matters, so that your interests can be well served.
Best regards,
/s/ Edward C. Johnson 3d
Edward C. Johnson 3d
Annual Report 4
| Fidelity Advisor International Discovery Fund Institutional Class Performance: The Bottom Line |
Average annual total return reflects the change in the value of an investment, assuming reinvestment of the class’ dividend income and capital gains (the profits earned upon the sale of securities that have grown in value) and assuming a constant rate of perfor mance each year. The $10,000 table and the fund’s returns do not reflect the deduction of taxes that a shareholder would pay on fund distributions or the redemption of fund shares. During periods of reimbursement by Fidelity, a fund’s total return will be greater than it would be had the reimbursement not occurred. How a fund did yesterday is no guarantee of how it will do tomorrow.
| Average Annual Total Returns | ||||||
| Periods ended October 31, 2005 | Past 1 | Past 5 | Life of | |||
| year | years | fundA | ||||
| Institutional Class | 22.41% | 6.01% | 9.69% |
A The initial offering of Institutional Class shares took place on January 6, 2005. Returns prior to January 6, 2005 are those of International Discovery, the original class of the fund.
$10,000 Over 10 Years
Let’s say hypothetically that $10,000 was invested in Fidelity Advisor International Discovery Fund — Institutional Class on October 31, 1995. The chart shows how the value of your investment would have changed, and also shows how the Morgan Stanley Capital InternationalSM EAFE Index performed over the same period. The initial offering of Institutional Class took place on January 6, 2005. See above for additional information regarding the performance of Institutional Class.
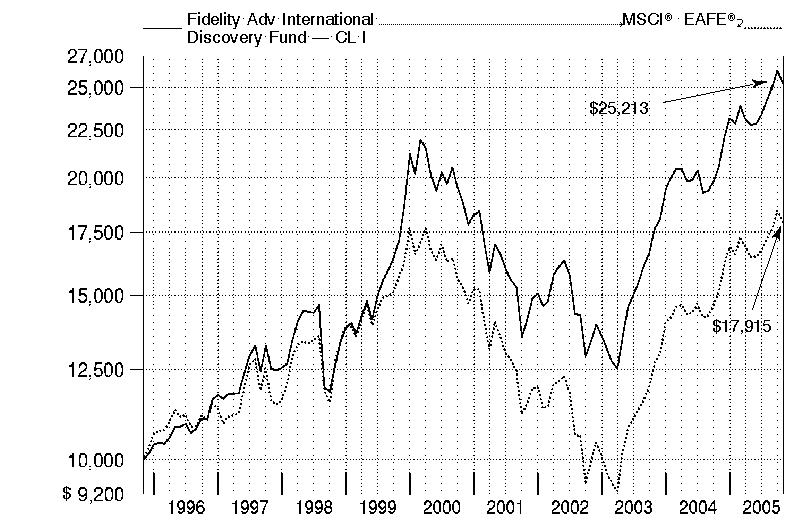
5 Annual Report
5
Management’s Discussion of Fund Performance
Comments from William Kennedy, Portfolio Manager of Fidelity Advisor International Discovery Fund
Foreign stock markets enjoyed broad based advances during the 12 month period that ended October 31, 2005, encouraged by better than expected corporate earnings and markedly improved economies. For the 12 months overall, the Morgan Stanley Capital InternationalSM Europe, Australasia, Far East (MSCI® EAFE®) Index a performance measure of developed stock markets outside the United States and Canada gained 18.28% . The Japanese stock market climbed to its highest level in more than four years. Positive economic indicators and Prime Minister Koizumi’s decisive election victory attracted record inflows from overseas investors. In response, the Tokyo Stock Exchange Stock Price Index (TOPIX) soared 22.89% . Southeast Asian equities outside of Japan, particularly South Korea, also responded well to the better macroeconomic environment, illustrated by the 19.44% return for the MSCI All Country Far East ex Japan index. Euro pean stock markets were up as well, despite investors’ concern about higher energy prices and potential downgrades to economic growth in the region. For the year overall, the MSCI Europe index rose 16.51% .
For the 12 months ending October 31, 2005, the fund beat the MSCI EAFE index and the 17.75% return for the LipperSM International Funds Average. (For specific performance information on the fund’s Institutional Class shares, please see performance section of this report.) The fund would have done even better on an absolute basis were it not for currency movements in Europe and Japan that adversely affected U.S. investors. Relative to the index, performance benefited from strong stock picking, especially in financials and telecommunication services, as well as favorable country selection. Weak returns from semiconductor stocks and underweightings in certain index components hurt relative returns. Small and mid cap stocks that were not in the index were among the top relative performers. They included Orascom Telecom, an Egyptian wireless company that benefited from its growth in emerging markets, and Telewest Global, a cable company operating in England that was bought out at a nice premium. I sold both stocks during the period. Banco Bradesco and Banco Itau, Brazilian banks, also rallied nicely, fueled by strong demand for commercial and consumer loans. Underweightings in Mitsubishi UFJ Financial, a Japanese bank, and GlaxoSmithKline, a U.K. based pharmaceutical company, detracted from relative performance as both stocks began to rally. An overweighting in Tokyo Elec tron, a semiconductor equipment stock that declined, further hampered relative returns.
The views expressed in this statement reflect those of the portfolio manager only through the end of the period of the report as stated on the cover and do not necessarily represent the views of Fidelity or any other person in the Fidelity organization. Any such views are subject to change at any time based upon market or other conditions and Fidelity disclaims any responsibility to update such views. These views may not be relied on as investment advice and, because investment decisions for a Fidelity fund are based on numerous factors, may not be relied on as an indication of trading intent on behalf of any Fidelity fund.
| Annual Report |
| 6 6 |
Shareholder Expense Example
As a shareholder of the Fund, you incur two types of costs: (1) transaction costs, including sales charges (loads) on redemptions of shares purchased prior to October 12, 1990, and redemption fees, and (2) ongoing costs, including management fees, distribution and/or service (12b 1) fees and other Fund expenses. This Example is intended to help you understand your ongoing costs (in dollars) of investing in the Fund and to compare these costs with the ongoing costs of investing in other mutual funds.
The Example is based on an investment of $1,000 invested at the beginning of the period and held for the entire period (May 1, 2005 to October 31, 2005).
| Actual Expenses |
The first line of the table below for each class of the Fund provides information about actual account values and actual expenses. You may use the information in this line, together with the amount you invested, to estimate the expenses that you paid over the period. Simply divide your account value by $1,000.00 (for example, an $8,600 account value divided by $1,000.00 = 8.6), then multiply the result by the number in the first line for a class of the Fund under the heading entitled “Expenses Paid During Period” to estimate the expenses you paid on your account during this period. A small balance maintenance fee of $12.00 that is charged once a year may apply for certain accounts with a value of less than $2,000. This fee is not included in the table below. If it was, the esti mate of expenses you paid during the period would be higher, and your ending account value lower, by this amount.
Hypothetical Example for Comparison Purposes
The second line of the table below for each class of the Fund provides information about hypothetical account values and hypothetical expenses based on a Class’ actual expense ratio and an assumed rate of return of 5% per year before expenses, which is not the Class’ actual return. The hypothetical account values and expenses may not be used to estimate the actual ending account balance or expenses you paid for the period. You may use this information to compare the ongoing costs of investing in the Fund and other funds. To do so, compare this 5% hypothetical example with the 5% hypothetical examples that appear in the shareholder reports of the other funds. A small balance maintenance fee of $12.00 that is charged once a year may apply for certain accounts with a value of less than $2,000. This fee is not included in the table below. If it was, the estimate of expenses you paid during the period would be higher, and your ending account value lower, by this amount.
7 Annual Report
Shareholder Expense Example continued
Please note that the expenses shown in the table are meant to highlight your ongoing costs only and do not reflect any transaction costs. Therefore, the second line of the table is useful in comparing ongoing costs only, and will not help you determine the relative total costs of owning different funds. In addition, if these transactional costs were included, your costs would have been higher.
| Expenses Paid | ||||||||||||
| Beginning | Ending | During Period* | ||||||||||
| Account Value | Account Value | May 1, 2005 | ||||||||||
| May 1, 2005 | October 31, 2005 | to October 31, 2005 | ||||||||||
| Class A | ||||||||||||
| Actual | $ | 1,000.00 | $ | 1,105.20 | $ | 7.64 | ||||||
| HypotheticalA | $ | 1,000.00 | $ | 1,017.95 | $ | 7.32 | ||||||
| Class T | ||||||||||||
| Actual | $ | 1,000.00 | $ | 1,103.10 | $ | 9.28 | ||||||
| HypotheticalA | $ | 1,000.00 | $ | 1,016.38 | $ | 8.89 | ||||||
| Class B | ||||||||||||
| Actual | $ | 1,000.00 | $ | 1,100.40 | $ | 11.91 | ||||||
| HypotheticalA | $ | 1,000.00 | $ | 1,013.86 | $ | 11.42 | ||||||
| Class C | ||||||||||||
| Actual | $ | 1,000.00 | $ | 1,101.80 | $ | 10.91 | ||||||
| HypotheticalA | $ | 1,000.00 | $ | 1,014.82 | $ | 10.46 | ||||||
| International Discovery Fund | ||||||||||||
| Actual | $ | 1,000.00 | $ | 1,106.90 | $ | 5.68 | ||||||
| HypotheticalA | $ | 1,000.00 | $ | 1,019.81 | $ | 5.45 | ||||||
| Institutional Class | ||||||||||||
| Actual | $ | 1,000.00 | $ | 1,107.60 | $ | 5.21 | ||||||
| HypotheticalA | $ | 1,000.00 | $ | 1,020.27 | $ | 4.99 | ||||||
| A 5% return per year before expenses | ||||||||||||
* Expenses are equal to each Class’ annualized expense ratio (shown in the table below); multiplied by the average account value over the period, multiplied by 184/365 (to reflect the one half year period).
| Annualized | ||
| Expense Ratio | ||
| Class A | 1.44% | |
| Class T | 1.75% | |
| Class B | 2.25% | |
| Class C | 2.06% | |
| International Discovery Fund | 1.07% | |
| Institutional Class | 98% |
| Annual Report |
| 8 |
Investment Changes
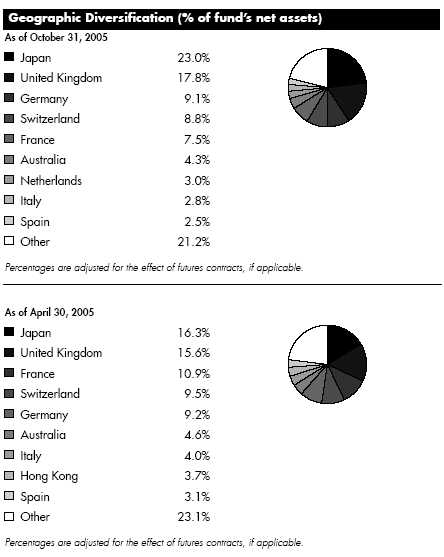
9 Annual Report
| Investment Changes continued | ||||||
| Asset Allocation | ||||||
| % of fund’s | % of fund’s net assets | |||||
| net assets | 6 months ago | |||||
| Stocks and Equity Futures | 99.4 | 98.5 | ||||
| Short Term Investments and Net Other Assets | 0.6 | 1.5 | ||||
| Top Ten Stocks as of October 31, 2005 | ||||||
| % of fund’s | % of fund’s net assets | |||||
| net assets | 6 months ago | |||||
| BP PLC sponsored ADR (United Kingdom, Oil, | ||||||
| Gas & Consumable Fuels) | 2.1 | 1.8 | ||||
| Novartis AG (Reg.) (Switzerland, | ||||||
| Pharmaceuticals) | 1.8 | 1.7 | ||||
| Roche Holding AG (participation certificate) | ||||||
| (Switzerland, Pharmaceuticals) | 1.8 | 1.7 | ||||
| Total SA Series B (France, Oil, Gas & | ||||||
| Consumable Fuels) | 1.7 | 1.6 | ||||
| Vodafone Group PLC (United Kingdom, Wireless | ||||||
| Telecommunication Services) | 1.6 | 1.5 | ||||
| GlaxoSmithKline PLC sponsored ADR (United | ||||||
| Kingdom, Pharmaceuticals) | 1.5 | 0.6 | ||||
| Royal Dutch Shell PLC Class B (United Kingdom, | ||||||
| Oil, Gas & Consumable Fuels) | 1.5 | 0.0 | ||||
| Toyota Motor Corp. (Japan, Automobiles) | 1.4 | 0.6 | ||||
| Nestle SA (Reg.) (Switzerland, Food Products) | 1.2 | 1.0 | ||||
| Allianz AG (Reg.) (Germany, Insurance) | 1.2 | 1.0 | ||||
| 15.8 | ||||||
| Market Sectors as of October 31, 2005 | ||||||
| % of fund’s | % of fund’s net assets | |||||
| net assets | 6 months ago | |||||
| Financials | 24.5 | 24.8 | ||||
| Consumer Discretionary | 15.6 | 20.1 | ||||
| Industrials | 11.0 | 10.3 | ||||
| Health Care | 10.0 | 10.6 | ||||
| Consumer Staples | 8.9 | 5.2 | ||||
| Energy | 8.4 | 7.7 | ||||
| Information Technology | 7.6 | 7.1 | ||||
| Materials | 5.7 | 4.2 | ||||
| Telecommunication Services | 4.4 | 5.6 | ||||
| Utilities | 2.0 | 2.1 | ||||
| Annual Report | 10 | |||||
| Investments October 31, 2005 | ||||||
| Showing Percentage of Net Assets | ||||||
| Common Stocks 96.7% | ||||||
| Shares | Value (Note 1) | |||||
| (000s) | ||||||
| Australia – 4.3% | ||||||
| ABC Learning Centres Ltd. | 1,730,169 | $ | 8,409 | |||
| AMP Ltd. | 699,000 | 3,810 | ||||
| Babcock & Brown Japan Property Trust | 6,743,900 | 7,867 | ||||
| BHP Billiton Ltd. | 2,473,100 | 38,395 | ||||
| Billabong International Ltd. | 925,928 | 8,959 | ||||
| Caltex Australia Ltd. | 272,100 | 4,134 | ||||
| Commonwealth Bank of Australia | 241,000 | 7,006 | ||||
| Computershare Ltd. | 1,432,900 | 7,018 | ||||
| CSL Ltd. | 269,050 | 7,544 | ||||
| Downer EDI Ltd. | 2,523,506 | 11,473 | ||||
| Macquarie Airports unit | 1,991,381 | 4,467 | ||||
| Macquarie Bank Ltd. | 391,000 | 18,908 | ||||
| Macquarie Communications Infrastructure Group unit | 1,632,940 | 7,021 | ||||
| Macquarie Infrastructure Group unit | 1,632,500 | 4,187 | ||||
| QBE Insurance Group Ltd. | 978,567 | 13,025 | ||||
| Seek Ltd. | 2,000,000 | 4,247 | ||||
| Transurban Group unit | 918,000 | 4,393 | ||||
| Westfield Group unit | 676,200 | 8,398 | ||||
| TOTAL AUSTRALIA | 169,261 | |||||
| Austria – 0.6% | ||||||
| Erste Bank der Oesterreichischen Sparkassen AG | 208,400 | 10,842 | ||||
| OMV AG | 259,000 | 13,971 | ||||
| TOTAL AUSTRIA | 24,813 | |||||
| Belgium – 0.3% | ||||||
| InBev SA | 305,000 | 12,193 | ||||
| Bermuda – 0.0% | ||||||
| Catlin Group Ltd. | 224,221 | 1,923 | ||||
| Brazil – 0.6% | ||||||
| Banco Bradesco SA (PN) sponsored ADR (non-vtg.) | 222,300 | 11,535 | ||||
| Banco Itau Holding Financeira SA (PN) | 382,170 | 9,116 | ||||
| Banco Nossa Caixa SA | 103,000 | 1,706 | ||||
| TOTAL BRAZIL | 22,357 | |||||
| Canada 0.5% | ||||||
| EnCana Corp. | 410,000 | 18,747 | ||||
See accompanying notes which are an integral part of the financial statements.
11 Annual Report
| Investments continued | ||||||
| Common Stocks continued | ||||||
| Shares | Value (Note 1) | |||||
| (000s) | ||||||
| Cayman Islands – 0.2% | ||||||
| Foxconn International Holdings Ltd. | 4,277,000 | $ | 4,579 | |||
| Kingboard Chemical Holdings Ltd. | 1,351,000 | 2,858 | ||||
| TOTAL CAYMAN ISLANDS | 7,437 | |||||
| China – 0.4% | ||||||
| China Construction Bank Corp. (H Shares) | 26,650,000 | 8,079 | ||||
| Li Ning Co. Ltd. | 7,030,000 | 4,262 | ||||
| Xinao Gas Holdings Ltd. | 5,392,000 | 4,104 | ||||
| TOTAL CHINA | 16,445 | |||||
| Denmark – 0.9% | ||||||
| GN Store Nordic AS | 1,347,000 | 16,227 | ||||
| Vestas Wind Systems AS (a)(d) | 872,100 | 18,876 | ||||
| TOTAL DENMARK | 35,103 | |||||
| Finland – 2.0% | ||||||
| Citycon Oyj | 576,935 | 2,213 | ||||
| Fortum Oyj | 538,600 | 9,536 | ||||
| Metso Corp. | 400,500 | 10,418 | ||||
| Neste Oil Oyj | 174,750 | 5,415 | ||||
| Nokia Corp. sponsored ADR | 1,907,100 | 32,077 | ||||
| Nokian Tyres Ltd. | 500,300 | 7,797 | ||||
| Sampo Oyj (A Shares) | 695,900 | 10,678 | ||||
| TOTAL FINLAND | 78,134 | |||||
| France – 7.5% | ||||||
| Alstom SA (a) | 206,800 | 9,914 | ||||
| AXA SA | 572,300 | 16,574 | ||||
| BNP Paribas SA | 167,327 | 12,687 | ||||
| Eiffage SA | 64,893 | 5,601 | ||||
| Financiere Marc de Lacharriere SA (Fimalac) | 94,958 | 5,157 | ||||
| Groupe Danone | 73,800 | 7,529 | ||||
| Lagardere S.C.A. (Reg.) | 248,900 | 17,111 | ||||
| Louis Vuitton Moet Hennessy (LVMH) | 102,800 | 8,324 | ||||
| Neopost SA | 251,500 | 24,270 | ||||
| Nexity | 305,200 | 13,936 | ||||
| Orpea (a) | 249,764 | 13,473 | ||||
| Pernod Ricard SA | 158,600 | 27,739 | ||||
| Sanofi-Aventis sponsored ADR | 622,900 | 24,991 | ||||
| Suez SA (France) | 559,900 | 15,169 | ||||
| Total SA Series B | 261,544 | 65,920 | ||||
See accompanying notes which are an integral part of the financial statements.
| Annual Report |
| 12 |
| Common Stocks continued | ||||||
| Shares | Value (Note 1) | |||||
| (000s) | ||||||
| France – continued | ||||||
| Vinci SA | 84,500 | $ | 6,604 | |||
| Vivendi Universal SA sponsored ADR | 662,000 | 20,800 | ||||
| TOTAL FRANCE | 295,799 | |||||
| Germany – 8.4% | ||||||
| Allianz AG (Reg.) | 342,630 | 48,448 | ||||
| BASF AG | 213,900 | 15,401 | ||||
| Bayer AG sponsored ADR | 459,000 | 15,973 | ||||
| Bijou Brigitte Modische Accessoires AG | 12,480 | 2,596 | ||||
| CeWe Color Holding AG | 81,100 | 4,297 | ||||
| Continental AG | 93,400 | 7,143 | ||||
| DaimlerChrysler AG (Reg.) | 373,000 | 18,669 | ||||
| Deutsche Boerse AG | 136,000 | 12,798 | ||||
| Deutsche Telekom AG sponsored ADR | 1,110,800 | 19,661 | ||||
| Deutz AG (a)(d) | 505,500 | 2,291 | ||||
| E.ON AG | 405,800 | 36,778 | ||||
| ESCADA AG (a) | 134,277 | 3,412 | ||||
| GFK AG | 288,897 | 9,576 | ||||
| Hypo Real Estate Holding AG | 347,168 | 16,788 | ||||
| IWKA AG | 234,300 | 5,196 | ||||
| K&S AG | 37,900 | 2,487 | ||||
| Linde AG | 156,800 | 11,173 | ||||
| Merck KGaA | 180,100 | 14,897 | ||||
| MPC Muenchmeyer Petersen Capital AG | 50,500 | 3,572 | ||||
| MTU Aero Engines Holding AG | 337,500 | 9,811 | ||||
| Muenchener Rueckversicherungs Gesellschaft AG (Reg.) | 116,100 | 13,639 | ||||
| Pfleiderer AG (a) | 441,780 | 8,050 | ||||
| RWE AG | 255,519 | 16,320 | ||||
| SAP AG | 108,600 | 18,653 | ||||
| Siemens AG sponsored ADR | 74,400 | 5,537 | ||||
| SolarWorld AG | 81,900 | 11,067 | ||||
| TOTAL GERMANY | 334,233 | |||||
| Greece – 0.5% | ||||||
| EFG Eurobank Ergasias SA | 311,750 | 9,380 | ||||
| Greek Organization of Football Prognostics SA | 359,130 | 10,367 | ||||
| TOTAL GREECE | 19,747 | |||||
| Hong Kong – 2.2% | ||||||
| Chaoda Modern Agriculture (Holdings) Ltd. | 12,600,000 | 4,754 | ||||
| CNOOC Ltd. | 13,257,000 | 8,710 | ||||
| Esprit Holdings Ltd. | 2,846,000 | 20,063 | ||||
See accompanying notes which are an integral part of the financial statements.
13 Annual Report
| Investments continued | ||||||
| Common Stocks continued | ||||||
| Shares | Value (Note 1) | |||||
| (000s) | ||||||
| Hong Kong – continued | ||||||
| Hutchison Whampoa Ltd. | 2,234,000 | $ | 21,152 | |||
| Li & Fung Ltd. | 4,172,000 | 8,907 | ||||
| PYI Corp. Ltd. | 26,305 | 5 | ||||
| Shun Tak Holdings Ltd. | 2,424,000 | 1,751 | ||||
| Techtronic Industries Co. Ltd. | 6,707,500 | 16,483 | ||||
| Wharf Holdings Ltd. | 1,509,000 | 5,149 | ||||
| TOTAL HONG KONG | 86,974 | |||||
| India – 1.4% | ||||||
| Cipla Ltd. | 511,165 | 4,087 | ||||
| Crompton Greaves Ltd. | 252,847 | 3,452 | ||||
| Infosys Technologies Ltd. | 296,842 | 16,610 | ||||
| Pfizer Ltd. | 218,539 | 3,755 | ||||
| State Bank of India | 721,022 | 14,952 | ||||
| Suzlon Energy Ltd. (a) | 714,804 | 11,333 | ||||
| TOTAL INDIA | 54,189 | |||||
| Ireland – 1.2% | ||||||
| Allied Irish Banks PLC | 776,300 | 16,326 | ||||
| C&C Group PLC | 2,043,700 | 12,617 | ||||
| Independent News & Media PLC (Ireland) | 3,153,642 | 8,544 | ||||
| Paddy Power PLC (Ireland) | 623,197 | 10,534 | ||||
| TOTAL IRELAND | 48,021 | |||||
| Israel – 0.7% | ||||||
| Bank Hapoalim BM (Reg.) | 2,497,200 | 9,565 | ||||
| Bank Leumi le-Israel BM | 1,776,100 | 5,796 | ||||
| Teva Pharmaceutical Industries Ltd. sponsored ADR | 290,200 | 11,062 | ||||
| TOTAL ISRAEL | 26,423 | |||||
| Italy 2.1% | ||||||
| Banche Popolari Unite S.c.a.r.l. | 263,700 | 5,583 | ||||
| Cassa Di Risparmio Di Firenze | 2,248,700 | 6,707 | ||||
| ENI Spa | 288,800 | 7,725 | ||||
| ENI Spa sponsored ADR | 149,700 | 20,022 | ||||
| Lottomatica Spa New | 227,400 | 8,260 | ||||
| Mediobanca Spa | 391,500 | 6,932 | ||||
| Pirelli & C. Real Estate Spa | 122,800 | 6,720 | ||||
| Unicredito Italiano Spa | 3,725,500 | 20,802 | ||||
| TOTAL ITALY | 82,751 | |||||
See accompanying notes which are an integral part of the financial statements.
| Annual Report |
| 14 |
| Common Stocks continued | ||||||
| Shares | Value (Note 1) | |||||
| (000s) | ||||||
| Japan 21.7% | ||||||
| Aeon Co. Ltd. | 1,205,600 | $ | 25,058 | |||
| Asics Corp. | 327,000 | 2,821 | ||||
| Astellas Pharma, Inc. | 353,700 | 12,712 | ||||
| Canon, Inc. | 340,100 | 18,049 | ||||
| Credit Saison Co. Ltd. | 593,600 | 26,989 | ||||
| Daihatsu Motor Co. Ltd. | 782,000 | 7,463 | ||||
| Daikin Industries Ltd. | 350,000 | 9,154 | ||||
| E*TRADE Securities Co. Ltd. (d) | 3,361 | 17,668 | ||||
| FamilyMart Co. Ltd. | 281,200 | 8,402 | ||||
| Fullcast Co. Ltd. (d) | 1,334 | 3,443 | ||||
| Hokuto Corp. (d) | 144,400 | 2,343 | ||||
| Honda Motor Co. Ltd. | 200,100 | 11,130 | ||||
| Hoya Corp. | 111,400 | 3,917 | ||||
| Hoya Corp. New | 334,200 | 11,664 | ||||
| Ibiden Co. Ltd. | 269,900 | 10,939 | ||||
| JAFCO Co. Ltd. | 116,400 | 7,016 | ||||
| JGC Corp. | 400,000 | 6,551 | ||||
| JSR Corp. | 659,900 | 15,630 | ||||
| Kose Corp. | 165,200 | 5,994 | ||||
| Koyo Seiko Co. Ltd. | 659,000 | 10,604 | ||||
| Matsushita Electric Industrial Co. Ltd. | 1,492,000 | 27,453 | ||||
| Mitsubishi UFJ Financial Group, Inc. | 974 | 12,360 | ||||
| Mitsui & Co. Ltd. | 2,006,000 | 24,721 | ||||
| Mitsui Fudosan Co. Ltd. | 925,000 | 15,180 | ||||
| Mitsui Trust Holdings, Inc. | 1,921,000 | 23,191 | ||||
| Mizuho Financial Group, Inc. | 4,023 | 26,896 | ||||
| Nidec Corp. | 37,100 | 2,182 | ||||
| Nidec Corp. New | 37,100 | 2,182 | ||||
| Nikko Cordial Corp. | 1,732,500 | 21,005 | ||||
| Nippon Electric Glass Co. Ltd. | 923,000 | 17,705 | ||||
| Nippon Oil Corp. | 1,544,000 | 13,144 | ||||
| Nippon Steel Corp. | 1,972,000 | 7,053 | ||||
| Nishi-Nippon City Bank Ltd. (a) | 1,065,000 | 6,216 | ||||
| Nishimatsuya Chain Co. Ltd. | 70,900 | 2,702 | ||||
| Nitto Denko Corp. | 330,300 | 20,052 | ||||
| Nomura Holdings, Inc. | 557,600 | 8,637 | ||||
| Okumura Holdings, Inc. | 1,568,000 | 9,845 | ||||
| OMC Card, Inc. | 738,000 | 12,418 | ||||
| ORIX Corp. | 140,900 | 26,442 | ||||
| Saint Marc Co. Ltd. | 83,900 | 4,251 | ||||
| Sega Sammy Holdings, Inc. | 359,800 | 12,962 | ||||
| Sega Sammy Holdings, Inc. New | 359,800 | 13,056 | ||||
See accompanying notes which are an integral part of the financial statements.
15 Annual Report
| Investments continued | ||||||
| Common Stocks continued | ||||||
| Shares | Value (Note 1) | |||||
| (000s) | ||||||
| Japan – continued | ||||||
| Seiyu Ltd. (a)(d) | 2,865,000 | $ | 5,880 | |||
| Seven & I Holdings Co. Ltd. (a) | 576,900 | 18,985 | ||||
| SFCG Co. Ltd. | 6,990 | 1,688 | ||||
| SHIMIZU Corp. | 2,038,000 | 13,819 | ||||
| Sompo Japan Insurance, Inc | 1,506,000 | 22,693 | ||||
| Sugi Pharmacy Co. Ltd. | 171,900 | 6,669 | ||||
| Sumitomo Electric Industries Ltd. | 1,487,000 | 19,600 | ||||
| Sumitomo Forestry Co. Ltd. | 448,000 | 4,155 | ||||
| Sumitomo Mitsui Financial Group, Inc. | 3,629 | 33,628 | ||||
| Sumitomo Rubber Industries Ltd. | 677,000 | 8,337 | ||||
| Sumitomo Titanium Corp. (d) | 36,000 | 4,178 | ||||
| Sumitomo Titanium Corp. New | 36,000 | 4,053 | ||||
| T&D Holdings, Inc. | 311,000 | 19,634 | ||||
| Takeda Pharamaceutical Co. Ltd. | 196,000 | 10,795 | ||||
| The Daimaru, Inc. | 316,000 | 3,864 | ||||
| The Sumitomo Warehouse Co. Ltd. (d) | 338,000 | 2,629 | ||||
| THK Co. Ltd. | 387,900 | 8,768 | ||||
| TIS, Inc. | 92,600 | 2,189 | ||||
| Toho Titanium Co. Ltd. | 112,000 | 7,517 | ||||
| Tokuyama Corp. | 1,846,000 | 18,385 | ||||
| Tokyo Electron Ltd. | 195,600 | 9,842 | ||||
| Tokyo Star Bank Ltd. (a) | 296 | 1,041 | ||||
| Tokyo Tomin Bank Ltd. | 284,400 | 10,468 | ||||
| Toyo Ink Manufacturing Co. Ltd. | 829,000 | 3,568 | ||||
| Toyota Motor Corp. | 1,213,800 | 56,326 | ||||
| UCS Co. Ltd. | 1,000 | 38 | ||||
| Urban Corp. (d) | 237,200 | 14,749 | ||||
| USS Co. Ltd. | 82,540 | 5,690 | ||||
| Valor Co. Ltd. | 24,000 | 727 | ||||
| Yahoo! Japan Corp | 3,840 | 4,090 | ||||
| Yahoo! Japan Corp. New | 3,840 | 4,157 | ||||
| Yamada Denki Co. Ltd. | 70,200 | 6,183 | ||||
| TOTAL JAPAN | 861,545 | |||||
| Korea (South) 1.6% | ||||||
| Hyundai Department Store Co. Ltd. | 65,420 | 4,343 | ||||
| Hyundai Mobis | 69,770 | 5,547 | ||||
| LG Household & Health Care Ltd. | 177,780 | 9,706 | ||||
| NHN Corp. (a) | 57,857 | 9,615 | ||||
| Samsung Electronics Co. Ltd. | 18,972 | 10,031 | ||||
See accompanying notes which are an integral part of the financial statements.
| Annual Report |
| 16 |
| Common Stocks continued | ||||||
| Shares | Value (Note 1) | |||||
| (000s) | ||||||
| Korea (South) – continued | ||||||
| Shinhan Financial Group Co. Ltd. | 588,780 | $ | 19,626 | |||
| Shinsegae Co. Ltd. | 15,900 | 5,696 | ||||
| TOTAL KOREA (SOUTH) | 64,564 | |||||
| Luxembourg 0.6% | ||||||
| SES Global unit | 1,048,962 | 16,410 | ||||
| Stolt-Nielsen SA Class B sponsored ADR | 195,300 | 7,005 | ||||
| TOTAL LUXEMBOURG | 23,415 | |||||
| Mexico – 0.1% | ||||||
| Urbi, Desarrollos Urbanos, SA de CV (a) | 604,900 | 3,870 | ||||
| Netherlands – 3.0% | ||||||
| ASML Holding NV (NY Shares) (a) | 928,800 | 15,771 | ||||
| Axalto Holding NV (a) | 180,900 | 4,925 | ||||
| EADS NV (d) | 369,500 | 12,801 | ||||
| ING Groep NV (Certificaten Van Aandelen) | 588,444 | 16,982 | ||||
| Koninklijke Numico NV (a) | 229,000 | 9,273 | ||||
| Koninklijke Wessanen NV | 571,800 | 8,397 | ||||
| Randstad Holdings NV | 198,700 | 7,608 | ||||
| Tele Atlas NV (a) | 132,400 | 3,682 | ||||
| Unilever NV (NY Shares) | 405,900 | 28,539 | ||||
| VNU NV | 388,575 | 12,358 | ||||
| TOTAL NETHERLANDS | 120,336 | |||||
| Norway 1.5% | ||||||
| DnB NOR ASA | 1,648,600 | 16,851 | ||||
| Schibsted ASA (B Shares) | 321,200 | 9,257 | ||||
| TANDBERG ASA (d) | 585,300 | 5,758 | ||||
| TANDBERG Television ASA (a) | 833,500 | 10,377 | ||||
| Telenor ASA | 1,501,000 | 14,650 | ||||
| Yara International ASA | 291,600 | 4,807 | ||||
| TOTAL NORWAY | 61,700 | |||||
| Poland – 0.2% | ||||||
| TVN SA | 487,049 | 8,309 | ||||
| Portugal 0.2% | ||||||
| Media Capital SGPS SA (a) | 1,046,093 | 8,402 | ||||
| Russia – 0.2% | ||||||
| Mobile TeleSystems OJSC sponsored ADR | 146,700 | 5,426 | ||||
| Novatek JSC GDR (a)(e) | 66,900 | 1,504 | ||||
| TOTAL RUSSIA | 6,930 | |||||
See accompanying notes which are an integral part of the financial statements.
17 Annual Report
| Investments continued | ||||||
| Common Stocks continued | ||||||
| Shares | Value (Note 1) | |||||
| (000s) | ||||||
| Singapore – 0.5% | ||||||
| Ascendas Real Estate Investment Trust (A REIT) | 4,630,000 | $ | 5,494 | |||
| HTL International Holdings Ltd. | 5,750,000 | 4,277 | ||||
| Keppel Corp. Ltd. | 1,166,000 | 7,985 | ||||
| STATS ChipPAC Ltd. (a) | 4,624,000 | 2,539 | ||||
| TOTAL SINGAPORE | 20,295 | |||||
| South Africa 1.1% | ||||||
| FirstRand Ltd. | 3,829,000 | 9,010 | ||||
| JD Group Ltd. | 832,000 | 8,897 | ||||
| MTN Group Ltd. | 1,019,800 | 7,599 | ||||
| Nedbank Group Ltd | 404,000 | 5,148 | ||||
| Standard Bank Group Ltd. | 522,700 | 5,391 | ||||
| Steinhoff International Holdings Ltd. | 3,205,100 | 8,388 | ||||
| TOTAL SOUTH AFRICA | 44,433 | |||||
| Spain – 2.5% | ||||||
| Altadis SA (Spain) | 595,900 | 25,287 | ||||
| Antena 3 Television SA | 554,756 | 10,787 | ||||
| Banco Bilbao Vizcaya Argentaria SA | 904,800 | 15,952 | ||||
| Banco Santander Central Hispano SA | 1,324,300 | 16,805 | ||||
| Gestevision Telecinco SA | 76,300 | 1,693 | ||||
| Telefonica SA sponsored ADR | 610,279 | 29,263 | ||||
| TOTAL SPAIN | 99,787 | |||||
| Sweden – 1.4% | ||||||
| Eniro AB (d) | 1,035,700 | 11,318 | ||||
| Gambro AB (A Shares) | 549,550 | 7,765 | ||||
| Hennes & Mauritz AB (H&M) (B Shares) | 456,450 | 14,820 | ||||
| Modern Times Group AB (MTG) (B Shares) (a) | 160,900 | 6,154 | ||||
| Skandia Foersaekrings AB | 836,080 | 4,169 | ||||
| Telefonaktiebolaget LM Ericsson (B Shares) sponsored ADR | 366,300 | 12,018 | ||||
| TOTAL SWEDEN | 56,244 | |||||
| Switzerland – 8.8% | ||||||
| ABB Ltd. sponsored ADR (a) | 2,803,300 | 21,838 | ||||
| Actelion Ltd. (Reg.) (a) | 61,976 | 6,971 | ||||
| Compagnie Financiere Richemont unit | 499,334 | 18,999 | ||||
| Credit Suisse Group (Reg.) | 511,224 | 22,652 | ||||
| Logitech International SA (Reg.) (a) | 246,526 | 9,342 | ||||
| Nestle SA (Reg.) | 165,409 | 49,270 | ||||
| Nobel Biocare Holding AG (Switzerland) | 72,217 | 16,652 | ||||
| Novartis AG (Reg.) | 1,339,631 | 72,099 | ||||
See accompanying notes which are an integral part of the financial statements.
| Annual Report |
| 18 |
| Common Stocks continued | ||||||
| Shares | Value (Note 1) | |||||
| (000s) | ||||||
| Switzerland – continued | ||||||
| Pargesa Holding SA | 116,000 | $ | 8,953 | |||
| Phonak Holding AG | 213,528 | 8,903 | ||||
| Roche Holding AG (participation certificate) | 465,762 | 69,585 | ||||
| Societe Generale de Surveillance Holding SA (SGS) (Reg.) | 10,415 | 7,675 | ||||
| Syngenta AG (Switzerland) | 77,508 | 8,309 | ||||
| The Swatch Group AG (Reg.) | 311,573 | 8,858 | ||||
| UBS AG (NY Shares) | 243,750 | 20,882 | ||||
| TOTAL SWITZERLAND | 350,988 | |||||
| Taiwan 0.6% | ||||||
| Acer, Inc. | 3,086,440 | 6,246 | ||||
| Advanced Semiconductor Engineering, Inc. | 12,166,455 | 7,416 | ||||
| Holtek Semiconductor, Inc. | 2,780,371 | 3,282 | ||||
| Hon Hai Precision Industry Co. Ltd. (Foxconn) | 1,259,742 | 5,444 | ||||
| TOTAL TAIWAN | 22,388 | |||||
| Turkey 0.3% | ||||||
| Tupras Turkiye Petrol Rafinerileri AS | 815,000 | 13,930 | ||||
| United Arab Emirates – 0.4% | ||||||
| Investcom LLC GDR | 1,153,900 | 15,589 | ||||
| United Kingdom – 17.8% | ||||||
| Anglo American PLC (United Kingdom) | 627,100 | 18,541 | ||||
| AstraZeneca PLC sponsored ADR | 266,300 | 11,957 | ||||
| BAE Systems PLC | 4,750,009 | 27,794 | ||||
| Benfield Group PLC | 723,300 | 4,098 | ||||
| BG Group PLC | 1,368,000 | 12,013 | ||||
| BG Group PLC sponsored ADR | 200,000 | 8,904 | ||||
| Big Yellow Group PLC | 1,078,700 | 4,583 | ||||
| Body Shop International PLC | 694,700 | 2,583 | ||||
| BP PLC sponsored ADR | 1,241,500 | 82,433 | ||||
| British American Tobacco PLC sponsored ADR | 375,000 | 16,526 | ||||
| British Land Co. PLC | 627,900 | 9,894 | ||||
| Cadbury Schweppes PLC sponsored ADR | 183,000 | 7,263 | ||||
| Capita Group PLC | 1,106,900 | 7,643 | ||||
| Carnival PLC | 212,200 | 10,780 | ||||
| CLS Holdings PLC (a) | 623,893 | 5,056 | ||||
| Diageo PLC sponsored ADR (d) | 319,100 | 18,964 | ||||
| Enterprise Inns PLC | 505,225 | 6,972 | ||||
| GlaxoSmithKline PLC sponsored ADR | 1,177,000 | 61,192 | ||||
| Hilton Group PLC | 1,670,000 | 10,030 | ||||
See accompanying notes which are an integral part of the financial statements.
19 Annual Report
| Investments continued | ||||||
| Common Stocks continued | ||||||
| Shares | Value (Note 1) | |||||
| (000s) | ||||||
| United Kingdom – continued | ||||||
| HSBC Holdings PLC: | ||||||
| (Hong Kong) (Reg.) | 2,859,677 | $ | 45,046 | |||
| (United Kingdom) (Reg.) | 700,000 | 11,026 | ||||
| Imperial Tobacco Group PLC sponsored ADR | 175,100 | 10,107 | ||||
| Inchcape PLC | 274,800 | 10,022 | ||||
| Informa PLC | 1,379,400 | 9,140 | ||||
| Kazakhmys PLC | 392,800 | 3,755 | ||||
| Man Group PLC | 228,400 | 6,227 | ||||
| NDS Group PLC sponsored ADR (a) | 83,800 | 3,067 | ||||
| Prudential PLC | 1,400,482 | 11,753 | ||||
| Reckitt Benckiser PLC | 221,900 | 6,706 | ||||
| Reuters Group PLC sponsored ADR | 315,700 | 12,003 | ||||
| RHM PLC | 545,700 | 2,502 | ||||
| Rio Tinto PLC sponsored ADR | 119,100 | 18,177 | ||||
| Rolls Royce Group PLC | 1,870,810 | 12,089 | ||||
| Royal Bank of Scotland Group PLC | 707,171 | 19,581 | ||||
| Royal Dutch Shell PLC Class B | 1,861,659 | 60,886 | ||||
| SIG PLC | 536,100 | 6,454 | ||||
| Smiths Group PLC | 881,900 | 14,247 | ||||
| Standard Chartered PLC (United Kingdom) | 5,218 | 110 | ||||
| Tesco PLC | 2,887,000 | 15,372 | ||||
| Virgin Mobile Holdings (UK) PLC | 2,275,000 | 12,083 | ||||
| Vodafone Group PLC | 24,328,312 | 63,886 | ||||
| Whatman PLC | 735,900 | 3,648 | ||||
| William Hill PLC | 1,104,700 | 10,454 | ||||
| Yell Group PLC | 1,122,600 | 8,795 | ||||
| TOTAL UNITED KINGDOM | 704,362 | |||||
| United States of America – 0.4% | ||||||
| Macquarie Infrastructure Co. Trust | 131,000 | 3,930 | ||||
| Synthes, Inc. | 96,588 | 10,227 | ||||
| TOTAL UNITED STATES OF AMERICA | 14,157 | |||||
| TOTAL COMMON STOCKS | ||||||
| (Cost $3,254,009) | 3,835,794 | |||||
See accompanying notes which are an integral part of the financial statements.
| Annual Report |
| 20 |
| Nonconvertible Preferred Stocks 1.4% | ||||||||||
| Shares | Value (Note 1) | |||||||||
| (000s) | ||||||||||
| Germany – 0.7% | ||||||||||
| Fresenius AG | 91,800 | $ | 12,897 | |||||||
| Porsche AG (non-vtg.) | 20,595 | 14,850 | ||||||||
| TOTAL GERMANY | 27,747 | |||||||||
| Italy 0.7% | ||||||||||
| Banca Intesa Spa (Risp) | 4,403,802 | 19,073 | ||||||||
| Telecom Italia Spa (Risp) | 2,851,985 | 6,896 | ||||||||
| TOTAL ITALY | 25,969 | |||||||||
| United Kingdom – 0.0% | ||||||||||
| Rolls Royce Group PLC Series B | 62,485,054 | 112 | ||||||||
| TOTAL NONCONVERTIBLE PREFERRED STOCKS | ||||||||||
| (Cost $43,252) | 53,828 | |||||||||
| Government Obligations 0.1% | ||||||||||
| Principal | ||||||||||
| Amount (000s) | ||||||||||
| United States of America – 0.1% | ||||||||||
| U.S. Treasury Bills, yield at date of purchase 3.4% to | ||||||||||
| 3.7% 11/10/05 to 1/12/06 (f) | ||||||||||
| (Cost $3,537) | $ | 3,550 | 3,537 | |||||||
| Money Market Funds 3.8% | ||||||||||
| Shares | ||||||||||
| Fidelity Cash Central Fund, 3.92% (b) | 87,790,364 | 87,790 | ||||||||
| Fidelity Securities Lending Cash Central Fund, | ||||||||||
| 3.94% (b)(c) | 61,922,662 | 61,923 | ||||||||
| TOTAL MONEY MARKET FUNDS | ||||||||||
| (Cost $149,713) | 149,713 | |||||||||
| TOTAL INVESTMENT PORTFOLIO 102.0% | ||||||||||
| (Cost $3,450,511) | 4,042,872 | |||||||||
| NET OTHER ASSETS – (2.0)% | (78,121) | |||||||||
| NET ASSETS 100% | $ | 3,964,751 | ||||||||
See accompanying notes which are an integral part of the financial statements.
21 Annual Report
| Investments continued | ||||||||
| Futures Contracts | ||||||||
| Expiration | Underlying | Unrealized | ||||||
| Date | Face Amount | Appreciation/ | ||||||
| at Value (000s) | (Depreciation) | |||||||
| (000s) | ||||||||
| Purchased | ||||||||
| Equity Index Contracts | ||||||||
| 734 Nikkei 225 Index Contracts (Japan) | Dec. 2005 | $ 50,224 | $ | 3,471 | ||||
The face value of futures purchased as a percentage of net assets – 1.3%
| Legend (a) Non-income producing (b) Affiliated fund that is available only to investment companies and other accounts managed by Fidelity Investments. The rate quoted is the annualized seven-day yield of the fund at period end. A complete unaudited listing of the fund’s holdings as of its most recent quarter end is available upon request. (c) Investment made with cash collateral received from securities on loan. (d) Security or a portion of the security is on loan at period end. (e) Security exempt from registration under Rule 144A of the Securities Act of 1933 These securities may be resold in transactions exempt from registration, normally to qualified institutional buyers At the period end, the value of these securities amounted to $1,504,000 or 0.0% of net assets. (f) Security or a portion of the security was pledged to cover margin requirements for futures contracts. At the period end, the value of securities pledged amounted to $3,537,000. |
See accompanying notes which are an integral part of the financial statements.
Annual Report 22
| Financial Statements | ||||||||
| Statement of Assets and Liabilities | ||||||||
| Amounts in thousands (except per share amounts) | October 31, 2005 | |||||||
| Assets | ||||||||
| Investment in securities, at value (including securities | ||||||||
| loaned of $59,194) (cost $3,450,511) See | ||||||||
| accompanying schedule | $ | 4,042,872 | ||||||
| Foreign currency held at value (cost $5,466) | 5,473 | |||||||
| Receivable for investments sold | 63,155 | |||||||
| Receivable for fund shares sold | 11,994 | |||||||
| Dividends receivable | 4,355 | |||||||
| Interest receivable | 303 | |||||||
| Receivable for daily variation on futures contracts | 918 | |||||||
| Other affiliated receivables | 1 | |||||||
| Other receivables | 396 | |||||||
| Total assets | 4,129,467 | |||||||
| Liabilities | ||||||||
| Payable for investments purchased | $ | 96,287 | ||||||
| Payable for fund shares redeemed | 2,333 | |||||||
| Accrued management fee | 2,590 | |||||||
| Distribution fees payable | 3 | |||||||
| Other affiliated payables | 875 | |||||||
| Other payables and accrued expenses | 705 | |||||||
| Collateral on securities loaned, at value | 61,923 | |||||||
| Total liabilities | 164,716 | |||||||
| Net Assets | $ | 3,964,751 | ||||||
| Net Assets consist of: | ||||||||
| Paid in capital | $ | 3,137,488 | ||||||
| Undistributed net investment income | 40,185 | |||||||
| Accumulated undistributed net realized gain (loss) on | ||||||||
| investments and foreign currency transactions | 191,747 | |||||||
| Net unrealized appreciation (depreciation) on | ||||||||
| investments and assets and liabilities in foreign | ||||||||
| currencies | 595,331 | |||||||
| Net Assets | $ | 3,964,751 | ||||||
See accompanying notes which are an integral part of the financial statements.
23 Annual Report
| Financial Statements continued | ||||
| Statement of Assets and Liabilities | ||||
| Amounts in thousands (except per share amounts) | October 31, 2005 | |||
| Calculation of Maximum Offering Price | ||||
| Class A: | ||||
| Net Asset Value and redemption price per share | ||||
| ($1,864 ÷ 60.98 shares) | $ | 30.57 | ||
| Maximum offering price per share (100/94.25 of | ||||
| $30.57) | $ | 32.44 | ||
| Class T: | ||||
| Net Asset Value and redemption price per share | ||||
| ($1,859 ÷ 60.961 shares) | $ | 30.49 | ||
| Maximum offering price per share (100/96.50 of | ||||
| $30.49) | $ | 31.60 | ||
| Class B: | ||||
| Net Asset Value and offering price per share | ||||
| ($750 ÷ 24.7 shares)A | $ | 30.36 | ||
| Class C: | ||||
| Net Asset Value and offering price per share | ||||
| ($1,926 ÷ 63.34 shares)A | $ | 30.41 | ||
| International Discovery Fund: | ||||
| Net Asset Value and offering price per share | ||||
| ($3,948,625 ÷ 128,826 shares)A | $ | 30.65 | ||
| Institutional Class: | ||||
| Net Asset Value, offering price and redemption | ||||
| price per share ($9,727 ÷ 317 shares) | $ | 30.68 | ||
| A Redemption price per share is equal to net asset value less any applicable contingent deferred sales charge. | ||||
See accompanying notes which are an integral part of the financial statements.
Annual Report 24
| Statement of Operations | ||||||
| Amounts in thousands | Year ended October 31, 2005 | |||||
| Investment Income | ||||||
| Dividends | $ | 75,520 | ||||
| Interest | 2,236 | |||||
| Security lending | 3,003 | |||||
| 80,759 | ||||||
| Less foreign taxes withheld | (7,662) | |||||
| Total income | 73,097 | |||||
| Expenses | ||||||
| Management fee | ||||||
| Basic fee | $ | 22,337 | ||||
| Performance adjustment | 497 | |||||
| Transfer agent fees | 7,458 | |||||
| Distribution fees | 18 | |||||
| Accounting and security lending fees | 1,279 | |||||
| Independent trustees’ compensation | 14 | |||||
| Custodian fees and expenses | 1,218 | |||||
| Registration fees | 376 | |||||
| Audit | 106 | |||||
| Legal | 15 | |||||
| Interest | 1 | |||||
| Miscellaneous | 30 | |||||
| Total expenses before reductions | 33,349 | |||||
| Expense reductions | (2,029) | 31,320 | ||||
| Net investment income (loss) | 41,777 | |||||
| Realized and Unrealized Gain (Loss) | ||||||
| Net realized gain (loss) on: | ||||||
| Investment securities (net of foreign taxes of $1,279) . | 191,163 | |||||
| Foreign currency transactions | (720) | |||||
| Futures contracts | 3,731 | |||||
| Total net realized gain (loss) | 194,174 | |||||
| Change in net unrealized appreciation (depreciation) on: | ||||||
| Investment securities (net of decrease in deferred for- | ||||||
| eign taxes of $374) | 320,747 | |||||
| Assets and liabilities in foreign currencies | (602) | |||||
| Futures contracts | 4,699 | |||||
| Total change in net unrealized appreciation | ||||||
| (depreciation) | 324,844 | |||||
| Net gain (loss) | 519,018 | |||||
| Net increase (decrease) in net assets resulting from | ||||||
| operations | $ | 560,795 | ||||
See accompanying notes which are an integral part of the financial statements.
25 Annual Report
| Financial Statements continued | ||||||||
| Statement of Changes in Net Assets | ||||||||
| Year ended | Year ended | |||||||
| October 31, | October 31, | |||||||
| Amounts in thousands | 2005 | 2004 | ||||||
| Increase (Decrease) in Net Assets | ||||||||
| Operations | ||||||||
| Net investment income (loss) | $ | 41,777 | $ | 16,421 | ||||
| Net realized gain (loss) | 194,174 | 91,216 | ||||||
| Change in net unrealized appreciation (depreciation) . | 324,844 | 127,395 | ||||||
| Net increase (decrease) in net assets resulting | ||||||||
| from operations | 560,795 | 235,032 | ||||||
| Distributions to shareholders from net investment income . | (12,813) | (10,818) | ||||||
| Distributions to shareholders from net realized gain | (10,250) | — | ||||||
| Total distributions | (23,063) | (10,818) | ||||||
| Share transactions - net increase (decrease) | 1,234,164 | 725,354 | ||||||
| Redemption fees | 193 | 227 | ||||||
| Total increase (decrease) in net assets | 1,772,089 | 949,795 | ||||||
| Net Assets | ||||||||
| Beginning of period | 2,192,662 | 1,242,867 | ||||||
| End of period (including undistributed net investment | ||||||||
| income of $40,185 and undistributed net investment | ||||||||
| income of $15,147, respectively) | $ | 3,964,751 | $ | 2,192,662 | ||||
See accompanying notes which are an integral part of the financial statements.
| Annual Report |
| 26 |
| Financial Highlights Class A | ||||
| Year ended October 31, | 2005F | |||
| Selected Per Share Data | ||||
| Net asset value, beginning of period | $ | 27.41 | ||
| Income from Investment Operations | ||||
| Net investment income (loss)E | 28 | |||
| Net realized and unrealized gain (loss) | 2.88 | |||
| Total from investment operations | 3.16 | |||
| Redemption fees added to paid in capitalE | —H | |||
| Net asset value, end of period | $ | 30.57 | ||
| Total ReturnB,C,D | 11.53% | |||
| Ratios to Average Net AssetsG | ||||
| Expenses before expense reductions | 1.42%A | |||
| Expenses net of voluntary waivers, if any | 1.42%A | |||
| Expenses net of all reductions | 1.36%A | |||
| Net investment income (loss) | 1.15%A | |||
| Supplemental Data | ||||
| Net assets, end of period (000 omitted) | $ | 1,864 | ||
| Portfolio turnover rate | 75% |
| A Annualized B Total returns for periods of less than one year are not annualized. C Total returns would have been lower had certain expenses not been reduced during the periods shown. D Total returns do not include the effect of the sales charges. E Calculated based on average shares outstanding during the period. F For the period January 6, 2005 (commencement of sale of shares) to October 31, 2005. G Expense ratios reflect operating expenses of the class. Expenses before reductions do not reflect amounts reimbursed by the investment adviser or reductions from brokerage service arrangements or other expense offset arrangements and do not represent the amount paid by the class during periods when reimbursements or reductions occur. Expense ratios before reductions for start up periods may not be representative of longer term operating periods. Expenses net of any voluntary waivers reflect expenses after reimbursement by the investment adviser but prior to reductions from brokerage service arrangements or other expense offset arrangements. Expenses net of all reductions represent the net expenses paid by the class. H Amount represents less than $.01 per share. |
See accompanying notes which are an integral part of the financial statements.
27 Annual Report
| Financial Highlights Class T | ||||
| Year ended October 31, | 2005F | |||
| Selected Per Share Data | ||||
| Net asset value, beginning of period | $ | 27.41 | ||
| Income from Investment Operations | ||||
| Net investment income (loss)E | 20 | |||
| Net realized and unrealized gain (loss) | 2.88 | |||
| Total from investment operations | 3.08 | |||
| Redemption fees added to paid in capitalE | —H | |||
| Net asset value, end of period | $ | 30.49 | ||
| Total ReturnB,C,D | 11.24% | |||
| Ratios to Average Net AssetsG | ||||
| Expenses before expense reductions | 1.75%A | |||
| Expenses net of voluntary waivers, if any | 1.75%A | |||
| Expenses net of all reductions | 1.69%A | |||
| Net investment income (loss) | 83%A | |||
| Supplemental Data | ||||
| Net assets, end of period (000 omitted) | $ | 1,859 | ||
| Portfolio turnover rate | 75% |
| A Annualized B Total returns for periods of less than one year are not annualized. C Total returns would have been lower had certain expenses not been reduced during the periods shown. D Total returns do not include the effect of the sales charges. E Calculated based on average shares outstanding during the period. F For the period January 6, 2005 (commencement of sale of shares) to October 31, 2005. G Expense ratios reflect operating expenses of the class. Expenses before reductions do not reflect amounts reimbursed by the investment adviser or reductions from brokerage service arrangements or other expense offset arrangements and do not represent the amount paid by the class during periods when reimbursements or reductions occur. Expense ratios before reductions for start up periods may not be representative of longer term operating periods. Expenses net of any voluntary waivers reflect expenses after reimbursement by the investment adviser but prior to reductions from brokerage service arrangements or other expense offset arrangements. Expenses net of all reductions represent the net expenses paid by the class. H Amount represents less than $.01 per share. |
See accompanying notes which are an integral part of the financial statements.
| Annual Report |
| 28 |
| Financial Highlights Class B | ||||
| Year ended October 31, | 2005F | |||
| Selected Per Share Data | ||||
| Net asset value, beginning of period | $ | 27.41 | ||
| Income from Investment Operations | ||||
| Net investment income (loss)E | 08 | |||
| Net realized and unrealized gain (loss) | 2.87 | |||
| Total from investment operations | 2.95 | |||
| Redemption fees added to paid in capitalE | —H | |||
| Net asset value, end of period | $ | 30.36 | ||
| Total ReturnB,C,D | 10.76% | |||
| Ratios to Average Net AssetsG | ||||
| Expenses before expense reductions | 2.24%A | |||
| Expenses net of voluntary waivers, if any | 2.24%A | |||
| Expenses net of all reductions | 2.18%A | |||
| Net investment income (loss) | 33%A | |||
| Supplemental Data | ||||
| Net assets, end of period (000 omitted) | $ | 750 | ||
| Portfolio turnover rate | 75% |
| A Annualized B Total returns for periods of less than one year are not annualized. C Total returns would have been lower had certain expenses not been reduced during the periods shown. D Total returns do not include the effect of the contingent deferred sales charge. E Calculated based on average shares outstanding during the period. F For the period January 6, 2005 (commencement of sale of shares) to October 31, 2005. G Expense ratios reflect operating expenses of the class. Expenses before reductions do not reflect amounts reimbursed by the investment adviser or reductions from brokerage service arrangements or other expense offset arrangements and do not represent the amount paid by the class during periods when reimbursements or reductions occur. Expense ratios before reductions for start up periods may not be representative of longer term operating periods. Expenses net of any voluntary waivers reflect expenses after reimbursement by the investment adviser but prior to reductions from brokerage service arrangements or other expense offset arrangements. Expenses net of all reductions represent the net expenses paid by the class. H Amount represents less than $.01 per share. |
See accompanying notes which are an integral part of the financial statements.
29 Annual Report
| Financial Highlights Class C | ||||
| Year ended October 31, | 2005F | |||
| Selected Per Share Data | ||||
| Net asset value, beginning of period | $ | 27.41 | ||
| Income from Investment Operations | ||||
| Net investment income (loss)E | 13 | |||
| Net realized and unrealized gain (loss) | 2.87 | |||
| Total from investment operations | 3.00 | |||
| Redemption fees added to paid in capitalE | —H | |||
| Net asset value, end of period | $ | 30.41 | ||
| Total ReturnB,C,D | 10.94% | |||
| Ratios to Average Net AssetsG | ||||
| Expenses before expense reductions | 2.04%A | |||
| Expenses net of voluntary waivers, if any | 2.04%A | |||
| Expenses net of all reductions | 1.98%A | |||
| Net investment income (loss) | 53%A | |||
| Supplemental Data | ||||
| Net assets, end of period (000 omitted) | $ | 1,926 | ||
| Portfolio turnover rate | 75% |
| A Annualized B Total returns for periods of less than one year are not annualized. C Total returns would have been lower had certain expenses not been reduced during the periods shown. D Total returns do not include the effect of the contingent deferred sales charge. E Calculated based on average shares outstanding during the period. F For the period January 6, 2005 (commencement of sale of shares) to October 31, 2005. G Expense ratios reflect operating expenses of the class. Expenses before reductions do not reflect amounts reimbursed by the investment adviser or reductions from brokerage service arrangements or other expense offset arrangements and do not represent the amount paid by the class during periods when reimbursements or reductions occur. Expense ratios before reductions for start up periods may not be representative of longer term operating periods. Expenses net of any voluntary waivers reflect expenses after reimbursement by the investment adviser but prior to reductions from brokerage service arrangements or other expense offset arrangements. Expenses net of all reductions represent the net expenses paid by the class. H Amount represents less than $.01 per share. |
See accompanying notes which are an integral part of the financial statements.
| Annual Report |
| 30 |
| Financial Highlights International Discovery Fund | ||||||||||||||
| Years ended October 31, | 2005 | 2004 | 2003 | 2002 | 2001 | |||||||||
| Selected Per Share Data | ||||||||||||||
| Net asset value, beginning of | ||||||||||||||
| period | $ 25.31 | $ 21.87 | $ 16.66 | $ | 17.61 | $ | 26.70 | |||||||
| Income from Investment | ||||||||||||||
| Operations | ||||||||||||||
| Net investment income (loss)C | 37 | .22 | .19 | .11 | .19D | |||||||||
| Net realized and unrealized | ||||||||||||||
| gain (loss) | 5.24 | 3.40 | 5.11 | (1.06) | (6.11) | |||||||||
| Total from investment operations . | 5.61 | 3.62 | 5.30 | (.95) | (5.92) | |||||||||
| Distributions from net investment | ||||||||||||||
| income | (.15) | (.18) | (.09) | — | (.51) | |||||||||
| Distributions from net realized | ||||||||||||||
| gain | (.12) | — | — | (2.66) | ||||||||||
| Total distributions | (.27) | (.18) | (.09) | (3.17) | ||||||||||
| Redemption fees added to paid in | ||||||||||||||
| capitalC,F | — | — | — | — | — | |||||||||
| Net asset value, end of period | $ 30.65 | $ 25.31 | $ 21.87 | $ | 16.66 | $ | 17.61 | |||||||
| Total ReturnA,B | 22.29% | 16.65% | 31.97% | (5.39)% | (24.91)% | |||||||||
| Ratios to Average Net AssetsE | ||||||||||||||
| Expenses before expense re- | ||||||||||||||
| ductions | 1.08% | 1.10% | 1.14% | 1.14% | 1.14% | |||||||||
| Expenses net of voluntary | ||||||||||||||
| waivers, if any | 1.07% | 1.10% | 1.14% | 1.14% | 1.14% | |||||||||
| Expenses net of all reductions . | 1.01% | 1.06% | 1.11% | 1.12% | 1.09% | |||||||||
| Net investment income (loss) | 1.35% | .92% | 1.08% | .59% | .91% | |||||||||
| Supplemental Data | ||||||||||||||
| Net assets, end of period (in | ||||||||||||||
| millions) | $ 3,949 | $ 2,193 | $ 1,243 | $ | 890 | $ | 882 | |||||||
| Portfolio turnover rate | 75% | 87% | 81% | 63% | 81% | |||||||||
| A Total returns would have been lower had certain expenses not been reduced during the periods shown. B Total returns do not include the effect of the contingent deferred sales charge. C Calculated based on average shares outstanding during the period. D Investment income per share reflects a special dividend which amounted to $.04 per share. E Expense ratios reflect operating expenses of the class. Expenses before reductions do not reflect amounts reimbursed by the investment adviser or reductions from brokerage service arrangements or other expense offset arrangements and do not represent the amount paid by the class during periods when reimbursements or reductions occur. Expenses net of any voluntary waivers reflect expenses after reimbursement by the investment adviser but prior to reductions from brokerage service arrangements or other expense offset arrangements. Expenses net of all reductions repre sent the net expenses paid by the class. F Amount represents less than $.01 per share. |
See accompanying notes which are an integral part of the financial statements.
31 Annual Report
| Financial Highlights Institutional Class | ||||
| Year ended October 31, | 2005E | |||
| Selected Per Share Data | ||||
| Net asset value, beginning of period | $ | 27.41 | ||
| Income from Investment Operations | ||||
| Net investment income (loss)D | 38 | |||
| Net realized and unrealized gain (loss) | 2.89 | |||
| Total from investment operations | 3.27 | |||
| Redemption fees added to paid in capitalD | —G | |||
| Net asset value, end of period | $ | 30.68 | ||
| Total ReturnB,C | 11.93% | |||
| Ratios to Average Net AssetsF | ||||
| Expenses before expense reductions | 97%A | |||
| Expenses net of voluntary waivers, if any | 97%A | |||
| Expenses net of all reductions | 90%A | |||
| Net investment income (loss) | 1.60%A | |||
| Supplemental Data | ||||
| Net assets, end of period (000 omitted) | $ | 9,727 | ||
| Portfolio turnover rate | 75% |
| A Annualized B Total returns for periods of less than one year are not annualized. C Total returns would have been lower had certain expenses not been reduced during the periods shown. D Calculated based on average shares outstanding during the period. E For the period January 6, 2005 (commencement of sale of shares) to October 31, 2005. F Expense ratios reflect operating expenses of the class. Expenses before reductions do not reflect amounts reimbursed by the investment adviser or reductions from brokerage service arrangements or other expense offset arrangements and do not represent the amount paid by the class during periods when reimbursements or reductions occur. Expense ratios before reductions for start up periods may not be representative of longer term operating periods. Expenses net of any voluntary waivers reflect expenses after reimbursement by the investment adviser but prior to reductions from brokerage service arrangements or other expense offset arrangements. Expenses net of all reductions represent the net expenses paid by the class. G Amount represents less than $.01 per share. |
See accompanying notes which are an integral part of the financial statements.
| Annual Report |
| 32 |
Notes to Financial Statements
| For the period ended October 31, 2005 |
1. Significant Accounting Policies.
Fidelity Advisor International Discovery Fund (the fund) is a fund of Fidelity Investment Trust (the trust) and is authorized to issue an unlimited number of shares. The trust is registered under the Investment Company Act of 1940, as amended (the 1940 Act), as an open end management investment company organized as a Massachusetts business trust.
The fund offers Class A, Class T, Class B, Class C, International Discovery Fund and Institutional Class shares, each of which has equal rights as to assets and voting privi leges. Each class has exclusive voting rights with respect to matters that affect that class. The fund commenced sale of Class A, Class T, Class B, Class C and Institutional Class shares on January 6, 2005. Class B shares will automatically convert to Class A shares after a holding period of seven years from the initial date of purchase. Investment income, realized and unrealized capital gains and losses, the common expenses of the fund, and certain fund level expense reductions, if any, are allocated on a pro rata basis to each class based on the relative net assets of each class to the total net assets of the fund. Each class differs with respect to transfer agent and distribution and service plan fees incurred. Certain expense reductions also differ by class.
The fund’s investments in emerging markets can be subject to social, economic, regula tory, and political uncertainties and can be extremely volatile.
The fund may invest in affiliated money market central funds (Money Market Central Funds), which are open end investment companies available to investment companies and other accounts managed by Fidelity Management & Research Company (FMR) and its affiliates. The financial statements have been prepared in conformity with accounting principles generally accepted in the United States of America, which require manage ment to make certain estimates and assumptions at the date of the financial statements. The following summarizes the significant accounting policies of the fund:
Security Valuation. Investments are valued and net asset value (NAV) per share is calculated (NAV calculation) as of the close of business of the New York Stock Exchange (NYSE), normally 4:00 p.m. Eastern time. Wherever possible, the fund uses independent pricing services approved by the Board of Trustees to value its investments.
Equity securities, including restricted securities, for which market quotations are readily available, are valued at the last reported sale price or official closing price as reported by an independent pricing service on the primary market or exchange on which they are traded. In the event there were no sales during the day or closing prices are not available, securities are valued at the last quoted bid price. Investments in open end mutual funds are valued at their closing net asset value each business day. Short term securities with remaining maturities of sixty days or less for which quotations are not readily available are valued at amortized cost, which approximates value.
33 Annual Report
Notes to Financial Statements continued
1. Significant Accounting Policies continued
Security Valuation continued
When current market prices or quotations are not readily available or do not accurately reflect fair value, valuations may be determined in accordance with procedures adopted by the Board of Trustees. For example, when developments occur between the close of a market and the close of the NYSE that may materially affect the value of some or all of the securities, or when trading in a security is halted, those securities may be fair valued. Factors used in the determination of fair value may include monitoring news to identify significant market or security specific events such as changes in the value of U.S. securi ties market, reviewing developments in foreign markets and evaluating the performance of ADRs, futures contracts and exchange traded funds. Because the fund’s utilization of fair value pricing depends on market activity, the frequency with which fair value pricing is used can not be predicted and may be utilized to a significant extent. The value of securities used for NAV calculation under fair value pricing may differ from published prices for the same securities.
Foreign Currency. The fund uses foreign currency contracts to facilitate transactions in foreign denominated securities. Losses from these transactions may arise from changes in the value of the foreign currency or if the counterparties do not perform under the contracts’ terms.
Foreign denominated assets, including investment securities, and liabilities are trans lated into U.S. dollars at the exchange rate at period end. Purchases and sales of invest ment securities, income and dividends received and expenses denominated in foreign currencies are translated into U.S. dollars at the exchange rate in effect on the transac tion date.
The effects of exchange rate fluctuations on investments are included with the net realized and unrealized gain (loss) on investment securities. Other foreign currency transactions resulting in realized and unrealized gain (loss) are disclosed separately.
Investment Transactions and Income. Security transactions are accounted for as of trade date. Gains and losses on securities sold are determined on the basis of identified cost. Dividend income is recorded on the ex dividend date, except for certain dividends from foreign securities where the ex dividend date may have passed, which are recorded as soon as the fund is informed of the ex dividend date. Non cash dividends included in dividend income, if any, are recorded at the fair market value of the securities received. Interest income is accrued as earned. Interest income includes coupon interest and amortization of premium and accretion of discount on debt securities. Investment income is recorded net of foreign taxes withheld where recovery of such taxes is uncertain.
Expenses. Most expenses of the trust can be directly attributed to a fund. Expenses which cannot be directly attributed are apportioned among each fund in the trust.
| Annual Report |
| 34 |
1. Significant Accounting Policies continued
Income Tax Information and Distributions to Shareholders. Each year, the fund intends to qualify as a regulated investment company by distributing all of its taxable income and realized gains under Subchapter M of the Internal Revenue Code. As a result, no provision for income taxes is required in the accompanying financial statements. Foreign taxes are provided for based on the fund’s understanding of the tax rules and rates that exist in the foreign markets in which it invests.
Distributions are recorded on the ex dividend date. Income dividends and capital gain distributions are declared separately for each class. Income and capital gain distribu tions are determined in accordance with income tax regulations, which may differ from generally accepted accounting principles. In addition, the fund will claim a portion of the payment made to redeeming shareholders as a distribution for income tax purposes.
Capital accounts within the financial statements are adjusted for permanent book tax differences. These adjustments have no impact on net assets or the results of operations. Temporary book tax differences will reverse in a subsequent period.
Book tax differences are primarily due to futures transactions, foreign currency transac tions, certain foreign taxes, passive foreign investment companies (PFIC), and losses deferred due to wash sales.
The tax basis components of distributable earnings and the federal tax cost as of period end were as follows:
| Unrealized appreciation | $ | 630,155,482 | ||
| Unrealized depreciation | (52,455,112) | |||
| Net unrealized appreciation (depreciation) | 577,700,370 | |||
| Undistributed ordinary income | 100,259,702 | |||
| Undistributed long term capital gain | 124,878,582 | |||
| Cost for federal income tax purposes | $ | 3,465,171,161 | ||
The tax character of distributions paid was as follows:
| October 31, 2005 | October 31, 2004 | |||||||
| Ordinary Income | $ | 12,812,810 | $ | 10,817,689 | ||||
| Long term Capital Gains | 10,250,246 | — | ||||||
| Total | $ | 23,063,056 | $ | 10,817,689 | ||||
35 Annual Report
Notes to Financial Statements continued
1. Significant Accounting Policies continued
Short Term Trading (Redemption) Fees. Shares held in the fund less than 30 days are subject to a redemption fee equal to 1.00% of the proceeds of the redeemed shares. All redemption fees, including any estimated redemption fees paid by FMR, are retained by the fund and accounted for as an addition to paid in capital.
| 2. Operating Policies. |
Repurchase Agreements. FMR has received an Exemptive Order from the Securities and Exchange Commission (the SEC) which permits the fund and other affiliated entities of FMR to transfer uninvested cash balances into joint trading accounts which are then invested in repurchase agreements. The fund may also invest directly with institutions in repurchase agreements. Repurchase agreements are collateralized by government or non government securities. Collateral is held in segregated accounts with custodian banks and may be obtained in the event of a default of the counterparty. The fund monitors, on a daily basis, the value of the collateral to ensure it is at least equal to the principal amount of the repurchase agreement (including accrued interest). In the event of a default by the counterparty, realization of the collateral proceeds could be delayed, during which time the value of the collateral may decline.
Futures Contracts. The fund may use futures contracts to manage its exposure to the stock market. Buying futures tends to increase a fund’s exposure to the underlying instrument, while selling futures tends to decrease a fund’s exposure to the underlying instrument or hedge other fund investments. Futures contracts involve, to varying degrees, risk of loss in excess of any futures variation margin reflected in the Statement of Assets and Liabilities. The underlying face amount at value of any open futures contracts at period end is shown in the Schedule of Investments under the caption “Futures Contracts.” This amount reflects each contract’s exposure to the underlying instrument at period end. Losses may arise from changes in the value of the underlying instruments or if the counterparties do not perform under the contracts’ terms. Gains (losses) are realized upon the expiration or closing of the futures contracts. Futures contracts are valued at the settlement price established each day by the board of trade or exchange on which they are traded.
Restricted Securities. The fund may invest in securities that are subject to legal or contractual restrictions on resale. These securities generally may be resold in transac tions exempt from registration or to the public if the securities are registered. Disposal of these securities may involve time consuming negotiations and expense, and prompt sale at an acceptable price may be difficult. Information regarding restricted securities is included at the end of the fund’s Schedule of Investments.
| Annual Report |
| 36 |
3. Purchases and Sales of Investments.
Purchases and sales of securities, other than short term securities and U.S. government securities, aggregated $3,540,147,268 and $2,247,496,092, respectively.
4. Fees and Other Transactions with Affiliates.
Management Fee. FMR and its affiliates provide the fund with investment manage ment related services for which the fund pays a monthly management fee. The manage ment fee is the sum of an individual fund fee rate that is based on an annual rate of .45% of the fund’s average net assets and a group fee rate that averaged .27% during the period. The group fee rate is based upon the average net assets of all the mutual funds advised by FMR. The group fee rate decreases as assets under management increase and increases as assets under management decrease. In addition, the management fee is subject to a performance adjustment (up to a maximum of .20% of the fund’s average net assets over a 36 month performance period). The upward or downward adjustment to the management fee is based on the investment performance of the asset weighted return of all classes as compared to an appropriate benchmark index. The fund’s perfor mance adjustment took effect in September 2005. Subsequent months will be added until the performance period includes 36 months. For the period, the total annual management fee rate, including the performance adjustment, was .74% of the fund’s average net assets.
Distribution and Service Plan. In accordance with Rule 12b 1 of the 1940 Act, the fund has adopted separate Distribution and Service Plans for each class of shares. Certain classes pay Fidelity Distributors Corporation (FDC), an affiliate of FMR, separate Distribution and Service Fees, each of which is based on an annual percentage of each class’ average net assets. In addition, FDC may pay financial intermediaries for selling shares of the fund and providing shareholder support services. For the period, the Distribution and Service Fee rates and the total amounts paid to and retained by FDC were as follows:
| Distribution | Service | Paid to | Retained | |||||||||
| Fee | Fee | FDC | by FDC | |||||||||
| Class A | 0% | .25% | $ | 1,809 | $ | 198 | ||||||
| Class T | 25% | .25% | 3,154 | 386 | ||||||||
| Class B | 75% | .25% | 3,610 | 2,916 | ||||||||
| Class C | 75% | .25% | 9,858 | 8,621 | ||||||||
| $ | 18,431 | $ | 12,121 | |||||||||
37 Annual Report
| Notes to Financial Statements continued | ||
4. Fees and Other Transactions with Affiliates | continued |
Sales Load. FDC receives a front end sales charge of up to 5.75% for selling Class A shares, and 3.50% for selling Class T shares, some of which is paid to financial intermedi aries for selling shares of the fund. FDC receives the proceeds of contingent deferred sales charges levied on Class A, Class T, Class B, and Class C redemptions. These charges depend on the holding period. The deferred sales charges range from 5% to 1% for Class B, 1% for Class C, and .25% for certain purchases of Class A and Class T shares.
| For the period, sales charge amounts retained by FDC were as follows: | ||||
| Retained | ||||
| by FDC | ||||
| Class A | $ | 8,161 | ||
| Class T | 1,288 | |||
| Class B* | 74 | |||
| Class C* | — | |||
| $ | 9,523 |
* When Class B and Class C shares are initially sold, FDC pays commissions from its own resources to financial intermediaries through which the sales are made.
Transfer Agent Fees. Fidelity Investments Institutional Operations Company, Inc. (FIIOC), an affiliate of FMR, is the transfer, dividend disbursing and shareholder servic ing agent for each class of the fund, except for International Discovery Fund. Fidelity Service Company, Inc. (FSC), an affiliate of FMR, is the transfer agent for International Discovery Fund shares. FIIOC and FSC receive account fees and asset based fees that vary according to the account size and type of account of the shareholders of the respec tive classes of the fund. FIIOC and FSC pay for typesetting, printing and mailing of shareholder reports, except proxy statements. For the period the total transfer agent fees paid by each class to FIIOC or FSC, were as follows:
| % of | ||||||
| Average | ||||||
| Amount | Net Assets | |||||
| Class A | $ | 2,481 | .34* | |||
| Class T | 2,696 | .42* | ||||
| Class B | 1,516 | .42* | ||||
| Class C | 2,159 | .22* | ||||
| International Discovery Fund | 7,441,106 | .24 | ||||
| Institutional Class | 8,521 | .14* | ||||
| $ | 7,458,479 | |||||
| * Annualized |
Accounting and Security Lending Fees. FSC maintains the fund’s accounting records. The accounting fee is based on the level of average net assets for the month. Under a separate contract, FSC administers the security lending program. The security lending fee is based on the number and duration of lending transactions.
| Annual Report |
| 38 |
4. Fees and Other Transactions with Affiliates continued
Affiliated Central Funds. The fund may invest in Money Market Central Funds which seek preservation of capital and current income and are managed by Fidelity Invest ments Money Management, Inc. (FIMM), an affiliate of FMR.
The Money Market Central Funds do not pay a management fee. Income distributions earned by the fund are recorded as income in the accompanying financial statements and totaled $4,677,957, for the period.
Brokerage Commissions. The fund placed a portion of its portfolio transactions with brokerage firms which are affiliates of the investment adviser. The commissions paid to these affiliated firms were $338 for the period.
| 5. Committed Line of Credit. |
The fund participates with other funds managed by FMR in a $4.2 billion credit facility (the “line of credit”) to be utilized for temporary or emergency purposes to fund share holder redemptions or for other short term liquidity purposes. The fund has agreed to pay commitment fees on its pro rata portion of the line of credit. During the period, there were no borrowings on this line of credit.
| 6. Security Lending. |
The fund lends portfolio securities from time to time in order to earn additional income. The fund receives collateral (in the form of U.S. Treasury obligations, letters of credit and/or cash) against the loaned securities and maintains collateral in an amount not less than 100% of the market value of the loaned securities during the period of the loan. The market value of the loaned securities is determined at the close of business of the fund and any additional required collateral is delivered to the fund on the next business day. If the borrower defaults on its obligation to return the securities loaned because of insol vency or other reasons, a fund could experience delays and costs in recovering the securities loaned or in gaining access to the collateral. Cash collateral is invested in the Fidelity Securities Lending Cash Central Fund. The value of loaned securities and cash collateral at period end are disclosed on the fund’s Statement of Assets and Liabilities. Security lending income represents the income earned on investing cash collateral, less fees and expenses associated with the loan, plus any premium payments that may be received on the loan of certain types of securities.
39 Annual Report
| Notes to Financial Statements continued | ||
7. Bank Borrowings. | ||
The fund is permitted to have bank borrowings for temporary or emergency purposes to fund shareholder redemptions. The fund has established borrowing arrangements with certain banks. The interest rate on the borrowings is the bank’s base rate, as revised from time to time. The average daily loan balance during the period for which loans were outstanding amounted to $5,090,000. The weighted average interest rate was 3.13% . At period end, there were no bank borrowings outstanding.
| 8. Expense Reductions. |
FMR voluntarily agreed to reimburse a portion of Fidelity International Discovery Fund’s operating expenses. During this period, this reimbursement reduced the class expenses by $69,175.
FMR voluntarily agreed to reimburse each class to the extent annual operating expenses exceeded certain levels of average net assets as noted in the table below. Some expenses, for example interest expense, are excluded from this reimbursement.
| The following classes were in reimbursement during the period: | ||||||
| Expense | Reimbursement | |||||
| Limitations | from adviser | |||||
| Class T | 1.75% | $ | 35 | |||
Many of the brokers with whom FMR places trades on behalf of the fund provided services to the fund in addition to trade execution. These services included payments of certain expenses on behalf of the fund totaling $1,888,955 for the period. In addition, through arrangements with the fund’s custodian and each class’ transfer agent, credits realized as a result of uninvested cash balances were used to reduce the fund’s expenses. During the period, these credits reduced the fund’s custody expenses by $4,216. During the period, credits reduced each class’ transfer agent expense as noted in the table below.
| Transfer Agent | ||||
| expense reduction | ||||
| International Discovery Fund | $ | 66,176 | ||
| Institutional Class | 303 | |||
| $ | 66,479 | |||
| 9. Other. | ||||
The fund’s organizational documents provide former and current trustees and officers with a limited indemnification against liabilities arising in connection with the perfor mance of their duties to the fund. In the normal course of business, the fund may also enter into contracts that provide general indemnifications. The fund’s maximum expo sure under these arrangements is unknown as this would be dependent on future claims that may be made against the fund. The risk of material loss from such claims is consid ered remote.
| Annual Report |
| 40 |
| 10. Distributions to Shareholders. | ||||||||||||
| Distributions to shareholders of each class were as follows: | ||||||||||||
| Years ended October 31, | 2005 | 2004 | ||||||||||
| From net investment income | ||||||||||||
| International Discovery Fund | $ | 12,812,810 | $ | 10,817,689 | ||||||||
| From net realized gain | ||||||||||||
| International Discovery Fund | $ | 10,250,246 | $ | — | ||||||||
| 11. Share Transactions. | ||||||||||||
| Transactions for each class of shares were as follows: | ||||||||||||
| Shares | Dollars | |||||||||||
| Years ended October 31, | 2005A | 2004 | 2005A | 2004 | ||||||||
| Class A | ||||||||||||
| Shares sold | 62,020 | — | $ | 1,786,147 | $ | — | ||||||
| Shares redeemed | (1,044) | — | (30,450) | — | ||||||||
| Net increase (decrease) | 60,976 | — | $ | 1,755,697 | $ | — | ||||||
| Class T | ||||||||||||
| Shares sold | 62,995 | — | $ | 1,829,664 | $ | — | ||||||
| Shares redeemed | (2,034) | — | (58,410) | — | ||||||||
| Net increase (decrease) | 60,961 | — | $ | 1,771,254 | $ | — | ||||||
| Class B | ||||||||||||
| Shares sold | 26,549 | — | $ | 759,109 | $ | — | ||||||
| Shares redeemed | (1,863) | — | (53,496) | — | ||||||||
| Net increase (decrease) | 24,686 | — | $ | 705,613 | $ | — | ||||||
| Class C | ||||||||||||
| Shares sold | 63,361 | — | $ | 1,804,133 | $ | — | ||||||
| Shares redeemed | (17) | — | (530) | — | ||||||||
| Net increase (decrease) | 63,344 | — | $ | 1,803,603 | $ | — | ||||||
| International Discovery | ||||||||||||
| Fund | ||||||||||||
| Shares sold | 73,475,478 | 46,698,105 | $ 2,106,762,661 | $ | 1,135,826,685 | |||||||
| Reinvestment of | ||||||||||||
| distributions | 780,847 | 435,617 | 21,434,265 | 9,888,485 | ||||||||
| Shares redeemed | (32,072,087) | (17,322,166) | (909,132,021) | (420,361,799) | ||||||||
| Net increase (decrease) | 42,184,238 | 29,811,556 | $ 1,219,064,905 | $ | 725,353,371 | |||||||
| Institutional Class | ||||||||||||
| Shares sold | 364,765 | — | $ | 10,479,191 | $ | — | ||||||
| Shares redeemed | (47,766) | — | (1,415,764) | — | ||||||||
| Net increase (decrease) | 316,999 | — | $ | 9,063,427 | $ | — | ||||||
A Share transactions for Class A, T, B, C and Institutional Class are for the period January 6, 2005 (commencement of sale of shares) to October 31, 2005.
41 Annual Report
Report of Independent Registered Public Accounting Firm
To the Trustees of Fidelity Investment Trust and the Shareholders of Fidelity In ternational Discovery Fund:
In our opinion, the accompanying statement of assets and liabilities, including the sched ule of investments, and the related statements of operations and of changes in net assets and the financial highlights present fairly, in all material respects, the financial position of Fidelity International Discovery Fund (a fund of Fidelity Investment Trust) at October 31, 2005 and the results of its operations, the changes in its net assets and the financial highlights for the periods indicated, in conformity with accounting principles generally accepted in the United States of America. These financial statements and financial highlights (hereafter referred to as “financial statements”) are the responsibility of the Fidelity International Discovery Fund’s management; our responsibility is to express an opinion on these financial statements based on our audits. We conducted our audits of these financial statements in accordance with the standards of the Public Company Accounting Oversight Board (United States). Those standards require that we plan and perform the audit to obtain reasonable assurance about whether the financial statements are free of material misstatement. An audit includes examining, on a test basis, evidence supporting the amounts and disclosures in the financial statements, assessing the ac counting principles used and significant estimates made by management, and evaluating the overall financial statement presentation. We believe that our audits, which included confirmation of securities at October 31, 2005 by correspondence with the custodian and brokers, provide a reasonable basis for our opinion.
| /s/ PricewaterhouseCoopers LLP PricewaterhouseCoopers LLP Boston, Massachusetts December 13, 2005 |
| Annual Report |
| 42 |
Trustees and Officers
The Trustees, Members of the Advisory Board, and executive officers of the trust and fund, as applicable, are listed below. The Board of Trustees governs the fund and is responsible for protecting the interests of shareholders. The Trustees are experienced executives who meet periodically throughout the year to oversee the fund’s activities, review contractual arrangements with companies that provide services to the fund, and review the fund’s performance. Except for William O. McCoy, Stephen P. Jonas, and Kenneth L. Wolfe, each of the Trustees oversees 322 funds advised by FMR or an affiliate. Mr. McCoy oversees 324 funds advised by FMR or an affiliate. Mr. Jonas and Mr. Wolfe oversee 319 funds advised by FMR or an affiliate.
The Trustees hold office without limit in time except that (a) any Trustee may resign; (b) any Trustee may be removed by written instrument, signed by at least two thirds of the number of Trustees prior to such removal; (c) any Trustee who requests to be retired or who has become incapacitated by illness or injury may be retired by written instru ment signed by a majority of the other Trustees; and (d) any Trustee may be removed at any special meeting of shareholders by a two thirds vote of the outstanding voting securities of the trust. Each Trustee who is not an interested person (as defined in the 1940 Act) (Independent Trustee), shall retire not later than the last day of the calendar year in which his or her 72nd birthday occurs. The Independent Trustees may waive this mandatory retirement age policy with respect to individual Trustees. The executive officers and Advisory Board Members hold office without limit in time, except that any officer and Advisory Board Member may resign or may be removed by a vote of a majority of the Trustees at any regular meeting or any special meeting of the Trustees. Except as indicated, each individual has held the office shown or other offices in the same company for the past five years.
The fund’s Statement of Additional Information (SAI) includes more information about the Trustees. To request a free copy, call Fidelity at 1-877-208-0098.
| Interested Trustees*: |
Correspondence intended for each Trustee who is an interested person may be sent to Fidelity Investments, 82 Devonshire Street, Boston, Massachusetts 02109.
| Name, Age; Principal Occupation Edward C. Johnson 3d (75)** |
Year of Election or Appointment: 1984
Mr. Johnson is Chairman of the Board of Trustees. Mr. Johnson serves as Chief Executive Officer, Chairman, and a Director of FMR Corp.; a Di rector and Chairman of the Board and of the Executive Committee of FMR; Chairman and a Director of Fidelity Management & Research (Far East) Inc.; Chairman and a Director of Fidelity Investments Money Man agement, Inc.; and Chairman (2001 present) and a Director (2000 present) of FMR Co., Inc.
43 Annual Report
Trustees and Officers - continued
| Name, Age; Principal Occupation Abigail P. Johnson (43)** |
Year of Election or Appointment: 2001
Ms. Johnson serves as President of Fidelity Employer Services Company (FESCO) (2005 present). She is President and a Director of Fidelity In vestments Money Management, Inc. (2001 present), FMR Co., Inc. (2001 present), and a Director of FMR Corp. Previously, Ms. Johnson served as President and a Director of FMR (2001 2005), Senior Vice President of the Fidelity funds (2001 2005), and managed a number of Fidelity funds.
| Stephen P. Jonas (52) |
Year of Election or Appointment: 2005
Mr. Jonas is Senior Vice President of the fund (2005 present). He also serves as Senior Vice President of other Fidelity funds (2005 present). Mr. Jonas is Executive Director of FMR (2005 present). Previously, Mr. Jonas served as President of Fidelity Enterprise Operations and Risk Services (2004 2005), Chief Administrative Officer (2002 2004), and Chief Financial Officer of FMR Co. (1998 2000). Mr. Jonas has been with Fidelity Investments since 1987 and has held various financial and management positions including Chief Financial Officer of FMR. In addi tion, he serves on the Boards of Boston Ballet (2003 present) and Sim mons College (2003 present).
| Robert L. Reynolds (53) |
Year of Election or Appointment: 2003
Mr. Reynolds is a Director (2003 present) and Chief Operating Officer (2002 present) of FMR Corp. He also serves on the Board at Fidelity Investments Canada, Ltd. (2000 present). Previously, Mr. Reynolds served as President of Fidelity Investments Institutional Retirement Group (1996 2000).
* Trustees have been determined to be “Interested Trustees” by virtue of, among other things, their affiliation with the trust or various entities under common control with FMR.
** Edward C. Johnson 3d, Trustee, is Abigail P. Johnson’s father.
| Annual Report |
| 44 |
| Independent Trustees: |
Correspondence intended for each Independent Trustee (that is, the Trustees other than the Interested Trustees) may be sent to Fidelity Investments, P.O. Box 55235, Boston, Massachusetts 02205 5235.
| Name, Age; Principal Occupation Dennis J. Dirks (57) |
Year of Election or Appointment: 2005
Prior to his retirement in May 2003, Mr. Dirks was Chief Operating Officer and a member of the Board of The Depository Trust & Clearing Corporation (DTCC) (1999 2003). He also served as President, Chief Operating Officer, and Board member of The Depository Trust Company (DTC) (1999 2003) and President and Board member of the National Securities Clearing Corporation (NSCC) (1999 2003). In addi tion, Mr. Dirks served as Chief Executive Officer and Board member of the Government Securities Clearing Corporation (2001 2003) and Chief Executive Officer and Board member of the Mortgage Backed Securities Clearing Corporation (2001 2003). Mr. Dirks also serves as a Trustee of Manhattan College (2005 present).
| Robert M. Gates (62) |
Year of Election or Appointment: 1997
Dr. Gates is Vice Chairman of the Independent Trustees (2005 present). Dr. Gates is President of Texas A&M University (2002 present). He was Director of the Central Intelligence Agency (CIA) from 1991 to 1993. From 1989 to 1991, Dr. Gates served as Assistant to the President of the United States and Deputy National Security Advisor. Dr. Gates is a Director of NACCO Industries, Inc. (mining and manufacturing), Parker Drilling Co., Inc. (drilling and rental tools for the energy industry, 2001 present), and Brinker International (restaurant management, 2003 present). Previously, Dr. Gates served as a Director of LucasVarity PLC (automotive components and diesel engines), a Director of TRW Inc. (automotive, space, defense, and information technology), and Dean of the George Bush School of Government and Public Service at Texas A&M University (1999 2001). Dr. Gates also is a Trustee of the Forum for International Policy.
45 Annual Report
Trustees and Officers - continued
| Name, Age; Principal Occupation George H. Heilmeier (69) |
Year of Election or Appointment: 2004
Dr. Heilmeier is Chairman Emeritus of Telcordia Technologies (commu nication software and systems), where prior to his retirement, he served as company Chairman and Chief Executive Officer. He currently serves on the Boards of Directors of The Mitre Corporation (systems engineer ing and information technology support for the government), and HRL Laboratories (private research and development, 2004 present). He is Chairman of the General Motors Science & Technology Advisory Board and a Life Fellow of the Institute of Electrical and Electronics Engineers (IEEE) (2000 present). Dr. Heilmeier is a member of the Defense Science Board and the National Security Agency Advisory Board. He is also a member of the National Academy of Engineering, the American Aca demy of Arts and Sciences, and the Board of Overseers of the School of Engineering and Applied Science of the University of Pennsylvania. Pre viously, Dr. Heilmeier served as a Director of TRW Inc. (automotive, space, defense, and information technology, 1992 2002), Compaq (1994 2002), Automatic Data Processing, Inc. (ADP) (technology based business outsourcing, 1995 2002), INET Technologies Inc. (telecommu nications network surveillance, 2001 2004), and Teletech Holdings (cus tomer management services). He is the recipient of the 2005 Kyoto Prize in Advanced Technology for his invention of the liquid display.
| Marie L. Knowles (59) |
Year of Election or Appointment: 2001
Prior to Ms. Knowles’ retirement in June 2000, she served as Executive Vice President and Chief Financial Officer of Atlantic Richfield Company (ARCO) (diversified energy, 1996 2000). From 1993 to 1996, she was a Senior Vice President of ARCO and President of ARCO Transportation Company. She served as a Director of ARCO from 1996 to 1998. She currently serves as a Director of Phelps Dodge Corporation (copper mining and manufacturing) and McKesson Corporation (healthcare ser vice, 2002 present). Ms. Knowles is a Trustee of the Brookings Institution and the Catalina Island Conservancy and also serves as a member of the Advisory Board for the School of Engineering of the University of Southern California.
| Annual Report |
| 46 |
| Name, Age; Principal Occupation Ned C. Lautenbach (61) |
Year of Election or Appointment: 2000
Mr. Lautenbach has been a partner of Clayton, Dubilier & Rice, Inc. (private equity investment firm) since September 1998. Previously, Mr. Lautenbach was with the International Business Machines Corporation (IBM) from 1968 until his retirement in 1998. Mr. Lautenbach serves as a Director of Italtel Holding S.p.A. (telecommunications (Milan, Italy), 2004 present) and Eaton Corporation (diversified industrial) as well as the Philharmonic Center for the Arts in Naples, Florida. He also is a member of the Board of Trustees of Fairfield University (2005 present), as well as a member of the Council on Foreign Relations.
| Marvin L. Mann (72) |
Year of Election or Appointment: 1993
Mr. Mann is Chairman of the Independent Trustees (2001 present). He is Chairman Emeritus of Lexmark International, Inc. (computer peripherals), where he served as CEO until April 1998, retired as Chairman May 1999, and remains a member of the Board. Prior to 1991, he held the positions of Vice President of International Business Machines Corporation (IBM) and President and General Manager of various IBM divisions and subsidiaries. He is a member of the Executive Committee of the Independent Director’s Council of the Investment Com pany Institute. In addition, Mr. Mann is a member of the President’s Cabinet at the University of Alabama and the Board of Visitors of the Culverhouse College of Commerce and Business Administration at the University of Alabama.
| William O. McCoy (72) |
Year of Election or Appointment: 1997
Prior to his retirement in December 1994, Mr. McCoy was Vice Chair man of the Board of BellSouth Corporation (telecommunications) and President of BellSouth Enterprises. He is currently a Director of Liberty Corporation (holding company), Duke Realty Corporation (real estate), and Progress Energy, Inc. (electric utility). He is also a partner of Frank lin Street Partners (private investment management firm) and a member of the Research Triangle Foundation Board. In addition, Mr. McCoy served as the Interim Chancellor (1999 2000) and a member of the Board of Visitors for the University of North Carolina at Chapel Hill and currently serves on the Board of Directors of the University of North Carolina Health Care System and the Board of Visitors of the Kenan Flagler Business School (University of North Carolina at Chapel Hill). He also served as Vice President of Finance for the University of North Car olina (16 school system).
47 Annual Report
Trustees and Officers - continued
| Name, Age; Principal Occupation Cornelia M. Small (61) |
Year of Election or Appointment: 2005
Ms. Small is a member (2000 present) and Chairperson (2002 present) of the Investment Committee, and a member (2002 present) of the Board of Trustees of Smith College. Previously, she served as Chief In vestment Officer (1999 2000), Director of Global Equity Investments (1996 1999), and a member of the Board of Directors of Scudder, Stevens & Clark (1990 1997) and Scudder Kemper Investments (1997 1998). In addition, Ms. Small served as Co Chair (2000 2003) of the Annual Fund for the Fletcher School of Law and Diplomacy.
| William S. Stavropoulos (66) |
Year of Election or Appointment: 2001
Mr. Stavropoulos is Chairman of the Board (2000 present) and a Mem ber of the Board of Directors of The Dow Chemical Company. Since joining The Dow Chemical Company in 1967, Mr. Stavropoulos served in numerous senior management positions, including President (1993 2000; 2002 2003), CEO (1995 2000; 2002 2004), and Chair man of the Executive Committee (2000 2004). Currently, he is a Direc tor of NCR Corporation (data warehousing and technology solutions), BellSouth Corporation (telecommunications), Chemical Financial Corpo ration, Maersk Inc. (industrial conglomerate, 2002 present), and Metal mark Capital (private equity investment firm, 2005 present). He also serves as a member of the Board of Trustees of the American Enterprise Institute for Public Policy Research. In addition, Mr. Stavropoulos is a member of The Business Council, J.P. Morgan International Council and the University of Notre Dame Advisory Council for the College of Science.
| Kenneth L. Wolfe (66) |
Year of Election or Appointment: 2005
Mr. Wolfe also serves as a Trustee (2005 present) or Member of the Advisory Board (2004 present) of other investment companies advised by FMR. Prior to his retirement in 2001, Mr. Wolfe was Chairman and Chief Executive Officer of Hershey Foods Corporation (1993 2001). He currently serves as a member of the boards of Adelphia Communica tions Corporation (2003 present), Bausch & Lomb, Inc., and Revlon Inc. (2004 present).
| Annual Report |
| 48 |
Advisory Board Members and Executive Officers:
Correspondence intended for Mr. Gamper may be sent to Fidelity Investments, P.O. Box 55235, Boston, Massachusetts 02205 5235. Correspondence intended for each executive officer and Mr. Lynch may be sent to Fidelity Investments, 82 Devonshire Street, Boston, Massachusetts 02109.
| Name, Age; Principal Occupation Albert R. Gamper, Jr. (63) |
Year of Election or Appointment: 2005
Member of the Advisory Board of Fidelity Investment Trust. Prior to his retirement in December 2004, Mr. Gamper served as Chairman of the Board of CIT Group Inc. (commercial finance). During his tenure with CIT Group Inc. Mr. Gamper served in numerous senior management positions, including Chairman (1987 1989; 1999 2001; 2002 2004), Chief Executive Officer (1987 2004), and President (1989 2002). He currently serves as a member of the Board of Directors of Public Service Enterprise Group (utilities, 2001 present), Chairman of the Board of Governors, Rutgers University (2004 present), and Chairman of the Board of Saint Barnabas Health Care System.
| Peter S. Lynch (61) |
Year of Election or Appointment: 2003
Member of the Advisory Board of Fidelity Investment Trust. Vice Chair man and a Director of FMR, and Vice Chairman (2001 present) and a Director (2000 present) of FMR Co., Inc. Previously, Mr. Lynch served as a Trustee of the Fidelity funds (1990 2003). In addition, he serves as a Trustee of Boston College, Massachusetts Eye & Ear Infirmary, Historic Deerfield, John F. Kennedy Library, and the Museum of Fine Arts of Boston.
| Dwight D. Churchill (51) |
Year of Election or Appointment: 2005
Vice President of the fund. Mr. Churchill also serves as Vice President of certain Equity Funds (2005 present) and certain High Income Funds (2005 present). Previously, he served as Head of Fidelity’s Fixed Income Division (2000 2005), Vice President of Fidelity’s Money Market Funds (2000 2005), Vice President of Fidelity’s Bond Funds, and Senior Vice President of FIMM (2000) and FMR. Mr. Churchill joined Fidelity in 1993 as Vice President and Group Leader of Taxable Fixed Income Investments.
| William Kennedy (37) |
Year of Election or Appointment: 2005
Vice President of the fund. Prior to assuming his current responsibilities, Mr. Kennedy worked as a research analyst and manager.
49 Annual Report
Trustees and Officers - continued
| Name, Age; Principal Occupation Eric D. Roiter (56) |
Year of Election or Appointment: 1998
Secretary of the fund. He also serves as Secretary of other Fidelity funds; Vice President, General Counsel, and Secretary of FMR Co., Inc. (2001 present) and FMR; Assistant Secretary of Fidelity Management & Research (U.K.) Inc. (2001 present), Fidelity Management & Research (Far East) Inc. (2001 present), and Fidelity Investments Money Manage ment, Inc. (2001 present). Mr. Roiter is an Adjunct Member, Faculty of Law, at Boston College Law School (2003 present). Previously, Mr. Roiter served as Vice President and Secretary of Fidelity Distributors Corpora tion (FDC) (1998 2005).
| Stuart Fross (46) |
Year of Election or Appointment: 2003
Assistant Secretary of the fund. Mr. Fross also serves as Assistant Secre tary of other Fidelity funds (2003 present), Vice President and Secretary of FDC (2005 present), and is an employee of FMR.
| Christine Reynolds (47) |
Year of Election or Appointment: 2004
President, Treasurer, and Anti Money Laundering (AML) officer of the fund. Ms. Reynolds also serves as President, Treasurer, and AML officer of other Fidelity funds (2004) and is a Vice President (2003) and an employee (2002) of FMR. Before joining Fidelity Investments, Ms. Reynolds worked at PricewaterhouseCoopers LLP (PwC) (1980 2002), where she was most recently an audit partner with PwC’s investment management practice.
| Paul M. Murphy (58) |
Year of Election or Appointment: 2005
Chief Financial Officer of the fund. Mr. Murphy also serves as Chief Financial Officer of other Fidelity funds (2005 present). He also serves as Senior Vice President of Fidelity Pricing and Cash Management Ser vices Group (FPCMS).
| Kenneth A. Rathgeber (58) |
Year of Election or Appointment: 2004
Chief Compliance Officer of the fund. Mr. Rathgeber also serves as Chief Compliance Officer of other Fidelity funds (2004) and Executive Vice President of Risk Oversight for Fidelity Investments (2002). Pre viously, he served as Executive Vice President and Chief Operating Officer for Fidelity Investments Institutional Services Company, Inc. (1998 2002).
| Annual Report |
| 50 |
| Name, Age; Principal Occupation John R. Hebble (47) |
Year of Election or Appointment: 2003
Deputy Treasurer of the fund. Mr. Hebble also serves as Deputy Treasurer of other Fidelity funds (2003), and is an employee of FMR. Before joining Fidelity Investments, Mr. Hebble worked at Deutsche Asset Management where he served as Director of Fund Accounting (2002 2003) and Assistant Treasurer of the Scudder Funds (1998 2003).
| Bryan A. Mehrmann (44) |
Year of Election or Appointment: 2005
Deputy Treasurer of the fund. Mr. Mehrmann also serves as Deputy Treasurer of other Fidelity funds (2005 present) and is an employee of FMR. Previously, Mr. Mehrmann served as Vice President of Fidelity In vestments Institutional Services Group (FIIS)/Fidelity Investments Institu tional Operations Corporation, Inc. (FIIOC) Client Services (1998 2004).
| Kimberley H. Monasterio (41) |
Year of Election or Appointment: 2004
Deputy Treasurer of the fund. Ms. Monasterio also serves as Deputy Treasurer of other Fidelity funds (2004) and is an employee of FMR (2004). Before joining Fidelity Investments, Ms. Monasterio served as Treasurer (2000 2004) and Chief Financial Officer (2002 2004) of the Franklin Templeton Funds and Senior Vice President of Franklin Temple ton Services, LLC (2000 2004).
| Kenneth B. Robins (36) |
Year of Election or Appointment: 2005
Deputy Treasurer of the fund. Mr. Robins also serves as Deputy Treasurer of other Fidelity funds (2005 present) and is an employee of FMR (2004 present). Before joining Fidelity Investments, Mr. Robins worked at KPMG LLP, where he was a partner in KPMG’s department of profes sional practice (2002 2004) and a Senior Manager (1999 2000). In addition, Mr. Robins served as Assistant Chief Accountant, United States Securities and Exchange Commission (2000 2002).
| Robert G. Byrnes (38) |
Year of Election or Appointment: 2005
Assistant Treasurer of the fund. Mr. Byrnes also serves as Assistant Trea surer of other Fidelity funds (2005 present) and is an employee of FMR (2005 present). Previously, Mr. Byrnes served as Vice President of FPCMS (2003 2005). Before joining Fidelity Investments, Mr. Byrnes worked at Deutsche Asset Management where he served as Vice Presi dent of the Investment Operations Group (2000 2003).
51 Annual Report
Trustees and Officers - continued
| Name, Age; Principal Occupation John H. Costello (59) |
Year of Election or Appointment: 1986
Assistant Treasurer of the fund. Mr. Costello also serves as Assistant Treasurer of other Fidelity funds and is an employee of FMR.
| Peter L. Lydecker (51) |
Year of Election or Appointment: 2004
Assistant Treasurer of the fund. Mr. Lydecker also serves as Assistant Treasurer of other Fidelity funds (2004) and is an employee of FMR.
| Mark Osterheld (50) |
Year of Election or Appointment: 2002
Assistant Treasurer of the fund. Mr. Osterheld also serves as Assistant Treasurer of other Fidelity funds (2002) and is an employee of FMR.
| Gary W. Ryan (47) |
Year of Election or Appointment: 2005
Assistant Treasurer of the fund. Mr. Ryan also serves as Assistant Trea surer of other Fidelity funds (2005 present) and is an employee of FMR (2005 present). Previously, Mr. Ryan served as Vice President of Fund Reporting in FPCMS (1999 2005).
| Salvatore Schiavone (39) |
Year of Election or Appointment: 2005
Assistant Treasurer of the fund. Mr. Schiavone also serves as Assistant Treasurer of other Fidelity funds (2005 present) and is an employee of FMR (2005 present). Before joining Fidelity Investments, Mr. Schiavone worked at Deutsche Asset Management, where he most recently served as Assistant Treasurer (2003 2005) of the Scudder Funds and Vice Pres ident and Head of Fund Reporting (1996 2003).
| Annual Report |
| 52 |
| Distributions |
The Board of Trustees of Fidelity International Discovery Fund voted to pay to shareholders of record at the opening of business on record date, the following distributions per share derived from capital gains realized from sales of portfolio securities, and dividends derived from net investment income:
| Pay Date | Record Date | Dividends | Capital Gains | |||||
| Institutional Class | 12/5/05 | 12/2/05 | $.33 | $1.40 |
The fund hereby designates as capital gain dividends: For dividends with respect to the taxable year ended October 31, 2005, $125,101,084, or, if subsequently determined to be different, the net capital gain of such year.
The fund will notify shareholders in January 2006 of amounts for use in preparing 2005 income tax returns.
53 Annual Report
Board Approval of Investment Advisory Contracts and Management Fees
Fidelity International Discovery Fund
Each year, typically in July, the Board of Trustees, including the independent Trustees (together, the Board), votes on the renewal of the management contract and sub advisory agreements (together, the Advisory Contracts) for the fund. The Board, assisted by the advice of fund counsel and independent Trustees’ counsel, requests and considers a broad range of information throughout the year.
The Board meets regularly each month except August and takes into account throughout the year matters bearing on Advisory Contracts. The Board, acting directly and through its separate committees, considers at each of its meetings factors that are relevant to the annual renewal of the fund’s Advisory Contracts, including the services and support provided to the fund and its shareholders by Fidelity. At the time of the renewal, the Board had 11 standing committees, each composed of independent Trustees with varying backgrounds, to which the Board has assigned specific subject matter responsibilities in order to enhance effective decision making by the Board. Each committee has adopted a written charter outlining the structure and purposes of the committee. One such com mittee, the Equity Contract Committee, meets periodically during the first six months of each year and as necessary to consider matters specifically related to the annual renewal of Advisory Contracts. The committee requests and receives information on, and makes recommendations to the independent Trustees concerning, the approval and annual review of the Advisory Contracts.
At its July 2005 meeting, the Board of Trustees, including the independent Trustees, unanimously determined to renew the Advisory Contracts for the fund. In reaching its determination, the Board considered all factors it believed relevant, including (1) the nature, extent, and quality of the services to be provided to the fund and its shareholders by Fidelity (including the investment performance of the fund); (2) the competitiveness of the management fee and total expenses of the fund; (3) the total costs of the services to be provided by and the profits to be realized by the investment adviser and its affiliates from the relationship with the fund; (4) the extent to which economies of scale would be realized as the fund grows; and (5) whether fee levels reflect these economies of scale, if any, for the benefit of fund shareholders.
In determining whether to renew the Advisory Contracts for the fund, the Board ulti mately reached a determination, with the assistance of fund counsel and independent Trustees’ counsel, that the renewal of the Advisory Contracts and the compensation to be received by Fidelity under the management contract is consistent with Fidelity’s fidu ciary duty under applicable law. In addition to evaluating the specific factors noted above, the Board, in reaching its determination, is aware that shareholders in the fund have a broad range of investment choices available to them, including a wide choice among mutual funds offered by competitors to Fidelity, and that the fund’s shareholders, with the opportunity to review and weigh the disclosure provided by the fund in its
| Annual Report |
| 54 |
prospectus and other public disclosures, have chosen to invest in this fund, managed by Fidelity.
Nature, Extent, and Quality of Services Provided by Fidelity. The Board consid ered staffing within the investment adviser, FMR, and the sub advisers (together, the Investment Advisers), including the background of the fund’s portfolio manager and the fund’s investment objective and discipline. The independent Trustees also had discus sions with senior management of Fidelity’s investment operations and investment groups. The Board considered the structure of the portfolio manager compensation program and whether this structure provides appropriate incentives.
Fidelity Resources Dedicated to Investment Management and Support Services. The Board reviewed the size, education, and experience of the Investment Advisers’ invest ment staff, their use of technology, and the Investment Advisers’ approach to recruiting, training, and retaining portfolio managers and other research, advisory, and manage ment personnel. The Board considered Fidelity’s extensive global research capabilities that enable the Investment Advisers to aggregate data from various sources in an effort to produce positive investment results. The Board noted that Fidelity’s analysts have access to a variety of technological tools that enable them to perform both fundamental and quantitative analysis and to specialize in various disciplines. The Board also considered that Fidelity’s portfolio managers and analysts have access to daily portfolio attribution that allows for monitoring of a fund’s portfolio, as well as an electronic communication system that provides immediate real time access to research concerning issuers and credit enhancers.
Shareholder and Administrative Services. The Board considered the nature, extent, quality, and cost of administrative, distribution, and shareholder services performed by the Investment Advisers and their affiliates under the Advisory Contracts and under separate agreements covering transfer agency, pricing and bookkeeping, and securities lending services for the fund. The Board also considered the nature and extent of the Investment Advisers’ supervision of third party service providers, principally custodians and subcustodians. The Board reviewed the allocation of fund brokerage, including allocations to brokers affiliated with the Investment Advisers, the use of brokerage commissions to pay fund expenses, and the use of “soft” commission dollars to pay for research services. The Board also considered that Fidelity voluntarily decided in 2004 to stop using “soft” commission dollars to pay for market data and, instead, to pay for that data out of its own resources. The Board also considered the resources devoted to, and the record of compliance with, the fund’s compliance policies and procedures.
The Board noted that the growth of fund assets across the complex allows Fidelity to reinvest in the development of services designed to enhance the value or convenience of the Fidelity funds as investment vehicles. These services include 24 hour access to
55 Annual Report
Board Approval of Investment Advisory Contracts and Management Fees continued
account information and market information through phone representatives and over the Internet, and investor education materials and asset allocation tools.
Investment in a Large Fund Family. The Board considered the benefits to shareholders of investing in a Fidelity fund, including the benefits of investing in a fund that is part of a large family of funds offering a variety of investment disciplines and providing for a large variety of mutual fund investor services. For example, fund shareholders are offered the privilege of exchanging shares of the fund for shares of other Fidelity funds, as set forth in the fund’s prospectus, without paying an additional sales charge. The Board noted that, since the last Advisory Contract renewals in July 2004, Fidelity has taken a number of actions that benefited particular funds, including (i) voluntarily deciding in 2004 to stop using “soft” commission dollars to pay for market data and, instead, to pay for that data out of its own resources, (ii) contractually agreeing to impose management fee reductions and expense limitations on its five Spartan stock index funds and its stock index fund available through variable insurance products, (iii) contractually agreeing to eliminate the management fees on the Fidelity Freedom Funds and the Fidelity Advisor Freedom Funds, (iv) contractually agreeing to reduce the management fees on most of its investment grade taxable bond funds, and (v) contractually agreeing to impose expense limitations on its retail and Spartan investment grade taxable bond funds.
Investment Performance and Compliance. The Board considered whether the fund has operated within its investment objective, as well as its record of compliance with its investment restrictions. It also reviewed the fund’s absolute investment performance, as well as the fund’s relative investment performance measured against (i) a broad based securities market index, and (ii) a peer group of mutual funds deemed appropriate by the Board over multiple periods. The following charts considered by the Board show, over the one , three , and five year periods ended December 31, 2004, the returns of the retail class of the fund, the returns of a broad based securities market index (“benchmark”), and a range of returns of a peer group of mutual funds identified by Lipper Inc. as having an investment objective similar to that of the fund. (The fund did not offer Advisor classes as of December 31, 2004.) The box within each chart shows the 25th percentile return (bottom of box) and the 75th percentile return (top of box) of the Lipper peer group. Returns shown above the box are in the first quartile and returns shown below the box are in the fourth quartile. The percentage beaten numbers noted below each chart correspond to the percentile box and represent the percentage of funds in the Lipper peer group whose performance was equal to or lower than that of the retail class.
| Annual Report |
| 56 |
The Board reviewed the fund’s relative investment performance against its Lipper peer group and stated that the performance of the fund was in the second quartile for the one year period and the first quartile for the three and five year periods. The Board also stated that the relative investment performance of the fund has compared favorably to its benchmark over time, although the fund’s one year cumulative total return was lower than its benchmark.
The Board also considered that, beginning September 1, 2005, the fund’s management fee is subject to upward or downward adjustment depending upon whether, and to what extent, the fund’s investment performance for the performance period exceeds, or is exceeded by, the record (over the same period) of a Board approved performance adjustment index. The Board realizes that the performance adjustment provides FMR with a strong economic incentive to seek to achieve superior performance for the fund’s shareholders and helps to more closely align the interests of FMR and the fund’s shareholders.
The Board has had thorough discussions with FMR throughout the year about the Board’s and FMR’s concerns about equity research, equity fund performance, and compliance with internal policies governing gifts and entertainment. FMR has taken steps that it believes will refocus and strengthen equity research and equity portfolio management and compliance. The Board noted with favor FMR’s recent reorganization of its senior management team and FMR’s plans to dedicate additional resources to investment research, and participated in the process that led to those changes.
Based on its review, and giving particular weight to the nature and quality of the resources dedicated by the Investment Advisers to maintain and improve relative
57 Annual Report
Board Approval of Investment Advisory Contracts and Management Fees continued
performance, the Board concluded that the nature, extent, and quality of the services provided by Fidelity will benefit the fund’s shareholders, particularly in light of the Board’s view that the fund’s shareholders benefit from investing in a fund that is part of a large family of funds offering a variety of investment disciplines and services.
Competitiveness of Management Fee and Total Fund Expenses. The Board considered the fund’s management fee and total expenses compared to “mapped groups” of competitive funds and classes. Fidelity creates “mapped groups” by combining similar Lipper investment objective categories that have comparable management fee charac teristics. Combining Lipper investment objective categories aids the Board’s manage ment fee and total expense comparisons by broadening the competitive group used for comparison and by reducing the number of universes to which various Fidelity funds are compared.
The Board considered two proprietary management fee comparisons for the 12 month periods shown in the chart below. The group of Lipper funds used by the Board for management fee comparisons is referred to below as the “Total Mapped Group” and, for the reasons explained above, is broader than the Lipper peer group used by the Board for performance comparisons. The Total Mapped Group comparison focuses on a fund’s standing relative to the total universe of comparable funds available to investors, in terms of gross management fees before expense reimbursements or caps. “TMG %” represents the percentage of funds in the Total Mapped Group that had management fees that were lower than the fund’s. For example, a TMG % of 21% means that 79% of the funds in the Total Mapped Group had higher management fees than the fund. The “Asset Size Peer Group” (ASPG) comparison focuses on a fund’s standing relative to non Fidelity funds similar in size to the fund within the Total Mapped Group. The ASPG represents at least 15% of the funds in the Total Mapped Group with comparable asset size and management fee characteristics, subject to a minimum of 50 funds (or all funds in the Total Mapped Group if fewer than 50). Additional information, such as the ASPG quartile (“quadrant”) in which the fund’s management fee ranked, is also included in the chart and considered by the Board.
| Annual Report |
| 58 |

The Board noted that the fund’s management fee ranked below the median of its Total Mapped Group and below the median of its ASPG for 2004.
Based on its review, the Board concluded that the fund’s management fee was fair and reasonable in light of the services that the fund receives and the other factors considered.
In its review of the fund’s total expenses, the Board considered the fund’s management fee as well as other fund expenses, such as transfer agent fees, pricing and bookkeeping fees, and custodial, legal, and audit fees. The Board also noted the effects of any waivers and reimbursements on fees and expenses. As part of its review, the Board also consid ered current and historical total expenses of the fund compared to competitive fund median expenses. The fund is compared to those funds and classes in the Total Mapped Group (used by the Board for management fee comparisons) that have a similar sales load structure.
The Board noted that the fund’s total expenses ranked below its competitive median for 2004.
In its review of total expenses, the Board also considered Fidelity fee structures and other information on clients that FMR and its affiliates service in other competitive markets, such as other mutual funds advised or subadvised by FMR or its affiliates, pension plan clients, and other institutional clients.
Based on its review, the Board concluded that the fund’s total expenses were reasonable in light of the services that the fund and its shareholders receive and the other factors considered.
59 Annual Report
Board Approval of Investment Advisory Contracts and Management Fees continued
Costs of the Services and Profitability. The Board considered the revenues earned and the expenses incurred by Fidelity in conducting the business of developing, market ing, distributing, managing, administering and servicing the fund and its shareholders. The Board also considered the level of Fidelity’s profits in respect of all the Fidelity funds.
On an annual basis, FMR presents to the Board Fidelity’s profitability for the fund. Fidelity calculates the profitability for each fund, as well as aggregate profitability for groups of Fidelity funds and all Fidelity funds, using a series of detailed revenue and cost allocation methodologies which originate with the audited books and records of Fidelity. The Audit Committee of the Board reviews any significant changes from the prior year’s methodologies.
PricewaterhouseCoopers LLP (PwC), independent registered accounting firm and auditor to Fidelity and certain Fidelity funds, has been engaged annually by the Board as part of the Board’s assessment of the results of Fidelity’s profitability analysis. PwC’s engagement includes the review and assessment of Fidelity’s methodologies used in determining the revenues and expenses attributable to Fidelity’s mutual fund business, and completion of agreed upon procedures surrounding the mathematical accuracy of fund profitability and its conformity to allocation methodologies. After considering PwC’s reports issued under the engagement and information provided by Fidelity, the Board believes that while other allocation methods may also be reasonable, Fidelity’s profitabil ity methodologies are reasonable in all material respects.
The Board has also reviewed Fidelity’s non fund businesses and any fall out benefits related to the mutual fund business as well as cases where Fidelity’s affiliates may benefit from or be related to the fund’s business. In addition, a special committee of the Board reviewed services provided to Fidelity by its affiliates and determined that the fees that Fidelity paid for such services were reasonable.
The Board considered the costs of the services provided by and the profits realized by Fidelity in connection with the operation of the fund and determined that the amount of profit is a fair entrepreneurial profit for the management of the fund.
Economies of Scale. The Board considered whether there have been economies of scale in respect of the management of the Fidelity funds, whether the Fidelity funds (including the fund) have appropriately benefited from any such economies of scale, and whether there is potential for realization of any further economies of scale. The Board considered the extent to which the fund will benefit from economies of scale through increased services to the fund, through waivers or reimbursements, or through fee or expense reductions, including reductions that occur through operation of the transfer agent agreement. The transfer agent fee varies in part based on the number of accounts in the fund. If the number of accounts decreases or the average account size increases, the overall transfer agent fee rate decreases.
| Annual Report |
| 60 |
The Board recognized that the fund’s management contract incorporates a “group fee” structure, which provides for lower fee rates as total fund assets under FMR’s manage ment increase, and for higher fee rates as total fund assets under FMR’s management decrease. The Board considered that the group fee is designed to deliver the benefits of economies of scale to fund shareholders when total fund assets increase, even if assets of any particular fund are unchanged or have declined, because some portion of Fidelity’s costs are attributable to services provided to all Fidelity funds, and all funds benefit if those costs can be allocated among more assets. The Board concluded that, given the group fee structure, fund shareholders will achieve a certain level of economies of scale as assets under FMR’s management increase at the fund complex level, regardless of whether Fidelity achieves any such economies of scale.
The Board further concluded that any potential economies of scale are being shared between fund shareholders and Fidelity in an appropriate manner.
Additional Information Requested by the Board. In order to develop fully the factual basis for consideration of the Advisory Contracts, the Board requested additional information regarding (i) equity fund transfer agency fees; (ii) Fidelity’s fund profitability methodology and the impact of various changes in the methodology over time; (iii) benefits to shareholders from economies of scale; (iv) composition and characteristics of various fund and industry data used in comparisons; and (v) com pensation of portfolio managers and research analysts.
Based on its evaluation of all of the conclusions noted above, and after considering all material factors, the Board ultimately concluded that the existing advisory fee structures are fair and reasonable, and that the fund’s existing Advisory Contracts should be renewed.
61 Annual Report
| Annual Report |
| 62 |
63 Annual Report
| Investment Adviser Fidelity Management & Research Company Boston, MA Investment Sub Advisers FMR Co., Inc. Fidelity Management & Research (U.K.) Inc. Fidelity Management & Research (Far East) Inc. Fidelity International Investment Advisors Fidelity Investments Japan Limited Fidelity International Investment Advisors (U.K.) Limited General Distributor Fidelity Distributors Corporation Boston, MA Transfer and Service Agents Fidelity Investments Institutional Operations Company, Inc. Boston, MA Fidelity Service Company, Inc. Boston, MA Custodian JPMorgan Chase Bank New York, NY |
| AIDI-UANN-1205 1.806657.100 |

| Fidelity® International Small Cap Opportunities Fund |
| Annual Report October 31, 2005 |


| Contents | ||||
| Chairman’s Message | 68 | Ned Johnson’s message to shareholders. | ||
| Shareholder Expense | 69 | An example of shareholder expenses. | ||
| Example | ||||
| Investment Summary | 71 | A summary of the fund’s investments. | ||
| Investments | 73 | A complete list of the fund’s investments | ||
| with their market values. | ||||
| Financial Statements | 79 | Statements of assets and liabilities, | ||
| operations, and changes in net assets, | ||||
| as well as financial highlights. | ||||
| Notes | 89 | Notes to the financial statements. | ||
| Report of Independent | 97 | |||
| Registered Public | ||||
| Accounting Firm | ||||
| Trustees and Officers | 98 | |||
| Distributions | 108 | |||
| Board Approval of | 109 | |||
| Investment Advisory | ||||
| Contracts and | ||||
| Management Fees | ||||
| To view a fund’s proxy voting guidelines and proxy voting record for the 12 month period ended June 30, visit www.fidelity.com/proxyvotingresults or visit the Securities and Exchange Commission’s (SEC) web site at www.sec.gov. You may also call 1-800-544-8544 to request a free copy of the proxy voting guidelines. Standard & Poor’s, S&P and S&P 500 are registered service marks of The McGraw Hill Companies, Inc. and have been licensed for use by Fidelity Distributors Corporation. Other third party marks appearing herein are the property of their respective owners. All other marks appearing herein are registered or unregistered trademarks or service marks of FMR Corp. or an affiliated company. |
Annual Report 66
| This report and the financial statements contained herein are submitted for the general information of the shareholders of the fund. This report is not authorized for distribution to prospective investors in the fund unless preceded or accompanied by an effective prospectus. A fund files its complete schedule of portfolio holdings with the SEC for the first and third quar ters of each fiscal year on Form N Q. Forms N Q are available on the SEC’s web site at http://www.sec.gov. A fund’s Forms N Q may be reviewed and copied at the SEC’s Public Reference Room in Washington, DC. Information regarding the operation of the SEC’s Public Reference Room may be obtained by calling 1-800-SEC-0330. For a complete list of a fund’s portfolio holdings, view the most recent quarterly holdings report, semiannual report, or annual report on Fidelity’s web site at http://www.fidelity.com/holdings. NOT FDIC INSURED · MAY LOSE VALUE · NO BANK GUARANTEE Neither the fund nor Fidelity Distributors Corporation is a bank. |
67 Annual Report
Chairman’s Message
(photograph of Edward C. Johnson 3d)
Dear Shareholder:
During the past year or so, much has been reported about the mutual fund industry, and much of it has been more critical than I believe is warranted. Allegations that some companies have been less than forthright with their shareholders have cast a shadow on the entire industry. I continue to find these reports disturbing, and assert that they do not create an accurate picture of the industry overall. Therefore, I would like to remind every one where Fidelity stands on these issues. I will say two things specifically regarding allegations that some mutual fund companies were in violation of the Securities and Exchange Commission’s forward pricing rules or were involved in so called “market timing” activities.
First, Fidelity has no agreements that permit customers who buy fund shares after 4 p.m. to obtain the 4 p.m. price. This is not a new policy. This is not to say that some one could not deceive the company through fraudulent acts. However, we are extremely diligent in preventing fraud from occurring in this manner and in every other. But I underscore again that Fidelity has no so called “agreements” that sanction illegal practices.
Second, Fidelity continues to stand on record, as we have for years, in opposition to predatory short term trading that adversely affects shareholders in a mutual fund. Back in the 1980s, we initiated a fee which is returned to the fund and, therefore, to investors to discourage this activity. Further, we took the lead several years ago in developing a Fair Value Pricing Policy to prevent market timing on foreign securities in our funds. I am confident we will find other ways to make it more difficult for predatory traders to op erate. However, this will only be achieved through close cooperation among regulators, legislators and the industry.
Yes, there have been unfortunate instances of unethical and illegal activity within the mutual fund industry from time to time. That is true of any industry. When this occurs, confessed or convicted offenders should be dealt with appropriately. But we are still concerned about the risk of over regulation and the quick application of simplistic solutions to intricate problems. Every system can be improved, and we support and applaud well thought out improvements by regulators, legislators and industry representatives that achieve the common goal of building and protecting the value of investors’ holdings.
For nearly 60 years, Fidelity has worked very hard to improve its products and service to justify your trust. When our family founded this company in 1946, we had only a few hundred customers. Today, we serve more than 18 million customers in cluding individual investors and participants in retirement plans across America.
Let me close by saying that we do not take your trust in us for granted, and we realize that we must always work to improve all aspects of our service to you. In turn, we urge you to continue your active participation with your financial matters, so that your interests can be well served.
Best regards,
/s/ Edward C. Johnson 3d
Edward C. Johnson 3d
Annual Report 68
Shareholder Expense Example
As a shareholder of the Fund, you incur two types of costs: (1) transaction costs, including sales charges (loads) on purchase payments or redemption proceeds, redemption fees, and (2) ongoing costs, including management fees, distribution and/or service (12b 1) fees and other Fund expenses. This Example is intended to help you understand your ongoing costs (in dollars) of investing in the Fund and to compare these costs with the ongoing costs of investing in other mutual funds.
The actual expense Example is based on an investment of $1,000 invested at the beginning of the period and held for the entire period (August 2, 2005 to October 31, 2005). The hypothetical expense Example is based on an investment of $1,000 invested for the one half year period (May 1, 2005 to October 31, 2005).
| Actual Expenses |
The first line of the table below for each class of the Fund provides information about actual account values and actual expenses. You may use the information in this line, together with the amount you invested, to estimate the expenses that you paid over the period. Simply divide your account value by $1,000.00 (for example, an $8,600 account value divided by $1,000.00 = 8.6), then multiply the result by the number in the first line for a class of the Fund under the heading entitled “Expenses Paid During Period” to estimate the expenses you paid on your account during this period.
Hypothetical Example for Comparison Purposes
The second line of the table below for each class of the Fund provides information about hypothetical account values and hypothetical expenses based on a Class’ actual expense ratio and an assumed rate of return of 5% per year before expenses, which is not the Class’ actual return. The hypothetical account values and expenses may not be used to estimate the actual ending account balance or expenses you paid for the period. You may use this information to compare the ongoing costs of investing in the Fund and other funds. To do so, compare this 5% hypothetical example with the 5% hypothetical examples that appear in the shareholder reports of the other funds.
69 Annual Report
Shareholder Expense Example continued
Please note that the expenses shown in the table are meant to highlight your ongoing costs only and do not reflect any transaction costs. Therefore, the second line of the table is useful in comparing ongoing costs only, and will not help you determine the relative total costs of owning different funds. In addition, if these transactional costs were included, your costs would have been higher.
| Ending | ||||||||||||
| Beginning | Account Value | Expenses Paid | ||||||||||
| Account Value | October 31, 2005 | During Period | ||||||||||
| Class A | ||||||||||||
| Actual | $ | 1,000.00 | $ | 1,041.00 | $ | 4.20B | ||||||
| HypotheticalA | $ | 1,000.00 | $ | 1,016.89 | $ | 8.39C | ||||||
| Class T | ||||||||||||
| Actual | $ | 1,000.00 | $ | 1,038.00 | $ | 4.83B | ||||||
| HypotheticalA | $ | 1,000.00 | $ | 1,015.63 | $ | 9.65C | ||||||
| Class B | ||||||||||||
| Actual | $ | 1,000.00 | $ | 1,037.00 | $ | 6.09B | ||||||
| HypotheticalA | $ | 1,000.00 | $ | 1,013.11 | $ | 12.18C | ||||||
| Class C | ||||||||||||
| Actual | $ | 1,000.00 | $ | 1,037.00 | $ | 6.09B | ||||||
| HypotheticalA | $ | 1,000.00 | $ | 1,013.11 | $ | 12.18C | ||||||
| Fidelity International Small Cap | ||||||||||||
| Opportunities Fund | ||||||||||||
| Actual | $ | 1,000.00 | $ | 1,040.00 | $ | 3.56B | ||||||
| HypotheticalA | $ | 1,000.00 | $ | 1,018.15 | $ | 7.12C | ||||||
| Institutional Class | ||||||||||||
| Actual | $ | 1,000.00 | $ | 1,040.00 | $ | 3.56B | ||||||
| HypotheticalA | $ | 1,000.00 | $ | 1,018.15 | $ | 7.12C |
| A 5% return per year before expenses B Actual expenses are equal to each Class’ annualized expense ratio (shown in the table below); multiplied by the average account value over the period, multiplied by 91/365 (to reflect the period August 2, 2005 to October 31, 2005). C Hypothetical expenses are equal to each Class’ annualized expense ratio (shown in the table below); multiplied by the average account value over the period, multiplied by 184/365 (to reflect the one half year period). |
| Annualized | ||
| Expense Ratio | ||
| Class A | 1.65% | |
| Class T | 1.90% | |
| Class B | 2.40% | |
| Class C | 2.40% | |
| Fidelity International Small Cap Opportunities Fund | 1.40% | |
| Institutional Class | 1.40% |
Annual Report 70
Investment Summary
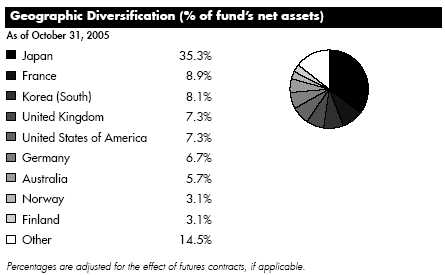
| Asset Allocation | ||
| % of fund’s | ||
| net assets | ||
| Stocks | 100.6 | |
| Net Other Assets | (0.6) | |
| Top Ten Stocks as of October 31, 2005 | ||
| % of fund’s | ||
| net assets | ||
| CSL Ltd. (Australia, Biotechnology) | 2.1 | |
| Neopost SA (France, Office Electronics) | 2.0 | |
| NTL, Inc. (United States of America, Media) | 2.0 | |
| Alstom SA (France, Electrical Equipment) | 1.7 | |
| Orion Corp. (Korea (South), Food Products) | 1.6 | |
| Ryohin Keikaku Co. Ltd. (Japan, Multiline Retail) | 1.5 | |
| KCI Konecranes Oyj (Finland, Machinery) | 1.4 | |
| Teijin Ltd. (Japan, Chemicals) | 1.4 | |
| PMP Ltd. (Australia, Commercial Services & Supplies) | 1.4 | |
| Motech Industries, Inc. (Taiwan, Electrical Equipment) | 1.4 | |
| 16.5 |
71 Annual Report
| Investments continued | ||
| Market Sectors as of October 31, 2005 | ||
| % of fund’s | ||
| net assets | ||
| Industrials | 26.5 | |
| Consumer Discretionary | 17.0 | |
| Materials | 12.4 | |
| Information Technology | 12.1 | |
| Financials | 12.0 | |
| Energy | 10.5 | |
| Consumer Staples | 5.9 | |
| Health Care | 3.8 | |
| Telecommunication Services | 0.4 | |
| Annual Report |
| 72 |
| Investments October 31, 2005 | ||||||
| Showing Percentage of Net Assets | ||||||
| Common Stocks 100.6% | ||||||
| Shares | Value (Note 1) | |||||
| Australia – 5.7% | ||||||
| ABC Learning Centres Ltd. | 230,000 | $ | 1,117,886 | |||
| Bradken Ltd. | 179,061 | 502,098 | ||||
| Computershare Ltd. | 241,800 | 1,184,279 | ||||
| CSL Ltd. | 158,300 | 4,438,824 | ||||
| Downer EDI Ltd. | 451,175 | 2,051,186 | ||||
| PMP Ltd. (a) | 2,516,300 | 2,963,462 | ||||
| TOTAL AUSTRALIA | 12,257,735 | |||||
| Austria – 0.1% | ||||||
| IMMOFINANZ Immobilien Anlagen AG (a) | 21,900 | 211,859 | ||||
| Bermuda – 0.8% | ||||||
| China Lotsynergy Holding Ltd. (a) | 4,390,000 | 1,444,060 | ||||
| Paul Y. Engineering Group Ltd. | 2,386,000 | 215,451 | ||||
| TOTAL BERMUDA | 1,659,511 | |||||
| Canada 0.2% | ||||||
| Oilexco, Inc. (a) | 106,500 | 360,711 | ||||
| China – 1.1% | ||||||
| China Sun Bio-chem Technology Group Co. Ltd. | 661,000 | 171,704 | ||||
| Global Bio-Chem Technology Group Co. Ltd. | 5,723,300 | 2,270,243 | ||||
| TOTAL CHINA | 2,441,947 | |||||
| Finland – 3.1% | ||||||
| KCI Konecranes Oyj | 69,650 | 3,026,619 | ||||
| Metso Corp. | 81,800 | 2,127,853 | ||||
| Neste Oil Oyj | 44,600 | 1,382,051 | ||||
| TOTAL FINLAND | 6,536,523 | |||||
| France – 8.9% | ||||||
| Alstom SA (a) | 74,962 | 3,593,529 | ||||
| BVRP Software SA (a) | 16,300 | 381,413 | ||||
| Compagnie Generale de Geophysique SA (a) | 25,000 | 2,180,227 | ||||
| Elior SA | 140,000 | 1,825,936 | ||||
| Infovista SA (a) | 68,700 | 383,770 | ||||
| Neopost SA | 45,100 | 4,352,122 | ||||
| Nexity | 27,693 | 1,264,473 | ||||
| Silicon On Insulator Technologies SA (SOITEC) (a) | 139,200 | 2,084,156 | ||||
| Vallourec SA | 6,500 | 2,921,953 | ||||
| TOTAL FRANCE | 18,987,579 | |||||
| Germany – 6.7% | ||||||
| CeWe Color Holding AG | 28,800 | 1,525,961 | ||||
| See accompanying notes which are an integral part of the financial statements. | ||||||
| 73 | Annual Report | |||||
| Investments continued | ||||||
| Common Stocks continued | ||||||
| Shares | Value (Note 1) | |||||
| Germany – continued | ||||||
| ESCADA AG (a) | 25,000 | $ | 635,338 | |||
| Fielmann AG | 4,500 | 307,210 | ||||
| Fresenius AG | 4,800 | 619,073 | ||||
| MTU Aero Engines Holding AG | 92,600 | 2,691,853 | ||||
| Muehlbauer Holding AG & Co. | 7,400 | 340,814 | ||||
| Norddeutsche Affinerie AG | 6,500 | 139,085 | ||||
| Rheinmetall AG | 6,400 | 393,804 | ||||
| Salzgitter AG | 30,000 | 1,313,351 | ||||
| SolarWorld AG | 20,000 | 2,702,462 | ||||
| Techem AG (a) | 27,000 | 1,074,560 | ||||
| United Internet AG | 77,400 | 2,500,509 | ||||
| TOTAL GERMANY | 14,244,020 | |||||
| Hong Kong – 1.5% | ||||||
| Burwill Holdings Ltd. | 2,482,000 | 192,103 | ||||
| Hanny Holdings Ltd. | 2,018,402 | 1,132,603 | ||||
| Hengan International Group Co. Ltd. | 313,400 | 291,080 | ||||
| PYI Corp. Ltd. | 5,333,752 | 1,018,299 | ||||
| Techtronic Industries Co. Ltd. | 214,500 | 527,112 | ||||
| TOTAL HONG KONG | 3,161,197 | |||||
| Ireland – 0.1% | ||||||
| DEPFA BANK PLC | 10,700 | 166,746 | ||||
| Italy 1.0% | ||||||
| Banca Italease Spa | 98,100 | 2,075,476 | ||||
| Japan 35.3% | ||||||
| Aeon Co. Ltd. | 55,800 | 1,159,769 | ||||
| Aoyama Trading Co. Ltd. | 16,400 | 494,253 | ||||
| Argo Graphics, Inc. | 46,400 | 1,084,946 | ||||
| Asics Corp. | 43,000 | 370,898 | ||||
| Bals Corp. | 291 | 937,480 | ||||
| Bank of Nagoya Ltd. | 153,000 | 1,381,981 | ||||
| Capcom Co. Ltd. | 22,500 | 226,810 | ||||
| Chiyoda Corp. | 100,000 | 1,727,703 | ||||
| Chiyoda Integre Co. Ltd. | 60,400 | 1,532,607 | ||||
| Daikin Industries Ltd. | 39,900 | 1,043,533 | ||||
| E*TRADE Securities Co. Ltd. | 285 | 1,498,165 | ||||
| EDION Corp. | 160,000 | 2,520,455 | ||||
| Excite Japan Co. Ltd | 138 | 838,962 | ||||
| Fujikura Ltd. | 175,000 | 1,133,616 | ||||
| Hitachi Metals Ltd. | 212,000 | 2,182,951 | ||||
| Hokuhoku Financial Group, Inc. | 436,000 | 1,808,624 | ||||
See accompanying notes which are an integral part of the financial statements.
| Annual Report |
| 74 |
| Common Stocks continued | ||||||
| Shares | Value (Note 1) | |||||
| Japan – continued | ||||||
| Hokuto Corp. | 8,200 | $ | 133,079 | |||
| Ibiden Co. Ltd. | 23,700 | 960,551 | ||||
| Ichiyoshi Securities Co. Ltd. | 267,200 | 2,869,355 | ||||
| Intelligent Wave, Inc. | 845 | 2,802,733 | ||||
| Isuzu Motors Ltd. | 250,000 | 976,434 | ||||
| Japan Steel Works Ltd | 162,000 | 580,820 | ||||
| JGC Corp. | 141,000 | 2,309,069 | ||||
| Joint Corp. | 22,700 | 1,234,559 | ||||
| JSR Corp. | 69,600 | 1,648,514 | ||||
| Kayaba Industry Co. Ltd. | 196,000 | 775,708 | ||||
| Miraial Co. Ltd. | 28,700 | 2,440,729 | ||||
| Mitsui Engineering & Shipbuilding Co. | 599,000 | 1,442,108 | ||||
| Mitsui Mining & Smelting Co. Ltd. | 380,000 | 2,171,970 | ||||
| Modec, Inc. | 45,300 | 1,278,916 | ||||
| Nabtesco Corp. | 132,000 | 1,112,277 | ||||
| NGK Insulators Ltd. | 81,000 | 968,735 | ||||
| NGK Spark Plug Co. Ltd. | 66,000 | 1,062,550 | ||||
| Nifco, Inc. | 25,000 | 421,750 | ||||
| Nisshin Fudosan Co. Ltd. | 119,900 | 1,769,355 | ||||
| Nissin Co. Ltd. | 386,600 | 562,467 | ||||
| Nissin Co. Ltd. New | 323,600 | 465,203 | ||||
| Omron Corp. | 26,500 | 627,667 | ||||
| Ryohin Keikaku Co. Ltd. | 46,900 | 3,127,446 | ||||
| Saint Marc Co. Ltd. | 2,600 | 131,721 | ||||
| Sammy NetWorks Co. Ltd. | 46 | 577,633 | ||||
| Sega Sammy Holdings, Inc. | 11,200 | 403,494 | ||||
| Sega Sammy Holdings, Inc. New | 22,400 | 812,809 | ||||
| Seiyu Ltd. (a) | 795,000 | 1,631,705 | ||||
| SFCG Co. Ltd. | 990 | 239,117 | ||||
| Sugi Pharmacy Co. Ltd. | 49,200 | 1,908,839 | ||||
| Sumisho Lease Co. Ltd. | 5,400 | 257,207 | ||||
| Sumitomo Titanium Corp. New | 5,100 | 574,169 | ||||
| Take & Give Needs Co. Ltd. (a) | 2,000 | 2,805,894 | ||||
| Techmatrix Corp. | 128 | 279,342 | ||||
| Teijin Ltd | 500,000 | 2,987,757 | ||||
| Telewave, Inc. | 46 | 268,898 | ||||
| The Sumitomo Warehouse Co. Ltd. | 200,000 | 1,555,366 | ||||
| Toho Tenax Co. Ltd. (a) | 313,000 | 1,263,154 | ||||
| Tokuyama Corp. | 93,000 | 926,205 | ||||
| Tokyo Seimitsu Co. Ltd. | 8,400 | 386,278 | ||||
| Tokyu Land Corp. | 120,000 | 955,043 | ||||
| Toray Industries, Inc. | 200,000 | 1,115,429 | ||||
See accompanying notes which are an integral part of the financial statements.
75 Annual Report
| Investments continued | ||||||
| Common Stocks continued | ||||||
| Shares | Value (Note 1) | |||||
| Japan – continued | ||||||
| UFJ Central Leasing Co. Ltd. | 11,200 | $ | 622,701 | |||
| Venture Link Co. Ltd. (a) | 960,300 | 2,852,510 | ||||
| Yasuragi Co. Ltd. (a) | 26,100 | 881,518 | ||||
| Yuraku Real Estate Co. Ltd. | 56,000 | 326,869 | ||||
| TOTAL JAPAN | 75,448,406 | |||||
| Korea (South) 8.1% | ||||||
| Daewoo Securities Co. Ltd. (a) | 242,110 | 2,608,943 | ||||
| Hyundai Department Store Co. Ltd. | 20,090 | 1,333,560 | ||||
| Hyundai Mipo Dockyard Co. Ltd. | 27,350 | 1,689,726 | ||||
| Korea Investment Holdings Co. Ltd. | 103,090 | 2,646,371 | ||||
| LG Card Co. Ltd. (a) | 53,290 | 1,924,360 | ||||
| Orion Corp. | 17,322 | 3,359,869 | ||||
| Shinhan Financial Group Co. Ltd. | 83,240 | 2,774,665 | ||||
| Yedang Entertainment Co. Ltd. (a) | 65,000 | 1,008,620 | ||||
| TOTAL KOREA (SOUTH) | 17,346,114 | |||||
| Luxembourg 0.2% | ||||||
| Stolt-Nielsen SA | 15,000 | 527,974 | ||||
| Mexico – 0.8% | ||||||
| Grupo Mexico SA de CV Series B | 933,120 | 1,800,318 | ||||
| Netherlands – 1.4% | ||||||
| Fugro NV (Certificaten Van Aandelen) unit | 72,700 | 1,964,341 | ||||
| Koninklijke Boskalis Westminster NV (Certificaten Van | ||||||
| Aandelen) | 19,300 | 958,982 | ||||
| TOTAL NETHERLANDS | 2,923,323 | |||||
| Norway 3.1% | ||||||
| Det Norske Oljeselskap ASA (DNO) (A Shares) | 422,100 | 2,069,627 | ||||
| Fred Olsen Energy ASA (a) | 75,400 | 2,080,280 | ||||
| Norse Energy Corp. ASA (a) | 686,000 | 362,718 | ||||
| Petroleum Geo-Services ASA (a) | 52,800 | 1,339,072 | ||||
| Schibsted ASA (B Shares) | 24,600 | 708,961 | ||||
| TOTAL NORWAY | 6,560,658 | |||||
| Poland – 0.0% | ||||||
| Powszechna Kasa Oszczednosci Bank SA | 3,900 | 32,793 | ||||
| Singapore – 0.6% | ||||||
| STATS ChipPAC Ltd. (a) | 2,364,000 | 1,297,943 | ||||
| South Africa 0.5% | ||||||
| Steinhoff International Holdings Ltd. | 448,000 | 1,172,411 | ||||
See accompanying notes which are an integral part of the financial statements.
| Annual Report |
| 76 |
| Common Stocks continued | ||||||
| Shares | Value (Note 1) | |||||
| Sweden – 3.1% | ||||||
| Boliden AB (a) | 501,000 | $ | 2,561,147 | |||
| Eniro AB | 111,300 | 1,216,233 | ||||
| Gambro AB (B Shares) | 42,600 | 599,280 | ||||
| International Business Systems AB (IBS) (B Shares) (a) | 69,000 | 173,333 | ||||
| Lindex AB | 36,500 | 1,771,923 | ||||
| Modern Times Group AB (MTG) (B Shares) (a) | 5,050 | 193,144 | ||||
| TOTAL SWEDEN | 6,515,060 | |||||
| Switzerland – 1.3% | ||||||
| Actelion Ltd. (Reg.) (a) | 19,913 | 2,239,759 | ||||
| Phonak Holding AG | 5,608 | 233,821 | ||||
| Sika AG (Bearer) | 533 | 379,548 | ||||
| TOTAL SWITZERLAND | 2,853,128 | |||||
| Taiwan 1.6% | ||||||
| Chipbond Technology Corp. | 376,000 | 487,489 | ||||
| Motech Industries, Inc. | 269,000 | 2,934,414 | ||||
| TOTAL TAIWAN | 3,421,903 | |||||
| Turkey 0.8% | ||||||
| Tupras Turkiye Petrol Rafinerileri AS | 100,000 | 1,709,212 | ||||
| United Kingdom – 7.3% | ||||||
| AMEC PLC | 122,600 | 740,165 | ||||
| British Land Co. PLC | 59,200 | 932,815 | ||||
| Burren Energy PLC | 100,000 | 1,416,360 | ||||
| Carillion PLC | 83,000 | 407,779 | ||||
| Development Securities PLC | 37,100 | 301,817 | ||||
| Hunting PLC | 500,000 | 2,525,104 | ||||
| Inchcape PLC | 33,000 | 1,203,552 | ||||
| Informa PLC | 12,200 | 80,836 | ||||
| ITE Group PLC | 154,700 | 309,494 | ||||
| London Clubs International PLC (a) | 70,200 | 151,007 | ||||
| Meggitt PLC | 466,200 | 2,496,786 | ||||
| Rank Group PLC | 32,700 | 171,365 | ||||
| Richmond Foods PLC | 195,300 | 1,772,066 | ||||
| Sportingbet PLC | 544,701 | 2,840,058 | ||||
| Stanley Leisure PLC | 8,373 | 89,982 | ||||
| Urban Dining PLC (a) | 116,100 | 81,192 | ||||
| TOTAL UNITED KINGDOM | 15,520,378 | |||||
| United States of America – 7.3% | ||||||
| Airgas, Inc. | 85,100 | 2,405,777 | ||||
See accompanying notes which are an integral part of the financial statements.
77 Annual Report
| Investments continued | ||||||||
| Common Stocks continued | ||||||||
| Shares | Value (Note 1) | |||||||
| United States of America – continued | ||||||||
| Covad Communications Group, Inc. (a) | 984,000 | $ | 875,760 | |||||
| NTL, Inc. (a) | 70,100 | 4,298,532 | ||||||
| Oil States International, Inc. (a) | 15,200 | 503,120 | ||||||
| Plains Exploration & Production Co. (a) | 72,500 | 2,827,500 | ||||||
| RTI International Metals, Inc. (a) | 51,500 | 1,726,280 | ||||||
| Titanium Metals Corp. (a) | 62,000 | 2,926,400 | ||||||
| TOTAL UNITED STATES OF AMERICA | 15,563,369 | |||||||
| TOTAL COMMON STOCKS | ||||||||
| (Cost $213,598,275) | 214,796,294 | |||||||
| TOTAL INVESTMENT PORTFOLIO 100.6% | ||||||||
| (Cost $213,598,275) | 214,796,294 | |||||||
| NET OTHER ASSETS – (0.6)% | (1,339,807) | |||||||
| NET ASSETS 100% | $ | 213,456,487 | ||||||
| Legend (a) Non-income producing |
Income Tax Information
At October 31, 2005, the fund had a capital loss carryforward of approximately $3,072,229 all of which will expire on October 31, 2013.
See accompanying notes which are an integral part of the financial statements.
| Annual Report |
| 78 |
| Financial Statements | ||||||||
| Statement of Assets and Liabilities | ||||||||
| October 31, 2005 | ||||||||
| Assets | ||||||||
| Investment in securities, at value (cost $213,598,275) | ||||||||
| See accompanying schedule | $ | 214,796,294 | ||||||
| Foreign currency held at value (cost $11,965) | 11,965 | |||||||
| Receivable for investments sold | 11,394,843 | |||||||
| Receivable for fund shares sold | 3,250,912 | |||||||
| Dividends receivable | 95,243 | |||||||
| Interest receivable | 13,037 | |||||||
| Prepaid expenses | 65,808 | |||||||
| Receivable from investment adviser for expense | ||||||||
| reductions | 112,637 | |||||||
| Other affiliated receivables | 609 | |||||||
| Other receivables | 26,122 | |||||||
| Total assets | 229,767,470 | |||||||
| Liabilities | ||||||||
| Payable to custodian bank | $ | 1,588,751 | ||||||
| Payable for investments purchased | 14,257,737 | |||||||
| Payable for fund shares redeemed | 38,935 | |||||||
| Accrued management fee | 137,069 | |||||||
| Distribution fees payable | 5,670 | |||||||
| Other affiliated payables | 51,769 | |||||||
| Other payables and accrued expenses | 231,052 | |||||||
| Total liabilities | 16,310,983 | |||||||
| Net Assets | $ | 213,456,487 | ||||||
| Net Assets consist of: | ||||||||
| Paid in capital | $ | 215,542,869 | ||||||
| Undistributed net investment income | 25,213 | |||||||
| Accumulated undistributed net realized gain (loss) on | ||||||||
| investments and foreign currency transactions | (3,306,615) | |||||||
| Net unrealized appreciation (depreciation) on | ||||||||
| investments and assets and liabilities in foreign | ||||||||
| currencies | 1,195,020 | |||||||
| Net Assets | $ | 213,456,487 | ||||||
See accompanying notes which are an integral part of the financial statements.
79 Annual Report
| Financial Statements continued | ||||||
| Statement of Assets and Liabilities continued | ||||||
| October 31, 2005 | ||||||
| Calculation of Maximum Offering Price | ||||||
| Class A: | ||||||
| Net Asset Value and redemption price per share | ||||||
| ($5,532,847 ÷ 531,609 shares) | $ | 10.41 | ||||
| Maximum offering price per share (100/94.25 of | ||||||
| $10.41) | $ | 11.05 | ||||
| Class T: | ||||||
| Net Asset Value and redemption price per share | ||||||
| ($2,704,469 ÷ 260,435 shares) | $ | 10.38 | ||||
| Maximum offering price per share (100/96.50 of | ||||||
| $10.38) | $ | 10.76 | ||||
| Class B: | ||||||
| Net Asset Value and offering price per share | ||||||
| ($1,704,690 ÷ 164,338 shares)A | $ | 10.37 | ||||
| Class C: | ||||||
| Net Asset Value and offering price per share | ||||||
| ($3,316,682 ÷ 319,752 shares)A | $ | 10.37 | ||||
| Fidelity International Small Cap Opportunities | ||||||
| Fund: | ||||||
| Net Asset Value, offering price and redemption | ||||||
| price per share ($197,348,717 ÷ 18,973,897 | ||||||
| shares) | $ | 10.40 | ||||
| Institutional Class: | ||||||
| Net Asset Value, offering price and redemption | ||||||
| price per share ($2,849,082 ÷ 274,003 | ||||||
| shares) | $ | 10.40 | ||||
| A Redemption price per share is equal to net asset value less any applicable contingent deferred sales charge. | ||||||
See accompanying notes which are an integral part of the financial statements.
Annual Report 80
| Statement of Operations | ||||||
| August 2, 2005 (commencement of operations) to October 31, 2005 | ||||||
| Investment Income | ||||||
| Dividends | $ | 333,348 | ||||
| Interest | 61,715 | |||||
| 395,063 | ||||||
| Less foreign taxes withheld | (14,276) | |||||
| Total income | 380,787 | |||||
| Expenses | ||||||
| Management fee | $ | 227,382 | ||||
| Transfer agent fees | 85,754 | |||||
| Distribution fees | 11,741 | |||||
| Accounting fees and expenses | 14,376 | |||||
| Independent trustees’ compensation | 42 | |||||
| Custodian fees and expenses | 131,764 | |||||
| Registration fees | 89,351 | |||||
| Audit | 46,278 | |||||
| Miscellaneous | 1,050 | |||||
| Total expenses before reductions | 607,738 | |||||
| Expense reductions | (252,181) | 355,557 | ||||
| Net investment income (loss) | 25,230 | |||||
| Realized and Unrealized Gain (Loss) | ||||||
| Net realized gain (loss) on: | ||||||
| Investment securities (net of foreign taxes of $6,741) . | (3,249,999) | |||||
| Foreign currency transactions | (56,633) | |||||
| Total net realized gain (loss) | (3,306,632) | |||||
| Change in net unrealized appreciation (depreciation) on: | ||||||
| Investment securities | 1,198,019 | |||||
| Assets and liabilities in foreign currencies | (2,999) | |||||
| Total change in net unrealized appreciation | ||||||
| (depreciation) | 1,195,020 | |||||
| Net gain (loss) | (2,111,612) | |||||
| Net increase (decrease) in net assets resulting from | ||||||
| operations | $ | (2,086,382) | ||||
| See accompanying notes which are an integral part of the financial statements. | ||||||
| 81 | Annual Report | |||||
| Financial Statements continued | ||||
| Statement of Changes in Net Assets | ||||
| August 2, 2005 | ||||
| (commencement | ||||
| of operations) to | ||||
| October 31, 2005 | ||||
| Increase (Decrease) in Net Assets | ||||
| Operations | ||||
| Net investment income (loss) | $ | 25,230 | ||
| Net realized gain (loss) | (3,306,632) | |||
| Change in net unrealized appreciation (depreciation) | 1,195,020 | |||
| Net increase (decrease) in net assets resulting | ||||
| from operations | (2,086,382) | |||
| Share transactions - net increase (decrease) | 215,410,790 | |||
| Redemption fees | 132,079 | |||
| Total increase (decrease) in net assets | 213,456,487 | |||
| Net Assets | ||||
| Beginning of period | — | |||
| End of period (including undistributed net investment income of $25,213) | $ | 213,456,487 | ||
See accompanying notes which are an integral part of the financial statements.
| Annual Report |
| 82 |
| Financial Highlights Class A | ||||
| Year ended October 31, | 2005G | |||
| Selected Per Share Data | ||||
| Net asset value, beginning of period | $ | 10.00 | ||
| Income from Investment Operations | ||||
| Net investment income (loss)E | —I | |||
| Net realized and unrealized gain (loss) | 40F | |||
| Total from investment operations | 40 | |||
| Redemption fees added to paid in capitalE | 01 | |||
| Net asset value, end of period | $ | 10.41 | ||
| Total ReturnB,C,D | 4.10% | |||
| Ratios to Average Net AssetsH | ||||
| Expenses before expense reductions | 2.67%A | |||
| Expenses net of voluntary waivers, if any | 1.65%A | |||
| Expenses net of all reductions | 1.54%A | |||
| Net investment income (loss) | (.09)%A | |||
| Supplemental Data | ||||
| Net assets, end of period (000 omitted) | $ | 5,533 | ||
| Portfolio turnover rate | 46% |
| A Annualized B Total returns for periods of less than one year are not annualized. C Total returns would have been lower had certain expenses not been reduced during the periods shown. D Total returns do not include the effect of the sales charges. E Calculated based on average shares outstanding during the period. F The amount shown for a share outstanding does not correspond with the aggregate net gain (loss) on investments for the period due to the timing of sales and repurchases of shares in relation to fluctuating market values of the investments of the fund. G For the period August 2, 2005 (commencement of operations) to October 31, 2005. H Expense ratios reflect operating expenses of the class. Expenses before reductions do not reflect amounts reimbursed by the investment adviser or reductions from brokerage service arrangements or other expense offset arrangements and do not represent the amount paid by the class during periods when reimbursements or reductions occur. Expense ratios before reductions for start up periods may not be representative of longer term operating periods. Expenses net of any voluntary waivers reflect expenses after reimbursement by the investment adviser but prior to reductions from brokerage service arrangements or other expense offset arrangements. Expenses net of all reductions represent the net expenses paid by the class. I Amount represents less than $.01 per share. |
See accompanying notes which are an integral part of the financial statements.
83 Annual Report
| Financial Highlights Class T | ||||
| Year ended October 31, | 2005G | |||
| Selected Per Share Data | ||||
| Net asset value, beginning of period | $ | 10.00 | ||
| Income from Investment Operations | ||||
| Net investment income (loss)E | (.01) | |||
| Net realized and unrealized gain (loss) | 38F | |||
| Total from investment operations | 37 | |||
| Redemption fees added to paid in capitalE | 01 | |||
| Net asset value, end of period | $ | 10.38 | ||
| Total ReturnB,C,D | 3.80% | |||
| Ratios to Average Net AssetsH | ||||
| Expenses before expense reductions | 2.92%A | |||
| Expenses net of voluntary waivers, if any | 1.90%A | |||
| Expenses net of all reductions | 1.78%A | |||
| Net investment income (loss) | (.33)%A | |||
| Supplemental Data | ||||
| Net assets, end of period (000 omitted) | $ | 2,704 | ||
| Portfolio turnover rate | 46% |
| A Annualized B Total returns for periods of less than one year are not annualized. C Total returns would have been lower had certain expenses not been reduced during the periods shown. D Total returns do not include the effect of the sales charges. E Calculated based on average shares outstanding during the period. F The amount shown for a share outstanding does not correspond with the aggregate net gain (loss) on investments for the period due to the timing of sales and repurchases of shares in relation to fluctuating market values of the investments of the fund. G For the period August 2, 2005 (commencement of operations) to October 31, 2005. H Expense ratios reflect operating expenses of the class. Expenses before reductions do not reflect amounts reimbursed by the investment adviser or reductions from brokerage service arrangements or other expense offset arrangements and do not represent the amount paid by the class during periods when reimbursements or reductions occur. Expense ratios before reductions for start up periods may not be representative of longer term operating periods. Expenses net of any voluntary waivers reflect expenses after reimbursement by the investment adviser but prior to reductions from brokerage service arrangements or other expense offset arrangements. Expenses net of all reductions represent the net expenses paid by the class. |
See accompanying notes which are an integral part of the financial statements.
| Annual Report |
| 84 |
| Financial Highlights Class B | ||||
| Year ended October 31, | 2005G | |||
| Selected Per Share Data | ||||
| Net asset value, beginning of period | $ | 10.00 | ||
| Income from Investment Operations | ||||
| Net investment income (loss)E | (.02) | |||
| Net realized and unrealized gain (loss) | 38F | |||
| Total from investment operations | 36 | |||
| Redemption fees added to paid in capitalE | 01 | |||
| Net asset value, end of period | $ | 10.37 | ||
| Total ReturnB,C,D | 3.70% | |||
| Ratios to Average Net AssetsH | ||||
| Expenses before expense reductions | 3.43%A | |||
| Expenses net of voluntary waivers, if any | 2.40%A | |||
| Expenses net of all reductions | 2.27%A | |||
| Net investment income (loss) | (.82)%A | |||
| Supplemental Data | ||||
| Net assets, end of period (000 omitted) | $ | 1,705 | ||
| Portfolio turnover rate | 46% |
| A Annualized B Total returns for periods of less than one year are not annualized. C Total returns would have been lower had certain expenses not been reduced during the periods shown. D Total returns do not include the effect of the contingent deferred sales charge. E Calculated based on average shares outstanding during the period. F The amount shown for a share outstanding does not correspond with the aggregate net gain (loss) on investments for the period due to the timing of sales and repurchases of shares in relation to fluctuating market values of the investments of the fund. G For the period August 2, 2005 (commencement of operations) to October 31, 2005. H Expense ratios reflect operating expenses of the class. Expenses before reductions do not reflect amounts reimbursed by the investment adviser or reductions from brokerage service arrangements or other expense offset arrangements and do not represent the amount paid by the class during periods when reimbursements or reductions occur. Expense ratios before reductions for start up periods may not be representative of longer term operating periods. Expenses net of any voluntary waivers reflect expenses after reimbursement by the investment adviser but prior to reductions from brokerage service arrangements or other expense offset arrangements. Expenses net of all reductions represent the net expenses paid by the class. |
See accompanying notes which are an integral part of the financial statements.
85 Annual Report
| Financial Highlights Class C | ||||
| Year ended October 31, | 2005G | |||
| Selected Per Share Data | ||||
| Net asset value, beginning of period | $ | 10.00 | ||
| Income from Investment Operations | ||||
| Net investment income (loss)E | (.02) | |||
| Net realized and unrealized gain (loss) | 38F | |||
| Total from investment operations | 36 | |||
| Redemption fees added to paid in capitalE | 01 | |||
| Net asset value, end of period | $ | 10.37 | ||
| Total ReturnB,C,D, | 3.70% | |||
| Ratios to Average Net AssetsH | ||||
| Expenses before expense reductions | 3.32%A | |||
| Expenses net of voluntary waivers, if any | 2.40%A | |||
| Expenses net of all reductions | 2.29%A | |||
| Net investment income (loss) | (.84)%A | |||
| Supplemental Data | ||||
| Net assets, end of period (000 omitted) | $ | 3,317 | ||
| Portfolio turnover rate | 46% |
| A Annualized B Total returns for periods of less than one year are not annualized. C Total returns would have been lower had certain expenses not been reduced during the periods shown. D Total returns do not include the effect of the contingent deferred sales charge. E Calculated based on average shares outstanding during the period. F The amount shown for a share outstanding does not correspond with the aggregate net gain (loss) on investments for the period due to the timing of sales and repurchases of shares in relation to fluctuating market values of the investments of the fund. G For the period August 2, 2005 (commencement of operations) to October 31, 2005. H Expense ratios reflect operating expenses of the class. Expenses before reductions do not reflect amounts reimbursed by the investment adviser or reductions from brokerage service arrangements or other expense offset arrangements and do not represent the amount paid by the class during periods when reimbursements or reductions occur. Expense ratios before reductions for start up periods may not be representative of longer term operating periods. Expenses net of any voluntary waivers reflect expenses after reimbursement by the investment adviser but prior to reductions from brokerage service arrangements or other expense offset arrangements. Expenses net of all reductions represent the net expenses paid by the class. |
See accompanying notes which are an integral part of the financial statements.
| Annual Report |
| 86 |
| Financial Highlights Fidelity International Small Cap Opportunities Fund | ||||
| Year ended October 31, | 2005F | |||
| Selected Per Share Data | ||||
| Net asset value, beginning of period | $ | 10.00 | ||
| Income from Investment Operations | ||||
| Net investment income (loss)D | —H | |||
| Net realized and unrealized gain (loss) | 39E | |||
| Total from investment operations | 39 | |||
| Redemption fees added to paid in capitalD | 01 | |||
| Net asset value, end of period | $ | 10.40 | ||
| Total ReturnB,C | 4.00% | |||
| Ratios to Average Net AssetsG | ||||
| Expenses before expense reductions | 2.25%A | |||
| Expenses net of voluntary waivers, if any | 1.40%A | |||
| Expenses net of all reductions | 1.31%A | |||
| Net investment income (loss) | 14%A | |||
| Supplemental Data | ||||
| Net assets, end of period (000 omitted) | $ | 197,349 | ||
| Portfolio turnover rate | 46% | |||
| A Annualized B Total returns for periods of less than one year are not annualized. C Total returns would have been lower had certain expenses not been reduced during the periods shown. D Calculated based on average shares outstanding during the period. E The amount shown for a share outstanding does not correspond with the aggregate net gain (loss) on investments for the period due to the timing of sales and repurchases of shares in relation to fluctuating market values of the investments of the fund. F For the period August 2, 2005 (commencement of operations) to October 31, 2005. G Expense ratios reflect operating expenses of the class. Expenses before reductions do not reflect amounts reimbursed by the investment adviser or reductions from brokerage service arrangements or other expense offset arrangements and do not represent the amount paid by the class during periods when reimbursements or reductions occur. Expense ratios before reductions for start up periods may not be representative of longer term operating periods. Expenses net of any voluntary waivers reflect expenses after reimbursement by the investment adviser but prior to reductions from brokerage service arrangements or other expense offset arrangements. Expenses net of all reductions represent the net expenses paid by the class. H Amount represents less than $.01 per share. |
See accompanying notes which are an integral part of the financial statements.
87 Annual Report
| Financial Highlights Institutional Class | ||||
| Year ended October 31, | 2005F | |||
| Selected Per Share Data | ||||
| Net asset value, beginning of period | $ | 10.00 | ||
| Income from Investment Operations | ||||
| Net investment income (loss)D | —H | |||
| Net realized and unrealized gain (loss) | 39E | |||
| Total from investment operations | 39 | |||
| Redemption fees added to paid in capitalD | 01 | |||
| Net asset value, end of period | $ | 10.40 | ||
| Total ReturnB,C | 4.00% | |||
| Ratios to Average Net AssetsG | ||||
| Expenses before expense reductions | 2.25%A | |||
| Expenses net of voluntary waivers, if any | 1.40%A | |||
| Expenses net of all reductions | 1.29%A | |||
| Net investment income (loss) | 16%A | |||
| Supplemental Data | ||||
| Net assets, end of period (000 omitted) | $ | 2,849 | ||
| Portfolio turnover rate | 46% |
| A Annualized B Total returns for periods of less than one year are not annualized. C Total returns would have been lower had certain expenses not been reduced during the periods shown. D Calculated based on average shares outstanding during the period. E The amount shown for a share outstanding does not correspond with the aggregate net gain (loss) on investments for the period due to the timing of sales and repurchases of shares in relation to fluctuating market values of the investments of the fund. F For the period August 2, 2005 (commencement of operations) to October 31, 2005. G Expense ratios reflect operating expenses of the class. Expenses before reductions do not reflect amounts reimbursed by the investment adviser or reductions from brokerage service arrangements or other expense offset arrangements and do not represent the amount paid by the class during periods when reimbursements or reductions occur. Expense ratios before reductions for start up periods may not be representative of longer term operating periods. Expenses net of any voluntary waivers reflect expenses after reimbursement by the investment adviser but prior to reductions from brokerage service arrangements or other expense offset arrangements. Expenses net of all reductions represent the net expenses paid by the class. H Amount represents less than $.01 per share. |
See accompanying notes which are an integral part of the financial statements.
| Annual Report |
| 88 |
Notes to Financial Statements
| For the period ended October 31, 2005 |
1. Significant Accounting Policies.
Fidelity International Small Cap Opportunities Fund (the fund) is a fund of Fidelity Investment Trust (the trust) and is authorized to issue an unlimited number of shares. The trust is registered under the Investment Company Act of 1940, as amended (the 1940 Act), as an open end management investment company organized as a Massachusetts business trust.
The fund offers Class A, Class T, Class B, Class C, International Small Cap Opportunities Fund and Institutional Class shares, each of which has equal rights as to assets and voting privileges. Each class has exclusive voting rights with respect to matters that affect that class. Class B shares will automatically convert to Class A shares after a holding period of seven years from the initial date of purchase. Investment income, realized and unrealized capital gains and losses, the common expenses of the fund, and certain fund level expense reductions, if any, are allocated on a pro rata basis to each class based on the relative net assets of each class to the total net assets of the fund. Each class differs with respect to transfer agent and distribution and service plan fees incurred. Certain expense reductions also differ by class.
The fund’s investments in emerging markets can be subject to social, economic, reg ulatory, and political uncertainties and can be extremely volatile. The fund may invest in affiliated money market central funds (Money Market Central Funds) which are open end investment companies available to investment companies and other accounts managed by Fidelity Management & Research Company (FMR) and its affiliates. The financial statements have been prepared in conformity with accounting principles generally accepted in the United States of America, which require management to make certain estimates and assumptions at the date of the financial statements. The following summarizes the significant accounting policies of the fund:
Security Valuation. Investments are valued and net asset value (NAV) per share is calculated (NAV calculation) as of the close of business of the New York Stock Exchange (NYSE), normally 4:00 p.m. Eastern time. Wherever possible, each fund uses indepen dent pricing services approved by the Board of Trustees to value their investments.
Equity securities, including restricted securities, for which market quotations are readily available, are valued at the last reported sale price or official closing price as reported by an independent pricing service on the primary market or exchange on which they are traded. In the event there were no sales during the day or closing prices are not available, securities are valued at the last quoted bid price. Investments in open end mutual funds, are valued at their closing net asset value each business day. Short term securities with remaining maturities of sixty days or less for which quotations are not readily available are valued at amortized cost, which approximates value.
89 Annual Report
Notes to Financial Statements continued
1. Significant Accounting Policies continued
Security Valuation continued
When current market prices or quotations are not readily available or do not accurately reflect fair value, valuations may be determined in accordance with procedures adopted by the Board of Trustees. For example, when developments occur between the close of a market and the close of the NYSE that may materially affect the value of some or all of the securities, or when trading in a security is halted, those securities may be fair valued. Factors used in the determination of fair value may include monitoring news to identify significant market or security specific events such as changes in the value of U.S. securi ties market, reviewing developments in foreign markets and evaluating the performance of ADRs, futures contracts and exchange traded funds. Because the fund’s utilization of fair value pricing depends on market activity, the frequency with which fair value pricing is used can not be predicted and may be utilized to a significant extent. The value of securities used for NAV calculation under fair value pricing may differ from published prices for the same securities.
Foreign Currency. The fund uses foreign currency contracts to facilitate transactions in foreign denominated securities. Losses from these transactions may arise from changes in the value of the foreign currency or if the counterparties do not perform under the contracts’ terms.
Foreign denominated assets, including investment securities, and liabilities are trans lated into U.S. dollars at the exchange rate at period end. Purchases and sales of invest ment securities, income and dividends received and expenses denominated in foreign currencies are translated into U.S. dollars at the exchange rate in effect on the transac tion date.
The effects of exchange rate fluctuations on investments are included with the net realized and unrealized gain (loss) on investment securities. Other foreign currency transactions resulting in realized and unrealized gain (loss) are disclosed separately.
Investment Transactions and Income. Security transactions are accounted for as of trade date. Gains and losses on securities sold are determined on the basis of identified cost. Dividend income is recorded on the ex dividend date, except for certain dividends from foreign securities where the ex dividend date may have passed, which are recorded as soon as the fund is informed of the ex dividend date. Non cash dividends included in dividend income, if any, are recorded at the fair market value of the securities received. Interest income is accrued as earned. Interest income includes coupon interest and amortization of premium and accretion of discount on debt securities. Investment income is recorded net of foreign taxes withheld where recovery of such taxes is uncertain.
| Annual Report |
| 90 |
1. Significant Accounting Policies continued
Expenses. Most expenses of the trust can be directly attributed to a fund. Expenses which cannot be directly attributed are apportioned among each fund in the trust.
Income Tax Information and Distributions to Shareholders. Each year, the fund intends to qualify as a regulated investment company by distributing all of its taxable income and realized gains under Subchapter M of the Internal Revenue Code. As a result, no provision for income taxes is required in the accompanying financial statements. Foreign taxes are provided for based on the fund’s understanding of the tax rules and rates that exist in the foreign markets in which it invests.
Distributions are recorded on the ex dividend date. Income dividends and capital gain distributions are declared separately for each class. Income and capital gain distribu tions are determined in accordance with income tax regulations, which may differ from generally accepted accounting principles. In addition, the fund will claim a portion of the payment made to redeeming shareholders as a distribution for income tax purposes.
Capital accounts within the financial statements are adjusted for permanent book tax differences. These adjustments have no impact on net assets or the results of operations. Temporary book tax differences will reverse in a subsequent period.
Book tax differences are primarily due to foreign currency transactions, certain foreign taxes, passive foreign investment companies (PFIC), capital loss carryforwards and losses deferred due to wash sales.
The tax basis components of distributable earnings and the federal tax cost as of period end were as follows:
| Unrealized appreciation | $ | 9,432,980 | ||
| Unrealized depreciation | (8,507,152) | |||
| Net unrealized appreciation (depreciation) | 925,828 | |||
| Undistributed ordinary income | 57,206 | |||
| Capital loss carryforward | (3,072,229) | |||
| Cost for federal income tax purposes | $ | 213,870,466 | ||
Short Term Trading (Redemption) Fees. Shares purchased and held in the fund less than 90 days will be subject to a redemption fee equal to 2.00% of the proceeds of the redeemed shares. All redemption fees, including any estimated redemption fees paid by FMR, are retained by the fund and accounted for as an addition to paid in capital.
91 Annual Report
| Notes to Financial Statements continued | ||
2. Operating Policies. | ||
Repurchase Agreements. FMR has received an Exemptive Order from the Securities and Exchange Commission (the SEC) which permits the fund and other affiliated entities of FMR to transfer uninvested cash balances into joint trading accounts which are then invested in repurchase agreements. The fund may also invest directly with institutions in repurchase agreements. Repurchase agreements are collateralized by government or non government securities. Collateral is held in segregated accounts with custodian banks and may be obtained in the event of a default of the counterparty. The fund monitors, on a daily basis, the value of the collateral to ensure it is at least equal to the principal amount of the repurchase agreement (including accrued interest). In the event of a default by the counterparty, realization of the collateral proceeds could be delayed, during which time the value of the collateral may decline.
3. Purchases and Sales of Investments.
Purchases and sales of securities, other than short term securities and U.S. government securities, aggregated $282,288,880 and $65,440,601, respectively.
4. Fees and Other Transactions with Affiliates.
Management Fee. FMR and its affiliates provide the fund with investment manage ment related services for which the fund pays a monthly management fee. The manage ment fee is the sum of an individual fund fee rate that is based on an annual rate of .60% of the fund’s average net assets and a group fee rate that averaged .27% during the period. The group fee rate is based upon the average net assets of all the mutual funds advised by FMR. The group fee rate decreases as assets under management increase and increases as assets under management decrease. In addition, the management fee is subject to a performance adjustment (up to a maximum of ±.20% of the fund’s average net assets over a 36 month performance period). The upward or downward adjustment to the management fee is based on the fund’s relative investment performance as compared to an appropriate benchmark index. The fund’s performance adjustment will not take effect until July 2006. Subsequent months will be added until the performance period includes 36 months. For the period, the total annualized management fee rate was .86% of the fund’s average net assets.
Distribution and Service Plan. In accordance with Rule 12b 1 of the 1940 Act, the fund has adopted separate Distribution and Service Plans for each class of shares. Certain classes pay Fidelity Distributors Corporation (FDC), an affiliate of FMR, separate Distribution and Service Fees, each of which is based on an annual percentage of each class’ average net assets. In addition, FDC may pay financial intermediaries for selling shares of the fund and providing shareholder support services. For the period, the
| Annual Report |
| 92 |
| 4. Fees and Other Transactions with Affiliates continued | ||
Distribution and Service Plan continued | ||
Distribution and Service Fee rates and the total amounts paid to and retained by FDC were as follows:
| Distribution | Service | Paid to | Retained | |||||||||
| Fee | Fee | FDC | by FDC | |||||||||
| Class A | 0% | .25% | $ | 1,456 | $ | 459 | ||||||
| Class T | 25% | .25% | 1,976 | 990 | ||||||||
| Class B | 75% | .25% | 2,894 | 2,675 | ||||||||
| Class C | 75% | .25% | 5,415 | 5,257 | ||||||||
| $ | 11,741 | $ | 9,381 |
Sales Load. FDC receives a front end sales charge of up to 5.75% for selling Class A shares, and 3.50% for selling Class T shares, some of which is paid to financial intermedi aries for selling shares of the fund. FDC receives the proceeds of contingent deferred sales charges levied on Class A, Class T, Class B, and Class C redemptions. These charges depend on the holding period. The deferred sales charges range from 5% to 1% for Class B, 1% for Class C, and .25% for certain purchases of Class A and Class T shares.
| For the period, sales charge amounts retained by FDC were as follows: | ||||
| Retained | ||||
| by FDC | ||||
| Class A | $ | 12,750 | ||
| Class T | 2,294 | |||
| Class B* | 10 | |||
| Class C* | 231 | |||
| $ | 15,285 | |||
* When Class B and Class C shares are initially sold, FDC pays commissions from its own resources to financial intermediaries through which the sales are made.
Transfer Agent Fees. Fidelity Investments Institutional Operations Company, Inc. (FIIOC), an affiliate of FMR, is the transfer, dividend disbursing and shareholder servic ing agent for each class of the fund, except for Fidelity International Small Cap Opportu nities Fund. Fidelity Service Company, Inc. (FSC), an affiliate of FMR, is the transfer agent for Fidelity International Small Cap Opportunities Fund shares. FIIOC and FSC receive account fees and asset based fees that vary according to the account size and type of account of the shareholders of the respective classes of the fund. FIIOC and FSC pay for typesetting, printing and mailing of shareholder reports, except proxy statements.
93 Annual Report
| Notes to Financial Statements continued | ||
| 4. Fees and Other Transactions with Affiliates continued | ||
Transfer Agent Fees continued | ||
For the period the total transfer agent fees paid by each class to FIIOC or FSC, were as follows:
| % of | ||||||
| Average | ||||||
| Amount | Net Assets | |||||
| Class A | $ | 2,158 | .36* | |||
| Class T | 1,388 | .34* | ||||
| Class B | 830 | .28* | ||||
| Class C | 1,495 | .27* | ||||
| Fidelity International Small Cap Opportunities Fund | 78,812 | .33* | ||||
| Institutional Class | 1,071 | .21* | ||||
| $ | 85,754 | |||||
| * Annualized |
Accounting Fees. FSC maintains the fund’s accounting records. The fee is based on the level of average net assets for the month.
Affiliated Central Funds. The fund may invest in Money Market Central Funds which seek preservation of capital and current income and are managed by Fidelity Invest ments Money Management, Inc. (FIMM), an affiliate of FMR.
Income distributions earned by the fund are recorded as income in the accompanying financial statements and totaled $55,685 for the period.
Brokerage Commissions. The fund placed a portion of its portfolio transactions with brokerage firms which are affiliates of the investment adviser. The commissions paid to these affiliated firms were $7,977 for the period.
| Annual Report |
| 94 |
| 5. Expense Reductions. |
FMR voluntarily agreed to reimburse each class to the extent annual operating expenses exceeded certain levels of average net assets as noted in the table below. Some expenses, for example interest expense, are excluded from this reimbursement.
| The following classes were in reimbursement during the period: | ||||||
| Expense | Reimbursement | |||||
| Limitations | from adviser | |||||
| Class A | 1.65% | $ | 6,027 | |||
| Class T | 1.90% | 4,117 | ||||
| Class B | 2.40% | 3,055 | ||||
| Class C | 2.40% | 5,067 | ||||
| Fidelity International Small Cap Opportunities Fund . | 1.40% | 205,242 | ||||
| Institutional Class | 1.40% | 4,405 | ||||
| $ | 227,913 | |||||
Many of the brokers with whom FMR places trades on behalf of the fund provided services to the fund in addition to trade execution. These services included payments of certain expenses on behalf of the fund totaling $23,569 for the period. In addition, through arrangements with the fund’s custodian and each class’ transfer agent, credits realized as a result of uninvested cash balances were used to reduce the fund’s expenses. During the period, these credits reduced the fund’s custody expenses by $89. During the period, credits reduced each class’ transfer agent expense as noted in the table below.
| Transfer Agent | ||||
| expense reduction | ||||
| Class A | $ | 124 | ||
| Class T | 120 | |||
| Class B | 123 | |||
| Class C | 120 | |||
| Institutional Class | 123 | |||
| $ | 610 | |||
| 6. Other. | ||||
The fund’s organizational documents provide former and current trustees and officers with a limited indemnification against liabilities arising in connection with the perfor mance of their duties to the fund. In the normal course of business, the fund may also enter into contracts that provide general indemnifications. The fund’s maximum expo sure under these arrangements is unknown as this would be dependent on future claims that may be made against the fund. The risk of material loss from such claims is consid ered remote.
95 Annual Report
| Notes to Financial Statements continued | ||||||
| 7. Share Transactions. | ||||||
| Transactions for each class of shares were as follows: | ||||||
| Shares | Dollars | |||||
| Year ended | Year ended | |||||
| October 31, 2005A | October 31, 2005A | |||||
| Class A | ||||||
| Shares sold | 533,911 | $ | 5,543,122 | |||
| Shares redeemed | (2,302) | (24,252) | ||||
| Net increase (decrease) | 531,609 | $ | 5,518,870 | |||
| Class T | ||||||
| Shares sold | 262,396 | $ | 2,707,886 | |||
| Shares redeemed | (1,961) | (19,686) | ||||
| Net increase (decrease) | 260,435 | $ | 2,688,200 | |||
| Class B | ||||||
| Shares sold | 169,923 | $ | 1,745,697 | |||
| Shares redeemed | (5,585) | (57,751) | ||||
| Net increase (decrease) | 164,338 | $ | 1,687,946 | |||
| Class C | ||||||
| Shares sold | 322,125 | $ | 3,329,826 | |||
| Shares redeemed | (2,373) | (24,472) | ||||
| Net increase (decrease) | 319,752 | $ | 3,305,354 | |||
| Fidelity International Small Cap Opportunities Fund | ||||||
| Shares sold | 19,620,455 | $ | 205,992,728 | |||
| Shares redeemed | (646,558) | (6,587,124) | ||||
| Net increase (decrease) | 18,973,897 | $ | 199,405,604 | |||
| Institutional Class | ||||||
| Shares sold | 274,003 | $ | 2,804,816 | |||
| Net increase (decrease) | 274,003 | $ | 2,804,816 | |||
| A For the period August 2, 2005 (commencement of operations) to October 31, 2005. | ||||||
| Annual Report |
| 96 |
Report of Independent Registered Public Accounting Firm
To the Trustees of Fidelity Investment Trust and Shareholders of Fidelity International Small Cap Opportunities Fund:
We have audited the accompanying statement of assets and liabilities of Fidelity Interna tional Small Cap Opportunities Fund (the Fund), a fund of Fidelity Investment Trust, including the schedule of investments, as of October 31, 2005, and the related statement of operations, the statement of changes in net assets, and the financial highlights for the period from August 2, 2005 (commencement of operations) to October 31, 2005. These financial statements and financial highlights are the responsibility of the Fund’s manage ment. Our responsibility is to express an opinion on these financial statements and financial highlights based on our audit.
We conducted our audit in accordance with standards of the Public Company Accounting Oversight Board (United States). Those standards require that we plan and perform the audit to obtain reasonable assurance about whether the financial statements and financial highlights are free of material misstatement. The Fund is not required to have, nor were we engaged to perform, an audit of its internal control over financial reporting. Our audit included consideration of internal control over financial reporting as a basis for designing audit procedures that are appropriate in the circumstances, but not for the purpose of expressing an opinion on the effectiveness of the Fund’s internal control over financial reporting. Accordingly, we express no such opinion. An audit also includes examining, on a test basis, evidence supporting the amounts and disclosures in the financial statements, assessing the accounting principles used and significant estimates made by management, as well as evaluating the overall financial statement presentation. Our procedures in cluded confirmation of securities owned as of October 31, 2005, by correspondence with the custodians and brokers; where replies were not received from brokers, we performed other auditing procedures. We believe that our audit provide a reasonable basis for our opinion.
In our opinion, the financial statements and financial highlights referred to above present fairly, in all material respects, the financial position of Fidelity International Small Cap Opportunities Fund as of October 31, 2005, the results of its operations, the changes in its net assets, and its financial highlights for the period from August 2, 2005 (commencement of operations) to October 31, 2005, in conformity with accounting principles generally accepted in the United States of America.
| /s/ Deloitte & Touche LLP DELOITTE & TOUCHE LLP Boston, Massachusetts December 13, 2005 |
97 Annual Report
Trustees and Officers
The Trustees, Members of the Advisory Board, and executive officers of the trust and fund, as applicable, are listed below. The Board of Trustees governs the fund and is responsible for protecting the interests of shareholders. The Trustees are experienced executives who meet periodically throughout the year to oversee the fund’s activities, review contractual arrangements with companies that provide services to the fund, and review the fund’s performance. Except for William O. McCoy, Stephen P. Jonas, and Kenneth L. Wolfe, each of the Trustees oversees 322 funds advised by FMR or an affiliate. Mr. McCoy oversees 324 funds advised by FMR or an affiliate. Mr. Jonas and Mr. Wolfe oversee 319 funds advised by FMR or an affiliate.
The Trustees hold office without limit in time except that (a) any Trustee may resign; (b) any Trustee may be removed by written instrument, signed by at least two thirds of the number of Trustees prior to such removal; (c) any Trustee who requests to be retired or who has become incapacitated by illness or injury may be retired by written instru ment signed by a majority of the other Trustees; and (d) any Trustee may be removed at any special meeting of shareholders by a two thirds vote of the outstanding voting securities of the trust. Each Trustee who is not an interested person (as defined in the 1940 Act) (Independent Trustee), shall retire not later than the last day of the calendar year in which his or her 72nd birthday occurs. The Independent Trustees may waive this mandatory retirement age policy with respect to individual Trustees. The executive officers and Advisory Board Members hold office without limit in time, except that any officer and Advisory Board Member may resign or may be removed by a vote of a majority of the Trustees at any regular meeting or any special meeting of the Trustees. Except as indicated, each individual has held the office shown or other offices in the same company for the past five years.
The fund’s statement of additional information (SAI) includes more information about the Trustees. To request a free copy, call Fidelity at 1-800-544-8544.
| Interested Trustees*: |
Correspondence intended for each Trustee who is an interested person may be sent to Fidelity Investments, 82 Devonshire Street, Boston, Massachusetts 02109.
| Name, Age; Principal Occupation Edward C. Johnson 3d (75)** |
Year of Election or Appointment: 1984
Mr. Johnson is Chairman of the Board of Trustees. Mr. Johnson serves as Chief Executive Officer, Chairman, and a Director of FMR Corp.; a Di rector and Chairman of the Board and of the Executive Committee of FMR; Chairman and a Director of Fidelity Management & Research (Far East) Inc.; Chairman and a Director of Fidelity Investments Money Man agement, Inc.; and Chairman (2001 present) and a Director (2000 present) of FMR Co., Inc.
| Annual Report |
| 98 |
| Name, Age; Principal Occupation Abigail P. Johnson (43)** |
Year of Election or Appointment: 2001
Ms. Johnson serves as President of Fidelity Employer Services Company (FESCO) (2005 present). She is President and a Director of Fidelity In vestments Money Management, Inc. (2001 present), FMR Co., Inc. (2001 present), and a Director of FMR Corp. Previously, Ms. Johnson served as President and a Director of FMR (2001 2005), Senior Vice President of the Fidelity funds (2001 2005), and managed a number of Fidelity funds.
| Stephen P. Jonas (52) |
Year of Election or Appointment: 2005
Mr. Jonas is Senior Vice President of International Small Cap Opportuni ties (2005 present). He also serves as Senior Vice President of other Fidelity funds (2005 present). Mr. Jonas is Executive Director of FMR (2005 present). Previously, Mr. Jonas served as President of Fidelity En terprise Operations and Risk Services (2004 2005), Chief Administra tive Officer (2002 2004), and Chief Financial Officer of FMR Co. (1998 2000). Mr. Jonas has been with Fidelity Investments since 1987 and has held various financial and management positions including Chief Financial Officer of FMR. In addition, he serves on the Boards of Boston Ballet (2003 present) and Simmons College (2003 present).
| Robert L. Reynolds (53) |
Year of Election or Appointment: 2003
Mr. Reynolds is a Director (2003 present) and Chief Operating Officer (2002 present) of FMR Corp. He also serves on the Board at Fidelity Investments Canada, Ltd. (2000 present). Previously, Mr. Reynolds served as President of Fidelity Investments Institutional Retirement Group (1996 2000).
* Trustees have been determined to be “Interested Trustees” by virtue of, among other things, their affiliation with the trust or various entities under common control with FMR.
** Edward C. Johnson 3d, Trustee, is Abigail P. Johnson’s father.
99 Annual Report
Trustees and Officers - continued
Independent Trustees:
Correspondence intended for each Independent Trustee (that is, the Trustees other than the Interested Trustees) may be sent to Fidelity Investments, P.O. Box 55235, Boston, Massachusetts 02205 5235.
| Name, Age; Principal Occupation Dennis J. Dirks (57) |
Year of Election or Appointment: 2005
Prior to his retirement in May 2003, Mr. Dirks was Chief Operating Officer and a member of the Board of The Depository Trust & Clearing Corporation (DTCC) (1999 2003). He also served as President, Chief Operating Officer, and Board member of The Depository Trust Company (DTC) (1999 2003) and President and Board member of the National Securities Clearing Corporation (NSCC) (1999 2003). In addi tion, Mr. Dirks served as Chief Executive Officer and Board member of the Government Securities Clearing Corporation (2001 2003) and Chief Executive Officer and Board member of the Mortgage Backed Securities Clearing Corporation (2001 2003). Mr. Dirks also serves as a Trustee of Manhattan College (2005 present).
| Robert M. Gates (62) |
Year of Election or Appointment: 1997
Dr. Gates is Vice Chairman of the Independent Trustees (2005 present). Dr. Gates is President of Texas A&M University (2002 present). He was Director of the Central Intelligence Agency (CIA) from 1991 to 1993. From 1989 to 1991, Dr. Gates served as Assistant to the President of the United States and Deputy National Security Advisor. Dr. Gates is a Director of NACCO Industries, Inc. (mining and manufacturing), Parker Drilling Co., Inc. (drilling and rental tools for the energy industry, 2001 present), and Brinker International (restaurant management, 2003 present). Previously, Dr. Gates served as a Director of LucasVarity PLC (automotive components and diesel engines), a Director of TRW Inc. (automotive, space, defense, and information technology), and Dean of the George Bush School of Government and Public Service at Texas A&M University (1999 2001). Dr. Gates also is a Trustee of the Forum for International Policy.
| Annual Report |
| 100 |
| Name, Age; Principal Occupation George H. Heilmeier (69) |
Year of Election or Appointment: 2004
Dr. Heilmeier is Chairman Emeritus of Telcordia Technologies (commu nication software and systems), where prior to his retirement, he served as company Chairman and Chief Executive Officer. He currently serves on the Boards of Directors of The Mitre Corporation (systems engineer ing and information technology support for the government), and HRL Laboratories (private research and development, 2004 present). He is Chairman of the General Motors Science & Technology Advisory Board and a Life Fellow of the Institute of Electrical and Electronics Engineers (IEEE) (2000 present). Dr. Heilmeier is a member of the Defense Science Board and the National Security Agency Advisory Board. He is also a member of the National Academy of Engineering, the American Acad emy of Arts and Sciences, and the Board of Overseers of the School of Engineering and Applied Science of the University of Pennsylvania. Pre viously, Dr. Heilmeier served as a Director of TRW Inc. (automotive, space, defense, and information technology, 1992 2002), Compaq (1994 2002), Automatic Data Processing, Inc. (ADP) (technology based business outsourcing, 1995 2002), INET Technologies Inc. (telecommu nications network surveillance, 2001 2004), and Teletech Holdings (cus tomer management services). He is the recipient of the 2005 Kyoto Prize in Advanced Technology for his invention of the liquid display.
| Marie L. Knowles (59) |
Year of Election or Appointment: 2001
Prior to Ms. Knowles’ retirement in June 2000, she served as Executive Vice President and Chief Financial Officer of Atlantic Richfield Company (ARCO) (diversified energy, 1996 2000). From 1993 to 1996, she was a Senior Vice President of ARCO and President of ARCO Transportation Company. She served as a Director of ARCO from 1996 to 1998. She currently serves as a Director of Phelps Dodge Corporation (copper mining and manufacturing) and McKesson Corporation (healthcare ser vice, 2002 present). Ms. Knowles is a Trustee of the Brookings Institution and the Catalina Island Conservancy and also serves as a member of the Advisory Board for the School of Engineering of the University of Southern California.
101 Annual Report
Trustees and Officers - continued
| Name, Age; Principal Occupation Ned C. Lautenbach (61) |
Year of Election or Appointment: 2000
Mr. Lautenbach has been a partner of Clayton, Dubilier & Rice, Inc. (private equity investment firm) since September 1998. Previously, Mr. Lautenbach was with the International Business Machines Corporation (IBM) from 1968 until his retirement in 1998. Mr. Lautenbach serves as a Director of Italtel Holding S.p.A. (telecommunications (Milan, Italy), 2004 present) and Eaton Corporation (diversified industrial) as well as the Philharmonic Center for the Arts in Naples, Florida. He also is a member of the Board of Trustees of Fairfield University (2005 present), as well as a member of the Council on Foreign Relations.
| Marvin L. Mann (72) |
Year of Election or Appointment: 1993
Mr. Mann is Chairman of the Independent Trustees (2001 present). He is Chairman Emeritus of Lexmark International, Inc. (computer peripherals), where he served as CEO until April 1998, retired as Chairman May 1999, and remains a member of the Board. Prior to 1991, he held the positions of Vice President of International Business Machines Corporation (IBM) and President and General Manager of various IBM divisions and subsidiaries. He is a member of the Executive Committee of the Independent Director’s Council of the Investment Com pany Institute. In addition, Mr. Mann is a member of the President’s Cabinet at the University of Alabama and the Board of Visitors of the Culverhouse College of Commerce and Business Administration at the University of Alabama.
| William O. McCoy (72) |
Year of Election or Appointment: 1997
Prior to his retirement in December 1994, Mr. McCoy was Vice Chair man of the Board of BellSouth Corporation (telecommunications) and President of BellSouth Enterprises. He is currently a Director of Liberty Corporation (holding company), Duke Realty Corporation (real estate), and Progress Energy, Inc. (electric utility). He is also a partner of Frank lin Street Partners (private investment management firm) and a member of the Research Triangle Foundation Board. In addition, Mr. McCoy served as the Interim Chancellor (1999 2000) and a member of the Board of Visitors for the University of North Carolina at Chapel Hill and currently serves on the Board of Directors of the University of North Carolina Health Care System and the Board of Visitors of the Kenan Flagler Business School (University of North Carolina at Chapel Hill). He also served as Vice President of Finance for the University of North Car olina (16 school system).
| Annual Report |
| 102 |
| Name, Age; Principal Occupation Cornelia M. Small (61) |
Year of Election or Appointment: 2005
Ms. Small is a member (2000 present) and Chairperson (2002 present) of the Investment Committee, and a member (2002 present) of the Board of Trustees of Smith College. Previously, she served as Chief In vestment Officer (1999 2000), Director of Global Equity Investments (1996 1999), and a member of the Board of Directors of Scudder, Stevens & Clark (1990 1997) and Scudder Kemper Investments (1997 1998). In addition, Ms. Small served as Co Chair (2000 2003) of the Annual Fund for the Fletcher School of Law and Diplomacy.
| William S. Stavropoulos (66) |
Year of Election or Appointment: 2001
Mr. Stavropoulos is Chairman of the Board (2000 present) and a Mem ber of the Board of Directors of The Dow Chemical Company. Since joining The Dow Chemical Company in 1967, Mr. Stavropoulos served in numerous senior management positions, including President (1993 2000; 2002 2003), CEO (1995 2000; 2002 2004), and Chair man of the Executive Committee (2000 2004). Currently, he is a Direc tor of NCR Corporation (data warehousing and technology solutions), BellSouth Corporation (telecommunications), Chemical Financial Corpo ration, Maersk Inc. (industrial conglomerate, 2002 present), and Metal mark Capital (private equity investment firm, 2005 present). He also serves as a member of the Board of Trustees of the American Enterprise Institute for Public Policy Research. In addition, Mr. Stavropoulos is a member of The Business Council, J.P. Morgan International Council and the University of Notre Dame Advisory Council for the College of Science.
| Kenneth L. Wolfe (66) |
Year of Election or Appointment: 2005
Mr. Wolfe also serves as a Trustee (2005 present) or Member of the Advisory Board (2004 present) of other investment companies advised by FMR. Prior to his retirement in 2001, Mr. Wolfe was Chairman and Chief Executive Officer of Hershey Foods Corporation (1993 2001). He currently serves as a member of the boards of Adelphia Communica tions Corporation (2003 present), Bausch & Lomb, Inc., and Revlon Inc. (2004 present).
103 Annual Report
Trustees and Officers - continued
Advisory Board Members and Executive Officers:
Correspondence intended for Mr. Gamper may be sent to Fidelity Investments, P.O. Box 55235, Boston, Massachusetts 02205 5235. Correspondence intended for each executive officer and Mr. Lynch may be sent to Fidelity Investments, 82 Devonshire Street, Boston, Massachusetts 02109.
| Name, Age; Principal Occupation Albert R. Gamper, Jr. (63) |
Year of Election or Appointment: 2005
Member of the Advisory Board of Fidelity Investment Trust. Prior to his retirement in December 2004, Mr. Gamper served as Chairman of the Board of CIT Group Inc. (commercial finance). During his tenure with CIT Group Inc. Mr. Gamper served in numerous senior management positions, including Chairman (1987 1989; 1999 2001; 2002 2004), Chief Executive Officer (1987 2004), and President (1989 2002). He currently serves as a member of the Board of Directors of Public Service Enterprise Group (utilities, 2001 present), Chairman of the Board of Governors, Rutgers University (2004 present), and Chairman of the Board of Saint Barnabas Health Care System.
| Peter S. Lynch (61) |
Year of Election or Appointment: 2003
Member of the Advisory Board of Fidelity Investment Trust. Vice Chair man and a Director of FMR, and Vice Chairman (2001 present) and a Director (2000 present) of FMR Co., Inc. Previously, Mr. Lynch served as a Trustee of the Fidelity funds (1990 2003). In addition, he serves as a Trustee of Boston College, Massachusetts Eye & Ear Infirmary, Historic Deerfield, John F. Kennedy Library, and the Museum of Fine Arts of Boston.
| Dwight D. Churchill (51) |
Year of Election or Appointment: 2005
Vice President of International Small Cap Opportunities. Mr. Churchill also serves as Vice President of certain Equity Funds (2005 present) and certain High Income Funds (2005 present). Previously, he served as Head of Fidelity’s Fixed Income Division (2000 2005), Vice President of Fidelity’s Money Market Funds (2000 2005), Vice President of Fidelity’s Bond Funds, and Senior Vice President of FIMM (2000) and FMR. Mr. Churchill joined Fidelity in 1993 as Vice President and Group Leader of Taxable Fixed Income Investments.
| Annual Report |
| 104 |
| Name, Age; Principal Occupation Eric D. Roiter (56) |
Year of Election or Appointment: 2005
Secretary of International Small Cap Opportunities. He also serves as Secretary of other Fidelity funds; Vice President, General Counsel, and Secretary of FMR Co., Inc. (2001 present) and FMR; Assistant Secretary of Fidelity Management & Research (U.K.) Inc. (2001 present), Fidelity Management & Research (Far East) Inc. (2001 present), and Fidelity Investments Money Management, Inc. (2001 present). Mr. Roiter is an Adjunct Member, Faculty of Law, at Boston College Law School (2003 present). Previously, Mr. Roiter served as Vice President and Sec retary of Fidelity Distributors Corporation (FDC) (1998 2005).
| Stuart Fross (46) |
Year of Election or Appointment: 2005
Assistant Secretary of International Small Cap Opportunities. Mr. Fross also serves as Assistant Secretary of other Fidelity funds (2003 present), Vice President and Secretary of FDC (2005 present), and is an em ployee of FMR.
| Christine Reynolds (47) |
Year of Election or Appointment: 2005
President, Treasurer, and Anti Money Laundering (AML) officer of Inter national Small Cap Opportunities. Ms. Reynolds also serves as Presi dent, Treasurer, and AML officer of other Fidelity funds (2004) and is a Vice President (2003) and an employee (2002) of FMR. Before joining Fidelity Investments, Ms. Reynolds worked at PricewaterhouseCoopers LLP (PwC) (1980 2002), where she was most recently an audit partner with PwC’s investment management practice.
| Paul M. Murphy (58) |
Year of Election or Appointment: 2005
Chief Financial Officer of International Small Cap Opportunities. Mr. Murphy also serves as Chief Financial Officer of other Fidelity funds (2005 present). He also serves as Senior Vice President of Fidelity Pric ing and Cash Management Services Group (FPCMS).
| Kenneth A. Rathgeber (58) |
Year of Election or Appointment: 2005
Chief Compliance Officer of International Small Cap Opportunities. Mr. Rathgeber also serves as Chief Compliance Officer of other Fidelity funds (2004) and Executive Vice President of Risk Oversight for Fidelity Investments (2002). Previously, he served as Executive Vice President and Chief Operating Officer for Fidelity Investments Institutional Services Company, Inc. (1998 2002).
105 Annual Report
Trustees and Officers - continued
| Name, Age; Principal Occupation John R. Hebble (47) |
Year of Election or Appointment: 2005
Deputy Treasurer of International Small Cap Opportunities. Mr. Hebble also serves as Deputy Treasurer of other Fidelity funds (2003), and is an employee of FMR. Before joining Fidelity Investments, Mr. Hebble worked at Deutsche Asset Management where he served as Director of Fund Accounting (2002 2003) and Assistant Treasurer of the Scudder Funds (1998 2003).
| Bryan A. Mehrmann (44) |
Year of Election or Appointment: 2005
Deputy Treasurer of International Small Cap Opportunities. Mr. Mehr mann also serves as Deputy Treasurer of other Fidelity funds (2005 present) and is an employee of FMR. Previously, Mr. Mehrmann served as Vice President of Fidelity Investments Institutional Services Group (FIIS)/Fidelity Investments Institutional Operations Corporation, Inc. (FIIOC) Client Services (1998 2004).
| Kimberley H. Monasterio (41) |
Year of Election or Appointment: 2005
Deputy Treasurer of International Small Cap Opportunities. Ms. Mon asterio also serves as Deputy Treasurer of other Fidelity funds (2004) and is an employee of FMR (2004). Before joining Fidelity Investments, Ms. Monasterio served as Treasurer (2000 2004) and Chief Financial Officer (2002 2004) of the Franklin Templeton Funds and Senior Vice President of Franklin Templeton Services, LLC (2000 2004).
| Kenneth B. Robins (36) |
Year of Election or Appointment: 2005
Deputy Treasurer of International Small Cap Opportunities. Mr. Robins also serves as Deputy Treasurer of other Fidelity funds (2005 present) and is an employee of FMR (2004 present). Before joining Fidelity In vestments, Mr. Robins worked at KPMG LLP, where he was a partner in KPMG’s department of professional practice (2002 2004) and a Senior Manager (1999 2000). In addition, Mr. Robins served as Assistant Chief Accountant, United States Securities and Exchange Commission (2000 2002).
| Annual Report |
| 106 |
| Name, Age; Principal Occupation Robert G. Byrnes (38) |
Year of Election or Appointment: 2005
Assistant Treasurer of International Small Cap Opportunities. Mr. Byrnes also serves as Assistant Treasurer of other Fidelity funds (2005 present) and is an employee of FMR (2005 present). Previously, Mr. Byrnes served as Vice President of FPCMS (2003 2005). Before joining Fidelity Investments, Mr. Byrnes worked at Deutsche Asset Management where he served as Vice President of the Investment Operations Group (2000 2003).
| John H. Costello (59) |
Year of Election or Appointment: 2005
Assistant Treasurer of International Small Cap Opportunities. Mr. Costello also serves as Assistant Treasurer of other Fidelity funds and is an employee of FMR.
| Peter L. Lydecker (51) |
Year of Election or Appointment: 2005
Assistant Treasurer of International Small Cap Opportunities. Mr. Lydecker also serves as Assistant Treasurer of other Fidelity funds (2004) and is an employee of FMR.
| Mark Osterheld (50) |
Year of Election or Appointment: 2005
Assistant Treasurer of International Small Cap Opportunities. Mr. Oster held also serves as Assistant Treasurer of other Fidelity funds (2002) and is an employee of FMR.
| Gary W. Ryan (47) |
Year of Election or Appointment: 2005
Assistant Treasurer of International Small Cap Opportunities. Mr. Ryan also serves as Assistant Treasurer of other Fidelity funds (2005 present) and is an employee of FMR (2005 present). Previously, Mr. Ryan served as Vice President of Fund Reporting in FPCMS (1999 2005).
| Salvatore Schiavone (39) |
Year of Election or Appointment: 2005
Assistant Treasurer of International Small Cap Opportunities. Mr. Schiavone also serves as Assistant Treasurer of other Fidelity funds (2005 present) and is an employee of FMR (2005 present). Before join ing Fidelity Investments, Mr. Schiavone worked at Deutsche Asset Man agement, where he most recently served as Assistant Treasurer (2003 2005) of the Scudder Funds and Vice President and Head of Fund Reporting (1996 2003).
107 Annual Report
| Distributions |
The Board of Trustees of Fidelity International Small Cap Opportunities Fund voted to pay to shareholders of record at the opening of business on record date, the following distributions per share derived from capital gains realized from sales of portfolio securities, and dividends derived from net investment income:
| Pay Date | Record Date | Dividends | Capital Gains | |||||
| Fidelity International Small | 12/12/05 | 12/09/05 | — | $.003 | ||||
| Cap Opportunities Fund |
The fund will notify shareholders in January 2006 of amounts for use in preparing 2005 income tax returns.
| Annual Report |
| 108 |
Board Approval of Investment Advisory Contracts and Management Fees
Fidelity International Small Cap Opportunities Fund
On July 21, 2005, the Board of Trustees, including the independent Trustees (together, the Board), voted to approve the management contract and subadvisory agreements (together, the Advisory Contracts) for the fund. The Board, assisted by the advice of fund counsel and independent Trustees’ counsel, considered a broad range of information.
In determining whether to approve the Advisory Contracts for the fund, the Board was aware that shareholders have a broad range of investment choices available to them, including a wide choice among mutual funds offered by competitors to Fidelity, and that shareholders, with the opportunity to review and weigh the disclosure provided by the fund in its prospectus and other public disclosures, may choose to invest in this fund, managed by Fidelity.
Nature, Extent, and Quality of Services Provided by Fidelity. The Board consid ered staffing within the investment adviser, FMR, and the sub advisers (together, the Investment Advisers), including the background of the fund’s portfolio manager and the fund’s investment objective and discipline.
Fidelity Resources Dedicated to Investment Management and Support Services. The Board considered Fidelity’s extensive global research capabilities that enable the Investment Advisers to aggregate data from various sources in an effort to produce positive investment results. The Board noted that Fidelity’s analysts have access to a variety of technological tools that enable them to perform both fundamental and quanti tative analysis and to specialize in various disciplines. The Board also considered that Fidelity’s portfolio managers and analysts have access to daily portfolio attribution that allows for monitoring of a fund’s portfolio, as well as an electronic communication system that provides immediate real time access to research concerning issuers and credit enhancers.
Shareholder and Administrative Services. The Board considered the nature, extent, quality, and cost of administrative, distribution, and shareholder services performed by the Investment Advisers and their affiliates under the Advisory Contracts and under separate agreements covering transfer agency, pricing and bookkeeping, and securities lending services for the fund. The Board also considered the nature and extent of the Investment Advisers’ supervision of third party service providers, principally custodians and subcustodians.
The Board noted that the growth of fund assets across the complex allows Fidelity to reinvest in the development of services designed to enhance the value or convenience of the Fidelity funds as investment vehicles. These services include 24 hour access to account information and market information through phone representatives and over the Internet, and investor education materials and asset allocation tools.
109 Annual Report
Board Approval of Investment Advisory Contracts and Management Fees continued
Investment in a Large Fund Family. The Board considered the benefits to shareholders of investing in a Fidelity fund, including the benefits of investing in a fund that is part of a large family of funds offering a variety of investment disciplines and providing for a large variety of mutual fund investor services. For example, fund shareholders are offered the privilege of exchanging shares of the fund for shares of other Fidelity funds, as set forth in the fund’s prospectus, without paying an additional sales charge.
Investment Performance. Fidelity International Small Cap Opportunities Fund is a new fund and therefore had no historical performance for the Board to review at the time it approved the fund’s Advisory Contracts.
The Board considered that the fund’s management fee is subject to upward or downward adjustment depending upon whether, and to what extent, the fund’s investment perfor mance for the performance period exceeds, or is exceeded by, the record (over the same period) of a Board approved performance adjustment index. The Board realizes that the performance adjustment provides FMR with a strong economic incentive to seek to achieve superior performance for the fund’s shareholders and helps to more closely align the interests of FMR and the fund’s shareholders.
Based on its review, the Board concluded that the nature, extent, and quality of the services provided by Fidelity will benefit the fund’s shareholders, particularly in light of the Board’s view that the fund’s shareholders benefit from investing in a fund that is part of a large family of funds offering a variety of investment disciplines and services.
Competitiveness of Management Fee and Total Fund Expenses. The Board considered the fund’s proposed management fee and projected total operating expenses in reviewing the Advisory Contracts. The Board noted that the fund’s proposed manage ment fee rate is lower than the median fee rate of funds with similar Lipper investment objective categories and comparable management fee characteristics. The Board also considered that the projected total operating expenses are comparable to those of similar classes and funds that Fidelity offers to shareholders.
Based on its review, the Board concluded that the fund’s management fee and the total expenses for each class of the fund were fair and reasonable in light of the services that the fund and its shareholders receive and the other factors considered.
Costs of the Services and Profitability. The fund is a new fund and therefore no revenue, cost, or profitability data was available for the Board to review in respect of the fund at the time it approved the Advisory Contracts.
Economies of Scale. The Board considered the extent to which the fund will benefit from economies of scale through increased services to the fund, through waivers or reimbursements, or through fee or expense reductions, including reductions that occur through operation of the transfer agent agreement. The transfer agent fee varies in part
| Annual Report |
| 110 |
based on the number of accounts in the fund. If the number of accounts decreases or the average account size increases, the overall transfer agent fee rate decreases.
The Board recognized that the fund’s management contract incorporates a “group fee” structure, which provides for lower fee rates as total fund assets under FMR’s manage ment increase, and for higher fee rates as total fund assets under FMR’s management decrease. The Board considered that the group fee is designed to deliver the benefits of economies of scale to fund shareholders when total fund assets increase, even if assets of any particular fund are unchanged or have declined, because some portion of Fidelity’s costs are attributable to services provided to all Fidelity funds, and all funds benefit if those costs can be allocated among more assets.
The Board concluded that, given the group fee structure, fund shareholders will achieve a certain level of economies of scale as assets under FMR’s management increase at the fund complex level, regardless of whether Fidelity achieves any such economies of scale.
Based on its evaluation of all of the conclusions noted above, and after considering all material factors, the Board ultimately concluded that the advisory fee structures are fair and reasonable, and that the fund’s Advisory Contracts should be approved.
111 Annual Report
| Investment Adviser Fidelity Management & Research Company Boston, MA Investment Sub Advisers FMR Co., Inc. Fidelity Management & Research (Far East) Inc. Fidelity Management & Research (U.K.) Inc. Fidelity Investments Japan Limited Fidelity International Investment Advisors Fidelity International Investment Advisors (U.K.) Limited General Distributor Fidelity Distributors Corporation Boston, MA Transfer and Service Agent Fidelity Service Company, Inc. Boston, MA Custodian The Northern Trust Company Chicago, IL |
| The Fidelity Telephone Connection | ||
| Mutual Fund 24-Hour Service | ||
| Exchanges/Redemptions | ||
| and Account Assistance | 1-800-544-6666 | |
| Product Information | 1-800-544-6666 | |
| Retirement Accounts | 1-800-544-4774 | |
| (8 a.m. - 9 p.m.) | ||
| TDD Service | 1-800-544-0118 | |
| for the deaf and hearing impaired | ||
| (9 a.m. - 9 p.m. Eastern time) | ||
| Fidelity Automated Service | ||
| Telephone (FAST®) (automated phone logo) | 1-800-544-5555 | |
| (automated phone logo) Automated line for quickest service | ||
| ILS-UANN-1205 1.815061.101 |


| Fidelity Advisor International Small Cap Opportunities Fund - Class A, Class T, Class B and Class C |
| Annual Report October 31, 2005 |

Class A, Class T, Class B and Class C are classes of Fidelity® International Small Cap Opportunities Fund
| Contents | ||||
| Chairman’s Message | 4 | Ned Johnson’s message to shareholders. | ||
| Shareholder Expense | 5 | An example of shareholder expenses. | ||
| Example | ||||
| Investment Summary | 7 | A summary of the fund’s investments. | ||
| Investments | 9 | A complete list of the fund’s investments | ||
| with their market values. | ||||
| Financial Statements | 15 | Statements of assets and liabilities, | ||
| operations, and changes in net assets, | ||||
| as well as financial highlights. | ||||
| Notes | 25 | Notes to the financial statements. | ||
| Report of Independent | 33 | |||
| Registered Public | ||||
| Accounting Firm | ||||
| Trustees and Officers | 34 | |||
| Distributions | 45 | |||
| Board Approval of | 46 | |||
| Investment Advisory | ||||
| Contracts and | ||||
| Management Fees | ||||
| To view a fund’s proxy voting guidelines and proxy voting record for the 12 month period ended June 30, visit www.fidelity.com/proxyvotingresults or visit the Securities and Exchange Commis sion’s (SEC) web site at www.sec.gov. You may also call 1-877-208-0098 to request a free copy of the proxy voting guidelines. Standard & Poor’s, S&P and S&P 500 are registered service marks of The McGraw Hill Companies, Inc. and have been licensed for use by Fidelity Distributors Corporation. Other third party marks appearing herein are the property of their respective owners. All other marks appearing herein are registered or unregistered trademarks or service marks of FMR Corp. or an affiliated company. |
| Annual Report |
| 2 |
| This report and the financial statements contained herein are submitted for the general information of the shareholders of the fund. This report is not authorized for distribution to prospective investors in the fund unless preceded or accompanied by an effective prospectus. A fund files its complete schedule of portfolio holdings with the SEC for the first and third quarters of each fiscal year on Form N Q. Forms N Q are available on the SEC’s web site at http://www.sec.gov. A fund’s Forms N Q may be reviewed and copied at the SEC’s Public Reference Room in Washington, DC. Information regarding the operation of the SEC’s Public Reference Room may be obtained by calling 1-800-SEC-0330. For a complete list of a fund’s portfolio hold ings, view the most recent quarterly holdings report, semiannual report, or annual report on Fidelity’s web site at http://www.advisor.fidelity.com. NOT FDIC INSURED · MAY LOSE VALUE · NO BANK GUARANTEE Neither the fund nor Fidelity Distributors Corporation is a bank. |
3 Annual Report
Chairman’s Message
(photograph of Edward C. Johnson 3d)
Dear Shareholder:
During the past year or so, much has been reported about the mutual fund industry, and much of it has been more critical than I believe is warranted. Allegations that some companies have been less than forthright with their shareholders have cast a shadow on the entire industry. I continue to find these reports disturbing, and assert that they do not create an accurate picture of the industry overall. Therefore, I would like to remind every one where Fidelity stands on these issues. I will say two things specifically regarding allegations that some mutual fund companies were in violation of the Securities and Exchange Commission’s forward pricing rules or were involved in so called “market timing” activities.
First, Fidelity has no agreements that permit customers who buy fund shares after 4 p.m. to obtain the 4 p.m. price. This is not a new policy. This is not to say that some one could not deceive the company through fraudulent acts. However, we are extremely diligent in preventing fraud from occurring in this manner and in every other. But I underscore again that Fidelity has no so called “agreements” that sanction illegal practices.
Second, Fidelity continues to stand on record, as we have for years, in opposition to predatory short term trading that adversely affects shareholders in a mutual fund. Back in the 1980s, we initiated a fee which is returned to the fund and, therefore, to investors to discourage this activity. Further, we took the lead several years ago in developing a Fair Value Pricing Policy to prevent market timing on foreign securities in our funds. I am confident we will find other ways to make it more difficult for predatory traders to op erate. However, this will only be achieved through close cooperation among regulators, legislators and the industry.
Yes, there have been unfortunate instances of unethical and illegal activity within the mutual fund industry from time to time. That is true of any industry. When this occurs, confessed or convicted offenders should be dealt with appropriately. But we are still concerned about the risk of over regulation and the quick application of simplistic solutions to intricate problems. Every system can be improved, and we support and applaud well thought out improvements by regulators, legislators and industry representatives that achieve the common goal of building and protecting the value of investors’ holdings.
For nearly 60 years, Fidelity has worked very hard to improve its products and service to justify your trust. When our family founded this company in 1946, we had only a few hundred customers. Today, we serve more than 18 million customers in cluding individual investors and participants in retirement plans across America.
Let me close by saying that we do not take your trust in us for granted, and we realize that we must always work to improve all aspects of our service to you. In turn, we urge you to continue your active participation with your financial matters, so that your interests can be well served.
Best regards,
/s/ Edward C. Johnson 3d
Edward C. Johnson 3d
Annual Report 4
Shareholder Expense Example
As a shareholder of the Fund, you incur two types of costs: (1) transaction costs, including sales charges (loads) on purchase payments or redemption proceeds, redemption fees, and (2) ongoing costs, including management fees, distribution and/or service (12b 1) fees and other Fund expenses. This Example is intended to help you understand your ongoing costs (in dollars) of investing in the Fund and to compare these costs with the ongoing costs of investing in other mutual funds.
The actual expense Example is based on an investment of $1,000 invested at the beginning of the period and held for the entire period (August 2, 2005 to October 31, 2005). The hypothetical expense Example is based on an investment of $1,000 invested for the one half year period (May 1, 2005 to October 31, 2005).
| Actual Expenses |
The first line of the table below for each class of the Fund provides information about actual account values and actual expenses. You may use the information in this line, together with the amount you invested, to estimate the expenses that you paid over the period. Simply divide your account value by $1,000.00 (for example, an $8,600 account value divided by $1,000.00 = 8.6), then multiply the result by the number in the first line for a class of the Fund under the heading entitled “Expenses Paid During Period” to estimate the expenses you paid on your account during this period.
Hypothetical Example for Comparison Purposes
The second line of the table below for each class of the Fund provides information about hypothetical account values and hypothetical expenses based on a Class’ actual expense ratio and an assumed rate of return of 5% per year before expenses, which is not the Class’ actual return. The hypothetical account values and expenses may not be used to estimate the actual ending account balance or expenses you paid for the period. You may use this information to compare the ongoing costs of investing in the Fund and other funds. To do so, compare this 5% hypothetical example with the 5% hypothetical examples that appear in the shareholder reports of the other funds.
5 Annual Report
Shareholder Expense Example continued
Please note that the expenses shown in the table are meant to highlight your ongoing costs only and do not reflect any transaction costs. Therefore, the second line of the table is useful in comparing ongoing costs only, and will not help you determine the relative total costs of owning different funds. In addition, if these transactional costs were included, your costs would have been higher.
| Ending | ||||||||||||
| Beginning | Account Value | Expenses Paid | ||||||||||
| Account Value | October 31, 2005 | During Period | ||||||||||
| Class A | ||||||||||||
| Actual | $ | 1,000.00 | $ | 1,041.00 | $ | 4.20B | ||||||
| HypotheticalA | $ | 1,000.00 | $ | 1,016.89 | $ | 8.39C | ||||||
| Class T | ||||||||||||
| Actual | $ | 1,000.00 | $ | 1,038.00 | $ | 4.83B | ||||||
| HypotheticalA | $ | 1,000.00 | $ | 1,015.63 | $ | 9.65C | ||||||
| Class B | ||||||||||||
| Actual | $ | 1,000.00 | $ | 1,037.00 | $ | 6.09B | ||||||
| HypotheticalA | $ | 1,000.00 | $ | 1,013.11 | $ | 12.18C | ||||||
| Class C | ||||||||||||
| Actual | $ | 1,000.00 | $ | 1,037.00 | $ | 6.09B | ||||||
| HypotheticalA | $ | 1,000.00 | $ | 1,013.11 | $ | 12.18C | ||||||
| Fidelity International Small Cap | ||||||||||||
| Opportunities Fund | ||||||||||||
| Actual | $ | 1,000.00 | $ | 1,040.00 | $ | 3.56B | ||||||
| HypotheticalA | $ | 1,000.00 | $ | 1,018.15 | $ | 7.12C | ||||||
| Institutional Class | ||||||||||||
| Actual | $ | 1,000.00 | $ | 1,040.00 | $ | 3.56B | ||||||
| HypotheticalA | $ | 1,000.00 | $ | 1,018.15 | $ | 7.12C |
| A 5% return per year before expenses B Actual expenses are equal to each Class’ annualized expense ratio (shown in the |
| table below); multiplied by the average account value over the period, multiplied by 91/365 (to reflect the period August 2, 2005 to October 31, 2005). C Hypothetical expenses are equal to each Class’ annualized expense ratio (shown in the table below); multiplied by the average account value over the period, multiplied by 184/365 (to reflect the one half year period). |
| Annualized | ||
| Expense Ratio | ||
| Class A | 1.65% | |
| Class T | 1.90% | |
| Class B | 2.40% | |
| Class C | 2.40% | |
| Fidelity International Small Cap Opportunities Fund | 1.40% | |
| Institutional Class | 1.40% |
| Annual Report |
| 6 |
Investment Summary
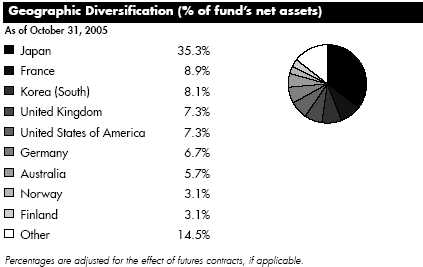
| Asset Allocation | ||
| % of | ||
| net assets | ||
| Stocks | 100.6 | |
| Net Other Assets | (0.6) | |
| Top Ten Stocks as of October 31, 2005 | ||
| % of | ||
| net assets | ||
| CSL Ltd. (Australia, Biotechnology) | 2.1 | |
| Neopost SA (France, Office Electronics) | 2.0 | |
| NTL, Inc. (United States of America, Media) | 2.0 | |
| Alstom SA (France, Electrical Equipment) | 1.7 | |
| Orion Corp. (Korea (South), Food Products) | 1.6 | |
| Ryohin Keikaku Co. Ltd. (Japan, Multiline Retail) | 1.5 | |
| KCI Konecranes Oyj (Finland, Machinery) | 1.4 | |
| Teijin Ltd. (Japan, Chemicals) | 1.4 | |
| PMP Ltd. (Australia, Commercial Services & Supplies) | 1.4 | |
| Motech Industries, Inc. (Taiwan, Electrical Equipment) | 1.4 | |
| 16.5 |
7 Annual Report
| Investments continued | ||
| Market Sectors as of October 31, 2005 | ||
| % of fund’s | ||
| net assets | ||
| Industrials | 26.5 | |
| Consumer Discretionary | 17.0 | |
| Materials | 12.4 | |
| Information Technology | 12.1 | |
| Financials | 12.0 | |
| Energy | 10.5 | |
| Consumer Staples | 5.9 | |
| Health Care | 3.8 | |
| Telecommunication Services | 0.4 | |
| Annual Report |
| 8 |
| Investments October 31, 2005 | ||||||
| Showing Percentage of Net Assets | ||||||
| Common Stocks 100.6% | ||||||
| Shares | Value (Note 1) | |||||
| Australia – 5.7% | ||||||
| ABC Learning Centres Ltd. | 230,000 | $ | 1,117,886 | |||
| Bradken Ltd. | 179,061 | 502,098 | ||||
| Computershare Ltd. | 241,800 | 1,184,279 | ||||
| CSL Ltd. | 158,300 | 4,438,824 | ||||
| Downer EDI Ltd. | 451,175 | 2,051,186 | ||||
| PMP Ltd. (a) | 2,516,300 | 2,963,462 | ||||
| TOTAL AUSTRALIA | 12,257,735 | |||||
| Austria – 0.1% | ||||||
| IMMOFINANZ Immobilien Anlagen AG (a) | 21,900 | 211,859 | ||||
| Bermuda – 0.8% | ||||||
| China Lotsynergy Holding Ltd. (a) | 4,390,000 | 1,444,060 | ||||
| Paul Y. Engineering Group Ltd. | 2,386,000 | 215,451 | ||||
| TOTAL BERMUDA | 1,659,511 | |||||
| Canada 0.2% | ||||||
| Oilexco, Inc. (a) | 106,500 | 360,711 | ||||
| China – 1.1% | ||||||
| China Sun Bio-chem Technology Group Co. Ltd. | 661,000 | 171,704 | ||||
| Global Bio-Chem Technology Group Co. Ltd. | 5,723,300 | 2,270,243 | ||||
| TOTAL CHINA | 2,441,947 | |||||
| Finland – 3.1% | ||||||
| KCI Konecranes Oyj | 69,650 | 3,026,619 | ||||
| Metso Corp. | 81,800 | 2,127,853 | ||||
| Neste Oil Oyj | 44,600 | 1,382,051 | ||||
| TOTAL FINLAND | 6,536,523 | |||||
| France – 8.9% | ||||||
| Alstom SA (a) | 74,962 | 3,593,529 | ||||
| BVRP Software SA (a) | 16,300 | 381,413 | ||||
| Compagnie Generale de Geophysique SA (a) | 25,000 | 2,180,227 | ||||
| Elior SA | 140,000 | 1,825,936 | ||||
| Infovista SA (a) | 68,700 | 383,770 | ||||
| Neopost SA | 45,100 | 4,352,122 | ||||
| Nexity | 27,693 | 1,264,473 | ||||
| Silicon On Insulator Technologies SA (SOITEC) (a) | 139,200 | 2,084,156 | ||||
| Vallourec SA | 6,500 | 2,921,953 | ||||
| TOTAL FRANCE | 18,987,579 | |||||
| Germany – 6.7% | ||||||
| CeWe Color Holding AG | 28,800 | 1,525,961 | ||||
| See accompanying notes which are an integral part of the financial statements. | ||||||
| 9 | Annual Report | |||||
| Investments continued | ||||||
| Common Stocks continued | ||||||
| Shares | Value (Note 1) | |||||
| Germany – continued | ||||||
| ESCADA AG (a) | 25,000 | $ | 635,338 | |||
| Fielmann AG | 4,500 | 307,210 | ||||
| Fresenius AG | 4,800 | 619,073 | ||||
| MTU Aero Engines Holding AG | 92,600 | 2,691,853 | ||||
| Muehlbauer Holding AG & Co. | 7,400 | 340,814 | ||||
| Norddeutsche Affinerie AG | 6,500 | 139,085 | ||||
| Rheinmetall AG | 6,400 | 393,804 | ||||
| Salzgitter AG | 30,000 | 1,313,351 | ||||
| SolarWorld AG | 20,000 | 2,702,462 | ||||
| Techem AG (a) | 27,000 | 1,074,560 | ||||
| United Internet AG | 77,400 | 2,500,509 | ||||
| TOTAL GERMANY | 14,244,020 | |||||
| Hong Kong – 1.5% | ||||||
| Burwill Holdings Ltd. | 2,482,000 | 192,103 | ||||
| Hanny Holdings Ltd. | 2,018,402 | 1,132,603 | ||||
| Hengan International Group Co. Ltd. | 313,400 | 291,080 | ||||
| PYI Corp. Ltd. | 5,333,752 | 1,018,299 | ||||
| Techtronic Industries Co. Ltd. | 214,500 | 527,112 | ||||
| TOTAL HONG KONG | 3,161,197 | |||||
| Ireland – 0.1% | ||||||
| DEPFA BANK PLC | 10,700 | 166,746 | ||||
| Italy 1.0% | ||||||
| Banca Italease Spa | 98,100 | 2,075,476 | ||||
| Japan 35.3% | ||||||
| Aeon Co. Ltd. | 55,800 | 1,159,769 | ||||
| Aoyama Trading Co. Ltd. | 16,400 | 494,253 | ||||
| Argo Graphics, Inc. | 46,400 | 1,084,946 | ||||
| Asics Corp. | 43,000 | 370,898 | ||||
| Bals Corp. | 291 | 937,480 | ||||
| Bank of Nagoya Ltd. | 153,000 | 1,381,981 | ||||
| Capcom Co. Ltd. | 22,500 | 226,810 | ||||
| Chiyoda Corp. | 100,000 | 1,727,703 | ||||
| Chiyoda Integre Co. Ltd. | 60,400 | 1,532,607 | ||||
| Daikin Industries Ltd. | 39,900 | 1,043,533 | ||||
| E*TRADE Securities Co. Ltd. | 285 | 1,498,165 | ||||
| EDION Corp. | 160,000 | 2,520,455 | ||||
| Excite Japan Co. Ltd | 138 | 838,962 | ||||
| Fujikura Ltd. | 175,000 | 1,133,616 | ||||
| Hitachi Metals Ltd. | 212,000 | 2,182,951 | ||||
| Hokuhoku Financial Group, Inc. | 436,000 | 1,808,624 | ||||
See accompanying notes which are an integral part of the financial statements.
| Annual Report |
| 10 |
| Common Stocks continued | ||||||
| Shares | Value (Note 1) | |||||
| Japan – continued | ||||||
| Hokuto Corp. | 8,200 | $ | 133,079 | |||
| Ibiden Co. Ltd. | 23,700 | 960,551 | ||||
| Ichiyoshi Securities Co. Ltd. | 267,200 | 2,869,355 | ||||
| Intelligent Wave, Inc. | 845 | 2,802,733 | ||||
| Isuzu Motors Ltd. | 250,000 | 976,434 | ||||
| Japan Steel Works Ltd | 162,000 | 580,820 | ||||
| JGC Corp. | 141,000 | 2,309,069 | ||||
| Joint Corp. | 22,700 | 1,234,559 | ||||
| JSR Corp. | 69,600 | 1,648,514 | ||||
| Kayaba Industry Co. Ltd. | 196,000 | 775,708 | ||||
| Miraial Co. Ltd. | 28,700 | 2,440,729 | ||||
| Mitsui Engineering & Shipbuilding Co. | 599,000 | 1,442,108 | ||||
| Mitsui Mining & Smelting Co. Ltd. | 380,000 | 2,171,970 | ||||
| Modec, Inc. | 45,300 | 1,278,916 | ||||
| Nabtesco Corp. | 132,000 | 1,112,277 | ||||
| NGK Insulators Ltd. | 81,000 | 968,735 | ||||
| NGK Spark Plug Co. Ltd. | 66,000 | 1,062,550 | ||||
| Nifco, Inc. | 25,000 | 421,750 | ||||
| Nisshin Fudosan Co. Ltd. | 119,900 | 1,769,355 | ||||
| Nissin Co. Ltd. | 386,600 | 562,467 | ||||
| Nissin Co. Ltd. New | 323,600 | 465,203 | ||||
| Omron Corp. | 26,500 | 627,667 | ||||
| Ryohin Keikaku Co. Ltd. | 46,900 | 3,127,446 | ||||
| Saint Marc Co. Ltd. | 2,600 | 131,721 | ||||
| Sammy NetWorks Co. Ltd. | 46 | 577,633 | ||||
| Sega Sammy Holdings, Inc. | 11,200 | 403,494 | ||||
| Sega Sammy Holdings, Inc. New | 22,400 | 812,809 | ||||
| Seiyu Ltd. (a) | 795,000 | 1,631,705 | ||||
| SFCG Co. Ltd. | 990 | 239,117 | ||||
| Sugi Pharmacy Co. Ltd. | 49,200 | 1,908,839 | ||||
| Sumisho Lease Co. Ltd. | 5,400 | 257,207 | ||||
| Sumitomo Titanium Corp. New | 5,100 | 574,169 | ||||
| Take & Give Needs Co. Ltd. (a) | 2,000 | 2,805,894 | ||||
| Techmatrix Corp. | 128 | 279,342 | ||||
| Teijin Ltd | 500,000 | 2,987,757 | ||||
| Telewave, Inc. | 46 | 268,898 | ||||
| The Sumitomo Warehouse Co. Ltd. | 200,000 | 1,555,366 | ||||
| Toho Tenax Co. Ltd. (a) | 313,000 | 1,263,154 | ||||
| Tokuyama Corp. | 93,000 | 926,205 | ||||
| Tokyo Seimitsu Co. Ltd. | 8,400 | 386,278 | ||||
| Tokyu Land Corp. | 120,000 | 955,043 | ||||
| Toray Industries, Inc. | 200,000 | 1,115,429 | ||||
See accompanying notes which are an integral part of the financial statements.
11 Annual Report
| Investments continued | ||||||
| Common Stocks continued | ||||||
| Shares | Value (Note 1) | |||||
| Japan – continued | ||||||
| UFJ Central Leasing Co. Ltd. | 11,200 | $ | 622,701 | |||
| Venture Link Co. Ltd. (a) | 960,300 | 2,852,510 | ||||
| Yasuragi Co. Ltd. (a) | 26,100 | 881,518 | ||||
| Yuraku Real Estate Co. Ltd. | 56,000 | 326,869 | ||||
| TOTAL JAPAN | 75,448,406 | |||||
| Korea (South) 8.1% | ||||||
| Daewoo Securities Co. Ltd. (a) | 242,110 | 2,608,943 | ||||
| Hyundai Department Store Co. Ltd. | 20,090 | 1,333,560 | ||||
| Hyundai Mipo Dockyard Co. Ltd. | 27,350 | 1,689,726 | ||||
| Korea Investment Holdings Co. Ltd. | 103,090 | 2,646,371 | ||||
| LG Card Co. Ltd. (a) | 53,290 | 1,924,360 | ||||
| Orion Corp. | 17,322 | 3,359,869 | ||||
| Shinhan Financial Group Co. Ltd. | 83,240 | 2,774,665 | ||||
| Yedang Entertainment Co. Ltd. (a) | 65,000 | 1,008,620 | ||||
| TOTAL KOREA (SOUTH) | 17,346,114 | |||||
| Luxembourg 0.2% | ||||||
| Stolt-Nielsen SA | 15,000 | 527,974 | ||||
| Mexico – 0.8% | ||||||
| Grupo Mexico SA de CV Series B | 933,120 | 1,800,318 | ||||
| Netherlands – 1.4% | ||||||
| Fugro NV (Certificaten Van Aandelen) unit | 72,700 | 1,964,341 | ||||
| Koninklijke Boskalis Westminster NV (Certificaten Van | ||||||
| Aandelen) | 19,300 | 958,982 | ||||
| TOTAL NETHERLANDS | 2,923,323 | |||||
| Norway 3.1% | ||||||
| Det Norske Oljeselskap ASA (DNO) (A Shares) | 422,100 | 2,069,627 | ||||
| Fred Olsen Energy ASA (a) | 75,400 | 2,080,280 | ||||
| Norse Energy Corp. ASA (a) | 686,000 | 362,718 | ||||
| Petroleum Geo-Services ASA (a) | 52,800 | 1,339,072 | ||||
| Schibsted ASA (B Shares) | 24,600 | 708,961 | ||||
| TOTAL NORWAY | 6,560,658 | |||||
| Poland – 0.0% | ||||||
| Powszechna Kasa Oszczednosci Bank SA | 3,900 | 32,793 | ||||
| Singapore – 0.6% | ||||||
| STATS ChipPAC Ltd. (a) | 2,364,000 | 1,297,943 | ||||
| South Africa 0.5% | ||||||
| Steinhoff International Holdings Ltd. | 448,000 | 1,172,411 | ||||
See accompanying notes which are an integral part of the financial statements.
| Annual Report |
| 12 |
| Common Stocks continued | ||||||
| Shares | Value (Note 1) | |||||
| Sweden – 3.1% | ||||||
| Boliden AB (a) | 501,000 | $ | 2,561,147 | |||
| Eniro AB | 111,300 | 1,216,233 | ||||
| Gambro AB (B Shares) | 42,600 | 599,280 | ||||
| International Business Systems AB (IBS) (B Shares) (a) | 69,000 | 173,333 | ||||
| Lindex AB | 36,500 | 1,771,923 | ||||
| Modern Times Group AB (MTG) (B Shares) (a) | 5,050 | 193,144 | ||||
| TOTAL SWEDEN | 6,515,060 | |||||
| Switzerland – 1.3% | ||||||
| Actelion Ltd. (Reg.) (a) | 19,913 | 2,239,759 | ||||
| Phonak Holding AG | 5,608 | 233,821 | ||||
| Sika AG (Bearer) | 533 | 379,548 | ||||
| TOTAL SWITZERLAND | 2,853,128 | |||||
| Taiwan 1.6% | ||||||
| Chipbond Technology Corp. | 376,000 | 487,489 | ||||
| Motech Industries, Inc. | 269,000 | 2,934,414 | ||||
| TOTAL TAIWAN | 3,421,903 | |||||
| Turkey 0.8% | ||||||
| Tupras Turkiye Petrol Rafinerileri AS | 100,000 | 1,709,212 | ||||
| United Kingdom – 7.3% | ||||||
| AMEC PLC | 122,600 | 740,165 | ||||
| British Land Co. PLC | 59,200 | 932,815 | ||||
| Burren Energy PLC | 100,000 | 1,416,360 | ||||
| Carillion PLC | 83,000 | 407,779 | ||||
| Development Securities PLC | 37,100 | 301,817 | ||||
| Hunting PLC | 500,000 | 2,525,104 | ||||
| Inchcape PLC | 33,000 | 1,203,552 | ||||
| Informa PLC | 12,200 | 80,836 | ||||
| ITE Group PLC | 154,700 | 309,494 | ||||
| London Clubs International PLC (a) | 70,200 | 151,007 | ||||
| Meggitt PLC | 466,200 | 2,496,786 | ||||
| Rank Group PLC | 32,700 | 171,365 | ||||
| Richmond Foods PLC | 195,300 | 1,772,066 | ||||
| Sportingbet PLC | 544,701 | 2,840,058 | ||||
| Stanley Leisure PLC | 8,373 | 89,982 | ||||
| Urban Dining PLC (a) | 116,100 | 81,192 | ||||
| TOTAL UNITED KINGDOM | 15,520,378 | |||||
| United States of America – 7.3% | ||||||
| Airgas, Inc. | 85,100 | 2,405,777 | ||||
See accompanying notes which are an integral part of the financial statements.
13 Annual Report
| Investments continued | ||||||||
| Common Stocks continued | ||||||||
| Shares | Value (Note 1) | |||||||
| United States of America – continued | ||||||||
| Covad Communications Group, Inc. (a) | 984,000 | $ | 875,760 | |||||
| NTL, Inc. (a) | 70,100 | 4,298,532 | ||||||
| Oil States International, Inc. (a) | 15,200 | 503,120 | ||||||
| Plains Exploration & Production Co. (a) | 72,500 | 2,827,500 | ||||||
| RTI International Metals, Inc. (a) | 51,500 | 1,726,280 | ||||||
| Titanium Metals Corp. (a) | 62,000 | 2,926,400 | ||||||
| TOTAL UNITED STATES OF AMERICA | 15,563,369 | |||||||
| TOTAL COMMON STOCKS | ||||||||
| (Cost $213,598,275) | 214,796,294 | |||||||
| TOTAL INVESTMENT PORTFOLIO 100.6% | ||||||||
| (Cost $213,598,275) | 214,796,294 | |||||||
| NET OTHER ASSETS – (0.6)% | (1,339,807) | |||||||
| NET ASSETS 100% | $ | 213,456,487 | ||||||
| Legend (a) Non-income producing |
Income Tax Information
At October 31, 2005, the fund had a capital loss carryforward of approximately $3,072,229 all of which will expire on October 31, 2013.
See accompanying notes which are an integral part of the financial statements.
| Annual Report |
| 14 |
| Financial Statements | ||||||||
| Statement of Assets and Liabilities | ||||||||
| October 31, 2005 | ||||||||
| Assets | ||||||||
| Investment in securities, at value (cost $213,598,275) | ||||||||
| See accompanying schedule | $ | 214,796,294 | ||||||
| Foreign currency held at value (cost $11,965) | 11,965 | |||||||
| Receivable for investments sold | 11,394,843 | |||||||
| Receivable for fund shares sold | 3,250,912 | |||||||
| Dividends receivable | 95,243 | |||||||
| Interest receivable | 13,037 | |||||||
| Prepaid expenses | 65,808 | |||||||
| Receivable from investment adviser for expense | ||||||||
| reductions | 112,637 | |||||||
| Other affiliated receivables | 609 | |||||||
| Other receivables | 26,122 | |||||||
| Total assets | 229,767,470 | |||||||
| Liabilities | ||||||||
| Payable to custodian bank | $ | 1,588,751 | ||||||
| Payable for investments purchased | 14,257,737 | |||||||
| Payable for fund shares redeemed | 38,935 | |||||||
| Accrued management fee | 137,069 | |||||||
| Distribution fees payable | 5,670 | |||||||
| Other affiliated payables | 51,769 | |||||||
| Other payables and accrued expenses | 231,052 | |||||||
| Total liabilities | 16,310,983 | |||||||
| Net Assets | $ | 213,456,487 | ||||||
| Net Assets consist of: | ||||||||
| Paid in capital | $ | 215,542,869 | ||||||
| Undistributed net investment income | 25,213 | |||||||
| Accumulated undistributed net realized gain (loss) on | ||||||||
| investments and foreign currency transactions | (3,306,615) | |||||||
| Net unrealized appreciation (depreciation) on | ||||||||
| investments and assets and liabilities in foreign | ||||||||
| currencies | 1,195,020 | |||||||
| Net Assets | $ | 213,456,487 | ||||||
See accompanying notes which are an integral part of the financial statements.
15 Annual Report
| Financial Statements continued | ||||||||
| Statement of Assets and Liabilities continued | ||||||||
| October 31, 2005 | ||||||||
| Calculation of Maximum Offering Price | ||||||||
| Class A: | ||||||||
| Net Asset Value and redemption price per share | ||||||||
| ($5,532,847 ÷ 531,609 shares) | $ | 10.41 | ||||||
| Maximum offering price per share (100/94.25 of | ||||||||
| $10.41) | $ | 11.05 | ||||||
| Class T: | ||||||||
| Net Asset Value and redemption price per share | ||||||||
| ($2,704,469 ÷ 260,435 shares) | $ | 10.38 | ||||||
| Maximum offering price per share (100/96.50 of | ||||||||
| $10.38) | $ | 10.76 | ||||||
| Class B: | ||||||||
| Net Asset Value and offering price per share | ||||||||
| ($1,704,690 ÷ 164,338 shares)A | $ | 10.37 | ||||||
| Class C: | ||||||||
| Net Asset Value and offering price per share | ||||||||
| ($3,316,682 ÷ 319,752 shares)A | $ | 10.37 | ||||||
| Fidelity International Small Cap Opportunities | ||||||||
| Fund: | ||||||||
| Net Asset Value, offering price and redemption | ||||||||
| price per share ($197,348,717 ÷ 18,973,897 | ||||||||
| shares) | $ | 10.40 | ||||||
| Institutional Class: | ||||||||
| Net Asset Value, offering price and redemption | ||||||||
| price per share ($2,849,082 ÷ 274,003 | ||||||||
| shares) | $ | 10.40 | ||||||
| A Redemption price per share is equal to net asset value less any applicable contingent deferred sales charge. | ||||||||
| See accompanying notes which are an integral part of the financial statements. | ||||||||
| Annual Report | 16 | |||||||
| Statement of Operations | ||||||
| August 2, 2005 (commencement of operations) to October 31, 2005 | ||||||
| Investment Income | ||||||
| Dividends | $ | 333,348 | ||||
| Interest | 61,715 | |||||
| 395,063 | ||||||
| Less foreign taxes withheld | (14,276) | |||||
| Total income | 380,787 | |||||
| Expenses | ||||||
| Management fee | $ | 227,382 | ||||
| Transfer agent fees | 85,754 | |||||
| Distribution fees | 11,741 | |||||
| Accounting fees and expenses | 14,376 | |||||
| Independent trustees’ compensation | 42 | |||||
| Custodian fees and expenses | 131,764 | |||||
| Registration fees | 89,351 | |||||
| Audit | 46,278 | |||||
| Miscellaneous | 1,050 | |||||
| Total expenses before reductions | 607,738 | |||||
| Expense reductions | (252,181) | 355,557 | ||||
| Net investment income (loss) | 25,230 | |||||
| Realized and Unrealized Gain (Loss) | ||||||
| Net realized gain (loss) on: | ||||||
| Investment securities (net of foreign taxes of $6,741) . | (3,249,999) | |||||
| Foreign currency transactions | (56,633) | |||||
| Total net realized gain (loss) | (3,306,632) | |||||
| Change in net unrealized appreciation (depreciation) on: | ||||||
| Investment securities | 1,198,019 | |||||
| Assets and liabilities in foreign currencies | (2,999) | |||||
| Total change in net unrealized appreciation | ||||||
| (depreciation) | 1,195,020 | |||||
| Net gain (loss) | (2,111,612) | |||||
| Net increase (decrease) in net assets resulting from | ||||||
| operations | $ | (2,086,382) | ||||
| See accompanying notes which are an integral part of the financial statements. | ||||||
| 17 | Annual Report | |||||
| Financial Statements continued | ||||
| Statement of Changes in Net Assets | ||||
| August 2, 2005 | ||||
| (commencement | ||||
| of operations) to | ||||
| October 31, 2005 | ||||
| Increase (Decrease) in Net Assets | ||||
| Operations | ||||
| Net investment income (loss) | $ | 25,230 | ||
| Net realized gain (loss) | (3,306,632) | |||
| Change in net unrealized appreciation (depreciation) | 1,195,020 | |||
| Net increase (decrease) in net assets resulting | ||||
| from operations | (2,086,382) | |||
| Share transactions - net increase (decrease) | 215,410,790 | |||
| Redemption fees | 132,079 | |||
| Total increase (decrease) in net assets | 213,456,487 | |||
| Net Assets | ||||
| Beginning of period | — | |||
| End of period (including undistributed net investment income of $25,213) | $ | 213,456,487 | ||
See accompanying notes which are an integral part of the financial statements.
| Annual Report |
| 18 |
| Financial Highlights Class A | ||||
| Year ended October 31, | 2005G | |||
| Selected Per Share Data | ||||
| Net asset value, beginning of period | $ | 10.00 | ||
| Income from Investment Operations | ||||
| Net investment income (loss)E | —I | |||
| Net realized and unrealized gain (loss) | 40F | |||
| Total from investment operations | 40 | |||
| Redemption fees added to paid in capitalE | 01 | |||
| Net asset value, end of period | $ | 10.41 | ||
| Total ReturnB,C,D | 4.10% | |||
| Ratios to Average Net AssetsH | ||||
| Expenses before expense reductions | 2.67%A | |||
| Expenses net of voluntary waivers, if any | 1.65%A | |||
| Expenses net of all reductions | 1.54%A | |||
| Net investment income (loss) | (.09)%A | |||
| Supplemental Data | ||||
| Net assets, end of period (000 omitted) | $ | 5,533 | ||
| Portfolio turnover rate | 46% |
| A Annualized B Total returns for periods of less than one year are not annualized. C Total returns would have been lower had certain expenses not been reduced during the periods shown. D Total returns do not include the effect of the sales charges. E Calculated based on average shares outstanding during the period. F The amount shown for a share outstanding does not correspond with the aggregate net gain (loss) on investments for the period due to the timing of sales and repurchases of shares in relation to fluctuating market values of the investments of the fund. G For the period August 2, 2005 (commencement of operations) to October 31, 2005. H Expense ratios reflect operating expenses of the class. Expenses before reductions do not reflect amounts reimbursed by the investment adviser or reductions from brokerage service arrangements or other expense offset arrangements and do not represent the amount paid by the class during periods when reimbursements or reductions occur. Expense ratios before reductions for start up periods may not be representative of longer term operating periods. Expenses net of any voluntary waivers reflect expenses after reimbursement by the investment adviser but prior to reductions from brokerage service arrangements or other expense offset arrangements. Expenses net of all reductions represent the net expenses paid by the class. I Amount represents less than $.01 per share. |
See accompanying notes which are an integral part of the financial statements.
19 Annual Report
| Financial Highlights Class T | ||||
| Year ended October 31, | 2005G | |||
| Selected Per Share Data | ||||
| Net asset value, beginning of period | $ | 10.00 | ||
| Income from Investment Operations | ||||
| Net investment income (loss)E | (.01) | |||
| Net realized and unrealized gain (loss) | 38F | |||
| Total from investment operations | 37 | |||
| Redemption fees added to paid in capitalE | 01 | |||
| Net asset value, end of period | $ | 10.38 | ||
| Total ReturnB,C,D | 3.80% | |||
| Ratios to Average Net AssetsH | ||||
| Expenses before expense reductions | 2.92%A | |||
| Expenses net of voluntary waivers, if any | 1.90%A | |||
| Expenses net of all reductions | 1.78%A | |||
| Net investment income (loss) | (.33)%A | |||
| Supplemental Data | ||||
| Net assets, end of period (000 omitted) | $ | 2,704 | ||
| Portfolio turnover rate | 46% |
| A Annualized B Total returns for periods of less than one year are not annualized. C Total returns would have been lower had certain expenses not been reduced during the periods shown. D Total returns do not include the effect of the sales charges. E Calculated based on average shares outstanding during the period. F The amount shown for a share outstanding does not correspond with the aggregate net gain (loss) on investments for the period due to the timing of sales and repurchases of shares in relation to fluctuating market values of the investments of the fund. G For the period August 2, 2005 (commencement of operations) to October 31, 2005. H Expense ratios reflect operating expenses of the class. Expenses before reductions do not reflect amounts reimbursed by the investment adviser or reductions from brokerage service arrangements or other expense offset arrangements and do not represent the amount paid by the class during periods when reimbursements or reductions occur. Expense ratios before reductions for start up periods may not be representative of longer term operating periods. Expenses net of any voluntary waivers reflect expenses after reimbursement by the investment adviser but prior to reductions from brokerage service arrangements or other expense offset arrangements. Expenses net of all reductions represent the net expenses paid by the class. |
See accompanying notes which are an integral part of the financial statements.
| Annual Report |
| 20 |
| Financial Highlights Class B | ||||
| Year ended October 31, | 2005G | |||
| Selected Per Share Data | ||||
| Net asset value, beginning of period | $ | 10.00 | ||
| Income from Investment Operations | ||||
| Net investment income (loss)E | (.02) | |||
| Net realized and unrealized gain (loss) | 38F | |||
| Total from investment operations | 36 | |||
| Redemption fees added to paid in capitalE | 01 | |||
| Net asset value, end of period | $ | 10.37 | ||
| Total ReturnB,C,D | 3.70% | |||
| Ratios to Average Net AssetsH | ||||
| Expenses before expense reductions | 3.43%A | |||
| Expenses net of voluntary waivers, if any | 2.40%A | |||
| Expenses net of all reductions | 2.27%A | |||
| Net investment income (loss) | (.82)%A | |||
| Supplemental Data | ||||
| Net assets, end of period (000 omitted) | $ | 1,705 | ||
| Portfolio turnover rate | 46% |
| A Annualized B Total returns for periods of less than one year are not annualized. C Total returns would have been lower had certain expenses not been reduced during the periods shown. D Total returns do not include the effect of the contingent deferred sales charge. E Calculated based on average shares outstanding during the period. F The amount shown for a share outstanding does not correspond with the aggregate net gain (loss) on investments for the period due to the timing of sales and repurchases of shares in relation to fluctuating market values of the investments of the fund. G For the period August 2, 2005 (commencement of operations) to October 31, 2005. H Expense ratios reflect operating expenses of the class. Expenses before reductions do not reflect amounts reimbursed by the investment adviser or reductions from brokerage service arrangements or other expense offset arrangements and do not represent the amount paid by the class during periods when reimbursements or reductions occur. Expense ratios before reductions for start up periods may not be representative of longer term operating periods. Expenses net of any voluntary waivers reflect expenses after reimbursement by the investment adviser but prior to reductions from brokerage service arrangements or other expense offset arrangements. Expenses net of all reductions represent the net expenses paid by the class. |
See accompanying notes which are an integral part of the financial statements.
21 Annual Report
| Financial Highlights Class C | ||||
| Year ended October 31, | 2005G | |||
| Selected Per Share Data | ||||
| Net asset value, beginning of period | $ | 10.00 | ||
| Income from Investment Operations | ||||
| Net investment income (loss)E | (.02) | |||
| Net realized and unrealized gain (loss) | 38F | |||
| Total from investment operations | 36 | |||
| Redemption fees added to paid in capitalE | 01 | |||
| Net asset value, end of period | $ | 10.37 | ||
| Total ReturnB,C,D, | 3.70% | |||
| Ratios to Average Net AssetsH | ||||
| Expenses before expense reductions | 3.32%A | |||
| Expenses net of voluntary waivers, if any | 2.40%A | |||
| Expenses net of all reductions | 2.29%A | |||
| Net investment income (loss) | (.84)%A | |||
| Supplemental Data | ||||
| Net assets, end of period (000 omitted) | $ | 3,317 | ||
| Portfolio turnover rate | 46% |
| A Annualized B Total returns for periods of less than one year are not annualized. C Total returns would have been lower had certain expenses not been reduced during the periods shown. D Total returns do not include the effect of the contingent deferred sales charge. E Calculated based on average shares outstanding during the period. F The amount shown for a share outstanding does not correspond with the aggregate net gain (loss) on investments for the period due to the timing of sales and repurchases of shares in relation to fluctuating market values of the investments of the fund. G For the period August 2, 2005 (commencement of operations) to October 31, 2005. H Expense ratios reflect operating expenses of the class. Expenses before reductions do not reflect amounts reimbursed by the investment adviser or reductions from brokerage service arrangements or other expense offset arrangements and do not represent the amount paid by the class during periods when reimbursements or reductions occur. Expense ratios before reductions for start up periods may not be representative of longer term operating periods. Expenses net of any voluntary waivers reflect expenses after reimbursement by the investment adviser but prior to reductions from brokerage service arrangements or other expense offset arrangements. Expenses net of all reductions represent the net expenses paid by the class. |
See accompanying notes which are an integral part of the financial statements.
| Annual Report |
| 22 |
| Financial Highlights Fidelity International Small Cap Opportunities Fund | ||||
| Year ended October 31, | 2005F | |||
| Selected Per Share Data | ||||
| Net asset value, beginning of period | $ | 10.00 | ||
| Income from Investment Operations | ||||
| Net investment income (loss)D | —H | |||
| Net realized and unrealized gain (loss) | 39E | |||
| Total from investment operations | 39 | |||
| Redemption fees added to paid in capitalD | 01 | |||
| Net asset value, end of period | $ | 10.40 | ||
| Total ReturnB,C | 4.00% | |||
| Ratios to Average Net AssetsG | ||||
| Expenses before expense reductions | 2.25%A | |||
| Expenses net of voluntary waivers, if any | 1.40%A | |||
| Expenses net of all reductions | 1.31%A | |||
| Net investment income (loss) | 14%A | |||
| Supplemental Data | ||||
| Net assets, end of period (000 omitted) | $ | 197,349 | ||
| Portfolio turnover rate | 46% | |||
| A Annualized B Total returns for periods of less than one year are not annualized. C Total returns would have been lower had certain expenses not been reduced during the periods shown. D Calculated based on average shares outstanding during the period. E The amount shown for a share outstanding does not correspond with the aggregate net gain (loss) on investments for the period due to the timing of sales and repurchases of shares in relation to fluctuating market values of the investments of the fund. F For the period August 2, 2005 (commencement of operations) to October 31, 2005. G Expense ratios reflect operating expenses of the class. Expenses before reductions do not reflect amounts reimbursed by the investment adviser or reductions from brokerage service arrangements or other expense offset arrangements and do not represent the amount paid by the class during periods when reimbursements or reductions occur. Expense ratios before reductions for start up periods may not be representative of longer term operating periods. Expenses net of any voluntary waivers reflect expenses after reimbursement by the investment adviser but prior to reductions from brokerage service arrangements or other expense offset arrangements. Expenses net of all reductions represent the net expenses paid by the class. H Amount represents less than $.01 per share. |
See accompanying notes which are an integral part of the financial statements.
23 Annual Report
| Financial Highlights Institutional Class | ||||
| Year ended October 31, | 2005F | |||
| Selected Per Share Data | ||||
| Net asset value, beginning of period | $ | 10.00 | ||
| Income from Investment Operations | ||||
| Net investment income (loss)D | —H | |||
| Net realized and unrealized gain (loss) | 39E | |||
| Total from investment operations | 39 | |||
| Redemption fees added to paid in capitalD | 01 | |||
| Net asset value, end of period | $ | 10.40 | ||
| Total ReturnB,C | 4.00% | |||
| Ratios to Average Net AssetsG | ||||
| Expenses before expense reductions | 2.25%A | |||
| Expenses net of voluntary waivers, if any | 1.40%A | |||
| Expenses net of all reductions | 1.29%A | |||
| Net investment income (loss) | 16%A | |||
| Supplemental Data | ||||
| Net assets, end of period (000 omitted) | $ | 2,849 | ||
| Portfolio turnover rate | 46% |
| A Annualized B Total returns for periods of less than one year are not annualized. C Total returns would have been lower had certain expenses not been reduced during the periods shown. D Calculated based on average shares outstanding during the period. E The amount shown for a share outstanding does not correspond with the aggregate net gain (loss) on investments for the period due to the timing of sales and repurchases of shares in relation to fluctuating market values of the investments of the fund. F For the period August 2, 2005 (commencement of operations) to October 31, 2005. G Expense ratios reflect operating expenses of the class. Expenses before reductions do not reflect amounts reimbursed by the investment adviser or reductions from brokerage service arrangements or other expense offset arrangements and do not represent the amount paid by the class during periods when reimbursements or reductions occur. Expense ratios before reductions for start up periods may not be representative of longer term operating periods. Expenses net of any voluntary waivers reflect expenses after reimbursement by the investment adviser but prior to reductions from brokerage service arrangements or other expense offset arrangements. Expenses net of all reductions represent the net expenses paid by the class. H Amount represents less than $.01 per share. |
See accompanying notes which are an integral part of the financial statements.
| Annual Report |
| 24 |
Notes to Financial Statements
| For the period ended October 31, 2005 |
1. Significant Accounting Policies.
Fidelity International Small Cap Opportunities Fund (the fund) is a fund of Fidelity Investment Trust (the trust) and is authorized to issue an unlimited number of shares. The trust is registered under the Investment Company Act of 1940, as amended (the 1940 Act), as an open end management investment company organized as a Massachusetts business trust.
The fund offers Class A, Class T, Class B, Class C, International Small Cap Opportunities Fund and Institutional Class shares, each of which has equal rights as to assets and voting privileges. Each class has exclusive voting rights with respect to matters that affect that class. Class B shares will automatically convert to Class A shares after a holding period of seven years from the initial date of purchase. Investment income, realized and unrealized capital gains and losses, the common expenses of the fund, and certain fund level expense reductions, if any, are allocated on a pro rata basis to each class based on the relative net assets of each class to the total net assets of the fund. Each class differs with respect to transfer agent and distribution and service plan fees incurred. Certain expense reductions also differ by class.
The fund’s investments in emerging markets can be subject to social, economic, reg ulatory, and political uncertainties and can be extremely volatile. The fund may invest in affiliated money market central funds (Money Market Central Funds) which are open end investment companies available to investment companies and other accounts managed by Fidelity Management & Research Company (FMR) and its affiliates. The financial statements have been prepared in conformity with accounting principles generally accepted in the United States of America, which require management to make certain estimates and assumptions at the date of the financial statements. The following summarizes the significant accounting policies of the fund:
Security Valuation. Investments are valued and net asset value (NAV) per share is calculated (NAV calculation) as of the close of business of the New York Stock Exchange (NYSE), normally 4:00 p.m. Eastern time. Wherever possible, each fund uses indepen dent pricing services approved by the Board of Trustees to value their investments.
Equity securities, including restricted securities, for which market quotations are readily available, are valued at the last reported sale price or official closing price as reported by an independent pricing service on the primary market or exchange on which they are traded. In the event there were no sales during the day or closing prices are not available, securities are valued at the last quoted bid price. Investments in open end mutual funds, are valued at their closing net asset value each business day. Short term securities with remaining maturities of sixty days or less for which quotations are not readily available are valued at amortized cost, which approximates value.
25 Annual Report
Notes to Financial Statements continued
1. Significant Accounting Policies continued
Security Valuation continued
When current market prices or quotations are not readily available or do not accurately reflect fair value, valuations may be determined in accordance with procedures adopted by the Board of Trustees. For example, when developments occur between the close of a market and the close of the NYSE that may materially affect the value of some or all of the securities, or when trading in a security is halted, those securities may be fair valued. Factors used in the determination of fair value may include monitoring news to identify significant market or security specific events such as changes in the value of U.S. securi ties market, reviewing developments in foreign markets and evaluating the performance of ADRs, futures contracts and exchange traded funds. Because the fund’s utilization of fair value pricing depends on market activity, the frequency with which fair value pricing is used can not be predicted and may be utilized to a significant extent. The value of securities used for NAV calculation under fair value pricing may differ from published prices for the same securities.
Foreign Currency. The fund uses foreign currency contracts to facilitate transactions in foreign denominated securities. Losses from these transactions may arise from changes in the value of the foreign currency or if the counterparties do not perform under the contracts’ terms.
Foreign denominated assets, including investment securities, and liabilities are trans lated into U.S. dollars at the exchange rate at period end. Purchases and sales of invest ment securities, income and dividends received and expenses denominated in foreign currencies are translated into U.S. dollars at the exchange rate in effect on the transac tion date.
The effects of exchange rate fluctuations on investments are included with the net realized and unrealized gain (loss) on investment securities. Other foreign currency transactions resulting in realized and unrealized gain (loss) are disclosed separately.
Investment Transactions and Income. Security transactions are accounted for as of trade date. Gains and losses on securities sold are determined on the basis of identified cost. Dividend income is recorded on the ex dividend date, except for certain dividends from foreign securities where the ex dividend date may have passed, which are recorded as soon as the fund is informed of the ex dividend date. Non cash dividends included in dividend income, if any, are recorded at the fair market value of the securities received. Interest income is accrued as earned. Interest income includes coupon interest and amortization of premium and accretion of discount on debt securities. Investment income is recorded net of foreign taxes withheld where recovery of such taxes is uncertain.
| Annual Report |
| 26 |
1. Significant Accounting Policies continued
Expenses. Most expenses of the trust can be directly attributed to a fund. Expenses which cannot be directly attributed are apportioned among each fund in the trust.
Income Tax Information and Distributions to Shareholders. Each year, the fund intends to qualify as a regulated investment company by distributing all of its taxable income and realized gains under Subchapter M of the Internal Revenue Code. As a result, no provision for income taxes is required in the accompanying financial statements. Foreign taxes are provided for based on the fund’s understanding of the tax rules and rates that exist in the foreign markets in which it invests.
Distributions are recorded on the ex dividend date. Income dividends and capital gain distributions are declared separately for each class. Income and capital gain distribu tions are determined in accordance with income tax regulations, which may differ from generally accepted accounting principles. In addition, the fund will claim a portion of the payment made to redeeming shareholders as a distribution for income tax purposes.
Capital accounts within the financial statements are adjusted for permanent book tax differences. These adjustments have no impact on net assets or the results of operations. Temporary book tax differences will reverse in a subsequent period.
Book tax differences are primarily due to foreign currency transactions, certain foreign taxes, passive foreign investment companies (PFIC), capital loss carryforwards and losses deferred due to wash sales.
The tax basis components of distributable earnings and the federal tax cost as of period end were as follows:
| Unrealized appreciation | $ | 9,432,980 | ||
| Unrealized depreciation | (8,507,152) | |||
| Net unrealized appreciation (depreciation) | 925,828 | |||
| Undistributed ordinary income | 57,206 | |||
| Capital loss carryforward | (3,072,229) | |||
| Cost for federal income tax purposes | $ | 213,870,466 | ||
Short Term Trading (Redemption) Fees. Shares purchased and held in the fund less than 90 days will be subject to a redemption fee equal to 2.00% of the proceeds of the redeemed shares. All redemption fees, including any estimated redemption fees paid by FMR, are retained by the fund and accounted for as an addition to paid in capital.
27 Annual Report
| Notes to Financial Statements | continued | |
2. Operating Policies. |
Repurchase Agreements. FMR has received an Exemptive Order from the Securities and Exchange Commission (the SEC) which permits the fund and other affiliated entities of FMR to transfer uninvested cash balances into joint trading accounts which are then invested in repurchase agreements. The fund may also invest directly with institutions in repurchase agreements. Repurchase agreements are collateralized by government or non government securities. Collateral is held in segregated accounts with custodian banks and may be obtained in the event of a default of the counterparty. The fund monitors, on a daily basis, the value of the collateral to ensure it is at least equal to the principal amount of the repurchase agreement (including accrued interest). In the event of a default by the counterparty, realization of the collateral proceeds could be delayed, during which time the value of the collateral may decline.
3. Purchases and Sales of Investments.
Purchases and sales of securities, other than short term securities and U.S. government securities, aggregated $282,288,880 and $65,440,601, respectively.
4. Fees and Other Transactions with Affiliates.
Management Fee. FMR and its affiliates provide the fund with investment manage ment related services for which the fund pays a monthly management fee. The manage ment fee is the sum of an individual fund fee rate that is based on an annual rate of .60% of the fund’s average net assets and a group fee rate that averaged .27% during the period. The group fee rate is based upon the average net assets of all the mutual funds advised by FMR. The group fee rate decreases as assets under management increase and increases as assets under management decrease. In addition, the management fee is subject to a performance adjustment (up to a maximum of ±.20% of the fund’s average net assets over a 36 month performance period). The upward or downward adjustment to the management fee is based on the fund’s relative investment performance as compared to an appropriate benchmark index. The fund’s performance adjustment will not take effect until July 2006. Subsequent months will be added until the performance period includes 36 months. For the period, the total annualized management fee rate was .86% of the fund’s average net assets.
Distribution and Service Plan. In accordance with Rule 12b 1 of the 1940 Act, the fund has adopted separate Distribution and Service Plans for each class of shares. Certain classes pay Fidelity Distributors Corporation (FDC), an affiliate of FMR, separate Distribution and Service Fees, each of which is based on an annual percentage of each class’ average net assets. In addition, FDC may pay financial intermediaries for selling shares of the fund and providing shareholder support services. For the period, the
| Annual Report |
| 28 |
| 4. Fees and Other Transactions with Affiliates continued | ||
Distribution and Service Plan continued | ||
Distribution and Service Fee rates and the total amounts paid to and retained by FDC were as follows:
| Distribution | Service | Paid to | Retained | |||||||||
| Fee | Fee | FDC | by FDC | |||||||||
| Class A | 0% | .25% | $ | 1,456 | $ | 459 | ||||||
| Class T | 25% | .25% | 1,976 | 990 | ||||||||
| Class B | 75% | .25% | 2,894 | 2,675 | ||||||||
| Class C | 75% | .25% | 5,415 | 5,257 | ||||||||
| $ | 11,741 | $ | 9,381 |
Sales Load. FDC receives a front end sales charge of up to 5.75% for selling Class A shares, and 3.50% for selling Class T shares, some of which is paid to financial intermedi aries for selling shares of the fund. FDC receives the proceeds of contingent deferred sales charges levied on Class A, Class T, Class B, and Class C redemptions. These charges depend on the holding period. The deferred sales charges range from 5% to 1% for Class B, 1% for Class C, and .25% for certain purchases of Class A and Class T shares.
| For the period, sales charge amounts retained by FDC were as follows: | ||||
| Retained | ||||
| by FDC | ||||
| Class A | $ | 12,750 | ||
| Class T | 2,294 | |||
| Class B* | 10 | |||
| Class C* | 231 | |||
| $ | 15,285 | |||
* When Class B and Class C shares are initially sold, FDC pays commissions from its own resources to financial intermediaries through which the sales are made.
Transfer Agent Fees. Fidelity Investments Institutional Operations Company, Inc. (FIIOC), an affiliate of FMR, is the transfer, dividend disbursing and shareholder servic ing agent for each class of the fund, except for Fidelity International Small Cap Opportu nities Fund. Fidelity Service Company, Inc. (FSC), an affiliate of FMR, is the transfer agent for Fidelity International Small Cap Opportunities Fund shares. FIIOC and FSC receive account fees and asset based fees that vary according to the account size and type of account of the shareholders of the respective classes of the fund. FIIOC and FSC pay for typesetting, printing and mailing of shareholder reports, except proxy statements.
29 Annual Report
| Notes to Financial Statements continued | ||
| 4. Fees and Other Transactions with Affiliates continued | ||
Transfer Agent Fees continued | ||
For the period the total transfer agent fees paid by each class to FIIOC or FSC, were as follows:
| % of | ||||||
| Average | ||||||
| Amount | Net Assets | |||||
| Class A | $ | 2,158 | .36* | |||
| Class T | 1,388 | .34* | ||||
| Class B | 830 | .28* | ||||
| Class C | 1,495 | .27* | ||||
| Fidelity International Small Cap Opportunities Fund | 78,812 | .33* | ||||
| Institutional Class | 1,071 | .21* | ||||
| $ | 85,754 | |||||
| * Annualized |
Accounting Fees. FSC maintains the fund’s accounting records. The fee is based on the level of average net assets for the month.
Affiliated Central Funds. The fund may invest in Money Market Central Funds which seek preservation of capital and current income and are managed by Fidelity Invest ments Money Management, Inc. (FIMM), an affiliate of FMR.
Income distributions earned by the fund are recorded as income in the accompanying financial statements and totaled $55,685 for the period.
Brokerage Commissions. The fund placed a portion of its portfolio transactions with brokerage firms which are affiliates of the investment adviser. The commissions paid to these affiliated firms were $7,977 for the period.
| Annual Report |
| 30 |
| 5. Expense Reductions. |
FMR voluntarily agreed to reimburse each class to the extent annual operating expenses exceeded certain levels of average net assets as noted in the table below. Some expenses, for example interest expense, are excluded from this reimbursement.
| The following classes were in reimbursement during the period: | ||||||
| Expense | Reimbursement | |||||
| Limitations | from adviser | |||||
| Class A | 1.65% | $ | 6,027 | |||
| Class T | 1.90% | 4,117 | ||||
| Class B | 2.40% | 3,055 | ||||
| Class C | 2.40% | 5,067 | ||||
| Fidelity International Small Cap Opportunities Fund . | 1.40% | 205,242 | ||||
| Institutional Class | 1.40% | 4,405 | ||||
| $ | 227,913 | |||||
Many of the brokers with whom FMR places trades on behalf of the fund provided services to the fund in addition to trade execution. These services included payments of certain expenses on behalf of the fund totaling $23,569 for the period. In addition, through arrangements with the fund’s custodian and each class’ transfer agent, credits realized as a result of uninvested cash balances were used to reduce the fund’s expenses. During the period, these credits reduced the fund’s custody expenses by $89. During the period, credits reduced each class’ transfer agent expense as noted in the table below.
| Transfer Agent | ||||
| expense reduction | ||||
| Class A | $ | 124 | ||
| Class T | 120 | |||
| Class B | 123 | |||
| Class C | 120 | |||
| Institutional Class | 123 | |||
| $ | 610 | |||
| 6. Other. | ||||
The fund’s organizational documents provide former and current trustees and officers with a limited indemnification against liabilities arising in connection with the perfor mance of their duties to the fund. In the normal course of business, the fund may also enter into contracts that provide general indemnifications. The fund’s maximum expo sure under these arrangements is unknown as this would be dependent on future claims that may be made against the fund. The risk of material loss from such claims is consid ered remote.
31 Annual Report
| Notes to Financial Statements continued | ||||||
| 7. Share Transactions. | ||||||
| Transactions for each class of shares were as follows: | ||||||
| Shares | Dollars | |||||
| Year ended | Year ended | |||||
| October 31, 2005A | October 31, 2005A | |||||
| Class A | ||||||
| Shares sold | 533,911 | $ | 5,543,122 | |||
| Shares redeemed | (2,302) | (24,252) | ||||
| Net increase (decrease) | 531,609 | $ | 5,518,870 | |||
| Class T | ||||||
| Shares sold | 262,396 | $ | 2,707,886 | |||
| Shares redeemed | (1,961) | (19,686) | ||||
| Net increase (decrease) | 260,435 | $ | 2,688,200 | |||
| Class B | ||||||
| Shares sold | 169,923 | $ | 1,745,697 | |||
| Shares redeemed | (5,585) | (57,751) | ||||
| Net increase (decrease) | 164,338 | $ | 1,687,946 | |||
| Class C | ||||||
| Shares sold | 322,125 | $ | 3,329,826 | |||
| Shares redeemed | (2,373) | (24,472) | ||||
| Net increase (decrease) | 319,752 | $ | 3,305,354 | |||
| Fidelity International Small Cap Opportunities Fund | ||||||
| Shares sold | 19,620,455 | $ | 205,992,728 | |||
| Shares redeemed | (646,558) | (6,587,124) | ||||
| Net increase (decrease) | 18,973,897 | $ | 199,405,604 | |||
| Institutional Class | ||||||
| Shares sold | 274,003 | $ | 2,804,816 | |||
| Net increase (decrease) | 274,003 | $ | 2,804,816 | |||
| A For the period August 2, 2005 (commencement of operations) to October 31, 2005. | ||||||
| Annual Report |
| 32 |
Report of Independent Registered Public Accounting Firm
To the Trustees of Fidelity Investment Trust and Shareholders of Fidelity International Small Cap Opportunities Fund:
We have audited the accompanying statement of assets and liabilities of Fidelity Interna tional Small Cap Opportunities Fund (the Fund), a fund of Fidelity Investment Trust, including the schedule of investments, as of October 31, 2005, and the related statement of operations, the statement of changes in net assets, and the financial highlights for the period from August 2, 2005 (commencement of operations) to October 31, 2005. These financial statements and financial highlights are the responsibility of the Fund’s manage ment. Our responsibility is to express an opinion on these financial statements and financial highlights based on our audit.
We conducted our audit in accordance with standards of the Public Company Accounting Oversight Board (United States). Those standards require that we plan and perform the audit to obtain reasonable assurance about whether the financial statements and financial highlights are free of material misstatement. The Fund is not required to have, nor were we engaged to perform, an audit of its internal control over financial reporting. Our audit included consideration of internal control over financial reporting as a basis for designing audit procedures that are appropriate in the circumstances, but not for the purpose of expressing an opinion on the effectiveness of the Fund’s internal control over financial reporting. Accordingly, we express no such opinion. An audit also includes examining, on a test basis, evidence supporting the amounts and disclosures in the financial statements, assessing the accounting principles used and significant estimates made by management, as well as evaluating the overall financial statement presentation. Our procedures in cluded confirmation of securities owned as of October 31, 2005, by correspondence with the custodians and brokers; where replies were not received from brokers, we performed other auditing procedures. We believe that our audit provide a reasonable basis for our opinion.
In our opinion, the financial statements and financial highlights referred to above present fairly, in all material respects, the financial position of Fidelity International Small Cap Opportunities Fund as of October 31, 2005, the results of its operations, the changes in its net assets, and its financial highlights for the period from August 2, 2005 (commencement of operations) to October 31, 2005, in conformity with accounting principles generally accepted in the United States of America.
| /s/ Deloitte & Touche LLP DELOITTE & TOUCHE LLP Boston, Massachusetts December 13, 2005 |
33 Annual Report
Trustees and Officers
The Trustees, Members of the Advisory Board, and executive officers of the trust and fund, as applicable, are listed below. The Board of Trustees governs the fund and is responsible for protecting the interests of shareholders. The Trustees are experienced executives who meet periodically throughout the year to oversee the fund’s activities, review contractual arrangements with companies that provide services to the fund, and review the fund’s performance. Except for William O. McCoy, Stephen P. Jonas, and Kenneth L. Wolfe, each of the Trustees oversees 322 funds advised by FMR or an affiliate. Mr. McCoy oversees 324 funds advised by FMR or an affiliate. Mr. Jonas and Mr. Wolfe oversee 319 funds advised by FMR or an affiliate.
The Trustees hold office without limit in time except that (a) any Trustee may resign; (b) any Trustee may be removed by written instrument, signed by at least two thirds of the number of Trustees prior to such removal; (c) any Trustee who requests to be retired or who has become incapacitated by illness or injury may be retired by written instru ment signed by a majority of the other Trustees; and (d) any Trustee may be removed at any special meeting of shareholders by a two thirds vote of the outstanding voting securities of the trust. Each Trustee who is not an interested person (as defined in the 1940 Act) (Independent Trustee), shall retire not later than the last day of the calendar year in which his or her 72nd birthday occurs. The Independent Trustees may waive this mandatory retirement age policy with respect to Individual Trustees. The executive officers and Advisory Board Members hold office without limit in time, except that any officer and Advisory Board Member may resign or may be removed by a vote of a majority of the Trustees at any regular meeting or any special meeting of the Trustees. Except as indicated, each individual has held the office shown or other offices in the same company for the past five years.
The fund’s Statement of Additional Information (SAI) includes more information about the Trustees. To request a free copy, call Fidelity at 1-877-208-0098.
| Interested Trustees*: |
Correspondence intended for each Trustee who is an interested person may be sent to Fidelity Investments, 82 Devonshire Street, Boston, Massachusetts 02109.
| Name, Age; Principal Occupation Edward C. Johnson 3d (75)** |
Year of Election or Appointment: 1984
Mr. Johnson is Chairman of the Board of Trustees. Mr. Johnson serves as Chief Executive Officer, Chairman, and a Director of FMR Corp.; a Di rector and Chairman of the Board and of the Executive Committee of FMR; Chairman and a Director of Fidelity Management & Research (Far East) Inc.; Chairman and a Director of Fidelity Investments Money Man agement, Inc.; and Chairman (2001 present) and a Director (2000 present) of FMR Co., Inc.
| Annual Report |
| 34 |
| Name, Age; Principal Occupation Abigail P. Johnson (43)** |
Year of Election or Appointment: 2001
Ms. Johnson serves as President of Fidelity Employer Services Company (FESCO) (2005 present). She is President and a Director of Fidelity In vestments Money Management, Inc. (2001 present), FMR Co., Inc. (2001 present), and a Director of FMR Corp. Previously, Ms. Johnson served as President and a Director of FMR (2001 2005), Senior Vice President of the Fidelity funds (2001 2005), and managed a number of Fidelity funds.
| Stephen P. Jonas (52) |
Year of Election or Appointment: 2005
Mr. Jonas is Senior Vice President of the fund (2005 present). He also serves as Senior Vice President of other Fidelity funds (2005 present). Mr. Jonas is Executive Director of FMR Corp (2005 present). Previously, Mr. Jonas served as President of Fidelity Enterprise Operations and Risk Services (2004 2005), Chief Administrative Officer (2002 2004), and Chief Financial Officer of FMR Co. (1998 2000). Mr. Jonas has been with Fidelity Investments since 1987 and has held various financial and management positions including Chief Financial Officer of FMR. In addi tion, he serves on the Boards of Boston Ballet (2003 present) and Sim mons College (2003 present).
| Robert L. Reynolds (53) |
Year of Election or Appointment: 2003
Mr. Reynolds is a Director (2003 present) and Chief Operating Officer (2002 present) of FMR Corp. He also serves on the Board at Fidelity Investments Canada, Ltd. (2000 present). Previously, Mr. Reynolds served as President of Fidelity Investments Institutional Retirement Group (1996 2000).
* Trustees have been determined to be “Interested Trustees” by virtue of, among other things, their affiliation with the trust or various entities under common control with FMR.
** Edward C. Johnson 3d, Trustee, is Abigail P. Johnson’s father.
35 Annual Report
Trustees and Officers - continued
Independent Trustees:
Correspondence intended for each Independent Trustee (that is, the Trustees other than the Interested Trustees) may be sent to Fidelity Investments, P.O. Box 55235, Boston, Massachusetts 02205 5235.
| Name, Age; Principal Occupation Dennis J. Dirks (57) |
Year of Election or Appointment: 2005
Prior to his retirement in May 2003, Mr. Dirks was Chief Operating Officer and a member of the Board of The Depository Trust & Clearing Corporation (DTCC) (1999 2003). He also served as President, Chief Operating Officer, and Board member of The Depository Trust Company (DTC) (1999 2003) and President and Board member of the National Securities Clearing Corporation (NSCC) (1999 2003). In addi tion, Mr. Dirks served as Chief Executive Officer and Board member of the Government Securities Clearing Corporation (2001 2003) and Chief Executive Officer and Board member of the Mortgage Backed Securities Clearing Corporation (2001 2003). Mr. Dirks also serves as a Trustee of Manhattan College (2005 present).
| Robert M. Gates (62) |
Year of Election or Appointment: 1997
Dr. Gates is Vice Chairman of the Independent Trustees (2005 present). Dr. Gates is President of Texas A&M University (2002 present). He was Director of the Central Intelligence Agency (CIA) from 1991 to 1993. From 1989 to 1991, Dr. Gates served as Assistant to the President of the United States and Deputy National Security Advisor. Dr. Gates is a Director of NACCO Industries, Inc. (mining and manufacturing), Parker Drilling Co., Inc. (drilling and rental tools for the energy industry, 2001 present), and Brinker International (restaurant management, 2003 present). Previously, Dr. Gates served as a Director of LucasVarity PLC (automotive components and diesel engines), a Director of TRW Inc. (automotive, space, defense, and information technology), and Dean of the George Bush School of Government and Public Service at Texas A&M University (1999 2001). Dr. Gates also is a Trustee of the Forum for International Policy.
| Annual Report |
| 36 |
| Name, Age; Principal Occupation George H. Heilmeier (69) |
Year of Election or Appointment: 2004
Dr. Heilmeier is Chairman Emeritus of Telcordia Technologies (commu nication software and systems), where prior to his retirement, he served as company Chairman and Chief Executive Officer. He currently serves on the Boards of Directors of The Mitre Corporation (systems engineer ing and information technology support for the government), and HRL Laboratories (private research and development, 2004 present). He is Chairman of the General Motors Science & Technology Advisory Board and a Life Fellow of the Institute of Electrical and Electronics Engineers (IEEE) (2000 present). Dr. Heilmeier is a member of the Defense Science Board and the National Security Agency Advisory Board. He is also a member of the National Academy of Engineering, the American Academy of Arts and Sciences, and the Board of Overseers of the School of Engineering and Applied Science of the University of Pennsyl vania. Previously, Dr. Heilmeier served as a Director of TRW Inc. (auto motive, space, defense, and information technology, 1992 2002), Compaq (1994 2002), Automatic Data Processing, Inc. (ADP) (technology based business outsourcing, 1995 2002), INET Technolo gies Inc. (telecommunications network surveillance, 2001 2004), and Teltech Holdings (customer management services). He is the recipient of the 2005 Kyoto Prize in Advanced Technology for his invention of the liquid display.
| Marie L. Knowles (59) |
Year of Election or Appointment: 2001
Prior to Ms. Knowles’ retirement in June 2000, she served as Executive Vice President and Chief Financial Officer of Atlantic Richfield Company (ARCO) (diversified energy, 1996 2000). From 1993 to 1996, she was a Senior Vice President of ARCO and President of ARCO Transportation Company. She served as a Director of ARCO from 1996 to 1998. She currently serves as a Director of Phelps Dodge Corporation (copper mining and manufacturing) and McKesson Corporation (healthcare ser vice, 2002 present). Ms. Knowles is a Trustee of the Brookings Institution and the Catalina Island Conservancy and also serves as a member of the Advisory Board for the School of Engineering of the University of Southern California.
37 Annual Report
Trustees and Officers - continued
| Name, Age; Principal Occupation Ned C. Lautenbach (61) |
Year of Election or Appointment: 2000
Mr. Lautenbach has been a partner of Clayton, Dubilier & Rice, Inc. (private equity investment firm) since September 1998. Previously, Mr. Lautenbach was with the International Business Machines Corporation (IBM) from 1968 until his retirement in 1998. Mr. Lautenbach serves as a Director of Italtel Holding S.p.A. (telecommunications (Milan, Italy), 2004 present) and Eaton Corporation (diversified industrial) as well as the Philharmonic Center for the Arts in Naples, Florida. He also is a member of the Board of Trustees of Fairfield University (2005 present), as well as a member of the Council on Foreign Relations.
| Marvin L. Mann (72) |
Year of Election or Appointment: 1993
Mr. Mann is Chairman of the Independent Trustees (2001 present). He is Chairman Emeritus of Lexmark International, Inc. (computer peripherals), where he served as CEO until April 1998, retired as Chairman May 1999, and remains a member of the Board. Prior to 1991, he held the positions of Vice President of International Business Machines Corporation (IBM) and President and General Manager of various IBM divisions and subsidiaries. He is a member of the Executive Committee of the Independent Director’s Council of the Investment Com pany Institute. In addition, Mr. Mann is a member of the President’s Cabinet at the University of Alabama and the Board of Visitors of the Culverhouse College of Commerce and Business Administration at the University of Alabama.
| William O. McCoy (72) |
Year of Election or Appointment: 1997
Prior to his retirement in December 1994, Mr. McCoy was Vice Chairman of the Board of BellSouth Corporation (telecommunications) and President of BellSouth Enterprises. He is currently a Director of Liberty Corporation (holding company), Duke Realty Corporation (real estate), and Progress Energy, Inc. (electric utility). He is also a partner of Franklin Street Partners (private investment management firm) and a member of the Research Triangle Foundation Board. In addition, Mr. McCoy served as the Interim Chancellor (1999 2000) and a member of the Board of Visitors for the University of North Carolina at Chapel Hill and currently serves on the Board of Directors of the University of North Carolina Health Care System and the Board of Visitors of the Kenan Flagler Business School (University of North Carolina at Chapel Hill). He also served as Vice President of Finance for the University of North Carolina (16 school system).
| Annual Report |
| 38 |
| Name, Age; Principal Occupation Cornelia M. Small (61) |
Year of Election or Appointment: 2005
Ms. Small is a member (2000 present) and Chairperson (2002 present) of the Investment Committee, and a member (2002 present) of the Board of Trustees of Smith College. Previously, she served as Chief In vestment Officer (1999 2000), Director of Global Equity Investments (1996 1999), and a member of the Board of Directors of Scudder, Stevens & Clark (1990 1997) and Scudder Kemper Investments (1997 1998). In addition, Ms. Small served as Co Chair (2000 2003) of the Annual Fund for the Fletcher School of Law and Diplomacy.
| William S. Stavropoulos (66) |
Year of Election or Appointment: 2001
Mr. Stavropoulos is Chairman of the Board (2000 present) and a Mem ber of the Board of Directors of The Dow Chemical Company. Since joining The Dow Chemical Company in 1967, Mr. Stavropoulos served in numerous senior management positions, including President (1993 2000; 2002 2003), CEO (1995 2000; 2002 2004), and Chair man of the Executive Committee (2000 2004). Currently, he is a Direc tor of NCR Corporation (data warehousing and technology solutions), BellSouth Corporation (telecommunications), Chemical Financial Corpo ration, Maersk Inc. (industrial conglomerate, 2002 present), and Metal mark Capital (private equity investment firm, 2005 present). He also serves as a member of the Board of Trustees of the American Enterprise Institute for Public Policy Research. In addition, Mr. Stavropoulos is a member of The Business Council, J.P. Morgan International Council and the University of Notre Dame Advisory Council for the College of Science.
| Kenneth L. Wolfe (66) |
Year of Election or Appointment: 2005
Mr. Wolfe also serves as a Trustee (2005 present) or Member of the Advisory Board (2004 present) of other investment companies advised by FMR. Prior to his retirement in 2001, Mr. Wolfe was Chairman and Chief Executive Officer of Hershey Foods Corporation (1993 2001). He currently serves as a member of the boards of Adelphia Communica tions Corporation (2003 present), Bausch & Lomb, Inc., and Revlon Inc. (2004 present).
39 Annual Report
Trustees and Officers - continued
Advisory Board Members and Executive Officers:
Correspondence intended for Mr. Gamper may be sent to Fidelity Investments, P.O. Box 55235, Boston, Massachusetts 02205 5235. Correspondence intended for each executive officer and Mr. Lynch may be sent to Fidelity Investments, 82 Devonshire Street, Boston, Massachusetts 02109.
| Name, Age; Principal Occupation Albert R. Gamper, Jr. (63) |
Year of Election or Appointment: 2005
Member of the Advisory Board of Fidelity Investment Trust. Prior to his retirement in December 2004, Mr. Gamper served as Chairman of the Board of CIT Group Inc. (commercial finance). During his tenure with CIT Group Inc. Mr. Gamper served in numerous senior management positions, including Chairman (1987 1989; 1999 2001; 2002 2004), Chief Executive Officer (1987 2004), and President (1989 2002). He currently serves as a member of the Board of Directors of Public Service Enterprise Group (utilities, 2001 present), Chairman of the Board of Governors, Rutgers University (2004 present), and Chairman of the Board of Saint Barnabas Health Care System (1996 present).
| Peter S. Lynch (61) |
Year of Election or Appointment: 2003
Member of the Advisory Board of Fidelity Investment Trust. Vice Chair man and a Director of FMR, and Vice Chairman (2001 present) and a Director (2000 present) of FMR Co., Inc. Previously, Mr. Lynch served as a Trustee of the Fidelity funds (1990 2003). In addition, he serves as a Trustee of Boston College, Massachusetts Eye & Ear Infirmary, Historic Deerfield, John F. Kennedy Library, and the Museum of Fine Arts of Boston.
| Dwight D. Churchill (51) |
Year of Election or Appointment: 2005
Vice President of the fund. Mr. Churchill also serves as Vice President of certain Equity Funds (2005 present) and certain High Income Funds (2005 present). Previously, he served as Head of Fidelity’s Fixed Income Division (2000 2005), Vice President of Fidelity’s Money Market Funds (2000 2005), Vice President of Fidelity’s Bond Funds, and Senior Vice President of FIMM (2000) and FMR. Mr. Churchill joined Fidelity in 1993 as Vice President and Group Leader of Taxable Fixed Income Investments.
| Annual Report |
| 40 |
| Name, Age; Principal Occupation Eric D. Roiter (56) |
Year of Election or Appointment: 2005
Secretary of the fund. He also serves as Secretary of other Fidelity funds; Vice President, General Counsel, and Secretary of FMR Co., Inc. (2001 present) and FMR; Assistant Secretary of Fidelity Management & Research (U.K.) Inc. (2001 present), Fidelity Management & Research (Far East) Inc. (2001 present), and Fidelity Investments Money Manage ment, Inc. (2001 present). Mr. Roiter is an Adjunct Member, Faculty of Law, at Boston College Law School (2003 present). Previously, Mr. Roiter served as Vice President and Secretary of Fidelity Distributors Corpora tion (FDC) (1998 2005).
| Stuart Fross (46) |
Year of Election or Appointment: 2005
Assistant Secretary of the fund. Mr. Fross also serves as Assistant Secre tary of other Fidelity funds (2003 present), Vice President and Secretary of FDC (2005 present), and is an employee of FMR.
| Christine Reynolds (47) |
Year of Election or Appointment: 2005
President, Treasurer, and Anti Money Laundering (AML) officer of the fund. Ms. Reynolds also serves as President, Treasurer, and AML officer of other Fidelity funds (2004) and is a Vice President (2003) and an employee (2002) of FMR. Before joining Fidelity Investments, Ms. Reynolds worked at PricewaterhouseCoopers LLP (PwC) (1980 2002), where she was most recently an audit partner with PwC’s investment management practice.
41 Annual Report
Trustees and Officers - continued
| Name, Age; Principal Occupation Paul M. Murphy (58) |
Year of Election or Appointment: 2005
Chief Financial Officer of the fund. Mr. Murphy also serves as Chief Financial Officer of other Fidelity funds (2005 present). He also serves as Senior Vice President of Fidelity Pricing and Cash Management Ser vices Group (FPCMS).
| Kenneth A. Rathgeber (58) |
Year of Election or Appointment: 2005
Chief Compliance Officer of the fund. Mr. Rathgeber also serves as Chief Compliance Officer of other Fidelity funds (2004) and Executive Vice President of Risk Oversight for Fidelity Investments (2002). Pre viously, he served as Executive Vice President and Chief Operating Officer for Fidelity Investments Institutional Services Company, Inc. (1998 2002).
| John R. Hebble (47) |
Year of Election or Appointment: 2005
Deputy Treasurer of the fund. Mr. Hebble also serves as Deputy Treasurer of other Fidelity funds (2003), and is an employee of FMR. Before joining Fidelity Investments, Mr. Hebble worked at Deutsche Asset Management where he served as Director of Fund Accounting (2002 2003) and Assistant Treasurer of the Scudder Funds (1998 2003).
| Bryan A. Mehrmann (44) |
Year of Election or Appointment: 2005
Deputy Treasurer of the fund. Mr. Mehrmann also serves as Deputy Treasurer of other Fidelity funds (2005 present) and is an employee of FMR. Previously, Mr. Mehrmann served as Vice President of Fidelity In vestments Institutional Services Group (FIIS)/Fidelity Investments Institu tional Operations Corporation, Inc. (FIIOC) Client Services (1998 2004).
| Kimberley H. Monasterio (41) |
Year of Election or Appointment: 2005
Deputy Treasurer of the fund. Ms. Monasterio also serves as Deputy Treasurer of other Fidelity funds (2004) and is an employee of FMR (2004). Before joining Fidelity Investments, Ms. Monasterio served as Treasurer (2000 2004) and Chief Financial Officer (2002 2004) of the Franklin Templeton Funds and Senior Vice President of Franklin Temple ton Services, LLC (2000 2004).
| Annual Report |
| 42 |
| Name, Age; Principal Occupation Kenneth B. Robins (36) |
Year of Election or Appointment: 2005
Deputy Treasurer of the fund. Mr. Robins also serves as Deputy Treasurer of other Fidelity funds (2005 present) and is an employee of FMR (2005 present). Before joining Fidelity Investments, Mr. Robins worked at KPMG LLP, where he was a partner in KPMG’s department of profes sional practice (2002 2004) and a Senior Manager (1999 2000). In addition, Mr. Robins served as Assistant Chief Accountant, United States Securities and Exchange Commission (2000 2002).
| Robert G. Byrnes (38) |
Year of Election or Appointment: 2005
Assistant Treasurer of the fund. Mr. Byrnes also serves as Assistant Treas urer of other Fidelity funds (2005 present) and is an employee of FMR (2005 present). Previously, Mr. Byrnes served as Vice President of FPCMS (2003 2005). Before joining Fidelity Investments, Mr. Byrnes worked at Deutsche Asset Management where he served as Vice Presi dent of the Investment Operations Group (2000 2003).
| John H. Costello (59) |
Year of Election or Appointment: 2005
Assistant Treasurer of the fund. Mr. Costello also serves as Assistant Treasurer of other Fidelity funds and is an employee of FMR.
| Peter L. Lydecker (51) |
Year of Election or Appointment: 2005
Assistant Treasurer of the fund. Mr. Lydecker also serves as Assistant Treasurer of other Fidelity funds (2004) and is an employee of FMR.
| Mark Osterheld (50) |
Year of Election or Appointment: 2005
Assistant Treasurer of the fund. Mr. Osterheld also serves as Assistant Treasurer of other Fidelity funds (2002) and is an employee of FMR.
| Gary W. Ryan (47) |
Year of Election or Appointment: 2005
Assistant Treasurer of the fund. Mr. Ryan also serves as Assistant Treas urer of other Fidelity funds (2005 present) and is an employee of FMR (2005 present). Previously, Mr. Ryan served as Vice President of Fund Reporting in FPCMS (1999 2005).
43 Annual Report
Trustees and Officers - continued
| Name, Age; Principal Occupation Salvatore Schiavone (39) |
Year of Election or Appointment: 2005
Assistant Treasurer of the fund. Mr. Schiavone also serves as Assistant Treasurer of other Fidelity funds (2005 present) and is an employee of FMR (2005 present). Before joining Fidelity Investments, Mr. Schiavone worked at Deutsche Asset Management, where he most recently served as Assistant Treasurer (2003 2005) of the Scudder Funds and Vice Pres ident and Head of Fund Reporting (1996 2003).
| Annual Report |
| 44 |
| Distributions |
The Board of Trustees of Fidelity International Small Cap Opportunities Fund voted to pay to shareholders of record at the opening of business on record date, the following distributions per share derived from capital gains realized from sales of portfolio securities, and dividends derived from net investment income:
| Pay Date | Record Date | Dividends | Capital Gains | |||||
| Class A | 12/12/05 | 12/9/05 | — | $.003 |
The fund will notify shareholders in January 2006 of amounts for use in preparing 2005 income tax returns.
45 Annual Report
Board Approval of Investment Advisory Contracts and Management Fees
Fidelity International Small Cap Opportunities Fund
On July 21, 2005, the Board of Trustees, including the independent Trustees (together, the Board), voted to approve the management contract and subadvisory agreements (together, the Advisory Contracts) for the fund. The Board, assisted by the advice of fund counsel and independent Trustees’ counsel, considered a broad range of information.
In determining whether to approve the Advisory Contracts for the fund, the Board was aware that shareholders have a broad range of investment choices available to them, including a wide choice among mutual funds offered by competitors to Fidelity, and that shareholders, with the opportunity to review and weigh the disclosure provided by the fund in its prospectus and other public disclosures, may choose to invest in this fund, managed by Fidelity.
Nature, Extent, and Quality of Services Provided by Fidelity. The Board consid ered staffing within the investment adviser, FMR, and the sub advisers (together, the Investment Advisers), including the background of the fund’s portfolio manager and the fund’s investment objective and discipline.
Fidelity Resources Dedicated to Investment Management and Support Services. The Board considered Fidelity’s extensive global research capabilities that enable the Investment Advisers to aggregate data from various sources in an effort to produce positive investment results. The Board noted that Fidelity’s analysts have access to a variety of technological tools that enable them to perform both fundamental and quanti tative analysis and to specialize in various disciplines. The Board also considered that Fidelity’s portfolio managers and analysts have access to daily portfolio attribution that allows for monitoring of a fund’s portfolio, as well as an electronic communication system that provides immediate real time access to research concerning issuers and credit enhancers.
Shareholder and Administrative Services. The Board considered the nature, extent, quality, and cost of administrative, distribution, and shareholder services performed by the Investment Advisers and their affiliates under the Advisory Contracts and under separate agreements covering transfer agency, pricing and bookkeeping, and securities lending services for the fund. The Board also considered the nature and extent of the Investment Advisers’ supervision of third party service providers, principally custodians and subcustodians.
The Board noted that the growth of fund assets across the complex allows Fidelity to reinvest in the development of services designed to enhance the value or convenience of the Fidelity funds as investment vehicles. These services include 24 hour access to account information and market information through phone representatives and over the Internet, and investor education materials and asset allocation tools.
| Annual Report |
| 46 |
Investment in a Large Fund Family. The Board considered the benefits to shareholders of investing in a Fidelity fund, including the benefits of investing in a fund that is part of a large family of funds offering a variety of investment disciplines and providing for a large variety of mutual fund investor services. For example, fund shareholders are offered the privilege of exchanging shares of the fund for shares of other Fidelity funds, as set forth in the fund’s prospectus, without paying an additional sales charge.
Investment Performance. Fidelity International Small Cap Opportunities Fund is a new fund and therefore had no historical performance for the Board to review at the time it approved the fund’s Advisory Contracts.
The Board considered that the fund’s management fee is subject to upward or downward adjustment depending upon whether, and to what extent, the fund’s investment perfor mance for the performance period exceeds, or is exceeded by, the record (over the same period) of a Board approved performance adjustment index. The Board realizes that the performance adjustment provides FMR with a strong economic incentive to seek to achieve superior performance for the fund’s shareholders and helps to more closely align the interests of FMR and the fund’s shareholders.
Based on its review, the Board concluded that the nature, extent, and quality of the services provided by Fidelity will benefit the fund’s shareholders, particularly in light of the Board’s view that the fund’s shareholders benefit from investing in a fund that is part of a large family of funds offering a variety of investment disciplines and services.
Competitiveness of Management Fee and Total Fund Expenses. The Board considered the fund’s proposed management fee and projected total operating expenses in reviewing the Advisory Contracts. The Board noted that the fund’s proposed manage ment fee rate is lower than the median fee rate of funds with similar Lipper investment objective categories and comparable management fee characteristics. The Board also considered that the projected total operating expenses are comparable to those of similar classes and funds that Fidelity offers to shareholders.
Based on its review, the Board concluded that the fund’s management fee and the total expenses for each class of the fund were fair and reasonable in light of the services that the fund and its shareholders receive and the other factors considered.
Costs of the Services and Profitability. The fund is a new fund and therefore no revenue, cost, or profitability data was available for the Board to review in respect of the fund at the time it approved the Advisory Contracts.
Economies of Scale. The Board considered the extent to which the fund will benefit from economies of scale through increased services to the fund, through waivers or reimbursements, or through fee or expense reductions, including reductions that occur through operation of the transfer agent agreement. The transfer agent fee varies in part
47 Annual Report
Board Approval of Investment Advisory Contracts and Management Fees continued
based on the number of accounts in the fund. If the number of accounts decreases or the average account size increases, the overall transfer agent fee rate decreases.
The Board recognized that the fund’s management contract incorporates a “group fee” structure, which provides for lower fee rates as total fund assets under FMR’s manage ment increase, and for higher fee rates as total fund assets under FMR’s management decrease. The Board considered that the group fee is designed to deliver the benefits of economies of scale to fund shareholders when total fund assets increase, even if assets of any particular fund are unchanged or have declined, because some portion of Fidelity’s costs are attributable to services provided to all Fidelity funds, and all funds benefit if those costs can be allocated among more assets.
The Board concluded that, given the group fee structure, fund shareholders will achieve a certain level of economies of scale as assets under FMR’s management increase at the fund complex level, regardless of whether Fidelity achieves any such economies of scale.
Based on its evaluation of all of the conclusions noted above, and after considering all material factors, the Board ultimately concluded that the advisory fee structures are fair and reasonable, and that the fund’s Advisory Contracts should be approved.
| Annual Report |
| 48 |
49 Annual Report
| Annual Report |
| 50 |
51 Annual Report
| Annual Report |
| 52 |
53 Annual Report
| Annual Report |
| 54 |
55 Annual Report
| Investment Adviser Fidelity Management & Research Company Boston, MA Investment Sub Advisers FMR Co., Inc. Fidelity Management & Research (U.K.) Inc. Fidelity Management & Research (Far East) Inc. Fidelity International Investment Advisors Fidelity Investments Japan Limited Fidelity International Investment Advisors (U.K.) Limited General Distributor Fidelity Distributors Corporation Boston, MA Transfer and Service Agents Fidelity Investments Institutional Operations Company, Inc. Boston, MA Fidelity Service Company, Inc. Boston, MA Custodian The Northern Trust Company Chicago, IL |
| AILS-UANN-1205 1.815089.100 |


| Fidelity Advisor International Small Cap Opportunities Fund - Institutional Class |
| Annual Report October 31, 2005 |

Institutional Class is a class of Fidelity® International Small Cap Opportunities Fund
| Contents | ||||
| Chairman’s Message | 4 | Ned Johnson’s message to shareholders. | ||
| Shareholder Expense | 5 | An example of shareholder expenses. | ||
| Example | ||||
| Investment Summary | 7 | A summary of the fund’s investments. | ||
| Investments | 9 | A complete list of the fund’s investments | ||
| with their market values. | ||||
| Financial Statements | 15 | Statements of assets and liabilities, | ||
| operations, and changes in net assets, | ||||
| as well as financial highlights. | ||||
| Notes | 25 | Notes to the financial statements. | ||
| Report of Independent | 33 | |||
| Registered Public | ||||
| Accounting Firm | ||||
| Trustees and Officers | 34 | |||
| Distributions | 45 | |||
| Board Approval of | 46 | |||
| Investment Advisory | ||||
| Contracts and | ||||
| Management Fees | ||||
| To view a fund’s proxy voting guidelines and proxy voting record for the 12 month period ended June 30, visit www.fidelity.com/proxyvotingresults or visit the Securities and Exchange Commis sion’s (SEC) web site at www.sec.gov. You may also call 1-877-208-0098 to request a free copy of the proxy voting guidelines. Standard & Poor’s, S&P and S&P 500 are registered service marks of The McGraw Hill Companies, Inc. and have been licensed for use by Fidelity Distributors Corporation. Other third party marks appearing herein are the property of their respective owners. All other marks appearing herein are registered or unregistered trademarks or service marks of FMR Corp. or an affiliated company. |
| Annual Report |
| 2 |
| This report and the financial statements contained herein are submitted for the general information of the shareholders of the fund. This report is not authorized for distribution to prospective investors in the fund unless preceded or accompanied by an effective prospectus. A fund files its complete schedule of portfolio holdings with the SEC for the first and third quarters of each fiscal year on Form N Q. Forms N Q are available on the SEC’s web site at http://www.sec.gov. A fund’s Forms N Q may be reviewed and copied at the SEC’s Public Reference Room in Washington, DC. Information regarding the operation of the SEC’s Public Reference Room may be obtained by calling 1-800-SEC-0330. For a complete list of a fund’s portfolio hold ings, view the most recent quarterly holdings report, semiannual report, or annual report on Fidelity’s web site at http://www.advisor.fidelity.com. NOT FDIC INSURED · MAY LOSE VALUE · NO BANK GUARANTEE Neither the fund nor Fidelity Distributors Corporation is a bank. |
3 Annual Report
Chairman’s Message
(photograph of Edward C. Johnson 3d)
Dear Shareholder:
During the past year or so, much has been reported about the mutual fund industry, and much of it has been more critical than I believe is warranted. Allegations that some companies have been less than forthright with their shareholders have cast a shadow on the entire industry. I continue to find these reports disturbing, and assert that they do not create an accurate picture of the industry overall. Therefore, I would like to remind every one where Fidelity stands on these issues. I will say two things specifically regarding allegations that some mutual fund companies were in violation of the Securities and Exchange Commission’s forward pricing rules or were involved in so called “market timing” activities.
First, Fidelity has no agreements that permit customers who buy fund shares after 4 p.m. to obtain the 4 p.m. price. This is not a new policy. This is not to say that some one could not deceive the company through fraudulent acts. However, we are extremely diligent in preventing fraud from occurring in this manner and in every other. But I underscore again that Fidelity has no so called “agreements” that sanction illegal practices.
Second, Fidelity continues to stand on record, as we have for years, in opposition to predatory short term trading that adversely affects shareholders in a mutual fund. Back in the 1980s, we initiated a fee which is returned to the fund and, therefore, to investors to discourage this activity. Further, we took the lead several years ago in developing a Fair Value Pricing Policy to prevent market timing on foreign securities in our funds. I am confident we will find other ways to make it more difficult for predatory traders to operate. However, this will only be achieved through close cooperation among regulators, legislators and the industry.
Yes, there have been unfortunate instances of unethical and illegal activity within the mutual fund industry from time to time. That is true of any industry. When this occurs, confessed or convicted offenders should be dealt with appropriately. But we are still concerned about the risk of over regulation and the quick application of simplistic solutions to intricate problems. Every system can be improved, and we support and applaud well thought out improvements by regulators, legislators and industry representatives that achieve the common goal of building and protecting the value of investors’ holdings.
For nearly 60 years, Fidelity has worked very hard to improve its products and service to justify your trust. When our family founded this company in 1946, we had only a few hundred customers. Today, we serve more than 18 million customers in cluding individual investors and participants in retirement plans across America.
Let me close by saying that we do not take your trust in us for granted, and we realize that we must always work to improve all aspects of our service to you. In turn, we urge you to continue your active participation with your financial matters, so that your interests can be well served.
Best regards,
/s/ Edward C. Johnson 3d
Edward C. Johnson 3d
Annual Report 4
Shareholder Expense Example
As a shareholder of the Fund, you incur two types of costs: (1) transaction costs, including sales charges (loads) on purchase payments or redemption proceeds, redemption fees, and (2) ongoing costs, including management fees, distribution and/or service (12b 1) fees and other Fund expenses. This Example is intended to help you understand your ongoing costs (in dollars) of investing in the Fund and to compare these costs with the ongoing costs of investing in other mutual funds.
The actual expense Example is based on an investment of $1,000 invested at the beginning of the period and held for the entire period (August 2, 2005 to October 31, 2005). The hypothetical expense Example is based on an investment of $1,000 invested for the one half year period (May 1, 2005 to October 31, 2005).
| Actual Expenses |
The first line of the table below for each class of the Fund provides information about actual account values and actual expenses. You may use the information in this line, together with the amount you invested, to estimate the expenses that you paid over the period. Simply divide your account value by $1,000.00 (for example, an $8,600 account value divided by $1,000.00 = 8.6), then multiply the result by the number in the first line for a class of the Fund under the heading entitled “Expenses Paid During Period” to estimate the expenses you paid on your account during this period.
Hypothetical Example for Comparison Purposes
The second line of the table below for each class of the Fund provides information about hypothetical account values and hypothetical expenses based on a Class’ actual expense ratio and an assumed rate of return of 5% per year before expenses, which is not the Class’ actual return. The hypothetical account values and expenses may not be used to estimate the actual ending account balance or expenses you paid for the period. You may use this information to compare the ongoing costs of investing in the Fund and other funds. To do so, compare this 5% hypothetical example with the 5% hypothetical examples that appear in the shareholder reports of the other funds.
5 Annual Report
Shareholder Expense Example continued
Please note that the expenses shown in the table are meant to highlight your ongoing costs only and do not reflect any transaction costs. Therefore, the second line of the table is useful in comparing ongoing costs only, and will not help you determine the relative total costs of owning different funds. In addition, if these transactional costs were included, your costs would have been higher.
| Ending | ||||||||||||
| Beginning | Account Value | Expenses Paid | ||||||||||
| Account Value | October 31, 2005 | During Period | ||||||||||
| Class A | ||||||||||||
| Actual | $ | 1,000.00 | $ | 1,041.00 | $ | 4.20B | ||||||
| HypotheticalA | $ | 1,000.00 | $ | 1,016.89 | $ | 8.39C | ||||||
| Class T | ||||||||||||
| Actual | $ | 1,000.00 | $ | 1,038.00 | $ | 4.83B | ||||||
| HypotheticalA | $ | 1,000.00 | $ | 1,015.63 | $ | 9.65C | ||||||
| Class B | ||||||||||||
| Actual | $ | 1,000.00 | $ | 1,037.00 | $ | 6.09B | ||||||
| HypotheticalA | $ | 1,000.00 | $ | 1,013.11 | $ | 12.18C | ||||||
| Class C | ||||||||||||
| Actual | $ | 1,000.00 | $ | 1,037.00 | $ | 6.09B | ||||||
| HypotheticalA | $ | 1,000.00 | $ | 1,013.11 | $ | 12.18C | ||||||
| Fidelity International Small Cap | ||||||||||||
| Opportunities Fund | ||||||||||||
| Actual | $ | 1,000.00 | $ | 1,040.00 | $ | 3.56B | ||||||
| HypotheticalA | $ | 1,000.00 | $ | 1,018.15 | $ | 7.12C | ||||||
| Institutional Class | ||||||||||||
| Actual | $ | 1,000.00 | $ | 1,040.00 | $ | 3.56B | ||||||
| HypotheticalA | $ | 1,000.00 | $ | 1,018.15 | $ | 7.12C |
| A 5% return per year before expenses B Actual expenses are equal to each Class’ annualized expense ratio (shown in the |
| table below); multiplied by the average account value over the period, multiplied by 91/365 (to reflect the period August 2, 2005 to October 31, 2005). C Hypothetical expenses are equal to each Class’ annualized expense ratio (shown in the table below); multiplied by the average account value over the period, multiplied by 184/365 (to reflect the one half year period). |
| Annualized | ||
| Expense Ratio | ||
| Class A | 1.65% | |
| Class T | 1.90% | |
| Class B | 2.40% | |
| Class C | 2.40% | |
| Fidelity International Small Cap Opportunities Fund | 1.40% | |
| Institutional Class | 1.40% |
| Annual Report |
| 6 |
Investment Summary
| Geographic Diversification (% of fund’s net assets) | ||
| As of October 31, 2005 | ||
| Japan | 35.3% | |
| France | 8.9% | |
| Korea (South) | 8.1% | |
| United Kingdom | 7.3% | |
| United States of America | 7.3% | |
| Germany | 6.7% | |
| Australia | 5.7% | |
| Norway | 3.1% | |
| Finland | 3.1% | |
| Other | 14.5% | |
| Percentages are adjusted for the effect of futures contracts, if applicable. | ||
| Asset Allocation | ||
| % of fund’s | ||
| net assets | ||
| Stocks | 100.6 | |
| Net Other Assets | (0.6) | |
| Top Ten Stocks as of October 31, 2005 | ||
| % of fund’s | ||
| net assets | ||
| CSL Ltd. (Australia, Biotechnology) | 2.1 | |
| Neopost SA (France, Office Electronics) | 2.0 | |
| NTL, Inc. (United States of America, Media) | 2.0 | |
| Alstom SA (France, Electrical Equipment) | 1.7 | |
| Orion Corp. (Korea (South), Food Products) | 1.6 | |
| Ryohin Keikaku Co. Ltd. (Japan, Multiline Retail) | 1.5 | |
| KCI Konecranes Oyj (Finland, Machinery) | 1.4 | |
| Teijin Ltd. (Japan, Chemicals) | 1.4 | |
| PMP Ltd. (Australia, Commercial Services & Supplies) | 1.4 | |
| Motech Industries, Inc. (Taiwan, Electrical Equipment) | 1.4 | |
| 16.5 |
7 Annual Report
| Investments continued | ||
| Market Sectors as of October 31, 2005 | ||
| % of fund’s | ||
| net assets | ||
| Industrials | 26.5 | |
| Consumer Discretionary | 17.0 | |
| Materials | 12.4 | |
| Information Technology | 12.1 | |
| Financials | 12.0 | |
| Energy | 10.5 | |
| Consumer Staples | 5.9 | |
| Health Care | 3.8 | |
| Telecommunication Services | 0.4 | |
| Annual Report |
| 8 |
| Investments October 31, 2005 | ||||||
| Showing Percentage of Net Assets | ||||||
| Common Stocks 100.6% | ||||||
| Shares | Value (Note 1) | |||||
| Australia – 5.7% | ||||||
| ABC Learning Centres Ltd. | 230,000 | $ | 1,117,886 | |||
| Bradken Ltd. | 179,061 | 502,098 | ||||
| Computershare Ltd. | 241,800 | 1,184,279 | ||||
| CSL Ltd. | 158,300 | 4,438,824 | ||||
| Downer EDI Ltd. | 451,175 | 2,051,186 | ||||
| PMP Ltd. (a) | 2,516,300 | 2,963,462 | ||||
| TOTAL AUSTRALIA | 12,257,735 | |||||
| Austria – 0.1% | ||||||
| IMMOFINANZ Immobilien Anlagen AG (a) | 21,900 | 211,859 | ||||
| Bermuda – 0.8% | ||||||
| China Lotsynergy Holding Ltd. (a) | 4,390,000 | 1,444,060 | ||||
| Paul Y. Engineering Group Ltd. | 2,386,000 | 215,451 | ||||
| TOTAL BERMUDA | 1,659,511 | |||||
| Canada 0.2% | ||||||
| Oilexco, Inc. (a) | 106,500 | 360,711 | ||||
| China – 1.1% | ||||||
| China Sun Bio-chem Technology Group Co. Ltd. | 661,000 | 171,704 | ||||
| Global Bio-Chem Technology Group Co. Ltd. | 5,723,300 | 2,270,243 | ||||
| TOTAL CHINA | 2,441,947 | |||||
| Finland – 3.1% | ||||||
| KCI Konecranes Oyj | 69,650 | 3,026,619 | ||||
| Metso Corp. | 81,800 | 2,127,853 | ||||
| Neste Oil Oyj | 44,600 | 1,382,051 | ||||
| TOTAL FINLAND | 6,536,523 | |||||
| France – 8.9% | ||||||
| Alstom SA (a) | 74,962 | 3,593,529 | ||||
| BVRP Software SA (a) | 16,300 | 381,413 | ||||
| Compagnie Generale de Geophysique SA (a) | 25,000 | 2,180,227 | ||||
| Elior SA | 140,000 | 1,825,936 | ||||
| Infovista SA (a) | 68,700 | 383,770 | ||||
| Neopost SA | 45,100 | 4,352,122 | ||||
| Nexity | 27,693 | 1,264,473 | ||||
| Silicon On Insulator Technologies SA (SOITEC) (a) | 139,200 | 2,084,156 | ||||
| Vallourec SA | 6,500 | 2,921,953 | ||||
| TOTAL FRANCE | 18,987,579 | |||||
| Germany – 6.7% | ||||||
| CeWe Color Holding AG | 28,800 | 1,525,961 | ||||
| See accompanying notes which are an integral part of the financial statements. | ||||||
| 9 | Annual Report | |||||
| Investments continued | ||||||
| Common Stocks continued | ||||||
| Shares | Value (Note 1) | |||||
| Germany – continued | ||||||
| ESCADA AG (a) | 25,000 | $ | 635,338 | |||
| Fielmann AG | 4,500 | 307,210 | ||||
| Fresenius AG | 4,800 | 619,073 | ||||
| MTU Aero Engines Holding AG | 92,600 | 2,691,853 | ||||
| Muehlbauer Holding AG & Co. | 7,400 | 340,814 | ||||
| Norddeutsche Affinerie AG | 6,500 | 139,085 | ||||
| Rheinmetall AG | 6,400 | 393,804 | ||||
| Salzgitter AG | 30,000 | 1,313,351 | ||||
| SolarWorld AG | 20,000 | 2,702,462 | ||||
| Techem AG (a) | 27,000 | 1,074,560 | ||||
| United Internet AG | 77,400 | 2,500,509 | ||||
| TOTAL GERMANY | 14,244,020 | |||||
| Hong Kong – 1.5% | ||||||
| Burwill Holdings Ltd. | 2,482,000 | 192,103 | ||||
| Hanny Holdings Ltd. | 2,018,402 | 1,132,603 | ||||
| Hengan International Group Co. Ltd. | 313,400 | 291,080 | ||||
| PYI Corp. Ltd. | 5,333,752 | 1,018,299 | ||||
| Techtronic Industries Co. Ltd. | 214,500 | 527,112 | ||||
| TOTAL HONG KONG | 3,161,197 | |||||
| Ireland – 0.1% | ||||||
| DEPFA BANK PLC | 10,700 | 166,746 | ||||
| Italy 1.0% | ||||||
| Banca Italease Spa | 98,100 | 2,075,476 | ||||
| Japan 35.3% | ||||||
| Aeon Co. Ltd. | 55,800 | 1,159,769 | ||||
| Aoyama Trading Co. Ltd. | 16,400 | 494,253 | ||||
| Argo Graphics, Inc. | 46,400 | 1,084,946 | ||||
| Asics Corp. | 43,000 | 370,898 | ||||
| Bals Corp. | 291 | 937,480 | ||||
| Bank of Nagoya Ltd. | 153,000 | 1,381,981 | ||||
| Capcom Co. Ltd. | 22,500 | 226,810 | ||||
| Chiyoda Corp. | 100,000 | 1,727,703 | ||||
| Chiyoda Integre Co. Ltd. | 60,400 | 1,532,607 | ||||
| Daikin Industries Ltd. | 39,900 | 1,043,533 | ||||
| E*TRADE Securities Co. Ltd. | 285 | 1,498,165 | ||||
| EDION Corp. | 160,000 | 2,520,455 | ||||
| Excite Japan Co. Ltd | 138 | 838,962 | ||||
| Fujikura Ltd. | 175,000 | 1,133,616 | ||||
| Hitachi Metals Ltd. | 212,000 | 2,182,951 | ||||
| Hokuhoku Financial Group, Inc. | 436,000 | 1,808,624 | ||||
See accompanying notes which are an integral part of the financial statements.
| Annual Report |
| 10 |
| Common Stocks continued | ||||||
| Shares | Value (Note 1) | |||||
| Japan – continued | ||||||
| Hokuto Corp. | 8,200 | $ | 133,079 | |||
| Ibiden Co. Ltd. | 23,700 | 960,551 | ||||
| Ichiyoshi Securities Co. Ltd. | 267,200 | 2,869,355 | ||||
| Intelligent Wave, Inc. | 845 | 2,802,733 | ||||
| Isuzu Motors Ltd. | 250,000 | 976,434 | ||||
| Japan Steel Works Ltd | 162,000 | 580,820 | ||||
| JGC Corp. | 141,000 | 2,309,069 | ||||
| Joint Corp. | 22,700 | 1,234,559 | ||||
| JSR Corp. | 69,600 | 1,648,514 | ||||
| Kayaba Industry Co. Ltd. | 196,000 | 775,708 | ||||
| Miraial Co. Ltd. | 28,700 | 2,440,729 | ||||
| Mitsui Engineering & Shipbuilding Co. | 599,000 | 1,442,108 | ||||
| Mitsui Mining & Smelting Co. Ltd. | 380,000 | 2,171,970 | ||||
| Modec, Inc. | 45,300 | 1,278,916 | ||||
| Nabtesco Corp. | 132,000 | 1,112,277 | ||||
| NGK Insulators Ltd. | 81,000 | 968,735 | ||||
| NGK Spark Plug Co. Ltd. | 66,000 | 1,062,550 | ||||
| Nifco, Inc. | 25,000 | 421,750 | ||||
| Nisshin Fudosan Co. Ltd. | 119,900 | 1,769,355 | ||||
| Nissin Co. Ltd. | 386,600 | 562,467 | ||||
| Nissin Co. Ltd. New | 323,600 | 465,203 | ||||
| Omron Corp. | 26,500 | 627,667 | ||||
| Ryohin Keikaku Co. Ltd. | 46,900 | 3,127,446 | ||||
| Saint Marc Co. Ltd. | 2,600 | 131,721 | ||||
| Sammy NetWorks Co. Ltd. | 46 | 577,633 | ||||
| Sega Sammy Holdings, Inc. | 11,200 | 403,494 | ||||
| Sega Sammy Holdings, Inc. New | 22,400 | 812,809 | ||||
| Seiyu Ltd. (a) | 795,000 | 1,631,705 | ||||
| SFCG Co. Ltd. | 990 | 239,117 | ||||
| Sugi Pharmacy Co. Ltd. | 49,200 | 1,908,839 | ||||
| Sumisho Lease Co. Ltd. | 5,400 | 257,207 | ||||
| Sumitomo Titanium Corp. New | 5,100 | 574,169 | ||||
| Take & Give Needs Co. Ltd. (a) | 2,000 | 2,805,894 | ||||
| Techmatrix Corp. | 128 | 279,342 | ||||
| Teijin Ltd | 500,000 | 2,987,757 | ||||
| Telewave, Inc. | 46 | 268,898 | ||||
| The Sumitomo Warehouse Co. Ltd. | 200,000 | 1,555,366 | ||||
| Toho Tenax Co. Ltd. (a) | 313,000 | 1,263,154 | ||||
| Tokuyama Corp. | 93,000 | 926,205 | ||||
| Tokyo Seimitsu Co. Ltd. | 8,400 | 386,278 | ||||
| Tokyu Land Corp. | 120,000 | 955,043 | ||||
| Toray Industries, Inc. | 200,000 | 1,115,429 | ||||
See accompanying notes which are an integral part of the financial statements.
11 Annual Report
| Investments continued | ||||||
| Common Stocks continued | ||||||
| Shares | Value (Note 1) | |||||
| Japan – continued | ||||||
| UFJ Central Leasing Co. Ltd. | 11,200 | $ | 622,701 | |||
| Venture Link Co. Ltd. (a) | 960,300 | 2,852,510 | ||||
| Yasuragi Co. Ltd. (a) | 26,100 | 881,518 | ||||
| Yuraku Real Estate Co. Ltd. | 56,000 | 326,869 | ||||
| TOTAL JAPAN | 75,448,406 | |||||
| Korea (South) 8.1% | ||||||
| Daewoo Securities Co. Ltd. (a) | 242,110 | 2,608,943 | ||||
| Hyundai Department Store Co. Ltd. | 20,090 | 1,333,560 | ||||
| Hyundai Mipo Dockyard Co. Ltd. | 27,350 | 1,689,726 | ||||
| Korea Investment Holdings Co. Ltd. | 103,090 | 2,646,371 | ||||
| LG Card Co. Ltd. (a) | 53,290 | 1,924,360 | ||||
| Orion Corp. | 17,322 | 3,359,869 | ||||
| Shinhan Financial Group Co. Ltd. | 83,240 | 2,774,665 | ||||
| Yedang Entertainment Co. Ltd. (a) | 65,000 | 1,008,620 | ||||
| TOTAL KOREA (SOUTH) | 17,346,114 | |||||
| Luxembourg 0.2% | ||||||
| Stolt-Nielsen SA | 15,000 | 527,974 | ||||
| Mexico – 0.8% | ||||||
| Grupo Mexico SA de CV Series B | 933,120 | 1,800,318 | ||||
| Netherlands – 1.4% | ||||||
| Fugro NV (Certificaten Van Aandelen) unit | 72,700 | 1,964,341 | ||||
| Koninklijke Boskalis Westminster NV (Certificaten Van | ||||||
| Aandelen) | 19,300 | 958,982 | ||||
| TOTAL NETHERLANDS | 2,923,323 | |||||
| Norway 3.1% | ||||||
| Det Norske Oljeselskap ASA (DNO) (A Shares) | 422,100 | 2,069,627 | ||||
| Fred Olsen Energy ASA (a) | 75,400 | 2,080,280 | ||||
| Norse Energy Corp. ASA (a) | 686,000 | 362,718 | ||||
| Petroleum Geo-Services ASA (a) | 52,800 | 1,339,072 | ||||
| Schibsted ASA (B Shares) | 24,600 | 708,961 | ||||
| TOTAL NORWAY | 6,560,658 | |||||
| Poland – 0.0% | ||||||
| Powszechna Kasa Oszczednosci Bank SA | 3,900 | 32,793 | ||||
| Singapore – 0.6% | ||||||
| STATS ChipPAC Ltd. (a) | 2,364,000 | 1,297,943 | ||||
| South Africa 0.5% | ||||||
| Steinhoff International Holdings Ltd. | 448,000 | 1,172,411 | ||||
See accompanying notes which are an integral part of the financial statements.
| Annual Report |
| 12 |
| Common Stocks continued | ||||||
| Shares | Value (Note 1) | |||||
| Sweden – 3.1% | ||||||
| Boliden AB (a) | 501,000 | $ | 2,561,147 | |||
| Eniro AB | 111,300 | 1,216,233 | ||||
| Gambro AB (B Shares) | 42,600 | 599,280 | ||||
| International Business Systems AB (IBS) (B Shares) (a) | 69,000 | 173,333 | ||||
| Lindex AB | 36,500 | 1,771,923 | ||||
| Modern Times Group AB (MTG) (B Shares) (a) | 5,050 | 193,144 | ||||
| TOTAL SWEDEN | 6,515,060 | |||||
| Switzerland – 1.3% | ||||||
| Actelion Ltd. (Reg.) (a) | 19,913 | 2,239,759 | ||||
| Phonak Holding AG | 5,608 | 233,821 | ||||
| Sika AG (Bearer) | 533 | 379,548 | ||||
| TOTAL SWITZERLAND | 2,853,128 | |||||
| Taiwan 1.6% | ||||||
| Chipbond Technology Corp. | 376,000 | 487,489 | ||||
| Motech Industries, Inc. | 269,000 | 2,934,414 | ||||
| TOTAL TAIWAN | 3,421,903 | |||||
| Turkey 0.8% | ||||||
| Tupras Turkiye Petrol Rafinerileri AS | 100,000 | 1,709,212 | ||||
| United Kingdom – 7.3% | ||||||
| AMEC PLC | 122,600 | 740,165 | ||||
| British Land Co. PLC | 59,200 | 932,815 | ||||
| Burren Energy PLC | 100,000 | 1,416,360 | ||||
| Carillion PLC | 83,000 | 407,779 | ||||
| Development Securities PLC | 37,100 | 301,817 | ||||
| Hunting PLC | 500,000 | 2,525,104 | ||||
| Inchcape PLC | 33,000 | 1,203,552 | ||||
| Informa PLC | 12,200 | 80,836 | ||||
| ITE Group PLC | 154,700 | 309,494 | ||||
| London Clubs International PLC (a) | 70,200 | 151,007 | ||||
| Meggitt PLC | 466,200 | 2,496,786 | ||||
| Rank Group PLC | 32,700 | 171,365 | ||||
| Richmond Foods PLC | 195,300 | 1,772,066 | ||||
| Sportingbet PLC | 544,701 | 2,840,058 | ||||
| Stanley Leisure PLC | 8,373 | 89,982 | ||||
| Urban Dining PLC (a) | 116,100 | 81,192 | ||||
| TOTAL UNITED KINGDOM | 15,520,378 | |||||
| United States of America – 7.3% | ||||||
| Airgas, Inc. | 85,100 | 2,405,777 | ||||
See accompanying notes which are an integral part of the financial statements.
13 Annual Report
| Investments continued | ||||||||
| Common Stocks continued | ||||||||
| Shares | Value (Note 1) | |||||||
| United States of America – continued | ||||||||
| Covad Communications Group, Inc. (a) | 984,000 | $ | 875,760 | |||||
| NTL, Inc. (a) | 70,100 | 4,298,532 | ||||||
| Oil States International, Inc. (a) | 15,200 | 503,120 | ||||||
| Plains Exploration & Production Co. (a) | 72,500 | 2,827,500 | ||||||
| RTI International Metals, Inc. (a) | 51,500 | 1,726,280 | ||||||
| Titanium Metals Corp. (a) | 62,000 | 2,926,400 | ||||||
| TOTAL UNITED STATES OF AMERICA | 15,563,369 | |||||||
| TOTAL COMMON STOCKS | ||||||||
| (Cost $213,598,275) | 214,796,294 | |||||||
| TOTAL INVESTMENT PORTFOLIO 100.6% | ||||||||
| (Cost $213,598,275) | 214,796,294 | |||||||
| NET OTHER ASSETS – (0.6)% | (1,339,807) | |||||||
| NET ASSETS 100% | $ | 213,456,487 | ||||||
| Legend (a) Non-income producing |
Income Tax Information
At October 31, 2005, the fund had a capital loss carryforward of approximately $3,072,229 all of which will expire on October 31, 2013.
See accompanying notes which are an integral part of the financial statements.
| Annual Report |
| 14 |
| Financial Statements | ||||||||
| Statement of Assets and Liabilities | ||||||||
| October 31, 2005 | ||||||||
| Assets | ||||||||
| Investment in securities, at value (cost $213,598,275) | ||||||||
| See accompanying schedule | $ | 214,796,294 | ||||||
| Foreign currency held at value (cost $11,965) | 11,965 | |||||||
| Receivable for investments sold | 11,394,843 | |||||||
| Receivable for fund shares sold | 3,250,912 | |||||||
| Dividends receivable | 95,243 | |||||||
| Interest receivable | 13,037 | |||||||
| Prepaid expenses | 65,808 | |||||||
| Receivable from investment adviser for expense | ||||||||
| reductions | 112,637 | |||||||
| Other affiliated receivables | 609 | |||||||
| Other receivables | 26,122 | |||||||
| Total assets | 229,767,470 | |||||||
| Liabilities | ||||||||
| Payable to custodian bank | $ | 1,588,751 | ||||||
| Payable for investments purchased | 14,257,737 | |||||||
| Payable for fund shares redeemed | 38,935 | |||||||
| Accrued management fee | 137,069 | |||||||
| Distribution fees payable | 5,670 | |||||||
| Other affiliated payables | 51,769 | |||||||
| Other payables and accrued expenses | 231,052 | |||||||
| Total liabilities | 16,310,983 | |||||||
| Net Assets | $ | 213,456,487 | ||||||
| Net Assets consist of: | ||||||||
| Paid in capital | $ | 215,542,869 | ||||||
| Undistributed net investment income | 25,213 | |||||||
| Accumulated undistributed net realized gain (loss) on | ||||||||
| investments and foreign currency transactions | (3,306,615) | |||||||
| Net unrealized appreciation (depreciation) on | ||||||||
| investments and assets and liabilities in foreign | ||||||||
| currencies | 1,195,020 | |||||||
| Net Assets | $ | 213,456,487 | ||||||
See accompanying notes which are an integral part of the financial statements.
15 Annual Report
| Financial Statements continued | ||||||
| Statement of Assets and Liabilities continued | ||||||
| October 31, 2005 | ||||||
| Calculation of Maximum Offering Price | ||||||
| Class A: | ||||||
| Net Asset Value and redemption price per share | ||||||
| ($5,532,847 ÷ 531,609 shares) | $ | 10.41 | ||||
| Maximum offering price per share (100/94.25 of | ||||||
| $10.41) | $ | 11.05 | ||||
| Class T: | ||||||
| Net Asset Value and redemption price per share | ||||||
| ($2,704,469 ÷ 260,435 shares) | $ | 10.38 | ||||
| Maximum offering price per share (100/96.50 of | ||||||
| $10.38) | $ | 10.76 | ||||
| Class B: | ||||||
| Net Asset Value and offering price per share | ||||||
| ($1,704,690 ÷ 164,338 shares)A | $ | 10.37 | ||||
| Class C: | ||||||
| Net Asset Value and offering price per share | ||||||
| ($3,316,682 ÷ 319,752 shares)A | $ | 10.37 | ||||
| Fidelity International Small Cap Opportunities | ||||||
| Fund: | ||||||
| Net Asset Value, offering price and redemption | ||||||
| price per share ($197,348,717 ÷ 18,973,897 | ||||||
| shares) | $ | 10.40 | ||||
| Institutional Class: | ||||||
| Net Asset Value, offering price and redemption | ||||||
| price per share ($2,849,082 ÷ 274,003 | ||||||
| shares) | $ | 10.40 | ||||
| A Redemption price per share is equal to net asset value less any applicable contingent deferred sales charge. | ||||||
See accompanying notes which are an integral part of the financial statements.
Annual Report 16
| Statement of Operations | ||||||
| August 2, 2005 (commencement of operations) to October 31, 2005 | ||||||
| Investment Income | ||||||
| Dividends | $ | 333,348 | ||||
| Interest | 61,715 | |||||
| 395,063 | ||||||
| Less foreign taxes withheld | (14,276) | |||||
| Total income | 380,787 | |||||
| Expenses | ||||||
| Management fee | $ | 227,382 | ||||
| Transfer agent fees | 85,754 | |||||
| Distribution fees | 11,741 | |||||
| Accounting fees and expenses | 14,376 | |||||
| Independent trustees’ compensation | 42 | |||||
| Custodian fees and expenses | 131,764 | |||||
| Registration fees | 89,351 | |||||
| Audit | 46,278 | |||||
| Miscellaneous | 1,050 | |||||
| Total expenses before reductions | 607,738 | |||||
| Expense reductions | (252,181) | 355,557 | ||||
| Net investment income (loss) | 25,230 | |||||
| Realized and Unrealized Gain (Loss) | ||||||
| Net realized gain (loss) on: | ||||||
| Investment securities (net of foreign taxes of $6,741) . | (3,249,999) | |||||
| Foreign currency transactions | (56,633) | |||||
| Total net realized gain (loss) | (3,306,632) | |||||
| Change in net unrealized appreciation (depreciation) on: | ||||||
| Investment securities | 1,198,019 | |||||
| Assets and liabilities in foreign currencies | (2,999) | |||||
| Total change in net unrealized appreciation | ||||||
| (depreciation) | 1,195,020 | |||||
| Net gain (loss) | (2,111,612) | |||||
| Net increase (decrease) in net assets resulting from | ||||||
| operations | $ | (2,086,382) | ||||
| See accompanying notes which are an integral part of the financial statements. | ||||||
| 17 | Annual Report | |||||
| Financial Statements continued | ||||
| Statement of Changes in Net Assets | ||||
| August 2, 2005 | ||||
| (commencement | ||||
| of operations) to | ||||
| October 31, 2005 | ||||
| Increase (Decrease) in Net Assets | ||||
| Operations | ||||
| Net investment income (loss) | $ | 25,230 | ||
| Net realized gain (loss) | (3,306,632) | |||
| Change in net unrealized appreciation (depreciation) | 1,195,020 | |||
| Net increase (decrease) in net assets resulting | ||||
| from operations | (2,086,382) | |||
| Share transactions - net increase (decrease) | 215,410,790 | |||
| Redemption fees | 132,079 | |||
| Total increase (decrease) in net assets | 213,456,487 | |||
| Net Assets | ||||
| Beginning of period | — | |||
| End of period (including undistributed net investment income of $25,213) | $ | 213,456,487 | ||
See accompanying notes which are an integral part of the financial statements.
| Annual Report |
| 18 |
| Financial Highlights Class A | ||||
| Year ended October 31, | 2005G | |||
| Selected Per Share Data | ||||
| Net asset value, beginning of period | $ | 10.00 | ||
| Income from Investment Operations | ||||
| Net investment income (loss)E | —I | |||
| Net realized and unrealized gain (loss) | 40F | |||
| Total from investment operations | 40 | |||
| Redemption fees added to paid in capitalE | 01 | |||
| Net asset value, end of period | $ | 10.41 | ||
| Total ReturnB,C,D | 4.10% | |||
| Ratios to Average Net AssetsH | ||||
| Expenses before expense reductions | 2.67%A | |||
| Expenses net of voluntary waivers, if any | 1.65%A | |||
| Expenses net of all reductions | 1.54%A | |||
| Net investment income (loss) | (.09)%A | |||
| Supplemental Data | ||||
| Net assets, end of period (000 omitted) | $ | 5,533 | ||
| Portfolio turnover rate | 46% |
| A Annualized B Total returns for periods of less than one year are not annualized. C Total returns would have been lower had certain expenses not been reduced during the periods shown. D Total returns do not include the effect of the sales charges. E Calculated based on average shares outstanding during the period. F The amount shown for a share outstanding does not correspond with the aggregate net gain (loss) on investments for the period due to the timing of sales and repurchases of shares in relation to fluctuating market values of the investments of the fund. G For the period August 2, 2005 (commencement of operations) to October 31, 2005. H Expense ratios reflect operating expenses of the class. Expenses before reductions do not reflect amounts reimbursed by the investment adviser or reductions from brokerage service arrangements or other expense offset arrangements and do not represent the amount paid by the class during periods when reimbursements or reductions occur. Expense ratios before reductions for start up periods may not be representative of longer term operating periods. Expenses net of any voluntary waivers reflect expenses after reimbursement by the investment adviser but prior to reductions from brokerage service arrangements or other expense offset arrangements. Expenses net of all reductions represent the net expenses paid by the class. I Amount represents less than $.01 per share. |
See accompanying notes which are an integral part of the financial statements.
19 Annual Report
| Financial Highlights Class T | ||||
| Year ended October 31, | 2005G | |||
| Selected Per Share Data | ||||
| Net asset value, beginning of period | $ | 10.00 | ||
| Income from Investment Operations | ||||
| Net investment income (loss)E | (.01) | |||
| Net realized and unrealized gain (loss) | 38F | |||
| Total from investment operations | 37 | |||
| Redemption fees added to paid in capitalE | 01 | |||
| Net asset value, end of period | $ | 10.38 | ||
| Total ReturnB,C,D | 3.80% | |||
| Ratios to Average Net AssetsH | ||||
| Expenses before expense reductions | 2.92%A | |||
| Expenses net of voluntary waivers, if any | 1.90%A | |||
| Expenses net of all reductions | 1.78%A | |||
| Net investment income (loss) | (.33)%A | |||
| Supplemental Data | ||||
| Net assets, end of period (000 omitted) | $ | 2,704 | ||
| Portfolio turnover rate | 46% |
| A Annualized B Total returns for periods of less than one year are not annualized. C Total returns would have been lower had certain expenses not been reduced during the periods shown. D Total returns do not include the effect of the sales charges. E Calculated based on average shares outstanding during the period. F The amount shown for a share outstanding does not correspond with the aggregate net gain (loss) on investments for the period due to the timing of sales and repurchases of shares in relation to fluctuating market values of the investments of the fund. G For the period August 2, 2005 (commencement of operations) to October 31, 2005. H Expense ratios reflect operating expenses of the class. Expenses before reductions do not reflect amounts reimbursed by the investment adviser or reductions from brokerage service arrangements or other expense offset arrangements and do not represent the amount paid by the class during periods when reimbursements or reductions occur. Expense ratios before reductions for start up periods may not be representative of longer term operating periods. Expenses net of any voluntary waivers reflect expenses after reimbursement by the investment adviser but prior to reductions from brokerage service arrangements or other expense offset arrangements. Expenses net of all reductions represent the net expenses paid by the class. |
See accompanying notes which are an integral part of the financial statements.
| Annual Report |
| 20 |
| Financial Highlights Class B | ||||
| Year ended October 31, | 2005G | |||
| Selected Per Share Data | ||||
| Net asset value, beginning of period | $ | 10.00 | ||
| Income from Investment Operations | ||||
| Net investment income (loss)E | (.02) | |||
| Net realized and unrealized gain (loss) | 38F | |||
| Total from investment operations | 36 | |||
| Redemption fees added to paid in capitalE | 01 | |||
| Net asset value, end of period | $ | 10.37 | ||
| Total ReturnB,C,D | 3.70% | |||
| Ratios to Average Net AssetsH | ||||
| Expenses before expense reductions | 3.43%A | |||
| Expenses net of voluntary waivers, if any | 2.40%A | |||
| Expenses net of all reductions | 2.27%A | |||
| Net investment income (loss) | (.82)%A | |||
| Supplemental Data | ||||
| Net assets, end of period (000 omitted) | $ | 1,705 | ||
| Portfolio turnover rate | 46% |
| A Annualized B Total returns for periods of less than one year are not annualized. C Total returns would have been lower had certain expenses not been reduced during the periods shown. D Total returns do not include the effect of the contingent deferred sales charge. E Calculated based on average shares outstanding during the period. F The amount shown for a share outstanding does not correspond with the aggregate net gain (loss) on investments for the period due to the timing of sales and repurchases of shares in relation to fluctuating market values of the investments of the fund. G For the period August 2, 2005 (commencement of operations) to October 31, 2005. H Expense ratios reflect operating expenses of the class. Expenses before reductions do not reflect amounts reimbursed by the investment adviser or reductions from brokerage service arrangements or other expense offset arrangements and do not represent the amount paid by the class during periods when reimbursements or reductions occur. Expense ratios before reductions for start up periods may not be representative of longer term operating periods. Expenses net of any voluntary waivers reflect expenses after reimbursement by the investment adviser but prior to reductions from brokerage service arrangements or other expense offset arrangements. Expenses net of all reductions represent the net expenses paid by the class. |
See accompanying notes which are an integral part of the financial statements.
21 Annual Report
| Financial Highlights Class C | ||||
| Year ended October 31, | 2005G | |||
| Selected Per Share Data | ||||
| Net asset value, beginning of period | $ | 10.00 | ||
| Income from Investment Operations | ||||
| Net investment income (loss)E | (.02) | |||
| Net realized and unrealized gain (loss) | 38F | |||
| Total from investment operations | 36 | |||
| Redemption fees added to paid in capitalE | 01 | |||
| Net asset value, end of period | $ | 10.37 | ||
| Total ReturnB,C,D, | 3.70% | |||
| Ratios to Average Net AssetsH | ||||
| Expenses before expense reductions | 3.32%A | |||
| Expenses net of voluntary waivers, if any | 2.40%A | |||
| Expenses net of all reductions | 2.29%A | |||
| Net investment income (loss) | (.84)%A | |||
| Supplemental Data | ||||
| Net assets, end of period (000 omitted) | $ | 3,317 | ||
| Portfolio turnover rate | 46% |
| A Annualized B Total returns for periods of less than one year are not annualized. C Total returns would have been lower had certain expenses not been reduced during the periods shown. D Total returns do not include the effect of the contingent deferred sales charge. E Calculated based on average shares outstanding during the period. F The amount shown for a share outstanding does not correspond with the aggregate net gain (loss) on investments for the period due to the timing of sales and repurchases of shares in relation to fluctuating market values of the investments of the fund. G For the period August 2, 2005 (commencement of operations) to October 31, 2005. H Expense ratios reflect operating expenses of the class. Expenses before reductions do not reflect amounts reimbursed by the investment adviser or reductions from brokerage service arrangements or other expense offset arrangements and do not represent the amount paid by the class during periods when reimbursements or reductions occur. Expense ratios before reductions for start up periods may not be representative of longer term operating periods. Expenses net of any voluntary waivers reflect expenses after reimbursement by the investment adviser but prior to reductions from brokerage service arrangements or other expense offset arrangements. Expenses net of all reductions represent the net expenses paid by the class. |
See accompanying notes which are an integral part of the financial statements.
| Annual Report |
| 22 |
| Financial Highlights Fidelity International Small Cap Opportunities Fund | ||||
| Year ended October 31, | 2005F | |||
| Selected Per Share Data | ||||
| Net asset value, beginning of period | $ | 10.00 | ||
| Income from Investment Operations | ||||
| Net investment income (loss)D | —H | |||
| Net realized and unrealized gain (loss) | 39E | |||
| Total from investment operations | 39 | |||
| Redemption fees added to paid in capitalD | 01 | |||
| Net asset value, end of period | $ | 10.40 | ||
| Total ReturnB,C | 4.00% | |||
| Ratios to Average Net AssetsG | ||||
| Expenses before expense reductions | 2.25%A | |||
| Expenses net of voluntary waivers, if any | 1.40%A | |||
| Expenses net of all reductions | 1.31%A | |||
| Net investment income (loss) | 14%A | |||
| Supplemental Data | ||||
| Net assets, end of period (000 omitted) | $ | 197,349 | ||
| Portfolio turnover rate | 46% | |||
| A Annualized B Total returns for periods of less than one year are not annualized. C Total returns would have been lower had certain expenses not been reduced during the periods shown. D Calculated based on average shares outstanding during the period. E The amount shown for a share outstanding does not correspond with the aggregate net gain (loss) on investments for the period due to the timing of sales and repurchases of shares in relation to fluctuating market values of the investments of the fund. F For the period August 2, 2005 (commencement of operations) to October 31, 2005. G Expense ratios reflect operating expenses of the class. Expenses before reductions do not reflect amounts reimbursed by the investment adviser or reductions from brokerage service arrangements or other expense offset arrangements and do not represent the amount paid by the class during periods when reimbursements or reductions occur. Expense ratios before reductions for start up periods may not be representative of longer term operating periods. Expenses net of any voluntary waivers reflect expenses after reimbursement by the investment adviser but prior to reductions from brokerage service arrangements or other expense offset arrangements. Expenses net of all reductions represent the net expenses paid by the class. H Amount represents less than $.01 per share. |
See accompanying notes which are an integral part of the financial statements.
23 Annual Report
| Financial Highlights Institutional Class | ||||
| Year ended October 31, | 2005F | |||
| Selected Per Share Data | ||||
| Net asset value, beginning of period | $ | 10.00 | ||
| Income from Investment Operations | ||||
| Net investment income (loss)D | —H | |||
| Net realized and unrealized gain (loss) | 39E | |||
| Total from investment operations | 39 | |||
| Redemption fees added to paid in capitalD | 01 | |||
| Net asset value, end of period | $ | 10.40 | ||
| Total ReturnB,C | 4.00% | |||
| Ratios to Average Net AssetsG | ||||
| Expenses before expense reductions | 2.25%A | |||
| Expenses net of voluntary waivers, if any | 1.40%A | |||
| Expenses net of all reductions | 1.29%A | |||
| Net investment income (loss) | 16%A | |||
| Supplemental Data | ||||
| Net assets, end of period (000 omitted) | $ | 2,849 | ||
| Portfolio turnover rate | 46% |
| A Annualized B Total returns for periods of less than one year are not annualized. C Total returns would have been lower had certain expenses not been reduced during the periods shown. D Calculated based on average shares outstanding during the period. E The amount shown for a share outstanding does not correspond with the aggregate net gain (loss) on investments for the period due to the timing of sales and repurchases of shares in relation to fluctuating market values of the investments of the fund. F For the period August 2, 2005 (commencement of operations) to October 31, 2005. G Expense ratios reflect operating expenses of the class. Expenses before reductions do not reflect amounts reimbursed by the investment adviser or reductions from brokerage service arrangements or other expense offset arrangements and do not represent the amount paid by the class during periods when reimbursements or reductions occur. Expense ratios before reductions for start up periods may not be representative of longer term operating periods. Expenses net of any voluntary waivers reflect expenses after reimbursement by the investment adviser but prior to reductions from brokerage service arrangements or other expense offset arrangements. Expenses net of all reductions represent the net expenses paid by the class. H Amount represents less than $.01 per share. |
See accompanying notes which are an integral part of the financial statements.
| Annual Report |
| 24 |
Notes to Financial Statements
| For the period ended October 31, 2005 |
1. Significant Accounting Policies.
Fidelity International Small Cap Opportunities Fund (the fund) is a fund of Fidelity Investment Trust (the trust) and is authorized to issue an unlimited number of shares. The trust is registered under the Investment Company Act of 1940, as amended (the 1940 Act), as an open end management investment company organized as a Massachusetts business trust.
The fund offers Class A, Class T, Class B, Class C, International Small Cap Opportunities Fund and Institutional Class shares, each of which has equal rights as to assets and voting privileges. Each class has exclusive voting rights with respect to matters that affect that class. Class B shares will automatically convert to Class A shares after a holding period of seven years from the initial date of purchase. Investment income, realized and unrealized capital gains and losses, the common expenses of the fund, and certain fund level expense reductions, if any, are allocated on a pro rata basis to each class based on the relative net assets of each class to the total net assets of the fund. Each class differs with respect to transfer agent and distribution and service plan fees incurred. Certain expense reductions also differ by class.
The fund’s investments in emerging markets can be subject to social, economic, reg ulatory, and political uncertainties and can be extremely volatile. The fund may invest in affiliated money market central funds (Money Market Central Funds) which are open end investment companies available to investment companies and other accounts managed by Fidelity Management & Research Company (FMR) and its affiliates. The financial statements have been prepared in conformity with accounting principles generally accepted in the United States of America, which require management to make certain estimates and assumptions at the date of the financial statements. The following summarizes the significant accounting policies of the fund:
Security Valuation. Investments are valued and net asset value (NAV) per share is calculated (NAV calculation) as of the close of business of the New York Stock Exchange (NYSE), normally 4:00 p.m. Eastern time. Wherever possible, each fund uses indepen dent pricing services approved by the Board of Trustees to value their investments.
Equity securities, including restricted securities, for which market quotations are readily available, are valued at the last reported sale price or official closing price as reported by an independent pricing service on the primary market or exchange on which they are traded. In the event there were no sales during the day or closing prices are not available, securities are valued at the last quoted bid price. Investments in open end mutual funds, are valued at their closing net asset value each business day. Short term securities with remaining maturities of sixty days or less for which quotations are not readily available are valued at amortized cost, which approximates value.
25 Annual Report
Notes to Financial Statements continued
1. Significant Accounting Policies continued
Security Valuation continued
When current market prices or quotations are not readily available or do not accurately reflect fair value, valuations may be determined in accordance with procedures adopted by the Board of Trustees. For example, when developments occur between the close of a market and the close of the NYSE that may materially affect the value of some or all of the securities, or when trading in a security is halted, those securities may be fair valued. Factors used in the determination of fair value may include monitoring news to identify significant market or security specific events such as changes in the value of U.S. securi ties market, reviewing developments in foreign markets and evaluating the performance of ADRs, futures contracts and exchange traded funds. Because the fund’s utilization of fair value pricing depends on market activity, the frequency with which fair value pricing is used can not be predicted and may be utilized to a significant extent. The value of securities used for NAV calculation under fair value pricing may differ from published prices for the same securities.
Foreign Currency. The fund uses foreign currency contracts to facilitate transactions in foreign denominated securities. Losses from these transactions may arise from changes in the value of the foreign currency or if the counterparties do not perform under the contracts’ terms.
Foreign denominated assets, including investment securities, and liabilities are trans lated into U.S. dollars at the exchange rate at period end. Purchases and sales of invest ment securities, income and dividends received and expenses denominated in foreign currencies are translated into U.S. dollars at the exchange rate in effect on the transac tion date.
The effects of exchange rate fluctuations on investments are included with the net realized and unrealized gain (loss) on investment securities. Other foreign currency transactions resulting in realized and unrealized gain (loss) are disclosed separately.
Investment Transactions and Income. Security transactions are accounted for as of trade date. Gains and losses on securities sold are determined on the basis of identified cost. Dividend income is recorded on the ex dividend date, except for certain dividends from foreign securities where the ex dividend date may have passed, which are recorded as soon as the fund is informed of the ex dividend date. Non cash dividends included in dividend income, if any, are recorded at the fair market value of the securities received. Interest income is accrued as earned. Interest income includes coupon interest and amortization of premium and accretion of discount on debt securities. Investment income is recorded net of foreign taxes withheld where recovery of such taxes is uncertain.
| Annual Report |
| 26 |
1. Significant Accounting Policies continued
Expenses. Most expenses of the trust can be directly attributed to a fund. Expenses which cannot be directly attributed are apportioned among each fund in the trust.
Income Tax Information and Distributions to Shareholders. Each year, the fund intends to qualify as a regulated investment company by distributing all of its taxable income and realized gains under Subchapter M of the Internal Revenue Code. As a result, no provision for income taxes is required in the accompanying financial statements. Foreign taxes are provided for based on the fund’s understanding of the tax rules and rates that exist in the foreign markets in which it invests.
Distributions are recorded on the ex dividend date. Income dividends and capital gain distributions are declared separately for each class. Income and capital gain distribu tions are determined in accordance with income tax regulations, which may differ from generally accepted accounting principles. In addition, the fund will claim a portion of the payment made to redeeming shareholders as a distribution for income tax purposes.
Capital accounts within the financial statements are adjusted for permanent book tax differences. These adjustments have no impact on net assets or the results of operations. Temporary book tax differences will reverse in a subsequent period.
Book tax differences are primarily due to foreign currency transactions, certain foreign taxes, passive foreign investment companies (PFIC), capital loss carryforwards and losses deferred due to wash sales.
The tax basis components of distributable earnings and the federal tax cost as of period end were as follows:
| Unrealized appreciation | $ | 9,432,980 | ||
| Unrealized depreciation | (8,507,152) | |||
| Net unrealized appreciation (depreciation) | 925,828 | |||
| Undistributed ordinary income | 57,206 | |||
| Capital loss carryforward | (3,072,229) | |||
| Cost for federal income tax purposes | $ | 213,870,466 | ||
Short Term Trading (Redemption) Fees. Shares purchased and held in the fund less than 90 days will be subject to a redemption fee equal to 2.00% of the proceeds of the redeemed shares. All redemption fees, including any estimated redemption fees paid by FMR, are retained by the fund and accounted for as an addition to paid in capital.
27 Annual Report
| Notes to Financial Statements continued | ||
2. Operating Policies. | ||
Repurchase Agreements. FMR has received an Exemptive Order from the Securities and Exchange Commission (the SEC) which permits the fund and other affiliated entities of FMR to transfer uninvested cash balances into joint trading accounts which are then invested in repurchase agreements. The fund may also invest directly with institutions in repurchase agreements. Repurchase agreements are collateralized by government or non government securities. Collateral is held in segregated accounts with custodian banks and may be obtained in the event of a default of the counterparty. The fund monitors, on a daily basis, the value of the collateral to ensure it is at least equal to the principal amount of the repurchase agreement (including accrued interest). In the event of a default by the counterparty, realization of the collateral proceeds could be delayed, during which time the value of the collateral may decline.
3. Purchases and Sales of Investments.
Purchases and sales of securities, other than short term securities and U.S. government securities, aggregated $282,288,880 and $65,440,601, respectively.
4. Fees and Other Transactions with Affiliates.
Management Fee. FMR and its affiliates provide the fund with investment manage ment related services for which the fund pays a monthly management fee. The manage ment fee is the sum of an individual fund fee rate that is based on an annual rate of .60% of the fund’s average net assets and a group fee rate that averaged .27% during the period. The group fee rate is based upon the average net assets of all the mutual funds advised by FMR. The group fee rate decreases as assets under management increase and increases as assets under management decrease. In addition, the management fee is subject to a performance adjustment (up to a maximum of ±.20% of the fund’s average net assets over a 36 month performance period). The upward or downward adjustment to the management fee is based on the fund’s relative investment performance as compared to an appropriate benchmark index. The fund’s performance adjustment will not take effect until July 2006. Subsequent months will be added until the performance period includes 36 months. For the period, the total annualized management fee rate was .86% of the fund’s average net assets.
Distribution and Service Plan. In accordance with Rule 12b 1 of the 1940 Act, the fund has adopted separate Distribution and Service Plans for each class of shares. Certain classes pay Fidelity Distributors Corporation (FDC), an affiliate of FMR, separate Distribution and Service Fees, each of which is based on an annual percentage of each class’ average net assets. In addition, FDC may pay financial intermediaries for selling shares of the fund and providing shareholder support services. For the period, the
| Annual Report |
| 28 |
| 4. Fees and Other Transactions with Affiliates continued | ||
Distribution and Service Plan continued | ||
Distribution and Service Fee rates and the total amounts paid to and retained by FDC were as follows:
| Distribution | Service | Paid to | Retained | |||||||||
| Fee | Fee | FDC | by FDC | |||||||||
| Class A | 0% | .25% | $ | 1,456 | $ | 459 | ||||||
| Class T | 25% | .25% | 1,976 | 990 | ||||||||
| Class B | 75% | .25% | 2,894 | 2,675 | ||||||||
| Class C | 75% | .25% | 5,415 | 5,257 | ||||||||
| $ | 11,741 | $ | 9,381 |
Sales Load. FDC receives a front end sales charge of up to 5.75% for selling Class A shares, and 3.50% for selling Class T shares, some of which is paid to financial intermedi aries for selling shares of the fund. FDC receives the proceeds of contingent deferred sales charges levied on Class A, Class T, Class B, and Class C redemptions. These charges depend on the holding period. The deferred sales charges range from 5% to 1% for Class B, 1% for Class C, and .25% for certain purchases of Class A and Class T shares.
| For the period, sales charge amounts retained by FDC were as follows: | ||||
| Retained | ||||
| by FDC | ||||
| Class A | $ | 12,750 | ||
| Class T | 2,294 | |||
| Class B* | 10 | |||
| Class C* | 231 | |||
| $ | 15,285 | |||
* When Class B and Class C shares are initially sold, FDC pays commissions from its own resources to financial intermediaries through which the sales are made.
Transfer Agent Fees. Fidelity Investments Institutional Operations Company, Inc. (FIIOC), an affiliate of FMR, is the transfer, dividend disbursing and shareholder servic ing agent for each class of the fund, except for Fidelity International Small Cap Opportu nities Fund. Fidelity Service Company, Inc. (FSC), an affiliate of FMR, is the transfer agent for Fidelity International Small Cap Opportunities Fund shares. FIIOC and FSC receive account fees and asset based fees that vary according to the account size and type of account of the shareholders of the respective classes of the fund. FIIOC and FSC pay for typesetting, printing and mailing of shareholder reports, except proxy statements.
29 Annual Report
| Notes to Financial Statements continued | ||
| 4. Fees and Other Transactions with Affiliates continued | ||
Transfer Agent Fees continued | ||
For the period the total transfer agent fees paid by each class to FIIOC or FSC, were as follows:
| % of | ||||||
| Average | ||||||
| Amount | Net Assets | |||||
| Class A | $ | 2,158 | .36* | |||
| Class T | 1,388 | .34* | ||||
| Class B | 830 | .28* | ||||
| Class C | 1,495 | .27* | ||||
| Fidelity International Small Cap Opportunities Fund | 78,812 | .33* | ||||
| Institutional Class | 1,071 | .21* | ||||
| $ | 85,754 | |||||
| * Annualized |
Accounting Fees. FSC maintains the fund’s accounting records. The fee is based on the level of average net assets for the month.
Affiliated Central Funds. The fund may invest in Money Market Central Funds which seek preservation of capital and current income and are managed by Fidelity Invest ments Money Management, Inc. (FIMM), an affiliate of FMR.
Income distributions earned by the fund are recorded as income in the accompanying financial statements and totaled $55,685 for the period.
Brokerage Commissions. The fund placed a portion of its portfolio transactions with brokerage firms which are affiliates of the investment adviser. The commissions paid to these affiliated firms were $7,977 for the period.
| Annual Report |
| 30 |
| 5. Expense Reductions. |
FMR voluntarily agreed to reimburse each class to the extent annual operating expenses exceeded certain levels of average net assets as noted in the table below. Some expenses, for example interest expense, are excluded from this reimbursement.
| The following classes were in reimbursement during the period: | ||||||
| Expense | Reimbursement | |||||
| Limitations | from adviser | |||||
| Class A | 1.65% | $ | 6,027 | |||
| Class T | 1.90% | 4,117 | ||||
| Class B | 2.40% | 3,055 | ||||
| Class C | 2.40% | 5,067 | ||||
| Fidelity International Small Cap Opportunities Fund . | 1.40% | 205,242 | ||||
| Institutional Class | 1.40% | 4,405 | ||||
| $ | 227,913 | |||||
Many of the brokers with whom FMR places trades on behalf of the fund provided services to the fund in addition to trade execution. These services included payments of certain expenses on behalf of the fund totaling $23,569 for the period. In addition, through arrangements with the fund’s custodian and each class’ transfer agent, credits realized as a result of uninvested cash balances were used to reduce the fund’s expenses. During the period, these credits reduced the fund’s custody expenses by $89. During the period, credits reduced each class’ transfer agent expense as noted in the table below.
| Transfer Agent | ||||
| expense reduction | ||||
| Class A | $ | 124 | ||
| Class T | 120 | |||
| Class B | 123 | |||
| Class C | 120 | |||
| Institutional Class | 123 | |||
| $ | 610 | |||
| 6. Other. | ||||
The fund’s organizational documents provide former and current trustees and officers with a limited indemnification against liabilities arising in connection with the perfor mance of their duties to the fund. In the normal course of business, the fund may also enter into contracts that provide general indemnifications. The fund’s maximum expo sure under these arrangements is unknown as this would be dependent on future claims that may be made against the fund. The risk of material loss from such claims is consid ered remote.
31 Annual Report
| Notes to Financial Statements continued | ||||||
| 7. Share Transactions. | ||||||
| Transactions for each class of shares were as follows: | ||||||
| Shares | Dollars | |||||
| Year ended | Year ended | |||||
| October 31, 2005A | October 31, 2005A | |||||
| Class A | ||||||
| Shares sold | 533,911 | $ | 5,543,122 | |||
| Shares redeemed | (2,302) | (24,252) | ||||
| Net increase (decrease) | 531,609 | $ | 5,518,870 | |||
| Class T | ||||||
| Shares sold | 262,396 | $ | 2,707,886 | |||
| Shares redeemed | (1,961) | (19,686) | ||||
| Net increase (decrease) | 260,435 | $ | 2,688,200 | |||
| Class B | ||||||
| Shares sold | 169,923 | $ | 1,745,697 | |||
| Shares redeemed | (5,585) | (57,751) | ||||
| Net increase (decrease) | 164,338 | $ | 1,687,946 | |||
| Class C | ||||||
| Shares sold | 322,125 | $ | 3,329,826 | |||
| Shares redeemed | (2,373) | (24,472) | ||||
| Net increase (decrease) | 319,752 | $ | 3,305,354 | |||
| Fidelity International Small Cap Opportunities Fund | ||||||
| Shares sold | 19,620,455 | $ | 205,992,728 | |||
| Shares redeemed | (646,558) | (6,587,124) | ||||
| Net increase (decrease) | 18,973,897 | $ | 199,405,604 | |||
| Institutional Class | ||||||
| Shares sold | 274,003 | $ | 2,804,816 | |||
| Net increase (decrease) | 274,003 | $ | 2,804,816 | |||
| A For the period August 2, 2005 (commencement of operations) to October 31, 2005. | ||||||
| Annual Report |
| 32 |
Report of Independent Registered Public Accounting Firm
To the Trustees of Fidelity Investment Trust and Shareholders of Fidelity International Small Cap Opportunities Fund:
We have audited the accompanying statement of assets and liabilities of Fidelity Interna tional Small Cap Opportunities Fund (the Fund), a fund of Fidelity Investment Trust, including the schedule of investments, as of October 31, 2005, and the related statement of operations, the statement of changes in net assets, and the financial highlights for the period from August 2, 2005 (commencement of operations) to October 31, 2005. These financial statements and financial highlights are the responsibility of the Fund’s manage ment. Our responsibility is to express an opinion on these financial statements and financial highlights based on our audit.
We conducted our audit in accordance with standards of the Public Company Accounting Oversight Board (United States). Those standards require that we plan and perform the audit to obtain reasonable assurance about whether the financial statements and financial highlights are free of material misstatement. The Fund is not required to have, nor were we engaged to perform, an audit of its internal control over financial reporting. Our audit included consideration of internal control over financial reporting as a basis for designing audit procedures that are appropriate in the circumstances, but not for the purpose of expressing an opinion on the effectiveness of the Fund’s internal control over financial reporting. Accordingly, we express no such opinion. An audit also includes examining, on a test basis, evidence supporting the amounts and disclosures in the financial statements, assessing the accounting principles used and significant estimates made by management, as well as evaluating the overall financial statement presentation. Our procedures in cluded confirmation of securities owned as of October 31, 2005, by correspondence with the custodians and brokers; where replies were not received from brokers, we performed other auditing procedures. We believe that our audit provide a reasonable basis for our opinion.
In our opinion, the financial statements and financial highlights referred to above present fairly, in all material respects, the financial position of Fidelity International Small Cap Opportunities Fund as of October 31, 2005, the results of its operations, the changes in its net assets, and its financial highlights for the period from August 2, 2005 (commencement of operations) to October 31, 2005, in conformity with accounting principles generally accepted in the United States of America.
| /s/ Deloitte & Touche LLP DELOITTE & TOUCHE LLP Boston, Massachusetts December 13, 2005 |
33 Annual Report
Trustees and Officers
The Trustees, Members of the Advisory Board, and executive officers of the trust and fund, as applicable, are listed below. The Board of Trustees governs the fund and is responsible for protecting the interests of shareholders. The Trustees are experienced executives who meet periodically throughout the year to oversee the fund’s activities, review contractual arrangements with companies that provide services to the fund, and review the fund’s performance. Except for William O. McCoy, Stephen P. Jonas, and Kenneth L. Wolfe, each of the Trustees oversees 322 funds advised by FMR or an affiliate. Mr. McCoy oversees 324 funds advised by FMR or an affiliate. Mr. Jonas and Mr. Wolfe oversee 319 funds advised by FMR or an affiliate.
The Trustees hold office without limit in time except that (a) any Trustee may resign; (b) any Trustee may be removed by written instrument, signed by at least two thirds of the number of Trustees prior to such removal; (c) any Trustee who requests to be retired or who has become incapacitated by illness or injury may be retired by written instru ment signed by a majority of the other Trustees; and (d) any Trustee may be removed at any special meeting of shareholders by a two thirds vote of the outstanding voting securities of the trust. Each Trustee who is not an interested person (as defined in the 1940 Act) (Independent Trustee), shall retire not later than the last day of the calendar year in which his or her 72nd birthday occurs. The Independent Trustees may waive this mandatory retirement age policy with respect to Individual Trustees. The executive officers and Advisory Board Members hold office without limit in time, except that any officer and Advisory Board Member may resign or may be removed by a vote of a majority of the Trustees at any regular meeting or any special meeting of the Trustees. Except as indicated, each individual has held the office shown or other offices in the same company for the past five years.
The fund’s Statement of Additional Information (SAI) includes more information about the Trustees. To request a free copy, call Fidelity at 1-877-208-0098.
| Interested Trustees*: |
Correspondence intended for each Trustee who is an interested person may be sent to Fidelity Investments, 82 Devonshire Street, Boston, Massachusetts 02109.
| Name, Age; Principal Occupation Edward C. Johnson 3d (75)** |
Year of Election or Appointment: 1984
Mr. Johnson is Chairman of the Board of Trustees. Mr. Johnson serves as Chief Executive Officer, Chairman, and a Director of FMR Corp.; a Di rector and Chairman of the Board and of the Executive Committee of FMR; Chairman and a Director of Fidelity Management & Research (Far East) Inc.; Chairman and a Director of Fidelity Investments Money Man agement, Inc.; and Chairman (2001 present) and a Director (2000 present) of FMR Co., Inc.
| Annual Report |
| 34 |
| Name, Age; Principal Occupation Abigail P. Johnson (43)** |
Year of Election or Appointment: 2001
Ms. Johnson serves as President of Fidelity Employer Services Company (FESCO) (2005 present). She is President and a Director of Fidelity In vestments Money Management, Inc. (2001 present), FMR Co., Inc. (2001 present), and a Director of FMR Corp. Previously, Ms. Johnson served as President and a Director of FMR (2001 2005), Senior Vice President of the Fidelity funds (2001 2005), and managed a number of Fidelity funds.
| Stephen P. Jonas (52) |
Year of Election or Appointment: 2005
Mr. Jonas is Senior Vice President of the fund (2005 present). He also serves as Senior Vice President of other Fidelity funds (2005 present). Mr. Jonas is Executive Director of FMR Corp (2005 present). Previously, Mr. Jonas served as President of Fidelity Enterprise Operations and Risk Services (2004 2005), Chief Administrative Officer (2002 2004), and Chief Financial Officer of FMR Co. (1998 2000). Mr. Jonas has been with Fidelity Investments since 1987 and has held various financial and management positions including Chief Financial Officer of FMR. In addi tion, he serves on the Boards of Boston Ballet (2003 present) and Sim mons College (2003 present).
| Robert L. Reynolds (53) |
Year of Election or Appointment: 2003
Mr. Reynolds is a Director (2003 present) and Chief Operating Officer (2002 present) of FMR Corp. He also serves on the Board at Fidelity Investments Canada, Ltd. (2000 present). Previously, Mr. Reynolds served as President of Fidelity Investments Institutional Retirement Group (1996 2000).
* Trustees have been determined to be “Interested Trustees” by virtue of, among other things, their affiliation with the trust or various entities under common control with FMR.
** Edward C. Johnson 3d, Trustee, is Abigail P. Johnson’s father.
35 Annual Report
Trustees and Officers - continued
Independent Trustees:
Correspondence intended for each Independent Trustee (that is, the Trustees other than the Interested Trustees) may be sent to Fidelity Investments, P.O. Box 55235, Boston, Massachusetts 02205 5235.
| Name, Age; Principal Occupation Dennis J. Dirks (57) |
Year of Election or Appointment: 2005
Prior to his retirement in May 2003, Mr. Dirks was Chief Operating Officer and a member of the Board of The Depository Trust & Clearing Corporation (DTCC) (1999 2003). He also served as President, Chief Operating Officer, and Board member of The Depository Trust Company (DTC) (1999 2003) and President and Board member of the National Securities Clearing Corporation (NSCC) (1999 2003). In addi tion, Mr. Dirks served as Chief Executive Officer and Board member of the Government Securities Clearing Corporation (2001 2003) and Chief Executive Officer and Board member of the Mortgage Backed Securities Clearing Corporation (2001 2003). Mr. Dirks also serves as a Trustee of Manhattan College (2005 present).
| Robert M. Gates (62) |
Year of Election or Appointment: 1997
Dr. Gates is Vice Chairman of the Independent Trustees (2005 present). Dr. Gates is President of Texas A&M University (2002 present). He was Director of the Central Intelligence Agency (CIA) from 1991 to 1993. From 1989 to 1991, Dr. Gates served as Assistant to the President of the United States and Deputy National Security Advisor. Dr. Gates is a Director of NACCO Industries, Inc. (mining and manufacturing), Parker Drilling Co., Inc. (drilling and rental tools for the energy industry, 2001 present), and Brinker International (restaurant management, 2003 present). Previously, Dr. Gates served as a Director of LucasVarity PLC (automotive components and diesel engines), a Director of TRW Inc. (automotive, space, defense, and information technology), and Dean of the George Bush School of Government and Public Service at Texas A&M University (1999 2001). Dr. Gates also is a Trustee of the Forum for International Policy.
| Annual Report |
| 36 |
| Name, Age; Principal Occupation George H. Heilmeier (69) |
Year of Election or Appointment: 2004
Dr. Heilmeier is Chairman Emeritus of Telcordia Technologies (commu nication software and systems), where prior to his retirement, he served as company Chairman and Chief Executive Officer. He currently serves on the Boards of Directors of The Mitre Corporation (systems engineer ing and information technology support for the government), and HRL Laboratories (private research and development, 2004 present). He is Chairman of the General Motors Science & Technology Advisory Board and a Life Fellow of the Institute of Electrical and Electronics Engineers (IEEE) (2000 present). Dr. Heilmeier is a member of the Defense Science Board and the National Security Agency Advisory Board. He is also a member of the National Academy of Engineering, the American Academy of Arts and Sciences, and the Board of Overseers of the School of Engineering and Applied Science of the University of Pennsyl vania. Previously, Dr. Heilmeier served as a Director of TRW Inc. (auto motive, space, defense, and information technology, 1992 2002), Compaq (1994 2002), Automatic Data Processing, Inc. (ADP) (technology based business outsourcing, 1995 2002), INET Technolo gies Inc. (telecommunications network surveillance, 2001 2004), and Teltech Holdings (customer management services). He is the recipient of the 2005 Kyoto Prize in Advanced Technology for his invention of the liquid display.
| Marie L. Knowles (59) |
Year of Election or Appointment: 2001
Prior to Ms. Knowles’ retirement in June 2000, she served as Executive Vice President and Chief Financial Officer of Atlantic Richfield Company (ARCO) (diversified energy, 1996 2000). From 1993 to 1996, she was a Senior Vice President of ARCO and President of ARCO Transportation Company. She served as a Director of ARCO from 1996 to 1998. She currently serves as a Director of Phelps Dodge Corporation (copper mining and manufacturing) and McKesson Corporation (healthcare ser vice, 2002 present). Ms. Knowles is a Trustee of the Brookings Institution and the Catalina Island Conservancy and also serves as a member of the Advisory Board for the School of Engineering of the University of Southern California.
37 Annual Report
Trustees and Officers - continued
| Name, Age; Principal Occupation Ned C. Lautenbach (61) |
Year of Election or Appointment: 2000
Mr. Lautenbach has been a partner of Clayton, Dubilier & Rice, Inc. (private equity investment firm) since September 1998. Previously, Mr. Lautenbach was with the International Business Machines Corporation (IBM) from 1968 until his retirement in 1998. Mr. Lautenbach serves as a Director of Italtel Holding S.p.A. (telecommunications (Milan, Italy), 2004 present) and Eaton Corporation (diversified industrial) as well as the Philharmonic Center for the Arts in Naples, Florida. He also is a member of the Board of Trustees of Fairfield University (2005 present), as well as a member of the Council on Foreign Relations.
| Marvin L. Mann (72) |
Year of Election or Appointment: 1993
Mr. Mann is Chairman of the Independent Trustees (2001 present). He is Chairman Emeritus of Lexmark International, Inc. (computer peripherals), where he served as CEO until April 1998, retired as Chairman May 1999, and remains a member of the Board. Prior to 1991, he held the positions of Vice President of International Business Machines Corporation (IBM) and President and General Manager of various IBM divisions and subsidiaries. He is a member of the Executive Committee of the Independent Director’s Council of the Investment Com pany Institute. In addition, Mr. Mann is a member of the President’s Cabinet at the University of Alabama and the Board of Visitors of the Culverhouse College of Commerce and Business Administration at the University of Alabama.
| William O. McCoy (72) |
Year of Election or Appointment: 1997
Prior to his retirement in December 1994, Mr. McCoy was Vice Chairman of the Board of BellSouth Corporation (telecommunications) and President of BellSouth Enterprises. He is currently a Director of Liberty Corporation (holding company), Duke Realty Corporation (real estate), and Progress Energy, Inc. (electric utility). He is also a partner of Franklin Street Partners (private investment management firm) and a member of the Research Triangle Foundation Board. In addition, Mr. McCoy served as the Interim Chancellor (1999 2000) and a member of the Board of Visitors for the University of North Carolina at Chapel Hill and currently serves on the Board of Directors of the University of North Carolina Health Care System and the Board of Visitors of the Kenan Flagler Business School (University of North Carolina at Chapel Hill). He also served as Vice President of Finance for the University of North Carolina (16 school system).
| Annual Report |
| 38 |
| Name, Age; Principal Occupation Cornelia M. Small (61) |
Year of Election or Appointment: 2005
Ms. Small is a member (2000 present) and Chairperson (2002 present) of the Investment Committee, and a member (2002 present) of the Board of Trustees of Smith College. Previously, she served as Chief In vestment Officer (1999 2000), Director of Global Equity Investments (1996 1999), and a member of the Board of Directors of Scudder, Stevens & Clark (1990 1997) and Scudder Kemper Investments (1997 1998). In addition, Ms. Small served as Co Chair (2000 2003) of the Annual Fund for the Fletcher School of Law and Diplomacy.
| William S. Stavropoulos (66) |
Year of Election or Appointment: 2001
Mr. Stavropoulos is Chairman of the Board (2000 present) and a Mem ber of the Board of Directors of The Dow Chemical Company. Since joining The Dow Chemical Company in 1967, Mr. Stavropoulos served in numerous senior management positions, including President (1993 2000; 2002 2003), CEO (1995 2000; 2002 2004), and Chair man of the Executive Committee (2000 2004). Currently, he is a Direc tor of NCR Corporation (data warehousing and technology solutions), BellSouth Corporation (telecommunications), Chemical Financial Corpo ration, Maersk Inc. (industrial conglomerate, 2002 present), and Metal mark Capital (private equity investment firm, 2005 present). He also serves as a member of the Board of Trustees of the American Enterprise Institute for Public Policy Research. In addition, Mr. Stavropoulos is a member of The Business Council, J.P. Morgan International Council and the University of Notre Dame Advisory Council for the College of Science.
| Kenneth L. Wolfe (66) |
Year of Election or Appointment: 2005
Mr. Wolfe also serves as a Trustee (2005 present) or Member of the Advisory Board (2004 present) of other investment companies advised by FMR. Prior to his retirement in 2001, Mr. Wolfe was Chairman and Chief Executive Officer of Hershey Foods Corporation (1993 2001). He currently serves as a member of the boards of Adelphia Communica tions Corporation (2003 present), Bausch & Lomb, Inc., and Revlon Inc. (2004 present).
39 Annual Report
Trustees and Officers - continued
Advisory Board Members and Executive Officers:
Correspondence intended for Mr. Gamper may be sent to Fidelity Investments, P.O. Box 55235, Boston, Massachusetts 02205 5235. Correspondence intended for each executive officer and Mr. Lynch may be sent to Fidelity Investments, 82 Devonshire Street, Boston, Massachusetts 02109.
| Name, Age; Principal Occupation Albert R. Gamper, Jr. (63) |
Year of Election or Appointment: 2005
Member of the Advisory Board of Fidelity Investment Trust. Prior to his retirement in December 2004, Mr. Gamper served as Chairman of the Board of CIT Group Inc. (commercial finance). During his tenure with CIT Group Inc. Mr. Gamper served in numerous senior management positions, including Chairman (1987 1989; 1999 2001; 2002 2004), Chief Executive Officer (1987 2004), and President (1989 2002). He currently serves as a member of the Board of Directors of Public Service Enterprise Group (utilities, 2001 present), Chairman of the Board of Governors, Rutgers University (2004 present), and Chairman of the Board of Saint Barnabas Health Care System (1996 present).
| Peter S. Lynch (61) |
Year of Election or Appointment: 2003
Member of the Advisory Board of Fidelity Investment Trust. Vice Chair man and a Director of FMR, and Vice Chairman (2001 present) and a Director (2000 present) of FMR Co., Inc. Previously, Mr. Lynch served as a Trustee of the Fidelity funds (1990 2003). In addition, he serves as a Trustee of Boston College, Massachusetts Eye & Ear Infirmary, Historic Deerfield, John F. Kennedy Library, and the Museum of Fine Arts of Boston.
| Dwight D. Churchill (51) |
Year of Election or Appointment: 2005
Vice President of the fund. Mr. Churchill also serves as Vice President of certain Equity Funds (2005 present) and certain High Income Funds (2005 present). Previously, he served as Head of Fidelity’s Fixed Income Division (2000 2005), Vice President of Fidelity’s Money Market Funds (2000 2005), Vice President of Fidelity’s Bond Funds, and Senior Vice President of FIMM (2000) and FMR. Mr. Churchill joined Fidelity in 1993 as Vice President and Group Leader of Taxable Fixed Income Investments.
| Annual Report |
| 40 |
| Name, Age; Principal Occupation Eric D. Roiter (56) |
Year of Election or Appointment: 2005
Secretary of the fund. He also serves as Secretary of other Fidelity funds; Vice President, General Counsel, and Secretary of FMR Co., Inc. (2001 present) and FMR; Assistant Secretary of Fidelity Management & Research (U.K.) Inc. (2001 present), Fidelity Management & Research (Far East) Inc. (2001 present), and Fidelity Investments Money Manage ment, Inc. (2001 present). Mr. Roiter is an Adjunct Member, Faculty of Law, at Boston College Law School (2003 present). Previously, Mr. Roiter served as Vice President and Secretary of Fidelity Distributors Corpora tion (FDC) (1998 2005).
| Stuart Fross (46) |
Year of Election or Appointment: 2005
Assistant Secretary of the fund. Mr. Fross also serves as Assistant Secre tary of other Fidelity funds (2003 present), Vice President and Secretary of FDC (2005 present), and is an employee of FMR.
| Christine Reynolds (47) |
Year of Election or Appointment: 2005
President, Treasurer, and Anti Money Laundering (AML) officer of the fund. Ms. Reynolds also serves as President, Treasurer, and AML officer of other Fidelity funds (2004) and is a Vice President (2003) and an employee (2002) of FMR. Before joining Fidelity Investments, Ms. Reynolds worked at PricewaterhouseCoopers LLP (PwC) (1980 2002), where she was most recently an audit partner with PwC’s investment management practice.
41 Annual Report
Trustees and Officers - continued
| Name, Age; Principal Occupation Paul M. Murphy (58) |
Year of Election or Appointment: 2005
Chief Financial Officer of the fund. Mr. Murphy also serves as Chief Financial Officer of other Fidelity funds (2005 present). He also serves as Senior Vice President of Fidelity Pricing and Cash Management Ser vices Group (FPCMS).
| Kenneth A. Rathgeber (58) |
Year of Election or Appointment: 2005
Chief Compliance Officer of the fund. Mr. Rathgeber also serves as Chief Compliance Officer of other Fidelity funds (2004) and Executive Vice President of Risk Oversight for Fidelity Investments (2002). Pre viously, he served as Executive Vice President and Chief Operating Officer for Fidelity Investments Institutional Services Company, Inc. (1998 2002).
| John R. Hebble (47) |
Year of Election or Appointment: 2005
Deputy Treasurer of the fund. Mr. Hebble also serves as Deputy Treasurer of other Fidelity funds (2003), and is an employee of FMR. Before joining Fidelity Investments, Mr. Hebble worked at Deutsche Asset Management where he served as Director of Fund Accounting (2002 2003) and Assistant Treasurer of the Scudder Funds (1998 2003).
| Bryan A. Mehrmann (44) |
Year of Election or Appointment: 2005
Deputy Treasurer of the fund. Mr. Mehrmann also serves as Deputy Treasurer of other Fidelity funds (2005 present) and is an employee of FMR. Previously, Mr. Mehrmann served as Vice President of Fidelity In vestments Institutional Services Group (FIIS)/Fidelity Investments Institu tional Operations Corporation, Inc. (FIIOC) Client Services (1998 2004).
| Kimberley H. Monasterio (41) |
Year of Election or Appointment: 2005
Deputy Treasurer of the fund. Ms. Monasterio also serves as Deputy Treasurer of other Fidelity funds (2004) and is an employee of FMR (2004). Before joining Fidelity Investments, Ms. Monasterio served as Treasurer (2000 2004) and Chief Financial Officer (2002 2004) of the Franklin Templeton Funds and Senior Vice President of Franklin Temple ton Services, LLC (2000 2004).
| Annual Report |
| 42 |
| Name, Age; Principal Occupation Kenneth B. Robins (36) |
Year of Election or Appointment: 2005
Deputy Treasurer of the fund. Mr. Robins also serves as Deputy Treasurer of other Fidelity funds (2005 present) and is an employee of FMR (2005 present). Before joining Fidelity Investments, Mr. Robins worked at KPMG LLP, where he was a partner in KPMG’s department of profes sional practice (2002 2004) and a Senior Manager (1999 2000). In addition, Mr. Robins served as Assistant Chief Accountant, United States Securities and Exchange Commission (2000 2002).
| Robert G. Byrnes (38) |
Year of Election or Appointment: 2005
Assistant Treasurer of the fund. Mr. Byrnes also serves as Assistant Treas urer of other Fidelity funds (2005 present) and is an employee of FMR (2005 present). Previously, Mr. Byrnes served as Vice President of FPCMS (2003 2005). Before joining Fidelity Investments, Mr. Byrnes worked at Deutsche Asset Management where he served as Vice Presi dent of the Investment Operations Group (2000 2003).
| John H. Costello (59) |
Year of Election or Appointment: 2005
Assistant Treasurer of the fund. Mr. Costello also serves as Assistant Treasurer of other Fidelity funds and is an employee of FMR.
| Peter L. Lydecker (51) |
Year of Election or Appointment: 2005
Assistant Treasurer of the fund. Mr. Lydecker also serves as Assistant Treasurer of other Fidelity funds (2004) and is an employee of FMR.
| Mark Osterheld (50) |
Year of Election or Appointment: 2005
Assistant Treasurer of the fund. Mr. Osterheld also serves as Assistant Treasurer of other Fidelity funds (2002) and is an employee of FMR.
| Gary W. Ryan (47) |
Year of Election or Appointment: 2005
Assistant Treasurer of the fund. Mr. Ryan also serves as Assistant Treas urer of other Fidelity funds (2005 present) and is an employee of FMR (2005 present). Previously, Mr. Ryan served as Vice President of Fund Reporting in FPCMS (1999 2005).
43 Annual Report
Trustees and Officers - continued
| Name, Age; Principal Occupation Salvatore Schiavone (39) |
Year of Election or Appointment: 2005
Assistant Treasurer of the fund. Mr. Schiavone also serves as Assistant Treasurer of other Fidelity funds (2005 present) and is an employee of FMR (2005 present). Before joining Fidelity Investments, Mr. Schiavone worked at Deutsche Asset Management, where he most recently served as Assistant Treasurer (2003 2005) of the Scudder Funds and Vice Pres ident and Head of Fund Reporting (1996 2003).
| Annual Report |
| 44 |
| Distributions |
The Board of Trustees of Fidelity International Small Cap Opportunities Fund voted to pay to shareholders of record at the opening of business on record date, the following distributions per share derived from capital gains realized from sales of portfolio securities, and dividends derived from net investment income:
| Pay Date | Record Date | Dividends | Capital Gains | |||||
| Institutional Class | 12/12/05 | 12/09/05 | — | $.003 |
The fund will notify shareholders in January 2006 of amounts for use in preparing 2005 income tax returns.
45 Annual Report
Board Approval of Investment Advisory Contracts and Management Fees
Fidelity International Small Cap Opportunities Fund
On July 21, 2005, the Board of Trustees, including the independent Trustees (together, the Board), voted to approve the management contract and subadvisory agreements (together, the Advisory Contracts) for the fund. The Board, assisted by the advice of fund counsel and independent Trustees’ counsel, considered a broad range of information.
In determining whether to approve the Advisory Contracts for the fund, the Board was aware that shareholders have a broad range of investment choices available to them, including a wide choice among mutual funds offered by competitors to Fidelity, and that shareholders, with the opportunity to review and weigh the disclosure provided by the fund in its prospectus and other public disclosures, may choose to invest in this fund, managed by Fidelity.
Nature, Extent, and Quality of Services Provided by Fidelity. The Board consid ered staffing within the investment adviser, FMR, and the sub advisers (together, the Investment Advisers), including the background of the fund’s portfolio manager and the fund’s investment objective and discipline.
Fidelity Resources Dedicated to Investment Management and Support Services. The Board considered Fidelity’s extensive global research capabilities that enable the Investment Advisers to aggregate data from various sources in an effort to produce positive investment results. The Board noted that Fidelity’s analysts have access to a variety of technological tools that enable them to perform both fundamental and quanti tative analysis and to specialize in various disciplines. The Board also considered that Fidelity’s portfolio managers and analysts have access to daily portfolio attribution that allows for monitoring of a fund’s portfolio, as well as an electronic communication system that provides immediate real time access to research concerning issuers and credit enhancers.
Shareholder and Administrative Services. The Board considered the nature, extent, quality, and cost of administrative, distribution, and shareholder services performed by the Investment Advisers and their affiliates under the Advisory Contracts and under separate agreements covering transfer agency, pricing and bookkeeping, and securities lending services for the fund. The Board also considered the nature and extent of the Investment Advisers’ supervision of third party service providers, principally custodians and subcustodians.
The Board noted that the growth of fund assets across the complex allows Fidelity to reinvest in the development of services designed to enhance the value or convenience of the Fidelity funds as investment vehicles. These services include 24 hour access to account information and market information through phone representatives and over the Internet, and investor education materials and asset allocation tools.
| Annual Report |
| 46 |
Investment in a Large Fund Family. The Board considered the benefits to shareholders of investing in a Fidelity fund, including the benefits of investing in a fund that is part of a large family of funds offering a variety of investment disciplines and providing for a large variety of mutual fund investor services. For example, fund shareholders are offered the privilege of exchanging shares of the fund for shares of other Fidelity funds, as set forth in the fund’s prospectus, without paying an additional sales charge.
Investment Performance. Fidelity International Small Cap Opportunities Fund is a new fund and therefore had no historical performance for the Board to review at the time it approved the fund’s Advisory Contracts.
The Board considered that the fund’s management fee is subject to upward or downward adjustment depending upon whether, and to what extent, the fund’s investment perfor mance for the performance period exceeds, or is exceeded by, the record (over the same period) of a Board approved performance adjustment index. The Board realizes that the performance adjustment provides FMR with a strong economic incentive to seek to achieve superior performance for the fund’s shareholders and helps to more closely align the interests of FMR and the fund’s shareholders.
Based on its review, the Board concluded that the nature, extent, and quality of the services provided by Fidelity will benefit the fund’s shareholders, particularly in light of the Board’s view that the fund’s shareholders benefit from investing in a fund that is part of a large family of funds offering a variety of investment disciplines and services.
Competitiveness of Management Fee and Total Fund Expenses. The Board considered the fund’s proposed management fee and projected total operating expenses in reviewing the Advisory Contracts. The Board noted that the fund’s proposed manage ment fee rate is lower than the median fee rate of funds with similar Lipper investment objective categories and comparable management fee characteristics. The Board also considered that the projected total operating expenses are comparable to those of similar classes and funds that Fidelity offers to shareholders.
Based on its review, the Board concluded that the fund’s management fee and the total expenses for each class of the fund were fair and reasonable in light of the services that the fund and its shareholders receive and the other factors considered.
Costs of the Services and Profitability. The fund is a new fund and therefore no revenue, cost, or profitability data was available for the Board to review in respect of the fund at the time it approved the Advisory Contracts.
Economies of Scale. The Board considered the extent to which the fund will benefit from economies of scale through increased services to the fund, through waivers or reimbursements, or through fee or expense reductions, including reductions that occur through operation of the transfer agent agreement. The transfer agent fee varies in part
47 Annual Report
Board Approval of Investment Advisory Contracts and Management Fees continued
based on the number of accounts in the fund. If the number of accounts decreases or the average account size increases, the overall transfer agent fee rate decreases.
The Board recognized that the fund’s management contract incorporates a “group fee” structure, which provides for lower fee rates as total fund assets under FMR’s manage ment increase, and for higher fee rates as total fund assets under FMR’s management decrease. The Board considered that the group fee is designed to deliver the benefits of economies of scale to fund shareholders when total fund assets increase, even if assets of any particular fund are unchanged or have declined, because some portion of Fidelity’s costs are attributable to services provided to all Fidelity funds, and all funds benefit if those costs can be allocated among more assets.
The Board concluded that, given the group fee structure, fund shareholders will achieve a certain level of economies of scale as assets under FMR’s management increase at the fund complex level, regardless of whether Fidelity achieves any such economies of scale.
Based on its evaluation of all of the conclusions noted above, and after considering all material factors, the Board ultimately concluded that the advisory fee structures are fair and reasonable, and that the fund’s Advisory Contracts should be approved.
| Annual Report |
| 48 |
49 Annual Report
| Annual Report |
| 50 |
51 Annual Report
| Annual Report |
| 52 |
53 Annual Report
| Annual Report |
| 54 |
55 Annual Report
| Investment Adviser Fidelity Management & Research Company Boston, MA Investment Sub Advisers FMR Co., Inc. Fidelity Management & Research (U.K.) Inc. Fidelity Management & Research (Far East) Inc. Fidelity International Investment Advisors Fidelity Investments Japan Limited Fidelity International Investment Advisors (U.K.) Limited General Distributor Fidelity Distributors Corporation Boston, MA Transfer and Service Agents Fidelity Investments Institutional Operations Company, Inc. Boston, MA Fidelity Service Company, Inc. Boston, MA Custodian The Northern Trust Company Chicago, IL |
| AILSI-UANN-1205 1.815081.100 |

Item 2. Code of Ethics
As of the end of the period, October 31, 2005, Fidelity Investment Trust (the trust) has adopted a code of ethics, as defined in Item 2 of Form N-CSR, that applies to its President and Treasurer and its Chief Financial Officer. A copy of the code of ethics is filed as an exhibit to this Form N-CSR.
Item 3. Audit Committee Financial Expert
The Board of Trustees of the trust has determined that Marie L. Knowles is an audit committee financial expert, as defined in Item 3 of Form N-CSR. Ms. Knowles is independent for purposes of Item 3 of Form N-CSR.
Item 4. Principal Accountant Fees and Services
(a) Audit Fees.
For the fiscal years ended October 31, 2005 and October 31, 2004, the aggregate Audit Fees billed by PricewaterhouseCoopers LLP (PwC) for professional services rendered for the audits of the financial statements, or services that are normally provided in connection with statutory and regulatory filings or engagements for those fiscal years, for Fidelity Canada Fund, Fidelity China Region Fund, Fidelity Emerging Markets Fund, Fidelity Europe Fund, Fidelity Global Balanced Fund, Fidelity International Discovery Fund, Fidelity Japan Fund, Fidelity Japan Smaller Companies Fund, Fidelity Latin America Fund, Fidelity Nordic Fund, Fidelity Overseas Fund, Fidelity Pacific Basin Fund and Fidelity Southeast Asia Fund (the funds) and for all funds in the Fidelity Group of Funds are shown in the table below.
Fund | 2005A | 2004A |
Fidelity Canada Fund | $53,000 | $49,000 |
Fidelity China Region Fund | $48,000 | $45,000 |
Fidelity Emerging Markets Fund | $102,000 | $62,000 |
Fidelity Europe Fund | $63,000 | $58,000 |
Fidelity Global Balanced Fund | $66,000 | $62,000 |
Fidelity International Discovery Fund | $66,000 | $59,000 |
Fidelity Japan Fund | $52,000 | $50,000 |
Fidelity Japan Smaller Companies Fund | $46,000 | $44,000 |
Fidelity Latin America Fund | $65,000 | $68,000 |
Fidelity Nordic Fund | $42,000 | $40,000 |
Fidelity Overseas Fund | $98,000 | $87,000 |
Fidelity Pacific Basin Fund | $52,000 | $50,000 |
Fidelity Southeast Asia Fund | $65,000 | $69,000 |
All funds in the Fidelity Group of Funds audited by PwC | $11,900,000 | $10,600,000 |
A | Aggregate amounts may reflect rounding. |
For the fiscal years ended October 31, 2005 and October 31, 2004, the aggregate Audit Fees billed by Deloitte & Touche LLP, the member firms of Deloitte Touche Tohmatsu, and their respective affiliates (collectively, "Deloitte Entities") for professional services rendered for the audits of the financial statements, or services that are normally provided in connection with statutory and regulatory filings or engagements for those fiscal years, for Fidelity Aggressive International Fund, Fidelity Diversified International Fund, Fidelity Europe Capital Appreciation Fund, Fidelity International Small Cap Fund, Fidelity International Small Cap Opportunities Fund and Fidelity Worldwide Fund (the funds) and for all funds in the Fidelity Group of Funds are shown in the table below.
Fund | 2005A | 2004A,B |
Fidelity Aggressive International Fund | $41,000 | $37,000 |
Fidelity Diversified International Fund | $102,000 | $56,000 |
Fidelity Europe Capital Appreciation Fund | $42,000 | $41,000 |
Fidelity International Small Cap Fund | $37,000 | $32,000 |
Fidelity International Small Cap Opportunities Fund | $36,000 | $0 |
Fidelity Worldwide Fund | $43,000 | $42,000 |
All funds in the Fidelity Group of Funds audited by Deloitte Entities | $5,400,000 | $4,300,000 |
A | Aggregate amounts may reflect rounding. |
B | No Audit Fees were billed by Deloitte Entities for professional services rendered for the audit of the annual financial statements, or services that are normally provided in connection with the statutory and regulatory filings or engagements, to Fidelity International Small Cap Opportunities Fund as the fund did not commence operations until August 2, 2005. |
(b) Audit-Related Fees.
In each of the fiscal years ended October 31, 2005 and October 31, 2004, the aggregate Audit-Related Fees billed by PwC for services rendered for assurance and related services to each fund that are reasonably related to the performance of the audit or review of the fund's financial statements, but not reported as Audit Fees, are shown in the table below.
Fund | 2005A | 2004 A |
Fidelity Canada Fund | $0 | $0 |
Fidelity China Region Fund | $0 | $0 |
Fidelity Emerging Markets Fund | $0 | $0 |
Fidelity Europe Fund | $0 | $0 |
Fidelity Global Balanced Fund | $0 | $0 |
Fidelity International Discovery Fund | $0 | $0 |
Fidelity Japan Fund | $0 | $0 |
Fidelity Japan Smaller Companies Fund | $0 | $0 |
Fidelity Latin America Fund | $0 | $0 |
Fidelity Nordic Fund | $0 | $0 |
Fidelity Overseas Fund | $0 | $0 |
Fidelity Pacific Basin Fund | $0 | $0 |
Fidelity Southeast Asia Fund | $0 | $0 |
A | Aggregate amounts may reflect rounding. |
In each of the fiscal years ended October 31, 2005 and October 31, 2004, the aggregate Audit-Related Fees billed by Deloitte Entities for services rendered for assurance and related services to each fund that are reasonably related to the performance of the audit or review of the fund's financial statements, but not reported as Audit Fees, are shown in the table below.
Fund | 2005A | 2004 A,B |
Fidelity Aggressive International Fund | $0 | $0 |
Fidelity Diversified International Fund | $0 | $0 |
Fidelity Europe Capital Appreciation Fund | $0 | $0 |
Fidelity International Small Cap Fund | $0 | $0 |
Fidelity International Small Cap Opportunities Fund | $0 | $0 |
Fidelity Worldwide Fund | $0 | $0 |
A | Aggregate amounts may reflect rounding. |
B | No Audit-Related Fees were billed by Deloitte Entities for services rendered for assurance and related services to Fidelity International Small Cap Opportunities Fund as the fund did not commence operations until August 2, 2005. |
In each of the fiscal years ended October 31, 2005 and October 31, 2004, the aggregate Audit-Related Fees that were billed by PwC and Deloitte Entities that were required to be approved by the Audit Committee for services rendered on behalf of Fidelity Management & Research Company (FMR) and entities controlling, controlled by, or under common control with FMR (not including any sub-adviser whose role is primarily portfolio management and is subcontracted with or overseen by another investment adviser) that provide ongoing services to the funds ("Fund Service Providers") for assurance and related services that relate directly to the operations and financial reporting of each fund that are reasonably related to the performance of the audit or review of the fund's financial statements, but not reported as Audit Fees, are shown in the table below.
Billed By | 2005 A,B | 2004A,B |
PwC | $0 | $0 |
Deloitte Entities | $0 | $0 |
A | Aggregate amounts may reflect rounding. |
B | May include amounts billed prior to Fidelity International Small Cap Opportunities Fund's commencement of operations. |
Fees included in the audit-related category comprise assurance and related services (e.g., due diligence services) that are traditionally performed by the independent registered public accounting firm. These audit-related services include due diligence related to mergers and acquisitions, accounting consultations and audits in connection with acquisitions, internal control reviews, attest services that are not required by statute or regulation and consultation concerning financial accounting and reporting standards.
(c) Tax Fees.
In each of the fiscal years ended October 31, 2005 and October 31, 2004, the aggregate Tax Fees billed by PwC for professional services rendered for tax compliance, tax advice, and tax planning for each fund is shown in the table below.
Fund | 2005A | 2004A |
Fidelity Canada Fund | $4,200 | $4,000 |
Fidelity China Region Fund | $4,200 | $4,000 |
Fidelity Emerging Markets Fund | $34,600 | $23,000 |
Fidelity Europe Fund | $4,200 | $4,000 |
Fidelity Global Balanced Fund | $4,200 | $4,000 |
Fidelity International Discovery Fund | $26,500 | $16,300 |
Fidelity Japan Fund | $4,700 | $4,000 |
Fidelity Japan Smaller Companies Fund | $4,200 | $4,000 |
Fidelity Latin America Fund | $4,200 | $4,000 |
Fidelity Nordic Fund | $4,200 | $4,000 |
Fidelity Overseas Fund | $4,200 | $4,000 |
Fidelity Pacific Basin Fund | $27,800 | $13,000 |
Fidelity Southeast Asia Fund | $16,300 | $16,900 |
A | Aggregate amounts may reflect rounding. |
In each of the fiscal years ended October 31, 2005 and October 31, 2004, the aggregate Tax Fees billed by Deloitte Entities for professional services rendered for tax compliance, tax advice, and tax planning for each fund is shown in the table below.
Fund | 2005A | 2004A,B |
Fidelity Aggressive International Fund | $3,900 | $3,900 |
Fidelity Diversified International Fund | $4,000 | $4,000 |
Fidelity Europe Capital Appreciation Fund | $4,000 | $4,000 |
Fidelity International Small Cap Fund | $3,600 | $3,600 |
Fidelity International Small Cap Opportunities Fund | $3,800 | $0 |
Fidelity Worldwide Fund | $4,000 | $4,000 |
A | Aggregate amounts may reflect rounding. |
B | No Tax Fees were billed by Deloitte Entities for services rendered for tax compliance, tax advice, and tax planning for Fidelity International Small Cap Opportunities Fund as the fund did not commence operations until August 2, 2005. |
In each of the fiscal years ended October 31, 2005 and October 31, 2004, the aggregate Tax Fees billed by PwC and Deloitte Entities that were required to be approved by the Audit Committee for professional services rendered on behalf of the Fund Service Providers for tax compliance, tax advice, and tax planning that relate directly to the operations and financial reporting of each fund is shown in the table below.
Billed By | 2005A,B | 2004A,B |
PwC | $0 | $0 |
Deloitte Entities | $0 | $0 |
A | Aggregate amounts may reflect rounding. |
B | May include amounts billed prior to Fidelity International Small Cap Opportunities Fund's commencement of operations. |
Fees included in the Tax Fees category comprise all services performed by professional staff in the independent registered public accounting firm's tax division except those services related to the audit. Typically, this category would include fees for tax compliance, tax planning, and tax advice. Tax compliance, tax advice, and tax planning services include preparation of original and amended tax returns, claims for refund and tax payment-planning services, assistance with tax audits and appeals, tax advice related to mergers and acquisitions and requests for rulings or technical advice from taxing authorities.
(d) All Other Fees.
In each of the fiscal years ended October 31, 2005 and October 31, 2004, the aggregate Other Fees billed by PwC for all other non-audit services rendered to the funds is shown in the table below.
Fund | 2005A | 2004A |
Fidelity Canada Fund | $2,200 | $1,500 |
Fidelity China Region Fund | $1,700 | $1,500 |
Fidelity Emerging Markets Fund | $2,200 | $1,700 |
Fidelity Europe Fund | $3,400 | $2,600 |
Fidelity Global Balanced Fund | $1,500 | $1,400 |
Fidelity International Discovery Fund | $4,000 | $2,700 |
Fidelity Japan Fund | $2,000 | $1,800 |
Fidelity Japan Smaller Companies Fund | $2,400 | $2,200 |
Fidelity Latin America Fund | $2,000 | $1,500 |
Fidelity Nordic Fund | $1,500 | $1,300 |
Fidelity Overseas Fund | $5,400 | $4,700 |
Fidelity Pacific Basin Fund | $1,800 | $1,600 |
Fidelity Southeast Asia Fund | $1,900 | $1,600 |
A | Aggregate amounts may reflect rounding. |
In each of the fiscal years ended October 31, 2005 and October 31, 2004, the aggregate Other Fees billed by Deloitte Entities for all other non-audit services rendered to the funds is shown in the table below.
Fund | 2005A | 2004A,B |
Fidelity Aggressive International Fund | $0 | $0 |
Fidelity Diversified International Fund | $0 | $0 |
Fidelity Europe Capital Appreciation Fund | $0 | $0 |
Fidelity International Small Cap Fund | $0 | $0 |
Fidelity International Small Cap Opportunities Fund | $0 | $0 |
Fidelity Worldwide Fund | $0 | $0 |
A | Aggregate amounts may reflect rounding. |
B | No Other Fees were billed by Deloitte Entities for all other non-audit services rendered to Fidelity International Small Cap Opportunities Fund as the fund did not commence operations until August 2, 2005. |
In each of the fiscal years ended October 31, 2005 and October 31, 2004, the aggregate Other Fees billed by PwC and Deloitte Entities that were required to be approved by the Audit Committee for all other non-audit services rendered on behalf of the Fund Service Providers that relate directly to the operations and financial reporting of each fund is shown in the table below.
Billed By | 2005A,B | 2004A,B |
PwC | $420,000 | $300,000 |
Deloitte Entities | $210,000 | $720,000 |
A | Aggregate amounts may reflect rounding. |
B | May include amounts billed prior to Fidelity International Small Cap Opportunities Fund's commencement of operations. |
Fees included in the All Other Fees category include services related to internal control reviews, strategy and other consulting, financial information systems design and implementation, consulting on other information systems, and other tax services unrelated to the fund.
(e) (1) | Audit Committee Pre-Approval Policies and Procedures: |
The trust's Audit Committee must pre-approve all audit and non-audit services provided by the independent registered public accounting firm relating to the operations or financial reporting of the funds. Prior to the commencement of any audit or non-audit services to a fund, the Audit Committee reviews the services to determine whether they are appropriate and permissible under applicable law.
The trust's Audit Committee has adopted policies and procedures to, among other purposes, provide a framework for the Committee's consideration of non-audit services by the audit firms that audit the Fidelity funds. The policies and procedures require that any non-audit service provided by a fund audit firm to a Fidelity Fund and any non-audit service provided by a fund auditor to a Fund Service Provider that relates directly to the operations and financial reporting of a Fidelity fund (Covered Service) are subject to approval by the Audit Committee before such service is provided. Non-audit services provided by a fund audit firm for a Fund Service Provider that do not relate directly to the operations and financial reporting of a Fidelity fund (Non-Covered Service) but that are expected to exceed $50,000 are also subject to pre-approval by the Audit Committee.
All Covered Services, as well as Non-Covered Services that are expected to exceed $50,000, must be approved in advance of provision of the service either: (i) by formal resolution of the Audit Committee, or (ii) by oral or written approval of the service by the Chair of the Audit Committee (or if the Chair is unavailable, such other member of the Audit Committee as may be designated by the Chair to act in the Chair's absence). The approval contemplated by (ii) above is permitted where the Treasurer determines that action on such an engagement is necessary before the next meeting of the Audit Committee. Neither pre-approval nor advance notice of Non-Covered Service engagements for which fees are not expected to exceed $50,000 is required; such engagements are to be reported to the Audit Committee monthly.
(e) (2) | Services approved pursuant to paragraph (c)(7)(i)(C) of Rule 2-01 of Regulation S-X: |
Audit-Related Fees:
There were no amounts that were approved by the Audit Committee pursuant to the de minimis exception for the fiscal years ended October 31, 2005 and October 31, 2004 on behalf of each fund.
There were no amounts that were required to be approved by the Audit Committee pursuant to the de minimis exception for the fiscal years ended October 31, 2005 and October 31, 2004 on behalf of the Fund Service Providers that relate directly to the operations and financial reporting of each fund.
Tax Fees:
There were no amounts that were approved by the Audit Committee pursuant to the de minimis exception for the fiscal years ended October 31, 2005 and October 31, 2004 on behalf of each fund.
There were no amounts that were required to be approved by the Audit Committee pursuant to the de minimis exception for the fiscal years ended October 31, 2005 and October 31, 2004 on behalf of the Fund Service Providers that relate directly to the operations and financial reporting of each fund.
All Other Fees:
There were no amounts that were approved by the Audit Committee pursuant to the de minimis exception for the fiscal years ended October 31, 2005 and October 31, 2004 on behalf of each fund.
There were no amounts that were required to be approved by the Audit Committee pursuant to the de minimis exception for the fiscal years ended October 31, 2005 and October 31, 2004 on behalf of the Fund Service Providers that relate directly to the operations and financial reporting of each fund.
(f) Not applicable.
(g) For the fiscal years ended October 31, 2005 and October 31, 2004, the aggregate fees billed by PwC of $4,200,000A and $2,350,000A for non-audit services rendered on behalf of the funds, FMR (not including any sub-adviser whose role is primarily portfolio management and is subcontracted with or overseen by another investment adviser) and Fund Service Providers relating to Covered Services and Non-Covered Services are shown in the table below.
2005A | 2004A | |
Covered Services | $600,000 | $400,000 |
Non-Covered Services | $3,600,000 | $1,950,000 |
A | Aggregate amounts may reflect rounding. |
For the fiscal years ended October 31, 2005 and October 31, 2004, the aggregate fees billed by Deloitte Entities of $650,000A,B and $1,600,000A,B for non-audit services rendered on behalf of the fund, FMR (not including any sub-adviser whose role is primarily portfolio management and is subcontracted with or overseen by another investment adviser) and Fund Service Providers relating to Covered Services and Non-Covered Services are shown in the table below.
2005A,B | 2004A,B | |
Covered Services | $250,000 | $700,000 |
Non-Covered Services | $400,000 | $900,000 |
A | Aggregate amounts may reflect rounding. |
B | May include amounts billed prior to Fidelity International Small Cap Opportunities Fund's commencement of operations. |
(h) The trust's Audit Committee has considered Non-Covered Services that were not pre-approved that were provided by PwC and Deloitte Entities to Fund Service Providers to be compatible with maintaining the independence of PwC and Deloitte Entities in their audit of the funds, taking into account representations from PwC and Deloitte Entities, in accordance with Independence Standards Board Standard No.1, regarding their independence from the funds and their related entities.
Item 5. Audit Committee of Listed Registrants
Not applicable.
Item 6. Schedule of Investments
Not applicable.
Item 7. Disclosure of Proxy Voting Policies and Procedures for Closed-End Management Investment Companies
Not applicable.
Item 8. Portfolio Managers of Closed-End Management Investment Companies
Not applicable.
Item 9. Purchase of Equity Securities by Closed-End Management Investment Company and Affiliated Purchasers
Not applicable.
Item 10. Submission of Matters to a Vote of Security Holders
There were no material changes to the procedures by which shareholders may recommend nominees to the trust's Board of Trustees.
Item 11. Controls and Procedures
(a)(i) The President and Treasurer and the Chief Financial Officer have concluded that the trust's disclosure controls and procedures (as defined in Rule 30a-3(c) under the Investment Company Act) provide reasonable assurances that material information relating to the trust is made known to them by the appropriate persons, based on their evaluation of these controls and procedures as of a date within 90 days of the filing date of this report.
(a)(ii) There was no change in the trust's internal control over financial reporting (as defined in Rule 30a-3(d) under the Investment Company Act) that occurred during the second fiscal quarter of the period covered by this report that has materially affected, or is reasonably likely to materially affect, the trust's internal control over financial reporting.
Item 12. Exhibits
(a) | (1) | Code of Ethics pursuant to Item 2 of Form N-CSR is filed and attached hereto as EX-99.CODE ETH. |
(a) | (2) | Certification pursuant to Rule 30a-2(a) under the Investment Company Act of 1940 (17 CFR 270.30a-2(a)) is filed and attached hereto as Exhibit 99.CERT. |
(a) | (3) | Not applicable. |
(b) | Certification pursuant to Rule 30a-2(b) under the Investment Company Act of 1940 (17 CFR 270.30a-2(b)) is furnished and attached hereto as Exhibit 99.906CERT. |
SIGNATURES
Pursuant to the requirements of the Securities Exchange Act of 1934 and the Investment Company Act of 1940, the registrant has duly caused this report to be signed on its behalf by the undersigned, thereunto duly authorized.
Fidelity Investment Trust
By: | /s/Christine Reynolds |
Christine Reynolds | |
President and Treasurer | |
Date: | December 22, 2005 |
Pursuant to the requirements of the Securities Exchange Act of 1934 and the Investment Company Act of 1940, this report has been signed below by the following persons on behalf of the registrant and in the capacities and on the dates indicated.
By: | /s/Christine Reynolds |
Christine Reynolds | |
President and Treasurer | |
Date: | December 22, 2005 |
By: | /s/Paul M. Murphy |
Paul M. Murphy | |
Chief Financial Officer | |
Date: | December 22, 2005 |