UNITED STATES
SECURITIES AND EXCHANGE COMMISSION
Washington, D.C. 20549
FORM N-CSR
CERTIFIED SHAREHOLDER REPORT OF REGISTERED
MANAGEMENT INVESTMENT COMPANIES
Investment Company Act file number 811-4008
Fidelity Investment Trust
(Exact name of registrant as specified in charter)
82 Devonshire St., Boston, Massachusetts 02109
(Address of principal executive offices) (Zip code)
Scott C. Goebel, Secretary
82 Devonshire St.
Boston, Massachusetts 02109
(Name and address of agent for service)
Registrant's telephone number, including area code: 617-563-7000
Date of fiscal year end: | October 31 |
| |
Date of reporting period: | October 31, 2011 |
Item 1. Reports to Stockholders
Fidelity's
Targeted International Equity
Funds®
Fidelity® Canada Fund
Fidelity China Region Fund
Fidelity Emerging Asia Fund
Fidelity Emerging Markets Fund
Fidelity Europe Capital Appreciation Fund
Fidelity Europe Fund
Fidelity Japan Fund
Fidelity Japan Smaller Companies Fund
Fidelity Latin America Fund
Fidelity Nordic Fund
Fidelity Pacific Basin Fund
Annual Report
October 31, 2011
Contents
To view a fund's proxy voting guidelines and proxy voting record for the 12-month period ended June 30, visit http://www.fidelity.com/proxyvotingresults or visit the Securities and Exchange Commission's (SEC) web site at http://www.sec.gov. You may also call 1-800-544-8544 to request a free copy of the proxy voting guidelines.
Standard & Poor's, S&P and S&P 500 are registered service marks of The McGraw-Hill Companies, Inc. and have been licensed for use by Fidelity Distributors Corporation.
Other third party marks appearing herein are the property of their respective owners.
All other marks appearing herein are registered or unregistered trademarks or service marks of FMR LLC or an affiliated company.
Annual Report
This report and the financial statements contained herein are submitted for the general information of the shareholders of the funds. This report is not authorized for distribution to prospective investors in the funds unless preceded or accompanied by an effective prospectus.
A fund files its complete schedule of portfolio holdings with the SEC for the first and third quarters of each fiscal year on Form N-Q. Forms N-Q are available on the SEC's web site at http://www.sec.gov. A fund's Forms N-Q may be reviewed and copied at the SEC's Public Reference Room in Washington, DC. Information regarding the operation of the SEC's Public Reference Room may be obtained by calling 1-800-SEC-0330. For a complete list of a fund's portfolio holdings, view the most recent holdings listing, semiannual report, or annual report on Fidelity's web site at http://www.fidelity.com, http://www.advisor.fidelity.com, or http://www.401k.com, as applicable.
NOT FDIC INSURED • MAY LOSE VALUE • NO BANK GUARANTEE
Neither the funds nor Fidelity Distributors Corporation is a bank.
Annual Report
(The Acting Chairman's photo appears here.)
Dear Shareholder:
Global equity markets began the fourth quarter on a strong note, sharply reversing course in October amid strong corporate earnings, better-than-expected economic news and the promise of a resolution to the sovereign debt crisis in Europe. The mini rally followed a third quarter marked by a significant downturn in July and August, which heightened investor anxiety and set off a wave of volatility that hampered most major asset classes through the end of September. Financial markets are difficult to predict, of course, but you can help put the odds in your favor by following these time-tested investment principles.
One of the basic tenets is to invest according to your time horizon. For long-term investors, riding out the markets' inevitable ups and downs has proven much more effective than making decisions based on short-term developments. If your goal is approaching, you can also benefit from patience and restraint, rather than attempting to time the market. No matter your time horizon, missing only a few of the markets' best days can significantly diminish returns. Patience also affords the benefits of compounding - earning interest on additional income or reinvested dividends and capital gains. While staying the course doesn't eliminate risk, it can considerably lessen the negative impact of short-term downturns.
Asset allocation is another principle to manage risk. As you spread your portfolio among the asset classes, be sure to consider your time horizon, risk tolerance and investment objectives. Younger investors may be better served by emphasizing equities, which historically have been the best-performing asset class over time. Investors who are nearing a specific goal, such as retirement or sending a child to college, may choose to favor bonds and other investments that have tended to be more stable. Studies indicate that asset allocation is the single most important determinant of a portfolio's long-term success. After deciding on a suitable allocation strategy, make sure your portfolio is adequately diversified, with exposure to stocks of small-, mid- and large-cap companies in a range of sectors, for example. And today, more than ever, geographic diversification should be taken into account.
Lastly, investing a certain amount of money on a regular basis - a principle known as dollar-cost averaging - can help lower the average cost of your purchases, while also giving you the discipline to avoid selling weak performers just prior to an upswing, or chasing a hot performer just before a correction.
We invite you to learn more by visiting us on the Internet, dropping by one of our Investor Centers or calling us by phone. It is our privilege to provide the resources you need to choose investments that are right for you.
Sincerely,
(The Acting Chairman's signature appears here.)
James C. Curvey
Acting Chairman
Annual Report
Fidelity Canada Fund
Performance: The Bottom Line
Average annual total return reflects the change in the value of an investment, assuming reinvestment of the class' distributions from dividend income and capital gains (the profits earned upon the sale of securities that have grown in value, if any) and assuming a constant rate of performance each year. The $10,000 table and the fund's returns do not reflect the deduction of taxes that a shareholder would pay on fund distributions or the redemption of fund shares. During periods of reimbursement by Fidelity, a fund's total return will be greater than it would be had the reimbursement not occurred. How a fund did yesterday is no guarantee of how it will do tomorrow.
Average Annual Total Returns
Periods ended October 31, 2011 | Past 1
year | Past 5
years | Past 10
years |
Fidelity® Canada Fund | -1.33% | 3.62% | 13.29% |
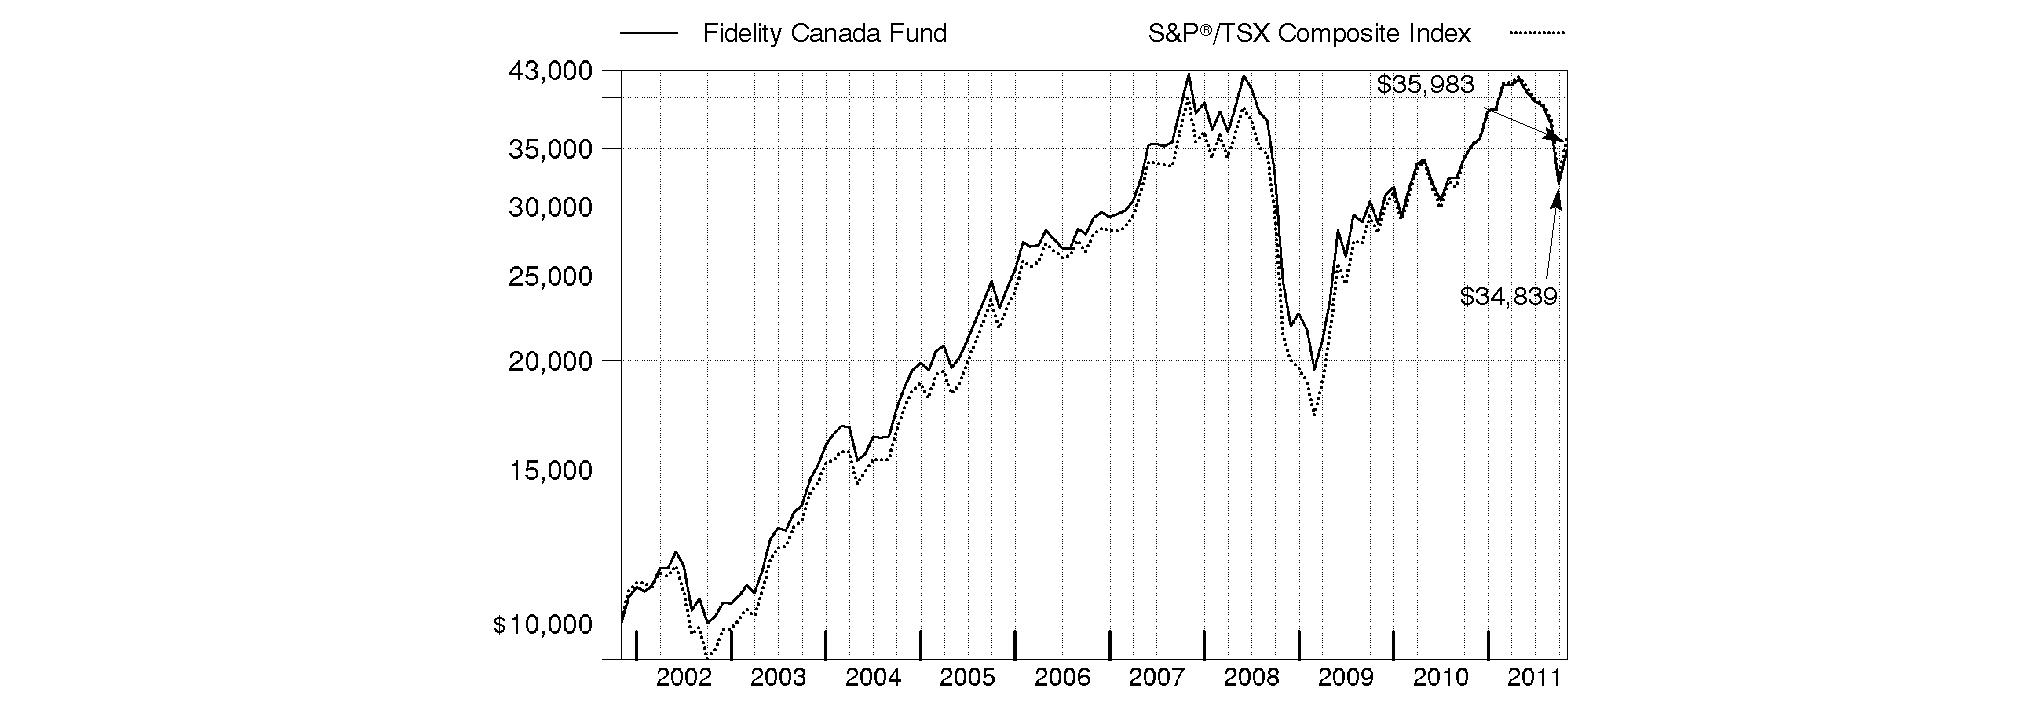
$10,000 Over 10 Years
Let's say hypothetically that $10,000 was invested in Fidelity® Canada Fund, a class of the fund, on October 31, 2001. The chart shows how the value of your investment would have changed, and also shows how the S&P®/TSX Composite Index performed over the same period.
Annual Report
Fidelity Canada Fund
Market Recap: International equities were rocked by a number of headline events during the year ending October 31, 2011. Stocks posted a solid advance for the first half of the period, despite concern about the sovereign debt crisis in Europe, a devastating earthquake and tsunami in Japan, and political upheaval in the Middle East and North Africa. Sentiment turned decidedly negative in the second half, however, as fresh worries about Europe, inflation in China and a dimmed outlook for global growth caused foreign markets to suffer declines that intensified in August and September. October brought with it yet another dramatic swing, as eurozone policymakers appeared near a resolution to the debt debacle and buyers stormed back onto the scene in search of bargains. Still, those gains - along with favorable currency fluctuations overall - weren't enough to offset prior losses, and the MSCI® ACWI® (All Country World Index) ex USA Index finished the period down 4.56%. Within the MSCI index, Europe and emerging markets suffered the biggest declines, with many countries in these areas sustaining steep losses. By contrast, Japan showed resilience in the wake of its natural disasters, falling only 2%. Australia (+4%), Switzerland (+3%), the U.K. (+2%) and Canada, which produced a nominal return, were among the few major benchmark components to break into positive territory.
Comments from Douglas Lober, Portfolio Manager of Fidelity® Canada Fund: For the 12 months ending October 31, 2011, the fund's Retail Class shares declined 1.33%, trailing the 1.60% gain of the S&P/TSX Composite Index. It was a challenging year for equities worldwide. Canadian stocks enjoyed a strong surge in the first half of the period, only to see most of those gains erased during the summer, when heightened macroeconomic and sovereign debt concerns fueled a sharp sell-off in the market. Against this backdrop, positioning in energy, financials and industrials detracted meaningfully versus the index, as did an overweighting in the weak materials sector. Conversely, positioning within the hard-hit information technology sector contributed the most, largely due to underweighting and then selling poor-performing Research In Motion, maker of the BlackBerry® personal communications device. Larger-than-index exposure to the strong-performing health care group also helped. On an individual stock basis, three of the four biggest detractors were energy names, with the largest blow coming from an underweighting in pipleline developer TransCanada. The stock gained 20% for the year, as investors were attracted to the company's solid dividend yield amid the market uncertainty. Canadian Natural Resources and Precision Drilling, two crude-oil-oriented energy companies, experienced volatile stock price swings during the period, and my untimely ownership of both created a head wind for the fund. Elsewhere, a poorly timed overweighting in First Quantum Minerals detracted, as copper prices fell. On the upside, overweighting Valeant Pharmaceuticals International helped, as shares of the specialty pharmaceuticals firm benefited from strong earnings and small additive acquisitions during the period. Scant exposure to Encana, a natural gas exploration and production company in the index that performed poorly, also provided a lift. In materials, major gold miner Goldcorp helped, as the price of the yellow metal climbed more than 25% during the period, due in part to a generally weakening U.S. dollar and concern about a potential global financial crisis. Also in this space, shares of Consolidated Thompson Iron Mines got a boost when the firm agreed to be acquired by Cliffs Natural Resources in January, a deal that closed in May.
Note to shareholders: Fidelity Canada Fund may invest up to 35% of its total assets in any industry that represents more than 20% of the Canadian market. As of October 31, 2011, the fund did not have more than 25% of its assets invested in any one industry.
The views expressed above reflect those of the portfolio manager(s) only through the end of the period as stated on the cover of this report and do not necessarily represent the views of Fidelity or any other person in the Fidelity organization. Any such views are subject to change at any time based upon market or other conditions and Fidelity disclaims any responsibility to update such views. These views may not be relied on as investment advice and, because investment decisions for a Fidelity fund are based on numerous factors, may not be relied on as an indication of trading intent on behalf of any Fidelity fund.
Annual Report
Fidelity Canada Fund
As a shareholder of the Fund, you incur two types of costs: (1) transaction costs, including sales charges (loads) on purchase payments or redemption proceeds, redemption fees, and (2) ongoing costs, including management fees, distribution and/or service (12b-1) fees and other Fund expenses. This Example is intended to help you understand your ongoing costs (in dollars) of investing in the Fund and to compare these costs with the ongoing costs of investing in other mutual funds.
The Example is based on an investment of $1,000 invested at the beginning of the period and held for the entire period (May 1, 2011 to October 31, 2011).
Actual Expenses
The first line of the accompanying table for each class of the Fund provides information about actual account values and actual expenses. You may use the information in this line, together with the amount you invested, to estimate the expenses that you paid over the period. Simply divide your account value by $1,000.00 (for example, an $8,600 account value divided by $1,000.00 = 8.6), then multiply the result by the number in the first line for a class of the Fund under the heading entitled "Expenses Paid During Period" to estimate the expenses you paid on your account during this period. A small balance maintenance fee of $12.00 that is charged once a year may apply for certain accounts with a value of less than $2,000. This fee is not included in the table below. If it was, the estimate of expenses you paid during the period would be higher, and your ending account value lower, by this amount. In addition, the Fund, as a shareholder in the underlying Fidelity Central Funds, will indirectly bear its pro-rata share of the fees and expenses incurred by the underlying Fidelity Central Funds. These fees and expenses are not included in the Fund's annualized expense ratio used to calculate the expense estimate in the table below.
Hypothetical Example for Comparison Purposes
The second line of the accompanying table for each class of the Fund provides information about hypothetical account values and hypothetical expenses based on a Class' actual expense ratio and an assumed rate of return of 5% per year before expenses, which is not the Class' actual return. The hypothetical account values and expenses may not be used to estimate the actual ending account balance or expenses you paid for the period. You may use this information to compare the ongoing costs of investing in the Fund and other funds. To do so, compare this 5% hypothetical example with the 5% hypothetical examples that appear in the shareholder reports of the other funds. A small balance maintenance fee of $12.00 that is charged once a year may apply for certain accounts with a value of less than $2,000. This fee is not included in the table below. If it was, the estimate of expenses you paid during the period would be higher, and your ending account value lower, by this amount. In addition, the Fund, as a shareholder in the underlying Fidelity Central Funds, will indirectly bear its pro-rata share of the fees and expenses incurred by the underlying Fidelity Central Funds. These fees and expenses are not included in the Fund's annualized expense ratio used to calculate the expense estimate in the table below.
Please note that the expenses shown in the table are meant to highlight your ongoing costs only and do not reflect any transaction costs. Therefore, the second line of the table is useful in comparing ongoing costs only, and will not help you determine the relative total costs of owning different funds. In addition, if these transactional costs were included, your costs would have been higher.
| Annualized
Expense Ratio | Beginning
Account Value
May 1, 2011 | Ending
Account Value
October 31, 2011 | Expenses Paid
During Period*
May 1, 2011 to
October 31, 2011 |
Class A | 1.11% | | | |
Actual | | $ 1,000.00 | $ 829.20 | $ 5.12 |
HypotheticalA | | $ 1,000.00 | $ 1,019.61 | $ 5.65 |
Class T | 1.41% | | | |
Actual | | $ 1,000.00 | $ 828.10 | $ 6.50 |
HypotheticalA | | $ 1,000.00 | $ 1,018.10 | $ 7.17 |
Class B | 1.90% | | | |
Actual | | $ 1,000.00 | $ 825.90 | $ 8.74 |
HypotheticalA | | $ 1,000.00 | $ 1,015.63 | $ 9.65 |
Class C | 1.86% | | | |
Actual | | $ 1,000.00 | $ 826.20 | $ 8.56 |
HypotheticalA | | $ 1,000.00 | $ 1,015.83 | $ 9.45 |
Canada | .81% | | | |
Actual | | $ 1,000.00 | $ 830.50 | $ 3.74 |
HypotheticalA | | $ 1,000.00 | $ 1,021.12 | $ 4.13 |
Institutional Class | .82% | | | |
Actual | | $ 1,000.00 | $ 830.40 | $ 3.78 |
HypotheticalA | | $ 1,000.00 | $ 1,021.07 | $ 4.18 |
A 5% return per year before expenses
* Expenses are equal to each Class' annualized expense ratio, multiplied by the average account value over the period, multiplied by 184/365 (to reflect the one-half year period).
Annual Report
Fidelity Canada Fund
Investment Changes (Unaudited)
Geographic Diversification (% of fund's net assets) |
As of October 31, 2011 |
 | Canada | 95.8% | |
 | United States of America | 4.2% | |

Percentages are adjusted for the effect of futures contracts, if applicable. |
As of April 30, 2011 |
| Canada | 93.5% | |
 | United States of America | 6.2% | |
 | United Kingdom | 0.2% | |
| France | 0.1% | |

Percentages are adjusted for the effect of futures contracts, if applicable. |
Asset Allocation |
| % of fund's
net assets | % of fund's net assets
6 months ago |
Stocks | 99.8 | 98.2 |
Short-Term Investments and Net Other Assets | 0.2 | 1.8 |
Top Ten Stocks as of October 31, 2011 |
| % of fund's
net assets | % of fund's net assets
6 months ago |
The Toronto-Dominion Bank (Commercial Banks) | 5.4 | 4.1 |
Enbridge, Inc. (Oil, Gas & Consumable Fuels) | 3.9 | 2.2 |
Bank of Nova Scotia (Commercial Banks) | 3.9 | 3.3 |
Suncor Energy, Inc. (Oil, Gas & Consumable Fuels) | 3.8 | 5.0 |
Goldcorp, Inc. (Metals & Mining) | 3.7 | 5.8 |
Open Text Corp. (Internet Software & Services) | 3.5 | 0.8 |
Canadian National Railway Co. (Road & Rail) | 3.5 | 2.5 |
Bank of Montreal (Commercial Banks) | 3.3 | 1.8 |
Potash Corp. of Saskatchewan, Inc. (Chemicals) | 3.1 | 3.3 |
BCE, Inc. (Diversified Telecommunication Services) | 2.8 | 1.5 |
| 36.9 | |
Market Sectors as of October 31, 2011 |
| % of fund's
net assets | % of fund's net assets
6 months ago |
Energy | 23.4 | 27.3 |
Materials | 23.4 | 22.9 |
Financials | 22.8 | 22.8 |
Telecommunication Services | 5.6 | 2.7 |
Information Technology | 5.5 | 3.5 |
Consumer Discretionary | 5.5 | 4.2 |
Industrials | 5.4 | 7.4 |
Health Care | 4.7 | 6.5 |
Consumer Staples | 2.6 | 0.9 |
Utilities | 0.9 | 0.0 |
Annual Report
Fidelity Canada Fund
Investments October 31, 2011
Showing Percentage of Net Assets
Common Stocks - 99.8% |
| Shares | | Value |
CONSUMER DISCRETIONARY - 5.5% |
Hotels, Restaurants & Leisure - 1.5% |
McDonald's Corp. | 150,000 | | $ 13,927,500 |
Tim Hortons, Inc. (Canada) | 1,010,300 | | 49,721,942 |
| | 63,649,442 |
Media - 1.4% |
Astral Media, Inc. Class A (non-vtg.) | 400,000 | | 13,731,253 |
Cineplex, Inc. | 250,000 | | 6,638,411 |
Corus Entertainment, Inc. Class B (non-vtg.) | 600,000 | | 11,490,194 |
Quebecor, Inc. Class B (sub. vtg.) | 750,000 | | 25,956,764 |
| | 57,816,622 |
Multiline Retail - 1.7% |
Dollar Tree, Inc. (a) | 350,000 | | 27,986,000 |
Dollarama, Inc. | 1,134,975 | | 42,718,826 |
| | 70,704,826 |
Textiles, Apparel & Luxury Goods - 0.9% |
Gildan Activewear, Inc. | 166,400 | | 4,293,332 |
lululemon athletica, Inc. (a) | 437,600 | | 24,715,648 |
NIKE, Inc. Class B | 100,000 | | 9,635,000 |
| | 38,643,980 |
TOTAL CONSUMER DISCRETIONARY | | 230,814,870 |
CONSUMER STAPLES - 2.6% |
Food & Staples Retailing - 2.3% |
Alimentation Couche-Tard, Inc. Class B (sub. vtg.) | 1,090,200 | | 32,809,349 |
Metro, Inc. Class A (sub. vtg.) | 785,165 | | 38,468,635 |
Whole Foods Market, Inc. | 320,000 | | 23,078,400 |
| | 94,356,384 |
Food Products - 0.3% |
Saputo, Inc. | 350,000 | | 14,458,544 |
TOTAL CONSUMER STAPLES | | 108,814,928 |
ENERGY - 23.4% |
Energy Equipment & Services - 1.1% |
Calfrac Well Services Ltd. | 150,000 | | 4,649,646 |
Precision Drilling Corp. (a) | 1,200,000 | | 13,915,835 |
Trican Well Service Ltd. | 600,000 | | 10,611,426 |
Trinidad Drilling Ltd. | 2,303,400 | | 18,023,293 |
| | 47,200,200 |
Oil, Gas & Consumable Fuels - 22.3% |
Baytex Energy Corp. (d) | 1,800,000 | | 95,141,696 |
Canadian Natural Resources Ltd. | 1,700,000 | | 59,960,877 |
Canadian Oil Sands Ltd. | 1,400,000 | | 32,442,193 |
Celtic Exploration Ltd. (a) | 54,500 | | 1,349,857 |
Celtic Exploration Ltd. (e) | 1,700,000 | | 42,105,633 |
Cenovus Energy, Inc. | 2,700,000 | | 92,469,278 |
|
| Shares | | Value |
Crescent Point Energy Corp. (d) | 583,400 | | $ 24,913,817 |
Enbridge, Inc. | 4,737,800 | | 164,113,191 |
Encana Corp. | 1,000,000 | | 21,688,318 |
Imperial Oil Ltd. | 250,000 | | 10,352,611 |
Keyera Corp. | 1,083,402 | | 49,417,955 |
Open Range Energy Corp. (a) | 61,200 | | 704,796 |
Painted Pony Petroleum Ltd. (a)(e) | 113,000 | | 1,381,823 |
Petrominerales Ltd. | 192,130 | | 5,068,986 |
Peyto Exploration & Development Corp. (d) | 300,000 | | 6,545,619 |
Suncor Energy, Inc. | 5,007,600 | | 159,493,705 |
Surge Energy, Inc. (a)(e) | 632,000 | | 5,566,494 |
Talisman Energy, Inc. | 3,400,000 | | 48,227,918 |
Tourmaline Oil Corp. (a) | 850,000 | | 28,258,013 |
Tourmaline Oil Corp. (a)(e) | 380,000 | | 12,632,994 |
TransCanada Corp. | 800,000 | | 34,003,110 |
Trilogy Energy Corp. | 700,000 | | 23,847,118 |
Vermilion Energy, Inc. (d) | 300,000 | | 14,132,517 |
| | 933,818,519 |
TOTAL ENERGY | | 981,018,719 |
FINANCIALS - 22.8% |
Capital Markets - 0.4% |
Morgan Stanley | 500,000 | | 8,820,000 |
State Street Corp. | 200,000 | | 8,078,000 |
| | 16,898,000 |
Commercial Banks - 17.2% |
Bank of Montreal (d) | 2,300,000 | | 135,875,006 |
Bank of Nova Scotia | 3,100,000 | | 163,357,576 |
Canadian Imperial Bank of Commerce | 1,054,600 | | 79,450,730 |
Canadian Western Bank, Edmonton | 200,000 | | 5,718,012 |
National Bank of Canada | 700,000 | | 49,955,359 |
Royal Bank of Canada (d) | 890,000 | | 43,408,537 |
The Toronto-Dominion Bank (d) | 2,973,800 | | 224,425,922 |
U.S. Bancorp | 700,000 | | 17,913,000 |
| | 720,104,142 |
Insurance - 3.0% |
Industrial Alliance Life Insurance Co. | 600,000 | | 19,519,486 |
Intact Financial Corp. | 1,560,925 | | 87,092,991 |
MetLife, Inc. | 600,000 | | 21,096,000 |
| | 127,708,477 |
Real Estate Investment Trusts - 0.8% |
RioCan (REIT) | 1,400,000 | | 35,517,881 |
Real Estate Management & Development - 1.4% |
Brookfield Asset Management, Inc. Class A | 1,550,000 | | 44,843,256 |
Brookfield Properties Corp. | 800,000 | | 13,129,357 |
| | 57,972,613 |
TOTAL FINANCIALS | | 958,201,113 |
Common Stocks - continued |
| Shares | | Value |
HEALTH CARE - 4.7% |
Health Care Technology - 2.7% |
SXC Health Solutions Corp. (a) | 2,403,234 | | $ 111,573,125 |
Pharmaceuticals - 2.0% |
Valeant Pharmaceuticals International, Inc. (Canada) | 2,184,871 | | 86,268,268 |
TOTAL HEALTH CARE | | 197,841,393 |
INDUSTRIALS - 5.4% |
Aerospace & Defense - 0.2% |
Bombardier, Inc. Class B (sub. vtg.) (d) | 2,100,000 | | 8,679,340 |
Airlines - 0.1% |
Air Canada Class A (a) | 2,975,000 | | 4,297,537 |
Commercial Services & Supplies - 0.7% |
Progressive Waste Solution Ltd. | 1,384,000 | | 29,155,841 |
Construction & Engineering - 0.5% |
SNC-Lavalin Group, Inc. | 400,000 | | 20,099,313 |
Machinery - 0.3% |
Cummins, Inc. | 100,000 | | 9,943,000 |
Road & Rail - 3.5% |
Canadian National Railway Co. | 1,890,000 | | 148,037,518 |
Trading Companies & Distributors - 0.1% |
Finning International, Inc. | 200,000 | | 4,674,725 |
TOTAL INDUSTRIALS | | 224,887,274 |
INFORMATION TECHNOLOGY - 5.5% |
Internet Software & Services - 3.5% |
Open Text Corp. (a) | 2,430,407 | | 148,747,686 |
IT Services - 2.0% |
CGI Group, Inc. Class A (sub. vtg.) (a) | 4,090,000 | | 83,699,654 |
TOTAL INFORMATION TECHNOLOGY | | 232,447,340 |
MATERIALS - 23.4% |
Chemicals - 4.4% |
Agrium, Inc. | 500,000 | | 41,219,843 |
Methanex Corp. | 500,000 | | 12,890,605 |
Potash Corp. of Saskatchewan, Inc. | 2,780,000 | | 131,574,861 |
| | 185,685,309 |
Metals & Mining - 19.0% |
Agnico-Eagle Mines Ltd. (Canada) | 150,000 | | 6,506,495 |
Alamos Gold, Inc. | 100,000 | | 1,850,830 |
Barrick Gold Corp. | 2,250,000 | | 111,072,378 |
Copper Mountain Mining Corp. (a) | 400,000 | | 2,134,724 |
Detour Gold Corp. (a) | 1,680,000 | | 55,615,188 |
Detour Gold Corp. (a)(e) | 300,000 | | 9,931,284 |
Eldorado Gold Corp. | 3,970,000 | | 74,593,068 |
First Majestic Silver Corp. (a) | 422,400 | | 7,173,830 |
|
| Shares | | Value |
First Quantum Minerals Ltd. | 2,530,000 | | $ 53,069,469 |
Franco-Nevada Corp. | 1,600,000 | | 63,383,659 |
Goldcorp, Inc. | 3,200,000 | | 155,690,425 |
Grande Cache Coal Corp. (a) | 2,422,800 | | 23,988,600 |
IAMGOLD Corp. | 700,000 | | 15,048,402 |
Ivanhoe Mines Ltd. (a) | 1,285,000 | | 26,296,835 |
Kinross Gold Corp. | 300,000 | | 4,276,471 |
Major Drilling Group International, Inc. | 800,000 | | 10,697,698 |
New Gold, Inc. (a) | 1,600,000 | | 19,822,441 |
Osisko Mining Corp. (a) | 1,765,700 | | 21,290,780 |
Silver Wheaton Corp. | 1,075,900 | | 37,149,499 |
Tahoe Resources, Inc. (a) | 400,000 | | 7,547,775 |
Teck Resources Ltd. Class B (sub. vtg.) | 1,320,000 | | 52,913,879 |
Yamana Gold, Inc. | 2,300,000 | | 34,332,146 |
| | 794,385,876 |
TOTAL MATERIALS | | 980,071,185 |
TELECOMMUNICATION SERVICES - 5.6% |
Diversified Telecommunication Services - 4.9% |
BCE, Inc. | 3,000,000 | | 118,904,549 |
TELUS Corp. | 1,600,000 | | 86,079,149 |
| | 204,983,698 |
Wireless Telecommunication Services - 0.7% |
Rogers Communications, Inc. Class B (non-vtg.) | 800,000 | | 29,171,891 |
TOTAL TELECOMMUNICATION SERVICES | | 234,155,589 |
UTILITIES - 0.9% |
Electric Utilities - 0.9% |
Fortis, Inc. | 1,100,000 | | 37,187,139 |
TOTAL COMMON STOCKS (Cost $3,540,301,994) | 4,185,439,550 |
Money Market Funds - 10.8% |
| | | |
Fidelity Cash Central Fund, 0.12% (b) | 157,102,420 | | 157,102,420 |
Fidelity Securities Lending Cash Central Fund, 0.11% (b)(c) | 297,466,236 | | 297,466,236 |
TOTAL MONEY MARKET FUNDS (Cost $454,568,656) | 454,568,656 |
TOTAL INVESTMENT PORTFOLIO - 110.6% (Cost $3,994,870,650) | | 4,640,008,206 |
NET OTHER ASSETS (LIABILITIES) - (10.6)% | | (443,582,265) |
NET ASSETS - 100% | $ 4,196,425,941 |
Legend |
(a) Non-income producing |
(b) Affiliated fund that is available only to investment companies and other accounts managed by Fidelity Investments. The rate quoted is the annualized seven-day yield of the fund at period end. A complete unaudited listing of the fund's holdings as of its most recent quarter end is available upon request. In addition, each Fidelity Central Fund's financial statements, which are not covered by the Fund's Report of Independent Registered Public Accounting Firm, are available on the SEC's website or upon request. |
(c) Investment made with cash collateral received from securities on loan. |
(d) Security or a portion of the security is on loan at period end. |
(e) Security exempt from registration under Rule 144A of the Securities Act of 1933. These securities may be resold in transactions exempt from registration, normally to qualified institutional buyers. At the end of the period, the value of these securities amounted to $71,618,228 or 1.7% of net assets. |
Affiliated Central Funds |
Information regarding fiscal year to date income earned by the Fund from investments in Fidelity Central Funds is as follows: |
Fund | Income earned |
Fidelity Cash Central Fund | $ 95,341 |
Fidelity Securities Lending Cash Central Fund | 3,940,584 |
Total | $ 4,035,925 |
Other Affiliated Issuers |
An affiliated company is a company in which the Fund has ownership of at least 5% of the voting securities. Fiscal year to date transactions with companies which are or were affiliates are as follows: |
Affiliate | Value,
beginning of period | Purchases | Sales
Proceeds | Dividend
Income | Value,
end of
period |
SXC Health Solutions Corp. | $ 148,489,830 | $ 39,379,069 | $ 91,179,472 | $ - | $ - |
Total | $ 148,489,830 | $ 39,379,069 | $ 91,179,472 | $ - | $ - |
Other Information |
All investments are categorized as Level 1 under the Fair Value Hierarchy. The inputs or methodology used for valuing securities may not be an indication of the risk associated with investing in those securities. For more information on valuation inputs, please refer to the Security Valuation section in the accompanying Notes to Financial Statements. |
Income Tax Information |
At October 31, 2011, the Fund had a capital loss carryforward of approximately $230,403,828 of which $79,486,047 and $150,917,781 will expire in fiscal 2016 and 2017, respectively. Capital loss carryforwards are only available to offset future capital gains of the Fund to the extent provided by regulations and may be limited. |
See accompanying notes which are an integral part of the financial statements.
Annual Report
Fidelity Canada Fund
Statement of Assets and Liabilities
| October 31, 2011 |
| | |
Assets | | |
Investment in securities, at value (including securities loaned of $276,476,232) - See accompanying schedule: Unaffiliated issuers (cost $3,540,301,994) | $ 4,185,439,550 | |
Fidelity Central Funds (cost $454,568,656) | 454,568,656 | |
Total Investments (cost $3,994,870,650) | | $ 4,640,008,206 |
Foreign currency held at value (cost $3,344,813) | | 3,343,781 |
Receivable for investments sold | | 76,604,521 |
Receivable for fund shares sold | | 4,290,977 |
Dividends receivable | | 3,803,995 |
Distributions receivable from Fidelity Central Funds | | 219,888 |
Prepaid expenses | | 19,502 |
Other receivables | | 8,010 |
Total assets | | 4,728,298,880 |
| | |
Liabilities | | |
Payable for investments purchased | $ 222,658,895 | |
Payable for fund shares redeemed | 8,853,519 | |
Accrued management fee | 1,756,982 | |
Distribution and service plan fees payable | 137,316 | |
Other affiliated payables | 933,977 | |
Other payables and accrued expenses | 66,014 | |
Collateral on securities loaned, at value | 297,466,236 | |
Total liabilities | | 531,872,939 |
| | |
Net Assets | | $ 4,196,425,941 |
Net Assets consist of: | | |
Paid in capital | | $ 3,780,567,444 |
Undistributed net investment income | | 25,762,870 |
Accumulated undistributed net realized gain (loss) on investments and foreign currency transactions | | (255,068,905) |
Net unrealized appreciation (depreciation) on investments and assets and liabilities in foreign currencies | | 645,164,532 |
Net Assets | | $ 4,196,425,941 |
Statement of Assets and Liabilities - continued
| October 31, 2011 |
| | |
Calculation of Maximum Offering Price Class A:
Net Asset Value and redemption price per share ($215,368,915 ÷ 4,125,938 shares) | | $ 52.20 |
| | |
Maximum offering price per share (100/94.25 of $52.20) | | $ 55.38 |
Class T:
Net Asset Value and redemption price per share ($34,323,432 ÷ 659,962 shares) | | $ 52.01 |
| | |
Maximum offering price per share (100/96.50 of $52.01) | | $ 53.90 |
Class B:
Net Asset Value and offering price per share ($11,865,923 ÷ 230,978 shares)A | | $ 51.37 |
| | |
Class C:
Net Asset Value and offering price per share ($87,990,432 ÷ 1,719,005 shares)A | | $ 51.19 |
| | |
Canada:
Net Asset Value, offering price and redemption price per share ($3,778,765,485 ÷ 71,854,822 shares) | | $ 52.59 |
| | |
Institutional Class:
Net Asset Value, offering price and redemption price per share ($68,111,754 ÷ 1,298,734 shares) | | $ 52.44 |
A Redemption price per share is equal to net asset value less any applicable contingent deferred sales charge.
See accompanying notes which are an integral part of the financial statements.
Annual Report
Fidelity Canada Fund
Financial Statements - continued
Statement of Operations
| Year ended October 31, 2011 |
Investment Income | | |
Dividends | | $ 93,229,781 |
Interest | | 2,244 |
Income from Fidelity Central Funds | | 4,035,925 |
Income before foreign taxes withheld | | 97,267,950 |
Less foreign taxes withheld | | (14,111,670) |
Total income | | 83,156,280 |
| | |
Expenses | | |
Management fee
Basic fee | $ 34,360,665 | |
Performance adjustment | (6,900,443) | |
Transfer agent fees | 10,426,659 | |
Distribution and service plan fees | 1,760,960 | |
Accounting and security lending fees | 1,578,714 | |
Custodian fees and expenses | 175,916 | |
Independent trustees' compensation | 26,697 | |
Registration fees | 206,023 | |
Audit | 76,184 | |
Legal | 18,843 | |
Interest | 1,812 | |
Miscellaneous | 46,952 | |
Total expenses before reductions | 41,778,982 | |
Expense reductions | (167,832) | 41,611,150 |
| | |
Net investment income (loss) | | 41,545,130 |
Realized and Unrealized Gain (Loss) Net realized gain (loss) on: | | |
Investment securities: | | |
Unaffiliated issuers | 37,110,984 | |
Other affiliated issuers | 7,343,328 | |
Foreign currency transactions | (1,156,953) | |
Total net realized gain (loss) | | 43,297,359 |
Change in net unrealized appreciation (depreciation) on: Investment securities | (192,052,898) | |
Assets and liabilities in foreign currencies | (69,228) | |
Total change in net unrealized appreciation (depreciation) | | (192,122,126) |
Net gain (loss) | | (148,824,767) |
Net increase (decrease) in net assets resulting from operations | | $ (107,279,637) |
Statement of Changes in Net Assets
| Year ended
October 31,
2011 | Year ended
October 31,
2010 |
Increase (Decrease) in Net Assets | | |
Operations | | |
Net investment income (loss) | $ 41,545,130 | $ 34,662,867 |
Net realized gain (loss) | 43,297,359 | 83,766,517 |
Change in net unrealized appreciation (depreciation) | (192,122,126) | 641,046,346 |
Net increase (decrease) in net assets resulting from operations | (107,279,637) | 759,475,730 |
Distributions to shareholders from net investment income | (35,317,815) | (34,208,293) |
Distributions to shareholders from net realized gain | (35,060,747) | - |
Total distributions | (70,378,562) | (34,208,293) |
Share transactions - net increase (decrease) | 103,024,419 | 243,266,632 |
Redemption fees | 1,146,266 | 759,127 |
Total increase (decrease) in net assets | (73,487,514) | 969,293,196 |
| | |
Net Assets | | |
Beginning of period | 4,269,913,455 | 3,300,620,259 |
End of period (including undistributed net investment income of $25,762,870 and undistributed net investment income of $26,745,120, respectively) | $ 4,196,425,941 | $ 4,269,913,455 |
See accompanying notes which are an integral part of the financial statements.
Annual Report
Financial Highlights - Class A
Years ended October 31, | 2011 | 2010 | 2009 | 2008 | 2007 H |
Selected Per-Share Data | | | | | |
Net asset value, beginning of period | $ 53.81 | $ 44.24 | $ 38.20 | $ 70.16 | $ 54.00 |
Income from Investment Operations | | | | | |
Net investment income (loss) E | .34 | .31 | .38 | .39 | .19 |
Net realized and unrealized gain (loss) | (1.17) | 9.64 | 5.72 | (28.71) | 15.96 |
Total from investment operations | (.83) | 9.95 | 6.10 | (28.32) | 16.15 |
Distributions from net investment income | (.35) | (.39) | (.07) | (.41) | - |
Distributions from net realized gain | (.44) | - | - | (3.27) | - |
Total distributions | (.79) | (.39) | (.07) | (3.68) | - |
Redemption fees added to paid in capital E | .01 | .01 | .01 | .04 | .01 |
Net asset value, end of period | $ 52.20 | $ 53.81 | $ 44.24 | $ 38.20 | $ 70.16 |
Total Return B, C, D | (1.64)% | 22.62% | 16.08% | (42.23)% | 29.93% |
Ratios to Average Net Assets F, I | | | | | |
Expenses before reductions | 1.12% | 1.24% | 1.42% | 1.34% | 1.23% A |
Expenses net of fee waivers, if any | 1.12% | 1.24% | 1.42% | 1.34% | 1.23% A |
Expenses net of all reductions | 1.12% | 1.18% | 1.39% | 1.31% | 1.22% A |
Net investment income (loss) | .59% | .63% | .98% | .69% | .63% A |
Supplemental Data | | | | | |
Net assets, end of period (000 omitted) | $ 215,369 | $ 170,446 | $ 83,015 | $ 56,242 | $ 20,912 |
Portfolio turnover rate G | 104% | 143% | 123% | 63% | 42% |
A Annualized B Total returns for periods of less than one year are not annualized. C Total returns would have been lower if certain expenses had not been reduced during the applicable periods shown. D Total returns do not include the effect of the sales charges. E Calculated based on average shares outstanding during the period. F Fees and expenses of any underlying Fidelity Central Funds are not included in the Fund's expense ratio. The Fund indirectly bears its proportionate share of the expenses of any underlying Fidelity Central Funds. G Amount does not include the portfolio activity of any underlying Fidelity Central Funds. H For the period May 2, 2007 (commencement of sale of shares) to October 31, 2007. I Expense ratios reflect operating expenses of the class. Expenses before reductions do not reflect amounts reimbursed by the investment adviser or reductions from brokerage service arrangements or reductions from other expense offset arrangements and do not represent the amount paid by the class during periods when reimbursements or reductions occur. Expense ratios before reductions for start-up periods may not be representative of longer-term operating periods. Expenses net of fee waivers reflect expenses after reimbursement by the investment adviser but prior to reductions from brokerage service arrangements or other expense offset arrangements. Expenses net of all reductions represent the net expenses paid by the class. |
Financial Highlights - Class T
Years ended October 31, | 2011 | 2010 | 2009 | 2008 | 2007 H |
Selected Per-Share Data | | | | | |
Net asset value, beginning of period | $ 53.64 | $ 44.11 | $ 38.10 | $ 70.09 | $ 54.00 |
Income from Investment Operations | | | | | |
Net investment income (loss) E | .17 | .18 | .27 | .23 | .09 |
Net realized and unrealized gain (loss) | (1.16) | 9.60 | 5.73 | (28.66) | 15.99 |
Total from investment operations | (.99) | 9.78 | 6.00 | (28.43) | 16.08 |
Distributions from net investment income | (.21) | (.26) | - | (.33) | - |
Distributions from net realized gain | (.44) | - | - | (3.27) | - |
Total distributions | (.65) | (.26) | - | (3.60) | - |
Redemption fees added to paid in capital E | .01 | .01 | .01 | .04 | .01 |
Net asset value, end of period | $ 52.01 | $ 53.64 | $ 44.11 | $ 38.10 | $ 70.09 |
Total Return B, C, D | (1.93)% | 22.27% | 15.77% | (42.40)% | 29.80% |
Ratios to Average Net Assets F, I | | | | | |
Expenses before reductions | 1.42% | 1.51% | 1.70% | 1.63% | 1.48% A |
Expenses net of fee waivers, if any | 1.42% | 1.51% | 1.70% | 1.63% | 1.48% A |
Expenses net of all reductions | 1.42% | 1.46% | 1.67% | 1.60% | 1.47% A |
Net investment income (loss) | .30% | .36% | .71% | .40% | .30% A |
Supplemental Data | | | | | |
Net assets, end of period (000 omitted) | $ 34,323 | $ 31,522 | $ 17,727 | $ 14,963 | $ 14,522 |
Portfolio turnover rate G | 104% | 143% | 123% | 63% | 42% |
A Annualized B Total returns for periods of less than one year are not annualized. C Total returns would have been lower if certain expenses had not been reduced during the applicable periods shown. D Total returns do not include the effect of the sales charges. E Calculated based on average shares outstanding during the period. F Fees and expenses of any underlying Fidelity Central Funds are not included in the Fund's expense ratio. The Fund indirectly bears its proportionate share of the expenses of any underlying Fidelity Central Funds. G Amount does not include the portfolio activity of any underlying Fidelity Central Funds. H For the period May 2, 2007 (commencement of sale of shares) to October 31, 2007. I Expense ratios reflect operating expenses of the class. Expenses before reductions do not reflect amounts reimbursed by the investment adviser or reductions from brokerage service arrangements or reductions from other expense offset arrangements and do not represent the amount paid by the class during periods when reimbursements or reductions occur. Expense ratios before reductions for start-up periods may not be representative of longer-term operating periods. Expenses net of fee waivers reflect expenses after reimbursement by the investment adviser but prior to reductions from brokerage service arrangements or other expense offset arrangements. Expenses net of all reductions represent the net expenses paid by the class. |
See accompanying notes which are an integral part of the financial statements.
Annual Report
Financial Highlights - Class B
Years ended October 31, | 2011 | 2010 | 2009 | 2008 | 2007 H |
Selected Per-Share Data | | | | | |
Net asset value, beginning of period | $ 53.03 | $ 43.68 | $ 37.91 | $ 69.88 | $ 54.00 |
Income from Investment Operations | | | | | |
Net investment income (loss) E | (.11) | (.07) | .08 | (.06) | (.06) |
Net realized and unrealized gain (loss) | (1.14) | 9.50 | 5.68 | (28.54) | 15.93 |
Total from investment operations | (1.25) | 9.43 | 5.76 | (28.60) | 15.87 |
Distributions from net investment income | (.01) | (.09) | - | (.14) | - |
Distributions from net realized gain | (.41) | - | - | (3.27) | - |
Total distributions | (.42) | (.09) | - | (3.41) | - |
Redemption fees added to paid in capital E | .01 | .01 | .01 | .04 | .01 |
Net asset value, end of period | $ 51.37 | $ 53.03 | $ 43.68 | $ 37.91 | $ 69.88 |
Total Return B, C, D | (2.41)% | 21.64% | 15.22% | (42.68)% | 29.41% |
Ratios to Average Net Assets F, I | | | | | |
Expenses before reductions | 1.91% | 2.01% | 2.19% | 2.13% | 2.00% A |
Expenses net of fee waivers, if any | 1.91% | 2.01% | 2.19% | 2.13% | 2.00% A |
Expenses net of all reductions | 1.91% | 1.96% | 2.16% | 2.10% | 1.99% A |
Net investment income (loss) | (.20)% | (.14)% | .21% | (.10)% | (.21)% A |
Supplemental Data | | | | | |
Net assets, end of period (000 omitted) | $ 11,866 | $ 13,464 | $ 7,283 | $ 5,615 | $ 4,078 |
Portfolio turnover rate G | 104% | 143% | 123% | 63% | 42% |
A Annualized B Total returns for periods of less than one year are not annualized. C Total returns would have been lower if certain expenses had not been reduced during the applicable periods shown. D Total returns do not include the effect of the contingent deferred sales charge. E Calculated based on average shares outstanding during the period. F Fees and expenses of any underlying Fidelity Central Funds are not included in the Fund's expense ratio. The Fund indirectly bears its proportionate share of the expenses of any underlying Fidelity Central Funds. G Amount does not include the portfolio activity of any underlying Fidelity Central Funds. H For the period May 2, 2007 (commencement of sale of shares) to October 31, 2007. I Expense ratios reflect operating expenses of the class. Expenses before reductions do not reflect amounts reimbursed by the investment adviser or reductions from brokerage service arrangements or reductions from other expense offset arrangements and do not represent the amount paid by the class during periods when reimbursements or reductions occur. Expense ratios before reductions for start-up periods may not be representative of longer-term operating periods. Expenses net of fee waivers reflect expenses after reimbursement by the investment adviser but prior to reductions from brokerage service arrangements or other expense offset arrangements. Expenses net of all reductions represent the net expenses paid by the class. |
Financial Highlights - Class C
Years ended October 31, | 2011 | 2010 | 2009 | 2008 | 2007 H |
Selected Per-Share Data | | | | | |
Net asset value, beginning of period | $ 52.87 | $ 43.60 | $ 37.84 | $ 69.91 | $ 54.00 |
Income from Investment Operations | | | | | |
Net investment income (loss) E | (.08) | (.06) | .09 | (.05) | (.04) |
Net realized and unrealized gain (loss) | (1.14) | 9.48 | 5.66 | (28.52) | 15.94 |
Total from investment operations | (1.22) | 9.42 | 5.75 | (28.57) | 15.90 |
Distributions from net investment income | (.03) | (.16) | - | (.27) | - |
Distributions from net realized gain | (.44) | - | - | (3.27) | - |
Total distributions | (.47) | (.16) | - | (3.54) | - |
Redemption fees added to paid in capital E | .01 | .01 | .01 | .04 | .01 |
Net asset value, end of period | $ 51.19 | $ 52.87 | $ 43.60 | $ 37.84 | $ 69.91 |
Total Return B, C, D | (2.36)% | 21.68% | 15.22% | (42.69)% | 29.46% |
Ratios to Average Net Assets F, I | | | | | |
Expenses before reductions | 1.86% | 1.99% | 2.18% | 2.13% | 1.99% A |
Expenses net of fee waivers, if any | 1.86% | 1.99% | 2.18% | 2.13% | 1.99% A |
Expenses net of all reductions | 1.86% | 1.94% | 2.15% | 2.10% | 1.97% A |
Net investment income (loss) | (.15)% | (.12)% | .22% | (.10)% | (.15)% A |
Supplemental Data | | | | | |
Net assets, end of period (000 omitted) | $ 87,990 | $ 54,052 | $ 24,848 | $ 16,716 | $ 8,752 |
Portfolio turnover rate G | 104% | 143% | 123% | 63% | 42% |
A Annualized B Total returns for periods of less than one year are not annualized. C Total returns would have been lower if certain expenses had not been reduced during the applicable periods shown. D Total returns do not include the effect of the contingent deferred sales charge. E Calculated based on average shares outstanding during the period. F Fees and expenses of any underlying Fidelity Central Funds are not included in the Fund's expense ratio. The Fund indirectly bears its proportionate share of the expenses of any underlying Fidelity Central Funds. G Amount does not include the portfolio activity of any underlying Fidelity Central Funds. H For the period May 2, 2007 (commencement of sale of shares) to October 31, 2007. I Expense ratios reflect operating expenses of the class. Expenses before reductions do not reflect amounts reimbursed by the investment adviser or reductions from brokerage service arrangements or reductions from other expense offset arrangements and do not represent the amount paid by the class during periods when reimbursements or reductions occur. Expense ratios before reductions for start-up periods may not be representative of longer-term operating periods. Expenses net of fee waivers reflect expenses after reimbursement by the investment adviser but prior to reductions from brokerage service arrangements or other expense offset arrangements. Expenses net of all reductions represent the net expenses paid by the class. |
See accompanying notes which are an integral part of the financial statements.
Annual Report
Financial Highlights - Canada
Years ended October 31, | 2011 | 2010 | 2009 | 2008 | 2007 |
Selected Per-Share Data | | | | | |
Net asset value, beginning of period | $ 54.14 | $ 44.46 | $ 38.37 | $ 70.25 | $ 49.48 |
Income from Investment Operations | | | | | |
Net investment income (loss) B | .52 | .46 | .48 | .58 | .52 |
Net realized and unrealized gain (loss) | (1.18) | 9.68 | 5.74 | (28.83) | 21.62 |
Total from investment operations | (.66) | 10.14 | 6.22 | (28.25) | 22.14 |
Distributions from net investment income | (.46) | (.47) | (.14) | (.40) | (.36) |
Distributions from net realized gain | (.44) | - | - | (3.27) | (1.03) |
Total distributions | (.90) | (.47) | (.14) | (3.67) | (1.39) |
Redemption fees added to paid in capital B | .01 | .01 | .01 | .04 | .02 |
Net asset value, end of period | $ 52.59 | $ 54.14 | $ 44.46 | $ 38.37 | $ 70.25 |
Total Return A | (1.33)% | 22.97% | 16.40% | (42.06)% | 46.03% |
Ratios to Average Net Assets C, E | | | | | |
Expenses before reductions | .82% | .94% | 1.17% | 1.03% | .96% |
Expenses net of fee waivers, if any | .82% | .94% | 1.17% | 1.03% | .96% |
Expenses net of all reductions | .82% | .89% | 1.13% | 1.00% | .94% |
Net investment income (loss) | .90% | .93% | 1.24% | 1.00% | .94% |
Supplemental Data | | | | | |
Net assets, end of period (000 omitted) | $ 3,778,765 | $ 3,953,693 | $ 3,149,791 | $ 2,776,298 | $ 4,890,617 |
Portfolio turnover rate D | 104% | 143% | 123% | 63% | 42% |
A Total returns would have been lower if certain expenses had not been reduced during the applicable periods shown. B Calculated based on average shares outstanding during the period. C Fees and expenses of any underlying Fidelity Central Funds are not included in the Fund's expense ratio. The Fund indirectly bears its proportionate share of the expenses of any underlying Fidelity Central Funds. D Amount does not include the portfolio activity of any underlying Fidelity Central Funds. E Expense ratios reflect operating expenses of the class. Expenses before reductions do not reflect amounts reimbursed by the investment adviser or reductions from brokerage service arrangements or reductions from other expense offset arrangements and do not represent the amount paid by the class during periods when reimbursements or reductions occur. Expenses net of fee waivers reflect expenses after reimbursement by the investment adviser but prior to reductions from brokerage service arrangements or other expense offset arrangements. Expenses net of all reductions represent the net expenses paid by the class. |
Financial Highlights - Institutional Class
Years ended October 31, | 2011 | 2010 | 2009 | 2008 | 2007 G |
Selected Per-Share Data | | | | | |
Net asset value, beginning of period | $ 54.02 | $ 44.39 | $ 38.31 | $ 70.25 | $ 54.00 |
Income from Investment Operations | | | | | |
Net investment income (loss) D | .51 | .46 | .49 | .52 | .25 |
Net realized and unrealized gain (loss) | (1.18) | 9.65 | 5.72 | (28.78) | 15.99 |
Total from investment operations | (.67) | 10.11 | 6.21 | (28.26) | 16.24 |
Distributions from net investment income | (.48) | (.49) | (.14) | (.45) | - |
Distributions from net realized gain | (.44) | - | - | (3.27) | - |
Total distributions | (.92) | (.49) | (.14) | (3.72) | - |
Redemption fees added to paid in capital D | .01 | .01 | .01 | .04 | .01 |
Net asset value, end of period | $ 52.44 | $ 54.02 | $ 44.39 | $ 38.31 | $ 70.25 |
Total Return B, C | (1.35)% | 22.94% | 16.40% | (42.11)% | 30.09% |
Ratios to Average Net Assets E, H | | | | | |
Expenses before reductions | .82% | .95% | 1.17% | 1.11% | 1.01% A |
Expenses net of fee waivers, if any | .82% | .95% | 1.17% | 1.11% | 1.01% A |
Expenses net of all reductions | .82% | .90% | 1.14% | 1.08% | .99% A |
Net investment income (loss) | .89% | .92% | 1.23% | .92% | .83% A |
Supplemental Data | | | | | |
Net assets, end of period (000 omitted) | $ 68,112 | $ 46,737 | $ 17,956 | $ 8,870 | $ 4,064 |
Portfolio turnover rate F | 104% | 143% | 123% | 63% | 42% |
A Annualized B Total returns for periods of less than one year are not annualized. C Total returns would have been lower if certain expenses had not been reduced during the applicable periods shown. D Calculated based on average shares outstanding during the period. E Fees and expenses of any underlying Fidelity Central Funds are not included in the Fund's expense ratio. The Fund indirectly bears its proportionate share of the expenses of any underlying Fidelity Central Funds. F Amount does not include the portfolio activity of any underlying Fidelity Central Funds. G For the period May 2, 2007 (commencement of sale of shares) to October 31, 2007. H Expense ratios reflect operating expenses of the class. Expenses before reductions do not reflect amounts reimbursed by the investment adviser or reductions from brokerage service arrangements or reductions from other expense offset arrangements and do not represent the amount paid by the class during periods when reimbursements or reductions occur. Expense ratios before reductions for start-up periods may not be representative of longer-term operating periods. Expenses net of fee waivers reflect expenses after reimbursement by the investment adviser but prior to reductions from brokerage service arrangements or other expense offset arrangements. Expenses net of all reductions represent the net expenses paid by the class. |
See accompanying notes which are an integral part of the financial statements.
Annual Report
Notes to Financial Statements
For the period ended October 31, 2011
1. Organization.
Fidelity Canada Fund (the Fund) is a fund of Fidelity Investment Trust (the Trust) and is authorized to issue an unlimited number of shares. The Trust is registered under the Investment Company Act of 1940, as amended (the 1940 Act), as an open-end management investment company organized as a Massachusetts business trust. The Fund offers Class A, Class T, Class C, Canada, and Institutional Class shares, each of which, along with Class B shares, has equal rights as to assets and voting privileges. Effective after the close of business on September 1, 2010, Class B shares were closed to new accounts and additional purchases, except for exchanges and reinvestments by existing shareholders. Each class has exclusive voting rights with respect to matters that affect that class. Class B shares will automatically convert to Class A shares after a holding period of seven years from the initial date of purchase. Investment income, realized and unrealized capital gains and losses, the common expenses of the Fund, and certain fund-level expense reductions, if any, are allocated on a pro-rata basis to each class based on the relative net assets of each class to the total net assets of the Fund. Each class differs with respect to transfer agent and distribution and service plan fees incurred. Certain expense reductions may also differ by class.
2. Investments in Fidelity Central Funds.
The Fund invests in Fidelity Central Funds, which are open-end investment companies available only to other investment companies and accounts managed by Fidelity Management & Research Company (FMR) and its affiliates. The Fund's Schedule of Investments lists each of the Fidelity Central Funds held as of period end, if any, as an investment of the Fund, but does not include the underlying holdings of each Fidelity Central Fund. As an Investing Fund, the Fund indirectly bears its proportionate share of the expenses of the underlying Fidelity Central Funds.
The Money Market Central Funds seek preservation of capital and current income and are managed by Fidelity Investments Money Management, Inc. (FIMM), an affiliate of FMR.
A complete unaudited list of holdings for each Fidelity Central Fund is available upon request or at the Securities and Exchange Commission (the SEC) web site at www.sec.gov. In addition, the financial statements of the Fidelity Central Funds, which are not covered by the Fund's Report of Independent Registered Public Accounting Firm are available on the SEC web site or upon request.
3. Significant Accounting Policies.
The financial statements have been prepared in conformity with accounting principles generally accepted in the United States of America (GAAP), which require management to make certain estimates and assumptions at the date of the financial statements. Actual results could differ from those estimates. Subsequent events, if any, through the date that the financial statements were issued have been evaluated in the preparation of the financial statements. The following summarizes the significant accounting policies of the Fund:
Security Valuation. Investments are valued as of 4:00 p.m. Eastern time on the last calendar day of the period. The Fund uses independent pricing services approved by the Board of Trustees to value its investments. When current market prices or quotations are not readily available or reliable, valuations may be determined in good faith in accordance with procedures adopted by the Board of Trustees. Factors used in determining value may include market or security specific events. The frequency with which these procedures are used cannot be predicted and they may be utilized to a significant extent. The value used for net asset value (NAV) calculation under these procedures may differ from published prices for the same securities.
The Fund categorizes the inputs to valuation techniques used to value its investments into a disclosure hierarchy consisting of three levels as shown below:
Level 1 - quoted prices in active markets for identical investments
Level 2 - other significant observable inputs (including quoted prices for similar investments, interest rates, prepayment speeds, etc.)
Level 3 - unobservable inputs (including the Fund's own assumptions based on the best information available)
Changes in valuation techniques may result in transfers in or out of an assigned level within the disclosure hierarchy. Valuation techniques used to value the Fund's investments by major category are as follows:
Equity securities, including restricted securities, for which market quotations are readily available, are valued at the last reported sale price or official closing price as reported by an independent pricing service on the primary market or exchange on which they are traded and are categorized as Level 1 in the hierarchy. In the event there were no sales during the day or closing prices are not available, securities are valued at the last quoted bid price or may be valued using the last available price and are generally categorized as Level 2 in the hierarchy. For foreign equity securities, when significant market or security specific events arise, comparisons to the valuation of American Depositary Receipts (ADRs), futures contracts, Exchange-traded funds (ETFs) and certain indexes as well as quoted prices for similar securities are used and are categorized as Level 2 in the hierarchy in these
Annual Report
3. Significant Accounting Policies - continued
Security Valuation - continued
circumstances. Utilizing these techniques may result in transfers between Level 1 and Level 2. For restricted equity securities and private placements where observable inputs are limited, assumptions about market activity and risk are used and are categorized as Level 3 in the hierarchy.
Investments in open-end mutual funds, including the Fidelity Central Funds, are valued at their closing net asset value each business day and are categorized as Level 1 in the hierarchy.
Foreign Currency. The Fund may use foreign currency contracts to facilitate transactions in foreign-denominated securities. Gains and losses from these transactions may arise from changes in the value of the foreign currency or if the counterparties do not perform under the contracts' terms.
Foreign-denominated assets, including investment securities, and liabilities are translated into U.S. dollars at the exchange rate at period end. Purchases and sales of investment securities, income and dividends received and expenses denominated in foreign currencies are translated into U.S. dollars at the exchange rate in effect on the transaction date.
The effects of exchange rate fluctuations on investments are included with the net realized and unrealized gain (loss) on investment securities. Other foreign currency transactions resulting in realized and unrealized gain (loss) are disclosed separately.
Investment Transactions and Income. For financial reporting purposes, the Fund's investment holdings and NAV include trades executed through the end of the last business day of the period. The NAV per share for processing shareholder transactions is calculated as of the close of business of the New York Stock Exchange (NYSE), normally 4:00 p.m. Eastern time and includes trades executed through the end of the prior business day. Gains and losses on securities sold are determined on the basis of identified cost and may include proceeds received from litigation. Dividend income is recorded on the ex-dividend date, except for certain dividends from foreign securities where the ex-dividend date may have passed, which are recorded as soon as the Fund is informed of the ex-dividend date. Non-cash dividends included in dividend income, if any, are recorded at the fair market value of the securities received. Distributions received on securities that represent a return of capital or capital gain are recorded as a reduction of cost of investments and/or as a realized gain. The Fund estimates the components of distributions received that may be considered return of capital distributions or capital gain distributions. Interest income and distributions from the Fidelity Central Funds are accrued as earned. Interest income includes coupon interest and amortization of premium and accretion of discount on debt securities. Investment income is recorded net of foreign taxes withheld where recovery of such taxes is uncertain.
Expenses. Expenses directly attributable to a fund are charged to that fund. Expenses attributable to more than one fund are allocated among the respective funds on the basis of relative net assets or other appropriate methods. Expense estimates are accrued in the period to which they relate and adjustments are made when actual amounts are known.
Income Tax Information and Distributions to Shareholders. Each year, the Fund intends to qualify as a regulated investment company, including distributing substantially all of its taxable income and realized gains under Subchapter M of the Internal Revenue Code and filing its U.S. federal tax return. As a result, no provision for income taxes is required. As of October 31, 2011, the Fund did not have any unrecognized tax benefits in the financial statements. A fund's federal tax return is subject to examination by the Internal Revenue Service (IRS) for a period of three years. Foreign taxes are provided for based on the Fund's understanding of the tax rules and rates that exist in the foreign markets in which it invests.
Distributions are declared and recorded on the ex-dividend date. Income dividends and capital gain distributions are declared separately for each class. Income and capital gain distributions are determined in accordance with income tax regulations, which may differ from GAAP. In addition, the Fund claimed a portion of the payment made to redeeming shareholders as a distribution for income tax purposes.
Capital accounts within the financial statements are adjusted for permanent book-tax differences. These adjustments have no impact on net assets or the results of operations. Temporary book-tax differences will reverse in a subsequent period.
Book-tax differences are primarily due to foreign currency transactions, passive foreign investment companies (PFIC), deferred trustees compensation, capital loss carryforwards and losses deferred due to wash sales.
The federal tax cost of investment securities and unrealized appreciation (depreciation) as of period end were as follows:
Gross unrealized appreciation | $ 717,722,960 |
Gross unrealized depreciation | (119,654,228) |
Net unrealized appreciation (depreciation) on securities and other investments | $ 598,068,732 |
| |
Tax Cost | $ 4,041,939,474 |
Annual Report
Notes to Financial Statements - continued
3. Significant Accounting Policies - continued
Income Tax Information and Distributions to Shareholders - continued
The tax-based components of distributable earnings as of period end were as follows:
Undistributed ordinary income | $ 48,166,855 |
Capital loss carryforward | $ (230,403,828) |
Net unrealized appreciation (depreciation) | $ 598,095,680 |
Under the recently enacted Regulated Investment Company Modernization Act of 2010 (the Act), the Fund will be permitted to carry forward capital losses incurred in taxable years beginning after December 22, 2010 for an unlimited period. However, any losses incurred during those future taxable years will be required to be utilized prior to any losses incurred in pre-enactment taxable years, which generally expire after eight years from when they are incurred. Additionally, post-enactment capital losses that are carried forward will retain their character as either short-term or long-term capital losses rather than being considered all short-term as under previous law. The Fund's first fiscal year end subject to the Act will be October 31, 2012.
The tax character of distributions paid was as follows:
| October 31, 2011 | October 31, 2010 |
Ordinary Income | $ 70,378,562 | $ 34,208,293 |
Short-Term Trading (Redemption) Fees. Shares held by investors in the Fund less than 90 days are subject to a redemption fee equal to 1.50% of the net asset value of shares redeemed. All redemption fees, which reduce the proceeds of the shareholder redemption, are retained by the Fund and accounted for as an addition to paid in capital.
New Accounting Pronouncement. In May 2011, the Financial Accounting Standards Board issued Accounting Standard Update No. 2011-04, Fair Value Measurement (Topic 820) - Amendments to Achieve Common Fair Value Measurement and Disclosure Requirements in U.S. GAAP and IFRSs. The update changes the wording used to describe the requirements in GAAP for measuring fair value and for disclosing information about fair value measurements. The update is effective during interim and annual periods beginning after December 15, 2011. Management is currently evaluating the impact of the update's adoption on the Fund's financial statement disclosures.
4. Operating Policies.
Restricted Securities. The Fund may invest in securities that are subject to legal or contractual restrictions on resale. These securities generally may be resold in transactions exempt from registration or to the public if the securities are registered. Disposal of these securities may involve time-consuming negotiations and expense, and prompt sale at an acceptable price may be difficult. Information regarding restricted securities is included at the end of the Fund's Schedule of Investments.
5. Purchases and Sales of Investments.
Purchases and sales of securities, other than short-term securities, aggregated $5,106,179,444 and $5,000,568,630, respectively.
6. Fees and Other Transactions with Affiliates.
Management Fee. FMR and its affiliates provide the Fund with investment management related services for which the Fund pays a monthly management fee. The management fee is the sum of an individual fund fee rate that is based on an annual rate of .45% of the Fund's average net assets and a group fee rate that averaged .26% during the period. The group fee rate is based upon the average net assets of all the mutual funds advised by FMR. The group fee rate decreases as assets under management increase and increases as assets under management decrease. In addition, the management fee is subject to a performance adjustment(up to a maximum of ± .20% of the Fund's average net assets over a 36 month performance period). The upward or downward adjustment to the management fee is based on the relative investment performance of Canada, as compared to an appropriate benchmark index. For the period, the total annual management fee rate, including the performance adjustment, was .57% of the Fund's average net assets.
Annual Report
6. Fees and Other Transactions with Affiliates - continued
Distribution and Service Plan Fees. In accordance with Rule 12b-1 of the 1940 Act, the Fund has adopted separate Distribution and Service Plans for each class of shares. Certain classes pay Fidelity Distributors Corporation (FDC), an affiliate of FMR, separate Distribution and Service Fees, each of which is based on an annual percentage of each class' average net assets. In addition, FDC may pay financial intermediaries for selling shares of the Fund and providing shareholder support services. For the period, the Distribution and Service Fee rates, total fees and amounts retained by FDC were as follows:
| Distribution
Fee | Service
Fee | Total Fees | Retained
by FDC |
Class A | -% | .25% | $ 566,795 | $ 32,945 |
Class T | .25% | .25% | 185,890 | 210 |
Class B | .75% | .25% | 139,258 | 104,508 |
Class C | .75% | .25% | 869,017 | 422,773 |
| | | $ 1,760,960 | $ 560,436 |
Sales Load. FDC may receive a front-end sales charge of up to 5.75% for selling Class A shares, and 3.50% for selling Class T shares, some of which is paid to financial intermediaries for selling shares of the Fund. Depending on the holding period, FDC may receive contingent deferred sales charges levied on Class A, Class T, Class B, and Class C redemptions. The deferred sales charges range from 5% to 1% for Class B, 1% for Class C, 1.00% for certain purchases of Class A shares and .25% for certain purchases of Class T shares.
For the period, sales charge amounts retained by FDC were as follows:
| Retained
by FDC |
Class A | $ 260,709 |
Class T | 25,148 |
Class B | 38,839 |
Class C | 30,296 |
| $ 354,992 |
* When Class B and Class C shares are initially sold, FDC pays commissions from its own resources to financial intermediaries through which the sales are made.
Transfer Agent Fees. Fidelity Investments Institutional Operations Company, Inc. (FIIOC), an affiliate of FMR, is the transfer, dividend disbursing and shareholder servicing agent for each class of the Fund. FIIOC receives account fees and asset-based fees that vary according to the account size and type of account of the shareholders of the respective classes of the Fund. FIIOC pays for typesetting, printing and mailing of shareholder reports, except proxy statements. For the period, transfer agent fees for each class were as follows:
| Amount | % of
Average
Net Assets |
Class A | $ 593,736 | .26 |
Class T | 114,586 | .31 |
Class B | 42,095 | .30 |
Class C | 221,883 | .26 |
Canada | 9,286,013 | .21 |
Institutional Class | 168,346 | .21 |
| $ 10,426,659 | |
Accounting and Security Lending Fees. Fidelity Service Company, Inc. (FSC), an affiliate of FMR, maintains the Fund's accounting records. The accounting fee is based on the level of average net assets for the month. Under a separate contract, FSC administers the security lending program. The security lending fee is based on the number and duration of lending transactions.
Brokerage Commissions. The Fund placed a portion of its portfolio transactions with brokerage firms which are affiliates of the investment adviser. The commissions paid to these affiliated firms were $10,658 for the period.
Interfund Lending Program. Pursuant to an Exemptive Order issued by the SEC, the Fund, along with other registered investment companies having management contracts with FMR, may participate in an interfund lending program. This program provides an alternative credit facility allowing the
Annual Report
Notes to Financial Statements - continued
6. Fees and Other Transactions with Affiliates - continued
Interfund Lending Program - continued
funds to borrow from, or lend money to, other participating affiliated funds. At period end, there were no interfund loans outstanding. The Fund's activity in this program during the period for which loans were outstanding was as follows:
Borrower or Lender | Average Daily
Loan Balance | Weighted Average Interest Rate | Interest
Expense |
Borrower | $ 10,827,176 | .35% | $ 1,812 |
7. Committed Line of Credit.
The Fund participates with other funds managed by FMR or an affiliate in a $4.0 billion credit facility (the "line of credit") to be utilized for temporary or emergency purposes to fund shareholder redemptions or for other short-term liquidity purposes. The Fund has agreed to pay commitment fees on its pro-rata portion of the line of credit, which amounted to $14,864 and is reflected in Miscellaneous expenses on the Statement of Operations. During the period, there were no borrowings on this line of credit.
8. Security Lending.
The Fund lends portfolio securities through a lending agent from time to time in order to earn additional income. For equity securities, a lending agent is used and may loan securities to certain qualified borrowers, including Fidelity Capital Markets (FCM), a broker-dealer affiliated with the Fund. On the settlement date of the loan, the Fund receives collateral (in the form of U.S. Treasury obligations, letters of credit and/or cash) against the loaned securities and maintains collateral in an amount not less than 100% of the market value of the loaned securities during the period of the loan. The market value of the loaned securities is determined at the close of business of the Fund and any additional required collateral is delivered to the Fund on the next business day. If the borrower defaults on its obligation to return the securities loaned because of insolvency or other reasons, a fund could experience delays and costs in recovering the securities loaned or in gaining access to the collateral. Any cash collateral received is invested in the Fidelity Securities Lending Cash Central Fund. The value of loaned securities and cash collateral at period end are disclosed on the Fund's Statement of Assets and Liabilities. Security lending income represents the income earned on investing cash collateral, less rebates paid to borrowers and any lending agent fees associated with the loan, plus any premium payments received for lending certain types of securities. Security lending income is presented in the Statement of Operations as a component of income from Fidelity Central Funds. Total security lending income during the period amounted to $3,940,584. During the period, there were no securities loaned to FCM.
9. Expense Reductions.
Many of the brokers with whom FMR places trades on behalf of the Fund provided services to the Fund in addition to trade execution. These services included payments of certain expenses on behalf of the Fund totaling $167,832 for the period.
10. Distributions to Shareholders.
Distributions to shareholders of each class were as follows:
Years ended October 31, | 2011 | 2010 |
From net investment income | | |
Class A | $ 1,141,830 | $ 756,039 |
Class T | 123,341 | 106,904 |
Class B | 2,503 | 15,600 |
Class C | 36,231 | 97,752 |
Canada | 33,570,065 | 33,027,962 |
Institutional Class | 443,845 | 204,036 |
Total | $ 35,317,815 | $ 34,208,293 |
From net realized gain | | |
Class A | $ 1,445,324 | $ - |
Class T | 261,152 | - |
Class B | 101,491 | - |
Class C | 470,108 | - |
Canada | 32,375,322 | - |
Institutional Class | 407,350 | - |
Total | $ 35,060,747 | $ - |
Annual Report
11. Share Transactions.
Transactions for each class of shares were as follows:
| Shares | Dollars |
Years ended October 31, | 2011 | 2010 | 2011 | 2010 |
Class A | | | | |
Shares sold | 2,386,291 | 2,050,255 | $ 138,991,055 | $ 102,518,373 |
Reinvestment of distributions | 39,424 | 14,622 | 2,233,433 | 696,013 |
Shares redeemed | (1,467,607) | (773,357) | (82,665,471) | (38,292,678) |
Net increase (decrease) | 958,108 | 1,291,520 | $ 58,559,017 | $ 64,921,708 |
Class T | | | | |
Shares sold | 254,873 | 296,633 | $ 14,715,904 | $ 14,818,898 |
Reinvestment of distributions | 6,640 | 2,182 | 375,773 | 103,790 |
Shares redeemed | (189,243) | (113,003) | (10,669,184) | (5,600,141) |
Net increase (decrease) | 72,270 | 185,812 | $ 4,422,493 | $ 9,322,547 |
Class B | | | | |
Shares sold | 29,930 | 134,473 | $ 1,729,701 | $ 6,579,801 |
Reinvestment of distributions | 1,508 | 263 | 84,713 | 12,424 |
Shares redeemed | (54,348) | (47,606) | (3,060,843) | (2,342,627) |
Net increase (decrease) | (22,910) | 87,130 | $ (1,246,429) | $ 4,249,598 |
Class C | | | | |
Shares sold | 1,081,104 | 647,123 | $ 62,770,855 | $ 31,812,568 |
Reinvestment of distributions | 7,014 | 1,580 | 392,322 | 74,410 |
Shares redeemed | (391,485) | (196,235) | (21,249,300) | (9,599,233) |
Net increase (decrease) | 696,633 | 452,468 | $ 41,913,877 | $ 22,287,745 |
Canada | | | | |
Shares sold | 20,804,881 | 20,151,337 | $ 1,223,871,558 | $ 1,010,632,290 |
Reinvestment of distributions | 1,069,329 | 659,119 | 60,856,944 | 31,486,105 |
Shares redeemed | (23,043,159) | (18,629,713) | (1,313,818,426) | (923,131,901) |
Net increase (decrease) | (1,168,949) | 2,180,743 | $ (29,089,924) | $ 118,986,494 |
Institutional Class | | | | |
Shares sold | 1,331,261 | 717,543 | $ 79,262,853 | $ 36,118,321 |
Reinvestment of distributions | 10,934 | 2,830 | 620,606 | 134,893 |
Shares redeemed | (908,649) | (259,715) | (51,418,074) | (12,754,674) |
Net increase (decrease) | 433,546 | 460,658 | $ 28,465,385 | $ 23,498,540 |
12. Other.
The Fund's organizational documents provide former and current trustees and officers with a limited indemnification against liabilities arising in connection with the performance of their duties to the Fund. In the normal course of business, the Fund may also enter into contracts that provide general indemnifications. The Fund's maximum exposure under these arrangements is unknown as this would be dependent on future claims that may be made against the Fund. The risk of material loss from such claims is considered remote.
Annual Report
Fidelity China Region Fund
Performance: The Bottom Line
Average annual total return reflects the change in the value of an investment, assuming reinvestment of the class' distributions from dividend income and capital gains (the profits earned upon the sale of securities that have grown in value, if any) and assuming a constant rate of performance each year. The $10,000 table and the fund's returns do not reflect the deduction of taxes that a shareholder would pay on fund distributions or the redemption of fund shares. During periods of reimbursement by Fidelity, a fund's total return will be greater than it would be had the reimbursement not occurred. How a fund did yesterday is no guarantee of how it will do tomorrow.
Average Annual Total Returns
Periods ended October 31, 2011 | Past 1
year | Past 5
years | Past 10
years |
Fidelity China Region Fund | -12.52% | 7.77% | 12.27% |
$10,000 Over 10 Years
Let's say hypothetically that $10,000 was invested in Fidelity China Region Fund, a class of the fund, on October 31, 2001. The chart shows how the value of your investment would have changed, and also shows how the MSCI® Golden Dragon Index performed over the same period.
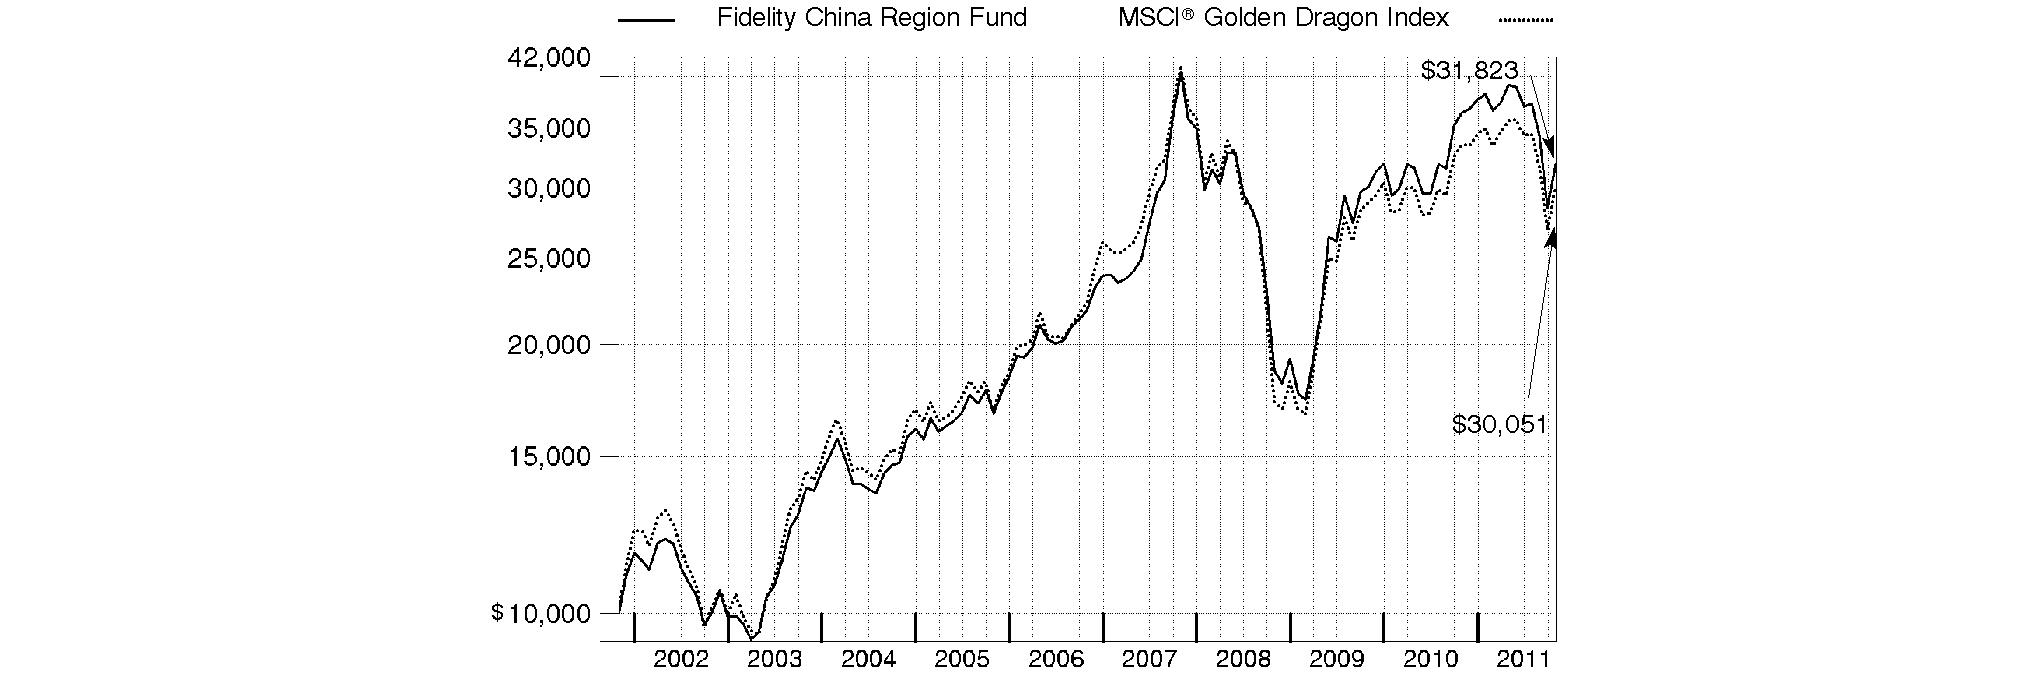
Annual Report
Fidelity China Region Fund
Market Recap: Emerging-markets stocks concluded the 12-month period ending October 31, 2011, on a strong note, reversing direction in October amid hope for a resolution to the sovereign debt crisis in Europe. The brief rally, on top of a robust first half of the period, could only partially offset the negative impact of a five-month downturn that began in May and intensified in August and September, as investors began to flee riskier securities due to the debt debacle, concern the U.S. economy may contract and worry about a significant slowdown in China. For the year, the MSCI® Emerging Markets Index declined 7.44%, hampered in part by global currency fluctuation. The index gained roughly 13% in October, after falling 9% in August and about 15% in September. For the full year, returns across the individual country components of the emerging-markets index were decidedly negative. Several of the largest countries in the index struggled, especially India (-20%), China (-17%) and Brazil (-12%), as did Turkey (-34%). Conversely, South Korea had the strongest result, gaining about 7%, while another sizable index component, Russia, returned roughly 1%. Smaller constituents Indonesia (+5%) and Malaysia (+4%) also finished in positive territory. A trio of countries had negative returns but outpaced the index: Mexico (-1%), Taiwan (-2%) and South Africa (-3%).
Comments from Joseph Tse, Portfolio Manager of Fidelity® China Region Fund for most of the period covered by this report: For the year, the fund's Retail Class shares returned -12.52%, versus -10.33% for the MSCI® Golden Dragon Index. Stock selection and unrewarding industry weightings in financials hurt relative performance the most, followed by weak positioning in consumer staples and an underweighting in utilities. Geographically, stock picking in Hong Kong significantly curbed our results. Hong Kong Exchanges & Clearing, the fund's biggest relative detractor and one of its largest positions during the period, was hampered by the China region's weak markets and low trading volume. Bank of China (Hong Kong) and China Merchants Bank were two lagging bank holdings that hurt. Underweighting and eventually selling power utility CLP Holdings, a strong-performing Hong Kong-based benchmark component, detracted, as did scant exposure to Taiwanese integrated telecommunication services provider Chunghwa Telecom. Conversely, stock selection in technology added value, as did positioning in consumer discretionary and industrials. The fund's modest cash position also provided a lift. Geographically, security selection in China bolstered performance. Overweighting Taiwan-based handset maker HTC - the fund's top contributor - was timely. The stock bucked the downward market trend, riding the popularity of high-end smartphones designed to run Google's popular AndroidTM operating system. Hong Kong-based casino operator SJM Holdings and China Unicom (Hong Kong), an integrated telecom services provider, also contributed.
Notes to shareholders: Fidelity China Region Fund may invest up to 35% of its total assets in any industry that represents more than 20% of the Hong Kong, Taiwanese and Chinese market. As of October 31, 2011, the fund did not have more than 25% of its total assets invested in any one industry.
Robert Bao became Portfolio Manager of the fund on October 1, 2011.
The views expressed above reflect those of the portfolio manager(s) only through the end of the period as stated on the cover of this report and do not necessarily represent the views of Fidelity or any other person in the Fidelity organization. Any such views are subject to change at any time based upon market or other conditions and Fidelity disclaims any responsibility to update such views. These views may not be relied on as investment advice and, because investment decisions for a Fidelity fund are based on numerous factors, may not be relied on as an indication of trading intent on behalf of any Fidelity fund.
Annual Report
Fidelity China Region Fund
As a shareholder of the Fund, you incur two types of costs: (1) transaction costs, including sales charges (loads) on purchase payments or redemption proceeds, redemption fees, and (2) ongoing costs, including management fees, distribution and/or service (12b-1) fees and other Fund expenses. This Example is intended to help you understand your ongoing costs (in dollars) of investing in the Fund and to compare these costs with the ongoing costs of investing in other mutual funds.
The Example is based on an investment of $1,000 invested at the beginning of the period and held for the entire period (May 1, 2011 to October 31, 2011).
Actual Expenses
The first line of the accompanying table for each class of the Fund provides information about actual account values and actual expenses. You may use the information in this line, together with the amount you invested, to estimate the expenses that you paid over the period. Simply divide your account value by $1,000.00 (for example, an $8,600 account value divided by $1,000.00 = 8.6), then multiply the result by the number in the first line for a class of the Fund under the heading entitled "Expenses Paid During Period" to estimate the expenses you paid on your account during this period. A small balance maintenance fee of $12.00 that is charged once a year may apply for certain accounts with a value of less than $2,000. This fee is not included in the table below. If it was, the estimate of expenses you paid during the period would be higher, and your ending account value lower, by this amount. In addition, the Fund, as a shareholder in the underlying Fidelity Central Funds, will indirectly bear its pro-rata share of the fees and expenses incurred by the underlying Fidelity Central Funds. These fees and expenses are not included in the Fund's annualized expense ratio used to calculate the expense estimate in the table below.
Hypothetical Example for Comparison Purposes
The second line of the accompanying table for each class of the Fund provides information about hypothetical account values and hypothetical expenses based on a Class' actual expense ratio and an assumed rate of return of 5% per year before expenses, which is not the Class' actual return. The hypothetical account values and expenses may not be used to estimate the actual ending account balance or expenses you paid for the period. You may use this information to compare the ongoing costs of investing in the Fund and other funds. To do so, compare this 5% hypothetical example with the 5% hypothetical examples that appear in the shareholder reports of the other funds. A small balance maintenance fee of $12.00 that is charged once a year may apply for certain accounts with a value of less than $2,000. This fee is not included in the table below. If it was, the estimate of expenses you paid during the period would be higher, and your ending account value lower, by this amount. In addition, the Fund, as a shareholder in the underlying Fidelity Central Funds, will indirectly bear its pro-rata share of the fees and expenses incurred by the underlying Fidelity Central Funds. These fees and expenses are not included in the Fund's annualized expense ratio used to calculate the expense estimate in the table below.
Please note that the expenses shown in the table are meant to highlight your ongoing costs only and do not reflect any transaction costs. Therefore, the second line of the table is useful in comparing ongoing costs only, and will not help you determine the relative total costs of owning different funds. In addition, if these transactional costs were included, your costs would have been higher.
| Annualized
Expense Ratio | Beginning
Account Value
May 1, 2011 | Ending
Account Value
October 31, 2011 | Expenses Paid
During Period*
May 1, 2011 to
October 31, 2011 |
Class A | 1.36% | | | |
Actual | | $ 1,000.00 | $ 813.10 | $ 6.22 |
HypotheticalA | | $ 1,000.00 | $ 1,018.35 | $ 6.92 |
Class T | 1.63% | | | |
Actual | | $ 1,000.00 | $ 812.00 | $ 7.44 |
HypotheticalA | | $ 1,000.00 | $ 1,016.99 | $ 8.29 |
Class B | 2.11% | | | |
Actual | | $ 1,000.00 | $ 810.00 | $ 9.63 |
HypotheticalA | | $ 1,000.00 | $ 1,014.57 | $ 10.71 |
Class C | 2.11% | | | |
Actual | | $ 1,000.00 | $ 810.00 | $ 9.63 |
HypotheticalA | | $ 1,000.00 | $ 1,014.57 | $ 10.71 |
China Region | 1.04% | | | |
Actual | | $ 1,000.00 | $ 814.30 | $ 4.76 |
HypotheticalA | | $ 1,000.00 | $ 1,019.96 | $ 5.30 |
Institutional Class | 1.05% | | | |
Actual | | $ 1,000.00 | $ 814.10 | $ 4.80 |
HypotheticalA | | $ 1,000.00 | $ 1,019.91 | $ 5.35 |
A 5% return per year before expenses
* Expenses are equal to each Class' annualized expense ratio, multiplied by the average account value over the period, multiplied by 184/365 (to reflect the one-half year period).
Annual Report
Fidelity China Region Fund
Investment Changes (Unaudited)
Geographic Diversification (% of fund's net assets) |
As of October 31, 2011 |
| Hong Kong | 32.9% | |
 | China | 28.9% | |
 | Taiwan | 19.6% | |
| Cayman Islands | 10.1% | |
 | Bermuda | 2.6% | |
 | United States of America | 1.1% | |
 | Australia | 1.0% | |
| Japan | 0.9% | |
 | Korea (South) | 0.7% | |
| Other | 2.2% | |

Percentages are adjusted for the effect of futures contracts, if applicable. |
As of April 30, 2011 |
| Hong Kong | 32.7% | |
| China | 24.3% | |
| Taiwan | 23.1% | |
| Cayman Islands | 8.3% | |
| Bermuda | 5.5% | |
| United States of America | 1.9% | |
| United Kingdom | 1.6% | |
| Japan | 1.3% | |
| Australia | 1.1% | |
| Other | 0.2% | |

Percentages are adjusted for the effect of futures contracts, if applicable. |
Asset Allocation |
| % of fund's
net assets | % of fund's net assets
6 months ago |
Stocks | 98.9 | 98.4 |
Short-Term Investments and Net Other Assets | 1.1 | 1.6 |
Top Ten Stocks as of October 31, 2011 |
| % of fund's
net assets | % of fund's net assets
6 months ago |
Industrial & Commercial Bank of China Ltd. (H Shares) (Commercial Banks) | 6.0 | 3.6 |
Taiwan Semiconductor Manufacturing Co. Ltd. (Semiconductors & Semiconductor Equipment) | 5.5 | 3.5 |
China Construction Bank Corp. (H Shares) (Commercial Banks) | 3.5 | 3.1 |
Hutchison Whampoa Ltd. (Industrial Conglomerates) | 3.4 | 2.0 |
PetroChina Co. Ltd. (H Shares) (Oil, Gas & Consumable Fuels) | 2.9 | 1.6 |
China Mobile (Hong Kong) Ltd. (Wireless Telecommunication Services) | 2.9 | 1.3 |
AIA Group Ltd. (Insurance) | 2.6 | 0.0 |
BOC Hong Kong (Holdings) Ltd. (Commercial Banks) | 2.5 | 3.0 |
Cheung Kong Holdings Ltd. (Real Estate Management & Development) | 2.2 | 2.1 |
Hang Seng Bank Ltd. (Commercial Banks) | 2.1 | 1.8 |
| 33.6 | |
Market Sectors as of October 31, 2011 |
| % of fund's
net assets | % of fund's net assets
6 months ago |
Financials | 36.0 | 39.7 |
Information Technology | 15.7 | 16.8 |
Materials | 9.8 | 8.0 |
Consumer Discretionary | 9.3 | 10.0 |
Energy | 8.8 | 8.0 |
Telecommunication Services | 7.0 | 5.4 |
Industrials | 6.7 | 7.6 |
Consumer Staples | 4.5 | 2.3 |
Utilities | 0.8 | 0.6 |
Health Care | 0.3 | 0.0 |
Annual Report
Fidelity China Region Fund
Investments October 31, 2011
Showing Percentage of Net Assets
Common Stocks - 98.9% |
| Shares | | Value |
CONSUMER DISCRETIONARY - 9.3% |
Automobiles - 0.3% |
Kia Motors Corp. | 70,970 | | $ 4,533,047 |
Qingling Motors Co. Ltd. (H Shares) | 2,158,000 | | 593,524 |
| | 5,126,571 |
Distributors - 0.4% |
Silver Base Group Holdings Ltd. | 5,369,000 | | 5,717,928 |
Diversified Consumer Services - 0.5% |
New Oriental Education & Technology Group, Inc. sponsored ADR (a) | 265,164 | | 7,859,461 |
Hotels, Restaurants & Leisure - 1.1% |
Sands China Ltd. (a) | 4,103,600 | | 12,332,089 |
SJM Holdings Ltd. | 2,601,000 | | 4,458,256 |
| | 16,790,345 |
Media - 0.7% |
Television Broadcasts Ltd. | 1,977,000 | | 11,392,275 |
Multiline Retail - 2.5% |
Far East Department Stores Co. Ltd. | 7,497,311 | | 11,462,779 |
Golden Eagle Retail Group Ltd. (H Shares) | 4,124,000 | | 10,364,374 |
Lifestyle International Holdings Ltd. | 6,221,500 | | 16,655,201 |
| | 38,482,354 |
Specialty Retail - 3.2% |
Belle International Holdings Ltd. | 13,240,000 | | 25,966,643 |
China ZhengTong Auto Services Holdings Ltd. | 5,181,000 | | 5,610,053 |
Chow Sang Sang Holdings International Ltd. | 1,016,000 | | 3,133,570 |
Emperor Watch & Jewellery Ltd. | 49,570,000 | | 8,069,752 |
Luk Fook Holdings International Ltd. | 1,332,000 | | 5,710,818 |
| | 48,490,836 |
Textiles, Apparel & Luxury Goods - 0.6% |
International Taifeng Holdings Ltd. | 1,906,000 | | 890,781 |
Prada SpA | 1,777,600 | | 8,787,483 |
| | 9,678,264 |
TOTAL CONSUMER DISCRETIONARY | | 143,538,034 |
CONSUMER STAPLES - 4.5% |
Beverages - 1.6% |
Tsingtao Brewery Co. Ltd. (H Shares) | 1,270,000 | | 6,458,132 |
Wuliangye Yibin Co. Ltd. (BNP Paribas Warrant Program) warrants 5/5/15 (a) | 1,351,900 | | 7,718,970 |
Yantai Changyu Pioneer Wine Co. (B Shares) | 922,108 | | 10,374,625 |
| | 24,551,727 |
Food & Staples Retailing - 2.1% |
China Resources Enterprise Ltd. | 4,050,000 | | 14,790,795 |
Dairy Farm International Holdings Ltd. | 1,778,200 | | 14,408,234 |
President Chain Store Corp. | 601,000 | | 3,342,003 |
| | 32,541,032 |
|
| Shares | | Value |
Food Products - 0.8% |
China Mengniu Dairy Co. Ltd. | 1,368,000 | | $ 4,359,125 |
Uni-President China Holdings Ltd. | 12,383,000 | | 7,359,931 |
| | 11,719,056 |
TOTAL CONSUMER STAPLES | | 68,811,815 |
ENERGY - 8.8% |
Energy Equipment & Services - 0.4% |
China Oilfield Services Ltd. (H Shares) | 3,520,000 | | 5,863,167 |
Oil, Gas & Consumable Fuels - 8.4% |
China Petroleum & Chemical Corp. (H Shares) | 26,838,000 | | 25,381,510 |
China Shenhua Energy Co. Ltd. (H Shares) | 3,600,500 | | 16,471,539 |
CNOOC Ltd. | 13,661,000 | | 25,824,205 |
CNPC (Hong Kong) Ltd. | 13,232,000 | | 18,535,159 |
PetroChina Co. Ltd. (H Shares) | 34,272,000 | | 44,491,660 |
| | 130,704,073 |
TOTAL ENERGY | | 136,567,240 |
FINANCIALS - 36.0% |
Capital Markets - 0.6% |
Wuliangye Yibin Co. Ltd. (UBS Warrant Programme) warrants 4/22/13 (a) | 345,100 | | 1,970,424 |
Yuanta Financial Holding Co. Ltd. | 13,890,525 | | 7,918,254 |
| | 9,888,678 |
Commercial Banks - 18.9% |
Agricultural Bank China Ltd. (H Shares) | 43,876,000 | | 19,692,247 |
BOC Hong Kong (Holdings) Ltd. | 16,572,000 | | 39,407,649 |
China Construction Bank Corp. (H Shares) | 73,095,000 | | 53,705,474 |
Chinatrust Financial Holding Co. Ltd. | 34,785,446 | | 22,798,274 |
Hang Seng Bank Ltd. | 2,488,800 | | 32,091,693 |
Industrial & Commercial Bank of China Ltd. (H Shares) | 147,535,000 | | 92,130,181 |
Mega Financial Holding Co. Ltd. | 20,451,340 | | 15,720,889 |
Standard Chartered PLC (United Kingdom) | 362,520 | | 8,506,038 |
Wing Hang Bank Ltd. | 904,500 | | 8,168,379 |
| | 292,220,824 |
Diversified Financial Services - 1.1% |
Hong Kong Exchanges and Clearing Ltd. | 1,008,200 | | 17,090,902 |
Insurance - 7.0% |
AIA Group Ltd. | 12,948,000 | | 39,591,604 |
Cathay Financial Holding Co. Ltd. | 8,847,248 | | 10,550,709 |
China Life Insurance Co. Ltd. (H Shares) | 10,723,000 | | 27,723,214 |
Ping An Insurance Group Co. China Ltd. (H Shares) | 4,035,000 | | 29,925,173 |
| | 107,790,700 |
Real Estate Management & Development - 8.4% |
Cheung Kong Holdings Ltd. | 2,726,000 | | 33,791,308 |
Common Stocks - continued |
| Shares | | Value |
FINANCIALS - continued |
Real Estate Management & Development - continued |
China Overseas Land & Investment Ltd. | 9,146,000 | | $ 16,923,669 |
Kerry Properties Ltd. | 2,323,500 | | 8,527,084 |
Sun Hung Kai Properties Ltd. | 2,215,000 | | 30,497,845 |
Swire Pacific Ltd. (A Shares) | 1,300,000 | | 15,022,234 |
Wharf Holdings Ltd. | 4,624,000 | | 24,596,195 |
| | 129,358,335 |
TOTAL FINANCIALS | | 556,349,439 |
HEALTH CARE - 0.3% |
Pharmaceuticals - 0.3% |
China Medical System Holding Ltd. | 6,564,000 | | 4,819,634 |
INDUSTRIALS - 6.7% |
Airlines - 0.1% |
China Southern Airlines Ltd. (H Shares) (a) | 4,400,000 | | 2,455,465 |
Construction & Engineering - 0.9% |
China Communications Construction Co. Ltd. (H Shares) | 4,803,000 | | 3,622,694 |
China State Construction International Holdings Ltd. | 13,696,000 | | 10,548,476 |
| | 14,171,170 |
Industrial Conglomerates - 3.9% |
Hutchison Whampoa Ltd. | 5,748,000 | | 52,573,759 |
Shun Tak Holdings Ltd. | 15,278,000 | | 7,097,500 |
| | 59,671,259 |
Machinery - 0.8% |
Airtac International Group | 452,000 | | 2,529,876 |
China International Marine Containers (Group) Ltd. (B Shares) | 3,903,787 | | 4,699,480 |
China Yuchai International Ltd. | 126,300 | | 1,919,760 |
Sany Heavy Equipment International Holdings Co. Ltd. | 1,975,000 | | 1,739,972 |
Shanghai Zhenhua Port Machinery Co. Ltd. (B Shares) (a) | 1,664,991 | | 861,259 |
| | 11,750,347 |
Road & Rail - 0.5% |
MTR Corp. Ltd. | 2,265,000 | | 7,311,372 |
Transportation Infrastructure - 0.5% |
Jiangsu Expressway Co. Ltd. (H Shares) | 9,140,000 | | 7,877,871 |
TOTAL INDUSTRIALS | | 103,237,484 |
INFORMATION TECHNOLOGY - 15.7% |
Communications Equipment - 1.7% |
AAC Acoustic Technology Holdings, Inc. | 3,480,000 | | 7,965,765 |
HTC Corp. | 469,750 | | 10,556,952 |
ZTE Corp. (H Shares) | 2,745,200 | | 7,792,522 |
| | 26,315,239 |
|
| Shares | | Value |
Computers & Peripherals - 0.7% |
Lenovo Group Ltd. | 11,080,000 | | $ 7,449,133 |
Quanta Computer, Inc. | 1,391,000 | | 2,737,265 |
| | 10,186,398 |
Electronic Equipment & Components - 3.0% |
Chroma ATE, Inc. | 1,938,000 | | 3,866,724 |
Delta Electronics, Inc. | 1,475,000 | | 3,468,088 |
Foxconn International Holdings Ltd. (a) | 5,582,000 | | 3,738,843 |
Hon Hai Precision Industry Co. Ltd. (Foxconn) | 9,030,589 | | 24,756,253 |
Largan Precision Co. Ltd. | 156,000 | | 3,487,580 |
Unimicron Technology Corp. | 5,139,000 | | 6,672,696 |
| | 45,990,184 |
Internet Software & Services - 3.6% |
Baidu.com, Inc. sponsored ADR (a) | 143,900 | | 20,171,902 |
Qihoo 360 Technology Co. Ltd. ADR (d) | 250,400 | | 5,060,584 |
Tencent Holdings Ltd. | 1,317,900 | | 30,479,837 |
| | 55,712,323 |
Semiconductors & Semiconductor Equipment - 6.7% |
ASM Pacific Technology Ltd. | 283,900 | | 3,117,474 |
Hynix Semiconductor, Inc. | 286,800 | | 5,782,401 |
MediaTek, Inc. | 372,000 | | 3,903,867 |
Spreadtrum Communications, Inc. ADR (d) | 242,900 | | 6,453,853 |
Taiwan Semiconductor Manufacturing Co. Ltd. | 34,656,796 | | 84,454,335 |
| | 103,711,930 |
TOTAL INFORMATION TECHNOLOGY | | 241,916,074 |
MATERIALS - 9.8% |
Chemicals - 5.4% |
Formosa Chemicals & Fibre Corp. | 5,245,000 | | 15,179,377 |
Formosa Plastics Corp. | 10,557,250 | | 31,049,842 |
Incitec Pivot Ltd. | 1,375,004 | | 4,980,927 |
Nan Ya Plastics Corp. | 6,290,000 | | 14,150,148 |
Petronas Chemicals Group Bhd | 2,305,100 | | 4,808,734 |
PTT Global Chemical PCL (For. Reg.) (a) | 2,728,458 | | 5,753,520 |
Taiwan Fertilizer Co. Ltd. | 3,015,000 | | 7,770,996 |
| | 83,693,544 |
Construction Materials - 2.0% |
Anhui Conch Cement Co. Ltd. (H Shares) | 5,724,000 | | 20,813,948 |
China Resources Cement Holdings Ltd. | 4,942,000 | | 3,921,522 |
Taiwan Cement Corp. | 4,629,000 | | 5,781,070 |
| | 30,516,540 |
Metals & Mining - 2.4% |
Angang Steel Co. Ltd. (H Shares) | 14,518,000 | | 8,857,733 |
Kingsgate Consolidated NL | 1,376,993 | | 10,857,319 |
Maanshan Iron & Steel Ltd. (H Shares) | 13,770,000 | | 4,099,723 |
Common Stocks - continued |
| Shares | | Value |
MATERIALS - continued |
Metals & Mining - continued |
United Co. RUSAL Ltd. (a) | 6,434,000 | | $ 5,866,364 |
Zhaojin Mining Industry Co. Ltd. (H Shares) | 4,104,500 | | 7,328,110 |
| | 37,009,249 |
TOTAL MATERIALS | | 151,219,333 |
TELECOMMUNICATION SERVICES - 7.0% |
Diversified Telecommunication Services - 3.2% |
China Telecom Corp. Ltd. (H Shares) | 12,082,000 | | 7,459,515 |
China Unicom (Hong Kong) Ltd. | 14,148,000 | | 28,446,195 |
Chunghwa Telecom Co. Ltd. | 4,050,000 | | 13,549,803 |
| | 49,455,513 |
Wireless Telecommunication Services - 3.8% |
China Mobile (Hong Kong) Ltd. | 4,658,500 | | 44,275,976 |
SOFTBANK CORP. | 440,400 | | 14,295,291 |
| | 58,571,267 |
TOTAL TELECOMMUNICATION SERVICES | | 108,026,780 |
UTILITIES - 0.8% |
Electric Utilities - 0.6% |
Power Assets Holdings Ltd. | 1,173,500 | | 8,917,203 |
Independent Power Producers & Energy Traders - 0.2% |
China Resources Power Holdings Co. Ltd. | 2,084,000 | | 3,701,297 |
TOTAL UTILITIES | | 12,618,500 |
TOTAL COMMON STOCKS (Cost $1,352,590,394) | 1,527,104,333 |
Money Market Funds - 1.5% |
| Shares | | Value |
Fidelity Cash Central Fund, 0.12% (b) | 15,856,352 | | $ 15,856,352 |
Fidelity Securities Lending Cash Central Fund, 0.11% (b)(c) | 7,655,750 | | 7,655,750 |
TOTAL MONEY MARKET FUNDS (Cost $23,512,102) | 23,512,102 |
TOTAL INVESTMENT PORTFOLIO - 100.4% (Cost $1,376,102,496) | | 1,550,616,435 |
NET OTHER ASSETS (LIABILITIES) - (0.4)% | | (6,378,964) |
NET ASSETS - 100% | $ 1,544,237,471 |
Legend |
(a) Non-income producing |
(b) Affiliated fund that is available only to investment companies and other accounts managed by Fidelity Investments. The rate quoted is the annualized seven-day yield of the fund at period end. A complete unaudited listing of the fund's holdings as of its most recent quarter end is available upon request. In addition, each Fidelity Central Fund's financial statements, which are not covered by the Fund's Report of Independent Registered Public Accounting Firm, are available on the SEC's website or upon request. |
(c) Investment made with cash collateral received from securities on loan. |
(d) Security or a portion of the security is on loan at period end. |
Affiliated Central Funds |
Information regarding fiscal year to date income earned by the Fund from investments in Fidelity Central Funds is as follows: |
Fund | Income earned |
Fidelity Cash Central Fund | $ 54,497 |
Fidelity Securities Lending Cash Central Fund | 1,097,622 |
Total | $ 1,152,119 |
Other Information |
The following is a summary of the inputs used, as of October 31, 2011, involving the Fund's assets and liabilities carried at fair value. The inputs or methodology used for valuing securities may not be an indication of the risk associated with investing in those securities. For more information on valuation inputs, and their aggregation into the levels used in the table below, please refer to the Security Valuation section in the accompanying Notes to Financial Statements. |
Valuation Inputs at Reporting Date: |
Description | Total | Level 1 | Level 2 | Level 3 |
Investments in Securities: | | | | |
Equities: | | | | |
Consumer Discretionary | $ 143,538,034 | $ 7,859,461 | $ 135,678,573 | $ - |
Consumer Staples | 68,811,815 | - | 68,811,815 | - |
Energy | 136,567,240 | - | 136,567,240 | - |
Financials | 556,349,439 | 8,506,038 | 547,843,401 | - |
Health Care | 4,819,634 | - | 4,819,634 | - |
Industrials | 103,237,484 | 1,919,760 | 101,317,724 | - |
Information Technology | 241,916,074 | 31,686,339 | 210,229,735 | - |
Materials | 151,219,333 | - | 151,219,333 | - |
Telecommunication Services | 108,026,780 | - | 108,026,780 | - |
Utilities | 12,618,500 | - | 12,618,500 | - |
Money Market Funds | 23,512,102 | 23,512,102 | - | - |
Total Investments in Securities: | $ 1,550,616,435 | $ 73,483,700 | $ 1,477,132,735 | $ - |
Transfers from Level 1 to Level 2 during the period were $998,441,272. |
See accompanying notes which are an integral part of the financial statements.
Annual Report
Fidelity China Region Fund
Statement of Assets and Liabilities
| October 31, 2011 |
| | |
Assets | | |
Investment in securities, at value (including securities loaned of $7,414,695) - See accompanying schedule: Unaffiliated issuers (cost $1,352,590,394) | $ 1,527,104,333 | |
Fidelity Central Funds (cost $23,512,102) | 23,512,102 | |
Total Investments (cost $1,376,102,496) | | $ 1,550,616,435 |
Receivable for investments sold | | 3,096,945 |
Receivable for fund shares sold | | 2,387,894 |
Dividends receivable | | 27,878 |
Distributions receivable from Fidelity Central Funds | | 83,053 |
Prepaid expenses | | 6,519 |
Other receivables | | 332,497 |
Total assets | | 1,556,551,221 |
| | |
Liabilities | | |
Payable for fund shares redeemed | $ 3,233,655 | |
Accrued management fee | 866,875 | |
Distribution and service plan fees payable | 10,527 | |
Other affiliated payables | 377,917 | |
Other payables and accrued expenses | 169,026 | |
Collateral on securities loaned, at value | 7,655,750 | |
Total liabilities | | 12,313,750 |
| | |
Net Assets | | $ 1,544,237,471 |
Net Assets consist of: | | |
Paid in capital | | $ 1,349,632,104 |
Undistributed net investment income | | 15,589,239 |
Accumulated undistributed net realized gain (loss) on investments and foreign currency transactions | | 4,502,101 |
Net unrealized appreciation (depreciation) on investments and assets and liabilities in foreign currencies | | 174,514,027 |
Net Assets | | $ 1,544,237,471 |
Statement of Assets and Liabilities - continued
| October 31, 2011 |
| | |
Calculation of Maximum Offering Price Class A:
Net Asset Value and redemption price per share ($14,807,740 ÷ 542,844 shares) | | $ 27.28 |
| | |
Maximum offering price per share (100/94.25 of $27.28) | | $ 28.94 |
Class T:
Net Asset Value and redemption price per share ($5,280,845 ÷ 194,657 shares) | | $ 27.13 |
| | |
Maximum offering price per share (100/96.50 of $27.13) | | $ 28.11 |
Class B:
Net Asset Value and offering price per share ($1,801,156 ÷ 66,865 shares)A | | $ 26.94 |
| | |
Class C:
Net Asset Value and offering price per share ($5,229,585 ÷ 194,711 shares)A | | $ 26.86 |
| | |
China Region:
Net Asset Value, offering price and redemption price per share ($1,515,083,763 ÷ 55,117,459 shares) | | $ 27.49 |
| | |
Institutional Class:
Net Asset Value, offering price and redemption price per share ($2,034,382 ÷ 74,075 shares) | | $ 27.46 |
A Redemption price per share is equal to net asset value less any applicable contingent deferred sales charge.
See accompanying notes which are an integral part of the financial statements.
Annual Report
Fund Name
Financial Statements - continued
Statement of Operations
| Year ended October 31, 2011 |
| | |
Investment Income | | |
Dividends | | $ 51,665,043 |
Interest | | 492 |
Income from Fidelity Central Funds | | 1,152,119 |
Income before foreign taxes withheld | | 52,817,654 |
Less foreign taxes withheld | | (5,194,113) |
Total income | | 47,623,541 |
| | |
Expenses | | |
Management fee | $ 14,146,741 | |
Transfer agent fees | 4,525,375 | |
Distribution and service plan fees | 161,388 | |
Accounting and security lending fees | 885,629 | |
Custodian fees and expenses | 889,163 | |
Independent trustees' compensation | 11,248 | |
Registration fees | 120,675 | |
Audit | 77,247 | |
Legal | 8,300 | |
Interest | 23,240 | |
Miscellaneous | 22,470 | |
Total expenses before reductions | 20,871,476 | |
Expense reductions | (1,099,159) | 19,772,317 |
Net investment income (loss) | | 27,851,224 |
Realized and Unrealized Gain (Loss) Net realized gain (loss) on: | | |
Investment securities: | | |
Unaffiliated issuers | 125,171,768 | |
Foreign currency transactions | (727,560) | |
Total net realized gain (loss) | | 124,444,208 |
Change in net unrealized appreciation (depreciation) on: Investment securities | (389,938,527) | |
Assets and liabilities in foreign currencies | 138 | |
Total change in net unrealized appreciation (depreciation) | | (389,938,389) |
Net gain (loss) | | (265,494,181) |
Net increase (decrease) in net assets resulting from operations | | $ (237,642,957) |
Statement of Changes in Net Assets
| Year ended
October 31,
2011 | Year ended
October 31,
2010 |
Increase (Decrease) in Net Assets | | |
Operations | | |
Net investment income (loss) | $ 27,851,224 | $ 25,698,168 |
Net realized gain (loss) | 124,444,208 | 87,056,704 |
Change in net unrealized appreciation (depreciation) | (389,938,389) | 253,069,337 |
Net increase (decrease) in net assets resulting from operations | (237,642,957) | 365,824,209 |
Distributions to shareholders from net investment income | (25,544,611) | (17,788,313) |
Distributions to shareholders from net realized gain | (1,707,007) | (5,540,851) |
Total distributions | (27,251,618) | (23,329,164) |
Share transactions - net increase (decrease) | (353,944,406) | (341,589,636) |
Redemption fees | 551,160 | 1,093,238 |
Total increase (decrease) in net assets | (618,287,821) | 1,998,647 |
| | |
Net Assets | | |
Beginning of period | 2,162,525,292 | 2,160,526,645 |
End of period (including undistributed net investment income of $15,589,239 and undistributed net investment income of $25,575,304, respectively) | $ 1,544,237,471 | $ 2,162,525,292 |
See accompanying notes which are an integral part of the financial statements.
Annual Report
Financial Highlights - Class A
Years ended October 31, | 2011 | 2010 | 2009 | 2008 H |
Selected Per-Share Data | | | | |
Net asset value, beginning of period | $ 31.61 | $ 26.47 | $ 16.67 | $ 29.28 |
Income from Investment Operations | | | | |
Net investment income (loss) E | .33 | .25 | .30 | .28 |
Net realized and unrealized gain (loss) | (4.33) | 5.15 | 9.63 | (12.91) |
Total from investment operations | (4.00) | 5.40 | 9.93 | (12.63) |
Distributions from net investment income | (.31) | (.20) | (.16) | - |
Distributions from net realized gain | (.03) | (.07) | - | - |
Total distributions | (.34) | (.27) | (.16) | - |
Redemption fees added to paid in capital E | .01 | .01 | .03 | .02 |
Net asset value, end of period | $ 27.28 | $ 31.61 | $ 26.47 | $ 16.67 |
Total Return B,C,D | (12.79)% | 20.54% | 60.41% | (43.07)% |
Ratios to Average Net Assets F,I | | | | |
Expenses before reductions | 1.37% | 1.38% | 1.39% | 1.44% A |
Expenses net of fee waivers, if any | 1.37% | 1.38% | 1.39% | 1.44% A |
Expenses net of all reductions | 1.31% | 1.31% | 1.31% | 1.30% A |
Net investment income (loss) | 1.07% | .91% | 1.27% | 2.63% A |
Supplemental Data | | | | |
Net assets, end of period (000 omitted) | $ 14,808 | $ 16,047 | $ 11,842 | $ 340 |
Portfolio turnover rate G | 87% | 57% | 88% | 133% |
A Annualized B Total returns for periods of less than one year are not annualized. C Total returns would have been lower if certain expenses had not been reduced during the applicable periods shown. D Total returns do not include the effect of the sales charges. E Calculated based on average shares outstanding during the period. F Fees and expenses of any underlying Fidelity Central Funds are not included in the Fund's expense ratio. The Fund indirectly bears its proportionate share of the expenses of any underlying Fidelity Central Funds. G Amount does not include the portfolio activity of any underlying Fidelity Central Funds. H For the period May 9, 2008 (commencement of sale of shares) to October 31, 2008. I Expense ratios reflect operating expenses of the class. Expenses before reductions do not reflect amounts reimbursed by the investment adviser or reductions from brokerage service arrangements or reductions from other expense offset arrangements and do not represent the amount paid by the class during periods when reimbursements or reductions occur. Expense ratios before reductions for start-up periods may not be representative of longer-term operating periods. Expenses net of fee waivers reflect expenses after reimbursement by the investment adviser but prior to reductions from brokerage service arrangements or other expense offset arrangements. Expenses net of all reductions represent the net expenses paid by the class. |
Financial Highlights - Class T
Years ended October 31, | 2011 | 2010 | 2009 | 2008 H |
Selected Per-Share Data | | | | |
Net asset value, beginning of period | $ 31.48 | $ 26.40 | $ 16.65 | $ 29.28 |
Income from Investment Operations | | | | |
Net investment income (loss) E | .25 | .18 | .23 | .26 |
Net realized and unrealized gain (loss) | (4.32) | 5.13 | 9.64 | (12.91) |
Total from investment operations | (4.07) | 5.31 | 9.87 | (12.65) |
Distributions from net investment income | (.27) | (.18) | (.14) | - |
Distributions from net realized gain | (.03) | (.07) | - | - |
Total distributions | (.29) J | (.24) K | (.14) | - |
Redemption fees added to paid in capital E | .01 | .01 | .02 | .02 |
Net asset value, end of period | $ 27.13 | $ 31.48 | $ 26.40 | $ 16.65 |
Total Return B,C,D | (13.04)% | 20.27% | 59.92% | (43.14)% |
Ratios to Average Net Assets F,I | | | | |
Expenses before reductions | 1.63% | 1.64% | 1.66% | 1.68% A |
Expenses net of fee waivers, if any | 1.63% | 1.64% | 1.66% | 1.68% A |
Expenses net of all reductions | 1.57% | 1.58% | 1.58% | 1.53% A |
Net investment income (loss) | .81% | .64% | 1.00% | 2.40% A |
Supplemental Data | | | | |
Net assets, end of period (000 omitted) | $ 5,281 | $ 6,070 | $ 3,139 | $ 107 |
Portfolio turnover rate G | 87% | 57% | 88% | 133% |
A Annualized B Total returns for periods of less than one year are not annualized. C Total returns would have been lower if certain expenses had not been reduced during the applicable periods shown. D Total returns do not include the effect of the sales charges. E Calculated based on average shares outstanding during the period. F Fees and expenses of any underlying Fidelity Central Funds are not included in the Fund's expense ratio. The Fund indirectly bears its proportionate share of the expenses of any underlying Fidelity Central Funds. G Amount does not include the portfolio activity of any underlying Fidelity Central Funds. H For the period May 9, 2008 (commencement of sale of shares) to October 31, 2008. I Expense ratios reflect operating expenses of the class. Expenses before reductions do not reflect amounts reimbursed by the investment adviser or reductions from brokerage service arrangements or reductions from other expense offset arrangements and do not represent the amount paid by the class during periods when reimbursements or reductions occur. Expense ratios before reductions for start-up periods may not be representative of longer-term operating periods. Expenses net of fee waivers reflect expenses after reimbursement by the investment adviser but prior to reductions from brokerage service arrangements or other expense offset arrangements. Expenses net of all reductions represent the net expenses paid by the class. J Total distributions of $.29 per share is comprised of distributions from net investment income of $.268 and distributions from net realized gain of $.025 per share. K Total distributions of $.24 per share is comprised of distributions from net investment income of $.177 and distributions from net realized gain of $.065 per share. |
See accompanying notes which are an integral part of the financial statements.
Annual Report
Financial Highlights - Class B
Years ended October 31, | 2011 | 2010 | 2009 | 2008 H |
Selected Per-Share Data | | | | |
Net asset value, beginning of period | $ 31.23 | $ 26.28 | $ 16.61 | $ 29.28 |
Income from Investment Operations | | | | |
Net investment income (loss) E | .10 | .04 | .12 | .20 |
Net realized and unrealized gain (loss) | (4.29) | 5.09 | 9.63 | (12.89) |
Total from investment operations | (4.19) | 5.13 | 9.75 | (12.69) |
Distributions from net investment income | (.08) | (.12) | (.10) | - |
Distributions from net realized gain | (.03) | (.07) | - | - |
Total distributions | (.11) | (.19) | (.10) | - |
Redemption fees added to paid in capital E | .01 | . 01 | .02 | .02 |
Net asset value, end of period | $ 26.94 | $ 31.23 | $ 26.28 | $ 16.61 |
Total Return B,C,D | (13.45)% | 19.63% | 59.16% | (43.27)% |
Ratios to Average Net Assets F,I | | | | |
Expenses before reductions | 2.12% | 2.14% | 2.15% | 2.17% A |
Expenses net of fee waivers, if any | 2.12% | 2.14% | 2.15% | 2.17% A |
Expenses net of all reductions | 2.06% | 2.08% | 2.06% | 2.02% A |
Net investment income (loss) | .32% | .14% | .51% | 1.91% A |
Supplemental Data | | | | |
Net assets, end of period (000 omitted) | $ 1,801 | $ 2,496 | $ 1,915 | $ 155 |
Portfolio turnover rate G | 87% | 57% | 88% | 133% |
A Annualized B Total returns for periods of less than one year are not annualized. C Total returns would have been lower if certain expenses had not been reduced during the applicable periods shown. D Total returns do not include the effect of the contingent deferred sales charge. E Calculated based on average shares outstanding during the period. F Fees and expenses of any underlying Fidelity Central Funds are not included in the Fund's expense ratio. The Fund indirectly bears its proportionate share of the expenses of any underlying Fidelity Central Funds. G Amount does not include the portfolio activity of any underlying Fidelity Central Funds. H For the period May 9, 2008 (commencement of sale of shares) to October 31, 2008. I Expense ratios reflect operating expenses of the class. Expenses before reductions do not reflect amounts reimbursed by the investment adviser or reductions from brokerage service arrangements or reductions from other expense offset arrangements and do not represent the amount paid by the class during periods when reimbursements or reductions occur. Expense ratios before reductions for start-up periods may not be representative of longer-term operating periods. Expenses net of fee waivers reflect expenses after reimbursement by the investment adviser but prior to reductions from brokerage service arrangements or other expense offset arrangements. Expenses net of all reductions represent the net expenses paid by the class. |
Financial Highlights - Class C
Years ended October 31, | 2011 | 2010 | 2009 | 2008 H |
Selected Per-Share Data | | | | |
Net asset value, beginning of period | $ 31.19 | $ 26.25 | $ 16.61 | $ 29.28 |
Income from Investment Operations | | | | |
Net investment income (loss) E | .10 | .04 | .12 | .20 |
Net realized and unrealized gain (loss) | (4.28) | 5.09 | 9.62 | (12.89) |
Total from investment operations | (4.18) | 5.13 | 9.74 | (12.69) |
Distributions from net investment income | (.13) | (.13) | (.12) | - |
Distributions from net realized gain | (.03) | (.07) | - | - |
Total distributions | (.16) | (.20) | (.12) | - |
Redemption fees added to paid in capital E | .01 | .01 | .02 | .02 |
Net asset value, end of period | $ 26.86 | $ 31.19 | $ 26.25 | $ 16.61 |
Total Return B,C,D | (13.46)% | 19.66% | 59.18% | (43.27)% |
Ratios to Average Net Assets F,I | | | | |
Expenses before reductions | 2.12% | 2.14% | 2.15% | 2.13% A |
Expenses net of fee waivers, if any | 2.12% | 2.14% | 2.15% | 2.13% A |
Expenses net of all reductions | 2.06% | 2.07% | 2.07% | 1.98% A |
Net investment income (loss) | .32% | .15% | .51% | 1.95% A |
Supplemental Data | | | | |
Net assets, end of period (000 omitted) | $ 5,230 | $ 5,938 | $ 3,806 | $ 233 |
Portfolio turnover rate G | 87% | 57% | 88% | 133% |
A Annualized B Total returns for periods of less than one year are not annualized. C Total returns would have been lower if certain expenses had not been reduced during the applicable periods shown. D Total returns do not include the effect of the contingent deferred sales charge. E Calculated based on average shares outstanding during the period. F Fees and expenses of any underlying Fidelity Central Funds are not included in the Fund's expense ratio. The Fund indirectly bears its proportionate share of the expenses of any underlying Fidelity Central Funds. G Amount does not include the portfolio activity of any underlying Fidelity Central Funds. H For the period May 9, 2008 (commencement of sale of shares) to October 31, 2008. I Expense ratios reflect operating expenses of the class. Expenses before reductions do not reflect amounts reimbursed by the investment adviser or reductions from brokerage service arrangements or reductions from other expense offset arrangements and do not represent the amount paid by the class during periods when reimbursements or reductions occur. Expense ratios before reductions for start-up periods may not be representative of longer-term operating periods. Expenses net of fee waivers reflect expenses after reimbursement by the investment adviser but prior to reductions from brokerage service arrangements or other expense offset arrangements. Expenses net of all reductions represent the net expenses paid by the class. |
See accompanying notes which are an integral part of the financial statements.
Annual Report
Financial Highlights - China Region
Years ended October 31, | 2011 | 2010 | 2009 | 2008 | 2007 |
Selected Per-Share Data | | | | | |
Net asset value, beginning of period | $ 31.81 | $ 26.55 | $ 16.69 | $ 41.52 | $ 22.94 |
Income from Investment Operations | | | | | |
Net investment income (loss) B | .44 | .34 | .33 | .39 | .46 |
Net realized and unrealized gain (loss) | (4.37) | 5.18 | 9.68 | (20.42) | 18.58 |
Total from investment operations | (3.93) | 5.52 | 10.01 | (20.03) | 19.04 |
Distributions from net investment income | (.38) | (.21) | (.17) | (.32) | (.29) |
Distributions from net realized gain | (.03) | (.07) | - | (4.53) | (.20) |
Total distributions | (.40) F | (.27) G | (.17) | (4.85) | (.49) |
Redemption fees added to paid in capital B | .01 | .01 | .02 | .05 | .03 |
Net asset value, end of period | $ 27.49 | $ 31.81 | $ 26.55 | $ 16.69 | $ 41.52 |
Total Return A | (12.52)% | 20.97% | 60.77% | (53.75)% | 84.73% |
Ratios to Average Net Assets C,E | | | | | |
Expenses before reductions | 1.04% | 1.06% | 1.12% | 1.11% | 1.08% |
Expenses net of fee waivers, if any | 1.04% | 1.06% | 1.12% | 1.11% | 1.08% |
Expenses net of all reductions | .98% | 1.00% | 1.03% | .96% | .92% |
Net investment income (loss) | 1.40% | 1.22% | 1.54% | 1.45% | 1.64% |
Supplemental Data | | | | | |
Net assets, end of period (000 omitted) | $ 1,515,084 | $ 2,130,070 | $ 2,138,141 | $ 740,289 | $ 2,044,527 |
Portfolio turnover rate D | 87% | 57% | 88% | 133% | 173% |
A Total returns would have been lower if certain expenses had not been reduced during the applicable periods shown. B Calculated based on average shares outstanding during the period. C Fees and expenses of any underlying Fidelity Central Funds are not included in the Fund's expense ratio. The Fund indirectly bears its proportionate share of the expenses of any underlying Fidelity Central Funds. D Amount does not include the portfolio activity of any underlying Fidelity Central Funds. E Expense ratios reflect operating expenses of the class. Expenses before reductions do not reflect amounts reimbursed by the investment adviser or reductions from brokerage service arrangements or reductions from other expense offset arrangements and do not represent the amount paid by the class during periods when reimbursements or reductions occur. Expenses net of fee waivers reflect expenses after reimbursement by the investment adviser but prior to reductions from brokerage service arrangements or other expense offset arrangements. Expenses net of all reductions represent the net expenses paid by the class. F Total distributions of $.40 per share is comprised of distributions from net investment income of $.376 and distributions from net realized gain of $.025 per share. G Total distributions of $.27 per share is comprised of distributions from net investment income of $.209 and distributions from net realized gain of $.065 per share. |
Financial Highlights - Institutional Class
Years ended October 31, | 2011 | 2010 | 2009 | 2008 G |
Selected Per-Share Data | | | | |
Net asset value, beginning of period | $ 31.79 | $ 26.55 | $ 16.70 | $ 29.28 |
Income from Investment Operations | | | | |
Net investment income (loss) D | .43 | .33 | .37 | .34 |
Net realized and unrealized gain (loss) | (4.37) | 5.18 | 9.64 | (12.94) |
Total from investment operations | (3.94) | 5.51 | 10.01 | (12.60) |
Distributions from net investment income | (.37) | (.22) | (.18) | - |
Distributions from net realized gain | (.03) | (.07) | - | - |
Total distributions | (.40) | (.28) I | (.18) | - |
Redemption fees added to paid in capital D | .01 | .01 | .02 | .02 |
Net asset value, end of period | $ 27.46 | $ 31.79 | $ 26.55 | $ 16.70 |
Total Return B,C | (12.56)% | 20.92% | 60.78% | (42.96)% |
Ratios to Average Net Assets E,H | | | | |
Expenses before reductions | 1.06% | 1.11% | 1.08% | 1.05% A |
Expenses net of fee waivers, if any | 1.06% | 1.11% | 1.08% | 1.05% A |
Expenses net of all reductions | 1.01% | 1.04% | 1.00% | .91% A |
Net investment income (loss) | 1.38% | 1.18% | 1.58% | 3.02% A |
Supplemental Data | | | | |
Net assets, end of period (000 omitted) | $ 2,034 | $ 1,904 | $ 1,684 | $ 60 |
Portfolio turnover rate F | 87% | 57% | 88% | 133% |
A Annualized B Total returns for periods of less than one year are not annualized. C Total returns would have been lower if certain expenses had not been reduced during the applicable periods shown. D Calculated based on average shares outstanding during the period. E Fees and expenses of any underlying Fidelity Central Funds are not included in the Fund's expense ratio. The Fund indirectly bears its proportionate share of the expenses of any underlying Fidelity Central Funds. F Amount does not include the portfolio activity of any underlying Fidelity Central Funds. G For the period May 9, 2008 (commencement of sale of shares) to October 31, 2008. H Expense ratios reflect operating expenses of the class. Expenses before reductions do not reflect amounts reimbursed by the investment adviser or reductions from brokerage service arrangements or reductions from other expense offset arrangements and do not represent the amount paid by the class during periods when reimbursements or reductions occur. Expense ratios before reductions for start-up periods may not be representative of longer-term operating periods. Expenses net of fee waivers reflect expenses after reimbursement by the investment adviser but prior to reductions from brokerage service arrangements or other expense offset arrangements. Expenses net of all reductions represent the net expenses paid by the class. I Total distributions of $.28 per share is comprised of distributions from net investment income of $.216 and distributions from net realized gain of $.065 per share. |
See accompanying notes which are an integral part of the financial statements.
Annual Report
Notes to Financial Statements
For the period ended October 31, 2011
1. Organization.
Fidelity China Region Fund (the Fund) is a fund of Fidelity Investment Trust (the Trust) and is authorized to issue an unlimited number of shares. The Trust is registered under the Investment Company Act of 1940, as amended (the 1940 Act), as an open-end management investment company organized as a Massachusetts business trust. The Fund offers Class A, Class T, Class C, China Region, and Institutional Class shares, each of which, along with Class B shares, has equal rights as to assets and voting privileges. Effective after the close of business on September 1, 2010, Class B shares were closed to new accounts and additional purchases, except for exchanges and reinvestments by existing shareholders. Each class has exclusive voting rights with respect to matters that affect that class. Class B shares will automatically convert to Class A shares after a holding period of seven years from the initial date of purchase. Investment income, realized and unrealized capital gains and losses, the common expenses of the Fund, and certain fund-level expense reductions, if any, are allocated on a pro-rata basis to each class based on the relative net assets of each class to the total net assets of the Fund. Each class differs with respect to transfer agent and distribution and service plan fees incurred. Certain expense reductions may also differ by class. The Fund's investments in emerging markets can be subject to social, economic, regulatory, and political uncertainties and can be extremely volatile.
2. Investments in Fidelity Central Funds.
The Fund invests in Fidelity Central Funds, which are open-end investment companies available only to other investment companies and accounts managed by Fidelity Management & Research Company (FMR) and its affiliates. The Fund's Schedule of Investments lists each of the Fidelity Central Funds held as of period end, if any, as an investment of the Fund, but does not include the underlying holdings of each Fidelity Central Fund. As an Investing Fund, the Fund indirectly bears its proportionate share of the expenses of the underlying Fidelity Central Funds.
The Money Market Central Funds seek preservation of capital and current income and are managed by Fidelity Investments Money Management, Inc. (FIMM), an affiliate of FMR.
A complete unaudited list of holdings for each Fidelity Central Fund is available upon request or at the Securities and Exchange Commission (the SEC) web site at www.sec.gov. In addition, the financial statements of the Fidelity Central Funds, which are not covered by the Fund's Report of Independent Registered Public Accounting Firm are available on the SEC web site or upon request.
3. Significant Accounting Policies.
The financial statements have been prepared in conformity with accounting principles generally accepted in the United States of America (GAAP), which require management to make certain estimates and assumptions at the date of the financial statements. Actual results could differ from those estimates. Subsequent events, if any, through the date that the financial statements were issued have been evaluated in the preparation of the financial statements. The following summarizes the significant accounting policies of the Fund:
Security Valuation. Investments are valued as of 4:00 p.m. Eastern time on the last calendar day of the period. The Fund uses independent pricing services approved by the Board of Trustees to value its investments. When current market prices or quotations are not readily available or reliable, valuations may be determined in good faith in accordance with procedures adopted by the Board of Trustees. Factors used in determining value may include market or security specific events. The frequency with which these procedures are used cannot be predicted and they may be utilized to a significant extent. The value used for net asset value (NAV) calculation under these procedures may differ from published prices for the same securities.
The Fund categorizes the inputs to valuation techniques used to value its investments into a disclosure hierarchy consisting of three levels as shown below:
Level 1 - quoted prices in active markets for identical investments
Level 2 - other significant observable inputs (including quoted prices for similar investments, interest rates, prepayment speeds, etc.)
Level 3 - unobservable inputs (including the Fund's own assumptions based on the best information available)
Changes in valuation techniques may result in transfers in or out of an assigned level within the disclosure hierarchy. The aggregate value of investments by input level, as of October 31, 2011, is included at the end of the Fund's Schedule of Investments. Valuation techniques used to value the Fund's investments by major category are as follows:
Equity securities, including restricted securities, for which market quotations are readily available, are valued at the last reported sale price or official closing price as reported by an independent pricing service on the primary market or exchange on which they are traded and are categorized as Level 1 in the hierarchy. In the event there were no sales during the day or closing prices are not available, securities are valued at the last quoted bid price or may be valued using the last available price and are generally categorized as Level 2 in the hierarchy. For foreign equity securities, when significant market or security specific events arise, comparisons to the valuation of American Depositary Receipts (ADRs), futures contracts, Exchange-traded
Annual Report
Notes to Financial Statements - continued
3. Significant Accounting Policies - continued
Security Valuation - continued
funds (ETFs) and certain indexes as well as quoted prices for similar securities are used and are categorized as Level 2 in the hierarchy in these circumstances. Utilizing these techniques may result in transfers between Level 1 and Level 2. For restricted equity securities and private placements where observable inputs are limited, assumptions about market activity and risk are used and are categorized as Level 3 in the hierarchy.
Investments in open-end mutual funds, including the Fidelity Central Funds, are valued at their closing net asset value each business day and are categorized as Level 1 in the hierarchy.
Foreign Currency. The Fund may use foreign currency contracts to facilitate transactions in foreign-denominated securities. Gains and losses from these transactions may arise from changes in the value of the foreign currency or if the counterparties do not perform under the contracts' terms.
Foreign-denominated assets, including investment securities, and liabilities are translated into U.S. dollars at the exchange rate at period end. Purchases and sales of investment securities, income and dividends received and expenses denominated in foreign currencies are translated into U.S. dollars at the exchange rate in effect on the transaction date.
The effects of exchange rate fluctuations on investments are included with the net realized and unrealized gain (loss) on investment securities. Other foreign currency transactions resulting in realized and unrealized gain (loss) are disclosed separately.
Investment Transactions and Income. For financial reporting purposes, the Fund's investment holdings and NAV include trades executed through the end of the last business day of the period. The NAV per share for processing shareholder transactions is calculated as of the close of business of the New York Stock Exchange (NYSE), normally 4:00 p.m. Eastern time and includes trades executed through the end of the prior business day. Gains and losses on securities sold are determined on the basis of identified cost. Dividend income is recorded on the ex-dividend date, except for certain dividends from foreign securities where the ex-dividend date may have passed, which are recorded as soon as the Fund is informed of the ex-dividend date. Non-cash dividends included in dividend income, if any, are recorded at the fair market value of the securities received. Interest income and distributions from the Fidelity Central Funds are accrued as earned. Interest income includes coupon interest and amortization of premium and accretion of discount on debt securities. Investment income is recorded net of foreign taxes withheld where recovery of such taxes is uncertain.
Expenses. Expenses directly attributable to a fund are charged to that fund. Expenses attributable to more than one fund are allocated among the respective funds on the basis of relative net assets or other appropriate methods. Expense estimates are accrued in the period to which they relate and adjustments are made when actual amounts are known.
Income Tax Information and Distributions to Shareholders. Each year, the Fund intends to qualify as a regulated investment company, including distributing substantially all of its taxable income and realized gains under Subchapter M of the Internal Revenue Code and filing its U.S. federal tax return. As a result, no provision for income taxes is required. As of October 31, 2011, the Fund did not have any unrecognized tax benefits in the financial statements. A fund's federal tax return is subject to examination by the Internal Revenue Service (IRS) for a period of three years. Foreign taxes are provided for based on the Fund's understanding of the tax rules and rates that exist in the foreign markets in which it invests.
Distributions are declared and recorded on the ex-dividend date. Income dividends and capital gain distributions are declared separately for each class. Income and capital gain distributions are determined in accordance with income tax regulations, which may differ from GAAP. In addition, the Fund claimed a portion of the payment made to redeeming shareholders as a distribution for income tax purposes.
Capital accounts within the financial statements are adjusted for permanent book-tax differences. These adjustments have no impact on net assets or the results of operations. Temporary book-tax differences will reverse in a subsequent period.
Book-tax differences are primarily due to the foreign currency transactions, deferred trustees compensation, passive foreign investment companies (PFIC), capital loss carryforwards and losses deferred due to wash sales.
The federal tax cost of investment securities and unrealized appreciation (depreciation) as of period end were as follows:
Gross unrealized appreciation | $ 225,517,453 |
Gross unrealized depreciation | (65,204,838) |
Net unrealized appreciation (depreciation) on securities and other investments | $ 160,312,615 |
| |
Tax Cost | $ 1,390,303,820 |
Annual Report
3. Significant Accounting Policies - continued
Income Tax Information and Distributions to Shareholders - continued
The tax-based components of distributable earnings as of period end were as follows:
Undistributed ordinary income | $ 15,589,243 |
Undistributed long-term capital gain | $ 18,703,425 |
Net unrealized appreciation (depreciation) | $ 160,312,703 |
Under the recently enacted Regulated Investment Company Modernization Act of 2010 (the Act), the Fund will be permitted to carry forward capital losses incurred in taxable years beginning after December 22, 2010 for an unlimited period. However, any losses incurred during those future taxable years will be required to be utilized prior to any losses incurred in pre-enactment taxable years, which generally expire after eight years from when they are incurred. Additionally, post-enactment capital losses that are carried forward will retain their character as either short-term or long-term capital losses rather than being considered all short-term as under previous law. The Fund's first fiscal year end subject to the Act will be October 31, 2012.
The tax character of distributions paid was as follows:
| October 31, 2011 | October 31, 2010 |
Ordinary Income | $ 27,251,618 | $ 23,329,164 |
Short-Term Trading (Redemption) Fees. Shares held by investors in the Fund less than 90 days are subject to a redemption fee equal to 1.50% of the net asset value of shares redeemed. All redemption fees, which reduce the proceeds of the shareholder redemption, are retained by the Fund and accounted for as an addition to paid in capital.
New Accounting Pronouncement. In May 2011, the Financial Accounting Standards Board issued Accounting Standard Update No. 2011-04, Fair Value Measurement (Topic 820) - Amendments to Achieve Common Fair Value Measurement and Disclosure Requirements in U.S. GAAP and IFRSs. The update changes the wording used to describe the requirements in GAAP for measuring fair value and for disclosing information about fair value measurements. The update is effective during interim and annual periods beginning after December 15, 2011. Management is currently evaluating the impact of the update's adoption on the Fund's financial statement disclosures.
4. Purchases and Sales of Investments.
Purchases and sales of securities, other than short-term securities, aggregated $1,708,508,008 and $2,005,473,744, respectively.
5. Fees and Other Transactions with Affiliates.
Management Fee. FMR and its affiliates provide the Fund with investment management related services for which the Fund pays a monthly management fee. The management fee is the sum of an individual fund fee rate that is based on an annual rate of .45% of the Fund's average net assets and a group fee rate that averaged .26% during the period. The group fee rate is based upon the average net assets of all the mutual funds advised by FMR. The group fee rate decreases as assets under management increase and increases as assets under management decrease. For the period, the total annual management fee rate was .71% of the Fund's average net assets.
Distribution and Service Plan Fees. In accordance with Rule 12b-1 of the 1940 Act, the Fund has adopted separate Distribution and Service Plans for each class of shares. Certain classes pay Fidelity Distributors Corporation (FDC), an affiliate of FMR, separate Distribution and Service Fees, each of which is based on an annual percentage of each class' average net assets. In addition, FDC may pay financial intermediaries for selling shares of the Fund and providing shareholder support services. For the period, the Distribution and Service Fee rates, total fees and amounts retained by FDC were as follows:
| Distribution
Fee | Service
Fee | Total Fees | Retained
by FDC |
Class A | -% | .25% | $ 43,649 | $ 1,347 |
Class T | .25% | .25% | 31,332 | - |
Class B | .75% | .25% | 23,294 | 17,555 |
Class C | .75% | .25% | 63,113 | 18,988 |
| | | $ 161,388 | $ 37,890 |
Sales Load. FDC may receive a front-end sales charge of up to 5.75% for selling Class A shares, and 3.50% for selling Class T shares, some of which is paid to financial intermediaries for selling shares of the Fund. Depending on the holding period, FDC may receive contingent deferred sales charges levied on Class A, Class T, Class B, and Class C redemptions. The deferred sales charges range from 5% to 1% for Class B, 1% for Class C, 1.00% for certain purchases of Class A shares and .25% for certain purchases of Class T shares.
Annual Report
Notes to Financial Statements - continued
5. Fees and Other Transactions with Affiliates - continued
Sales Load - continued
For the period, sales charge amounts retained by FDC were as follows:
| Retained
by FDC |
Class A | $ 27,851 |
Class T | 4,413 |
Class B* | 6,044 |
Class C* | 2,133 |
| $ 40,441 |
* When Class B and Class C shares are initially sold, FDC pays commissions from its own resources to financial intermediaries through which the sales are made.
Transfer Agent Fees. Fidelity Investments Institutional Operations Company, Inc. (FIIOC), an affiliate of FMR, is the transfer, dividend disbursing and shareholder servicing agent for each class of the Fund. FIIOC receives account fees and asset-based fees that vary according to the account size and type of account of the shareholders of the respective classes of the Fund. FIIOC pays for typesetting, printing and mailing of shareholder reports, except proxy statements. For the period, transfer agent fees for each class were as follows:
| Amount | % of
Average
Net Assets |
Class A | $ 53,201 | .31 |
Class T | 19,843 | .32 |
Class B | 7,069 | .30 |
Class C | 19,240 | .31 |
China Region | 4,421,467 | .23 |
Institutional Class | 4,555 | .25 |
| $ 4,525,375 | |
Accounting and Security Lending Fees. Fidelity Service Company, Inc. (FSC), an affiliate of FMR, maintains the Fund's accounting records. The accounting fee is based on the level of average net assets for the month. Under a separate contract, FSC administers the security lending program. The security lending fee is based on the number and duration of lending transactions.
Brokerage Commissions. The Fund placed portion of its portfolio transactions with brokerage firms which are affiliates of the investment adviser. The commissions paid to these affiliated firms were $222 for the period.
Interfund Lending Program. Pursuant to an Exemptive Order issued by the SEC, the Fund, along with other registered investment companies having management contracts with FMR, may participate in an interfund lending program. This program provides an alternative credit facility allowing the funds to borrow from, or lend money to, other participating affiliated funds. At period end, there were no interfund loans outstanding. The Fund's activity in this program during the period for which loans were outstanding was as follows:
Borrower or Lender | Average Daily
Loan Balance | Weighted Average Interest Rate | Interest
Expense |
Borrower | $ 16,084,375 | .34% | $ 1,206 |
6. Committed Line of Credit.
The Fund participates with other funds managed by FMR or an affiliate in a $4.0 billion credit facility (the "line of credit") to be utilized for temporary or emergency purposes to fund shareholder redemptions or for other short-term liquidity purposes. The Fund has agreed to pay commitment fees on its pro-rata portion of the line of credit, which amounted to $6,361 and is reflected in Miscellaneous expenses on the Statement of Operations. During the period, there were no borrowings on this line of credit.
7. Security Lending.
The Fund lends portfolio securities through a lending agent from time to time in order to earn additional income. For equity securities, a lending agent is used and may loan securities to certain qualified borrowers, including Fidelity Capital Markets (FCM), a broker-dealer affiliated with the Fund. On the settlement date of the loan, the Fund receives collateral (in the form of U.S. Treasury obligations, letters of credit and/or cash) against the loaned securities and maintains collateral in an amount not less than 100% of the market value of the loaned securities during the period of the loan. The market value of the loaned securities is determined at the close of business of the Fund and any additional required collateral is delivered to the Fund
Annual Report
7. Security Lending - continued
on the next business day. If the borrower defaults on its obligation to return the securities loaned because of insolvency or other reasons, a fund could experience delays and costs in recovering the securities loaned or in gaining access to the collateral. Any cash collateral received is invested in the Fidelity Securities Lending Cash Central Fund. The value of loaned securities and cash collateral at period end are disclosed on the Fund's Statement of Assets and Liabilities. Security lending income represents the income earned on investing cash collateral, less rebates paid to borrowers and any lending agent fees associated with the loan, plus any premium payments received for lending certain types of securities. Security lending income is presented in the Statement of Operations as a component of income from Fidelity Central Funds. Total security lending income during the period amounted to $1,097,622, including $2,921 from securities loaned to FCM.
8. Bank Borrowings.
The Fund is permitted to have bank borrowings for temporary or emergency purposes to fund shareholder redemptions or for other short-term liquidity requirements. The Fund has established borrowing arrangements with certain banks. The interest rate on the borrowings is the bank's base rate, as revised from time to time. The average daily loan balance during the period for which loans were outstanding amounted to $347,907,000. The weighted average interest rate was .57%. The interest expense amounted to $22,034 under the bank borrowing program. At period end, there were no bank borrowings outstanding.
9. Expense Reductions.
Many of the brokers with whom FMR places trades on behalf of the Fund provided services to the Fund in addition to trade execution. These services included payments of certain expenses on behalf of the Fund totaling $1,098,595 for the period. In addition, through arrangements with the Fund's custodian, credits realized as a result of uninvested cash balances were used to reduce the Fund's expenses. During the period, these credits reduced the Fund' expenses by $564.
10. Distributions to Shareholders.
Distributions to shareholders of each class were as follows:
Years ended October 31, | 2011 | 2010 |
From net investment income | | |
Class A | $ 172,777 | $ 99,129 |
Class T | 55,512 | 24,223 |
Class B | 6,583 | 9,817 |
Class C | 25,937 | 22,748 |
China Region | 25,262,487 | 17,620,183 |
Institutional Class | 21,315 | 12,213 |
Total | $ 25,544,611 | $ 17,788,313 |
From net realized gain | | |
Class A | $ 13,756 | $ 32,057 |
Class T | 5,178 | 8,895 |
Class B | 2,007 | 5,146 |
Class C | 4,950 | 11,118 |
China Region | 1,679,687 | 5,479,960 |
Institutional Class | 1,429 | 3,675 |
Total | $ 1,707,007 | $ 5,540,851 |
11. Share Transactions.
Transactions for each class of shares were as follows:
| Shares | Dollars |
Years ended October 31, | 2011 | 2010 | 2011 | 2010 |
Class A | | | | |
Shares sold | 281,861 | 342,123 | $ 8,932,867 | $ 9,544,171 |
Reinvestment of distributions | 5,327 | 4,199 | 172,528 | 118,611 |
Shares redeemed | (251,952) | (286,153) | (7,835,006) | (7,654,399) |
Net increase (decrease) | 35,236 | 60,169 | $ 1,270,389 | $ 2,008,383 |
Annual Report
Notes to Financial Statements - continued
11. Share Transactions - continued
| Shares | Dollars |
Years ended October 31, | 2011 | 2010 | 2011 | 2010 |
Class T | | | | |
Shares sold | 75,956 | 132,233 | $ 2,390,903 | $ 3,681,750 |
Reinvestment of distributions | 1,832 | 1,158 | 59,161 | 32,661 |
Shares redeemed | (75,948) | (59,475) | (2,353,550) | (1,609,136) |
Net increase (decrease) | 1,840 | 73,916 | $ 96,514 | $ 2,105,275 |
Class B | | | | |
Shares sold | 8,058 | 41,380 | $ 255,784 | $ 1,126,249 |
Reinvestment of distributions | 239 | 486 | 7,684 | 13,648 |
Shares redeemed | (21,353) | (34,810) | (653,889) | (913,219) |
Net increase (decrease) | (13,056) | 7,056 | $ (390,421) | $ 226,678 |
Class C | | | | |
Shares sold | 88,544 | 121,441 | $ 2,766,692 | $ 3,346,120 |
Reinvestment of distributions | 892 | 1,162 | 28,631 | 32,596 |
Shares redeemed | (85,136) | (77,220) | (2,585,147) | (2,041,365) |
Net increase (decrease) | 4,300 | 45,383 | $ 210,176 | $ 1,337,351 |
China Region | | | | |
Shares sold | 12,355,142 | 29,402,822 | $ 393,844,409 | $ 826,039,335 |
Reinvestment of distributions | 794,988 | 782,007 | 25,868,885 | 22,169,887 |
Shares redeemed | (24,993,159) | (43,745,336) | (775,253,396) | (1,195,393,614) |
Net increase (decrease) | (11,843,029) | (13,560,507) | $ (355,540,102) | $ (347,184,392) |
Institutional Class | | | | |
Shares sold | 53,728 | 53,076 | $ 1,636,945 | $ 1,486,647 |
Reinvestment of distributions | 607 | 500 | 19,735 | 14,160 |
Shares redeemed | (40,146) | (57,102) | (1,247,642) | (1,583,738) |
Net increase (decrease) | 14,189 | (3,526) | $ 409,038 | $ (82,931) |
12. Other.
The Fund's organizational documents provide former and current trustees and officers with a limited indemnification against liabilities arising in connection with the performance of their duties to the Fund. In the normal course of business, the Fund may also enter into contracts that provide general indemnifications. The Fund's maximum exposure under these arrangements is unknown as this would be dependent on future claims that may be made against the Fund. The risk of material loss from such claims is considered remote.
Annual Report
Fidelity Emerging Asia Fund
Performance: The Bottom Line
Average annual total return reflects the change in the value of an investment, assuming reinvestment of the fund's distributions from dividend income and capital gains (the profits earned upon the sale of securities that have grown in value, if any) and assuming a constant rate of performance each year. The $10,000 table and the fund's returns do not reflect the deduction of taxes that a shareholder would pay on fund distributions or the redemption of fund shares. During periods of reimbursement by Fidelity, a fund's total return will be greater than it would be had the reimbursement not occurred. How a fund did yesterday is no guarantee of how it will do tomorrow.
Average Annual Total Returns
Periods ended October 31, 2011 | Past 1
year | Past 5
years | Past 10
years |
Fidelity Emerging Asia Fund | -6.20% | 5.33% | 14.51% |
$10,000 Over 10 Years
Let's say hypothetically that $10,000 was invested in Fidelity Emerging Asia Fund on October 31, 2001. The chart shows how the value of your investment would have changed, and also shows how the MSCI AC (All Country) Asia ex Japan Index and MSCI AC (All Country) Far East ex Japan Index performed over the same period.
Effective December 1, 2010, Fidelity Emerging Asia Fund began comparing its performance to the MSCI AC Asia ex Japan Index rather than the MSCI AC Far East Asia ex Japan Index because the MSCI AC Asia ex Japan Index conforms more closely to the fund's investment strategies.
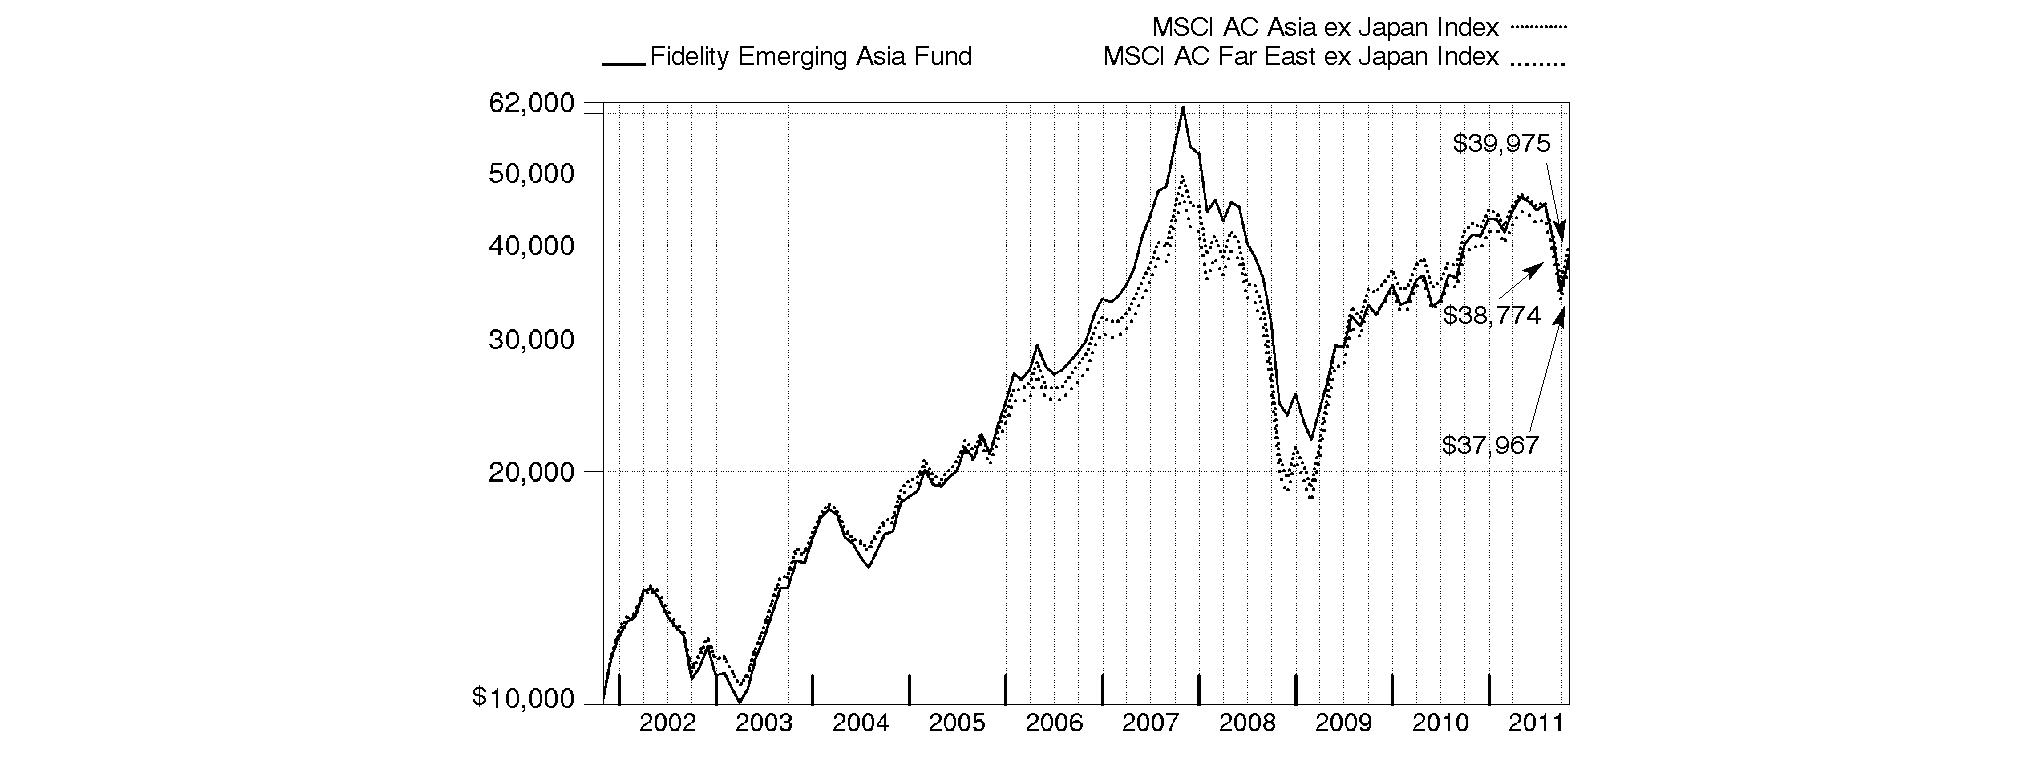
Annual Report
Fidelity Emerging Asia Fund
Market Recap: Stocks in emerging Asia lost ground during the 12-month period ending October 31, 2011, weighed down in part by double-digit losses in China and India. Share prices in those two countries struggled against the head wind of a tighter monetary environment, as government officials attempted to tame inflationary pressures without triggering abrupt slowdowns in their rapidly expanding economies. In China's case, inflation cooled a bit toward period end after hitting a three-year peak in July, but food prices continued to expand at a double-digit pace. For the year, the MSCI® AC (All Country) Asia ex Japan Index returned -6.74%. China, with an average benchmark allocation of 18%, finished the period with a roughly -17% return, while India, representing about 10% of the index, returned -20%. The three other major country constituents fared considerably better. Hong Kong, with a 17% weighting, modestly lagged the benchmark, at about -8%. Taiwan checked in with a 16% weighting and a return of -2%. South Korea, the largest benchmark constituent, at 20%, finished in the black, gaining about 7%, bolstered in part by stellar showings from its automakers.
Comments from Colin Chickles, Portfolio Manager of Fidelity® Emerging Asia Fund: For the 12 months ending October 31, 2011, the fund returned -6.20%, ahead of the -6.74% mark of the MSCI® AC (All Country) Asia ex Japan Index, which became the fund's primary benchmark on December 1, 2010. During the same period, the fund's old benchmark, the MSCI® AC (All Country) Far East ex Japan Index, returned -5.00%. The fund's performance was about in line with the -6.12% result of a linked index combining the returns of the old MSCI benchmark, with which the fund was compared through November, and the new MSCI benchmark, with which the fund was compared during the period's final 11 months. The fund's benchmark was changed in conjunction with a broadened investment focus to include India and a change of the fund's name from Fidelity Southeast Asia Fund to Fidelity Emerging Asia Fund. Versus the linked index, stock selection in consumer staples, energy, telecommunication services and the banking segment of financials hampered the fund's relative results. Geographically, stock picking in India and Hong Kong were negatives. China-based Chaoda Modern Agriculture, the fund's largest relative detractor, was hampered by suspicion the company was overstating the size of its land holdings. Other important detractors included Chinese energy producer PetroChina, which I sold by period end, and an underweighting in wireless carrier and benchmark component China Mobile. Conversely, positioning in materials, information technology and consumer discretionary added value. Geographically, my picks in Taiwan and South Korea bolstered performance. Hong Kong utility Power Assets Holdings was the fund's top relative contributor. The company was able to raise its rates and expand its customer base. Underweighting and ultimately selling two poorly performing benchmark components, Bank of China (Hong Kong) and China Life Insurance, also bolstered performance.
The views expressed above reflect those of the portfolio manager(s) only through the end of the period as stated on the cover of this report and do not necessarily represent the views of Fidelity or any other person in the Fidelity organization. Any such views are subject to change at any time based upon market or other conditions and Fidelity disclaims any responsibility to update such views. These views may not be relied on as investment advice and, because investment decisions for a Fidelity fund are based on numerous factors, may not be relied on as an indication of trading intent on behalf of any Fidelity fund.
Annual Report
Fidelity Emerging Asia Fund
As a shareholder of the Fund, you incur two types of costs: (1) transaction costs, including redemption fees, and (2) ongoing costs, including management fees and other Fund expenses. This Example is intended to help you understand your ongoing costs (in dollars) of investing in the Fund and to compare these costs with the ongoing costs of investing in other mutual funds.
The Example is based on an investment of $1,000 invested at the beginning of the period and held for the entire period (May 1, 2011 to October 31, 2011).
Actual Expenses
The first line of the accompanying table provides information about actual account values and actual expenses. You may use the information in this line, together with the amount you invested, to estimate the expenses that you paid over the period. Simply divide your account value by $1,000.00 (for example, an $8,600 account value divided by $1,000.00 = 8.6), then multiply the result by the number in the first line under the heading entitled "Expenses Paid During Period" to estimate the expenses you paid on your account during this period. A small balance maintenance fee of $12.00 that is charged once a year may apply for certain accounts with a value of less than $2,000. This fee is not included in the table below. If it was, the estimate of expenses you paid during the period would be higher, and your ending account value lower, by this amount. In addition, the Fund, as a shareholder in the underlying Fidelity Central Funds, will indirectly bear its pro-rata share of the fees and expenses incurred by the underlying Fidelity Central Funds. These fees and expenses are not included in the Fund's annualized expense ratio used to calculate the expense estimate in the table below.
Hypothetical Example for Comparison Purposes
The second line of the accompanying table provides information about hypothetical account values and hypothetical expenses based on the Fund's actual expense ratio and an assumed rate of return of 5% per year before expenses, which is not the Fund's actual return. The hypothetical account values and expenses may not be used to estimate the actual ending account balance or expenses you paid for the period. You may use this information to compare the ongoing costs of investing in the Fund and other funds. To do so, compare this 5% hypothetical example with the 5% hypothetical examples that appear in the shareholder reports of the other funds. A small balance maintenance fee of $12.00 that is charged once a year may apply for certain accounts with a value of less than $2,000. This fee is not included in the table below. If it was, the estimate of expenses you paid during the period would be higher, and your ending account value lower, by this amount. In addition, the Fund, as a shareholder in the underlying Fidelity Central Funds, will indirectly bear its pro-rata share of the fees and expenses incurred by the underlying Fidelity Central Funds. These fees and expenses are not included in the Fund's annualized expense ratio used to calculate the expense estimate in the table below.
Please note that the expenses shown in the table are meant to highlight your ongoing costs only and do not reflect any transaction costs. Therefore, the second line of the table is useful in comparing ongoing costs only, and will not help you determine the relative total costs of owning different funds. In addition, if these transactional costs were included, your costs would have been higher.
| Annualized
Expense Ratio | Beginning
Account Value
May 1, 2011 | Ending
Account Value
October 31, 2011 | Expenses Paid
During Period*
May 1, 2011 to
October 31, 2011 |
| | | | |
Actual | .81% | $ 1,000.00 | $ 834.70 | $ 3.75 |
Hypothetical (5% return per year before expenses) | | $ 1,000.00 | $ 1,021.12 | $ 4.13 |
* Expenses are equal to the Fund's annualized expense ratio, multiplied by the average account value over the period, multiplied by 184/365 (to reflect the one-half year period).
Annual Report
Fidelity Emerging Asia Fund
Investment Changes (Unaudited)
Geographic Diversification (% of fund's net assets) |
As of October 31, 2011 |
| Korea (South) | 25.6% | |
| Hong Kong | 18.2% | |
| China | 11.8% | |
| Taiwan | 10.8% | |
| India | 8.0% | |
| Thailand | 6.6% | |
| Singapore | 5.8% | |
| Cayman Islands | 3.4% | |
| Indonesia | 3.3% | |
| Other | 6.5% | |

Percentages are adjusted for the effect of futures contracts, if applicable. |
As of April 30, 2011 |
| Korea (South) | 21.0% | |
| China | 16.8% | |
| Taiwan | 16.4% | |
| Hong Kong | 11.7% | |
| India | 8.4% | |
| Thailand | 5.4% | |
| Singapore | 4.8% | |
| Cayman Islands | 4.3% | |
| Indonesia | 3.5% | |
| Other | 7.7% | |

Percentages are adjusted for the effect of futures contracts, if applicable. |
Asset Allocation |
| % of fund's
net assets | % of fund's net assets
6 months ago |
Stocks | 98.8 | 98.4 |
Short-Term Investments and Net Other Assets | 1.2 | 1.6 |
Top Ten Stocks as of October 31, 2011 |
| % of fund's
net assets | % of fund's net assets
6 months ago |
Samsung Electronics Co. Ltd. (Korea (South), Semiconductors & Semiconductor Equipment) | 5.7 | 4.2 |
Taiwan Semiconductor Manufacturing Co. Ltd. (Taiwan, Semiconductors & Semiconductor Equipment) | 3.9 | 3.4 |
China Mobile (Hong Kong) Ltd. (Hong Kong, Wireless Telecommunication Services) | 3.3 | 0.0 |
CNOOC Ltd. (Hong Kong, Oil, Gas & Consumable Fuels) | 2.6 | 1.9 |
POSCO (Korea (South), Metals & Mining) | 2.5 | 0.0 |
Sun Hung Kai Properties Ltd. (Hong Kong, Real Estate Management & Development) | 2.4 | 0.0 |
China Construction Bank Corp. (H Shares) (China, Commercial Banks) | 2.3 | 2.1 |
Power Assets Holdings Ltd. (Hong Kong, Electric Utilities) | 1.9 | 1.5 |
Industrial & Commercial Bank of China Ltd. (H Shares) (China, Commercial Banks) | 1.8 | 2.7 |
Housing Development Finance Corp. Ltd. (India, Thrifts & Mortgage Finance) | 1.5 | 0.0 |
| 27.9 | |
Market Sectors as of October 31, 2011 |
| % of fund's
net assets | % of fund's net assets
6 months ago |
Financials | 29.4 | 30.7 |
Information Technology | 17.2 | 17.1 |
Consumer Discretionary | 10.4 | 8.3 |
Industrials | 10.3 | 11.7 |
Materials | 8.6 | 10.4 |
Energy | 7.3 | 7.6 |
Telecommunication Services | 6.7 | 5.3 |
Consumer Staples | 5.0 | 3.5 |
Utilities | 3.6 | 3.6 |
Health Care | 0.3 | 0.2 |
Annual Report
Fidelity Emerging Asia Fund
Investments October 31, 2011
Showing Percentage of Net Assets
Common Stocks - 98.8% |
| Shares | | Value |
Australia - 0.2% |
Origin Energy Ltd. | 175,759 | | $ 2,648,838 |
Bailiwick of Jersey - 0.0% |
WNS Holdings Ltd. sponsored ADR (a) | 49,934 | | 604,201 |
Bermuda - 1.5% |
Cheung Kong Infrastructure Holdings Ltd. | 609,000 | | 3,262,241 |
China Oil & Gas Group Ltd. (a) | 3,500,000 | | 234,863 |
China Yurun Food Group Ltd. | 1,942,000 | | 3,370,727 |
CNPC (Hong Kong) Ltd. | 1,048,000 | | 1,468,020 |
First Pacific Co. Ltd. | 3,284,000 | | 3,421,294 |
Jardine Matheson Holdings Ltd. | 66,000 | | 3,326,307 |
Man Wah Holdings Ltd. | 859,200 | | 478,428 |
Noble Group Ltd. | 4,152,000 | | 5,067,771 |
PAX Global Technology Ltd. | 1,644,000 | | 346,464 |
Skyworth Digital Holdings Ltd. | 4,660,000 | | 2,462,417 |
TOTAL BERMUDA | | 23,438,532 |
Cayman Islands - 3.4% |
AirMedia Group, Inc. ADR (a) | 178,300 | | 484,976 |
Belle International Holdings Ltd. | 4,105,000 | | 8,050,836 |
Biostime International Holdings Ltd. | 1,191,000 | | 2,123,890 |
Changyou.com Ltd. (A Shares) ADR (a) | 36,300 | | 955,779 |
Chaoda Modern Agriculture (Holdings) Ltd. | 14,220,000 | | 2,013,438 |
China Resources Land Ltd. | 3,696,000 | | 5,409,821 |
China Shanshui Cement Group Ltd. | 2,466,000 | | 1,888,897 |
Haitian International Holdings Ltd. | 2,228,000 | | 1,979,567 |
Hidili Industry International Development Ltd. | 3,832,000 | | 1,604,936 |
International Taifeng Holdings Ltd. | 5,160,000 | | 2,411,557 |
Maoye International Holdings Ltd. (a) | 10,421,000 | | 2,862,816 |
New Oriental Education & Technology Group, Inc. sponsored ADR (a) | 32,600 | | 966,264 |
Qihoo 360 Technology Co. Ltd. ADR | 24,900 | | 503,229 |
Sands China Ltd. (a) | 3,076,400 | | 9,245,160 |
Shenguan Holdings Group Ltd. | 3,450,000 | | 1,853,532 |
Spreadtrum Communications, Inc. ADR | 165,800 | | 4,405,306 |
Springland International Holdings Ltd. | 1,680,000 | | 1,138,184 |
Yingde Gases Group Co. Ltd. | 740,500 | | 789,697 |
Youyuan International Holdings Ltd. (a) | 7,891,000 | | 2,458,623 |
TOTAL CAYMAN ISLANDS | | 51,146,508 |
China - 11.8% |
51job, Inc. sponsored ADR (a) | 27,600 | | 1,274,568 |
Baidu.com, Inc. sponsored ADR (a) | 73,000 | | 10,233,140 |
Changsha Zoomlion Heavy Industry Science & Technology Development Co. Ltd. (H Shares) | 2,214,000 | | 3,203,178 |
China Coal Energy Co. Ltd. (H Shares) | 6,751,000 | | 8,408,564 |
China Communications Construction Co. Ltd. (H Shares) | 7,548,000 | | 5,693,127 |
China Communications Services Corp. Ltd. (H Shares) | 10,340,000 | | 4,768,664 |
|
| Shares | | Value |
China Construction Bank Corp. (H Shares) | 47,081,000 | | $ 34,592,071 |
China Eastern Airlines Corp. Ltd.
(H Shares) (a) | 2,718,000 | | 1,069,374 |
China Metal Recycling (Holdings) Ltd. | 3,972,600 | | 4,253,451 |
China Minsheng Banking Corp. Ltd. (H Shares) | 10,408,000 | | 8,478,553 |
China National Building Materials Co. Ltd. (H Shares) | 3,298,000 | | 4,224,427 |
China Pacific Insurance Group Co. Ltd. (H Shares) | 1,843,200 | | 5,656,208 |
China Petroleum & Chemical Corp. (H Shares) | 16,644,000 | | 15,740,735 |
China Southern Airlines Ltd. (H Shares) (a) | 6,578,000 | | 3,670,921 |
Comba Telecom Systems Holdings Ltd. | 1,771,000 | | 1,495,361 |
Focus Media Holding Ltd. ADR (a) | 104,700 | | 2,845,746 |
Great Wall Motor Co. Ltd. (H Shares) | 5,916,000 | | 8,033,409 |
Harbin Power Equipment Co. Ltd. (H Shares) | 6,928,000 | | 6,981,608 |
Industrial & Commercial Bank of China Ltd. (H Shares) | 44,905,000 | | 28,041,522 |
PICC Property & Casualty Co. Ltd. (H Shares) | 4,884,000 | | 6,773,176 |
Shanghai Jin Jiang International Hotel Co. Ltd. (H Shares) | 5,198,000 | | 668,414 |
Sinopec Shanghai Petrochemical Co. Ltd. (H Shares) | 6,950,000 | | 2,551,687 |
Tianneng Power International Ltd. | 1,118,000 | | 523,599 |
Yanzhou Coal Mining Co. Ltd. (H Shares) | 2,366,000 | | 5,856,545 |
Zhongpin, Inc. (a)(d) | 126,900 | | 1,171,287 |
Zijin Mining Group Co. Ltd. (H Shares) | 7,486,000 | | 3,186,264 |
TOTAL CHINA | | 179,395,599 |
Hong Kong - 18.2% |
AIA Group Ltd. | 7,359,200 | | 22,502,513 |
Cathay Pacific Airways Ltd. | 2,695,000 | | 4,891,890 |
China Insurance International Holdings Co. Ltd. (a) | 1,315,800 | | 2,853,391 |
China Merchant Holdings International Co. Ltd. | 1,744,000 | | 5,381,509 |
China Mobile (Hong Kong) Ltd. | 5,277,500 | | 50,159,164 |
China Overseas Land & Investment Ltd. | 5,490,000 | | 10,158,642 |
China Unicom (Hong Kong) Ltd. | 5,742,000 | | 11,544,957 |
Citic Pacific Ltd. | 3,301,000 | | 5,965,802 |
CNOOC Ltd. | 21,297,000 | | 40,258,993 |
Dah Chong Hong Holdings Ltd. | 2,200,000 | | 2,671,759 |
Galaxy Entertainment Group Ltd. (a) | 1,778,000 | | 3,595,711 |
Giordano International Ltd. | 1,528,000 | | 1,152,546 |
Guangdong Investment Ltd. | 12,772,000 | | 7,688,559 |
Hang Lung Group Ltd. | 835,000 | | 5,074,699 |
Hysan Development Co. Ltd. | 1,233,313 | | 4,303,739 |
Lenovo Group Ltd. | 12,248,000 | | 8,234,385 |
MTR Corp. Ltd. | 2,170,500 | | 7,006,328 |
New World Development Co. Ltd. | 5,526,000 | | 5,821,385 |
New World Development Co. Ltd. rights 11/22/11 (a) | 2,763,000 | | 942,481 |
Common Stocks - continued |
| Shares | | Value |
Hong Kong - continued |
PCCW Ltd. | 25,232,000 | | $ 10,083,181 |
Power Assets Holdings Ltd. | 3,820,500 | | 29,031,253 |
Singamas Container Holdings Ltd. | 946,000 | | 219,120 |
Sinotruk Hong Kong Ltd. | 2,908,500 | | 1,710,359 |
Sun Hung Kai Properties Ltd. | 2,673,000 | | 36,803,945 |
TOTAL HONG KONG | | 278,056,311 |
India - 8.0% |
Apollo Tyres Ltd. | 1,157,964 | | 1,357,996 |
Axis Bank Ltd. | 462,400 | | 10,928,662 |
Bank of Baroda | 333,001 | | 5,250,625 |
Canara Bank | 433,924 | | 4,138,555 |
Deccan Chronicle Holdings Ltd. (a) | 972,884 | | 1,028,950 |
Dena Bank | 540,162 | | 889,549 |
Gateway Distriparks Ltd. | 447,814 | | 1,362,674 |
Grasim Industries Ltd. | 91,097 | | 4,837,815 |
HCL Infosystems Ltd. | 892,274 | | 1,185,004 |
Hindalco Industries Ltd. | 1,780,372 | | 4,921,793 |
Hindustan Petroleum Corp. Ltd. | 742,267 | | 5,023,954 |
Housing Development Finance Corp. Ltd. | 1,650,544 | | 23,227,823 |
ICSA (India) Ltd. | 492,574 | | 577,853 |
Indian Oil Corp. Ltd. | 778,930 | | 4,605,080 |
Indian Overseas Bank | 1,417,190 | | 2,970,018 |
Jubilant Life Sciences Ltd. | 190,075 | | 760,733 |
Page Industries Ltd. | 13,021 | | 677,619 |
Piramal Healthcare Ltd. | 252,126 | | 1,859,117 |
Ramky Infrastructure Ltd. | 239,799 | | 1,158,113 |
Sintex Industries Ltd. | 711,295 | | 1,710,316 |
SREI Infrastructure Finance Ltd. | 1,892,080 | | 1,380,942 |
State Bank of India | 255,869 | | 9,952,181 |
Tata Consultancy Services Ltd. | 840,976 | | 19,130,351 |
Tata Motors Ltd. Class A | 1,447,755 | | 3,164,594 |
Tata Steel Ltd. | 391,724 | | 3,857,469 |
Welspun Gujarat Stahl Rohren Ltd. | 458,520 | | 1,004,186 |
Yes Bank Ltd. | 874,950 | | 5,606,909 |
TOTAL INDIA | | 122,568,881 |
Indonesia - 3.3% |
PT Astra International Tbk | 1,995,000 | | 15,382,950 |
PT Bank Rakyat Indonesia Tbk | 24,453,000 | | 18,384,910 |
PT BISI International Tbk | 2,443,000 | | 278,172 |
PT Global Mediacom Tbk | 19,886,500 | | 1,785,331 |
PT Gudang Garam Tbk | 909,000 | | 5,966,562 |
PT Sampoerna Agro Tbk | 4,453,500 | | 1,506,586 |
PT Tower Bersama Infrastructure Tbk | 9,965,000 | | 2,319,188 |
PT Unilever Indonesia Tbk | 2,358,000 | | 4,145,288 |
TOTAL INDONESIA | | 49,768,987 |
Korea (South) - 25.6% |
BS Financial Group, Inc. (a) | 959,930 | | 10,525,607 |
Cheil Worldwide, Inc. | 505,680 | | 8,249,146 |
Chong Kun Dang Pharmaceutical Corp. | 116,860 | | 2,258,037 |
|
| Shares | | Value |
CJ CheilJedang Corp. | 30,029 | | $ 8,256,058 |
CJ Corp. | 79,657 | | 5,685,672 |
Daewoo Shipbuilding & Marine Engineering Co. Ltd. | 472,140 | | 11,566,907 |
DGB Financial Group Co. Ltd. (a) | 251,320 | | 3,117,140 |
Dongbu Insurance Co. Ltd. | 107,200 | | 4,496,218 |
Doosan Co. Ltd. | 40,904 | | 5,152,987 |
Hana Financial Group, Inc. | 519,960 | | 18,505,442 |
Hankook Tire Co. Ltd. | 123,280 | | 4,902,258 |
Hynix Semiconductor, Inc. | 572,230 | | 11,537,181 |
Hyundai Department Store Co. Ltd. | 30,043 | | 4,291,365 |
Hyundai Fire & Marine Insurance Co. Ltd. | 59,830 | | 1,725,964 |
Hyundai Heavy Industries Co. Ltd. | 77,975 | | 20,754,399 |
Hyundai Mobis | 63,958 | | 18,235,948 |
Hyundai Motor Co. | 54,150 | | 10,864,504 |
ICD Co. Ltd. (a) | 15,386 | | 697,671 |
Industrial Bank of Korea | 870,250 | | 11,382,283 |
KB Financial Group, Inc. | 374,330 | | 14,448,142 |
Kia Motors Corp. | 270,020 | | 17,246,910 |
Korea Electric Power Corp. (a) | 356,820 | | 7,960,269 |
Kyeryong Construction Industrial Co. Ltd. | 60,160 | | 790,520 |
LG International Corp. | 56,480 | | 2,484,369 |
Lotte Samkang Co. Ltd. | 5,211 | | 1,553,223 |
Lotte Shopping Co. Ltd. | 19,573 | | 6,998,599 |
MegaStudy Co. Ltd. | 37,089 | | 4,086,756 |
Nong Shim Co. Ltd. | 4,312 | | 841,813 |
Orion Corp. | 4,363 | | 2,331,950 |
POSCO | 111,159 | | 38,371,625 |
Samsung Electronics Co. Ltd. | 100,898 | | 86,535,152 |
Samsung Fire & Marine Insurance Co. Ltd. | 56,353 | | 11,937,929 |
Samsung Heavy Industries Ltd. | 302,080 | | 9,181,587 |
Shinsegae Co. Ltd. | 16,544 | | 4,145,290 |
SK Chemicals Co. Ltd. | 42,023 | | 2,678,395 |
SK Telecom Co. Ltd. | 89,410 | | 11,861,028 |
Sungwoo Hitech Co. Ltd. | 246,426 | | 4,052,727 |
Tong Yang Life Insurance Co. Ltd. | 124,950 | | 1,491,833 |
TOTAL KOREA (SOUTH) | | 391,202,904 |
Malaysia - 0.6% |
AirAsia Bhd | 2,103,400 | | 2,643,375 |
Genting Malaysia Bhd | 3,855,100 | | 4,795,624 |
Glomac Bhd | 3,231,800 | | 890,824 |
TOTAL MALAYSIA | | 8,329,823 |
Mauritius - 0.3% |
Golden Agri-Resources Ltd. | 9,462,000 | | 4,842,086 |
Papua New Guinea - 0.1% |
Oil Search Ltd. | 126,204 | | 861,071 |
Philippines - 1.0% |
Banco de Oro Universal Bank | 2,142,000 | | 2,828,535 |
Globe Telecom, Inc. | 160,250 | | 3,416,612 |
Common Stocks - continued |
| Shares | | Value |
Philippines - continued |
Manila Water Co., Inc. | 10,405,000 | | $ 4,734,537 |
Universal Robina Corp. | 4,374,000 | | 4,821,813 |
TOTAL PHILIPPINES | | 15,801,497 |
Singapore - 5.8% |
Avago Technologies Ltd. | 128,800 | | 4,349,576 |
City Developments Ltd. | 976,000 | | 8,413,664 |
DBS Group Holdings Ltd. | 1,302,000 | | 12,713,077 |
First Resources Ltd. | 3,573,000 | | 3,998,940 |
Keppel Corp. Ltd. | 2,223,900 | | 16,642,426 |
Mapletree Logistics Trust (REIT) | 2,817,000 | | 1,912,467 |
Sakari Resources Ltd. | 1,428,000 | | 2,666,515 |
SembCorp Industries Ltd. | 1,650,000 | | 5,437,958 |
United Overseas Bank Ltd. | 1,398,000 | | 18,953,638 |
UOL Group Ltd. | 800,000 | | 2,827,178 |
Wilmar International Ltd. | 2,070,000 | | 8,934,695 |
Yanlord Land Group Ltd. | 2,680,000 | | 2,174,019 |
TOTAL SINGAPORE | | 89,024,153 |
Taiwan - 10.8% |
Asia Cement Corp. | 5,839,100 | | 7,033,514 |
ASUSTeK Computer, Inc. | 1,010,000 | | 7,021,708 |
Catcher Technology Co. Ltd. | 685,000 | | 3,816,482 |
Chicony Electronics Co. Ltd. | 1,942,000 | | 3,245,076 |
Compal Electronics, Inc. | 7,312,000 | | 6,710,802 |
E.Sun Financial Holdings Co. Ltd. | 22,773,495 | | 11,349,733 |
EVA Airways Corp. | 7,124,100 | | 5,153,598 |
Far East Department Stores Co. Ltd. | 117,360 | | 179,434 |
Formosa Plastics Corp. | 7,029,000 | | 20,672,934 |
HIWIN Technologies Corp. | 294,000 | | 2,657,841 |
Hon Hai Precision Industry Co. Ltd. (Foxconn) | 2,676,700 | | 7,337,845 |
Insyde Software Corp. | 463,928 | | 2,053,536 |
King Slide Works Co. Ltd. | 323,400 | | 1,388,866 |
Quanta Computer, Inc. | 4,462,000 | | 8,780,499 |
Taichung Commercial Bank Co. Ltd. | 94,470 | | 31,791 |
Taishin Financial Holdings Co. Ltd. | 35,192,227 | | 14,901,025 |
Taiwan Semiconductor Manufacturing Co. Ltd. | 24,372,192 | | 59,392,025 |
Wistron Corp. | 2,442,170 | | 2,826,323 |
TOTAL TAIWAN | | 164,553,032 |
Thailand - 6.6% |
Advanced Info Service PCL (For. Reg.) | 2,000,700 | | 8,405,578 |
Asian Property Development PCL (For. Reg.) | 14,864,520 | | 2,172,610 |
Bangkok Life Assurance PCL NVDR | 932,300 | | 1,293,776 |
Banpu PCL NVDR unit | 742,400 | | 15,032,774 |
Big C Supercenter PCL unit | 325,800 | | 1,163,651 |
Bumrungrad Hospital PCL (For. Reg.) | 1,060,400 | | 1,357,007 |
C.P. Seven Eleven PCL (For. Reg.) | 2,449,800 | | 3,706,838 |
Charoen Pokphand Foods PCL (For. Reg.) | 6,433,500 | | 6,265,385 |
Glow Energy PCL (For. Reg.) | 1,360,500 | | 2,343,297 |
|
| Shares | | Value |
Indorama Ventures PCL (For. Reg.) | 2,429,600 | | $ 2,796,314 |
LPN Development PCL unit | 7,290,500 | | 2,374,723 |
PTT Global Chemical PCL
(For. Reg.) (a) | 2,747,338 | | 5,793,333 |
PTT PCL (For. Reg.) | 990,500 | | 9,757,779 |
Siam Cement PCL: | | | |
(For. Reg.) | 685,300 | | 8,216,462 |
NVDR unit | 533,300 | | 5,419,978 |
Siam Commercial Bank PCL (For. Reg.) | 3,174,300 | | 12,007,730 |
Siam Makro PCL (For. Reg.) | 619,300 | | 4,147,052 |
Supalai PCL (For. Reg.) | 5,888,500 | | 2,369,680 |
Thai Union Frozen Products PCL NVDR | 823,700 | | 1,412,472 |
Total Access Communication PCL unit | 1,610,900 | | 3,854,737 |
TOTAL THAILAND | | 99,891,176 |
United Kingdom - 0.5% |
HSBC Holdings PLC (Hong Kong) | 914,289 | | 7,986,625 |
United States of America - 1.1% |
China Natural Gas, Inc. (a)(d) | 84,700 | | 162,624 |
Citigroup, Inc. | 89,500 | | 2,827,305 |
Cognizant Technology Solutions Corp. Class A (a) | 135,800 | | 9,879,450 |
Freeport-McMoRan Copper & Gold, Inc. | 90,000 | | 3,623,400 |
SORL Auto Parts, Inc. (a)(d) | 188,800 | | 624,928 |
TOTAL UNITED STATES OF AMERICA | | 17,117,707 |
TOTAL COMMON STOCKS (Cost $1,514,895,456) | 1,507,237,931 |
Money Market Funds - 0.7% |
| | | |
Fidelity Cash Central Fund, 0.12% (b) | 9,197,046 | | 9,197,046 |
Fidelity Securities Lending Cash Central Fund, 0.11% (b)(c) | 1,013,025 | | 1,013,025 |
TOTAL MONEY MARKET FUNDS (Cost $10,210,071) | 10,210,071 |
TOTAL INVESTMENT PORTFOLIO - 99.5% (Cost $1,525,105,527) | | 1,517,448,002 |
NET OTHER ASSETS (LIABILITIES) - 0.5% | | 8,187,214 |
NET ASSETS - 100% | $ 1,525,635,216 |
Legend |
(a) Non-income producing |
(b) Affiliated fund that is available only to investment companies and other accounts managed by Fidelity Investments. The rate quoted is the annualized seven-day yield of the fund at period end. A complete unaudited listing of the fund's holdings as of its most recent quarter end is available upon request. In addition, each Fidelity Central Fund's financial statements, which are not covered by the Fund's Report of Independent Registered Public Accounting Firm, are available on the SEC's website or upon request. |
(c) Investment made with cash collateral received from securities on loan. |
(d) Security or a portion of the security is on loan at period end. |
Affiliated Central Funds |
Information regarding fiscal year to date income earned by the Fund from investments in Fidelity Central Funds is as follows: |
Fund | Income earned |
Fidelity Cash Central Fund | $ 33,350 |
Fidelity Securities Lending Cash Central Fund | 638,535 |
Total | $ 671,885 |
Other Information |
The following is a summary of the inputs used, as of October 31, 2011, involving the Fund's assets and liabilities carried at fair value. The inputs or methodology used for valuing securities may not be an indication of the risk associated with investing in those securities. For more information on valuation inputs, and their aggregation into the levels used in the tables below, please refer to the Security Valuation section in the accompanying Notes to Financial Statements. |
Valuation Inputs at Reporting Date: |
Description | Total | Level 1 | Level 2 | Level 3 |
Investments in Securities: | | | | |
Equities: | | | | |
Korea (South) | $ 391,202,904 | $ - | $ 391,202,904 | $ - |
Hong Kong | 278,056,311 | - | 278,056,311 | - |
China | 179,395,599 | 15,524,741 | 163,870,858 | - |
Taiwan | 164,553,032 | - | 164,553,032 | - |
India | 122,568,881 | - | 122,568,881 | - |
Thailand | 99,891,176 | - | 99,891,176 | - |
Singapore | 89,024,153 | 4,349,576 | 84,674,577 | - |
Cayman Islands | 51,146,508 | 7,315,554 | 41,817,516 | 2,013,438 |
Indonesia | 49,768,987 | - | 49,768,987 | - |
United States of America | 17,117,707 | 16,955,083 | - | 162,624 |
Other | 64,512,673 | 16,405,698 | 48,106,975 | - |
Money Market Funds | 10,210,071 | 10,210,071 | - | - |
Total Investments in Securities: | $ 1,517,448,002 | $ 70,760,723 | $ 1,444,511,217 | $ 2,176,062 |
Transfers from Level 1 to Level 2 during the period were $645,690,870. |
The following is a reconciliation of Investments in Securities for which Level 3 inputs were used in determining value: |
Investments in Securities: | |
Beginning Balance | $ - |
Total Realized Gain (Loss) | 116,451 |
Total Unrealized Gain (Loss) | (9,538,078) |
Cost of Purchases | 4,602,371 |
Proceeds of Sales | (1,405,216) |
Amortization/Accretion | - |
Transfers in to Level 3 | 8,400,534 |
Transfers out of Level 3 | - |
Ending Balance | $ 2,176,062 |
The change in unrealized gain (loss) for the period attributable to Level 3 securities held at October 31, 2011 | $ (9,538,078) |
The information used in the above reconciliation represents fiscal year to date activity for any Investments in Securities identified as using Level 3 inputs at either the beginning or the end of the current fiscal period. Transfers in or out of Level 3 represent the beginning value of any Security or Instrument where a change in the pricing level occurred from the beginning to the end of the period. The cost of purchases and the proceeds of sales may include securities received or delivered through corporate actions or exchanges. Realized and unrealized gains (losses) disclosed in the reconciliation are included in Net Gain (Loss) on the Fund's Statement of Operations. |
Income Tax Information |
At October 31, 2011, the Fund had a capital loss carryforward of approximately $266,190,956 all of which will expire in fiscal 2017. Capital loss carryforwards are only available to offset future capital gains of the Fund to the extent provided by regulations and may be limited. |
See accompanying notes which are an integral part of the financial statements.
Annual Report
Fidelity Emerging Asia Fund
Statement of Assets and Liabilities
| October 31, 2011 |
| | |
Assets | | |
Investment in securities, at value (including securities loaned of $948,442) - See accompanying schedule: Unaffiliated issuers (cost $1,514,895,456) | $ 1,507,237,931 | |
Fidelity Central Funds (cost $10,210,071) | 10,210,071 | |
Total Investments (cost $1,525,105,527) | | $ 1,517,448,002 |
Foreign currency held at value (cost $20,780) | | 20,902 |
Receivable for investments sold | | 17,688,688 |
Receivable for fund shares sold | | 1,339,192 |
Dividends receivable | | 440,351 |
Distributions receivable from Fidelity Central Funds | | 88,998 |
Prepaid expenses | | 6,646 |
Other receivables | | 759,337 |
Total assets | | 1,537,792,116 |
| | |
Liabilities | | |
Payable for investments purchased | $ 7,317,583 | |
Payable for fund shares redeemed | 2,669,385 | |
Accrued management fee | 577,704 | |
Other affiliated payables | 356,964 | |
Other payables and accrued expenses | 222,239 | |
Collateral on securities loaned, at value | 1,013,025 | |
Total liabilities | | 12,156,900 |
| | |
Net Assets | | $ 1,525,635,216 |
Net Assets consist of: | | |
Paid in capital | | $ 1,778,202,132 |
Undistributed net investment income | | 24,561,036 |
Accumulated undistributed net realized gain (loss) on investments and foreign currency transactions | | (269,408,157) |
Net unrealized appreciation (depreciation) on investments and assets and liabilities in foreign currencies | | (7,719,795) |
Net Assets, for 55,842,557 shares outstanding | | $ 1,525,635,216 |
Net Asset Value, offering price and redemption price per share ($1,525,635,216 ÷ 55,842,557 shares) | | $ 27.32 |
Statement of Operations
| Year ended October 31, 2011 |
| | |
Investment Income | | |
Dividends | | $ 48,327,588 |
Interest | | 580 |
Income from Fidelity Central Funds | | 671,885 |
Income before foreign taxes withheld | | 49,000,053 |
Less foreign taxes withheld | | (5,646,012) |
Total income | | 43,354,041 |
| | |
Expenses | | |
Management fee
Basic fee | $ 12,451,843 | |
Performance adjustment | (3,775,439) | |
Transfer agent fees | 3,989,582 | |
Accounting and security lending fees | 784,500 | |
Custodian fees and expenses | 967,166 | |
Independent trustees' compensation | 9,758 | |
Registration fees | 66,855 | |
Audit | 91,474 | |
Legal | 8,042 | |
Interest | 3,613 | |
Miscellaneous | (121,698) | |
Total expenses before reductions | 14,475,696 | |
Expense reductions | (679,633) | 13,796,063 |
Net investment income (loss) | | 29,557,978 |
Realized and Unrealized Gain (Loss) Net realized gain (loss) on: | | |
Investment securities: | | |
Unaffiliated issuers | 149,101,694 | |
Foreign currency transactions | (1,130,378) | |
Futures contracts | (2,107,940) | |
Total net realized gain (loss) | | 145,863,376 |
Change in net unrealized appreciation (depreciation) on: Investment securities (net of decrease in deferred foreign taxes of $490,151) | (283,629,017) | |
Assets and liabilities in foreign currencies | (12,596) | |
Total change in net unrealized appreciation (depreciation) | | (283,641,613) |
Net gain (loss) | | (137,778,237) |
Net increase (decrease) in net assets resulting from operations | | $ (108,220,259) |
See accompanying notes which are an integral part of the financial statements.
Annual Report
Fund Name
Financial Statements - continued
Statement of Changes in Net Assets
| Year ended
October 31,
2011 | Year ended
October 31,
2010 |
Increase (Decrease) in Net Assets | | |
Operations | | |
Net investment income (loss) | $ 29,557,978 | $ 25,364,629 |
Net realized gain (loss) | 145,863,376 | 143,512,811 |
Change in net unrealized appreciation (depreciation) | (283,641,613) | 237,384,013 |
Net increase (decrease) in net assets resulting from operations | (108,220,259) | 406,261,453 |
Distributions to shareholders from net investment income | (28,179,915) | (30,524,290) |
Distributions to shareholders from net realized gain | (6,100,808) | (28,589,443) |
Total distributions | (34,280,723) | (59,113,733) |
Share transactions - net increase (decrease) | (49,864,171) | (368,409,021) |
Redemption fees | 438,078 | 282,689 |
Total increase (decrease) in net assets | (191,927,075) | (20,978,612) |
| | |
Net Assets | | |
Beginning of period | 1,717,562,291 | 1,738,540,903 |
End of period (including undistributed net investment income of $24,561,036 and undistributed net investment income of $24,288,225, respectively) | $ 1,525,635,216 | $ 1,717,562,291 |
Financial Highlights
Years ended October 31, | 2011 | 2010 | 2009 | 2008 | 2007 |
Selected Per-Share Data | | | | | |
Net asset value, beginning of period | $ 29.70 | $ 23.98 | $ 18.50 | $ 49.39 | $ 25.59 |
Income from Investment Operations | | | | | |
Net investment income (loss) B | .50 | .39 | .58 E | .44 | .33 |
Net realized and unrealized gain (loss) | (2.30) | 6.16 | 5.09 | (28.21) | 24.95 |
Total from investment operations | (1.80) | 6.55 | 5.67 | (27.77) | 25.28 |
Distributions from net investment income | (.49) | (.43) | (.20) | (.28) | (.23) |
Distributions from net realized gain | (.11) | (.40) | - | (2.89) | (1.29) |
Total distributions | (.59) H | (.83) | (.20) | (3.17) | (1.52) |
Redemption fees added to paid in capital B | .01 | - G | .01 | .05 | .04 |
Net asset value, end of period | $ 27.32 | $ 29.70 | $ 23.98 | $ 18.50 | $ 49.39 |
Total Return A | (6.20)% | 27.93% | 31.08% | (59.64)% | 104.22% |
Ratios to Average Net Assets C,F | | | | | |
Expenses before reductions | .82% | .78% | 1.14% | 1.18% | 1.08% |
Expenses net of fee waivers, if any | .82% | .78% | 1.14% | 1.18% | 1.08% |
Expenses net of all reductions | .78% | .74% | .99% | 1.04% | .98% |
Net investment income (loss) | 1.68% | 1.50% | 2.86% E | 1.34% | .96% |
Supplemental Data | | | | | |
Net assets, end of period (000 omitted) | $ 1,525,635 | $ 1,717,562 | $ 1,736,852 | $ 1,605,632 | $ 6,293,936 |
Portfolio turnover rate D | 115% | 105% | 220% | 147% | 72% |
A Total returns would have been lower if certain expenses had not been reduced during the applicable periods shown. B Calculated based on average shares outstanding during the period. C Fees and expenses of any underlying Fidelity Central Funds are not included in the Fund's expense ratio. The Fund indirectly bears its proportionate share of the expenses of any underlying Fidelity Central Funds. D Amount does not include the portfolio activity of any underlying Fidelity Central Funds. E Investment income per share reflects a special dividend which amounted to $.16 per share. Excluding the special dividend, the ratio of net investment income (loss) to average net assets would have been 2.09%. F Expense ratios reflect operating expenses of the class. Expenses before reductions do not reflect amounts reimbursed by the investment adviser or reductions from brokerage service arrangements or reductions from other expense offset arrangements and do not represent the amount paid by the class during periods when reimbursements or reductions occur. Expenses net of fee waivers reflect expenses after reimbursement by the investment adviser but prior to reductions from brokerage service arrangements or other expense offset arrangements. Expenses net of all reductions represent the net expenses paid by the class. G Amount represents less than $.01 per share. H Total distributions of $.59 per share is comprised of distributions from net investment income of $.485 and distributions from net realized gain of $.105 per share. |
See accompanying notes which are an integral part of the financial statements.
Annual Report
Notes to Financial Statements
For the period ended October 31, 2011
1. Organization.
Fidelity Emerging Asia Fund (the Fund) (formerly Fidelity Southeast Asia Fund) is a fund of Fidelity Investment Trust (the Trust) and is authorized to issue an unlimited number of shares. The Trust is registered under the Investment Company Act of 1940, as amended (the 1940 Act), as an open-end management investment company organized as a Massachusetts business trust. The Fund offered Class F shares during the period June 26, 2009 through June 11, 2010 and all outstanding shares were redeemed by June 11, 2010. The Fund's investments in emerging markets can be subject to social, economic, regulatory, and political uncertainties and can be extremely volatile.
2. Investments in Fidelity Central Funds.
The Fund invests in Fidelity Central Funds, which are open-end investment companies available only to other investment companies and accounts managed by Fidelity Management & Research Company (FMR) and its affiliates. The Fund's Schedule of Investments lists each of the Fidelity Central Funds held as of period end, if any, as an investment of the Fund, but does not include the underlying holdings of each Fidelity Central Fund. As an Investing Fund, the Fund indirectly bears its proportionate share of the expenses of the underlying Fidelity Central Funds.
The Money Market Central Funds seek preservation of capital and current income and are managed by Fidelity Investments Money Management, Inc. (FIMM), an affiliate of FMR.
A complete unaudited list of holdings for each Fidelity Central Fund is available upon request or at the Securities and Exchange Commission (the SEC) web site at www.sec.gov. In addition, the financial statements of the Fidelity Central Funds, which are not covered by the Fund's Report of Independent Registered Public Accounting Firm are available on the SEC web site or upon request.
3. Significant Accounting Policies.
The financial statements have been prepared in conformity with accounting principles generally accepted in the United States of America (GAAP), which require management to make certain estimates and assumptions at the date of the financial statements. Actual results could differ from those estimates. Subsequent events, if any, through the date that the financial statements were issued have been evaluated in the preparation of the financial statements. The following summarizes the significant accounting policies of the Fund:
Security Valuation. Investments are valued as of 4:00 p.m. Eastern time on the last calendar day of the period. The Fund uses independent pricing services approved by the Board of Trustees to value its investments. When current market prices or quotations are not readily available or reliable, valuations may be determined in good faith in accordance with procedures adopted by the Board of Trustees. Factors used in determining value may include market or security specific events. The frequency with which these procedures are used cannot be predicted and they may be utilized to a significant extent. The value used for net asset value (NAV) calculation under these procedures may differ from published prices for the same securities.
The Fund categorizes the inputs to valuation techniques used to value its investments into a disclosure hierarchy consisting of three levels as shown below:
Level 1 - quoted prices in active markets for identical investments
Level 2 - other significant observable inputs (including quoted prices for similar investments, interest rates, prepayment speeds, etc.)
Level 3 - unobservable inputs (including the Fund's own assumptions based on the best information available)
Changes in valuation techniques may result in transfers in or out of an assigned level within the disclosure hierarchy. The aggregate value of investments by input level, as of October 31, 2011, as well as a roll forward of Level 3 securities, is included at the end of the Fund's Schedule of Investments. Valuation techniques used to value the Fund's investments by major category are as follows:
Equity securities, including restricted securities, for which market quotations are readily available, are valued at the last reported sale price or official closing price as reported by an independent pricing service on the primary market or exchange on which they are traded and are categorized as Level 1 in the hierarchy. In the event there were no sales during the day or closing prices are not available, securities are valued at the last quoted bid price or may be valued using the last available price and are generally categorized as Level 2 in the hierarchy. For foreign equity securities, when significant market or security specific events arise, comparisons to the valuation of American Depositary Receipts (ADRs), futures contracts, Exchange-traded funds (ETFs) and certain indexes as well as quoted prices for similar securities are used and are categorized as Level 2 in the hierarchy in these circumstances. Utilizing these techniques may result in transfers between Level 1 and Level 2. For restricted equity securities and private placements where observable inputs are limited, assumptions about market activity and risk are used and are categorized as Level 3 in the hierarchy.
Investments in open-end mutual funds, including the Fidelity Central Funds, are valued at their closing net asset value each business day and are categorized as Level 1 in the hierarchy.
Annual Report
3. Significant Accounting Policies - continued
Foreign Currency. The Fund may use foreign currency contracts to facilitate transactions in foreign-denominated securities. Gains and losses from these transactions may arise from changes in the value of the foreign currency or if the counterparties do not perform under the contracts' terms.
Foreign-denominated assets, including investment securities, and liabilities are translated into U.S. dollars at the exchange rate at period end. Purchases and sales of investment securities, income and dividends received and expenses denominated in foreign currencies are translated into U.S. dollars at the exchange rate in effect on the transaction date.
The effects of exchange rate fluctuations on investments are included with the net realized and unrealized gain (loss) on investment securities. Other foreign currency transactions resulting in realized and unrealized gain (loss) are disclosed separately.
Investment Transactions and Income. For financial reporting purposes, the Fund's investment holdings and NAV include trades executed through the end of the last business day of the period. The NAV per share for processing shareholder transactions is calculated as of the close of business of the New York Stock Exchange (NYSE), normally 4:00 p.m. Eastern time and includes trades executed through the end of the prior business day. Gains and losses on securities sold are determined on the basis of identified cost. Dividend income is recorded on the ex-dividend date, except for certain dividends from foreign securities where the ex-dividend date may have passed, which are recorded as soon as the Fund is informed of the ex-dividend date. Non-cash dividends included in dividend income, if any, are recorded at the fair market value of the securities received. Distributions received on securities that represent a return of capital or capital gain are recorded as a reduction of cost of investments and/or as a realized gain. The Fund estimates the components of distributions received that may be considered return of capital distributions or capital gain distributions. Interest income and distributions from the Fidelity Central Funds are accrued as earned. Interest income includes coupon interest and amortization of premium and accretion of discount on debt securities. Investment income is recorded net of foreign taxes withheld where recovery of such taxes is uncertain.
Expenses. Expenses directly attributable to a fund are charged to that fund. Expenses attributable to more than one fund are allocated among the respective funds on the basis of relative net assets or other appropriate methods. Expense estimates are accrued in the period to which they relate and adjustments are made when actual amounts are known.
Income Tax Information and Distributions to Shareholders. Each year, the Fund intends to qualify as a regulated investment company, including distributing substantially all of its taxable income and realized gains under Subchapter M of the Internal Revenue Code and filing its U.S. federal tax return. As a result, no provision for income taxes is required. As of October 31, 2011, the Fund did not have any unrecognized tax benefits in the financial statements. A fund's federal tax return is subject to examination by the Internal Revenue Service (IRS) for a period of three years. Foreign taxes are provided for based on the Fund's understanding of the tax rules and rates that exist in the foreign markets in which it invests.
Distributions are declared and recorded on the ex-dividend date. Income dividends and capital gain distributions are declared separately for each class. Income and capital gain distributions are determined in accordance with income tax regulations, which may differ from GAAP.
Capital accounts within the financial statements are adjusted for permanent book-tax differences. These adjustments have no impact on net assets or the results of operations. Temporary book-tax differences will reverse in a subsequent period.
Book-tax differences are primarily due to the foreign currency transactions, passive foreign investment companies (PFIC), futures transactions, certain foreign taxes, deferred trustees compensation, capital loss carryforwards and losses deferred due to wash sales.
The federal tax cost of investment securities and unrealized appreciation (depreciation) as of period end were as follows:
Gross unrealized appreciation | $ 133,360,110 |
Gross unrealized depreciation | (144,234,835) |
Net unrealized appreciation (depreciation) on securities and other investments | $ (10,874,725) |
| |
Tax Cost | $ 1,528,322,727 |
The tax-based components of distributable earnings as of period end were as follows:
Undistributed ordinary income | $ 24,561,364 |
Capital loss carryforward | $ (266,190,956) |
Net unrealized appreciation (depreciation) | $ (10,936,995) |
Annual Report
Notes to Financial Statements - continued
3. Significant Accounting Policies - continued
Income Tax Information and Distributions to Shareholders - continued
Under the recently enacted Regulated Investment Company Modernization Act of 2010 (the Act), the Fund will be permitted to carry forward capital losses incurred in taxable years beginning after December 22, 2010 for an unlimited period. However, any losses incurred during those future taxable years will be required to be utilized prior to any losses incurred in pre-enactment taxable years, which generally expire after eight years from when they are incurred. Additionally, post-enactment capital losses that are carried forward will retain their character as either short-term or long-term capital losses rather than being considered all short-term as under previous law. The Fund's first fiscal year end subject to the Act will be October 31, 2012.
The tax character of distributions paid was as follows:
| October 31, 2011 | October 31, 2010 |
Ordinary Income | $ 34,280,723 | $ 59,113,733 |
Short-Term Trading (Redemption) Fees. Shares held by investors in the Fund less than 90 days are subject to a redemption fee equal to 1.50% of the net asset value of shares redeemed. All redemption fees, which reduce the proceeds of the shareholder redemption, are retained by the Fund and accounted for as an addition to paid in capital.
New Accounting Pronouncement. In May 2011, the Financial Accounting Standards Board issued Accounting Standard Update No. 2011-04, Fair Value Measurement (Topic 820) - Amendments to Achieve Common Fair Value Measurement and Disclosure Requirements in U.S. GAAP and IFRSs. The update changes the wording used to describe the requirements in GAAP for measuring fair value and for disclosing information about fair value measurements. The update is effective during interim and annual periods beginning after December 15, 2011. Management is currently evaluating the impact of the update's adoption on the Fund's financial statement disclosures.
4. Derivative Instruments.
Risk Exposures and the Use of Derivative Instruments. The Fund used derivative instruments (derivatives), including futures contracts, in order to meet its investment objectives. The strategy is to use derivatives to increase returns and to manage exposure to certain risks as defined below. The success of any strategy involving derivatives depends on analysis of numerous economic factors, and if the strategies for investment do not work as intended, the Fund may not achieve its objectives.
The Fund's use of derivatives increased or decreased its exposure to the following risks:
Equity Risk | Equity risk relates to the fluctuations in the value of financial instruments as a result of changes in market prices (other than those arising from interest rate risk or foreign exchange risk), whether caused by factors specific to an individual investment, its issuer, or all factors affecting all instruments traded in a market or market segment. |
The Fund is also exposed to additional risks from investing in derivatives, such as liquidity risk and counterparty credit risk. Liquidity risk is the risk that the Fund will be unable to sell the derivative in the open market in a timely manner. Counterparty credit risk is the risk that the counterparty will not be able to fulfill its obligation to the Fund. The Fund's maximum risk of loss from counterparty credit risk is generally the aggregate unrealized appreciation and unpaid counterparty payments in excess of any collateral pledged by the counterparty to the Fund. Counterparty risk related to exchange-traded futures contracts is minimal because of the protection provided by the exchange on which they trade. Derivatives involve, to varying degrees, risk of loss in excess of the amounts recognized in the Statement of Assets and Liabilities.
Futures Contracts. A futures contract is an agreement between two parties to buy or sell a specified underlying instrument for a fixed price at a specified future date. The Fund used futures contracts to manage its exposure to the stock markets and to fluctuations in currency values.
Upon entering into a futures contract, a fund is required to deposit either cash or securities (initial margin) with a clearing broker in an amount equal to a certain percentage of the face value of the contract. Futures contracts are marked-to-market daily and subsequent payments (variation margin) are made or received by a fund depending on the daily fluctuations in the value of the futures contracts and are recorded as unrealized appreciation or (depreciation). This receivable and/or payable is included in daily variation margin on futures contracts in the Statement of Assets and Liabilities. Realized gain or (loss) is recorded upon the expiration or closing of a futures contract.
Certain risks arise upon entering into futures contracts, including the risk that an illiquid market limits the ability to close out a futures contract prior to settlement date. The underlying face amount at value of open futures contracts at period end, if any is shown in the Schedule of Investments under the caption "Futures Contracts." This amount reflects each contract's exposure to the underlying instrument at period end. Securities deposited to meet initial margin requirements are identified in the Schedule of Investments.
During the period the Fund recognized net realized gain (loss) of $(2,107,940) related to its investment in futures contracts. This amount is included in the Statement of Operations.
Annual Report
5. Purchases and Sales of Investments.
Purchases and sales of securities, other than short-term securities, aggregated $1,987,228,187 and $2,052,071,487, respectively.
6. Fees and Other Transactions with Affiliates.
Management Fee. FMR and its affiliates provide the Fund with investment management related services for which the Fund pays a monthly management fee. The management fee is the sum of an individual fund fee rate that is based on an annual rate of .45% of the Fund's average net assets and a group fee rate that averaged .26% during the period. The group fee rate is based upon the average net assets of all the mutual funds advised by FMR. The group fee rate decreases as assets under management increase and increases as assets under management decrease. In addition, the management fee is subject to a performance adjustment (up to a maximum of ± .20% of the Fund's average net assets over a 36 month performance period). The upward or downward adjustment to the management fee is based on the Fund's relative investment performance as compared to an appropriate benchmark index. For the period, the total annual management fee rate, including the performance adjustment, was .49% of the Fund's average net assets.
Transfer Agent Fees. Fidelity Investments Institutional Operations Company, Inc. (FIIOC), an affiliate of FMR, is the transfer, dividend disbursing and shareholder servicing agent. FIIOC receives account fees and asset-based fees that vary according to the account size and type of account. FIIOC pays for typesetting, printing and mailing of shareholder reports, except proxy statements. For the period, transfer agent fees were equivalent to an annualized rate of .23% of average net assets.
Accounting and Security Lending Fees. Fidelity Service Company, Inc. (FSC), an affiliate of FMR, maintains the Fund's accounting records. The accounting fee is based on the level of average net assets for the month. Under a separate contract, FSC administers the security lending program. The security lending fee is based on the number and duration of lending transactions.
Brokerage Commissions. The Fund placed a portion of its portfolio transactions with brokerage firms which are affiliates of the investment adviser. The commissions paid to these affiliated firms were $1,605 for the period.
Interfund Lending Program. Pursuant to an Exemptive Order issued by the SEC, the Fund, along with other registered investment companies having management contracts with FMR, may participate in an interfund lending program. This program provides an alternative credit facility allowing the funds to borrow from, or lend money to, other participating affiliated funds. At period end, there were no interfund loans outstanding. The Fund's activity in this program during the period for which loans were outstanding was as follows:
Borrower or Lender | Average Daily
Loan Balance | Weighted Average Interest Rate | Interest
Expense |
Borrower | $ 11,295,679 | .41% | $ 3,613 |
7. Committed Line of Credit.
The Fund participates with other funds managed by FMR or an affiliate in a $4.0 billion credit facility (the "line of credit") to be utilized for temporary or emergency purposes to fund shareholder redemptions or for other short-term liquidity purposes. The Fund has agreed to pay commitment fees on its pro-rata portion of the line of credit, which amounted to $5,462 and is reflected in Miscellaneous expenses on the Statement of Operations. During the period, there were no borrowings on this line of credit.
8. Security Lending.
The Fund lends portfolio securities through a lending agent from time to time in order to earn additional income. For equity securities, a lending agent is used and may loan securities to certain qualified borrowers, including Fidelity Capital Markets (FCM), a broker-dealer affiliated with the Fund. On the settlement date of the loan, the Fund receives collateral (in the form of U.S. Treasury obligations, letters of credit and/or cash) against the loaned securities and maintains collateral in an amount not less than 100% of the market value of the loaned securities during the period of the loan. The market value of the loaned securities is determined at the close of business of the Fund and any additional required collateral is delivered to the Fund on the next business day. If the borrower defaults on its obligation to return the securities loaned because of insolvency or other reasons, a fund could experience delays and costs in recovering the securities loaned or in gaining access to the collateral. Any cash collateral received is invested in the Fidelity Securities Lending Cash Central Fund. The value of loaned securities and cash collateral at period end are disclosed on the Fund's Statement of Assets and Liabilities. Security lending income represents the income earned on investing cash collateral, less rebates paid to borrowers and any lending agent fees associated with the loan, plus any premium payments received for lending certain types of securities. Security lending income is presented in the Statement of Operations as a component of income from Fidelity Central Funds. Total security lending income during the period amounted to $638,535, including $249 from securities loaned to FCM.
Annual Report
Notes to Financial Statements - continued
9. Expense Reductions.
Many of the brokers with whom FMR places trades on behalf of the Fund provided services to the Fund in addition to trade execution. These services included payments of certain expenses on behalf of the Fund totaling $679,632 for the period. In addition, through arrangements with the Fund's custodian, credits realized as a result of uninvested cash balances were used to reduce the Fund's expenses. During the period, these credits reduced the Fund's custody expenses by $1.
10. Distributions to Shareholders.
Distributions to shareholders of each class were as follows:
Years ended October 31, | 2011 | 2010A |
From net investment income | | |
Emerging Asia | $ 28,179,915 | $ 30,460,836 |
Class F | - | 63,454 |
Total | $ 28,179,915 | $ 30,524,290 |
From net realized gain | | |
Emerging Asia | $ 6,100,808 | $ 28,534,741 |
Class F | - | 54,702 |
Total | $ 6,100,808 | $ 28,589,443 |
A All Class F shares were redeemed on June 11, 2010.
11. Share Transactions.
Transactions for each class of shares were as follows:
| Shares | Dollars |
Years ended October 31, | 2011 | 2010 A | 2011 | 2010 A |
Emerging Asia | | | | |
Shares sold | 15,394,610 | 9,549,252 | $ 468,544,331 | $ 251,925,297 |
Reinvestment of distributions | 1,090,764 | 2,258,330 | 32,690,177 | 56,751,824 |
Shares redeemed | (18,480,637) | (26,400,169) | (551,098,679) | (675,382,094) |
Net increase (decrease) | (1,995,263) | (14,592,587) | $ (49,864,171) | $ (366,704,973) |
Class F | | | | |
Shares sold | - | 608,072 | $ - | $ 15,362,404 |
Reinvestment of distributions | - | 4,704 | - | 118,156 |
Shares redeemed | - | (683,167) | - | (17,184,608) |
Net increase (decrease) | - | (70,391) | $ - | $ (1,704,048) |
A All Class F shares were redeemed on June 11, 2010.
12. Other.
The Fund's organizational documents provide former and current trustees and officers with a limited indemnification against liabilities arising in connection with the performance of their duties to the Fund. In the normal course of business, the Fund may also enter into contracts that provide general indemnifications. The Fund's maximum exposure under these arrangements is unknown as this would be dependent on future claims that may be made against the Fund. The risk of material loss from such claims is considered remote.
Annual Report
Fidelity Emerging Markets Fund
Performance: The Bottom Line
Average annual total return reflects the change in the value of an investment, assuming reinvestment of the class' distributions from dividend income and capital gains (the profits earned upon the sale of securities that have grown in value, if any) and assuming a constant rate of performance each year. The $10,000 table and the fund's returns do not reflect the deduction of taxes that a shareholder would pay on fund distributions or the redemption of fund shares. During periods of reimbursement by Fidelity, a fund's total return will be greater than it would be had the reimbursement not occurred. How a fund did yesterday is no guarantee of how it will do tomorrow.
Average Annual Total Returns
Periods ended October 31, 2011 | Past 1
year | Past 5
years | Past 10
years |
Fidelity Emerging Markets Fund | -12.33% | 2.16% | 14.65% |
$10,000 Over 10 Years
Let's say hypothetically that $10,000 was invested in Fidelity Emerging Markets Fund, a class of the fund, on October 31, 2001. The chart shows how the value of your investment would have changed, and also shows how the MSCI Emerging Markets Index performed over the same period.
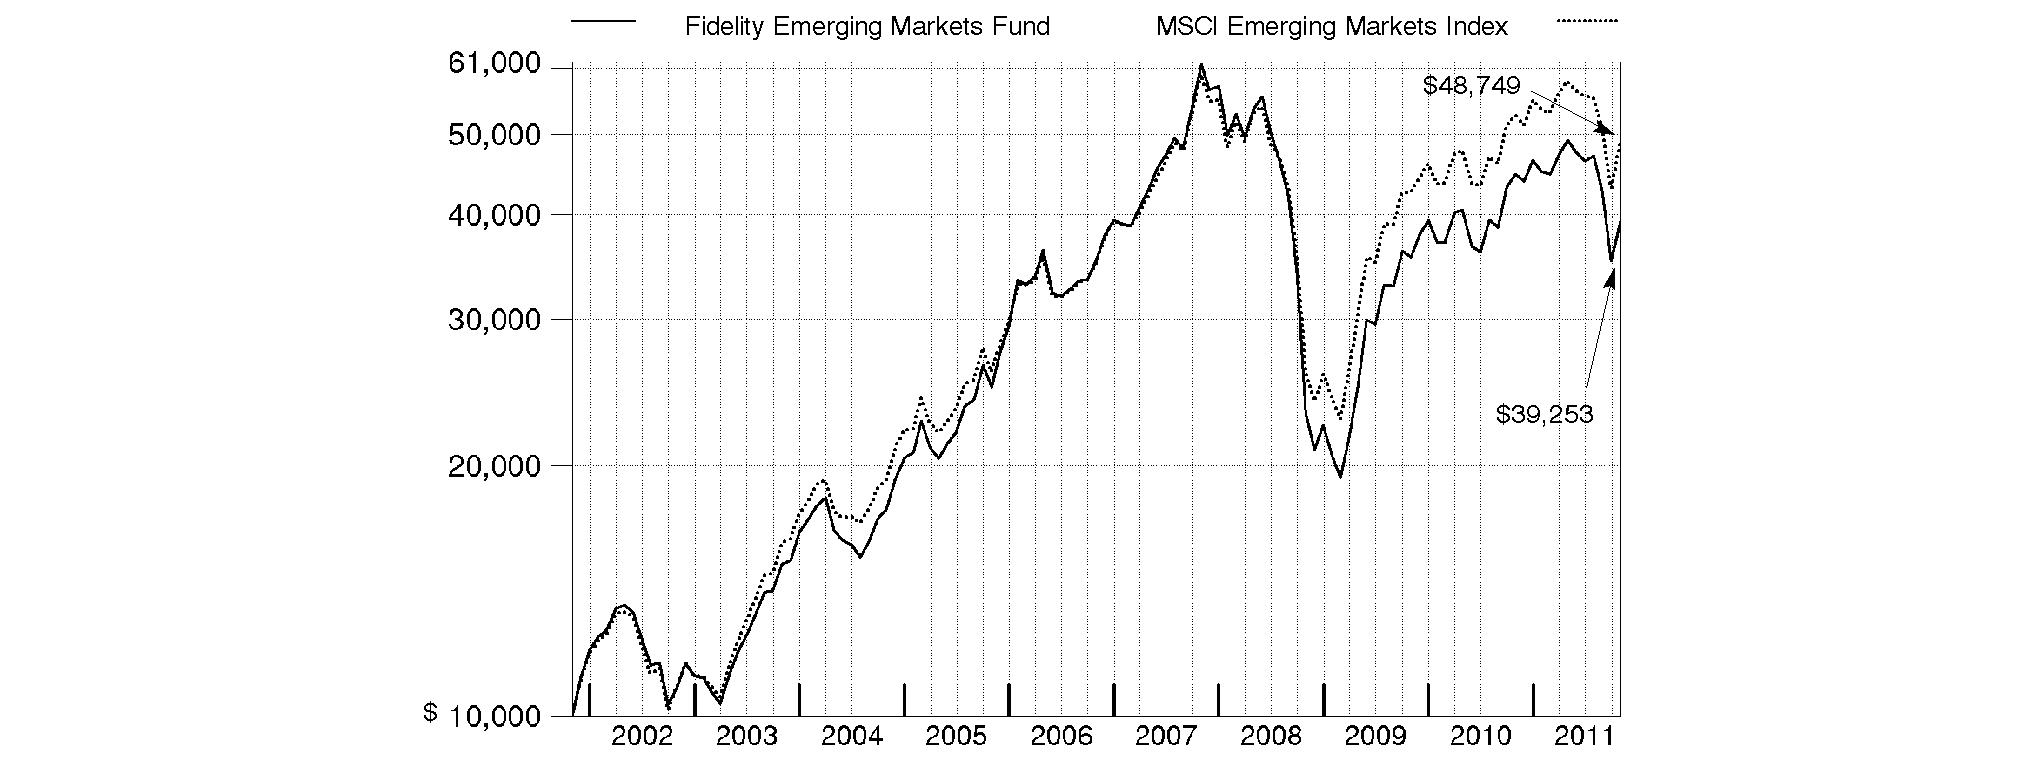
Annual Report
Fidelity Emerging Markets Fund
Market Recap: Emerging-markets stocks concluded the 12-month period ending October 31, 2011, on a strong note, reversing direction in October amid hope for a resolution to the sovereign debt crisis in Europe. The brief rally, on top of a robust first half of the period, could only partially offset the negative impact of a five-month downturn that began in May and intensified in August and September, as investors began to flee riskier securities due to the debt debacle, concern the U.S. economy may contract and worry about a significant slowdown in China. For the year, the MSCI® Emerging Markets Index declined 7.44%, hampered in part by global currency fluctuation. The index gained roughly 13% in October, after falling 9% in August and about 15% in September. For the full year, returns across the individual country components of the emerging-markets index were decidedly negative. Several of the largest countries in the index struggled, especially India (-20%), China (-17%) and Brazil (-12%), as did Turkey (-34%). Conversely, South Korea had the strongest result, gaining about 7%, while another sizable index component, Russia, returned roughly 1%. Smaller constituents Indonesia (+5%) and Malaysia (+4%) also finished in positive territory. A trio of countries had negative returns but outpaced the index: Mexico (-1%), Taiwan (-2%) and South Africa (-3%).
Comments from Robert von Rekowsky, Portfolio Manager of Fidelity® Emerging Markets Fund: During the year, the fund's Retail Class shares returned -12.33%, well behind the MSCI index. Relative performance was hurt the most by stock selection in energy, consumer staples and financials, followed by positioning in industrials and information technology. Geographically, security selection in China, India and South Africa weighed on the fund's results. Untimely ownership of wireless carrier and benchmark component China Mobile made it the fund's largest individual detractor. Similarly, underweighting Russian energy firm Gazprom when its stock was advancing early in the period dampened performance. Other key detractors were pork producer China Yurun Food Group - which I sold - and Turkish bank Turkiye Garanti Bankasi. Conversely, my picks in materials and positioning in the automobiles/components segment of consumer discretionary added value. Geographically, stock picking in Brazil and South Korea helped. Russian natural gas producer NOVATEK acquired additional acreage and added new customers, which bolstered its stock. Performance also benefited from Thai wireless carrier Advanced Info Service, as well as Korean automakers Kia Motors and Hyundai Motor.
The views expressed above reflect those of the portfolio manager(s) only through the end of the period as stated on the cover of this report and do not necessarily represent the views of Fidelity or any other person in the Fidelity organization. Any such views are subject to change at any time based upon market or other conditions and Fidelity disclaims any responsibility to update such views. These views may not be relied on as investment advice and, because investment decisions for a Fidelity fund are based on numerous factors, may not be relied on as an indication of trading intent on behalf of any Fidelity fund.
Annual Report
Fidelity Emerging Markets Fund
As a shareholder of the Fund, you incur two types of costs: (1) transaction costs, including redemption fees, and (2) ongoing costs, including management fees and other Fund expenses. This Example is intended to help you understand your ongoing costs (in dollars) of investing in the Fund and to compare these costs with the ongoing costs of investing in other mutual funds.
The Example is based on an investment of $1,000 invested at the beginning of the period and held for the entire period (May 1, 2011 to October 31, 2011).
Actual Expenses
The first line of the accompanying table for each class of the Fund provides information about actual account values and actual expenses. You may use the information in this line, together with the amount you invested, to estimate the expenses that you paid over the period. Simply divide your account value by $1,000.00 (for example, an $8,600 account value divided by $1,000.00 = 8.6), then multiply the result by the number in the first line for a class of the Fund under the heading entitled "Expenses Paid During Period" to estimate the expenses you paid on your account during this period. A small balance maintenance fee of $12.00 that is charged once a year may apply for certain accounts with a value of less than $2,000. This fee is not included in the table below. If it was, the estimate of expenses you paid during the period would be higher, and your ending account value lower, by this amount. In addition, the Fund, as a shareholder in the underlying Fidelity Central Funds, will indirectly bear its pro-rata share of the fees and expenses incurred by the underlying Fidelity Central Funds. These fees and expenses are not included in the Fund's annualized expense ratio used to calculate the expense estimate in the table below.
Hypothetical Example for Comparison Purposes
The second line of the accompanying table for each class of the Fund provides information about hypothetical account values and hypothetical expenses based on a Class' actual expense ratio and an assumed rate of return of 5% per year before expenses, which is not the Class' actual return. The hypothetical account values and expenses may not be used to estimate the actual ending account balance or expenses you paid for the period. You may use this information to compare the ongoing costs of investing in the Fund and other funds. To do so, compare this 5% hypothetical example with the 5% hypothetical examples that appear in the shareholder reports of the other funds. A small balance maintenance fee of $12.00 that is charged once a year may apply for certain accounts with a value of less than $2,000. This fee is not included in the table below. If it was, the estimate of expenses you paid during the period would be higher, and your ending account value lower, by this amount. In addition, the Fund, as a shareholder in the underlying Fidelity Central Funds, will indirectly bear its pro-rata share of the fees and expenses incurred by the underlying Fidelity Central Funds. These fees and expenses are not included in the Fund's annualized expense ratio used to calculate the expense estimate in the table below.
Please note that the expenses shown in the table are meant to highlight your ongoing costs only and do not reflect any transaction costs. Therefore, the second line of the table is useful in comparing ongoing costs only, and will not help you determine the relative total costs of owning different funds. In addition, if these transactional costs were included, your costs would have been higher.
| Annualized
Expense Ratio | Beginning
Account Value
May 1, 2011 | Ending
Account Value
October 31, 2011 | Expenses Paid
During Period*
May 1, 2011 to
October 31, 2011 |
Emerging Markets | 1.05% | | | |
Actual | | $ 1,000.00 | $ 798.50 | $ 4.76 |
Hypothetical A | | $ 1,000.00 | $ 1,019.91 | $ 5.35 |
Class K | .84% | | | |
Actual | | $ 1,000.00 | $ 799.40 | $ 3.81 |
Hypothetical A | | $ 1,000.00 | $ 1,020.97 | $ 4.28 |
A 5% return per year before expenses
* Expenses are equal to each Class' annualized expense ratio, multiplied by the average account value over the period, multiplied by 184/365 (to reflect the one-half year period).
Annual Report
Fidelity Emerging Markets Fund
Investment Changes (Unaudited)
Geographic Diversification (% of fund's net assets) |
As of October 31, 2011 |
| Korea (South) | 20.5% | |
| Brazil | 14.8% | |
| China | 7.9% | |
| Taiwan | 6.7% | |
| Russia | 5.9% | |
| Hong Kong | 5.6% | |
| Indonesia | 5.4% | |
| Thailand | 4.3% | |
| India | 4.3% | |
| Other | 24.6% | |

Percentages are adjusted for the effect of futures contracts, if applicable. |
As of April 30, 2011 |
| Korea (South) | 16.6% | |
| Brazil | 14.5% | |
| Taiwan | 10.6% | |
| Russia | 9.1% | |
| China | 8.7% | |
| South Africa | 5.1% | |
| Indonesia | 4.6% | |
| India | 4.5% | |
| Cayman Islands | 3.6% | |
| Other | 22.7% | |

Percentages are adjusted for the effect of futures contracts, if applicable. |
Asset Allocation |
| % of fund's
net assets | % of fund's net assets
6 months ago |
Stocks | 98.2 | 97.8 |
Short-Term Investments and Net Other Assets | 1.8 | 2.2 |
Top Ten Stocks as of October 31, 2011 |
| % of fund's
net assets | % of fund's net assets
6 months ago |
Samsung Electronics Co. Ltd. (Korea (South), Semiconductors & Semiconductor Equipment) | 4.3 | 2.5 |
China Mobile (Hong Kong) Ltd. (Hong Kong, Wireless Telecommunication Services) | 2.4 | 0.0 |
Hyundai Motor Co. (Korea (South), Automobiles) | 2.2 | 1.7 |
Banco Bradesco SA (PN) sponsored ADR (Brazil, Commercial Banks) | 2.1 | 1.5 |
Petroleo Brasileiro SA - Petrobras (PN) (Brazil, Oil, Gas & Consumable Fuels) | 2.0 | 2.1 |
CNOOC Ltd. (Hong Kong, Oil, Gas & Consumable Fuels) | 1.9 | 1.6 |
China Construction Bank Corp. (H Shares) (China, Commercial Banks) | 1.5 | 1.6 |
OAO NOVATEK GDR (Russia, Oil, Gas & Consumable Fuels) | 1.5 | 0.8 |
Taiwan Semiconductor Manufacturing Co. Ltd. (Taiwan, Semiconductors & Semiconductor Equipment) | 1.5 | 1.3 |
Vale SA (PN-A) sponsored ADR (Brazil, Metals & Mining) | 1.5 | 2.1 |
| 20.9 | |
Market Sectors as of October 31, 2011 |
| % of fund's
net assets | % of fund's net assets
6 months ago |
Financials | 23.3 | 23.8 |
Energy | 13.7 | 15.4 |
Information Technology | 11.5 | 13.4 |
Materials | 11.4 | 16.3 |
Consumer Discretionary | 10.7 | 8.2 |
Telecommunication Services | 9.1 | 5.6 |
Industrials | 7.7 | 6.7 |
Consumer Staples | 5.8 | 5.5 |
Utilities | 4.1 | 2.5 |
Health Care | 0.9 | 0.4 |
Annual Report
Fidelity Emerging Markets Fund
Investments October 31, 2011
Showing Percentage of Net Assets
Common Stocks - 98.2% |
| Shares | | Value |
Bailiwick of Jersey - 0.8% |
Randgold Resources Ltd. sponsored ADR | 236,900 | | $ 25,957,133 |
Bermuda - 1.5% |
Cheung Kong Infrastructure Holdings Ltd. | 3,450,000 | | 18,480,673 |
CNPC (Hong Kong) Ltd. | 11,710,000 | | 16,403,167 |
Great Eagle Holdings Ltd. | 3,869,888 | | 8,594,768 |
NWS Holdings Ltd. | 6,136,000 | | 9,304,472 |
TOTAL BERMUDA | | 52,783,080 |
Brazil - 14.8% |
Banco Bradesco SA (PN) sponsored ADR | 3,929,450 | | 71,515,990 |
Banco do Estado do Rio Grande do Sul SA | 1,982,300 | | 20,894,264 |
BR Malls Participacoes SA | 1,833,700 | | 19,808,488 |
Companhia de Bebidas das Americas (AmBev) (PN) sponsored ADR | 1,241,500 | | 41,863,380 |
Companhia de Saneamento Basico do Estado de Sao Paulo (SABESP) | 872,800 | | 23,939,483 |
Companhia de Saneamento de Minas Gerais | 308,900 | | 5,799,520 |
Eletropaulo Metropolitana SA (PN-B) | 1,139,200 | | 20,432,891 |
Embraer SA sponsored ADR | 526,400 | | 14,644,448 |
Gol Linhas Aereas Inteligentes SA sponsored ADR (d) | 2,014,300 | | 16,154,686 |
Klabin SA (PN) (non-vtg.) | 942,700 | | 3,469,522 |
Localiza Rent A Car SA | 397,500 | | 6,006,944 |
Marcopolo SA (PN) | 1,689,600 | | 7,477,848 |
Mills Estruturas e Servicos de Engenharia SA | 414,000 | | 4,134,696 |
Multiplus SA | 638,000 | | 10,774,517 |
OGX Petroleo e Gas Participacoes SA (a) | 4,250,600 | | 35,149,383 |
Petroleo Brasileiro SA - Petrobras: | | | |
(PN) (non-vtg.) | 778,300 | | 9,663,031 |
(PN) sponsored ADR (d) | 2,288,939 | | 57,887,267 |
Qualicorp SA | 656,400 | | 6,001,328 |
Tegma Gestao Logistica | 989,700 | | 12,852,498 |
Telefonica Brasil SA sponsored ADR (a) | 545,600 | | 15,833,312 |
TIM Participacoes SA sponsored ADR (d) | 1,252,433 | | 32,613,355 |
Ultrapar Participacoes SA | 1,053,900 | | 18,780,189 |
Vale SA (PN-A) sponsored ADR (d) | 2,104,698 | | 49,670,873 |
TOTAL BRAZIL | | 505,367,913 |
British Virgin Islands - 0.5% |
Mail.ru Group Ltd.: | | | |
GDR (a)(e) | 442,500 | | 15,244,125 |
GDR (Reg. S) | 40,000 | | 1,378,000 |
TOTAL BRITISH VIRGIN ISLANDS | | 16,622,125 |
Canada - 1.7% |
Eldorado Gold Corp. | 1,323,011 | | 24,858,300 |
First Quantum Minerals Ltd. | 902,200 | | 18,924,615 |
Petrominerales Ltd. | 535,800 | | 14,136,069 |
TOTAL CANADA | | 57,918,984 |
|
| Shares | | Value |
Cayman Islands - 3.4% |
Belle International Holdings Ltd. | 4,769,000 | | $ 9,353,091 |
Central China Real Estate Ltd. | 14,310,208 | | 3,231,432 |
China Shanshui Cement Group Ltd. | 24,730,000 | | 18,942,593 |
Country Garden Holdings Co. Ltd. | 36,851,000 | | 14,590,703 |
Eurasia Drilling Co. Ltd. GDR (Reg. S) | 808,700 | | 19,085,320 |
EVA Precision Industrial Holdings Ltd. | 37,790,000 | | 9,759,311 |
Haitian International Holdings Ltd. | 7,200,000 | | 6,397,165 |
Shenguan Holdings Group Ltd. | 20,996,000 | | 11,280,218 |
Silver Base Group Holdings Ltd. | 10,311,000 | | 10,981,105 |
SOHO China Ltd. | 19,398,500 | | 13,830,520 |
TOTAL CAYMAN ISLANDS | | 117,451,458 |
Chile - 1.1% |
CFR Pharmaceuticals SA | 61,972,153 | | 14,672,459 |
Empresa Nacional de Telecomunicaciones SA (ENTEL) | 1,068,744 | | 21,158,932 |
TOTAL CHILE | | 35,831,391 |
China - 7.9% |
Baidu.com, Inc. sponsored ADR (a) | 128,493 | | 18,012,149 |
China Communications Construction Co. Ltd. (H Shares) | 23,514,000 | | 17,735,585 |
China Communications Services Corp. Ltd. (H Shares) | 34,218,000 | | 15,780,865 |
China Construction Bank Corp. (H Shares) | 69,680,000 | | 51,196,353 |
China Minsheng Banking Corp. Ltd. (H Shares) | 34,434,500 | | 28,050,993 |
China National Building Materials Co. Ltd. (H Shares) | 11,408,000 | | 14,612,572 |
China Pacific Insurance Group Co. Ltd. (H Shares) | 3,380,000 | | 10,372,170 |
China Petroleum & Chemical Corp.: | | | |
(H Shares) | 17,218,000 | | 16,283,585 |
sponsored ADR (H Shares) (d) | 146,200 | | 13,801,280 |
China Southern Airlines Ltd. (H Shares) (a) | 25,102,000 | | 14,008,430 |
Great Wall Motor Co. Ltd. (H Shares) | 11,136,500 | | 15,122,391 |
Harbin Power Equipment Co. Ltd. (H Shares) | 18,078,000 | | 18,217,886 |
SINA Corp. (a)(d) | 116,700 | | 9,486,543 |
Sinopec Shanghai Petrochemical Co. Ltd. (H Shares) | 27,388,000 | | 10,055,483 |
Yantai Changyu Pioneer Wine Co. (B Shares) | 1,485,046 | | 16,708,233 |
TOTAL CHINA | | 269,444,518 |
Czech Republic - 1.7% |
Ceske Energeticke Zavody AS | 745,000 | | 31,506,316 |
Komercni Banka AS (d) | 77,600 | | 14,966,424 |
Philip Morris CR A/S | 14,961 | | 9,823,594 |
TOTAL CZECH REPUBLIC | | 56,296,334 |
Common Stocks - continued |
| Shares | | Value |
Egypt - 0.5% |
Commercial International Bank Ltd. sponsored GDR | 3,875,292 | | $ 17,121,040 |
Georgia - 0.2% |
Bank of Georgia GDR (Reg. S) | 480,001 | | 6,120,013 |
Hong Kong - 5.6% |
China Insurance International Holdings Co. Ltd. (a) | 7,614,400 | | 16,512,282 |
China Mobile (Hong Kong) Ltd. | 8,497,500 | | 80,763,144 |
China Power International Development Ltd. | 77,054,000 | | 16,304,575 |
CNOOC Ltd. | 28,270,000 | | 53,440,471 |
CNOOC Ltd. sponsored ADR | 66,600 | | 12,561,426 |
Dah Chong Hong Holdings Ltd. | 5,870,000 | | 7,128,738 |
Lenovo Group Ltd. | 6,000,000 | | 4,033,827 |
TOTAL HONG KONG | | 190,744,463 |
Hungary - 0.1% |
Magyar Telekom PLC | 1,380,700 | | 3,213,188 |
India - 4.3% |
Bank of Baroda | 1,412,618 | | 22,273,590 |
Bharti Airtel Ltd. | 2,706,596 | | 21,676,370 |
Housing Development Finance Corp. Ltd. | 2,541,720 | | 35,769,191 |
Indian Overseas Bank | 5,515,424 | | 11,558,726 |
ITC Ltd. | 3,000 | | 13,085 |
Jain Irrigation Systems Ltd. | 396,112 | | 1,009,312 |
Punjab National Bank | 357,790 | | 7,288,721 |
Tata Consultancy Services Ltd. | 1,174,258 | | 26,711,783 |
Tata Steel Ltd. | 763,513 | | 7,518,629 |
Ultratech Cement Ltd. | 551,743 | | 13,027,163 |
TOTAL INDIA | | 146,846,570 |
Indonesia - 5.4% |
PT Astra International Tbk | 5,076,500 | | 39,143,633 |
PT Bank Negara Indonesia (Persero) Tbk | 35,632,000 | | 15,968,902 |
PT Bank Rakyat Indonesia Tbk | 55,677,500 | | 41,860,950 |
PT Bank Tabungan Negara Tbk | 53,925,000 | | 8,680,322 |
PT Bumi Serpong Damai Tbk | 79,655,400 | | 8,196,748 |
PT Ciputra Development Tbk | 98,853,500 | | 5,420,035 |
PT Gadjah Tunggal Tbk | 18,599,500 | | 5,687,694 |
PT Indofood Sukses Makmur Tbk | 27,011,500 | | 16,034,011 |
PT Indosat Tbk | 26,279,700 | | 15,739,594 |
PT Summarecon Agung Tbk | 33,004,500 | | 4,319,137 |
PT Tower Bersama Infrastructure Tbk | 40,320,000 | | 9,383,810 |
PT XL Axiata Tbk | 26,029,500 | | 14,558,032 |
TOTAL INDONESIA | | 184,992,868 |
Israel - 0.5% |
Check Point Software Technologies Ltd. (a) | 269,700 | | 15,542,811 |
Kazakhstan - 0.5% |
KazMunaiGas Exploration & Production JSC (Reg. S) GDR | 1,026,911 | | 17,436,949 |
|
| Shares | | Value |
Korea (South) - 20.5% |
BS Financial Group, Inc. (a) | 1,415,610 | | $ 15,522,126 |
Cheil Worldwide, Inc. | 840,500 | | 13,711,056 |
CJ CheilJedang Corp. | 19,462 | | 5,350,808 |
CJ Corp. | 287,603 | | 20,528,220 |
Daum Communications Corp. | 84,360 | | 10,182,462 |
Doosan Co. Ltd. | 163,632 | | 20,613,962 |
GS Holdings Corp. | 374,573 | | 21,495,552 |
Hana Financial Group, Inc. | 877,450 | | 31,228,556 |
Hankook Tire Co. Ltd. | 297,050 | | 11,812,263 |
Hyundai Department Store Co. Ltd. | 149,034 | | 21,288,130 |
Hyundai Fire & Marine Insurance Co. Ltd. | 374,910 | | 10,815,329 |
Hyundai Heavy Industries Co. Ltd. | 116,377 | | 30,975,757 |
Hyundai Hysco Co. Ltd. | 363,390 | | 14,014,139 |
Hyundai Mobis | 125,135 | | 35,678,966 |
Hyundai Motor Co. | 364,582 | | 73,148,708 |
Industrial Bank of Korea | 2,000,080 | | 26,159,697 |
Kia Motors Corp. | 525,566 | | 33,569,327 |
Korea Zinc Co. Ltd. | 36,246 | | 10,584,368 |
KT&G Corp. | 552,295 | | 34,420,497 |
LG Chemical Ltd. | 40 | | 12,859 |
LIG Non-Life Insurance Co. Ltd. | 409,010 | | 8,674,196 |
Lotte Samkang Co. Ltd. | 13,049 | | 3,889,466 |
Nong Shim Co. Ltd. | 76,098 | | 14,856,286 |
Paradise Co. Ltd. | 1,823,471 | | 12,767,880 |
Samsung Card Co. Ltd. | 400,740 | | 14,960,937 |
Samsung Electronics Co. Ltd. | 171,704 | | 147,261,904 |
Shinhan Financial Group Co. Ltd. | 1,012,890 | | 40,200,111 |
SK Chemicals Co. Ltd. | 208,337 | | 13,278,653 |
TOTAL KOREA (SOUTH) | | 697,002,215 |
Luxembourg - 0.7% |
Millicom International Cellular SA (depositary receipt) | 217,800 | | 24,003,083 |
Malaysia - 0.7% |
Axiata Group Bhd | 14,916,300 | | 23,576,047 |
Mauritius - 0.0% |
Golden Agri-Resources Ltd. | 20,000 | | 10,235 |
Mexico - 0.3% |
Embotelladoras Arca SAB de CC | 2,439,900 | | 11,576,572 |
Netherlands - 0.2% |
Yandex NV | 260,800 | | 7,177,216 |
Nigeria - 0.4% |
Guaranty Trust Bank PLC GDR (Reg. S) | 2,921,542 | | 13,439,093 |
Panama - 0.5% |
Copa Holdings SA Class A | 251,300 | | 17,357,291 |
Peru - 0.8% |
Compania de Minas Buenaventura SA sponsored ADR | 626,941 | | 25,660,695 |
Philippines - 0.2% |
Globe Telecom, Inc. | 317,770 | | 6,775,019 |
Common Stocks - continued |
| Shares | | Value |
Poland - 0.7% |
Polska Grupa Energetyczna SA | 2,066,054 | | $ 12,732,568 |
TVN SA | 2,646,117 | | 10,591,457 |
TOTAL POLAND | | 23,324,025 |
Qatar - 0.1% |
Commercial Bank of Qatar GDR (Reg. S) | 463,393 | | 2,125,277 |
Russia - 5.9% |
Cherkizovo Group OJSC GDR (a) | 488,565 | | 6,813,728 |
Lukoil Oil Co. sponsored ADR | 675,221 | | 38,960,252 |
Mostotrest OAO (a) | 667,332 | | 3,836,000 |
Gazprom OAO sponsored ADR | 1,876,580 | | 21,787,094 |
NOVATEK OAO GDR | 360,758 | | 50,650,423 |
Rosneft Oil Co. OJSC GDR (Reg. S) | 1,212,900 | | 8,629,784 |
Sberbank of Russia (f) | 15,364,500 | | 41,692,026 |
TNK-BP Holding | 713,700 | | 1,952,700 |
Uralkali JSC GDR (Reg. S) | 581,400 | | 25,232,760 |
TOTAL RUSSIA | | 199,554,767 |
Singapore - 0.2% |
Sakari Resources Ltd. | 4,225,000 | | 7,889,375 |
Wilmar International Ltd. | 2,000 | | 8,633 |
TOTAL SINGAPORE | | 7,898,008 |
South Africa - 2.6% |
African Bank Investments Ltd. | 4,696,699 | | 20,381,577 |
Foschini Ltd. | 1,662,721 | | 20,980,165 |
Imperial Holdings Ltd. | 794,700 | | 11,765,842 |
Life Healthcare Group Holdings Ltd. | 5,279,500 | | 12,845,677 |
Mr Price Group Ltd. | 1,330,900 | | 12,812,111 |
Northam Platinum Ltd. | 2,277,300 | | 8,823,630 |
TOTAL SOUTH AFRICA | | 87,609,002 |
Taiwan - 6.7% |
Catcher Technology Co. Ltd. | 3,820,000 | | 21,283,155 |
Chroma ATE, Inc. | 4,069,786 | | 8,120,092 |
Formosa Chemicals & Fibre Corp. | 10,000 | | 28,941 |
Formosa Plastics Corp. | 9,830,000 | | 28,910,933 |
Hotai Motor Co. Ltd. | 414,000 | | 1,801,067 |
HTC Corp. | 1,105,305 | | 24,840,130 |
Kinsus Interconnect Technology Corp. | 3,034,000 | | 10,478,835 |
Leofoo Development Co. Ltd. (a) | 5,753,000 | | 3,786,567 |
President Chain Store Corp. | 3,024,000 | | 16,815,669 |
SIMPLO Technology Co. Ltd. | 1,341,900 | | 7,895,964 |
Taishin Financial Holdings Co. Ltd. | 62,126,146 | | 26,305,333 |
Taiwan Cement Corp. | 21,754,599 | | 27,168,905 |
Taiwan Semiconductor Manufacturing Co. Ltd. | 20,709,447 | | 50,466,367 |
TOTAL TAIWAN | | 227,901,958 |
|
| Shares | | Value |
Thailand - 4.3% |
Advanced Info Service PCL (For. Reg.) | 7,944,600 | | $ 33,377,793 |
Asian Property Development PCL (For. Reg.) | 54,389,540 | | 7,949,619 |
Bangkok Expressway PCL (For.Reg.) | 1,144,700 | | 604,381 |
Banpu PCL (For. Reg.) | 454,300 | | 9,222,464 |
Charoen Pokphand Foods PCL (For. Reg.) | 8,429,400 | | 8,209,130 |
Krung Thai Bank PCL (For. Reg.) | 22,145,500 | | 10,836,877 |
PTT Global Chemical PCL (For. Reg.) (a) | 1,402,718 | | 2,957,922 |
PTT PCL (For. Reg.) | 2,200,100 | | 21,673,993 |
Siam Cement PCL (For. Reg.) | 1,447,000 | | 17,348,927 |
Siam Commercial Bank PCL (For. Reg.) | 9,328,700 | | 35,288,571 |
Total Access Communication PCL (For. Reg.) | 105,200 | | 250,624 |
TOTAL THAILAND | | 147,720,301 |
Turkey - 1.5% |
Aygaz AS | 1,780,812 | | 9,728,627 |
Koc Holding AS | 2,227,630 | | 7,961,895 |
Tofas Turk Otomobil Fabrikasi AS | 2,747,735 | | 10,628,875 |
Turkiye Garanti Bankasi AS | 6,745,395 | | 23,803,911 |
TOTAL TURKEY | | 52,123,308 |
United Kingdom - 0.7% |
International Personal Finance PLC | 1,716,532 | | 7,569,364 |
Kazakhmys PLC | 1,130,800 | | 16,867,075 |
TOTAL UNITED KINGDOM | | 24,436,439 |
United States of America - 0.7% |
Cognizant Technology Solutions Corp. Class A (a) | 236,400 | | 17,198,100 |
Freeport-McMoRan Copper & Gold, Inc. | 164,500 | | 6,622,770 |
TOTAL UNITED STATES OF AMERICA | | 23,820,870 |
TOTAL COMMON STOCKS (Cost $3,014,558,536) | 3,342,782,259 |
Money Market Funds - 4.0% |
| Shares | | Value |
Fidelity Cash Central Fund, 0.12% (b) | 52,706,240 | | $ 52,706,240 |
Fidelity Securities Lending Cash Central Fund, 0.11% (b)(c) | 85,082,139 | | 85,082,139 |
TOTAL MONEY MARKET FUNDS (Cost $137,788,379) | 137,788,379 |
TOTAL INVESTMENT PORTFOLIO - 102.2% (Cost $3,152,346,915) | | 3,480,570,638 |
NET OTHER ASSETS (LIABILITIES) - (2.2)% | | (74,864,960) |
NET ASSETS - 100% | $ 3,405,705,678 |
Legend |
(a) Non-income producing |
(b) Affiliated fund that is available only to investment companies and other accounts managed by Fidelity Investments. The rate quoted is the annualized seven-day yield of the fund at period end. A complete unaudited listing of the fund's holdings as of its most recent quarter end is available upon request. In addition, each Fidelity Central Fund's financial statements, which are not covered by the Fund's Report of Independent Registered Public Accounting Firm, are available on the SEC's website or upon request. |
(c) Investment made with cash collateral received from securities on loan. |
(d) Security or a portion of the security is on loan at period end. |
(e) Security exempt from registration under Rule 144A of the Securities Act of 1933. These securities may be resold in transactions exempt from registration, normally to qualified institutional buyers. At the end of the period, the value of these securities amounted to $15,244,125 or 0.4% of net assets. |
(f) Security or a portion of the security purchased on a delayed delivery or when-issued basis. |
Affiliated Central Funds |
Information regarding fiscal year to date income earned by the Fund from investments in Fidelity Central Funds is as follows: |
Fund | Income earned |
Fidelity Cash Central Fund | $ 51,246 |
Fidelity Securities Lending Cash Central Fund | 1,194,501 |
Total | $ 1,245,747 |
Other Information |
The following is a summary of the inputs used, as of October 31, 2011, involving the Fund's assets and liabilities carried at fair value. The inputs or methodology used for valuing securities may not be an indication of the risk associated with investing in those securities. For more information on valuation inputs, and their aggregation into the levels used in the table below, please refer to the Security Valuation section in the accompanying Notes to Financial Statements. |
Valuation Inputs at Reporting Date: |
Description | Total | Level 1 | Level 2 | Level 3 |
Investments in Securities: | | | | |
Equities: | | | | |
Korea (South) | $ 697,002,215 | $ - | $ 697,002,215 | $ - |
Brazil | 505,367,913 | 505,367,913 | - | - |
China | 269,444,518 | 41,299,972 | 228,144,546 | - |
Taiwan | 227,901,958 | - | 227,901,958 | - |
Russia | 199,554,767 | 199,554,767 | - | - |
Hong Kong | 190,744,463 | 12,561,426 | 178,183,037 | - |
Indonesia | 184,992,868 | - | 184,992,868 | - |
Thailand | 147,720,301 | - | 147,720,301 | - |
India | 146,846,570 | - | 146,846,570 | - |
Other | 773,206,686 | 590,573,178 | 182,633,508 | - |
Money Market Funds | 137,788,379 | 137,788,379 | - | - |
Total Investments in Securities: | $ 3,480,570,638 | $ 1,487,145,635 | $ 1,993,425,003 | $ - |
Transfers from Level 1 to Level 2 during the period were $1,100,228,585. |
Income Tax Information |
At October 31, 2011, the Fund had a capital loss carryforward of approximately $300, 796,984 all of which will expire in fiscal 2017. Capital loss carryforwards are only available to offset future capital gains of the Fund to the extent provided by regulations and may be limited. |
See accompanying notes which are an integral part of the financial statements.
Annual Report
Fidelity Emerging Markets Fund
Statement of Assets and Liabilities
| October 31, 2011 |
| | |
Assets | | |
Investment in securities, at value (including securities loaned of $79,492,037) - See accompanying schedule: Unaffiliated issuers (cost $3,014,558,536) | $ 3,342,782,259 | |
Fidelity Central Funds (cost $137,788,379) | 137,788,379 | |
Total Investments (cost $3,152,346,915) | | $ 3,480,570,638 |
Cash | | 357,405 |
Foreign currency held at value (cost $4,182,807) | | 4,270,284 |
Receivable for investments sold | | 69,771,938 |
Receivable for fund shares sold | | 2,882,330 |
Dividends receivable | | 5,926,684 |
Distributions receivable from Fidelity Central Funds | | 15,956 |
Prepaid expenses | | 15,477 |
Other receivables | | 2,769,652 |
Total assets | | 3,566,580,364 |
| | |
Liabilities | | |
Regular delivery | | |
Payable for investments purchased | $ 64,620,126 | |
Delayed delivery | 1,292,781 | |
Payable for fund shares redeemed | 6,685,204 | |
Accrued management fee | 1,979,929 | |
Other affiliated payables | 812,583 | |
Other payables and accrued expenses | 401,924 | |
Collateral on securities loaned, at value | 85,082,139 | |
Total liabilities | | 160,874,686 |
| | |
Net Assets | | $ 3,405,705,678 |
Net Assets consist of: | | |
Paid in capital | | $ 3,393,247,624 |
Undistributed net investment income | | 36,916,001 |
Accumulated undistributed net realized gain (loss) on investments and foreign currency transactions | | (352,312,880) |
Net unrealized appreciation (depreciation) on investments and assets and liabilities in foreign currencies | | 327,854,933 |
Net Assets | | $ 3,405,705,678 |
Statement of Assets and Liabilities - continued
| October 31, 2011 |
| | |
Emerging Markets:
Net Asset Value, offering price and redemption price per share ($2,907,884,482 ÷ 130,829,897 shares) | | $ 22.23 |
| | |
Class K:
Net Asset Value, offering price and redemption price per share ($497,821,196 ÷ 22,393,784 shares) | | $ 22.23 |
See accompanying notes which are an integral part of the financial statements.
Annual Report
Fidelity Emerging Markets Fund
Financial Statements - continued
Statement of Operations
| Year ended October 31, 2011 |
| | |
Investment Income | | |
Dividends | | $ 118,482,469 |
Interest | | 30,085 |
Income from Fidelity Central Funds | | 1,245,747 |
Income before foreign taxes withheld | | 119,758,301 |
Less foreign taxes withheld | | (12,268,127) |
Total income | | 107,490,174 |
| | |
Expenses | | |
Management fee | $ 31,884,718 | |
Transfer agent fees | 9,712,570 | |
Accounting and security lending fees | 1,563,154 | |
Custodian fees and expenses | 2,995,129 | |
Independent trustees' compensation | 25,298 | |
Registration fees | 97,583 | |
Audit | 120,061 | |
Legal | 18,561 | |
Interest | 15,467 | |
Miscellaneous | 49,325 | |
Total expenses before reductions | 46,481,866 | |
Expense reductions | (2,922,454) | 43,559,412 |
Net investment income (loss) | | 63,930,762 |
Realized and Unrealized Gain (Loss) Net realized gain (loss) on: | | |
Investment securities: | | |
Unaffiliated issuers | 291,148,406 | |
Foreign currency transactions | (7,300,563) | |
Total net realized gain (loss) | | 283,847,843 |
Change in net unrealized appreciation (depreciation) on: Investment securities (net of decrease in deferred foreign taxes of $4,553,235) | (873,553,653) | |
Assets and liabilities in foreign currencies | (483,123) | |
Total change in net unrealized appreciation (depreciation) | | (874,036,776) |
Net gain (loss) | | (590,188,933) |
Net increase (decrease) in net assets resulting from operations | | $ (526,258,171) |
Statement of Changes in Net Assets
| Year ended
October 31,
2011 | Year ended
October 31,
2010 |
Increase (Decrease) in Net Assets | | |
Operations | | |
Net investment income (loss) | $ 63,930,762 | $ 44,633,525 |
Net realized gain (loss) | 283,847,843 | 524,250,063 |
Change in net unrealized appreciation (depreciation) | (874,036,776) | 400,552,581 |
Net increase (decrease) in net assets resulting from operations | (526,258,171) | 969,436,169 |
Distributions to shareholders from net investment income | (49,437,799) | (23,159,233) |
Distributions to shareholders from net realized gain | (24,690,435) | (26,416,955) |
Total distributions | (74,128,234) | (49,576,188) |
Share transactions - net increase (decrease) | (859,245,695) | 23,065,054 |
Redemption fees | 1,366,825 | 1,389,036 |
Total increase (decrease) in net assets | (1,458,265,275) | 944,314,071 |
| | |
Net Assets | | |
Beginning of period | 4,863,970,953 | 3,919,656,882 |
End of period (including undistributed net investment income of $36,916,001 and undistributed net investment income of $44,633,128, respectively) | $ 3,405,705,678 | $ 4,863,970,953 |
See accompanying notes which are an integral part of the financial statements.
Annual Report
Financial Highlights - Emerging Markets
Years ended October 31, | 2011 | 2010 | 2009 | 2008 | 2007 |
Selected Per-Share Data | | | | | |
Net asset value, beginning of period | $ 25.72 | $ 20.68 | $ 13.71 | $ 37.55 | $ 22.04 |
Income from Investment Operations | | | | | |
Net investment income (loss) B | .35 | .23 | .17 | .42 E | .25 |
Net realized and unrealized gain (loss) | (3.48) | 5.05 | 7.03 | (22.73) | 15.44 |
Total from investment operations | (3.13) | 5.28 | 7.20 | (22.31) | 15.69 |
Distributions from net investment income | (.24) | (.12) | (.24) | (.19) | (.20) |
Distributions from net realized gain | (.13) | (.14) | - | (1.37) | - |
Total distributions | (.37) | (.25) G | (.24) | (1.56) | (.20) |
Redemption fees added to paid in capital B | .01 | .01 | .01 | .03 | .02 |
Net asset value, end of period | $ 22.23 | $ 25.72 | $ 20.68 | $ 13.71 | $ 37.55 |
Total Return A | (12.33)% | 25.76% | 53.95% | (61.84)% | 71.81% |
Ratios to Average Net Assets C, F | | | | | |
Expenses before reductions | 1.07% | 1.14% | 1.16% | 1.07% | 1.05% |
Expenses net of fee waivers, if any | 1.07% | 1.14% | 1.16% | 1.07% | 1.05% |
Expenses net of all reductions | 1.01% | 1.09% | 1.10% | 1.02% | .99% |
Net investment income (loss) | 1.38% | 1.00% | 1.09% | 1.47% E | .89% |
Supplemental Data | | | | | |
Net assets, end of period (000 omitted) | $ 2,907,884 | $ 3,975,342 | $ 3,649,582 | $ 2,086,196 | $ 6,609,045 |
Portfolio turnover rate D | 122% | 85% | 88% | 63% | 52% |
A Total returns would have been lower if certain expenses had not been reduced during the applicable periods shown. B Calculated based on average shares outstanding during the period. C Fees and expenses of any underlying Fidelity Central Funds are not included in the Fund's expense ratio. The Fund indirectly bears its proportionate share of the expenses of any underlying Fidelity Central Funds. D Amount does not include the portfolio activity of any underlying Fidelity Central Funds. E Investment income per share reflects a special dividend which amounted to $.09 per share. Excluding the special dividend, the ratio of net investment income (loss) to average net assets would have been 1.17%. F Expense ratios reflect operating expenses of the class. Expenses before reductions do not reflect amounts reimbursed by the investment adviser or reductions from brokerage service arrangements or reductions from other expense offset arrangements and do not represent the amount paid by the class during periods when reimbursements or reductions occur. Expenses net of fee waivers reflect expenses after reimbursement by the investment adviser but prior to reductions from brokerage service arrangements or other expense offset arrangements. Expenses net of all reductions represent the net expenses paid by the class. G Total distributions of $.25 per share is comprised of distributions from net investment income of $.116 and distributions from net realized gain of $.135 per share. |
Financial Highlights - Class K
Years ended October 31, | 2011 | 2010 | 2009 | 2008 H |
Selected Per-Share Data | | | | |
Net asset value, beginning of period | $ 25.75 | $ 20.69 | $ 13.72 | $ 31.99 |
Income from Investment Operations | | | | |
Net investment income (loss) D | .40 | .28 | .22 | .15 G |
Net realized and unrealized gain (loss) | (3.48) | 5.05 | 7.02 | (18.43) |
Total from investment operations | (3.08) | 5.33 | 7.24 | (18.28) |
Distributions from net investment income | (.32) | (.15) | (.28) | - |
Distributions from net realized gain | (.13) | (.14) | - | - |
Total distributions | (.45) | (.28) J | (.28) | - |
Redemption fees added to paid in capital D | .01 | .01 | .01 | .01 |
Net asset value, end of period | $ 22.23 | $ 25.75 | $ 20.69 | $ 13.72 |
Total Return B, C | (12.17)% | 26.03% | 54.44% | (57.11)% |
Ratios to Average Net Assets E, I | | | | |
Expenses before reductions | .87% | .90% | .91% | .92% A |
Expenses net of fee waivers, if any | .87% | .90% | .91% | .92% A |
Expenses net of all reductions | .80% | .84% | .84% | .87% A |
Net investment income (loss) | 1.58% | 1.24% | 1.35% | 2.02% A, G |
Supplemental Data | | | | |
Net assets, end of period (000 omitted) | $ 497,821 | $ 888,629 | $ 270,075 | $ 87,427 |
Portfolio turnover rate F | 122% | 85% | 88% | 63% |
A Annualized B Total returns for periods of less than one year are not annualized. C Total returns would have been lower if certain expenses had not been reduced during the applicable periods shown. D Calculated based on average shares outstanding during the period. E Fees and expenses of any underlying Fidelity Central Funds are not included in the Fund's expense ratio. The Fund indirectly bears its proportionate share of the expenses of any underlying Fidelity Central Funds. F Amount does not include the portfolio activity of any underlying Fidelity Central Funds. G Investment income per share reflects a special dividend which amounted to $.02 per share. Excluding the special dividend, the ratio of net investment income (loss) to average net assets would have been 1.71%. H For the period May 9, 2008 (commencement of sale of shares) to October 31, 2008. I Expense ratios reflect operating expenses of the class. Expenses before reductions do not reflect amounts reimbursed by the investment adviser or reductions from brokerage service arrangements or reductions from other expense offset arrangements and do not represent the amount paid by the class during periods when reimbursements or reductions occur. Expense ratios before reductions for start-up periods may not be representative of longer-term operating periods. Expenses net of fee waivers reflect expenses after reimbursement by the investment adviser but prior to reductions from brokerage service arrangements or other expense offset arrangements. Expenses net of all reductions represent the net expenses paid by the class. J Total distributions of $.28 per share is comprised of distributions from net investment income of $.148 and distributions from net realized gain of $.135 per share. |
See accompanying notes which are an integral part of the financial statements.
Annual Report
Notes to Financial Statements
For the period ended October 31, 2011
1. Organization.
Fidelity Emerging Markets Fund (the Fund) is a fund of Fidelity Investment Trust (the Trust) and is authorized to issue an unlimited number of shares. The Trust is registered under the Investment Company Act of 1940, as amended (the 1940 Act), as an open-end management investment company organized as a Massachusetts business trust. The Fund offers Emerging Markets and Class K shares each of which has equal rights as to assets and voting privileges. Each class has exclusive voting rights with respect to matters that affect that class. Investment income, realized and unrealized capital gains and losses, the common expenses of the Fund, and certain fund-level expense reductions, if any, are allocated on a pro-rata basis to each class based on the relative net assets of each class to the total net assets of the Fund. Each class differs with respect to transfer agent fees incurred. Certain expense reductions may also differ by class. The Fund's investments in emerging markets can be subject to social, economic, regulatory, and political uncertainties and can be extremely volatile.
2. Investments in Fidelity Central Funds.
The Fund invests in Fidelity Central Funds, which are open-end investment companies available only to other investment companies and accounts managed by Fidelity Management & Research Company (FMR) and its affiliates. The Fund's Schedule of Investments lists each of the Fidelity Central Funds held as of period end, if any, as an investment of the Fund, but does not include the underlying holdings of each Fidelity Central Fund. As an Investing Fund, the Fund indirectly bears its proportionate share of the expenses of the underlying Fidelity Central Funds.
The Money Market Central Funds seek preservation of capital and current income and are managed by Fidelity Investments Money Management, Inc. (FIMM), an affiliate of FMR.
A complete unaudited list of holdings for each Fidelity Central Fund is available upon request or at the Securities and Exchange Commission (the SEC) web site at www.sec.gov. In addition, the financial statements of the Fidelity Central Funds, which are not covered by the Fund's Report of Independent Registered Public Accounting Firm are available on the SEC web site or upon request.
3. Significant Accounting Policies.
The financial statements have been prepared in conformity with accounting principles generally accepted in the United States of America (GAAP), which require management to make certain estimates and assumptions at the date of the financial statements. Actual results could differ from those estimates. Subsequent events, if any, through the date that the financial statements were issued have been evaluated in the preparation of the financial statements. The following summarizes the significant accounting policies of the Fund:
Security Valuation. Investments are valued as of 4:00 p.m. Eastern time on the last calendar day of the period. The Fund uses independent pricing services approved by the Board of Trustees to value its investments. When current market prices or quotations are not readily available or reliable, valuations may be determined in good faith in accordance with procedures adopted by the Board of Trustees. Factors used in determining value may include market or security specific events. The frequency with which these procedures are used cannot be predicted and they may be utilized to a significant extent. The value used for net asset value (NAV) calculation under these procedures may differ from published prices for the same securities.
The Fund categorizes the inputs to valuation techniques used to value its investments into a disclosure hierarchy consisting of three levels as shown below:
Level 1 - quoted prices in active markets for identical investments
Level 2 - other significant observable inputs (including quoted prices for similar investments, interest rates, prepayment speeds, etc.)
Level 3 - unobservable inputs (including the Fund's own assumptions based on the best information available)
Changes in valuation techniques may result in transfers in or out of an assigned level within the disclosure hierarchy. The aggregate value of investments by input level, as of October 31, 2011, is included at the end of the Fund's Schedule of Investments. Valuation techniques used to value the Fund's investments by major category are as follows:
Equity securities, including restricted securities, for which market quotations are readily available, are valued at the last reported sale price or official closing price as reported by an independent pricing service on the primary market or exchange on which they are traded and are categorized as Level 1 in the hierarchy. In the event there were no sales during the day or closing prices are not available, securities are valued at the last quoted bid price or may be valued using the last available price and are generally categorized as Level 2 in the hierarchy. For foreign equity securities, when significant market or security specific events arise, comparisons to the valuation of American Depositary Receipts (ADRs), futures contracts, Exchange-traded funds (ETFs) and certain indexes as well as quoted prices for similar securities are used and are categorized as Level 2 in the hierarchy in these circumstances. Utilizing these techniques may result in transfers between Level 1 and Level 2. For restricted equity securities and private placements where observable inputs are limited, assumptions about market activity and risk are used and are categorized as Level 3 in the hierarchy.
Annual Report
3. Significant Accounting Policies - continued
Security Valuation - continued
Investments in open-end mutual funds, including the Fidelity Central Funds, are valued at their closing net asset value each business day and are categorized as Level 1 in the hierarchy.
Foreign Currency. The Fund may use foreign currency contracts to facilitate transactions in foreign-denominated securities. Gains and losses from these transactions may arise from changes in the value of the foreign currency or if the counterparties do not perform under the contracts' terms.
Foreign-denominated assets, including investment securities, and liabilities are translated into U.S. dollars at the exchange rate at period end. Purchases and sales of investment securities, income and dividends received and expenses denominated in foreign currencies are translated into U.S. dollars at the exchange rate in effect on the transaction date.
The effects of exchange rate fluctuations on investments are included with the net realized and unrealized gain (loss) on investment securities. Other foreign currency transactions resulting in realized and unrealized gain (loss) are disclosed separately.
Investment Transactions and Income. For financial reporting purposes, the Fund's investment holdings and NAV include trades executed through the end of the last business day of the period. The NAV per share for processing shareholder transactions is calculated as of the close of business of the New York Stock Exchange (NYSE), normally 4:00 p.m. Eastern time and includes trades executed through the end of the prior business day. Gains and losses on securities sold are determined on the basis of identified cost and may include proceeds received from litigation. Dividend income is recorded on the ex-dividend date, except for certain dividends from foreign securities where the ex-dividend date may have passed, which are recorded as soon as the Fund is informed of the ex-dividend date. Non-cash dividends included in dividend income, if any, are recorded at the fair market value of the securities received. Distributions received on securities that represent a return of capital or capital gain are recorded as a reduction of cost of investments and/or as a realized gain. The Fund estimates the components of distributions received that may be considered return of capital distributions or capital gain distributions. Interest income and distributions from the Fidelity Central Funds are accrued as earned. Interest income includes coupon interest and amortization of premium and accretion of discount on debt securities. Investment income is recorded net of foreign taxes withheld where recovery of such taxes is uncertain.
Expenses. Expenses directly attributable to a fund are charged to that fund. Expenses attributable to more than one fund are allocated among the respective funds on the basis of relative net assets or other appropriate methods. Expense estimates are accrued in the period to which they relate and adjustments are made when actual amounts are known.
Income Tax Information and Distributions to Shareholders. Each year, the Fund intends to qualify as a regulated investment company, including distributing substantially all of its taxable income and realized gains under Subchapter M of the Internal Revenue Code and filing its U.S. federal tax return. As a result, no provision for income taxes is required. As of October 31, 2011, the Fund did not have any unrecognized tax benefits in the financial statements. A fund's federal tax return is subject to examination by the Internal Revenue Service (IRS) for a period of three years. Foreign taxes are provided for based on the Fund's understanding of the tax rules and rates that exist in the foreign markets in which it invests.
Distributions are declared and recorded on the ex-dividend date. Income dividends and capital gain distributions are declared separately for each class. Income and capital gain distributions are determined in accordance with income tax regulations, which may differ from GAAP. In addition, the Fund claimed a portion of the payment made to redeeming shareholders as a distribution for income tax purposes.
Capital accounts within the financial statements are adjusted for permanent book-tax differences. These adjustments have no impact on net assets or the results of operations. Temporary book-tax differences will reverse in a subsequent period.
Book-tax differences are primarily due to foreign currency transactions, passive foreign investment companies (PFIC), deferred trustees compensation, capital loss carryforwards and losses deferred due to wash sales.
The federal tax cost of investment securities and unrealized appreciation (depreciation) as of period end were as follows:
Gross unrealized appreciation | $ 495,347,698 |
Gross unrealized depreciation | (218,639,870) |
Net unrealized appreciation (depreciation) on securities and other investments | $ 276,707,828 |
| |
Tax Cost | $ 3,203,862,810 |
Annual Report
Notes to Financial Statements - continued
3. Significant Accounting Policies - continued
Income Tax Information and Distributions to Shareholders - continued
The tax-based components of distributable earnings as of period end were as follows:
Undistributed ordinary income | $ 36,916,395 |
Capital loss carryforward | $ (300,796,984) |
Net unrealized appreciation (depreciation) | $ 276,339,038 |
Under the recently enacted Regulated Investment Company Modernization Act of 2010 (the Act), the Fund will be permitted to carry forward capital losses incurred in taxable years beginning after December 22, 2010 for an unlimited period. However, any losses incurred during those future taxable years will be required to be utilized prior to any losses incurred in pre-enactment taxable years, which generally expire after eight years from when they are incurred. Additionally, post-enactment capital losses that are carried forward will retain their character as either short-term or long-term capital losses rather than being considered all short-term as under previous law. The Fund's first fiscal year end subject to the Act will be October 31, 2012.
The tax character of distributions paid was as follows:
| October 31, 2011 | October 31, 2010 |
Ordinary Income | $ 74,128,234 | $ 49,576,188 |
Short-Term Trading (Redemption) Fees. Shares held by investors in the Fund less than 90 days are subject to a redemption fee equal to 1.50% of the net asset value of shares redeemed. All redemption fees, which reduce the proceeds of the shareholder redemption, are retained by the Fund and accounted for as an addition to paid in capital.
New Accounting Pronouncement. In May 2011, the Financial Accounting Standards Board issued Accounting Standard Update No. 2011-04, Fair Value Measurement (Topic 820) - Amendments to Achieve Common Fair Value Measurement and Disclosure Requirements in U.S. GAAP and IFRSs. The update changes the wording used to describe the requirements in GAAP for measuring fair value and for disclosing information about fair value measurements. The update is effective during interim and annual periods beginning after December 15, 2011. Management is currently evaluating the impact of the update's adoption on the Fund's financial statement disclosures.
4. Operating Policies.
Delayed Delivery Transactions and When-Issued Securities. During the period, the Fund transacted in securities on a delayed delivery or when-issued basis. Payment and delivery may take place after the customary settlement period for that security. The price of the underlying securities and the date when the securities will be delivered and paid for are fixed at the time the transaction is negotiated. During the time a delayed delivery sell is outstanding, the contract is marked-to-market daily and equivalent deliverable securities are held for the transaction. The securities purchased on a delayed delivery or when-issued basis are identified as such in the Fund's Schedule of Investments. The Fund may receive compensation for interest forgone in the purchase of a delayed delivery or when-issued security. With respect to purchase commitments, the Fund identifies securities as segregated in its records with a value at least equal to the amount of the commitment. Losses may arise due to changes in the value of the underlying securities or if the counterparty does not perform under the contract's terms, or if the issuer does not issue the securities due to political, economic, or other factors.
Restricted Securities. The Fund may invest in securities that are subject to legal or contractual restrictions on resale. These securities generally may be resold in transactions exempt from registration or to the public if the securities are registered. Disposal of these securities may involve time-consuming negotiations and expense, and prompt sale at an acceptable price may be difficult. Information regarding restricted securities is included at the end of the Fund's Schedule of Investments.
5. Purchases and Sales of Investments.
Purchases and sales of securities, other than short-term securities, aggregated $5,419,965,479 and $6,262,037,839, respectively.
6. Fees and Other Transactions with Affiliates.
Management Fee. FMR and its affiliates provide the Fund with investment management related services for which the Fund pays a monthly management fee. The management fee is the sum of an individual fund fee rate that is based on an annual rate of .45% of the Fund's average net assets and a group fee rate that averaged .26% during the period. The group fee rate is based upon the average net assets of all the mutual funds advised by FMR. The group fee rate decreases as assets under management increase and increases as assets under management decrease. For the period, the total annual management fee rate was .71% of the Fund's average net assets.
Annual Report
6. Fees and Other Transactions with Affiliates - continued
Transfer Agent Fees. Fidelity Investments Institutional Operations Company, Inc. (FIIOC), an affiliate of FMR, is the transfer, dividend disbursing and shareholder servicing agent for each class of the Fund. FIIOC receives account fees and asset-based fees that vary according to the account size and type of account of the shareholders of Emerging Markets. FIIOC receives an asset based fee of Class K's average net assets. FIIOC pays for typesetting, printing and mailing of shareholder reports, except proxy statements. For the period, transfer agent fees for each class were as follows:
| Amount | % of
Average
Net Assets |
Emerging Markets | $ 9,274,632 | .25 |
Class K | 437,938 | .05 |
| $ 9,712,570 | |
Accounting and Security Lending Fees. Fidelity Service Company, Inc. (FSC), an affiliate of FMR, maintains the Fund's accounting records. The accounting fee is based on the level of average net assets for the month. Under a separate contract, FSC administers the security lending program. The security lending fee is based on the number and duration of lending transactions.
Brokerage Commissions. The Fund placed a portion of its portfolio transactions with brokerage firms which are affiliates of the investment adviser. The commissions paid to these affiliated firms were $2,431 for the period.
Interfund Lending Program. Pursuant to an Exemptive Order issued by the SEC, the Fund, along with other registered investment companies having management contracts with FMR, may participate in an interfund lending program. This program provides an alternative credit facility allowing the funds to borrow from, or lend money to, other participating affiliated funds. At period end, there were no interfund loans outstanding. The Fund's activity in this program during the period for which loans were outstanding was as follows:
Borrower or Lender | Average Daily
Loan Balance | Weighted Average Interest Rate | Interest
Expense |
Borrower | $ 11,313,279 | .39% | $ 5,301 |
7. Committed Line of Credit.
The Fund participates with other funds managed by FMR or an affiliate in a $4.0 billion credit facility (the "line of credit") to be utilized for temporary or emergency purposes to fund shareholder redemptions or for other short-term liquidity purposes. The Fund has agreed to pay commitment fees on its pro-rata portion of the line of credit, which amounted to $14,312 and is reflected in Miscellaneous expenses on the Statement of Operations. During the period, there were no borrowings on this line of credit.
8. Security Lending.
The Fund lends portfolio securities through a lending agent from time to time in order to earn additional income. For equity securities, a lending agent is used and may loan securities to certain qualified borrowers, including Fidelity Capital Markets (FCM), a broker-dealer affiliated with the Fund. On the settlement date of the loan, the Fund receives collateral (in the form of U.S. Treasury obligations, letters of credit and/or cash) against the loaned securities and maintains collateral in an amount not less than 100% of the market value of the loaned securities during the period of the loan. The market value of the loaned securities is determined at the close of business of the Fund and any additional required collateral is delivered to the Fund on the next business day. If the borrower defaults on its obligation to return the securities loaned because of insolvency or other reasons, a fund could experience delays and costs in recovering the securities loaned or in gaining access to the collateral. Any cash collateral received is invested in the Fidelity Securities Lending Cash Central Fund. The value of loaned securities and cash collateral at period end are disclosed on the Fund's Statement of Assets and Liabilities. Security lending income represents the income earned on investing cash collateral, less rebates paid to borrowers and any lending agent fees associated with the loan, plus any premium payments received for lending certain types of securities. Security lending income is presented in the Statement of Operations as a component of income from Fidelity Central Funds. Total security lending income during the period amounted to $1,194,501. During the period, there were no securities loaned to FCM.
9. Bank Borrowings.
The Fund is permitted to have bank borrowings for temporary or emergency purposes to fund shareholder redemptions or for other short-term liquidity requirements. The Fund has established borrowing arrangements with certain banks. The interest rate on the borrowings is the bank's base rate, as revised from time to time. The average daily loan balance during the period for which loans were outstanding amounted to $26,847,381. The weighted average interest rate was .65%. The interest expense amounted to $10,166 under the bank borrowing program. At period end, there were no bank borrowings outstanding.
Annual Report
Notes to Financial Statements - continued
10. Expense Reductions.
Many of the brokers with whom FMR places trades on behalf of the Fund provided services to the Fund in addition to trade execution. These services included payments of certain expenses on behalf of the Fund totaling $2,922,033 for the period. In addition, through arrangements with the Fund's custodian, credits realized as a result of uninvested cash balances were used to reduce the Fund's expenses. During the period, these credits reduced the Fund's custody expenses by $421.
11. Distributions to Shareholders.
Distributions to shareholders of each class were as follows:
Years ended October 31, | 2011 | 2010 |
From net investment income | | |
Emerging Markets | $ 38,140,950 | $ 21,030,807 |
Class K | 11,296,849 | 2,128,426 |
Total | $ 49,437,799 | $ 23,159,233 |
From net realized gain | | |
Emerging Markets | $ 20,164,680 | $ 24,475,486 |
Class K | 4,525,755 | 1,941,469 |
Total | $ 24,690,435 | $ 26,416,955 |
12. Share Transactions.
Transactions for each class of shares were as follows:
| Shares | Dollars |
Years ended October 31, | 2011 | 2010 | 2011 | 2010 |
Emerging Markets | | | | |
Shares sold | 35,985,818 | 69,154,267 | $ 924,231,122 | $ 1,590,197,264 |
Reinvestment of distributions | 2,151,168 | 1,952,719 | 55,865,828 | 43,877,566 |
Shares redeemed | (61,852,310) | (92,999,725) | (1,567,144,468) | (2,095,951,354) |
Net increase (decrease) | (23,715,324) | (21,892,739) | $ (587,047,518) | $ (461,876,524) |
Class K | | | | |
Shares sold | 11,514,792 | 28,708,422 | $ 289,925,357 | $ 648,209,971 |
Reinvestment of distributions | 610,205 | 181,368 | 15,822,605 | 4,069,895 |
Shares redeemed | (24,238,483) | (7,437,639) | (577,946,139) | (167,338,288) |
Net increase (decrease) | (12,113,486) | 21,452,151 | $ (272,198,177) | $ 484,941,578 |
13. Other.
The Fund's organizational documents provide former and current trustees and officers with a limited indemnification against liabilities arising in connection with the performance of their duties to the Fund. In the normal course of business, the Fund may also enter into contracts that provide general indemnifications. The Fund's maximum exposure under these arrangements is unknown as this would be dependent on future claims that may be made against the Fund. The risk of material loss from such claims is considered remote.
Annual Report
Fidelity Europe Capital Appreciation Fund
Performance: The Bottom Line
Average annual total return reflects the change in the value of an investment, assuming reinvestment of the fund's distributions from dividend income and capital gains (the profits earned upon the sale of securities that have grown in value, if any) and assuming a constant rate of performance each year. The $10,000 table and the fund's returns do not reflect the deduction of taxes that a shareholder would pay on fund distributions or the redemption of fund shares. During periods of reimbursement by Fidelity, a fund's total return will be greater than it would be had the reimbursement not occurred. How a fund did yesterday is no guarantee of how it will do tomorrow.
Average Annual Total Returns
Periods ended October 31, 2011 | Past 1
year | Past 5
years | Past 10
years |
Fidelity Europe Capital Appreciation Fund | -8.65% | -3.31% | 6.01% |
$10,000 Over 10 Years
Let's say hypothetically that $10,000 was invested in Fidelity Europe Capital Appreciation Fund on October 31, 2001. The chart shows how the value of your investment would have changed, and also shows how the MSCI Europe Index performed over the same period.
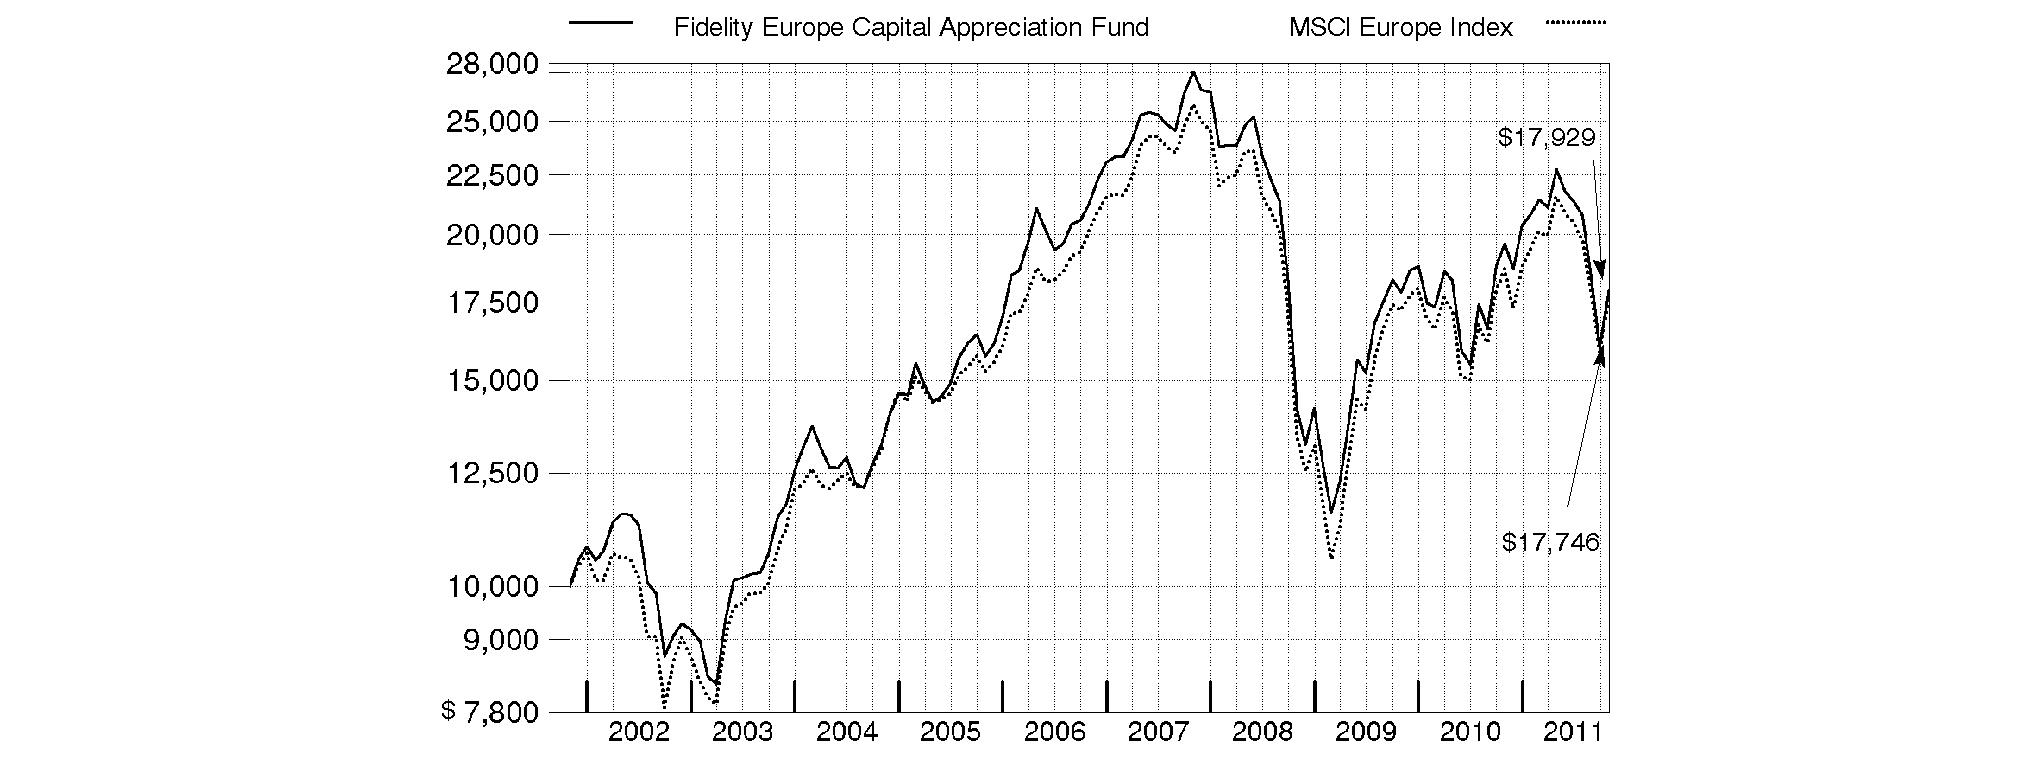
Annual Report
Fidelity Europe Capital Appreciation Fund
Market Recap: International equities were rocked by a number of headline events during the year ending October 31, 2011. Stocks posted a solid advance for the first half of the period, despite concern about the sovereign debt crisis in Europe, a devastating earthquake and tsunami in Japan, and political upheaval in the Middle East and North Africa. Sentiment turned decidedly negative in the second half, however, as fresh worries about Europe, inflation in China and a dimmed outlook for global growth caused foreign markets to suffer declines that intensified in August and September. October brought with it yet another dramatic swing, as euro zone policymakers appeared near a resolution to the debt debacle and buyers stormed back onto the scene in search of bargains. Still, those gains - along with favorable currency fluctuations overall - weren't enough to offset prior losses, and the MSCI® ACWI® (All Country World Index) ex USA Index finished the period down 4.56%. Within the MSCI index, Europe and emerging markets suffered the biggest declines, with many countries in these areas sustaining steep losses. By contrast, Japan showed resilience in the wake of its natural disasters, falling only 2%. Australia (+4%), Switzerland (+3%), the U.K. (+2%) and Canada, which produced a nominal return, were among the few major benchmark components to break into positive territory.
Comments from Melissa Reilly, Portfolio Manager of Fidelity® Europe Capital Appreciation Fund: For the year, the fund declined 8.65%, while the MSCI® Europe Index fell 5.01%. Several factors fueled the fund's underperformance versus the MSCI index: stock selection in financials, especially banks; positioning in the pharmaceuticals/biotechnology/life science group of health care; picks in energy and information technology; a modest stake in cash; and positioning in the food/beverage/tobacco area of consumer staples. Individual detractors included: Spain's Mediaset Espana Comunicacion, Germany-based chemicals firm BASF, French banks Societe Generale and BNP Paribas, and British bank Lloyds Banking Group. Underweighting the U.K.'s GlaxoSmithKline and not owning Roche Holding, two outperforming pharmaceutical companies in the index, also hurt. From a geographic perspective, picks in the U.K., Norway and Spain hurt the most. Aiding the fund were positioning in industrials, particularly capital goods; stock selection in the automobiles/components segment of consumer discretionary; positioning in utilities; and holdings in telecommunication services. On an individual security basis, the following positions were beneficial: German car manufacturer Volkswagen; U.K. software developer Autonomy, which was being acquired by Hewlett-Packard; an out-of-index holding in Russian fertilizer company Uralkali; and an out-of-index position in Mead Johnson Nutrition, a U.S.-based manufacturer of infant formula. On a country basis, holdings in Germany and the Bailiwick of Jersey, the largest of the Channel Islands, helped. Several of the stocks I've mentioned were sold from the fund by period end.
The views expressed above reflect those of the portfolio manager(s) only through the end of the period as stated on the cover of this report and do not necessarily represent the views of Fidelity or any other person in the Fidelity organization. Any such views are subject to change at any time based upon market or other conditions and Fidelity disclaims any responsibility to update such views. These views may not be relied on as investment advice and, because investment decisions for a Fidelity fund are based on numerous factors, may not be relied on as an indication of trading intent on behalf of any Fidelity fund.
Annual Report
Fidelity Europe Capital Appreciation Fund
As a shareholder of the Fund, you incur two types of costs: (1) transaction costs, including redemption fees, and (2) ongoing costs, including management fees and other Fund expenses. This Example is intended to help you understand your ongoing costs (in dollars) of investing in the Fund and to compare these costs with the ongoing costs of investing in other mutual funds.
The Example is based on an investment of $1,000 invested at the beginning of the period and held for the entire period (May 1, 2011 to October 31, 2011).
Actual Expenses
The first line of the accompanying table provides information about actual account values and actual expenses. You may use the information in this line, together with the amount you invested, to estimate the expenses that you paid over the period. Simply divide your account value by $1,000.00 (for example, an $8,600 account value divided by $1,000.00 = 8.6), then multiply the result by the number in the first line under the heading entitled "Expenses Paid During Period" to estimate the expenses you paid on your account during this period. A small balance maintenance fee of $12.00 that is charged once a year may apply for certain accounts with a value of less than $2,000. This fee is not included in the table below. If it was, the estimate of expenses you paid during the period would be higher, and your ending account value lower, by this amount. In addition, the Fund, as a shareholder in the underlying Fidelity Central Funds, will indirectly bear its pro-rata share of the fees and expenses incurred by the underlying Fidelity Central Funds. These fees and expenses are not included in the Fund's annualized expense ratio used to calculate the expense estimate in the table below.
Hypothetical Example for Comparison Purposes
The second line of the accompanying table provides information about hypothetical account values and hypothetical expenses based on the Fund's actual expense ratio and an assumed rate of return of 5% per year before expenses, which is not the Fund's actual return. The hypothetical account values and expenses may not be used to estimate the actual ending account balance or expenses you paid for the period. You may use this information to compare the ongoing costs of investing in the Fund and other funds. To do so, compare this 5% hypothetical example with the 5% hypothetical examples that appear in the shareholder reports of the other funds. A small balance maintenance fee of $12.00 that is charged once a year may apply for certain accounts with a value of less than $2,000. This fee is not included in the table below. If it was, the estimate of expenses you paid during the period would be higher, and your ending account value lower, by this amount. In addition, the Fund, as a shareholder in the underlying Fidelity Central Funds, will indirectly bear its pro-rata share of the fees and expenses incurred by the underlying Fidelity Central Funds. These fees and expenses are not included in the Fund's annualized expense ratio used to calculate the expense estimate in the table below.
Please note that the expenses shown in the table are meant to highlight your ongoing costs only and do not reflect any transaction costs. Therefore, the second line of the table is useful in comparing ongoing costs only, and will not help you determine the relative total costs of owning different funds. In addition, if these transactional costs were included, your costs would have been higher.
| Annualized
Expense Ratio | Beginning
Account Value
May 1, 2011 | Ending
Account Value
October 31, 2011 | Expenses Paid
During Period*
May 1, 2011 to
October 31, 2011 |
Actual | .98% | $ 1,000.00 | $ 789.40 | $ 4.42 |
Hypothetical (5% return per year before expenses) | | $ 1,000.00 | $ 1,020.27 | $ 4.99 |
* Expenses are equal to the Fund's annualized expense ratio, multiplied by the average account value over the period, multiplied by 184/365 (to reflect the one-half year period).
Annual Report
Fidelity Europe Capital Appreciation Fund
Investment Changes (Unaudited)
Geographic Diversification (% of fund's net assets) |
As of October 31, 2011 |
| United Kingdom | 33.5% | |
| France | 17.0% | |
| Germany | 10.0% | |
| Switzerland | 8.8% | |
| United States of America | 6.0% | |
| Italy | 5.0% | |
| Spain | 4.5% | |
| Netherlands | 3.2% | |
| Sweden | 3.0% | |
| Other | 9.0% | |

Percentages are adjusted for the effect of futures contracts, if applicable. |
As of April 30, 2011 |
| United Kingdom | 28.8% | |
| France | 15.0% | |
| Germany | 10.1% | |
| Spain | 7.3% | |
| Switzerland | 5.0% | |
| Italy | 4.6% | |
| United States of America | 4.1% | |
| Russia | 3.3% | |
| Denmark | 3.3% | |
| Other | 18.5% | |

Percentages are adjusted for the effect of futures contracts, if applicable. |
Asset Allocation |
| % of fund's
net assets | % of fund's net assets
6 months ago |
Stocks | 98.7 | 99.5 |
Short-Term Investments and Net Other Assets | 1.3 | 0.5 |
Top Ten Stocks as of October 31, 2011 |
| % of fund's
net assets | % of fund's net assets
6 months ago |
Royal Dutch Shell PLC Class A (United Kingdom) (United Kingdom, Oil, Gas & Consumable Fuels) | 5.0 | 3.5 |
Nestle SA (Switzerland, Food Products) | 3.8 | 0.0 |
Sanofi-aventis (France, Pharmaceuticals) | 3.2 | 0.0 |
Vodafone Group PLC (United Kingdom, Wireless Telecommunication Services) | 2.9 | 2.3 |
BG Group PLC (United Kingdom, Oil, Gas & Consumable Fuels) | 2.4 | 1.9 |
Carphone Warehouse Group PLC (United Kingdom, Specialty Retail) | 2.2 | 1.5 |
GlaxoSmithKline PLC (United Kingdom, Pharmaceuticals) | 2.0 | 0.0 |
British American Tobacco PLC (United Kingdom) (United Kingdom, Tobacco) | 1.9 | 0.0 |
HSBC Holdings PLC sponsored ADR (United Kingdom, Commercial Banks) | 1.9 | 1.7 |
Unilever PLC (United Kingdom, Food Products) | 1.8 | 0.0 |
| 27.1 | |
Market Sectors as of October 31, 2011 |
| % of fund's
net assets | % of fund's net assets
6 months ago |
Financials | 22.4 | 19.9 |
Consumer Discretionary | 16.5 | 20.1 |
Energy | 12.1 | 12.6 |
Health Care | 10.5 | 4.4 |
Consumer Staples | 10.2 | 6.0 |
Industrials | 8.7 | 11.2 |
Materials | 7.2 | 11.5 |
Information Technology | 6.4 | 7.2 |
Telecommunication Services | 3.7 | 4.7 |
Utilities | 1.0 | 1.9 |
Annual Report
Fidelity Europe Capital Appreciation Fund
Investments October 31, 2011
Showing Percentage of Net Assets
Common Stocks - 96.3% |
| Shares | | Value |
Australia - 0.4% |
Fortescue Metals Group Ltd. | 248,316 | | $ 1,247,372 |
Bailiwick of Guernsey - 0.4% |
Resolution Ltd. | 337,500 | | 1,492,611 |
Bailiwick of Jersey - 2.7% |
Experian PLC | 209,400 | | 2,729,416 |
Randgold Resources Ltd. sponsored ADR | 21,300 | | 2,333,841 |
Shire PLC | 127,582 | | 4,004,983 |
TOTAL BAILIWICK OF JERSEY | | 9,068,240 |
Belgium - 0.0% |
Anheuser-Busch InBev SA NV (strip VVPR) (a) | 103,680 | | 143 |
Bermuda - 0.3% |
Lazard Ltd. Class A | 39,900 | | 1,090,866 |
British Virgin Islands - 0.6% |
Mail.ru Group Ltd. GDR (Reg. S) | 58,500 | | 2,015,325 |
China - 0.6% |
Baidu.com, Inc. sponsored ADR (a) | 14,600 | | 2,046,628 |
Denmark - 1.6% |
Danske Bank A/S (a) | 141,148 | | 1,955,740 |
Novo Nordisk A/S Series B | 31,630 | | 3,358,575 |
TOTAL DENMARK | | 5,314,315 |
France - 17.0% |
Alstom SA | 78,173 | | 2,931,776 |
Arkema SA | 34,300 | | 2,346,569 |
Atos Origin SA | 48,390 | | 2,345,182 |
BNP Paribas SA | 101,758 | | 4,626,032 |
Christian Dior SA | 10,700 | | 1,514,831 |
Compagnie Generale de Geophysique SA (a) | 64,900 | | 1,418,231 |
Danone | 76,500 | | 5,325,178 |
Edenred | 78,200 | | 2,218,530 |
GDF Suez | 60,800 | | 1,726,155 |
Iliad SA | 23,126 | | 2,706,904 |
JC Decaux SA (a) | 87,800 | | 2,352,972 |
LVMH Moet Hennessy - Louis Vuitton | 22,619 | | 3,764,118 |
PPR SA | 30,000 | | 4,687,269 |
Publicis Groupe SA | 56,000 | | 2,715,156 |
Safran SA | 75,500 | | 2,473,147 |
Sanofi-aventis | 147,327 | | 10,541,155 |
Unibail-Rodamco | 14,000 | | 2,799,630 |
TOTAL FRANCE | | 56,492,835 |
Germany - 7.6% |
Allianz AG | 35,687 | | 4,010,738 |
BASF AG | 48,674 | | 3,582,876 |
Bayer AG | 58,200 | | 3,728,737 |
Deutsche Bank AG | 46,700 | | 1,931,257 |
E.ON AG | 61,228 | | 1,483,682 |
Fresenius Medical Care AG & Co. KGaA | 33,800 | | 2,462,542 |
HeidelbergCement AG | 38,600 | | 1,761,743 |
|
| Shares | | Value |
Kabel Deutschland Holding AG (a) | 33,900 | | $ 1,935,680 |
SAP AG | 73,835 | | 4,465,296 |
TOTAL GERMANY | | 25,362,551 |
Ireland - 0.3% |
Elan Corp. PLC (a) | 85,600 | | 1,015,293 |
Italy - 5.0% |
Amplifon SpA | 197,600 | | 950,542 |
ENI SpA | 217,600 | | 4,810,507 |
Fiat Industrial SpA (a) | 302,200 | | 2,636,843 |
Intesa Sanpaolo SpA | 1,650,490 | | 2,948,790 |
Prada SpA | 681,100 | | 3,366,986 |
Prysmian SpA | 119,100 | | 1,804,806 |
TOTAL ITALY | | 16,518,474 |
Netherlands - 3.2% |
AEGON NV (a) | 580,200 | | 2,767,343 |
ING Groep NV (Certificaten Van Aandelen) (a) | 514,600 | | 4,436,996 |
Koninklijke Philips Electronics NV | 100,600 | | 2,094,464 |
Yandex NV | 48,400 | | 1,331,968 |
TOTAL NETHERLANDS | | 10,630,771 |
Norway - 1.8% |
Aker Solutions ASA | 169,300 | | 1,968,923 |
Storebrand ASA (A Shares) | 651,500 | | 4,017,170 |
TOTAL NORWAY | | 5,986,093 |
Poland - 0.3% |
Eurocash SA | 141,700 | | 1,136,131 |
Spain - 4.5% |
Banco Bilbao Vizcaya Argentaria SA | 551,102 | | 4,960,590 |
Banco Santander SA: | | | |
rights 10/31/11 | 462,509 | | 80,008 |
(Spain) | 309,077 | | 2,616,363 |
Grifols SA (a) | 87,400 | | 1,631,049 |
Inditex SA | 48,710 | | 4,432,866 |
Mediaset Espana Comunicacion (d) | 206,050 | | 1,368,732 |
TOTAL SPAIN | | 15,089,608 |
Sweden - 3.0% |
H&M Hennes & Mauritz AB (B Shares) | 100,611 | | 3,331,812 |
Swedbank AB (A Shares) | 207,758 | | 2,926,977 |
Telefonaktiebolaget LM Ericsson (B Shares) | 343,983 | | 3,584,362 |
TOTAL SWEDEN | | 9,843,151 |
Switzerland - 8.8% |
Adecco SA (Reg.) | 46,378 | | 2,241,343 |
Bank Sarasin & Co. Ltd. Series B (Reg.) | 41,100 | | 1,568,970 |
Compagnie Financiere Richemont SA Series A | 66,634 | | 3,815,576 |
Nestle SA | 221,332 | | 12,837,786 |
Schindler Holding AG (participation certificate) | 24,325 | | 2,860,623 |
Common Stocks - continued |
| Shares | | Value |
Switzerland - continued |
Transocean Ltd. (United States) | 36,900 | | $ 2,108,835 |
UBS AG (a) | 307,428 | | 3,886,446 |
TOTAL SWITZERLAND | | 29,319,579 |
United Kingdom - 33.5% |
Aegis Group PLC | 1,044,909 | | 2,305,540 |
Aviva PLC | 420,800 | | 2,296,130 |
Barclays PLC | 1,607,524 | | 4,984,162 |
BG Group PLC | 359,941 | | 7,852,197 |
BHP Billiton PLC | 134,161 | | 4,225,449 |
British American Tobacco PLC (United Kingdom) | 140,600 | | 6,447,758 |
British Land Co. PLC | 386,352 | | 3,171,896 |
Carphone Warehouse Group PLC | 1,299,500 | | 7,335,394 |
Filtrona PLC | 304,000 | | 1,941,393 |
GlaxoSmithKline PLC | 297,700 | | 6,682,337 |
HSBC Holdings PLC sponsored ADR | 144,285 | | 6,299,483 |
Invensys PLC | 224,800 | | 815,235 |
Lloyds Banking Group PLC (a) | 5,826,100 | | 3,013,373 |
Meggitt PLC | 433,400 | | 2,680,638 |
Micro Focus International PLC | 289,000 | | 1,578,358 |
Misys PLC | 257,137 | | 1,206,674 |
Next PLC | 68,300 | | 2,807,512 |
Rolls-Royce Group PLC | 180,900 | | 2,043,737 |
Rolls-Royce Group PLC Class C | 12,482,100 | | 20,074 |
Royal Dutch Shell PLC Class A (United Kingdom) | 468,066 | | 16,584,192 |
Standard Chartered PLC (United Kingdom) | 188,765 | | 4,429,114 |
Tullow Oil PLC | 98,200 | | 2,215,691 |
Unilever PLC | 178,500 | | 5,984,464 |
Vodafone Group PLC | 3,522,600 | | 9,782,979 |
Xstrata PLC | 286,600 | | 4,818,815 |
TOTAL UNITED KINGDOM | | 111,522,595 |
United States of America - 4.7% |
Apple, Inc. (a) | 3,500 | | 1,416,730 |
Beam, Inc. | 21,400 | | 1,057,802 |
Dunkin' Brands Group, Inc. (a) | 1,100 | | 32,021 |
Fluor Corp. | 24,700 | | 1,404,195 |
Halliburton Co. | 39,100 | | 1,460,776 |
Mead Johnson Nutrition Co. Class A | 21,800 | | 1,566,330 |
Morgan Stanley | 119,600 | | 2,109,744 |
|
| Shares | | Value |
Noble Energy, Inc. | 17,900 | | $ 1,599,186 |
Perrigo Co. | 7,900 | | 713,212 |
salesforce.com, Inc. (a) | 8,800 | | 1,171,896 |
The Mosaic Co. | 28,800 | | 1,686,528 |
Virgin Media, Inc. | 60,700 | | 1,479,866 |
TOTAL UNITED STATES OF AMERICA | | 15,698,286 |
TOTAL COMMON STOCKS (Cost $339,803,611) | 320,890,867 |
Nonconvertible Preferred Stocks - 2.4% |
| | | |
Germany - 2.4% |
ProSiebenSat.1 Media AG | 186,600 | | 4,002,654 |
Volkswagen AG | 24,000 | | 4,211,484 |
TOTAL NONCONVERTIBLE PREFERRED STOCKS (Cost $6,948,737) | 8,214,138 |
Money Market Funds - 1.1% |
| | | |
Fidelity Cash Central Fund, 0.12% (b) | 1,799,979 | | 1,799,979 |
Fidelity Securities Lending Cash Central Fund, 0.11% (b)(c) | 1,785,000 | | 1,785,000 |
TOTAL MONEY MARKET FUNDS (Cost $3,584,979) | 3,584,979 |
TOTAL INVESTMENT PORTFOLIO - 99.8% (Cost $350,337,327) | | 332,689,984 |
NET OTHER ASSETS (LIABILITIES) - 0.2% | | 503,373 |
NET ASSETS - 100% | $ 333,193,357 |
Legend |
(a) Non-income producing |
(b) Affiliated fund that is available only to investment companies and other accounts managed by Fidelity Investments. The rate quoted is the annualized seven-day yield of the fund at period end. A complete unaudited listing of the fund's holdings as of its most recent quarter end is available upon request. In addition, each Fidelity Central Fund's financial statements, which are not covered by the Fund's Report of Independent Registered Public Accounting Firm, are available on the SEC's website or upon request. |
(c) Investment made with cash collateral received from securities on loan. |
(d) Security or a portion of the security is on loan at period end. |
Affiliated Central Funds |
Information regarding fiscal year to date income earned by the Fund from investments in Fidelity Central Funds is as follows: |
Fund | Income earned |
Fidelity Cash Central Fund | $ 7,288 |
Fidelity Securities Lending Cash Central Fund | 339,291 |
Total | $ 346,579 |
Other Information |
The following is a summary of the inputs used, as of October 31, 2011, involving the Fund's assets and liabilities carried at fair value. The inputs or methodology used for valuing securities may not be an indication of the risk associated with investing in those securities. For more information on valuation inputs, and their aggregation into the levels used in the table below, please refer to the Security Valuation section in the accompanying Notes to Financial Statements. |
Valuation Inputs at Reporting Date: |
Description | Total | Level 1 | Level 2 | Level 3 |
Investments in Securities: | | | | |
Equities: | | | | |
United Kingdom | $ 111,522,595 | $ 51,521,751 | $ 60,000,844 | $ - |
France | 56,492,835 | 44,533,449 | 11,959,386 | - |
Germany | 33,576,689 | 24,717,594 | 8,859,095 | - |
Switzerland | 29,319,579 | 25,433,133 | 3,886,446 | - |
Italy | 16,518,474 | 8,340,981 | 8,177,493 | - |
United States of America | 15,698,286 | 15,698,286 | - | - |
Spain | 15,089,608 | 7,512,655 | 7,576,953 | - |
Netherlands | 10,630,771 | 1,331,968 | 9,298,803 | - |
Sweden | 9,843,151 | 6,258,789 | 3,584,362 | - |
Other | 30,413,017 | 20,786,794 | 9,626,223 | - |
Money Market Funds | 3,584,979 | 3,584,979 | - | - |
Total Investments in Securities: | $ 332,689,984 | $ 209,720,379 | $ 122,969,605 | $ - |
Income Tax Information |
At October 31, 2011, the Fund had a capital loss carryforward of approximately $284,476,016 of which $147,332,547 and $137,143,469 will expire in fiscal 2016 and 2017, respectively. Capital loss carryforwards are only available to offset future capital gains of the Fund to the extent provided by regulations and may be limited. |
See accompanying notes which are an integral part of the financial statements.
Annual Report
Fidelity Europe Capital Appreciation Fund
Statement of Assets and Liabilities
| October 31, 2011 |
| | |
Assets | | |
Investment in securities, at value (including securities loaned of $1,593,417) - See accompanying schedule: Unaffiliated issuers (cost $346,752,348) | $ 329,105,005 | |
Fidelity Central Funds (cost $3,584,979) | 3,584,979 | |
Total Investments (cost $350,337,327) | | $ 332,689,984 |
Foreign currency held at value (cost $1,465) | | 1,465 |
Receivable for investments sold | | 5,810,505 |
Receivable for fund shares sold | | 737,203 |
Dividends receivable | | 1,017,014 |
Distributions receivable from Fidelity Central Funds | | 1,794 |
Prepaid expenses | | 1,306 |
Other receivables | | 63,119 |
Total assets | | 340,322,390 |
| | |
Liabilities | | |
Payable for investments purchased | $ 4,401,469 | |
Payable for fund shares redeemed | 648,760 | |
Accrued management fee | 155,321 | |
Other affiliated payables | 85,628 | |
Other payables and accrued expenses | 52,855 | |
Collateral on securities loaned, at value | 1,785,000 | |
Total liabilities | | 7,129,033 |
| | |
Net Assets | | $ 333,193,357 |
Net Assets consist of: | | |
Paid in capital | | $ 632,550,362 |
Undistributed net investment income | | 6,439,498 |
Accumulated undistributed net realized gain (loss) on investments and foreign currency transactions | | (288,215,501) |
Net unrealized appreciation (depreciation) on investments and assets and liabilities in foreign currencies | | (17,581,002) |
Net Assets, for 19,840,883 shares outstanding | | $ 333,193,357 |
Net Asset Value, offering price and redemption price per share ($333,193,357 ÷ 19,840,883 shares) | | $ 16.79 |
Statement of Operations
| Year ended October 31, 2011 |
| | |
Investment Income | | |
Dividends | | $ 11,630,244 |
Interest | | 16 |
Income from Fidelity Central Funds | | 346,579 |
Income before foreign taxes withheld | | 11,976,839 |
Less foreign taxes withheld | | (1,176,671) |
Total income | | 10,800,168 |
| | |
Expenses | | |
Management fee
Basic fee | $ 2,909,071 | |
Performance adjustment | (128,763) | |
Transfer agent fees | 1,007,271 | |
Accounting and security lending fees | 215,966 | |
Custodian fees and expenses | 104,572 | |
Independent trustees' compensation | 2,338 | |
Registration fees | 19,928 | |
Audit | 55,638 | |
Legal | 3,172 | |
Interest | 156 | |
Miscellaneous | 4,922 | |
Total expenses before reductions | 4,194,271 | |
Expense reductions | (183,725) | 4,010,546 |
Net investment income (loss) | | 6,789,622 |
Realized and Unrealized Gain (Loss) Net realized gain (loss) on: | | |
Investment securities: | | |
Unaffiliated issuers | 41,293,254 | |
Foreign currency transactions | 123,413 | |
Total net realized gain (loss) | | 41,416,667 |
Change in net unrealized appreciation (depreciation) on: Investment securities | (77,624,699) | |
Assets and liabilities in foreign currencies | (140,489) | |
Total change in net unrealized appreciation (depreciation) | | (77,765,188) |
Net gain (loss) | | (36,348,521) |
Net increase (decrease) in net assets resulting from operations | | $ (29,558,899) |
See accompanying notes which are an integral part of the financial statements.
Annual Report
Fidelity Europe Capital Appreciation Fund
Financial Statements - continued
Statement of Changes in Net Assets
| Year ended
October 31,
2011 | Year ended
October 31,
2010 |
Increase (Decrease) in Net Assets | | |
Operations | | |
Net investment income (loss) | $ 6,789,622 | $ 5,281,725 |
Net realized gain (loss) | 41,416,667 | 7,730,912 |
Change in net unrealized appreciation (depreciation) | (77,765,188) | 29,247,002 |
Net increase (decrease) in net assets resulting from operations | (29,558,899) | 42,259,639 |
Distributions to shareholders from net investment income | (4,458,817) | (9,633,705) |
Share transactions
Proceeds from sales of shares | 31,378,501 | 36,382,856 |
Reinvestment of distributions | 4,246,516 | 9,217,350 |
Cost of shares redeemed | (126,292,441) | (141,374,658) |
Net increase (decrease) in net assets resulting from share transactions | (90,667,424) | (95,774,452) |
Redemption fees | 29,241 | 13,460 |
Total increase (decrease) in net assets | (124,655,899) | (63,135,058) |
| | |
Net Assets | | |
Beginning of period | 457,849,256 | 520,984,314 |
End of period (including undistributed net investment income of $6,439,498 and undistributed net investment income of $4,108,694, respectively) | $ 333,193,357 | $ 457,849,256 |
Other Information Shares | | |
Sold | 1,658,219 | 2,148,209 |
Issued in reinvestment of distributions | 225,658 | 511,223 |
Redeemed | (6,711,062) | (8,358,624) |
Net increase (decrease) | (4,827,185) | (5,699,192) |
Financial Highlights
Years ended October 31, | 2011 | 2010 | 2009 | 2008 | 2007 |
Selected Per-Share Data | | | | | |
Net asset value, beginning of period | $ 18.56 | $ 17.16 | $ 14.27 | $ 32.66 | $ 27.47 |
Income from Investment Operations | | | | | |
Net investment income (loss) B | .31 | .19 | .31 | .50 | .62 |
Net realized and unrealized gain (loss) | (1.89) | 1.53 | 3.14 | (14.11) | 7.04 |
Total from investment operations | (1.58) | 1.72 | 3.45 | (13.61) | 7.66 |
Distributions from net investment income | (.19) | (.32) | (.56) | (.56) | (.22) |
Distributions from net realized gain | - | - | - | (4.22) | (2.25) |
Total distributions | (.19) | (.32) | (.56) | (4.78) | (2.47) |
Redemption fee added to paid in capital B,F | - | - | - | - | - |
Net asset value, end of period | $ 16.79 | $ 18.56 | $ 17.16 | $ 14.27 | $ 32.66 |
Total Return A | (8.65)% | 10.08% | 25.79% | (48.58)% | 29.95% |
Ratios to Average Net Assets C,E | | | | | |
Expenses before reductions | 1.02% | 1.03% | 1.10% | 1.16% | 1.05% |
Expenses net of fee waivers, if any | 1.02% | 1.03% | 1.10% | 1.16% | 1.05% |
Expenses net of all reductions | .98% | .96% | 1.07% | 1.12% | 1.01% |
Net investment income (loss) | 1.65% | 1.13% | 2.16% | 2.11% | 2.15% |
Supplemental Data | | | | | |
Net assets, end of period (000 omitted) | $ 333,193 | $ 457,849 | $ 520,984 | $ 493,654 | $ 1,365,449 |
Portfolio turnover rate D | 116% | 133% | 111% | 112% | 161% |
A Total returns would have been lower if certain expenses had not been reduced during the applicable periods shown. B Calculated based on average shares outstanding during the period. C Fees and expenses of any underlying Fidelity Central Funds are not included in the Fund's expense ratio. The Fund indirectly bears its proportionate share of the expenses of any underlying Fidelity Central Funds. D Amount does not include the portfolio activity of any underlying Fidelity Central Funds. E Expense ratios reflect operating expenses of the Fund. Expenses before reductions do not reflect amounts reimbursed by the investment adviser or reductions from brokerage service arrangements or reductions from other expense offset arrangements and do not represent the amount paid by the Fund during periods when reimbursements or reductions occur. Expenses net of fee waivers reflect expenses after reimbursement by the investment adviser but prior to reductions from brokerage service arrangements or other expense offset arrangements. Expenses net of all reductions represent the net expenses paid by the Fund. F Amount represents less than $.01 per share. |
See accompanying notes which are an integral part of the financial statements.
Annual Report
Notes to Financial Statements
For the period ended October 31, 2011
1. Organization.
Fidelity Europe Capital Appreciation Fund (the Fund) is a fund of Fidelity Investment Trust (the Trust) and is authorized to issue an unlimited number of shares. The Trust is registered under the Investment Company Act of 1940, as amended (the 1940 Act), as an open-end management investment company organized as a Massachusetts business trust.
2. Investments in Fidelity Central Funds.
The Fund invests in Fidelity Central Funds, which are open-end investment companies available only to other investment companies and accounts managed by Fidelity Management & Research Company (FMR) and its affiliates. The Fund's Schedule of Investments lists each of the Fidelity Central Funds held as of period end, if any, as an investment of the Fund, but does not include the underlying holdings of each Fidelity Central Fund. As an Investing Fund, the Fund indirectly bears its proportionate share of the expenses of the underlying Fidelity Central Funds.
The Money Market Central Funds seek preservation of capital and current income and are managed by Fidelity Investments Money Management, Inc. (FIMM), an affiliate of FMR.
A complete unaudited list of holdings for each Fidelity Central Fund is available upon request or at the Securities and Exchange Commission (the SEC) web site at www.sec.gov. In addition, the financial statements of the Fidelity Central Funds, which are not covered by the Fund's Report of Independent Registered Public Accounting Firm are available on the SEC web site or upon request.
3. Significant Accounting Policies.
The financial statements have been prepared in conformity with accounting principles generally accepted in the United States of America (GAAP), which require management to make certain estimates and assumptions at the date of the financial statements. Actual results could differ from those estimates. Subsequent events, if any, through the date that the financial statements were issued have been evaluated in the preparation of the financial statements. The following summarizes the significant accounting policies of the Fund:
Security Valuation. Investments are valued as of 4:00 p.m. Eastern time on the last calendar day of the period. The Fund uses independent pricing services approved by the Board of Trustees to value its investments. When current market prices or quotations are not readily available or reliable, valuations may be determined in good faith in accordance with procedures adopted by the Board of Trustees. Factors used in determining value may include market or security specific events. The frequency with which these procedures are used cannot be predicted and they may be utilized to a significant extent. The value used for net asset value (NAV) calculation under these procedures may differ from published prices for the same securities.
The Fund categorizes the inputs to valuation techniques used to value its investments into a disclosure hierarchy consisting of three levels as shown below:
Level 1 - quoted prices in active markets for identical investments
Level 2 - other significant observable inputs (including quoted prices for similar investments, interest rates, prepayment speeds, etc.)
Level 3 - unobservable inputs (including the Fund's own assumptions based on the best information available)
Changes in valuation techniques may result in transfers in or out of an assigned level within the disclosure hierarchy. The aggregate value of investments by input level, as of October 31, 2011, is included at the end of the Fund's Schedule of Investments. Valuation techniques used to value the Fund's investments by major category are as follows:
Equity securities, including restricted securities, for which market quotations are readily available, are valued at the last reported sale price or official closing price as reported by an independent pricing service on the primary market or exchange on which they are traded and are categorized as Level 1 in the hierarchy. In the event there were no sales during the day or closing prices are not available, securities are valued at the last quoted bid price or may be valued using the last available price and are generally categorized as Level 2 in the hierarchy. For foreign equity securities, when significant market or security specific events arise, comparisons to the valuation of American Depositary Receipts (ADRs), futures contracts, Exchange-traded funds (ETFs) and certain indexes as well as quoted prices for similar securities are used and are categorized as Level 2 in the hierarchy in these circumstances. Utilizing these techniques may result in transfers between Level 1 and Level 2. For restricted equity securities and private placements where observable inputs are limited, assumptions about market activity and risk are used and are categorized as Level 3 in the hierarchy.
Investments in open-end mutual funds, including the other Fidelity Central Funds, are valued at their closing net asset value each business day and are categorized as Level 1 in the hierarchy.
Annual Report
3. Significant Accounting Policies - continued
Foreign Currency. The Fund may use foreign currency contracts to facilitate transactions in foreign-denominated securities. Gains and losses from these transactions may arise from changes in the value of the foreign currency or if the counterparties do not perform under the contracts' terms.
Foreign-denominated assets, including investment securities, and liabilities are translated into U.S. dollars at the exchange rate at period end. Purchases and sales of investment securities, income and dividends received and expenses denominated in foreign currencies are translated into U.S. dollars at the exchange rate in effect on the transaction date.
The effects of exchange rate fluctuations on investments are included with the net realized and unrealized gain (loss) on investment securities. Other foreign currency transactions resulting in realized and unrealized gain (loss) are disclosed separately.
Investment Transactions and Income. For financial reporting purposes, the Fund's investment holdings and NAV include trades executed through the end of the last business day of the period. The NAV per share for processing shareholder transactions is calculated as of the close of business of the New York Stock Exchange (NYSE), normally 4:00 p.m. Eastern time and includes trades executed through the end of the prior business day. Gains and losses on securities sold are determined on the basis of identified cost and may include proceeds received from litigation. Dividend income is recorded on the ex-dividend date, except for certain dividends from foreign securities where the ex-dividend date may have passed, which are recorded as soon as the Fund is informed of the ex-dividend date. Non-cash dividends included in dividend income, if any, are recorded at the fair market value of the securities received. Distributions received on securities that represent a return of capital or capital gain are recorded as a reduction of cost of investments and/or as a realized gain. The Fund estimates the components of distributions received that may be considered return of capital distributions or capital gain distributions. Interest income and distributions from the Fidelity Central Funds are accrued as earned. Interest income includes coupon interest and amortization of premium and accretion of discount on debt securities. Investment income is recorded net of foreign taxes withheld where recovery of such taxes is uncertain.
Expenses. Expenses directly attributable to a fund are charged to that fund. Expenses attributable to more than one fund are allocated among the respective funds on the basis of relative net assets or other appropriate methods. Expense estimates are accrued in the period to which they relate and adjustments are made when actual amounts are known.
Income Tax Information and Distributions to Shareholders. Each year, the Fund intends to qualify as a regulated investment company, including distributing substantially all of its taxable income and realized gains under Subchapter M of the Internal Revenue Code and filing its U.S. federal tax return. As a result, no provision for income taxes is required. As of October 31, 2011, the Fund did not have any unrecognized tax benefits in the financial statements. A fund's federal tax return is subject to examination by the Internal Revenue Service (IRS) for a period of three years. Foreign taxes are provided for based on the Fund's understanding of the tax rules and rates that exist in the foreign markets in which it invests.
Distributions are declared and recorded on the ex-dividend date. Income and capital gain distributions are determined in accordance with income tax regulations, which may differ from GAAP.
Capital accounts within the financial statements are adjusted for permanent book-tax differences. These adjustments have no impact on net assets or the results of operations. Temporary book-tax differences will reverse in a subsequent period.
Book-tax differences are primarily due to certain foreign taxes, foreign currency transaction, passive foreign investment companies (PFIC), deferred trustees compensation, capital loss carry forwards, and losses deferred due to wash sales.
The federal tax cost of investment securities and unrealized appreciation (depreciation) as of period end were as follows:
Gross unrealized appreciation | $ 23,607,763 |
Gross unrealized depreciation | (45,118,585) |
Net unrealized appreciation (depreciation) on securities and other investments | $ (21,510,822) |
| |
Tax Cost | $ 354,200,806 |
The tax-based components of distributable earnings as of period end were as follows:
Undistributed ordinary income | $ 6,563,594 |
Capital loss carryforward | $ (284,476,015) |
Net unrealized appreciation (depreciation) | $ (21,444,481) |
Annual Report
Notes to Financial Statements - continued
3. Significant Accounting Policies - continued
Income Tax Information and Distributions to Shareholders - continued
Under the recently enacted Regulated Investment Company Modernization Act of 2010 (the Act), the Fund will be permitted to carry forward capital losses incurred in taxable years beginning after December 22, 2010 for an unlimited period. However, any losses incurred during those future taxable years will be required to be utilized prior to any losses incurred in pre-enactment taxable years, which generally expire after eight years from when they are incurred. Additionally, post-enactment capital losses that are carried forward will retain their character as either short-term or long-term capital losses rather than being considered all short-term as under previous law. The Fund's first fiscal year end subject to the Act will be October 31, 2012.
The tax character of distributions paid was as follows:
| October 31, 2011 | October 31, 2010 |
Ordinary Income | $ 4,458,817 | $ 9,633,705 |
Short-Term Trading (Redemption) Fees. Shares held by investors in the Fund less than 30 days are subject to a redemption fee equal to 1.00% of the net asset value of shares redeemed. All redemption fees, which reduce the proceeds of the shareholder redemption, are retained by the Fund and accounted for as an addition to paid in capital.
New Accounting Pronouncement. In May 2011, the Financial Accounting Standards Board issued Accounting Standard Update No. 2011-04, Fair Value Measurement (Topic 820) - Amendments to Achieve Common Fair Value Measurement and Disclosure Requirements in U.S. GAAP and IFRSs. The update changes the wording used to describe the requirements in GAAP for measuring fair value and for disclosing information about fair value measurements. The update is effective during interim and annual periods beginning after December 15, 2011. Management is currently evaluating the impact of the update's adoption on the Fund's financial statement disclosures.
4. Purchases and Sales of Investments.
Purchases and sales of securities, other than short-term securities, aggregated $473,380,966 and $562,767,276, respectively.
5. Fees and Other Transactions with Affiliates.
Management Fee. FMR and its affiliates provide the Fund with investment management related services for which the Fund pays a monthly management fee. The management fee is the sum of an individual fund fee rate that is based on an annual rate of .45% of the Fund's average net assets and a group fee rate that averaged .26% during the period. The group fee rate is based upon the average net assets of all the mutual funds advised by FMR. The group fee rate decreases as assets under management increase and increases as assets under management decrease. In addition, the management fee is subject to a performance adjustment (up to a maximum of ± .20% of the Fund's average net assets over a 36 month performance period). The upward or downward adjustment to the management fee is based on the Fund's relative investment performance as compared to an appropriate benchmark index. For the period, the total annual management fee rate, including the performance adjustment, was .68% of the Fund's average net assets.
Transfer Agent Fees. Fidelity Investments Institutional Operations Company, Inc. (FIIOC), an affiliate of FMR, is the Fund's transfer, dividend disbursing and shareholder servicing agent. FIIOC receives account fees and asset-based fees that vary according to account size and type of account. FIIOC pays for typesetting, printing and mailing of shareholder reports, except proxy statements. For the period, the transfer agent fees were equivalent to an annual rate of .25% of average net assets.
Accounting and Security Lending Fees. Fidelity Service Company, Inc. (FSC), an affiliate of FMR, maintains the Fund's accounting records. The accounting fee is based on the level of average net assets for the month. Under a separate contract, FSC administers the security lending program. The security lending fee is based on the number and duration of lending transactions.
Brokerage Commissions. The Fund placed a portion of its portfolio transactions with brokerage firms which are affiliates of the investment adviser. The commissions paid to these affiliated firms were $1,660 for the period.
Interfund Lending Program. Pursuant to an Exemptive Order issued by the SEC, the Fund, along with other registered investment companies having management contracts with FMR, may participate in an interfund lending program. This program provides an alternative credit facility allowing the funds to borrow from, or lend money to, other participating affiliated funds. At period end, there were no interfund loans outstanding.
Annual Report
5. Fees and Other Transactions with Affiliates - continued
Interfund Lending Program - continued
The Fund's activity in this program during the period for which loans were outstanding was as follows:
Borrower or Lender | Average Daily
Loan Balance | Weighted Average Interest Rate | Interest
Expense |
Borrower | $ 5,438,000 | .34% | $ 156 |
6. Committed Line of Credit.
The Fund participates with other funds managed by FMR or an affiliate in a $4.0 billion credit facility (the "line of credit") to be utilized for temporary or emergency purposes to fund shareholder redemptions or for other short-term liquidity purposes. The Fund has agreed to pay commitment fees on its pro-rata portion of the line of credit, which amounted to $1,304 and is reflected in Miscellaneous expenses on the Statement of Operations. During the period, there were no borrowings on this line of credit.
7. Security Lending.
The Fund lends portfolio securities through a lending agent from time to time in order to earn additional income. For equity securities, a lending agent is used and may loan securities to certain qualified borrowers, including Fidelity Capital Markets (FCM), a broker-dealer affiliated with the Fund. On the settlement date of the loan, the Fund receives collateral (in the form of U.S. Treasury obligations, letters of credit and/or cash) against the loaned securities and maintains collateral in an amount not less than 100% of the market value of the loaned securities during the period of the loan. The market value of the loaned securities is determined at the close of business of the Fund and any additional required collateral is delivered to the Fund on the next business day. If the borrower defaults on its obligation to return the securities loaned because of insolvency or other reasons, a fund could experience delays and costs in recovering the securities loaned or in gaining access to the collateral. Any cash collateral received is invested in the Fidelity Securities Lending Cash Central Fund. The value of loaned securities and cash collateral at period end are disclosed on the Fund's Statement of Assets and Liabilities. Security lending income represents the income earned on investing cash collateral, less rebates paid to borrowers and any lending agent fees associated with the loan, plus any premium payments received for lending certain types of securities. Security lending income is presented in the Statement of Operations as a component of income from Fidelity Central Funds. Total security lending income during the period amounted to $339,291. During the period, there were no securities loaned to FCM.
8. Expense Reductions.
Many of the brokers with whom FMR places trades on behalf of the Fund provided services to the Fund in addition to trade execution. These services included payments of certain expenses on behalf of the Fund totaling $183,725 for the period.
9. Other.
The Fund's organizational documents provide former and current trustees and officers with a limited indemnification against liabilities arising in connection with the performance of their duties to the Fund. In the normal course of business, the Fund may also enter into contracts that provide general indemnifications. The Fund's maximum exposure under these arrangements is unknown as this would be dependent on future claims that may be made against the Fund. The risk of material loss from such claims is considered remote.
Annual Report
Fidelity Europe Fund
Performance: The Bottom Line
Average annual total return reflects the change in the value of an investment, assuming reinvestment of the fund's distributions from dividend income and capital gains (the profits earned upon the sale of securities that have grown in value, if any) and assuming a constant rate of performance each year. The $10,000 table and the fund's returns do not reflect the deduction of taxes that a shareholder would pay on fund distributions or the redemption of fund shares. During periods of reimbursement by Fidelity, a fund's total return will be greater than it would be had the reimbursement not occurred. How a fund did yesterday is no guarantee of how it will do tomorrow.
Average Annual Total Returns
Periods ended October 31, 2011 | Past 1
year | Past 5
years | Past 10
years |
Fidelity Europe Fund | -8.32% | -2.62% | 6.60% |
$10,000 Over 10 Years
Let's say hypothetically that $10,000 was invested in Fidelity Europe Fund on October 31, 2001. The chart shows how the value of your investment would have changed, and also shows how the MSCI Europe Index performed over the same period.
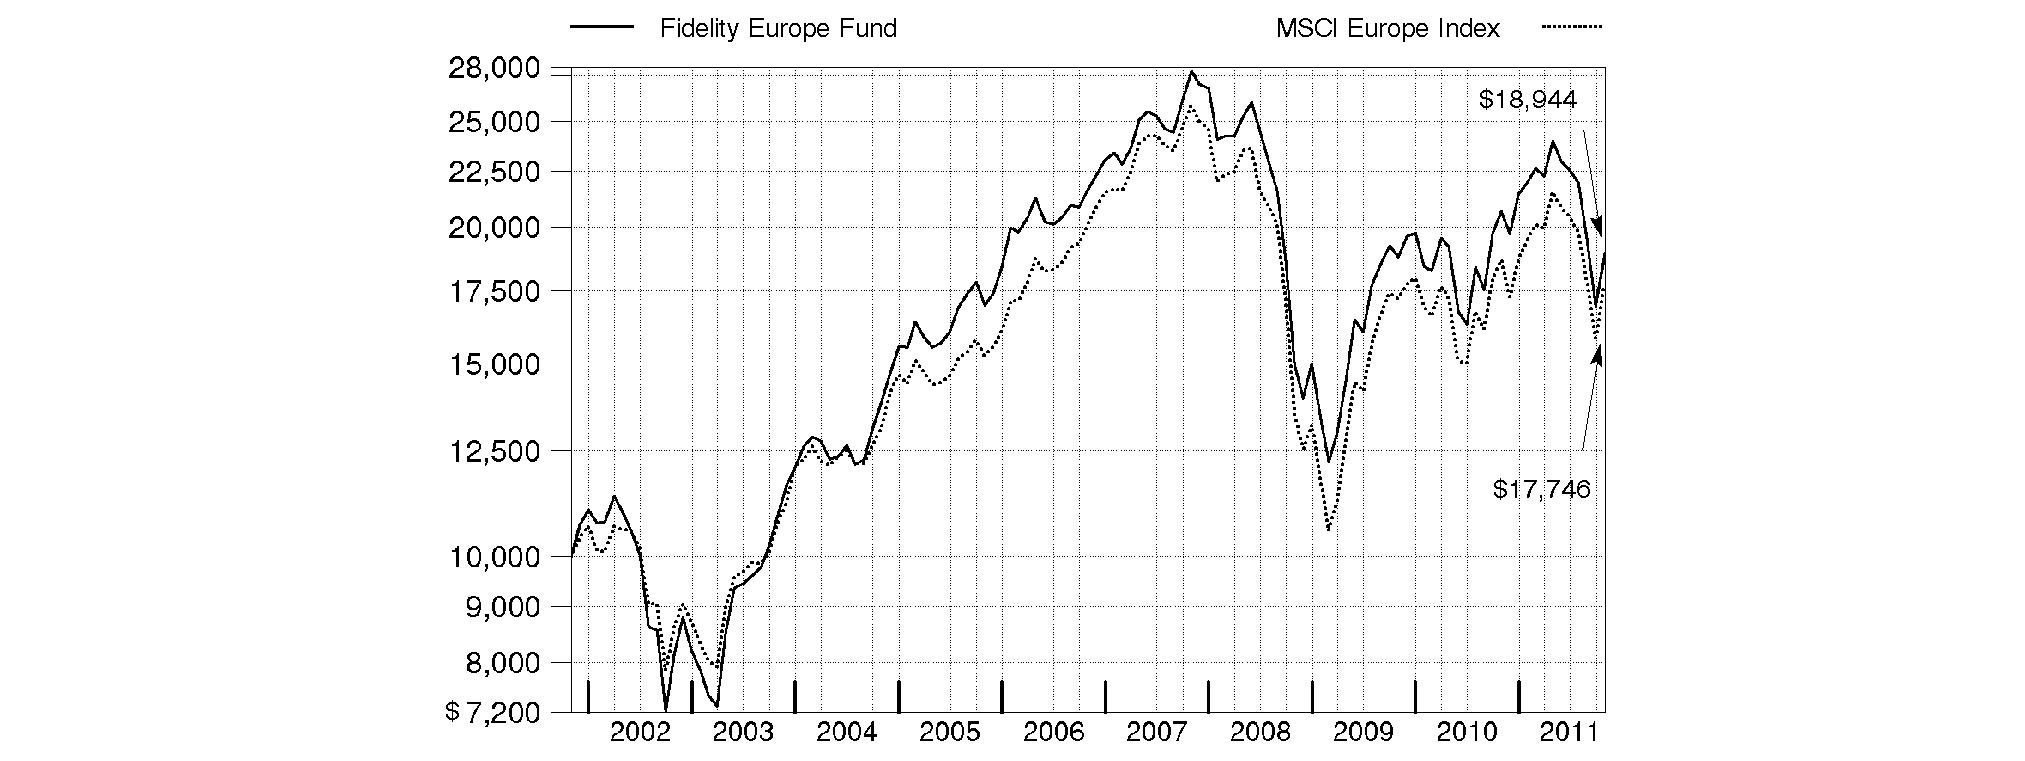
Annual Report
Fidelity Europe Fund
Market Recap: International equities were rocked by a number of headline events during the year ending October 31, 2011. Stocks posted a solid advance for the first half of the period, despite concern about the sovereign debt crisis in Europe, a devastating earthquake and tsunami in Japan, and political upheaval in the Middle East and North Africa. Sentiment turned decidedly negative in the second half, however, as fresh worries about Europe, inflation in China and a dimmed outlook for global growth caused foreign markets to suffer declines that intensified in August and September. October brought with it yet another dramatic swing, as euro zone policymakers appeared near a resolution to the debt debacle and buyers stormed back onto the scene in search of bargains. Still, those gains - along with favorable currency fluctuations overall - weren't enough to offset prior losses, and the MSCI® ACWI® (All Country World Index) ex USA Index finished the period down 4.56%. Within the MSCI index, Europe and emerging markets suffered the biggest declines, with many countries in these areas sustaining steep losses. By contrast, Japan showed resilience in the wake of its natural disasters, falling only 2%. Australia (+4%), Switzerland (+3%), the U.K. (+2%) and Canada, which produced a nominal return, were among the few major benchmark components to break into positive territory.
Comments from Melissa Reilly, Portfolio Manager of Fidelity® Europe Fund: For the year, the fund declined 8.32%, while the MSCI® Europe Index fell 5.01%. Several factors fueled the fund's underperformance versus the MSCI index: stock picking in financials, especially banks; positioning in the pharmaceuticals/biotechnology/life science group of health care; picks in energy and information technology; a modest stake in cash; and positioning in the food/beverage/tobacco area of consumer staples. Individual detractors included: Spain's Mediaset Espana Comunicacion, French banks Societe Generale and BNP Paribas, and British bank Lloyds Banking Group. Underweighting Germany-based chemicals company BASF hurt, as did underweighting the U.K.'s GlaxoSmithKline and not owning Roche Holding, two outperforming pharmaceutical companies in the index. From a geographic perspective, picks in the U.K., Norway and Spain hurt the most. Aiding the fund were positioning in industrials, particularly capital goods; stock selection in the automobiles/components segment of consumer discretionary; positioning in utilities; and holdings in telecommunication services. On an individual security basis, the following positions were beneficial: an out-of-index position in the U.K.'s Carphone Warehouse Group, German car manufacturer Volkswagen; U.K. software developer Autonomy, which was being acquired by Hewlett-Packard; an out-of-index holding in Russian fertilizer company Uralkali; and an out-of-index position in Mead Johnson Nutrition, a U.S.-based manufacturer of infant formula. On a country basis, holdings in Germany and the Bailiwick of Jersey, the largest of the Channel Islands, helped the most. Several of the stocks I've mentioned were sold from the fund by period end.
The views expressed above reflect those of the portfolio manager(s) only through the end of the period as stated on the cover of this report and do not necessarily represent the views of Fidelity or any other person in the Fidelity organization. Any such views are subject to change at any time based upon market or other conditions and Fidelity disclaims any responsibility to update such views. These views may not be relied on as investment advice and, because investment decisions for a Fidelity fund are based on numerous factors, may not be relied on as an indication of trading intent on behalf of any Fidelity fund.
Annual Report
Fidelity Europe Fund
As a shareholder of the Fund, you incur two types of costs: (1) transaction costs, including redemption fees, and (2) ongoing costs, including management fees and other Fund expenses. This Example is intended to help you understand your ongoing costs (in dollars) of investing in the Fund and to compare these costs with the ongoing costs of investing in other mutual funds.
The Example is based on an investment of $1,000 invested at the beginning of the period and held for the entire period (May 1, 2011 to October 31, 2011).
Actual Expenses
The first line of the accompanying table provides information about actual account values and actual expenses. You may use the information in this line, together with the amount you invested, to estimate the expenses that you paid over the period. Simply divide your account value by $1,000.00 (for example, an $8,600 account value divided by $1,000.00 = 8.6), then multiply the result by the number in the first line under the heading entitled "Expenses Paid During Period" to estimate the expenses you paid on your account during this period. A small balance maintenance fee of $12.00 that is charged once a year may apply for certain accounts with a value of less than $2,000. This fee is not included in the table below. If it was, the estimate of expenses you paid during the period would be higher, and your ending account value lower, by this amount. In addition, the Fund, as a shareholder in the underlying Fidelity Central Funds, will indirectly bear its pro-rata share of the fees and expenses incurred by the underlying Fidelity Central Funds. These fees and expenses are not included in the Fund's annualized expense ratio used to calculate the expense estimate in the table below.
Hypothetical Example for Comparison Purposes
The second line of the accompanying table provides information about hypothetical account values and hypothetical expenses based on the Fund's actual expense ratio and an assumed rate of return of 5% per year before expenses, which is not the Fund's actual return. The hypothetical account values and expenses may not be used to estimate the actual ending account balance or expenses you paid for the period. You may use this information to compare the ongoing costs of investing in the Fund and other funds. To do so, compare this 5% hypothetical example with the 5% hypothetical examples that appear in the shareholder reports of the other funds. A small balance maintenance fee of $12.00 that is charged once a year may apply for certain accounts with a value of less than $2,000. This fee is not included in the table below. If it was, the estimate of expenses you paid during the period would be higher, and your ending account value lower, by this amount. In addition, the Fund, as a shareholder in the underlying Fidelity Central Funds, will indirectly bear its pro-rata share of the fees and expenses incurred by the underlying Fidelity Central Funds. These fees and expenses are not included in the Fund's annualized expense ratio used to calculate the expense estimate in the table below.
Please note that the expenses shown in the table are meant to highlight your ongoing costs only and do not reflect any transaction costs. Therefore, the second line of the table is useful in comparing ongoing costs only, and will not help you determine the relative total costs of owning different funds. In addition, if these transactional costs were included, your costs would have been higher.
| Annualized
Expense Ratio | Beginning
Account Value
May 1, 2011 | Ending
Account Value
October 31, 2011 | Expenses Paid
During Period*
May 1, 2011 to
October 31, 2011 |
Actual | .98% | $ 1,000.00 | $ 790.30 | $ 4.42 |
Hypothetical (5% return per year before expenses) | | $ 1,000.00 | $ 1,020.27 | $ 4.99 |
* Expenses are equal to the Fund's annualized expense ratio, multiplied by the average account value over the period, multiplied by 184/365 (to reflect the one-half year period).
Annual Report
Fidelity Europe Fund
Investment Changes (Unaudited)
Geographic Diversification (% of fund's net assets) |
As of October 31, 2011 |
| United Kingdom | 33.9% | |
| France | 16.9% | |
| Germany | 10.1% | |
| Switzerland | 8.8% | |
| United States of America | 5.4% | |
| Italy | 4.9% | |
| Spain | 4.5% | |
| Netherlands | 3.2% | |
| Sweden | 3.0% | |
| Other | 9.3% | |

Percentages are adjusted for the effect of futures contracts, if applicable. |
As of April 30, 2011 |
| United Kingdom | 29.3% | |
| France | 14.9% | |
| Germany | 10.0% | |
| Spain | 7.3% | |
| Switzerland | 4.9% | |
| Italy | 4.6% | |
| United States of America | 4.3% | |
| Denmark | 3.3% | |
| Russia | 3.2% | |
| Other | 18.2% | |

Percentages are adjusted for the effect of futures contracts, if applicable. |
Asset Allocation |
| % of fund's
net assets | % of fund's net assets
6 months ago |
Stocks | 99.3 | 99.2 |
Short-Term Investments and Net Other Assets | 0.7 | 0.8 |
Top Ten Stocks as of October 31, 2011 |
| % of fund's
net assets | % of fund's net assets
6 months ago |
Royal Dutch Shell PLC Class A (Netherlands) (United Kingdom, Oil, Gas & Consumable Fuels) | 5.0 | 3.5 |
Nestle SA (Switzerland, Food Products) | 3.8 | 0.0 |
Sanofi-aventis (France, Pharmaceuticals) | 3.2 | 0.0 |
Vodafone Group PLC (United Kingdom, Wireless Telecommunication Services) | 2.9 | 2.3 |
Carphone Warehouse Group PLC (United Kingdom, Specialty Retail) | 2.7 | 2.3 |
BG Group PLC (United Kingdom, Oil, Gas & Consumable Fuels) | 2.4 | 1.9 |
GlaxoSmithKline PLC (United Kingdom, Pharmaceuticals) | 2.0 | 0.0 |
British American Tobacco PLC (United Kingdom) (United Kingdom, Tobacco) | 1.9 | 0.0 |
HSBC Holdings PLC (United Kingdom) (United Kingdom, Commercial Banks) | 1.9 | 1.7 |
Unilever PLC (United Kingdom, Food Products) | 1.8 | 0.0 |
| 27.6 | |
Market Sectors as of October 31, 2011 |
| % of fund's
net assets | % of fund's net assets
6 months ago |
Financials | 22.4 | 19.6 |
Consumer Discretionary | 17.2 | 20.7 |
Energy | 11.9 | 12.4 |
Health Care | 10.5 | 4.4 |
Consumer Staples | 10.2 | 6.1 |
Industrials | 8.8 | 11.2 |
Materials | 7.2 | 11.0 |
Information Technology | 6.4 | 7.1 |
Telecommunication Services | 3.7 | 4.8 |
Utilities | 1.0 | 1.9 |
Annual Report
Fidelity Europe Fund
Investments October 31, 2011
Showing Percentage of Net Assets
Common Stocks - 96.8% |
| Shares | | Value |
Australia - 0.4% |
Fortescue Metals Group Ltd. | 465,602 | | $ 2,338,868 |
Bailiwick of Guernsey - 0.5% |
Resolution Ltd. | 626,200 | | 2,769,401 |
Bailiwick of Jersey - 2.9% |
Experian PLC | 464,100 | | 6,049,293 |
Randgold Resources Ltd. sponsored ADR | 40,000 | | 4,382,800 |
Shire PLC | 237,598 | | 7,458,544 |
TOTAL BAILIWICK OF JERSEY | | 17,890,637 |
Bermuda - 0.3% |
Lazard Ltd. Class A | 74,700 | | 2,042,298 |
British Virgin Islands - 0.6% |
Mail.ru Group Ltd. GDR (Reg. S) | 109,200 | | 3,761,940 |
China - 0.6% |
Baidu.com, Inc. sponsored ADR (a) | 27,400 | | 3,840,932 |
Denmark - 1.6% |
Danske Bank A/S (a) | 264,010 | | 3,658,110 |
Novo Nordisk A/S Series B | 59,101 | | 6,275,535 |
TOTAL DENMARK | | 9,933,645 |
France - 16.9% |
Alstom SA | 146,536 | | 5,495,641 |
Arkema SA | 64,000 | | 4,378,438 |
Atos Origin SA | 88,227 | | 4,275,849 |
BNP Paribas SA | 190,261 | | 8,649,477 |
Christian Dior SA | 20,100 | | 2,845,617 |
Compagnie Generale de Geophysique SA (a) | 121,200 | | 2,648,530 |
Danone | 140,700 | | 9,794,151 |
Edenred | 147,100 | | 4,173,220 |
GDF Suez | 113,900 | | 3,233,702 |
Iliad SA | 42,255 | | 4,945,959 |
JC Decaux SA (a) | 163,700 | | 4,387,033 |
LVMH Moet Hennessy - Louis Vuitton | 42,385 | | 7,053,456 |
PPR SA | 56,200 | | 8,780,818 |
Publicis Groupe SA | 101,800 | | 4,935,767 |
Safran SA | 140,600 | | 4,605,622 |
Sanofi-aventis | 274,468 | | 19,638,014 |
Unibail-Rodamco | 26,100 | | 5,219,310 |
TOTAL FRANCE | | 105,060,604 |
Germany - 7.6% |
Allianz AG | 66,846 | | 7,512,589 |
BASF AG | 91,246 | | 6,716,585 |
Bayer AG | 108,900 | | 6,976,967 |
Deutsche Bank AG | 87,600 | | 3,622,658 |
E.ON AG | 114,624 | | 2,777,579 |
Fresenius Medical Care AG & Co. KGaA | 63,100 | | 4,597,231 |
HeidelbergCement AG | 72,000 | | 3,286,154 |
|
| Shares | | Value |
Kabel Deutschland Holding AG (a) | 64,000 | | $ 3,654,382 |
SAP AG | 137,877 | | 8,338,343 |
TOTAL GERMANY | | 47,482,488 |
Ireland - 0.3% |
Elan Corp. PLC (a) | 159,500 | | 1,891,814 |
Italy - 4.9% |
Amplifon SpA | 368,500 | | 1,772,646 |
ENI SpA | 406,300 | | 8,982,119 |
Fiat Industrial SpA (a) | 543,600 | | 4,743,176 |
Intesa Sanpaolo SpA | 3,088,273 | | 5,517,555 |
Prada SpA | 1,271,400 | | 6,285,107 |
Prysmian SpA | 218,600 | | 3,312,600 |
TOTAL ITALY | | 30,613,203 |
Netherlands - 3.2% |
AEGON NV (a) | 1,082,000 | | 5,160,747 |
ING Groep NV (Certificaten Van Aandelen) (a) | 962,300 | | 8,297,166 |
Koninklijke Philips Electronics NV | 188,300 | | 3,920,353 |
Yandex NV | 91,500 | | 2,518,080 |
TOTAL NETHERLANDS | | 19,896,346 |
Norway - 1.8% |
Aker Solutions ASA | 315,200 | | 3,665,709 |
Storebrand ASA (A Shares) | 1,214,000 | | 7,485,563 |
TOTAL NORWAY | | 11,151,272 |
Poland - 0.3% |
Eurocash SA | 261,800 | | 2,099,076 |
Spain - 4.5% |
Banco Bilbao Vizcaya Argentaria SA | 1,033,195 | | 9,300,015 |
Banco Santander SA: | | | |
rights 10/31/11 | 867,068 | | 149,992 |
(Spain) | 578,399 | | 4,896,197 |
Grifols SA (a) | 162,900 | | 3,040,022 |
Inditex SA | 90,425 | | 8,229,151 |
Mediaset Espana Comunicacion (d) | 385,440 | | 2,560,370 |
TOTAL SPAIN | | 28,175,747 |
Sweden - 3.0% |
H&M Hennes & Mauritz AB (B Shares) | 188,634 | | 6,246,763 |
Swedbank AB (A Shares) | 388,917 | | 5,479,217 |
Telefonaktiebolaget LM Ericsson (B Shares) | 631,454 | | 6,579,858 |
TOTAL SWEDEN | | 18,305,838 |
Switzerland - 8.8% |
Adecco SA (Reg.) | 86,858 | | 4,197,650 |
Bank Sarasin & Co. Ltd. Series B (Reg.) | 76,910 | | 2,935,998 |
Compagnie Financiere Richemont SA Series A | 124,856 | | 7,149,466 |
Nestle SA | 412,533 | | 23,927,901 |
Schindler Holding AG (participation certificate) | 44,604 | | 5,245,437 |
Common Stocks - continued |
| Shares | | Value |
Switzerland - continued |
Transocean Ltd. (United States) | 65,300 | | $ 3,731,895 |
UBS AG (NY Shares) (a) | 574,900 | | 7,255,238 |
TOTAL SWITZERLAND | | 54,443,585 |
United Kingdom - 33.9% |
Aegis Group PLC | 1,948,272 | | 4,298,766 |
Aviva PLC | 757,800 | | 4,134,998 |
Barclays PLC | 3,003,177 | | 9,311,414 |
BG Group PLC | 670,238 | | 14,621,398 |
BHP Billiton PLC | 241,250 | | 7,598,256 |
British American Tobacco PLC (United Kingdom) | 261,900 | | 12,010,439 |
British Land Co. PLC | 712,277 | | 5,847,695 |
Carphone Warehouse Group PLC | 2,917,789 | | 16,470,283 |
Filtrona PLC | 559,200 | | 3,571,142 |
GlaxoSmithKline PLC | 556,900 | | 12,500,482 |
HSBC Holdings PLC (United Kingdom) | 1,341,322 | | 11,705,632 |
Invensys PLC | 503,800 | | 1,827,026 |
Lloyds Banking Group PLC (a) | 10,928,200 | | 5,652,280 |
Meggitt PLC | 802,300 | | 4,962,336 |
Micro Focus International PLC | 539,100 | | 2,944,266 |
Misys PLC | 479,237 | | 2,248,929 |
Next PLC | 127,300 | | 5,232,742 |
Rolls-Royce Group PLC | 338,400 | | 3,823,110 |
Rolls-Royce Group PLC Class C | 23,349,600 | | 37,551 |
Royal Dutch Shell PLC: | | | |
Class A (Netherlands) | 760,300 | | 26,963,843 |
Class A (United Kingdom) | 109,000 | | 3,862,012 |
Standard Chartered PLC (United Kingdom) | 353,569 | | 8,296,015 |
Tullow Oil PLC | 183,800 | | 4,147,088 |
Unilever PLC | 333,800 | | 11,191,116 |
Vodafone Group PLC | 6,588,900 | | 18,298,720 |
Xstrata PLC | 537,400 | | 9,035,699 |
TOTAL UNITED KINGDOM | | 210,593,238 |
United States of America - 4.7% |
Apple, Inc. (a) | 6,500 | | 2,631,070 |
Beam, Inc. | 40,100 | | 1,982,143 |
Dunkin' Brands Group, Inc. (a) | 2,100 | | 61,131 |
Fluor Corp. | 46,100 | | 2,620,785 |
Halliburton Co. | 71,100 | | 2,656,296 |
Mead Johnson Nutrition Co. Class A | 40,700 | | 2,924,295 |
Morgan Stanley | 223,700 | | 3,946,068 |
|
| Shares | | Value |
Noble Energy, Inc. | 33,700 | | $ 3,010,758 |
Perrigo Co. | 14,900 | | 1,345,172 |
salesforce.com, Inc. (a) | 16,400 | | 2,183,988 |
The Mosaic Co. | 54,000 | | 3,162,240 |
Virgin Media, Inc. | 113,400 | | 2,764,692 |
TOTAL UNITED STATES OF AMERICA | | 29,288,638 |
TOTAL COMMON STOCKS (Cost $625,474,447) | 601,579,570 |
Nonconvertible Preferred Stocks - 2.5% |
| | | |
Germany - 2.5% |
ProSiebenSat.1 Media AG | 347,790 | | 7,460,252 |
Volkswagen AG | 45,300 | | 7,949,177 |
TOTAL NONCONVERTIBLE PREFERRED STOCKS (Cost $13,256,578) | 15,409,429 |
Money Market Funds - 1.1% |
| | | |
Fidelity Cash Central Fund, 0.12% (b) | 2,613,393 | | 2,613,393 |
Fidelity Securities Lending Cash Central Fund, 0.11% (b)(c) | 4,395,000 | | 4,395,000 |
TOTAL MONEY MARKET FUNDS (Cost $7,008,393) | 7,008,393 |
TOTAL INVESTMENT PORTFOLIO - 100.4% (Cost $645,739,418) | | 623,997,392 |
NET OTHER ASSETS (LIABILITIES) - (0.4)% | | (2,218,948) |
NET ASSETS - 100% | $ 621,778,444 |
Legend |
(a) Non-income producing |
(b) Affiliated fund that is available only to investment companies and other accounts managed by Fidelity Investments. The rate quoted is the annualized seven-day yield of the fund at period end. A complete unaudited listing of the fund's holdings as of its most recent quarter end is available upon request. In addition, each Fidelity Central Fund's financial statements, which are not covered by the Fund's Report of Independent Registered Public Accounting Firm, are available on the SEC's website or upon request. |
(c) Investment made with cash collateral received from securities on loan. |
(d) Security or a portion of the security is on loan at period end. |
Affiliated Central Funds |
Information regarding fiscal year to date income earned by the Fund from investments in Fidelity Central Funds is as follows: |
Fund | Income earned |
Fidelity Cash Central Fund | $ 14,227 |
Fidelity Securities Lending Cash Central Fund | 679,184 |
Total | $ 693,411 |
Other Information |
The following is a summary of the inputs used, as of October 31, 2011, involving the Fund's assets and liabilities carried at fair value. The inputs or methodology used for valuing securities may not be an indication of the risk associated with investing in those securities. For more information on valuation inputs, and their aggregation into the levels used in the table below, please refer to the Security Valuation section in the accompanying Notes to Financial Statements. |
Valuation Inputs at Reporting Date: |
Description | Total | Level 1 | Level 2 | Level 3 |
Investments in Securities: | | | | |
Equities: | | | | |
United Kingdom | $ 210,593,238 | $ 87,364,046 | $ 123,229,192 | $ - |
France | 105,060,604 | 82,774,060 | 22,286,544 | - |
Germany | 62,891,917 | 46,333,685 | 16,558,232 | - |
Switzerland | 54,443,585 | 54,443,585 | - | - |
Italy | 30,613,203 | 15,345,977 | 15,267,226 | - |
United States of America | 29,288,638 | 29,288,638 | - | - |
Spain | 28,175,747 | 13,979,535 | 14,196,212 | - |
Netherlands | 19,896,346 | 2,518,080 | 17,378,266 | - |
Sweden | 18,305,838 | 11,725,980 | 6,579,858 | - |
Other | 57,719,883 | 39,755,122 | 17,964,761 | - |
Money Market Funds | 7,008,393 | 7,008,393 | - | - |
Total Investments in Securities: | $ 623,997,392 | $ 390,537,101 | $ 233,460,291 | $ - |
Income Tax Information |
At October 31, 2011, the Fund had a capital loss carryforward of $864,810,581 of which $137,592,624 and $727,217,957 will expire in fiscal 2016 and 2017, respectively. As a result of large redemptions in October 2010, the Fund had an "ownership change" under the Internal Revenue Code, which limits capital losses that will be available to offset future capital gains to approximately $32,000,000 per year plus certain gains in the fund existing at the time of the ownership change. As a result, at least $582,385,646 of the Fund's capital loss carryforward will expire unused. To properly reflect the amount of losses that will expire unused, an adjustment was made between Accumulated Undistributed Net Realized Loss and Paid in Capital in the current period. |
See accompanying notes which are an integral part of the financial statements.
Annual Report
Fidelity Europe Fund
Statement of Assets and Liabilities
| October 31, 2011 |
| | |
Assets | | |
Investment in securities, at value (including securities loaned of $3,923,286) - See accompanying schedule: Unaffiliated issuers (cost $638,731,025) | $ 616,988,999 | |
Fidelity Central Funds (cost $7,008,393) | 7,008,393 | |
Total Investments (cost $645,739,418) | | $ 623,997,392 |
Foreign currency held at value (cost $27,528) | | 27,528 |
Receivable for investments sold | | 10,790,922 |
Receivable for fund shares sold | | 253,798 |
Dividends receivable | | 1,084,677 |
Distributions receivable from Fidelity Central Funds | | 3,380 |
Prepaid expenses | | 543 |
Other receivables | | 119,782 |
Total assets | | 636,278,022 |
| | |
Liabilities | | |
Payable for investments purchased | $ 8,241,226 | |
Payable for fund shares redeemed | 1,433,563 | |
Accrued management fee | 213,385 | |
Other affiliated payables | 144,115 | |
Other payables and accrued expenses | 72,289 | |
Collateral on securities loaned, at value | 4,395,000 | |
Total liabilities | | 14,499,578 |
| | |
Net Assets | | $ 621,778,444 |
Net Assets consist of: | | |
Paid in capital | | $ 917,083,572 |
Undistributed net investment income | | 11,598,984 |
Accumulated undistributed net realized gain (loss) on investments and foreign currency transactions | | (285,170,128) |
Net unrealized appreciation (depreciation) on investments and assets and liabilities in foreign currencies | | (21,733,984) |
Net Assets, for 22,469,493 shares outstanding | | $ 621,778,444 |
Net Asset Value, offering price and redemption price per share ($621,778,444 ÷ 22,469,493 shares) | | $ 27.67 |
Statement of Operations
| Year ended October 31, 2011 |
| | |
Investment Income | | |
Dividends | | $ 21,074,300 |
Interest | | 607 |
Income from Fidelity Central Funds | | 693,411 |
Income before foreign taxes withheld | | 21,768,318 |
Less foreign taxes withheld | | (2,129,809) |
Total income | | 19,638,509 |
| | |
Expenses | | |
Management fee
Basic fee | $ 5,290,033 | |
Performance adjustment | 744,266 | |
Transfer agent fees | 1,575,976 | |
Accounting and security lending fees | 365,944 | |
Custodian fees and expenses | 142,499 | |
Independent trustees' compensation | 4,583 | |
Registration fees | 22,622 | |
Audit | 72,321 | |
Legal | 3,961 | |
Interest | 467 | |
Miscellaneous | 16,363 | |
Total expenses before reductions | 8,239,035 | |
Expense reductions | (312,693) | 7,926,342 |
Net investment income (loss) | | 11,712,167 |
Realized and Unrealized Gain (Loss) Net realized gain (loss) on: | | |
Investment securities: | | |
Unaffiliated issuers | 58,965,984 | |
Foreign currency transactions | 361,274 | |
Total net realized gain (loss) | | 59,327,258 |
Change in net unrealized appreciation (depreciation) on: Investment securities | (126,026,903) | |
Assets and liabilities in foreign currencies | (143,066) | |
Total change in net unrealized appreciation (depreciation) | | (126,169,969) |
Net gain (loss) | | (66,842,711) |
Net increase (decrease) in net assets resulting from operations | | $ (55,130,544) |
See accompanying notes which are an integral part of the financial statements.
Annual Report
Fidelity Europe Fund
Financial Statements - continued
Statement of Changes in Net Assets
| Year ended
October 31,
2011 | Year ended
October 31,
2010 |
Increase (Decrease) in Net Assets | | |
Operations | | |
Net investment income (loss) | $ 11,712,167 | $ 24,024,495 |
Net realized gain (loss) | 59,327,258 | 399,418,776 |
Change in net unrealized appreciation (depreciation) | (126,169,969) | (269,996,849) |
Net increase (decrease) in net assets resulting from operations | (55,130,544) | 153,446,422 |
Distributions to shareholders from net investment income | (16,901,401) | (52,304,897) |
Share transactions - net increase (decrease) | (108,731,265) | (2,163,924,191) |
Redemption fees | 14,873 | 18,688 |
Total increase (decrease) in net assets | (180,748,337) | (2,062,763,978) |
| | |
Net Assets | | |
Beginning of period | 802,526,781 | 2,865,290,759 |
End of period (including undistributed net investment income of $11,598,984 and undistributed net investment income of $16,788,219, respectively) | $ 621,778,444 | $ 802,526,781 |
Financial Highlights
Years ended October 31, | 2011 | 2010 | 2009 | 2008 | 2007 |
Selected Per-Share Data | | | | | |
Net asset value, beginning of period | $ 30.83 | $ 28.52 | $ 23.57 | $ 47.46 | $ 42.31 |
Income from Investment Operations | | | | | |
Net investment income (loss) B | .48 | .33 | .52 | .68 | .69 |
Net realized and unrealized gain (loss) | (2.97) | 2.50 | 5.16 | (20.84) | 9.99 |
Total from investment operations | (2.49) | 2.83 | 5.68 | (20.16) | 10.68 |
Distributions from net investment income | (.67) | (.52) | (.73) | (.65) | (.46) |
Distributions from net realized gain | - | - | - | (3.08) | (5.07) |
Total distributions | (.67) | (.52) | (.73) | (3.73) | (5.53) |
Redemption fees added to paid in capital B, F | - | - | - | - | - |
Net asset value, end of period | $ 27.67 | $ 30.83 | $ 28.52 | $ 23.57 | $ 47.46 |
Total Return A | (8.32)% | 10.01% | 25.36% | (46.03)% | 28.33% |
Ratios to Average Net Assets C, E | | | | | |
Expenses before reductions | 1.10% | 1.12% | 1.09% | 1.00% | 1.06% |
Expenses net of fee waivers, if any | 1.10% | 1.12% | 1.09% | 1.00% | 1.06% |
Expenses net of all reductions | 1.06% | 1.04% | 1.04% | .95% | 1.01% |
Net investment income (loss) | 1.56% | 1.15% | 2.22% | 1.82% | 1.65% |
Supplemental Data | | | | | |
Net assets, end of period (000 omitted) | $ 621,778 | $ 802,527 | $ 2,845,423 | $ 2,751,772 | $ 5,464,623 |
Portfolio turnover rate D | 117% | 136% | 135% | 100% | 100% |
A Total returns would have been lower if certain expenses had not been reduced during the applicable periods shown. B Calculated based on average shares outstanding during the period. C Fees and expenses of any underlying Fidelity Central Funds are not included in the Fund's expense ratio. The Fund indirectly bears its proportionate share of the expenses of any underlying Fidelity Central Funds. D Amount does not include the portfolio activity of any underlying Fidelity Central Funds. E Expense ratios reflect operating expenses of the class. Expenses before reductions do not reflect amounts reimbursed by the investment adviser or reductions from brokerage service arrangements or reductions from other expense offset arrangements and do not represent the amount paid by the class during periods when reimbursements or reductions occur. Expenses net of fee waivers reflect expenses after reimbursement by the investment adviser but prior to reductions from brokerage service arrangements or other expense offset arrangements. Expenses net of all reductions represent the net expenses paid by the class. F Amount represents less than $.01 per share. |
See accompanying notes which are an integral part of the financial statements.
Annual Report
Notes to Financial Statements
For the period ended October 31, 2011
1. Organization.
Fidelity Europe Fund (the Fund) is a fund of Fidelity Investment Trust (the Trust) and is authorized to issue an unlimited number of shares. The Trust is registered under the Investment Company Act of 1940, as amended (the 1940 Act), as an open-end management investment company organized as a Massachusetts business trust. The Fund offered Class F shares during the period June 26, 2009 through October 22, 2010, and all outstanding shares were redeemed by October 22, 2010.
2. Investments in Fidelity Central Funds.
The Fund invests in Fidelity Central Funds, which are open-end investment companies available only to other investment companies and accounts managed by Fidelity Management & Research Company (FMR) and its affiliates. The Fund's Schedule of Investments lists each of the Fidelity Central Funds held as of period end, if any, as an investment of the Fund, but does not include the underlying holdings of each Fidelity Central Fund. As an Investing Fund, the Fund indirectly bears its proportionate share of the expenses of the underlying Fidelity Central Funds.
The Money Market Central Funds seek preservation of capital and current income and are managed by Fidelity Investments Money Management, Inc. (FIMM), an affiliate of FMR.
A complete unaudited list of holdings for each Fidelity Central Fund is available upon request or at the Securities and Exchange Commission (the SEC) web site at www.sec.gov. In addition, the financial statements of the Fidelity Central Funds, which are not covered by the Fund's Report of Independent Registered Public Accounting Firm are available on the SEC web site or upon request.
3. Significant Accounting Policies.
The financial statements have been prepared in conformity with accounting principles generally accepted in the United States of America (GAAP), which require management to make certain estimates and assumptions at the date of the financial statements. Actual results could differ from those estimates. Subsequent events, if any, through the date that the financial statements were issued have been evaluated in the preparation of the financial statements. The following summarizes the significant accounting policies of the Fund:
Security Valuation. Investments are valued as of 4:00 p.m. Eastern time on the last calendar day of the period. The Fund uses independent pricing services approved by the Board of Trustees to value its investments. When current market prices or quotations are not readily available or reliable, valuations may be determined in good faith in accordance with procedures adopted by the Board of Trustees. Factors used in determining value may include market or security specific events. The frequency with which these procedures are used cannot be predicted and they may be utilized to a significant extent. The value used for net asset value (NAV) calculation under these procedures may differ from published prices for the same securities.
The Fund categorizes the inputs to valuation techniques used to value its investments into a disclosure hierarchy consisting of three levels as shown below:
Level 1 - quoted prices in active markets for identical investments
Level 2 - other significant observable inputs (including quoted prices for similar investments, interest rates, prepayment speeds, etc.)
Level 3 - unobservable inputs (including the Fund's own assumptions based on the best information available)
Changes in valuation techniques may result in transfers in or out of an assigned level within the disclosure hierarchy. The aggregate value of investments by input level, as of October 31, 2011, is included at the end of the Fund's Schedule of Investments. Valuation techniques used to value the Fund's investments by major category are as follows:
Equity securities, including restricted securities, for which market quotations are readily available, are valued at the last reported sale price or official closing price as reported by an independent pricing service on the primary market or exchange on which they are traded and are categorized as Level 1 in the hierarchy. In the event there were no sales during the day or closing prices are not available, securities are valued at the last quoted bid price or may be valued using the last available price and are generally categorized as Level 2 in the hierarchy. For foreign equity securities, when significant market or security specific events arise, comparisons to the valuation of American Depositary Receipts (ADRs), futures contracts, Exchange-traded funds (ETFs) and certain indexes as well as quoted prices for similar securities are used and are categorized as Level 2 in the hierarchy in these circumstances. Utilizing these techniques may result in transfers between Level 1 and Level 2. For restricted equity securities and private placements where observable inputs are limited, assumptions about market activity and risk are used and are categorized as Level 3 in the hierarchy.
Investments in open-end mutual funds, including the Fidelity Central Funds, are valued at their closing net asset value each business day and are categorized as Level 1 in the hierarchy.
Annual Report
3. Significant Accounting Policies - continued
Foreign Currency. The Fund may use foreign currency contracts to facilitate transactions in foreign-denominated securities. Gains and losses from these transactions may arise from changes in the value of the foreign currency or if the counterparties do not perform under the contracts' terms.
Foreign-denominated assets, including investment securities, and liabilities are translated into U.S. dollars at the exchange rate at period end. Purchases and sales of investment securities, income and dividends received and expenses denominated in foreign currencies are translated into U.S. dollars at the exchange rate in effect on the transaction date.
The effects of exchange rate fluctuations on investments are included with the net realized and unrealized gain (loss) on investment securities. Other foreign currency transactions resulting in realized and unrealized gain (loss) are disclosed separately.
Investment Transactions and Income. For financial reporting purposes, the Fund's investment holdings and NAV include trades executed through the end of the last business day of the period. The NAV per share for processing shareholder transactions is calculated as of the close of business of the New York Stock Exchange (NYSE), normally 4:00 p.m. Eastern time and includes trades executed through the end of the prior business day. Gains and losses on securities sold are determined on the basis of identified cost and may include proceeds received from litigation. Dividend income is recorded on the ex-dividend date, except for certain dividends from foreign securities where the ex-dividend date may have passed, which are recorded as soon as the Fund is informed of the ex-dividend date. Non-cash dividends included in dividend income, if any, are recorded at the fair market value of the securities received. Distributions received on securities that represent a return of capital or capital gain are recorded as a reduction of cost of investments and/or as a realized gain. The Fund estimates the components of distributions received that may be considered return of capital distributions or capital gain distributions. Interest income and distributions from the Fidelity Central Funds are accrued as earned. Interest income includes coupon interest and amortization of premium and accretion of discount on debt securities. Investment income is recorded net of foreign taxes withheld where recovery of such taxes is uncertain.
Expenses. Expenses directly attributable to a fund are charged to that fund. Expenses attributable to more than one fund are allocated among the respective funds on the basis of relative net assets or other appropriate methods. Expense estimates are accrued in the period to which they relate and adjustments are made when actual amounts are known.
Income Tax Information and Distributions to Shareholders. Each year, the Fund intends to qualify as a regulated investment company, including distributing substantially all of its taxable income and realized gains under Subchapter M of the Internal Revenue Code and filing its U.S. federal tax return. As a result, no provision for income taxes is required. As of October 31, 2011, the Fund did not have any unrecognized tax benefits in the financial statements. A fund's federal tax return is subject to examination by the Internal Revenue Service (IRS) for a period of three years. Foreign taxes are provided for based on the Fund's understanding of the tax rules and rates that exist in the foreign markets in which it invests.
Distributions are declared and recorded on the ex-dividend date. Income dividends and capital gain distributions are declared separately for each class. Income and capital gain distributions are determined in accordance with income tax regulations, which may differ from GAAP.
Capital accounts within the financial statements are adjusted for permanent book-tax differences. These adjustments have no impact on net assets or the results of operations. Temporary book-tax differences will reverse in a subsequent period.
Book-tax differences are primarily due to passive foreign investment companies (PFIC), foreign currency transactions, deferred trustees compensation, capital loss carryforwards and losses deferred due to wash sales.
The federal tax cost of investment securities and unrealized appreciation (depreciation) as of period end were as follows:
Gross unrealized appreciation | $ 50,053,432 |
Gross unrealized depreciation | (74,902,943) |
Net unrealized appreciation (depreciation) on securities and other investments | $ (24,849,511) |
| |
Tax Cost | $ 648,846,903 |
The tax-based components of distributable earnings as of period end were as follows:
Undistributed ordinary income | $ 11,961,889 |
Capital loss carryforward | $ (282,424,937) |
Net unrealized appreciation (depreciation) | $ (24,841,469) |
Annual Report
Notes to Financial Statements - continued
3. Significant Accounting Policies - continued
Income Tax Information and Distributions to Shareholders - continued
Under the recently enacted Regulated Investment Company Modernization Act of 2010 (the Act), the Fund will be permitted to carry forward capital losses incurred in taxable years beginning after December 22, 2010 for an unlimited period. However, any losses incurred during those future taxable years will be required to be utilized prior to any losses incurred in pre-enactment taxable years, which generally expire after eight years from when they are incurred. Additionally, post-enactment capital losses that are carried forward will retain their character as either short-term or long-term capital losses rather than being considered all short-term as under previous law. The Fund's first fiscal year end subject to the Act will be October 31, 2012.
The tax character of distributions paid was as follows:
| October 31, 2011 | October 31, 2010 |
Ordinary Income | $ 16,901,401 | $ 52,304,897 |
Short-Term Trading (Redemption) Fees. Shares held by investors in the Fund less than 30 days are subject to a redemption fee equal to 1.00% of the net asset value of shares redeemed. All redemption fees, which reduce the proceeds of the shareholder redemption, are retained by the Fund and accounted for as an addition to paid in capital.
New Accounting Pronouncement. In May 2011, the Financial Accounting Standards Board issued Accounting Standard Update No. 2011-04, Fair Value Measurement (Topic 820) - Amendments to Achieve Common Fair Value Measurement and Disclosure Requirements in U.S. GAAP and IFRSs. The update changes the wording used to describe the requirements in GAAP for measuring fair value and for disclosing information about fair value measurements. The update is effective during interim and annual periods beginning after December 15, 2011. Management is currently evaluating the impact of the update's adoption on the Fund's financial statement disclosures.
4. Purchases and Sales of Investments.
Purchases and sales of securities, other than short-term securities, aggregated $870,047,447 and $963,591,860, respectively.
5. Fees and Other Transactions with Affiliates.
Management Fee. FMR and its affiliates provide the Fund with investment management related services for which the Fund pays a monthly management fee. The management fee is the sum of an individual fund fee rate that is based on an annual rate of .45% of the Fund's average net assets and a group fee rate that averaged .26% during the period. The group fee rate is based upon the average net assets of all the mutual funds advised by FMR. The group fee rate decreases as assets under management increase and increases as assets under management decrease. In addition, the management fee is subject to a performance adjustment (up to a maximum of ± .20% of the Fund's average net assets over a 36 month performance period). The upward or downward adjustment to the management fee is based on the Fund's relative investment performance as compared to an appropriate benchmark index. For the period, the total annual management fee rate, including the performance adjustment, was .81% of the Fund's average net assets.
Transfer Agent Fees. Fidelity Investments Institutional Operations Company, Inc. (FIIOC), an affiliate of FMR, is the transfer, dividend disbursing and shareholder servicing agent for the Fund. FIIOC receives account fees and asset-based fees that vary according to the account size and type of account. FIIOC pays for typesetting, printing and mailing of shareholder reports, except proxy statements. For the period, transfer agent fees were equivalent to an annual rate of .21% of average net assets.
Accounting and Security Lending Fees. Fidelity Service Company, Inc. (FSC), an affiliate of FMR, maintains the Fund's accounting records. The accounting fee is based on the level of average net assets for the month. Under a separate contract, FSC administers the security lending program. The security lending fee is based on the number and duration of lending transactions.
Brokerage Commissions. The Fund placed a portion of its portfolio transactions with brokerage firms which are affiliates of the investment adviser. The commissions paid to these affiliated firms were $2,702 for the period.
Interfund Lending Program. Pursuant to an Exemptive Order issued by the SEC, the Fund, along with other registered investment companies having management contracts with FMR, may participate in an interfund lending program. This program provides an alternative credit facility allowing the funds to borrow from, or lend money to, other participating affiliated funds. At period end, there were no interfund loans outstanding. The Fund's activity in this program during the period for which loans were outstanding was as follows:
Borrower or Lender | Average Daily
Loan Balance | Weighted Average Interest Rate | Interest
Expense |
Borrower | $ 3,536,333 | .40% | $ 467 |
Annual Report
6. Committed Line of Credit.
The Fund participates with other funds managed by FMR or an affiliate in a $4.0 billion credit facility (the "line of credit") to be utilized for temporary or emergency purposes to fund shareholder redemptions or for other short-term liquidity purposes. The Fund has agreed to pay commitment fees on its pro-rata portion of the line of credit, which amounted to $2,466 and is reflected in Miscellaneous expenses on the Statement of Operations. During the period, there were no borrowings on this line of credit.
7. Security Lending.
The Fund lends portfolio securities through a lending agent from time to time in order to earn additional income. For equity securities, a lending agent is used and may loan securities to certain qualified borrowers, including Fidelity Capital Markets (FCM), a broker-dealer affiliated with the Fund. On the settlement date of the loan, the Fund receives collateral (in the form of U.S. Treasury obligations, letters of credit and/or cash) against the loaned securities and maintains collateral in an amount not less than 100% of the market value of the loaned securities during the period of the loan. The market value of the loaned securities is determined at the close of business of the Fund and any additional required collateral is delivered to the Fund on the next business day. If the borrower defaults on its obligation to return the securities loaned because of insolvency or other reasons, a fund could experience delays and costs in recovering the securities loaned or in gaining access to the collateral. Any cash collateral received is invested in the Fidelity Securities Lending Cash Central Fund. The value of loaned securities and cash collateral at period end are disclosed on the Fund's Statement of Assets and Liabilities. Security lending income represents the income earned on investing cash collateral, less rebates paid to borrowers and any lending agent fees associated with the loan, plus any premium payments received for lending certain types of securities. Security lending income is presented in the Statement of Operations as a component of income from Fidelity Central Funds. Total security lending income during the period amounted to $679,184. During the period, there were no securities loaned to FCM.
8. Expense Reductions.
Many of the brokers with whom FMR places trades on behalf of the Fund provided services in addition to trade execution. These services included payments of certain expenses on behalf of the Fund totaling $312,693 for the period.
9. Distributions to Shareholders.
Distributions to shareholders of each class were as follows:
Years ended October 31, | 2011 | 2010 A |
From net investment income | | |
Europe | $ 16,901,401 | $ 51,533,641 |
Class F | - | 771,256 |
Total | $ 16,901,401 | $ 52,304,897 |
A All Class F shares were redeemed on October 22, 2010.
10. Share Transactions.
Transactions for each class of shares were as follows:
| Shares | Dollars |
Years ended October 31, | 2011 | 2010 A | 2011 | 2010 A |
Europe | | | | |
Shares sold | 1,519,828 | 3,055,065 | $ 47,231,141 | $ 87,101,342 |
Reinvestment of distributions | 520,808 | 1,727,950 | 16,129,417 | 50,888,132 |
Shares redeemed | (5,604,701) | (78,531,608) B | (172,091,823) | (2,273,191,951) B |
Net increase (decrease) | (3,564,065) | (73,748,593) | $ (108,731,265) | $ (2,135,202,477) |
Class F | | | | |
Shares sold | - | 7,673,061 | $ - | $ 215,895,954 |
Reinvestment of distributions | - | 26,189 | - | 771,256 |
Shares redeemed | - | (8,395,464) B | - | (245,388,924) B |
Net increase (decrease) | - | (696,214) | $ - | $ (28,721,714) |
A All Class F shares were redeemed on October 22, 2010.
B Amount includes in-kind redemptions.
Annual Report
Notes to Financial Statements - continued
11. Other.
The Fund's organizational documents provide former and current trustees and officers with a limited indemnification against liabilities arising in connection with the performance of their duties to the Fund. In the normal course of business, the Fund may also enter into contracts that provide general indemnifications. The Fund's maximum exposure under these arrangements is unknown as this would be dependent on future claims that may be made against the Fund. The risk of material loss from such claims is considered remote.
Annual Report
Fidelity Japan Fund
Performance: The Bottom Line
Average annual total return reflects the change in the value of an investment, assuming reinvestment of the class' distributions from dividend income and capital gains (the profits earned upon the sale of securities that have grown in value, if any) and assuming a constant rate of performance each year. The $10,000 table and the fund's returns do not reflect the deduction of taxes that a shareholder would pay on fund distributions or the redemption of fund shares. During periods of reimbursement by Fidelity, a fund's total return will be greater than it would be had the reimbursement not occurred. How a fund did yesterday is no guarantee of how it will do tomorrow.
Average Annual Total Returns
Periods ended October 31, 2011 | Past 1
year | Past 5
years | Past 10
years |
Fidelity Japan Fund | -6.00% | -6.47% | 2.26% |
$10,000 Over 10 Years
Let's say hypothetically that $10,000 was invested in Fidelity Japan Fund, a class of the fund, on October 31, 2001. The chart shows how the value of your investment would have changed, and also shows how the Tokyo Stock Price Index (TOPIX) performed over the same period.
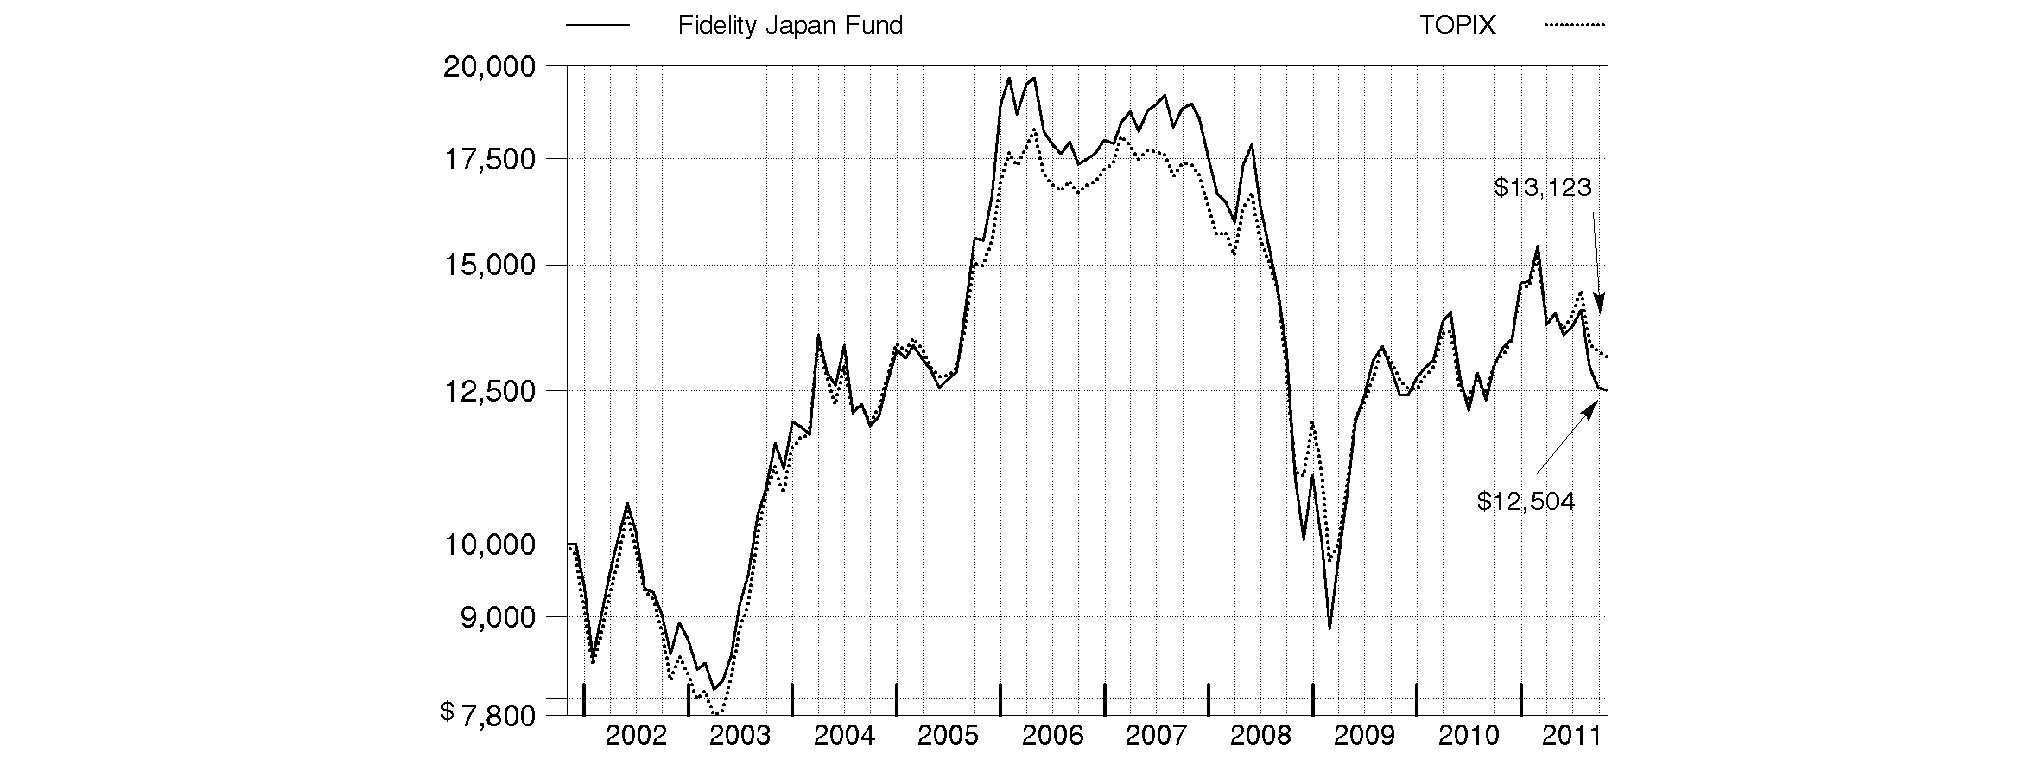
Annual Report
Fidelity Japan Fund
Market Recap: Beset by natural disaster and a fragile global economic climate, Japanese stocks were extremely volatile during the 12 months ending October 31, 2011. However, when the dust settled, share prices were essentially unchanged. For the year, the Tokyo Stock Price Index (TOPIX) returned -0.35%. Japanese equities mounted a strong advance during the first four months of the period, only to give back those gains and more within a few days following the mid-March tsunami and earthquake. Initially, the recovery from this plunge was relatively robust, as investors realized that supply and demand disruptions associated with the disaster would be resolved more quickly than originally feared. However, as the period progressed, Japanese stocks faced other challenges, such as the sovereign debt crisis in Europe and flood damage in Thailand. An appreciating yen - despite government intervention to contain it - aided Japanese equities quoted in U.S. dollars, while making it harder for Japanese exporters to remain competitive. The three smallest sectors within the index - energy, telecommunication services and consumer staples - were its strongest performers, each posting gains of more than 15%. By contrast, utilities sustained by far the biggest loss, weighed down by the company that owned the nuclear reactor damaged by the tsunami.
Comments from Rie Shigekawa, who became Portfolio Manager of Fidelity® Japan Fund on May 1, 2011: During the year, the fund's Retail Class shares returned -6.00%, significantly trailing the TOPIX. Positioning in consumer discretionary, information technology, industrials and telecommunication services detracted from performance versus the index. Video-game maker Nintendo was the largest individual detractor, as unimpressive software offerings for its latest game console resulted in disappointing earnings and a declining stock price. Automakers Honda and Toyota were hampered by extensive flooding in Thailand and further strength in the yen. Conversely, a large underweighting in utilities was beneficial, as this was the sector most hurt by the earthquake/tsunami. Positioning in consumer staples lifted performance as well. At the stock level, an overweighted stake in Japan Tobacco was the fund's largest contributor. Given the greater freedom it would provide for the firm's management, the market liked a proposal by the nation's ruling political party to sell the government's roughly 50% stake in the company. Software provider Otsuka and negligible exposure to Tokyo Electric Power, which owned the nuclear facility most devastated by the mid-March disaster, further added value. The fund did not own this security at period end.
The views expressed above reflect those of the portfolio manager(s) only through the end of the period as stated on the cover of this report and do not necessarily represent the views of Fidelity or any other person in the Fidelity organization. Any such views are subject to change at any time based upon market or other conditions and Fidelity disclaims any responsibility to update such views. These views may not be relied on as investment advice and, because investment decisions for a Fidelity fund are based on numerous factors, may not be relied on as an indication of trading intent on behalf of any Fidelity fund.
Annual Report
Fidelity Japan Fund
As a shareholder of the Fund, you incur two types of costs: (1) transaction costs, including sales charges (loads) on purchase payments or redemption proceeds, redemption fees, and (2) ongoing costs, including management fees, distribution and/or service (12b-1) fees and other Fund expenses. This Example is intended to help you understand your ongoing costs (in dollars) of investing in the Fund and to compare these costs with the ongoing costs of investing in other mutual funds.
The Example is based on an investment of $1,000 invested at the beginning of the period and held for the entire period (May 1, 2011 to October 31, 2011).
Actual Expenses
The first line of the accompanying table for each class of the Fund provides information about actual account values and actual expenses. You may use the information in this line, together with the amount you invested, to estimate the expenses that you paid over the period. Simply divide your account value by $1,000.00 (for example, an $8,600 account value divided by $1,000.00 = 8.6), then multiply the result by the number in the first line for a class of the Fund under the heading entitled "Expenses Paid During Period" to estimate the expenses you paid on your account during this period. A small balance maintenance fee of $12.00 that is charged once a year may apply for certain accounts with a value of less than $2,000. This fee is not included in the table below. If it was, the estimate of expenses you paid during the period would be higher, and your ending account value lower, by this amount. In addition, the Fund, as a shareholder in the underlying Fidelity Central Funds, will indirectly bear its pro-rata share of the fees and expenses incurred by the underlying Fidelity Central Funds. These fees and expenses are not included in the Fund's annualized expense ratio used to calculate the expense estimate in the table below.
Hypothetical Example for Comparison Purposes
The second line of the accompanying table for each class of the Fund provides information about hypothetical account values and hypothetical expenses based on a Class' actual expense ratio and an assumed rate of return of 5% per year before expenses, which is not the Class' actual return. The hypothetical account values and expenses may not be used to estimate the actual ending account balance or expenses you paid for the period. You may use this information to compare the ongoing costs of investing in the Fund and other funds. To do so, compare this 5% hypothetical example with the 5% hypothetical examples that appear in the shareholder reports of the other funds. A small balance maintenance fee of $12.00 that is charged once a year may apply for certain accounts with a value of less than $2,000. This fee is not included in the table below. If it was, the estimate of expenses you paid during the period would be higher, and your ending account value lower, by this amount. In addition, the Fund, as a shareholder in the underlying Fidelity Central Funds, will indirectly bear its pro-rata share of the fees and expenses incurred by the underlying Fidelity Central Funds. These fees and expenses are not included in the Fund's annualized expense ratio used to calculate the expense estimate in the table below.
Please note that the expenses shown in the table are meant to highlight your ongoing costs only and do not reflect any transaction costs. Therefore, the second line of the table is useful in comparing ongoing costs only, and will not help you determine the relative total costs of owning different funds. In addition, if these transactional costs were included, your costs would have been higher.
| Annualized
Expense Ratio | Beginning
Account Value
May 1, 2011 | Ending
Account Value
October 31, 2011 | Expenses Paid
During Period*
May 1, 2011 to
October 31, 2011 |
Class A | 1.19% | | | |
Actual | | $ 1,000.00 | $ 893.30 | $ 5.68 |
HypotheticalA | | $ 1,000.00 | $ 1,019.21 | $ 6.06 |
Class T | 1.47% | | | |
Actual | | $ 1,000.00 | $ 891.30 | $ 7.01 |
HypotheticalA | | $ 1,000.00 | $ 1,017.80 | $ 7.48 |
Class B | 1.92% | | | |
Actual | | $ 1,000.00 | $ 889.20 | $ 9.14 |
HypotheticalA | | $ 1,000.00 | $ 1,015.53 | $ 9.75 |
Class C | 1.90% | | | |
Actual | | $ 1,000.00 | $ 890.10 | $ 9.05 |
HypotheticalA | | $ 1,000.00 | $ 1,015.63 | $ 9.65 |
Japan | .84% | | | |
Actual | | $ 1,000.00 | $ 894.40 | $ 4.01 |
HypotheticalA | | $ 1,000.00 | $ 1,020.97 | $ 4.28 |
Institutional Class | .78% | | | |
Actual | | $ 1,000.00 | $ 894.40 | $ 3.72 |
HypotheticalA | | $ 1,000.00 | $ 1,021.27 | $ 3.97 |
A 5% return per year before expenses
* Expenses are equal to each Class' annualized expense ratio, multiplied by the average account value over the period, multiplied by 184/365 (to reflect the one-half year period).
Annual Report
Fidelity Japan Fund
Investment Changes (Unaudited)
Geographic Diversification (% of fund's net assets) |
As of October 31, 2011 |
| Japan | 96.3% | |
| United States of America | 3.7% | |

Percentages are adjusted for the effect of futures contracts, if applicable. |
As of April 30, 2011 |
| Japan | 94.9% | |
| United States of America | 5.1% | |

Percentages are adjusted for the effect of futures contracts, if applicable. |
Asset Allocation |
| % of fund's
net assets | % of fund's net assets
6 months ago |
Stocks | 96.3 | 94.9 |
Short-Term Investments and Net Other Assets | 3.7 | 5.1 |
Top Ten Stocks as of October 31, 2011 |
| % of fund's
net assets | % of fund's net assets
6 months ago |
Toyota Motor Corp. (Automobiles) | 5.6 | 3.5 |
Honda Motor Co. Ltd. (Automobiles) | 3.9 | 1.6 |
Otsuka Corp. (IT Services) | 3.4 | 0.0 |
Toshiba Corp. (Computers & Peripherals) | 3.4 | 0.4 |
Mitsubishi UFJ Financial Group, Inc. (Commercial Banks) | 3.3 | 2.9 |
Japan Tobacco, Inc. (Tobacco) | 3.3 | 0.0 |
Astellas Pharma, Inc. (Pharmaceuticals) | 3.1 | 0.0 |
Canon, Inc. (Office Electronics) | 3.0 | 4.1 |
Nomura Real Estate Holdings, Inc. (Real Estate Management & Development) | 3.0 | 0.0 |
Fujitsu Ltd. (Computers & Peripherals) | 2.8 | 0.4 |
| 34.8 | |
Market Sectors as of October 31, 2011 |
| % of fund's
net assets | % of fund's net assets
6 months ago |
Information Technology | 21.5 | 15.2 |
Consumer Discretionary | 21.5 | 19.3 |
Financials | 16.4 | 26.7 |
Consumer Staples | 10.5 | 5.0 |
Materials | 7.8 | 7.5 |
Industrials | 7.4 | 18.9 |
Health Care | 7.2 | 0.4 |
Telecommunication Services | 2.1 | 1.9 |
Energy | 1.1 | 0.0 |
Utilities | 0.8 | 0.0 |
Annual Report
Fidelity Japan Fund
Investments October 31, 2011
Showing Percentage of Net Assets
Common Stocks - 96.3% |
| Shares | | Value |
CONSUMER DISCRETIONARY - 21.5% |
Auto Components - 2.7% |
Denso Corp. | 243,000 | | $ 7,474,001 |
Yokohama Rubber Co. Ltd. | 1,005,000 | | 5,737,462 |
| | 13,211,463 |
Automobiles - 11.0% |
Honda Motor Co. Ltd. | 632,500 | | 18,916,540 |
Suzuki Motor Corp. | 335,300 | | 7,112,335 |
Toyota Motor Corp. | 816,300 | | 27,105,263 |
| | 53,134,138 |
Household Durables - 2.5% |
Funai Electric Co. Ltd. | 136,800 | | 2,689,100 |
Panasonic Corp. | 943,400 | | 9,538,137 |
| | 12,227,237 |
Leisure Equipment & Products - 0.9% |
SHIMANO, Inc. | 82,700 | | 4,088,402 |
Media - 1.2% |
Avex Group Holdings, Inc. | 476,800 | | 5,641,483 |
Multiline Retail - 2.1% |
Marui Group Co. Ltd. | 1,281,200 | | 9,961,645 |
Specialty Retail - 0.8% |
EDION Corp. | 455,300 | | 3,643,415 |
Textiles, Apparel & Luxury Goods - 0.3% |
Asics Corp. | 109,200 | | 1,447,867 |
TOTAL CONSUMER DISCRETIONARY | | 103,355,650 |
CONSUMER STAPLES - 10.5% |
Food & Staples Retailing - 2.1% |
Lawson, Inc. | 93,800 | | 5,278,772 |
Seven & i Holdings Co., Ltd. | 186,800 | | 4,985,534 |
| | 10,264,306 |
Food Products - 2.2% |
Nisshin Oillio Group Ltd. | 1,206,000 | | 5,392,785 |
Toyo Suisan Kaisha Ltd. | 206,000 | | 5,257,704 |
| | 10,650,489 |
Personal Products - 2.9% |
Kao Corp. | 189,600 | | 4,974,672 |
Shiseido Co. Ltd. | 480,800 | | 8,801,385 |
| | 13,776,057 |
Tobacco - 3.3% |
Japan Tobacco, Inc. | 3,146 | | 15,726,230 |
TOTAL CONSUMER STAPLES | | 50,417,082 |
ENERGY - 1.1% |
Oil, Gas & Consumable Fuels - 1.1% |
INPEX Corp. | 808 | | 5,335,164 |
|
| Shares | | Value |
FINANCIALS - 16.4% |
Commercial Banks - 7.5% |
Mitsubishi UFJ Financial Group, Inc. | 3,695,800 | | $ 16,063,770 |
Sumitomo Mitsui Financial Group, Inc. | 375,900 | | 10,508,323 |
Sumitomo Mitsui Trust Holdings, Inc. | 2,764,130 | | 9,460,406 |
| | 36,032,499 |
Insurance - 1.4% |
Tokio Marine Holdings, Inc. | 284,300 | | 6,779,854 |
Real Estate Investment Trusts - 3.0% |
Frontier Real Estate Investment Corp. | 844 | | 7,319,723 |
Japan Logistics Fund, Inc. | 856 | | 7,377,960 |
| | 14,697,683 |
Real Estate Management & Development - 4.5% |
Mitsui Fudosan Co. Ltd. | 438,000 | | 7,284,997 |
Nomura Real Estate Holdings, Inc. | 881,600 | | 14,213,755 |
| | 21,498,752 |
TOTAL FINANCIALS | | 79,008,788 |
HEALTH CARE - 7.2% |
Health Care Equipment & Supplies - 1.5% |
Terumo Corp. | 144,500 | | 7,342,989 |
Health Care Providers & Services - 1.6% |
Message Co. Ltd. | 2,320 | | 7,503,564 |
Pharmaceuticals - 4.1% |
Astellas Pharma, Inc. | 413,300 | | 15,117,730 |
Rohto Pharmaceutical Co. Ltd. | 418,000 | | 4,815,951 |
| | 19,933,681 |
TOTAL HEALTH CARE | | 34,780,234 |
INDUSTRIALS - 7.4% |
Building Products - 1.3% |
Daikin Industries Ltd. | 211,300 | | 6,253,951 |
Machinery - 1.2% |
Makita Corp. | 155,300 | | 5,798,643 |
Road & Rail - 1.2% |
Sankyu, Inc. | 1,370,000 | | 5,425,169 |
Trading Companies & Distributors - 3.7% |
Mitsui & Co. Ltd. | 609,100 | | 8,890,662 |
Sumitomo Corp. | 729,300 | | 9,030,728 |
| | 17,921,390 |
TOTAL INDUSTRIALS | | 35,399,153 |
INFORMATION TECHNOLOGY - 21.5% |
Computers & Peripherals - 6.2% |
Fujitsu Ltd. | 2,503,000 | | 13,386,871 |
Toshiba Corp. | 3,756,000 | | 16,383,497 |
| | 29,770,368 |
Common Stocks - continued |
| Shares | | Value |
INFORMATION TECHNOLOGY - continued |
Electronic Equipment & Components - 6.3% |
Daishinku Corp. | 523,000 | | $ 1,781,434 |
Fujifilm Holdings Corp. | 284,300 | | 6,958,905 |
Horiba Ltd. | 183,300 | | 5,815,349 |
Mitsumi Electric Co. Ltd. | 415,300 | | 3,296,100 |
Shimadzu Corp. | 1,468,000 | | 12,499,033 |
| | 30,350,821 |
Internet Software & Services - 1.3% |
Yahoo! Japan Corp. | 19,727 | | 6,336,334 |
IT Services - 3.4% |
Otsuka Corp. | 236,300 | | 16,416,472 |
Office Electronics - 3.0% |
Canon, Inc. | 315,200 | | 14,311,218 |
Semiconductors & Semiconductor Equipment - 0.6% |
ROHM Co. Ltd. | 59,600 | | 3,037,095 |
Software - 0.7% |
Nintendo Co. Ltd. | 21,200 | | 3,198,866 |
TOTAL INFORMATION TECHNOLOGY | | 103,421,174 |
MATERIALS - 7.8% |
Chemicals - 6.6% |
Asahi Kasei Corp. | 944,000 | | 5,598,953 |
JSP Corp. | 61,600 | | 904,290 |
Nippon Shokubai Co. Ltd. | 331,000 | | 3,376,378 |
Shin-Etsu Chemical Co., Ltd. | 189,200 | | 9,717,569 |
Toray Industries, Inc. | 1,688,000 | | 12,015,710 |
| | 31,612,900 |
Metals & Mining - 1.2% |
Hitachi Metals Ltd. | 520,000 | | 5,898,166 |
TOTAL MATERIALS | | 37,511,066 |
|
| Shares | | Value |
TELECOMMUNICATION SERVICES - 2.1% |
Wireless Telecommunication Services - 2.1% |
NTT DoCoMo, Inc. | 5,660 | | $ 10,053,689 |
UTILITIES - 0.8% |
Gas Utilities - 0.8% |
Osaka Gas Co. Ltd. | 997,000 | | 3,773,148 |
TOTAL COMMON STOCKS (Cost $539,552,123) | 463,055,148 |
Money Market Funds - 2.7% |
| | | |
Fidelity Cash Central Fund, 0.12% (a)
(Cost $13,103,924) | 13,103,924 | | 13,103,924 |
TOTAL INVESTMENT PORTFOLIO - 99.0% (Cost $552,656,047) | | 476,159,072 |
NET OTHER ASSETS (LIABILITIES) - 1.0% | | 5,031,379 |
NET ASSETS - 100% | $ 481,190,451 |
Legend |
(a) Affiliated fund that is available only to investment companies and other accounts managed by Fidelity Investments. The rate quoted is the annualized seven-day yield of the fund at period end. A complete unaudited listing of the fund's holdings as of its most recent quarter end is available upon request. In addition, each Fidelity Central Fund's financial statements, which are not covered by the Fund's Report of Independent Registered Public Accounting Firm, are available on the SEC's website or upon request. |
Affiliated Central Funds |
Information regarding fiscal year to date income earned by the Fund from investments in Fidelity Central Funds is as follows: |
Fund | Income earned |
Fidelity Cash Central Fund | $ 22,778 |
Fidelity Securities Lending Cash Central Fund | 6,193 |
Total | $ 28,971 |
Other Information |
The following is a summary of the inputs used, as of October 31, 2011, involving the Fund's assets and liabilities carried at fair value. The inputs or methodology used for valuing securities may not be an indication of the risk associated with investing in those securities. For more information on valuation inputs, and their aggregation into the levels used in the table below, please refer to the Security Valuation section in the accompanying Notes to Financial Statements. |
Valuation Inputs at Reporting Date: |
Description | Total | Level 1 | Level 2 | Level 3 |
Investments in Securities: | | | | |
Equities: | | | | |
Consumer Discretionary | $ 103,355,650 | $ - | $ 103,355,650 | $ - |
Consumer Staples | 50,417,082 | - | 50,417,082 | - |
Energy | 5,335,164 | - | 5,335,164 | - |
Financials | 79,008,788 | - | 79,008,788 | - |
Health Care | 34,780,234 | - | 34,780,234 | - |
Industrials | 35,399,153 | - | 35,399,153 | - |
Information Technology | 103,421,174 | - | 103,421,174 | - |
Materials | 37,511,066 | - | 37,511,066 | - |
Telecommunication Services | 10,053,689 | - | 10,053,689 | - |
Utilities | 3,773,148 | - | 3,773,148 | - |
Money Market Funds | 13,103,924 | 13,103,924 | - | - |
Total Investments in Securities: | $ 476,159,072 | $ 13,103,924 | $ 463,055,148 | $ - |
Income Tax Information |
At October 31, 2011, the Fund had a capital loss carryforward of $540,678,483 of which $6,632,380, $7,706,742, $161,194,648, $239,450,813, $26,887,863 and $98,806,037 will expire in fiscal 2014, 2015, 2016, 2017, 2018 and 2019 respectively. Capital loss carryforwards are only available to offset future capital gains of the Fund to the extent provided by regulations and may be limited. |
Included in the $540,678,483 of the Fund's capital loss carryforwards are $25,965,572 of capital loss carryforwards that were acquired from the Fidelity Advisor Japan Fund when it merged into the Fund on December 17, 2010 of which $6,632,380, $7,706,742, $10,009,147 and $1,617,303 will expire in fiscal 2014, 2015, 2016 and 2017 respectively. Under the Internal Revenue Code, the losses acquired from Fidelity Advisor Japan Fund that will be available to offset future capital gains of the Fund will be limited. As a result, at least $17,152,282 of the losses acquired from Fidelity Advisor Japan Fund will expire unused. |
See accompanying notes which are an integral part of the financial statements.
Annual Report
Fidelity Japan Fund
Statement of Assets and Liabilities
| October 31, 2011 |
| | |
Assets | | |
Investment in securities, at value - See accompanying schedule: Unaffiliated issuers (cost $539,552,123) | $ 463,055,148 | |
Fidelity Central Funds (cost $13,103,924) | 13,103,924 | |
Total Investments (cost $552,656,047) | | $ 476,159,072 |
Receivable for investments sold | | 8,279,738 |
Receivable for fund shares sold | | 218,365 |
Dividends receivable | | 4,287,974 |
Distributions receivable from Fidelity Central Funds | | 1,913 |
Prepaid expenses | | 892 |
Other receivables | | 33,572 |
Total assets | | 488,981,526 |
| | |
Liabilities | | |
Payable for investments purchased | $ 6,695,718 | |
Payable for fund shares redeemed | 648,418 | |
Accrued management fee | 251,540 | |
Distribution and service plan fees payable | 13,857 | |
Other affiliated payables | 116,658 | |
Other payables and accrued expenses | 64,884 | |
Total liabilities | | 7,791,075 |
| | |
Net Assets | | $ 481,190,451 |
Net Assets consist of: | | |
Paid in capital | | $ 1,079,805,300 |
Undistributed net investment income | | 7,491,842 |
Accumulated undistributed net realized gain (loss) on investments and foreign currency transactions | | (529,532,235) |
Net unrealized appreciation (depreciation) on investments and assets and liabilities in foreign currencies | | (76,574,456) |
Net Assets | | $ 481,190,451 |
Statement of Assets and Liabilities - continued
| October 31, 2011 |
| | |
Calculation of Maximum Offering Price Class A:
Net Asset Value and redemption price per share ($13,207,583 ÷ 1,385,059 shares) | | $ 9.54 |
| | |
Maximum offering price per share (100/94.25 of $9.54) | | $ 10.12 |
Class T:
Net Asset Value and redemption price per share ($4,642,769 ÷ 488,071 shares) | | $ 9.51 |
| | |
Maximum offering price per share (100/96.50 of $9.51) | | $ 9.85 |
Class B:
Net Asset Value and offering price per share ($1,458,218 ÷ 153,920 shares)A | | $ 9.47 |
| | |
Class C:
Net Asset Value and offering price per share ($8,749,997 ÷ 923,473 shares)A | | $ 9.48 |
| | |
Japan:
Net Asset Value, offering price and redemption price per share ($450,416,693 ÷ 47,072,045 shares) | | $ 9.57 |
| | |
Institutional Class:
Net Asset Value, offering price and redemption price per share ($2,715,191 ÷ 283,719 shares) | | $ 9.57 |
A Redemption price per share is equal to net asset value less any applicable contingent deferred sales charge.
See accompanying notes which are an integral part of the financial statements.
Annual Report
Fidelity Japan Fund
Financial Statements - continued
Statement of Operations
| Year ended October 31, 2011 |
| | |
Investment Income | | |
Dividends | | $ 13,038,354 |
Income from Fidelity Central Funds | | 28,971 |
Income before foreign taxes withheld | | 13,067,325 |
Less foreign taxes withheld | | (912,685) |
Total income | | 12,154,640 |
| | |
Expenses | | |
Management fee
Basic fee | $ 3,938,115 | |
Performance adjustment | (942,799) | |
Transfer agent fees | 1,199,596 | |
Distribution and service plan fees | 160,008 | |
Accounting and security lending fees | 282,827 | |
Custodian fees and expenses | 76,457 | |
Independent trustees' compensation | 3,303 | |
Registration fees | 111,372 | |
Audit | 62,837 | |
Legal | 10,741 | |
Miscellaneous | 35,194 | |
Total expenses before reductions | 4,937,651 | |
Expense reductions | (287,966) | 4,649,685 |
Net investment income (loss) | | 7,504,955 |
Realized and Unrealized Gain (Loss) Net realized gain (loss) on: | | |
Investment securities: | | |
Unaffiliated issuers | (69,086,349) | |
Foreign currency transactions | 373,429 | |
Total net realized gain (loss) | | (68,712,920) |
Change in net unrealized appreciation (depreciation) on: Investment securities | 32,202,153 | |
Assets and liabilities in foreign currencies | (372,358) | |
Total change in net unrealized appreciation (depreciation) | | 31,829,795 |
Net gain (loss) | | (36,883,125) |
Net increase (decrease) in net assets resulting from operations | | $ (29,378,170) |
Statement of Changes in Net Assets
| Year ended
October 31,
2011 | Year ended
October 31,
2010 |
Increase (Decrease) in Net Assets | | |
Operations | | |
Net investment income (loss) | $ 7,504,955 | $ 9,882,218 |
Net realized gain (loss) | (68,712,920) | (10,204,232) |
Change in net unrealized appreciation (depreciation) | 31,829,795 | 55,567,525 |
Net increase (decrease) in net assets resulting from operations | (29,378,170) | 55,245,511 |
Distributions to shareholders from net investment income | (9,748,982) | (6,665,780) |
Distributions to shareholders from net realized gain | (10,506,757) | (9,507,465) |
Total distributions | (20,255,739) | (16,173,245) |
Share transactions - net increase (decrease) | (153,265,919) | (305,864,432) |
Redemption fees | 492,971 | 107,736 |
Total increase (decrease) in net assets | (202,406,857) | (266,684,430) |
| | |
Net Assets | | |
Beginning of period | 683,597,308 | 950,281,738 |
End of period (including undistributed net investment income of $7,491,842 and undistributed net investment income of $9,735,869, respectively) | $ 481,190,451 | $ 683,597,308 |
See accompanying notes which are an integral part of the financial statements.
Annual Report
Financial Highlights - Class A
Years ended October 31, | 2011 H |
Selected Per-Share Data | |
Net asset value, beginning of period | $ 10.83 |
Income from Investment Operations | |
Net investment income (loss) E | .09 |
Net realized and unrealized gain (loss) | (1.39) |
Total from investment operations | (1.30) |
Redemption fees added to paid in capital E | .01 |
Net asset value, end of period | $ 9.54 |
Total Return B,C,D | (11.91)% |
Ratios to Average Net Assets F,I | |
Expenses before reductions | 1.20% A |
Expenses net of fee waivers, if any | 1.20% A |
Expenses net of all reductions | 1.16% A |
Net investment income (loss) | 1.02% A |
Supplemental Data | |
Net assets, end of period (000 omitted) | $ 13,208 |
Portfolio turnover rate G | 134% J |
A Annualized B Total returns for periods of less than one year are not annualized. C Total returns would have been lower if certain expenses had not been reduced during the applicable periods shown. D Total returns do not include the effect of the sales charges. ECalculated based on average shares outstanding during the period. F Fees and expenses of any underlying Fidelity Central Funds are not included in the Fund's expense ratio. The Fund indirectly bears its proportionate share of the expenses of any underlying Fidelity Central Funds. G Amount does not include the portfolio activity of any underlying Fidelity Central Funds. H For the period December 14, 2010 (commencement of sale of shares) to October 31, 2011. I Expense ratios reflect operating expenses of the class. Expenses before reductions do not reflect amounts reimbursed by the investment adviser or reductions from brokerage service arrangements or reductions from other expense offset arrangements and do not represent the amount paid by the class during periods when reimbursements or reductions occur. Expense ratios before reductions for start-up periods may not be representative of longer-term operating periods. Expenses net of fee waivers reflect expenses after reimbursement by the investment adviser but prior to reductions from brokerage service arrangements or other expense offset arrangements. Expenses net of all reductions represent the net expenses paid by the class. J The portfolio turnover rate does not include the assets acquired in the merger. |
Financial Highlights - Class T
Years ended October 31, | 2011 H |
Selected Per-Share Data | |
Net asset value, beginning of period | $ 10.83 |
Income from Investment Operations | |
Net investment income (loss) E | .07 |
Net realized and unrealized gain (loss) | (1.40) |
Total from investment operations | (1.33) |
Redemption fees added to paid in capital E | .01 |
Net asset value, end of period | $ 9.51 |
Total Return B,C,D | (12.19)% |
Ratios to Average Net Assets F,I | |
Expenses before reductions | 1.48% A |
Expenses net of fee waivers, if any | 1.48% A |
Expenses net of all reductions | 1.44% A |
Net investment income (loss) | .74% A |
Supplemental Data | |
Net assets, end of period (000 omitted) | $ 4,643 |
Portfolio turnover rate G | 134% J |
A Annualized B Total returns for periods of less than one year are not annualized. C Total returns would have been lower if certain expenses had not been reduced during the applicable periods shown. D Total returns do not include the effect of the sales charges. E Calculated based on average shares outstanding during the period. F Fees and expenses of any underlying Fidelity Central Funds are not included in the Fund's expense ratio. The Fund indirectly bears its proportionate share of the expenses of any underlying Fidelity Central Funds. G Amount does not include the portfolio activity of any underlying Fidelity Central Funds. H For the period December 14, 2010 (commencement of sale of shares) to October 31, 2011. I Expense ratios reflect operating expenses of the class. Expenses before reductions do not reflect amounts reimbursed by the investment adviser or reductions from brokerage service arrangements or reductions from other expense offset arrangements and do not represent the amount paid by the class during periods when reimbursements or reductions occur. Expense ratios before reductions for start-up periods may not be representative of longer-term operating periods. Expenses net of fee waivers reflect expenses after reimbursement by the investment adviser but prior to reductions from brokerage service arrangements or other expense offset arrangements. Expenses net of all reductions represent the net expenses paid by the class. J The portfolio turnover rate does not include the assets acquired in the merger. |
See accompanying notes which are an integral part of the financial statements.
Annual Report
Financial Highlights - Class B
Years ended October 31, | 2011 H |
Selected Per-Share Data | |
Net asset value, beginning of period | $ 10.83 |
Income from Investment Operations | |
Net investment income (loss) E | .02 |
Net realized and unrealized gain (loss) | (1.39) |
Total from investment operations | (1.37) |
Redemption fees added to paid in capital E | .01 |
Net asset value, end of period | $ 9.47 |
Total Return B,C,D | (12.56)% |
Ratios to Average Net Assets F,I | |
Expenses before reductions | 1.95% A |
Expenses net of fee waivers, if any | 1.95% A |
Expenses net of all reductions | 1.91% A |
Net investment income (loss) | .27% A |
Supplemental Data | |
Net assets, end of period (000 omitted) | $ 1,458 |
Portfolio turnover rate G | 134% J |
A Annualized B Total returns for periods of less than one year are not annualized. C Total returns would have been lower if certain expenses had not been reduced during the applicable periods shown. D Total returns do not include the effect of the contingent deferred sales charge. E Calculated based on average shares outstanding during the period. F Fees and expenses of any underlying Fidelity Central Funds are not included in the Fund's expense ratio. The Fund indirectly bears its proportionate share of the expenses of any underlying Fidelity Central Funds. G Amount does not include the portfolio activity of any underlying Fidelity Central Funds. H For the period December 14, 2010 (commencement of sale of shares) to October 31, 2011. I Expense ratios reflect operating expenses of the class. Expenses before reductions do not reflect amounts reimbursed by the investment adviser or reductions from brokerage service arrangements or reductions from other expense offset arrangements and do not represent the amount paid by the class during periods when reimbursements or reductions occur. Expense ratios before reductions for start-up periods may not be representative of longer-term operating periods. Expenses net of fee waivers reflect expenses after reimbursement by the investment adviser but prior to reductions from brokerage service arrangements or other expense offset arrangements. Expenses net of all reductions represent the net expenses paid by the class. J The portfolio turnover rate does not include the assets acquired in the merger. |
Financial Highlights - Class C
Years ended October 31, | 2011 H |
Selected Per-Share Data | |
Net asset value, beginning of period | $ 10.83 |
Income from Investment Operations | |
Net investment income (loss) E | .03 |
Net realized and unrealized gain (loss) | (1.39) |
Total from investment operations | (1.36) |
Redemption fees added to paid in capital E | .01 |
Net asset value, end of period | $ 9.48 |
Total Return B,C,D | (12.47)% |
Ratios to Average Net Assets F,I | |
Expenses before reductions | 1.92% A |
Expenses net of fee waivers, if any | 1.92% A |
Expenses net of all reductions | 1.88% A |
Net investment income (loss) | .30% A |
Supplemental Data | |
Net assets, end of period (000 omitted) | $ 8,750 |
Portfolio turnover rate G | 134% J |
A Annualized B Total returns for periods of less than one year are not annualized. C Total returns would have been lower if certain expenses had not been reduced during the applicable periods shown. D Total returns do not include the effect of the contingent deferred sales charge. E Calculated based on average shares outstanding during the period. F Fees and expenses of any underlying Fidelity Central Funds are not included in the Fund's expense ratio. The Fund indirectly bears its proportionate share of the expenses of any underlying Fidelity Central Funds. G Amount does not include the portfolio activity of any underlying Fidelity Central Funds. H For the period December 14, 2010 (commencement of sale of shares) to October 31, 2011. I Expense ratios reflect operating expenses of the class. Expenses before reductions do not reflect amounts reimbursed by the investment adviser or reductions from brokerage service arrangements or reductions from other expense offset arrangements and do not represent the amount paid by the class during periods when reimbursements or reductions occur. Expense ratios before reductions for start-up periods may not be representative of longer-term operating periods. Expenses net of fee waivers reflect expenses after reimbursement by the investment adviser but prior to reductions from brokerage service arrangements or other expense offset arrangements. Expenses net of all reductions represent the net expenses paid by the class. J The portfolio turnover rate does not include the assets acquired in the merger. |
See accompanying notes which are an integral part of the financial statements.
Annual Report
Financial Highlights - Japan
Years ended October 31, | 2011 | 2010 | 2009 | 2008 | 2007 |
Selected Per-Share Data | | | | | |
Net asset value, beginning of period | $ 10.57 | $ 10.03 | $ 9.03 | $ 18.00 | $ 16.85 |
Income from Investment Operations | | | | | |
Net investment income (loss) B | .15 | .10 | .08 | .10 | .04 |
Net realized and unrealized gain (loss) | (.75) | .61 | 1.04 | (6.64) | 1.35 |
Total from investment operations | (.60) | .71 | 1.12 | (6.54) | 1.39 |
Distributions from net investment income | (.20) | (.07) | (.11) | (.04) | (.01) |
Distributions from net realized gain | (.21) | (.10) | (.01) | (2.39) | (.23) |
Total distributions | (.41) | (.17) | (.12) | (2.43) | (.24) |
Redemption fees added to paid in capital B | .01 | - G | - G | - G | - G |
Net asset value, end of period | $ 9.57 | $ 10.57 | $ 10.03 | $ 9.03 | $ 18.00 |
Total Return A | (6.00)% | 7.12% | 12.84% | (41.88)% | 8.36% |
Ratios to Average Net Assets C,E | | | | | |
Expenses before reductions | .86% | .93% | .90% | 1.12% | 1.08% |
Expenses net of fee waivers, if any | .84% | .93% | .90% | 1.12% | 1.08% |
Expenses net of all reductions | .80% | .93% | .89% | 1.10% | 1.06% |
Net investment income (loss) | 1.38% | .97% | .90% | .72% | .24% |
Supplemental Data | | | | | |
Net assets, end of period (000 omitted) | $ 450,417 | $ 649,316 | $ 944,902 | $ 1,025,334 | $ 1,779,451 |
Portfolio turnover rate D | 134% F | 43% | 73% | 78% | 158% |
A Total returns would have been lower if certain expenses had not been reduced during the applicable periods shown. B Calculated based on average shares outstanding during the period. C Fees and expenses of any underlying Fidelity Central Funds are not included in the Fund's expense ratio. The Fund indirectly bears its proportionate share of the expenses of any underlying Fidelity Central Funds. D Amount does not include the portfolio activity of any underlying Fidelity Central Funds. E Expense ratios reflect operating expenses of the class. Expenses before reductions do not reflect amounts reimbursed by the investment adviser or reductions from brokerage service arrangements or reductions from other expense offset arrangements and do not represent the amount paid by the class during periods when reimbursements or reductions occur. Expenses net of fee waivers reflect expenses after reimbursement by the investment adviser but prior to reductions from brokerage service arrangements or other expense offset arrangements. Expenses net of all reductions represent the net expenses paid by the class. F The portfolio turnover rate does not include the assets acquired in the merger. G Amount represents less than $.01 per share. |
Financial Highlights - Institutional Class
Years ended October 31, | 2011 G |
Selected Per-Share Data | |
Net asset value, beginning of period | $ 10.83 |
Income from Investment Operations | |
Net investment income (loss) D | .13 |
Net realized and unrealized gain (loss) | (1.40) |
Total from investment operations | (1.27) |
Redemption fees added to paid in capital D | .01 |
Net asset value, end of period | $ 9.57 |
Total Return B,C | (11.63)% |
Ratios to Average Net Assets E,H | |
Expenses before reductions | .79% A |
Expenses net of fee waivers, if any | .79% A |
Expenses net of all reductions | .75% A |
Net investment income (loss) | 1.43% A |
Supplemental Data | |
Net assets, end of period (000 omitted) | $ 2,715 |
Portfolio turnover rate F | 134% I |
A Annualized B Total returns for periods of less than one year are not annualized. C Total returns would have been lower if certain expenses had not been reduced during the applicable periods shown. D Calculated based on average shares outstanding during the period. E Fees and expenses of any underlying Fidelity Central Funds are not included in the Fund's expense ratio. The Fund indirectly bears its proportionate share of the expenses of any underlying Fidelity Central Funds. F Amount does not include the portfolio activity of any underlying Fidelity Central Funds. G For the period December 14, 2010 (commencement of sale of shares) to October 31, 2011. H Expense ratios reflect operating expenses of the class. Expenses before reductions do not reflect amounts reimbursed by the investment adviser or reductions from brokerage service arrangements or reductions from other expense offset arrangements and do not represent the amount paid by the class during periods when reimbursements or reductions occur. Expense ratios before reductions for start-up periods may not be representative of longer-term operating periods. Expenses net of fee waivers reflect expenses after reimbursement by the investment adviser but prior to reductions from brokerage service arrangements or other expense offset arrangements. Expenses net of all reductions represent the net expenses paid by the class. I The portfolio turnover rate does not include the assets acquired in the merger. |
See accompanying notes which are an integral part of the financial statements.
Annual Report
Notes to Financial Statements
For the period ended October 31, 2011
1. Organization.
Fidelity Japan Fund (the Fund) is a fund of Fidelity Investment Trust (the Trust) and is authorized to issue an unlimited number of shares. The Trust is registered under the Investment Company Act of 1940, as amended (the 1940 Act), as an open-end management investment company organized as a Massachusetts business trust. The Fund launched shares of Class A, Class T, Class B, Class C and Institutional Class and the existing class was designated Japan on December 14, 2011. Each class has equal rights as to assets and voting privileges. Class B shares are closed to new accounts and additional purchases by existing shareholders. Each class has exclusive voting rights with respect to matters that affect that class. Class B shares automatically convert to Class A shares after a holding period of seven years from the initial date of purchase. Investment income, realized and unrealized capital gains and losses, the common expenses of the Fund, and certain fund-level expense reductions, if any, are allocated on a pro-rata basis to each class based on the relative net assets of each class to the total net assets of the Fund. Each class differs with respect to transfer agent and distribution and service plan fees incurred. Certain expense reductions may also differ by class. The Fund offered Class F shares during the period June 26, 2009 through December 15, 2010 and all outstanding shares were redeemed by December 15, 2010.
2. Investments in Fidelity Central Funds.
The Fund invests in Fidelity Central Funds, which are open-end investment companies available only to other investment companies and accounts managed by Fidelity Management & Research Company (FMR) and its affiliates. The Fund's Schedule of Investments lists each of the Fidelity Central Funds held as of period end, if any, as an investment of the Fund, but does not include the underlying holdings of each Fidelity Central Fund. As an Investing Fund, the Fund indirectly bears its proportionate share of the expenses of the underlying Fidelity Central Funds.
The Money Market Central Funds seek preservation of capital and current income and are managed by Fidelity Investments Money Management, Inc. (FIMM), an affiliate of FMR.
A complete unaudited list of holdings for each Fidelity Central Fund is available upon request or at the Securities and Exchange Commission (the SEC) web site at www.sec.gov. In addition, the financial statements of the Fidelity Central Funds, which are not covered by the Fund's Report of Independent Registered Public Accounting Firm are available on the SEC web site or upon request.
3. Significant Accounting Policies.
The financial statements have been prepared in conformity with accounting principles generally accepted in the United States of America (GAAP), which require management to make certain estimates and assumptions at the date of the financial statements. Actual results could differ from those estimates. Subsequent events, if any, through the date that the financial statements were issued have been evaluated in the preparation of the financial statements. The following summarizes the significant accounting policies of the Fund:
Security Valuation. Investments are valued as of 4:00 p.m. Eastern time on the last calendar day of the period. The Fund uses independent pricing services approved by the Board of Trustees to value its investments. When current market prices or quotations are not readily available or reliable, valuations may be determined in good faith in accordance with procedures adopted by the Board of Trustees. Factors used in determining value may include market or security specific events. The frequency with which these procedures are used cannot be predicted and they may be utilized to a significant extent. The value used for net asset value (NAV) calculation under these procedures may differ from published prices for the same securities.
The Fund categorizes the inputs to valuation techniques used to value its investments into a disclosure hierarchy consisting of three levels as shown below:
Level 1 - quoted prices in active markets for identical investments
Level 2 - other significant observable inputs (including quoted prices for similar investments, interest rates, prepayment speeds, etc.)
Level 3 - unobservable inputs (including the Fund's own assumptions based on the best information available)
Changes in valuation techniques may result in transfers in or out of an assigned level within the disclosure hierarchy. The aggregate value of investments by input level, as of October 31, 2011, is included at the end of the Fund's Schedule of Investments. Valuation techniques used to value the Fund's investments by major category are as follows:
Equity securities, including restricted securities, for which market quotations are readily available, are valued at the last reported sale price or official closing price as reported by an independent pricing service on the primary market or exchange on which they are traded and are categorized as Level 1 in the hierarchy. In the event there were no sales during the day or closing prices are not available, securities are valued at the last quoted bid price or may be valued using the last available price and are generally categorized as Level 2 in the hierarchy. For foreign equity securities, when significant market or security specific events arise, comparisons to the valuation of American Depositary Receipts (ADRs), futures contracts, Exchange-traded
Annual Report
3. Significant Accounting Policies - continued
Security Valuation - continued
funds (ETFs) and certain indexes as well as quoted prices for similar securities are used and are categorized as Level 2 in the hierarchy in these circumstances. Utilizing these techniques may result in transfers between Level 1 and Level 2. For restricted equity securities and private placements where observable inputs are limited, assumptions about market activity and risk are used and are categorized as Level 3 in the hierarchy.
Investments in open-end mutual funds, including the Fidelity Central Funds, are valued at their closing net asset value each business day and are categorized as Level 1 in the hierarchy.
Foreign Currency. The Fund may use foreign currency contracts to facilitate transactions in foreign-denominated securities. Gains and losses from these transactions may arise from changes in the value of the foreign currency or if the counterparties do not perform under the contracts' terms.
Foreign-denominated assets, including investment securities, and liabilities are translated into U.S. dollars at the exchange rate at period end. Purchases and sales of investment securities, income and dividends received and expenses denominated in foreign currencies are translated into U.S. dollars at the exchange rate in effect on the transaction date.
The effects of exchange rate fluctuations on investments are included with the net realized and unrealized gain (loss) on investment securities. Other foreign currency transactions resulting in realized and unrealized gain (loss) are disclosed separately.
Investment Transactions and Income. For financial reporting purposes, the Fund's investment holdings and NAV include trades executed through the end of the last business day of the period. The NAV per share for processing shareholder transactions is calculated as of the close of business of the New York Stock Exchange (NYSE), normally 4:00 p.m. Eastern time and includes trades executed through the end of the prior business day. Gains and losses on securities sold are determined on the basis of identified cost. Dividend income is recorded on the ex-dividend date, except for certain dividends from foreign securities where the ex-dividend date may have passed, which are recorded as soon as the Fund is informed of the ex-dividend date. Non-cash dividends included in dividend income, if any, are recorded at the fair market value of the securities received. Interest income and distributions from the Fidelity Central Funds are accrued as earned. Interest income includes coupon interest and amortization of premium and accretion of discount on debt securities. Investment income is recorded net of foreign taxes withheld where recovery of such taxes is uncertain.
Expenses. Expenses directly attributable to a fund are charged to that fund. Expenses attributable to more than one fund are allocated among the respective funds on the basis of relative net assets or other appropriate methods. Expense estimates are accrued in the period to which they relate and adjustments are made when actual amounts are known.
Income Tax Information and Distributions to Shareholders. Each year, the Fund intends to qualify as a regulated investment company, including distributing substantially all of its taxable income and realized gains under Subchapter M of the Internal Revenue Code and filing its U.S. federal tax return. As a result, no provision for income taxes is required. As of October 31, 2011, the Fund did not have any unrecognized tax benefits in the financial statements. A fund's federal tax return is subject to examination by the Internal Revenue Service (IRS) for a period of three years. Foreign taxes are provided for based on the Fund's understanding of the tax rules and rates that exist in the foreign markets in which it invests.
Distributions are declared and recorded on the ex-dividend date. Income dividends and capital gain distributions are declared separately for each class. Income and capital gain distributions are determined in accordance with income tax regulations, which may differ from GAAP.
Capital accounts within the financial statements are adjusted for permanent book-tax differences. These adjustments have no impact on net assets or the results of operations. Temporary book-tax differences will reverse in a subsequent period.
Book-tax differences are primarily due to the foreign currency transactions, passive foreign investment companies (PFIC), capital loss carryforwards and losses deferred due to wash sales.
The federal tax cost of investment securities and unrealized appreciation (depreciation) as of period end were as follows:
Gross unrealized appreciation | $ 9,010,731 |
Gross unrealized depreciation | (93,994,822) |
Net unrealized appreciation (depreciation) on securities and other investments | $ (84,984,091) |
| |
Tax Cost | $ 561,143,163 |
Annual Report
Notes to Financial Statements - continued
3. Significant Accounting Policies - continued
Income Tax Information and Distributions to Shareholders - continued
The tax-based components of distributable earnings as of period end were as follows:
Undistributed ordinary income | $ 9,973,043 |
Capital loss carryforward | $ (523,526,201) |
Net unrealized appreciation (depreciation) | $ (85,061,572) |
Under the recently enacted Regulated Investment Company Modernization Act of 2010 (the Act), the Fund will be permitted to carry forward capital losses incurred in taxable years beginning after December 22, 2010 for an unlimited period. However, any losses incurred during those future taxable years will be required to be utilized prior to any losses incurred in pre-enactment taxable years, which generally expire after eight years from when they are incurred. Additionally, post-enactment capital losses that are carried forward will retain their character as either short-term or long-term capital losses rather than being considered all short-term as under previous law. The Fund's first fiscal year end subject to the Act will be October 31, 2012.
The tax character of distributions paid was as follows:
| October 31, 2011 | October 31, 2010 |
Ordinary Income | $ 20,255,739 | $ 16,173,245 |
Short-Term Trading (Redemption) Fees. Shares held by investors in the Fund less than 90 days are subject to a redemption fee equal to 1.50% of the net asset value of shares redeemed. All redemption fees, which reduce the proceeds of the shareholder redemption, are retained by the Fund and accounted for as an addition to paid in capital.
New Accounting Pronouncement. In May 2011, the Financial Accounting Standards Board issued Accounting Standard Update No. 2011-04, Fair Value Measurement (Topic 820) - Amendments to Achieve Common Fair Value Measurement and Disclosure Requirements in U.S. GAAP and IFRSs. The update changes the wording used to describe the requirements in GAAP for measuring fair value and for disclosing information about fair value measurements. The update is effective during interim and annual periods beginning after December 15, 2011. Management is currently evaluating the impact of the update's adoption on the Fund's financial statement disclosures.
4. Purchases and Sales of Investments.
Purchases and sales of securities, other than short-term securities, aggregated $721,537,081 and $904,027,023, respectively.
5. Fees and Other Transactions with Affiliates.
Management Fee. FMR and its affiliates provide the Fund with investment management related services for which the Fund pays a monthly management fee. The management fee is the sum of an individual fund fee rate that is based on an annual rate of .45% of the Fund's average net assets and a group fee rate that averaged .26% during the period. The group fee rate is based upon the average net assets of all the mutual funds advised by FMR. The group fee rate decreases as assets under management increase and increases as assets under management decrease. In addition, the management fee is subject to a performance adjustment (up to a maximum of ± .20% of the Fund's average net assets over a 36 month performance period). The upward or downward adjustment to the management fee is based on the relative investment performance of Japan class of shares as compared to an appropriate benchmark index. For the period, the total annual management fee rate, including the performance adjustment, was .54% of the Fund's average net assets.
Distribution and Service Plan Fees. In accordance with Rule 12b-1 of the 1940 Act, the Fund has adopted separate Distribution and Service Plans for each class of shares. Certain classes pay Fidelity Distributors Corporation (FDC), an affiliate of FMR, separate Distribution and Service Fees, each of which is based on an annual percentage of each class' average net assets. In addition, FDC may pay financial intermediaries for selling shares of the Fund and providing shareholder support services. For the period, the Distribution and Service Fee rates, total fees and amounts retained by FDC were as follows:
| Distribution
Fee | Service
Fee | Total Fees | Retained
by FDC |
Class A | -% | .25% | $ 33,584 | $ 956 |
Class T | .25% | .25% | 21,758 | - |
Class B | .75% | .25% | 16,323 | 12,260 |
Class C | .75% | .25% | 88,343 | 36,106 |
| | | $ 160,008 | $ 49,322 |
Annual Report
5. Fees and Other Transactions with Affiliates - continued
Sales Load. FDC may receive a front-end sales charge of up to 5.75% for selling Class A shares, and 3.50% for selling Class T shares, some of which is paid to financial intermediaries for selling shares of the Fund. Depending on the holding period, FDC may receive contingent deferred sales charges levied on Class A, Class T, Class B, and Class C redemptions. The deferred sales charges range from 5% to 1% for Class B, 1% for Class C, 1.00% for certain purchases of Class A shares and .25% for certain purchases of Class T shares.
For the period, sales charge amounts retained by FDC were as follows:
| Retained
by FDC |
Class A | $ 14,607 |
Class T | 2,755 |
Class B* | 1,789 |
Class C* | 3,545 |
| $ 22,696 |
* When Class B and Class C shares are initially sold, FDC pays commissions from its own resources to financial intermediaries through which the sales are made.
Transfer Agent Fees. Fidelity Investments Institutional Operations Company, Inc. (FIIOC), an affiliate of FMR, is the transfer, dividend disbursing and shareholder servicing agent for each class of the Fund. FIIOC receives account fees and asset-based fees that vary according to the account size and type of account of the shareholders of the respective classes of the Fund. FIIOC pays for typesetting, printing and mailing of shareholder reports, except proxy statements. For the period, transfer agent fees for each class were as follows:
| Amount | % of
Average
Net Assets |
Class A | $ 40,772 | .30 |
Class T | 14,503 | .33 |
Class B | 4,919 | .30 |
Class C | 24,172 | .27 |
Japan | 1,110,816 | .21 |
Institutional Class | 4,414 | .15 |
| $ 1,199,596 | |
Accounting and Security Lending Fees. Fidelity Service Company, Inc. (FSC), an affiliate of FMR, maintains the Fund's accounting records. The accounting fee is based on the level of average net assets for the month. Under a separate contract, FSC administers the security lending program. The security lending fee is based on the number and duration of lending transactions.
6. Committed Line of Credit.
The Fund participates with other funds managed by FMR or an affiliate in a $4.0 billion credit facility (the "line of credit") to be utilized for temporary or emergency purposes to fund shareholder redemptions or for other short-term liquidity purposes. The Fund has agreed to pay commitment fees on its pro-rata portion of the line of credit, which amounted to $1,762 and is reflected in Miscellaneous expenses on the Statement of Operations. During the period, there were no borrowings on this line of credit.
7. Security Lending.
The Fund lends portfolio securities through a lending agent from time to time in order to earn additional income. For equity securities, a lending agent is used and may loan securities to certain qualified borrowers, including Fidelity Capital Markets (FCM), a broker-dealer affiliated with the Fund. On the settlement date of the loan, the Fund receives collateral (in the form of U.S. Treasury obligations, letters of credit and/or cash) against the loaned securities and maintains collateral in an amount not less than 100% of the market value of the loaned securities during the period of the loan. The market value of the loaned securities is determined at the close of business of the Fund and any additional required collateral is delivered to the Fund on the next business day. If the borrower defaults on its obligation to return the securities loaned because of insolvency or other reasons, a fund could experience delays and costs in recovering the securities loaned or in gaining access to the collateral. Any cash collateral received is invested in the Fidelity Securities Lending Cash Central Fund. At period end, there were no security loans outstanding. Security lending income represents the income earned on investing cash collateral, less rebates paid to borrowers and any lending agent fees associated with the loan, plus any premium payments received for lending certain types of securities. Security lending income is presented in the Statement of Operations as a component of income from Fidelity Central Funds. Total security lending income during the period amounted to $6,193. During the period, there were no securities loaned to FCM.
Annual Report
Notes to Financial Statements - continued
8. Expense Reductions.
FMR voluntarily agreed to reimburse a portion of Japan's operating expenses. During the period, this reimbursement reduced the class' expenses by $68,875.
Many of the brokers with whom FMR places trades on behalf of the Fund provided services in addition to trade execution. These services included payments of certain expenses on behalf of the Fund totaling $219,091 for the period.
9. Distributions to Shareholders.
Distributions to shareholders of each class were as follows:
Years ended October 31, | 2011A,B | 2010 |
From net investment income | | |
Class A | $ - | $ - |
Class T | - | - |
Class B | - | - |
Class C | - | - |
Japan | 9,544,936 | 6,581,344 |
Class F | 204,046 | 84,436 |
Institutional Class | - | - |
Total | $ 9,748,982 | $ 6,665,780 |
From net realized gain | | |
Class A | $ - | $ - |
Class T | - | - |
Class B | - | - |
Class C | - | - |
Japan | 10,328,111 | 9,401,920 |
Class F | 178,646 | 105,545 |
Institutional Class | - | - |
Total | $ 10,506,757 | $ 9,507,465 |
A Distributions for Class A, Class T, Class B, Class C and Institutional Class are for the period December 14, 2010 (commencement of sale of shares) to October 31, 2011.
B All Class F shares were redeemed on December 15, 2010.
10. Share Transactions.
Transactions for each class of shares were as follows:
| Shares | Dollars |
Years ended October 31, | 2011A,B | 2010 | 2011A,B | 2010 |
Class A | | | | |
Shares sold | 902,250 | - | $ 9,266,531 | $ - |
Issued in exchange for shares of Fidelity Advisor Japan Fund | 1,458,691 | - | 15,812,213 | - |
Shares redeemed | (975,882) | - | (10,202,627) | - |
Net increase (decrease) | 1,385,059 | - | $ 14,876,117 | $ - |
Class T | | | | |
Shares sold | 132,383 | - | $ 1,384,063 | $ - |
Issued in exchange for shares of Fidelity Advisor Japan Fund | 487,882 | - | 5,288,638 | - |
Shares redeemed | (132,194) | - | (1,415,637) | - |
Net increase (decrease) | 488,071 | - | $ 5,257,064 | $ - |
Class B | | | | |
Shares sold | 15,198 | - | $ 161,868 | $ - |
Issued in exchange for shares of Fidelity Advisor Japan Fund | 224,548 | - | 2,434,105 | - |
Shares redeemed | (85,826) | - | (926,239) | - |
Net increase (decrease) | 153,920 | - | $ 1,669,734 | $ - |
Class C | | | | |
Shares sold | 711,218 | - | $ 7,424,606 | $ - |
Issued in exchange for shares of Fidelity Advisor Japan Fund | 857,308 | - | 9,293,223 | - |
Shares redeemed | (645,053) | - | (6,643,542) | - |
Net increase (decrease) | 923,473 | - | $ 10,074,287 | $ - |
Annual Report
10. Share Transactions - continued
| Shares | Dollars |
Years ended October 31, | 2011A,B | 2010 | 2011A,B | 2010 |
Japan | | | | |
Shares sold | 16,755,813 | 20,810,343 | $ 180,371,996 | $ 217,088,312 |
Reinvestment of distributions | 1,718,167 | 1,440,939 | 18,229,748 | 14,827,260 |
Shares redeemed | (32,842,865) | (55,048,520) | (351,598,189) | (565,865,726) |
Net increase (decrease) | (14,368,885) | (32,797,238) | $ (152,996,445) | $ (333,950,154) |
Class F | | | | |
Shares sold | 346,757 | 8,109,487 | $ 3,766,116 | $ 83,695,320 |
Reinvestment of distributions | 36,103 | 18,463 | 382,692 | 189,982 |
Shares redeemed | (3,617,960) | (5,428,702) | (39,396,699) | (55,799,580) |
Net increase (decrease) | (3,235,100) | 2,699,248 | $ (35,247,891) | $ 28,085,722 |
Institutional Class | | | | |
Shares sold | 324,072 | - | $ 3,355,850 | $ - |
Issued in exchange for shares of Fidelity Advisor Japan Fund | 420,228 | - | 4,555,276 | - |
Shares redeemed | (460,581) | - | (4,809,911) | - |
Net increase (decrease) | 283,719 | - | $ 3,101,215 | $ - |
A Share transactions for Class A, Class T, Class B, Class C and Institutional Class are for the period December 14, 2010 (commencement of sale of shares) to October 31, 2011.
B All Class F shares were redeemed on December 15, 2010.
11. Other.
The Fund's organizational documents provide former and current trustees and officers with a limited indemnification against liabilities arising in connection with the performance of their duties to the Fund. In the normal course of business, the Fund may also enter into contracts that provide general indemnifications. The Fund's maximum exposure under these arrangements is unknown as this would be dependent on future claims that may be made against the Fund. The risk of material loss from such claims is considered remote.
At the end of the period, Strategic Advisors International Fund was the owner of record of approximately 31% of the total outstanding shares of the Fund. Mutual funds managed by Strategic Advisors, Inc., an affiliate of FMR, were the owners of record, in the aggregate, of approximately 36% of the total outstanding shares of the Fund.
12. Merger Information.
On December 17, 2010, the Fund acquired all of the assets and assumed all of the liabilities of the Fidelity Advisor Japan Fund ("Target Fund") pursuant to an agreement and plan of reorganization approved by the Board of Trustees ("The Board") on July 14, 2010. The reorganization provides shareholders of the Target Fund access to a larger portfolio with the same investment objective and lower expenses. The acquisition was accomplished by an exchange of 1,458,691 Class A shares, 487,882 Class T shares, 224,548 Class B shares, 857,308 Class C shares, and 420,228 Institutional Class shares of the Fund, respectively, for 1,347,662 Class A shares, 458,320 Class T shares, 220,839 Class B shares, 837,651 Class C shares, and 377,690 Institutional Class shares then outstanding (valued at $11.73, $11.54, $11.02, $11.09 and $12.06 per share for Class A, Class T, Class B, Class C, and Institutional Class, respectively) of the Target Fund. The reorganization qualified as a tax-free reorganization for federal income tax purposes with no gain or loss recognized to the funds or their shareholders. The Target Fund's net assets, including securities of $37,429,891, unrealized depreciation of $(2,434,247), cash of $6,456 and net other liabilities of $(52,892), were combined with the Fund's net assets of $515,046,445 for total net assets after the acquisition of $552,429,900.
Pro forma results of operations of the combined entity for the entire period ended October 31, 2011, as though the acquisition had occurred as of the beginning of the year (rather than on the actual acquisition date), are as follows:
Net investment income (loss) | $ 7,426,258 |
Total net realized gain (loss) | (68,640,546) |
Total change in net unrealized appreciation (depreciation) | 34,276,793 |
Net increase (decrease) in net assets resulting from operations | $ 26,937,495 |
Because the combined investment portfolios have been managed as a single portfolio since the acquisition was completed, it is not practicable to separate the amounts of revenue and earnings of the acquired fund that have been included in the Fund's accompanying Statement of Operations since December 17, 2010.
Annual Report
Fidelity Japan Smaller Companies Fund
Performance: The Bottom Line
Average annual total return reflects the change in the value of an investment, assuming reinvestment of the fund's distributions from dividend income and capital gains (the profits earned upon the sale of securities that have grown in value, if any) and assuming a constant rate of performance each year. The $10,000 table and the fund's returns do not reflect the deduction of taxes that a shareholder would pay on fund distributions or the redemption of fund shares. During periods of reimbursement by Fidelity, a fund's total return will be greater than it would be had the reimbursement not occurred. How a fund did yesterday is no guarantee of how it will do tomorrow.
Average Annual Total Returns
Periods ended October 31, 2011 | Past 1
year | Past 5
years | Past 10
years |
Fidelity Japan Smaller Companies Fund | 6.44% | -6.85% | 3.71% |
$10,000 Over 10 years
Let's say hypothetically that $10,000 was invested in Fidelity Japan Smaller Companies Fund on October 31, 2001. The chart shows how the value of your investment would have changed, and also shows how the Russell®/Nomura® Mid-Small Cap Index performed over the same period.
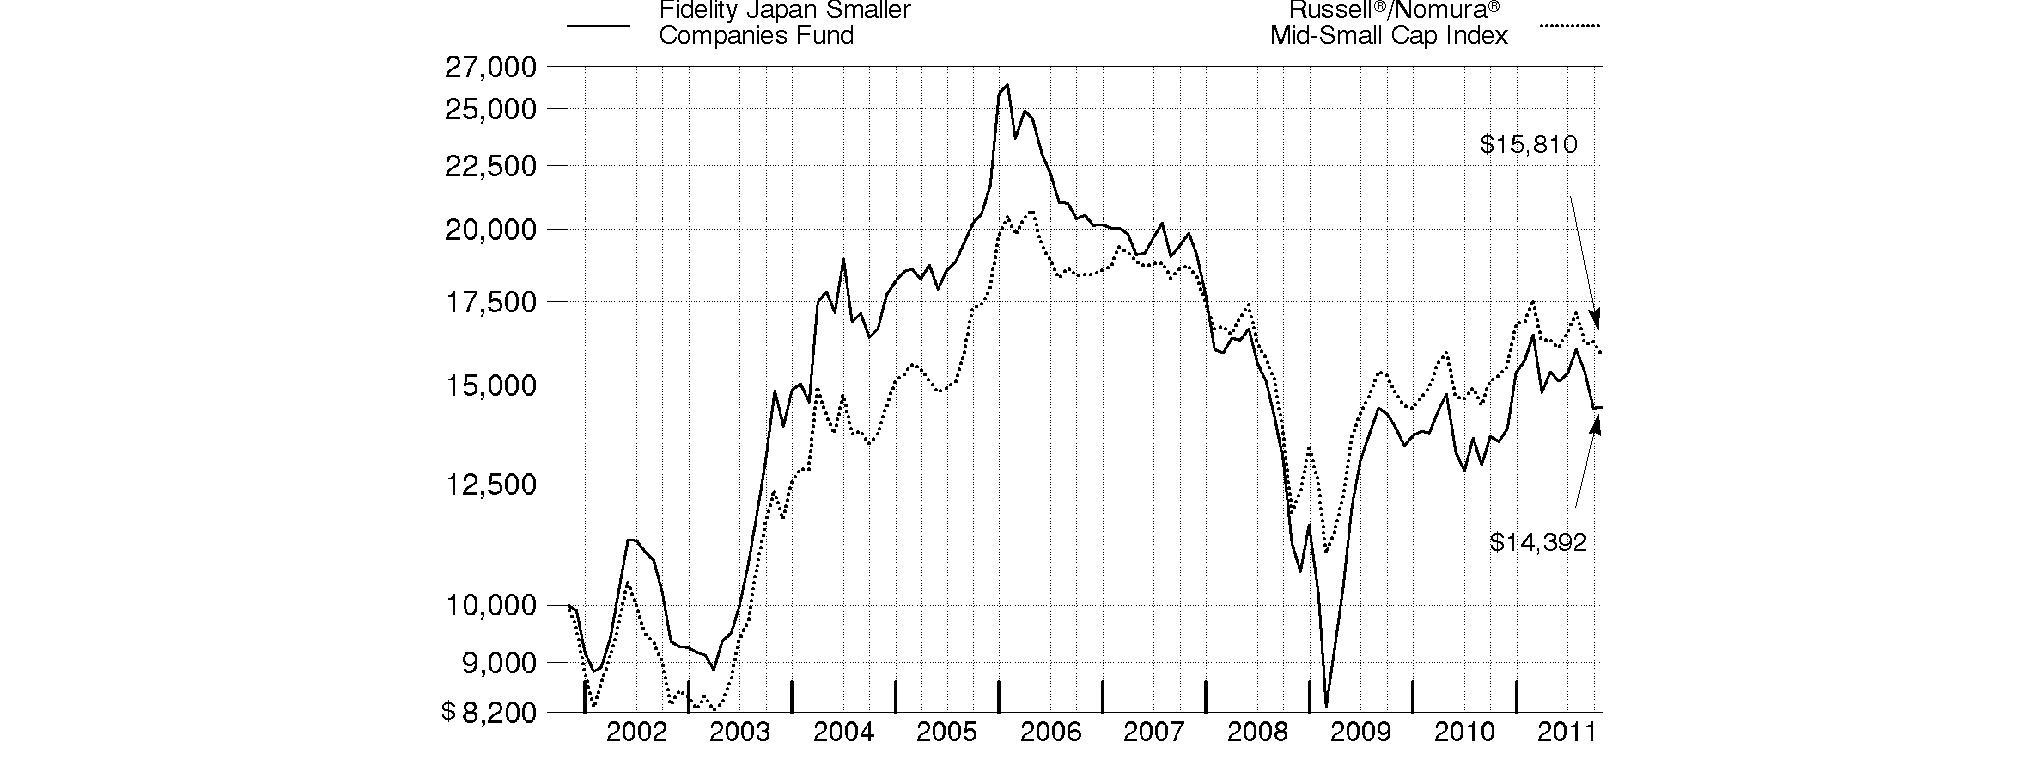
Annual Report
Fidelity Japan Smaller Companies Fund
Market Recap: Beset by natural disaster and a fragile global economic climate, Japanese stocks were extremely volatile during the 12 months ending October 31, 2011. However, when the dust settled, share prices were essentially unchanged. For the year, the Tokyo Stock Price Index (TOPIX) returned -0.35%. Japanese equities mounted a strong advance during the first four months of the period, only to give back those gains and more within a few days following the mid-March tsunami and earthquake. Initially, the recovery from this plunge was relatively robust, as investors realized that supply and demand disruptions associated with the disaster would be resolved more quickly than originally feared. However, as the period progressed, Japanese stocks faced other challenges, such as the sovereign debt crisis in Europe and flood damage in Thailand. An appreciating yen - despite government intervention to contain it - aided Japanese equities quoted in U.S. dollars, while making it harder for Japanese exporters to remain competitive. The three smallest sectors within the index - energy, telecommunication services and consumer staples - were its strongest performers, each posting gains of more than 15%. By contrast, utilities sustained by far the biggest loss, weighed down by the company that owned the nuclear reactor damaged by the tsunami.
Comments from Nicholas Price, Portfolio Manager of Fidelity® Japan Smaller Companies Fund: For the 12 months ending October 31, 2011, the fund returned 6.44%, outperforming the 3.68% return of the Russell®/Nomura® Mid-Small Cap Index. Overall positioning in information technology led the way, followed by an underweighting in utilities. Positioning in consumer discretionary and stock picking in consumer staples helped, as well. On the other hand, stock picking in materials, industrials and financials detracted. Among individual stocks that helped the fund's relative performance, GREE, a mobile social networking site (SNS) gaming company, was by far the period's standout contributor. Other Internet-related holdings, such as Start Today - the operator of the Zozotown online apparel site - and price comparison website Kakaku.com also saw strong growth. Baby-goods distributor Pigeon benefited from a post-earthquake surge in demand for its products, and MEGANE TOP, operator of a chain of eyeglass stores, reported record operating profits for fiscal 2010. Not holding Tokyo Electric Power, operator of the stricken Fukushima nuclear plant, also helped. On the other hand, video game developer Nintendo, an out-of-benchmark stock, detracted the most, and the position was sold by period end. Elsewhere, Shinko Electric Industries and Kanto Denka Kogyo mirrored a downturn in the semiconductor/LCD cycles. Non-bank financials, including Takara Leben (condo development) and Osaka Securities Exchange, also suffered relatively steep stock price declines.
The views expressed above reflect those of the portfolio manager(s) only through the end of the period as stated on the cover of this report and do not necessarily represent the views of Fidelity or any other person in the Fidelity organization. Any such views are subject to change at any time based upon market or other conditions and Fidelity disclaims any responsibility to update such views. These views may not be relied on as investment advice and, because investment decisions for a Fidelity fund are based on numerous factors, may not be relied on as an indication of trading intent on behalf of any Fidelity fund.
Annual Report
Fidelity Japan Smaller Companies Fund
As a shareholder of the Fund, you incur two types of costs: (1) transaction costs, including redemption fees, and (2) ongoing costs, including management fees and other Fund expenses. This Example is intended to help you understand your ongoing costs (in dollars) of investing in the Fund and to compare these costs with the ongoing costs of investing in other mutual funds.
The Example is based on an investment of $1,000 invested at the beginning of the period and held for the entire period (May 1, 2011 to October 31, 2011).
Actual Expenses
The first line of the accompanying table provides information about actual account values and actual expenses. You may use the information in this line, together with the amount you invested, to estimate the expenses that you paid over the period. Simply divide your account value by $1,000.00 (for example, an $8,600 account value divided by $1,000.00 = 8.6), then multiply the result by the number in the first line under the heading entitled "Expenses Paid During Period" to estimate the expenses you paid on your account during this period. A small balance maintenance fee of $12.00 that is charged once a year may apply for certain accounts with a value of less than $2,000. This fee is not included in the table below. If it was, the estimate of expenses you paid during the period would be higher, and your ending account value lower, by this amount. In addition, the Fund, as a shareholder in the underlying Fidelity Central Funds, will indirectly bear its pro-rata share of the fees and expenses incurred by the underlying Fidelity Central Funds. These fees and expenses are not included in the Fund's annualized expense ratio used to calculate the expense estimate in the table below.
Hypothetical Example for Comparison Purposes
The second line of the accompanying table provides information about hypothetical account values and hypothetical expenses based on the Fund's actual expense ratio and an assumed rate of return of 5% per year before expenses, which is not the Fund's actual return. The hypothetical account values and expenses may not be used to estimate the actual ending account balance or expenses you paid for the period. You may use this information to compare the ongoing costs of investing in the Fund and other funds. To do so, compare this 5% hypothetical example with the 5% hypothetical examples that appear in the shareholder reports of the other funds. A small balance maintenance fee of $12.00 that is charged once a year may apply for certain accounts with a value of less than $2,000. This fee is not included in the table below. If it was, the estimate of expenses you paid during the period would be higher, and your ending account value lower, by this amount. In addition, the Fund, as a shareholder in the underlying Fidelity Central Funds, will indirectly bear its pro-rata share of the fees and expenses incurred by the underlying Fidelity Central Funds. These fees and expenses are not included in the Fund's annualized expense ratio used to calculate the expense estimate in the table below.
Please note that the expenses shown in the table are meant to highlight your ongoing costs only and do not reflect any transaction costs. Therefore, the second line of the table is useful in comparing ongoing costs only, and will not help you determine the relative total costs of owning different funds. In addition, if these transactional costs were included, your costs would have been higher.
| Annualized
Expense Ratio | Beginning
Account Value
May 1, 2011 | Ending
Account Value
October 31, 2011 | Expenses Paid
During Period*
May 1, 2011 to
October 31, 2011 |
Actual | 1.05% | $ 1,000.00 | $ 937.00 | $ 5.13 |
Hypothetical (5% return per year before expenses) | | $ 1,000.00 | $ 1,019.91 | $ 5.35 |
* Expenses are equal to the Fund's annualized expense ratio, multiplied by the average account value over the period, multiplied by 184/365 (to reflect the one-half year period).
Annual Report
Fidelity Japan Smaller Companies Fund
Investment Changes (Unaudited)
Geographic Diversification (% of fund's net assets) |
As of October 31, 2011 |
| Japan | 99.4% | |
| United States of America | 0.6% | |

Percentages are adjusted for the effect of futures contracts, if applicable. |
As of April 30, 2011 |
| Japan | 99.2% | |
| United States of America | 0.8% | |

Percentages are adjusted for the effect of futures contracts, if applicable. |
Asset Allocation |
| % of fund's
net assets | % of fund's net assets
6 months ago |
Stocks | 99.4 | 99.2 |
Short-Term Investments and Net Other Assets | 0.6 | 0.8 |
Top Ten Stocks as of October 31, 2011 |
| % of fund's
net assets | % of fund's net assets
6 months ago |
GREE, Inc. (Internet Software & Services) | 8.3 | 5.6 |
Pigeon Corp. (Household Products) | 6.4 | 5.0 |
ORIX Corp. (Diversified Financial Services) | 6.1 | 5.8 |
Osaka Securities Exchange Co. Ltd. (Diversified Financial Services) | 3.8 | 4.0 |
Kakaku.com, Inc. (Internet Software & Services) | 3.6 | 2.4 |
Takara Leben Co. Ltd. (Real Estate Management & Development) | 3.5 | 3.8 |
Honda Motor Co. Ltd. (Automobiles) | 3.2 | 0.0 |
Sosei Group Corp. (Biotechnology) | 3.0 | 2.2 |
Citizen Holdings Co. Ltd. (Electronic Equipment & Components) | 2.9 | 2.7 |
Stanley Electric Co. Ltd. (Auto Components) | 2.7 | 3.3 |
| 43.5 | |
Market Sectors as of October 31, 2011 |
| % of fund's
net assets | % of fund's net assets
6 months ago |
Information Technology | 23.7 | 25.4 |
Consumer Discretionary | 19.0 | 24.8 |
Industrials | 18.3 | 10.5 |
Financials | 15.9 | 17.1 |
Materials | 10.4 | 10.6 |
Consumer Staples | 6.4 | 5.9 |
Health Care | 5.7 | 4.3 |
Telecommunication Services | 0.0 | 0.6 |
Annual Report
Fidelity Japan Smaller Companies Fund
Investments October 31, 2011
Showing Percentage of Net Assets
Common Stocks - 99.4% |
| Shares | | Value |
CONSUMER DISCRETIONARY - 19.0% |
Auto Components - 2.9% |
Nippon Seiki Co. Ltd. | 47,000 | | $ 472,266 |
Stanley Electric Co. Ltd. | 559,900 | | 8,193,819 |
Yachiyo Industry Co. Ltd. | 16,800 | | 101,272 |
| | 8,767,357 |
Automobiles - 3.7% |
Honda Motor Co. Ltd. | 324,600 | | 9,707,998 |
Nissan Motor Co. Ltd. | 155,800 | | 1,432,725 |
| | 11,140,723 |
Household Durables - 1.0% |
Koshidaka Holdings Co. Ltd. (d) | 75,400 | | 1,644,196 |
Rinnai Corp. | 2,100 | | 156,904 |
West Holdings Corp. (d) | 160,000 | | 1,363,950 |
| | 3,165,050 |
Internet & Catalog Retail - 0.0% |
Start Today Co. Ltd. | 100 | | 2,116 |
Leisure Equipment & Products - 0.9% |
Nikon Corp. | 56,100 | | 1,256,301 |
SHIMANO, Inc. | 28,100 | | 1,389,167 |
| | 2,645,468 |
Media - 2.8% |
CyberAgent, Inc. (d) | 2,164 | | 7,294,295 |
Opt, Inc. | 582 | | 729,558 |
Proto Corp. | 14,100 | | 478,826 |
| | 8,502,679 |
Specialty Retail - 7.1% |
eBook Initiative Japan Co. Ltd. | 11,400 | | 237,836 |
K'S Denki Corp. | 132,900 | | 5,581,638 |
MEGANE TOP CO. LTD. | 395,685 | | 4,621,314 |
Otsuka Kagu Ltd. | 67,500 | | 577,921 |
Pal Co. Ltd. | 154,000 | | 5,598,149 |
Point, Inc. | 117,380 | | 5,063,495 |
| | 21,680,353 |
Textiles, Apparel & Luxury Goods - 0.6% |
Fuji Spinning Co. Ltd. | 961,000 | | 1,868,209 |
TOTAL CONSUMER DISCRETIONARY | | 57,771,955 |
CONSUMER STAPLES - 6.4% |
Household Products - 6.4% |
Pigeon Corp. | 525,500 | | 19,417,782 |
FINANCIALS - 15.9% |
Capital Markets - 0.2% |
Sawada Holdings Co. Ltd. (a) | 88,000 | | 710,273 |
Consumer Finance - 2.0% |
Aeon Credit Service Co. Ltd. | 406,700 | | 6,065,842 |
|
| Shares | | Value |
Diversified Financial Services - 9.9% |
ORIX Corp. | 211,450 | | $ 18,456,719 |
Osaka Securities Exchange Co. Ltd. | 2,477 | | 11,608,864 |
| | 30,065,583 |
Real Estate Management & Development - 3.8% |
Airport Facilities Co. Ltd. | 164,300 | | 626,657 |
Takara Leben Co. Ltd. (e) | 2,006,300 | | 10,582,018 |
Toho Real Estate Co. Ltd. | 46,000 | | 237,506 |
| | 11,446,181 |
TOTAL FINANCIALS | | 48,287,879 |
HEALTH CARE - 5.7% |
Biotechnology - 3.0% |
Sosei Group Corp. (a)(d) | 5,844 | | 9,173,908 |
Health Care Equipment & Supplies - 2.0% |
Nikkiso Co. Ltd. | 618,000 | | 5,139,587 |
Sysmex Corp. | 8,900 | | 292,581 |
Terumo Corp. | 9,400 | | 477,675 |
| | 5,909,843 |
Pharmaceuticals - 0.7% |
Rohto Pharmaceutical Co. Ltd. | 188,000 | | 2,166,026 |
TOTAL HEALTH CARE | | 17,249,777 |
INDUSTRIALS - 18.3% |
Air Freight & Logistics - 0.2% |
Kintetsu World Express, Inc. | 19,500 | | 594,108 |
Airlines - 1.4% |
Skymark Airlines, Inc. | 291,500 | | 4,277,284 |
Building Products - 4.2% |
Asahi Glass Co. Ltd. | 457,000 | | 4,002,430 |
Daikin Industries Ltd. | 95,400 | | 2,823,601 |
JS Group Corp. | 21,400 | | 448,797 |
Nichias Corp. | 888,000 | | 4,824,104 |
Shinko Kogyo Co. Ltd. | 210,000 | | 715,784 |
| | 12,814,716 |
Construction & Engineering - 0.7% |
Toyo Engineering Corp. | 590,000 | | 1,950,773 |
Yahagi Construction Co. Ltd. | 49,800 | | 242,953 |
| | 2,193,726 |
Electrical Equipment - 1.0% |
Endo Lighting Corp. | 1,000 | | 14,911 |
Mitsubishi Electric Corp. | 337,000 | | 3,118,729 |
| | 3,133,640 |
Machinery - 9.5% |
Fanuc Corp. | 45,400 | | 7,341,677 |
HIRANO TECSEED Co. Ltd. | 259,000 | | 2,310,822 |
Hoshizaki Electric Co. Ltd. | 129,900 | | 2,903,252 |
Kubota Corp. | 940,000 | | 7,743,009 |
Makita Corp. | 108,300 | | 4,043,741 |
Common Stocks - continued |
| Shares | | Value |
INDUSTRIALS - continued |
Machinery - continued |
Nitta Corp. | 202,100 | | $ 3,668,989 |
SMC Corp. | 5,600 | | 871,145 |
| | 28,882,635 |
Marine - 0.1% |
Japan Transcity Corp. | 55,000 | | 162,247 |
Professional Services - 0.3% |
Fullcast Holdings Co. Ltd. (a)(d) | 5,034 | | 900,460 |
Trading Companies & Distributors - 0.9% |
Mitsui & Co. Ltd. | 91,700 | | 1,338,489 |
MonotaRO Co. Ltd. (d) | 77,500 | | 754,482 |
Tomoe Engineering Co. Ltd. | 29,000 | | 510,339 |
| | 2,603,310 |
TOTAL INDUSTRIALS | | 55,562,126 |
INFORMATION TECHNOLOGY - 23.7% |
Electronic Equipment & Components - 4.3% |
Citizen Holdings Co. Ltd. | 1,695,600 | | 8,994,668 |
Hitachi High-Technologies Corp. | 47,600 | | 994,843 |
Origin Electric Co. Ltd. | 734,000 | | 2,666,411 |
Shinko Shoji Co. Ltd. | 66,700 | | 515,157 |
| | 13,171,079 |
Internet Software & Services - 13.6% |
DeNA Co. Ltd. | 120,300 | | 5,193,004 |
GREE, Inc. (d) | 780,700 | | 25,195,769 |
Kakaku.com, Inc. | 277,600 | | 10,992,979 |
| | 41,381,752 |
IT Services - 0.2% |
CAC Corp. | 65,700 | | 483,989 |
Semiconductors & Semiconductor Equipment - 4.7% |
Disco Corp. (d) | 64,000 | | 3,381,032 |
Shinko Electric Industries Co.Ltd. (d) | 361,500 | | 2,612,394 |
Tokyo Electron Ltd. | 153,400 | | 8,159,392 |
| | 14,152,818 |
Software - 0.9% |
Capcom Co. Ltd. | 99,600 | | 2,605,897 |
NSD Co. Ltd. | 14,700 | | 117,116 |
| | 2,723,013 |
TOTAL INFORMATION TECHNOLOGY | | 71,912,651 |
MATERIALS - 10.4% |
Chemicals - 5.1% |
Asahi Kasei Corp. | 243,000 | | 1,441,256 |
Daiichi Kigenso Kagaku-Kogyo Co. Ltd. | 9,700 | | 414,098 |
Hitachi Chemical Co. Ltd. | 38,300 | | 680,557 |
JSP Corp. | 40,500 | | 594,542 |
|
| Shares | | Value |
Kanto Denka Kogyo Co. Ltd. (d) | 721,000 | | $ 3,534,841 |
Lintec Corp. | 65,500 | | 1,383,862 |
Mitsubishi Chemical Holdings Corp. | 238,000 | | 1,442,911 |
Nitto Denko Corp. | 11,800 | | 495,760 |
STELLA CHEMIFA Corp. (d) | 115,200 | | 3,337,088 |
Sumitomo Bakelite Co. Ltd. | 72,000 | | 421,627 |
Toray Industries, Inc. | 240,000 | | 1,708,395 |
| | 15,454,937 |
Metals & Mining - 5.3% |
Chuo Denki Kogyo Co. Ltd. | 139,900 | | 535,800 |
Hitachi Metals Ltd. | 290,000 | | 3,289,362 |
Kurimoto Ltd. | 1,505,000 | | 2,262,353 |
OSAKA Titanium technologies Co. Ltd. (d) | 85,900 | | 4,731,935 |
Sumitomo Metal Mining Co. Ltd. | 171,000 | | 2,354,203 |
Toyo Kohan Co. Ltd. | 289,000 | | 1,140,570 |
Yamato Kogyo Co. Ltd. | 71,900 | | 1,818,909 |
| | 16,133,132 |
TOTAL MATERIALS | | 31,588,069 |
TOTAL COMMON STOCKS (Cost $298,003,558) | 301,790,239 |
Money Market Funds - 6.8% |
| | | |
Fidelity Cash Central Fund, 0.12% (b) | 287,918 | | 287,918 |
Fidelity Securities Lending Cash Central Fund, 0.11% (b)(c) | 20,241,747 | | 20,241,747 |
TOTAL MONEY MARKET FUNDS (Cost $20,529,665) | 20,529,665 |
TOTAL INVESTMENT PORTFOLIO - 106.2% (Cost $318,533,223) | | 322,319,904 |
NET OTHER ASSETS (LIABILITIES) - (6.2)% | | (18,701,300) |
NET ASSETS - 100% | $ 303,618,604 |
Legend |
(a) Non-income producing |
(b) Affiliated fund that is available only to investment companies and other accounts managed by Fidelity Investments. The rate quoted is the annualized seven-day yield of the fund at period end. A complete unaudited listing of the fund's holdings as of its most recent quarter end is available upon request. In addition, each Fidelity Central Fund's financial statements, which are not covered by the Fund's Report of Independent Registered Public Accounting Firm, are available on the SEC's website or upon request. |
(c) Investment made with cash collateral received from securities on loan. |
(d) Security or a portion of the security is on loan at period end. |
(e) Affiliated company |
Affiliated Central Funds |
Information regarding fiscal year to date income earned by the Fund from investments in Fidelity Central Funds is as follows: |
Fund | Income earned |
Fidelity Cash Central Fund | $ 2,923 |
Fidelity Securities Lending Cash Central Fund | 137,330 |
Total | $ 140,253 |
Other Affiliated Issuers |
An affiliated company is a company in which the Fund has ownership of at least 5% of the voting securities. Fiscal year to date transactions with companies which are or were affiliates are as follows: |
Affiliate | Value, beginning of period | Purchases | Sales Proceeds | Dividend Income | Value,
end of
period |
Takara Leben Co. Ltd. | $ 6,428,824 | $ 8,103,981 | $ 114,833 | $ 208,069 | $ 10,582,018 |
Total | $ 6,428,824 | $ 8,103,981 | $ 114,833 | $ 208,069 | $ 10,582,018 |
Other Information |
The following is a summary of the inputs used, as of October 31, 2011, involving the Fund's assets and liabilities carried at fair value. The inputs or methodology used for valuing securities may not be an indication of the risk associated with investing in those securities. For more information on valuation inputs, and their aggregation into the levels used in the table below, please refer to the Security Valuation section in the accompanying Notes to Financial Statements. |
Valuation Inputs at Reporting Date: |
Description | Total | Level 1 | Level 2 | Level 3 |
Investments in Securities: | | | | |
Equities: | | | | |
Consumer Discretionary | $ 57,771,955 | $ - | $ 57,771,955 | $ - |
Consumer Staples | 19,417,782 | - | 19,417,782 | - |
Financials | 48,287,879 | - | 48,287,879 | - |
Health Care | 17,249,777 | - | 17,249,777 | - |
Industrials | 55,562,126 | - | 55,562,126 | - |
Information Technology | 71,912,651 | - | 71,912,651 | - |
Materials | 31,588,069 | - | 31,588,069 | - |
Money Market Funds | 20,529,665 | 20,529,665 | - | - |
Total Investments in Securities: | $ 322,319,904 | $ 20,529,665 | $ 301,790,239 | $ - |
Transfers from Level 1 to Level 2 during the period were $151,323,066. |
Income Tax Information |
At October 31, 2011, the Fund had a capital loss carryforward of approximately $79,477,718 of which $14,097,674 and $65,380,044 will expire in fiscal 2016 and 2017, respectively. Capital loss carryforwards are only available to offset future capital gains of the Fund to the extent provided by regulations and may be limited. |
See accompanying notes which are an integral part of the financial statements.
Annual Report
Fidelity Japan Smaller Companies Fund
Statement of Assets and Liabilities
| October 31, 2011 |
| | |
Assets | | |
Investment in securities, at value (including securities loaned of $19,272,553) - See accompanying schedule: Unaffiliated issuers (cost $285,663,635) | $ 291,208,221 | |
Fidelity Central Funds (cost $20,529,665) | 20,529,665 | |
Other affiliated issuers (cost $12,339,923) | 10,582,018 | |
Total Investments (cost $318,533,223) | | $ 322,319,904 |
Receivable for investments sold | | 5,385,657 |
Receivable for fund shares sold | | 564,012 |
Dividends receivable | | 1,710,616 |
Distributions receivable from Fidelity Central Funds | | 9,640 |
Prepaid expenses | | 1,196 |
Other receivables | | 24,364 |
Total assets | | 330,015,389 |
| | |
Liabilities | | |
Payable for investments purchased | $ 5,264,165 | |
Payable for fund shares redeemed | 571,675 | |
Accrued management fee | 184,772 | |
Other affiliated payables | 75,834 | |
Other payables and accrued expenses | 58,592 | |
Collateral on securities loaned, at value | 20,241,747 | |
Total liabilities | | 26,396,785 |
| | |
Net Assets | | $ 303,618,604 |
Net Assets consist of: | | |
Paid in capital | | $ 383,865,435 |
Undistributed net investment income | | 2,751,743 |
Accumulated undistributed net realized gain (loss) on investments and foreign currency transactions | | (86,755,711) |
Net unrealized appreciation (depreciation) on investments and assets and liabilities in foreign currencies | | 3,757,137 |
Net Assets, for 35,242,046 shares outstanding | | $ 303,618,604 |
Net Asset Value, offering price and redemption price per share ($303,618,604 ÷ 35,242,046 shares) | | $ 8.62 |
Statement of Operations
| Year ended October 31, 2011 |
| | |
Investment Income | | |
Dividends (including $208,069 earned from other affiliated issuers) | | $ 6,407,822 |
Interest | | 66 |
Income from Fidelity Central Funds | | 140,253 |
Income before foreign taxes withheld | | 6,548,141 |
Less foreign taxes withheld | | (448,547) |
Total income | | 6,099,594 |
| | |
Expenses | | |
Management fee | $ 2,286,641 | |
Transfer agent fees | 751,817 | |
Accounting and security lending fees | 170,976 | |
Custodian fees and expenses | 99,102 | |
Independent trustees' compensation | 1,866 | |
Registration fees | 24,840 | |
Audit | 56,716 | |
Legal | 1,262 | |
Interest | 131 | |
Miscellaneous | 3,556 | |
Total expenses before reductions | 3,396,907 | |
Expense reductions | (133,635) | 3,263,272 |
Net investment income (loss) | | 2,836,322 |
Realized and Unrealized Gain (Loss) Net realized gain (loss) on: | | |
Investment securities: | | |
Unaffiliated issuers | 23,122,207 | |
Other affiliated issuers | 49,684 | |
Foreign currency transactions | 38,661 | |
Total net realized gain (loss) | | 23,210,552 |
Change in net unrealized appreciation (depreciation) on: Investment securities | (10,073,435) | |
Assets and liabilities in foreign currencies | (96,239) | |
Total change in net unrealized appreciation (depreciation) | | (10,169,674) |
Net gain (loss) | | 13,040,878 |
Net increase (decrease) in net assets resulting from operations | | $ 15,877,200 |
See accompanying notes which are an integral part of the financial statements.
Annual Report
Statement of Changes in Net Assets
| Year ended
October 31,
2011 | Year ended
October 31,
2010 |
Increase (Decrease) in Net Assets | | |
Operations | | |
Net investment income (loss) | $ 2,836,322 | $ 1,419,195 |
Net realized gain (loss) | 23,210,552 | 28,486,150 |
Change in net unrealized appreciation (depreciation) | (10,169,674) | (38,277,520) |
Net increase (decrease) in net assets resulting from operations | 15,877,200 | (8,372,175) |
Distributions to shareholders from net investment income | (1,489,334) | (1,348,099) |
Distributions to shareholders from net realized gain | (3,144,149) | (5,392,393) |
Total distributions | (4,633,483) | (6,740,492) |
Share transactions
Proceeds from sales of shares | 121,909,283 | 50,767,825 |
Reinvestment of distributions | 3,574,551 | 4,237,697 |
Cost of shares redeemed | (118,866,572) | (150,075,480) |
Net increase (decrease) in net assets resulting from share transactions | 6,617,262 | (95,069,958) |
Redemption fees | 154,525 | 71,634 |
Total increase (decrease) in net assets | 18,015,504 | (110,110,991) |
| | |
Net Assets | | |
Beginning of period | 285,603,100 | 395,714,091 |
End of period (including undistributed net investment income of $2,751,743 and undistributed net investment income of $1,379,701, respectively) | $ 303,618,604 | $ 285,603,100 |
Other Information Shares | | |
Sold | 13,512,424 | 5,995,088 |
Issued in reinvestment of distributions | 415,163 | 497,382 |
Redeemed | (13,376,811) | (17,876,316) |
Net increase (decrease) | 550,776 | (11,383,846) |
Financial Highlights
Years ended October 31, | 2011 | 2010 | 2009 | 2008 | 2007 |
Selected Per-Share Data | | | | | |
Net asset value, beginning of period | $ 8.23 | $ 8.59 | $ 6.99 | $ 12.63 | $ 13.43 |
Income from Investment Operations | | | | | |
Net investment income (loss) B | .08 | .04 | .02 | .04 | .03 |
Net realized and unrealized gain (loss) | .45 | (.25) | 1.63 | (5.45) | (.46) |
Total from investment operations | .53 | (.21) | 1.65 | (5.41) | (.43) |
Distributions from net investment income | (.05) | (.03) | (.04) | (.02) | (.01) |
Distributions from net realized gain | (.10) | (.12) | (.01) | (.21) | (.36) |
Total distributions | (.14) G | (.15) | (.05) | (.23) | (.37) |
Redemption fees added to paid in capital B, F | - | - | - | - | - |
Net asset value, end of period | $ 8.62 | $ 8.23 | $ 8.59 | $ 6.99 | $ 12.63 |
Total Return A | 6.44% | (2.50)% | 23.84% | (43.58)% | (3.27)% |
Ratios to Average Net Assets C, E | | | | | |
Expenses before reductions | 1.05% | 1.09% | 1.16% | 1.05% | 1.02% |
Expenses net of fee waivers, if any | 1.05% | 1.09% | 1.16% | 1.05% | 1.02% |
Expenses net of all reductions | 1.01% | 1.09% | 1.14% | 1.03% | 1.00% |
Net investment income (loss) | .88% | .43% | .33% | .44% | .23% |
Supplemental Data | | | | | |
Net assets, end of period (000 omitted) | $ 303,619 | $ 285,603 | $ 395,714 | $ 393,934 | $ 811,653 |
Portfolio turnover rate D | 133% | 78% | 183% | 86% | 76% |
A Total returns would have been lower if certain expenses had not been reduced during the applicable periods shown. B Calculated based on average shares outstanding during the period. C Fees and expenses of any underlying Fidelity Central Funds are not included in the Fund's expense ratio. The Fund indirectly bears its proportionate share of the expenses of any underlying Fidelity Central Funds. D Amount does not include the portfolio activity of any underlying Fidelity Central Funds. E Expense ratios reflect operating expenses of the Fund. Expenses before reductions do not reflect amounts reimbursed by the investment adviser or reductions from brokerage service arrangements or reductions from other expense offset arrangements and do not represent the amount paid by the Fund during periods when reimbursements or reductions occur. Expenses net of fee waivers reflect expenses after reimbursement by the investment adviser but prior to reductions from brokerage service arrangements or other expense offset arrangements. Expenses net of all reductions represent the net expenses paid by the Fund. F Amount represents less than $.01 per share. G Total distributions of $.14 per share is comprised of distributions from net investment income of $.045 and distributions from net realized gain of $.095 per share. |
See accompanying notes which are an integral part of the financial statements.
Annual Report
Notes to Financial Statements
For the period ended October 31, 2011
1. Organization.
Fidelity Japan Smaller Companies Fund (the Fund) is a fund of Fidelity Investment Trust (the Trust) and is authorized to issue an unlimited number of shares. The Trust is registered under the Investment Company Act of 1940, as amended (the 1940 Act), as an open-end management investment company organized as a Massachusetts business trust.
2. Investments in Fidelity Central Funds.
The Fund invests in Fidelity Central Funds, which are open-end investment companies available only to other investment companies and accounts managed by Fidelity Management & Research Company (FMR) and its affiliates. The Fund's Schedule of Investments lists each of the Fidelity Central Funds held as of period end, if any, as an investment of the Fund, but does not include the underlying holdings of each Fidelity Central Fund. As an Investing Fund, the Fund indirectly bears its proportionate share of the expenses of the underlying Fidelity Central Funds.
The Money Market Central Funds seek preservation of capital and current income and are managed by Fidelity Investments Money Management, Inc. (FIMM), an affiliate of FMR.
A complete unaudited list of holdings for each Fidelity Central Fund is available upon request or at the Securities and Exchange Commission (the SEC) web site at www.sec.gov. In addition, the financial statements of the Fidelity Central Funds, which are not covered by the Fund's Report of Independent Registered Public Accounting Firm are available on the SEC web site or upon request.
3. Significant Accounting Policies.
The financial statements have been prepared in conformity with accounting principles generally accepted in the United States of America (GAAP), which require management to make certain estimates and assumptions at the date of the financial statements. Actual results could differ from those estimates. Subsequent events, if any, through the date that the financial statements were issued have been evaluated in the preparation of the financial statements. The following summarizes the significant accounting policies of the Fund:
Security Valuation. Investments are valued as of 4:00 p.m. Eastern time on the last calendar day of the period. The Fund uses independent pricing services approved by the Board of Trustees to value its investments. When current market prices or quotations are not readily available or reliable, valuations may be determined in good faith in accordance with procedures adopted by the Board of Trustees. Factors used in determining value may include market or security specific events. The frequency with which these procedures are used cannot be predicted and they may be utilized to a significant extent. The value used for net asset value (NAV) calculation under these procedures may differ from published prices for the same securities.
The Fund categorizes the inputs to valuation techniques used to value its investments into a disclosure hierarchy consisting of three levels as shown below:
Level 1 - quoted prices in active markets for identical investments
Level 2 - other significant observable inputs (including quoted prices for similar investments, interest rates, prepayment speeds, etc.)
Level 3 - unobservable inputs (including the Fund's own assumptions based on the best information available)
Changes in valuation techniques may result in transfers in or out of an assigned level within the disclosure hierarchy. The aggregate value of investments by input level, as of October 31, 2011, is included at the end of the Fund's Schedule of Investments. Valuation techniques used to value the Fund's investments by major category are as follows:
Equity securities, including restricted securities, for which market quotations are readily available, are valued at the last reported sale price or official closing price as reported by an independent pricing service on the primary market or exchange on which they are traded and are categorized as Level 1 in the hierarchy. In the event there were no sales during the day or closing prices are not available, securities are valued at the last quoted bid price or may be valued using the last available price and are generally categorized as Level 2 in the hierarchy. For foreign equity securities, when significant market or security specific events arise, comparisons to the valuation of American Depositary Receipts (ADRs), futures contracts, Exchange-traded funds (ETFs) and certain indexes as well as quoted prices for similar securities are used and are categorized as Level 2 in the hierarchy in these circumstances. Utilizing these techniques may result in transfers between Level 1 and Level 2. For restricted equity securities and private placements where observable inputs are limited, assumptions about market activity and risk are used and are categorized as Level 3 in the hierarchy.
Investments in open-end mutual funds, including the Fidelity Central Funds, are valued at their closing net asset value each business day and are categorized as Level 1 in the hierarchy.
Annual Report
Notes to Financial Statements - continued
3. Significant Accounting Policies - continued
Foreign Currency. The Fund may use foreign currency contracts to facilitate transactions in foreign-denominated securities. Gains and losses from these transactions may arise from changes in the value of the foreign currency or if the counterparties do not perform under the contracts' terms.
Foreign-denominated assets, including investment securities, and liabilities are translated into U.S. dollars at the exchange rate at period end. Purchases and sales of investment securities, income and dividends received and expenses denominated in foreign currencies are translated into U.S. dollars at the exchange rate in effect on the transaction date.
The effects of exchange rate fluctuations on investments are included with the net realized and unrealized gain (loss) on investment securities. Other foreign currency transactions resulting in realized and unrealized gain (loss) are disclosed separately.
Investment Transactions and Income. For financial reporting purposes, the Fund's investment holdings and NAV include trades executed through the end of the last business day of the period. The NAV per share for processing shareholder transactions is calculated as of the close of business of the New York Stock Exchange (NYSE), normally 4:00 p.m. Eastern time and includes trades executed through the end of the prior business day. Gains and losses on securities sold are determined on the basis of identified cost. Dividend income is recorded on the ex-dividend date, except for certain dividends from foreign securities where the ex-dividend date may have passed, which are recorded as soon as the Fund is informed of the ex-dividend date. Non-cash dividends included in dividend income, if any, are recorded at the fair market value of the securities received. Interest income and distributions from the Fidelity Central Funds are accrued as earned. Interest income includes coupon interest and amortization of premium and accretion of discount on debt securities. Investment income is recorded net of foreign taxes withheld where recovery of such taxes is uncertain.
Expenses. Expenses directly attributable to a fund are charged to that fund. Expenses attributable to more than one fund are allocated among the respective funds on the basis of relative net assets or other appropriate methods. Expense estimates are accrued in the period to which they relate and adjustments are made when actual amounts are known.
Income Tax Information and Distributions to Shareholders. Each year, the Fund intends to qualify as a regulated investment company, including distributing substantially all of its taxable income and realized gains under Subchapter M of the Internal Revenue Code and filing its U.S. federal tax return. As a result, no provision for income taxes is required. As of October 31, 2011, the Fund did not have any unrecognized tax benefits in the financial statements. A fund's federal tax return is subject to examination by the Internal Revenue Service (IRS) for a period of three years. Foreign taxes are provided for based on the Fund's understanding of the tax rules and rates that exist in the foreign markets in which it invests.
Distributions are declared and recorded on the ex-dividend date. Income and capital gain distributions are determined in accordance with income tax regulations, which may differ from GAAP.
Capital accounts within the financial statements are adjusted for permanent book-tax differences. These adjustments have no impact on net assets or the results of operations. Temporary book-tax differences will reverse in a subsequent period.
Book-tax differences are primarily due to foreign currency transactions, passive foreign investment companies (PFIC), deferred trustees compensation, capital loss carryforwards and losses deferred due to wash sales.
The federal tax cost of investment securities and unrealized appreciation (depreciation) as of period end were as follows:
Gross unrealized appreciation | $ 28,613,217 |
Gross unrealized depreciation | (33,156,001) |
Net unrealized appreciation (depreciation) on securities and other investments | $ (4,542,784) |
| |
Tax Cost | $ 326,862,688 |
The tax-based components of distributable earnings as of period end were as follows:
Undistributed ordinary income | $ 3,803,231 |
Capital loss carryforward | $ (79,477,718) |
Net unrealized appreciation (depreciation) | $ (4,572,328) |
Under the recently enacted Regulated Investment Company Modernization Act of 2010 (the Act), the Fund will be permitted to carry forward capital losses incurred in taxable years beginning after December 22, 2010 for an unlimited period. However, any losses incurred during those future taxable years will be required to be utilized prior to any losses incurred in pre-enactment taxable years, which generally expire after eight years from when they are incurred. Additionally, post-enactment capital losses that are carried forward will retain their character as either short-term or long-term capital losses rather than being considered all short-term as under previous law. The Fund's first fiscal year end subject to the Act will be October 31, 2012.
Annual Report
3. Significant Accounting Policies - continued
Income Tax Information and Distributions to Shareholders - continued
The tax character of distributions paid was as follows:
| October 31, 2011 | October 31, 2010 |
Ordinary Income | $ 4,633,483 | $ 6,740,492 |
Short-Term Trading (Redemption) Fees. Shares held by investors in the Fund less than 90 days are subject to a redemption fee equal to 1.50% of the net asset value of shares redeemed. All redemption fees, which reduce the proceeds of the shareholder redemption, are retained by the Fund and accounted for as an addition to paid in capital.
New Accounting Pronouncement. In May 2011, the Financial Accounting Standards Board issued Accounting Standard Update No. 2011-04, Fair Value Measurement (Topic 820) - Amendments to Achieve Common Fair Value Measurement and Disclosure Requirements in U.S. GAAP and IFRSs. The update changes the wording used to describe the requirements in GAAP for measuring fair value and for disclosing information about fair value measurements. The update is effective during interim and annual periods beginning after December 15, 2011. Management is currently evaluating the impact of the update's adoption on the Fund's financial statement disclosures.
4. Purchases and Sales of Investments.
Purchases and sales of securities, other than short-term securities, aggregated $432,410,859 and $426,612,542, respectively.
5. Fees and Other Transactions with Affiliates.
Management Fee. FMR and its affiliates provide the Fund with investment management related services for which the Fund pays a monthly management fee. The management fee is the sum of an individual fund fee rate that is based on an annual rate of .45% of the Fund's average net assets and a group fee rate that averaged .26% during the period. The group fee rate is based upon the average net assets of all the mutual funds advised by FMR. The group fee rate decreases as assets under management increase and increases as assets under management decrease. For the period, the total annual management fee rate was .71% of the Fund's average net assets.
Transfer Agent Fees. Fidelity Investments Institutional Operations Company, Inc. (FIIOC), an affiliate of FMR, is the Fund's transfer, dividend disbursing and shareholder servicing agent. FIIOC receives account fees and asset-based fees that vary according to account size and type of account. FIIOC pays for typesetting, printing and mailing of shareholder reports, except proxy statements. For the period, the transfer agent fees were equivalent to an annual rate of .23% of average net assets.
Accounting and Security Lending Fees. Fidelity Service Company, Inc. (FSC), an affiliate of FMR, maintains the Fund's accounting records. The accounting fee is based on the level of average net assets for the month. Under a separate contract, FSC administers the security lending program. The security lending fee is based on the number and duration of lending transactions.
Interfund Lending Program. Pursuant to an Exemptive Order issued by the SEC, the Fund, along with other registered investment companies having management contracts with FMR, may participate in an interfund lending program. This program provides an alternative credit facility allowing the funds to borrow from, or lend money to, other participating affiliated funds. At period end, there were no interfund loans outstanding. The Fund's activity in this program during the period for which loans were outstanding was as follows:
Borrower or Lender | Average Daily
Loan Balance | Weighted Average Interest Rate | Interest
Expense |
Borrower | $ 5,273,000 | .30% | $ 131 |
6. Committed Line of Credit.
The Fund participates with other funds managed by FMR or an affiliate in a $4.0 billion credit facility (the "line of credit") to be utilized for temporary or emergency purposes to fund shareholder redemptions or for other short-term liquidity purposes. The Fund has agreed to pay commitment fees on its pro-rata portion of the line of credit, which amounted to $981 and is reflected in Miscellaneous expenses on the Statement of Operations. During the period, there were no borrowings on this line of credit.
Annual Report
Notes to Financial Statements - continued
7. Security Lending.
The Fund lends portfolio securities through a lending agent from time to time in order to earn additional income. For equity securities, a lending agent is used and may loan securities to certain qualified borrowers, including Fidelity Capital Markets (FCM), a broker-dealer affiliated with the Fund. On the settlement date of the loan, the Fund receives collateral (in the form of U.S. Treasury obligations, letters of credit and/or cash) against the loaned securities and maintains collateral in an amount not less than 100% of the market value of the loaned securities during the period of the loan. The market value of the loaned securities is determined at the close of business of the Fund and any additional required collateral is delivered to the Fund on the next business day. If the borrower defaults on its obligation to return the securities loaned because of insolvency or other reasons, a fund could experience delays and costs in recovering the securities loaned or in gaining access to the collateral. Any cash collateral received is invested in the Fidelity Securities Lending Cash Central Fund. The value of loaned securities and cash collateral at period end are disclosed on the Fund's Statement of Assets and Liabilities. Security lending income represents the income earned on investing cash collateral, less rebates paid to borrowers and any lending agent fees associated with the loan, plus any premium payments received for lending certain types of securities. Security lending income is presented in the Statement of Operations as a component of income from Fidelity Central Funds. Total security lending income during the period amounted to $137,330. During the period, there were no securities loaned to FCM.
8. Expense Reductions.
Many of the brokers with whom FMR places trades on behalf of the Fund provided services to the Fund in addition to trade execution. These services included payments of certain expenses on behalf of the Fund totaling $133,635 for the period.
9. Other.
The Fund's organizational documents provide former and current trustees and officers with a limited indemnification against liabilities arising in connection with the performance of their duties to the Fund. In the normal course of business, the Fund may also enter into contracts that provide general indemnifications. The Fund's maximum exposure under these arrangements is unknown as this would be dependent on future claims that may be made against the Fund. The risk of material loss from such claims is considered remote.
At the end of the period, Strategic Advisers International Fund was the owner of record of approximately 18% of the total outstanding shares of the Fund.
Annual Report
Fidelity Latin America Fund
Performance: The Bottom Line
Average annual total return reflects the change in the value of an investment, assuming reinvestment of the class' distributions from dividend income and capital gains (the profits earned upon the sale of securities that have grown in value, if any) and assuming a constant rate of performance each year. The $10,000 table and the fund's returns do not reflect the deduction of taxes that a shareholder would pay on fund distributions or the redemption of fund shares. During periods of reimbursement by Fidelity, a fund's total return will be greater than it would be had the reimbursement not occurred. How a fund did yesterday is no guarantee of how it will do tomorrow.
Average Annual Total Returns
Periods ended October 31, 2011 | Past 1
year | Past 5
years | Past 10
years |
Fidelity Latin America Fund | -7.96% | 7.74% | 20.26% |
$10,000 Over 10 Years
Let's say hypothetically that $10,000 was invested in Fidelity Latin America Fund, a class of the fund, on October 31, 2001. The chart shows how the value of your investment would have changed, and also shows how the MSCI EM (Emerging Markets) Latin America Index performed over the same period.
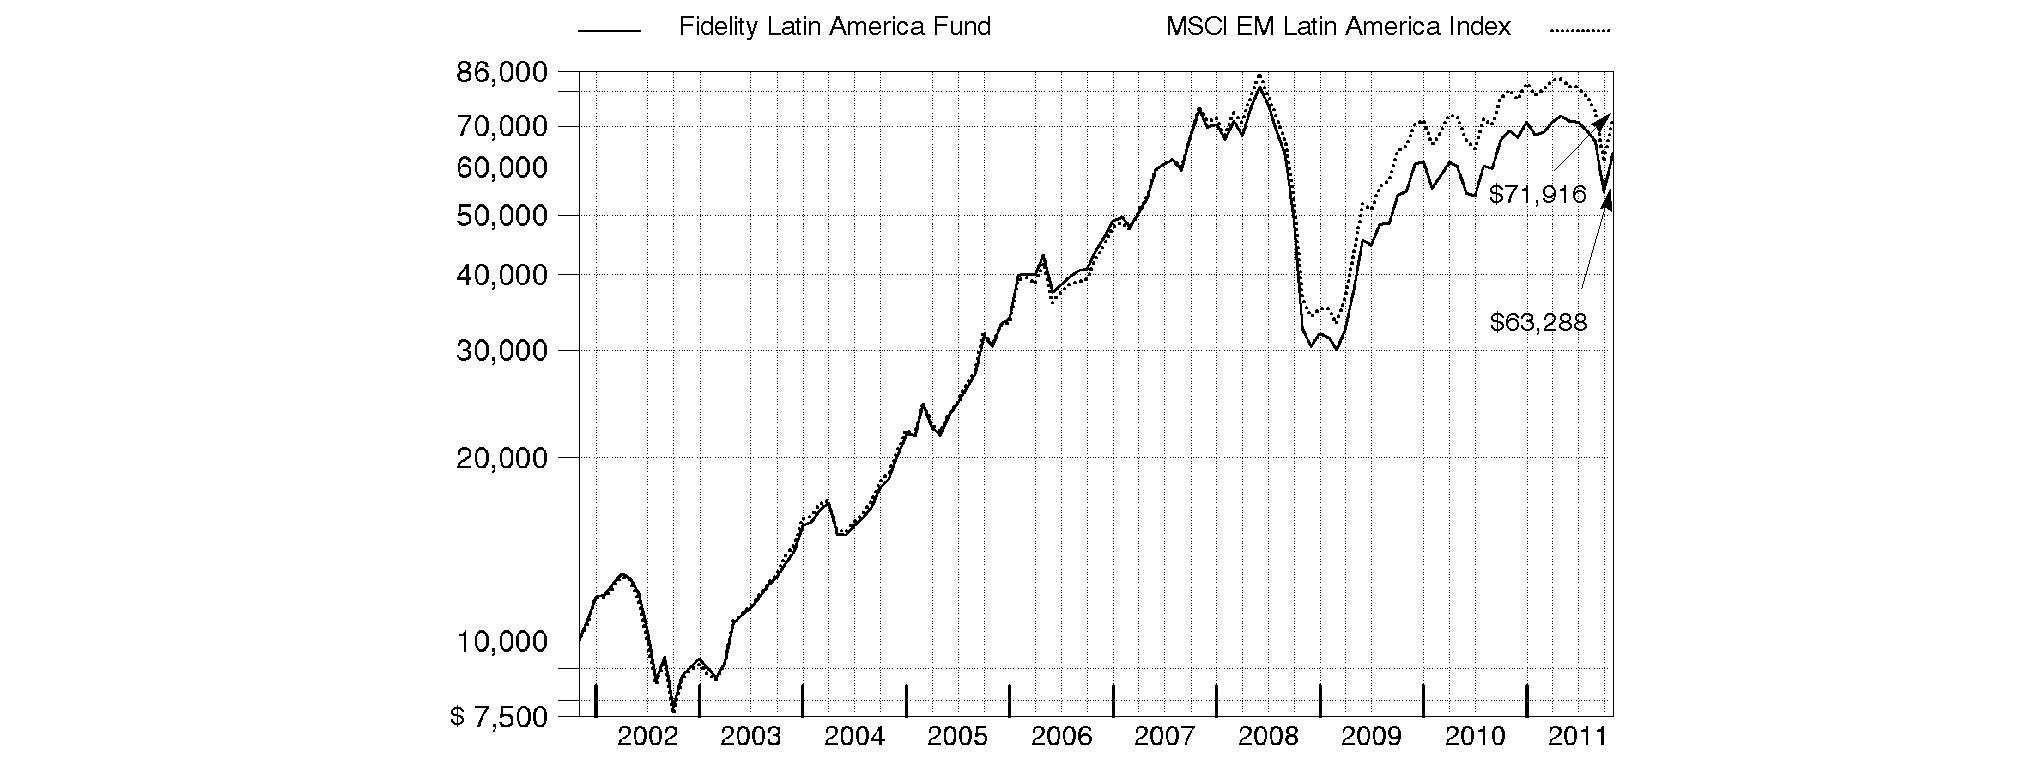
Annual Report
Fidelity Latin America Fund
Market Recap: Emerging-markets stocks concluded the 12-month period ending October 31, 2011, on a strong note, reversing direction in October amid hope for a resolution to the sovereign debt crisis in Europe. The brief rally, on top of a robust first half of the period, could only partially offset the negative impact of a five-month downturn that began in May and intensified in August and September, as investors began to flee riskier securities due to the debt debacle, concern the U.S. economy may contract and worry about a significant slowdown in China. For the year, the MSCI® Emerging Markets Index declined 7.44%, hampered in part by global currency fluctuation. The index gained roughly 13% in October, after falling 9% in August and about 15% in September. For the full year, returns across the individual country components of the emerging-markets index were decidedly negative. Several of the largest countries in the index struggled, especially India (-20%), China (-17%) and Brazil (-12%), as did Turkey (-34%). Conversely, South Korea had the strongest result, gaining about 7%, while another sizable index component, Russia, returned roughly 1%. Smaller constituents Indonesia (+5%) and Malaysia (+4%) also finished in positive territory. A trio of countries had negative returns but outpaced the index: Mexico (-1%), Taiwan (-2%) and South Africa (-3%).
Comments from Adam Kutas, Portfolio Manager of Fidelity® Latin America Fund: For the year, the fund's Retail Class shares returned -7.96%, outperforming the -10.27% return of the MSCI® EM (Emerging Markets) Latin America Index. The fund benefited from strong market selection in telecommunication services and from overweighting consumer staples, particularly in the food, beverage and tobacco industry. Geographically, we were helped by very strong stock selection in Brazil. The top individual contributors all came from that country: telecom companies TIM Participacoes and Vivo Participacoes, the latter of which was no longer held at period end; tobacco company Souza Cruz and beverage distributor Bebidas das Americas; electric power producer AES Tiete; and not owning steel company and underperforming index component Siderurgica Nacional. Conversely, unfavorable security selection in the consumer discretionary sector hurt - although this was offset somewhat by underweighting this lagging group - particularly in consumer durables/apparel. Underweighting information technology also detracted. Weak market positioning in Mexico and the underperformance of our Chilean holdings proved problematic. Individual detractors included untimely ownership of beverage company Fomento Economico Mexicano; not owning outperforming index component and electronics retailer Grupo Elektra; underweighting two index heavyweights from Brazil - integrated oil company Petroleo Brasileiro (Petrobras) and iron ore producer Vale; and our investment in Chilean iron and steel manufacturer CAP.
Note to shareholders: Fidelity Latin America Fund may invest up to 35% of its total assets in any industry that represents more than 20% of the Latin American market. As of October 31, 2011, the fund did not have more than 25% of its total assets in any one industry.
The views expressed above reflect those of the portfolio manager(s) only through the end of the period as stated on the cover of this report and do not necessarily represent the views of Fidelity or any other person in the Fidelity organization. Any such views are subject to change at any time based upon market or other conditions and Fidelity disclaims any responsibility to update such views. These views may not be relied on as investment advice and, because investment decisions for a Fidelity fund are based on numerous factors, may not be relied on as an indication of trading intent on behalf of any Fidelity fund.
Annual Report
Fidelity Latin America Fund
As a shareholder of the Fund, you incur two types of costs: (1) transaction costs, including sales charges (loads) on purchase payments or redemption proceeds, redemption fees, and (2) ongoing costs, including management fees, distribution and/or service (12b-1) fees and other Fund expenses. This Example is intended to help you understand your ongoing costs (in dollars) of investing in the Fund and to compare these costs with the ongoing costs of investing in other mutual funds.
The Example is based on an investment of $1,000 invested at the beginning of the period and held for the entire period (May 1, 2011 to October 31, 2011).
Actual Expenses
The first line of the accompanying table for each class of the Fund provides information about actual account values and actual expenses. You may use the information in this line, together with the amount you invested, to estimate the expenses that you paid over the period. Simply divide your account value by $1,000.00 (for example, an $8,600 account value divided by $1,000.00 = 8.6), then multiply the result by the number in the first line for a class of the Fund under the heading entitled "Expenses Paid During Period" to estimate the expenses you paid on your account during this period. A small balance maintenance fee of $12.00 that is charged once a year may apply for certain accounts with a value of less than $2,000. This fee is not included in the table below. If it was, the estimate of expenses you paid during the period would be higher, and your ending account value lower, by this amount. In addition, the Fund, as a shareholder in the underlying Fidelity Central Funds, will indirectly bear its pro-rata share of the fees and expenses incurred by the underlying Fidelity Central Funds. These fees and expenses are not included in the Fund's annualized expense ratio used to calculate the expense estimate in the table below.
Hypothetical Example for Comparison Purposes
The second line of the accompanying table for each class of the Fund provides information about hypothetical account values and hypothetical expenses based on a Class' actual expense ratio and an assumed rate of return of 5% per year before expenses, which is not the Class' actual return. The hypothetical account values and expenses may not be used to estimate the actual ending account balance or expenses you paid for the period. You may use this information to compare the ongoing costs of investing in the Fund and other funds. To do so, compare this 5% hypothetical example with the 5% hypothetical examples that appear in the shareholder reports of the other funds. A small balance maintenance fee of $12.00 that is charged once a year may apply for certain accounts with a value of less than $2,000. This fee is not included in the table below. If it was, the estimate of expenses you paid during the period would be higher, and your ending account value lower, by this amount. In addition, the Fund, as a shareholder in the underlying Fidelity Central Funds, will indirectly bear its pro-rata share of the fees and expenses incurred by the underlying Fidelity Central Funds. These fees and expenses are not included in the Fund's annualized expense ratio used to calculate the expense estimate in the table below.
Please note that the expenses shown in the table are meant to highlight your ongoing costs only and do not reflect any transaction costs. Therefore, the second line of the table is useful in comparing ongoing costs only, and will not help you determine the relative total costs of owning different funds. In addition, if these transactional costs were included, your costs would have been higher.
| Annualized
Expense Ratio | Beginning
Account Value
May 1, 2011 | Ending
Account Value
October 31, 2011 | Expenses Paid
During Period*
May 1, 2011 to
October 31, 2011 |
Class A | 1.34% | | | |
Actual | | $ 1,000.00 | $ 869.80 | $ 6.32 |
HypotheticalA | | $ 1,000.00 | $ 1,018.45 | $ 6.82 |
Class T | 1.60% | | | |
Actual | | $ 1,000.00 | $ 868.70 | $ 7.54 |
HypotheticalA | | $ 1,000.00 | $ 1,017.14 | $ 8.13 |
Class B | 2.09% | | | |
Actual | | $ 1,000.00 | $ 866.70 | $ 9.83 |
HypotheticalA | | $ 1,000.00 | $ 1,014.67 | $ 10.61 |
Class C | 2.08% | | | |
Actual | | $ 1,000.00 | $ 866.60 | $ 9.79 |
HypotheticalA | | $ 1,000.00 | $ 1,014.72 | $ 10.56 |
Latin America | 1.00% | | | |
Actual | | $ 1,000.00 | $ 871.20 | $ 4.72 |
HypotheticalA | | $ 1,000.00 | $ 1,020.16 | $ 5.09 |
Institutional Class | 1.03% | | | |
Actual | | $ 1,000.00 | $ 871.10 | $ 4.86 |
HypotheticalA | | $ 1,000.00 | $ 1,020.01 | $ 5.24 |
A 5% return per year before expenses
* Expenses are equal to each Class' annualized expense ratio, multiplied by the average account value over the period, multiplied by 184/365 (to reflect the one-half year period).
Annual Report
Fidelity Latin America Fund
Investment Changes (Unaudited)
Geographic Diversification (% of fund's net assets) |
As of October 31, 2011 |
| Brazil | 56.9% | |
| Mexico | 19.5% | |
| Chile | 12.4% | |
| Colombia | 3.6% | |
| United States of America | 2.8% | |
| Peru | 2.3% | |
| Luxembourg | 1.4% | |
| Canada | 0.8% | |
| Norway | 0.3% | |

Percentages are adjusted for the effect of futures contracts, if applicable. |
As of April 30, 2011 |
| Brazil | 60.1% | |
| Mexico | 17.7% | |
| Chile | 12.9% | |
| United States of America | 3.0% | |
| Colombia | 2.7% | |
| Peru | 1.7% | |
 | Luxembourg | 1.3% | |
| Canada | 0.6% | |

Percentages are adjusted for the effect of futures contracts, if applicable. |
Asset Allocation |
| % of fund's
net assets | % of fund's net assets
6 months ago |
Stocks | 98.0 | 98.4 |
Short-Term Investments and Net Other Assets | 2.0 | 1.6 |
Top Ten Stocks as of October 31, 2011 |
| % of fund's
net assets | % of fund's net assets
6 months ago |
America Movil SAB de CV Series L (Mexico, Wireless Telecommunication Services) | 9.2 | 8.3 |
Itau Unibanco Banco Multiplo SA (Brazil, Commercial Banks) | 8.5 | 8.5 |
Vale SA (PN-A) (Brazil, Metals & Mining) | 5.4 | 5.8 |
Companhia de Bebidas das Americas (AmBev) (PN) sponsored ADR (Brazil, Beverages) | 4.6 | 4.5 |
Wal-Mart de Mexico SA de CV Series V (Mexico, Food & Staples Retailing) | 4.6 | 4.6 |
Petroleo Brasileiro SA - Petrobras sponsored ADR (Brazil, Oil, Gas & Consumable Fuels) | 3.8 | 4.7 |
Petroleo Brasileiro SA - Petrobras (PN) (non-vtg.) (Brazil, Oil, Gas & Consumable Fuels) | 3.6 | 3.5 |
CAP SA (Chile, Metals & Mining) | 3.4 | 3.5 |
Banco Bradesco SA (PN) (Brazil, Commercial Banks) | 3.0 | 3.5 |
Vale SA sponsored ADR (Brazil, Metals & Mining) | 2.7 | 3.4 |
| 48.8 | |
Market Sectors as of October 31, 2011 |
| % of fund's
net assets | % of fund's net assets
6 months ago |
Consumer Staples | 18.4 | 19.5 |
Materials | 18.0 | 17.9 |
Financials | 17.9 | 18.4 |
Telecommunication Services | 16.1 | 14.4 |
Energy | 12.9 | 15.1 |
Utilities | 7.1 | 6.6 |
Industrials | 4.3 | 3.5 |
Consumer Discretionary | 3.2 | 3.0 |
Health Care | 0.1 | 0.0 |
Annual Report
Fidelity Latin America Fund
Investments October 31, 2011
Showing Percentage of Net Assets
Common Stocks - 98.0% |
| Shares | | Value |
Brazil - 56.9% |
AES Tiete SA (PN) (non-vtg.) | 4,965,445 | | $ 70,757,302 |
Banco Bradesco SA: | | | |
(PN) | 3,184,616 | | 57,583,465 |
(PN) sponsored ADR | 1,774,697 | | 32,299,485 |
Brasil Foods SA | 1,040,200 | | 21,655,690 |
Brasil Insurance Participacoes e Administracao SA | 780,000 | | 7,494,759 |
Braskem SA Class A sponsored ADR | 286,200 | | 5,163,048 |
Brookfield Incorporacoes SA | 5,954,800 | | 22,887,072 |
Companhia de Bebidas das Americas (AmBev): | | | |
(PN) sponsored ADR | 4,151,130 | | 139,976,104 |
sponsored ADR | 341,225 | | 9,189,189 |
Companhia de Concessoes Rodoviarias | 1,623,600 | | 44,674,528 |
CPFL Energia SA sponsored ADR (d) | 1,366,799 | | 35,523,106 |
Eletropaulo Metropolitana SA (PN-B) | 1,220,220 | | 21,886,080 |
Itau Unibanco Banco Multiplo SA | 3,470,631 | | 66,150,566 |
Itau Unibanco Banco Multiplo SA sponsored ADR | 10,085,003 | | 192,825,257 |
Itausa-Investimentos Itau SA (PN) | 4,827,500 | | 30,221,072 |
Light SA | 1,068,500 | | 16,644,756 |
Lojas Americanas SA (PN) | 3,561,037 | | 31,313,568 |
Lupatech SA (a) | 981,100 | | 5,142,034 |
Multiplus SA | 1,777,500 | | 30,018,344 |
OGX Petroleo e Gas Participacoes SA (a) | 1,674,600 | | 13,847,729 |
Petroleo Brasileiro SA - Petrobras: | | | |
(ON) | 908,128 | | 12,205,680 |
(PN) (non-vtg.) | 8,786,971 | | 109,095,168 |
(PN) sponsored ADR (d) | 2,847,161 | | 72,004,702 |
sponsored ADR | 4,254,220 | | 114,906,482 |
Souza Cruz Industria Comerico | 5,964,700 | | 73,151,981 |
TAM SA (PN) sponsored ADR (ltd. vtg.) (d) | 2,494,846 | | 50,121,456 |
Telefonica Brasil SA | 1,210,613 | | 35,214,372 |
Telefonica Brasil SA sponsored ADR (a) | 1,428,583 | | 41,457,479 |
TIM Participacoes SA | 5,577,495 | | 28,842,392 |
TIM Participacoes SA sponsored ADR (d) | 1,553,224 | | 40,445,953 |
Tractebel Energia SA | 776,000 | | 12,427,207 |
Usinas Siderurgicas de Minas Gerais SA - Usiminas | 1,684,750 | | 24,184,188 |
Usinas Siderurgicas de Minas Gerais SA - Usiminas (PN-A) (non-vtg.) | 3,539,400 | | 24,321,523 |
Vale SA: | | | |
(PN-A) | 1,755,200 | | 41,702,865 |
(PN-A) sponsored ADR | 5,163,929 | | 121,868,724 |
sponsored ADR | 3,257,362 | | 82,769,568 |
TOTAL BRAZIL | | 1,739,972,894 |
|
| Shares | | Value |
Canada - 0.8% |
Petrominerales Ltd. | 655,300 | | $ 17,288,850 |
Silver Standard Resources, Inc. (a) | 372,300 | | 7,293,360 |
TOTAL CANADA | | 24,582,210 |
Chile - 12.4% |
Banco Santander Chile sponsored ADR (d) | 995,186 | | 81,286,792 |
CAP SA | 2,723,464 | | 105,064,197 |
CFR Pharmaceuticals SA | 17,206,348 | | 4,073,756 |
Compania Cervecerias Unidas SA | 3,361,122 | | 38,073,744 |
Compania Cervecerias Unidas SA sponsored ADR (d) | 202,200 | | 11,582,016 |
Empresa Nacional de Electricidad SA | 5,333,893 | | 8,545,988 |
Empresa Nacional de Telecomunicaciones SA (ENTEL) | 1,795,610 | | 35,549,384 |
Enersis SA | 34,899,771 | | 14,167,907 |
Enersis SA sponsored ADR | 1,805,047 | | 35,433,073 |
SACI Falabella | 4,770,394 | | 44,787,870 |
TOTAL CHILE | | 378,564,727 |
Colombia - 3.6% |
BanColombia SA sponsored ADR (d) | 304,029 | | 18,965,329 |
Bolsa de Valores de Colombia | 576,460,285 | | 10,287,320 |
Ecopetrol SA | 25,394,899 | | 54,437,115 |
Empresa de Telecomunicaciones de Bogota | 34,198,589 | | 10,409,866 |
Grupo de Inversiones Surameric | 946,202 | | 16,621,929 |
Grupo de Inversiones Surameric rights 11/22/11 (a) | 275,614 | | 41,357 |
TOTAL COLOMBIA | | 110,762,916 |
Luxembourg - 1.4% |
Millicom International Cellular SA (depositary receipt) | 191,813 | | 21,139,134 |
Ternium SA sponsored ADR | 943,707 | | 23,158,570 |
TOTAL LUXEMBOURG | | 44,297,704 |
Mexico - 19.5% |
America Movil SAB de CV: | | | |
Series L | 5,073,400 | | 6,478,796 |
Series L sponsored ADR | 10,878,828 | | 276,539,807 |
Bolsa Mexicana de Valores SA de CV | 13,306,500 | | 21,757,681 |
Coca-Cola FEMSA SAB de CV sponsored ADR | 209,100 | | 18,724,905 |
Compartamos SAB de CV | 7,429,600 | | 11,484,515 |
Fomento Economico Mexicano SAB de CV sponsored ADR | 289,400 | | 19,404,270 |
Grupo Comercial Chedraui de CV | 5,604,100 | | 13,492,602 |
Grupo Modelo SAB de CV Series C | 3,093,800 | | 19,624,041 |
Industrias Penoles SA de CV | 712,955 | | 28,689,693 |
Common Stocks - continued |
| Shares | | Value |
Mexico - continued |
Kimberly-Clark de Mexico SA de CV Series A | 6,939,600 | | $ 39,501,092 |
Wal-Mart de Mexico SA de CV Series V | 54,347,670 | | 140,396,567 |
TOTAL MEXICO | | 596,093,969 |
Norway - 0.3% |
Copeinca ASA (a) | 1,297,051 | | 8,410,005 |
Peru - 2.3% |
Alicorp SA Class C | 3,055,222 | | 6,772,326 |
Compania de Minas Buenaventura SA sponsored ADR | 1,582,600 | | 64,775,818 |
TOTAL PERU | | 71,548,144 |
United States of America - 0.8% |
Southern Copper Corp. | 812,400 | | 24,924,432 |
TOTAL COMMON STOCKS (Cost $1,609,339,679) | 2,999,157,001 |
Money Market Funds - 5.8% |
| Shares | | Value |
Fidelity Cash Central Fund, 0.12% (b) | 38,877,614 | | $ 38,877,614 |
Fidelity Securities Lending Cash Central Fund, 0.11% (b)(c) | 138,971,400 | | 138,971,400 |
TOTAL MONEY MARKET FUNDS (Cost $177,849,014) | 177,849,014 |
TOTAL INVESTMENT PORTFOLIO - 103.8% (Cost $1,787,188,693) | | 3,177,006,015 |
NET OTHER ASSETS (LIABILITIES) - (3.8)% | | (116,357,760) |
NET ASSETS - 100% | $ 3,060,648,255 |
Legend |
(a) Non-income producing |
(b) Affiliated fund that is available only to investment companies and other accounts managed by Fidelity Investments. The rate quoted is the annualized seven-day yield of the fund at period end. A complete unaudited listing of the fund's holdings as of its most recent quarter end is available upon request. In addition, each Fidelity Central Fund's financial statements, which are not covered by the Fund's Report of Independent Registered Public Accounting Firm, are available on the SEC's website or upon request. |
(c) Investment made with cash collateral received from securities on loan. |
(d) Security or a portion of the security is on loan at period end. |
Affiliated Central Funds |
Information regarding fiscal year to date income earned by the Fund from investments in Fidelity Central Funds is as follows: |
Fund | Income earned |
Fidelity Cash Central Fund | $ 45,797 |
Fidelity Securities Lending Cash Central Fund | 397,722 |
Total | $ 443,519 |
Other Information |
The following is a summary of the inputs used, as of October 31, 2011, involving the Fund's assets and liabilities carried at fair value. The inputs or methodology used for valuing securities may not be an indication of the risk associated with investing in those securities. For more information on valuation inputs, and their aggregation into the levels used in the table below, please refer to the Security Valuation section in the accompanying Notes to Financial Statements. |
Valuation Inputs at Reporting Date: |
Description | Total | Level 1 | Level 2 | Level 3 |
Investments in Securities: | | | | |
Equities: | | | | |
Brazil | $ 1,739,972,894 | $ 1,739,972,894 | $ - | $ - |
Mexico | 596,093,969 | 596,093,969 | - | - |
Chile | 378,564,727 | 378,564,727 | - | - |
Colombia | 110,762,916 | 110,721,559 | 41,357 | - |
Peru | 71,548,144 | 71,548,144 | - | - |
Luxembourg | 44,297,704 | 44,297,704 | - | - |
United States of America | 24,924,432 | 24,924,432 | - | - |
Canada | 24,582,210 | 24,582,210 | - | - |
Norway | 8,410,005 | 8,410,005 | - | - |
Money Market Funds | 177,849,014 | 177,849,014 | - | - |
Total Investments in Securities: | $ 3,177,006,015 | $ 3,176,964,658 | $ 41,357 | $ - |
Income Tax Information |
At October 31, 2011, the Fund had a capital loss carryforward of approximately $96,320,870 of which $22,463,155 and $73,857,715 will expire in fiscal 2016 and 2017, respectively. Capital loss carryforwards are only available to offset future capital gains of the Fund to the extent provided by regulations and may be limited. |
The capital loss carryforward expiring October 31, 2016 was acquired from Fidelity Advisor Latin America Fund. |
See accompanying notes which are an integral part of the financial statements.
Annual Report
Fidelity Latin America Fund
Statement of Assets and Liabilities
| October 31, 2011 |
| | |
Assets | | |
Investment in securities, at value (including securities loaned of $132,968,419) - See accompanying schedule: Unaffiliated issuers (cost $1,609,339,679) | $ 2,999,157,001 | |
Fidelity Central Funds (cost $177,849,014) | 177,849,014 | |
Total Investments (cost $1,787,188,693) | | $ 3,177,006,015 |
Foreign currency held at value (cost $12,549,606) | | 12,617,377 |
Receivable for investments sold | | 2,097,234 |
Receivable for fund shares sold | | 2,521,871 |
Dividends receivable | | 17,868,344 |
Distributions receivable from Fidelity Central Funds | | 19,346 |
Prepaid expenses | | 11,748 |
Other receivables | | 251,992 |
Total assets | | 3,212,393,927 |
| | |
Liabilities | | |
Payable for investments purchased | $ 5,902,112 | |
Payable for fund shares redeemed | 4,206,545 | |
Accrued management fee | 1,696,988 | |
Distribution and service plan fees payable | 65,704 | |
Other affiliated payables | 671,439 | |
Other payables and accrued expenses | 231,484 | |
Collateral on securities loaned, at value | 138,971,400 | |
Total liabilities | | 151,745,672 |
| | |
Net Assets | | $ 3,060,648,255 |
Net Assets consist of: | | |
Paid in capital | | $ 1,744,785,826 |
Undistributed net investment income | | 34,016,290 |
Accumulated undistributed net realized gain (loss) on investments and foreign currency transactions | | (108,069,810) |
Net unrealized appreciation (depreciation) on investments and assets and liabilities in foreign currencies | | 1,389,915,949 |
Net Assets | | $ 3,060,648,255 |
Statement of Assets and Liabilities - continued
| October 31, 2011 |
| | |
Calculation of Maximum Offering Price Class A:
Net Asset Value and redemption price per share ($91,406,884 ÷ 1,745,019 shares) | | $ 52.38 |
| | |
Maximum offering price per share (100/94.25 of $52.38) | | $ 55.58 |
Class T:
Net Asset Value and redemption price per share ($26,020,229 ÷ 497,850 shares) | | $ 52.27 |
| | |
Maximum offering price per share (100/96.50 of $52.27) | | $ 54.17 |
Class B:
Net Asset Value and offering price per share ($14,113,935 ÷ 271,135 shares)A | | $ 52.06 |
| | |
Class C:
Net Asset Value and offering price per share ($35,203,130 ÷ 676,369 shares)A | | $ 52.05 |
| | |
Latin America:
Net Asset Value, offering price and redemption price per share ($2,884,301,428 ÷ 54,955,792 shares) | | $ 52.48 |
| | |
Institutional Class:
Net Asset Value, offering price and redemption price per share ($9,602,649 ÷ 182,860 shares) | | $ 52.51 |
A Redemption price per share is equal to net asset value less any applicable contingent deferred sales charge.
See accompanying notes which are an integral part of the financial statements.
Annual Report
Fidelity Latin America Fund
Financial Statements - continued
Statement of Operations
| Year ended October 31, 2011 |
| | |
Investment Income | | |
Dividends | | $ 140,014,056 |
Interest | | 157 |
Income from Fidelity Central Funds | | 443,519 |
Income before foreign taxes withheld | | 140,457,732 |
Less foreign taxes withheld | | (10,432,951) |
Total income | | 130,024,781 |
| | |
Expenses | | |
Management fee | $ 27,173,065 | |
Transfer agent fees | 8,141,717 | |
Distribution and service plan fees | 1,039,278 | |
Accounting and security lending fees | 1,494,378 | |
Custodian fees and expenses | 1,577,432 | |
Independent trustees' compensation | 21,700 | |
Registration fees | 137,345 | |
Audit | 65,324 | |
Legal | 31,816 | |
Interest | 8,383 | |
Miscellaneous | 44,176 | |
Total expenses before reductions | 39,734,614 | |
Expense reductions | (84,041) | 39,650,573 |
Net investment income (loss) | | 90,374,208 |
Realized and Unrealized Gain (Loss) Net realized gain (loss) on: | | |
Investment securities: | | |
Unaffiliated issuers | 338,788,328 | |
Foreign currency transactions | (764,969) | |
Total net realized gain (loss) | | 338,023,359 |
Change in net unrealized appreciation (depreciation) on: Investment securities | (733,223,257) | |
Assets and liabilities in foreign currencies | 84,819 | |
Total change in net unrealized appreciation (depreciation) | | (733,138,438) |
Net gain (loss) | | (395,115,079) |
Net increase (decrease) in net assets resulting from operations | | $ (304,740,871) |
Statement of Changes in Net Assets
| Year ended
October 31,
2011 | Year ended
October 31,
2010 |
Increase (Decrease) in Net Assets | | |
Operations | | |
Net investment income (loss) | $ 90,374,208 | $ 87,692,165 |
Net realized gain (loss) | 338,023,359 | 293,510,668 |
Change in net unrealized appreciation (depreciation) | (733,138,438) | 519,183,458 |
Net increase (decrease) in net assets resulting from operations | (304,740,871) | 900,386,291 |
Distributions to shareholders from net investment income | (22,292,136) | (118,560,409) |
Distributions to shareholders from net realized gain | (15,707,585) | (33,986,366) |
Total distributions | (37,999,721) | (152,546,775) |
Share transactions - net increase (decrease) | (1,114,870,853) | (275,675,234) |
Redemption fees | 763,732 | 1,583,234 |
Total increase (decrease) in net assets | (1,456,847,713) | 473,747,516 |
| | |
Net Assets | | |
Beginning of period | 4,517,495,968 | 4,043,748,452 |
End of period (including undistributed net investment income of $34,016,290 and undistributed net investment income of $12,014,368, respectively) | $ 3,060,648,255 | $ 4,517,495,968 |
See accompanying notes which are an integral part of the financial statements.
Annual Report
Financial Highlights - Class A
Years ended October 31, | 2011 | 2010 H |
Selected Per-Share Data | | |
Net asset value, beginning of period | $ 57.48 | $ 55.47 |
Income from Investment Operations | | |
Net investment income (loss) E | 1.15 | .02 |
Net realized and unrealized gain (loss) | (5.87) | 2.79 |
Total from investment operations | (4.72) | 2.81 |
Distributions from net investment income | (.19) | (.80) |
Distributions from net realized gain | (.20) | - |
Total distributions | (.39) | (.80) |
Redemption fees added to paid in capital E | .01 | - K |
Net asset value, end of period | $ 52.38 | $ 57.48 |
Total Return B, C, D | (8.26)% | 5.14% |
Ratios to Average Net Assets F, I | | |
Expenses before reductions | 1.34% | 1.37% A |
Expenses net of fee waivers, if any | 1.34% | 1.37% A |
Expenses net of all reductions | 1.34% | 1.34% A |
Net investment income (loss) | 2.05% | .39% A |
Supplemental Data | | |
Net assets, end of period (000 omitted) | $ 91,407 | $ 115,626 |
Portfolio turnover rate G | 11% | 56% J |
A Annualized B Total returns for periods of less than one year are not annualized. C Total returns would have been lower if certain expenses had not been reduced during the applicable periods shown. D Total returns do not include the effect of the sales charges. E Calculated based on average shares outstanding during the period. F Fees and expenses of any underlying Fidelity Central Funds are not included in the Fund's expense ratio. The Fund indirectly bears its proportionate share of the expenses of any underlying Fidelity Central Funds. G Amount does not include the portfolio activity of any underlying Fidelity Central Funds. H For the period September 28, 2010 (commencement of sale of shares) to October 31, 2010. I Expense ratios reflect operating expenses of the class. Expenses before reductions do not reflect amounts reimbursed by the investment adviser or reductions from brokerage service arrangements or reductions from other expense offset arrangements and do not represent the amount paid by the class during periods when reimbursements or reductions occur. Expense ratios before reductions for start-up periods may not be representative of longer-term operating periods. Expenses net of fee waivers reflect expenses after reimbursement by the investment adviser but prior to reductions from brokerage service arrangements or other expense offset arrangements. Expenses net of all reductions represent the net expenses paid by the class. J The portfolio turnover rate does not include the assets acquired in the merger. K Amount represents less than $.01 per share. |
Financial Highlights - Class T
Years ended October 31, | 2011 | 2010 H |
Selected Per-Share Data | | |
Net asset value, beginning of period | $ 57.47 | $ 55.47 |
Income from Investment Operations | | |
Net investment income (loss) E | .99 | .01 |
Net realized and unrealized gain (loss) | (5.85) | 2.79 |
Total from investment operations | (4.86) | 2.80 |
Distributions from net investment income | (.15) | (.80) |
Distributions from net realized gain | (.20) | - |
Total distributions | (.35) | (.80) |
Redemption fees added to paid in capital E | .01 | - K |
Net asset value, end of period | $ 52.27 | $ 57.47 |
Total Return B, C, D | (8.50)% | 5.12% |
Ratios to Average Net Assets F, I | | |
Expenses before reductions | 1.61% | 1.63% A |
Expenses net of fee waivers, if any | 1.61% | 1.63% A |
Expenses net of all reductions | 1.61% | 1.60% A |
Net investment income (loss) | 1.78% | .13% A |
Supplemental Data | | |
Net assets, end of period (000 omitted) | $ 26,020 | $ 36,820 |
Portfolio turnover rate G | 11% | 56% J |
A Annualized B Total returns for periods of less than one year are not annualized. C Total returns would have been lower if certain expenses had not been reduced during the applicable periods shown. D Total returns do not include the effect of the sales charges. E Calculated based on average shares outstanding during the period. F Fees and expenses of any underlying Fidelity Central Funds are not included in the Fund's expense ratio. The Fund indirectly bears its proportionate share of the expenses of any underlying Fidelity Central Funds. G Amount does not include the portfolio activity of any underlying Fidelity Central Funds. H For the period September 28, 2010 (commencement of sale of shares) to October 31, 2010. I Expense ratios reflect operating expenses of the class. Expenses before reductions do not reflect amounts reimbursed by the investment adviser or reductions from brokerage service arrangements or reductions from other expense offset arrangements and do not represent the amount paid by the class during periods when reimbursements or reductions occur. Expense ratios before reductions for start-up periods may not be representative of longer-term operating periods. Expenses net of fee waivers reflect expenses after reimbursement by the investment adviser but prior to reductions from brokerage service arrangements or other expense offset arrangements. Expenses net of all reductions represent the net expenses paid by the class. J The portfolio turnover rate does not include the assets acquired in the merger. K Amount represents less than $.01 per share. |
See accompanying notes which are an integral part of the financial statements.
Annual Report
Financial Highlights - Class B
Years ended October 31, | 2011 | 2010 H |
Selected Per-Share Data | | |
Net asset value, beginning of period | $ 57.44 | $ 55.47 |
Income from Investment Operations | | |
Net investment income (loss) E | .72 | (.02) |
Net realized and unrealized gain (loss) | (5.84) | 2.79 |
Total from investment operations | (5.12) | 2.77 |
Distributions from net investment income | (.07) | (.80) |
Distributions from net realized gain | (.20) | - |
Total distributions | (.27) | (.80) |
Redemption fees added to paid in capital E | .01 | - K |
Net asset value, end of period | $ 52.06 | $ 57.44 |
Total Return B, C, D | (8.94)% | 5.06% |
Ratios to Average Net Assets F, I | | |
Expenses before reductions | 2.10% | 2.12% A |
Expenses net of fee waivers, if any | 2.10% | 2.12% A |
Expenses net of all reductions | 2.10% | 2.10% A |
Net investment income (loss) | 1.29% | (.36)% A |
Supplemental Data | | |
Net assets, end of period (000 omitted) | $ 14,114 | $ 20,392 |
Portfolio turnover rate G | 11% | 56% J |
A Annualized B Total returns for periods of less than one year are not annualized. C Total returns would have been lower if certain expenses had not been reduced during the applicable periods shown. D Total returns do not include the effect of the contingent deferred sales charge. E Calculated based on average shares outstanding during the period. F Fees and expenses of any underlying Fidelity Central Funds are not included in the Fund's expense ratio. The Fund indirectly bears its proportionate share of the expenses of any underlying Fidelity Central Funds. G Amount does not include the portfolio activity of any underlying Fidelity Central Funds. H For the period September 28, 2010 (commencement of sale of shares) to October 31, 2010. I Expense ratios reflect operating expenses of the class. Expenses before reductions do not reflect amounts reimbursed by the investment adviser or reductions from brokerage service arrangements or reductions from other expense offset arrangements and do not represent the amount paid by the class during periods when reimbursements or reductions occur. Expense ratios before reductions for start-up periods may not be representative of longer-term operating periods. Expenses net of fee waivers reflect expenses after reimbursement by the investment adviser but prior to reductions from brokerage service arrangements or other expense offset arrangements. Expenses net of all reductions represent the net expenses paid by the class. J The portfolio turnover rate does not include the assets acquired in the merger. K Amount represents less than $.01 per share. |
Financial Highlights - Class C
Years ended October 31, | 2011 | 2010 H |
Selected Per-Share Data | | |
Net asset value, beginning of period | $ 57.44 | $ 55.47 |
Income from Investment Operations | | |
Net investment income (loss) E | .73 | (.02) |
Net realized and unrealized gain (loss) | (5.84) | 2.79 |
Total from investment operations | (5.11) | 2.77 |
Distributions from net investment income | (.09) | (.80) |
Distributions from net realized gain | (.20) | - |
Total distributions | (.29) | (.80) |
Redemption fees added to paid in capital E | .01 | - K |
Net asset value, end of period | $ 52.05 | $ 57.44 |
Total Return B, C, D | (8.93)% | 5.06% |
Ratios to Average Net Assets F, I | | |
Expenses before reductions | 2.08% | 2.09% A |
Expenses net of fee waivers, if any | 2.08% | 2.09% A |
Expenses net of all reductions | 2.08% | 2.07% A |
Net investment income (loss) | 1.31% | (.34)% A |
Supplemental Data | | |
Net assets, end of period (000 omitted) | $ 35,203 | $ 48,329 |
Portfolio turnover rate G | 11% | 56% J |
A Annualized B Total returns for periods of less than one year are not annualized. C Total returns would have been lower if certain expenses had not been reduced during the applicable periods shown. D Total returns do not include the effect of the contingent deferred sales charge. E Calculated based on average shares outstanding during the period. F Fees and expenses of any underlying Fidelity Central Funds are not included in the Fund's expense ratio. The Fund indirectly bears its proportionate share of the expenses of any underlying Fidelity Central Funds. G Amount does not include the portfolio activity of any underlying Fidelity Central Funds. H For the period September 28, 2010 (commencement of sale of shares) to October 31, 2010. I Expense ratios reflect operating expenses of the class. Expenses before reductions do not reflect amounts reimbursed by the investment adviser or reductions from brokerage service arrangements or reductions from other expense offset arrangements and do not represent the amount paid by the class during periods when reimbursements or reductions occur. Expense ratios before reductions for start-up periods may not be representative of longer-term operating periods. Expenses net of fee waivers reflect expenses after reimbursement by the investment adviser but prior to reductions from brokerage service arrangements or other expense offset arrangements. Expenses net of all reductions represent the net expenses paid by the class. J The portfolio turnover rate does not include the assets acquired in the merger. K Amount represents less than $.01 per share. |
See accompanying notes which are an integral part of the financial statements.
Annual Report
Financial Highlights - Latin America
Years ended October 31, | 2011 | 2010 | 2009 | 2008 | 2007 |
Selected Per-Share Data | | | | | |
Net asset value, beginning of period | $ 57.50 | $ 47.29 | $ 28.69 | $ 67.90 | $ 41.13 |
Income from Investment Operations | | | | | |
Net investment income (loss) B | 1.34 | 1.07 | .72 | .83 | .68 |
Net realized and unrealized gain (loss) | (5.88) | 11.00 | 18.32 | (37.74) | 27.43 |
Total from investment operations | (4.54) | 12.07 | 19.04 | (36.91) | 28.11 |
Distributions from net investment income | (.29) | (1.49) | (.46) | (.65) | (.61) |
Distributions from net realized gain | (.20) | (.39) | - | (1.72) | (.77) |
Total distributions | (.49) | (1.88) | (.46) | (2.37) | (1.38) |
Redemption fees added to paid in capital B | .01 | .02 | .02 | .07 | .04 |
Net asset value, end of period | $ 52.48 | $ 57.50 | $ 47.29 | $ 28.69 | $ 67.90 |
Total Return A | (7.96)% | 25.91% | 67.88% | (56.20)% | 70.35% |
Ratios to Average Net Assets C, E | | | | | |
Expenses before reductions | 1.00% | 1.03% | 1.07% | 1.02% | 1.00% |
Expenses net of fee waivers, if any | 1.00% | 1.03% | 1.07% | 1.02% | 1.00% |
Expenses net of all reductions | 1.00% | 1.01% | 1.05% | 1.00% | .98% |
Net investment income (loss) | 2.39% | 2.10% | 2.04% | 1.41% | 1.33% |
Supplemental Data | | | | | |
Net assets, end of period (000 omitted) | $ 2,884,301 | $ 4,283,462 | $ 4,043,748 | $ 2,225,606 | $ 6,219,690 |
Portfolio turnover rate D | 11% | 56% F | 52% | 51% | 52% |
A Total returns would have been lower if certain expenses had not been reduced during the applicable periods shown. B Calculated based on average shares outstanding during the period. C Fees and expenses of any underlying Fidelity Central Funds are not included in the Fund's expense ratio. The Fund indirectly bears its proportionate share of the expenses of any underlying Fidelity Central Funds. D Amount does not include the portfolio activity of any underlying Fidelity Central Funds. E Expense ratios reflect operating expenses of the class. Expenses before reductions do not reflect amounts reimbursed by the investment adviser or reductions from brokerage service arrangements or reductions from other expense offset arrangements and do not represent the amount paid by the class during periods when reimbursements or reductions occur. Expenses net of fee waivers reflect expenses after reimbursement by the investment adviser but prior to reductions from brokerage service arrangements or other expense offset arrangements. Expenses net of all reductions represent the net expenses paid by the class. F The portfolio turnover rate does not include the assets acquired in the merger. |
Financial Highlights - Institutional Class
Years ended October 31, | 2011 | 2010 G |
Selected Per-Share Data | | |
Net asset value, beginning of period | $ 57.49 | $ 55.47 |
Income from Investment Operations | | |
Net investment income (loss) D | 1.32 | .03 |
Net realized and unrealized gain (loss) | (5.88) | 2.79 |
Total from investment operations | (4.56) | 2.82 |
Distributions from net investment income | (.23) | (.80) |
Distributions from net realized gain | (.20) | - |
Total distributions | (.43) | (.80) |
Redemption fees added to paid in capital D | .01 | - J |
Net asset value, end of period | $ 52.51 | $ 57.49 |
Total Return B, C | (7.98)% | 5.15% |
Ratios to Average Net Assets E, H | | |
Expenses before reductions | 1.04% | 1.08% A |
Expenses net of fee waivers, if any | 1.04% | 1.08% A |
Expenses net of all reductions | 1.04% | 1.06% A |
Net investment income (loss) | 2.35% | .68% A |
Supplemental Data | | |
Net assets, end of period (000 omitted) | $ 9,603 | $ 12,868 |
Portfolio turnover rate F | 11% | 56% I |
A Annualized B Total returns for periods of less than one year are not annualized. C Total returns would have been lower if certain expenses had not been reduced during the applicable periods shown. D Calculated based on average shares outstanding during the period. E Fees and expenses of any underlying Fidelity Central Funds are not included in the Fund's expense ratio. The Fund indirectly bears its proportionate share of the expenses of any underlying Fidelity Central Funds. F Amount does not include the portfolio activity of any underlying Fidelity Central Funds. G For the period September 28, 2010 (commencement of sale of shares) to October 31, 2010. H Expense ratios reflect operating expenses of the class. Expenses before reductions do not reflect amounts reimbursed by the investment adviser or reductions from brokerage service arrangements or reductions from other expense offset arrangements and do not represent the amount paid by the class during periods when reimbursements or reductions occur. Expense ratios before reductions for start-up periods may not be representative of longer-term operating periods. Expenses net of fee waivers reflect expenses after reimbursement by the investment adviser but prior to reductions from brokerage service arrangements or other expense offset arrangements. Expenses net of all reductions represent the net expenses paid by the class. I The portfolio turnover rate does not include the assets acquired in the merger. J Amount represents less than $.01 per share. |
See accompanying notes which are an integral part of the financial statements.
Annual Report
Notes to Financial Statements
For the period ended October 31, 2011
1. Organization.
Fidelity Latin America Fund (the Fund) is a non-diversified fund of Fidelity Investment Trust (the Trust) and is authorized to issue an unlimited number of shares. The Trust is registered under the Investment Company Act of 1940, as amended (the 1940 Act), as an open-end management investment company organized as a Massachusetts business trust. The Fund offers Class A, Class T, Class C, Latin America and Institutional Class shares, each of which, along with Class B shares, has equal rights as to assets and voting privileges. Effective after the close of business on September 1, 2010, Class B shares were closed to new accounts and additional purchases, except for exchanges and reinvestments by existing shareholders. Each class has exclusive voting rights with respect to matters that affect that class. Class B shares automatically convert to Class A shares after a holding period of seven years from the initial date of purchase. Investment income, realized and unrealized capital gains and losses, the common expenses of the Fund, and certain fund-level expense reductions, if any, are allocated on a pro-rata basis to each class based on the relative net assets of each class to the total net assets of the Fund. Each class differs with respect to transfer agent and distribution and service plan fees incurred. Certain expense reductions may also differ by class. The Fund's investments in emerging markets can be subject to social, economic, regulatory, and political uncertainties and can be extremely volatile.
2. Investments in Fidelity Central Funds.
The Fund invests in Fidelity Central Funds, which are open-end investment companies available only to other investment companies and accounts managed by Fidelity Management & Research Company (FMR) and its affiliates. The Fund's Schedule of Investments lists each of the Fidelity Central Funds held as of period end, if any, as an investment of the Fund, but does not include the underlying holdings of each Fidelity Central Fund. As an Investing Fund, the Fund indirectly bears its proportionate share of the expenses of the underlying Fidelity Central Funds.
The Money Market Central Funds seek preservation of capital and current income and are managed by Fidelity Investments Money Management, Inc. (FIMM), an affiliate of FMR.
A complete unaudited list of holdings for each Fidelity Central Fund is available upon request or at the Securities and Exchange Commission (the SEC) web site at www.sec.gov. In addition, the financial statements of the Fidelity Central Funds, which are not covered by the Fund's Report of Independent Registered Public Accounting Firm are available on the SEC web site or upon request.
3. Significant Accounting Policies.
The financial statements have been prepared in conformity with accounting principles generally accepted in the United States of America (GAAP), which require management to make certain estimates and assumptions at the date of the financial statements. Actual results could differ from those estimates. Subsequent events, if any, through the date that the financial statements were issued have been evaluated in the preparation of the financial statements. The following summarizes the significant accounting policies of the Fund:
Security Valuation. Investments are valued as of 4:00 p.m. Eastern time on the last calendar day of the period. The Fund uses independent pricing services approved by the Board of Trustees to value its investments. When current market prices or quotations are not readily available or reliable, valuations may be determined in good faith in accordance with procedures adopted by the Board of Trustees. Factors used in determining value may include market or security specific events. The frequency with which these procedures are used cannot be predicted and they may be utilized to a significant extent. The value used for net asset value (NAV) calculation under these procedures may differ from published prices for the same securities.
The Fund categorizes the inputs to valuation techniques used to value its investments into a disclosure hierarchy consisting of three levels as shown below:
Level 1 - quoted prices in active markets for identical investments
Level 2 - other significant observable inputs (including quoted prices for similar investments, interest rates, prepayment speeds, etc.)
Level 3 - unobservable inputs (including the Fund's own assumptions based on the best information available)
Changes in valuation techniques may result in transfers in or out of an assigned level within the disclosure hierarchy. The aggregate value of investments by input level, as of October 31, 2011, is included at the end of the Fund's Schedule of Investments. Valuation techniques used to value the Fund's investments by major category are as follows:
Equity securities, including restricted securities, for which market quotations are readily available, are valued at the last reported sale price or official closing price as reported by an independent pricing service on the primary market or exchange on which they are traded and are categorized as Level 1 in the hierarchy. In the event there were no sales during the day or closing prices are not available, securities are valued at the last quoted bid price or may be valued using the last available price and are generally categorized as Level 2 in the hierarchy. For foreign equity securities, when significant market or security specific events arise, comparisons to the valuation of American Depositary Receipts (ADRs), futures contracts, Exchange-traded
Annual Report
Notes to Financial Statements - continued
3. Significant Accounting Policies - continued
Security Valuation - continued
funds (ETFs) and certain indexes as well as quoted prices for similar securities are used and are categorized as Level 2 in the hierarchy in these circumstances. Utilizing these techniques may result in transfers between Level 1 and Level 2. For restricted equity securities and private placements where observable inputs are limited, assumptions about market activity and risk are used and are categorized as Level 3 in the hierarchy.
Investments in open-end mutual funds, including the Fidelity Central Funds, are valued at their closing net asset value each business day and are categorized as Level 1 in the hierarchy.
Foreign Currency. The Fund may use foreign currency contracts to facilitate transactions in foreign-denominated securities. Gains and losses from these transactions may arise from changes in the value of the foreign currency or if the counterparties do not perform under the contracts' terms.
Foreign-denominated assets, including investment securities, and liabilities are translated into U.S. dollars at the exchange rate at period end. Purchases and sales of investment securities, income and dividends received and expenses denominated in foreign currencies are translated into U.S. dollars at the exchange rate in effect on the transaction date.
The effects of exchange rate fluctuations on investments are included with the net realized and unrealized gain (loss) on investment securities. Other foreign currency transactions resulting in realized and unrealized gain (loss) are disclosed separately.
Investment Transactions and Income. For financial reporting purposes, the Fund's investment holdings and NAV include trades executed through the end of the last business day of the period. The NAV per share for processing shareholder transactions is calculated as of the close of business of the New York Stock Exchange (NYSE), normally 4:00 p.m. Eastern time and includes trades executed through the end of the prior business day. Gains and losses on securities sold are determined on the basis of identified cost and may include proceeds received from litigation. Dividend income is recorded on the ex-dividend date, except for certain dividends from foreign securities where the ex-dividend date may have passed, which are recorded as soon as the Fund is informed of the ex-dividend date. Non-cash dividends included in dividend income, if any, are recorded at the fair market value of the securities received. Distributions received on securities that represent a return of capital or capital gain are recorded as a reduction of cost of investments and/or as a realized gain. The Fund estimates the components of distributions received that may be considered return of capital distributions or capital gain distributions. Interest income and distributions from the Fidelity Central Funds are accrued as earned. Interest income includes coupon interest and amortization of premium and accretion of discount on debt securities. Investment income is recorded net of foreign taxes withheld where recovery of such taxes is uncertain.
Expenses. Expenses directly attributable to a fund are charged to that fund. Expenses attributable to more than one fund are allocated among the respective funds on the basis of relative net assets or other appropriate methods. Expense estimates are accrued in the period to which they relate and adjustments are made when actual amounts are known.
Income Tax Information and Distributions to Shareholders. Each year, the Fund intends to qualify as a regulated investment company, including distributing substantially all of its taxable income and realized gains under Subchapter M of the Internal Revenue Code and filing its U.S. federal tax return. As a result, no provision for income taxes is required. As of October 31, 2011, the Fund did not have any unrecognized tax benefits in the financial statements. A fund's federal tax return is subject to examination by the Internal Revenue Service (IRS) for a period of three years. Foreign taxes are provided for based on the Fund's understanding of the tax rules and rates that exist in the foreign markets in which it invests.
Distributions are declared and recorded on the ex-dividend date. Income dividends and capital gain distributions are declared separately for each class. Income and capital gain distributions are determined in accordance with income tax regulations, which may differ from GAAP. In addition, the Fund claimed a portion of the payment made to redeeming shareholders as a distribution for income tax purposes.
Capital accounts within the financial statements are adjusted for permanent book-tax differences. These adjustments have no impact on net assets or the results of operations. Temporary book-tax differences will reverse in a subsequent period.
Book-tax differences are primarily due to foreign currency transactions, passive foreign investment companies (PFIC), deferred trustees compensation, capital loss carryforwards and losses deferred due to wash sales.
The federal tax cost of investment securities and unrealized appreciation (depreciation) as of period end were as follows:
Gross unrealized appreciation | $ 1,438,494,908 |
Gross unrealized depreciation | (60,426,525) |
Net unrealized appreciation (depreciation) on securities and other investments | $ 1,378,068,383 |
| |
Tax Cost | $ 1,798,937,632 |
Annual Report
3. Significant Accounting Policies - continued
Income Tax Information and Distributions to Shareholders - continued
The tax-based components of distributable earnings as of period end were as follows:
Undistributed ordinary income | $ 34,016,899 |
Capital loss carryforward | $ (96,320,871) |
Net unrealized appreciation (depreciation) | $ 1,378,167,010 |
Under the recently enacted Regulated Investment Company Modernization Act of 2010 (the Act), the Fund will be permitted to carry forward capital losses incurred in taxable years beginning after December 22, 2010 for an unlimited period. However, any losses incurred during those future taxable years will be required to be utilized prior to any losses incurred in pre-enactment taxable years, which generally expire after eight years from when they are incurred. Additionally, post-enactment capital losses that are carried forward will retain their character as either short-term or long-term capital losses rather than being considered all short-term as under previous law. The Fund's first fiscal year end subject to the Act will be October 31, 2012.
The tax character of distributions paid was as follows:
| October 31, 2011 | October 31, 2010 |
Ordinary Income | $ 37,999,721 | $ 152,546,775 |
Short-Term Trading (Redemption) Fees. Shares held by investors in the Fund less than 90 days are subject to a redemption fee equal to 1.50% of the net asset value of shares redeemed. All redemption fees, which reduce the proceeds of the shareholder redemption, are retained by the Fund and accounted for as an addition to paid in capital.
New Accounting Pronouncement. In May 2011, the Financial Accounting Standards Board issued Accounting Standard Update No. 2011-04, Fair Value Measurement (Topic 820) - Amendments to Achieve Common Fair Value Measurement and Disclosure Requirements in U.S. GAAP and IFRSs. The update changes the wording used to describe the requirements in GAAP for measuring fair value and for disclosing information about fair value measurements. The update is effective during interim and annual periods beginning after December 15, 2011. Management is currently evaluating the impact of the update's adoption on the Fund's financial statement disclosures.
4. Purchases and Sales of Investments.
Purchases and sales of securities, other than short-term securities, aggregated $432,655,967 and $1,472,546,394, respectively.
5. Fees and Other Transactions with Affiliates.
Management Fee. FMR and its affiliates provide the Fund with investment management related services for which the Fund pays a monthly management fee. The management fee is the sum of an individual fund fee rate that is based on an annual rate of .45% of the Fund's average net assets and a group fee rate that averaged .26% during the period. The group fee rate is based upon the average net assets of all the mutual funds advised by FMR. The group fee rate decreases as assets under management increase and increases as assets under management decrease. For the period, the total annual management fee rate was .71% of the Fund's average net assets.
Distribution and Service Plan Fees. In accordance with Rule 12b-1 of the 1940 Act, the Fund has adopted separate Distribution and Service Plans for each class of shares. Certain classes pay Fidelity Distributors Corporation (FDC), an affiliate of FMR, separate Distribution and Service Fees, each of which are based on an annual percentage of each class' average net assets. In addition, FDC may pay financial intermediaries for selling shares of the Fund and providing shareholder support services. For the period, the Distribution and Service Fee rates, total fees and amounts retained by FDC were as follows:
| Distribution
Fee | Service
Fee | Total Fees | Retained
by FDC |
Class A | -% | .25% | $ 267,457 | $ 5,858 |
Class T | .25% | .25% | 161,457 | 1,475 |
Class B | .75% | .25% | 173,640 | 130,230 |
Class C | .75% | .25% | 436,724 | 63,761 |
| | | $ 1,039,278 | $ 201,324 |
Annual Report
Notes to Financial Statements - continued
5. Fees and Other Transactions with Affiliates - continued
Sales Load. FDC may receive a front-end sales charge of up to 5.75% for selling Class A shares, and 3.50% for selling Class T shares, some of which is paid to financial intermediaries for selling shares of the Fund. Depending on the holding period, FDC may receive contingent deferred sales charges levied on Class A, Class T, Class B, and Class C redemptions. The deferred sales charges range from 5% to 1% for Class B, 1% for Class C, 1.00% for certain purchases of Class A shares and .25% for certain purchases of Class T shares.
For the period, sales charge amounts retained by FDC were as follows:
| Retained
by FDC |
Class A | $ 62,781 |
Class T | 8,150 |
Class B* | 14,426 |
Class C* | 5,552 |
| $ 90,909 |
* When Class B and Class C shares are initially sold, FDC pays commissions from its own resources to financial intermediaries through which the sales are made.
Transfer Agent Fees. Fidelity Investments Institutional Operations Company, Inc. (FIIOC), an affiliate of FMR, is the transfer, dividend disbursing and shareholder servicing agent for each class of the Fund. FIIOC receives account fees and asset-based fees that vary according to the account size and type of account of the shareholders of the respective classes of the Fund. FIIOC pays for typesetting, printing and mailing of shareholder reports, except proxy statements. For the period, transfer agent fees for each class were as follows:
| Amount | % of
Average
Net Assets |
Class A | $ 312,176 | .29 |
Class T | 101,225 | .31 |
Class B | 52,537 | .30 |
Class C | 122,538 | .28 |
Latin America | 7,524,751 | .21 |
Institutional Class | 28,490 | .24 |
| $ 8,141,717 | |
Accounting and Security Lending Fees. Fidelity Service Company, Inc. (FSC), an affiliate of FMR, maintains the Fund's accounting records. The accounting fee is based on the level of average net assets for the month. Under a separate contract, FSC administers the security lending program. The security lending fee is based on the number and duration of lending transactions.
Brokerage Commissions. The Fund placed a portion of its portfolio transactions with brokerage firms which are affiliates of the investment adviser. The commissions paid to these affiliated firms were $2,495 for the period.
Interfund Lending Program. Pursuant to an Exemptive Order issued by the SEC, the Fund, along with other registered investment companies having management contracts with FMR, may participate in an interfund lending program. This program provides an alternative credit facility allowing the funds to borrow from, or lend money to, other participating affiliated funds. At period end, there were no interfund loans outstanding. The Fund's activity in this program during the period for which loans were outstanding was as follows:
Borrower or Lender | Average Daily
Loan Balance | Weighted Average Interest Rate | Interest
Expense |
Borrower | $ 14,398,611 | .39% | $ 8,383 |
6. Committed Line of Credit.
The Fund participates with other funds managed by FMR or an affiliate in a $4.0 billion credit facility (the "line of credit") to be utilized for temporary or emergency purposes to fund shareholder redemptions or for other short-term liquidity purposes. The Fund has agreed to pay commitment fees on its pro-rata portion of the line of credit, which amounted to $12,344 and is reflected in Miscellaneous expenses on the Statement of Operations. During the period, there were no borrowings on this line of credit.
Annual Report
7. Security Lending.
The Fund lends portfolio securities through a lending agent from time to time in order to earn additional income. For equity securities, a lending agent is used and may loan securities to certain qualified borrowers, including Fidelity Capital Markets (FCM), a broker-dealer affiliated with the Fund. On the settlement date of the loan, the Fund receives collateral (in the form of U.S. Treasury obligations, letters of credit and/or cash) against the loaned securities and maintains collateral in an amount not less than 100% of the market value of the loaned securities during the period of the loan. The market value of the loaned securities is determined at the close of business of the Fund and any additional required collateral is delivered to the Fund on the next business day. If the borrower defaults on its obligation to return the securities loaned because of insolvency or other reasons, a fund could experience delays and costs in recovering the securities loaned or in gaining access to the collateral. Any cash collateral received is invested in the Fidelity Securities Lending Cash Central Fund. The value of loaned securities and cash collateral at period end are disclosed on the Fund's Statement of Assets and Liabilities. Security lending income represents the income earned on investing cash collateral, less rebates paid to borrowers and any lending agent fees associated with the loan, plus any premium payments received for lending certain types of securities. Security lending income is presented in the Statement of Operations as a component of income from Fidelity Central Funds. Total security lending income during the period amounted to $397,722. During the period, there were no securities loaned to FCM.
8. Expense Reductions.
FMR voluntarily agreed to reimburse a portion of Latin America's operating expenses. During the period, this reimbursement reduced the class' expenses by $45,747.
Many of the brokers with whom FMR places trades on behalf of the Fund provided services to the Fund in addition to trade execution. These services included payments of certain expenses on behalf of the Fund totaling $38,294 for the period.
9. Distributions to Shareholders.
Distributions to shareholders of each class were as follows:
Years ended October 31, | 2011 | 2010A |
From net investment income | | |
Class A | $ 387,219 | $ 1,442 |
Class T | 94,474 | 1,442 |
Class B | 23,836 | 1,442 |
Class C | 78,469 | 1,442 |
Latin America | 21,655,692 | 118,553,199 |
Institutional Class | 52,446 | 1,442 |
Total | $ 22,292,136 | $ 118,560,409 |
From net realized gain | | |
Class A | $ 407,401 | $ - |
Class T | 127,447 | - |
Class B | 68,279 | - |
Class C | 170,156 | - |
Latin America | 14,889,803 | 33,986,366 |
Institutional Class | 44,499 | - |
Total | $ 15,707,585 | $ 33,986,366 |
A Distributions for Class A, Class T, Class B, Class C and Institutional Class are for the period September 28, 2010 (commencement of sale of shares) to October 31, 2010.
10. Share Transactions.
Transactions for each class of shares were as follows:
| Shares | Dollars |
Years ended October 31, | 2011 | 2010A | 2011 | 2010A |
Class A | | | | |
Shares sold | 412,254 | 41,687 | $ 23,066,057 | $ 2,369,263 |
Issued in exchange of shares of Fidelity Advisor Latin America Fund | - | 2,023,866 | - | 113,640,086 |
Reinvestment of distributions | 12,195 | 26 | 706,536 | 1,442 |
Shares redeemed | (691,058) | (53,951) | (38,328,762) | (3,076,408) |
Net increase (decrease) | (266,609) | 2,011,628 | $ (14,556,169) | $ 112,934,383 |
Annual Report
Notes to Financial Statements - continued
10. Share Transactions - continued
| Shares | Dollars |
Years ended October 31, | 2011 | 2010A | 2011 | 2010A |
Class T | | | | |
Shares sold | 87,514 | 18,758 | $ 4,903,931 | $ 1,058,068 |
Issued in exchange of shares of Fidelity Advisor Latin America Fund | - | 637,585 | - | 35,800,407 |
Reinvestment of distributions | 3,721 | 26 | 215,680 | 1,442 |
Shares redeemed | (234,128) | (15,626) | (12,893,248) | (885,588) |
Net increase (decrease) | (142,893) | 640,743 | $ (7,773,637) | $ 35,974,329 |
Class B | | | | |
Shares sold | 11,256 | 3,456 | $ 626,261 | $ 192,197 |
Issued in exchange of shares of Fidelity Advisor Latin America Fund | - | 359,402 | - | 20,176,816 |
Reinvestment of distributions | 1,326 | 26 | 76,906 | 1,442 |
Shares redeemed | (96,470) | (7,861) | (5,351,844) | (450,086) |
Net increase (decrease) | (83,888) | 355,023 | $ (4,648,677) | $ 19,920,369 |
Class C | | | | |
Shares sold | 137,950 | 17,327 | $ 7,785,005 | $ 976,205 |
Issued in exchange of shares of Fidelity Advisor Latin America Fund | - | 840,828 | - | 47,204,057 |
Reinvestment of distributions | 3,829 | 26 | 222,012 | 1,442 |
Shares redeemed | (306,800) | (16,791) | (16,851,535) | (947,712) |
Net increase (decrease) | (165,021) | 841,390 | $ (8,844,518) | $ 47,233,992 |
Latin America | | | | |
Shares sold | 8,382,994 | 22,062,249 | $ 474,305,310 | $ 1,142,552,819 |
Reinvestment of distributions | 609,933 | 2,770,809 | 35,291,350 | 147,652,381 |
Shares redeemed | (28,534,583) | (35,850,914) | (1,586,342,682) | (1,794,503,952) |
Net increase (decrease) | (19,541,656) | (11,017,856) | $ (1,076,746,022) | $ (504,298,752) |
Institutional Class | | | | |
Shares sold | 72,884 | 3,784 | $ 4,108,817 | $ 212,699 |
Issued in exchange of shares of Fidelity Advisor Latin America Fund | - | 228,366 | - | 12,822,761 |
Reinvestment of distributions | 1,178 | 26 | 68,214 | 1,442 |
Shares redeemed | (115,010) | (8,368) | (6,478,861) | (476,457) |
Net increase (decrease) | (40,948) | 223,808 | $ (2,301,830) | $ 12,560,445 |
A Share transactions for Class A, Class T, Class B, Class C and Institutional Class are for the period September 28, 2010 (commencement of sale of shares) to October 31, 2010.
11. Other.
The Fund's organizational documents provide former and current trustees and officers with a limited indemnification against liabilities arising in connection with the performance of their duties to the Fund. In the normal course of business, the Fund may also enter into contracts that provide general indemnifications. The Fund's maximum exposure under these arrangements is unknown as this would be dependent on future claims that may be made against the Fund. The risk of material loss from such claims is considered remote.
12. Merger Information.
On October 1, 2010 the Fund acquired all of the assets and assumed all of the liabilities of the Fidelity Advisor Latin America Fund ("Target Fund") pursuant to an agreement and plan of reorganization approved by the Board of Trustees ("The Board") on July 6, 2010. The reorganization provides shareholders of the Target Fund access to a larger portfolio with the same investment objectives and lower expenses. The acquisition was accomplished by an exchange of 2,023,866 Class A shares, 637,585 Class T shares, 359,402 Class B shares, 840,828 Class C shares, and 228,366 Institutional Class shares of the Fund, respectively, for 2,219,330 Class A shares, 700,912 Class T shares, 400,205 Class B shares, 940,861 Class C shares, and 245,559 Institutional Class shares then outstanding (valued at $51.20, $51.08, $50.42, $50.17 and $52.22 per share for Class A, Class T, Class B, Class C, and Institutional Class, respectively) of the Target Fund. The reorganization qualified as a tax-free reorganization for federal income tax purposes with no gain or loss recognized to the funds or their shareholders. The Target Fund's net assets, including securities of $229,225,487, unrealized appreciation of $95,362,395, and net other assets of $418,642, were combined with the Fund's net assets of $4,149,781,255 for total net assets after the acquisition of $4,379,425,384.
Annual Report
12. Merger Information - continued
Pro forma results of operations of the combined entity for the entire year ended October 31, 2010, as though the acquisition had occurred as of the beginning of the year (rather than on the actual acquisition date), are as follows:
Net investment income (loss) | $ 90,969,628 |
Total net realized gain (loss) | 302,327,523 |
Total change in net unrealized appreciation (depreciation) | 548,871,563 |
Net increase (decrease) in net assets resulting from operations | $ 942,168,714 |
Because the combined investment portfolios have been managed as a single portfolio since the acquisition was completed, it is not practicable to separate the amounts of revenue and earnings of the acquired fund that have been included in the Fund's accompanying Statement of Operations since October 1, 2010.
Annual Report
Fidelity Nordic Fund
Performance: The Bottom Line
Average annual total return reflects the change in the value of an investment, assuming reinvestment of the fund's distributions from dividend income and capital gains (the profits earned upon the sale of securities that have grown in value, if any) and assuming a constant rate of performance each year. The $10,000 table and the fund's returns do not reflect the deduction of taxes that a shareholder would pay on fund distributions or the redemption of fund shares. During periods of reimbursement by Fidelity, a fund's total return will be greater than it would be had the reimbursement not occurred. How a fund did yesterday is no guarantee of how it will do tomorrow.
Average Annual Total Returns
Periods ended October 31, 2011 | Past 1
year | Past 5
years | Past 10
years |
Fidelity Nordic Fund | -7.49% | -0.53% | 8.76% |
$10,000 Over 10 Years
Let's say hypothetically that $10,000 was invested in Fidelity Nordic Fund on October 31, 2001. The chart shows how the value of your investment would have changed, and also shows how the FTSE Capped Nordic Index performed over the same period. Returns shown for the FTSE Capped Nordic Index for periods prior to October 1, 2009 (its inception date) are returns of the uncapped FTSE Nordic Index.
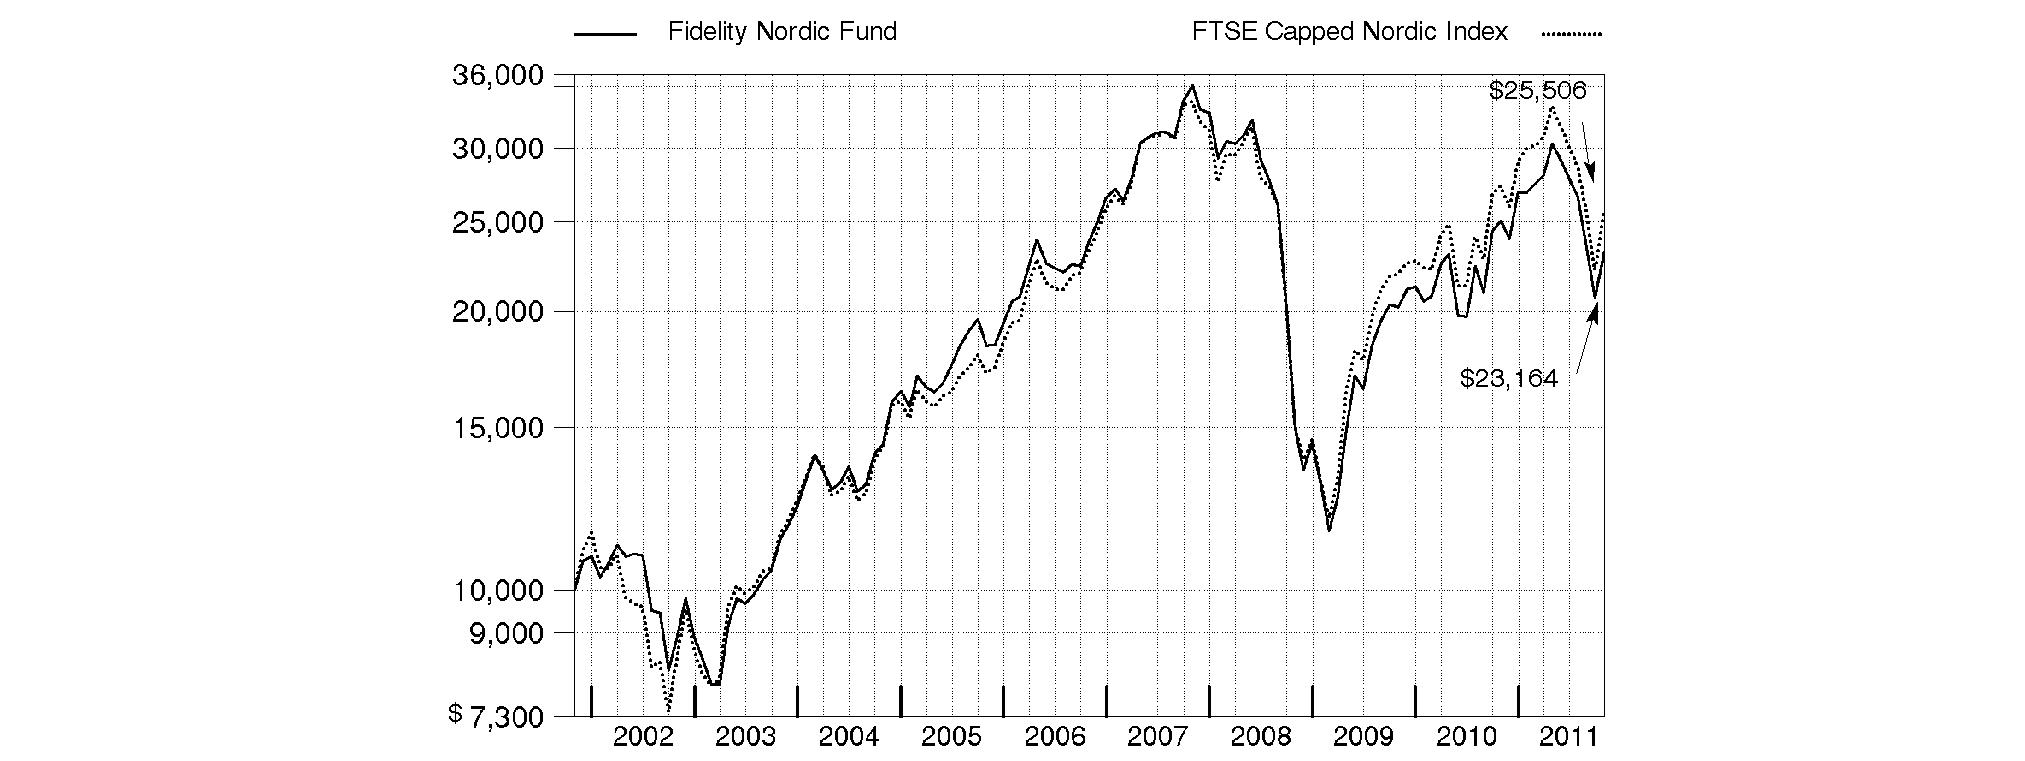
Annual Report
Fidelity Nordic Fund
Market Recap: International equities were rocked by a number of headline events during the year ending October 31, 2011. Stocks posted a solid advance for the first half of the period, despite concern about the sovereign debt crisis in Europe, a devastating earthquake and tsunami in Japan, and political upheaval in the Middle East and North Africa. Sentiment turned decidedly negative in the second half, however, as fresh worries about Europe, inflation in China and a dimmed outlook for global growth caused foreign markets to suffer declines that intensified in August and September. October brought with it yet another dramatic swing, as euro zone policymakers appeared near a resolution to the debt debacle and buyers stormed back onto the scene in search of bargains. Still, those gains - along with favorable currency fluctuations overall - weren't enough to offset prior losses, and the MSCI® ACWI® (All Country World Index) ex USA Index finished the period down 4.56%. Within the MSCI index, Europe and emerging markets suffered the biggest declines, with many countries in these areas sustaining steep losses. By contrast, Japan showed resilience in the wake of its natural disasters, falling only 2%. Australia (+4%), Switzerland (+3%), the U.K. (+2%) and Canada, which produced a nominal return, were among the few major benchmark components to break into positive territory.
Comments from Per Johansson, who became Portfolio Manager of Fidelity® Nordic Fund on April 12, 2011: For the year, the fund returned -7.49%, while the FTSE® Capped Nordic Index returned -6.60%. Positioning in telecommunications, energy, financials and technology was detrimental. On an individual stock basis, the fund was hurt by a significant underweighting in Norway's Statoil, a benchmark component whose stock jumped on the company's discovery of one of the largest oil fields in the North Sea. Also in energy, the fund lost ground from underweighting and eventually selling deep-sea driller SeaDrill, a Bermuda-domiciled company, because the stock rose as demand for deepwater drilling improved. In technology, the fund's stake in Hexagon, a Swedish company that designs land surveying systems, declined later in the period as it missed earnings estimates due to a decrease in capital spending on the Chinese railways, where many of the company's services are used. The fund's position in Telenor, a telecommunications company in Norway, was detrimental. As the company resolved issues regarding increased competition, the stock gained and the fund did not hold enough of it. On the upside, the fund's holdings in industrials, especially in the capital goods and commercial/professional services segments, were beneficial. Within commercial/professional services, the fund's out-of-index position in Sweden's Intrum Justitia contributed because the credit management company successfully bought bank and consumer debt throughout the sovereign debt crisis in Europe. Elsewhere, stock selection in the food/beverage/tobacco segment of consumer staples provided a boost. Tobacco company Swedish Match was the fund's top contributor, rising solidly due in part to its stable revenue growth and success from expanding its business in the U.S. An underweighting in materials was helpful, as was timely ownership of Norway's Norsk Hydro, an aluminum company that is heavily reliant on growth in China, which was signaling signs of economic distress. Many of the stocks I've mentioned in this update were sold from the fund by period end.
Note to shareholders: Fidelity Nordic Fund may invest up to 35% of its total assets in any industry that represents more than 20% of the Nordic market. As of October 31, 2011, the fund did not have more than 20% of its assets in any one industry.
The views expressed above reflect those of the portfolio manager(s) only through the end of the period as stated on the cover of this report and do not necessarily represent the views of Fidelity or any other person in the Fidelity organization. Any such views are subject to change at any time based upon market or other conditions and Fidelity disclaims any responsibility to update such views. These views may not be relied on as investment advice and, because investment decisions for a Fidelity fund are based on numerous factors, may not be relied on as an indication of trading intent on behalf of any Fidelity fund.
Annual Report
Fidelity Nordic Fund
As a shareholder of the Fund, you incur two types of costs: (1) transaction costs, including redemption fees, and (2) ongoing costs, including management fees and other Fund expenses. This Example is intended to help you understand your ongoing costs (in dollars) of investing in the Fund and to compare these costs with the ongoing costs of investing in other mutual funds.
The Example is based on an investment of $1,000 invested at the beginning of the period and held for the entire period (May 1, 2011 to October 31, 2011).
Actual Expenses
The first line of the accompanying table provides information about actual account values and actual expenses. You may use the information in this line, together with the amount you invested, to estimate the expenses that you paid over the period. Simply divide your account value by $1,000.00 (for example, an $8,600 account value divided by $1,000.00 = 8.6), then multiply the result by the number in the first line under the heading entitled "Expenses Paid During Period" to estimate the expenses you paid on your account during this period. A small balance maintenance fee of $12.00 that is charged once a year may apply for certain accounts with a value of less than $2,000. This fee is not included in the table below. If it was, the estimate of expenses you paid during the period would be higher, and your ending account value lower, by this amount. In addition, the Fund, as a shareholder in the underlying Fidelity Central Funds, will indirectly bear its pro-rata share of the fees and expenses incurred by the underlying Fidelity Central Funds. These fees and expenses are not included in the Fund's annualized expense ratio used to calculate the expense estimate in the table below.
Hypothetical Example for Comparison Purposes
The second line of the accompanying table provides information about hypothetical account values and hypothetical expenses based on the Fund's actual expense ratio and an assumed rate of return of 5% per year before expenses, which is not the Fund's actual return. The hypothetical account values and expenses may not be used to estimate the actual ending account balance or expenses you paid for the period. You may use this information to compare the ongoing costs of investing in the Fund and other funds. To do so, compare this 5% hypothetical example with the 5% hypothetical examples that appear in the shareholder reports of the other funds. A small balance maintenance fee of $12.00 that is charged once a year may apply for certain accounts with a value of less than $2,000. This fee is not included in the table below. If it was, the estimate of expenses you paid during the period would be higher, and your ending account value lower, by this amount. In addition, the Fund, as a shareholder in the underlying Fidelity Central Funds, will indirectly bear its pro-rata share of the fees and expenses incurred by the underlying Fidelity Central Funds. These fees and expenses are not included in the Fund's annualized expense ratio used to calculate the expense estimate in the table below.
Please note that the expenses shown in the table are meant to highlight your ongoing costs only and do not reflect any transaction costs. Therefore, the second line of the table is useful in comparing ongoing costs only, and will not help you determine the relative total costs of owning different funds. In addition, if these transactional costs were included, your costs would have been higher.
| Annualized
Expense Ratio | Beginning
Account Value
May 1, 2011 | Ending
Account Value
October 31, 2011 | Expenses Paid
During Period*
May 1, 2011 to
October 31, 2011 |
Actual | 1.06% | $ 1,000.00 | $ 763.90 | $ 4.71 |
Hypothetical (5% return per year before expenses) | | $ 1,000.00 | $ 1,019.86 | $ 5.40 |
* Expenses are equal to the Fund's annualized expense ratio, multiplied by the average account value over the period, multiplied by 184/365 (to reflect the one-half year period).
Annual Report
Fidelity Nordic Fund
Investment Changes (Unaudited)
Geographic Diversification (% of fund's net assets) |
As of October 31, 2011 |
| Sweden | 38.7% | |
| Norway | 24.8% | |
| Denmark | 16.7% | |
| Finland | 14.1% | |
| Luxembourg | 4.1% | |
| United States of America | 1.6% | |

Percentages are adjusted for the effect of futures contracts, if applicable. |
As of April 30, 2011 |
| Sweden | 51.9% | |
| Norway | 14.4% | |
| Finland | 13.7% | |
| Denmark | 11.5% | |
| United States of America | 2.9% | |
| France | 2.0% | |
| Germany | 1.6% | |
| Bermuda | 1.1% | |
| Russia | 0.4% | |
| Other | 0.5% | |

Percentages are adjusted for the effect of futures contracts, if applicable. |
Asset Allocation |
| % of fund's
net assets | % of fund's net assets
6 months ago |
Stocks | 98.4 | 99.1 |
Short-Term Investments and Net Other Assets | 1.6 | 0.9 |
Top Ten Stocks as of October 31, 2011 |
| % of fund's
net assets | % of fund's net assets
6 months ago |
Novo Nordisk A/S Series B (Denmark, Pharmaceuticals) | 6.5 | 9.0 |
Swedbank AB (A Shares) (Sweden, Commercial Banks) | 6.3 | 3.1 |
Atlas Copco AB (A Shares) (Sweden, Machinery) | 6.1 | 0.0 |
Orkla ASA (A Shares) (Norway, Industrial Conglomerates) | 4.9 | 2.9 |
Telenor ASA (Norway, Diversified Telecommunication Services) | 4.7 | 0.0 |
Danske Bank A/S (Denmark, Commercial Banks) | 4.7 | 0.0 |
Sampo OYJ (A Shares) (Finland, Insurance) | 4.6 | 0.0 |
Subsea 7 SA (Luxembourg, Energy Equipment & Services) | 4.1 | 0.0 |
DnB NOR ASA (Norway, Commercial Banks) | 3.9 | 3.3 |
Schibsted ASA (B Shares) (Norway, Media) | 3.6 | 2.0 |
| 49.4 | |
Market Sectors as of October 31, 2011 |
| % of fund's
net assets | % of fund's net assets
6 months ago |
Industrials | 25.9 | 30.0 |
Financials | 25.8 | 24.0 |
Consumer Discretionary | 12.2 | 7.3 |
Health Care | 10.5 | 9.3 |
Energy | 8.6 | 7.3 |
Telecommunication Services | 6.1 | 4.5 |
Materials | 4.4 | 5.4 |
Information Technology | 2.5 | 8.3 |
Consumer Staples | 2.4 | 3.0 |
Annual Report
Fidelity Nordic Fund
Investments October 31, 2011
Showing Percentage of Net Assets
Common Stocks - 98.4% |
| Shares | | Value |
Denmark - 16.7% |
A.P. Moller - Maersk A/S Series B | 1,800 | | $ 12,279,537 |
Christian Hansen Holding AS | 341,100 | | 7,454,178 |
Danske Bank A/S (a) | 1,222,562 | | 16,939,763 |
Novo Nordisk A/S Series B | 221,301 | | 23,498,453 |
TOTAL DENMARK | | 60,171,931 |
Finland - 14.1% |
Amer Group PLC (A Shares) | 585,200 | | 8,090,484 |
Elisa Corp. (A Shares) (d) | 242,600 | | 5,126,660 |
Kone Oyj (B Shares) | 178,820 | | 9,883,912 |
Nokian Tyres PLC | 309,400 | | 11,368,143 |
Sampo OYJ (A Shares) | 598,400 | | 16,537,672 |
TOTAL FINLAND | | 51,006,871 |
Luxembourg - 4.1% |
Subsea 7 SA (a) | 673,500 | | 14,649,194 |
Norway - 24.8% |
ABG Sundal Collier ASA | 6,477,600 | | 4,677,052 |
DnB NOR ASA | 1,211,553 | | 14,133,624 |
Kvaerner ASA (a) | 2,103,149 | | 4,053,235 |
Orkla ASA (A Shares) (d) | 2,011,500 | | 17,522,406 |
Schibsted ASA (B Shares) | 490,800 | | 12,843,875 |
Storebrand ASA (A Shares) | 990,700 | | 6,108,688 |
Telenor ASA | 951,400 | | 16,985,624 |
TGS Nopec Geophysical Co. ASA | 210,900 | | 4,814,532 |
Yara International ASA | 177,800 | | 8,469,100 |
TOTAL NORWAY | | 89,608,136 |
Sweden - 38.7% |
ASSA ABLOY AB (B Shares) | 491,600 | | 11,996,773 |
Atlas Copco AB (A Shares) | 1,004,300 | | 21,982,132 |
Avanza Bank Holding AB | 195,456 | | 5,231,507 |
BioGaia AB | 285,000 | | 7,212,921 |
Intrum Justitia AB | 749,800 | | 12,334,601 |
Lundin Petroleum AB | 307,900 | | 7,556,350 |
Meda AB (A Shares) | 706,700 | | 7,219,244 |
Mekonomen AB | 102,200 | | 3,738,709 |
|
| Shares | | Value |
Nobia AB (a) | 1,812,700 | | $ 7,868,551 |
Ratos AB (B Shares) | 481,900 | | 6,445,488 |
Sandvik AB | 544,700 | | 7,531,916 |
Swedbank AB (A Shares) | 1,625,700 | | 22,903,505 |
Swedish Match Co. | 246,400 | | 8,526,331 |
Telefonaktiebolaget LM Ericsson (B Shares) | 863,298 | | 8,995,713 |
TOTAL SWEDEN | | 139,543,741 |
TOTAL COMMON STOCKS (Cost $371,541,883) |
354,979,873
|
Money Market Funds - 5.0% |
| | | |
Fidelity Cash Central Fund, 0.12% (b) | 1,778,767 | | 1,778,767 |
Fidelity Securities Lending Cash Central Fund, 0.11% (b)(c) | 16,475,000 | | 16,475,000 |
TOTAL MONEY MARKET FUNDS (Cost $18,253,767) |
18,253,767
|
TOTAL INVESTMENT PORTFOLIO - 103.4% (Cost $389,795,650) | | 373,233,640 |
NET OTHER ASSETS (LIABILITIES) - (3.4)% | | (12,333,552) |
NET ASSETS - 100% | $ 360,900,088 |
Legend |
(a) Non-income producing |
(b) Affiliated fund that is available only to investment companies and other accounts managed by Fidelity Investments. The rate quoted is the annualized seven-day yield of the fund at period end. A complete unaudited listing of the fund's holdings as of its most recent quarter end is available upon request. In addition, each Fidelity Central Fund's financial statements, which are not covered by the Fund's Report of Independent Registered Public Accounting Firm, are available on the SEC's website or upon request. |
(c) Investment made with cash collateral received from securities on loan. |
(d) Security or a portion of the security is on loan at period end. |
Affiliated Central Funds |
Information regarding fiscal year to date income earned by the Fund from investments in Fidelity Central Funds is as follows: |
Fund | Income earned |
Fidelity Cash Central Fund | $ 6,498 |
Fidelity Securities Lending Cash Central Fund | 895,176 |
Total | $ 901,674 |
Other Information |
The following is a summary of the inputs used, as of October 31, 2011, involving the Fund's assets and liabilities carried at fair value. The inputs or methodology used for valuing securities may not be an indication of the risk associated with investing in those securities. For more information on valuation inputs, and their aggregation into the levels used in the table below, please refer to the Security Valuation section in the accompanying Notes to Financial Statements. |
Valuation Inputs at Reporting Date: |
Description | Total | Level 1 | Level 2 | Level 3 |
Investments in Securities: | | | | |
Equities: | | | | |
Sweden | $ 139,543,741 | $ 130,548,028 | $ 8,995,713 | $ - |
Norway | 89,608,136 | 89,608,136 | - | - |
Denmark | 60,171,931 | 36,673,478 | 23,498,453 | - |
Finland | 51,006,871 | 51,006,871 | - | - |
Luxembourg | 14,649,194 | 14,649,194 | - | - |
Money Market Funds | 18,253,767 | 18,253,767 | - | - |
Total Investments in Securities: | $ 373,233,640 | $ 340,739,474 | $ 32,494,166 | $ - |
Income Tax Information |
At October 31, 2011, the Fund had a capital loss carryforward of approximately $116,424,475 all of which will expire in fiscal 2017. Capital loss carryforwards are only available to offset future capital gains of the Fund to the extent provided by regulations and may be limited. |
See accompanying notes which are an integral part of the financial statements.
Annual Report
Fidelity Nordic Fund
Statement of Assets and Liabilities
| October 31, 2011 |
| | |
Assets | | |
Investment in securities, at value (including securities loaned of $15,253,555) - See accompanying schedule: Unaffiliated issuers (cost $371,541,883) | $ 354,979,873 | |
Fidelity Central Funds (cost $18,253,767) | 18,253,767 | |
Total Investments (cost $389,795,650) | | $ 373,233,640 |
Receivable for investments sold | | 19,385,418 |
Receivable for fund shares sold | | 294,716 |
Dividends receivable | | 136,634 |
Distributions receivable from Fidelity Central Funds | | 150,509 |
Prepaid expenses | | 1,767 |
Other receivables | | 137,757 |
Total assets | | 393,340,441 |
| | |
Liabilities | | |
Payable for investments purchased | $ 14,016,637 | |
Payable for fund shares redeemed | 1,583,676 | |
Accrued management fee | 206,426 | |
Other affiliated payables | 95,598 | |
Other payables and accrued expenses | 63,016 | |
Collateral on securities loaned, at value | 16,475,000 | |
Total liabilities | | 32,440,353 |
| | |
Net Assets | | $ 360,900,088 |
Net Assets consist of: | | |
Paid in capital | | $ 498,258,053 |
Undistributed net investment income | | 6,065,540 |
Accumulated undistributed net realized gain (loss) on investments and foreign currency transactions | | (126,863,750) |
Net unrealized appreciation (depreciation) on investments and assets and liabilities in foreign currencies | | (16,559,755) |
Net Assets, for 12,194,376 shares outstanding | | $ 360,900,088 |
Net Asset Value, offering price and redemption price per share ($360,900,088 ÷ 12,194,376 shares) | | $ 29.60 |
Statement of Operations
| Year ended October 31, 2011 |
| | |
Investment Income | | |
Dividends | | $ 11,973,815 |
Interest | | 63 |
Income from Fidelity Central Funds (including $895,176 from security lending) | | 901,674 |
Income before foreign taxes withheld | | 12,875,552 |
Less foreign taxes withheld | | (1,947,528) |
Total income | | 10,928,024 |
| | |
Expenses | | |
Management fee | $ 3,232,791 | |
Transfer agent fees | 1,139,914 | |
Accounting and security lending fees | 239,544 | |
Custodian fees and expenses | 92,807 | |
Independent trustees' compensation | 2,545 | |
Registration fees | 31,320 | |
Audit | 57,139 | |
Legal | 1,834 | |
Interest | 1,571 | |
Miscellaneous | 4,430 | |
Total expenses before reductions | 4,803,895 | |
Expense reductions | (281,769) | 4,522,126 |
Net investment income (loss) | | 6,405,898 |
Realized and Unrealized Gain (Loss) Net realized gain (loss) on: | | |
Investment securities: | | |
Unaffiliated issuers | 59,563,796 | |
Foreign currency transactions | (303,679) | |
Total net realized gain (loss) | | 59,260,117 |
Change in net unrealized appreciation (depreciation) on: Investment securities | (98,662,547) | |
Assets and liabilities in foreign currencies | (595) | |
Total change in net unrealized appreciation (depreciation) | | (98,663,142) |
Net gain (loss) | | (39,403,025) |
Net increase (decrease) in net assets resulting from operations | | $ (32,997,127) |
See accompanying notes which are an integral part of the financial statements.
Annual Report
Statement of Changes in Net Assets
| Year ended
October 31,
2011 | Year ended
October 31,
2010 |
Increase (Decrease) in Net Assets | | |
Operations | | |
Net investment income (loss) | $ 6,405,898 | $ 4,179,042 |
Net realized gain (loss) | 59,260,117 | 41,433,413 |
Change in net unrealized appreciation (depreciation) | (98,663,142) | 33,478,890 |
Net increase (decrease) in net assets resulting from operations | (32,997,127) | 79,091,345 |
Distributions to shareholders from net investment income | (4,111,279) | (4,315,648) |
Share transactions
Proceeds from sales of shares | 107,813,311 | 163,155,616 |
Reinvestment of distributions | 3,976,175 | 4,158,861 |
Cost of shares redeemed | (171,718,515) | (118,821,372) |
Net increase (decrease) in net assets resulting from share transactions | (59,929,029) | 48,493,105 |
Redemption fees | 162,955 | 91,663 |
Total increase (decrease) in net assets | (96,874,480) | 123,360,465 |
| | |
Net Assets | | |
Beginning of period | 457,774,568 | 334,414,103 |
End of period (including undistributed net investment income of $6,065,540 and undistributed net investment income of $4,074,601, respectively) | $ 360,900,088 | $ 457,774,568 |
Other Information Shares | | |
Sold | 3,156,914 | 5,576,785 |
Issued in reinvestment of distributions | 119,440 | 148,584 |
Redeemed | (5,268,807) | (4,240,424) |
Net increase (decrease) | (1,992,453) | 1,484,945 |
See accompanying notes which are an integral part of the financial statements.
Annual Report
Financial Highlights
Years ended October 31, | 2011 | 2010 | 2009 | 2008 | 2007 |
Selected Per-Share Data | | | | | |
Net asset value, beginning of period | $ 32.27 | $ 26.33 | $ 20.75 | $ 52.81 | $ 36.58 |
Income from Investment Operations | | | | | |
Net investment income (loss) B | .47 | .33 | .35 | .85 | 2.39 E |
Net realized and unrealized gain (loss) | (2.86) | 5.94 | 6.29 | (28.93) | 14.60 |
Total from investment operations | (2.39) | 6.27 | 6.64 | (28.08) | 16.99 |
Distributions from net investment income | (.29) | (.34) | (1.06) | (1.73) | (.29) |
Distributions from net realized gain | - | - | - | (2.28) | (.51) |
Total distributions | (.29) | (.34) | (1.06) | (4.01) | (.80) |
Redemption fees added to paid in capital B | .01 | .01 | - G | .03 | .04 |
Net asset value, end of period | $ 29.60 | $ 32.27 | $ 26.33 | $ 20.75 | $ 52.81 |
Total Return A | (7.49)% | 24.05% | 34.90% | (57.32)% | 47.38% |
Ratios to Average Net Assets C,F | | | | | |
Expenses before reductions | 1.05% | 1.12% | 1.15% | 1.09% | 1.06% |
Expenses net of fee waivers, if any | 1.05% | 1.12% | 1.15% | 1.09% | 1.06% |
Expenses net of all reductions | .99% | 1.10% | 1.12% | 1.07% | 1.03% |
Net investment income (loss) | 1.40% | 1.16% | 1.71% | 2.10% | 5.37% E |
Supplemental Data | | | | | |
Net assets, end of period (000 omitted) | $ 360,900 | $ 457,775 | $ 334,414 | $ 290,401 | $ 997,726 |
Portfolio turnover rate D | 265% | 80% | 107% | 72% | 62% |
ATotal returns would have been lower if certain expenses had not been reduced during the applicable periods shown. BCalculated based on average shares outstanding during the period. CFees and expenses of any underlying Fidelity Central Funds are not included in the Fund's expense ratio. The Fund indirectly bears its proportionate share of the expenses of any underlying Fidelity Central Funds. DAmount does not include the portfolio activity of any underlying Fidelity Central Funds. EInvestment income per share reflects a special dividend which amounted to $1.62 per share. Excluding the special dividend, the ratio of net investment income (loss) to average net assets would have been 1.72%. FExpense ratios reflect operating expenses of the Fund. Expenses before reductions do not reflect amounts reimbursed by the investment adviser or reductions from brokerage service arrangements or reductions from other expense offset arrangements and do not represent the amount paid by the Fund during periods when reimbursements or reductions occur. Expenses net of fee waivers reflect expenses after reimbursement by the investment adviser but prior to reductions from brokerage service arrangements or other expense offset arrangements. Expenses net of all reductions represent the net expenses paid by the Fund. GAmount represents less than $.01 per share. |
See accompanying notes which are an integral part of the financial statements.
Annual Report
Notes to Financial Statements
For the period ended October 31, 2011
1. Organization.
Fidelity Nordic Fund (the Fund) is a fund of Fidelity Investment Trust (the Trust) and is authorized to issue an unlimited number of shares. The Trust is registered under the Investment Company Act of 1940, as amended (the 1940 Act), as an open-end management investment company organized as a Massachusetts business trust.
2. Investments in Fidelity Central Funds.
The Fund invests in Fidelity Central Funds, which are open-end investment companies available only to other investment companies and accounts managed by Fidelity Management & Research Company (FMR) and its affiliates. The Fund's Schedule of Investments lists each of the Fidelity Central Funds held as of period end, if any, as an investment of the Fund, but does not include the underlying holdings of each Fidelity Central Fund. As an Investing Fund, the Fund indirectly bears its proportionate share of the expenses of the underlying Fidelity Central Funds.
The Money Market Central Funds seek preservation of capital and current income and are managed by Fidelity Investments Money Management, Inc. (FIMM), an affiliate of FMR.
A complete unaudited list of holdings for each Fidelity Central Fund is available upon request or at the Securities and Exchange Commission (the SEC) web site at www.sec.gov. In addition, the financial statements of the Fidelity Central Funds, which are not covered by the Fund's Report of Independent Registered Public Accounting Firm are available on the SEC web site or upon request.
3. Significant Accounting Policies.
The financial statements have been prepared in conformity with accounting principles generally accepted in the United States of America (GAAP), which require management to make certain estimates and assumptions at the date of the financial statements. Actual results could differ from those estimates. Subsequent events, if any, through the date that the financial statements were issued have been evaluated in the preparation of the financial statements. The following summarizes the significant accounting policies of the Fund:
Security Valuation. Investments are valued as of 4:00 p.m. Eastern time on the last calendar day of the period. The Fund uses independent pricing services approved by the Board of Trustees to value its investments. When current market prices or quotations are not readily available or reliable, valuations may be determined in good faith in accordance with procedures adopted by the Board of Trustees. Factors used in determining value may include market or security specific events. The frequency with which these procedures are used cannot be predicted and they may be utilized to a significant extent. The value used for net asset value (NAV) calculation under these procedures may differ from published prices for the same securities.
The Fund categorizes the inputs to valuation techniques used to value its investments into a disclosure hierarchy consisting of three levels as shown below:
Level 1 - quoted prices in active markets for identical investments
Level 2 - other significant observable inputs (including quoted prices for similar investments, interest rates, prepayment speeds, etc.)
Level 3 - unobservable inputs (including the Fund's own assumptions based on the best information available)
Changes in valuation techniques may result in transfers in or out of an assigned level within the disclosure hierarchy. The aggregate value of investments by input level, as of October 31, 2011, is included at the end of the Fund's Schedule of Investments. Valuation techniques used to value the Fund's investments by major category are as follows:
Equity securities, including restricted securities, for which market quotations are readily available, are valued at the last reported sale price or official closing price as reported by an independent pricing service on the primary market or exchange on which they are traded and are categorized as Level 1 in the hierarchy. In the event there were no sales during the day or closing prices are not available, securities are valued at the last quoted bid price or may be valued using the last available price and are generally categorized as Level 2 in the hierarchy. For foreign equity securities, when significant market or security specific events arise, comparisons to the valuation of American Depositary Receipts (ADRs), futures contracts, Exchange-traded funds (ETFs) and certain indexes as well as quoted prices for similar securities are used and are categorized as Level 2 in the hierarchy in these circumstances. Utilizing these techniques may result in transfers between Level 1 and Level 2. For restricted equity securities and private placements where observable inputs are limited, assumptions about market activity and risk are used and are categorized as Level 3 in the hierarchy.
Investments in open-end mutual funds, including the Fidelity Central Funds, are valued at their closing net asset value each business day and are categorized as Level 1 in the hierarchy.
Foreign Currency. The Fund may use foreign currency contracts to facilitate transactions in foreign-denominated securities. Gains and losses from these transactions may arise from changes in the value of the foreign currency or if the counterparties do not perform under the contracts' terms.
Annual Report
3. Significant Accounting Policies - continued
Foreign Currency - continued
Foreign-denominated assets, including investment securities, and liabilities are translated into U.S. dollars at the exchange rate at period end. Purchases and sales of investment securities, income and dividends received and expenses denominated in foreign currencies are translated into U.S. dollars at the exchange rate in effect on the transaction date.
The effects of exchange rate fluctuations on investments are included with the net realized and unrealized gain (loss) on investment securities. Other foreign currency transactions resulting in realized and unrealized gain (loss) are disclosed separately.
Investment Transactions and Income. For financial reporting purposes, the Fund's investment holdings and NAV include trades executed through the end of the last business day of the period. The NAV per share for processing shareholder transactions is calculated as of the close of business of the New York Stock Exchange (NYSE), normally 4:00 p.m. Eastern time and includes trades executed through the end of the prior business day. Gains and losses on securities sold are determined on the basis of identified cost. Dividend income is recorded on the ex-dividend date, except for certain dividends from foreign securities where the ex-dividend date may have passed, which are recorded as soon as the Fund is informed of the ex-dividend date. Non-cash dividends included in dividend income, if any, are recorded at the fair market value of the securities received. Interest income and distributions from the Fidelity Central Funds are accrued as earned. Interest income includes coupon interest and amortization of premium and accretion of discount on debt securities. Investment income is recorded net of foreign taxes withheld where recovery of such taxes is uncertain.
Expenses. Expenses directly attributable to a fund are charged to that fund. Expenses attributable to more than one fund are allocated among the respective funds on the basis of relative net assets or other appropriate methods. Expense estimates are accrued in the period to which they relate and adjustments are made when actual amounts are known.
Income Tax Information and Distributions to Shareholders. Each year, the Fund intends to qualify as a regulated investment company, including distributing substantially all of its taxable income and realized gains under Subchapter M of the Internal Revenue Code and filing its U.S. federal tax return. As a result, no provision for income taxes is required. As of October 31, 2011, the Fund did not have any unrecognized tax benefits in the financial statements. A fund's federal tax return is subject to examination by the Internal Revenue Service (IRS) for a period of three years. Foreign taxes are provided for based on the Fund's understanding of the tax rules and rates that exist in the foreign markets in which it invests.
Distributions are declared and recorded on the ex-dividend date. Income and capital gain distributions are determined in accordance with income tax regulations, which may differ from GAAP.
Capital accounts within the financial statements are adjusted for permanent book-tax differences. These adjustments have no impact on net assets or the results of operations. Temporary book-tax differences will reverse in a subsequent period.
Book-tax differences are primarily due to foreign currency transactions, deferred trustees compensation, capital loss carryforwards, and losses deferred due to wash sales.
The federal tax cost of investment securities and unrealized appreciation (depreciation) as of period end were as follows:
Gross unrealized appreciation | $ 11,494,945 |
Gross unrealized depreciation | (38,496,230) |
Net unrealized appreciation (depreciation) on securities and other investments | $ (27,001,285) |
| |
Tax Cost | $ 400,234,925 |
The tax-based components of distributable earnings as of period end were as follows:
Undistributed ordinary income | $ 6,065,541 |
Capital loss carryforward | $ (116,424,475) |
Net unrealized appreciation (depreciation) | $ (26,999,030) |
Under the recently enacted Regulated Investment Company Modernization Act of 2010 (the Act), the Fund will be permitted to carry forward capital losses incurred in taxable years beginning after December 22, 2010 for an unlimited period. However, any losses incurred during those future taxable years will be required to be utilized prior to any losses incurred in pre-enactment taxable years, which generally expire after eight years from when they are incurred. Additionally, post-enactment capital losses that are carried forward will retain their character as either short-term or long-term capital losses rather than being considered all short-term as under previous law. The Fund's first fiscal year end subject to the Act will be October 31, 2012.
Annual Report
Notes to Financial Statements - continued
3. Significant Accounting Policies - continued
Income Tax Information and Distributions to Shareholders - continued
The tax character of distributions paid was as follows:
| October 31, 2011 | October 31, 2010 |
Ordinary Income | $ 4,111,279 | $ 4,315,648 |
Short-Term Trading (Redemption) Fees. Shares held by investors in the Fund less than 90 days are subject to a redemption fee equal to 1.50% of the net asset value of shares redeemed. All redemption fees, which reduce the proceeds of the shareholder redemption, are retained by the Fund and accounted for as an addition to paid in capital.
New Accounting Pronouncement. In May 2011, the Financial Accounting Standards Board issued Accounting Standard Update No. 2011-04, Fair Value Measurement (Topic 820) - Amendments to Achieve Common Fair Value Measurement and Disclosure Requirements in U.S. GAAP and IFRSs. The update changes the wording used to describe the requirements in GAAP for measuring fair value and for disclosing information about fair value measurements. The update is effective during interim and annual periods beginning after December 15, 2011. Management is currently evaluating the impact of the update's adoption on the Fund's financial statement disclosures.
4. Purchases and Sales of Investments.
Purchases and sales of securities, other than short-term securities, aggregated $1,208,390,364 and $1,265,249,637, respectively.
5. Fees and Other Transactions with Affiliates.
Management Fee. FMR and its affiliates provide the Fund with investment management related services for which the Fund pays a monthly management fee. The management fee is the sum of an individual fund fee rate that is based on an annual rate of .45% of the Fund's average net assets and a group fee rate that averaged .26% during the period. The group fee rate is based upon the average net assets of all the mutual funds advised by FMR. The group fee rate decreases as assets under management increase and increases as assets under management decrease. For the period, the total annual management fee rate was .71% of the Fund's average net assets.
Transfer Agent Fees. Fidelity Investments Institutional Operations Company, Inc. (FIIOC), an affiliate of FMR, is the Fund's transfer, dividend disbursing and shareholder servicing agent. FIIOC receives account fees and asset-based fees that vary according to account size and type of account. FIIOC pays for typesetting, printing and mailing of shareholder reports, except proxy statements. For the period, the transfer agent fees were equivalent to an annual rate of .25% of average net assets.
Accounting and Security Lending Fees. Fidelity Service Company, Inc. (FSC), an affiliate of FMR, maintains the Fund's accounting records. The accounting fee is based on the level of average net assets for the month. Under a separate contract, FSC administers the security lending program. The security lending fee is based on the number and duration of lending transactions.
Interfund Lending Program. Pursuant to an Exemptive Order issued by the SEC, the Fund, along with other registered investment companies having management contracts with FMR, may participate in an interfund lending program. This program provides an alternative credit facility allowing the funds to borrow from, or lend money to, other participating affiliated funds. At period end, there were no interfund loans outstanding. The Fund's activity in this program during the period for which loans were outstanding was as follows:
Borrower or Lender | Average Daily
Loan Balance | Weighted Average
Interest Rate | Interest
Expense |
Borrower | $ 9,362,176 | .36% | $ 1,571 |
6. Committed Line of Credit.
The Fund participates with other funds managed by FMR or an affiliate in a $4.0 billion credit facility (the "line of credit") to be utilized for temporary or emergency purposes to fund shareholder redemptions or for other short-term liquidity purposes. The Fund has agreed to pay commitment fees on its pro-rata portion of the line of credit, which amounted to $1,434 and is reflected in Miscellaneous expenses on the Statement of Operations. During the period, there were no borrowings on this line of credit.
Annual Report
7. Security Lending.
The Fund lends portfolio securities through a lending agent from time to time in order to earn additional income. For equity securities, a lending agent is used and may loan securities to certain qualified borrowers, including Fidelity Capital Markets (FCM), a broker-dealer affiliated with the Fund. On the settlement date of the loan, the Fund receives collateral (in the form of U.S. Treasury obligations, letters of credit and/or cash) against the loaned securities and maintains collateral in an amount not less than 100% of the market value of the loaned securities during the period of the loan. The market value of the loaned securities is determined at the close of business of the Fund and any additional required collateral is delivered to the Fund on the next business day. If the borrower defaults on its obligation to return the securities loaned because of insolvency or other reasons, a fund could experience delays and costs in recovering the securities loaned or in gaining access to the collateral. Any cash collateral received is invested in the Fidelity Securities Lending Cash Central Fund. The value of loaned securities and cash collateral at period end are disclosed on the Fund's Statement of Assets and Liabilities. Security lending income represents the income earned on investing cash collateral, less rebates paid to borrowers and any lending agent fees associated with the loan, plus any premium payments received for lending certain types of securities. Security lending income is presented in the Statement of Operations as a component of income from Fidelity Central Funds. During the period, there were no securities loaned to FCM.
8. Expense Reductions.
Many of the brokers with whom FMR places trades on behalf of the Fund provided services to the Fund in addition to trade execution. These services included payments of certain expenses on behalf of the Fund totaling $278,687 for the period. In addition, through arrangements with the Fund's custodian , credits realized as a result of uninvested cash balances were used to reduce the Fund's expenses. During the period, these credits reduced the Fund's custody expenses by $3,082.
9. Other.
The Fund's organizational documents provide former and current trustees and officers with a limited indemnification against liabilities arising in connection with the performance of their duties to the Fund. In the normal course of business, the Fund may also enter into contracts that provide general indemnifications. The Fund's maximum exposure under these arrangements is unknown as this would be dependent on future claims that may be made against the Fund. The risk of material loss from such claims is considered remote.
At the end of the period, Fidelity VIP FundsManager 60% Portfolio was the owner of record of approximately 12% of the total outstanding shares of the Fund.
Annual Report
Fidelity Pacific Basin Fund
Performance: The Bottom Line
Average annual total return reflects the change in the value of an investment, assuming reinvestment of the fund's distributions from dividend income and capital gains (the profits earned upon the sale of securities that have grown in value, if any) and assuming a constant rate of performance each year. The $10,000 table and the fund's returns do not reflect the deduction of taxes that a shareholder would pay on fund distributions or the redemption of fund shares. During periods of reimbursement by Fidelity, a fund's total return will be greater than it would be had the reimbursement not occurred. How a fund did yesterday is no guarantee of how it will do tomorrow.
Average Annual Total Returns
Periods ended October 31, 2011 | Past 1
year | Past 5
years | Past 10
years |
Fidelity Pacific Basin Fund | -5.44% | 2.39% | 9.38% |
$10,000 Over 10 Years
Let's say hypothetically that $10,000 was invested in Fidelity Pacific Basin Fund on October 31, 2001. The chart shows how the value of your investment would have changed, and also shows how the MSCI AC (All Country) Pacific Index performed over the same period.
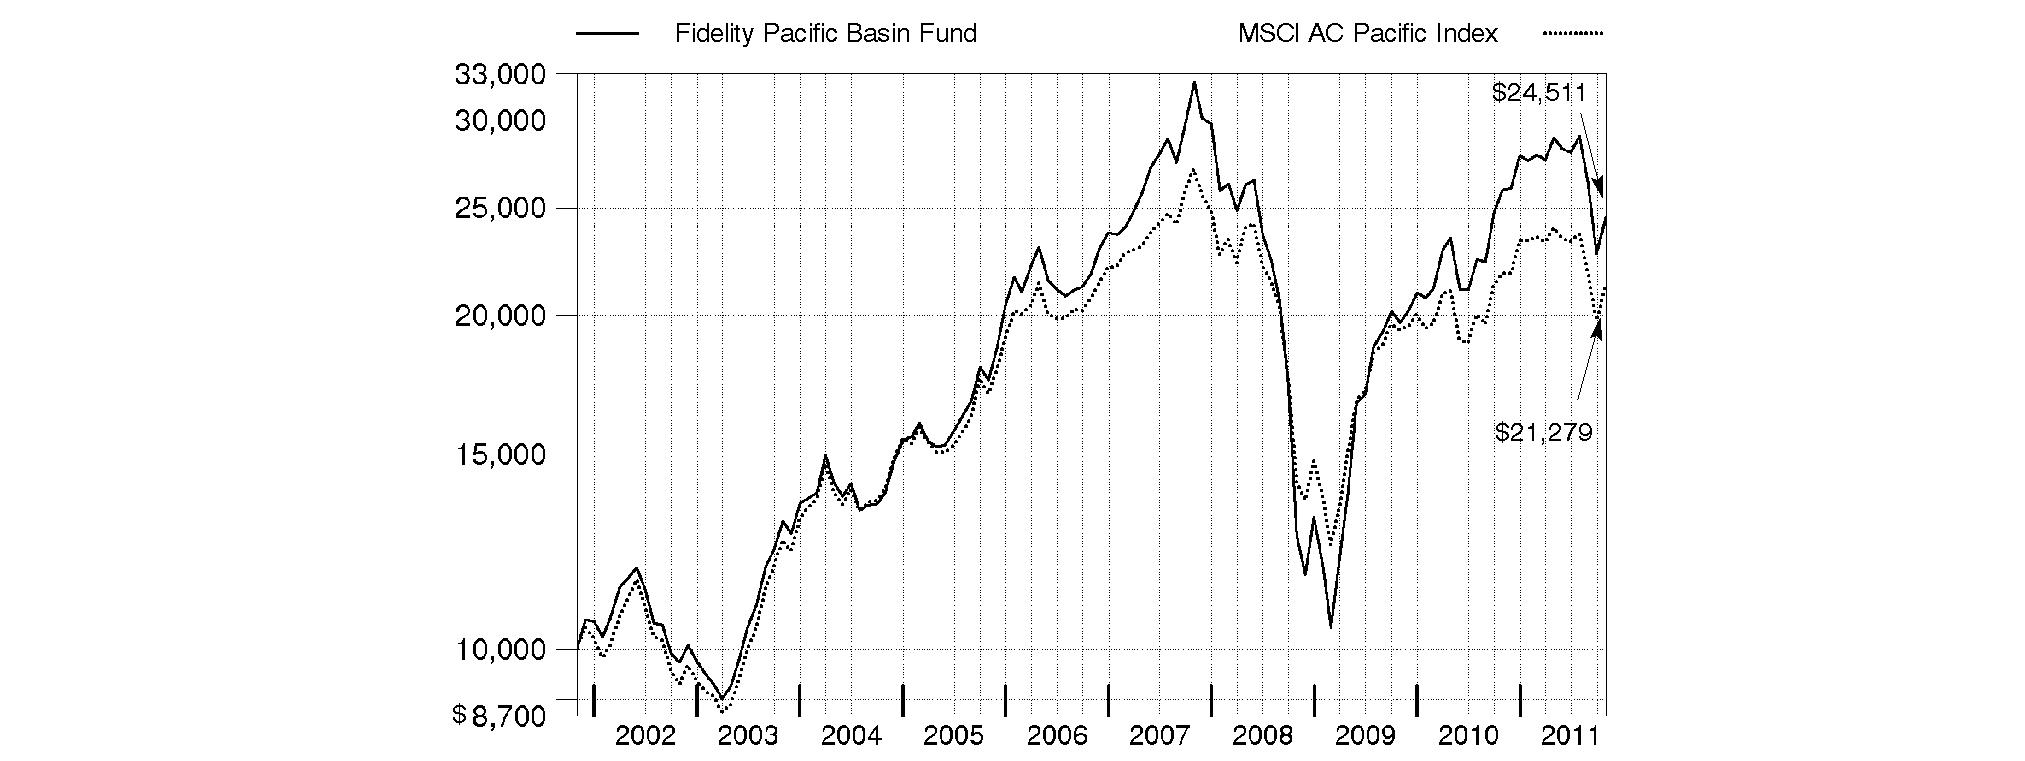
Annual Report
Fidelity Pacific Basin Fund
Market Recap: International equities were rocked by a number of headline events during the year ending October 31, 2011. Stocks posted a solid advance for the first half of the period, despite concern about the sovereign debt crisis in Europe, a devastating earthquake and tsunami in Japan, and political upheaval in the Middle East and North Africa. Sentiment turned decidedly negative in the second half, however, as fresh worries about Europe, inflation in China and a dimmed outlook for global growth caused foreign markets to suffer declines that intensified in August and September. October brought with it yet another dramatic swing, as eurozone policymakers appeared near a resolution to the debt debacle and buyers stormed back onto the scene in search of bargains. Still, those gains - along with favorable currency fluctuations overall - weren't enough to offset prior losses, and the MSCI® ACWI® (All Country World Index) ex USA Index finished the period down 4.56%. Within the MSCI index, Europe and emerging markets suffered the biggest declines, with many countries in these areas sustaining steep losses. By contrast, Japan showed resilience in the wake of its natural disasters, falling only 2%. Australia (+4%), Switzerland (+3%), the U.K. (+2%) and Canada, which produced a nominal return, were among the few major benchmark components to break into positive territory.
Comments from Dale Nicholls, Portfolio Manager of Fidelity® Pacific Basin Fund: For the year, the fund returned -5.44%, versus -2.55% for the MSCI® AC (All Country) Pacific Index. Geographically, the most negative influence on relative performance by far was China, where both stock picking and a large overweighting worked against the fund's results. A non-benchmark allocation to India also had a negative impact, as did security selection in Hong Kong and Taiwan. Among market sectors, unfavorable stock selection and industry weightings in consumer discretionary especially hampered performance. To a lesser extent, positioning in energy and pockets of information technology also hurt, along with an underweighting in telecommunication services. EVA Precision Industrial Holdings, a Hong Kong-based supplier of molded metal and plastic components for various industries, was the fund's largest individual detractor. Disruption of its Japanese customers' supply chains following that country's mid-March earthquake and tsunami hampered the company's stock. Other detractors included Chinese online gaming firm Perfect World, China's Ping An Insurance Group and Chinese online travel agent Ctrip.com International. Conversely, stock picking in Japan added five percentage points to relative performance. At the sector/industry level, stock picking among diversified financials was helpful, as it more than made up for a punitive overweighting in this weak-performing group. The fund also benefited from underweighting lagging utilities and from favorable positioning in materials and industrials. The largest individual contributor was Japanese online business incubator Digital Garage. The value of the company's investments in Twitter and other social media services was bolstered by Japan's earthquake, which prompted a surge in consumers' usage of social media. Also lifting performance was Indonesia-based AKR Corporindo, a distributor of petroleum and chemical products, and Japanese Internet services provider So-net Entertainment. All of the stocks I've mentioned, except for Ping An Insurance Group, were out-of-index positions.
The views expressed above reflect those of the portfolio manager(s) only through the end of the period as stated on the cover of this report and do not necessarily represent the views of Fidelity or any other person in the Fidelity organization. Any such views are subject to change at any time based upon market or other conditions and Fidelity disclaims any responsibility to update such views. These views may not be relied on as investment advice and, because investment decisions for a Fidelity fund are based on numerous factors, may not be relied on as an indication of trading intent on behalf of any Fidelity fund.
Annual Report
Fidelity Pacific Basin Fund
As a shareholder of the Fund, you incur two types of costs: (1) transaction costs, including redemption fees, and (2) ongoing costs, including management fees and other Fund expenses. This Example is intended to help you understand your ongoing costs (in dollars) of investing in the Fund and to compare these costs with the ongoing costs of investing in other mutual funds.
The Example is based on an investment of $1,000 invested at the beginning of the period and held for the entire period (May 1, 2011 to October 31, 2011).
Actual Expenses
The first line of the accompanying table provides information about actual account values and actual expenses. You may use the information in this line, together with the amount you invested, to estimate the expenses that you paid over the period. Simply divide your account value by $1,000.00 (for example, an $8,600 account value divided by $1,000.00 = 8.6), then multiply the result by the number in the first line under the heading entitled "Expenses Paid During Period" to estimate the expenses you paid on your account during this period. A small balance maintenance fee of $12.00 that is charged once a year may apply for certain accounts with a value of less than $2,000. This fee is not included in the table below. If it was, the estimate of expenses you paid during the period would be higher, and your ending account value lower, by this amount. In addition, the Fund, as a shareholder in the underlying Fidelity Central Funds, will indirectly bear its pro-rata share of the fees and expenses incurred by the underlying Fidelity Central Funds. These fees and expenses are not included in the Fund's annualized expense ratio used to calculate the expense estimate in the table below.
Hypothetical Example for Comparison Purposes
The second line of the accompanying table provides information about hypothetical account values and hypothetical expenses based on the Fund's actual expense ratio and an assumed rate of return of 5% per year before expenses, which is not the Fund's actual return. The hypothetical account values and expenses may not be used to estimate the actual ending account balance or expenses you paid for the period. You may use this information to compare the ongoing costs of investing in the Fund and other funds. To do so, compare this 5% hypothetical example with the 5% hypothetical examples that appear in the shareholder reports of the other funds. A small balance maintenance fee of $12.00 that is charged once a year may apply for certain accounts with a value of less than $2,000. This fee is not included in the table below. If it was, the estimate of expenses you paid during the period would be higher, and your ending account value lower, by this amount. In addition, the Fund, as a shareholder in the underlying Fidelity Central Funds, will indirectly bear its pro-rata share of the fees and expenses incurred by the underlying Fidelity Central Funds. These fees and expenses are not included in the Fund's annualized expense ratio used to calculate the expense estimate in the table below.
Please note that the expenses shown in the table are meant to highlight your ongoing costs only and do not reflect any transaction costs. Therefore, the second line of the table is useful in comparing ongoing costs only, and will not help you determine the relative total costs of owning different funds. In addition, if these transactional costs were included, your costs would have been higher.
| Annualized
Expense Ratio | Beginning
Account Value
May 1, 2011 | Ending
Account Value
October 31, 2011 | Expenses Paid
During Period*
May 1, 2011 to
October 31, 2011 |
Actual | 1.17% | $ 1,000.00 | $ 847.90 | $ 5.45 |
Hypothetical (5% return per year before expenses) | | $ 1,000.00 | $ 1,019.31 | $ 5.96 |
* Expenses are equal to the Fund's annualized expense ratio, multiplied by the average account value over the period, multiplied by 184/365 (to reflect the one-half year period).
Annual Report
Fidelity Pacific Basin Fund
Investment Changes (Unaudited)
Geographic Diversification (% of fund's net assets) |
As of October 31, 2011 |
| Japan | 37.1% | |
| Cayman Islands | 14.2% | |
| Australia | 8.4% | |
| Korea (South) | 7.9% | |
| China | 7.1% | |
| Bermuda | 5.5% | |
| Hong Kong | 3.4% | |
| India | 3.4% | |
| Indonesia | 3.3% | |
| Other | 9.7% | |

Percentages are adjusted for the effect of futures contracts, if applicable. |
As of April 30, 2011 |
| Japan | 33.2% | |
| Cayman Islands | 13.5% | |
| Australia | 9.1% | |
| China | 8.6% | |
| Korea (South) | 8.3% | |
| Bermuda | 5.5% | |
| India | 4.2% | |
| Hong Kong | 3.8% | |
| Indonesia | 3.6% | |
| Other | 10.2% | |

Percentages are adjusted for the effect of futures contracts, if applicable. |
Asset Allocation |
| % of fund's
net assets | % of fund's net assets
6 months ago |
Stocks | 99.9 | 98.3 |
Short-Term Investments and Net Other Assets | 0.1 | 1.7 |
Top Ten Stocks as of October 31, 2011 |
| % of fund's
net assets | % of fund's net assets
6 months ago |
ORIX Corp. (Japan, Diversified Financial Services) | 3.6 | 3.6 |
SOFTBANK CORP. (Japan, Wireless Telecommunication Services) | 1.9 | 2.3 |
Aeon Credit Service Co. Ltd. (Japan, Consumer Finance) | 1.8 | 1.5 |
EVA Precision Industrial Holdings Ltd. (Cayman Islands, Machinery) | 1.8 | 2.3 |
Biosensors International Group Ltd. (Bermuda, Health Care Equipment & Supplies) | 1.7 | 1.5 |
So-Net Entertainment Corp. (Japan, Internet Software & Services) | 1.5 | 1.5 |
Ping An Insurance Group Co. China Ltd. (H Shares) (China, Insurance) | 1.5 | 2.0 |
Baidu.com, Inc. sponsored ADR (China, Internet Software & Services) | 1.4 | 1.2 |
Daou Technology, Inc. (Korea (South), Internet Software & Services) | 1.4 | 1.0 |
China Mengniu Dairy Co. Ltd. (Cayman Islands, Food Products) | 1.4 | 1.1 |
| 18.0 | |
Market Sectors as of October 31, 2011 |
| % of fund's
net assets | % of fund's net assets
6 months ago |
Information Technology | 20.7 | 19.8 |
Industrials | 19.0 | 19.9 |
Financials | 17.6 | 18.8 |
Consumer Discretionary | 16.5 | 15.3 |
Materials | 7.1 | 10.5 |
Consumer Staples | 6.4 | 3.6 |
Health Care | 5.6 | 4.3 |
Energy | 2.8 | 2.4 |
Telecommunication Services | 2.4 | 2.7 |
Utilities | 1.8 | 1.0 |
Annual Report
Fidelity Pacific Basin Fund
Investments October 31, 2011
Showing Percentage of Net Assets
Common Stocks - 99.9% |
| Shares | | Value |
Australia - 8.4% |
Atlas Iron Ltd. | 711,228 | | $ 2,307,003 |
Austal Ltd. | 1,974,120 | | 4,694,980 |
Dart Energy Ltd. (a) | 4,322,903 | | 2,782,507 |
Goodman Group unit | 5,831,226 | | 3,789,732 |
Iluka Resources Ltd. | 252,666 | | 4,200,896 |
Imdex Ltd. | 1,220,094 | | 2,664,442 |
Linc Energy Ltd. | 853,741 | | 1,832,916 |
Macquarie Group Ltd. | 126,781 | | 3,264,448 |
MAp Group unit | 1,112,575 | | 3,970,366 |
Mesoblast Ltd. (a)(d) | 516,550 | | 4,392,125 |
Navitas Ltd. | 1,067,570 | | 4,624,122 |
Newcrest Mining Ltd. | 211,101 | | 7,461,407 |
Origin Energy Ltd. (d) | 572,732 | | 8,631,560 |
Paladin Energy Ltd. (Australia) (a) | 649,670 | | 992,223 |
realestate.com.au Ltd. | 240,124 | | 3,259,287 |
Wotif.com Holdings Ltd. (d) | 456,867 | | 1,760,677 |
TOTAL AUSTRALIA | | 60,628,691 |
Bermuda - 5.5% |
Aquarius Platinum Ltd. (Australia) | 508,067 | | 1,490,598 |
Biosensors International Group Ltd. (a) | 11,119,000 | | 12,390,603 |
Cheung Kong Infrastructure Holdings Ltd. | 397,000 | | 2,126,617 |
China Animal Healthcare Ltd. | 11,668,000 | | 2,614,971 |
China Singyes Solar Tech Holdings Ltd. | 2,285,000 | | 1,249,382 |
China Water Affairs Group Ltd. | 6,846,000 | | 1,966,372 |
G-Resources Group Ltd. (a) | 19,509,000 | | 1,176,691 |
GOME Electrical Appliances Holdings Ltd. | 5,982,000 | | 1,834,089 |
Huabao International Holdings Ltd. | 2,882,000 | | 1,830,813 |
Imagi International Holdings Ltd. (a) | 51,200,000 | | 1,337,317 |
Noble Group Ltd. | 3,013,527 | | 3,678,195 |
Texwinca Holdings Ltd. | 2,072,000 | | 2,625,046 |
Vtech Holdings Ltd. | 578,600 | | 5,402,560 |
TOTAL BERMUDA | | 39,723,254 |
Cayman Islands - 14.2% |
AirMedia Group, Inc. ADR (a)(d) | 667,800 | | 1,816,416 |
Airtac International Group | 492,000 | | 2,753,759 |
China Automation Group Ltd. | 5,211,000 | | 1,809,014 |
China High Precision Automation Group Ltd. | 4,875,000 | | 1,719,378 |
China Lilang Ltd. | 3,089,000 | | 3,251,572 |
China Mengniu Dairy Co. Ltd. | 3,110,000 | | 9,909,998 |
China Real Estate Information Corp. ADR (a)(d) | 361,700 | | 2,152,115 |
China ZhengTong Auto Services Holdings Ltd. | 3,000,000 | | 3,248,438 |
CNinsure, Inc. ADR (a)(d) | 178,700 | | 1,349,185 |
Ctrip.com International Ltd. sponsored ADR (a)(d) | 169,500 | | 5,908,770 |
Daphne International Holdings Ltd. | 3,308,000 | | 3,456,065 |
EVA Precision Industrial Holdings Ltd. | 50,196,000 | | 12,963,175 |
Fook Woo Group Holdings Ltd. (a) | 11,590,000 | | 2,189,979 |
|
| Shares | | Value |
GCL-Poly Energy Holdings Ltd. | 4,890,000 | | $ 1,578,472 |
Haitian International Holdings Ltd. | 2,664,000 | | 2,366,951 |
Jiayuan.com International Ltd. sponsored ADR (d) | 155,000 | | 1,607,350 |
Kingdee International Software Group Co. Ltd. | 6,925,513 | | 2,805,531 |
KongZhong Corp. sponsored ADR (a)(d) | 384,600 | | 1,969,152 |
Little Sheep Group Ltd. | 4,223,000 | | 2,735,515 |
Minth Group Ltd. | 3,792,000 | | 3,934,451 |
MStar Semiconductor, Inc. | 359,000 | | 2,080,451 |
Perfect World Co. Ltd. sponsored ADR Class B (a) | 216,775 | | 2,820,243 |
Qihoo 360 Technology Co. Ltd. ADR (d) | 95,700 | | 1,934,097 |
Shenguan Holdings Group Ltd. | 9,116,000 | | 4,897,622 |
Sino Biopharmaceutical Ltd. | 5,244,000 | | 1,597,405 |
SouFun Holdings Ltd. ADR (d) | 131,100 | | 1,672,836 |
Tencent Holdings Ltd. | 378,800 | | 8,760,727 |
Uni-President China Holdings Ltd. | 3,703,000 | | 2,200,906 |
VanceInfo Technologies, Inc. ADR (a)(d) | 176,700 | | 2,051,487 |
VisionChina Media, Inc. ADR (a)(d) | 708,000 | | 1,274,400 |
WuXi PharmaTech Cayman, Inc. sponsored ADR (a) | 240,300 | | 2,986,929 |
Xueda Education Group sponsored ADR | 286,300 | | 950,516 |
TOTAL CAYMAN ISLANDS | | 102,752,905 |
China - 7.1% |
51job, Inc. sponsored ADR (a)(d) | 75,400 | | 3,481,972 |
AMVIG Holdings Ltd. | 9,052,000 | | 5,647,984 |
Baidu.com, Inc. sponsored ADR (a)(d) | 72,300 | | 10,135,014 |
Beijing Jingkelong Co. Ltd. (H Shares) | 2,273,000 | | 2,219,971 |
China Metal Recycling (Holdings) Ltd. | 2,572,200 | | 2,754,047 |
Dalian Port (PDA) Co. Ltd. (H Shares) | 6,926,000 | | 1,770,679 |
People's Food Holdings Ltd. (a) | 4,276,000 | | 2,215,597 |
Ping An Insurance Group Co. China Ltd. (H Shares) | 1,485,000 | | 11,013,354 |
Royale Furniture Holdings Ltd. | 16,998,809 | | 5,144,523 |
Yantai Changyu Pioneer Wine Co. (B Shares) | 312,700 | | 3,518,184 |
Zhongpin, Inc. (a)(d) | 196,900 | | 1,817,387 |
Zijin Mining Group Co. Ltd. (H Shares) | 3,158,000 | | 1,344,139 |
TOTAL CHINA | | 51,062,851 |
Hong Kong - 3.4% |
China State Construction International Holdings Ltd. | 3,601,302 | | 2,773,675 |
China Unicom (Hong Kong) Ltd. | 1,818,000 | | 3,655,300 |
Convenience Retail Asia Ltd. | 2,000,000 | | 845,837 |
Magnificent Estates Ltd. | 56,182,000 | | 1,786,324 |
REXCAPITAL Financial Holdings Ltd. | 44,986,967 | | 3,128,538 |
Techtronic Industries Co. Ltd. | 5,713,000 | | 4,943,078 |
Tian An China Investments Co. Ltd. | 4,934,800 | | 2,606,386 |
Wharf Holdings Ltd. | 828,000 | | 4,404,336 |
YGM Trading Ltd. | 246,000 | | 577,391 |
TOTAL HONG KONG | | 24,720,865 |
Common Stocks - continued |
| Shares | | Value |
India - 3.4% |
CESC Ltd. GDR | 306,236 | | $ 1,726,015 |
Educomp Solutions Ltd. | 349,410 | | 1,931,918 |
Financial Technologies India Ltd. | 168,768 | | 2,528,837 |
Gateway Distriparks Ltd. | 697,430 | | 2,122,242 |
Geodesic Ltd. | 1,605,385 | | 1,932,029 |
Grasim Industries Ltd. | 59,043 | | 3,135,549 |
Indian Overseas Bank | 1,251,645 | | 2,623,084 |
IndusInd Bank Ltd. | 340,379 | | 2,075,321 |
INFO Edge India Ltd. | 175,376 | | 2,446,154 |
NIIT Ltd. | 2,270,534 | | 2,230,091 |
Reliance Industries Ltd. | 87,888 | | 1,573,960 |
TOTAL INDIA | | 24,325,200 |
Indonesia - 3.3% |
PT AKR Corporindo Tbk | 14,094,500 | | 4,768,042 |
PT Ciputra Development Tbk | 81,872,000 | | 4,488,957 |
PT Jasa Marga Tbk | 7,401,000 | | 3,189,900 |
PT Lippo Karawaci Tbk | 47,106,000 | | 3,377,281 |
PT Mitra Adiperkasa Tbk | 6,979,000 | | 3,843,763 |
PT Nippon Indosari Corpindo Tbk | 2,925,500 | | 1,119,348 |
PT United Tractors Tbk | 1,143,954 | | 3,146,495 |
TOTAL INDONESIA | | 23,933,786 |
Ireland - 0.7% |
James Hardie Industries NV CDI (a) | 748,779 | | 4,850,242 |
Japan - 37.1% |
Aeon Credit Service Co. Ltd. | 879,300 | | 13,114,567 |
Asahi Diamond Industrial Co. Ltd. | 210,100 | | 3,094,340 |
BLife Investment Corp. | 406 | | 2,312,563 |
Calbee, Inc. (d) | 62,000 | | 2,826,736 |
Chiyoda Corp. | 352,000 | | 4,054,049 |
Citizen Holdings Co. Ltd. | 393,500 | | 2,087,404 |
Credit Saison Co. Ltd. | 181,900 | | 3,550,026 |
DeNA Co. Ltd. | 126,800 | | 5,473,590 |
Digital Garage, Inc. (a)(d) | 983 | | 3,218,749 |
Fuji Heavy Industries Ltd. | 688,000 | | 4,361,269 |
Fuji Spinning Co. Ltd. (d) | 3,972,000 | | 7,721,672 |
Fujifilm Holdings Corp. | 192,300 | | 4,706,990 |
Fujitsu Ltd. | 780,000 | | 4,171,698 |
Glory Ltd. | 89,500 | | 1,915,908 |
GMO Internet, Inc. | 1,291,600 | | 5,567,721 |
Hamakyorex Co. Ltd. | 91,100 | | 2,606,808 |
Haseko Corp. (a) | 3,748,500 | | 2,356,922 |
Hikari Tsushin, Inc. | 120,500 | | 2,805,739 |
Honeys Co. Ltd. (d) | 253,340 | | 3,647,791 |
Horiba Ltd. | 106,800 | | 3,388,321 |
INPEX Corp. | 683 | | 4,509,799 |
ISE Chemical Corp. (d) | 456,000 | | 2,504,860 |
Japan Tobacco, Inc. | 1,529 | | 7,643,168 |
Kenedix Realty Investment Corp. | 2,783 | | 8,071,375 |
Kenedix, Inc. (a)(d) | 15,878 | | 2,354,203 |
Message Co. Ltd. | 1,416 | | 4,579,762 |
|
| Shares | | Value |
Micronics Japan Co. Ltd. (d) | 339,900 | | $ 1,959,605 |
MS&AD Insurance Group Holdings, Inc. | 355,700 | | 6,967,758 |
NEC Leasing Ltd. | 169,700 | | 2,434,159 |
Nihon M&A Center, Inc. | 669 | | 3,776,627 |
Nikon Corp. | 79,700 | | 1,784,798 |
Nippon Seiki Co. Ltd. | 684,000 | | 6,872,973 |
Nishimatsu Construction Co. Ltd. | 1,096,000 | | 1,800,609 |
Nitta Corp. | 471,800 | | 8,565,209 |
NTT Urban Development Co. | 6,101 | | 4,200,738 |
ORIX Corp. | 295,910 | | 25,828,929 |
Osaka Securities Exchange Co. Ltd. | 336 | | 1,574,719 |
Point, Inc. | 33,180 | | 1,431,307 |
Rakuten, Inc. | 3,800 | | 4,166,228 |
Rohto Pharmaceutical Co. Ltd. | 706,000 | | 8,134,117 |
Saizeriya Co. Ltd. | 329,200 | | 5,335,882 |
Sankyo Seiko Co. Ltd. | 925,400 | | 3,004,823 |
Shinsei Bank Ltd. | 3,011,000 | | 3,309,763 |
SHO-BOND Holdings Co. Ltd. | 128,800 | | 2,873,515 |
So-Net Entertainment Corp. | 2,788 | | 11,052,282 |
SOFTBANK CORP. | 413,900 | | 13,435,107 |
Sony Financial Holdings, Inc. | 365,700 | | 6,084,152 |
Tokyo Ohka Kogyo Co. Ltd. | 117,500 | | 2,441,957 |
Tomy Co. Ltd. | 242,900 | | 1,667,081 |
Toridoll Corp. | 566,000 | | 5,360,738 |
Toshiba Corp. | 775,000 | | 3,380,514 |
Toshiba Plant Systems & Services Corp. | 325,000 | | 3,474,753 |
Toyo Engineering Corp. | 882,000 | | 2,916,241 |
Toyo Tanso Co. Ltd. | 84,400 | | 3,916,661 |
Tsutsumi Jewelry Co. Ltd. | 74,600 | | 1,738,570 |
Yamato Kogyo Co. Ltd. | 234,600 | | 5,934,855 |
TOTAL JAPAN | | 268,070,700 |
Korea (South) - 7.9% |
Daou Technology, Inc. | 1,117,860 | | 10,036,485 |
Duksan Hi-Metal Co. Ltd. (a) | 289,894 | | 6,509,901 |
Grand Korea Leisure Co. Ltd. | 121,890 | | 2,163,311 |
Hana Financial Group, Inc. | 65,290 | | 2,323,679 |
Hyundai Home Shopping Network Corp. | 26,389 | | 2,765,342 |
KC Tech Co. Ltd. | 823,855 | | 3,775,986 |
Korea Electric Power Corp. (a) | 330,910 | | 7,382,244 |
Medy-Tox, Inc. | 62,683 | | 1,142,041 |
NHN Corp. (a) | 8,999 | | 1,870,374 |
Orion Corp. | 6,914 | | 3,695,417 |
Power Logics Co. Ltd. (a) | 343,039 | | 1,170,703 |
Samsung Electronics Co. Ltd. | 11,512 | | 9,873,265 |
TK Corp. (a) | 227,245 | | 4,192,005 |
TOTAL KOREA (SOUTH) | | 56,900,753 |
Malaysia - 2.1% |
IJM Land Bhd warrants 9/11/13 (a) | 116,970 | | 39,592 |
JobStreet Corp. Bhd | 7,040,150 | | 5,432,296 |
Lion Industries Corp. Bhd | 4,269,600 | | 2,110,632 |
Muhibbah Engineering (M) Bhd | 5,189,500 | | 2,036,723 |
RHB Capital Bhd | 695,100 | | 1,738,144 |
Common Stocks - continued |
| Shares | | Value |
Malaysia - continued |
Top Glove Corp. Bhd | 1,519,200 | | $ 2,109,292 |
WCT Bhd | 2,340,600 | | 1,971,651 |
TOTAL MALAYSIA | | 15,438,330 |
Philippines - 1.2% |
Alliance Global Group, Inc. | 25,222,542 | | 6,270,879 |
Universal Robina Corp. | 2,339,000 | | 2,578,468 |
TOTAL PHILIPPINES | | 8,849,347 |
Singapore - 2.4% |
CSE Global Ltd. | 7,480,500 | | 4,978,891 |
First (REIT) | 3,434,000 | | 2,167,197 |
Goodpack Ltd. | 6,355,000 | | 8,466,733 |
Goodpack Ltd. warrants 11/30/12 (a) | 2,233,800 | | 1,671,991 |
Tat Hong Holdings Ltd. warrants 8/2/13 (a) | 125,700 | | 1,916 |
TOTAL SINGAPORE | | 17,286,728 |
Taiwan - 2.1% |
104 Corp. | 479,000 | | 1,333,408 |
HTC Corp. | 43,000 | | 966,363 |
Lite-On Technology Corp. | 3,049,333 | | 2,877,468 |
Lung Yen Life Service Co. Ltd. | 353,000 | | 1,092,909 |
Pacific Hospital Supply Co. Ltd. | 441,000 | | 1,443,084 |
Tatung Co. Ltd. (a) | 6,233,204 | | 2,194,642 |
Tong Hsing Electronics Industries Ltd. | 1,243,096 | | 3,149,693 |
WPG Holding Co. Ltd. | 1,525,000 | | 1,841,444 |
TOTAL TAIWAN | | 14,899,011 |
Thailand - 0.6% |
TISCO Financial Group PCL | 1,040,100 | | 1,155,232 |
Toyo-Thai Corp. PCL | 7,448,100 | | 2,253,972 |
Toyo-Thai Corp. PCL NVDR | 3,829,000 | | 1,161,221 |
TOTAL THAILAND | | 4,570,425 |
|
| Shares | | Value |
United States of America - 0.5% |
ChinaCast Education Corp. (a)(d) | 351,000 | | $ 1,411,020 |
YOU On Demand Holdings, Inc. (a) | 33,005,100 | | 2,307,056 |
TOTAL UNITED STATES OF AMERICA | | 3,718,076 |
TOTAL COMMON STOCKS (Cost $684,498,278) |
721,731,164
|
Money Market Funds - 5.5% |
| | | |
Fidelity Securities Lending Cash Central Fund, 0.11% (b)(c)
(Cost $39,999,828) | 39,999,828 | |
39,999,828
|
TOTAL INVESTMENT PORTFOLIO - 105.4% (Cost $724,498,106) | | 761,730,992 |
NET OTHER ASSETS (LIABILITIES) - (5.4)% | | (39,277,688) |
NET ASSETS - 100% | $ 722,453,304 |
Legend |
(a) Non-income producing |
(b) Affiliated fund that is available only to investment companies and other accounts managed by Fidelity Investments. The rate quoted is the annualized seven-day yield of the fund at period end. A complete unaudited listing of the fund's holdings as of its most recent quarter end is available upon request. In addition, each Fidelity Central Fund's financial statements, which are not covered by the Fund's Report of Independent Registered Public Accounting Firm, are available on the SEC's website or upon request. |
(c) Investment made with cash collateral received from securities on loan. |
(d) Security or a portion of the security is on loan at period end. |
Affiliated Central Funds |
Information regarding fiscal year to date income earned by the Fund from investments in Fidelity Central Funds is as follows: |
Fund | Income earned |
Fidelity Cash Central Fund | $ 15,114 |
Fidelity Securities Lending Cash Central Fund | 744,050 |
Total | $ 759,164 |
Other Information |
The following is a summary of the inputs used, as of October 31, 2011, involving the Fund's assets and liabilities carried at fair value. The inputs or methodology used for valuing securities may not be an indication of the risk associated with investing in those securities. For more information on valuation inputs, and their aggregation into the levels used in the tables below, please refer to the Security Valuation section in the accompanying Notes to Financial Statements. |
Valuation Inputs at Reporting Date: |
Description | Total | Level 1 | Level 2 | Level 3 |
Investments in Securities: | | | | |
Equities: | | | | |
Japan | $ 268,070,700 | $ - | $ 268,070,700 | $ - |
Cayman Islands | 102,752,905 | 28,493,496 | 72,540,031 | 1,719,378 |
Australia | 60,628,691 | - | 60,628,691 | - |
Korea (South) | 56,900,753 | - | 56,900,753 | - |
China | 51,062,851 | 15,434,373 | 35,628,478 | - |
Bermuda | 39,723,254 | - | 39,723,254 | - |
Hong Kong | 24,720,865 | - | 24,720,865 | - |
India | 24,325,200 | - | 24,325,200 | - |
Indonesia | 23,933,786 | - | 23,933,786 | - |
Other | 69,612,159 | 12,567,423 | 57,044,736 | - |
Money Market Funds | 39,999,828 | 39,999,828 | - | - |
Total Investments in Securities: | $ 761,730,992 | $ 96,495,120 | $ 663,516,494 | $ 1,719,378 |
Transfers from Level 1 to Level 2 during the period were $479,841,352. |
The following is a reconciliation of Investments in Securities for which Level 3 inputs were used in determining value: |
Investments in Securities: | |
Beginning Balance | $ - |
Total Realized Gain (Loss) | - |
Total Unrealized Gain (Loss) | (1,387,540) |
Cost of Purchases | - |
Proceeds of Sales | - |
Amortization/Accretion | - |
Transfers in to Level 3 | 3,106,918 |
Transfers out of Level 3 | - |
Ending Balance | $ 1,719,378 |
The change in unrealized gain (loss) for the period attributable to Level 3 securities held at October 31, 2011 | $ (1,387,540) |
The information used in the above reconciliation represents fiscal year to date activity for any Investments in Securities identified as using Level 3 inputs at either the beginning or the end of the current fiscal period. Transfers in or out of Level 3 represent the beginning value of any Security or Instrument where a change in the pricing level occurred from the beginning to the end of the period. The cost of purchases and the proceeds of sales may include securities received or delivered through corporate actions or exchanges. Realized and unrealized gains (losses) disclosed in the reconciliation are included in Net Gain (Loss) on the Fund's Statement of Operations. |
Income Tax Information |
At October 31, 2011, the Fund had a capital loss carryforward of approximately $13,028,843 all of which will expire in fiscal 2017. Capital loss carryforwards are only available to offset future capital gains of the Fund to the extent provided by regulations and may be limited. |
See accompanying notes which are an integral part of the financial statements.
Annual Report
Fidelity Pacific Basin Fund
Statement of Assets and Liabilities
| October 31, 2011 |
| | |
Assets | | |
Investment in securities, at value (including securities loaned of $37,406,911) - See accompanying schedule: Unaffiliated issuers (cost $684,498,278) | $ 721,731,164 | |
Fidelity Central Funds (cost $39,999,828) | 39,999,828 | |
Total Investments (cost $724,498,106) | | $ 761,730,992 |
Receivable for investments sold | | 1,735,411 |
Receivable for fund shares sold | | 451,153 |
Dividends receivable | | 1,883,570 |
Distributions receivable from Fidelity Central Funds | | 105,102 |
Prepaid expenses | | 3,293 |
Other receivables | | 67,607 |
Total assets | | 765,977,128 |
| | |
Liabilities | | |
Payable to custodian bank | $ 209,413 | |
Payable for investments purchased | 338,819 | |
Payable for fund shares redeemed | 2,179,062 | |
Accrued management fee | 531,145 | |
Other affiliated payables | 168,483 | |
Other payables and accrued expenses | 97,074 | |
Collateral on securities loaned, at value | 39,999,828 | |
Total liabilities | | 43,523,824 |
| | |
Net Assets | | $ 722,453,304 |
Net Assets consist of: | | |
Paid in capital | | $ 715,620,104 |
Undistributed net investment income | | 2,372,302 |
Accumulated undistributed net realized gain (loss) on investments and foreign currency transactions | | (32,730,981) |
Net unrealized appreciation (depreciation) on investments and assets and liabilities in foreign currencies | | 37,191,879 |
Net Assets, for 31,465,616 shares outstanding | | $ 722,453,304 |
Net Asset Value, offering price and redemption price per share ($722,453,304 ÷ 31,465,616 shares) | | $ 22.96 |
Statement of Operations
| Year ended October 31, 2011 |
| | |
Investment Income | | |
Dividends | | $ 17,294,030 |
Interest | | 9 |
Income from Fidelity Central Funds | | 759,164 |
Income before foreign taxes withheld | | 18,053,203 |
Less foreign taxes withheld | | (1,126,794) |
Total income | | 16,926,409 |
| | |
Expenses | | |
Management fee
Basic fee | $ 6,274,565 | |
Performance adjustment | 970,065 | |
Transfer agent fees | 1,925,207 | |
Accounting and security lending fees | 426,536 | |
Custodian fees and expenses | 314,197 | |
Independent trustees' compensation | 4,903 | |
Registration fees | 54,818 | |
Audit | 87,434 | |
Legal | 3,764 | |
Interest | 1,664 | |
Miscellaneous | 8,649 | |
Total expenses before reductions | 10,071,802 | |
Expense reductions | (331,837) | 9,739,965 |
Net investment income (loss) | | 7,186,444 |
Realized and Unrealized Gain (Loss) Net realized gain (loss) on: | | |
Investment securities: | | |
Unaffiliated issuers | 80,950,728 | |
Foreign currency transactions | 89,028 | |
Total net realized gain (loss) | | 81,039,756 |
Change in net unrealized appreciation (depreciation) on: Investment securities (net of decrease in deferred foreign taxes of $571,786) | (130,736,729) | |
Assets and liabilities in foreign currencies | (101,131) | |
Total change in net unrealized appreciation (depreciation) | | (130,837,860) |
Net gain (loss) | | (49,798,104) |
Net increase (decrease) in net assets resulting from operations | | $ (42,611,660) |
See accompanying notes which are an integral part of the financial statements.
Annual Report
Fidelity Pacific Basin Fund
Financial Statements - continued
Statement of Changes in Net Assets
| Year ended
October 31,
2011 | Year ended
October 31,
2010 |
Increase (Decrease) in Net Assets | | |
Operations | | |
Net investment income (loss) | $ 7,186,444 | $ 6,603,265 |
Net realized gain (loss) | 81,039,756 | 59,127,875 |
Change in net unrealized appreciation (depreciation) | (130,837,860) | 122,328,582 |
Net increase (decrease) in net assets resulting from operations | (42,611,660) | 188,059,722 |
Distributions to shareholders from net investment income | (6,798,978) | (4,570,702) |
Distributions to shareholders from net realized gain | (22,436,616) | (21,329,936) |
Total distributions | (29,235,594) | (25,900,638) |
Share transactions
Proceeds from sales of shares | 325,706,660 | 278,700,546 |
Reinvestment of distributions | 27,290,655 | 23,912,533 |
Cost of shares redeemed | (396,071,405) | (237,343,251) |
Net increase (decrease) in net assets resulting from share transactions | (43,074,090) | 65,269,828 |
Redemption fees | 461,937 | 274,534 |
Total increase (decrease) in net assets | (114,459,407) | 227,703,446 |
| | |
Net Assets | | |
Beginning of period | 836,912,711 | 609,209,265 |
End of period (including undistributed net investment income of $2,372,302 and undistributed net investment income of $6,000,914, respectively) | $ 722,453,304 | $ 836,912,711 |
Other Information Shares | | |
Sold | 12,640,955 | 12,592,586 |
Issued in reinvestment of distributions | 1,082,533 | 1,189,087 |
Redeemed | (15,582,896) | (11,097,905) |
Net increase (decrease) | (1,859,408) | 2,683,768 |
See accompanying notes which are an integral part of the financial statements.
Annual Report
Financial Highlights
Years ended October 31, | 2011 | 2010 | 2009 | 2008 | 2007 |
Selected Per-Share Data | | | | | |
Net asset value, beginning of period | $ 25.11 | $ 19.88 | $ 12.84 | $ 37.32 | $ 27.36 |
Income from Investment Operations | | | | | |
Net investment income (loss) B | .21 | .21 | .20 | .22 | .22 |
Net realized and unrealized gain (loss) | (1.51) | 5.86 | 6.90 | (20.61) | 12.16 |
Total from investment operations | (1.30) | 6.07 | 7.10 | (20.39) | 12.38 |
Distributions from net investment income | (.20) | (.15) | (.07) | (.22) | (.16) |
Distributions from net realized gain | (.66) | (.70) | - | (3.88) | (2.27) |
Total distributions | (.86) | (.85) | (.07) | (4.10) | (2.43) |
Redemption fees added to paid in capital B | .01 | .01 | .01 | .01 | .01 |
Net asset value, end of period | $ 22.96 | $ 25.11 | $ 19.88 | $ 12.84 | $ 37.32 |
Total Return A | (5.44)% | 31.65% | 55.77% | (61.02)% | 48.86% |
Ratios to Average Net Assets C, E | | | | | |
Expenses before reductions | 1.14% | 1.07% | .90% | 1.22% | 1.19% |
Expenses net of fee waivers, if any | 1.13% | 1.07% | .90% | 1.22% | 1.19% |
Expenses net of all reductions | 1.10% | 1.03% | .85% | 1.17% | 1.13% |
Net investment income (loss) | .81% | .95% | 1.30% | .89% | .71% |
Supplemental Data | | | | | |
Net assets, end of period (000 omitted) | $ 722,453 | $ 836,913 | $ 609,209 | $ 392,393 | $ 1,266,514 |
Portfolio turnover rate D | 59% | 66% | 91% | 73% | 91% |
ATotal returns would have been lower if certain expenses had not been reduced during the applicable periods shown. BCalculated based on average shares outstanding during the period. CFees and expenses of any underlying Fidelity Central Funds are not included in the Fund's expense ratio. The Fund indirectly bears its proportionate share of the expenses of any underlying Fidelity Central Funds. DAmount does not include the portfolio activity of any underlying Fidelity Central Funds. EExpense ratios reflect operating expenses of the Fund. Expenses before reductions do not reflect amounts reimbursed by the investment adviser or reductions from brokerage service arrangements or reductions from other expense offset arrangements and do not represent the amount paid by the Fund during periods when reimbursements or reductions occur. Expenses net of fee waivers reflect expenses after reimbursement by the investment adviser but prior to reductions from brokerage service arrangements or other expense offset arrangements. Expenses net of all reductions represent the net expenses paid by the Fund. |
See accompanying notes which are an integral part of the financial statements.
Annual Report
Notes to Financial Statements
For the period ended October 31, 2011
1. Organization.
Fidelity Pacific Basin Fund (the Fund) is a fund of Fidelity Investment Trust (the Trust) and is authorized to issue an unlimited number of shares. The Trust is registered under the Investment Company Act of 1940, as amended (the 1940 Act), as an open-end management investment company organized as a Massachusetts business trust. The Fund's investments in emerging markets can be subject to social, economic, regulatory and political uncertainties and can be extremely volatile.
2. Investments in Fidelity Central Funds.
The Fund invests in Fidelity Central Funds, which are open-end investment companies available only to other investment companies and accounts managed by Fidelity Management & Research Company (FMR) and its affiliates. The Fund's Schedule of Investments lists each of the Fidelity Central Funds held as of period end, if any, as an investment of the Fund, but does not include the underlying holdings of each Fidelity Central Fund. As an Investing Fund, the Fund indirectly bears its proportionate share of the expenses of the underlying Fidelity Central Funds.
The Money Market Central Funds seek preservation of capital and current income and are managed by Fidelity Investments Money Management, Inc. (FIMM), an affiliate of FMR.
A complete unaudited list of holdings for each Fidelity Central Fund is available upon request or at the Securities and Exchange Commission (the SEC) web site at www.sec.gov. In addition, the financial statements of the Fidelity Central Funds, which are not covered by the Fund's Report of Independent Registered Public Accounting Firm are available on the SEC web site or upon request.
3. Significant Accounting Policies.
The financial statements have been prepared in conformity with accounting principles generally accepted in the United States of America (GAAP), which require management to make certain estimates and assumptions at the date of the financial statements. Actual results could differ from those estimates. Subsequent events, if any, through the date that the financial statements were issued have been evaluated in the preparation of the financial statements. The following summarizes the significant accounting policies of the Fund:
Security Valuation. Investments are valued as of 4:00 p.m. Eastern time on the last calendar day of the period. The Fund uses independent pricing services approved by the Board of Trustees to value its investments. When current market prices or quotations are not readily available or reliable, valuations may be determined in good faith in accordance with procedures adopted by the Board of Trustees. Factors used in determining value may include market or security specific events. The frequency with which these procedures are used cannot be predicted and they may be utilized to a significant extent. The value used for net asset value (NAV) calculation under these procedures may differ from published prices for the same securities.
The Fund categorizes the inputs to valuation techniques used to value its investments into a disclosure hierarchy consisting of three levels as shown below:
Level 1 - quoted prices in active markets for identical investments
Level 2 - other significant observable inputs (including quoted prices for similar investments, interest rates, prepayment speeds, etc.)
Level 3 - unobservable inputs (including the Fund's own assumptions based on the best information available)
Changes in valuation techniques may result in transfers in or out of an assigned level within the disclosure hierarchy. The aggregate value of investments by input level, as of October 31, 2011, as well as a roll forward of Level 3 securities, is included at the end of the Fund's Schedule of Investments. Valuation techniques used to value the Fund's investments by major category are as follows:
Equity securities, including restricted securities, for which market quotations are readily available, are valued at the last reported sale price or official closing price as reported by an independent pricing service on the primary market or exchange on which they are traded and are categorized as Level 1 in the hierarchy. In the event there were no sales during the day or closing prices are not available, securities are valued at the last quoted bid price or may be valued using the last available price and are generally categorized as Level 2 in the hierarchy. For foreign equity securities, when significant market or security specific events arise, comparisons to the valuation of American Depositary Receipts (ADRs), futures contracts, Exchange-traded funds (ETFs) and certain indexes as well as quoted prices for similar securities are used and are categorized as Level 2 in the hierarchy in these circumstances. Utilizing these techniques may result in transfers between Level 1 and Level 2. For restricted equity securities and private placements where observable inputs are limited, assumptions about market activity and risk are used and are categorized as Level 3 in the hierarchy.
Investments in open-end mutual funds, including the Fidelity Central Funds, are valued at their closing net asset value each business day and are categorized as Level 1 in the hierarchy.
Annual Report
Notes to Financial Statements - continued
3. Significant Accounting Policies - continued
Foreign Currency. The Fund may use foreign currency contracts to facilitate transactions in foreign-denominated securities. Gains and losses from these transactions may arise from changes in the value of the foreign currency or if the counterparties do not perform under the contracts' terms.
Foreign-denominated assets, including investment securities, and liabilities are translated into U.S. dollars at the exchange rate at period end. Purchases and sales of investment securities, income and dividends received and expenses denominated in foreign currencies are translated into U.S. dollars at the exchange rate in effect on the transaction date.
The effects of exchange rate fluctuations on investments are included with the net realized and unrealized gain (loss) on investment securities. Other foreign currency transactions resulting in realized and unrealized gain (loss) are disclosed separately.
Investment Transactions and Income. For financial reporting purposes, the Fund's investment holdings and NAV include trades executed through the end of the last business day of the period. The NAV per share for processing shareholder transactions is calculated as of the close of business of the New York Stock Exchange (NYSE), normally 4:00 p.m. Eastern time and includes trades executed through the end of the prior business day. Gains and losses on securities sold are determined on the basis of identified cost. Dividend income is recorded on the ex-dividend date, except for certain dividends from foreign securities where the ex-dividend date may have passed, which are recorded as soon as the Fund is informed of the ex-dividend date. Non-cash dividends included in dividend income, if any, are recorded at the fair market value of the securities received. Distributions received on securities that represent a return of capital or capital gain are recorded as a reduction of cost of investments and/or as a realized gain. The Fund estimates the components of distributions received that may be considered return of capital distributions or capital gain distributions. Interest income and distributions from the Fidelity Central Funds are accrued as earned. Interest income includes coupon interest and amortization of premium and accretion of discount on debt securities. Investment income is recorded net of foreign taxes withheld where recovery of such taxes is uncertain.
Expenses. Expenses directly attributable to a fund are charged to that fund. Expenses attributable to more than one fund are allocated among the respective funds on the basis of relative net assets or other appropriate methods. Expense estimates are accrued in the period to which they relate and adjustments are made when actual amounts are known.
Income Tax Information and Distributions to Shareholders. Each year, the Fund intends to qualify as a regulated investment company, including distributing substantially all of its taxable income and realized gains under Subchapter M of the Internal Revenue Code and filing its U.S. federal tax return. As a result, no provision for income taxes is required. As of October 31, 2011, the Fund did not have any unrecognized tax benefits in the financial statements. A fund's federal tax return is subject to examination by the Internal Revenue Service (IRS) for a period of three years. Foreign taxes are provided for based on the Fund's understanding of the tax rules and rates that exist in the foreign markets in which it invests.
Distributions are declared and recorded on the ex-dividend date. Income and capital gain distributions are determined in accordance with income tax regulations, which may differ from GAAP. In addition, the Fund claimed a portion of the payment made to redeeming shareholders as a distribution for income tax purposes.
Capital accounts within the financial statements are adjusted for permanent book-tax differences. These adjustments have no impact on net assets or the results of operations. Temporary book-tax differences will reverse in a subsequent period.
Book-tax differences are primarily due to foreign currency transactions, certain foreign taxes, passive foreign investment companies (PFIC), deferred trustees compensation, capital loss carryforwards and losses deferred due to wash sales.
The federal tax cost of investment securities and unrealized appreciation (depreciation) as of period end were as follows:
Gross unrealized appreciation | $ 126,497,368 |
Gross unrealized depreciation | (111,425,895) |
Net unrealized appreciation (depreciation) on securities and other investments | $ 15,071,473 |
| |
Tax Cost | $ 746,659,519 |
The tax-based components of distributable earnings as of period end were as follows:
Undistributed ordinary income | $ 4,831,929 |
Capital loss carryforward | $ (13,028,843) |
Net unrealized appreciation (depreciation) | $ 15,030,466 |
Under the recently enacted Regulated Investment Company Modernization Act of 2010 (the Act), the Fund will be permitted to carry forward capital losses incurred in taxable years beginning after December 22, 2010 for an unlimited period. However, any losses incurred during those future taxable years will be required to be utilized prior to any losses incurred in pre-enactment taxable years, which generally expire after eight years from when they
Annual Report
3. Significant Accounting Policies - continued
Income Tax Information and Distributions to Shareholders - continued
are incurred. Additionally, post-enactment capital losses that are carried forward will retain their character as either short-term or long-term capital losses rather than being considered all short-term as under previous law. The Fund's first fiscal year end subject to the Act will be October 31, 2012.
The tax character of distributions paid was as follows:
| October 31, 2011 | October 31, 2010 |
Ordinary Income | $ 29,235,594 | $ 25,900,638 |
Short-Term Trading (Redemption) Fees. Shares held by investors in the Fund less than 90 days are subject to a redemption fee equal to 1.50% of the net asset value of shares redeemed. All redemption fees, which reduce the proceeds of the shareholder redemption, are retained by the Fund and accounted for as an addition to paid in capital.
New Accounting Pronouncement. In May 2011, the Financial Accounting Standards Board issued Accounting Standard Update No. 2011-04, Fair Value Measurement (Topic 820) - Amendments to Achieve Common Fair Value Measurement and Disclosure Requirements in U.S. GAAP and IFRSs. The update changes the wording used to describe the requirements in GAAP for measuring fair value and for disclosing information about fair value measurements. The update is effective during interim and annual periods beginning after December 15, 2011. Management is currently evaluating the impact of the update's adoption on the Fund's financial statement disclosures.
4. Purchases and Sales of Investments.
Purchases and sales of securities, other than short-term securities, aggregated $518,678,117 and $571,054,720, respectively.
5. Fees and Other Transactions with Affiliates.
Management Fee. FMR and its affiliates provide the Fund with investment management related services for which the Fund pays a monthly management fee. The management fee is the sum of an individual fund fee rate that is based on an annual rate of .45% of the Fund's average net assets and a group fee rate that averaged .26% during the period. The group fee rate is based upon the average net assets of all the mutual funds advised by FMR. The group fee rate decreases as assets under management increase and increases as assets under management decrease. In addition, the management fee is subject to a performance adjustment (up to a maximum of ± .20% of the Fund's average net assets over a 36 month performance period). The upward or downward adjustment to the management fee is based on the Fund's relative investment performance as compared to an appropriate benchmark index. For the period, the total annual management fee rate, including the performance adjustment, was .82% of the Fund's average net assets.
Transfer Agent Fees. Fidelity Investments Institutional Operations Company, Inc. (FIIOC), an affiliate of FMR, is the Fund's transfer, dividend disbursing and shareholder servicing agent. FIIOC receives account fees and asset-based fees that vary according to account size and type of account. FIIOC pays for typesetting, printing and mailing of shareholder reports, except proxy statements. For the period, the transfer agent fees were equivalent to an annual rate of .22% of average net assets.
Accounting and Security Lending Fees. Fidelity Service Company, Inc. (FSC), an affiliate of FMR, maintains the Fund's accounting records. The accounting fee is based on the level of average net assets for the month. Under a separate contract, FSC administers the security lending program. The security lending fee is based on the number and duration of lending transactions.
Brokerage Commissions. The Fund placed a portion of its portfolio transactions with brokerage firms which are affiliates of the investment adviser. The commissions paid to these affiliated firms were $1,204 for the period.
Interfund Lending Program. Pursuant to an Exemptive Order issued by the SEC, the Fund, along with other registered investment companies having management contracts with FMR, may participate in an interfund lending program. This program provides an alternative credit facility allowing the funds to borrow from, or lend money to, other participating affiliated funds. At period end, there were no interfund loans outstanding. The Fund's activity in this program during the period for which loans were outstanding was as follows:
Borrower or Lender | Average Daily
Loan Balance | Weighted Average
Interest Rate | Interest
Expense |
Borrower | $ 7,585,750 | .39% | $ 1,664 |
Annual Report
Notes to Financial Statements - continued
6. Committed Line of Credit.
The Fund participates with other funds managed by FMR or an affiliate in a $4.0 billion credit facility (the "line of credit") to be utilized for temporary or emergency purposes to fund shareholder redemptions or for other short-term liquidity purposes. The Fund has agreed to pay commitment fees on its pro-rata portion of the line of credit, which amounted to $2,770 and is reflected in Miscellaneous expenses on the Statement of Operations. During the period, there were no borrowings on this line of credit.
7. Security Lending.
The Fund lends portfolio securities through a lending agent from time to time in order to earn additional income. For equity securities, a lending agent is used and may loan securities to certain qualified borrowers, including Fidelity Capital Markets (FCM), a broker-dealer affiliated with the Fund. On the settlement date of the loan, the Fund receives collateral (in the form of U.S. Treasury obligations, letters of credit and/or cash) against the loaned securities and maintains collateral in an amount not less than 100% of the market value of the loaned securities during the period of the loan. The market value of the loaned securities is determined at the close of business of the Fund and any additional required collateral is delivered to the Fund on the next business day. If the borrower defaults on its obligation to return the securities loaned because of insolvency or other reasons, a fund could experience delays and costs in recovering the securities loaned or in gaining access to the collateral. Any cash collateral received is invested in the Fidelity Securities Lending Cash Central Fund. The value of loaned securities and cash collateral at period end are disclosed on the Fund's Statement of Assets and Liabilities. Security lending income represents the income earned on investing cash collateral, less rebates paid to borrowers and any lending agent fees associated with the loan, plus any premium payments received for lending certain types of securities. Security lending income is presented in the Statement of Operations as a component of income from Fidelity Central Funds. Total security lending income during the period amounted to $744,050, including $1,573 from securities loaned to FCM.
8. Expense Reductions.
FMR voluntarily agreed to reimburse a portion of its management fee. For the period, the amount of this reimbursement was $107,324.
Many of the brokers with whom FMR places trades on behalf of the Fund provided services to the Fund in addition to trade execution. These services included payments of certain expenses on behalf of the Fund totaling $224,513 for the period.
9. Other.
The Fund's organizational documents provide former and current trustees and officers with a limited indemnification against liabilities arising in connection with the performance of their duties to the Fund. In the normal course of business, the Fund may also enter into contracts that provide general indemnifications. The Fund's maximum exposure under these arrangements is unknown as this would be dependent on future claims that may be made against the Fund. The risk of material loss from such claims is considered remote.
Annual Report
Report of Independent Registered Public Accounting Firm
To the Trustees of Fidelity Investment Trust and the Shareholders of:
Fidelity Canada Fund,
Fidelity China Region Fund,
Fidelity Emerging Asia Fund,
Fidelity Emerging Markets Fund,
Fidelity Europe Fund,
Fidelity Japan Fund,
Fidelity Japan Smaller Companies Fund,
Fidelity Latin America Fund,
Fidelity Nordic Fund,
Fidelity Pacific Basin Fund
In our opinion, the accompanying statements of assets and liabilities, including the schedules of investments, and the related statements of operations and of changes in net assets and the financial highlights present fairly, in all material respects, the financial position of Fidelity Canada Fund, Fidelity China Region Fund, Fidelity Emerging Asia Fund, Fidelity Emerging Markets Fund, Fidelity Europe Fund, Fidelity Japan Fund, Fidelity Japan Smaller Companies Fund, Fidelity Latin America Fund, Fidelity Nordic Fund, Fidelity Pacific Basin Fund (each a fund of Fidelity Investment Trust) at October 31, 2011, the results of each of their operations for the year then ended, the changes in each of their net assets for each of the two years in the period then ended and the financial highlights for each of the periods indicated, in conformity with accounting principles generally accepted in the United States of America. These financial statements and financial highlights (hereafter referred to as "financial statements") are the responsibility of the Fidelity Investment Trust's management. Our responsibility is to express an opinion on these financial statements based on our audits. We conducted our audits of these financial statements in accordance with the standards of the Public Company Accounting Oversight Board (United States). Those standards require that we plan and perform the audit to obtain reasonable assurance about whether the financial statements are free of material misstatement. An audit includes examining, on a test basis, evidence supporting the amounts and disclosures in the financial statements, assessing the accounting principles used and significant estimates made by management, and evaluating the overall financial statement presentation. We believe that our audits, which included confirmation of securities at October 31, 2011 by correspondence with the custodian and brokers, provide a reasonable basis for our opinion.
PricewaterhouseCoopers LLP
Boston, Massachusetts
December 16, 2011
Annual Report
Report of Independent Registered Public Accounting Firm
To the Trustees of Fidelity Investment Trust and Shareholders of Fidelity Europe Capital Appreciation Fund:
We have audited the accompanying statement of assets and liabilities of Fidelity Europe Capital Appreciation Fund (the Fund), a fund of Fidelity Investment Trust, including the schedule of investments, as of October 31, 2011, and the related statement of operations for the year then ended, the statement of changes in net assets for each of the two years in the period then ended, and the financial highlights for each of the five years in the period then ended. These financial statements and financial highlights are the responsibility of the Fund's management. Our responsibility is to express an opinion on these financial statements and financial highlights based on our audits.
We conducted our audits in accordance with the standards of the Public Company Accounting Oversight Board (United States). Those standards require that we plan and perform the audit to obtain reasonable assurance about whether the financial statements and financial highlights are free of material misstatement. The Fund is not required to have, nor were we engaged to perform, an audit of its internal control over financial reporting. Our audits included consideration of internal control over financial reporting as a basis for designing audit procedures that are appropriate in the circumstances, but not for the purpose of expressing an opinion on the effectiveness of the Fund's internal control over financial reporting. Accordingly, we express no such opinion. An audit also includes examining, on a test basis, evidence supporting the amounts and disclosures in the financial statements, assessing the accounting principles used and significant estimates made by management, as well as evaluating the overall financial statement presentation. Our procedures included confirmation of securities owned as of October 31, 2011, by correspondence with the custodians and brokers; where replies were not received from brokers, we performed other auditing procedures. We believe that our audits provide a reasonable basis for our opinion.
In our opinion, the financial statements and financial highlights referred to above present fairly, in all material respects, the financial position of Fidelity Europe Capital Appreciation Fund as of October 31, 2011, the results of its operations for the year then ended, the changes in its net assets for each of the two years in the period then ended, and the financial highlights for each of the five years in the period then ended, in conformity with accounting principles generally accepted in the United States of America.
DELOITTE & TOUCHE LLP
Boston, Massachusetts
December 16, 2011
Annual Report
The Trustees, Members of the Advisory Board, and executive officers of the trust and funds, as applicable, are listed below. The Board of Trustees governs each fund and is responsible for protecting the interests of shareholders. The Trustees are experienced executives who meet periodically throughout the year to oversee each fund's activities, review contractual arrangements with companies that provide services to each fund, oversee management of the risks associated with such activities and contractual arrangements, and review each fund's performance. Except for James C. Curvey, each of the Trustees oversees 226 funds advised by FMR or an affiliate. Mr. Curvey oversees 429 funds advised by FMR or an affiliate.
The Trustees hold office without limit in time except that (a) any Trustee may resign; (b) any Trustee may be removed by written instrument, signed by at least two-thirds of the number of Trustees prior to such removal; (c) any Trustee who requests to be retired or who has become incapacitated by illness or injury may be retired by written instrument signed by a majority of the other Trustees; and (d) any Trustee may be removed at any special meeting of shareholders by a two-thirds vote of the outstanding voting securities of the trust. Each Trustee who is not an interested person (as defined in the 1940 Act) (Independent Trustee), shall retire not later than the last day of the calendar year in which his or her 75th birthday occurs. The Independent Trustees may waive this mandatory retirement age policy with respect to individual Trustees. The executive officers and Advisory Board Members hold office without limit in time, except that any officer and Advisory Board Member may resign or may be removed by a vote of a majority of the Trustees at any regular meeting or any special meeting of the Trustees. Except as indicated, each individual has held the office shown or other offices in the same company for the past five years.
Experience, Skills, Attributes, and Qualifications of the Funds' Trustees. The Governance and Nominating Committee has adopted a statement of policy that describes the experience, qualifications, attributes, and skills that are necessary and desirable for potential Independent Trustee candidates (Statement of Policy). The Board believes that each Trustee satisfied at the time he or she was initially elected or appointed a Trustee, and continues to satisfy, the standards contemplated by the Statement of Policy. The Governance and Nominating Committee also engages professional search firms to help identify potential Independent Trustee candidates who have the experience, qualifications, attributes, and skills consistent with the Statement of Policy. From time to time, additional criteria based on the composition and skills of the current Independent Trustees, as well as experience or skills that may be appropriate in light of future changes to board composition, business conditions, and regulatory or other developments, have also been considered by the professional search firms and the Governance and Nominating Committee. In addition, the Board takes into account the Trustees' commitment and participation in Board and committee meetings, as well as their leadership of standing and ad hoc committees throughout their tenure.
In determining that a particular Trustee was and continues to be qualified to serve as a Trustee, the Board has considered a variety of criteria, none of which, in isolation, was controlling. The Board believes that, collectively, the Trustees have balanced and diverse experience, qualifications, attributes, and skills, which allow the Board to operate effectively in governing each fund and protecting the interests of shareholders. Information about the specific experience, skills, attributes, and qualifications of each Trustee, which in each case led to the Board's conclusion that the Trustee should serve (or continue to serve) as a trustee of the funds, is provided below.
Board Structure and Oversight Function. James C. Curvey is an interested person (as defined in the 1940 Act) and currently serves as Acting Chairman. The Trustees have determined that an interested Chairman is appropriate and benefits shareholders because an interested Chairman has a personal and professional stake in the quality and continuity of services provided to the funds. Independent Trustees exercise their informed business judgment to appoint an individual of their choosing to serve as Chairman, regardless of whether the Trustee happens to be independent or a member of management. The Independent Trustees have determined that they can act independently and effectively without having an Independent Trustee serve as Chairman and that a key structural component for assuring that they are in a position to do so is for the Independent Trustees to constitute a substantial majority for the Board. The Independent Trustees also regularly meet in executive session. Ned C. Lautenbach serves as Chairman of the Independent Trustees and as such (i) acts as a liaison between the Independent Trustees and management with respect to matters important to the Independent Trustees and (ii) with management prepares agendas for Board meetings.
Fidelity funds are overseen by different Boards of Trustees. The funds' Board oversees Fidelity's equity and high income funds and another Board oversees Fidelity's investment-grade bond, money market, and asset allocation funds. The asset allocation funds may invest in Fidelity funds overseen by the funds' Board. The use of separate Boards, each with its own committee structure, allows the Trustees of each group of Fidelity funds to focus on the unique issues of the funds they oversee, including common research, investment, and operational issues. On occasion, the separate Boards establish joint committees to address issues of overlapping consequences for the Fidelity funds overseen by each Board.
The Trustees operate using a system of committees to facilitate the timely and efficient consideration of all matters of importance to the Trustees, each fund, and fund shareholders and to facilitate compliance with legal and regulatory requirements and oversight of the funds' activities and associated risks. The Board, acting through its committees, has charged FMR and its affiliates with (i) identifying events or circumstances the occurrence of which could have demonstrably adverse effects on the funds' business and/or reputation; (ii) implementing processes and controls to lessen the possibility that such events or circumstances occur or to mitigate the effects of such events or circumstances if they do occur; and (iii) creating and maintaining a system designed to evaluate continuously business and market conditions in order to facilitate the identification and implementation processes described in (i) and (ii) above. Because the day-to-day operations and activities of the funds are carried out by or through FMR, its affiliates and other service providers, the funds' exposure to risks is mitigated but not eliminated by the processes overseen by the Trustees. While each of the Board's committees has responsibility for overseeing different aspects of the funds' activities, oversight is exercised primarily through the Operations, Audit, and Compliance Committees. In addition, the Independent Trustees have worked with FMR to enhance the Board's oversight of investment and financial risks, legal and regulatory risks, technology risks, and operational risks, including the development of additional risk reporting to the Board. For example, a working group comprised of Independent Trustees and FMR has worked and continues to work to review the Fidelity funds' valuation-related activities, reporting and risk management. Appropriate personnel, including but not limited to the funds' Chief Compliance Officer (CCO), FMR's internal auditor, the independent accountants, the funds' Treasurer and portfolio management personnel, make periodic reports to the Board's committees, as appropriate, including an annual review of FMR's risk management program for the Fidelity funds. The responsibilities of each standing committee, including their oversight responsibilities, are described further under "Standing Committees of the Funds' Trustees."
Annual Report
The funds' Statement of Additional Information (SAI) includes more information about the Trustees. To request a free copy, call Fidelity at 1-800-544-8544.
Interested Trustees*:
Correspondence intended for each Trustee who is an interested person may be sent to Fidelity Investments, 82 Devonshire Street, Boston, Massachusetts 02109.
Name, Age; Principal Occupations and Other Relevant Experience+ |
James C. Curvey (76) |
| Year of Election or Appointment: 2007 Mr. Curvey is Trustee and Acting Chairman of the Board of Trustees of certain Trusts. Mr. Curvey also serves as Trustee (2007-present) of other investment companies advised by FMR. Mr. Curvey is a Director of Fidelity Investments Money Management, Inc. (2009-present), Director of Fidelity Research & Analysis Co. (2009-present) and Director of FMR and FMR Co., Inc. (2007-present). Mr. Curvey is also Vice Chairman (2007-present) and Director of FMR LLC. In addition, Mr. Curvey serves as an Overseer for the Boston Symphony Orchestra and a member of the Trustees of Villanova University. Previously, Mr. Curvey was the Vice Chairman (2006-2007) and Director (2000-2007) of FMR Corp. |
Ronald P. O'Hanley (54) |
| Year of Election or Appointment: 2011 Mr. O'Hanley is Director of FMR Co., Inc. (2010-present), Director of Fidelity Investments Money Management, Inc. (2010-present), Director of Fidelity Research & Analysis Company (2010-present), President of Fidelity Asset Management and Corporate Services and a member of Fidelity's Executive Committee (2010-present). Previously, Mr. O'Hanley served as President and Chief Executive Officer of BNY Mellon Asset Management (2007-2010). Mr. O'Hanley also served as Vice Chairman of Bank New York Mellon Corp. and a member of that firm's Executive Committee. Prior to the 2007 merger of The Bank of New York and Mellon Financial Corporation, he was Vice Chairman of Mellon Financial Corporation and President and Chief Executive Officer of Mellon Asset Management. He joined Mellon in February 1997. Mr. O'Hanley currently serves as Chairman of the Boston Public Library Foundation Board of Directors and sits on the Board of Directors of Beth Israel Deaconess Medical Center, the Board of Trustees of the Marine Biological Laboratory and the Advisory Board of the Maxwell School of Citizenship and Public Administration at Syracuse University. Mr. O'Hanley also chairs the Council on Asset Management for the Financial Services Roundtable and is a member of the Board of Directors of Institutional Investor's U.S. Institute. |
* Trustees have been determined to be "Interested Trustees" by virtue of, among other things, their affiliation with the trust or various entities under common control with FMR.
+ The information above includes each Trustee's principal occupation during the last five years and other information relating to the experience, attributes, and skills relevant to each Trustee's qualifications to serve as a Trustee, which led to the conclusion that each Trustee should serve as a Trustee for each fund.
Independent Trustees:
Correspondence intended for each Independent Trustee (that is, the Trustees other than the Interested Trustees) may be sent to Fidelity Investments, P.O. Box 55235, Boston, Massachusetts 02205-5235.
Name, Age; Principal Occupations and Other Relevant Experience+ |
Dennis J. Dirks (63) |
| Year of Election or Appointment: 2005 Prior to his retirement in May 2003, Mr. Dirks was Chief Operating Officer and a member of the Board of The Depository Trust & Clearing Corporation (DTCC). He also served as President, Chief Operating Officer, and Board member of The Depository Trust Company (DTC) and President and Board member of the National Securities Clearing Corporation (NSCC). In addition, Mr. Dirks served as Chief Executive Officer and Board member of the Government Securities Clearing Corporation, Chief Executive Officer and Board member of the Mortgage-Backed Securities Clearing Corporation, as a Trustee and a member of the Finance Committee of Manhattan College (2005-2008), and as a Trustee and a member of the Finance Committee of AHRC of Nassau County (2006-2008). Mr. Dirks is a member of the Independent Directors Council (IDC) Governing Council (2010-Present) and Board of Directors for The Brookville Center for Children's Services, Inc. (2009-present). |
Alan J. Lacy (58) |
| Year of Election or Appointment: 2008 Mr. Lacy serves as Senior Adviser (2007-present) of Oak Hill Capital Partners, L.P. (private equity). Mr. Lacy also served as Chief Executive Officer (2000-2005) and Vice Chairman (2005-2006) of Sears Holdings Corporation and Sears, Roebuck and Co. (retail). In addition, Mr. Lacy serves as a member of the Board of Directors of Dave & Buster's, Inc. (restaurant and entertainment complexes, 2010-present), The Hillman Companies, Inc. (hardware wholesalers, 2010-present), and Bristol-Myers Squibb Company (global pharmaceuticals, 2007-present). Mr. Lacy is a member of the Board of Trustees of The National Parks Conservation Association (2006-Present). Previously, Mr. Lacy served as Chairman of the Board of Trustees of the National Parks Conservation Association (2008-2011) and as a member of the Board of Directors for the Western Union Company (global money transfer, 2006-2011). |
Ned C. Lautenbach (67) |
| Year of Election or Appointment: 2000 Mr. Lautenbach is Chairman of the Independent Trustees of the Equity and High Income Funds (2006-present). Mr. Lautenbach currently serves as the Lead Director of the Eaton Corporation Board of Directors (diversified industrial, 1997-present). Mr. Lautenbach is also a member of the Board of Directors of the Philharmonic Center for the Arts in Naples, Florida (1999-present); a member of the Board of Trustees of Fairfield University (2005-present); and a member of the Council on Foreign Relations (1994-present). Previously, Mr. Lautenbach was a Partner/Advisory Partner at Clayton, Dubilier & Rice, LLC (private equity investment, 1998-2010), as well as a Director of Sony Corporation (2006-2007). |
Joseph Mauriello (67) |
| Year of Election or Appointment: 2008 Prior to his retirement in January 2006, Mr. Mauriello served in numerous senior management positions including Deputy Chairman and Chief Operating Officer (2004-2005), and Vice Chairman of Financial Services (2002-2004) of KPMG LLP US (professional services, 1965-2005). Mr. Mauriello currently serves as a member of the Board of Directors of XL Group plc. (global insurance and re-insurance, 2006-present) and of Arcadia Resources Inc. (health care services and products, 2007-present). Previously, Mr. Mauriello served as a Director of the Hamilton Funds of the Bank of New York (2006-2007). |
Robert W. Selander (61) |
| Year of Election or Appointment: 2011 Previously, Mr. Selander served as a Member of the Advisory Board of Fidelity's Equity and High Income Funds (2011), Executive Vice Chairman (2010), Chief Executive Officer (2009-2010), and President and Chief Executive Officer (1997-2009) of Mastercard, Inc. |
Cornelia M. Small (67) |
| Year of Election or Appointment: 2005 Ms. Small is a member of the Board of Directors of the Teagle Foundation (2009-present). Ms. Small is also a member of the Investment Committee, and Chair (2008-present) and a member of the Board of Trustees of Smith College. In addition, Ms. Small serves on the Investment Committee of the Berkshire Taconic Community Foundation (2008-present). Previously, Ms. Small served as Chairperson of the Investment Committee (2002-2008) of Smith College. In addition, Ms. Small served as Chief Investment Officer, Director of Global Equity Investments, and a member of the Board of Directors of Scudder, Stevens & Clark and Scudder Kemper Investments. |
William S. Stavropoulos (72) |
| Year of Election or Appointment: 2001 Mr. Stavropoulos is Vice Chairman of the Independent Trustees of the Equity and High Income Funds (2006-present). Mr. Stavropoulos serves as President and Founder of the Michigan Baseball Foundation, the Great Lakes Loons (2007-present). Mr. Stavropoulos is Chairman Emeritus of the Board of Directors of The Dow Chemical Company, where he previously served in numerous senior management positions, including President, CEO (1995-2000; 2002-2004), Chairman of the Executive Committee (2000-2006), and as a member of the Board of Directors (1990-2006). Currently, Mr. Stavropoulos is Chairman of Univar (global distributor of commodity and specialty chemicals, 2010-present), a Director of Teradata Corporation (data warehousing and technology solutions, 2008-present), Chemical Financial Corporation, Maersk Inc. (industrial conglomerate), Tyco International, Inc. (multinational manufacturing and services, 2007-present), and a member of the Advisory Board for Metalmark Capital (private equity investment, 2005-present). Mr. Stavropoulos is a special advisor to Clayton, Dubilier & Rice, LLC (private equity investment). In addition, Mr. Stavropoulos is a member of the University of Notre Dame Advisory Council for the College of Science. |
David M. Thomas (62) |
| Year of Election or Appointment: 2008 Previously, Mr. Thomas served as Executive Chairman (2005-2006) and Chairman and Chief Executive Officer (2000-2005) of IMS Health, Inc. (pharmaceutical and healthcare information solutions). In addition, Mr. Thomas serves as a member of the Board of Directors of Fortune Brands, Inc. (consumer products), and Interpublic Group of Companies, Inc. (marketing communication, 2004-present). |
Michael E. Wiley (61) |
| Year of Election or Appointment: 2008 Mr. Wiley also serves as a Director of Asia Pacific Exploration Consolidated (international oil and gas exploration and production, 2008-present). Mr. Wiley serves as a Director of Tesoro Corporation (independent oil refiner and marketer, 2005-present), and a Director of Bill Barrett Corporation (exploration and production, 2005-present). In addition, Mr. Wiley also serves as a Director of Post Oak Bank (privately-held bank, 2004-present). Previously, Mr. Wiley served as a member of the Board of Trustees of the University of Tulsa (2000-2006; 2007-2010), as a Senior Energy Advisor of Katzenbach Partners, LLC (consulting, 2006-2007), as an Advisory Director of Riverstone Holdings (private investment), Chairman, President, and CEO of Baker Hughes, Inc. (oilfield services, 2000-2004), and as Director of Spinnaker Exploration Company (exploration and production, 2001-2005). |
+ The information above includes each Trustee's principal occupation during the last five years and other information relating to the experience, attributes, and skills relevant to each Trustee's qualifications to serve as a Trustee, which led to the conclusion that each Trustee should serve as a Trustee for each fund.
Advisory Board Members and Executive Officers:
Correspondence intended for each executive officer, Edward C. Johnson 3d, and Peter S. Lynch, may be sent to Fidelity Investments, 82 Devonshire Street, Boston, Massachusetts 02109.
Name, Age; Principal Occupation |
Edward C. Johnson 3d (81) |
| Year of Election or Appointment: 2011 Member of the Advisory Board of Fidelity's Equity and High Income Funds. Mr. Johnson serves as Chief Executive Officer, Chairman, and a Director of FMR LLC, and also serves as Chairman and Director of FIL Limited. Previously, Mr. Johnson served as a Trustee and Chairman of the Board of certain Fidelity Trusts, Chairman and a Director of FMR, Chairman and a Director of FMR Co., Inc., and President of FMR LLC (2006-2007). |
Peter S. Lynch (67) |
| Year of Election or Appointment: 2003 Member of the Advisory Board of Fidelity's Equity and High Income Funds. Mr. Lynch is Vice Chairman and a Director of FMR and FMR Co., Inc. In addition, Mr. Lynch serves as a Trustee of Boston College and as the Chairman of the Inner-City Scholarship Fund. Previously, Mr. Lynch served on the Special Olympics International Board of Directors (1997-2006). |
Kenneth B. Robins (42) |
| Year of Election or Appointment: 2008 President and Treasurer of Fidelity's Equity and High Income Funds. Mr. Robins also serves as President and Treasurer (2010-present) and Assistant Treasurer (2009-present) of other Fidelity funds and is an employee of Fidelity Investments (2004-present). Previously, Mr. Robins served as Deputy Treasurer of the Fidelity funds (2005-2008) and Treasurer and Chief Financial Officer of The North Carolina Capital Management Trust: Cash and Term Portfolios (2006-2008). |
Bruce T. Herring (46) |
| Year of Election or Appointment: 2006 Vice President of certain Equity Funds. Mr. Herring also serves as Chief Investment Officer and Director of Fidelity Management & Research (U.K.) Inc. (2010-present) and Group Chief Investments Officer of FMR. Previously, Mr. Herring served as Vice President (2005-2006) and Senior Vice President (2006-2007) of Fidelity Management & Research Company, Vice President of FMR Co., Inc. (2001-2007) and as a portfolio manager for Fidelity U.S. Equity Funds. |
Brian B. Hogan (47) |
| Year of Election or Appointment: 2009 Vice President of Equity and High Income Funds. Mr. Hogan also serves as President of FMR's Equity Division (2009-present). Previously, Mr. Hogan served as Senior Vice President, Equity Research of FMR (2006-2009) and as a portfolio manager. |
Scott C. Goebel (43) |
| Year of Election or Appointment: 2008 Secretary and Chief Legal Officer (CLO) of the Fidelity funds. Mr. Goebel also serves as Secretary of Fidelity Investments Money Management, Inc. (FIMM) (2010-present) and Fidelity Research and Analysis Company (FRAC) (2010-present); Secretary and CLO of The North Carolina Capital Management Trust: Cash and Term Portfolios (2008-present); General Counsel, Secretary, and Senior Vice President of FMR (2008-present) and FMR Co., Inc. (2008-present); employed by FMR LLC or an affiliate (2001-present); Chief Legal Officer of Fidelity Management & Research (Hong Kong) Limited (2008-present) and Assistant Secretary of Fidelity Management & Research (Japan) Inc. (2008-present), and Fidelity Management & Research (U.K.) Inc. (2008-present). Previously, Mr. Goebel served as Assistant Secretary of FIMM (2008-2010), FRAC (2008-2010), and the Funds (2007-2008) and as Vice President and Secretary of Fidelity Distributors Corporation (FDC) (2005-2007). |
William C. Coffey (42) |
| Year of Election or Appointment: 2009 Assistant Secretary of Fidelity's Equity and High Income Funds. Mr. Coffey also serves as Senior Vice President and Deputy General Counsel of FMR LLC (2010-present), and is an employee of Fidelity Investments. Previously, Mr. Coffey served as Vice President and Associate General Counsel of FMR LLC (2005-2009). |
Holly C. Laurent (57) |
| Year of Election or Appointment: 2008 Anti-Money Laundering (AML) Officer of the Fidelity funds. Ms. Laurent also serves as AML Officer of The North Carolina Capital Management Trust: Cash and Term Portfolios (2008-present) and is an employee of Fidelity Investments. Previously, Ms. Laurent was Senior Vice President and Head of Legal for Fidelity Business Services India Pvt. Ltd. (2006-2008), and Senior Vice President, Deputy General Counsel and Group Head for FMR LLC (2005-2006). |
Christine Reynolds (53) |
| Year of Election or Appointment: 2008 Chief Financial Officer of the Fidelity funds. Ms. Reynolds became President of Fidelity Pricing and Cash Management Services (FPCMS) in August 2008. Ms. Reynolds served as Chief Operating Officer of FPCMS (2007-2008). Previously, Ms. Reynolds served as President, Treasurer, and Anti-Money Laundering officer of the Fidelity funds (2004-2007). |
Kenneth A. Rathgeber (64) |
| Year of Election or Appointment: 2004 Chief Compliance Officer of Fidelity's Equity and High Income Funds. Mr. Rathgeber is Chief Compliance Officer of Fidelity Management & Research (Hong Kong) Limited (2008-present), Fidelity Management & Research (Japan) Inc. (2008-present), FMR (2005-present), FMR Co., Inc. (2005-present), Fidelity Management & Research (U.K.) Inc. (2005-present), Fidelity Research & Analysis Company (2005-present), Fidelity Investments Money Management, Inc. (2005-present), Pyramis Global Advisors, LLC (2005-present), and Strategic Advisers, Inc. (2005-present). |
Jeffrey S. Christian (50) |
| Year of Election or Appointment: 2009 Deputy Treasurer of the Fidelity funds. Mr. Christian is an employee of Fidelity Investments. Previously, Mr. Christian served as Chief Financial Officer (2008-2009) of certain Fidelity funds and Senior Vice President of Fidelity Pricing and Cash Management Services (FPCMS) (2004-2009). |
Joseph F. Zambello (54) |
| Year of Election or Appointment: 2011 Deputy Treasurer of the Fidelity funds. Mr. Zambello is an employee of Fidelity Investments. Previously, Mr. Zambello served as Vice President of FMR's Program Management Group (2009-2011) and Vice President of the Transfer Agent Oversight Group (2005-2009). |
Adrien E. Deberghes (44) |
| Year of Election or Appointment: 2008 Deputy Treasurer of Fidelity's Equity and High Income Funds. Mr. Deberghes also serves as Vice President and Assistant Treasurer of Fidelity Rutland Square Trust II and Fidelity Commonwealth Trust II (2011-present), Assistant Treasurer of other Fidelity funds (2010-present), and is an employee of Fidelity Investments (2008-present). Previously, Mr. Deberghes served as Senior Vice President of Mutual Fund Administration at State Street Corporation (2007-2008), Senior Director of Mutual Fund Administration at Investors Bank & Trust (2005-2007), and Director of Finance for Dunkin' Brands (2000-2005). |
Stephanie J. Dorsey (42) |
| Year of Election or Appointment: 2010 Assistant Treasurer of Fidelity's Equity and High Income Funds. Ms. Dorsey also serves as Deputy Treasurer of other Fidelity funds (2008-present) and is an employee of Fidelity Investments (2008-present). Previously, Ms. Dorsey served as Treasurer (2004-2008) of the JPMorgan Mutual Funds and Vice President (2004-2008) of JPMorgan Chase Bank. |
John R. Hebble (53) |
| Year of Election or Appointment: 2009 Assistant Treasurer of Fidelity's Equity and High Income Funds. Mr. Hebble also serves as President (2011-present), Treasurer, and Chief Financial Officer of The North Carolina Capital Management Trust: Cash and Term Portfolios (2008-present), President and Treasurer of other Fidelity funds (2008-present) and is an employee of Fidelity Investments. |
Gary W. Ryan (53) |
| Year of Election or Appointment: 2005 Assistant Treasurer of the Fidelity funds. Mr. Ryan is an employee of Fidelity Investments. Previously, Mr. Ryan served as Vice President of Fund Reporting in Fidelity Pricing and Cash Management Services (FPCMS) (1999-2005). |
Jonathan Davis (43) |
| Year of Election or Appointment: 2010 Assistant Treasurer of the Fidelity funds. Mr. Davis is also Assistant Treasurer of Fidelity Rutland Square Trust II and Fidelity Commonwealth Trust II. Mr. Davis is an employee of Fidelity Investments. Previously, Mr. Davis served as Vice President and Associate General Counsel of FMR LLC (2003-2010). |
Annual Report
The Board of Trustees of each fund voted to pay to shareholders of record at the opening of business on record date, the following distributions per share derived from capital gains realized from sales of portfolio securities, and dividends derived from net investment income:
| Pay Date | Record Date | Dividends | Capital Gains |
Fidelity Canada Fund | 12/05/11 | 12/02/11 | $0.491 | $0.289 |
Fidelity China Region Fund | 12/05/11 | 12/02/11 | $0.287 | $0.339 |
Fidelity Emerging Markets Fund | 12/05/11 | 12/02/11 | $0.302 | $0.000 |
Fidelity Europe Fund | 12/05/11 | 12/02/11 | $0.595 | $0.017 |
Fidelity Europe Capital Appreciation Fund | 12/05/11 | 12/02/11 | $0.361 | $0.007 |
Fidelity Japan Fund | 12/12/11 | 12/09/11 | $0.159 | $0.052 |
Fidelity Japan Smaller Companies Fund | 12/05/11 | 12/02/11 | $0.078 | $0.031 |
Fidelity Latin America Fund | 12/05/11 | 12/02/11 | $0.806 | $0.000 |
Fidelity Nordic Fund | 12/05/11 | 12/02/11 | $0.609 | $0.000 |
Fidelity Pacific Basin Fund | 12/05/11 | 12/02/11 | $0.103 | $0.084 |
Fidelity Emerging Asia Fund | 12/05/11 | 12/02/11 | $0.513 | $0.000 |
The funds hereby designate as capital gain dividend the amounts noted below for the taxable year ended October 31, 2011, or, if subsequently determined to be different, the net capital gain of such year.
Fidelity China Region Fund | $30,167,882 |
A percentage of the dividends distributed during the fiscal year for the following funds may be taken into account as a dividend for purposes of the maximum rate under section 1(h)(11) of the Internal Revenue Code.
| December 3, 2010 | December 10, 2010 | December 30, 2010 |
Fidelity Canada Fund | 45% | - | 100% |
Fidelity China Region Fund | 48% | - | - |
Fidelity Emerging Markets Fund | 93% | - | - |
Fidelity Europe Fund | 100% | - | - |
Fidelity Europe Capital Appreciation Fund | 100% | - | 100% |
Fidelity Japan Fund | - | 87% | - |
Fidelity Japan Fund: Class F | - | 78% | - |
Fidelity Japan Smaller Companies Fund | 91% | - | - |
Fidelity Latin America Fund | 39% | - | 92% |
Fidelity Nordic Fund | 82% | - | - |
Fidelity Pacific Basin Fund | 23% | - | - |
Fidelity Emerging Asia Fund | 51% | - | - |
Annual Report
The amounts per share which represent income derived from sources within, and taxes paid to, foreign countries or possessions of the United States are as follows:
Fund | Pay Date | Income | Taxes |
Fidelity Canada Fund | 12/06/2010 | $0.689 | $0.0770 |
Fidelity Canada Fund | 12/31/2010 | $0.007 | $0.0000 |
Fidelity China Region Fund | 12/06/2010 | $0.463 | $0.0624 |
Fidelity Emerging Markets Fund | 12/06/2010 | $0.303 | $0.0586 |
Fidelity Europe Fund | 12/06/2010 | $0.797 | $0.1325 |
Fidelity Europe Capital Appreciation Fund | 12/06/2010 | $0.206 | $0.0310 |
Fidelity Europe Capital Appreciation Fund | 12/31/2010 | $0.010 | $0.0000 |
Fidelity Japan Fund | 12/13/2010 | $0.155 | $0.0286 |
Fidelity Japan Fund: Class F | 12/13/2010 | $0.171 | $0.0286 |
Fidelity Japan Smaller Companies Fund | 12/06/2010 | $0.061 | $0.0098 |
Fidelity Latin America Fund | 12/06/2010 | $0.395 | $0.0538 |
Fidelity Latin America Fund | 12/31/2010 | $0.023 | $0.0000 |
Fidelity Nordic Fund | 12/06/2010 | $0.331 | $0.0458 |
Fidelity Pacific Basin Fund | 12/06/2010 | $0.269 | $0.0209 |
Fidelity Emerging Asia Fund | 12/06/2010 | $0.536 | $0.0812 |
The fund will notify shareholders in January 2012 of amounts for use in preparing 2011 income tax returns.
Annual Report
A special meeting of Fidelity Emerging Asia Fund (formerly Fidelity Southeast Asia Fund) shareholders was held on November 16, 2010. The results of votes taken among shareholders on the proposals before them are reported below. Each vote reported represents one dollar of net asset value held on the record date for the meeting.
PROPOSAL 1 |
To approve a change in the performance adjustment index for the fund. |
| # of
Votes | % of
Votes |
Affirmative | 762,743,251.15 | 89.962 |
Against | 54,698,229.87 | 6.451 |
Abstain | 24,743,409.13 | 2.919 |
Uninstructed | 5,663,975.59 | 0.668 |
TOTAL | 847,848,865.74 | 100.000 |
PROPOSAL 2 |
To authorize the Trustees to change the performance adjustment index for the fund in the future without a shareholder vote. |
| # of
Votes | % of
Votes |
Affirmative | 604,723,907.38 | 71.324 |
Against | 207,016,787.49 | 24.417 |
Abstain | 30,444,195.28 | 3.591 |
Uninstructed | 5,663,975.59 | 0.668 |
TOTAL | 847,848,865.74 | 100.000 |
Annual Report
Board Approval of Investment Advisory Contracts and Management Fees
Targeted International Equity Funds
Each year, the Board of Trustees, including the Independent Trustees (together, the Board), votes on the renewal of the management contract and sub-advisory agreements (together, the Advisory Contracts) for each fund. The Board, assisted by the advice of fund counsel and Independent Trustees' counsel, requests and considers a broad range of information relevant to the renewal of the Advisory Contracts throughout the year.
The Board meets regularly and considers at each of its meetings factors that are relevant to its annual consideration of the renewal of each fund's Advisory Contracts, including the services and support provided to each fund and its shareholders. The Board has established various standing committees, each composed of Independent Trustees with varying backgrounds, to which the Board has assigned specific subject matter responsibilities in order to enhance effective decision-making by the Board. The Board, acting directly and through its Committees, requests and receives information concerning the annual consideration of the renewal of each fund's Advisory Contracts. The Board also meets as needed to consider matters specifically related to the Board's annual consideration of the renewal of Advisory Contracts. Members of the Board may also meet with trustees of other Fidelity funds through ad hoc joint committees to discuss certain matters relevant to the Fidelity funds.
At its July 2011 meeting, the Board of Trustees, including the Independent Trustees, unanimously determined to renew each fund's Advisory Contracts. In reaching its determination, the Board considered all factors it believed relevant, including (i) the nature, extent, and quality of the services to be provided to each fund and its shareholders (including the investment performance of each fund); (ii) the competitiveness of each fund's management fee and total expense ratio; (iii) the total costs of the services to be provided by and the profits to be realized by Fidelity from its relationship with each fund; (iv) the extent to which economies of scale would be realized as each fund grows; and (v) whether fee levels reflect these economies of scale, if any, for the benefit of fund shareholders.
In considering whether to renew the Advisory Contracts for each fund, the Board reached a determination, with the assistance of fund counsel and Independent Trustees' counsel and through the exercise of its business judgment, that the renewal of the Advisory Contracts is in the best interests of each fund and its shareholders and that the compensation payable under the Advisory Contracts is fair and reasonable. The Board's decision to renew the Advisory Contracts was not based on any single factor, but rather was based on a comprehensive consideration of all the information provided to the Board at its meetings throughout the year. The Board, in reaching its determination to renew the Advisory Contracts, is aware that shareholders in each fund have a broad range of investment choices available to them, including a wide choice among mutual funds offered by Fidelity's competitors, and that each fund's shareholders, who have the opportunity to review and weigh the disclosure provided by the fund in its prospectus and other public disclosures, have chosen to invest in that fund, managed by Fidelity.
Nature, Extent, and Quality of Services Provided. The Board considered the staffing within the investment adviser, FMR, and the sub-advisers (together, the Investment Advisers), including the backgrounds of the funds' investment personnel and the funds' investment objectives and disciplines. The Independent Trustees also had discussions with senior management of Fidelity's investment operations and investment groups. The Board considered the structure of the portfolio manager compensation program and whether this structure provides appropriate incentives to act in the best interests of each fund.
Resources Dedicated to Investment Management and Support Services. The Board and the Fund Oversight and Research Committees reviewed the general qualifications and capabilities of the Investment Advisers' investment staff, including its size, education, experience, and resources, as well as the Investment Advisers' approach to recruiting, training, managing, and compensating investment personnel. The Board also noted that FMR has devoted increased resources to non-U.S. offices. The Board noted that Fidelity's analysts have extensive resources, tools and capabilities which allow them to conduct sophisticated quantitative and fundamental analysis, as well as credit analysis of issuers, counterparties and enhancers. The Board also believes that Fidelity's investment professionals have sufficient access to global information and data so as to provide competitive investment results over time, and that those professionals also have access to sophisticated tools which permit them to assess portfolio construction and risk and performance attribution characteristics continuously, as well as to transmit new information and research conclusions rapidly around the world. Additionally, in their deliberations, the Board considered the Investment Advisers' trading capabilities and resources which are an integral part of the investment management process.
Shareholder and Administrative Services. The Board considered (i) the nature, extent, quality, and cost of advisory, administrative, and shareholder services performed by the Investment Advisers and their affiliates under the Advisory Contracts and under separate agreements covering transfer agency, pricing and bookkeeping, and securities lending services for each fund; (ii) the nature and extent of the investment adviser's supervision of third party service providers, principally custodians and subcustodians; and (iii) the resources devoted to, and the record of compliance with, each fund's compliance policies and procedures. The Board also reviewed the allocation of fund brokerage, including allocations to brokers affiliated with the Investment Advisers, the use of brokerage commissions to pay fund expenses, and the use of "soft" commission dollars to pay for research services.
The Board noted that the growth of fund assets over time across the complex allows Fidelity to reinvest in the development of services designed to enhance the value or convenience of the Fidelity funds as investment vehicles. These services include 24-hour access to account information and market information through telephone representatives and over the Internet, investor education materials and asset allocation tools, and the expanded availability of Fidelity Investor Centers, with 35 new branches opening since 2010.
Annual Report
Board Approval of Investment Advisory Contracts and Management Fees - continued
Investment in a Large Fund Family. The Board considered the benefits to shareholders of investing in a Fidelity fund, including the benefits of investing in a fund that is part of a large family of funds offering a variety of investment disciplines and providing a large variety of mutual fund investor services. The Board noted that Fidelity had taken, or had made recommendations that resulted in the Fidelity funds taking, a number of actions over the previous year that benefited particular funds, including (i) continuing to dedicate additional resources to investment research and support of the senior management team that oversees asset management; (ii) rationalizing product lines through the mergers of six funds into other funds; (iii) continuing to migrate the Freedom Funds to dedicated lower cost underlying funds; (iv) obtaining shareholder approval to broaden the investment strategies for Fidelity Consumer Finance Portfolio, Fidelity Emerging Asia Fund, and Fidelity Environment and Alternative Energy Portfolio; (v) contractually agreeing to reduce the management fees and impose other expense limitations on Spartan 500 Index Fund and U.S. Bond Index Fund in connection with launching new institutional classes of these funds; (vi) changing the name, primary and supplemental benchmarks, and investment policies of Fidelity Global Strategies Fund to support the fund's flexible investment mandate and global orientation; and (vii) reducing the transfer agency account fee rates on certain accounts.
Investment Performance (Canada Fund, China Region Fund, Emerging Asia Fund, Japan Smaller Companies Fund, Latin America Fund, Nordic Fund, and Pacific Basin Fund). The Board considered whether each fund has operated in accordance with its investment objective, as well as its record of compliance with its investment restrictions. It also reviewed each fund's absolute investment performance (for each class, in the case of Canada Fund and China Region Fund, and for the retail class, in the case of Latin America Fund), as well as each fund's relative investment performance (for each class, in the case of Canada Fund and China Region Fund, and for the retail class, in the case of Latin America Fund) measured over multiple periods against a broad-based securities market index. The Board noted that FMR does not believe that a meaningful peer group exists against which to compare either fund's performance.
For each of Canada Fund and China Region Fund, the following charts considered by the Board show, over the one-, three-, and five-year periods ended December 31, 2010, as available, the cumulative total returns of the retail class and Class B of the fund and the cumulative total returns of a broad-based securities market index ("benchmark"). The returns of the retail class and Class B show the performance of the highest performing class (based on five-year performance) and the lowest performing class (based on three-year performance for Canada Fund and one-year performance for China Region Fund), respectively.
For each of Emerging Asia Fund, Japan Smaller Companies Fund, Nordic Fund, and Pacific Basin Fund, the following charts considered by the Board show, over the one-, three-, and five-year periods ended December 31, 2010, the fund's cumulative total returns and the cumulative total returns of a broad-based securities market index ("benchmark").
For Latin America Fund, the following charts considered by the Board show, over the one-, three-, and five-year periods ended December 31, 2010, the cumulative total returns of the retail class of the fund and the cumulative total returns of a broad-based securities market index ("benchmark"). (The Advisor classes of the fund had less than one year of performance as of December 31, 2010.)
Fidelity Canada Fund

The Board noted that the investment performance of the fund was lower than its benchmark for all the periods shown. The Board considered that the variations in performance among the fund's classes reflect the variations in class expenses, which result in lower performance for higher expense classes. The Board discussed with FMR actions that have been taken by FMR to improve the fund's below-benchmark performance. The Board noted that this fund had underperformed in 2009 and discussed with FMR its disappointment with the continued underperformance of the fund. The Board also reviewed the fund's performance since inception as well as performance in the current year. The Board will continue to closely monitor the performance of the fund in the coming year and discuss with FMR other appropriate actions to address the performance of the fund.
Annual Report
Fidelity China Region Fund

The Board noted that the investment performance of the retail class of the fund compared favorably to its benchmark for all the periods shown. The Board considered that the variations in performance among the fund's classes reflect the variations in class expenses, which result in lower performance for higher expense classes. The Board also reviewed the fund's performance since inception as well as performance in the current year.
Fidelity Emerging Asia Fund
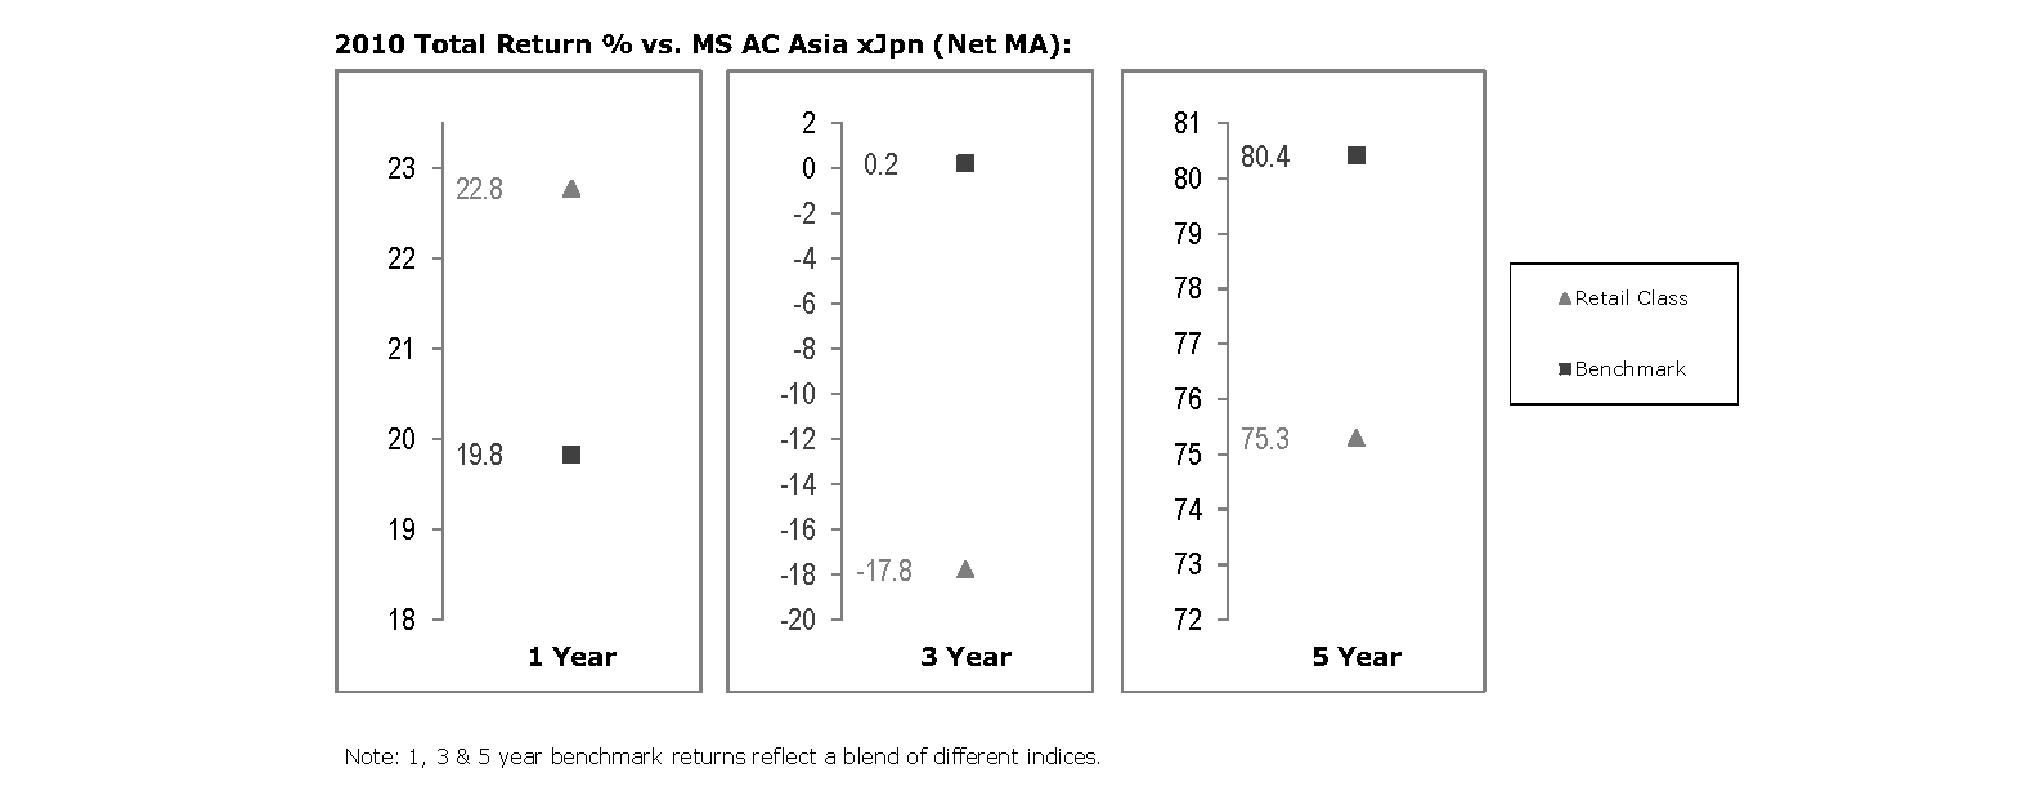
The Board noted that the investment performance of the fund was lower than its benchmark for the three- and five-year periods, although the fund's one-year total return compared favorably to its benchmark. The Board also reviewed the fund's performance since inception as well as performance in the current year, and in light of the fund's changed investment strategy.
Annual Report
Board Approval of Investment Advisory Contracts and Management Fees - continued
Fidelity Japan Smaller Companies Fund
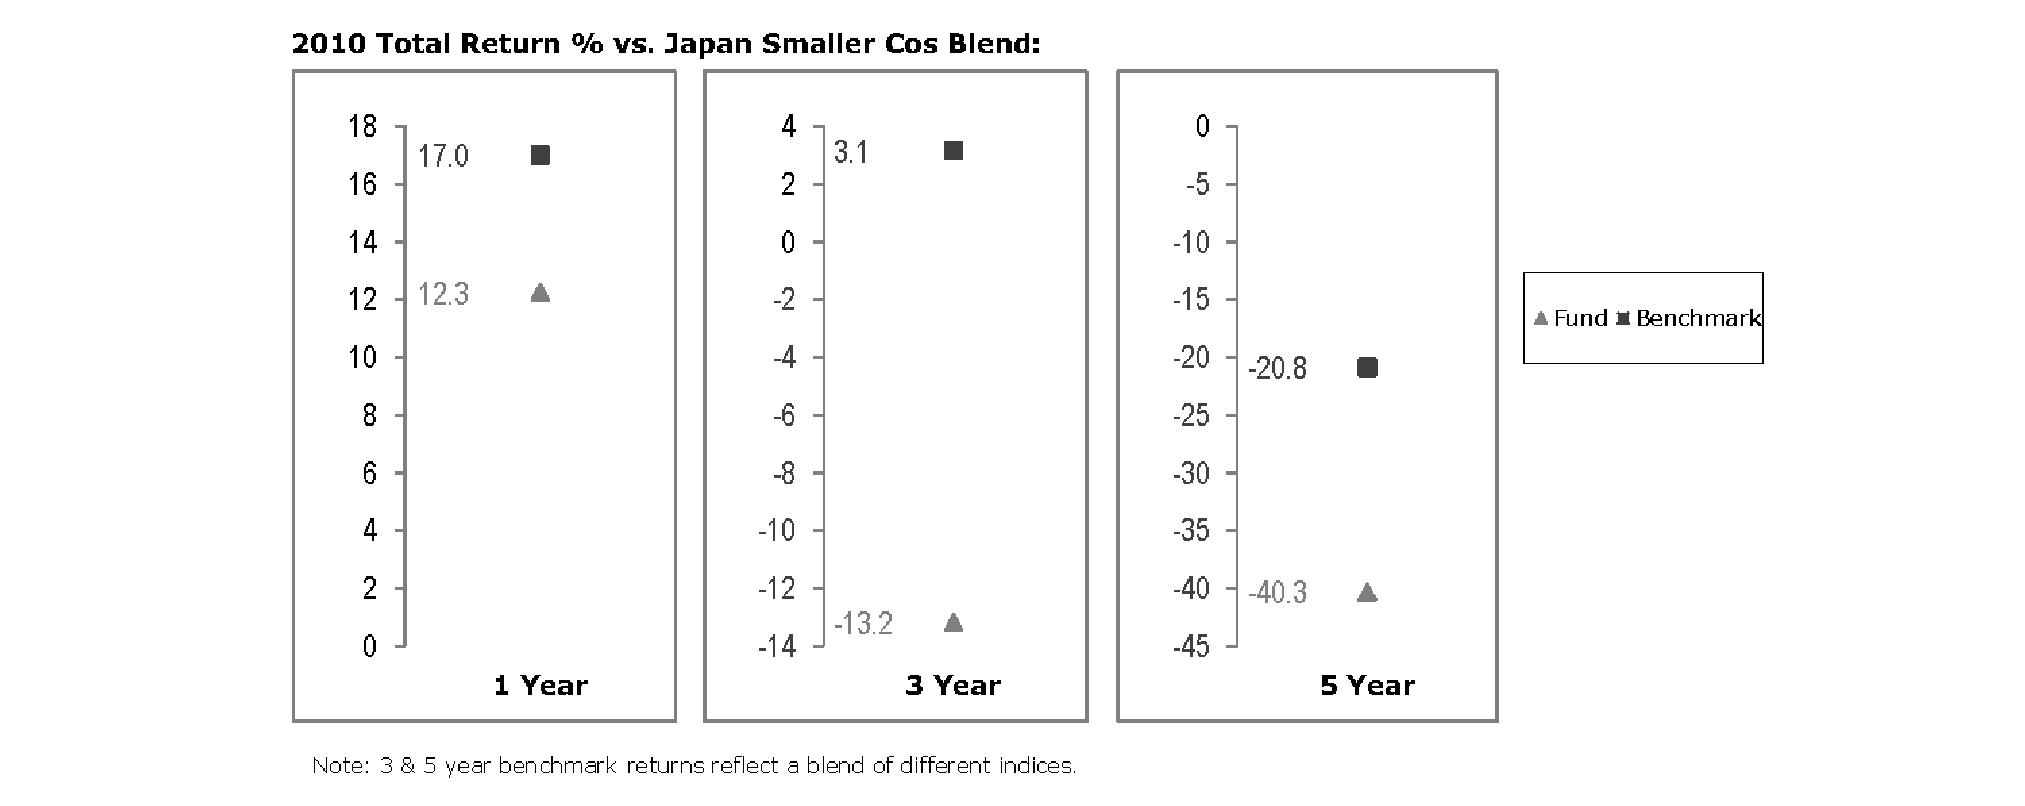
The Board noted that the investment performance of the fund was lower than its benchmark for all the periods shown. The Board discussed with FMR actions that have been taken by FMR to improve the fund's below-benchmark performance. The Board also reviewed the fund's performance since inception as well as performance in the current year. The Board will continue to closely monitor the performance of the fund in the coming year and discuss with FMR other appropriate actions to address the performance of the fund.
Fidelity Latin America Fund

The Board noted that the investment performance of the fund was lower than its benchmark for the three- and five-year periods, although the one-year total return of the retail class compared favorably to its benchmark. The Board also reviewed the fund's performance since inception as well as performance in the current year.
Annual Report
Fidelity Nordic Fund
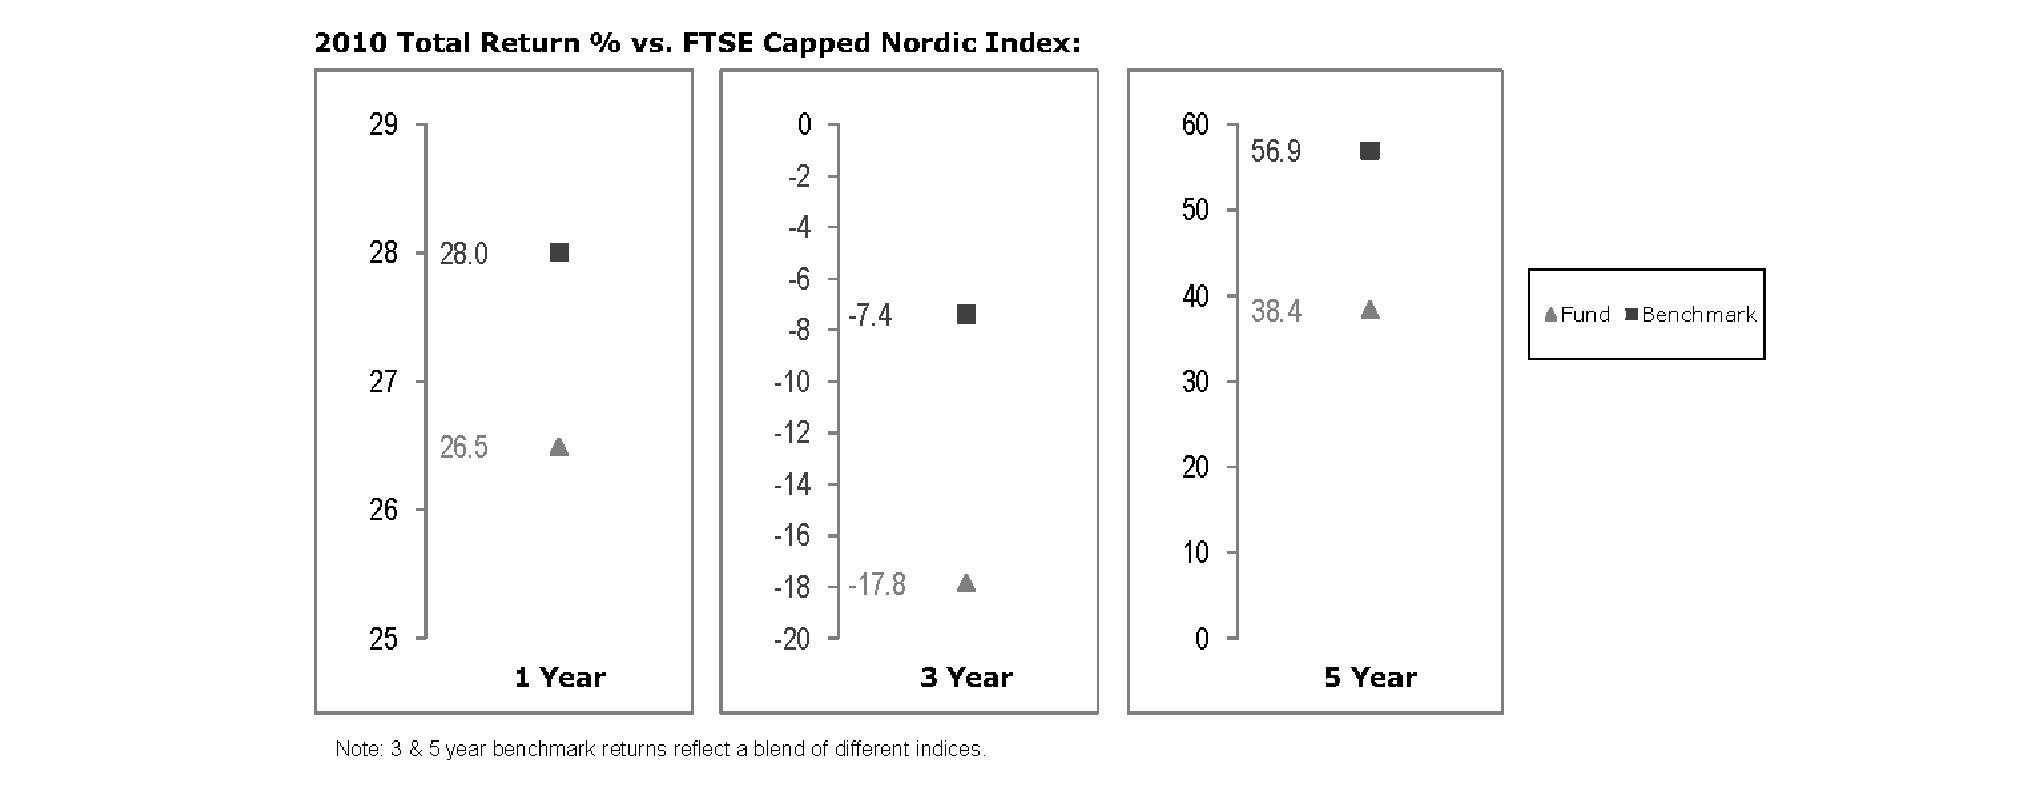
The Board noted that the investment performance of the fund was lower than its benchmark for all the periods shown. The Board discussed with FMR actions that have been taken by FMR to improve the fund's below-benchmark performance. The Board noted that this fund had underperformed in 2009 and discussed with FMR its disappointment with the continued underperformance of the fund. The Board also reviewed the fund's performance since inception as well as performance in the current year. The Board will continue to closely monitor the performance of the fund in the coming year and discuss with FMR other appropriate actions to address the performance of the fund.
Fidelity Pacific Basin Fund
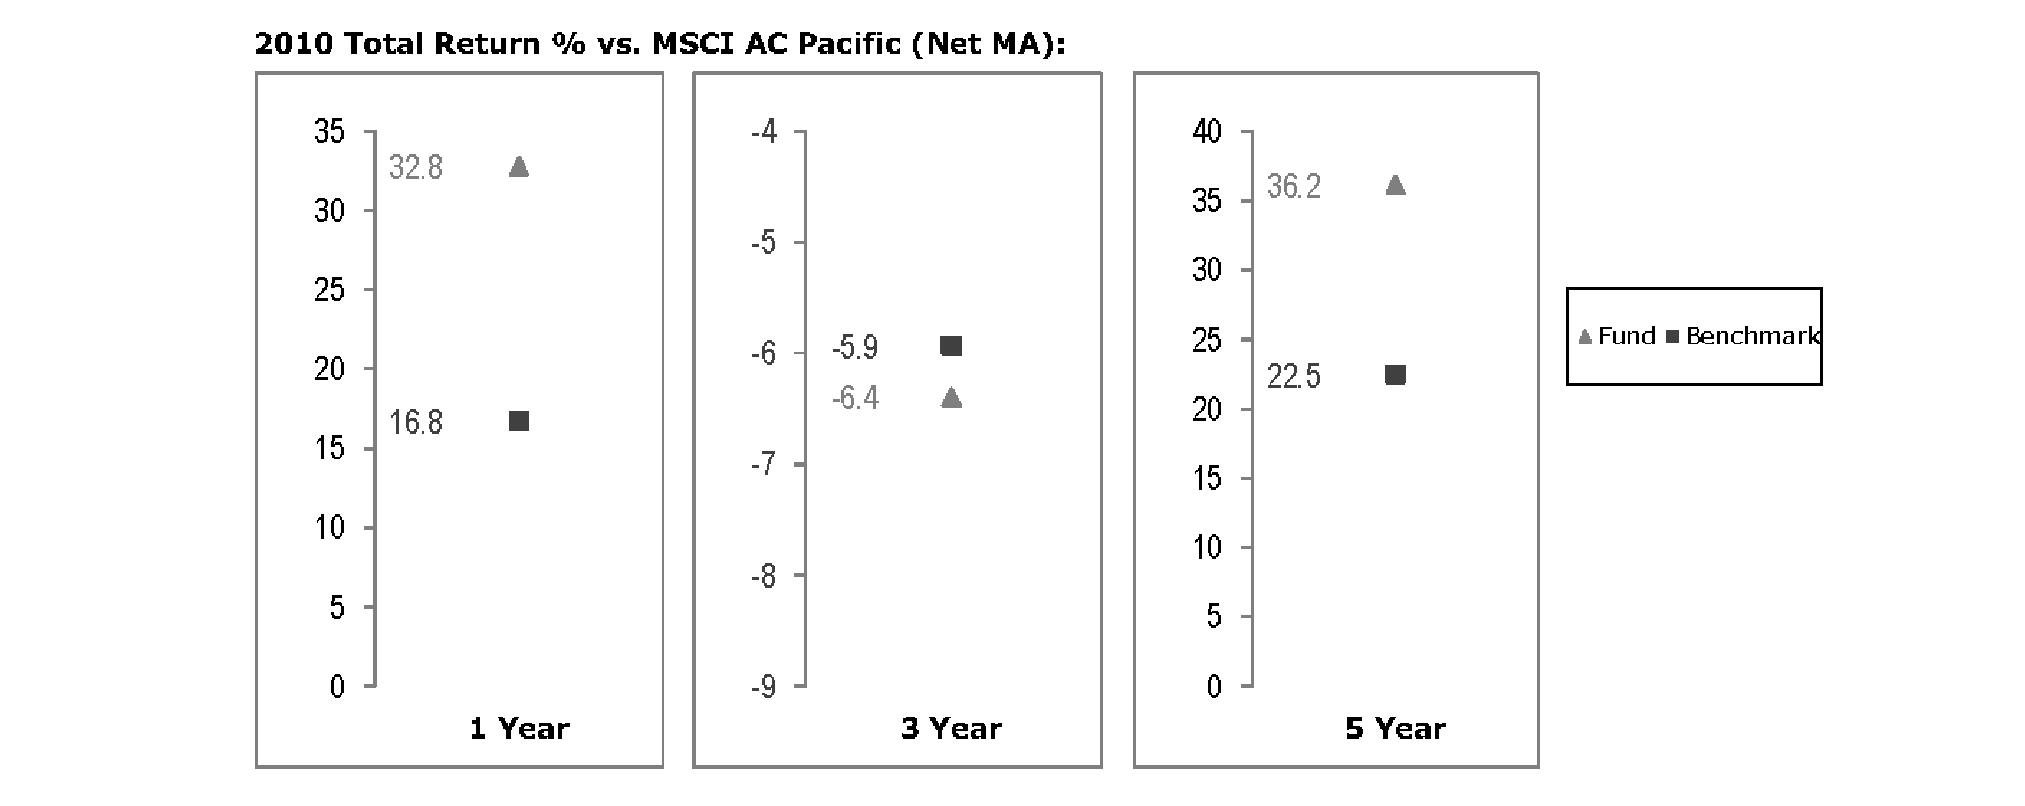
The Board noted that the investment performance of the fund compared favorably to its benchmark for the one- and five-year periods, although the fund's three-year cumulative total return was lower than its benchmark. The Board also reviewed the fund's performance since inception as well as performance in the current year.
The Board also considered that each of Canada Fund's, Emerging Asia Fund's, and Pacific Basin Fund's management fee is subject to upward or downward adjustment depending upon whether, and to what extent, the fund's investment performance for the performance period exceeds, or is exceeded by, the record (over the same period) of a Board-approved performance adjustment index. The Board noted that the performance adjustment provides FMR with a strong economic incentive to seek to achieve superior performance for each fund's shareholders and helps to more closely align the interests of FMR and each fund's shareholders.
Annual Report
Board Approval of Investment Advisory Contracts and Management Fees - continued
Based on its review, the Board concluded that the nature, extent, and quality of services provided to each fund under the Advisory Contracts should benefit each fund's shareholders.
Investment Performance (Emerging Markets Fund, Europe Fund, Europe Capital Appreciation Fund, and Japan Fund). The Board considered whether each fund has operated in accordance with its investment objective, as well as its record of compliance with its investment restrictions. It also reviewed each fund's absolute investment performance (for each class, in the case of Emerging Markets Fund, and for the retail class, in the case of Japan Fund), as well as each fund's relative investment performance (for each class, in the case of Emerging Markets Fund, and for the retail class, in the case of Japan Fund) measured over multiple periods against (i) a broad-based securities market index, and (ii) a peer group of mutual funds deemed appropriate by Fidelity and reviewed by the Board.
For Emerging Markets Fund, the following charts considered by the Board show, over the one-, three-, and five-year periods ended December 31, 2010, as available, the cumulative total returns of Class K and the retail class of the fund, the cumulative total returns of a broad-based securities market index ("benchmark"), and a range of cumulative total returns of a peer group of mutual funds identified by Morningstar, Inc. as having an investment style similar to that of the fund based on underlying portfolio holdings.
For each of Europe Fund, and Europe Capital Appreciation Fund, the following charts considered by the Board show, over the one-, three-, and five-year periods ended December 31, 2010, the fund's cumulative total returns, the cumulative total returns of a broad-based securities market index ("benchmark"), and a range of cumulative total returns of a peer group of mutual funds identified by Morningstar, Inc. as having an investment style similar to that of the fund based on underlying portfolio holdings.
For Japan Fund, the following charts considered by the Board show, over the one-, three-, and five-year periods ended December 31, 2010, the cumulative total returns of the retail class of the fund, the cumulative total returns of a broad-based securities market index ("benchmark"), and a range of cumulative total returns of a peer group of mutual funds identified by Lipper, Inc. as having an investment objective similar to that of the fund. (The Advisor classes of the fund had less than one year of performance as of December 31, 2010.)
The box within each chart shows the 25th percentile return (bottom of box) and the 75th percentile return (top of box) of the peer group. Returns shown above the box are in the first quartile and returns shown below the box are in the fourth quartile. The percentage beaten numbers noted below each chart correspond to the percentile box and represent the percentage of funds in the peer group whose performance was equal to or lower than that of the fund or class indicated.
Fidelity Emerging Markets Fund

The Board reviewed the fund's relative investment performance against its peer group and noted that the performance of the retail class of the fund (the class with the longer performance record) was in the third quartile for the one-year period and the fourth quartile for the three- and five-year periods. The Board also noted that the investment performance of the fund was lower than its benchmark for all the periods shown. The Board considered that the variations in performance between the fund's classes reflect the variations in class expenses, which result in lower performance for the higher expense class. The Board discussed with FMR actions that have been taken by FMR to improve the fund's disappointing performance relative to its peer group and benchmark. The Board also reviewed the fund's performance since inception as well as performance in the current year. The Board will continue to closely monitor the performance of the fund in the coming year and discuss with FMR other appropriate actions to address the performance of the fund.
Annual Report
Fidelity Europe Fund
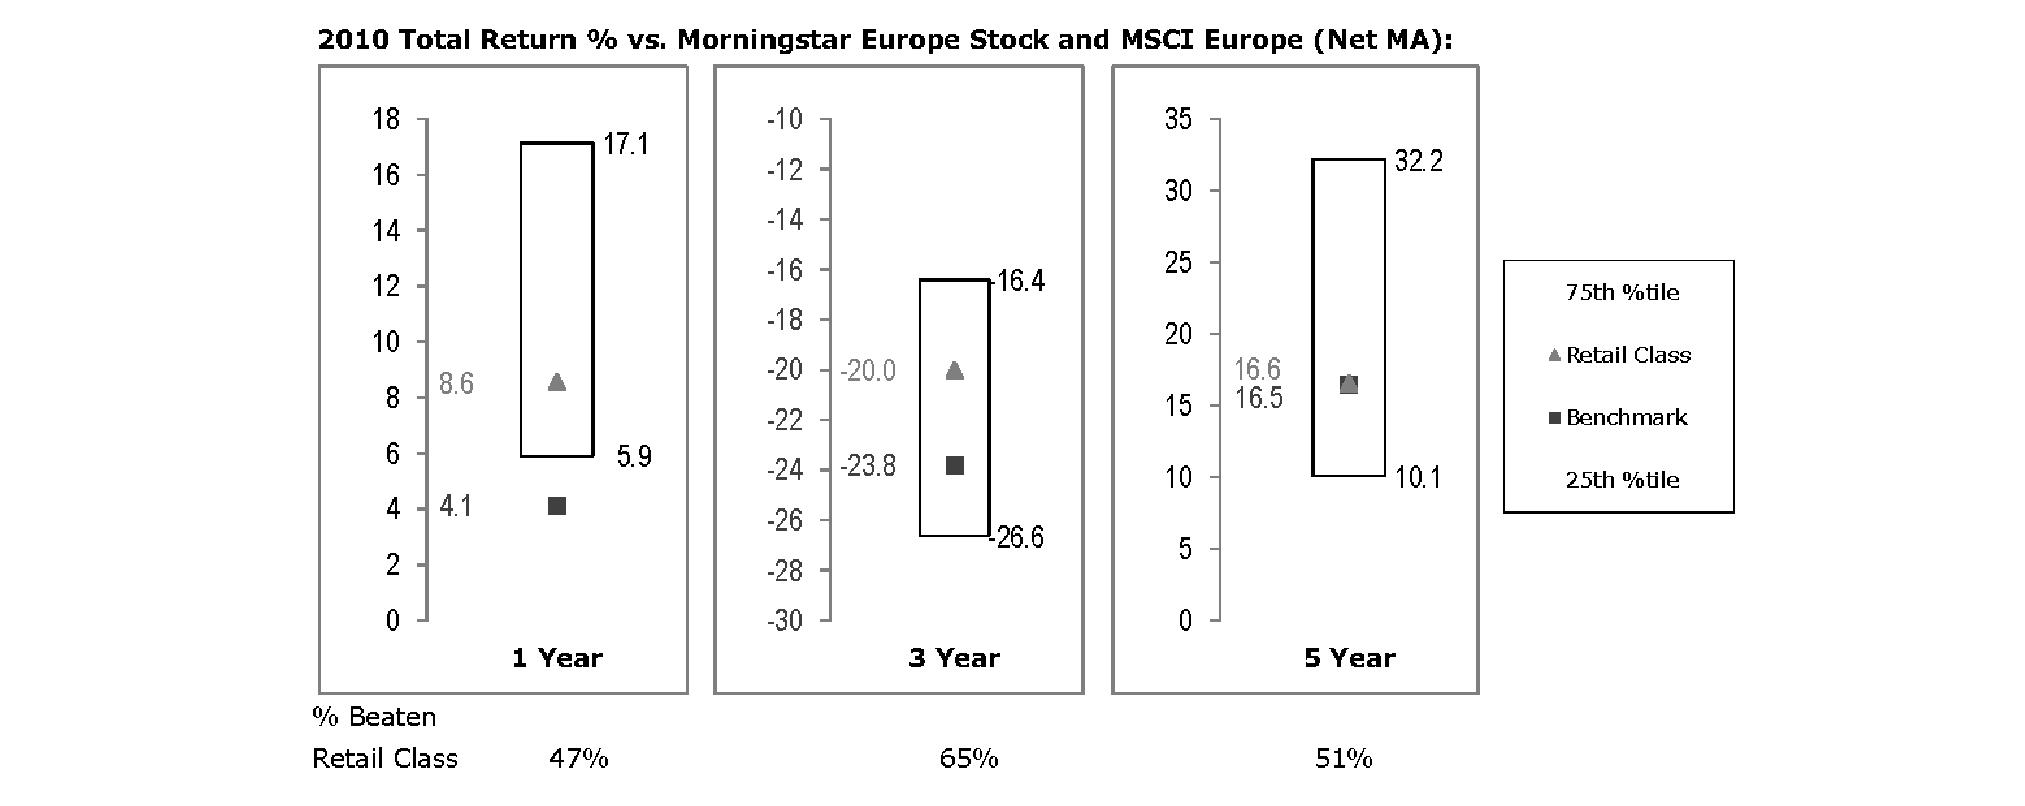
The Board reviewed the fund's relative investment performance against its peer group and noted that the performance of the fund was in the third quartile for the one-year period and the second quartile for the three- and five-year periods. The Board also noted that the investment performance of the fund compared favorably to its benchmark for all the periods shown. The Board also reviewed the fund's performance since inception as well as performance in the current year.
Fidelity Europe Capital Appreciation Fund
The Board reviewed the fund's relative investment performance against its peer group and noted that the performance of the fund was in the third quartile for the one-year period and the second quartile for the three- and five-year periods. The Board also noted that the investment performance of the fund compared favorably to its benchmark for all the periods shown. The Board also reviewed the fund's performance since inception as well as performance in the current year.
Annual Report
Board Approval of Investment Advisory Contracts and Management Fees - continued
Fidelity Japan Fund

The Board reviewed the fund's relative investment performance against its peer group and noted that the performance of the retail class of the fund was in the third quartile for the one- and three-year periods and the second quartile for the five-year period. The Board also noted that the investment performance of the fund was lower than its benchmark for all the periods shown. The Board discussed with FMR actions that have been taken by FMR to improve the fund's disappointing performance relative to its peer group and benchmark. The Board also reviewed the fund's performance since inception as well as performance in the current year. The Board will continue to closely monitor the performance of the fund in the coming year and discuss with FMR other appropriate actions to address the performance of the fund.
The Board also considered that Europe Fund's, Europe Capital Appreciation Fund's, and Japan Fund's management fee is subject to upward or downward adjustment depending upon whether, and to what extent, the fund's investment performance for the performance period exceeds, or is exceeded by, the record (over the same period) of a Board-approved performance adjustment index. The Board noted that the performance adjustment provides FMR with a strong economic incentive to seek to achieve superior performance for each fund's shareholders and helps to more closely align the interests of FMR and each fund's shareholders.
Based on its review, the Board concluded that the nature, extent, and quality of services provided to each fund under the Advisory Contracts should benefit each fund's shareholders.
Competitiveness of Management Fee and Total Expense Ratio. The Board considered each fund's management fee and total expense ratio compared to "mapped groups" of competitive funds and classes. Fidelity creates "mapped groups" by combining similar Lipper investment objective categories that have comparable management fee characteristics. Combining Lipper investment objective categories aids the Board's management fee and total expense ratio comparisons by broadening the competitive group used for comparison and by reducing the number of universes to which various Fidelity funds are compared.
Management Fee. The Board considered two proprietary management fee comparisons for the 12-month periods shown in the charts below. The group of Lipper funds used by the Board for management fee comparisons is referred to below as the "Total Mapped Group." For Japan Fund, the Total Mapped Group is broader than the Lipper peer group used by the Board for performance comparisons because the Total Mapped Group combines several Lipper investment objective categories while the Lipper peer group does not. The Total Mapped Group comparison focuses on a fund's standing relative to the total universe of comparable funds available to investors in terms of gross management fees before expense reimbursements or caps, and without giving effect to a fund's performance adjustment (if applicable). "TMG %" represents the percentage of funds in the Total Mapped Group that had management fees that were lower than a fund's. For example, a TMG % of 16% would mean that 84% of the funds in the Total Mapped Group had higher management fees than a fund. The "Asset-Size Peer Group" (ASPG) comparison focuses on a fund's standing relative to non-Fidelity funds similar in size to the fund within the Total Mapped Group. The ASPG represents at least 15% of the funds in the Total Mapped Group with comparable asset size and management fee characteristics, subject to a minimum of 50 funds (or all funds in the Total Mapped Group if fewer than 50). Additional information, such as the ASPG quartile in which a fund's management fee ranked and the impact of a fund's performance adjustment (if applicable), is also included in the charts and considered by the Board.
Annual Report
Fidelity Canada Fund

The Board noted that the fund's management fee ranked below the median of its Total Mapped Group and below the median of its ASPG for 2010. The Board also noted the effect of the fund's negative performance adjustment on the fund's management fee ranking. The Board noted that the performance adjustment for each year represents calculations for performance periods that differ from the periods shown in the performance charts above.
Fidelity China Region Fund
The Board noted that the fund's management fee ranked below the median of its Total Mapped Group and below the median of its ASPG for 2010.
Annual Report
Board Approval of Investment Advisory Contracts and Management Fees - continued
Fidelity Emerging Asia Fund

The Board noted that the fund's management fee ranked below the median of its Total Mapped Group and below the median of its ASPG for 2010. The Board also noted the effect of the fund's negative performance adjustment on the fund's management fee ranking. The Board noted that the performance adjustment for each year represents calculations for performance periods that differ from the periods shown in the performance charts above.
Furthermore, the Board considered that shareholders of Emerging Asia Fund approved a prospective change in the index used to calculate the fund's performance adjustment, beginning December 1, 2010. The Board also considered that, because the performance adjustment is based on a rolling 36-month measurement period, during a transition period the fund's performance is compared to a blended index return that reflects the performance of the former index for the portion of the measurement period prior to December 1, 2010 and the performance of the current index for the remainder of the measurement period. The Board noted that the fund's performance adjustment for 2010 shown in the chart above reflects the effect of using the blended index return to calculate the fund's performance adjustment.
Fidelity Emerging Markets Fund
The Board noted that the fund's management fee ranked below the median of its Total Mapped Group and below the median of its ASPG for 2010.
Annual Report
Fidelity Europe Fund
The Board noted that the fund's management fee ranked below the median of its Total Mapped Group and below the median of its ASPG for 2010. The Board also noted the effect of the fund's positive performance adjustment on the fund's management fee ranking. The Board noted that the performance adjustment for each year represents calculations for performance periods that differ from the periods shown in the performance charts above.
Fidelity Europe Capital Appreciation Fund
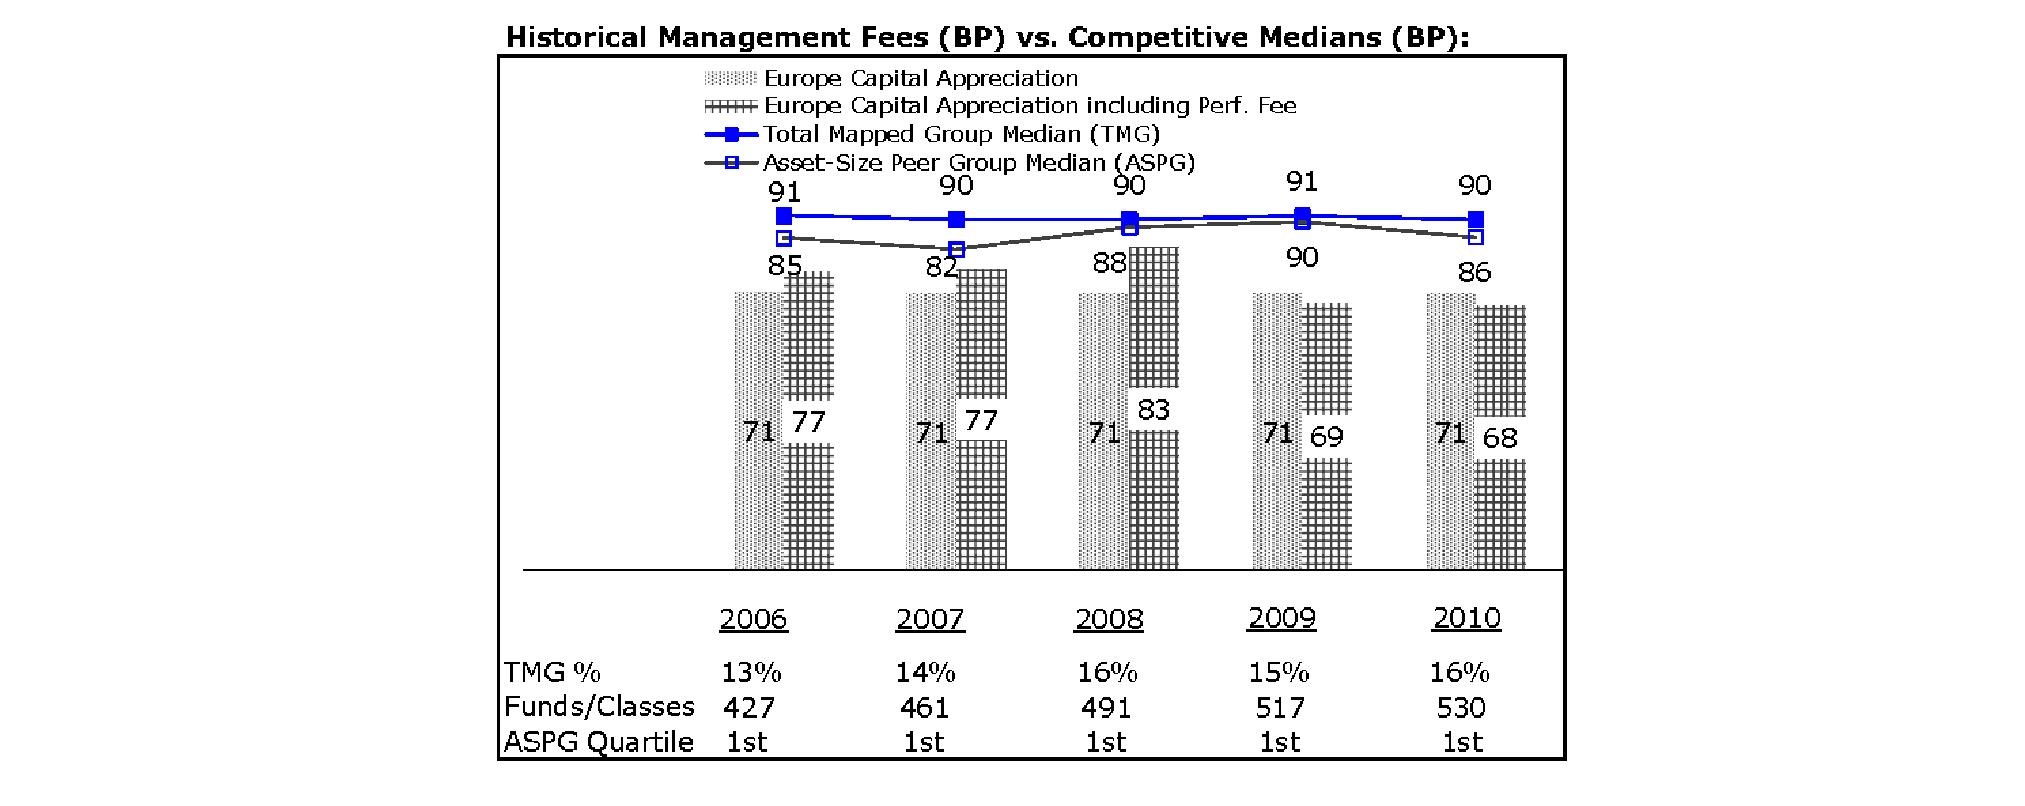
The Board noted that the fund's management fee ranked below the median of its Total Mapped Group and below the median of its ASPG for 2010. The Board also noted the effect of the fund's negative performance adjustment on the fund's management fee ranking. The Board noted that the performance adjustment for each year represents calculations for performance periods that differ from the periods shown in the performance charts above.
Annual Report
Board Approval of Investment Advisory Contracts and Management Fees - continued
Fidelity Japan Fund

The Board noted that the fund's management fee ranked below the median of its Total Mapped Group and below the median of its ASPG for 2010. The Board also noted the effect of the fund's negative performance adjustment on the fund's management fee ranking. The Board noted that the performance adjustment for each year represents calculations for performance periods that differ from the periods shown in the performance charts above.
Fidelity Japan Smaller Companies Fund
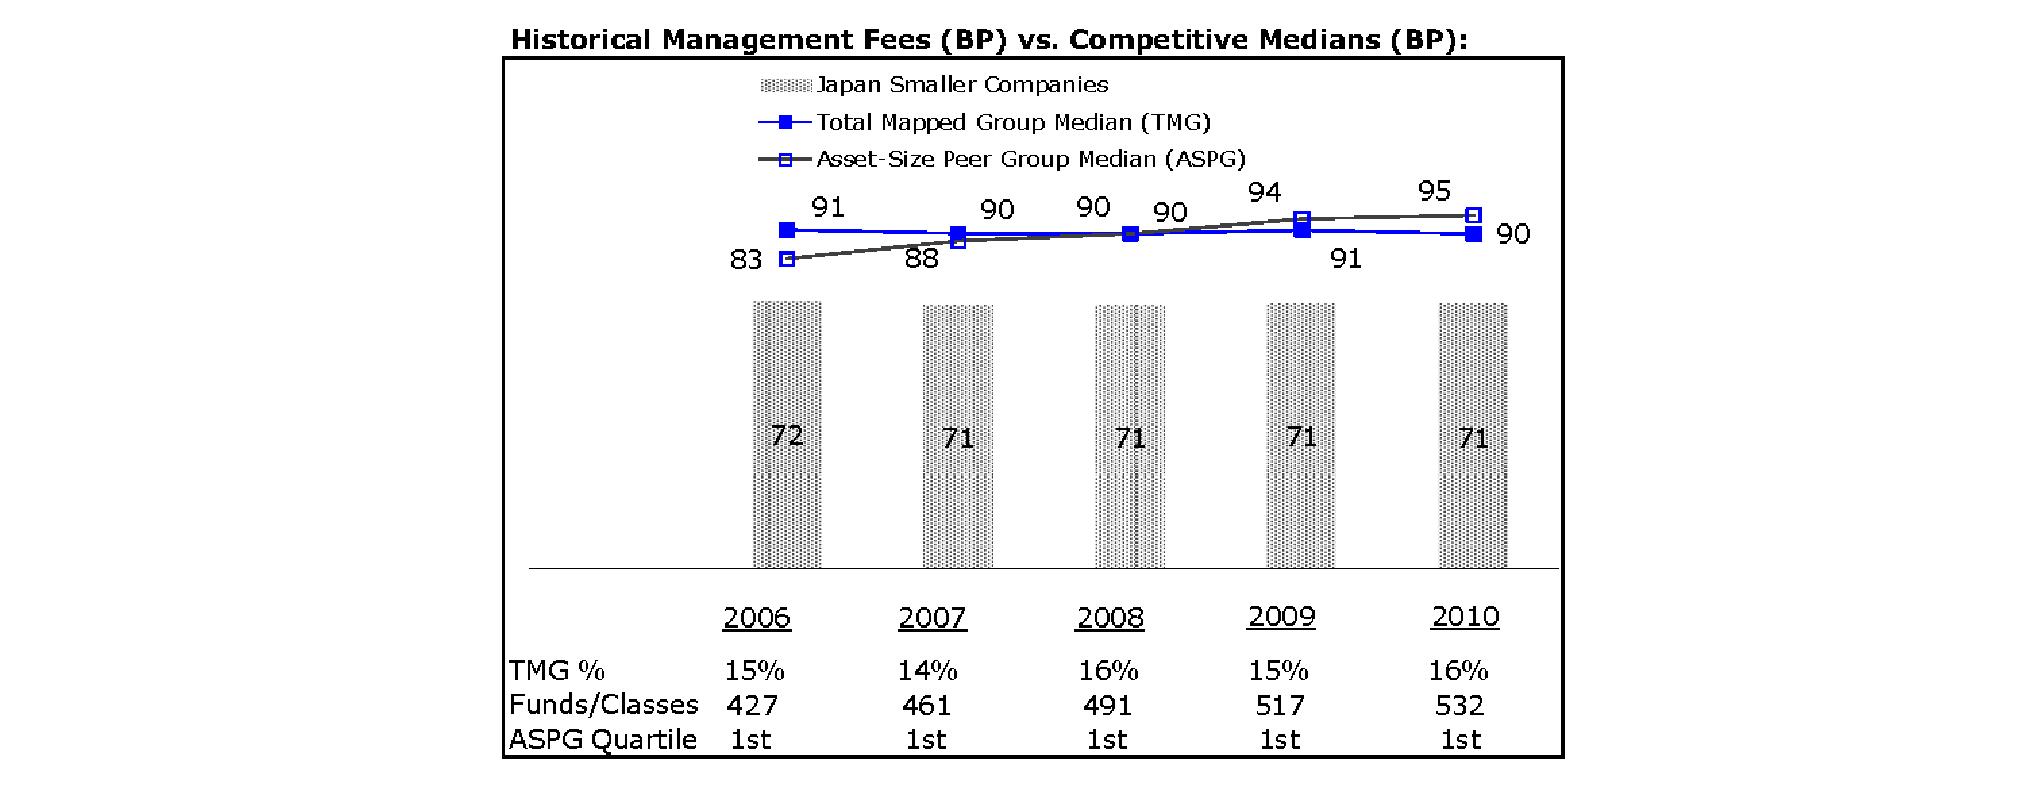
The Board noted that the fund's management fee ranked below the median of its Total Mapped Group and below the median of its ASPG for 2010.
Annual Report
Fidelity Latin America Fund

The Board noted that the fund's management fee ranked below the median of its Total Mapped Group and below the median of its ASPG for 2010.
Fidelity Nordic Fund
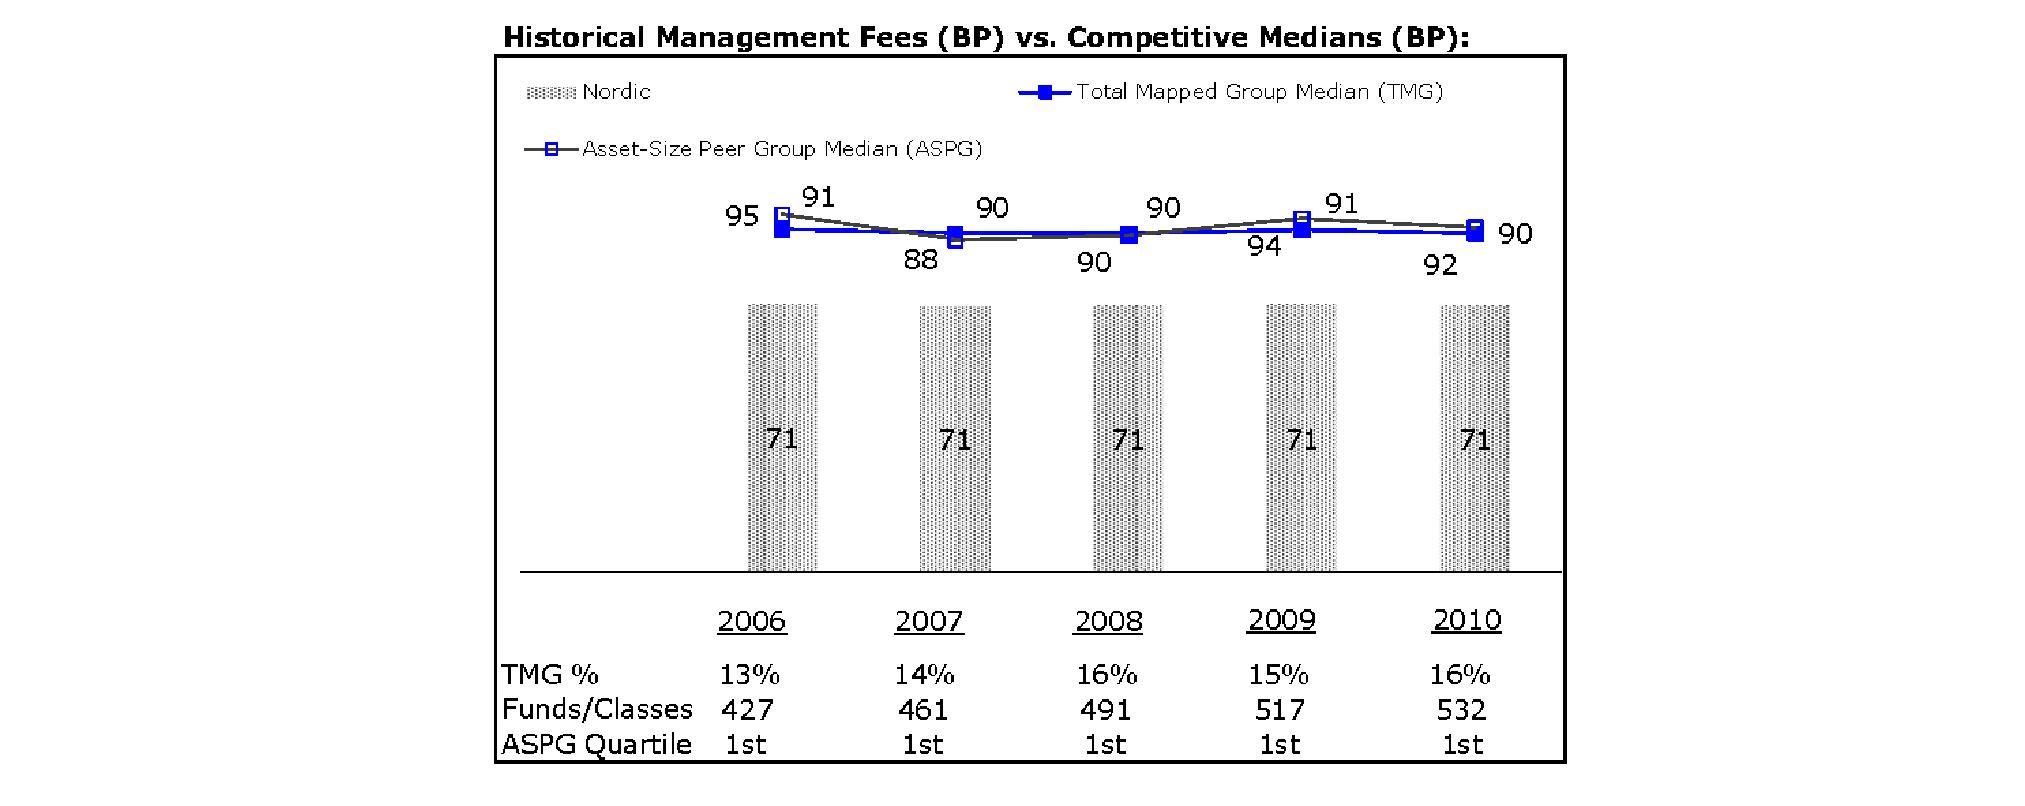
The Board noted that the fund's management fee ranked below the median of its Total Mapped Group and below the median of its ASPG for 2010.
Annual Report
Board Approval of Investment Advisory Contracts and Management Fees - continued
Fidelity Pacific Basin Fund
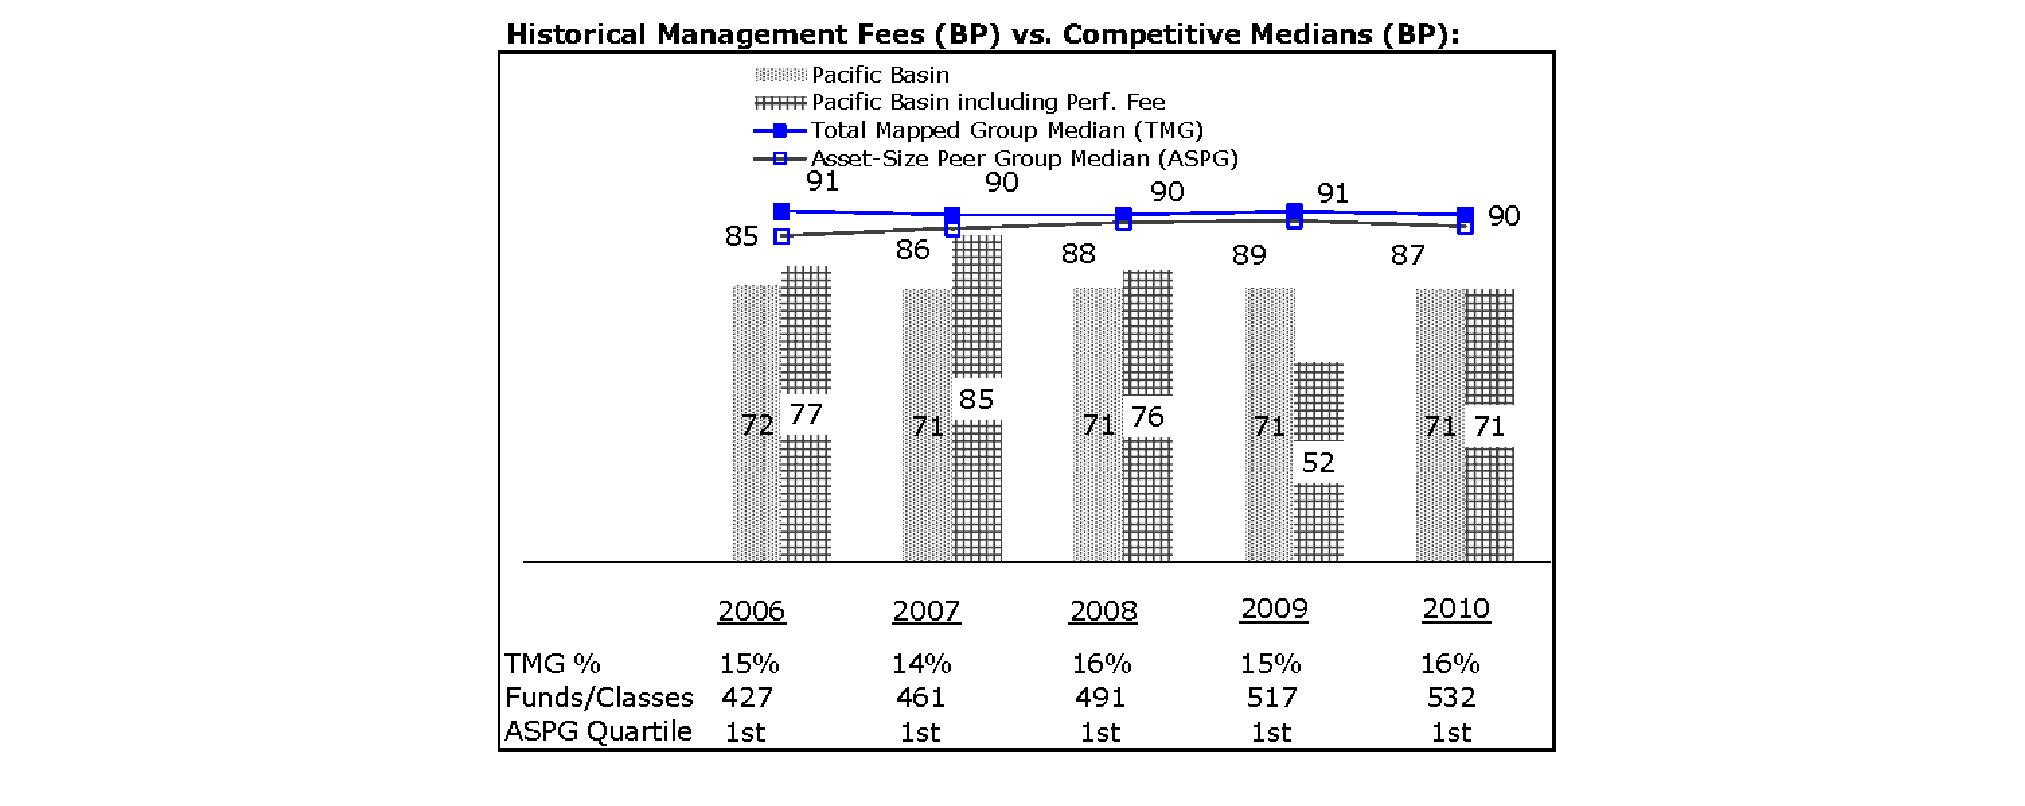
The Board noted that the fund's management fee ranked below the median of its Total Mapped Group and below the median of its ASPG for 2010. The Board also noted the effect of the fund's performance adjustment on the fund's management fee ranking. The Board noted that the performance adjustment for each year represents calculations for performance periods that differ from the periods shown in the performance charts above.
Based on its review, the Board concluded that each fund's management fee is fair and reasonable in light of the services that the fund receives and the other factors considered.
Total Expense Ratio (Canada Fund, China Region Fund, Emerging Markets Fund, Japan Fund, and Latin America Fund). In its review of the total expense ratio of each class of each fund, the Board considered the fund's management fee as well as other fund expenses, such as transfer agent fees, pricing and bookkeeping fees, fund-paid 12b-1 fees, and custodial, legal, and audit fees. The Board also noted the effects of any waivers and reimbursements on fees and expenses, as well as the impact of Canada Fund's and Japan Fund's performance adjustment. As part of its review, the Board also considered the current and historical total expense ratios of each class of each fund compared to competitive fund median expenses. Each class of each fund is compared to those funds and classes in the Total Mapped Group (used by the Board for management fee comparisons) that have a similar sales load structure.
The Board noted that the total expense ratio of each of Class A, Class B, Class C, Institutional Class, and the retail class of Canada Fund ranked below its competitive median for 2010 and the total expense ratio of Class T ranked equal to its competitive median for 2010. The Board considered that various factors, including 12b-1 fees, positive or negative performance adjustments, and relatively higher other expenses in the case of small fund size, can affect total expense ratio.
The Board noted that the total expense ratio of each class of China Region Fund, Emerging Markets Fund, Japan Fund, and Latin America Fund ranked below its competitive median for the period. The Board considered that various factors, including 12b-1 fees, positive or negative performance adjustments, and relatively higher other expenses in the case of small fund size, can affect total expense ratios.
Total Expense Ratio (Emerging Asia Fund, Europe Fund, Europe Capital Appreciation Fund, Japan Smaller Companies Fund, Nordic Fund, and Pacific Basin Fund). In its review of each fund's total expense ratio, the Board considered the fund's management fee as well as other fund expenses, such as transfer agent fees, pricing and bookkeeping fees, and custodial, legal, and audit fees. The Board also noted the effects of any waivers and reimbursements on fees and expenses, as well as the impact of Emerging Asia Fund's, Europe Fund's, Europe Capital Appreciation Fund's, and Pacific Basin Fund's performance adjustment. As part of its review, the Board also considered the current and historical total expense ratios of each fund compared to competitive fund median expenses. Each fund is compared to those funds and classes in the Total Mapped Group (used by the Board for management fee comparisons) that have a similar sales load structure.
The Board noted that each fund's total expense ratio ranked below its competitive median for 2010. The Board considered that various factors, including 12b-1 fees, positive or negative performance adjustments, and relatively higher other expenses in the case of small fund size, can affect total expense ratios.
Fees Charged to Other Fidelity Clients. The Board also considered Fidelity fee structures and other information with respect to clients of FMR and its affiliates, such as other mutual funds advised or subadvised by FMR or its affiliates, pension plan clients, and other institutional clients. In March 2010, the Board created an ad hoc joint committee with the board of other Fidelity funds (the Committee) to review and compare Fidelity's institutional investment advisory business with its business of providing services to the Fidelity funds, including the differences in services provided, fees charged, and costs incurred, as well as competition in their respective marketplaces.
Annual Report
Based on its review of total expense ratios and fees charged to other Fidelity clients, the Board concluded that the total expense ratio of each class of each fund was reasonable in light of the services that the fund and its shareholders receive and the other factors considered, including the findings of the Committee.
Costs of the Services and Profitability. The Board considered the revenues earned and the expenses incurred by Fidelity in conducting the business of developing, marketing, distributing, managing, administering and servicing each fund and its shareholders. The Board also considered the level of Fidelity's profits in respect of all the Fidelity funds.
On an annual basis, FMR presents to the Board Fidelity's profitability for each fund. Fidelity calculates the profitability for each fund, as well as aggregate profitability for groups of Fidelity funds and all Fidelity funds, using a series of detailed revenue and cost allocation methodologies which originate with the books and records of Fidelity on which Fidelity's audited financial statements are based. The Audit Committee of the Board reviews any significant changes from the prior year's methodologies.
PricewaterhouseCoopers LLP (PwC), independent registered public accounting firm and auditor to Fidelity and certain Fidelity funds, has been engaged annually by the Board as part of the Board's assessment of Fidelity's profitability analysis. PwC's engagement includes the review and assessment of Fidelity's methodologies used in determining the revenues and expenses attributable to Fidelity's mutual fund business, and completion of agreed-upon procedures surrounding the mathematical accuracy of fund profitability and its conformity to allocation methodologies. After considering PwC's reports issued under the engagement and information provided by Fidelity, the Board concluded that while other allocation methods may also be reasonable, Fidelity's profitability methodologies are reasonable in all material respects.
The Board also reviewed Fidelity's non-fund businesses and fall-out benefits related to the mutual fund business as well as cases where Fidelity's affiliates may benefit from or be related to the funds' business.
The Board considered the costs of the services provided by and the profits realized by Fidelity in connection with the operation of each fund and was satisfied that the profitability was not excessive in the circumstances.
Economies of Scale. The Board considered whether there have been economies of scale in respect of the management of the Fidelity funds, whether the Fidelity funds (including each fund) have appropriately benefited from any such economies of scale, and whether there is potential for realization of any further economies of scale. The Board considered the extent to which each fund will benefit from economies of scale through increased services to the fund, through waivers or reimbursements, or through fee or expense reductions. The Board also noted that in 2009, it and the board of other Fidelity funds created an ad hoc committee (the Economies of Scale Committee) to analyze whether FMR attains economies of scale in respect of the management and servicing of the Fidelity funds, whether the Fidelity funds have appropriately benefited from such economies of scale, and whether there is potential for realization of any further economies of scale.
The Board recognized that each fund's management contract incorporates a "group fee" structure, which provides for lower group fee rates as total fund assets under FMR's management increase, and for higher group fee rates as total fund assets under FMR's management decrease. FMR calculates the group fee rates based on a tiered asset "breakpoint" schedule that varies based on asset class. The Board considered that the group fee is designed to deliver the benefits of economies of scale to fund shareholders when total Fidelity fund assets increase, even if assets of any particular fund are unchanged or have declined, because some portion of Fidelity's costs are attributable to services provided to all Fidelity funds, and all funds benefit if those costs can be allocated among more assets. The Board concluded that, given the group fee structure, fund shareholders will benefit from lower management fees as assets under FMR's management increase at the fund complex level, regardless of whether Fidelity achieves any such economies of scale.
The Board concluded, taking into account the analysis of the Economies of Scale Committee, that any potential economies of scale are being appropriately shared between fund shareholders and Fidelity.
Additional Information Requested by the Board. In order to develop fully the factual basis for consideration of the Fidelity funds' Advisory Contracts, the Board requested and received additional information on certain topics, including (i) fund performance trends, actions to be taken by FMR to improve certain funds' overall performance, and Fidelity's long-term strategies for certain funds; (ii) portfolio manager changes that have occurred during the past year and length of portfolio manager tenure for different categories of funds over time; (iii) Fidelity's compensation structure for portfolio managers and other key personnel and strategies for attracting and retaining non-investment personnel; (iv) the amount of the investment that each portfolio manager has made in the Fidelity fund(s) that he or she manages; (v) historical trends in Fidelity's realization of fall-out benefits; (vi) Fidelity's group fee structures and the rationale for the individual fee rates of certain funds; (vii) fund profitability methodology and the impact of certain factors on fund profitability results; (viii) trends regarding industry use of performance fee structures and Fidelity's compliance practices with respect to performance adjustment calculations; (ix) the fee structures in place for certain other Fidelity clients; and (x) explanations regarding the relative total expense ratios of certain funds and classes, total expense competitive trends, and actions that might be taken by FMR to reduce total expense ratios for certain funds and classes.
Annual Report
Board Approval of Investment Advisory Contracts and Management Fees - continued
Based on its evaluation of all of the conclusions noted above, and after considering all factors it believed relevant, the Board ultimately concluded that the advisory fee structures are fair and reasonable, and that each fund's Advisory Contracts should be renewed.
Annual Report
Investment Adviser
Fidelity Management & Research Company
Boston, MA
Investment Sub-Advisers
FMR Co., Inc.
Fidelity Management & Research
(U.K.) Inc.
Fidelity Management & Research
(Hong Kong) Limited
Fidelity Management & Research
(Japan) Inc.
Fidelity Research & Analysis Company
FIL Investments (Japan) Limited
FIL Investment Advisors
FIL Investment Advisors
(UK) Limited
General Distributor
Fidelity Distributors Corporation
Boston, MA
Transfer and Service Agents
Fidelity Investments Institutional
Operations Company, Inc.
Boston, MA
Fidelity Service Company, Inc.
Boston, MA
Custodians
JPMorgan Chase Bank
New York, NY
Fidelity Emerging Markets Fund, Fidelity Japan Fund,
Fidelity Pacific Basin Fund
Brown Brothers Harriman & Co.
Boston, MA
Fidelity China Region Fund, Fidelity Latin America Fund,
Fidelity Nordic Fund
State Street Bank and Trust Company
Quincy, MA
Fidelity Canada Fund, Fidelity Europe Fund
The Northern Trust Company
Chicago, IL
Fidelity Emerging Asia Fund,
Fidelity Europe Capital Appreciation Fund,
Fidelity Japan Smaller Companies Fund
Fidelity's International Equity Funds
Fidelity Canada Fund
Fidelity China Region Fund
Fidelity Diversified International Fund
Fidelity Emerging Asia Fund
Fidelity Emerging Europe, Middle East, Africa (EMEA) Fund
Fidelity Emerging Markets Fund
Fidelity Europe Capital Appreciation Fund
Fidelity Europe Fund
Fidelity Global Balanced Fund
Fidelity Global Commodity Stock Fund
Fidelity Global Strategies Fund
Fidelity International Capital Appreciation Fund
Fidelity International Discovery Fund
Fidelity International Growth Fund
Fidelity International Small Cap Fund
Fidelity International Small Cap Opportunities Fund
Fidelity International Value Fund
Fidelity Japan Fund
Fidelity Japan Smaller Companies Fund
Fidelity Latin America Fund
Fidelity Nordic Fund
Fidelity Overseas Fund
Fidelity Pacific Basin Fund
Fidelity Total International Equity Fund
Fidelity Worldwide Fund
Corporate Headquarters
82 Devonshire Street
Boston, MA 02109
www.fidelity.com
The Fidelity Telephone Connection
Mutual Fund 24-Hour Service
Exchanges/Redemptions
and Account Assistance 1-800-544-6666
Product Information 1-800-544-6666
Retirement Accounts 1-800-544-4774
(8 a.m. - 9 p.m.)
TDD Service 1-800-544-0118
for the deaf and hearing impaired
(9 a.m. - 9 p.m. Eastern time)
Fidelity Automated Service
Telephone (FAST®)
1-800-544-5555
Automated line for quickest service
TIF-UANNPRO-1211
1.784781.108
Fidelity Advisor®
Canada Fund -
Class A, Class T, Class B, and Class C
Annual Report
October 31, 2011
Class A, Class T, Class B, and Class C are
classes of Fidelity® Canada Fund

Contents
Chairman's Message | (Click Here) | The Chairman's message to shareholders. |
Performance | (Click Here) | How the fund has done over time. |
Management's Discussion of Fund Performance | (Click Here) | The Portfolio Manager's review of fund performance and strategy. |
Shareholder Expense Example | (Click Here) | An example of shareholder expenses. |
Investment Changes | (Click Here) | A summary of major shifts in the fund's investments over the past six months. |
Investments | (Click Here) | A complete list of the fund's investments with their market values. |
Financial Statements | (Click Here) | Statements of assets and liabilities, operations, and changes in net assets, as well as financial highlights. |
Notes | (Click Here) | Notes to the financial statements. |
Report of Independent Registered Public Accounting Firm | (Click Here) | |
Trustees and Officers | (Click Here) | |
Distributions | (Click Here) | |
Board Approval of Investment Advisory Contracts and Management Fees | (Click Here) | |
To view a fund's proxy voting guidelines and proxy voting record for the 12-month period ended June 30, visit http://www.fidelity.com/proxyvotingresults or visit the Securities and Exchange Commission's (SEC) web site at http://www.sec.gov. You may also call 1-877-208-0098 to request a free copy of the proxy voting guidelines.
Standard & Poor's, S&P and S&P 500 are registered service marks of The McGraw-Hill Companies, Inc. and have been licensed for use by Fidelity Distributors Corporation.
Other third party marks appearing herein are the property of their respective owners.
All other marks appearing herein are registered or unregistered trademarks or service marks of FMR LLC or an affiliated company.
This report and the financial statements contained herein are submitted for the general information of the shareholders of the fund. This report is not authorized for distribution to prospective investors in the fund unless preceded or accompanied by an effective prospectus.
A fund files its complete schedule of portfolio holdings with the SEC for the first and third quarters of each fiscal year on Form N-Q. Forms N-Q are available on the SEC's web site at http://www.sec.gov. A fund's Forms N-Q may be reviewed and copied at the SEC's Public Reference Room in Washington, DC. Information regarding the operation of the SEC's Public Reference Room may be obtained by calling 1-800-SEC-0330. For a complete list of a fund's portfolio holdings, view the most recent holdings listing, semiannual report, or annual report on Fidelity's web site at http://www.fidelity.com, http://www.advisor.fidelity.com, or http://www.401k.com, as applicable.
NOT FDIC INSURED • MAY LOSE VALUE • NO BANK GUARANTEE
Neither the fund nor Fidelity Distributors Corporation is a bank.
Annual Report
(The Acting Chairman's photo appears here.)
Dear Shareholder:
Global equity markets began the fourth quarter on a strong note, sharply reversing course in October amid strong corporate earnings, better-than-expected economic news and the promise of a resolution to the sovereign debt crisis in Europe. The mini rally followed a third quarter marked by a significant downturn in July and August, which heightened investor anxiety and set off a wave of volatility that hampered most major asset classes through the end of September. Financial markets are difficult to predict, of course, but you can help put the odds in your favor by following these time-tested investment principles.
One of the basic tenets is to invest according to your time horizon. For long-term investors, riding out the markets' inevitable ups and downs has proven much more effective than making decisions based on short-term developments. If your goal is approaching, you can also benefit from patience and restraint, rather than attempting to time the market. No matter your time horizon, missing only a few of the markets' best days can significantly diminish returns. Patience also affords the benefits of compounding - earning interest on additional income or reinvested dividends and capital gains. While staying the course doesn't eliminate risk, it can considerably lessen the negative impact of short-term downturns.
Asset allocation is another principle to manage risk. As you spread your portfolio among the asset classes, be sure to consider your time horizon, risk tolerance and investment objectives. Younger investors may be better served by emphasizing equities, which historically have been the best-performing asset class over time. Investors who are nearing a specific goal, such as retirement or sending a child to college, may choose to favor bonds and other investments that have tended to be more stable. Studies indicate that asset allocation is the single most important determinant of a portfolio's long-term success. After deciding on a suitable allocation strategy, make sure your portfolio is adequately diversified, with exposure to stocks of small-, mid- and large-cap companies in a range of sectors, for example. And today, more than ever, geographic diversification should be taken into account.
Lastly, investing a certain amount of money on a regular basis - a principle known as dollar-cost averaging - can help lower the average cost of your purchases, while also giving you the discipline to avoid selling weak performers just prior to an upswing, or chasing a hot performer just before a correction.
We invite you to learn more by visiting us on the Internet, dropping by one of our Investor Centers or calling us by phone. It is our privilege to provide the resources you need to choose investments that are right for you.
Sincerely,
(The Acting Chairman's signature appears here.)
James C. Curvey
Acting Chairman
Annual Report
Average annual total return reflects the change in the value of an investment, assuming reinvestment of the class' distributions from dividend income and capital gains (the profits earned upon the sale of securities that have grown in value, if any) and assuming a constant rate of performance each year. The $10,000 table and the fund's returns do not reflect the deduction of taxes that a shareholder would pay on fund distributions or the redemption of fund shares. During periods of reimbursement by Fidelity, a fund's total return will be greater than it would be had the reimbursement not occurred. How a fund did yesterday is no guarantee of how it will do tomorrow.
Average Annual Total Returns
Periods ended October 31, 2011 | Past 1
year | Past 5
years | Past 10
years |
Class A (incl. 5.75% sales charge)A | -7.30% | 2.14% | 12.48% |
Class T (incl. 3.50% sales charge) B | -5.36% | 2.37% | 12.61% |
Class B (incl. contingent deferred sales charge) C | -7.25% | 2.27% | 12.75% |
Class C (incl. contingent deferred sales charge) D | -3.33% | 2.66% | 12.76% |
A Class A shares bear a 0.25% 12b-1 fee. The initial offering of Class A shares took place on May 2, 2007. Returns prior to May 2, 2007 are those of Fidelity® Canada Fund, the original class of the fund, which has no 12b-1 fee. Had Class A shares' 12b-1 fee been reflected, returns prior to May 2, 2007 would have been lower.
B Class T shares bear a 0.50% 12b-1 fee. The initial offering of Class T shares took place on May 2, 2007. Returns prior to May 2, 2007 are those of Fidelity Canada Fund, the original class of the fund, which has no 12b-1 fee. Had Class T shares' 12b-1 fee been reflected, returns prior to May 2, 2007 would have been lower.
C Class B shares bear a 1.00% 12b-1 fee. The initial offering of Class B shares took place on May 2, 2007. Returns prior to May 2, 2007 are those of Fidelity Canada Fund, the original class of the fund, which has no 12b-1 fee. Had Class B shares' 12b-1 fee been reflected, returns prior to May 2, 2007 would have been lower. Class B shares' contingent deferred sales charge included in the past one year, past five years, and past 10 years total return figures are 5%, 2%, and 0% respectively.
D Class C shares bear a 1.00% 12b-1 fee. The initial offering of Class C shares took place on May 2, 2007. Returns prior to May 2, 2007 are those of Fidelity Canada Fund, the original class of the fund, which has no 12b-1 fee. Had Class C shares' 12b-1 fee been reflected, returns prior to May 2, 2007 would have been lower. Class C shares' contingent deferred sales charge included in the past one year, past five years, and past 10 years total return figures are 1%, 0%, and 0%, respectively.
$10,000 Over 10 Years
Let's say hypothetically that $10,000 was invested in Fidelity Advisor® Canada Fund - Class A on October 31, 2001, and the current 5.75% sales charge was paid. The chart shows how the value of your investment would have changed, and also shows how the S&P®/TSX Composite Index performed over the same period. The initial offering of Class A took place on May 2, 2007. See above for additional information regarding the performance of Class A.
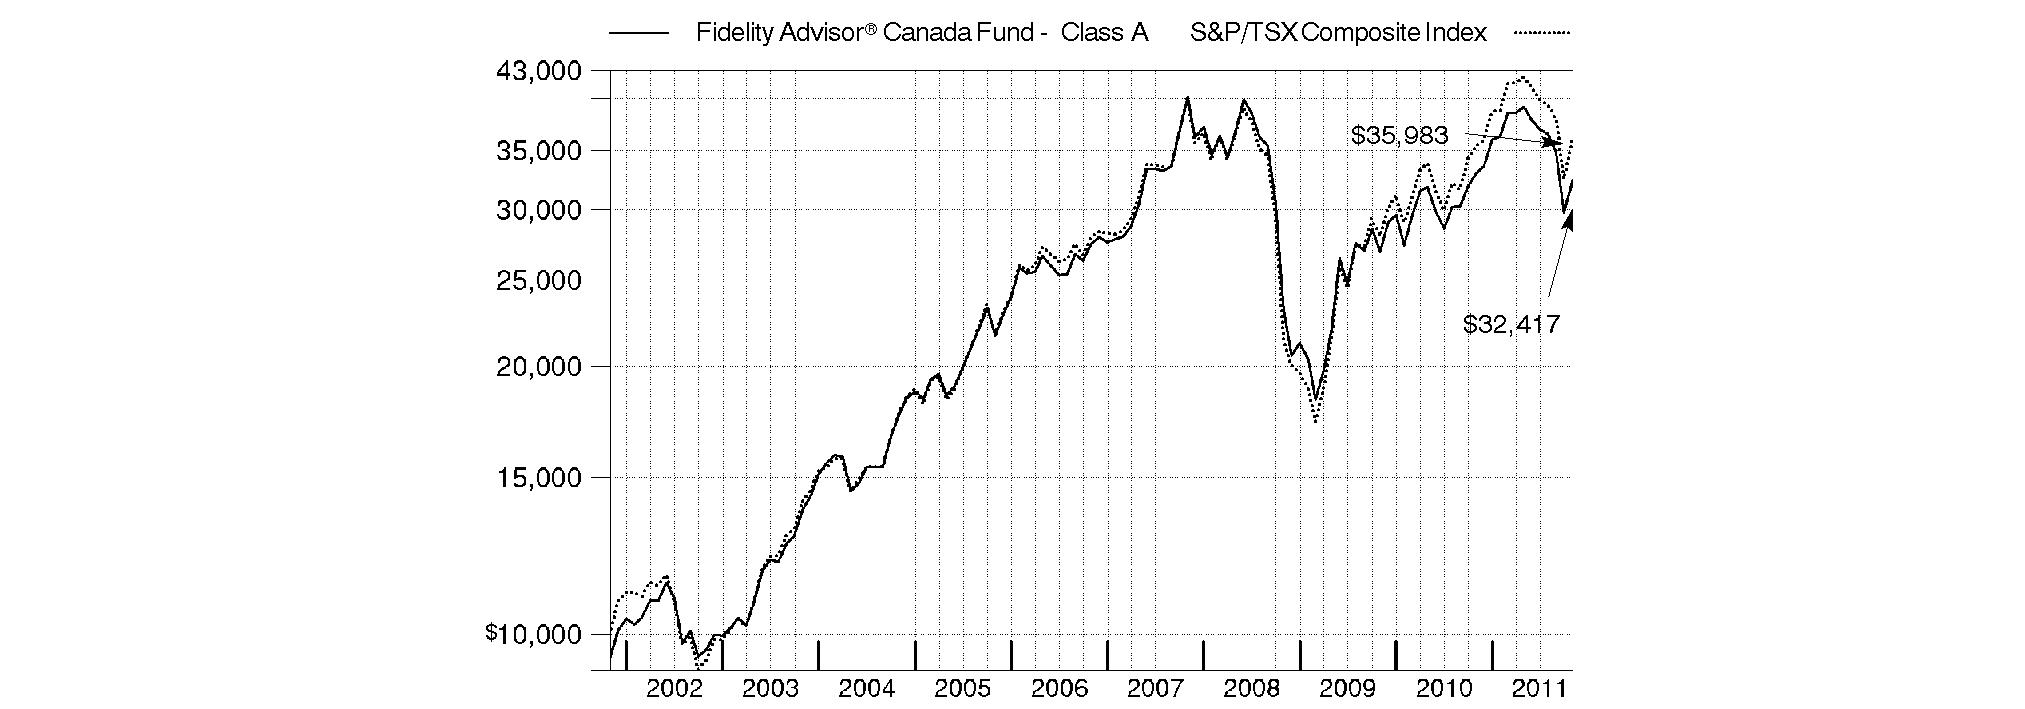
Annual Report
Market Recap: International equities were rocked by a number of headline events during the year ending October 31, 2011. Stocks posted a solid advance for the first half of the period, despite concern about the sovereign debt crisis in Europe, a devastating earthquake and tsunami in Japan, and political upheaval in the Middle East and North Africa. Sentiment turned decidedly negative in the second half, however, as fresh worries about Europe, inflation in China and a dimmed outlook for global growth caused foreign markets to suffer declines that intensified in August and September. October brought with it yet another dramatic swing, as eurozone policymakers appeared near a resolution to the debt debacle and buyers stormed back onto the scene in search of bargains. Still, those gains - along with favorable currency fluctuations overall - weren't enough to offset prior losses, and the MSCI® ACWI® (All Country World Index) ex USA Index finished the period down 4.56%. Within the MSCI index, Europe and emerging markets suffered the biggest declines, with many countries in these areas sustaining steep losses. By contrast, Japan showed resilience in the wake of its natural disasters, falling only 2%. Australia (+4%), Switzerland (+3%), the U.K. (+2%) and Canada, which produced a nominal return, were among the few major benchmark components to break into positive territory.
Comments from Douglas Lober, Portfolio Manager of Fidelity Advisor® Canada Fund: For the 12 months ending October 31, 2011, the fund's Class A, Class T, Class B and Class C shares declined 1.64%, 1.93%, 2.41% and 2.36%, respectively (excluding sales charges), trailing the 1.60% gain of the S&P/TSX Composite Index. It was a challenging year for equities worldwide. Canadian stocks enjoyed a strong surge in the first half of the period, only to see most of those gains erased during the summer, when heightened macroeconomic and sovereign debt concerns fueled a sharp sell-off in the market. Against this backdrop, positioning in energy, financials and industrials detracted meaningfully versus the index, as did an overweighting in the weak materials sector. Conversely, positioning within the hard-hit information technology sector contributed the most, largely due to underweighting and then selling poor-performing Research In Motion, maker of the BlackBerry® personal communications device. Larger-than-index exposure to the strong-performing health care group also helped. On an individual stock basis, three of the four biggest detractors were energy names, with the largest blow coming from an underweighting in pipleline developer TransCanada. The stock gained 20% for the year, as investors were attracted to the company's solid dividend yield amid the market uncertainty. Canadian Natural Resources and Precision Drilling, two crude-oil-oriented energy companies, experienced volatile stock price swings during the period, and my untimely ownership of both created a head wind for the fund. Elsewhere, a poorly timed overweighting in First Quantum Minerals detracted, as copper prices fell. On the upside, overweighting Valeant Pharmaceuticals International helped, as shares of the specialty pharmaceuticals firm benefited from strong earnings and small additive acquisitions during the period. Scant exposure to Encana, a natural gas exploration and production company in the index that performed poorly, also provided a lift. In materials, major gold miner Goldcorp helped, as the price of the yellow metal climbed more than 25% during the period, due in part to a generally weakening U.S. dollar and concern about a potential global financial crisis. Also in this space, shares of Consolidated Thompson Iron Mines got a boost when the firm agreed to be acquired by Cliffs Natural Resources in January, a deal that closed in May.
Note to shareholders: Fidelity Advisor Canada Fund may invest up to 35% of its total assets in any industry that represents more than 20% of the Canadian market. As of October 31, 2011, the fund did not have more than 25% of its assets invested in any one industry.
The views expressed above reflect those of the portfolio manager(s) only through the end of the period as stated on the cover of this report and do not necessarily represent the views of Fidelity or any other person in the Fidelity organization. Any such views are subject to change at any time based upon market or other conditions and Fidelity disclaims any responsibility to update such views. These views may not be relied on as investment advice and, because investment decisions for a Fidelity fund are based on numerous factors, may not be relied on as an indication of trading intent on behalf of any Fidelity fund.
Annual Report
Fidelity Canada Fund
As a shareholder of the Fund, you incur two types of costs: (1) transaction costs, including sales charges (loads) on purchase payments or redemption proceeds, redemption fees, and (2) ongoing costs, including management fees, distribution and/or service (12b-1) fees and other Fund expenses. This Example is intended to help you understand your ongoing costs (in dollars) of investing in the Fund and to compare these costs with the ongoing costs of investing in other mutual funds.
The Example is based on an investment of $1,000 invested at the beginning of the period and held for the entire period (May 1, 2011 to October 31, 2011).
Actual Expenses
The first line of the accompanying table for each class of the Fund provides information about actual account values and actual expenses. You may use the information in this line, together with the amount you invested, to estimate the expenses that you paid over the period. Simply divide your account value by $1,000.00 (for example, an $8,600 account value divided by $1,000.00 = 8.6), then multiply the result by the number in the first line for a class of the Fund under the heading entitled "Expenses Paid During Period" to estimate the expenses you paid on your account during this period. A small balance maintenance fee of $12.00 that is charged once a year may apply for certain accounts with a value of less than $2,000. This fee is not included in the table below. If it was, the estimate of expenses you paid during the period would be higher, and your ending account value lower, by this amount. In addition, the Fund, as a shareholder in the underlying Fidelity Central Funds, will indirectly bear its pro-rata share of the fees and expenses incurred by the underlying Fidelity Central Funds. These fees and expenses are not included in the Fund's annualized expense ratio used to calculate the expense estimate in the table below.
Hypothetical Example for Comparison Purposes
The second line of the accompanying table for each class of the Fund provides information about hypothetical account values and hypothetical expenses based on a Class' actual expense ratio and an assumed rate of return of 5% per year before expenses, which is not the Class' actual return. The hypothetical account values and expenses may not be used to estimate the actual ending account balance or expenses you paid for the period. You may use this information to compare the ongoing costs of investing in the Fund and other funds. To do so, compare this 5% hypothetical example with the 5% hypothetical examples that appear in the shareholder reports of the other funds. A small balance maintenance fee of $12.00 that is charged once a year may apply for certain accounts with a value of less than $2,000. This fee is not included in the table below. If it was, the estimate of expenses you paid during the period would be higher, and your ending account value lower, by this amount. In addition, the Fund, as a shareholder in the underlying Fidelity Central Funds, will indirectly bear its pro-rata share of the fees and expenses incurred by the underlying Fidelity Central Funds. These fees and expenses are not included in the Fund's annualized expense ratio used to calculate the expense estimate in the table below.
Please note that the expenses shown in the table are meant to highlight your ongoing costs only and do not reflect any transaction costs. Therefore, the second line of the table is useful in comparing ongoing costs only, and will not help you determine the relative total costs of owning different funds. In addition, if these transactional costs were included, your costs would have been higher.
| Annualized
Expense Ratio | Beginning
Account Value
May 1, 2011 | Ending
Account Value
October 31, 2011 | Expenses Paid
During Period*
May 1, 2011 to
October 31, 2011 |
Class A | 1.11% | | | |
Actual | | $ 1,000.00 | $ 829.20 | $ 5.12 |
HypotheticalA | | $ 1,000.00 | $ 1,019.61 | $ 5.65 |
Class T | 1.41% | | | |
Actual | | $ 1,000.00 | $ 828.10 | $ 6.50 |
HypotheticalA | | $ 1,000.00 | $ 1,018.10 | $ 7.17 |
Class B | 1.90% | | | |
Actual | | $ 1,000.00 | $ 825.90 | $ 8.74 |
HypotheticalA | | $ 1,000.00 | $ 1,015.63 | $ 9.65 |
Class C | 1.86% | | | |
Actual | | $ 1,000.00 | $ 826.20 | $ 8.56 |
HypotheticalA | | $ 1,000.00 | $ 1,015.83 | $ 9.45 |
Canada | .81% | | | |
Actual | | $ 1,000.00 | $ 830.50 | $ 3.74 |
HypotheticalA | | $ 1,000.00 | $ 1,021.12 | $ 4.13 |
Institutional Class | .82% | | | |
Actual | | $ 1,000.00 | $ 830.40 | $ 3.78 |
HypotheticalA | | $ 1,000.00 | $ 1,021.07 | $ 4.18 |
A 5% return per year before expenses
* Expenses are equal to each Class' annualized expense ratio, multiplied by the average account value over the period, multiplied by 184/365 (to reflect the one-half year period).
Annual Report
Fidelity Canada Fund
Investment Changes (Unaudited)
Geographic Diversification (% of fund's net assets) |
As of October 31, 2011 |
 | Canada | 95.8% | |
 | United States of America | 4.2% | |

Percentages are adjusted for the effect of futures contracts, if applicable. |
As of April 30, 2011 |
| Canada | 93.5% | |
 | United States of America | 6.2% | |
 | United Kingdom | 0.2% | |
| France | 0.1% | |

Percentages are adjusted for the effect of futures contracts, if applicable. |
Asset Allocation |
| % of fund's
net assets | % of fund's net assets
6 months ago |
Stocks | 99.8 | 98.2 |
Short-Term Investments and Net Other Assets | 0.2 | 1.8 |
Top Ten Stocks as of October 31, 2011 |
| % of fund's
net assets | % of fund's net assets
6 months ago |
The Toronto-Dominion Bank (Commercial Banks) | 5.4 | 4.1 |
Enbridge, Inc. (Oil, Gas & Consumable Fuels) | 3.9 | 2.2 |
Bank of Nova Scotia (Commercial Banks) | 3.9 | 3.3 |
Suncor Energy, Inc. (Oil, Gas & Consumable Fuels) | 3.8 | 5.0 |
Goldcorp, Inc. (Metals & Mining) | 3.7 | 5.8 |
Open Text Corp. (Internet Software & Services) | 3.5 | 0.8 |
Canadian National Railway Co. (Road & Rail) | 3.5 | 2.5 |
Bank of Montreal (Commercial Banks) | 3.3 | 1.8 |
Potash Corp. of Saskatchewan, Inc. (Chemicals) | 3.1 | 3.3 |
BCE, Inc. (Diversified Telecommunication Services) | 2.8 | 1.5 |
| 36.9 | |
Market Sectors as of October 31, 2011 |
| % of fund's
net assets | % of fund's net assets
6 months ago |
Energy | 23.4 | 27.3 |
Materials | 23.4 | 22.9 |
Financials | 22.8 | 22.8 |
Telecommunication Services | 5.6 | 2.7 |
Information Technology | 5.5 | 3.5 |
Consumer Discretionary | 5.5 | 4.2 |
Industrials | 5.4 | 7.4 |
Health Care | 4.7 | 6.5 |
Consumer Staples | 2.6 | 0.9 |
Utilities | 0.9 | 0.0 |
Annual Report
Fidelity Canada Fund
Investments October 31, 2011
Showing Percentage of Net Assets
Common Stocks - 99.8% |
| Shares | | Value |
CONSUMER DISCRETIONARY - 5.5% |
Hotels, Restaurants & Leisure - 1.5% |
McDonald's Corp. | 150,000 | | $ 13,927,500 |
Tim Hortons, Inc. (Canada) | 1,010,300 | | 49,721,942 |
| | 63,649,442 |
Media - 1.4% |
Astral Media, Inc. Class A (non-vtg.) | 400,000 | | 13,731,253 |
Cineplex, Inc. | 250,000 | | 6,638,411 |
Corus Entertainment, Inc. Class B (non-vtg.) | 600,000 | | 11,490,194 |
Quebecor, Inc. Class B (sub. vtg.) | 750,000 | | 25,956,764 |
| | 57,816,622 |
Multiline Retail - 1.7% |
Dollar Tree, Inc. (a) | 350,000 | | 27,986,000 |
Dollarama, Inc. | 1,134,975 | | 42,718,826 |
| | 70,704,826 |
Textiles, Apparel & Luxury Goods - 0.9% |
Gildan Activewear, Inc. | 166,400 | | 4,293,332 |
lululemon athletica, Inc. (a) | 437,600 | | 24,715,648 |
NIKE, Inc. Class B | 100,000 | | 9,635,000 |
| | 38,643,980 |
TOTAL CONSUMER DISCRETIONARY | | 230,814,870 |
CONSUMER STAPLES - 2.6% |
Food & Staples Retailing - 2.3% |
Alimentation Couche-Tard, Inc. Class B (sub. vtg.) | 1,090,200 | | 32,809,349 |
Metro, Inc. Class A (sub. vtg.) | 785,165 | | 38,468,635 |
Whole Foods Market, Inc. | 320,000 | | 23,078,400 |
| | 94,356,384 |
Food Products - 0.3% |
Saputo, Inc. | 350,000 | | 14,458,544 |
TOTAL CONSUMER STAPLES | | 108,814,928 |
ENERGY - 23.4% |
Energy Equipment & Services - 1.1% |
Calfrac Well Services Ltd. | 150,000 | | 4,649,646 |
Precision Drilling Corp. (a) | 1,200,000 | | 13,915,835 |
Trican Well Service Ltd. | 600,000 | | 10,611,426 |
Trinidad Drilling Ltd. | 2,303,400 | | 18,023,293 |
| | 47,200,200 |
Oil, Gas & Consumable Fuels - 22.3% |
Baytex Energy Corp. (d) | 1,800,000 | | 95,141,696 |
Canadian Natural Resources Ltd. | 1,700,000 | | 59,960,877 |
Canadian Oil Sands Ltd. | 1,400,000 | | 32,442,193 |
Celtic Exploration Ltd. (a) | 54,500 | | 1,349,857 |
Celtic Exploration Ltd. (e) | 1,700,000 | | 42,105,633 |
Cenovus Energy, Inc. | 2,700,000 | | 92,469,278 |
|
| Shares | | Value |
Crescent Point Energy Corp. (d) | 583,400 | | $ 24,913,817 |
Enbridge, Inc. | 4,737,800 | | 164,113,191 |
Encana Corp. | 1,000,000 | | 21,688,318 |
Imperial Oil Ltd. | 250,000 | | 10,352,611 |
Keyera Corp. | 1,083,402 | | 49,417,955 |
Open Range Energy Corp. (a) | 61,200 | | 704,796 |
Painted Pony Petroleum Ltd. (a)(e) | 113,000 | | 1,381,823 |
Petrominerales Ltd. | 192,130 | | 5,068,986 |
Peyto Exploration & Development Corp. (d) | 300,000 | | 6,545,619 |
Suncor Energy, Inc. | 5,007,600 | | 159,493,705 |
Surge Energy, Inc. (a)(e) | 632,000 | | 5,566,494 |
Talisman Energy, Inc. | 3,400,000 | | 48,227,918 |
Tourmaline Oil Corp. (a) | 850,000 | | 28,258,013 |
Tourmaline Oil Corp. (a)(e) | 380,000 | | 12,632,994 |
TransCanada Corp. | 800,000 | | 34,003,110 |
Trilogy Energy Corp. | 700,000 | | 23,847,118 |
Vermilion Energy, Inc. (d) | 300,000 | | 14,132,517 |
| | 933,818,519 |
TOTAL ENERGY | | 981,018,719 |
FINANCIALS - 22.8% |
Capital Markets - 0.4% |
Morgan Stanley | 500,000 | | 8,820,000 |
State Street Corp. | 200,000 | | 8,078,000 |
| | 16,898,000 |
Commercial Banks - 17.2% |
Bank of Montreal (d) | 2,300,000 | | 135,875,006 |
Bank of Nova Scotia | 3,100,000 | | 163,357,576 |
Canadian Imperial Bank of Commerce | 1,054,600 | | 79,450,730 |
Canadian Western Bank, Edmonton | 200,000 | | 5,718,012 |
National Bank of Canada | 700,000 | | 49,955,359 |
Royal Bank of Canada (d) | 890,000 | | 43,408,537 |
The Toronto-Dominion Bank (d) | 2,973,800 | | 224,425,922 |
U.S. Bancorp | 700,000 | | 17,913,000 |
| | 720,104,142 |
Insurance - 3.0% |
Industrial Alliance Life Insurance Co. | 600,000 | | 19,519,486 |
Intact Financial Corp. | 1,560,925 | | 87,092,991 |
MetLife, Inc. | 600,000 | | 21,096,000 |
| | 127,708,477 |
Real Estate Investment Trusts - 0.8% |
RioCan (REIT) | 1,400,000 | | 35,517,881 |
Real Estate Management & Development - 1.4% |
Brookfield Asset Management, Inc. Class A | 1,550,000 | | 44,843,256 |
Brookfield Properties Corp. | 800,000 | | 13,129,357 |
| | 57,972,613 |
TOTAL FINANCIALS | | 958,201,113 |
Common Stocks - continued |
| Shares | | Value |
HEALTH CARE - 4.7% |
Health Care Technology - 2.7% |
SXC Health Solutions Corp. (a) | 2,403,234 | | $ 111,573,125 |
Pharmaceuticals - 2.0% |
Valeant Pharmaceuticals International, Inc. (Canada) | 2,184,871 | | 86,268,268 |
TOTAL HEALTH CARE | | 197,841,393 |
INDUSTRIALS - 5.4% |
Aerospace & Defense - 0.2% |
Bombardier, Inc. Class B (sub. vtg.) (d) | 2,100,000 | | 8,679,340 |
Airlines - 0.1% |
Air Canada Class A (a) | 2,975,000 | | 4,297,537 |
Commercial Services & Supplies - 0.7% |
Progressive Waste Solution Ltd. | 1,384,000 | | 29,155,841 |
Construction & Engineering - 0.5% |
SNC-Lavalin Group, Inc. | 400,000 | | 20,099,313 |
Machinery - 0.3% |
Cummins, Inc. | 100,000 | | 9,943,000 |
Road & Rail - 3.5% |
Canadian National Railway Co. | 1,890,000 | | 148,037,518 |
Trading Companies & Distributors - 0.1% |
Finning International, Inc. | 200,000 | | 4,674,725 |
TOTAL INDUSTRIALS | | 224,887,274 |
INFORMATION TECHNOLOGY - 5.5% |
Internet Software & Services - 3.5% |
Open Text Corp. (a) | 2,430,407 | | 148,747,686 |
IT Services - 2.0% |
CGI Group, Inc. Class A (sub. vtg.) (a) | 4,090,000 | | 83,699,654 |
TOTAL INFORMATION TECHNOLOGY | | 232,447,340 |
MATERIALS - 23.4% |
Chemicals - 4.4% |
Agrium, Inc. | 500,000 | | 41,219,843 |
Methanex Corp. | 500,000 | | 12,890,605 |
Potash Corp. of Saskatchewan, Inc. | 2,780,000 | | 131,574,861 |
| | 185,685,309 |
Metals & Mining - 19.0% |
Agnico-Eagle Mines Ltd. (Canada) | 150,000 | | 6,506,495 |
Alamos Gold, Inc. | 100,000 | | 1,850,830 |
Barrick Gold Corp. | 2,250,000 | | 111,072,378 |
Copper Mountain Mining Corp. (a) | 400,000 | | 2,134,724 |
Detour Gold Corp. (a) | 1,680,000 | | 55,615,188 |
Detour Gold Corp. (a)(e) | 300,000 | | 9,931,284 |
Eldorado Gold Corp. | 3,970,000 | | 74,593,068 |
First Majestic Silver Corp. (a) | 422,400 | | 7,173,830 |
|
| Shares | | Value |
First Quantum Minerals Ltd. | 2,530,000 | | $ 53,069,469 |
Franco-Nevada Corp. | 1,600,000 | | 63,383,659 |
Goldcorp, Inc. | 3,200,000 | | 155,690,425 |
Grande Cache Coal Corp. (a) | 2,422,800 | | 23,988,600 |
IAMGOLD Corp. | 700,000 | | 15,048,402 |
Ivanhoe Mines Ltd. (a) | 1,285,000 | | 26,296,835 |
Kinross Gold Corp. | 300,000 | | 4,276,471 |
Major Drilling Group International, Inc. | 800,000 | | 10,697,698 |
New Gold, Inc. (a) | 1,600,000 | | 19,822,441 |
Osisko Mining Corp. (a) | 1,765,700 | | 21,290,780 |
Silver Wheaton Corp. | 1,075,900 | | 37,149,499 |
Tahoe Resources, Inc. (a) | 400,000 | | 7,547,775 |
Teck Resources Ltd. Class B (sub. vtg.) | 1,320,000 | | 52,913,879 |
Yamana Gold, Inc. | 2,300,000 | | 34,332,146 |
| | 794,385,876 |
TOTAL MATERIALS | | 980,071,185 |
TELECOMMUNICATION SERVICES - 5.6% |
Diversified Telecommunication Services - 4.9% |
BCE, Inc. | 3,000,000 | | 118,904,549 |
TELUS Corp. | 1,600,000 | | 86,079,149 |
| | 204,983,698 |
Wireless Telecommunication Services - 0.7% |
Rogers Communications, Inc. Class B (non-vtg.) | 800,000 | | 29,171,891 |
TOTAL TELECOMMUNICATION SERVICES | | 234,155,589 |
UTILITIES - 0.9% |
Electric Utilities - 0.9% |
Fortis, Inc. | 1,100,000 | | 37,187,139 |
TOTAL COMMON STOCKS (Cost $3,540,301,994) | 4,185,439,550 |
Money Market Funds - 10.8% |
| | | |
Fidelity Cash Central Fund, 0.12% (b) | 157,102,420 | | 157,102,420 |
Fidelity Securities Lending Cash Central Fund, 0.11% (b)(c) | 297,466,236 | | 297,466,236 |
TOTAL MONEY MARKET FUNDS (Cost $454,568,656) | 454,568,656 |
TOTAL INVESTMENT PORTFOLIO - 110.6% (Cost $3,994,870,650) | | 4,640,008,206 |
NET OTHER ASSETS (LIABILITIES) - (10.6)% | | (443,582,265) |
NET ASSETS - 100% | $ 4,196,425,941 |
Legend |
(a) Non-income producing |
(b) Affiliated fund that is available only to investment companies and other accounts managed by Fidelity Investments. The rate quoted is the annualized seven-day yield of the fund at period end. A complete unaudited listing of the fund's holdings as of its most recent quarter end is available upon request. In addition, each Fidelity Central Fund's financial statements, which are not covered by the Fund's Report of Independent Registered Public Accounting Firm, are available on the SEC's website or upon request. |
(c) Investment made with cash collateral received from securities on loan. |
(d) Security or a portion of the security is on loan at period end. |
(e) Security exempt from registration under Rule 144A of the Securities Act of 1933. These securities may be resold in transactions exempt from registration, normally to qualified institutional buyers. At the end of the period, the value of these securities amounted to $71,618,228 or 1.7% of net assets. |
Affiliated Central Funds |
Information regarding fiscal year to date income earned by the Fund from investments in Fidelity Central Funds is as follows: |
Fund | Income earned |
Fidelity Cash Central Fund | $ 95,341 |
Fidelity Securities Lending Cash Central Fund | 3,940,584 |
Total | $ 4,035,925 |
Other Affiliated Issuers |
An affiliated company is a company in which the Fund has ownership of at least 5% of the voting securities. Fiscal year to date transactions with companies which are or were affiliates are as follows: |
Affiliate | Value,
beginning of period | Purchases | Sales
Proceeds | Dividend
Income | Value,
end of
period |
SXC Health Solutions Corp. | $ 148,489,830 | $ 39,379,069 | $ 91,179,472 | $ - | $ - |
Total | $ 148,489,830 | $ 39,379,069 | $ 91,179,472 | $ - | $ - |
Other Information |
All investments are categorized as Level 1 under the Fair Value Hierarchy. The inputs or methodology used for valuing securities may not be an indication of the risk associated with investing in those securities. For more information on valuation inputs, please refer to the Security Valuation section in the accompanying Notes to Financial Statements. |
Income Tax Information |
At October 31, 2011, the Fund had a capital loss carryforward of approximately $230,403,828 of which $79,486,047 and $150,917,781 will expire in fiscal 2016 and 2017, respectively. Capital loss carryforwards are only available to offset future capital gains of the Fund to the extent provided by regulations and may be limited. |
See accompanying notes which are an integral part of the financial statements.
Annual Report
Fidelity Canada Fund
Statement of Assets and Liabilities
| October 31, 2011 |
| | |
Assets | | |
Investment in securities, at value (including securities loaned of $276,476,232) - See accompanying schedule: Unaffiliated issuers (cost $3,540,301,994) | $ 4,185,439,550 | |
Fidelity Central Funds (cost $454,568,656) | 454,568,656 | |
Total Investments (cost $3,994,870,650) | | $ 4,640,008,206 |
Foreign currency held at value (cost $3,344,813) | | 3,343,781 |
Receivable for investments sold | | 76,604,521 |
Receivable for fund shares sold | | 4,290,977 |
Dividends receivable | | 3,803,995 |
Distributions receivable from Fidelity Central Funds | | 219,888 |
Prepaid expenses | | 19,502 |
Other receivables | | 8,010 |
Total assets | | 4,728,298,880 |
| | |
Liabilities | | |
Payable for investments purchased | $ 222,658,895 | |
Payable for fund shares redeemed | 8,853,519 | |
Accrued management fee | 1,756,982 | |
Distribution and service plan fees payable | 137,316 | |
Other affiliated payables | 933,977 | |
Other payables and accrued expenses | 66,014 | |
Collateral on securities loaned, at value | 297,466,236 | |
Total liabilities | | 531,872,939 |
| | |
Net Assets | | $ 4,196,425,941 |
Net Assets consist of: | | |
Paid in capital | | $ 3,780,567,444 |
Undistributed net investment income | | 25,762,870 |
Accumulated undistributed net realized gain (loss) on investments and foreign currency transactions | | (255,068,905) |
Net unrealized appreciation (depreciation) on investments and assets and liabilities in foreign currencies | | 645,164,532 |
Net Assets | | $ 4,196,425,941 |
Statement of Assets and Liabilities - continued
| October 31, 2011 |
| | |
Calculation of Maximum Offering Price Class A:
Net Asset Value and redemption price per share ($215,368,915 ÷ 4,125,938 shares) | | $ 52.20 |
| | |
Maximum offering price per share (100/94.25 of $52.20) | | $ 55.38 |
Class T:
Net Asset Value and redemption price per share ($34,323,432 ÷ 659,962 shares) | | $ 52.01 |
| | |
Maximum offering price per share (100/96.50 of $52.01) | | $ 53.90 |
Class B:
Net Asset Value and offering price per share ($11,865,923 ÷ 230,978 shares)A | | $ 51.37 |
| | |
Class C:
Net Asset Value and offering price per share ($87,990,432 ÷ 1,719,005 shares)A | | $ 51.19 |
| | |
Canada:
Net Asset Value, offering price and redemption price per share ($3,778,765,485 ÷ 71,854,822 shares) | | $ 52.59 |
| | |
Institutional Class:
Net Asset Value, offering price and redemption price per share ($68,111,754 ÷ 1,298,734 shares) | | $ 52.44 |
A Redemption price per share is equal to net asset value less any applicable contingent deferred sales charge.
See accompanying notes which are an integral part of the financial statements.
Annual Report
Fidelity Canada Fund
Financial Statements - continued
Statement of Operations
| Year ended October 31, 2011 |
Investment Income | | |
Dividends | | $ 93,229,781 |
Interest | | 2,244 |
Income from Fidelity Central Funds | | 4,035,925 |
Income before foreign taxes withheld | | 97,267,950 |
Less foreign taxes withheld | | (14,111,670) |
Total income | | 83,156,280 |
| | |
Expenses | | |
Management fee
Basic fee | $ 34,360,665 | |
Performance adjustment | (6,900,443) | |
Transfer agent fees | 10,426,659 | |
Distribution and service plan fees | 1,760,960 | |
Accounting and security lending fees | 1,578,714 | |
Custodian fees and expenses | 175,916 | |
Independent trustees' compensation | 26,697 | |
Registration fees | 206,023 | |
Audit | 76,184 | |
Legal | 18,843 | |
Interest | 1,812 | |
Miscellaneous | 46,952 | |
Total expenses before reductions | 41,778,982 | |
Expense reductions | (167,832) | 41,611,150 |
| | |
Net investment income (loss) | | 41,545,130 |
Realized and Unrealized Gain (Loss) Net realized gain (loss) on: | | |
Investment securities: | | |
Unaffiliated issuers | 37,110,984 | |
Other affiliated issuers | 7,343,328 | |
Foreign currency transactions | (1,156,953) | |
Total net realized gain (loss) | | 43,297,359 |
Change in net unrealized appreciation (depreciation) on: Investment securities | (192,052,898) | |
Assets and liabilities in foreign currencies | (69,228) | |
Total change in net unrealized appreciation (depreciation) | | (192,122,126) |
Net gain (loss) | | (148,824,767) |
Net increase (decrease) in net assets resulting from operations | | $ (107,279,637) |
Statement of Changes in Net Assets
| Year ended
October 31,
2011 | Year ended
October 31,
2010 |
Increase (Decrease) in Net Assets | | |
Operations | | |
Net investment income (loss) | $ 41,545,130 | $ 34,662,867 |
Net realized gain (loss) | 43,297,359 | 83,766,517 |
Change in net unrealized appreciation (depreciation) | (192,122,126) | 641,046,346 |
Net increase (decrease) in net assets resulting from operations | (107,279,637) | 759,475,730 |
Distributions to shareholders from net investment income | (35,317,815) | (34,208,293) |
Distributions to shareholders from net realized gain | (35,060,747) | - |
Total distributions | (70,378,562) | (34,208,293) |
Share transactions - net increase (decrease) | 103,024,419 | 243,266,632 |
Redemption fees | 1,146,266 | 759,127 |
Total increase (decrease) in net assets | (73,487,514) | 969,293,196 |
| | |
Net Assets | | |
Beginning of period | 4,269,913,455 | 3,300,620,259 |
End of period (including undistributed net investment income of $25,762,870 and undistributed net investment income of $26,745,120, respectively) | $ 4,196,425,941 | $ 4,269,913,455 |
See accompanying notes which are an integral part of the financial statements.
Annual Report
Financial Highlights - Class A
Years ended October 31, | 2011 | 2010 | 2009 | 2008 | 2007 H |
Selected Per-Share Data | | | | | |
Net asset value, beginning of period | $ 53.81 | $ 44.24 | $ 38.20 | $ 70.16 | $ 54.00 |
Income from Investment Operations | | | | | |
Net investment income (loss) E | .34 | .31 | .38 | .39 | .19 |
Net realized and unrealized gain (loss) | (1.17) | 9.64 | 5.72 | (28.71) | 15.96 |
Total from investment operations | (.83) | 9.95 | 6.10 | (28.32) | 16.15 |
Distributions from net investment income | (.35) | (.39) | (.07) | (.41) | - |
Distributions from net realized gain | (.44) | - | - | (3.27) | - |
Total distributions | (.79) | (.39) | (.07) | (3.68) | - |
Redemption fees added to paid in capital E | .01 | .01 | .01 | .04 | .01 |
Net asset value, end of period | $ 52.20 | $ 53.81 | $ 44.24 | $ 38.20 | $ 70.16 |
Total Return B, C, D | (1.64)% | 22.62% | 16.08% | (42.23)% | 29.93% |
Ratios to Average Net Assets F, I | | | | | |
Expenses before reductions | 1.12% | 1.24% | 1.42% | 1.34% | 1.23% A |
Expenses net of fee waivers, if any | 1.12% | 1.24% | 1.42% | 1.34% | 1.23% A |
Expenses net of all reductions | 1.12% | 1.18% | 1.39% | 1.31% | 1.22% A |
Net investment income (loss) | .59% | .63% | .98% | .69% | .63% A |
Supplemental Data | | | | | |
Net assets, end of period (000 omitted) | $ 215,369 | $ 170,446 | $ 83,015 | $ 56,242 | $ 20,912 |
Portfolio turnover rate G | 104% | 143% | 123% | 63% | 42% |
A Annualized B Total returns for periods of less than one year are not annualized. C Total returns would have been lower if certain expenses had not been reduced during the applicable periods shown. D Total returns do not include the effect of the sales charges. E Calculated based on average shares outstanding during the period. F Fees and expenses of any underlying Fidelity Central Funds are not included in the Fund's expense ratio. The Fund indirectly bears its proportionate share of the expenses of any underlying Fidelity Central Funds. G Amount does not include the portfolio activity of any underlying Fidelity Central Funds. H For the period May 2, 2007 (commencement of sale of shares) to October 31, 2007. I Expense ratios reflect operating expenses of the class. Expenses before reductions do not reflect amounts reimbursed by the investment adviser or reductions from brokerage service arrangements or reductions from other expense offset arrangements and do not represent the amount paid by the class during periods when reimbursements or reductions occur. Expense ratios before reductions for start-up periods may not be representative of longer-term operating periods. Expenses net of fee waivers reflect expenses after reimbursement by the investment adviser but prior to reductions from brokerage service arrangements or other expense offset arrangements. Expenses net of all reductions represent the net expenses paid by the class. |
Financial Highlights - Class T
Years ended October 31, | 2011 | 2010 | 2009 | 2008 | 2007 H |
Selected Per-Share Data | | | | | |
Net asset value, beginning of period | $ 53.64 | $ 44.11 | $ 38.10 | $ 70.09 | $ 54.00 |
Income from Investment Operations | | | | | |
Net investment income (loss) E | .17 | .18 | .27 | .23 | .09 |
Net realized and unrealized gain (loss) | (1.16) | 9.60 | 5.73 | (28.66) | 15.99 |
Total from investment operations | (.99) | 9.78 | 6.00 | (28.43) | 16.08 |
Distributions from net investment income | (.21) | (.26) | - | (.33) | - |
Distributions from net realized gain | (.44) | - | - | (3.27) | - |
Total distributions | (.65) | (.26) | - | (3.60) | - |
Redemption fees added to paid in capital E | .01 | .01 | .01 | .04 | .01 |
Net asset value, end of period | $ 52.01 | $ 53.64 | $ 44.11 | $ 38.10 | $ 70.09 |
Total Return B, C, D | (1.93)% | 22.27% | 15.77% | (42.40)% | 29.80% |
Ratios to Average Net Assets F, I | | | | | |
Expenses before reductions | 1.42% | 1.51% | 1.70% | 1.63% | 1.48% A |
Expenses net of fee waivers, if any | 1.42% | 1.51% | 1.70% | 1.63% | 1.48% A |
Expenses net of all reductions | 1.42% | 1.46% | 1.67% | 1.60% | 1.47% A |
Net investment income (loss) | .30% | .36% | .71% | .40% | .30% A |
Supplemental Data | | | | | |
Net assets, end of period (000 omitted) | $ 34,323 | $ 31,522 | $ 17,727 | $ 14,963 | $ 14,522 |
Portfolio turnover rate G | 104% | 143% | 123% | 63% | 42% |
A Annualized B Total returns for periods of less than one year are not annualized. C Total returns would have been lower if certain expenses had not been reduced during the applicable periods shown. D Total returns do not include the effect of the sales charges. E Calculated based on average shares outstanding during the period. F Fees and expenses of any underlying Fidelity Central Funds are not included in the Fund's expense ratio. The Fund indirectly bears its proportionate share of the expenses of any underlying Fidelity Central Funds. G Amount does not include the portfolio activity of any underlying Fidelity Central Funds. H For the period May 2, 2007 (commencement of sale of shares) to October 31, 2007. I Expense ratios reflect operating expenses of the class. Expenses before reductions do not reflect amounts reimbursed by the investment adviser or reductions from brokerage service arrangements or reductions from other expense offset arrangements and do not represent the amount paid by the class during periods when reimbursements or reductions occur. Expense ratios before reductions for start-up periods may not be representative of longer-term operating periods. Expenses net of fee waivers reflect expenses after reimbursement by the investment adviser but prior to reductions from brokerage service arrangements or other expense offset arrangements. Expenses net of all reductions represent the net expenses paid by the class. |
See accompanying notes which are an integral part of the financial statements.
Annual Report
Financial Highlights - Class B
Years ended October 31, | 2011 | 2010 | 2009 | 2008 | 2007 H |
Selected Per-Share Data | | | | | |
Net asset value, beginning of period | $ 53.03 | $ 43.68 | $ 37.91 | $ 69.88 | $ 54.00 |
Income from Investment Operations | | | | | |
Net investment income (loss) E | (.11) | (.07) | .08 | (.06) | (.06) |
Net realized and unrealized gain (loss) | (1.14) | 9.50 | 5.68 | (28.54) | 15.93 |
Total from investment operations | (1.25) | 9.43 | 5.76 | (28.60) | 15.87 |
Distributions from net investment income | (.01) | (.09) | - | (.14) | - |
Distributions from net realized gain | (.41) | - | - | (3.27) | - |
Total distributions | (.42) | (.09) | - | (3.41) | - |
Redemption fees added to paid in capital E | .01 | .01 | .01 | .04 | .01 |
Net asset value, end of period | $ 51.37 | $ 53.03 | $ 43.68 | $ 37.91 | $ 69.88 |
Total Return B, C, D | (2.41)% | 21.64% | 15.22% | (42.68)% | 29.41% |
Ratios to Average Net Assets F, I | | | | | |
Expenses before reductions | 1.91% | 2.01% | 2.19% | 2.13% | 2.00% A |
Expenses net of fee waivers, if any | 1.91% | 2.01% | 2.19% | 2.13% | 2.00% A |
Expenses net of all reductions | 1.91% | 1.96% | 2.16% | 2.10% | 1.99% A |
Net investment income (loss) | (.20)% | (.14)% | .21% | (.10)% | (.21)% A |
Supplemental Data | | | | | |
Net assets, end of period (000 omitted) | $ 11,866 | $ 13,464 | $ 7,283 | $ 5,615 | $ 4,078 |
Portfolio turnover rate G | 104% | 143% | 123% | 63% | 42% |
A Annualized B Total returns for periods of less than one year are not annualized. C Total returns would have been lower if certain expenses had not been reduced during the applicable periods shown. D Total returns do not include the effect of the contingent deferred sales charge. E Calculated based on average shares outstanding during the period. F Fees and expenses of any underlying Fidelity Central Funds are not included in the Fund's expense ratio. The Fund indirectly bears its proportionate share of the expenses of any underlying Fidelity Central Funds. G Amount does not include the portfolio activity of any underlying Fidelity Central Funds. H For the period May 2, 2007 (commencement of sale of shares) to October 31, 2007. I Expense ratios reflect operating expenses of the class. Expenses before reductions do not reflect amounts reimbursed by the investment adviser or reductions from brokerage service arrangements or reductions from other expense offset arrangements and do not represent the amount paid by the class during periods when reimbursements or reductions occur. Expense ratios before reductions for start-up periods may not be representative of longer-term operating periods. Expenses net of fee waivers reflect expenses after reimbursement by the investment adviser but prior to reductions from brokerage service arrangements or other expense offset arrangements. Expenses net of all reductions represent the net expenses paid by the class. |
Financial Highlights - Class C
Years ended October 31, | 2011 | 2010 | 2009 | 2008 | 2007 H |
Selected Per-Share Data | | | | | |
Net asset value, beginning of period | $ 52.87 | $ 43.60 | $ 37.84 | $ 69.91 | $ 54.00 |
Income from Investment Operations | | | | | |
Net investment income (loss) E | (.08) | (.06) | .09 | (.05) | (.04) |
Net realized and unrealized gain (loss) | (1.14) | 9.48 | 5.66 | (28.52) | 15.94 |
Total from investment operations | (1.22) | 9.42 | 5.75 | (28.57) | 15.90 |
Distributions from net investment income | (.03) | (.16) | - | (.27) | - |
Distributions from net realized gain | (.44) | - | - | (3.27) | - |
Total distributions | (.47) | (.16) | - | (3.54) | - |
Redemption fees added to paid in capital E | .01 | .01 | .01 | .04 | .01 |
Net asset value, end of period | $ 51.19 | $ 52.87 | $ 43.60 | $ 37.84 | $ 69.91 |
Total Return B, C, D | (2.36)% | 21.68% | 15.22% | (42.69)% | 29.46% |
Ratios to Average Net Assets F, I | | | | | |
Expenses before reductions | 1.86% | 1.99% | 2.18% | 2.13% | 1.99% A |
Expenses net of fee waivers, if any | 1.86% | 1.99% | 2.18% | 2.13% | 1.99% A |
Expenses net of all reductions | 1.86% | 1.94% | 2.15% | 2.10% | 1.97% A |
Net investment income (loss) | (.15)% | (.12)% | .22% | (.10)% | (.15)% A |
Supplemental Data | | | | | |
Net assets, end of period (000 omitted) | $ 87,990 | $ 54,052 | $ 24,848 | $ 16,716 | $ 8,752 |
Portfolio turnover rate G | 104% | 143% | 123% | 63% | 42% |
A Annualized B Total returns for periods of less than one year are not annualized. C Total returns would have been lower if certain expenses had not been reduced during the applicable periods shown. D Total returns do not include the effect of the contingent deferred sales charge. E Calculated based on average shares outstanding during the period. F Fees and expenses of any underlying Fidelity Central Funds are not included in the Fund's expense ratio. The Fund indirectly bears its proportionate share of the expenses of any underlying Fidelity Central Funds. G Amount does not include the portfolio activity of any underlying Fidelity Central Funds. H For the period May 2, 2007 (commencement of sale of shares) to October 31, 2007. I Expense ratios reflect operating expenses of the class. Expenses before reductions do not reflect amounts reimbursed by the investment adviser or reductions from brokerage service arrangements or reductions from other expense offset arrangements and do not represent the amount paid by the class during periods when reimbursements or reductions occur. Expense ratios before reductions for start-up periods may not be representative of longer-term operating periods. Expenses net of fee waivers reflect expenses after reimbursement by the investment adviser but prior to reductions from brokerage service arrangements or other expense offset arrangements. Expenses net of all reductions represent the net expenses paid by the class. |
See accompanying notes which are an integral part of the financial statements.
Annual Report
Financial Highlights - Canada
Years ended October 31, | 2011 | 2010 | 2009 | 2008 | 2007 |
Selected Per-Share Data | | | | | |
Net asset value, beginning of period | $ 54.14 | $ 44.46 | $ 38.37 | $ 70.25 | $ 49.48 |
Income from Investment Operations | | | | | |
Net investment income (loss) B | .52 | .46 | .48 | .58 | .52 |
Net realized and unrealized gain (loss) | (1.18) | 9.68 | 5.74 | (28.83) | 21.62 |
Total from investment operations | (.66) | 10.14 | 6.22 | (28.25) | 22.14 |
Distributions from net investment income | (.46) | (.47) | (.14) | (.40) | (.36) |
Distributions from net realized gain | (.44) | - | - | (3.27) | (1.03) |
Total distributions | (.90) | (.47) | (.14) | (3.67) | (1.39) |
Redemption fees added to paid in capital B | .01 | .01 | .01 | .04 | .02 |
Net asset value, end of period | $ 52.59 | $ 54.14 | $ 44.46 | $ 38.37 | $ 70.25 |
Total Return A | (1.33)% | 22.97% | 16.40% | (42.06)% | 46.03% |
Ratios to Average Net Assets C, E | | | | | |
Expenses before reductions | .82% | .94% | 1.17% | 1.03% | .96% |
Expenses net of fee waivers, if any | .82% | .94% | 1.17% | 1.03% | .96% |
Expenses net of all reductions | .82% | .89% | 1.13% | 1.00% | .94% |
Net investment income (loss) | .90% | .93% | 1.24% | 1.00% | .94% |
Supplemental Data | | | | | |
Net assets, end of period (000 omitted) | $ 3,778,765 | $ 3,953,693 | $ 3,149,791 | $ 2,776,298 | $ 4,890,617 |
Portfolio turnover rate D | 104% | 143% | 123% | 63% | 42% |
A Total returns would have been lower if certain expenses had not been reduced during the applicable periods shown. B Calculated based on average shares outstanding during the period. C Fees and expenses of any underlying Fidelity Central Funds are not included in the Fund's expense ratio. The Fund indirectly bears its proportionate share of the expenses of any underlying Fidelity Central Funds. D Amount does not include the portfolio activity of any underlying Fidelity Central Funds. E Expense ratios reflect operating expenses of the class. Expenses before reductions do not reflect amounts reimbursed by the investment adviser or reductions from brokerage service arrangements or reductions from other expense offset arrangements and do not represent the amount paid by the class during periods when reimbursements or reductions occur. Expenses net of fee waivers reflect expenses after reimbursement by the investment adviser but prior to reductions from brokerage service arrangements or other expense offset arrangements. Expenses net of all reductions represent the net expenses paid by the class. |
Financial Highlights - Institutional Class
Years ended October 31, | 2011 | 2010 | 2009 | 2008 | 2007 G |
Selected Per-Share Data | | | | | |
Net asset value, beginning of period | $ 54.02 | $ 44.39 | $ 38.31 | $ 70.25 | $ 54.00 |
Income from Investment Operations | | | | | |
Net investment income (loss) D | .51 | .46 | .49 | .52 | .25 |
Net realized and unrealized gain (loss) | (1.18) | 9.65 | 5.72 | (28.78) | 15.99 |
Total from investment operations | (.67) | 10.11 | 6.21 | (28.26) | 16.24 |
Distributions from net investment income | (.48) | (.49) | (.14) | (.45) | - |
Distributions from net realized gain | (.44) | - | - | (3.27) | - |
Total distributions | (.92) | (.49) | (.14) | (3.72) | - |
Redemption fees added to paid in capital D | .01 | .01 | .01 | .04 | .01 |
Net asset value, end of period | $ 52.44 | $ 54.02 | $ 44.39 | $ 38.31 | $ 70.25 |
Total Return B, C | (1.35)% | 22.94% | 16.40% | (42.11)% | 30.09% |
Ratios to Average Net Assets E, H | | | | | |
Expenses before reductions | .82% | .95% | 1.17% | 1.11% | 1.01% A |
Expenses net of fee waivers, if any | .82% | .95% | 1.17% | 1.11% | 1.01% A |
Expenses net of all reductions | .82% | .90% | 1.14% | 1.08% | .99% A |
Net investment income (loss) | .89% | .92% | 1.23% | .92% | .83% A |
Supplemental Data | | | | | |
Net assets, end of period (000 omitted) | $ 68,112 | $ 46,737 | $ 17,956 | $ 8,870 | $ 4,064 |
Portfolio turnover rate F | 104% | 143% | 123% | 63% | 42% |
A Annualized B Total returns for periods of less than one year are not annualized. C Total returns would have been lower if certain expenses had not been reduced during the applicable periods shown. D Calculated based on average shares outstanding during the period. E Fees and expenses of any underlying Fidelity Central Funds are not included in the Fund's expense ratio. The Fund indirectly bears its proportionate share of the expenses of any underlying Fidelity Central Funds. F Amount does not include the portfolio activity of any underlying Fidelity Central Funds. G For the period May 2, 2007 (commencement of sale of shares) to October 31, 2007. H Expense ratios reflect operating expenses of the class. Expenses before reductions do not reflect amounts reimbursed by the investment adviser or reductions from brokerage service arrangements or reductions from other expense offset arrangements and do not represent the amount paid by the class during periods when reimbursements or reductions occur. Expense ratios before reductions for start-up periods may not be representative of longer-term operating periods. Expenses net of fee waivers reflect expenses after reimbursement by the investment adviser but prior to reductions from brokerage service arrangements or other expense offset arrangements. Expenses net of all reductions represent the net expenses paid by the class. |
See accompanying notes which are an integral part of the financial statements.
Annual Report
Notes to Financial Statements
For the period ended October 31, 2011
1. Organization.
Fidelity Canada Fund (the Fund) is a fund of Fidelity Investment Trust (the Trust) and is authorized to issue an unlimited number of shares. The Trust is registered under the Investment Company Act of 1940, as amended (the 1940 Act), as an open-end management investment company organized as a Massachusetts business trust. The Fund offers Class A, Class T, Class C, Canada, and Institutional Class shares, each of which, along with Class B shares, has equal rights as to assets and voting privileges. Effective after the close of business on September 1, 2010, Class B shares were closed to new accounts and additional purchases, except for exchanges and reinvestments by existing shareholders. Each class has exclusive voting rights with respect to matters that affect that class. Class B shares will automatically convert to Class A shares after a holding period of seven years from the initial date of purchase. Investment income, realized and unrealized capital gains and losses, the common expenses of the Fund, and certain fund-level expense reductions, if any, are allocated on a pro-rata basis to each class based on the relative net assets of each class to the total net assets of the Fund. Each class differs with respect to transfer agent and distribution and service plan fees incurred. Certain expense reductions may also differ by class.
2. Investments in Fidelity Central Funds.
The Fund invests in Fidelity Central Funds, which are open-end investment companies available only to other investment companies and accounts managed by Fidelity Management & Research Company (FMR) and its affiliates. The Fund's Schedule of Investments lists each of the Fidelity Central Funds held as of period end, if any, as an investment of the Fund, but does not include the underlying holdings of each Fidelity Central Fund. As an Investing Fund, the Fund indirectly bears its proportionate share of the expenses of the underlying Fidelity Central Funds.
The Money Market Central Funds seek preservation of capital and current income and are managed by Fidelity Investments Money Management, Inc. (FIMM), an affiliate of FMR.
A complete unaudited list of holdings for each Fidelity Central Fund is available upon request or at the Securities and Exchange Commission (the SEC) web site at www.sec.gov. In addition, the financial statements of the Fidelity Central Funds, which are not covered by the Fund's Report of Independent Registered Public Accounting Firm are available on the SEC web site or upon request.
3. Significant Accounting Policies.
The financial statements have been prepared in conformity with accounting principles generally accepted in the United States of America (GAAP), which require management to make certain estimates and assumptions at the date of the financial statements. Actual results could differ from those estimates. Subsequent events, if any, through the date that the financial statements were issued have been evaluated in the preparation of the financial statements. The following summarizes the significant accounting policies of the Fund:
Security Valuation. Investments are valued as of 4:00 p.m. Eastern time on the last calendar day of the period. The Fund uses independent pricing services approved by the Board of Trustees to value its investments. When current market prices or quotations are not readily available or reliable, valuations may be determined in good faith in accordance with procedures adopted by the Board of Trustees. Factors used in determining value may include market or security specific events. The frequency with which these procedures are used cannot be predicted and they may be utilized to a significant extent. The value used for net asset value (NAV) calculation under these procedures may differ from published prices for the same securities.
The Fund categorizes the inputs to valuation techniques used to value its investments into a disclosure hierarchy consisting of three levels as shown below:
Level 1 - quoted prices in active markets for identical investments
Level 2 - other significant observable inputs (including quoted prices for similar investments, interest rates, prepayment speeds, etc.)
Level 3 - unobservable inputs (including the Fund's own assumptions based on the best information available)
Changes in valuation techniques may result in transfers in or out of an assigned level within the disclosure hierarchy. Valuation techniques used to value the Fund's investments by major category are as follows:
Equity securities, including restricted securities, for which market quotations are readily available, are valued at the last reported sale price or official closing price as reported by an independent pricing service on the primary market or exchange on which they are traded and are categorized as Level 1 in the hierarchy. In the event there were no sales during the day or closing prices are not available, securities are valued at the last quoted bid price or may be valued using the last available price and are generally categorized as Level 2 in the hierarchy. For foreign equity securities, when significant market or security specific events arise, comparisons to the valuation of American Depositary Receipts (ADRs), futures contracts, Exchange-traded funds (ETFs) and certain indexes as well as quoted prices for similar securities are used and are categorized as Level 2 in the hierarchy in these
Annual Report
3. Significant Accounting Policies - continued
Security Valuation - continued
circumstances. Utilizing these techniques may result in transfers between Level 1 and Level 2. For restricted equity securities and private placements where observable inputs are limited, assumptions about market activity and risk are used and are categorized as Level 3 in the hierarchy.
Investments in open-end mutual funds, including the Fidelity Central Funds, are valued at their closing net asset value each business day and are categorized as Level 1 in the hierarchy.
Foreign Currency. The Fund may use foreign currency contracts to facilitate transactions in foreign-denominated securities. Gains and losses from these transactions may arise from changes in the value of the foreign currency or if the counterparties do not perform under the contracts' terms.
Foreign-denominated assets, including investment securities, and liabilities are translated into U.S. dollars at the exchange rate at period end. Purchases and sales of investment securities, income and dividends received and expenses denominated in foreign currencies are translated into U.S. dollars at the exchange rate in effect on the transaction date.
The effects of exchange rate fluctuations on investments are included with the net realized and unrealized gain (loss) on investment securities. Other foreign currency transactions resulting in realized and unrealized gain (loss) are disclosed separately.
Investment Transactions and Income. For financial reporting purposes, the Fund's investment holdings and NAV include trades executed through the end of the last business day of the period. The NAV per share for processing shareholder transactions is calculated as of the close of business of the New York Stock Exchange (NYSE), normally 4:00 p.m. Eastern time and includes trades executed through the end of the prior business day. Gains and losses on securities sold are determined on the basis of identified cost and may include proceeds received from litigation. Dividend income is recorded on the ex-dividend date, except for certain dividends from foreign securities where the ex-dividend date may have passed, which are recorded as soon as the Fund is informed of the ex-dividend date. Non-cash dividends included in dividend income, if any, are recorded at the fair market value of the securities received. Distributions received on securities that represent a return of capital or capital gain are recorded as a reduction of cost of investments and/or as a realized gain. The Fund estimates the components of distributions received that may be considered return of capital distributions or capital gain distributions. Interest income and distributions from the Fidelity Central Funds are accrued as earned. Interest income includes coupon interest and amortization of premium and accretion of discount on debt securities. Investment income is recorded net of foreign taxes withheld where recovery of such taxes is uncertain.
Expenses. Expenses directly attributable to a fund are charged to that fund. Expenses attributable to more than one fund are allocated among the respective funds on the basis of relative net assets or other appropriate methods. Expense estimates are accrued in the period to which they relate and adjustments are made when actual amounts are known.
Income Tax Information and Distributions to Shareholders. Each year, the Fund intends to qualify as a regulated investment company, including distributing substantially all of its taxable income and realized gains under Subchapter M of the Internal Revenue Code and filing its U.S. federal tax return. As a result, no provision for income taxes is required. As of October 31, 2011, the Fund did not have any unrecognized tax benefits in the financial statements. A fund's federal tax return is subject to examination by the Internal Revenue Service (IRS) for a period of three years. Foreign taxes are provided for based on the Fund's understanding of the tax rules and rates that exist in the foreign markets in which it invests.
Distributions are declared and recorded on the ex-dividend date. Income dividends and capital gain distributions are declared separately for each class. Income and capital gain distributions are determined in accordance with income tax regulations, which may differ from GAAP. In addition, the Fund claimed a portion of the payment made to redeeming shareholders as a distribution for income tax purposes.
Capital accounts within the financial statements are adjusted for permanent book-tax differences. These adjustments have no impact on net assets or the results of operations. Temporary book-tax differences will reverse in a subsequent period.
Book-tax differences are primarily due to foreign currency transactions, passive foreign investment companies (PFIC), deferred trustees compensation, capital loss carryforwards and losses deferred due to wash sales.
The federal tax cost of investment securities and unrealized appreciation (depreciation) as of period end were as follows:
Gross unrealized appreciation | $ 717,722,960 |
Gross unrealized depreciation | (119,654,228) |
Net unrealized appreciation (depreciation) on securities and other investments | $ 598,068,732 |
| |
Tax Cost | $ 4,041,939,474 |
Annual Report
Notes to Financial Statements - continued
3. Significant Accounting Policies - continued
Income Tax Information and Distributions to Shareholders - continued
The tax-based components of distributable earnings as of period end were as follows:
Undistributed ordinary income | $ 48,166,855 |
Capital loss carryforward | $ (230,403,828) |
Net unrealized appreciation (depreciation) | $ 598,095,680 |
Under the recently enacted Regulated Investment Company Modernization Act of 2010 (the Act), the Fund will be permitted to carry forward capital losses incurred in taxable years beginning after December 22, 2010 for an unlimited period. However, any losses incurred during those future taxable years will be required to be utilized prior to any losses incurred in pre-enactment taxable years, which generally expire after eight years from when they are incurred. Additionally, post-enactment capital losses that are carried forward will retain their character as either short-term or long-term capital losses rather than being considered all short-term as under previous law. The Fund's first fiscal year end subject to the Act will be October 31, 2012.
The tax character of distributions paid was as follows:
| October 31, 2011 | October 31, 2010 |
Ordinary Income | $ 70,378,562 | $ 34,208,293 |
Short-Term Trading (Redemption) Fees. Shares held by investors in the Fund less than 90 days are subject to a redemption fee equal to 1.50% of the net asset value of shares redeemed. All redemption fees, which reduce the proceeds of the shareholder redemption, are retained by the Fund and accounted for as an addition to paid in capital.
New Accounting Pronouncement. In May 2011, the Financial Accounting Standards Board issued Accounting Standard Update No. 2011-04, Fair Value Measurement (Topic 820) - Amendments to Achieve Common Fair Value Measurement and Disclosure Requirements in U.S. GAAP and IFRSs. The update changes the wording used to describe the requirements in GAAP for measuring fair value and for disclosing information about fair value measurements. The update is effective during interim and annual periods beginning after December 15, 2011. Management is currently evaluating the impact of the update's adoption on the Fund's financial statement disclosures.
4. Operating Policies.
Restricted Securities. The Fund may invest in securities that are subject to legal or contractual restrictions on resale. These securities generally may be resold in transactions exempt from registration or to the public if the securities are registered. Disposal of these securities may involve time-consuming negotiations and expense, and prompt sale at an acceptable price may be difficult. Information regarding restricted securities is included at the end of the Fund's Schedule of Investments.
5. Purchases and Sales of Investments.
Purchases and sales of securities, other than short-term securities, aggregated $5,106,179,444 and $5,000,568,630, respectively.
6. Fees and Other Transactions with Affiliates.
Management Fee. FMR and its affiliates provide the Fund with investment management related services for which the Fund pays a monthly management fee. The management fee is the sum of an individual fund fee rate that is based on an annual rate of .45% of the Fund's average net assets and a group fee rate that averaged .26% during the period. The group fee rate is based upon the average net assets of all the mutual funds advised by FMR. The group fee rate decreases as assets under management increase and increases as assets under management decrease. In addition, the management fee is subject to a performance adjustment(up to a maximum of ± .20% of the Fund's average net assets over a 36 month performance period). The upward or downward adjustment to the management fee is based on the relative investment performance of Canada, as compared to an appropriate benchmark index. For the period, the total annual management fee rate, including the performance adjustment, was .57% of the Fund's average net assets.
Annual Report
6. Fees and Other Transactions with Affiliates - continued
Distribution and Service Plan Fees. In accordance with Rule 12b-1 of the 1940 Act, the Fund has adopted separate Distribution and Service Plans for each class of shares. Certain classes pay Fidelity Distributors Corporation (FDC), an affiliate of FMR, separate Distribution and Service Fees, each of which is based on an annual percentage of each class' average net assets. In addition, FDC may pay financial intermediaries for selling shares of the Fund and providing shareholder support services. For the period, the Distribution and Service Fee rates, total fees and amounts retained by FDC were as follows:
| Distribution
Fee | Service
Fee | Total Fees | Retained
by FDC |
Class A | -% | .25% | $ 566,795 | $ 32,945 |
Class T | .25% | .25% | 185,890 | 210 |
Class B | .75% | .25% | 139,258 | 104,508 |
Class C | .75% | .25% | 869,017 | 422,773 |
| | | $ 1,760,960 | $ 560,436 |
Sales Load. FDC may receive a front-end sales charge of up to 5.75% for selling Class A shares, and 3.50% for selling Class T shares, some of which is paid to financial intermediaries for selling shares of the Fund. Depending on the holding period, FDC may receive contingent deferred sales charges levied on Class A, Class T, Class B, and Class C redemptions. The deferred sales charges range from 5% to 1% for Class B, 1% for Class C, 1.00% for certain purchases of Class A shares and .25% for certain purchases of Class T shares.
For the period, sales charge amounts retained by FDC were as follows:
| Retained
by FDC |
Class A | $ 260,709 |
Class T | 25,148 |
Class B | 38,839 |
Class C | 30,296 |
| $ 354,992 |
* When Class B and Class C shares are initially sold, FDC pays commissions from its own resources to financial intermediaries through which the sales are made.
Transfer Agent Fees. Fidelity Investments Institutional Operations Company, Inc. (FIIOC), an affiliate of FMR, is the transfer, dividend disbursing and shareholder servicing agent for each class of the Fund. FIIOC receives account fees and asset-based fees that vary according to the account size and type of account of the shareholders of the respective classes of the Fund. FIIOC pays for typesetting, printing and mailing of shareholder reports, except proxy statements. For the period, transfer agent fees for each class were as follows:
| Amount | % of
Average
Net Assets |
Class A | $ 593,736 | .26 |
Class T | 114,586 | .31 |
Class B | 42,095 | .30 |
Class C | 221,883 | .26 |
Canada | 9,286,013 | .21 |
Institutional Class | 168,346 | .21 |
| $ 10,426,659 | |
Accounting and Security Lending Fees. Fidelity Service Company, Inc. (FSC), an affiliate of FMR, maintains the Fund's accounting records. The accounting fee is based on the level of average net assets for the month. Under a separate contract, FSC administers the security lending program. The security lending fee is based on the number and duration of lending transactions.
Brokerage Commissions. The Fund placed a portion of its portfolio transactions with brokerage firms which are affiliates of the investment adviser. The commissions paid to these affiliated firms were $10,658 for the period.
Interfund Lending Program. Pursuant to an Exemptive Order issued by the SEC, the Fund, along with other registered investment companies having management contracts with FMR, may participate in an interfund lending program. This program provides an alternative credit facility allowing the
Annual Report
Notes to Financial Statements - continued
6. Fees and Other Transactions with Affiliates - continued
Interfund Lending Program - continued
funds to borrow from, or lend money to, other participating affiliated funds. At period end, there were no interfund loans outstanding. The Fund's activity in this program during the period for which loans were outstanding was as follows:
Borrower or Lender | Average Daily
Loan Balance | Weighted Average Interest Rate | Interest
Expense |
Borrower | $ 10,827,176 | .35% | $ 1,812 |
7. Committed Line of Credit.
The Fund participates with other funds managed by FMR or an affiliate in a $4.0 billion credit facility (the "line of credit") to be utilized for temporary or emergency purposes to fund shareholder redemptions or for other short-term liquidity purposes. The Fund has agreed to pay commitment fees on its pro-rata portion of the line of credit, which amounted to $14,864 and is reflected in Miscellaneous expenses on the Statement of Operations. During the period, there were no borrowings on this line of credit.
8. Security Lending.
The Fund lends portfolio securities through a lending agent from time to time in order to earn additional income. For equity securities, a lending agent is used and may loan securities to certain qualified borrowers, including Fidelity Capital Markets (FCM), a broker-dealer affiliated with the Fund. On the settlement date of the loan, the Fund receives collateral (in the form of U.S. Treasury obligations, letters of credit and/or cash) against the loaned securities and maintains collateral in an amount not less than 100% of the market value of the loaned securities during the period of the loan. The market value of the loaned securities is determined at the close of business of the Fund and any additional required collateral is delivered to the Fund on the next business day. If the borrower defaults on its obligation to return the securities loaned because of insolvency or other reasons, a fund could experience delays and costs in recovering the securities loaned or in gaining access to the collateral. Any cash collateral received is invested in the Fidelity Securities Lending Cash Central Fund. The value of loaned securities and cash collateral at period end are disclosed on the Fund's Statement of Assets and Liabilities. Security lending income represents the income earned on investing cash collateral, less rebates paid to borrowers and any lending agent fees associated with the loan, plus any premium payments received for lending certain types of securities. Security lending income is presented in the Statement of Operations as a component of income from Fidelity Central Funds. Total security lending income during the period amounted to $3,940,584. During the period, there were no securities loaned to FCM.
9. Expense Reductions.
Many of the brokers with whom FMR places trades on behalf of the Fund provided services to the Fund in addition to trade execution. These services included payments of certain expenses on behalf of the Fund totaling $167,832 for the period.
10. Distributions to Shareholders.
Distributions to shareholders of each class were as follows:
Years ended October 31, | 2011 | 2010 |
From net investment income | | |
Class A | $ 1,141,830 | $ 756,039 |
Class T | 123,341 | 106,904 |
Class B | 2,503 | 15,600 |
Class C | 36,231 | 97,752 |
Canada | 33,570,065 | 33,027,962 |
Institutional Class | 443,845 | 204,036 |
Total | $ 35,317,815 | $ 34,208,293 |
From net realized gain | | |
Class A | $ 1,445,324 | $ - |
Class T | 261,152 | - |
Class B | 101,491 | - |
Class C | 470,108 | - |
Canada | 32,375,322 | - |
Institutional Class | 407,350 | - |
Total | $ 35,060,747 | $ - |
Annual Report
11. Share Transactions.
Transactions for each class of shares were as follows:
| Shares | Dollars |
Years ended October 31, | 2011 | 2010 | 2011 | 2010 |
Class A | | | | |
Shares sold | 2,386,291 | 2,050,255 | $ 138,991,055 | $ 102,518,373 |
Reinvestment of distributions | 39,424 | 14,622 | 2,233,433 | 696,013 |
Shares redeemed | (1,467,607) | (773,357) | (82,665,471) | (38,292,678) |
Net increase (decrease) | 958,108 | 1,291,520 | $ 58,559,017 | $ 64,921,708 |
Class T | | | | |
Shares sold | 254,873 | 296,633 | $ 14,715,904 | $ 14,818,898 |
Reinvestment of distributions | 6,640 | 2,182 | 375,773 | 103,790 |
Shares redeemed | (189,243) | (113,003) | (10,669,184) | (5,600,141) |
Net increase (decrease) | 72,270 | 185,812 | $ 4,422,493 | $ 9,322,547 |
Class B | | | | |
Shares sold | 29,930 | 134,473 | $ 1,729,701 | $ 6,579,801 |
Reinvestment of distributions | 1,508 | 263 | 84,713 | 12,424 |
Shares redeemed | (54,348) | (47,606) | (3,060,843) | (2,342,627) |
Net increase (decrease) | (22,910) | 87,130 | $ (1,246,429) | $ 4,249,598 |
Class C | | | | |
Shares sold | 1,081,104 | 647,123 | $ 62,770,855 | $ 31,812,568 |
Reinvestment of distributions | 7,014 | 1,580 | 392,322 | 74,410 |
Shares redeemed | (391,485) | (196,235) | (21,249,300) | (9,599,233) |
Net increase (decrease) | 696,633 | 452,468 | $ 41,913,877 | $ 22,287,745 |
Canada | | | | |
Shares sold | 20,804,881 | 20,151,337 | $ 1,223,871,558 | $ 1,010,632,290 |
Reinvestment of distributions | 1,069,329 | 659,119 | 60,856,944 | 31,486,105 |
Shares redeemed | (23,043,159) | (18,629,713) | (1,313,818,426) | (923,131,901) |
Net increase (decrease) | (1,168,949) | 2,180,743 | $ (29,089,924) | $ 118,986,494 |
Institutional Class | | | | |
Shares sold | 1,331,261 | 717,543 | $ 79,262,853 | $ 36,118,321 |
Reinvestment of distributions | 10,934 | 2,830 | 620,606 | 134,893 |
Shares redeemed | (908,649) | (259,715) | (51,418,074) | (12,754,674) |
Net increase (decrease) | 433,546 | 460,658 | $ 28,465,385 | $ 23,498,540 |
12. Other.
The Fund's organizational documents provide former and current trustees and officers with a limited indemnification against liabilities arising in connection with the performance of their duties to the Fund. In the normal course of business, the Fund may also enter into contracts that provide general indemnifications. The Fund's maximum exposure under these arrangements is unknown as this would be dependent on future claims that may be made against the Fund. The risk of material loss from such claims is considered remote.
Annual Report
Report of Independent Registered Public Accounting Firm
To the Trustees of Fidelity Investment Trust and the Shareholders of Fidelity Canada Fund:
In our opinion, the accompanying statement of assets and liabilities, including the schedule of investments, and the related statements of operations and of changes in net assets and the financial highlights present fairly, in all material respects, the financial position of Fidelity Canada Fund (a fund of Fidelity Investment Trust) at October 31, 2011, the results of its operations for the year then ended, the changes in its net assets for each of the two years in the period then ended and the financial highlights for each of the periods indicated, in conformity with accounting principles generally accepted in the United States of America. These financial statements and financial highlights (hereafter referred to as "financial statements") are the responsibility of the Fidelity Canada Fund's management. Our responsibility is to express an opinion on these financial statements based on our audits. We conducted our audits of these financial statements in accordance with the standards of the Public Company Accounting Oversight Board (United States). Those standards require that we plan and perform the audit to obtain reasonable assurance about whether the financial statements are free of material misstatement. An audit includes examining, on a test basis, evidence supporting the amounts and disclosures in the financial statements, assessing the accounting principles used and significant estimates made by management, and evaluating the overall financial statement presentation. We believe that our audits, which included confirmation of securities at October 31, 2011 by correspondence with the custodian and brokers, provide a reasonable basis for our opinion.
PricewaterhouseCoopers LLP
Boston, Massachusetts
December 16, 2011
Annual Report
The Trustees, Members of the Advisory Board, and executive officers of the trust and fund, as applicable, are listed below. The Board of Trustees governs the fund and is responsible for protecting the interests of shareholders. The Trustees are experienced executives who meet periodically throughout the year to oversee the fund's activities, review contractual arrangements with companies that provide services to the fund, oversee management of the risks associated with such activities and contractual arrangements, and review the fund's performance. Except for James C. Curvey, each of the Trustees oversees 226 funds advised by FMR or an affiliate. Mr. Curvey oversees 429 funds advised by FMR or an affiliate.
The Trustees hold office without limit in time except that (a) any Trustee may resign; (b) any Trustee may be removed by written instrument, signed by at least two-thirds of the number of Trustees prior to such removal; (c) any Trustee who requests to be retired or who has become incapacitated by illness or injury may be retired by written instrument signed by a majority of the other Trustees; and (d) any Trustee may be removed at any special meeting of shareholders by a two-thirds vote of the outstanding voting securities of the trust. Each Trustee who is not an interested person (as defined in the 1940 Act) (Independent Trustee), shall retire not later than the last day of the calendar year in which his or her 75th birthday occurs. The Independent Trustees may waive this mandatory retirement age policy with respect to individual Trustees. The executive officers and Advisory Board Members hold office without limit in time, except that any officer and Advisory Board Member may resign or may be removed by a vote of a majority of the Trustees at any regular meeting or any special meeting of the Trustees. Except as indicated, each individual has held the office shown or other offices in the same company for the past five years.
Experience, Skills, Attributes, and Qualifications of the Fund's Trustees. The Governance and Nominating Committee has adopted a statement of policy that describes the experience, qualifications, attributes, and skills that are necessary and desirable for potential Independent Trustee candidates (Statement of Policy). The Board believes that each Trustee satisfied at the time he or she was initially elected or appointed a Trustee, and continues to satisfy, the standards contemplated by the Statement of Policy. The Governance and Nominating Committee also engages professional search firms to help identify potential Independent Trustee candidates who have the experience, qualifications, attributes, and skills consistent with the Statement of Policy. From time to time, additional criteria based on the composition and skills of the current Independent Trustees, as well as experience or skills that may be appropriate in light of future changes to board composition, business conditions, and regulatory or other developments, have also been considered by the professional search firms and the Governance and Nominating Committee. In addition, the Board takes into account the Trustees' commitment and participation in Board and committee meetings, as well as their leadership of standing and ad hoc committees throughout their tenure.
In determining that a particular Trustee was and continues to be qualified to serve as a Trustee, the Board has considered a variety of criteria, none of which, in isolation, was controlling. The Board believes that, collectively, the Trustees have balanced and diverse experience, qualifications, attributes, and skills, which allow the Board to operate effectively in governing the fund and protecting the interests of shareholders. Information about the specific experience, skills, attributes, and qualifications of each Trustee, which in each case led to the Board's conclusion that the Trustee should serve (or continue to serve) as a trustee of the fund, is provided below.
Board Structure and Oversight Function. James C. Curvey is an interested person (as defined in the 1940 Act) and currently serves as Acting Chairman. The Trustees have determined that an interested Chairman is appropriate and benefits shareholders because an interested Chairman has a personal and professional stake in the quality and continuity of services provided to the fund. Independent Trustees exercise their informed business judgment to appoint an individual of their choosing to serve as Chairman, regardless of whether the Trustee happens to be independent or a member of management. The Independent Trustees have determined that they can act independently and effectively without having an Independent Trustee serve as Chairman and that a key structural component for assuring that they are in a position to do so is for the Independent Trustees to constitute a substantial majority for the Board. The Independent Trustees also regularly meet in executive session. Ned C. Lautenbach serves as Chairman of the Independent Trustees and as such (i) acts as a liaison between the Independent Trustees and management with respect to matters important to the Independent Trustees and (ii) with management prepares agendas for Board meetings.
Fidelity funds are overseen by different Boards of Trustees. The fund's Board oversees Fidelity's equity and high income funds and another Board oversees Fidelity's investment-grade bond, money market, and asset allocation funds. The asset allocation funds may invest in Fidelity funds overseen by the fund's Board. The use of separate Boards, each with its own committee structure, allows the Trustees of each group of Fidelity funds to focus on the unique issues of the funds they oversee, including common research, investment, and operational issues. On occasion, the separate Boards establish joint committees to address issues of overlapping consequences for the Fidelity funds overseen by each Board.
The Trustees operate using a system of committees to facilitate the timely and efficient consideration of all matters of importance to the Trustees, the fund, and fund shareholders and to facilitate compliance with legal and regulatory requirements and oversight of the fund's activities and associated risks. The Board, acting through its committees, has charged FMR and its affiliates with (i) identifying events or circumstances the occurrence of which could have demonstrably adverse effects on the fund's business and/or reputation; (ii) implementing processes and controls to lessen the possibility that such events or circumstances occur or to mitigate the effects of such events or circumstances if they do occur; and (iii) creating and maintaining a system designed to evaluate continuously business and market conditions in order to facilitate the identification and implementation processes described in (i) and (ii) above. Because the day-to-day operations and activities of the fund are carried out by or through FMR, its affiliates and other service providers, the fund's exposure to risks is mitigated but not eliminated by the processes overseen by the Trustees. While each of the Board's committees has responsibility for overseeing different aspects of the fund's activities, oversight is exercised primarily through the Operations, Audit, and Compliance Committees. In addition, the Independent Trustees have worked with FMR to enhance the Board's oversight of investment and financial risks, legal and regulatory risks, technology risks, and operational risks, including the development of additional risk reporting to the Board. For example, a working group comprised of Independent Trustees and FMR has worked and continues to work to review the Fidelity funds' valuation-related activities, reporting and risk management. Appropriate personnel, including but not limited to the fund's Chief Compliance Officer (CCO), FMR's internal auditor, the independent accountants, the fund's Treasurer and portfolio management personnel, make periodic reports to the Board's committees, as appropriate, including an annual review of FMR's risk management program for the Fidelity funds. The responsibilities of each standing committee, including their oversight responsibilities, are described further under "Standing Committees of the Fund's Trustees."
Annual Report
Trustees and Officers - continued
The fund's Statement of Additional Information (SAI) includes more information about the Trustees. To request a free copy, call Fidelity at 1-877-208-0098.
Interested Trustees*:
Correspondence intended for each Trustee who is an interested person may be sent to Fidelity Investments, 82 Devonshire Street, Boston, Massachusetts 02109.
Name, Age; Principal Occupations and Other Relevant Experience+ |
James C. Curvey (76) |
| Year of Election or Appointment: 2007 Mr. Curvey is Trustee and Acting Chairman of the Board of Trustees of certain Trusts. Mr. Curvey also serves as Trustee (2007-present) of other investment companies advised by FMR. Mr. Curvey is a Director of Fidelity Investments Money Management, Inc. (2009-present), Director of Fidelity Research & Analysis Co. (2009-present) and Director of FMR and FMR Co., Inc. (2007-present). Mr. Curvey is also Vice Chairman (2007-present) and Director of FMR LLC. In addition, Mr. Curvey serves as an Overseer for the Boston Symphony Orchestra and a member of the Trustees of Villanova University. Previously, Mr. Curvey was the Vice Chairman (2006-2007) and Director (2000-2007) of FMR Corp. |
Ronald P. O'Hanley (54) |
| Year of Election or Appointment: 2011 Mr. O'Hanley is Director of FMR Co., Inc. (2010-present), Director of Fidelity Investments Money Management, Inc. (2010-present), Director of Fidelity Research & Analysis Company (2010-present), President of Fidelity Asset Management and Corporate Services and a member of Fidelity's Executive Committee (2010-present). Previously, Mr. O'Hanley served as President and Chief Executive Officer of BNY Mellon Asset Management (2007-2010). Mr. O'Hanley also served as Vice Chairman of Bank New York Mellon Corp. and a member of that firm's Executive Committee. Prior to the 2007 merger of The Bank of New York and Mellon Financial Corporation, he was Vice Chairman of Mellon Financial Corporation and President and Chief Executive Officer of Mellon Asset Management. He joined Mellon in February 1997. Mr. O'Hanley currently serves as Chairman of the Boston Public Library Foundation Board of Directors and sits on the Board of Directors of Beth Israel Deaconess Medical Center, the Board of Trustees of the Marine Biological Laboratory and the Advisory Board of the Maxwell School of Citizenship and Public Administration at Syracuse University. Mr. O'Hanley also chairs the Council on Asset Management for the Financial Services Roundtable and is a member of the Board of Directors of Institutional Investor's U.S. Institute. |
* Trustees have been determined to be "Interested Trustees" by virtue of, among other things, their affiliation with the trust or various entities under common control with FMR.
+ The information above includes each Trustee's principal occupation during the last five years and other information relating to the experience, attributes, and skills relevant to each Trustee's qualifications to serve as a Trustee, which led to the conclusion that each Trustee should serve as a Trustee for the fund.
Independent Trustees:
Correspondence intended for each Independent Trustee (that is, the Trustees other than the Interested Trustees) may be sent to Fidelity Investments, P.O. Box 55235, Boston, Massachusetts 02205-5235.
Name, Age; Principal Occupations and Other Relevant Experience+ |
Dennis J. Dirks (63) |
| Year of Election or Appointment: 2005 Prior to his retirement in May 2003, Mr. Dirks was Chief Operating Officer and a member of the Board of The Depository Trust & Clearing Corporation (DTCC). He also served as President, Chief Operating Officer, and Board member of The Depository Trust Company (DTC) and President and Board member of the National Securities Clearing Corporation (NSCC). In addition, Mr. Dirks served as Chief Executive Officer and Board member of the Government Securities Clearing Corporation, Chief Executive Officer and Board member of the Mortgage-Backed Securities Clearing Corporation, as a Trustee and a member of the Finance Committee of Manhattan College (2005-2008), and as a Trustee and a member of the Finance Committee of AHRC of Nassau County (2006-2008). Mr. Dirks is a member of the Independent Directors Council (IDC) Governing Council (2010-Present) and Board of Directors for The Brookville Center for Children's Services, Inc. (2009-present). |
Alan J. Lacy (58) |
| Year of Election or Appointment: 2008 Mr. Lacy serves as Senior Adviser (2007-present) of Oak Hill Capital Partners, L.P. (private equity). Mr. Lacy also served as Chief Executive Officer (2000-2005) and Vice Chairman (2005-2006) of Sears Holdings Corporation and Sears, Roebuck and Co. (retail). In addition, Mr. Lacy serves as a member of the Board of Directors of Dave & Buster's, Inc. (restaurant and entertainment complexes, 2010-present), The Hillman Companies, Inc. (hardware wholesalers, 2010-present), and Bristol-Myers Squibb Company (global pharmaceuticals, 2007-present). Mr. Lacy is a member of the Board of Trustees of The National Parks Conservation Association (2006-Present). Previously, Mr. Lacy served as Chairman of the Board of Trustees of the National Parks Conservation Association (2008-2011) and as a member of the Board of Directors for the Western Union Company (global money transfer, 2006-2011). |
Ned C. Lautenbach (67) |
| Year of Election or Appointment: 2000 Mr. Lautenbach is Chairman of the Independent Trustees of the Equity and High Income Funds (2006-present). Mr. Lautenbach currently serves as the Lead Director of the Eaton Corporation Board of Directors (diversified industrial, 1997-present). Mr. Lautenbach is also a member of the Board of Directors of the Philharmonic Center for the Arts in Naples, Florida (1999-present); a member of the Board of Trustees of Fairfield University (2005-present); and a member of the Council on Foreign Relations (1994-present). Previously, Mr. Lautenbach was a Partner/Advisory Partner at Clayton, Dubilier & Rice, LLC (private equity investment, 1998-2010), as well as a Director of Sony Corporation (2006-2007). |
Joseph Mauriello (67) |
| Year of Election or Appointment: 2008 Prior to his retirement in January 2006, Mr. Mauriello served in numerous senior management positions including Deputy Chairman and Chief Operating Officer (2004-2005), and Vice Chairman of Financial Services (2002-2004) of KPMG LLP US (professional services, 1965-2005). Mr. Mauriello currently serves as a member of the Board of Directors of XL Group plc. (global insurance and re-insurance, 2006-present) and of Arcadia Resources Inc. (health care services and products, 2007-present). Previously, Mr. Mauriello served as a Director of the Hamilton Funds of the Bank of New York (2006-2007). |
Robert W. Selander (61) |
| Year of Election or Appointment: 2011 Previously, Mr. Selander served as a Member of the Advisory Board of Fidelity's Equity and High Income Funds (2011), Executive Vice Chairman (2010), Chief Executive Officer (2009-2010), and President and Chief Executive Officer (1997-2009) of Mastercard, Inc. |
Cornelia M. Small (67) |
| Year of Election or Appointment: 2005 Ms. Small is a member of the Board of Directors of the Teagle Foundation (2009-present). Ms. Small is also a member of the Investment Committee, and Chair (2008-present) and a member of the Board of Trustees of Smith College. In addition, Ms. Small serves on the Investment Committee of the Berkshire Taconic Community Foundation (2008-present). Previously, Ms. Small served as Chairperson of the Investment Committee (2002-2008) of Smith College. In addition, Ms. Small served as Chief Investment Officer, Director of Global Equity Investments, and a member of the Board of Directors of Scudder, Stevens & Clark and Scudder Kemper Investments. |
William S. Stavropoulos (72) |
| Year of Election or Appointment: 2001 Mr. Stavropoulos is Vice Chairman of the Independent Trustees of the Equity and High Income Funds (2006-present). Mr. Stavropoulos serves as President and Founder of the Michigan Baseball Foundation, the Great Lakes Loons (2007-present). Mr. Stavropoulos is Chairman Emeritus of the Board of Directors of The Dow Chemical Company, where he previously served in numerous senior management positions, including President, CEO (1995-2000; 2002-2004), Chairman of the Executive Committee (2000-2006), and as a member of the Board of Directors (1990-2006). Currently, Mr. Stavropoulos is Chairman of Univar (global distributor of commodity and specialty chemicals, 2010-present), a Director of Teradata Corporation (data warehousing and technology solutions, 2008-present), Chemical Financial Corporation, Maersk Inc. (industrial conglomerate), Tyco International, Inc. (multinational manufacturing and services, 2007-present), and a member of the Advisory Board for Metalmark Capital (private equity investment, 2005-present). Mr. Stavropoulos is a special advisor to Clayton, Dubilier & Rice, LLC (private equity investment). In addition, Mr. Stavropoulos is a member of the University of Notre Dame Advisory Council for the College of Science. |
David M. Thomas (62) |
| Year of Election or Appointment: 2008 Previously, Mr. Thomas served as Executive Chairman (2005-2006) and Chairman and Chief Executive Officer (2000-2005) of IMS Health, Inc. (pharmaceutical and healthcare information solutions). In addition, Mr. Thomas serves as a member of the Board of Directors of Fortune Brands, Inc. (consumer products), and Interpublic Group of Companies, Inc. (marketing communication, 2004-present). |
Michael E. Wiley (61) |
| Year of Election or Appointment: 2008 Mr. Wiley also serves as a Director of Asia Pacific Exploration Consolidated (international oil and gas exploration and production, 2008-present). Mr. Wiley serves as a Director of Tesoro Corporation (independent oil refiner and marketer, 2005-present), and a Director of Bill Barrett Corporation (exploration and production, 2005-present). In addition, Mr. Wiley also serves as a Director of Post Oak Bank (privately-held bank, 2004-present). Previously, Mr. Wiley served as a member of the Board of Trustees of the University of Tulsa (2000-2006; 2007-2010), as a Senior Energy Advisor of Katzenbach Partners, LLC (consulting, 2006-2007), as an Advisory Director of Riverstone Holdings (private investment), Chairman, President, and CEO of Baker Hughes, Inc. (oilfield services, 2000-2004), and as Director of Spinnaker Exploration Company (exploration and production, 2001-2005). |
+ The information above includes each Trustee's principal occupation during the last five years and other information relating to the experience, attributes, and skills relevant to each Trustee's qualifications to serve as a Trustee, which led to the conclusion that each Trustee should serve as a Trustee for the fund.
Advisory Board Members and Executive Officers:
Correspondence intended for each executive officer, Edward C. Johnson 3d, and Peter S. Lynch may be sent to Fidelity Investments, 82 Devonshire Street, Boston, Massachusetts 02109.
Name, Age; Principal Occupation |
Edward C. Johnson 3d (81) |
| Year of Election or Appointment: 2011 Member of the Advisory Board of Fidelity's Equity and High Income Funds. Mr. Johnson serves as Chief Executive Officer, Chairman, and a Director of FMR LLC, and also serves as Chairman and Director of FIL Limited. Previously, Mr. Johnson served as a Trustee and Chairman of the Board of certain Fidelity Trusts, Chairman and a Director of FMR, Chairman and a Director of FMR Co., Inc., and President of FMR LLC (2006-2007). |
Peter S. Lynch (67) |
| Year of Election or Appointment: 2003 Member of the Advisory Board of Fidelity's Equity and High Income Funds. Mr. Lynch is Vice Chairman and a Director of FMR and FMR Co., Inc. In addition, Mr. Lynch serves as a Trustee of Boston College and as the Chairman of the Inner-City Scholarship Fund. Previously, Mr. Lynch served on the Special Olympics International Board of Directors (1997-2006). |
Kenneth B. Robins (42) |
| Year of Election or Appointment: 2008 President and Treasurer of Fidelity's Equity and High Income Funds. Mr. Robins also serves as President and Treasurer (2010-present) and Assistant Treasurer (2009-present) of other Fidelity funds and is an employee of Fidelity Investments (2004-present). Previously, Mr. Robins served as Deputy Treasurer of the Fidelity funds (2005-2008) and Treasurer and Chief Financial Officer of The North Carolina Capital Management Trust: Cash and Term Portfolios (2006-2008). |
Bruce T. Herring (46) |
| Year of Election or Appointment: 2006 Vice President of certain Equity Funds. Mr. Herring also serves as Chief Investment Officer and Director of Fidelity Management & Research (U.K.) Inc. (2010-present) and Group Chief Investments Officer of FMR. Previously, Mr. Herring served as Vice President (2005-2006) and Senior Vice President (2006-2007) of Fidelity Management & Research Company, Vice President of FMR Co., Inc. (2001-2007) and as a portfolio manager for Fidelity U.S. Equity Funds. |
Brian B. Hogan (47) |
| Year of Election or Appointment: 2009 Vice President of Equity and High Income Funds. Mr. Hogan also serves as President of FMR's Equity Division (2009-present). Previously, Mr. Hogan served as Senior Vice President, Equity Research of FMR (2006-2009) and as a portfolio manager. |
Scott C. Goebel (43) |
| Year of Election or Appointment: 2008 Secretary and Chief Legal Officer (CLO) of the Fidelity funds. Mr. Goebel also serves as Secretary of Fidelity Investments Money Management, Inc. (FIMM) (2010-present) and Fidelity Research and Analysis Company (FRAC) (2010-present); Secretary and CLO of The North Carolina Capital Management Trust: Cash and Term Portfolios (2008-present); General Counsel, Secretary, and Senior Vice President of FMR (2008-present) and FMR Co., Inc. (2008-present); employed by FMR LLC or an affiliate (2001-present); Chief Legal Officer of Fidelity Management & Research (Hong Kong) Limited (2008-present) and Assistant Secretary of Fidelity Management & Research (Japan) Inc. (2008-present), and Fidelity Management & Research (U.K.) Inc. (2008-present). Previously, Mr. Goebel served as Assistant Secretary of FIMM (2008-2010), FRAC (2008-2010), and the Funds (2007-2008) and as Vice President and Secretary of Fidelity Distributors Corporation (FDC) (2005-2007). |
William C. Coffey (42) |
| Year of Election or Appointment: 2009 Assistant Secretary of Fidelity's Equity and High Income Funds. Mr. Coffey also serves as Senior Vice President and Deputy General Counsel of FMR LLC (2010-present), and is an employee of Fidelity Investments. Previously, Mr. Coffey served as Vice President and Associate General Counsel of FMR LLC (2005-2009). |
Holly C. Laurent (57) |
| Year of Election or Appointment: 2008 Anti-Money Laundering (AML) Officer of the Fidelity funds. Ms. Laurent also serves as AML Officer of The North Carolina Capital Management Trust: Cash and Term Portfolios (2008-present) and is an employee of Fidelity Investments. Previously, Ms. Laurent was Senior Vice President and Head of Legal for Fidelity Business Services India Pvt. Ltd. (2006-2008), and Senior Vice President, Deputy General Counsel and Group Head for FMR LLC (2005-2006). |
Christine Reynolds (53) |
| Year of Election or Appointment: 2008 Chief Financial Officer of the Fidelity funds. Ms. Reynolds became President of Fidelity Pricing and Cash Management Services (FPCMS) in August 2008. Ms. Reynolds served as Chief Operating Officer of FPCMS (2007-2008). Previously, Ms. Reynolds served as President, Treasurer, and Anti-Money Laundering officer of the Fidelity funds (2004-2007). |
Kenneth A. Rathgeber (64) |
| Year of Election or Appointment: 2004 Chief Compliance Officer of Fidelity's Equity and High Income Funds. Mr. Rathgeber is Chief Compliance Officer of Fidelity Management & Research (Hong Kong) Limited (2008-present), Fidelity Management & Research (Japan) Inc. (2008-present), FMR (2005-present), FMR Co., Inc. (2005-present), Fidelity Management & Research (U.K.) Inc. (2005-present), Fidelity Research & Analysis Company (2005-present), Fidelity Investments Money Management, Inc. (2005-present), Pyramis Global Advisors, LLC (2005-present), and Strategic Advisers, Inc. (2005-present). |
Jeffrey S. Christian (50) |
| Year of Election or Appointment: 2009 Deputy Treasurer of the Fidelity funds. Mr. Christian is an employee of Fidelity Investments. Previously, Mr. Christian served as Chief Financial Officer (2008-2009) of certain Fidelity funds and Senior Vice President of Fidelity Pricing and Cash Management Services (FPCMS) (2004-2009). |
Joseph F. Zambello (54) |
| Year of Election or Appointment: 2011 Deputy Treasurer of the Fidelity funds. Mr. Zambello is an employee of Fidelity Investments. Previously, Mr. Zambello served as Vice President of FMR's Program Management Group (2009-2011) and Vice President of the Transfer Agent Oversight Group (2005-2009). |
Adrien E. Deberghes (44) |
| Year of Election or Appointment: 2008 Deputy Treasurer of Fidelity's Equity and High Income Funds. Mr. Deberghes also serves as Vice President and Assistant Treasurer of Fidelity Rutland Square Trust II and Fidelity Commonwealth Trust II (2011-present), Assistant Treasurer of other Fidelity funds (2010-present), and is an employee of Fidelity Investments (2008-present). Previously, Mr. Deberghes served as Senior Vice President of Mutual Fund Administration at State Street Corporation (2007-2008), Senior Director of Mutual Fund Administration at Investors Bank & Trust (2005-2007), and Director of Finance for Dunkin' Brands (2000-2005). |
Stephanie J. Dorsey (42) |
| Year of Election or Appointment: 2010 Assistant Treasurer of Fidelity's Equity and High Income Funds. Ms. Dorsey also serves as Deputy Treasurer of other Fidelity funds (2008-present) and is an employee of Fidelity Investments (2008-present). Previously, Ms. Dorsey served as Treasurer (2004-2008) of the JPMorgan Mutual Funds and Vice President (2004-2008) of JPMorgan Chase Bank. |
John R. Hebble (53) |
| Year of Election or Appointment: 2009 Assistant Treasurer of Fidelity's Equity and High Income Funds. Mr. Hebble also serves as President (2011-present), Treasurer, and Chief Financial Officer of The North Carolina Capital Management Trust: Cash and Term Portfolios (2008-present), President and Treasurer of other Fidelity funds (2008-present) and is an employee of Fidelity Investments. |
Gary W. Ryan (53) |
| Year of Election or Appointment: 2005 Assistant Treasurer of the Fidelity funds. Mr. Ryan is an employee of Fidelity Investments. Previously, Mr. Ryan served as Vice President of Fund Reporting in Fidelity Pricing and Cash Management Services (FPCMS) (1999-2005). |
Jonathan Davis (43) |
| Year of Election or Appointment: 2010 Assistant Treasurer of the Fidelity funds. Mr. Davis is also Assistant Treasurer of Fidelity Rutland Square Trust II and Fidelity Commonwealth Trust II. Mr. Davis is an employee of Fidelity Investments. Previously, Mr. Davis served as Vice President and Associate General Counsel of FMR LLC (2003-2010). |
Annual Report
The Board of Trustees of Fidelity Advisor Canada Fund voted to pay to shareholders of record at the opening of business on record date, the following distributions per share derived from capital gains realized from sales of portfolio securities, and dividends derived from net investment income:
| Pay Date | Record Date | Dividends | Capital Gains |
Class A | 12/05/11 | 12/02/11 | $0.329 | $0.289 |
Class T | 12/05/11 | 12/02/11 | $0.157 | $0.289 |
Class B | 12/05/11 | 12/02/11 | $- | $0.141 |
Class C | 12/05/11 | 12/02/11 | $- | $0.234 |
A percentage of the dividends distributed during the fiscal year for the following funds may be taken into account as a dividend for purposes of the maximum rate under section 1(h)(11) of the Internal Revenue Code.
| December 03, 2010 | December 30, 2010 |
Class A | 51% | 100% |
Class T | 60% | 100% |
Class B | 89% | 100% |
Class C | 80% | 100% |
The amounts per share which represent income derived from sources within, and taxes paid to, foreign countries or possessions of the United States are as follows:
| Pay Date | Income | Taxes |
Class A | 12/06/2010 | 0.611 | 0.077 |
| 12/31/2010 | 0.007 | 0.000 |
Class T | 12/06/2010 | 0.511 | 0.077 |
| 12/31/2010 | 0.007 | 0.000 |
Class B | 12/06/2010 | 0.346 | 0.077 |
| 12/31/2010 | 0.007 | 0.000 |
Class C | 12/06/2010 | 0.386 | 0.077 |
| 12/31/2010 | 0.007 | 0.000 |
The fund will notify shareholders in January 2012 of amounts for use in preparing 2011 income tax returns.
Annual Report
Board Approval of Investment Advisory Contracts and Management Fees
Fidelity Canada Fund
Each year, the Board of Trustees, including the Independent Trustees (together, the Board), votes on the renewal of the management contract and sub-advisory agreements (together, the Advisory Contracts) for the fund. The Board, assisted by the advice of fund counsel and Independent Trustees' counsel, requests and considers a broad range of information relevant to the renewal of the Advisory Contracts throughout the year.
The Board meets regularly and considers at each of its meetings factors that are relevant to its annual consideration of the renewal of the fund's Advisory Contracts, including the services and support provided to the fund and its shareholders. The Board has established various standing committees, each composed of Independent Trustees with varying backgrounds, to which the Board has assigned specific subject matter responsibilities in order to enhance effective decision-making by the Board. The Board, acting directly and through its Committees, requests and receives information concerning the annual consideration of the renewal of the fund's Advisory Contracts. The Board also meets as needed to consider matters specifically related to the Board's annual consideration of the renewal of Advisory Contracts. Members of the Board may also meet with trustees of other Fidelity funds through ad hoc joint committees to discuss certain matters relevant to the Fidelity funds.
At its July 2011 meeting, the Board of Trustees, including the Independent Trustees, unanimously determined to renew the fund's Advisory Contracts. In reaching its determination, the Board considered all factors it believed relevant, including (i) the nature, extent, and quality of the services to be provided to the fund and its shareholders (including the investment performance of the fund); (ii) the competitiveness of the fund's management fee and total expense ratio; (iii) the total costs of the services to be provided by and the profits to be realized by Fidelity from its relationship with the fund; (iv) the extent to which economies of scale would be realized as the fund grows; and (v) whether fee levels reflect these economies of scale, if any, for the benefit of fund shareholders.
In considering whether to renew the Advisory Contracts for the fund, the Board reached a determination, with the assistance of fund counsel and Independent Trustees' counsel and through the exercise of its business judgment, that the renewal of the Advisory Contracts is in the best interests of the fund and its shareholders and that the compensation payable under the Advisory Contracts is fair and reasonable. The Board's decision to renew the Advisory Contracts was not based on any single factor, but rather was based on a comprehensive consideration of all the information provided to the Board at its meetings throughout the year. The Board, in reaching its determination to renew the Advisory Contracts, is aware that shareholders in the fund have a broad range of investment choices available to them, including a wide choice among mutual funds offered by Fidelity's competitors, and that the fund's shareholders, who have the opportunity to review and weigh the disclosure provided by the fund in its prospectus and other public disclosures, have chosen to invest in this fund, managed by Fidelity.
Nature, Extent, and Quality of Services Provided. The Board considered the staffing within the investment adviser, FMR, and the sub-advisers (together, the Investment Advisers), including the backgrounds of the fund's investment personnel and the fund's investment objective and discipline. The Independent Trustees also had discussions with senior management of Fidelity's investment operations and investment groups. The Board considered the structure of the portfolio manager compensation program and whether this structure provides appropriate incentives to act in the best interests of the fund.
Resources Dedicated to Investment Management and Support Services. The Board and the Fund Oversight and Research Committees reviewed the general qualifications and capabilities of the Investment Advisers' investment staff, including its size, education, experience, and resources, as well as the Investment Advisers' approach to recruiting, training, managing, and compensating investment personnel. The Board also noted that FMR has devoted increased resources to non-U.S. offices. The Board noted that Fidelity's analysts have extensive resources, tools and capabilities which allow them to conduct sophisticated quantitative and fundamental analysis, as well as credit analysis of issuers, counterparties and enhancers. The Board also believes that Fidelity's investment professionals have sufficient access to global information and data so as to provide competitive investment results over time, and that those professionals also have access to sophisticated tools which permit them to assess portfolio construction and risk and performance attribution characteristics continuously, as well as to transmit new information and research conclusions rapidly around the world. Additionally, in their deliberations, the Board considered the Investment Advisers' trading capabilities and resources which are an integral part of the investment management process.
Shareholder and Administrative Services. The Board considered (i) the nature, extent, quality, and cost of advisory, administrative, and shareholder services performed by the Investment Advisers and their affiliates under the Advisory Contracts and under separate agreements covering transfer agency, pricing and bookkeeping, and securities lending services for the fund; (ii) the nature and extent of the investment adviser's supervision of third party service providers, principally custodians and subcustodians; and (iii) the resources devoted to, and the record of compliance with, the fund's compliance policies and procedures. The Board also reviewed the allocation of fund brokerage, including allocations to brokers affiliated with the Investment Advisers, the use of brokerage commissions to pay fund expenses, and the use of "soft" commission dollars to pay for research services.
The Board noted that the growth of fund assets over time across the complex allows Fidelity to reinvest in the development of services designed to enhance the value or convenience of the Fidelity funds as investment vehicles. These services include 24-hour access to account information and market information through telephone representatives and over the Internet, investor education materials and asset allocation tools, and the expanded availability of Fidelity Investor Centers, with 35 new branches opening since 2010.
Annual Report
Investment in a Large Fund Family. The Board considered the benefits to shareholders of investing in a Fidelity fund, including the benefits of investing in a fund that is part of a large family of funds offering a variety of investment disciplines and providing a large variety of mutual fund investor services. The Board noted that Fidelity had taken, or had made recommendations that resulted in the Fidelity funds taking, a number of actions over the previous year that benefited particular funds, including (i) continuing to dedicate additional resources to investment research and support of the senior management team that oversees asset management; (ii) rationalizing product lines through the mergers of six funds into other funds; (iii) continuing to migrate the Freedom Funds to dedicated lower cost underlying funds; (iv) obtaining shareholder approval to broaden the investment strategies for Fidelity Consumer Finance Portfolio, Fidelity Emerging Asia Fund, and Fidelity Environment and Alternative Energy Portfolio; (v) contractually agreeing to reduce the management fees and impose other expense limitations on Spartan 500 Index Fund and U.S. Bond Index Fund in connection with launching new institutional classes of these funds; (vi) changing the name, primary and supplemental benchmarks, and investment policies of Fidelity Global Strategies Fund to support the fund's flexible investment mandate and global orientation; and (vii) reducing the transfer agency account fee rates on certain accounts.
Investment Performance. The Board considered whether the fund has operated in accordance with its investment objective, as well as its record of compliance with its investment restrictions. It also reviewed the fund's absolute investment performance for each class, as well as the fund's relative investment performance for each class measured over multiple periods against a broad-based securities market index. The Board noted that FMR does not believe that a meaningful peer group exists against which to compare the fund's performance. The following charts considered by the Board show, over the one-, three-, and five-year periods ended December 31, 2010, as available, the cumulative total returns of the retail class and Class B of the fund and the cumulative total returns of a broad-based securities market index ("benchmark"). The returns of the retail class and Class B show the performance of the highest performing class (based on five-year performance) and the lowest performing class (based on three-year performance), respectively.
Fidelity Canada Fund

The Board noted that the investment performance of the fund was lower than its benchmark for all the periods shown. The Board considered that the variations in performance among the fund's classes reflect the variations in class expenses, which result in lower performance for higher expense classes. The Board discussed with FMR actions that have been taken by FMR to improve the fund's below-benchmark performance. The Board noted that this fund had underperformed in 2009 and discussed with FMR its disappointment with the continued underperformance. The Board also reviewed the fund's performance since inception as well as performance in the current year. The Board will continue to closely monitor the performance of the fund in the coming year and discuss with FMR other appropriate actions to address the performance of the fund.
The Board also considered that the fund's management fee is subject to upward or downward adjustment depending upon whether, and to what extent, the fund's investment performance for the performance period exceeds, or is exceeded by, the record (over the same period) of a Board-approved performance adjustment index. The Board noted that the performance adjustment provides FMR with a strong economic incentive to seek to achieve superior performance for the fund's shareholders and helps to more closely align the interests of FMR and the fund's shareholders.
Based on its review, the Board concluded that the nature, extent, and quality of services provided to the fund under the Advisory Contracts should benefit the fund's shareholders.
Annual Report
Board Approval of Investment Advisory Contracts and Management Fees - continued
Competitiveness of Management Fee and Total Expense Ratio. The Board considered the fund's management fee and total expense ratio compared to "mapped groups" of competitive funds and classes. Fidelity creates "mapped groups" by combining similar Lipper investment objective categories that have comparable management fee characteristics. Combining Lipper investment objective categories aids the Board's management fee and total expense ratio comparisons by broadening the competitive group used for comparison and by reducing the number of universes to which various Fidelity funds are compared.
Management Fee. The Board considered two proprietary management fee comparisons for the 12-month periods shown in the chart below. The group of Lipper funds used by the Board for management fee comparisons is referred to below as the "Total Mapped Group." The Total Mapped Group comparison focuses on a fund's standing relative to the total universe of comparable funds available to investors in terms of gross management fees before expense reimbursements or caps, and without giving effect to the fund's performance adjustment. "TMG %" represents the percentage of funds in the Total Mapped Group that had management fees that were lower than the fund's. For example, a TMG % of 16% means that 84% of the funds in the Total Mapped Group had higher management fees than the fund. The "Asset-Size Peer Group" (ASPG) comparison focuses on a fund's standing relative to non-Fidelity funds similar in size to the fund within the Total Mapped Group. The ASPG represents at least 15% of the funds in the Total Mapped Group with comparable asset size and management fee characteristics, subject to a minimum of 50 funds (or all funds in the Total Mapped Group if fewer than 50). Additional information, such as the ASPG quartile in which the fund's management fee ranked and the impact of the fund's performance adjustment, is also included in the chart and considered by the Board.
Fidelity Canada Fund

The Board noted that the fund's management fee ranked below the median of its Total Mapped Group and below the median of its ASPG for 2010. The Board also noted the effect of the fund's positive performance adjustment on the fund's management fee ranking. The Board noted that the performance adjustment for each year represents calculations for performance periods that differ from the periods shown in the performance charts above.
Based on its review, the Board concluded that the fund's management fee is fair and reasonable in light of the services that the fund receives and the other factors considered.
Total Expense Ratio. In its review of each class's total expense ratio, the Board considered the fund's management fee as well as other fund or class expenses, as applicable, such as transfer agent fees, pricing and bookkeeping fees, fund-paid 12b-1 fees, and custodial, legal, and audit fees. The Board also noted the effects of any waivers and reimbursements on fees and expenses, as well as the impact of the fund's performance adjustment. As part of its review, the Board also considered the current and historical total expense ratios of each class of the fund compared to competitive fund median expenses. Each class of the fund is compared to those funds and classes in the Total Mapped Group (used by the Board for management fee comparisons) that have a similar sales load structure.
The Board noted that the total expense ratio of each of Class A, Class B, Class C, Institutional Class, and the retail class of the fund ranked below its competitive median for 2010 and the total expense ratio of Class T ranked equal to its competitive median for 2010. The Board considered that various factors, including 12b-1 fees, positive or negative performance adjustments, and relatively higher other expenses in the case of small fund size, can affect total expense ratios.
Fees Charged to Other Fidelity Clients. The Board also considered Fidelity fee structures and other information with respect to clients of FMR and its affiliates, such as other mutual funds advised or subadvised by FMR or its affiliates, pension plan clients, and other institutional clients. In March 2010, the Board created an ad hoc joint committee with the board of other Fidelity funds (the Committee) to review and compare Fidelity's institutional investment advisory business with its business of providing services to the Fidelity funds, including the differences in services provided, fees charged, and costs incurred, as well as competition in their respective marketplaces.
Annual Report
Based on its review of total expense ratios and fees charged to other Fidelity clients, the Board concluded that the total expense ratio of each class of the fund was reasonable in light of the services that the fund and its shareholders receive and the other factors considered, including the findings of the Committee.
Costs of the Services and Profitability. The Board considered the revenues earned and the expenses incurred by Fidelity in conducting the business of developing, marketing, distributing, managing, administering and servicing the fund and its shareholders. The Board also considered the level of Fidelity's profits in respect of all the Fidelity funds.
On an annual basis, FMR presents to the Board Fidelity's profitability for the fund. Fidelity calculates the profitability for each fund, as well as aggregate profitability for groups of Fidelity funds and all Fidelity funds, using a series of detailed revenue and cost allocation methodologies which originate with the books and records of Fidelity on which Fidelity's audited financial statements are based. The Audit Committee of the Board reviews any significant changes from the prior year's methodologies.
PricewaterhouseCoopers LLP (PwC), independent registered public accounting firm and auditor to Fidelity and certain Fidelity funds, has been engaged annually by the Board as part of the Board's assessment of Fidelity's profitability analysis. PwC's engagement includes the review and assessment of Fidelity's methodologies used in determining the revenues and expenses attributable to Fidelity's mutual fund business, and completion of agreed-upon procedures surrounding the mathematical accuracy of fund profitability and its conformity to allocation methodologies. After considering PwC's reports issued under the engagement and information provided by Fidelity, the Board concluded that while other allocation methods may also be reasonable, Fidelity's profitability methodologies are reasonable in all material respects.
The Board also reviewed Fidelity's non-fund businesses and fall-out benefits related to the mutual fund business as well as cases where Fidelity's affiliates may benefit from or be related to the fund's business.
The Board considered the costs of the services provided by and the profits realized by Fidelity in connection with the operation of the fund and was satisfied that the profitability was not excessive in the circumstances.
Economies of Scale. The Board considered whether there have been economies of scale in respect of the management of the Fidelity funds, whether the Fidelity funds (including the fund) have appropriately benefited from any such economies of scale, and whether there is potential for realization of any further economies of scale. The Board considered the extent to which the fund will benefit from economies of scale through increased services to the fund, through waivers or reimbursements, or through fee or expense reductions. The Board also noted that in 2009, it and the board of other Fidelity funds created an ad hoc committee (the Economies of Scale Committee) to analyze whether FMR attains economies of scale in respect of the management and servicing of the Fidelity funds, whether the Fidelity funds have appropriately benefited from such economies of scale, and whether there is potential for realization of any further economies of scale.
The Board recognized that the fund's management contract incorporates a "group fee" structure, which provides for lower group fee rates as total fund assets under FMR's management increase, and for higher group fee rates as total fund assets under FMR's management decrease. FMR calculates the group fee rates based on a tiered asset "breakpoint" schedule that varies based on asset class. The Board considered that the group fee is designed to deliver the benefits of economies of scale to fund shareholders when total Fidelity fund assets increase, even if assets of any particular fund are unchanged or have declined, because some portion of Fidelity's costs are attributable to services provided to all Fidelity funds, and all funds benefit if those costs can be allocated among more assets. The Board concluded that, given the group fee structure, fund shareholders will benefit from lower management fees as assets under FMR's management increase at the fund complex level, regardless of whether Fidelity achieves any such economies of scale.
The Board concluded, taking into account the analysis of the Economies of Scale Committee, that any potential economies of scale are being appropriately shared between fund shareholders and Fidelity.
Additional Information Requested by the Board. In order to develop fully the factual basis for consideration of the Fidelity funds' Advisory Contracts, the Board requested and received additional information on certain topics, including (i) fund performance trends, actions to be taken by FMR to improve certain funds' overall performance, and Fidelity's long-term strategies for certain funds; (ii) portfolio manager changes that have occurred during the past year and length of portfolio manager tenure for different categories of funds over time; (iii) Fidelity's compensation structure for portfolio managers and other key personnel and strategies for attracting and retaining non-investment personnel; (iv) the amount of the investment that each portfolio manager has made in the Fidelity fund(s) that he or she manages; (v) historical trends in Fidelity's realization of fall-out benefits; (vi) Fidelity's group fee structures and the rationale for the individual fee rates of certain funds; (vii) fund profitability methodology and the impact of certain factors on fund profitability results; (viii) trends regarding industry use of performance fee structures and Fidelity's compliance practices with respect to performance adjustment calculations; (ix) the fee structures in place for certain other Fidelity clients; and (x) explanations regarding the relative total expense ratios of certain funds and classes, total expense competitive trends, and actions that might be taken by FMR to reduce total expense ratios for certain funds and classes.
Annual Report
Board Approval of Investment Advisory Contracts and Management Fees - continued
Based on its evaluation of all of the conclusions noted above, and after considering all factors it believed relevant, the Board ultimately concluded that the advisory fee structures are fair and reasonable, and that the fund's Advisory Contracts should be renewed.
Annual Report
Annual Report
Investment Adviser
Fidelity Management & Research Company
Boston, MA
Investment Sub-Advisers
FMR Co., Inc.
Fidelity Management & Research
(U.K.) Inc.
FIL Investment Advisors
FIL Investment Advisors
(UK) Limited
Fidelity Management & Research
(Hong Kong) Limited
Fidelity Management & Research
(Japan) Inc.
General Distributor
Fidelity Distributors Corporation
Boston, MA
Transfer and Service Agents
Fidelity Investments Institutional
Operations Company, Inc.
Boston, MA
Fidelity Service Company, Inc.
Boston, MA
Custodian
State Street Bank and Trust Company
Boston, Massachusetts

ACAN-UANN-1211
1.843164.104
Fidelity Advisor®
Canada Fund -
Institutional Class
Annual Report
October 31, 2011
Institutional Class is a class of
Fidelity® Canada Fund

Contents
Chairman's Message | (Click Here) | The Chairman's message to shareholders. |
Performance | (Click Here) | How the fund has done over time. |
Management's Discussion of Fund Performance | (Click Here) | The Portfolio Manager's review of fund performance and strategy. |
Shareholder Expense Example | (Click Here) | An example of shareholder expenses. |
Investment Changes | (Click Here) | A summary of major shifts in the fund's investments over the past six months. |
Investments | (Click Here) | A complete list of the fund's investments with their market values. |
Financial Statements | (Click Here) | Statements of assets and liabilities, operations, and changes in net assets, as well as financial highlights. |
Notes | (Click Here) | Notes to the financial statements. |
Report of Independent Registered Public Accounting Firm | (Click Here) | |
Trustees and Officers | (Click Here) | |
Distributions | (Click Here) | |
Board Approval of Investment Advisory Contracts and Management Fees | (Click Here) | |
To view a fund's proxy voting guidelines and proxy voting record for the 12-month period ended June 30, visit http://www.fidelity.com/proxyvotingresults or visit the Securities and Exchange Commission's (SEC) web site at http://www.sec.gov. You may also call 1-877-208-0098 to request a free copy of the proxy voting guidelines.
Standard & Poor's, S&P and S&P 500 are registered service marks of The McGraw-Hill Companies, Inc. and have been licensed for use by Fidelity Distributors Corporation.
Other third party marks appearing herein are the property of their respective owners.
All other marks appearing herein are registered or unregistered trademarks or service marks of FMR LLC or an affiliated company.
This report and the financial statements contained herein are submitted for the general information of the shareholders of the fund. This report is not authorized for distribution to prospective investors in the fund unless preceded or accompanied by an effective prospectus.
A fund files its complete schedule of portfolio holdings with the SEC for the first and third quarters of each fiscal year on Form N-Q. Forms N-Q are available on the SEC's web site at http://www.sec.gov. A fund's Forms N-Q may be reviewed and copied at the SEC's Public Reference Room in Washington, DC. Information regarding the operation of the SEC's Public Reference Room may be obtained by calling 1-800-SEC-0330. For a complete list of a fund's portfolio holdings, view the most recent holdings listing, semiannual report, or annual report on Fidelity's web site at http://www.fidelity.com, http://www.advisor.fidelity.com, or http://www.401k.com, as applicable.
NOT FDIC INSURED • MAY LOSE VALUE • NO BANK GUARANTEE
Neither the fund nor Fidelity Distributors Corporation is a bank.
Annual Report
(The Acting Chairman's photo appears here.)
Dear Shareholder:
Global equity markets began the fourth quarter on a strong note, sharply reversing course in October amid strong corporate earnings, better-than-expected economic news and the promise of a resolution to the sovereign debt crisis in Europe. The mini rally followed a third quarter marked by a significant downturn in July and August, which heightened investor anxiety and set off a wave of volatility that hampered most major asset classes through the end of September. Financial markets are difficult to predict, of course, but you can help put the odds in your favor by following these time-tested investment principles.
One of the basic tenets is to invest according to your time horizon. For long-term investors, riding out the markets' inevitable ups and downs has proven much more effective than making decisions based on short-term developments. If your goal is approaching, you can also benefit from patience and restraint, rather than attempting to time the market. No matter your time horizon, missing only a few of the markets' best days can significantly diminish returns. Patience also affords the benefits of compounding - earning interest on additional income or reinvested dividends and capital gains. While staying the course doesn't eliminate risk, it can considerably lessen the negative impact of short-term downturns.
Asset allocation is another principle to manage risk. As you spread your portfolio among the asset classes, be sure to consider your time horizon, risk tolerance and investment objectives. Younger investors may be better served by emphasizing equities, which historically have been the best-performing asset class over time. Investors who are nearing a specific goal, such as retirement or sending a child to college, may choose to favor bonds and other investments that have tended to be more stable. Studies indicate that asset allocation is the single most important determinant of a portfolio's long-term success. After deciding on a suitable allocation strategy, make sure your portfolio is adequately diversified, with exposure to stocks of small-, mid- and large-cap companies in a range of sectors, for example. And today, more than ever, geographic diversification should be taken into account.
Lastly, investing a certain amount of money on a regular basis - a principle known as dollar-cost averaging - can help lower the average cost of your purchases, while also giving you the discipline to avoid selling weak performers just prior to an upswing, or chasing a hot performer just before a correction.
We invite you to learn more by visiting us on the Internet, dropping by one of our Investor Centers or calling us by phone. It is our privilege to provide the resources you need to choose investments that are right for you.
Sincerely,
(The Acting Chairman's signature appears here.)
James C. Curvey
Acting Chairman
Annual Report
Average annual total return reflects the change in the value of an investment, assuming reinvestment of the class' distributions from dividend income and capital gains (the profits earned upon the sale of securities that have grown in value, if any) and assuming a constant rate of performance each year. The $10,000 table and the fund's returns do not reflect the deduction of taxes that a shareholder would pay on fund distributions or the redemption of fund shares. During periods of reimbursement by Fidelity, a fund's total return will be greater than it would be had the reimbursement not occurred. How a fund did yesterday is no guarantee of how it will do tomorrow.
Average Annual Total Returns
Periods ended October 31, 2011 | Past 1
year | Past 5
years | Past 10
years |
Institutional ClassA | -1.35% | 3.60% | 13.28% |
A The initial offering of Institutional Class shares took place on May 2, 2007. Returns prior to May 2, 2007 are those of Fidelity® Canada Fund, the original class of the fund.
$10,000 Over 10 Years
Let's say hypothetically that $10,000 was invested in Fidelity Advisor® Canada Fund - Institutional Class on October 31, 2001. The chart shows how the value of your investment would have changed, and also shows how the S&P®/TSX Composite Index performed over the same period. The inital offering of Institutional Class took place on May 2, 2007. See above for additional information regarding the performance of Institutional Class.
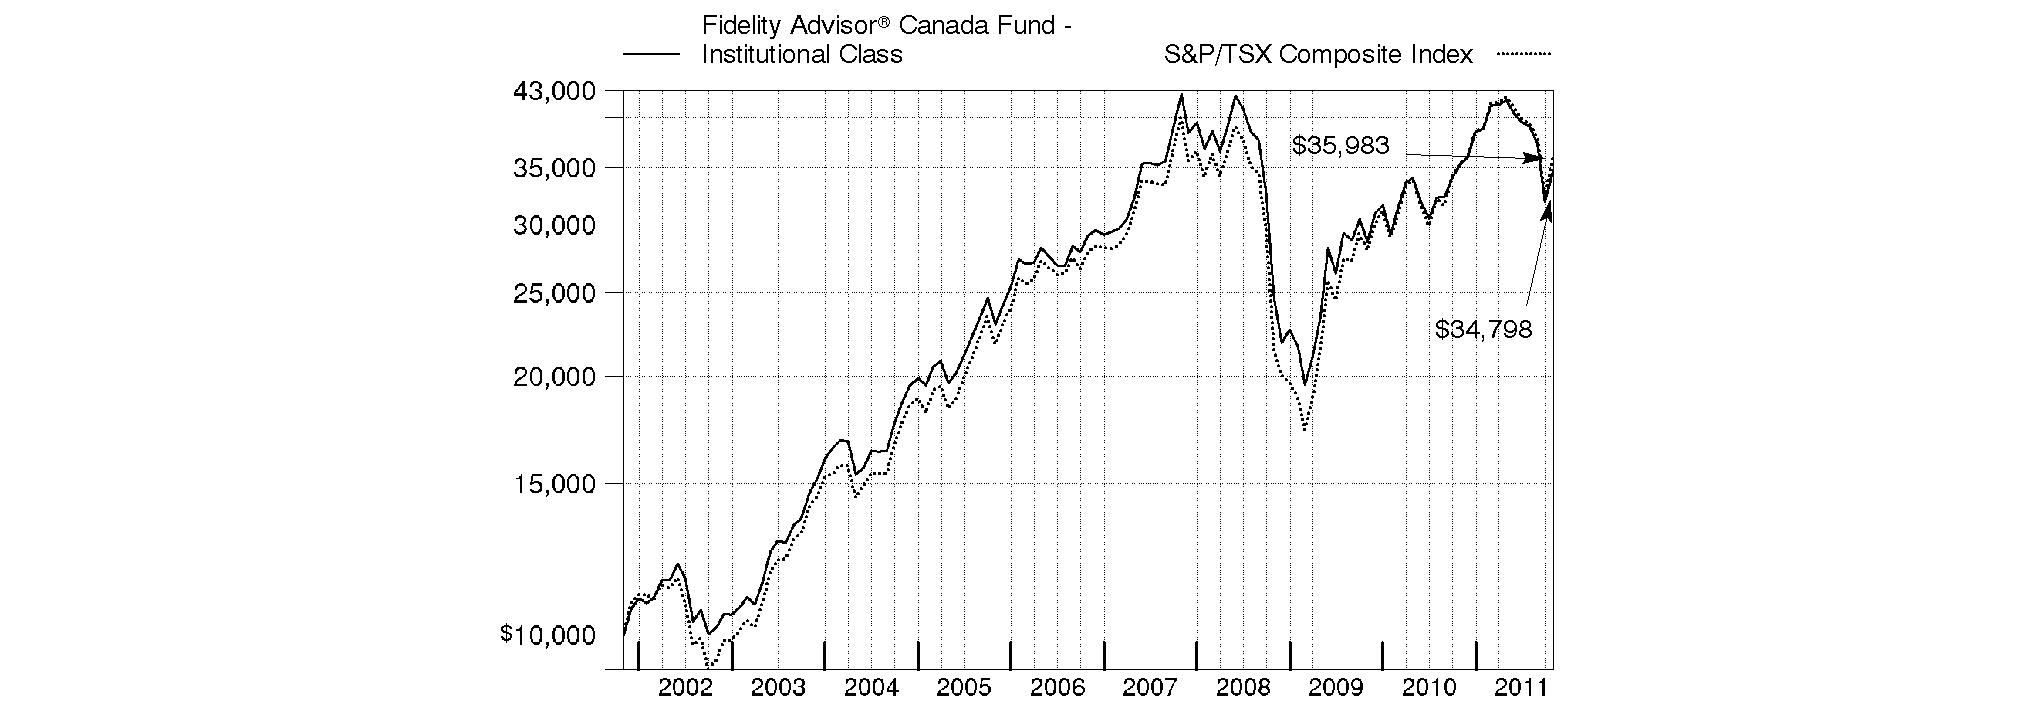
Annual Report
Market Recap: International equities were rocked by a number of headline events during the year ending October 31, 2011. Stocks posted a solid advance for the first half of the period, despite concern about the sovereign debt crisis in Europe, a devastating earthquake and tsunami in Japan, and political upheaval in the Middle East and North Africa. Sentiment turned decidedly negative in the second half, however, as fresh worries about Europe, inflation in China and a dimmed outlook for global growth caused foreign markets to suffer declines that intensified in August and September. October brought with it yet another dramatic swing, as eurozone policymakers appeared near a resolution to the debt debacle and buyers stormed back onto the scene in search of bargains. Still, those gains - along with favorable currency fluctuations overall - weren't enough to offset prior losses, and the MSCI® ACWI® (All Country World Index) ex USA Index finished the period down 4.56%. Within the MSCI index, Europe and emerging markets suffered the biggest declines, with many countries in these areas sustaining steep losses. By contrast, Japan showed resilience in the wake of its natural disasters, falling only 2%. Australia (+4%), Switzerland (+3%), the U.K. (+2%) and Canada, which produced a nominal return, were among the few major benchmark components to break into positive territory.
Comments from Douglas Lober, Portfolio Manager of Fidelity Advisor® Canada Fund: For the 12 months ending October 31, 2011, the fund's Institutional Class shares declined 1.35%, trailing the 1.60% gain of the S&P/TSX Composite Index. It was a challenging year for equities worldwide. Canadian stocks enjoyed a strong surge in the first half of the period, only to see most of those gains erased during the summer, when heightened macroeconomic and sovereign debt concerns fueled a sharp sell-off in the market. Against this backdrop, positioning in energy, financials and industrials detracted meaningfully versus the index, as did an overweighting in the weak materials sector. Conversely, positioning within the hard-hit information technology sector contributed the most, largely due to underweighting and then selling poor-performing Research In Motion, maker of the BlackBerry® personal communications device. Larger-than-index exposure to the strong-performing health care group also helped. On an individual stock basis, three of the four biggest detractors were energy names, with the largest blow coming from an underweighting in pipleline developer TransCanada. The stock gained 20% for the year, as investors were attracted to the company's solid dividend yield amid the market uncertainty. Canadian Natural Resources and Precision Drilling, two crude-oil-oriented energy companies, experienced volatile stock price swings during the period, and my untimely ownership of both created a head wind for the fund. Elsewhere, a poorly timed overweighting in First Quantum Minerals detracted, as copper prices fell. On the upside, overweighting Valeant Pharmaceuticals International helped, as shares of the specialty pharmaceuticals firm benefited from strong earnings and small additive acquisitions during the period. Scant exposure to Encana, a natural gas exploration and production company in the index that performed poorly, also provided a lift. In materials, major gold miner Goldcorp helped, as the price of the yellow metal climbed more than 25% during the period, due in part to a generally weakening U.S. dollar and concern about a potential global financial crisis. Also in this space, shares of Consolidated Thompson Iron Mines got a boost when the firm agreed to be acquired by Cliffs Natural Resources in January, a deal that closed in May.
Note to shareholders: Fidelity Advisor Canada Fund may invest up to 35% of its total assets in any industry that represents more than 20% of the Canadian market. As of October 31, 2011, the fund did not have more than 25% of its assets invested in any one industry.
The views expressed above reflect those of the portfolio manager(s) only through the end of the period as stated on the cover of this report and do not necessarily represent the views of Fidelity or any other person in the Fidelity organization. Any such views are subject to change at any time based upon market or other conditions and Fidelity disclaims any responsibility to update such views. These views may not be relied on as investment advice and, because investment decisions for a Fidelity fund are based on numerous factors, may not be relied on as an indication of trading intent on behalf of any Fidelity fund.
Annual Report
Fidelity Canada Fund
As a shareholder of the Fund, you incur two types of costs: (1) transaction costs, including sales charges (loads) on purchase payments or redemption proceeds, redemption fees, and (2) ongoing costs, including management fees, distribution and/or service (12b-1) fees and other Fund expenses. This Example is intended to help you understand your ongoing costs (in dollars) of investing in the Fund and to compare these costs with the ongoing costs of investing in other mutual funds.
The Example is based on an investment of $1,000 invested at the beginning of the period and held for the entire period (May 1, 2011 to October 31, 2011).
Actual Expenses
The first line of the accompanying table for each class of the Fund provides information about actual account values and actual expenses. You may use the information in this line, together with the amount you invested, to estimate the expenses that you paid over the period. Simply divide your account value by $1,000.00 (for example, an $8,600 account value divided by $1,000.00 = 8.6), then multiply the result by the number in the first line for a class of the Fund under the heading entitled "Expenses Paid During Period" to estimate the expenses you paid on your account during this period. A small balance maintenance fee of $12.00 that is charged once a year may apply for certain accounts with a value of less than $2,000. This fee is not included in the table below. If it was, the estimate of expenses you paid during the period would be higher, and your ending account value lower, by this amount. In addition, the Fund, as a shareholder in the underlying Fidelity Central Funds, will indirectly bear its pro-rata share of the fees and expenses incurred by the underlying Fidelity Central Funds. These fees and expenses are not included in the Fund's annualized expense ratio used to calculate the expense estimate in the table below.
Hypothetical Example for Comparison Purposes
The second line of the accompanying table for each class of the Fund provides information about hypothetical account values and hypothetical expenses based on a Class' actual expense ratio and an assumed rate of return of 5% per year before expenses, which is not the Class' actual return. The hypothetical account values and expenses may not be used to estimate the actual ending account balance or expenses you paid for the period. You may use this information to compare the ongoing costs of investing in the Fund and other funds. To do so, compare this 5% hypothetical example with the 5% hypothetical examples that appear in the shareholder reports of the other funds. A small balance maintenance fee of $12.00 that is charged once a year may apply for certain accounts with a value of less than $2,000. This fee is not included in the table below. If it was, the estimate of expenses you paid during the period would be higher, and your ending account value lower, by this amount. In addition, the Fund, as a shareholder in the underlying Fidelity Central Funds, will indirectly bear its pro-rata share of the fees and expenses incurred by the underlying Fidelity Central Funds. These fees and expenses are not included in the Fund's annualized expense ratio used to calculate the expense estimate in the table below.
Please note that the expenses shown in the table are meant to highlight your ongoing costs only and do not reflect any transaction costs. Therefore, the second line of the table is useful in comparing ongoing costs only, and will not help you determine the relative total costs of owning different funds. In addition, if these transactional costs were included, your costs would have been higher.
| Annualized
Expense Ratio | Beginning
Account Value
May 1, 2011 | Ending
Account Value
October 31, 2011 | Expenses Paid
During Period*
May 1, 2011 to
October 31, 2011 |
Class A | 1.11% | | | |
Actual | | $ 1,000.00 | $ 829.20 | $ 5.12 |
HypotheticalA | | $ 1,000.00 | $ 1,019.61 | $ 5.65 |
Class T | 1.41% | | | |
Actual | | $ 1,000.00 | $ 828.10 | $ 6.50 |
HypotheticalA | | $ 1,000.00 | $ 1,018.10 | $ 7.17 |
Class B | 1.90% | | | |
Actual | | $ 1,000.00 | $ 825.90 | $ 8.74 |
HypotheticalA | | $ 1,000.00 | $ 1,015.63 | $ 9.65 |
Class C | 1.86% | | | |
Actual | | $ 1,000.00 | $ 826.20 | $ 8.56 |
HypotheticalA | | $ 1,000.00 | $ 1,015.83 | $ 9.45 |
Canada | .81% | | | |
Actual | | $ 1,000.00 | $ 830.50 | $ 3.74 |
HypotheticalA | | $ 1,000.00 | $ 1,021.12 | $ 4.13 |
Institutional Class | .82% | | | |
Actual | | $ 1,000.00 | $ 830.40 | $ 3.78 |
HypotheticalA | | $ 1,000.00 | $ 1,021.07 | $ 4.18 |
A 5% return per year before expenses
* Expenses are equal to each Class' annualized expense ratio, multiplied by the average account value over the period, multiplied by 184/365 (to reflect the one-half year period).
Annual Report
Fidelity Canada Fund
Investment Changes (Unaudited)
Geographic Diversification (% of fund's net assets) |
As of October 31, 2011 |
 | Canada | 95.8% | |
 | United States of America | 4.2% | |

Percentages are adjusted for the effect of futures contracts, if applicable. |
As of April 30, 2011 |
| Canada | 93.5% | |
 | United States of America | 6.2% | |
 | United Kingdom | 0.2% | |
| France | 0.1% | |

Percentages are adjusted for the effect of futures contracts, if applicable. |
Asset Allocation |
| % of fund's
net assets | % of fund's net assets
6 months ago |
Stocks | 99.8 | 98.2 |
Short-Term Investments and Net Other Assets | 0.2 | 1.8 |
Top Ten Stocks as of October 31, 2011 |
| % of fund's
net assets | % of fund's net assets
6 months ago |
The Toronto-Dominion Bank (Commercial Banks) | 5.4 | 4.1 |
Enbridge, Inc. (Oil, Gas & Consumable Fuels) | 3.9 | 2.2 |
Bank of Nova Scotia (Commercial Banks) | 3.9 | 3.3 |
Suncor Energy, Inc. (Oil, Gas & Consumable Fuels) | 3.8 | 5.0 |
Goldcorp, Inc. (Metals & Mining) | 3.7 | 5.8 |
Open Text Corp. (Internet Software & Services) | 3.5 | 0.8 |
Canadian National Railway Co. (Road & Rail) | 3.5 | 2.5 |
Bank of Montreal (Commercial Banks) | 3.3 | 1.8 |
Potash Corp. of Saskatchewan, Inc. (Chemicals) | 3.1 | 3.3 |
BCE, Inc. (Diversified Telecommunication Services) | 2.8 | 1.5 |
| 36.9 | |
Market Sectors as of October 31, 2011 |
| % of fund's
net assets | % of fund's net assets
6 months ago |
Energy | 23.4 | 27.3 |
Materials | 23.4 | 22.9 |
Financials | 22.8 | 22.8 |
Telecommunication Services | 5.6 | 2.7 |
Information Technology | 5.5 | 3.5 |
Consumer Discretionary | 5.5 | 4.2 |
Industrials | 5.4 | 7.4 |
Health Care | 4.7 | 6.5 |
Consumer Staples | 2.6 | 0.9 |
Utilities | 0.9 | 0.0 |
Annual Report
Fidelity Canada Fund
Investments October 31, 2011
Showing Percentage of Net Assets
Common Stocks - 99.8% |
| Shares | | Value |
CONSUMER DISCRETIONARY - 5.5% |
Hotels, Restaurants & Leisure - 1.5% |
McDonald's Corp. | 150,000 | | $ 13,927,500 |
Tim Hortons, Inc. (Canada) | 1,010,300 | | 49,721,942 |
| | 63,649,442 |
Media - 1.4% |
Astral Media, Inc. Class A (non-vtg.) | 400,000 | | 13,731,253 |
Cineplex, Inc. | 250,000 | | 6,638,411 |
Corus Entertainment, Inc. Class B (non-vtg.) | 600,000 | | 11,490,194 |
Quebecor, Inc. Class B (sub. vtg.) | 750,000 | | 25,956,764 |
| | 57,816,622 |
Multiline Retail - 1.7% |
Dollar Tree, Inc. (a) | 350,000 | | 27,986,000 |
Dollarama, Inc. | 1,134,975 | | 42,718,826 |
| | 70,704,826 |
Textiles, Apparel & Luxury Goods - 0.9% |
Gildan Activewear, Inc. | 166,400 | | 4,293,332 |
lululemon athletica, Inc. (a) | 437,600 | | 24,715,648 |
NIKE, Inc. Class B | 100,000 | | 9,635,000 |
| | 38,643,980 |
TOTAL CONSUMER DISCRETIONARY | | 230,814,870 |
CONSUMER STAPLES - 2.6% |
Food & Staples Retailing - 2.3% |
Alimentation Couche-Tard, Inc. Class B (sub. vtg.) | 1,090,200 | | 32,809,349 |
Metro, Inc. Class A (sub. vtg.) | 785,165 | | 38,468,635 |
Whole Foods Market, Inc. | 320,000 | | 23,078,400 |
| | 94,356,384 |
Food Products - 0.3% |
Saputo, Inc. | 350,000 | | 14,458,544 |
TOTAL CONSUMER STAPLES | | 108,814,928 |
ENERGY - 23.4% |
Energy Equipment & Services - 1.1% |
Calfrac Well Services Ltd. | 150,000 | | 4,649,646 |
Precision Drilling Corp. (a) | 1,200,000 | | 13,915,835 |
Trican Well Service Ltd. | 600,000 | | 10,611,426 |
Trinidad Drilling Ltd. | 2,303,400 | | 18,023,293 |
| | 47,200,200 |
Oil, Gas & Consumable Fuels - 22.3% |
Baytex Energy Corp. (d) | 1,800,000 | | 95,141,696 |
Canadian Natural Resources Ltd. | 1,700,000 | | 59,960,877 |
Canadian Oil Sands Ltd. | 1,400,000 | | 32,442,193 |
Celtic Exploration Ltd. (a) | 54,500 | | 1,349,857 |
Celtic Exploration Ltd. (e) | 1,700,000 | | 42,105,633 |
Cenovus Energy, Inc. | 2,700,000 | | 92,469,278 |
|
| Shares | | Value |
Crescent Point Energy Corp. (d) | 583,400 | | $ 24,913,817 |
Enbridge, Inc. | 4,737,800 | | 164,113,191 |
Encana Corp. | 1,000,000 | | 21,688,318 |
Imperial Oil Ltd. | 250,000 | | 10,352,611 |
Keyera Corp. | 1,083,402 | | 49,417,955 |
Open Range Energy Corp. (a) | 61,200 | | 704,796 |
Painted Pony Petroleum Ltd. (a)(e) | 113,000 | | 1,381,823 |
Petrominerales Ltd. | 192,130 | | 5,068,986 |
Peyto Exploration & Development Corp. (d) | 300,000 | | 6,545,619 |
Suncor Energy, Inc. | 5,007,600 | | 159,493,705 |
Surge Energy, Inc. (a)(e) | 632,000 | | 5,566,494 |
Talisman Energy, Inc. | 3,400,000 | | 48,227,918 |
Tourmaline Oil Corp. (a) | 850,000 | | 28,258,013 |
Tourmaline Oil Corp. (a)(e) | 380,000 | | 12,632,994 |
TransCanada Corp. | 800,000 | | 34,003,110 |
Trilogy Energy Corp. | 700,000 | | 23,847,118 |
Vermilion Energy, Inc. (d) | 300,000 | | 14,132,517 |
| | 933,818,519 |
TOTAL ENERGY | | 981,018,719 |
FINANCIALS - 22.8% |
Capital Markets - 0.4% |
Morgan Stanley | 500,000 | | 8,820,000 |
State Street Corp. | 200,000 | | 8,078,000 |
| | 16,898,000 |
Commercial Banks - 17.2% |
Bank of Montreal (d) | 2,300,000 | | 135,875,006 |
Bank of Nova Scotia | 3,100,000 | | 163,357,576 |
Canadian Imperial Bank of Commerce | 1,054,600 | | 79,450,730 |
Canadian Western Bank, Edmonton | 200,000 | | 5,718,012 |
National Bank of Canada | 700,000 | | 49,955,359 |
Royal Bank of Canada (d) | 890,000 | | 43,408,537 |
The Toronto-Dominion Bank (d) | 2,973,800 | | 224,425,922 |
U.S. Bancorp | 700,000 | | 17,913,000 |
| | 720,104,142 |
Insurance - 3.0% |
Industrial Alliance Life Insurance Co. | 600,000 | | 19,519,486 |
Intact Financial Corp. | 1,560,925 | | 87,092,991 |
MetLife, Inc. | 600,000 | | 21,096,000 |
| | 127,708,477 |
Real Estate Investment Trusts - 0.8% |
RioCan (REIT) | 1,400,000 | | 35,517,881 |
Real Estate Management & Development - 1.4% |
Brookfield Asset Management, Inc. Class A | 1,550,000 | | 44,843,256 |
Brookfield Properties Corp. | 800,000 | | 13,129,357 |
| | 57,972,613 |
TOTAL FINANCIALS | | 958,201,113 |
Common Stocks - continued |
| Shares | | Value |
HEALTH CARE - 4.7% |
Health Care Technology - 2.7% |
SXC Health Solutions Corp. (a) | 2,403,234 | | $ 111,573,125 |
Pharmaceuticals - 2.0% |
Valeant Pharmaceuticals International, Inc. (Canada) | 2,184,871 | | 86,268,268 |
TOTAL HEALTH CARE | | 197,841,393 |
INDUSTRIALS - 5.4% |
Aerospace & Defense - 0.2% |
Bombardier, Inc. Class B (sub. vtg.) (d) | 2,100,000 | | 8,679,340 |
Airlines - 0.1% |
Air Canada Class A (a) | 2,975,000 | | 4,297,537 |
Commercial Services & Supplies - 0.7% |
Progressive Waste Solution Ltd. | 1,384,000 | | 29,155,841 |
Construction & Engineering - 0.5% |
SNC-Lavalin Group, Inc. | 400,000 | | 20,099,313 |
Machinery - 0.3% |
Cummins, Inc. | 100,000 | | 9,943,000 |
Road & Rail - 3.5% |
Canadian National Railway Co. | 1,890,000 | | 148,037,518 |
Trading Companies & Distributors - 0.1% |
Finning International, Inc. | 200,000 | | 4,674,725 |
TOTAL INDUSTRIALS | | 224,887,274 |
INFORMATION TECHNOLOGY - 5.5% |
Internet Software & Services - 3.5% |
Open Text Corp. (a) | 2,430,407 | | 148,747,686 |
IT Services - 2.0% |
CGI Group, Inc. Class A (sub. vtg.) (a) | 4,090,000 | | 83,699,654 |
TOTAL INFORMATION TECHNOLOGY | | 232,447,340 |
MATERIALS - 23.4% |
Chemicals - 4.4% |
Agrium, Inc. | 500,000 | | 41,219,843 |
Methanex Corp. | 500,000 | | 12,890,605 |
Potash Corp. of Saskatchewan, Inc. | 2,780,000 | | 131,574,861 |
| | 185,685,309 |
Metals & Mining - 19.0% |
Agnico-Eagle Mines Ltd. (Canada) | 150,000 | | 6,506,495 |
Alamos Gold, Inc. | 100,000 | | 1,850,830 |
Barrick Gold Corp. | 2,250,000 | | 111,072,378 |
Copper Mountain Mining Corp. (a) | 400,000 | | 2,134,724 |
Detour Gold Corp. (a) | 1,680,000 | | 55,615,188 |
Detour Gold Corp. (a)(e) | 300,000 | | 9,931,284 |
Eldorado Gold Corp. | 3,970,000 | | 74,593,068 |
First Majestic Silver Corp. (a) | 422,400 | | 7,173,830 |
|
| Shares | | Value |
First Quantum Minerals Ltd. | 2,530,000 | | $ 53,069,469 |
Franco-Nevada Corp. | 1,600,000 | | 63,383,659 |
Goldcorp, Inc. | 3,200,000 | | 155,690,425 |
Grande Cache Coal Corp. (a) | 2,422,800 | | 23,988,600 |
IAMGOLD Corp. | 700,000 | | 15,048,402 |
Ivanhoe Mines Ltd. (a) | 1,285,000 | | 26,296,835 |
Kinross Gold Corp. | 300,000 | | 4,276,471 |
Major Drilling Group International, Inc. | 800,000 | | 10,697,698 |
New Gold, Inc. (a) | 1,600,000 | | 19,822,441 |
Osisko Mining Corp. (a) | 1,765,700 | | 21,290,780 |
Silver Wheaton Corp. | 1,075,900 | | 37,149,499 |
Tahoe Resources, Inc. (a) | 400,000 | | 7,547,775 |
Teck Resources Ltd. Class B (sub. vtg.) | 1,320,000 | | 52,913,879 |
Yamana Gold, Inc. | 2,300,000 | | 34,332,146 |
| | 794,385,876 |
TOTAL MATERIALS | | 980,071,185 |
TELECOMMUNICATION SERVICES - 5.6% |
Diversified Telecommunication Services - 4.9% |
BCE, Inc. | 3,000,000 | | 118,904,549 |
TELUS Corp. | 1,600,000 | | 86,079,149 |
| | 204,983,698 |
Wireless Telecommunication Services - 0.7% |
Rogers Communications, Inc. Class B (non-vtg.) | 800,000 | | 29,171,891 |
TOTAL TELECOMMUNICATION SERVICES | | 234,155,589 |
UTILITIES - 0.9% |
Electric Utilities - 0.9% |
Fortis, Inc. | 1,100,000 | | 37,187,139 |
TOTAL COMMON STOCKS (Cost $3,540,301,994) | 4,185,439,550 |
Money Market Funds - 10.8% |
| | | |
Fidelity Cash Central Fund, 0.12% (b) | 157,102,420 | | 157,102,420 |
Fidelity Securities Lending Cash Central Fund, 0.11% (b)(c) | 297,466,236 | | 297,466,236 |
TOTAL MONEY MARKET FUNDS (Cost $454,568,656) | 454,568,656 |
TOTAL INVESTMENT PORTFOLIO - 110.6% (Cost $3,994,870,650) | | 4,640,008,206 |
NET OTHER ASSETS (LIABILITIES) - (10.6)% | | (443,582,265) |
NET ASSETS - 100% | $ 4,196,425,941 |
Legend |
(a) Non-income producing |
(b) Affiliated fund that is available only to investment companies and other accounts managed by Fidelity Investments. The rate quoted is the annualized seven-day yield of the fund at period end. A complete unaudited listing of the fund's holdings as of its most recent quarter end is available upon request. In addition, each Fidelity Central Fund's financial statements, which are not covered by the Fund's Report of Independent Registered Public Accounting Firm, are available on the SEC's website or upon request. |
(c) Investment made with cash collateral received from securities on loan. |
(d) Security or a portion of the security is on loan at period end. |
(e) Security exempt from registration under Rule 144A of the Securities Act of 1933. These securities may be resold in transactions exempt from registration, normally to qualified institutional buyers. At the end of the period, the value of these securities amounted to $71,618,228 or 1.7% of net assets. |
Affiliated Central Funds |
Information regarding fiscal year to date income earned by the Fund from investments in Fidelity Central Funds is as follows: |
Fund | Income earned |
Fidelity Cash Central Fund | $ 95,341 |
Fidelity Securities Lending Cash Central Fund | 3,940,584 |
Total | $ 4,035,925 |
Other Affiliated Issuers |
An affiliated company is a company in which the Fund has ownership of at least 5% of the voting securities. Fiscal year to date transactions with companies which are or were affiliates are as follows: |
Affiliate | Value,
beginning of period | Purchases | Sales
Proceeds | Dividend
Income | Value,
end of
period |
SXC Health Solutions Corp. | $ 148,489,830 | $ 39,379,069 | $ 91,179,472 | $ - | $ - |
Total | $ 148,489,830 | $ 39,379,069 | $ 91,179,472 | $ - | $ - |
Other Information |
All investments are categorized as Level 1 under the Fair Value Hierarchy. The inputs or methodology used for valuing securities may not be an indication of the risk associated with investing in those securities. For more information on valuation inputs, please refer to the Security Valuation section in the accompanying Notes to Financial Statements. |
Income Tax Information |
At October 31, 2011, the Fund had a capital loss carryforward of approximately $230,403,828 of which $79,486,047 and $150,917,781 will expire in fiscal 2016 and 2017, respectively. Capital loss carryforwards are only available to offset future capital gains of the Fund to the extent provided by regulations and may be limited. |
See accompanying notes which are an integral part of the financial statements.
Annual Report
Fidelity Canada Fund
Statement of Assets and Liabilities
| October 31, 2011 |
| | |
Assets | | |
Investment in securities, at value (including securities loaned of $276,476,232) - See accompanying schedule: Unaffiliated issuers (cost $3,540,301,994) | $ 4,185,439,550 | |
Fidelity Central Funds (cost $454,568,656) | 454,568,656 | |
Total Investments (cost $3,994,870,650) | | $ 4,640,008,206 |
Foreign currency held at value (cost $3,344,813) | | 3,343,781 |
Receivable for investments sold | | 76,604,521 |
Receivable for fund shares sold | | 4,290,977 |
Dividends receivable | | 3,803,995 |
Distributions receivable from Fidelity Central Funds | | 219,888 |
Prepaid expenses | | 19,502 |
Other receivables | | 8,010 |
Total assets | | 4,728,298,880 |
| | |
Liabilities | | |
Payable for investments purchased | $ 222,658,895 | |
Payable for fund shares redeemed | 8,853,519 | |
Accrued management fee | 1,756,982 | |
Distribution and service plan fees payable | 137,316 | |
Other affiliated payables | 933,977 | |
Other payables and accrued expenses | 66,014 | |
Collateral on securities loaned, at value | 297,466,236 | |
Total liabilities | | 531,872,939 |
| | |
Net Assets | | $ 4,196,425,941 |
Net Assets consist of: | | |
Paid in capital | | $ 3,780,567,444 |
Undistributed net investment income | | 25,762,870 |
Accumulated undistributed net realized gain (loss) on investments and foreign currency transactions | | (255,068,905) |
Net unrealized appreciation (depreciation) on investments and assets and liabilities in foreign currencies | | 645,164,532 |
Net Assets | | $ 4,196,425,941 |
Statement of Assets and Liabilities - continued
| October 31, 2011 |
| | |
Calculation of Maximum Offering Price Class A:
Net Asset Value and redemption price per share ($215,368,915 ÷ 4,125,938 shares) | | $ 52.20 |
| | |
Maximum offering price per share (100/94.25 of $52.20) | | $ 55.38 |
Class T:
Net Asset Value and redemption price per share ($34,323,432 ÷ 659,962 shares) | | $ 52.01 |
| | |
Maximum offering price per share (100/96.50 of $52.01) | | $ 53.90 |
Class B:
Net Asset Value and offering price per share ($11,865,923 ÷ 230,978 shares)A | | $ 51.37 |
| | |
Class C:
Net Asset Value and offering price per share ($87,990,432 ÷ 1,719,005 shares)A | | $ 51.19 |
| | |
Canada:
Net Asset Value, offering price and redemption price per share ($3,778,765,485 ÷ 71,854,822 shares) | | $ 52.59 |
| | |
Institutional Class:
Net Asset Value, offering price and redemption price per share ($68,111,754 ÷ 1,298,734 shares) | | $ 52.44 |
A Redemption price per share is equal to net asset value less any applicable contingent deferred sales charge.
See accompanying notes which are an integral part of the financial statements.
Annual Report
Fidelity Canada Fund
Financial Statements - continued
Statement of Operations
| Year ended October 31, 2011 |
Investment Income | | |
Dividends | | $ 93,229,781 |
Interest | | 2,244 |
Income from Fidelity Central Funds | | 4,035,925 |
Income before foreign taxes withheld | | 97,267,950 |
Less foreign taxes withheld | | (14,111,670) |
Total income | | 83,156,280 |
| | |
Expenses | | |
Management fee
Basic fee | $ 34,360,665 | |
Performance adjustment | (6,900,443) | |
Transfer agent fees | 10,426,659 | |
Distribution and service plan fees | 1,760,960 | |
Accounting and security lending fees | 1,578,714 | |
Custodian fees and expenses | 175,916 | |
Independent trustees' compensation | 26,697 | |
Registration fees | 206,023 | |
Audit | 76,184 | |
Legal | 18,843 | |
Interest | 1,812 | |
Miscellaneous | 46,952 | |
Total expenses before reductions | 41,778,982 | |
Expense reductions | (167,832) | 41,611,150 |
| | |
Net investment income (loss) | | 41,545,130 |
Realized and Unrealized Gain (Loss) Net realized gain (loss) on: | | |
Investment securities: | | |
Unaffiliated issuers | 37,110,984 | |
Other affiliated issuers | 7,343,328 | |
Foreign currency transactions | (1,156,953) | |
Total net realized gain (loss) | | 43,297,359 |
Change in net unrealized appreciation (depreciation) on: Investment securities | (192,052,898) | |
Assets and liabilities in foreign currencies | (69,228) | |
Total change in net unrealized appreciation (depreciation) | | (192,122,126) |
Net gain (loss) | | (148,824,767) |
Net increase (decrease) in net assets resulting from operations | | $ (107,279,637) |
Statement of Changes in Net Assets
| Year ended
October 31,
2011 | Year ended
October 31,
2010 |
Increase (Decrease) in Net Assets | | |
Operations | | |
Net investment income (loss) | $ 41,545,130 | $ 34,662,867 |
Net realized gain (loss) | 43,297,359 | 83,766,517 |
Change in net unrealized appreciation (depreciation) | (192,122,126) | 641,046,346 |
Net increase (decrease) in net assets resulting from operations | (107,279,637) | 759,475,730 |
Distributions to shareholders from net investment income | (35,317,815) | (34,208,293) |
Distributions to shareholders from net realized gain | (35,060,747) | - |
Total distributions | (70,378,562) | (34,208,293) |
Share transactions - net increase (decrease) | 103,024,419 | 243,266,632 |
Redemption fees | 1,146,266 | 759,127 |
Total increase (decrease) in net assets | (73,487,514) | 969,293,196 |
| | |
Net Assets | | |
Beginning of period | 4,269,913,455 | 3,300,620,259 |
End of period (including undistributed net investment income of $25,762,870 and undistributed net investment income of $26,745,120, respectively) | $ 4,196,425,941 | $ 4,269,913,455 |
See accompanying notes which are an integral part of the financial statements.
Annual Report
Financial Highlights - Class A
Years ended October 31, | 2011 | 2010 | 2009 | 2008 | 2007 H |
Selected Per-Share Data | | | | | |
Net asset value, beginning of period | $ 53.81 | $ 44.24 | $ 38.20 | $ 70.16 | $ 54.00 |
Income from Investment Operations | | | | | |
Net investment income (loss) E | .34 | .31 | .38 | .39 | .19 |
Net realized and unrealized gain (loss) | (1.17) | 9.64 | 5.72 | (28.71) | 15.96 |
Total from investment operations | (.83) | 9.95 | 6.10 | (28.32) | 16.15 |
Distributions from net investment income | (.35) | (.39) | (.07) | (.41) | - |
Distributions from net realized gain | (.44) | - | - | (3.27) | - |
Total distributions | (.79) | (.39) | (.07) | (3.68) | - |
Redemption fees added to paid in capital E | .01 | .01 | .01 | .04 | .01 |
Net asset value, end of period | $ 52.20 | $ 53.81 | $ 44.24 | $ 38.20 | $ 70.16 |
Total Return B, C, D | (1.64)% | 22.62% | 16.08% | (42.23)% | 29.93% |
Ratios to Average Net Assets F, I | | | | | |
Expenses before reductions | 1.12% | 1.24% | 1.42% | 1.34% | 1.23% A |
Expenses net of fee waivers, if any | 1.12% | 1.24% | 1.42% | 1.34% | 1.23% A |
Expenses net of all reductions | 1.12% | 1.18% | 1.39% | 1.31% | 1.22% A |
Net investment income (loss) | .59% | .63% | .98% | .69% | .63% A |
Supplemental Data | | | | | |
Net assets, end of period (000 omitted) | $ 215,369 | $ 170,446 | $ 83,015 | $ 56,242 | $ 20,912 |
Portfolio turnover rate G | 104% | 143% | 123% | 63% | 42% |
A Annualized B Total returns for periods of less than one year are not annualized. C Total returns would have been lower if certain expenses had not been reduced during the applicable periods shown. D Total returns do not include the effect of the sales charges. E Calculated based on average shares outstanding during the period. F Fees and expenses of any underlying Fidelity Central Funds are not included in the Fund's expense ratio. The Fund indirectly bears its proportionate share of the expenses of any underlying Fidelity Central Funds. G Amount does not include the portfolio activity of any underlying Fidelity Central Funds. H For the period May 2, 2007 (commencement of sale of shares) to October 31, 2007. I Expense ratios reflect operating expenses of the class. Expenses before reductions do not reflect amounts reimbursed by the investment adviser or reductions from brokerage service arrangements or reductions from other expense offset arrangements and do not represent the amount paid by the class during periods when reimbursements or reductions occur. Expense ratios before reductions for start-up periods may not be representative of longer-term operating periods. Expenses net of fee waivers reflect expenses after reimbursement by the investment adviser but prior to reductions from brokerage service arrangements or other expense offset arrangements. Expenses net of all reductions represent the net expenses paid by the class. |
Financial Highlights - Class T
Years ended October 31, | 2011 | 2010 | 2009 | 2008 | 2007 H |
Selected Per-Share Data | | | | | |
Net asset value, beginning of period | $ 53.64 | $ 44.11 | $ 38.10 | $ 70.09 | $ 54.00 |
Income from Investment Operations | | | | | |
Net investment income (loss) E | .17 | .18 | .27 | .23 | .09 |
Net realized and unrealized gain (loss) | (1.16) | 9.60 | 5.73 | (28.66) | 15.99 |
Total from investment operations | (.99) | 9.78 | 6.00 | (28.43) | 16.08 |
Distributions from net investment income | (.21) | (.26) | - | (.33) | - |
Distributions from net realized gain | (.44) | - | - | (3.27) | - |
Total distributions | (.65) | (.26) | - | (3.60) | - |
Redemption fees added to paid in capital E | .01 | .01 | .01 | .04 | .01 |
Net asset value, end of period | $ 52.01 | $ 53.64 | $ 44.11 | $ 38.10 | $ 70.09 |
Total Return B, C, D | (1.93)% | 22.27% | 15.77% | (42.40)% | 29.80% |
Ratios to Average Net Assets F, I | | | | | |
Expenses before reductions | 1.42% | 1.51% | 1.70% | 1.63% | 1.48% A |
Expenses net of fee waivers, if any | 1.42% | 1.51% | 1.70% | 1.63% | 1.48% A |
Expenses net of all reductions | 1.42% | 1.46% | 1.67% | 1.60% | 1.47% A |
Net investment income (loss) | .30% | .36% | .71% | .40% | .30% A |
Supplemental Data | | | | | |
Net assets, end of period (000 omitted) | $ 34,323 | $ 31,522 | $ 17,727 | $ 14,963 | $ 14,522 |
Portfolio turnover rate G | 104% | 143% | 123% | 63% | 42% |
A Annualized B Total returns for periods of less than one year are not annualized. C Total returns would have been lower if certain expenses had not been reduced during the applicable periods shown. D Total returns do not include the effect of the sales charges. E Calculated based on average shares outstanding during the period. F Fees and expenses of any underlying Fidelity Central Funds are not included in the Fund's expense ratio. The Fund indirectly bears its proportionate share of the expenses of any underlying Fidelity Central Funds. G Amount does not include the portfolio activity of any underlying Fidelity Central Funds. H For the period May 2, 2007 (commencement of sale of shares) to October 31, 2007. I Expense ratios reflect operating expenses of the class. Expenses before reductions do not reflect amounts reimbursed by the investment adviser or reductions from brokerage service arrangements or reductions from other expense offset arrangements and do not represent the amount paid by the class during periods when reimbursements or reductions occur. Expense ratios before reductions for start-up periods may not be representative of longer-term operating periods. Expenses net of fee waivers reflect expenses after reimbursement by the investment adviser but prior to reductions from brokerage service arrangements or other expense offset arrangements. Expenses net of all reductions represent the net expenses paid by the class. |
See accompanying notes which are an integral part of the financial statements.
Annual Report
Financial Highlights - Class B
Years ended October 31, | 2011 | 2010 | 2009 | 2008 | 2007 H |
Selected Per-Share Data | | | | | |
Net asset value, beginning of period | $ 53.03 | $ 43.68 | $ 37.91 | $ 69.88 | $ 54.00 |
Income from Investment Operations | | | | | |
Net investment income (loss) E | (.11) | (.07) | .08 | (.06) | (.06) |
Net realized and unrealized gain (loss) | (1.14) | 9.50 | 5.68 | (28.54) | 15.93 |
Total from investment operations | (1.25) | 9.43 | 5.76 | (28.60) | 15.87 |
Distributions from net investment income | (.01) | (.09) | - | (.14) | - |
Distributions from net realized gain | (.41) | - | - | (3.27) | - |
Total distributions | (.42) | (.09) | - | (3.41) | - |
Redemption fees added to paid in capital E | .01 | .01 | .01 | .04 | .01 |
Net asset value, end of period | $ 51.37 | $ 53.03 | $ 43.68 | $ 37.91 | $ 69.88 |
Total Return B, C, D | (2.41)% | 21.64% | 15.22% | (42.68)% | 29.41% |
Ratios to Average Net Assets F, I | | | | | |
Expenses before reductions | 1.91% | 2.01% | 2.19% | 2.13% | 2.00% A |
Expenses net of fee waivers, if any | 1.91% | 2.01% | 2.19% | 2.13% | 2.00% A |
Expenses net of all reductions | 1.91% | 1.96% | 2.16% | 2.10% | 1.99% A |
Net investment income (loss) | (.20)% | (.14)% | .21% | (.10)% | (.21)% A |
Supplemental Data | | | | | |
Net assets, end of period (000 omitted) | $ 11,866 | $ 13,464 | $ 7,283 | $ 5,615 | $ 4,078 |
Portfolio turnover rate G | 104% | 143% | 123% | 63% | 42% |
A Annualized B Total returns for periods of less than one year are not annualized. C Total returns would have been lower if certain expenses had not been reduced during the applicable periods shown. D Total returns do not include the effect of the contingent deferred sales charge. E Calculated based on average shares outstanding during the period. F Fees and expenses of any underlying Fidelity Central Funds are not included in the Fund's expense ratio. The Fund indirectly bears its proportionate share of the expenses of any underlying Fidelity Central Funds. G Amount does not include the portfolio activity of any underlying Fidelity Central Funds. H For the period May 2, 2007 (commencement of sale of shares) to October 31, 2007. I Expense ratios reflect operating expenses of the class. Expenses before reductions do not reflect amounts reimbursed by the investment adviser or reductions from brokerage service arrangements or reductions from other expense offset arrangements and do not represent the amount paid by the class during periods when reimbursements or reductions occur. Expense ratios before reductions for start-up periods may not be representative of longer-term operating periods. Expenses net of fee waivers reflect expenses after reimbursement by the investment adviser but prior to reductions from brokerage service arrangements or other expense offset arrangements. Expenses net of all reductions represent the net expenses paid by the class. |
Financial Highlights - Class C
Years ended October 31, | 2011 | 2010 | 2009 | 2008 | 2007 H |
Selected Per-Share Data | | | | | |
Net asset value, beginning of period | $ 52.87 | $ 43.60 | $ 37.84 | $ 69.91 | $ 54.00 |
Income from Investment Operations | | | | | |
Net investment income (loss) E | (.08) | (.06) | .09 | (.05) | (.04) |
Net realized and unrealized gain (loss) | (1.14) | 9.48 | 5.66 | (28.52) | 15.94 |
Total from investment operations | (1.22) | 9.42 | 5.75 | (28.57) | 15.90 |
Distributions from net investment income | (.03) | (.16) | - | (.27) | - |
Distributions from net realized gain | (.44) | - | - | (3.27) | - |
Total distributions | (.47) | (.16) | - | (3.54) | - |
Redemption fees added to paid in capital E | .01 | .01 | .01 | .04 | .01 |
Net asset value, end of period | $ 51.19 | $ 52.87 | $ 43.60 | $ 37.84 | $ 69.91 |
Total Return B, C, D | (2.36)% | 21.68% | 15.22% | (42.69)% | 29.46% |
Ratios to Average Net Assets F, I | | | | | |
Expenses before reductions | 1.86% | 1.99% | 2.18% | 2.13% | 1.99% A |
Expenses net of fee waivers, if any | 1.86% | 1.99% | 2.18% | 2.13% | 1.99% A |
Expenses net of all reductions | 1.86% | 1.94% | 2.15% | 2.10% | 1.97% A |
Net investment income (loss) | (.15)% | (.12)% | .22% | (.10)% | (.15)% A |
Supplemental Data | | | | | |
Net assets, end of period (000 omitted) | $ 87,990 | $ 54,052 | $ 24,848 | $ 16,716 | $ 8,752 |
Portfolio turnover rate G | 104% | 143% | 123% | 63% | 42% |
A Annualized B Total returns for periods of less than one year are not annualized. C Total returns would have been lower if certain expenses had not been reduced during the applicable periods shown. D Total returns do not include the effect of the contingent deferred sales charge. E Calculated based on average shares outstanding during the period. F Fees and expenses of any underlying Fidelity Central Funds are not included in the Fund's expense ratio. The Fund indirectly bears its proportionate share of the expenses of any underlying Fidelity Central Funds. G Amount does not include the portfolio activity of any underlying Fidelity Central Funds. H For the period May 2, 2007 (commencement of sale of shares) to October 31, 2007. I Expense ratios reflect operating expenses of the class. Expenses before reductions do not reflect amounts reimbursed by the investment adviser or reductions from brokerage service arrangements or reductions from other expense offset arrangements and do not represent the amount paid by the class during periods when reimbursements or reductions occur. Expense ratios before reductions for start-up periods may not be representative of longer-term operating periods. Expenses net of fee waivers reflect expenses after reimbursement by the investment adviser but prior to reductions from brokerage service arrangements or other expense offset arrangements. Expenses net of all reductions represent the net expenses paid by the class. |
See accompanying notes which are an integral part of the financial statements.
Annual Report
Financial Highlights - Canada
Years ended October 31, | 2011 | 2010 | 2009 | 2008 | 2007 |
Selected Per-Share Data | | | | | |
Net asset value, beginning of period | $ 54.14 | $ 44.46 | $ 38.37 | $ 70.25 | $ 49.48 |
Income from Investment Operations | | | | | |
Net investment income (loss) B | .52 | .46 | .48 | .58 | .52 |
Net realized and unrealized gain (loss) | (1.18) | 9.68 | 5.74 | (28.83) | 21.62 |
Total from investment operations | (.66) | 10.14 | 6.22 | (28.25) | 22.14 |
Distributions from net investment income | (.46) | (.47) | (.14) | (.40) | (.36) |
Distributions from net realized gain | (.44) | - | - | (3.27) | (1.03) |
Total distributions | (.90) | (.47) | (.14) | (3.67) | (1.39) |
Redemption fees added to paid in capital B | .01 | .01 | .01 | .04 | .02 |
Net asset value, end of period | $ 52.59 | $ 54.14 | $ 44.46 | $ 38.37 | $ 70.25 |
Total Return A | (1.33)% | 22.97% | 16.40% | (42.06)% | 46.03% |
Ratios to Average Net Assets C, E | | | | | |
Expenses before reductions | .82% | .94% | 1.17% | 1.03% | .96% |
Expenses net of fee waivers, if any | .82% | .94% | 1.17% | 1.03% | .96% |
Expenses net of all reductions | .82% | .89% | 1.13% | 1.00% | .94% |
Net investment income (loss) | .90% | .93% | 1.24% | 1.00% | .94% |
Supplemental Data | | | | | |
Net assets, end of period (000 omitted) | $ 3,778,765 | $ 3,953,693 | $ 3,149,791 | $ 2,776,298 | $ 4,890,617 |
Portfolio turnover rate D | 104% | 143% | 123% | 63% | 42% |
A Total returns would have been lower if certain expenses had not been reduced during the applicable periods shown. B Calculated based on average shares outstanding during the period. C Fees and expenses of any underlying Fidelity Central Funds are not included in the Fund's expense ratio. The Fund indirectly bears its proportionate share of the expenses of any underlying Fidelity Central Funds. D Amount does not include the portfolio activity of any underlying Fidelity Central Funds. E Expense ratios reflect operating expenses of the class. Expenses before reductions do not reflect amounts reimbursed by the investment adviser or reductions from brokerage service arrangements or reductions from other expense offset arrangements and do not represent the amount paid by the class during periods when reimbursements or reductions occur. Expenses net of fee waivers reflect expenses after reimbursement by the investment adviser but prior to reductions from brokerage service arrangements or other expense offset arrangements. Expenses net of all reductions represent the net expenses paid by the class. |
Financial Highlights - Institutional Class
Years ended October 31, | 2011 | 2010 | 2009 | 2008 | 2007 G |
Selected Per-Share Data | | | | | |
Net asset value, beginning of period | $ 54.02 | $ 44.39 | $ 38.31 | $ 70.25 | $ 54.00 |
Income from Investment Operations | | | | | |
Net investment income (loss) D | .51 | .46 | .49 | .52 | .25 |
Net realized and unrealized gain (loss) | (1.18) | 9.65 | 5.72 | (28.78) | 15.99 |
Total from investment operations | (.67) | 10.11 | 6.21 | (28.26) | 16.24 |
Distributions from net investment income | (.48) | (.49) | (.14) | (.45) | - |
Distributions from net realized gain | (.44) | - | - | (3.27) | - |
Total distributions | (.92) | (.49) | (.14) | (3.72) | - |
Redemption fees added to paid in capital D | .01 | .01 | .01 | .04 | .01 |
Net asset value, end of period | $ 52.44 | $ 54.02 | $ 44.39 | $ 38.31 | $ 70.25 |
Total Return B, C | (1.35)% | 22.94% | 16.40% | (42.11)% | 30.09% |
Ratios to Average Net Assets E, H | | | | | |
Expenses before reductions | .82% | .95% | 1.17% | 1.11% | 1.01% A |
Expenses net of fee waivers, if any | .82% | .95% | 1.17% | 1.11% | 1.01% A |
Expenses net of all reductions | .82% | .90% | 1.14% | 1.08% | .99% A |
Net investment income (loss) | .89% | .92% | 1.23% | .92% | .83% A |
Supplemental Data | | | | | |
Net assets, end of period (000 omitted) | $ 68,112 | $ 46,737 | $ 17,956 | $ 8,870 | $ 4,064 |
Portfolio turnover rate F | 104% | 143% | 123% | 63% | 42% |
A Annualized B Total returns for periods of less than one year are not annualized. C Total returns would have been lower if certain expenses had not been reduced during the applicable periods shown. D Calculated based on average shares outstanding during the period. E Fees and expenses of any underlying Fidelity Central Funds are not included in the Fund's expense ratio. The Fund indirectly bears its proportionate share of the expenses of any underlying Fidelity Central Funds. F Amount does not include the portfolio activity of any underlying Fidelity Central Funds. G For the period May 2, 2007 (commencement of sale of shares) to October 31, 2007. H Expense ratios reflect operating expenses of the class. Expenses before reductions do not reflect amounts reimbursed by the investment adviser or reductions from brokerage service arrangements or reductions from other expense offset arrangements and do not represent the amount paid by the class during periods when reimbursements or reductions occur. Expense ratios before reductions for start-up periods may not be representative of longer-term operating periods. Expenses net of fee waivers reflect expenses after reimbursement by the investment adviser but prior to reductions from brokerage service arrangements or other expense offset arrangements. Expenses net of all reductions represent the net expenses paid by the class. |
See accompanying notes which are an integral part of the financial statements.
Annual Report
Notes to Financial Statements
For the period ended October 31, 2011
1. Organization.
Fidelity Canada Fund (the Fund) is a fund of Fidelity Investment Trust (the Trust) and is authorized to issue an unlimited number of shares. The Trust is registered under the Investment Company Act of 1940, as amended (the 1940 Act), as an open-end management investment company organized as a Massachusetts business trust. The Fund offers Class A, Class T, Class C, Canada, and Institutional Class shares, each of which, along with Class B shares, has equal rights as to assets and voting privileges. Effective after the close of business on September 1, 2010, Class B shares were closed to new accounts and additional purchases, except for exchanges and reinvestments by existing shareholders. Each class has exclusive voting rights with respect to matters that affect that class. Class B shares will automatically convert to Class A shares after a holding period of seven years from the initial date of purchase. Investment income, realized and unrealized capital gains and losses, the common expenses of the Fund, and certain fund-level expense reductions, if any, are allocated on a pro-rata basis to each class based on the relative net assets of each class to the total net assets of the Fund. Each class differs with respect to transfer agent and distribution and service plan fees incurred. Certain expense reductions may also differ by class.
2. Investments in Fidelity Central Funds.
The Fund invests in Fidelity Central Funds, which are open-end investment companies available only to other investment companies and accounts managed by Fidelity Management & Research Company (FMR) and its affiliates. The Fund's Schedule of Investments lists each of the Fidelity Central Funds held as of period end, if any, as an investment of the Fund, but does not include the underlying holdings of each Fidelity Central Fund. As an Investing Fund, the Fund indirectly bears its proportionate share of the expenses of the underlying Fidelity Central Funds.
The Money Market Central Funds seek preservation of capital and current income and are managed by Fidelity Investments Money Management, Inc. (FIMM), an affiliate of FMR.
A complete unaudited list of holdings for each Fidelity Central Fund is available upon request or at the Securities and Exchange Commission (the SEC) web site at www.sec.gov. In addition, the financial statements of the Fidelity Central Funds, which are not covered by the Fund's Report of Independent Registered Public Accounting Firm are available on the SEC web site or upon request.
3. Significant Accounting Policies.
The financial statements have been prepared in conformity with accounting principles generally accepted in the United States of America (GAAP), which require management to make certain estimates and assumptions at the date of the financial statements. Actual results could differ from those estimates. Subsequent events, if any, through the date that the financial statements were issued have been evaluated in the preparation of the financial statements. The following summarizes the significant accounting policies of the Fund:
Security Valuation. Investments are valued as of 4:00 p.m. Eastern time on the last calendar day of the period. The Fund uses independent pricing services approved by the Board of Trustees to value its investments. When current market prices or quotations are not readily available or reliable, valuations may be determined in good faith in accordance with procedures adopted by the Board of Trustees. Factors used in determining value may include market or security specific events. The frequency with which these procedures are used cannot be predicted and they may be utilized to a significant extent. The value used for net asset value (NAV) calculation under these procedures may differ from published prices for the same securities.
The Fund categorizes the inputs to valuation techniques used to value its investments into a disclosure hierarchy consisting of three levels as shown below:
Level 1 - quoted prices in active markets for identical investments
Level 2 - other significant observable inputs (including quoted prices for similar investments, interest rates, prepayment speeds, etc.)
Level 3 - unobservable inputs (including the Fund's own assumptions based on the best information available)
Changes in valuation techniques may result in transfers in or out of an assigned level within the disclosure hierarchy. Valuation techniques used to value the Fund's investments by major category are as follows:
Equity securities, including restricted securities, for which market quotations are readily available, are valued at the last reported sale price or official closing price as reported by an independent pricing service on the primary market or exchange on which they are traded and are categorized as Level 1 in the hierarchy. In the event there were no sales during the day or closing prices are not available, securities are valued at the last quoted bid price or may be valued using the last available price and are generally categorized as Level 2 in the hierarchy. For foreign equity securities, when significant market or security specific events arise, comparisons to the valuation of American Depositary Receipts (ADRs), futures contracts, Exchange-traded funds (ETFs) and certain indexes as well as quoted prices for similar securities are used and are categorized as Level 2 in the hierarchy in these
Annual Report
3. Significant Accounting Policies - continued
Security Valuation - continued
circumstances. Utilizing these techniques may result in transfers between Level 1 and Level 2. For restricted equity securities and private placements where observable inputs are limited, assumptions about market activity and risk are used and are categorized as Level 3 in the hierarchy.
Investments in open-end mutual funds, including the Fidelity Central Funds, are valued at their closing net asset value each business day and are categorized as Level 1 in the hierarchy.
Foreign Currency. The Fund may use foreign currency contracts to facilitate transactions in foreign-denominated securities. Gains and losses from these transactions may arise from changes in the value of the foreign currency or if the counterparties do not perform under the contracts' terms.
Foreign-denominated assets, including investment securities, and liabilities are translated into U.S. dollars at the exchange rate at period end. Purchases and sales of investment securities, income and dividends received and expenses denominated in foreign currencies are translated into U.S. dollars at the exchange rate in effect on the transaction date.
The effects of exchange rate fluctuations on investments are included with the net realized and unrealized gain (loss) on investment securities. Other foreign currency transactions resulting in realized and unrealized gain (loss) are disclosed separately.
Investment Transactions and Income. For financial reporting purposes, the Fund's investment holdings and NAV include trades executed through the end of the last business day of the period. The NAV per share for processing shareholder transactions is calculated as of the close of business of the New York Stock Exchange (NYSE), normally 4:00 p.m. Eastern time and includes trades executed through the end of the prior business day. Gains and losses on securities sold are determined on the basis of identified cost and may include proceeds received from litigation. Dividend income is recorded on the ex-dividend date, except for certain dividends from foreign securities where the ex-dividend date may have passed, which are recorded as soon as the Fund is informed of the ex-dividend date. Non-cash dividends included in dividend income, if any, are recorded at the fair market value of the securities received. Distributions received on securities that represent a return of capital or capital gain are recorded as a reduction of cost of investments and/or as a realized gain. The Fund estimates the components of distributions received that may be considered return of capital distributions or capital gain distributions. Interest income and distributions from the Fidelity Central Funds are accrued as earned. Interest income includes coupon interest and amortization of premium and accretion of discount on debt securities. Investment income is recorded net of foreign taxes withheld where recovery of such taxes is uncertain.
Expenses. Expenses directly attributable to a fund are charged to that fund. Expenses attributable to more than one fund are allocated among the respective funds on the basis of relative net assets or other appropriate methods. Expense estimates are accrued in the period to which they relate and adjustments are made when actual amounts are known.
Income Tax Information and Distributions to Shareholders. Each year, the Fund intends to qualify as a regulated investment company, including distributing substantially all of its taxable income and realized gains under Subchapter M of the Internal Revenue Code and filing its U.S. federal tax return. As a result, no provision for income taxes is required. As of October 31, 2011, the Fund did not have any unrecognized tax benefits in the financial statements. A fund's federal tax return is subject to examination by the Internal Revenue Service (IRS) for a period of three years. Foreign taxes are provided for based on the Fund's understanding of the tax rules and rates that exist in the foreign markets in which it invests.
Distributions are declared and recorded on the ex-dividend date. Income dividends and capital gain distributions are declared separately for each class. Income and capital gain distributions are determined in accordance with income tax regulations, which may differ from GAAP. In addition, the Fund claimed a portion of the payment made to redeeming shareholders as a distribution for income tax purposes.
Capital accounts within the financial statements are adjusted for permanent book-tax differences. These adjustments have no impact on net assets or the results of operations. Temporary book-tax differences will reverse in a subsequent period.
Book-tax differences are primarily due to foreign currency transactions, passive foreign investment companies (PFIC), deferred trustees compensation, capital loss carryforwards and losses deferred due to wash sales.
The federal tax cost of investment securities and unrealized appreciation (depreciation) as of period end were as follows:
Gross unrealized appreciation | $ 717,722,960 |
Gross unrealized depreciation | (119,654,228) |
Net unrealized appreciation (depreciation) on securities and other investments | $ 598,068,732 |
| |
Tax Cost | $ 4,041,939,474 |
Annual Report
Notes to Financial Statements - continued
3. Significant Accounting Policies - continued
Income Tax Information and Distributions to Shareholders - continued
The tax-based components of distributable earnings as of period end were as follows:
Undistributed ordinary income | $ 48,166,855 |
Capital loss carryforward | $ (230,403,828) |
Net unrealized appreciation (depreciation) | $ 598,095,680 |
Under the recently enacted Regulated Investment Company Modernization Act of 2010 (the Act), the Fund will be permitted to carry forward capital losses incurred in taxable years beginning after December 22, 2010 for an unlimited period. However, any losses incurred during those future taxable years will be required to be utilized prior to any losses incurred in pre-enactment taxable years, which generally expire after eight years from when they are incurred. Additionally, post-enactment capital losses that are carried forward will retain their character as either short-term or long-term capital losses rather than being considered all short-term as under previous law. The Fund's first fiscal year end subject to the Act will be October 31, 2012.
The tax character of distributions paid was as follows:
| October 31, 2011 | October 31, 2010 |
Ordinary Income | $ 70,378,562 | $ 34,208,293 |
Short-Term Trading (Redemption) Fees. Shares held by investors in the Fund less than 90 days are subject to a redemption fee equal to 1.50% of the net asset value of shares redeemed. All redemption fees, which reduce the proceeds of the shareholder redemption, are retained by the Fund and accounted for as an addition to paid in capital.
New Accounting Pronouncement. In May 2011, the Financial Accounting Standards Board issued Accounting Standard Update No. 2011-04, Fair Value Measurement (Topic 820) - Amendments to Achieve Common Fair Value Measurement and Disclosure Requirements in U.S. GAAP and IFRSs. The update changes the wording used to describe the requirements in GAAP for measuring fair value and for disclosing information about fair value measurements. The update is effective during interim and annual periods beginning after December 15, 2011. Management is currently evaluating the impact of the update's adoption on the Fund's financial statement disclosures.
4. Operating Policies.
Restricted Securities. The Fund may invest in securities that are subject to legal or contractual restrictions on resale. These securities generally may be resold in transactions exempt from registration or to the public if the securities are registered. Disposal of these securities may involve time-consuming negotiations and expense, and prompt sale at an acceptable price may be difficult. Information regarding restricted securities is included at the end of the Fund's Schedule of Investments.
5. Purchases and Sales of Investments.
Purchases and sales of securities, other than short-term securities, aggregated $5,106,179,444 and $5,000,568,630, respectively.
6. Fees and Other Transactions with Affiliates.
Management Fee. FMR and its affiliates provide the Fund with investment management related services for which the Fund pays a monthly management fee. The management fee is the sum of an individual fund fee rate that is based on an annual rate of .45% of the Fund's average net assets and a group fee rate that averaged .26% during the period. The group fee rate is based upon the average net assets of all the mutual funds advised by FMR. The group fee rate decreases as assets under management increase and increases as assets under management decrease. In addition, the management fee is subject to a performance adjustment(up to a maximum of ± .20% of the Fund's average net assets over a 36 month performance period). The upward or downward adjustment to the management fee is based on the relative investment performance of Canada, as compared to an appropriate benchmark index. For the period, the total annual management fee rate, including the performance adjustment, was .57% of the Fund's average net assets.
Annual Report
6. Fees and Other Transactions with Affiliates - continued
Distribution and Service Plan Fees. In accordance with Rule 12b-1 of the 1940 Act, the Fund has adopted separate Distribution and Service Plans for each class of shares. Certain classes pay Fidelity Distributors Corporation (FDC), an affiliate of FMR, separate Distribution and Service Fees, each of which is based on an annual percentage of each class' average net assets. In addition, FDC may pay financial intermediaries for selling shares of the Fund and providing shareholder support services. For the period, the Distribution and Service Fee rates, total fees and amounts retained by FDC were as follows:
| Distribution
Fee | Service
Fee | Total Fees | Retained
by FDC |
Class A | -% | .25% | $ 566,795 | $ 32,945 |
Class T | .25% | .25% | 185,890 | 210 |
Class B | .75% | .25% | 139,258 | 104,508 |
Class C | .75% | .25% | 869,017 | 422,773 |
| | | $ 1,760,960 | $ 560,436 |
Sales Load. FDC may receive a front-end sales charge of up to 5.75% for selling Class A shares, and 3.50% for selling Class T shares, some of which is paid to financial intermediaries for selling shares of the Fund. Depending on the holding period, FDC may receive contingent deferred sales charges levied on Class A, Class T, Class B, and Class C redemptions. The deferred sales charges range from 5% to 1% for Class B, 1% for Class C, 1.00% for certain purchases of Class A shares and .25% for certain purchases of Class T shares.
For the period, sales charge amounts retained by FDC were as follows:
| Retained
by FDC |
Class A | $ 260,709 |
Class T | 25,148 |
Class B | 38,839 |
Class C | 30,296 |
| $ 354,992 |
* When Class B and Class C shares are initially sold, FDC pays commissions from its own resources to financial intermediaries through which the sales are made.
Transfer Agent Fees. Fidelity Investments Institutional Operations Company, Inc. (FIIOC), an affiliate of FMR, is the transfer, dividend disbursing and shareholder servicing agent for each class of the Fund. FIIOC receives account fees and asset-based fees that vary according to the account size and type of account of the shareholders of the respective classes of the Fund. FIIOC pays for typesetting, printing and mailing of shareholder reports, except proxy statements. For the period, transfer agent fees for each class were as follows:
| Amount | % of
Average
Net Assets |
Class A | $ 593,736 | .26 |
Class T | 114,586 | .31 |
Class B | 42,095 | .30 |
Class C | 221,883 | .26 |
Canada | 9,286,013 | .21 |
Institutional Class | 168,346 | .21 |
| $ 10,426,659 | |
Accounting and Security Lending Fees. Fidelity Service Company, Inc. (FSC), an affiliate of FMR, maintains the Fund's accounting records. The accounting fee is based on the level of average net assets for the month. Under a separate contract, FSC administers the security lending program. The security lending fee is based on the number and duration of lending transactions.
Brokerage Commissions. The Fund placed a portion of its portfolio transactions with brokerage firms which are affiliates of the investment adviser. The commissions paid to these affiliated firms were $10,658 for the period.
Interfund Lending Program. Pursuant to an Exemptive Order issued by the SEC, the Fund, along with other registered investment companies having management contracts with FMR, may participate in an interfund lending program. This program provides an alternative credit facility allowing the
Annual Report
Notes to Financial Statements - continued
6. Fees and Other Transactions with Affiliates - continued
Interfund Lending Program - continued
funds to borrow from, or lend money to, other participating affiliated funds. At period end, there were no interfund loans outstanding. The Fund's activity in this program during the period for which loans were outstanding was as follows:
Borrower or Lender | Average Daily
Loan Balance | Weighted Average Interest Rate | Interest
Expense |
Borrower | $ 10,827,176 | .35% | $ 1,812 |
7. Committed Line of Credit.
The Fund participates with other funds managed by FMR or an affiliate in a $4.0 billion credit facility (the "line of credit") to be utilized for temporary or emergency purposes to fund shareholder redemptions or for other short-term liquidity purposes. The Fund has agreed to pay commitment fees on its pro-rata portion of the line of credit, which amounted to $14,864 and is reflected in Miscellaneous expenses on the Statement of Operations. During the period, there were no borrowings on this line of credit.
8. Security Lending.
The Fund lends portfolio securities through a lending agent from time to time in order to earn additional income. For equity securities, a lending agent is used and may loan securities to certain qualified borrowers, including Fidelity Capital Markets (FCM), a broker-dealer affiliated with the Fund. On the settlement date of the loan, the Fund receives collateral (in the form of U.S. Treasury obligations, letters of credit and/or cash) against the loaned securities and maintains collateral in an amount not less than 100% of the market value of the loaned securities during the period of the loan. The market value of the loaned securities is determined at the close of business of the Fund and any additional required collateral is delivered to the Fund on the next business day. If the borrower defaults on its obligation to return the securities loaned because of insolvency or other reasons, a fund could experience delays and costs in recovering the securities loaned or in gaining access to the collateral. Any cash collateral received is invested in the Fidelity Securities Lending Cash Central Fund. The value of loaned securities and cash collateral at period end are disclosed on the Fund's Statement of Assets and Liabilities. Security lending income represents the income earned on investing cash collateral, less rebates paid to borrowers and any lending agent fees associated with the loan, plus any premium payments received for lending certain types of securities. Security lending income is presented in the Statement of Operations as a component of income from Fidelity Central Funds. Total security lending income during the period amounted to $3,940,584. During the period, there were no securities loaned to FCM.
9. Expense Reductions.
Many of the brokers with whom FMR places trades on behalf of the Fund provided services to the Fund in addition to trade execution. These services included payments of certain expenses on behalf of the Fund totaling $167,832 for the period.
10. Distributions to Shareholders.
Distributions to shareholders of each class were as follows:
Years ended October 31, | 2011 | 2010 |
From net investment income | | |
Class A | $ 1,141,830 | $ 756,039 |
Class T | 123,341 | 106,904 |
Class B | 2,503 | 15,600 |
Class C | 36,231 | 97,752 |
Canada | 33,570,065 | 33,027,962 |
Institutional Class | 443,845 | 204,036 |
Total | $ 35,317,815 | $ 34,208,293 |
From net realized gain | | |
Class A | $ 1,445,324 | $ - |
Class T | 261,152 | - |
Class B | 101,491 | - |
Class C | 470,108 | - |
Canada | 32,375,322 | - |
Institutional Class | 407,350 | - |
Total | $ 35,060,747 | $ - |
Annual Report
11. Share Transactions.
Transactions for each class of shares were as follows:
| Shares | Dollars |
Years ended October 31, | 2011 | 2010 | 2011 | 2010 |
Class A | | | | |
Shares sold | 2,386,291 | 2,050,255 | $ 138,991,055 | $ 102,518,373 |
Reinvestment of distributions | 39,424 | 14,622 | 2,233,433 | 696,013 |
Shares redeemed | (1,467,607) | (773,357) | (82,665,471) | (38,292,678) |
Net increase (decrease) | 958,108 | 1,291,520 | $ 58,559,017 | $ 64,921,708 |
Class T | | | | |
Shares sold | 254,873 | 296,633 | $ 14,715,904 | $ 14,818,898 |
Reinvestment of distributions | 6,640 | 2,182 | 375,773 | 103,790 |
Shares redeemed | (189,243) | (113,003) | (10,669,184) | (5,600,141) |
Net increase (decrease) | 72,270 | 185,812 | $ 4,422,493 | $ 9,322,547 |
Class B | | | | |
Shares sold | 29,930 | 134,473 | $ 1,729,701 | $ 6,579,801 |
Reinvestment of distributions | 1,508 | 263 | 84,713 | 12,424 |
Shares redeemed | (54,348) | (47,606) | (3,060,843) | (2,342,627) |
Net increase (decrease) | (22,910) | 87,130 | $ (1,246,429) | $ 4,249,598 |
Class C | | | | |
Shares sold | 1,081,104 | 647,123 | $ 62,770,855 | $ 31,812,568 |
Reinvestment of distributions | 7,014 | 1,580 | 392,322 | 74,410 |
Shares redeemed | (391,485) | (196,235) | (21,249,300) | (9,599,233) |
Net increase (decrease) | 696,633 | 452,468 | $ 41,913,877 | $ 22,287,745 |
Canada | | | | |
Shares sold | 20,804,881 | 20,151,337 | $ 1,223,871,558 | $ 1,010,632,290 |
Reinvestment of distributions | 1,069,329 | 659,119 | 60,856,944 | 31,486,105 |
Shares redeemed | (23,043,159) | (18,629,713) | (1,313,818,426) | (923,131,901) |
Net increase (decrease) | (1,168,949) | 2,180,743 | $ (29,089,924) | $ 118,986,494 |
Institutional Class | | | | |
Shares sold | 1,331,261 | 717,543 | $ 79,262,853 | $ 36,118,321 |
Reinvestment of distributions | 10,934 | 2,830 | 620,606 | 134,893 |
Shares redeemed | (908,649) | (259,715) | (51,418,074) | (12,754,674) |
Net increase (decrease) | 433,546 | 460,658 | $ 28,465,385 | $ 23,498,540 |
12. Other.
The Fund's organizational documents provide former and current trustees and officers with a limited indemnification against liabilities arising in connection with the performance of their duties to the Fund. In the normal course of business, the Fund may also enter into contracts that provide general indemnifications. The Fund's maximum exposure under these arrangements is unknown as this would be dependent on future claims that may be made against the Fund. The risk of material loss from such claims is considered remote.
Annual Report
Report of Independent Registered Public Accounting Firm
To the Trustees of Fidelity Investment Trust and the Shareholders of Fidelity Canada Fund:
In our opinion, the accompanying statement of assets and liabilities, including the schedule of investments, and the related statements of operations and of changes in net assets and the financial highlights present fairly, in all material respects, the financial position of Fidelity Canada Fund (a fund of Fidelity Investment Trust) at October 31, 2011, the results of its operations for the year then ended, the changes in its net assets for each of the two years in the period then ended and the financial highlights for each of the periods indicated, in conformity with accounting principles generally accepted in the United States of America. These financial statements and financial highlights (hereafter referred to as "financial statements") are the responsibility of the Fidelity Canada Fund's management. Our responsibility is to express an opinion on these financial statements based on our audits. We conducted our audits of these financial statements in accordance with the standards of the Public Company Accounting Oversight Board (United States). Those standards require that we plan and perform the audit to obtain reasonable assurance about whether the financial statements are free of material misstatement. An audit includes examining, on a test basis, evidence supporting the amounts and disclosures in the financial statements, assessing the accounting principles used and significant estimates made by management, and evaluating the overall financial statement presentation. We believe that our audits, which included confirmation of securities at October 31, 2011 by correspondence with the custodian and brokers, provide a reasonable basis for our opinion.
PricewaterhouseCoopers LLP
Boston, Massachusetts
December 16, 2011
Annual Report
The Trustees, Members of the Advisory Board, and executive officers of the trust and fund, as applicable, are listed below. The Board of Trustees governs the fund and is responsible for protecting the interests of shareholders. The Trustees are experienced executives who meet periodically throughout the year to oversee the fund's activities, review contractual arrangements with companies that provide services to the fund, oversee management of the risks associated with such activities and contractual arrangements, and review the fund's performance. Except for James C. Curvey, each of the Trustees oversees 226 funds advised by FMR or an affiliate. Mr. Curvey oversees 429 funds advised by FMR or an affiliate.
The Trustees hold office without limit in time except that (a) any Trustee may resign; (b) any Trustee may be removed by written instrument, signed by at least two-thirds of the number of Trustees prior to such removal; (c) any Trustee who requests to be retired or who has become incapacitated by illness or injury may be retired by written instrument signed by a majority of the other Trustees; and (d) any Trustee may be removed at any special meeting of shareholders by a two-thirds vote of the outstanding voting securities of the trust. Each Trustee who is not an interested person (as defined in the 1940 Act) (Independent Trustee), shall retire not later than the last day of the calendar year in which his or her 75th birthday occurs. The Independent Trustees may waive this mandatory retirement age policy with respect to individual Trustees. The executive officers and Advisory Board Members hold office without limit in time, except that any officer and Advisory Board Member may resign or may be removed by a vote of a majority of the Trustees at any regular meeting or any special meeting of the Trustees. Except as indicated, each individual has held the office shown or other offices in the same company for the past five years.
Experience, Skills, Attributes, and Qualifications of the Fund's Trustees. The Governance and Nominating Committee has adopted a statement of policy that describes the experience, qualifications, attributes, and skills that are necessary and desirable for potential Independent Trustee candidates (Statement of Policy). The Board believes that each Trustee satisfied at the time he or she was initially elected or appointed a Trustee, and continues to satisfy, the standards contemplated by the Statement of Policy. The Governance and Nominating Committee also engages professional search firms to help identify potential Independent Trustee candidates who have the experience, qualifications, attributes, and skills consistent with the Statement of Policy. From time to time, additional criteria based on the composition and skills of the current Independent Trustees, as well as experience or skills that may be appropriate in light of future changes to board composition, business conditions, and regulatory or other developments, have also been considered by the professional search firms and the Governance and Nominating Committee. In addition, the Board takes into account the Trustees' commitment and participation in Board and committee meetings, as well as their leadership of standing and ad hoc committees throughout their tenure.
In determining that a particular Trustee was and continues to be qualified to serve as a Trustee, the Board has considered a variety of criteria, none of which, in isolation, was controlling. The Board believes that, collectively, the Trustees have balanced and diverse experience, qualifications, attributes, and skills, which allow the Board to operate effectively in governing the fund and protecting the interests of shareholders. Information about the specific experience, skills, attributes, and qualifications of each Trustee, which in each case led to the Board's conclusion that the Trustee should serve (or continue to serve) as a trustee of the fund, is provided below.
Board Structure and Oversight Function. James C. Curvey is an interested person (as defined in the 1940 Act) and currently serves as Acting Chairman. The Trustees have determined that an interested Chairman is appropriate and benefits shareholders because an interested Chairman has a personal and professional stake in the quality and continuity of services provided to the fund. Independent Trustees exercise their informed business judgment to appoint an individual of their choosing to serve as Chairman, regardless of whether the Trustee happens to be independent or a member of management. The Independent Trustees have determined that they can act independently and effectively without having an Independent Trustee serve as Chairman and that a key structural component for assuring that they are in a position to do so is for the Independent Trustees to constitute a substantial majority for the Board. The Independent Trustees also regularly meet in executive session. Ned C. Lautenbach serves as Chairman of the Independent Trustees and as such (i) acts as a liaison between the Independent Trustees and management with respect to matters important to the Independent Trustees and (ii) with management prepares agendas for Board meetings.
Fidelity funds are overseen by different Boards of Trustees. The fund's Board oversees Fidelity's equity and high income funds and another Board oversees Fidelity's investment-grade bond, money market, and asset allocation funds. The asset allocation funds may invest in Fidelity funds overseen by the fund's Board. The use of separate Boards, each with its own committee structure, allows the Trustees of each group of Fidelity funds to focus on the unique issues of the funds they oversee, including common research, investment, and operational issues. On occasion, the separate Boards establish joint committees to address issues of overlapping consequences for the Fidelity funds overseen by each Board.
The Trustees operate using a system of committees to facilitate the timely and efficient consideration of all matters of importance to the Trustees, the fund, and fund shareholders and to facilitate compliance with legal and regulatory requirements and oversight of the fund's activities and associated risks. The Board, acting through its committees, has charged FMR and its affiliates with (i) identifying events or circumstances the occurrence of which could have demonstrably adverse effects on the fund's business and/or reputation; (ii) implementing processes and controls to lessen the possibility that such events or circumstances occur or to mitigate the effects of such events or circumstances if they do occur; and (iii) creating and maintaining a system designed to evaluate continuously business and market conditions in order to facilitate the identification and implementation processes described in (i) and (ii) above. Because the day-to-day operations and activities of the fund are carried out by or through FMR, its affiliates and other service providers, the fund's exposure to risks is mitigated but not eliminated by the processes overseen by the Trustees. While each of the Board's committees has responsibility for overseeing different aspects of the fund's activities, oversight is exercised primarily through the Operations, Audit, and Compliance Committees. In addition, the Independent Trustees have worked with FMR to enhance the Board's oversight of investment and financial risks, legal and regulatory risks, technology risks, and operational risks, including the development of additional risk reporting to the Board. For example, a working group comprised of Independent Trustees and FMR has worked and continues to work to review the Fidelity funds' valuation-related activities, reporting and risk management. Appropriate personnel, including but not limited to the fund's Chief Compliance Officer (CCO), FMR's internal auditor, the independent accountants, the fund's Treasurer and portfolio management personnel, make periodic reports to the Board's committees, as appropriate, including an annual review of FMR's risk management program for the Fidelity funds. The responsibilities of each standing committee, including their oversight responsibilities, are described further under "Standing Committees of the Fund's Trustees."
Annual Report
Trustees and Officers - continued
The fund's Statement of Additional Information (SAI) includes more information about the Trustees. To request a free copy, call Fidelity at 1-877-208-0098.
Interested Trustees*:
Correspondence intended for each Trustee who is an interested person may be sent to Fidelity Investments, 82 Devonshire Street, Boston, Massachusetts 02109.
Name, Age; Principal Occupations and Other Relevant Experience+ |
James C. Curvey (76) |
| Year of Election or Appointment: 2007 Mr. Curvey is Trustee and Acting Chairman of the Board of Trustees of certain Trusts. Mr. Curvey also serves as Trustee (2007-present) of other investment companies advised by FMR. Mr. Curvey is a Director of Fidelity Investments Money Management, Inc. (2009-present), Director of Fidelity Research & Analysis Co. (2009-present) and Director of FMR and FMR Co., Inc. (2007-present). Mr. Curvey is also Vice Chairman (2007-present) and Director of FMR LLC. In addition, Mr. Curvey serves as an Overseer for the Boston Symphony Orchestra and a member of the Trustees of Villanova University. Previously, Mr. Curvey was the Vice Chairman (2006-2007) and Director (2000-2007) of FMR Corp. |
Ronald P. O'Hanley (54) |
| Year of Election or Appointment: 2011 Mr. O'Hanley is Director of FMR Co., Inc. (2010-present), Director of Fidelity Investments Money Management, Inc. (2010-present), Director of Fidelity Research & Analysis Company (2010-present), President of Fidelity Asset Management and Corporate Services and a member of Fidelity's Executive Committee (2010-present). Previously, Mr. O'Hanley served as President and Chief Executive Officer of BNY Mellon Asset Management (2007-2010). Mr. O'Hanley also served as Vice Chairman of Bank New York Mellon Corp. and a member of that firm's Executive Committee. Prior to the 2007 merger of The Bank of New York and Mellon Financial Corporation, he was Vice Chairman of Mellon Financial Corporation and President and Chief Executive Officer of Mellon Asset Management. He joined Mellon in February 1997. Mr. O'Hanley currently serves as Chairman of the Boston Public Library Foundation Board of Directors and sits on the Board of Directors of Beth Israel Deaconess Medical Center, the Board of Trustees of the Marine Biological Laboratory and the Advisory Board of the Maxwell School of Citizenship and Public Administration at Syracuse University. Mr. O'Hanley also chairs the Council on Asset Management for the Financial Services Roundtable and is a member of the Board of Directors of Institutional Investor's U.S. Institute. |
* Trustees have been determined to be "Interested Trustees" by virtue of, among other things, their affiliation with the trust or various entities under common control with FMR.
+ The information above includes each Trustee's principal occupation during the last five years and other information relating to the experience, attributes, and skills relevant to each Trustee's qualifications to serve as a Trustee, which led to the conclusion that each Trustee should serve as a Trustee for the fund.
Independent Trustees:
Correspondence intended for each Independent Trustee (that is, the Trustees other than the Interested Trustees) may be sent to Fidelity Investments, P.O. Box 55235, Boston, Massachusetts 02205-5235.
Name, Age; Principal Occupations and Other Relevant Experience+ |
Dennis J. Dirks (63) |
| Year of Election or Appointment: 2005 Prior to his retirement in May 2003, Mr. Dirks was Chief Operating Officer and a member of the Board of The Depository Trust & Clearing Corporation (DTCC). He also served as President, Chief Operating Officer, and Board member of The Depository Trust Company (DTC) and President and Board member of the National Securities Clearing Corporation (NSCC). In addition, Mr. Dirks served as Chief Executive Officer and Board member of the Government Securities Clearing Corporation, Chief Executive Officer and Board member of the Mortgage-Backed Securities Clearing Corporation, as a Trustee and a member of the Finance Committee of Manhattan College (2005-2008), and as a Trustee and a member of the Finance Committee of AHRC of Nassau County (2006-2008). Mr. Dirks is a member of the Independent Directors Council (IDC) Governing Council (2010-Present) and Board of Directors for The Brookville Center for Children's Services, Inc. (2009-present). |
Alan J. Lacy (58) |
| Year of Election or Appointment: 2008 Mr. Lacy serves as Senior Adviser (2007-present) of Oak Hill Capital Partners, L.P. (private equity). Mr. Lacy also served as Chief Executive Officer (2000-2005) and Vice Chairman (2005-2006) of Sears Holdings Corporation and Sears, Roebuck and Co. (retail). In addition, Mr. Lacy serves as a member of the Board of Directors of Dave & Buster's, Inc. (restaurant and entertainment complexes, 2010-present), The Hillman Companies, Inc. (hardware wholesalers, 2010-present), and Bristol-Myers Squibb Company (global pharmaceuticals, 2007-present). Mr. Lacy is a member of the Board of Trustees of The National Parks Conservation Association (2006-Present). Previously, Mr. Lacy served as Chairman of the Board of Trustees of the National Parks Conservation Association (2008-2011) and as a member of the Board of Directors for the Western Union Company (global money transfer, 2006-2011). |
Ned C. Lautenbach (67) |
| Year of Election or Appointment: 2000 Mr. Lautenbach is Chairman of the Independent Trustees of the Equity and High Income Funds (2006-present). Mr. Lautenbach currently serves as the Lead Director of the Eaton Corporation Board of Directors (diversified industrial, 1997-present). Mr. Lautenbach is also a member of the Board of Directors of the Philharmonic Center for the Arts in Naples, Florida (1999-present); a member of the Board of Trustees of Fairfield University (2005-present); and a member of the Council on Foreign Relations (1994-present). Previously, Mr. Lautenbach was a Partner/Advisory Partner at Clayton, Dubilier & Rice, LLC (private equity investment, 1998-2010), as well as a Director of Sony Corporation (2006-2007). |
Joseph Mauriello (67) |
| Year of Election or Appointment: 2008 Prior to his retirement in January 2006, Mr. Mauriello served in numerous senior management positions including Deputy Chairman and Chief Operating Officer (2004-2005), and Vice Chairman of Financial Services (2002-2004) of KPMG LLP US (professional services, 1965-2005). Mr. Mauriello currently serves as a member of the Board of Directors of XL Group plc. (global insurance and re-insurance, 2006-present) and of Arcadia Resources Inc. (health care services and products, 2007-present). Previously, Mr. Mauriello served as a Director of the Hamilton Funds of the Bank of New York (2006-2007). |
Robert W. Selander (61) |
| Year of Election or Appointment: 2011 Previously, Mr. Selander served as a Member of the Advisory Board of Fidelity's Equity and High Income Funds (2011), Executive Vice Chairman (2010), Chief Executive Officer (2009-2010), and President and Chief Executive Officer (1997-2009) of Mastercard, Inc. |
Cornelia M. Small (67) |
| Year of Election or Appointment: 2005 Ms. Small is a member of the Board of Directors of the Teagle Foundation (2009-present). Ms. Small is also a member of the Investment Committee, and Chair (2008-present) and a member of the Board of Trustees of Smith College. In addition, Ms. Small serves on the Investment Committee of the Berkshire Taconic Community Foundation (2008-present). Previously, Ms. Small served as Chairperson of the Investment Committee (2002-2008) of Smith College. In addition, Ms. Small served as Chief Investment Officer, Director of Global Equity Investments, and a member of the Board of Directors of Scudder, Stevens & Clark and Scudder Kemper Investments. |
William S. Stavropoulos (72) |
| Year of Election or Appointment: 2001 Mr. Stavropoulos is Vice Chairman of the Independent Trustees of the Equity and High Income Funds (2006-present). Mr. Stavropoulos serves as President and Founder of the Michigan Baseball Foundation, the Great Lakes Loons (2007-present). Mr. Stavropoulos is Chairman Emeritus of the Board of Directors of The Dow Chemical Company, where he previously served in numerous senior management positions, including President, CEO (1995-2000; 2002-2004), Chairman of the Executive Committee (2000-2006), and as a member of the Board of Directors (1990-2006). Currently, Mr. Stavropoulos is Chairman of Univar (global distributor of commodity and specialty chemicals, 2010-present), a Director of Teradata Corporation (data warehousing and technology solutions, 2008-present), Chemical Financial Corporation, Maersk Inc. (industrial conglomerate), Tyco International, Inc. (multinational manufacturing and services, 2007-present), and a member of the Advisory Board for Metalmark Capital (private equity investment, 2005-present). Mr. Stavropoulos is a special advisor to Clayton, Dubilier & Rice, LLC (private equity investment). In addition, Mr. Stavropoulos is a member of the University of Notre Dame Advisory Council for the College of Science. |
David M. Thomas (62) |
| Year of Election or Appointment: 2008 Previously, Mr. Thomas served as Executive Chairman (2005-2006) and Chairman and Chief Executive Officer (2000-2005) of IMS Health, Inc. (pharmaceutical and healthcare information solutions). In addition, Mr. Thomas serves as a member of the Board of Directors of Fortune Brands, Inc. (consumer products), and Interpublic Group of Companies, Inc. (marketing communication, 2004-present). |
Michael E. Wiley (61) |
| Year of Election or Appointment: 2008 Mr. Wiley also serves as a Director of Asia Pacific Exploration Consolidated (international oil and gas exploration and production, 2008-present). Mr. Wiley serves as a Director of Tesoro Corporation (independent oil refiner and marketer, 2005-present), and a Director of Bill Barrett Corporation (exploration and production, 2005-present). In addition, Mr. Wiley also serves as a Director of Post Oak Bank (privately-held bank, 2004-present). Previously, Mr. Wiley served as a member of the Board of Trustees of the University of Tulsa (2000-2006; 2007-2010), as a Senior Energy Advisor of Katzenbach Partners, LLC (consulting, 2006-2007), as an Advisory Director of Riverstone Holdings (private investment), Chairman, President, and CEO of Baker Hughes, Inc. (oilfield services, 2000-2004), and as Director of Spinnaker Exploration Company (exploration and production, 2001-2005). |
+ The information above includes each Trustee's principal occupation during the last five years and other information relating to the experience, attributes, and skills relevant to each Trustee's qualifications to serve as a Trustee, which led to the conclusion that each Trustee should serve as a Trustee for the fund.
Advisory Board Members and Executive Officers:
Correspondence intended for each executive officer, Edward C. Johnson 3d, and Peter S. Lynch may be sent to Fidelity Investments, 82 Devonshire Street, Boston, Massachusetts 02109.
Name, Age; Principal Occupation |
Edward C. Johnson 3d (81) |
| Year of Election or Appointment: 2011 Member of the Advisory Board of Fidelity's Equity and High Income Funds. Mr. Johnson serves as Chief Executive Officer, Chairman, and a Director of FMR LLC, and also serves as Chairman and Director of FIL Limited. Previously, Mr. Johnson served as a Trustee and Chairman of the Board of certain Fidelity Trusts, Chairman and a Director of FMR, Chairman and a Director of FMR Co., Inc., and President of FMR LLC (2006-2007). |
Peter S. Lynch (67) |
| Year of Election or Appointment: 2003 Member of the Advisory Board of Fidelity's Equity and High Income Funds. Mr. Lynch is Vice Chairman and a Director of FMR and FMR Co., Inc. In addition, Mr. Lynch serves as a Trustee of Boston College and as the Chairman of the Inner-City Scholarship Fund. Previously, Mr. Lynch served on the Special Olympics International Board of Directors (1997-2006). |
Kenneth B. Robins (42) |
| Year of Election or Appointment: 2008 President and Treasurer of Fidelity's Equity and High Income Funds. Mr. Robins also serves as President and Treasurer (2010-present) and Assistant Treasurer (2009-present) of other Fidelity funds and is an employee of Fidelity Investments (2004-present). Previously, Mr. Robins served as Deputy Treasurer of the Fidelity funds (2005-2008) and Treasurer and Chief Financial Officer of The North Carolina Capital Management Trust: Cash and Term Portfolios (2006-2008). |
Bruce T. Herring (46) |
| Year of Election or Appointment: 2006 Vice President of certain Equity Funds. Mr. Herring also serves as Chief Investment Officer and Director of Fidelity Management & Research (U.K.) Inc. (2010-present) and Group Chief Investments Officer of FMR. Previously, Mr. Herring served as Vice President (2005-2006) and Senior Vice President (2006-2007) of Fidelity Management & Research Company, Vice President of FMR Co., Inc. (2001-2007) and as a portfolio manager for Fidelity U.S. Equity Funds. |
Brian B. Hogan (47) |
| Year of Election or Appointment: 2009 Vice President of Equity and High Income Funds. Mr. Hogan also serves as President of FMR's Equity Division (2009-present). Previously, Mr. Hogan served as Senior Vice President, Equity Research of FMR (2006-2009) and as a portfolio manager. |
Scott C. Goebel (43) |
| Year of Election or Appointment: 2008 Secretary and Chief Legal Officer (CLO) of the Fidelity funds. Mr. Goebel also serves as Secretary of Fidelity Investments Money Management, Inc. (FIMM) (2010-present) and Fidelity Research and Analysis Company (FRAC) (2010-present); Secretary and CLO of The North Carolina Capital Management Trust: Cash and Term Portfolios (2008-present); General Counsel, Secretary, and Senior Vice President of FMR (2008-present) and FMR Co., Inc. (2008-present); employed by FMR LLC or an affiliate (2001-present); Chief Legal Officer of Fidelity Management & Research (Hong Kong) Limited (2008-present) and Assistant Secretary of Fidelity Management & Research (Japan) Inc. (2008-present), and Fidelity Management & Research (U.K.) Inc. (2008-present). Previously, Mr. Goebel served as Assistant Secretary of FIMM (2008-2010), FRAC (2008-2010), and the Funds (2007-2008) and as Vice President and Secretary of Fidelity Distributors Corporation (FDC) (2005-2007). |
William C. Coffey (42) |
| Year of Election or Appointment: 2009 Assistant Secretary of Fidelity's Equity and High Income Funds. Mr. Coffey also serves as Senior Vice President and Deputy General Counsel of FMR LLC (2010-present), and is an employee of Fidelity Investments. Previously, Mr. Coffey served as Vice President and Associate General Counsel of FMR LLC (2005-2009). |
Holly C. Laurent (57) |
| Year of Election or Appointment: 2008 Anti-Money Laundering (AML) Officer of the Fidelity funds. Ms. Laurent also serves as AML Officer of The North Carolina Capital Management Trust: Cash and Term Portfolios (2008-present) and is an employee of Fidelity Investments. Previously, Ms. Laurent was Senior Vice President and Head of Legal for Fidelity Business Services India Pvt. Ltd. (2006-2008), and Senior Vice President, Deputy General Counsel and Group Head for FMR LLC (2005-2006). |
Christine Reynolds (53) |
| Year of Election or Appointment: 2008 Chief Financial Officer of the Fidelity funds. Ms. Reynolds became President of Fidelity Pricing and Cash Management Services (FPCMS) in August 2008. Ms. Reynolds served as Chief Operating Officer of FPCMS (2007-2008). Previously, Ms. Reynolds served as President, Treasurer, and Anti-Money Laundering officer of the Fidelity funds (2004-2007). |
Kenneth A. Rathgeber (64) |
| Year of Election or Appointment: 2004 Chief Compliance Officer of Fidelity's Equity and High Income Funds. Mr. Rathgeber is Chief Compliance Officer of Fidelity Management & Research (Hong Kong) Limited (2008-present), Fidelity Management & Research (Japan) Inc. (2008-present), FMR (2005-present), FMR Co., Inc. (2005-present), Fidelity Management & Research (U.K.) Inc. (2005-present), Fidelity Research & Analysis Company (2005-present), Fidelity Investments Money Management, Inc. (2005-present), Pyramis Global Advisors, LLC (2005-present), and Strategic Advisers, Inc. (2005-present). |
Jeffrey S. Christian (50) |
| Year of Election or Appointment: 2009 Deputy Treasurer of the Fidelity funds. Mr. Christian is an employee of Fidelity Investments. Previously, Mr. Christian served as Chief Financial Officer (2008-2009) of certain Fidelity funds and Senior Vice President of Fidelity Pricing and Cash Management Services (FPCMS) (2004-2009). |
Joseph F. Zambello (54) |
| Year of Election or Appointment: 2011 Deputy Treasurer of the Fidelity funds. Mr. Zambello is an employee of Fidelity Investments. Previously, Mr. Zambello served as Vice President of FMR's Program Management Group (2009-2011) and Vice President of the Transfer Agent Oversight Group (2005-2009). |
Adrien E. Deberghes (44) |
| Year of Election or Appointment: 2008 Deputy Treasurer of Fidelity's Equity and High Income Funds. Mr. Deberghes also serves as Vice President and Assistant Treasurer of Fidelity Rutland Square Trust II and Fidelity Commonwealth Trust II (2011-present), Assistant Treasurer of other Fidelity funds (2010-present), and is an employee of Fidelity Investments (2008-present). Previously, Mr. Deberghes served as Senior Vice President of Mutual Fund Administration at State Street Corporation (2007-2008), Senior Director of Mutual Fund Administration at Investors Bank & Trust (2005-2007), and Director of Finance for Dunkin' Brands (2000-2005). |
Stephanie J. Dorsey (42) |
| Year of Election or Appointment: 2010 Assistant Treasurer of Fidelity's Equity and High Income Funds. Ms. Dorsey also serves as Deputy Treasurer of other Fidelity funds (2008-present) and is an employee of Fidelity Investments (2008-present). Previously, Ms. Dorsey served as Treasurer (2004-2008) of the JPMorgan Mutual Funds and Vice President (2004-2008) of JPMorgan Chase Bank. |
John R. Hebble (53) |
| Year of Election or Appointment: 2009 Assistant Treasurer of Fidelity's Equity and High Income Funds. Mr. Hebble also serves as President (2011-present), Treasurer, and Chief Financial Officer of The North Carolina Capital Management Trust: Cash and Term Portfolios (2008-present), President and Treasurer of other Fidelity funds (2008-present) and is an employee of Fidelity Investments. |
Gary W. Ryan (53) |
| Year of Election or Appointment: 2005 Assistant Treasurer of the Fidelity funds. Mr. Ryan is an employee of Fidelity Investments. Previously, Mr. Ryan served as Vice President of Fund Reporting in Fidelity Pricing and Cash Management Services (FPCMS) (1999-2005). |
Jonathan Davis (43) |
| Year of Election or Appointment: 2010 Assistant Treasurer of the Fidelity funds. Mr. Davis is also Assistant Treasurer of Fidelity Rutland Square Trust II and Fidelity Commonwealth Trust II. Mr. Davis is an employee of Fidelity Investments. Previously, Mr. Davis served as Vice President and Associate General Counsel of FMR LLC (2003-2010). |
Annual Report
The Board of Trustees of Fidelity Advisor Canada Fund voted to pay to shareholders of record at the opening of business on record date, the following distributions per share derived from capital gains realized from sales of portfolio securities, and dividends derived from net investment income:
| Pay Date | Record Date | Dividends | Capital Gains |
Institutional Class | 12/05/11 | 12/02/11 | $0.482 | $0.289 |
The Institutional Class designates 44% of the dividends distributed on December 03, 2010 and 100% of the dividends distributed on December 30, 2010 as amounts which may be taken into account as a dividend for the purposes of the maximum rate under section 1(h)(11) of the Internal Revenue Code.
The amounts per share which represent income derived from sources within, and taxes paid to, foreign countries or possessions of the United States are as follows:
| Pay Date | Income | Taxes |
Institutional Class | 12/06/10 | 0.706 | 0.077 |
| 12/31/10 | 0.007 | 0.000 |
The fund will notify shareholders in January 2012 of amounts for use in preparing 2011 income tax returns.
Annual Report
Board Approval of Investment Advisory Contracts and Management Fees
Fidelity Canada Fund
Each year, the Board of Trustees, including the Independent Trustees (together, the Board), votes on the renewal of the management contract and sub-advisory agreements (together, the Advisory Contracts) for the fund. The Board, assisted by the advice of fund counsel and Independent Trustees' counsel, requests and considers a broad range of information relevant to the renewal of the Advisory Contracts throughout the year.
The Board meets regularly and considers at each of its meetings factors that are relevant to its annual consideration of the renewal of the fund's Advisory Contracts, including the services and support provided to the fund and its shareholders. The Board has established various standing committees, each composed of Independent Trustees with varying backgrounds, to which the Board has assigned specific subject matter responsibilities in order to enhance effective decision-making by the Board. The Board, acting directly and through its Committees, requests and receives information concerning the annual consideration of the renewal of the fund's Advisory Contracts. The Board also meets as needed to consider matters specifically related to the Board's annual consideration of the renewal of Advisory Contracts. Members of the Board may also meet with trustees of other Fidelity funds through ad hoc joint committees to discuss certain matters relevant to the Fidelity funds.
At its July 2011 meeting, the Board of Trustees, including the Independent Trustees, unanimously determined to renew the fund's Advisory Contracts. In reaching its determination, the Board considered all factors it believed relevant, including (i) the nature, extent, and quality of the services to be provided to the fund and its shareholders (including the investment performance of the fund); (ii) the competitiveness of the fund's management fee and total expense ratio; (iii) the total costs of the services to be provided by and the profits to be realized by Fidelity from its relationship with the fund; (iv) the extent to which economies of scale would be realized as the fund grows; and (v) whether fee levels reflect these economies of scale, if any, for the benefit of fund shareholders.
In considering whether to renew the Advisory Contracts for the fund, the Board reached a determination, with the assistance of fund counsel and Independent Trustees' counsel and through the exercise of its business judgment, that the renewal of the Advisory Contracts is in the best interests of the fund and its shareholders and that the compensation payable under the Advisory Contracts is fair and reasonable. The Board's decision to renew the Advisory Contracts was not based on any single factor, but rather was based on a comprehensive consideration of all the information provided to the Board at its meetings throughout the year. The Board, in reaching its determination to renew the Advisory Contracts, is aware that shareholders in the fund have a broad range of investment choices available to them, including a wide choice among mutual funds offered by Fidelity's competitors, and that the fund's shareholders, who have the opportunity to review and weigh the disclosure provided by the fund in its prospectus and other public disclosures, have chosen to invest in this fund, managed by Fidelity.
Nature, Extent, and Quality of Services Provided. The Board considered the staffing within the investment adviser, FMR, and the sub-advisers (together, the Investment Advisers), including the backgrounds of the fund's investment personnel and the fund's investment objective and discipline. The Independent Trustees also had discussions with senior management of Fidelity's investment operations and investment groups. The Board considered the structure of the portfolio manager compensation program and whether this structure provides appropriate incentives to act in the best interests of the fund.
Resources Dedicated to Investment Management and Support Services. The Board and the Fund Oversight and Research Committees reviewed the general qualifications and capabilities of the Investment Advisers' investment staff, including its size, education, experience, and resources, as well as the Investment Advisers' approach to recruiting, training, managing, and compensating investment personnel. The Board also noted that FMR has devoted increased resources to non-U.S. offices. The Board noted that Fidelity's analysts have extensive resources, tools and capabilities which allow them to conduct sophisticated quantitative and fundamental analysis, as well as credit analysis of issuers, counterparties and enhancers. The Board also believes that Fidelity's investment professionals have sufficient access to global information and data so as to provide competitive investment results over time, and that those professionals also have access to sophisticated tools which permit them to assess portfolio construction and risk and performance attribution characteristics continuously, as well as to transmit new information and research conclusions rapidly around the world. Additionally, in their deliberations, the Board considered the Investment Advisers' trading capabilities and resources which are an integral part of the investment management process.
Shareholder and Administrative Services. The Board considered (i) the nature, extent, quality, and cost of advisory, administrative, and shareholder services performed by the Investment Advisers and their affiliates under the Advisory Contracts and under separate agreements covering transfer agency, pricing and bookkeeping, and securities lending services for the fund; (ii) the nature and extent of the investment adviser's supervision of third party service providers, principally custodians and subcustodians; and (iii) the resources devoted to, and the record of compliance with, the fund's compliance policies and procedures. The Board also reviewed the allocation of fund brokerage, including allocations to brokers affiliated with the Investment Advisers, the use of brokerage commissions to pay fund expenses, and the use of "soft" commission dollars to pay for research services.
The Board noted that the growth of fund assets over time across the complex allows Fidelity to reinvest in the development of services designed to enhance the value or convenience of the Fidelity funds as investment vehicles. These services include 24-hour access to account information and market information through telephone representatives and over the Internet, investor education materials and asset allocation tools, and the expanded availability of Fidelity Investor Centers, with 35 new branches opening since 2010.
Annual Report
Investment in a Large Fund Family. The Board considered the benefits to shareholders of investing in a Fidelity fund, including the benefits of investing in a fund that is part of a large family of funds offering a variety of investment disciplines and providing a large variety of mutual fund investor services. The Board noted that Fidelity had taken, or had made recommendations that resulted in the Fidelity funds taking, a number of actions over the previous year that benefited particular funds, including (i) continuing to dedicate additional resources to investment research and support of the senior management team that oversees asset management; (ii) rationalizing product lines through the mergers of six funds into other funds; (iii) continuing to migrate the Freedom Funds to dedicated lower cost underlying funds; (iv) obtaining shareholder approval to broaden the investment strategies for Fidelity Consumer Finance Portfolio, Fidelity Emerging Asia Fund, and Fidelity Environment and Alternative Energy Portfolio; (v) contractually agreeing to reduce the management fees and impose other expense limitations on Spartan 500 Index Fund and U.S. Bond Index Fund in connection with launching new institutional classes of these funds; (vi) changing the name, primary and supplemental benchmarks, and investment policies of Fidelity Global Strategies Fund to support the fund's flexible investment mandate and global orientation; and (vii) reducing the transfer agency account fee rates on certain accounts.
Investment Performance. The Board considered whether the fund has operated in accordance with its investment objective, as well as its record of compliance with its investment restrictions. It also reviewed the fund's absolute investment performance for each class, as well as the fund's relative investment performance for each class measured over multiple periods against a broad-based securities market index. The Board noted that FMR does not believe that a meaningful peer group exists against which to compare the fund's performance. The following charts considered by the Board show, over the one-, three-, and five-year periods ended December 31, 2010, as available, the cumulative total returns of the retail class and Class B of the fund and the cumulative total returns of a broad-based securities market index ("benchmark"). The returns of the retail class and Class B show the performance of the highest performing class (based on five-year performance) and the lowest performing class (based on three-year performance), respectively.
Fidelity Canada Fund
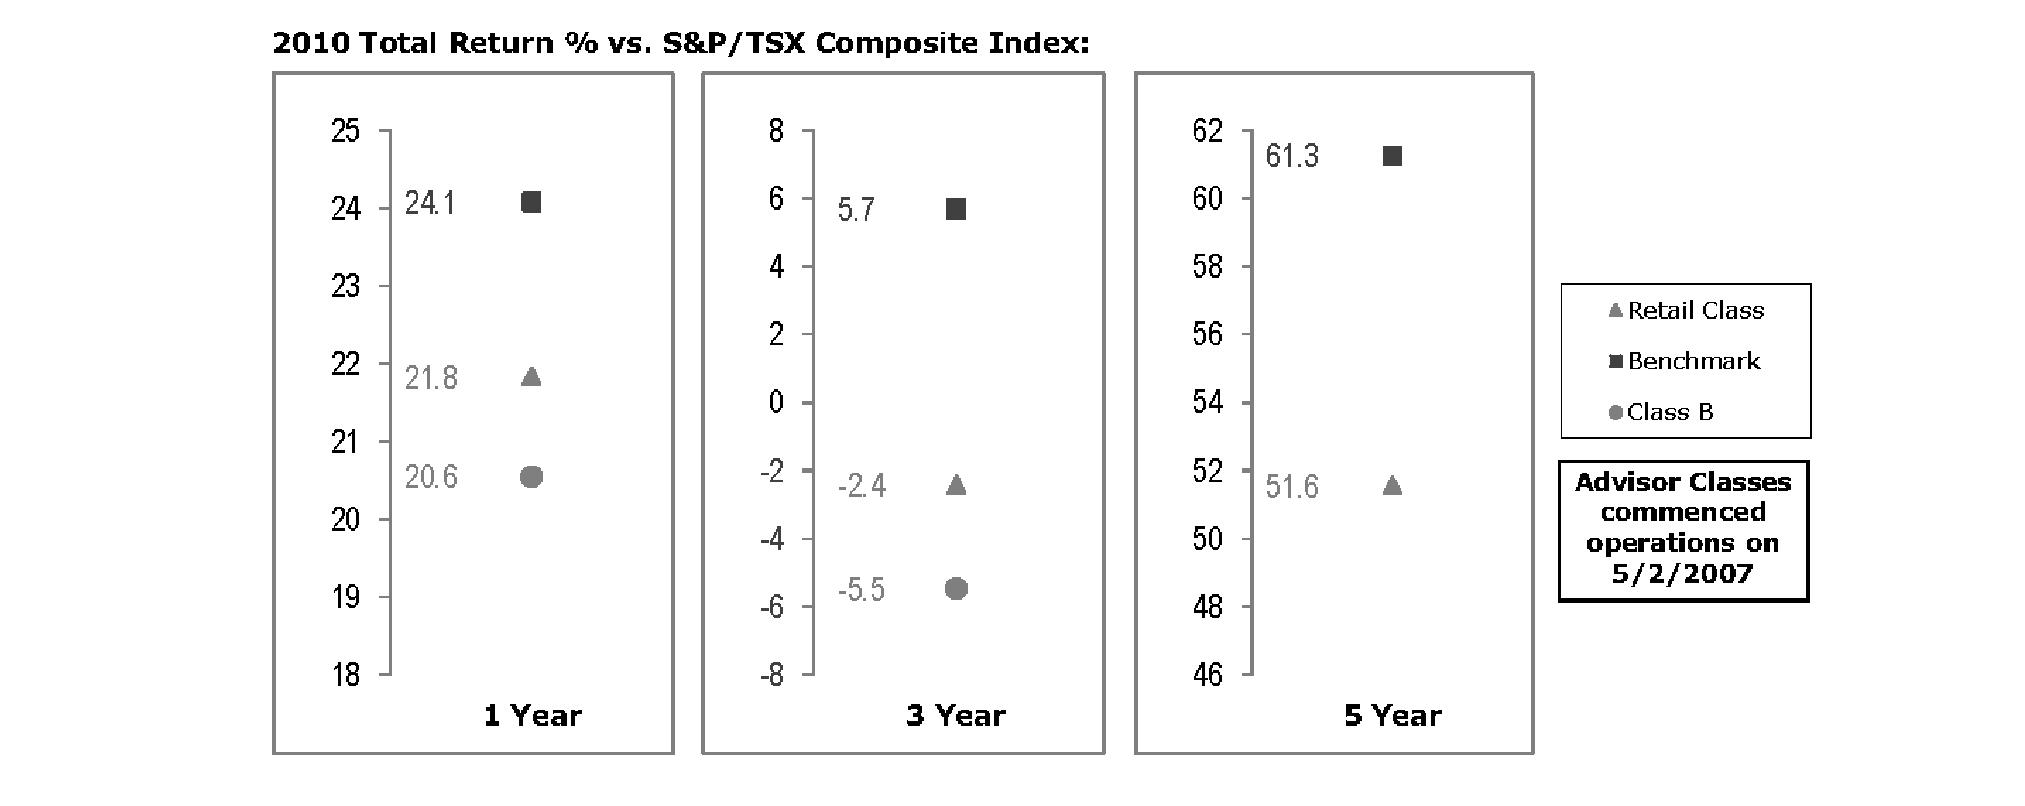
The Board noted that the investment performance of the fund was lower than its benchmark for all the periods shown. The Board considered that the variations in performance among the fund's classes reflect the variations in class expenses, which result in lower performance for higher expense classes. The Board discussed with FMR actions that have been taken by FMR to improve the fund's below-benchmark performance. The Board noted that this fund had underperformed in 2009 and discussed with FMR its disappointment with the continued underperformance. The Board also reviewed the fund's performance since inception as well as performance in the current year. The Board will continue to closely monitor the performance of the fund in the coming year and discuss with FMR other appropriate actions to address the performance of the fund.
The Board also considered that the fund's management fee is subject to upward or downward adjustment depending upon whether, and to what extent, the fund's investment performance for the performance period exceeds, or is exceeded by, the record (over the same period) of a Board-approved performance adjustment index. The Board noted that the performance adjustment provides FMR with a strong economic incentive to seek to achieve superior performance for the fund's shareholders and helps to more closely align the interests of FMR and the fund's shareholders.
Based on its review, the Board concluded that the nature, extent, and quality of services provided to the fund under the Advisory Contracts should benefit the fund's shareholders.
Annual Report
Board Approval of Investment Advisory Contracts and Management Fees - continued
Competitiveness of Management Fee and Total Expense Ratio. The Board considered the fund's management fee and total expense ratio compared to "mapped groups" of competitive funds and classes. Fidelity creates "mapped groups" by combining similar Lipper investment objective categories that have comparable management fee characteristics. Combining Lipper investment objective categories aids the Board's management fee and total expense ratio comparisons by broadening the competitive group used for comparison and by reducing the number of universes to which various Fidelity funds are compared.
Management Fee. The Board considered two proprietary management fee comparisons for the 12-month periods shown in the chart below. The group of Lipper funds used by the Board for management fee comparisons is referred to below as the "Total Mapped Group." The Total Mapped Group comparison focuses on a fund's standing relative to the total universe of comparable funds available to investors in terms of gross management fees before expense reimbursements or caps, and without giving effect to the fund's performance adjustment. "TMG %" represents the percentage of funds in the Total Mapped Group that had management fees that were lower than the fund's. For example, a TMG % of 16% means that 84% of the funds in the Total Mapped Group had higher management fees than the fund. The "Asset-Size Peer Group" (ASPG) comparison focuses on a fund's standing relative to non-Fidelity funds similar in size to the fund within the Total Mapped Group. The ASPG represents at least 15% of the funds in the Total Mapped Group with comparable asset size and management fee characteristics, subject to a minimum of 50 funds (or all funds in the Total Mapped Group if fewer than 50). Additional information, such as the ASPG quartile in which the fund's management fee ranked and the impact of the fund's performance adjustment, is also included in the chart and considered by the Board.
Fidelity Canada Fund
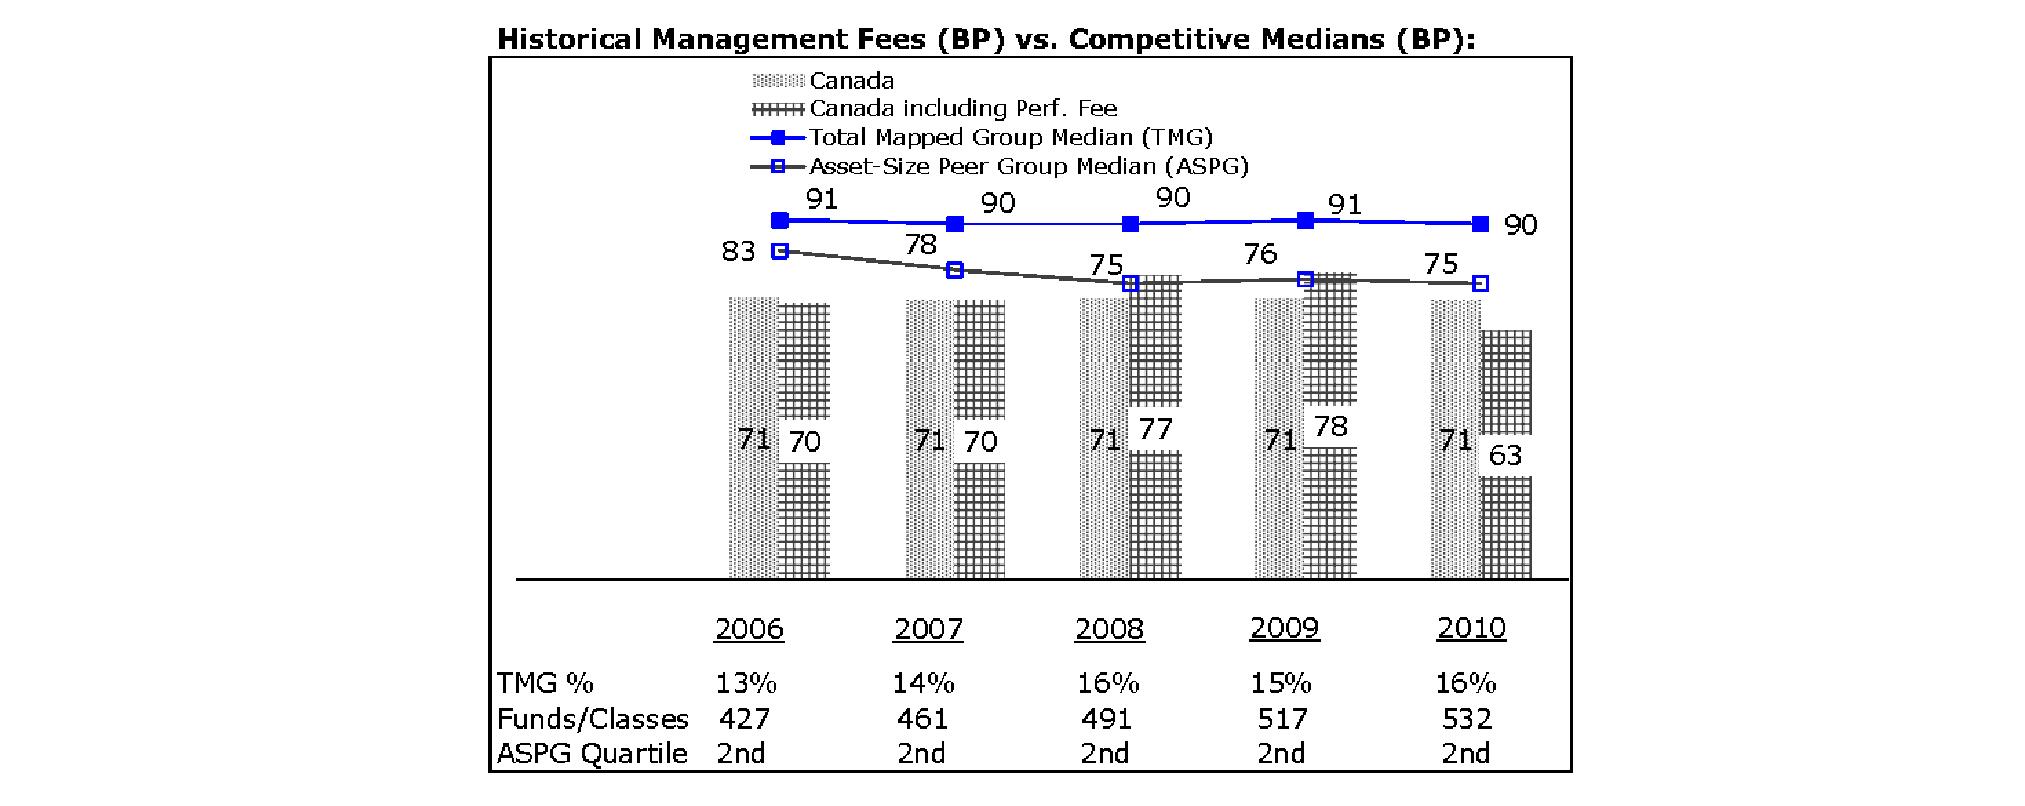
The Board noted that the fund's management fee ranked below the median of its Total Mapped Group and below the median of its ASPG for 2010. The Board also noted the effect of the fund's positive performance adjustment on the fund's management fee ranking. The Board noted that the performance adjustment for each year represents calculations for performance periods that differ from the periods shown in the performance charts above.
Based on its review, the Board concluded that the fund's management fee is fair and reasonable in light of the services that the fund receives and the other factors considered.
Total Expense Ratio. In its review of each class's total expense ratio, the Board considered the fund's management fee as well as other fund or class expenses, as applicable, such as transfer agent fees, pricing and bookkeeping fees, fund-paid 12b-1 fees, and custodial, legal, and audit fees. The Board also noted the effects of any waivers and reimbursements on fees and expenses, as well as the impact of the fund's performance adjustment. As part of its review, the Board also considered the current and historical total expense ratios of each class of the fund compared to competitive fund median expenses. Each class of the fund is compared to those funds and classes in the Total Mapped Group (used by the Board for management fee comparisons) that have a similar sales load structure.
The Board noted that the total expense ratio of each of Class A, Class B, Class C, Institutional Class, and the retail class of the fund ranked below its competitive median for 2010 and the total expense ratio of Class T ranked equal to its competitive median for 2010. The Board considered that various factors, including 12b-1 fees, positive or negative performance adjustments, and relatively higher other expenses in the case of small fund size, can affect total expense ratios.
Fees Charged to Other Fidelity Clients. The Board also considered Fidelity fee structures and other information with respect to clients of FMR and its affiliates, such as other mutual funds advised or subadvised by FMR or its affiliates, pension plan clients, and other institutional clients. In March 2010, the Board created an ad hoc joint committee with the board of other Fidelity funds (the Committee) to review and compare Fidelity's institutional investment advisory business with its business of providing services to the Fidelity funds, including the differences in services provided, fees charged, and costs incurred, as well as competition in their respective marketplaces.
Annual Report
Based on its review of total expense ratios and fees charged to other Fidelity clients, the Board concluded that the total expense ratio of each class of the fund was reasonable in light of the services that the fund and its shareholders receive and the other factors considered, including the findings of the Committee.
Costs of the Services and Profitability. The Board considered the revenues earned and the expenses incurred by Fidelity in conducting the business of developing, marketing, distributing, managing, administering and servicing the fund and its shareholders. The Board also considered the level of Fidelity's profits in respect of all the Fidelity funds.
On an annual basis, FMR presents to the Board Fidelity's profitability for the fund. Fidelity calculates the profitability for each fund, as well as aggregate profitability for groups of Fidelity funds and all Fidelity funds, using a series of detailed revenue and cost allocation methodologies which originate with the books and records of Fidelity on which Fidelity's audited financial statements are based. The Audit Committee of the Board reviews any significant changes from the prior year's methodologies.
PricewaterhouseCoopers LLP (PwC), independent registered public accounting firm and auditor to Fidelity and certain Fidelity funds, has been engaged annually by the Board as part of the Board's assessment of Fidelity's profitability analysis. PwC's engagement includes the review and assessment of Fidelity's methodologies used in determining the revenues and expenses attributable to Fidelity's mutual fund business, and completion of agreed-upon procedures surrounding the mathematical accuracy of fund profitability and its conformity to allocation methodologies. After considering PwC's reports issued under the engagement and information provided by Fidelity, the Board concluded that while other allocation methods may also be reasonable, Fidelity's profitability methodologies are reasonable in all material respects.
The Board also reviewed Fidelity's non-fund businesses and fall-out benefits related to the mutual fund business as well as cases where Fidelity's affiliates may benefit from or be related to the fund's business.
The Board considered the costs of the services provided by and the profits realized by Fidelity in connection with the operation of the fund and was satisfied that the profitability was not excessive in the circumstances.
Economies of Scale. The Board considered whether there have been economies of scale in respect of the management of the Fidelity funds, whether the Fidelity funds (including the fund) have appropriately benefited from any such economies of scale, and whether there is potential for realization of any further economies of scale. The Board considered the extent to which the fund will benefit from economies of scale through increased services to the fund, through waivers or reimbursements, or through fee or expense reductions. The Board also noted that in 2009, it and the board of other Fidelity funds created an ad hoc committee (the Economies of Scale Committee) to analyze whether FMR attains economies of scale in respect of the management and servicing of the Fidelity funds, whether the Fidelity funds have appropriately benefited from such economies of scale, and whether there is potential for realization of any further economies of scale.
The Board recognized that the fund's management contract incorporates a "group fee" structure, which provides for lower group fee rates as total fund assets under FMR's management increase, and for higher group fee rates as total fund assets under FMR's management decrease. FMR calculates the group fee rates based on a tiered asset "breakpoint" schedule that varies based on asset class. The Board considered that the group fee is designed to deliver the benefits of economies of scale to fund shareholders when total Fidelity fund assets increase, even if assets of any particular fund are unchanged or have declined, because some portion of Fidelity's costs are attributable to services provided to all Fidelity funds, and all funds benefit if those costs can be allocated among more assets. The Board concluded that, given the group fee structure, fund shareholders will benefit from lower management fees as assets under FMR's management increase at the fund complex level, regardless of whether Fidelity achieves any such economies of scale.
The Board concluded, taking into account the analysis of the Economies of Scale Committee, that any potential economies of scale are being appropriately shared between fund shareholders and Fidelity.
Additional Information Requested by the Board. In order to develop fully the factual basis for consideration of the Fidelity funds' Advisory Contracts, the Board requested and received additional information on certain topics, including (i) fund performance trends, actions to be taken by FMR to improve certain funds' overall performance, and Fidelity's long-term strategies for certain funds; (ii) portfolio manager changes that have occurred during the past year and length of portfolio manager tenure for different categories of funds over time; (iii) Fidelity's compensation structure for portfolio managers and other key personnel and strategies for attracting and retaining non-investment personnel; (iv) the amount of the investment that each portfolio manager has made in the Fidelity fund(s) that he or she manages; (v) historical trends in Fidelity's realization of fall-out benefits; (vi) Fidelity's group fee structures and the rationale for the individual fee rates of certain funds; (vii) fund profitability methodology and the impact of certain factors on fund profitability results; (viii) trends regarding industry use of performance fee structures and Fidelity's compliance practices with respect to performance adjustment calculations; (ix) the fee structures in place for certain other Fidelity clients; and (x) explanations regarding the relative total expense ratios of certain funds and classes, total expense competitive trends, and actions that might be taken by FMR to reduce total expense ratios for certain funds and classes.
Annual Report
Board Approval of Investment Advisory Contracts and Management Fees - continued
Based on its evaluation of all of the conclusions noted above, and after considering all factors it believed relevant, the Board ultimately concluded that the advisory fee structures are fair and reasonable, and that the fund's Advisory Contracts should be renewed.
Annual Report
Annual Report
Investment Adviser
Fidelity Management & Research Company
Boston, MA
Investment Sub-Advisers
FMR Co., Inc.
Fidelity Management & Research
(U.K.) Inc.
FIL Investment Advisors
FIL Investment Advisors
(UK) Limited
Fidelity Management & Research
(Hong Kong) Limited
Fidelity Management & Research
(Japan) Inc.
General Distributor
Fidelity Distributors Corporation
Boston, MA
Transfer and Service Agents
Fidelity Investments Institutional
Operations Company, Inc.
Boston, MA
Fidelity Service Company, Inc.
Boston, MA
Custodian
State Street Bank and Trust Company
Boston, Massachusetts

ACANI-UANN-1211
1.843157.104
Fidelity Advisor®
China Region Fund -
Class A, Class T, Class B, and Class C
Annual Report
October 31, 2011
Class A, Class T, Class B, and Class C are
classes of Fidelity® China Region Fund

Contents
Chairman's Message | (Click Here) | The Chairman's message to shareholders. |
Performance | (Click Here) | How the fund has done over time. |
Management's Discussion of Fund Performance | (Click Here) | The Portfolio Manager's review of fund performance and strategy. |
Shareholder Expense Example | (Click Here) | An example of shareholder expenses. |
Investment Changes | (Click Here) | A summary of major shifts in the fund's investments over the past six months. |
Investments | (Click Here) | A complete list of the fund's investments with their market values. |
Financial Statements | (Click Here) | Statements of assets and liabilities, operations, and changes in net assets, as well as financial highlights. |
Notes | (Click Here) | Notes to the financial statements. |
Report of Independent Registered Public Accounting Firm | (Click Here) | |
Trustees and Officers | (Click Here) | |
Distributions | (Click Here) | |
Board Approval of Investment Advisory Contracts and Management Fees | (Click Here) | |
To view a fund's proxy voting guidelines and proxy voting record for the 12-month period ended June 30, visit http://www.fidelity.com/proxyvotingresults or visit the Securities and Exchange Commission's (SEC) web site at http://www.sec.gov. You may also call 1-877-208-0098 to request a free copy of the proxy voting guidelines.
Standard & Poor's, S&P and S&P 500 are registered service marks of The McGraw-Hill Companies, Inc. and have been licensed for use by Fidelity Distributors Corporation.
Other third party marks appearing herein are the property of their respective owners.
All other marks appearing herein are registered or unregistered trademarks or service marks of FMR LLC or an affiliated company.
This report and the financial statements contained herein are submitted for the general information of the shareholders of the fund. This report is not authorized for distribution to prospective investors in the fund unless preceded or accompanied by an effective prospectus.
A fund files its complete schedule of portfolio holdings with the SEC for the first and third quarters of each fiscal year on Form N-Q. Forms N-Q are available on the SEC's web site at http://www.sec.gov. A fund's Forms N-Q may be reviewed and copied at the SEC's Public Reference Room in Washington, DC. Information regarding the operation of the SEC's Public Reference Room may be obtained by calling 1-800-SEC-0330. For a complete list of a fund's portfolio holdings, view the most recent holdings listing, semiannual report, or annual report on Fidelity's web site at http://www.fidelity.com, http://www.advisor.fidelity.com, or http://www.401k.com, as applicable.
NOT FDIC INSURED • MAY LOSE VALUE • NO BANK GUARANTEE
Neither the fund nor Fidelity Distributors Corporation is a bank.
Annual Report
(The Acting Chairman's photo appears here.)
Dear Shareholder:
Global equity markets began the fourth quarter on a strong note, sharply reversing course in October amid strong corporate earnings, better-than-expected economic news and the promise of a resolution to the sovereign debt crisis in Europe. The mini rally followed a third quarter marked by a significant downturn in July and August, which heightened investor anxiety and set off a wave of volatility that hampered most major asset classes through the end of September. Financial markets are difficult to predict, of course, but you can help put the odds in your favor by following these time-tested investment principles.
One of the basic tenets is to invest according to your time horizon. For long-term investors, riding out the markets' inevitable ups and downs has proven much more effective than making decisions based on short-term developments. If your goal is approaching, you can also benefit from patience and restraint, rather than attempting to time the market. No matter your time horizon, missing only a few of the markets' best days can significantly diminish returns. Patience also affords the benefits of compounding - earning interest on additional income or reinvested dividends and capital gains. While staying the course doesn't eliminate risk, it can considerably lessen the negative impact of short-term downturns.
Asset allocation is another principle to manage risk. As you spread your portfolio among the asset classes, be sure to consider your time horizon, risk tolerance and investment objectives. Younger investors may be better served by emphasizing equities, which historically have been the best-performing asset class over time. Investors who are nearing a specific goal, such as retirement or sending a child to college, may choose to favor bonds and other investments that have tended to be more stable. Studies indicate that asset allocation is the single most important determinant of a portfolio's long-term success. After deciding on a suitable allocation strategy, make sure your portfolio is adequately diversified, with exposure to stocks of small-, mid- and large-cap companies in a range of sectors, for example. And today, more than ever, geographic diversification should be taken into account.
Lastly, investing a certain amount of money on a regular basis - a principle known as dollar-cost averaging - can help lower the average cost of your purchases, while also giving you the discipline to avoid selling weak performers just prior to an upswing, or chasing a hot performer just before a correction.
We invite you to learn more by visiting us on the Internet, dropping by one of our Investor Centers or calling us by phone. It is our privilege to provide the resources you need to choose investments that are right for you.
Sincerely,
(The Acting Chairman's signature appears here.)
James C. Curvey
Acting Chairman
Annual Report
Performance: The Bottom Line
Average annual total return reflects the change in the value of an investment, assuming reinvestment of the class' distributions from dividend income and capital gains (the profits earned upon the sale of securities that have grown in value, if any) and assuming a constant rate of performance each year. The $10,000 table and the fund's returns do not reflect the deduction of taxes that a shareholder would pay on fund distributions or the redemption of fund shares. During periods of reimbursement by Fidelity, a fund's total return will be greater than it would be had the reimbursement not occurred. How a fund did yesterday is no guarantee of how it will do tomorrow.
Average Annual Total Returns
Periods ended October 31, 2011 | Past 1
year | Past 5
years | Past 10
years |
Class A (incl. 5.75% sales charge) A | -17.81% | 6.28% | 11.50% |
Class T (incl. 3.50% sales charge) B | -16.08% | 6.59% | 11.66% |
Class B (incl. contingent deferred sales charge) C | -17.76% | 6.67% | 11.86% |
Class C (incl. contingent deferred sales charge) D | -14.33% | 6.98% | 11.86% |
A Class A shares bear a 0.25% 12b-1 fee. The initial offering of Class A shares took place on May 9, 2008. Returns prior to May 9, 2008 are those of Fidelity® China Region Fund, the original class of the fund, which has no 12b-1 fee. Had Class A shares' 12b-1 fee been reflected, returns prior to May 9, 2008 would have been lower.
B Class T shares bear a 0.50% 12b-1 fee. The initial offering of Class T shares took place on May 9, 2008. Returns prior to May 9, 2008 are those of Fidelity China Region Fund, the original class of the fund, which has no 12b-1 fee. Had Class T shares' 12b-1 fee been reflected, returns prior to May 9, 2008 would have been lower.
C Class B shares bear a 1.00% 12b-1 fee. The initial offering of Class B shares took place on May 9, 2008. Returns prior to May 9, 2008 are those of Fidelity China Region Fund, the original class of the fund, which has no 12b-1 fee. Had Class B shares' 12b-1 fee been reflected, returns prior to May 9, 2008 would have been lower. Class B shares' contingent deferred sales charge included in the past one year, past five years, and past ten years total return figures are 5%, 2%, and 0% respectively.
D Class C shares bear a 1.00% 12b-1 fee. The initial offering of Class C shares took place on May 9, 2008. Returns prior to May 9, 2008 are those of Fidelity China Region Fund, the original class of the fund, which has no 12b-1 fee. Had Class C shares' 12b-1 fee been reflected, returns prior to May 9, 2008 would have been lower. Class C shares' contingent deferred sales charge included in the past one year, past five years, and past ten years total return figures are 1%, 0%, and 0%, respectively.
$10,000 Over 10 Years
Let's say hypothetically that $10,000 was invested in Fidelity Advisor® China Region Fund - Class A on October 31, 2001, and the current 5.75% sales charge was paid. The chart shows how the value of your investment would have changed, and also shows how the MSCI® Golden Dragon Index performed over the same period. The initial offering of Class A took place on May 9, 2008. See above for additional information regarding the performance of Class A.
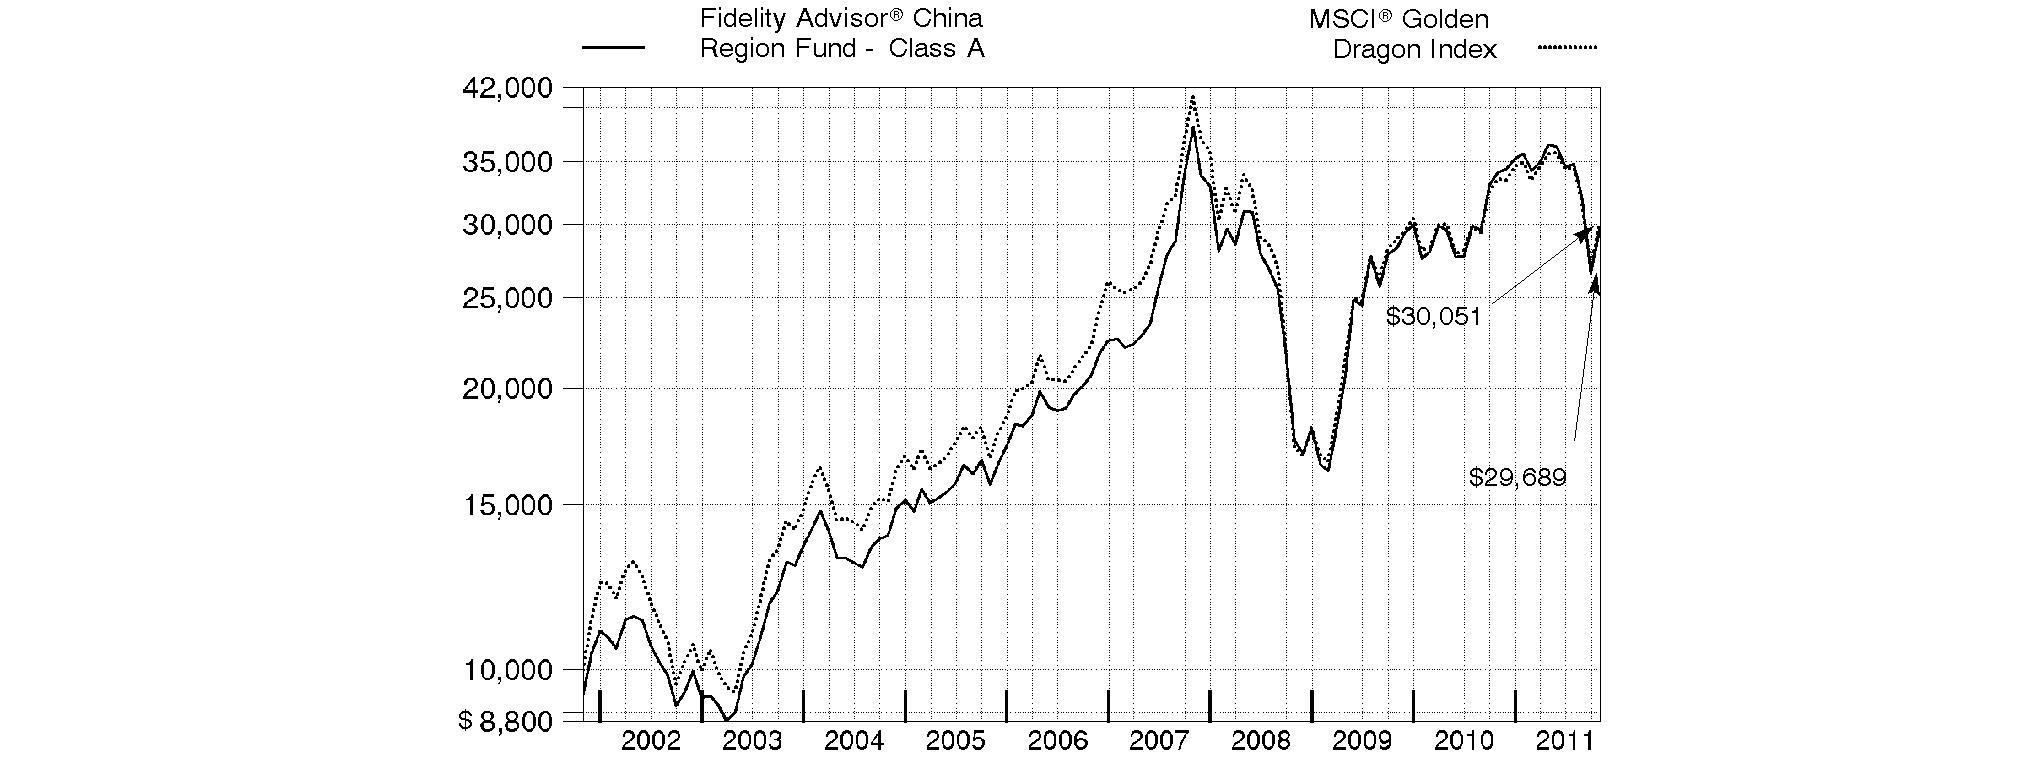
Annual Report
Market Recap: Emerging-markets stocks concluded the 12-month period ending October 31, 2011, on a strong note, reversing direction in October amid hope for a resolution to the sovereign debt crisis in Europe. The brief rally, on top of a robust first half of the period, could only partially offset the negative impact of a five-month downturn that began in May and intensified in August and September, as investors began to flee riskier securities due to the debt debacle, concern the U.S. economy may contract and worry about a significant slowdown in China. For the year, the MSCI® Emerging Markets Index declined 7.44%, hampered in part by global currency fluctuation. The index gained roughly 13% in October, after falling 9% in August and about 15% in September. For the full year, returns across the individual country components of the emerging-markets index were decidedly negative. Several of the largest countries in the index struggled, especially India (-20%), China (-17%) and Brazil (-12%), as did Turkey (-34%). Conversely, South Korea had the strongest result, gaining about 7%, while another sizable index component, Russia, returned roughly 1%. Smaller constituents Indonesia (+5%) and Malaysia (+4%) also finished in positive territory. A trio of countries had negative returns but outpaced the index: Mexico (-1%), Taiwan (-2%) and South Africa (-3%).
Comments from Joseph Tse, Portfolio Manager of Fidelity Advisor® China Region Fund for most of the period covered by this report: For the year, the fund's Class A, Class T, Class B and Class C shares returned -12.79%, -13.04%, -13.45% and -13.46%, respectively (excluding sales charges), versus -10.33% for the MSCI® Golden Dragon Index. Stock selection and unrewarding industry weightings in financials hurt relative performance the most, followed by weak positioning in consumer staples and an underweighting in utilities. Geographically, stock picking in Hong Kong significantly curbed our results. Hong Kong Exchanges & Clearing, the fund's biggest relative detractor and one of its largest positions during the period, was hampered by the China region's weak markets and low trading volume. Bank of China (Hong Kong) and China Merchants Bank - the latter of which I sold - were two lagging bank holdings that hurt. Underweighting and eventually selling power utility CLP Holdings, a strong-performing Hong Kong-based benchmark component detracted, as did scant exposure to Taiwanese integrated telecommunication services provider Chunghwa Telecom. Conversely, stock selection in technology added value, as did positioning in consumer discretionary and industrials. The fund's modest cash position also provided a lift. Geographically, security selection in China bolstered performance. Overweighting Taiwan-based handset maker HTC - the fund's top contributor - was timely. The stock bucked the downward market trend, riding the popularity of high-end smartphones designed to run Google's popular AndroidTM operating system. Hong Kong-based casino operator SJM Holdings and China Unicom (Hong Kong), an integrated telecom services provider, also contributed.
Notes to shareholders: Fidelity Advisor China Region Fund may invest up to 35% of its total assets in any industry that represents more than 20% of the Hong Kong, Taiwanese and Chinese market. As of October 31, 2011, the fund did not have more than 25% of its total assets invested in any one industry.
Robert Bao became Portfolio Manager of the fund on October 1, 2011.
The views expressed above reflect those of the portfolio manager(s) only through the end of the period as stated on the cover of this report and do not necessarily represent the views of Fidelity or any other person in the Fidelity organization. Any such views are subject to change at any time based upon market or other conditions and Fidelity disclaims any responsibility to update such views. These views may not be relied on as investment advice and, because investment decisions for a Fidelity fund are based on numerous factors, may not be relied on as an indication of trading intent on behalf of any Fidelity fund.
Annual Report
Fidelity China Region Fund
As a shareholder of the Fund, you incur two types of costs: (1) transaction costs, including sales charges (loads) on purchase payments or redemption proceeds, redemption fees, and (2) ongoing costs, including management fees, distribution and/or service (12b-1) fees and other Fund expenses. This Example is intended to help you understand your ongoing costs (in dollars) of investing in the Fund and to compare these costs with the ongoing costs of investing in other mutual funds.
The Example is based on an investment of $1,000 invested at the beginning of the period and held for the entire period (May 1, 2011 to October 31, 2011).
Actual Expenses
The first line of the accompanying table for each class of the Fund provides information about actual account values and actual expenses. You may use the information in this line, together with the amount you invested, to estimate the expenses that you paid over the period. Simply divide your account value by $1,000.00 (for example, an $8,600 account value divided by $1,000.00 = 8.6), then multiply the result by the number in the first line for a class of the Fund under the heading entitled "Expenses Paid During Period" to estimate the expenses you paid on your account during this period. A small balance maintenance fee of $12.00 that is charged once a year may apply for certain accounts with a value of less than $2,000. This fee is not included in the table below. If it was, the estimate of expenses you paid during the period would be higher, and your ending account value lower, by this amount. In addition, the Fund, as a shareholder in the underlying Fidelity Central Funds, will indirectly bear its pro-rata share of the fees and expenses incurred by the underlying Fidelity Central Funds. These fees and expenses are not included in the Fund's annualized expense ratio used to calculate the expense estimate in the table below.
Hypothetical Example for Comparison Purposes
The second line of the accompanying table for each class of the Fund provides information about hypothetical account values and hypothetical expenses based on a Class' actual expense ratio and an assumed rate of return of 5% per year before expenses, which is not the Class' actual return. The hypothetical account values and expenses may not be used to estimate the actual ending account balance or expenses you paid for the period. You may use this information to compare the ongoing costs of investing in the Fund and other funds. To do so, compare this 5% hypothetical example with the 5% hypothetical examples that appear in the shareholder reports of the other funds. A small balance maintenance fee of $12.00 that is charged once a year may apply for certain accounts with a value of less than $2,000. This fee is not included in the table below. If it was, the estimate of expenses you paid during the period would be higher, and your ending account value lower, by this amount. In addition, the Fund, as a shareholder in the underlying Fidelity Central Funds, will indirectly bear its pro-rata share of the fees and expenses incurred by the underlying Fidelity Central Funds. These fees and expenses are not included in the Fund's annualized expense ratio used to calculate the expense estimate in the table below.
Please note that the expenses shown in the table are meant to highlight your ongoing costs only and do not reflect any transaction costs. Therefore, the second line of the table is useful in comparing ongoing costs only, and will not help you determine the relative total costs of owning different funds. In addition, if these transactional costs were included, your costs would have been higher.
| Annualized
Expense Ratio | Beginning
Account Value
May 1, 2011 | Ending
Account Value
October 31, 2011 | Expenses Paid
During Period*
May 1, 2011 to
October 31, 2011 |
Class A | 1.36% | | | |
Actual | | $ 1,000.00 | $ 813.10 | $ 6.22 |
HypotheticalA | | $ 1,000.00 | $ 1,018.35 | $ 6.92 |
Class T | 1.63% | | | |
Actual | | $ 1,000.00 | $ 812.00 | $ 7.44 |
HypotheticalA | | $ 1,000.00 | $ 1,016.99 | $ 8.29 |
Class B | 2.11% | | | |
Actual | | $ 1,000.00 | $ 810.00 | $ 9.63 |
HypotheticalA | | $ 1,000.00 | $ 1,014.57 | $ 10.71 |
Class C | 2.11% | | | |
Actual | | $ 1,000.00 | $ 810.00 | $ 9.63 |
HypotheticalA | | $ 1,000.00 | $ 1,014.57 | $ 10.71 |
China Region | 1.04% | | | |
Actual | | $ 1,000.00 | $ 814.30 | $ 4.76 |
HypotheticalA | | $ 1,000.00 | $ 1,019.96 | $ 5.30 |
Institutional Class | 1.05% | | | |
Actual | | $ 1,000.00 | $ 814.10 | $ 4.80 |
HypotheticalA | | $ 1,000.00 | $ 1,019.91 | $ 5.35 |
A 5% return per year before expenses
* Expenses are equal to each Class' annualized expense ratio, multiplied by the average account value over the period, multiplied by 184/365 (to reflect the one-half year period).
Annual Report
Fidelity China Region Fund
Investment Changes (Unaudited)
Geographic Diversification (% of fund's net assets) |
As of October 31, 2011 |
 | Hong Kong | 32.9% | |
 | China | 28.9% | |
 | Taiwan | 19.6% | |
 | Cayman Islands | 10.1% | |
 | Bermuda | 2.6% | |
 | United States of America | 1.1% | |
 | Australia | 1.0% | |
 | Japan | 0.9% | |
 | Korea (South) | 0.7% | |
 | Other | 2.2% | |

Percentages are adjusted for the effect of futures contracts, if applicable. |
As of April 30, 2011 |
| Hong Kong | 32.7% | |
| China | 24.3% | |
| Taiwan | 23.1% | |
| Cayman Islands | 8.3% | |
| Bermuda | 5.5% | |
| United States of America | 1.9% | |
| United Kingdom | 1.6% | |
| Japan | 1.3% | |
| Australia | 1.1% | |
| Other | 0.2% | |

Percentages are adjusted for the effect of futures contracts, if applicable. |
Asset Allocation |
| % of fund's
net assets | % of fund's net assets
6 months ago |
Stocks | 98.9 | 98.4 |
Short-Term Investments and Net Other Assets | 1.1 | 1.6 |
Top Ten Stocks as of October 31, 2011 |
| % of fund's
net assets | % of fund's net assets
6 months ago |
Industrial & Commercial Bank of China Ltd. (H Shares) (Commercial Banks) | 6.0 | 3.6 |
Taiwan Semiconductor Manufacturing Co. Ltd. (Semiconductors & Semiconductor Equipment) | 5.5 | 3.5 |
China Construction Bank Corp. (H Shares) (Commercial Banks) | 3.5 | 3.1 |
Hutchison Whampoa Ltd. (Industrial Conglomerates) | 3.4 | 2.0 |
PetroChina Co. Ltd. (H Shares) (Oil, Gas & Consumable Fuels) | 2.9 | 1.6 |
China Mobile (Hong Kong) Ltd. (Wireless Telecommunication Services) | 2.9 | 1.3 |
AIA Group Ltd. (Insurance) | 2.6 | 0.0 |
BOC Hong Kong (Holdings) Ltd. (Commercial Banks) | 2.5 | 3.0 |
Cheung Kong Holdings Ltd. (Real Estate Management & Development) | 2.2 | 2.1 |
Hang Seng Bank Ltd. (Commercial Banks) | 2.1 | 1.8 |
| 33.6 | |
Market Sectors as of October 31, 2011 |
| % of fund's
net assets | % of fund's net assets
6 months ago |
Financials | 36.0 | 39.7 |
Information Technology | 15.7 | 16.8 |
Materials | 9.8 | 8.0 |
Consumer Discretionary | 9.3 | 10.0 |
Energy | 8.8 | 8.0 |
Telecommunication Services | 7.0 | 5.4 |
Industrials | 6.7 | 7.6 |
Consumer Staples | 4.5 | 2.3 |
Utilities | 0.8 | 0.6 |
Health Care | 0.3 | 0.0 |
Annual Report
Fidelity China Region Fund
Investments October 31, 2011
Showing Percentage of Net Assets
Common Stocks - 98.9% |
| Shares | | Value |
CONSUMER DISCRETIONARY - 9.3% |
Automobiles - 0.3% |
Kia Motors Corp. | 70,970 | | $ 4,533,047 |
Qingling Motors Co. Ltd. (H Shares) | 2,158,000 | | 593,524 |
| | 5,126,571 |
Distributors - 0.4% |
Silver Base Group Holdings Ltd. | 5,369,000 | | 5,717,928 |
Diversified Consumer Services - 0.5% |
New Oriental Education & Technology Group, Inc. sponsored ADR (a) | 265,164 | | 7,859,461 |
Hotels, Restaurants & Leisure - 1.1% |
Sands China Ltd. (a) | 4,103,600 | | 12,332,089 |
SJM Holdings Ltd. | 2,601,000 | | 4,458,256 |
| | 16,790,345 |
Media - 0.7% |
Television Broadcasts Ltd. | 1,977,000 | | 11,392,275 |
Multiline Retail - 2.5% |
Far East Department Stores Co. Ltd. | 7,497,311 | | 11,462,779 |
Golden Eagle Retail Group Ltd. (H Shares) | 4,124,000 | | 10,364,374 |
Lifestyle International Holdings Ltd. | 6,221,500 | | 16,655,201 |
| | 38,482,354 |
Specialty Retail - 3.2% |
Belle International Holdings Ltd. | 13,240,000 | | 25,966,643 |
China ZhengTong Auto Services Holdings Ltd. | 5,181,000 | | 5,610,053 |
Chow Sang Sang Holdings International Ltd. | 1,016,000 | | 3,133,570 |
Emperor Watch & Jewellery Ltd. | 49,570,000 | | 8,069,752 |
Luk Fook Holdings International Ltd. | 1,332,000 | | 5,710,818 |
| | 48,490,836 |
Textiles, Apparel & Luxury Goods - 0.6% |
International Taifeng Holdings Ltd. | 1,906,000 | | 890,781 |
Prada SpA | 1,777,600 | | 8,787,483 |
| | 9,678,264 |
TOTAL CONSUMER DISCRETIONARY | | 143,538,034 |
CONSUMER STAPLES - 4.5% |
Beverages - 1.6% |
Tsingtao Brewery Co. Ltd. (H Shares) | 1,270,000 | | 6,458,132 |
Wuliangye Yibin Co. Ltd. (BNP Paribas Warrant Program) warrants 5/5/15 (a) | 1,351,900 | | 7,718,970 |
Yantai Changyu Pioneer Wine Co. (B Shares) | 922,108 | | 10,374,625 |
| | 24,551,727 |
Food & Staples Retailing - 2.1% |
China Resources Enterprise Ltd. | 4,050,000 | | 14,790,795 |
Dairy Farm International Holdings Ltd. | 1,778,200 | | 14,408,234 |
President Chain Store Corp. | 601,000 | | 3,342,003 |
| | 32,541,032 |
|
| Shares | | Value |
Food Products - 0.8% |
China Mengniu Dairy Co. Ltd. | 1,368,000 | | $ 4,359,125 |
Uni-President China Holdings Ltd. | 12,383,000 | | 7,359,931 |
| | 11,719,056 |
TOTAL CONSUMER STAPLES | | 68,811,815 |
ENERGY - 8.8% |
Energy Equipment & Services - 0.4% |
China Oilfield Services Ltd. (H Shares) | 3,520,000 | | 5,863,167 |
Oil, Gas & Consumable Fuels - 8.4% |
China Petroleum & Chemical Corp. (H Shares) | 26,838,000 | | 25,381,510 |
China Shenhua Energy Co. Ltd. (H Shares) | 3,600,500 | | 16,471,539 |
CNOOC Ltd. | 13,661,000 | | 25,824,205 |
CNPC (Hong Kong) Ltd. | 13,232,000 | | 18,535,159 |
PetroChina Co. Ltd. (H Shares) | 34,272,000 | | 44,491,660 |
| | 130,704,073 |
TOTAL ENERGY | | 136,567,240 |
FINANCIALS - 36.0% |
Capital Markets - 0.6% |
Wuliangye Yibin Co. Ltd. (UBS Warrant Programme) warrants 4/22/13 (a) | 345,100 | | 1,970,424 |
Yuanta Financial Holding Co. Ltd. | 13,890,525 | | 7,918,254 |
| | 9,888,678 |
Commercial Banks - 18.9% |
Agricultural Bank China Ltd. (H Shares) | 43,876,000 | | 19,692,247 |
BOC Hong Kong (Holdings) Ltd. | 16,572,000 | | 39,407,649 |
China Construction Bank Corp. (H Shares) | 73,095,000 | | 53,705,474 |
Chinatrust Financial Holding Co. Ltd. | 34,785,446 | | 22,798,274 |
Hang Seng Bank Ltd. | 2,488,800 | | 32,091,693 |
Industrial & Commercial Bank of China Ltd. (H Shares) | 147,535,000 | | 92,130,181 |
Mega Financial Holding Co. Ltd. | 20,451,340 | | 15,720,889 |
Standard Chartered PLC (United Kingdom) | 362,520 | | 8,506,038 |
Wing Hang Bank Ltd. | 904,500 | | 8,168,379 |
| | 292,220,824 |
Diversified Financial Services - 1.1% |
Hong Kong Exchanges and Clearing Ltd. | 1,008,200 | | 17,090,902 |
Insurance - 7.0% |
AIA Group Ltd. | 12,948,000 | | 39,591,604 |
Cathay Financial Holding Co. Ltd. | 8,847,248 | | 10,550,709 |
China Life Insurance Co. Ltd. (H Shares) | 10,723,000 | | 27,723,214 |
Ping An Insurance Group Co. China Ltd. (H Shares) | 4,035,000 | | 29,925,173 |
| | 107,790,700 |
Real Estate Management & Development - 8.4% |
Cheung Kong Holdings Ltd. | 2,726,000 | | 33,791,308 |
Common Stocks - continued |
| Shares | | Value |
FINANCIALS - continued |
Real Estate Management & Development - continued |
China Overseas Land & Investment Ltd. | 9,146,000 | | $ 16,923,669 |
Kerry Properties Ltd. | 2,323,500 | | 8,527,084 |
Sun Hung Kai Properties Ltd. | 2,215,000 | | 30,497,845 |
Swire Pacific Ltd. (A Shares) | 1,300,000 | | 15,022,234 |
Wharf Holdings Ltd. | 4,624,000 | | 24,596,195 |
| | 129,358,335 |
TOTAL FINANCIALS | | 556,349,439 |
HEALTH CARE - 0.3% |
Pharmaceuticals - 0.3% |
China Medical System Holding Ltd. | 6,564,000 | | 4,819,634 |
INDUSTRIALS - 6.7% |
Airlines - 0.1% |
China Southern Airlines Ltd. (H Shares) (a) | 4,400,000 | | 2,455,465 |
Construction & Engineering - 0.9% |
China Communications Construction Co. Ltd. (H Shares) | 4,803,000 | | 3,622,694 |
China State Construction International Holdings Ltd. | 13,696,000 | | 10,548,476 |
| | 14,171,170 |
Industrial Conglomerates - 3.9% |
Hutchison Whampoa Ltd. | 5,748,000 | | 52,573,759 |
Shun Tak Holdings Ltd. | 15,278,000 | | 7,097,500 |
| | 59,671,259 |
Machinery - 0.8% |
Airtac International Group | 452,000 | | 2,529,876 |
China International Marine Containers (Group) Ltd. (B Shares) | 3,903,787 | | 4,699,480 |
China Yuchai International Ltd. | 126,300 | | 1,919,760 |
Sany Heavy Equipment International Holdings Co. Ltd. | 1,975,000 | | 1,739,972 |
Shanghai Zhenhua Port Machinery Co. Ltd. (B Shares) (a) | 1,664,991 | | 861,259 |
| | 11,750,347 |
Road & Rail - 0.5% |
MTR Corp. Ltd. | 2,265,000 | | 7,311,372 |
Transportation Infrastructure - 0.5% |
Jiangsu Expressway Co. Ltd. (H Shares) | 9,140,000 | | 7,877,871 |
TOTAL INDUSTRIALS | | 103,237,484 |
INFORMATION TECHNOLOGY - 15.7% |
Communications Equipment - 1.7% |
AAC Acoustic Technology Holdings, Inc. | 3,480,000 | | 7,965,765 |
HTC Corp. | 469,750 | | 10,556,952 |
ZTE Corp. (H Shares) | 2,745,200 | | 7,792,522 |
| | 26,315,239 |
|
| Shares | | Value |
Computers & Peripherals - 0.7% |
Lenovo Group Ltd. | 11,080,000 | | $ 7,449,133 |
Quanta Computer, Inc. | 1,391,000 | | 2,737,265 |
| | 10,186,398 |
Electronic Equipment & Components - 3.0% |
Chroma ATE, Inc. | 1,938,000 | | 3,866,724 |
Delta Electronics, Inc. | 1,475,000 | | 3,468,088 |
Foxconn International Holdings Ltd. (a) | 5,582,000 | | 3,738,843 |
Hon Hai Precision Industry Co. Ltd. (Foxconn) | 9,030,589 | | 24,756,253 |
Largan Precision Co. Ltd. | 156,000 | | 3,487,580 |
Unimicron Technology Corp. | 5,139,000 | | 6,672,696 |
| | 45,990,184 |
Internet Software & Services - 3.6% |
Baidu.com, Inc. sponsored ADR (a) | 143,900 | | 20,171,902 |
Qihoo 360 Technology Co. Ltd. ADR (d) | 250,400 | | 5,060,584 |
Tencent Holdings Ltd. | 1,317,900 | | 30,479,837 |
| | 55,712,323 |
Semiconductors & Semiconductor Equipment - 6.7% |
ASM Pacific Technology Ltd. | 283,900 | | 3,117,474 |
Hynix Semiconductor, Inc. | 286,800 | | 5,782,401 |
MediaTek, Inc. | 372,000 | | 3,903,867 |
Spreadtrum Communications, Inc. ADR (d) | 242,900 | | 6,453,853 |
Taiwan Semiconductor Manufacturing Co. Ltd. | 34,656,796 | | 84,454,335 |
| | 103,711,930 |
TOTAL INFORMATION TECHNOLOGY | | 241,916,074 |
MATERIALS - 9.8% |
Chemicals - 5.4% |
Formosa Chemicals & Fibre Corp. | 5,245,000 | | 15,179,377 |
Formosa Plastics Corp. | 10,557,250 | | 31,049,842 |
Incitec Pivot Ltd. | 1,375,004 | | 4,980,927 |
Nan Ya Plastics Corp. | 6,290,000 | | 14,150,148 |
Petronas Chemicals Group Bhd | 2,305,100 | | 4,808,734 |
PTT Global Chemical PCL (For. Reg.) (a) | 2,728,458 | | 5,753,520 |
Taiwan Fertilizer Co. Ltd. | 3,015,000 | | 7,770,996 |
| | 83,693,544 |
Construction Materials - 2.0% |
Anhui Conch Cement Co. Ltd. (H Shares) | 5,724,000 | | 20,813,948 |
China Resources Cement Holdings Ltd. | 4,942,000 | | 3,921,522 |
Taiwan Cement Corp. | 4,629,000 | | 5,781,070 |
| | 30,516,540 |
Metals & Mining - 2.4% |
Angang Steel Co. Ltd. (H Shares) | 14,518,000 | | 8,857,733 |
Kingsgate Consolidated NL | 1,376,993 | | 10,857,319 |
Maanshan Iron & Steel Ltd. (H Shares) | 13,770,000 | | 4,099,723 |
Common Stocks - continued |
| Shares | | Value |
MATERIALS - continued |
Metals & Mining - continued |
United Co. RUSAL Ltd. (a) | 6,434,000 | | $ 5,866,364 |
Zhaojin Mining Industry Co. Ltd. (H Shares) | 4,104,500 | | 7,328,110 |
| | 37,009,249 |
TOTAL MATERIALS | | 151,219,333 |
TELECOMMUNICATION SERVICES - 7.0% |
Diversified Telecommunication Services - 3.2% |
China Telecom Corp. Ltd. (H Shares) | 12,082,000 | | 7,459,515 |
China Unicom (Hong Kong) Ltd. | 14,148,000 | | 28,446,195 |
Chunghwa Telecom Co. Ltd. | 4,050,000 | | 13,549,803 |
| | 49,455,513 |
Wireless Telecommunication Services - 3.8% |
China Mobile (Hong Kong) Ltd. | 4,658,500 | | 44,275,976 |
SOFTBANK CORP. | 440,400 | | 14,295,291 |
| | 58,571,267 |
TOTAL TELECOMMUNICATION SERVICES | | 108,026,780 |
UTILITIES - 0.8% |
Electric Utilities - 0.6% |
Power Assets Holdings Ltd. | 1,173,500 | | 8,917,203 |
Independent Power Producers & Energy Traders - 0.2% |
China Resources Power Holdings Co. Ltd. | 2,084,000 | | 3,701,297 |
TOTAL UTILITIES | | 12,618,500 |
TOTAL COMMON STOCKS (Cost $1,352,590,394) | 1,527,104,333 |
Money Market Funds - 1.5% |
| Shares | | Value |
Fidelity Cash Central Fund, 0.12% (b) | 15,856,352 | | $ 15,856,352 |
Fidelity Securities Lending Cash Central Fund, 0.11% (b)(c) | 7,655,750 | | 7,655,750 |
TOTAL MONEY MARKET FUNDS (Cost $23,512,102) | 23,512,102 |
TOTAL INVESTMENT PORTFOLIO - 100.4% (Cost $1,376,102,496) | | 1,550,616,435 |
NET OTHER ASSETS (LIABILITIES) - (0.4)% | | (6,378,964) |
NET ASSETS - 100% | $ 1,544,237,471 |
Legend |
(a) Non-income producing |
(b) Affiliated fund that is available only to investment companies and other accounts managed by Fidelity Investments. The rate quoted is the annualized seven-day yield of the fund at period end. A complete unaudited listing of the fund's holdings as of its most recent quarter end is available upon request. In addition, each Fidelity Central Fund's financial statements, which are not covered by the Fund's Report of Independent Registered Public Accounting Firm, are available on the SEC's website or upon request. |
(c) Investment made with cash collateral received from securities on loan. |
(d) Security or a portion of the security is on loan at period end. |
Affiliated Central Funds |
Information regarding fiscal year to date income earned by the Fund from investments in Fidelity Central Funds is as follows: |
Fund | Income earned |
Fidelity Cash Central Fund | $ 54,497 |
Fidelity Securities Lending Cash Central Fund | 1,097,622 |
Total | $ 1,152,119 |
Other Information |
The following is a summary of the inputs used, as of October 31, 2011, involving the Fund's assets and liabilities carried at fair value. The inputs or methodology used for valuing securities may not be an indication of the risk associated with investing in those securities. For more information on valuation inputs, and their aggregation into the levels used in the table below, please refer to the Security Valuation section in the accompanying Notes to Financial Statements. |
Valuation Inputs at Reporting Date: |
Description | Total | Level 1 | Level 2 | Level 3 |
Investments in Securities: | | | | |
Equities: | | | | |
Consumer Discretionary | $ 143,538,034 | $ 7,859,461 | $ 135,678,573 | $ - |
Consumer Staples | 68,811,815 | - | 68,811,815 | - |
Energy | 136,567,240 | - | 136,567,240 | - |
Financials | 556,349,439 | 8,506,038 | 547,843,401 | - |
Health Care | 4,819,634 | - | 4,819,634 | - |
Industrials | 103,237,484 | 1,919,760 | 101,317,724 | - |
Information Technology | 241,916,074 | 31,686,339 | 210,229,735 | - |
Materials | 151,219,333 | - | 151,219,333 | - |
Telecommunication Services | 108,026,780 | - | 108,026,780 | - |
Utilities | 12,618,500 | - | 12,618,500 | - |
Money Market Funds | 23,512,102 | 23,512,102 | - | - |
Total Investments in Securities: | $ 1,550,616,435 | $ 73,483,700 | $ 1,477,132,735 | $ - |
Transfers from Level 1 to Level 2 during the period were $998,441,272. |
See accompanying notes which are an integral part of the financial statements.
Annual Report
Fidelity China Region Fund
Statement of Assets and Liabilities
| October 31, 2011 |
| | |
Assets | | |
Investment in securities, at value (including securities loaned of $7,414,695) - See accompanying schedule: Unaffiliated issuers (cost $1,352,590,394) | $ 1,527,104,333 | |
Fidelity Central Funds (cost $23,512,102) | 23,512,102 | |
Total Investments (cost $1,376,102,496) | | $ 1,550,616,435 |
Receivable for investments sold | | 3,096,945 |
Receivable for fund shares sold | | 2,387,894 |
Dividends receivable | | 27,878 |
Distributions receivable from Fidelity Central Funds | | 83,053 |
Prepaid expenses | | 6,519 |
Other receivables | | 332,497 |
Total assets | | 1,556,551,221 |
| | |
Liabilities | | |
Payable for fund shares redeemed | $ 3,233,655 | |
Accrued management fee | 866,875 | |
Distribution and service plan fees payable | 10,527 | |
Other affiliated payables | 377,917 | |
Other payables and accrued expenses | 169,026 | |
Collateral on securities loaned, at value | 7,655,750 | |
Total liabilities | | 12,313,750 |
| | |
Net Assets | | $ 1,544,237,471 |
Net Assets consist of: | | |
Paid in capital | | $ 1,349,632,104 |
Undistributed net investment income | | 15,589,239 |
Accumulated undistributed net realized gain (loss) on investments and foreign currency transactions | | 4,502,101 |
Net unrealized appreciation (depreciation) on investments and assets and liabilities in foreign currencies | | 174,514,027 |
Net Assets | | $ 1,544,237,471 |
Statement of Assets and Liabilities - continued
| October 31, 2011 |
| | |
Calculation of Maximum Offering Price Class A:
Net Asset Value and redemption price per share ($14,807,740 ÷ 542,844 shares) | | $ 27.28 |
| | |
Maximum offering price per share (100/94.25 of $27.28) | | $ 28.94 |
Class T:
Net Asset Value and redemption price per share ($5,280,845 ÷ 194,657 shares) | | $ 27.13 |
| | |
Maximum offering price per share (100/96.50 of $27.13) | | $ 28.11 |
Class B:
Net Asset Value and offering price per share ($1,801,156 ÷ 66,865 shares)A | | $ 26.94 |
| | |
Class C:
Net Asset Value and offering price per share ($5,229,585 ÷ 194,711 shares)A | | $ 26.86 |
| | |
China Region:
Net Asset Value, offering price and redemption price per share ($1,515,083,763 ÷ 55,117,459 shares) | | $ 27.49 |
| | |
Institutional Class:
Net Asset Value, offering price and redemption price per share ($2,034,382 ÷ 74,075 shares) | | $ 27.46 |
A Redemption price per share is equal to net asset value less any applicable contingent deferred sales charge.
See accompanying notes which are an integral part of the financial statements.
Annual Report
Fund Name
Financial Statements - continued
Statement of Operations
| Year ended October 31, 2011 |
| | |
Investment Income | | |
Dividends | | $ 51,665,043 |
Interest | | 492 |
Income from Fidelity Central Funds | | 1,152,119 |
Income before foreign taxes withheld | | 52,817,654 |
Less foreign taxes withheld | | (5,194,113) |
Total income | | 47,623,541 |
| | |
Expenses | | |
Management fee | $ 14,146,741 | |
Transfer agent fees | 4,525,375 | |
Distribution and service plan fees | 161,388 | |
Accounting and security lending fees | 885,629 | |
Custodian fees and expenses | 889,163 | |
Independent trustees' compensation | 11,248 | |
Registration fees | 120,675 | |
Audit | 77,247 | |
Legal | 8,300 | |
Interest | 23,240 | |
Miscellaneous | 22,470 | |
Total expenses before reductions | 20,871,476 | |
Expense reductions | (1,099,159) | 19,772,317 |
Net investment income (loss) | | 27,851,224 |
Realized and Unrealized Gain (Loss) Net realized gain (loss) on: | | |
Investment securities: | | |
Unaffiliated issuers | 125,171,768 | |
Foreign currency transactions | (727,560) | |
Total net realized gain (loss) | | 124,444,208 |
Change in net unrealized appreciation (depreciation) on: Investment securities | (389,938,527) | |
Assets and liabilities in foreign currencies | 138 | |
Total change in net unrealized appreciation (depreciation) | | (389,938,389) |
Net gain (loss) | | (265,494,181) |
Net increase (decrease) in net assets resulting from operations | | $ (237,642,957) |
Statement of Changes in Net Assets
| Year ended
October 31,
2011 | Year ended
October 31,
2010 |
Increase (Decrease) in Net Assets | | |
Operations | | |
Net investment income (loss) | $ 27,851,224 | $ 25,698,168 |
Net realized gain (loss) | 124,444,208 | 87,056,704 |
Change in net unrealized appreciation (depreciation) | (389,938,389) | 253,069,337 |
Net increase (decrease) in net assets resulting from operations | (237,642,957) | 365,824,209 |
Distributions to shareholders from net investment income | (25,544,611) | (17,788,313) |
Distributions to shareholders from net realized gain | (1,707,007) | (5,540,851) |
Total distributions | (27,251,618) | (23,329,164) |
Share transactions - net increase (decrease) | (353,944,406) | (341,589,636) |
Redemption fees | 551,160 | 1,093,238 |
Total increase (decrease) in net assets | (618,287,821) | 1,998,647 |
| | |
Net Assets | | |
Beginning of period | 2,162,525,292 | 2,160,526,645 |
End of period (including undistributed net investment income of $15,589,239 and undistributed net investment income of $25,575,304, respectively) | $ 1,544,237,471 | $ 2,162,525,292 |
See accompanying notes which are an integral part of the financial statements.
Annual Report
Financial Highlights - Class A
Years ended October 31, | 2011 | 2010 | 2009 | 2008 H |
Selected Per-Share Data | | | | |
Net asset value, beginning of period | $ 31.61 | $ 26.47 | $ 16.67 | $ 29.28 |
Income from Investment Operations | | | | |
Net investment income (loss) E | .33 | .25 | .30 | .28 |
Net realized and unrealized gain (loss) | (4.33) | 5.15 | 9.63 | (12.91) |
Total from investment operations | (4.00) | 5.40 | 9.93 | (12.63) |
Distributions from net investment income | (.31) | (.20) | (.16) | - |
Distributions from net realized gain | (.03) | (.07) | - | - |
Total distributions | (.34) | (.27) | (.16) | - |
Redemption fees added to paid in capital E | .01 | .01 | .03 | .02 |
Net asset value, end of period | $ 27.28 | $ 31.61 | $ 26.47 | $ 16.67 |
Total Return B,C,D | (12.79)% | 20.54% | 60.41% | (43.07)% |
Ratios to Average Net Assets F,I | | | | |
Expenses before reductions | 1.37% | 1.38% | 1.39% | 1.44% A |
Expenses net of fee waivers, if any | 1.37% | 1.38% | 1.39% | 1.44% A |
Expenses net of all reductions | 1.31% | 1.31% | 1.31% | 1.30% A |
Net investment income (loss) | 1.07% | .91% | 1.27% | 2.63% A |
Supplemental Data | | | | |
Net assets, end of period (000 omitted) | $ 14,808 | $ 16,047 | $ 11,842 | $ 340 |
Portfolio turnover rate G | 87% | 57% | 88% | 133% |
A Annualized B Total returns for periods of less than one year are not annualized. C Total returns would have been lower if certain expenses had not been reduced during the applicable periods shown. D Total returns do not include the effect of the sales charges. E Calculated based on average shares outstanding during the period. F Fees and expenses of any underlying Fidelity Central Funds are not included in the Fund's expense ratio. The Fund indirectly bears its proportionate share of the expenses of any underlying Fidelity Central Funds. G Amount does not include the portfolio activity of any underlying Fidelity Central Funds. H For the period May 9, 2008 (commencement of sale of shares) to October 31, 2008. I Expense ratios reflect operating expenses of the class. Expenses before reductions do not reflect amounts reimbursed by the investment adviser or reductions from brokerage service arrangements or reductions from other expense offset arrangements and do not represent the amount paid by the class during periods when reimbursements or reductions occur. Expense ratios before reductions for start-up periods may not be representative of longer-term operating periods. Expenses net of fee waivers reflect expenses after reimbursement by the investment adviser but prior to reductions from brokerage service arrangements or other expense offset arrangements. Expenses net of all reductions represent the net expenses paid by the class. |
Financial Highlights - Class T
Years ended October 31, | 2011 | 2010 | 2009 | 2008 H |
Selected Per-Share Data | | | | |
Net asset value, beginning of period | $ 31.48 | $ 26.40 | $ 16.65 | $ 29.28 |
Income from Investment Operations | | | | |
Net investment income (loss) E | .25 | .18 | .23 | .26 |
Net realized and unrealized gain (loss) | (4.32) | 5.13 | 9.64 | (12.91) |
Total from investment operations | (4.07) | 5.31 | 9.87 | (12.65) |
Distributions from net investment income | (.27) | (.18) | (.14) | - |
Distributions from net realized gain | (.03) | (.07) | - | - |
Total distributions | (.29) J | (.24) K | (.14) | - |
Redemption fees added to paid in capital E | .01 | .01 | .02 | .02 |
Net asset value, end of period | $ 27.13 | $ 31.48 | $ 26.40 | $ 16.65 |
Total Return B,C,D | (13.04)% | 20.27% | 59.92% | (43.14)% |
Ratios to Average Net Assets F,I | | | | |
Expenses before reductions | 1.63% | 1.64% | 1.66% | 1.68% A |
Expenses net of fee waivers, if any | 1.63% | 1.64% | 1.66% | 1.68% A |
Expenses net of all reductions | 1.57% | 1.58% | 1.58% | 1.53% A |
Net investment income (loss) | .81% | .64% | 1.00% | 2.40% A |
Supplemental Data | | | | |
Net assets, end of period (000 omitted) | $ 5,281 | $ 6,070 | $ 3,139 | $ 107 |
Portfolio turnover rate G | 87% | 57% | 88% | 133% |
A Annualized B Total returns for periods of less than one year are not annualized. C Total returns would have been lower if certain expenses had not been reduced during the applicable periods shown. D Total returns do not include the effect of the sales charges. E Calculated based on average shares outstanding during the period. F Fees and expenses of any underlying Fidelity Central Funds are not included in the Fund's expense ratio. The Fund indirectly bears its proportionate share of the expenses of any underlying Fidelity Central Funds. G Amount does not include the portfolio activity of any underlying Fidelity Central Funds. H For the period May 9, 2008 (commencement of sale of shares) to October 31, 2008. I Expense ratios reflect operating expenses of the class. Expenses before reductions do not reflect amounts reimbursed by the investment adviser or reductions from brokerage service arrangements or reductions from other expense offset arrangements and do not represent the amount paid by the class during periods when reimbursements or reductions occur. Expense ratios before reductions for start-up periods may not be representative of longer-term operating periods. Expenses net of fee waivers reflect expenses after reimbursement by the investment adviser but prior to reductions from brokerage service arrangements or other expense offset arrangements. Expenses net of all reductions represent the net expenses paid by the class. J Total distributions of $.29 per share is comprised of distributions from net investment income of $.268 and distributions from net realized gain of $.025 per share. K Total distributions of $.24 per share is comprised of distributions from net investment income of $.177 and distributions from net realized gain of $.065 per share. |
See accompanying notes which are an integral part of the financial statements.
Annual Report
Financial Highlights - Class B
Years ended October 31, | 2011 | 2010 | 2009 | 2008 H |
Selected Per-Share Data | | | | |
Net asset value, beginning of period | $ 31.23 | $ 26.28 | $ 16.61 | $ 29.28 |
Income from Investment Operations | | | | |
Net investment income (loss) E | .10 | .04 | .12 | .20 |
Net realized and unrealized gain (loss) | (4.29) | 5.09 | 9.63 | (12.89) |
Total from investment operations | (4.19) | 5.13 | 9.75 | (12.69) |
Distributions from net investment income | (.08) | (.12) | (.10) | - |
Distributions from net realized gain | (.03) | (.07) | - | - |
Total distributions | (.11) | (.19) | (.10) | - |
Redemption fees added to paid in capital E | .01 | . 01 | .02 | .02 |
Net asset value, end of period | $ 26.94 | $ 31.23 | $ 26.28 | $ 16.61 |
Total Return B,C,D | (13.45)% | 19.63% | 59.16% | (43.27)% |
Ratios to Average Net Assets F,I | | | | |
Expenses before reductions | 2.12% | 2.14% | 2.15% | 2.17% A |
Expenses net of fee waivers, if any | 2.12% | 2.14% | 2.15% | 2.17% A |
Expenses net of all reductions | 2.06% | 2.08% | 2.06% | 2.02% A |
Net investment income (loss) | .32% | .14% | .51% | 1.91% A |
Supplemental Data | | | | |
Net assets, end of period (000 omitted) | $ 1,801 | $ 2,496 | $ 1,915 | $ 155 |
Portfolio turnover rate G | 87% | 57% | 88% | 133% |
A Annualized B Total returns for periods of less than one year are not annualized. C Total returns would have been lower if certain expenses had not been reduced during the applicable periods shown. D Total returns do not include the effect of the contingent deferred sales charge. E Calculated based on average shares outstanding during the period. F Fees and expenses of any underlying Fidelity Central Funds are not included in the Fund's expense ratio. The Fund indirectly bears its proportionate share of the expenses of any underlying Fidelity Central Funds. G Amount does not include the portfolio activity of any underlying Fidelity Central Funds. H For the period May 9, 2008 (commencement of sale of shares) to October 31, 2008. I Expense ratios reflect operating expenses of the class. Expenses before reductions do not reflect amounts reimbursed by the investment adviser or reductions from brokerage service arrangements or reductions from other expense offset arrangements and do not represent the amount paid by the class during periods when reimbursements or reductions occur. Expense ratios before reductions for start-up periods may not be representative of longer-term operating periods. Expenses net of fee waivers reflect expenses after reimbursement by the investment adviser but prior to reductions from brokerage service arrangements or other expense offset arrangements. Expenses net of all reductions represent the net expenses paid by the class. |
Financial Highlights - Class C
Years ended October 31, | 2011 | 2010 | 2009 | 2008 H |
Selected Per-Share Data | | | | |
Net asset value, beginning of period | $ 31.19 | $ 26.25 | $ 16.61 | $ 29.28 |
Income from Investment Operations | | | | |
Net investment income (loss) E | .10 | .04 | .12 | .20 |
Net realized and unrealized gain (loss) | (4.28) | 5.09 | 9.62 | (12.89) |
Total from investment operations | (4.18) | 5.13 | 9.74 | (12.69) |
Distributions from net investment income | (.13) | (.13) | (.12) | - |
Distributions from net realized gain | (.03) | (.07) | - | - |
Total distributions | (.16) | (.20) | (.12) | - |
Redemption fees added to paid in capital E | .01 | .01 | .02 | .02 |
Net asset value, end of period | $ 26.86 | $ 31.19 | $ 26.25 | $ 16.61 |
Total Return B,C,D | (13.46)% | 19.66% | 59.18% | (43.27)% |
Ratios to Average Net Assets F,I | | | | |
Expenses before reductions | 2.12% | 2.14% | 2.15% | 2.13% A |
Expenses net of fee waivers, if any | 2.12% | 2.14% | 2.15% | 2.13% A |
Expenses net of all reductions | 2.06% | 2.07% | 2.07% | 1.98% A |
Net investment income (loss) | .32% | .15% | .51% | 1.95% A |
Supplemental Data | | | | |
Net assets, end of period (000 omitted) | $ 5,230 | $ 5,938 | $ 3,806 | $ 233 |
Portfolio turnover rate G | 87% | 57% | 88% | 133% |
A Annualized B Total returns for periods of less than one year are not annualized. C Total returns would have been lower if certain expenses had not been reduced during the applicable periods shown. D Total returns do not include the effect of the contingent deferred sales charge. E Calculated based on average shares outstanding during the period. F Fees and expenses of any underlying Fidelity Central Funds are not included in the Fund's expense ratio. The Fund indirectly bears its proportionate share of the expenses of any underlying Fidelity Central Funds. G Amount does not include the portfolio activity of any underlying Fidelity Central Funds. H For the period May 9, 2008 (commencement of sale of shares) to October 31, 2008. I Expense ratios reflect operating expenses of the class. Expenses before reductions do not reflect amounts reimbursed by the investment adviser or reductions from brokerage service arrangements or reductions from other expense offset arrangements and do not represent the amount paid by the class during periods when reimbursements or reductions occur. Expense ratios before reductions for start-up periods may not be representative of longer-term operating periods. Expenses net of fee waivers reflect expenses after reimbursement by the investment adviser but prior to reductions from brokerage service arrangements or other expense offset arrangements. Expenses net of all reductions represent the net expenses paid by the class. |
See accompanying notes which are an integral part of the financial statements.
Annual Report
Financial Highlights - China Region
Years ended October 31, | 2011 | 2010 | 2009 | 2008 | 2007 |
Selected Per-Share Data | | | | | |
Net asset value, beginning of period | $ 31.81 | $ 26.55 | $ 16.69 | $ 41.52 | $ 22.94 |
Income from Investment Operations | | | | | |
Net investment income (loss) B | .44 | .34 | .33 | .39 | .46 |
Net realized and unrealized gain (loss) | (4.37) | 5.18 | 9.68 | (20.42) | 18.58 |
Total from investment operations | (3.93) | 5.52 | 10.01 | (20.03) | 19.04 |
Distributions from net investment income | (.38) | (.21) | (.17) | (.32) | (.29) |
Distributions from net realized gain | (.03) | (.07) | - | (4.53) | (.20) |
Total distributions | (.40) F | (.27) G | (.17) | (4.85) | (.49) |
Redemption fees added to paid in capital B | .01 | .01 | .02 | .05 | .03 |
Net asset value, end of period | $ 27.49 | $ 31.81 | $ 26.55 | $ 16.69 | $ 41.52 |
Total Return A | (12.52)% | 20.97% | 60.77% | (53.75)% | 84.73% |
Ratios to Average Net Assets C,E | | | | | |
Expenses before reductions | 1.04% | 1.06% | 1.12% | 1.11% | 1.08% |
Expenses net of fee waivers, if any | 1.04% | 1.06% | 1.12% | 1.11% | 1.08% |
Expenses net of all reductions | .98% | 1.00% | 1.03% | .96% | .92% |
Net investment income (loss) | 1.40% | 1.22% | 1.54% | 1.45% | 1.64% |
Supplemental Data | | | | | |
Net assets, end of period (000 omitted) | $ 1,515,084 | $ 2,130,070 | $ 2,138,141 | $ 740,289 | $ 2,044,527 |
Portfolio turnover rate D | 87% | 57% | 88% | 133% | 173% |
A Total returns would have been lower if certain expenses had not been reduced during the applicable periods shown. B Calculated based on average shares outstanding during the period. C Fees and expenses of any underlying Fidelity Central Funds are not included in the Fund's expense ratio. The Fund indirectly bears its proportionate share of the expenses of any underlying Fidelity Central Funds. D Amount does not include the portfolio activity of any underlying Fidelity Central Funds. E Expense ratios reflect operating expenses of the class. Expenses before reductions do not reflect amounts reimbursed by the investment adviser or reductions from brokerage service arrangements or reductions from other expense offset arrangements and do not represent the amount paid by the class during periods when reimbursements or reductions occur. Expenses net of fee waivers reflect expenses after reimbursement by the investment adviser but prior to reductions from brokerage service arrangements or other expense offset arrangements. Expenses net of all reductions represent the net expenses paid by the class. F Total distributions of $.40 per share is comprised of distributions from net investment income of $.376 and distributions from net realized gain of $.025 per share. G Total distributions of $.27 per share is comprised of distributions from net investment income of $.209 and distributions from net realized gain of $.065 per share. |
Financial Highlights - Institutional Class
Years ended October 31, | 2011 | 2010 | 2009 | 2008 G |
Selected Per-Share Data | | | | |
Net asset value, beginning of period | $ 31.79 | $ 26.55 | $ 16.70 | $ 29.28 |
Income from Investment Operations | | | | |
Net investment income (loss) D | .43 | .33 | .37 | .34 |
Net realized and unrealized gain (loss) | (4.37) | 5.18 | 9.64 | (12.94) |
Total from investment operations | (3.94) | 5.51 | 10.01 | (12.60) |
Distributions from net investment income | (.37) | (.22) | (.18) | - |
Distributions from net realized gain | (.03) | (.07) | - | - |
Total distributions | (.40) | (.28) I | (.18) | - |
Redemption fees added to paid in capital D | .01 | .01 | .02 | .02 |
Net asset value, end of period | $ 27.46 | $ 31.79 | $ 26.55 | $ 16.70 |
Total Return B,C | (12.56)% | 20.92% | 60.78% | (42.96)% |
Ratios to Average Net Assets E,H | | | | |
Expenses before reductions | 1.06% | 1.11% | 1.08% | 1.05% A |
Expenses net of fee waivers, if any | 1.06% | 1.11% | 1.08% | 1.05% A |
Expenses net of all reductions | 1.01% | 1.04% | 1.00% | .91% A |
Net investment income (loss) | 1.38% | 1.18% | 1.58% | 3.02% A |
Supplemental Data | | | | |
Net assets, end of period (000 omitted) | $ 2,034 | $ 1,904 | $ 1,684 | $ 60 |
Portfolio turnover rate F | 87% | 57% | 88% | 133% |
A Annualized B Total returns for periods of less than one year are not annualized. C Total returns would have been lower if certain expenses had not been reduced during the applicable periods shown. D Calculated based on average shares outstanding during the period. E Fees and expenses of any underlying Fidelity Central Funds are not included in the Fund's expense ratio. The Fund indirectly bears its proportionate share of the expenses of any underlying Fidelity Central Funds. F Amount does not include the portfolio activity of any underlying Fidelity Central Funds. G For the period May 9, 2008 (commencement of sale of shares) to October 31, 2008. H Expense ratios reflect operating expenses of the class. Expenses before reductions do not reflect amounts reimbursed by the investment adviser or reductions from brokerage service arrangements or reductions from other expense offset arrangements and do not represent the amount paid by the class during periods when reimbursements or reductions occur. Expense ratios before reductions for start-up periods may not be representative of longer-term operating periods. Expenses net of fee waivers reflect expenses after reimbursement by the investment adviser but prior to reductions from brokerage service arrangements or other expense offset arrangements. Expenses net of all reductions represent the net expenses paid by the class. I Total distributions of $.28 per share is comprised of distributions from net investment income of $.216 and distributions from net realized gain of $.065 per share. |
See accompanying notes which are an integral part of the financial statements.
Annual Report
Notes to Financial Statements
For the period ended October 31, 2011
1. Organization.
Fidelity China Region Fund (the Fund) is a fund of Fidelity Investment Trust (the Trust) and is authorized to issue an unlimited number of shares. The Trust is registered under the Investment Company Act of 1940, as amended (the 1940 Act), as an open-end management investment company organized as a Massachusetts business trust. The Fund offers Class A, Class T, Class C, China Region, and Institutional Class shares, each of which, along with Class B shares, has equal rights as to assets and voting privileges. Effective after the close of business on September 1, 2010, Class B shares were closed to new accounts and additional purchases, except for exchanges and reinvestments by existing shareholders. Each class has exclusive voting rights with respect to matters that affect that class. Class B shares will automatically convert to Class A shares after a holding period of seven years from the initial date of purchase. Investment income, realized and unrealized capital gains and losses, the common expenses of the Fund, and certain fund-level expense reductions, if any, are allocated on a pro-rata basis to each class based on the relative net assets of each class to the total net assets of the Fund. Each class differs with respect to transfer agent and distribution and service plan fees incurred. Certain expense reductions may also differ by class. The Fund's investments in emerging markets can be subject to social, economic, regulatory, and political uncertainties and can be extremely volatile.
2. Investments in Fidelity Central Funds.
The Fund invests in Fidelity Central Funds, which are open-end investment companies available only to other investment companies and accounts managed by Fidelity Management & Research Company (FMR) and its affiliates. The Fund's Schedule of Investments lists each of the Fidelity Central Funds held as of period end, if any, as an investment of the Fund, but does not include the underlying holdings of each Fidelity Central Fund. As an Investing Fund, the Fund indirectly bears its proportionate share of the expenses of the underlying Fidelity Central Funds.
The Money Market Central Funds seek preservation of capital and current income and are managed by Fidelity Investments Money Management, Inc. (FIMM), an affiliate of FMR.
A complete unaudited list of holdings for each Fidelity Central Fund is available upon request or at the Securities and Exchange Commission (the SEC) web site at www.sec.gov. In addition, the financial statements of the Fidelity Central Funds, which are not covered by the Fund's Report of Independent Registered Public Accounting Firm are available on the SEC web site or upon request.
3. Significant Accounting Policies.
The financial statements have been prepared in conformity with accounting principles generally accepted in the United States of America (GAAP), which require management to make certain estimates and assumptions at the date of the financial statements. Actual results could differ from those estimates. Subsequent events, if any, through the date that the financial statements were issued have been evaluated in the preparation of the financial statements. The following summarizes the significant accounting policies of the Fund:
Security Valuation. Investments are valued as of 4:00 p.m. Eastern time on the last calendar day of the period. The Fund uses independent pricing services approved by the Board of Trustees to value its investments. When current market prices or quotations are not readily available or reliable, valuations may be determined in good faith in accordance with procedures adopted by the Board of Trustees. Factors used in determining value may include market or security specific events. The frequency with which these procedures are used cannot be predicted and they may be utilized to a significant extent. The value used for net asset value (NAV) calculation under these procedures may differ from published prices for the same securities.
The Fund categorizes the inputs to valuation techniques used to value its investments into a disclosure hierarchy consisting of three levels as shown below:
Level 1 - quoted prices in active markets for identical investments
Level 2 - other significant observable inputs (including quoted prices for similar investments, interest rates, prepayment speeds, etc.)
Level 3 - unobservable inputs (including the Fund's own assumptions based on the best information available)
Changes in valuation techniques may result in transfers in or out of an assigned level within the disclosure hierarchy. The aggregate value of investments by input level, as of October 31, 2011, is included at the end of the Fund's Schedule of Investments. Valuation techniques used to value the Fund's investments by major category are as follows:
Equity securities, including restricted securities, for which market quotations are readily available, are valued at the last reported sale price or official closing price as reported by an independent pricing service on the primary market or exchange on which they are traded and are categorized as Level 1 in the hierarchy. In the event there were no sales during the day or closing prices are not available, securities are valued at the last quoted bid price or may be valued using the last available price and are generally categorized as Level 2 in the hierarchy. For foreign equity securities, when significant market or security specific events arise, comparisons to the valuation of American Depositary Receipts (ADRs), futures contracts, Exchange-traded
Annual Report
Notes to Financial Statements - continued
3. Significant Accounting Policies - continued
Security Valuation - continued
funds (ETFs) and certain indexes as well as quoted prices for similar securities are used and are categorized as Level 2 in the hierarchy in these circumstances. Utilizing these techniques may result in transfers between Level 1 and Level 2. For restricted equity securities and private placements where observable inputs are limited, assumptions about market activity and risk are used and are categorized as Level 3 in the hierarchy.
Investments in open-end mutual funds, including the Fidelity Central Funds, are valued at their closing net asset value each business day and are categorized as Level 1 in the hierarchy.
Foreign Currency. The Fund may use foreign currency contracts to facilitate transactions in foreign-denominated securities. Gains and losses from these transactions may arise from changes in the value of the foreign currency or if the counterparties do not perform under the contracts' terms.
Foreign-denominated assets, including investment securities, and liabilities are translated into U.S. dollars at the exchange rate at period end. Purchases and sales of investment securities, income and dividends received and expenses denominated in foreign currencies are translated into U.S. dollars at the exchange rate in effect on the transaction date.
The effects of exchange rate fluctuations on investments are included with the net realized and unrealized gain (loss) on investment securities. Other foreign currency transactions resulting in realized and unrealized gain (loss) are disclosed separately.
Investment Transactions and Income. For financial reporting purposes, the Fund's investment holdings and NAV include trades executed through the end of the last business day of the period. The NAV per share for processing shareholder transactions is calculated as of the close of business of the New York Stock Exchange (NYSE), normally 4:00 p.m. Eastern time and includes trades executed through the end of the prior business day. Gains and losses on securities sold are determined on the basis of identified cost. Dividend income is recorded on the ex-dividend date, except for certain dividends from foreign securities where the ex-dividend date may have passed, which are recorded as soon as the Fund is informed of the ex-dividend date. Non-cash dividends included in dividend income, if any, are recorded at the fair market value of the securities received. Interest income and distributions from the Fidelity Central Funds are accrued as earned. Interest income includes coupon interest and amortization of premium and accretion of discount on debt securities. Investment income is recorded net of foreign taxes withheld where recovery of such taxes is uncertain.
Expenses. Expenses directly attributable to a fund are charged to that fund. Expenses attributable to more than one fund are allocated among the respective funds on the basis of relative net assets or other appropriate methods. Expense estimates are accrued in the period to which they relate and adjustments are made when actual amounts are known.
Income Tax Information and Distributions to Shareholders. Each year, the Fund intends to qualify as a regulated investment company, including distributing substantially all of its taxable income and realized gains under Subchapter M of the Internal Revenue Code and filing its U.S. federal tax return. As a result, no provision for income taxes is required. As of October 31, 2011, the Fund did not have any unrecognized tax benefits in the financial statements. A fund's federal tax return is subject to examination by the Internal Revenue Service (IRS) for a period of three years. Foreign taxes are provided for based on the Fund's understanding of the tax rules and rates that exist in the foreign markets in which it invests.
Distributions are declared and recorded on the ex-dividend date. Income dividends and capital gain distributions are declared separately for each class. Income and capital gain distributions are determined in accordance with income tax regulations, which may differ from GAAP. In addition, the Fund claimed a portion of the payment made to redeeming shareholders as a distribution for income tax purposes.
Capital accounts within the financial statements are adjusted for permanent book-tax differences. These adjustments have no impact on net assets or the results of operations. Temporary book-tax differences will reverse in a subsequent period.
Book-tax differences are primarily due to the foreign currency transactions, deferred trustees compensation, passive foreign investment companies (PFIC), capital loss carryforwards and losses deferred due to wash sales.
The federal tax cost of investment securities and unrealized appreciation (depreciation) as of period end were as follows:
Gross unrealized appreciation | $ 225,517,453 |
Gross unrealized depreciation | (65,204,838) |
Net unrealized appreciation (depreciation) on securities and other investments | $ 160,312,615 |
| |
Tax Cost | $ 1,390,303,820 |
Annual Report
3. Significant Accounting Policies - continued
Income Tax Information and Distributions to Shareholders - continued
The tax-based components of distributable earnings as of period end were as follows:
Undistributed ordinary income | $ 15,589,243 |
Undistributed long-term capital gain | $ 18,703,425 |
Net unrealized appreciation (depreciation) | $ 160,312,703 |
Under the recently enacted Regulated Investment Company Modernization Act of 2010 (the Act), the Fund will be permitted to carry forward capital losses incurred in taxable years beginning after December 22, 2010 for an unlimited period. However, any losses incurred during those future taxable years will be required to be utilized prior to any losses incurred in pre-enactment taxable years, which generally expire after eight years from when they are incurred. Additionally, post-enactment capital losses that are carried forward will retain their character as either short-term or long-term capital losses rather than being considered all short-term as under previous law. The Fund's first fiscal year end subject to the Act will be October 31, 2012.
The tax character of distributions paid was as follows:
| October 31, 2011 | October 31, 2010 |
Ordinary Income | $ 27,251,618 | $ 23,329,164 |
Short-Term Trading (Redemption) Fees. Shares held by investors in the Fund less than 90 days are subject to a redemption fee equal to 1.50% of the net asset value of shares redeemed. All redemption fees, which reduce the proceeds of the shareholder redemption, are retained by the Fund and accounted for as an addition to paid in capital.
New Accounting Pronouncement. In May 2011, the Financial Accounting Standards Board issued Accounting Standard Update No. 2011-04, Fair Value Measurement (Topic 820) - Amendments to Achieve Common Fair Value Measurement and Disclosure Requirements in U.S. GAAP and IFRSs. The update changes the wording used to describe the requirements in GAAP for measuring fair value and for disclosing information about fair value measurements. The update is effective during interim and annual periods beginning after December 15, 2011. Management is currently evaluating the impact of the update's adoption on the Fund's financial statement disclosures.
4. Purchases and Sales of Investments.
Purchases and sales of securities, other than short-term securities, aggregated $1,708,508,008 and $2,005,473,744, respectively.
5. Fees and Other Transactions with Affiliates.
Management Fee. FMR and its affiliates provide the Fund with investment management related services for which the Fund pays a monthly management fee. The management fee is the sum of an individual fund fee rate that is based on an annual rate of .45% of the Fund's average net assets and a group fee rate that averaged .26% during the period. The group fee rate is based upon the average net assets of all the mutual funds advised by FMR. The group fee rate decreases as assets under management increase and increases as assets under management decrease. For the period, the total annual management fee rate was .71% of the Fund's average net assets.
Distribution and Service Plan Fees. In accordance with Rule 12b-1 of the 1940 Act, the Fund has adopted separate Distribution and Service Plans for each class of shares. Certain classes pay Fidelity Distributors Corporation (FDC), an affiliate of FMR, separate Distribution and Service Fees, each of which is based on an annual percentage of each class' average net assets. In addition, FDC may pay financial intermediaries for selling shares of the Fund and providing shareholder support services. For the period, the Distribution and Service Fee rates, total fees and amounts retained by FDC were as follows:
| Distribution
Fee | Service
Fee | Total Fees | Retained
by FDC |
Class A | -% | .25% | $ 43,649 | $ 1,347 |
Class T | .25% | .25% | 31,332 | - |
Class B | .75% | .25% | 23,294 | 17,555 |
Class C | .75% | .25% | 63,113 | 18,988 |
| | | $ 161,388 | $ 37,890 |
Sales Load. FDC may receive a front-end sales charge of up to 5.75% for selling Class A shares, and 3.50% for selling Class T shares, some of which is paid to financial intermediaries for selling shares of the Fund. Depending on the holding period, FDC may receive contingent deferred sales charges levied on Class A, Class T, Class B, and Class C redemptions. The deferred sales charges range from 5% to 1% for Class B, 1% for Class C, 1.00% for certain purchases of Class A shares and .25% for certain purchases of Class T shares.
Annual Report
Notes to Financial Statements - continued
5. Fees and Other Transactions with Affiliates - continued
Sales Load - continued
For the period, sales charge amounts retained by FDC were as follows:
| Retained
by FDC |
Class A | $ 27,851 |
Class T | 4,413 |
Class B* | 6,044 |
Class C* | 2,133 |
| $ 40,441 |
* When Class B and Class C shares are initially sold, FDC pays commissions from its own resources to financial intermediaries through which the sales are made.
Transfer Agent Fees. Fidelity Investments Institutional Operations Company, Inc. (FIIOC), an affiliate of FMR, is the transfer, dividend disbursing and shareholder servicing agent for each class of the Fund. FIIOC receives account fees and asset-based fees that vary according to the account size and type of account of the shareholders of the respective classes of the Fund. FIIOC pays for typesetting, printing and mailing of shareholder reports, except proxy statements. For the period, transfer agent fees for each class were as follows:
| Amount | % of
Average
Net Assets |
Class A | $ 53,201 | .31 |
Class T | 19,843 | .32 |
Class B | 7,069 | .30 |
Class C | 19,240 | .31 |
China Region | 4,421,467 | .23 |
Institutional Class | 4,555 | .25 |
| $ 4,525,375 | |
Accounting and Security Lending Fees. Fidelity Service Company, Inc. (FSC), an affiliate of FMR, maintains the Fund's accounting records. The accounting fee is based on the level of average net assets for the month. Under a separate contract, FSC administers the security lending program. The security lending fee is based on the number and duration of lending transactions.
Brokerage Commissions. The Fund placed portion of its portfolio transactions with brokerage firms which are affiliates of the investment adviser. The commissions paid to these affiliated firms were $222 for the period.
Interfund Lending Program. Pursuant to an Exemptive Order issued by the SEC, the Fund, along with other registered investment companies having management contracts with FMR, may participate in an interfund lending program. This program provides an alternative credit facility allowing the funds to borrow from, or lend money to, other participating affiliated funds. At period end, there were no interfund loans outstanding. The Fund's activity in this program during the period for which loans were outstanding was as follows:
Borrower or Lender | Average Daily
Loan Balance | Weighted Average Interest Rate | Interest
Expense |
Borrower | $ 16,084,375 | .34% | $ 1,206 |
6. Committed Line of Credit.
The Fund participates with other funds managed by FMR or an affiliate in a $4.0 billion credit facility (the "line of credit") to be utilized for temporary or emergency purposes to fund shareholder redemptions or for other short-term liquidity purposes. The Fund has agreed to pay commitment fees on its pro-rata portion of the line of credit, which amounted to $6,361 and is reflected in Miscellaneous expenses on the Statement of Operations. During the period, there were no borrowings on this line of credit.
7. Security Lending.
The Fund lends portfolio securities through a lending agent from time to time in order to earn additional income. For equity securities, a lending agent is used and may loan securities to certain qualified borrowers, including Fidelity Capital Markets (FCM), a broker-dealer affiliated with the Fund. On the settlement date of the loan, the Fund receives collateral (in the form of U.S. Treasury obligations, letters of credit and/or cash) against the loaned securities and maintains collateral in an amount not less than 100% of the market value of the loaned securities during the period of the loan. The market value of the loaned securities is determined at the close of business of the Fund and any additional required collateral is delivered to the Fund
Annual Report
7. Security Lending - continued
on the next business day. If the borrower defaults on its obligation to return the securities loaned because of insolvency or other reasons, a fund could experience delays and costs in recovering the securities loaned or in gaining access to the collateral. Any cash collateral received is invested in the Fidelity Securities Lending Cash Central Fund. The value of loaned securities and cash collateral at period end are disclosed on the Fund's Statement of Assets and Liabilities. Security lending income represents the income earned on investing cash collateral, less rebates paid to borrowers and any lending agent fees associated with the loan, plus any premium payments received for lending certain types of securities. Security lending income is presented in the Statement of Operations as a component of income from Fidelity Central Funds. Total security lending income during the period amounted to $1,097,622, including $2,921 from securities loaned to FCM.
8. Bank Borrowings.
The Fund is permitted to have bank borrowings for temporary or emergency purposes to fund shareholder redemptions or for other short-term liquidity requirements. The Fund has established borrowing arrangements with certain banks. The interest rate on the borrowings is the bank's base rate, as revised from time to time. The average daily loan balance during the period for which loans were outstanding amounted to $347,907,000. The weighted average interest rate was .57%. The interest expense amounted to $22,034 under the bank borrowing program. At period end, there were no bank borrowings outstanding.
9. Expense Reductions.
Many of the brokers with whom FMR places trades on behalf of the Fund provided services to the Fund in addition to trade execution. These services included payments of certain expenses on behalf of the Fund totaling $1,098,595 for the period. In addition, through arrangements with the Fund's custodian, credits realized as a result of uninvested cash balances were used to reduce the Fund's expenses. During the period, these credits reduced the Fund' expenses by $564.
10. Distributions to Shareholders.
Distributions to shareholders of each class were as follows:
Years ended October 31, | 2011 | 2010 |
From net investment income | | |
Class A | $ 172,777 | $ 99,129 |
Class T | 55,512 | 24,223 |
Class B | 6,583 | 9,817 |
Class C | 25,937 | 22,748 |
China Region | 25,262,487 | 17,620,183 |
Institutional Class | 21,315 | 12,213 |
Total | $ 25,544,611 | $ 17,788,313 |
From net realized gain | | |
Class A | $ 13,756 | $ 32,057 |
Class T | 5,178 | 8,895 |
Class B | 2,007 | 5,146 |
Class C | 4,950 | 11,118 |
China Region | 1,679,687 | 5,479,960 |
Institutional Class | 1,429 | 3,675 |
Total | $ 1,707,007 | $ 5,540,851 |
11. Share Transactions.
Transactions for each class of shares were as follows:
| Shares | Dollars |
Years ended October 31, | 2011 | 2010 | 2011 | 2010 |
Class A | | | | |
Shares sold | 281,861 | 342,123 | $ 8,932,867 | $ 9,544,171 |
Reinvestment of distributions | 5,327 | 4,199 | 172,528 | 118,611 |
Shares redeemed | (251,952) | (286,153) | (7,835,006) | (7,654,399) |
Net increase (decrease) | 35,236 | 60,169 | $ 1,270,389 | $ 2,008,383 |
Annual Report
Notes to Financial Statements - continued
11. Share Transactions - continued
| Shares | Dollars |
Years ended October 31, | 2011 | 2010 | 2011 | 2010 |
Class T | | | | |
Shares sold | 75,956 | 132,233 | $ 2,390,903 | $ 3,681,750 |
Reinvestment of distributions | 1,832 | 1,158 | 59,161 | 32,661 |
Shares redeemed | (75,948) | (59,475) | (2,353,550) | (1,609,136) |
Net increase (decrease) | 1,840 | 73,916 | $ 96,514 | $ 2,105,275 |
Class B | | | | |
Shares sold | 8,058 | 41,380 | $ 255,784 | $ 1,126,249 |
Reinvestment of distributions | 239 | 486 | 7,684 | 13,648 |
Shares redeemed | (21,353) | (34,810) | (653,889) | (913,219) |
Net increase (decrease) | (13,056) | 7,056 | $ (390,421) | $ 226,678 |
Class C | | | | |
Shares sold | 88,544 | 121,441 | $ 2,766,692 | $ 3,346,120 |
Reinvestment of distributions | 892 | 1,162 | 28,631 | 32,596 |
Shares redeemed | (85,136) | (77,220) | (2,585,147) | (2,041,365) |
Net increase (decrease) | 4,300 | 45,383 | $ 210,176 | $ 1,337,351 |
China Region | | | | |
Shares sold | 12,355,142 | 29,402,822 | $ 393,844,409 | $ 826,039,335 |
Reinvestment of distributions | 794,988 | 782,007 | 25,868,885 | 22,169,887 |
Shares redeemed | (24,993,159) | (43,745,336) | (775,253,396) | (1,195,393,614) |
Net increase (decrease) | (11,843,029) | (13,560,507) | $ (355,540,102) | $ (347,184,392) |
Institutional Class | | | | |
Shares sold | 53,728 | 53,076 | $ 1,636,945 | $ 1,486,647 |
Reinvestment of distributions | 607 | 500 | 19,735 | 14,160 |
Shares redeemed | (40,146) | (57,102) | (1,247,642) | (1,583,738) |
Net increase (decrease) | 14,189 | (3,526) | $ 409,038 | $ (82,931) |
12. Other.
The Fund's organizational documents provide former and current trustees and officers with a limited indemnification against liabilities arising in connection with the performance of their duties to the Fund. In the normal course of business, the Fund may also enter into contracts that provide general indemnifications. The Fund's maximum exposure under these arrangements is unknown as this would be dependent on future claims that may be made against the Fund. The risk of material loss from such claims is considered remote.
Annual Report
Report of Independent Registered Public Accounting Firm
To the Trustees of Fidelity Investment Trust and the Shareholders of Fidelity China Region Fund:
In our opinion, the accompanying statement of assets and liabilities, including the schedule of investments, and the related statements of operations and of changes in net assets and the financial highlights present fairly, in all material respects, the financial position of Fidelity China Region Fund (a fund of Fidelity Investment Trust) at October 31, 2011, the results of its operations for the year then ended, the changes in its net assets for each of the two years in the period then ended and the financial highlights for each of the periods indicated, in conformity with accounting principles generally accepted in the United States of America. These financial statements and financial highlights (hereafter referred to as "financial statements") are the responsibility of the Fidelity China Region Fund's management. Our responsibility is to express an opinion on these financial statements based on our audits. We conducted our audits of these financial statements in accordance with the standards of the Public Company Accounting Oversight Board (United States). Those standards require that we plan and perform the audit to obtain reasonable assurance about whether the financial statements are free of material misstatement. An audit includes examining, on a test basis, evidence supporting the amounts and disclosures in the financial statements, assessing the accounting principles used and significant estimates made by management, and evaluating the overall financial statement presentation. We believe that our audits, which included confirmation of securities at October 31, 2011 by correspondence with the custodian and brokers, provide a reasonable basis for our opinion.
PricewaterhouseCoopers LLP
Boston, Massachusetts
December 16, 2011
Annual Report
The Trustees, Members of the Advisory Board, and executive officers of the trust and fund, as applicable, are listed below. The Board of Trustees governs the fund and is responsible for protecting the interests of shareholders. The Trustees are experienced executives who meet periodically throughout the year to oversee the fund's activities, review contractual arrangements with companies that provide services to the fund, oversee management of the risks associated with such activities and contractual arrangements, and review the fund's performance. Except for James C. Curvey, each of the Trustees oversees 226 funds advised by FMR or an affiliate. Mr. Curvey oversees 429 funds advised by FMR or an affiliate.
The Trustees hold office without limit in time except that (a) any Trustee may resign; (b) any Trustee may be removed by written instrument, signed by at least two-thirds of the number of Trustees prior to such removal; (c) any Trustee who requests to be retired or who has become incapacitated by illness or injury may be retired by written instrument signed by a majority of the other Trustees; and (d) any Trustee may be removed at any special meeting of shareholders by a two-thirds vote of the outstanding voting securities of the trust. Each Trustee who is not an interested person (as defined in the 1940 Act) (Independent Trustee), shall retire not later than the last day of the calendar year in which his or her 75th birthday occurs. The Independent Trustees may waive this mandatory retirement age policy with respect to individual Trustees. The executive officers and Advisory Board Members hold office without limit in time, except that any officer and Advisory Board Member may resign or may be removed by a vote of a majority of the Trustees at any regular meeting or any special meeting of the Trustees. Except as indicated, each individual has held the office shown or other offices in the same company for the past five years.
Experience, Skills, Attributes, and Qualifications of the Fund's Trustees. The Governance and Nominating Committee has adopted a statement of policy that describes the experience, qualifications, attributes, and skills that are necessary and desirable for potential Independent Trustee candidates (Statement of Policy). The Board believes that each Trustee satisfied at the time he or she was initially elected or appointed a Trustee, and continues to satisfy, the standards contemplated by the Statement of Policy. The Governance and Nominating Committee also engages professional search firms to help identify potential Independent Trustee candidates who have the experience, qualifications, attributes, and skills consistent with the Statement of Policy. From time to time, additional criteria based on the composition and skills of the current Independent Trustees, as well as experience or skills that may be appropriate in light of future changes to board composition, business conditions, and regulatory or other developments, have also been considered by the professional search firms and the Governance and Nominating Committee. In addition, the Board takes into account the Trustees' commitment and participation in Board and committee meetings, as well as their leadership of standing and ad hoc committees throughout their tenure.
In determining that a particular Trustee was and continues to be qualified to serve as a Trustee, the Board has considered a variety of criteria, none of which, in isolation, was controlling. The Board believes that, collectively, the Trustees have balanced and diverse experience, qualifications, attributes, and skills, which allow the Board to operate effectively in governing the fund and protecting the interests of shareholders. Information about the specific experience, skills, attributes, and qualifications of each Trustee, which in each case led to the Board's conclusion that the Trustee should serve (or continue to serve) as a trustee of the fund, is provided below.
Board Structure and Oversight Function. James C. Curvey is an interested person (as defined in the 1940 Act) and currently serves as Acting Chairman. The Trustees have determined that an interested Chairman is appropriate and benefits shareholders because an interested Chairman has a personal and professional stake in the quality and continuity of services provided to the fund. Independent Trustees exercise their informed business judgment to appoint an individual of their choosing to serve as Chairman, regardless of whether the Trustee happens to be independent or a member of management. The Independent Trustees have determined that they can act independently and effectively without having an Independent Trustee serve as Chairman and that a key structural component for assuring that they are in a position to do so is for the Independent Trustees to constitute a substantial majority for the Board. The Independent Trustees also regularly meet in executive session. Ned C. Lautenbach serves as Chairman of the Independent Trustees and as such (i) acts as a liaison between the Independent Trustees and management with respect to matters important to the Independent Trustees and (ii) with management prepares agendas for Board meetings.
Fidelity funds are overseen by different Boards of Trustees. The fund's Board oversees Fidelity's equity and high income funds and another Board oversees Fidelity's investment-grade bond, money market, and asset allocation funds. The asset allocation funds may invest in Fidelity funds overseen by the fund's Board. The use of separate Boards, each with its own committee structure, allows the Trustees of each group of Fidelity funds to focus on the unique issues of the funds they oversee, including common research, investment, and operational issues. On occasion, the separate Boards establish joint committees to address issues of overlapping consequences for the Fidelity funds overseen by each Board.
The Trustees operate using a system of committees to facilitate the timely and efficient consideration of all matters of importance to the Trustees, the fund, and fund shareholders and to facilitate compliance with legal and regulatory requirements and oversight of the fund's activities and associated risks. The Board, acting through its committees, has charged FMR and its affiliates with (i) identifying events or circumstances the occurrence of which could have demonstrably adverse effects on the fund's business and/or reputation; (ii) implementing processes and controls to lessen the possibility that such events or circumstances occur or to mitigate the effects of such events or circumstances if they do occur; and (iii) creating and maintaining a system designed to evaluate continuously business and market conditions in order to facilitate the identification and implementation processes described in (i) and (ii) above. Because the day-to-day operations and activities of the fund are carried out by or through FMR, its affiliates and other service providers, the fund's exposure to risks is mitigated but not eliminated by the processes overseen by the Trustees. While each of the Board's committees has responsibility for overseeing different aspects of the fund's activities, oversight is exercised primarily through the Operations, Audit, and Compliance Committees. In addition, the Independent Trustees have worked with FMR to enhance the Board's oversight of investment and financial risks, legal and regulatory risks, technology risks, and operational risks, including the development of additional risk reporting to the Board. For example, a working group comprised of Independent Trustees and FMR has worked and continues to work to review the Fidelity funds' valuation-related activities, reporting and risk management. Appropriate personnel, including but not limited to the fund's Chief Compliance Officer (CCO), FMR's internal auditor, the independent accountants, the fund's Treasurer and portfolio management personnel, make periodic reports to the Board's committees, as appropriate, including an annual review of FMR's risk management program for the Fidelity funds. The responsibilities of each standing committee, including their oversight responsibilities, are described further under "Standing Committees of the Fund's Trustees."
Annual Report
The fund's Statement of Additional Information (SAI) includes more information about the Trustees. To request a free copy, call Fidelity at 1-877-208-0098.
Interested Trustees*:
Correspondence intended for each Trustee who is an interested person may be sent to Fidelity Investments, 82 Devonshire Street, Boston, Massachusetts 02109.
Name, Age; Principal Occupations and Other Relevant Experience+ |
James C. Curvey (76) |
| Year of Election or Appointment: 2007 Mr. Curvey is Trustee and Acting Chairman of the Board of Trustees of certain Trusts. Mr. Curvey also serves as Trustee (2007-present) of other investment companies advised by FMR. Mr. Curvey is a Director of Fidelity Investments Money Management, Inc. (2009-present), Director of Fidelity Research & Analysis Co. (2009-present) and Director of FMR and FMR Co., Inc. (2007-present). Mr. Curvey is also Vice Chairman (2007-present) and Director of FMR LLC. In addition, Mr. Curvey serves as an Overseer for the Boston Symphony Orchestra and a member of the Trustees of Villanova University. Previously, Mr. Curvey was the Vice Chairman (2006-2007) and Director (2000-2007) of FMR Corp. |
Ronald P. O'Hanley (54) |
| Year of Election or Appointment: 2011 Mr. O'Hanley is Director of FMR Co., Inc. (2010-present), Director of Fidelity Investments Money Management, Inc. (2010-present), Director of Fidelity Research & Analysis Company (2010-present), President of Fidelity Asset Management and Corporate Services and a member of Fidelity's Executive Committee (2010-present). Previously, Mr. O'Hanley served as President and Chief Executive Officer of BNY Mellon Asset Management (2007-2010). Mr. O'Hanley also served as Vice Chairman of Bank New York Mellon Corp. and a member of that firm's Executive Committee. Prior to the 2007 merger of The Bank of New York and Mellon Financial Corporation, he was Vice Chairman of Mellon Financial Corporation and President and Chief Executive Officer of Mellon Asset Management. He joined Mellon in February 1997. Mr. O'Hanley currently serves as Chairman of the Boston Public Library Foundation Board of Directors and sits on the Board of Directors of Beth Israel Deaconess Medical Center, the Board of Trustees of the Marine Biological Laboratory and the Advisory Board of the Maxwell School of Citizenship and Public Administration at Syracuse University. Mr. O'Hanley also chairs the Council on Asset Management for the Financial Services Roundtable and is a member of the Board of Directors of Institutional Investor's U.S. Institute. |
* Trustees have been determined to be "Interested Trustees" by virtue of, among other things, their affiliation with the trust or various entities under common control with FMR.
+ The information above includes each Trustee's principal occupation during the last five years and other information relating to the experience, attributes, and skills relevant to each Trustee's qualifications to serve as a Trustee, which led to the conclusion that each Trustee should serve as a Trustee for the fund.
Independent Trustees:
Correspondence intended for each Independent Trustee (that is, the Trustees other than the Interested Trustees) may be sent to Fidelity Investments, P.O. Box 55235, Boston, Massachusetts 02205-5235.
Name, Age; Principal Occupations and Other Relevant Experience+ |
Dennis J. Dirks (63) |
| Year of Election or Appointment: 2005 Prior to his retirement in May 2003, Mr. Dirks was Chief Operating Officer and a member of the Board of The Depository Trust & Clearing Corporation (DTCC). He also served as President, Chief Operating Officer, and Board member of The Depository Trust Company (DTC) and President and Board member of the National Securities Clearing Corporation (NSCC). In addition, Mr. Dirks served as Chief Executive Officer and Board member of the Government Securities Clearing Corporation, Chief Executive Officer and Board member of the Mortgage-Backed Securities Clearing Corporation, as a Trustee and a member of the Finance Committee of Manhattan College (2005-2008), and as a Trustee and a member of the Finance Committee of AHRC of Nassau County (2006-2008). Mr. Dirks is a member of the Independent Directors Council (IDC) Governing Council (2010-Present) and Board of Directors for The Brookville Center for Children's Services, Inc. (2009-present). |
Alan J. Lacy (58) |
| Year of Election or Appointment: 2008 Mr. Lacy serves as Senior Adviser (2007-present) of Oak Hill Capital Partners, L.P. (private equity). Mr. Lacy also served as Chief Executive Officer (2000-2005) and Vice Chairman (2005-2006) of Sears Holdings Corporation and Sears, Roebuck and Co. (retail). In addition, Mr. Lacy serves as a member of the Board of Directors of Dave & Buster's, Inc. (restaurant and entertainment complexes, 2010-present), The Hillman Companies, Inc. (hardware wholesalers, 2010-present), and Bristol-Myers Squibb Company (global pharmaceuticals, 2007-present). Mr. Lacy is a member of the Board of Trustees of The National Parks Conservation Association (2006-Present). Previously, Mr. Lacy served as Chairman of the Board of Trustees of the National Parks Conservation Association (2008-2011) and as a member of the Board of Directors for the Western Union Company (global money transfer, 2006-2011). |
Ned C. Lautenbach (67) |
| Year of Election or Appointment: 2000 Mr. Lautenbach is Chairman of the Independent Trustees of the Equity and High Income Funds (2006-present). Mr. Lautenbach currently serves as the Lead Director of the Eaton Corporation Board of Directors (diversified industrial, 1997-present). Mr. Lautenbach is also a member of the Board of Directors of the Philharmonic Center for the Arts in Naples, Florida (1999-present); a member of the Board of Trustees of Fairfield University (2005-present); and a member of the Council on Foreign Relations (1994-present). Previously, Mr. Lautenbach was a Partner/Advisory Partner at Clayton, Dubilier & Rice, LLC (private equity investment, 1998-2010), as well as a Director of Sony Corporation (2006-2007). |
Joseph Mauriello (67) |
| Year of Election or Appointment: 2008 Prior to his retirement in January 2006, Mr. Mauriello served in numerous senior management positions including Deputy Chairman and Chief Operating Officer (2004-2005), and Vice Chairman of Financial Services (2002-2004) of KPMG LLP US (professional services, 1965-2005). Mr. Mauriello currently serves as a member of the Board of Directors of XL Group plc. (global insurance and re-insurance, 2006-present) and of Arcadia Resources Inc. (health care services and products, 2007-present). Previously, Mr. Mauriello served as a Director of the Hamilton Funds of the Bank of New York (2006-2007). |
Robert W. Selander (61) |
| Year of Election or Appointment: 2011 Previously, Mr. Selander served as a Member of the Advisory Board of Fidelity's Equity and High Income Funds (2011), Executive Vice Chairman (2010), Chief Executive Officer (2009-2010), and President and Chief Executive Officer (1997-2009) of Mastercard, Inc. |
Cornelia M. Small (67) |
| Year of Election or Appointment: 2005 Ms. Small is a member of the Board of Directors of the Teagle Foundation (2009-present). Ms. Small is also a member of the Investment Committee, and Chair (2008-present) and a member of the Board of Trustees of Smith College. In addition, Ms. Small serves on the Investment Committee of the Berkshire Taconic Community Foundation (2008-present). Previously, Ms. Small served as Chairperson of the Investment Committee (2002-2008) of Smith College. In addition, Ms. Small served as Chief Investment Officer, Director of Global Equity Investments, and a member of the Board of Directors of Scudder, Stevens & Clark and Scudder Kemper Investments. |
William S. Stavropoulos (72) |
| Year of Election or Appointment: 2001 Mr. Stavropoulos is Vice Chairman of the Independent Trustees of the Equity and High Income Funds (2006-present). Mr. Stavropoulos serves as President and Founder of the Michigan Baseball Foundation, the Great Lakes Loons (2007-present). Mr. Stavropoulos is Chairman Emeritus of the Board of Directors of The Dow Chemical Company, where he previously served in numerous senior management positions, including President, CEO (1995-2000; 2002-2004), Chairman of the Executive Committee (2000-2006), and as a member of the Board of Directors (1990-2006). Currently, Mr. Stavropoulos is Chairman of Univar (global distributor of commodity and specialty chemicals, 2010-present), a Director of Teradata Corporation (data warehousing and technology solutions, 2008-present), Chemical Financial Corporation, Maersk Inc. (industrial conglomerate), Tyco International, Inc. (multinational manufacturing and services, 2007-present), and a member of the Advisory Board for Metalmark Capital (private equity investment, 2005-present). Mr. Stavropoulos is a special advisor to Clayton, Dubilier & Rice, LLC (private equity investment). In addition, Mr. Stavropoulos is a member of the University of Notre Dame Advisory Council for the College of Science. |
David M. Thomas (62) |
| Year of Election or Appointment: 2008 Previously, Mr. Thomas served as Executive Chairman (2005-2006) and Chairman and Chief Executive Officer (2000-2005) of IMS Health, Inc. (pharmaceutical and healthcare information solutions). In addition, Mr. Thomas serves as a member of the Board of Directors of Fortune Brands, Inc. (consumer products), and Interpublic Group of Companies, Inc. (marketing communication, 2004-present). |
Michael E. Wiley (61) |
| Year of Election or Appointment: 2008 Mr. Wiley also serves as a Director of Asia Pacific Exploration Consolidated (international oil and gas exploration and production, 2008-present). Mr. Wiley serves as a Director of Tesoro Corporation (independent oil refiner and marketer, 2005-present), and a Director of Bill Barrett Corporation (exploration and production, 2005-present). In addition, Mr. Wiley also serves as a Director of Post Oak Bank (privately-held bank, 2004-present). Previously, Mr. Wiley served as a member of the Board of Trustees of the University of Tulsa (2000-2006; 2007-2010), as a Senior Energy Advisor of Katzenbach Partners, LLC (consulting, 2006-2007), as an Advisory Director of Riverstone Holdings (private investment), Chairman, President, and CEO of Baker Hughes, Inc. (oilfield services, 2000-2004), and as Director of Spinnaker Exploration Company (exploration and production, 2001-2005). |
+ The information above includes each Trustee's principal occupation during the last five years and other information relating to the experience, attributes, and skills relevant to each Trustee's qualifications to serve as a Trustee, which led to the conclusion that each Trustee should serve as a Trustee for the fund.
Advisory Board Members and Executive Officers:
Correspondence intended for each executive officer, Edward C. Johnson 3d, and Peter S. Lynch may be sent to Fidelity Investments, 82 Devonshire Street, Boston, Massachusetts 02109.
Name, Age; Principal Occupation |
Edward C. Johnson 3d (81) |
| Year of Election or Appointment: 2011 Member of the Advisory Board of Fidelity's Equity and High Income Funds. Mr. Johnson serves as Chief Executive Officer, Chairman, and a Director of FMR LLC, and also serves as Chairman and Director of FIL Limited. Previously, Mr. Johnson served as a Trustee and Chairman of the Board of certain Fidelity Trusts, Chairman and a Director of FMR, Chairman and a Director of FMR Co., Inc., and President of FMR LLC (2006-2007). |
Peter S. Lynch (67) |
| Year of Election or Appointment: 2003 Member of the Advisory Board of Fidelity's Equity and High Income Funds. Mr. Lynch is Vice Chairman and a Director of FMR and FMR Co., Inc. In addition, Mr. Lynch serves as a Trustee of Boston College and as the Chairman of the Inner-City Scholarship Fund. Previously, Mr. Lynch served on the Special Olympics International Board of Directors (1997-2006). |
Kenneth B. Robins (42) |
| Year of Election or Appointment: 2008 President and Treasurer of Fidelity's Equity and High Income Funds. Mr. Robins also serves as President and Treasurer (2010-present) and Assistant Treasurer (2009-present) of other Fidelity funds and is an employee of Fidelity Investments (2004-present). Previously, Mr. Robins served as Deputy Treasurer of the Fidelity funds (2005-2008) and Treasurer and Chief Financial Officer of The North Carolina Capital Management Trust: Cash and Term Portfolios (2006-2008). |
Bruce T. Herring (46) |
| Year of Election or Appointment: 2006 Vice President of certain Equity Funds. Mr. Herring also serves as Chief Investment Officer and Director of Fidelity Management & Research (U.K.) Inc. (2010-present) and Group Chief Investments Officer of FMR. Previously, Mr. Herring served as Vice President (2005-2006) and Senior Vice President (2006-2007) of Fidelity Management & Research Company, Vice President of FMR Co., Inc. (2001-2007) and as a portfolio manager for Fidelity U.S. Equity Funds. |
Brian B. Hogan (47) |
| Year of Election or Appointment: 2009 Vice President of Equity and High Income Funds. Mr. Hogan also serves as President of FMR's Equity Division (2009-present). Previously, Mr. Hogan served as Senior Vice President, Equity Research of FMR (2006-2009) and as a portfolio manager. |
Scott C. Goebel (43) |
| Year of Election or Appointment: 2008 Secretary and Chief Legal Officer (CLO) of the Fidelity funds. Mr. Goebel also serves as Secretary of Fidelity Investments Money Management, Inc. (FIMM) (2010-present) and Fidelity Research and Analysis Company (FRAC) (2010-present); Secretary and CLO of The North Carolina Capital Management Trust: Cash and Term Portfolios (2008-present); General Counsel, Secretary, and Senior Vice President of FMR (2008-present) and FMR Co., Inc. (2008-present); employed by FMR LLC or an affiliate (2001-present); Chief Legal Officer of Fidelity Management & Research (Hong Kong) Limited (2008-present) and Assistant Secretary of Fidelity Management & Research (Japan) Inc. (2008-present), and Fidelity Management & Research (U.K.) Inc. (2008-present). Previously, Mr. Goebel served as Assistant Secretary of FIMM (2008-2010), FRAC (2008-2010), and the Funds (2007-2008) and as Vice President and Secretary of Fidelity Distributors Corporation (FDC) (2005-2007). |
William C. Coffey (42) |
| Year of Election or Appointment: 2009 Assistant Secretary of Fidelity's Equity and High Income Funds. Mr. Coffey also serves as Senior Vice President and Deputy General Counsel of FMR LLC (2010-present), and is an employee of Fidelity Investments. Previously, Mr. Coffey served as Vice President and Associate General Counsel of FMR LLC (2005-2009). |
Holly C. Laurent (57) |
| Year of Election or Appointment: 2008 Anti-Money Laundering (AML) Officer of the Fidelity funds. Ms. Laurent also serves as AML Officer of The North Carolina Capital Management Trust: Cash and Term Portfolios (2008-present) and is an employee of Fidelity Investments. Previously, Ms. Laurent was Senior Vice President and Head of Legal for Fidelity Business Services India Pvt. Ltd. (2006-2008), and Senior Vice President, Deputy General Counsel and Group Head for FMR LLC (2005-2006). |
Christine Reynolds (53) |
| Year of Election or Appointment: 2008 Chief Financial Officer of the Fidelity funds. Ms. Reynolds became President of Fidelity Pricing and Cash Management Services (FPCMS) in August 2008. Ms. Reynolds served as Chief Operating Officer of FPCMS (2007-2008). Previously, Ms. Reynolds served as President, Treasurer, and Anti-Money Laundering officer of the Fidelity funds (2004-2007). |
Kenneth A. Rathgeber (64) |
| Year of Election or Appointment: 2004 Chief Compliance Officer of Fidelity's Equity and High Income Funds. Mr. Rathgeber is Chief Compliance Officer of Fidelity Management & Research (Hong Kong) Limited (2008-present), Fidelity Management & Research (Japan) Inc. (2008-present), FMR (2005-present), FMR Co., Inc. (2005-present), Fidelity Management & Research (U.K.) Inc. (2005-present), Fidelity Research & Analysis Company (2005-present), Fidelity Investments Money Management, Inc. (2005-present), Pyramis Global Advisors, LLC (2005-present), and Strategic Advisers, Inc. (2005-present). |
Jeffrey S. Christian (50) |
| Year of Election or Appointment: 2009 Deputy Treasurer of the Fidelity funds. Mr. Christian is an employee of Fidelity Investments. Previously, Mr. Christian served as Chief Financial Officer (2008-2009) of certain Fidelity funds and Senior Vice President of Fidelity Pricing and Cash Management Services (FPCMS) (2004-2009). |
Joseph F. Zambello (54) |
| Year of Election or Appointment: 2011 Deputy Treasurer of the Fidelity funds. Mr. Zambello is an employee of Fidelity Investments. Previously, Mr. Zambello served as Vice President of FMR's Program Management Group (2009-2011) and Vice President of the Transfer Agent Oversight Group (2005-2009). |
Adrien E. Deberghes (44) |
| Year of Election or Appointment: 2008 Deputy Treasurer of Fidelity's Equity and High Income Funds. Mr. Deberghes also serves as Vice President and Assistant Treasurer of Fidelity Rutland Square Trust II and Fidelity Commonwealth Trust II (2011-present), Assistant Treasurer of other Fidelity funds (2010-present), and is an employee of Fidelity Investments (2008-present). Previously, Mr. Deberghes served as Senior Vice President of Mutual Fund Administration at State Street Corporation (2007-2008), Senior Director of Mutual Fund Administration at Investors Bank & Trust (2005-2007), and Director of Finance for Dunkin' Brands (2000-2005). |
Stephanie J. Dorsey (42) |
| Year of Election or Appointment: 2010 Assistant Treasurer of Fidelity's Equity and High Income Funds. Ms. Dorsey also serves as Deputy Treasurer of other Fidelity funds (2008-present) and is an employee of Fidelity Investments (2008-present). Previously, Ms. Dorsey served as Treasurer (2004-2008) of the JPMorgan Mutual Funds and Vice President (2004-2008) of JPMorgan Chase Bank. |
John R. Hebble (53) |
| Year of Election or Appointment: 2009 Assistant Treasurer of Fidelity's Equity and High Income Funds. Mr. Hebble also serves as President (2011-present), Treasurer, and Chief Financial Officer of The North Carolina Capital Management Trust: Cash and Term Portfolios (2008-present), President and Treasurer of other Fidelity funds (2008-present) and is an employee of Fidelity Investments. |
Gary W. Ryan (53) |
| Year of Election or Appointment: 2005 Assistant Treasurer of the Fidelity funds. Mr. Ryan is an employee of Fidelity Investments. Previously, Mr. Ryan served as Vice President of Fund Reporting in Fidelity Pricing and Cash Management Services (FPCMS) (1999-2005). |
Jonathan Davis (43) |
| Year of Election or Appointment: 2010 Assistant Treasurer of the Fidelity funds. Mr. Davis is also Assistant Treasurer of Fidelity Rutland Square Trust II and Fidelity Commonwealth Trust II. Mr. Davis is an employee of Fidelity Investments. Previously, Mr. Davis served as Vice President and Associate General Counsel of FMR LLC (2003-2010). |
Annual Report
The Board of Trustees of Fidelity Advisor China Region Fund voted to pay to shareholders of record at the opening of business on record date, the following distributions per share derived from capital gains realized from sales of portfolio securities, and dividends derived from net investment income:
| Pay Date | Record Date | Dividends | Capital Gains |
Class A | 12/05/11 | 12/02/11 | $0.188 | $0.339 |
| | | | |
Class T | 12/05/11 | 12/02/11 | $0.083 | $0.339 |
| | | | |
Class B | 12/05/11 | 12/02/11 | $0.000 | $0.339 |
| | | | |
Class C | 12/05/11 | 12/02/11 | $0.000 | $0.339 |
The fund hereby designates as a capital gain dividend with respect to the taxable year ended October 31, 2011, $30,167,882 or, if subsequently determined to be different, the net capital gain of such year.
Class A designates 55%; Class T designates 62%; Class B designates 100%; and Class C designates 100%; of the dividends distributed in during the fiscal year as amounts which may be taken into account as a dividend for purposes of the maximum rate under section 1(h)(11) of the Internal Revenue Code.
The amounts per share which represent income derived from sources within, and taxes paid to, foreign countries or possessions of the United States are as follows:
| Pay Date | Income | Taxes |
Class A | 12/06/10 | $0.401 | $0.0624 |
| | | |
Class T | 12/06/10 | $0.355 | $0.0624 |
| | | |
Class B | 12/06/10 | $0.169 | $0.0624 |
| | | |
Class C | 12/06/10 | $0.218 | $0.0624 |
The fund will notify shareholders in January 2012 of amounts for use in preparing 2011 income tax returns.
Annual Report
Board Approval of Investment Advisory Contracts and Management Fees
Fidelity China Region Fund
Each year, the Board of Trustees, including the Independent Trustees (together, the Board), votes on the renewal of the management contract and sub-advisory agreements (together, the Advisory Contracts) for the fund. The Board, assisted by the advice of fund counsel and Independent Trustees' counsel, requests and considers a broad range of information relevant to the renewal of the Advisory Contracts throughout the year.
The Board meets regularly and considers at each of its meetings factors that are relevant to its annual consideration of the renewal of the fund's Advisory Contracts, including the services and support provided to the fund and its shareholders. The Board has established various standing committees, each composed of Independent Trustees with varying backgrounds, to which the Board has assigned specific subject matter responsibilities in order to enhance effective decision-making by the Board. The Board, acting directly and through its Committees, requests and receives information concerning the annual consideration of the renewal of the fund's Advisory Contracts. The Board also meets as needed to consider matters specifically related to the Board's annual consideration of the renewal of Advisory Contracts. Members of the Board may also meet with trustees of other Fidelity funds through ad hoc joint committees to discuss certain matters relevant to the Fidelity funds.
At its July 2011 meeting, the Board of Trustees, including the Independent Trustees, unanimously determined to renew the fund's Advisory Contracts. In reaching its determination, the Board considered all factors it believed relevant, including (i) the nature, extent, and quality of the services to be provided to the fund and its shareholders (including the investment performance of the fund); (ii) the competitiveness of the fund's management fee and total expense ratio; (iii) the total costs of the services to be provided by and the profits to be realized by Fidelity from its relationship with the fund; (iv) the extent to which economies of scale would be realized as the fund grows; and (v) whether fee levels reflect these economies of scale, if any, for the benefit of fund shareholders.
In considering whether to renew the Advisory Contracts for the fund, the Board reached a determination, with the assistance of fund counsel and Independent Trustees' counsel and through the exercise of its business judgment, that the renewal of the Advisory Contracts is in the best interests of the fund and its shareholders and that the compensation payable under the Advisory Contracts is fair and reasonable. The Board's decision to renew the Advisory Contracts was not based on any single factor, but rather was based on a comprehensive consideration of all the information provided to the Board at its meetings throughout the year. The Board, in reaching its determination to renew the Advisory Contracts, is aware that shareholders in the fund have a broad range of investment choices available to them, including a wide choice among mutual funds offered by Fidelity's competitors, and that the fund's shareholders, who have the opportunity to review and weigh the disclosure provided by the fund in its prospectus and other public disclosures, have chosen to invest in this fund, managed by Fidelity.
Nature, Extent, and Quality of Services Provided. The Board considered the staffing within the investment adviser, FMR, and the sub-advisers (together, the Investment Advisers), including the backgrounds of the fund's investment personnel and the fund's investment objective and discipline. The Independent Trustees also had discussions with senior management of Fidelity's investment operations and investment groups. The Board considered the structure of the portfolio manager compensation program and whether this structure provides appropriate incentives to act in the best interests of the fund.
Resources Dedicated to Investment Management and Support Services. The Board and the Fund Oversight and Research Committees reviewed the general qualifications and capabilities of the Investment Advisers' investment staff, including its size, education, experience, and resources, as well as the Investment Advisers' approach to recruiting, training, managing, and compensating investment personnel. The Board also noted that FMR has devoted increased resources to non-U.S. offices. The Board noted that Fidelity's analysts have extensive resources, tools and capabilities which allow them to conduct sophisticated quantitative and fundamental analysis, as well as credit analysis of issuers, counterparties and enhancers. The Board also believes that Fidelity's investment professionals have sufficient access to global information and data so as to provide competitive investment results over time, and that those professionals also have access to sophisticated tools which permit them to assess portfolio construction and risk and performance attribution characteristics continuously, as well as to transmit new information and research conclusions rapidly around the world. Additionally, in their deliberations, the Board considered the Investment Advisers' trading capabilities and resources which are an integral part of the investment management process.
Shareholder and Administrative Services. The Board considered (i) the nature, extent, quality, and cost of advisory, administrative, and shareholder services performed by the Investment Advisers and their affiliates under the Advisory Contracts and under separate agreements covering transfer agency, pricing and bookkeeping, and securities lending services for the fund; (ii) the nature and extent of the investment adviser's supervision of third party service providers, principally custodians and subcustodians; and (iii) the resources devoted to, and the record of compliance with, the fund's compliance policies and procedures. The Board also reviewed the allocation of fund brokerage, including allocations to brokers affiliated with the Investment Advisers, the use of brokerage commissions to pay fund expenses, and the use of "soft" commission dollars to pay for research services.
The Board noted that the growth of fund assets over time across the complex allows Fidelity to reinvest in the development of services designed to enhance the value or convenience of the Fidelity funds as investment vehicles. These services include 24-hour access to account information and market information through telephone representatives and over the Internet, investor education materials and asset allocation tools, and the expanded availability of Fidelity Investor Centers, with 35 new branches opening since 2010.
Annual Report
Board Approval of Investment Advisory Contracts and Management Fees - continued
Investment in a Large Fund Family. The Board considered the benefits to shareholders of investing in a Fidelity fund, including the benefits of investing in a fund that is part of a large family of funds offering a variety of investment disciplines and providing a large variety of mutual fund investor services. The Board noted that Fidelity had taken, or had made recommendations that resulted in the Fidelity funds taking, a number of actions over the previous year that benefited particular funds, including (i) continuing to dedicate additional resources to investment research and support of the senior management team that oversees asset management; (ii) rationalizing product lines through the mergers of six funds into other funds; (iii) continuing to migrate the Freedom Funds to dedicated lower cost underlying funds; (iv) obtaining shareholder approval to broaden the investment strategies for Fidelity Consumer Finance Portfolio, Fidelity Emerging Asia Fund, and Fidelity Environment and Alternative Energy Portfolio; (v) contractually agreeing to reduce the management fees and impose other expense limitations on Spartan 500 Index Fund and U.S. Bond Index Fund in connection with launching new institutional classes of these funds; (vi) changing the name, primary and supplemental benchmarks, and investment policies of Fidelity Global Strategies Fund to support the fund's flexible investment mandate and global orientation; and (vii) reducing the transfer agency account fee rates on certain accounts.
Investment Performance. The Board considered whether the fund has operated in accordance with its investment objective, as well as its record of compliance with its investment restrictions. It also reviewed the fund's absolute investment performance for each class, as well as the fund's relative investment performance for each class measured over multiple periods against a broad-based securities market index. The Board noted that FMR does not believe that a meaningful peer group exists against which to compare the fund's performance. The following charts considered by the Board show, over the one-, three-, and five-year periods ended December 31, 2010, as available, the cumulative total returns of the retail class and Class B of the fund and the cumulative total returns of a broad-based securities market index ("benchmark"). The returns of the retail class and Class B show the performance of the highest performing class (based on five-year performance) and the lowest performing class (based on one-year performance), respectively.
Fidelity China Region Fund
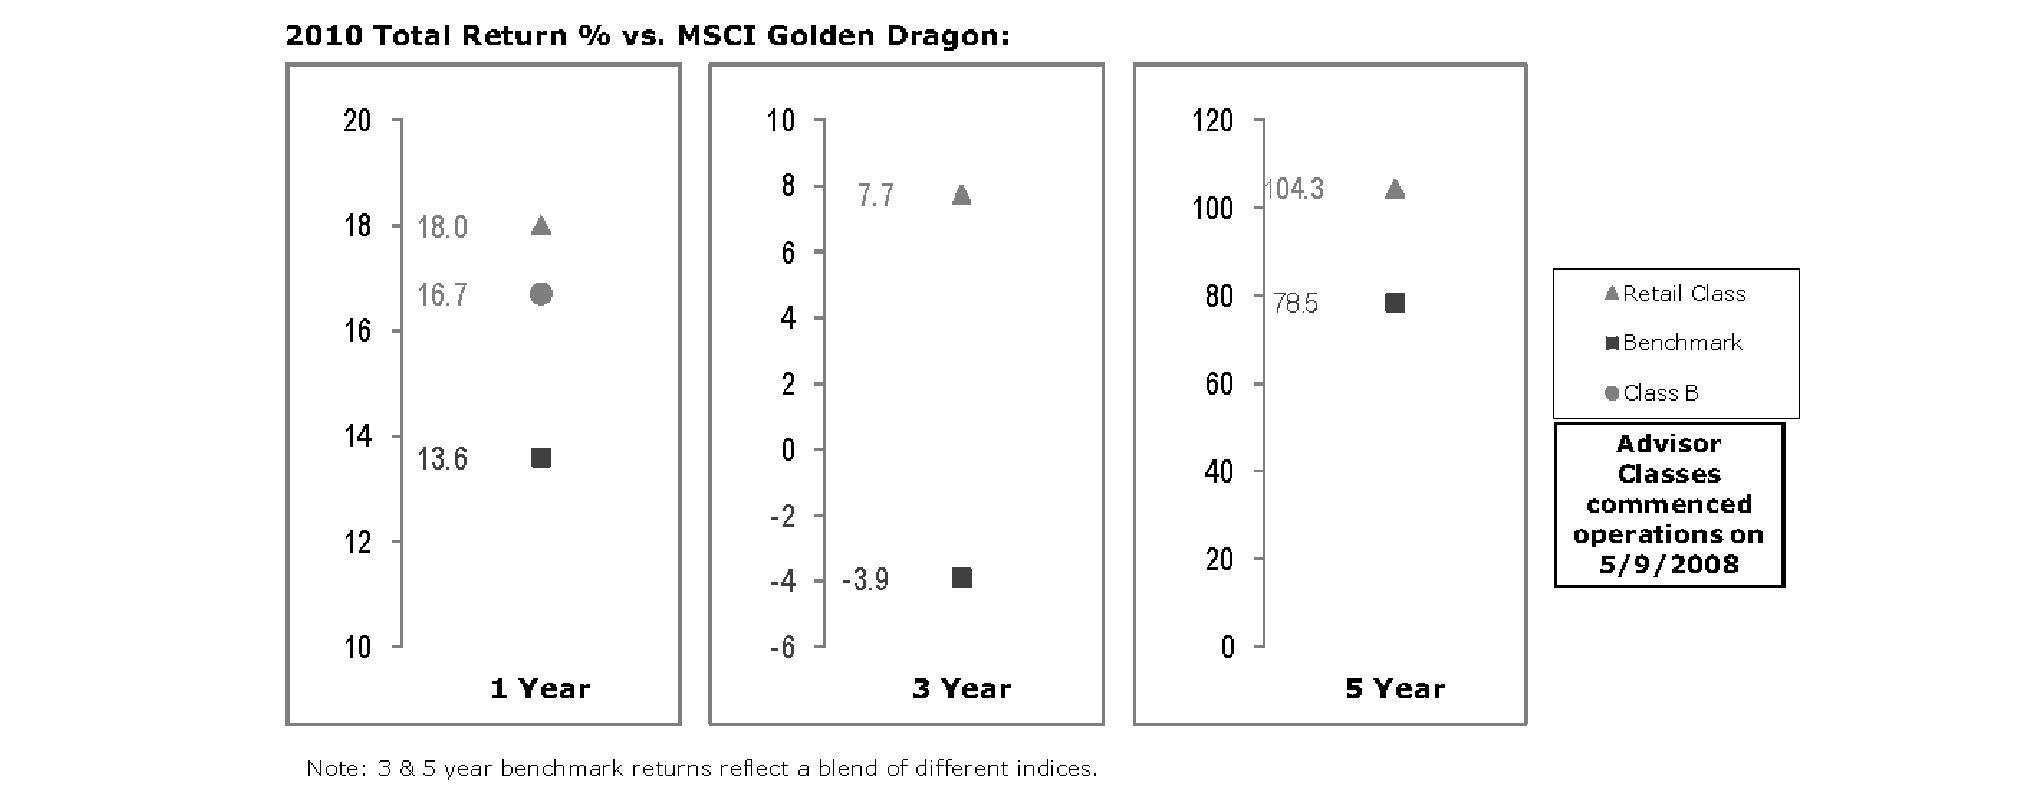
The Board noted that the investment performance of the retail class of the fund compared favorably to its benchmark for all the periods shown. The Board considered that the variations in performance among the fund's classes reflect the variations in class expenses, which result in lower performance for higher expense classes. The Board also reviewed the fund's performance since inception as well as performance in the current year.
Based on its review, the Board concluded that the nature, extent, and quality of services provided to the fund under the Advisory Contracts should benefit the fund's shareholders.
Competitiveness of Management Fee and Total Expense Ratio. The Board considered the fund's management fee and total expense ratio compared to "mapped groups" of competitive funds and classes. Fidelity creates "mapped groups" by combining similar Lipper investment objective categories that have comparable management fee characteristics. Combining Lipper investment objective categories aids the Board's management fee and total expense ratio comparisons by broadening the competitive group used for comparison and by reducing the number of universes to which various Fidelity funds are compared.
Management Fee. The Board considered two proprietary management fee comparisons for the 12-month periods shown in the chart below. The group of Lipper funds used by the Board for management fee comparisons is referred to below as the "Total Mapped Group." The Total Mapped Group comparison focuses on a fund's standing relative to the total universe of comparable funds available to investors in terms of gross management fees before expense reimbursements or caps. "TMG %" represents the percentage of funds in the Total Mapped Group that had management fees that were lower than the fund's. For example, a TMG % of 7% means that 93% of the funds in the Total Mapped Group had higher management fees than the fund. The "Asset-Size Peer Group" (ASPG) comparison focuses on a fund's standing relative to non-Fidelity funds similar in size to the fund within the Total Mapped Group. The ASPG represents at least 15% of the funds in the Total Mapped Group with comparable asset size and management fee characteristics, subject to a minimum of 50 funds (or all funds in the Total Mapped Group if fewer than 50). Additional information, such as the ASPG quartile in which the fund's management fee ranked, is also included in the chart and considered by the Board.
Annual Report
Fidelity China Region Fund

The Board noted that the fund's management fee ranked below the median of its Total Mapped Group and below the median of its ASPG for 2010.
Based on its review, the Board concluded that the fund's management fee is fair and reasonable in light of the services that the fund receives and the other factors considered.
Total Expense Ratio. In its review of each class's total expense ratio, the Board considered the fund's management fee as well as other fund or class expenses, as applicable, such as transfer agent fees, pricing and bookkeeping fees, fund-paid 12b-1 fees, and custodial, legal, and audit fees. The Board also noted the effects of any waivers and reimbursements on fees and expenses. As part of its review, the Board also considered the current and historical total expense ratios of each class of the fund compared to competitive fund median expenses. Each class of the fund is compared to those funds and classes in the Total Mapped Group (used by the Board for management fee comparisons) that have a similar sales load structure.
The Board noted that the total expense ratio of each class ranked below its competitive median for 2010. The Board considered that various factors, including 12b-1 fees, positive or negative performance adjustments, and relatively higher other expenses in the case of small fund size, can affect total expense ratios.
Fees Charged to Other Fidelity Clients. The Board also considered Fidelity fee structures and other information with respect to clients of FMR and its affiliates, such as other mutual funds advised or subadvised by FMR or its affiliates, pension plan clients, and other institutional clients. In March 2010, the Board created an ad hoc joint committee with the board of other Fidelity funds (the Committee) to review and compare Fidelity's institutional investment advisory business with its business of providing services to the Fidelity funds, including the differences in services provided, fees charged, and costs incurred, as well as competition in their respective marketplaces.
Based on its review of total expense ratios and fees charged to other Fidelity clients, the Board concluded that the total expense ratio of each class of the fund was reasonable in light of the services that the fund and its shareholders receive and the other factors considered, including the findings of the Committee.
Costs of the Services and Profitability. The Board considered the revenues earned and the expenses incurred by Fidelity in conducting the business of developing, marketing, distributing, managing, administering and servicing the fund and its shareholders. The Board also considered the level of Fidelity's profits in respect of all the Fidelity funds.
On an annual basis, FMR presents to the Board Fidelity's profitability for the fund. Fidelity calculates the profitability for each fund, as well as aggregate profitability for groups of Fidelity funds and all Fidelity funds, using a series of detailed revenue and cost allocation methodologies which originate with the books and records of Fidelity on which Fidelity's audited financial statements are based. The Audit Committee of the Board reviews any significant changes from the prior year's methodologies.
Annual Report
Board Approval of Investment Advisory Contracts and Management Fees - continued
PricewaterhouseCoopers LLP (PwC), independent registered public accounting firm and auditor to Fidelity and certain Fidelity funds, has been engaged annually by the Board as part of the Board's assessment of Fidelity's profitability analysis. PwC's engagement includes the review and assessment of Fidelity's methodologies used in determining the revenues and expenses attributable to Fidelity's mutual fund business, and completion of agreed-upon procedures surrounding the mathematical accuracy of fund profitability and its conformity to allocation methodologies. After considering PwC's reports issued under the engagement and information provided by Fidelity, the Board concluded that while other allocation methods may also be reasonable, Fidelity's profitability methodologies are reasonable in all material respects.
The Board also reviewed Fidelity's non-fund businesses and fall-out benefits related to the mutual fund business as well as cases where Fidelity's affiliates may benefit from or be related to the fund's business.
The Board considered the costs of the services provided by and the profits realized by Fidelity in connection with the operation of the fund and was satisfied that the profitability was not excessive in the circumstances.
Economies of Scale. The Board considered whether there have been economies of scale in respect of the management of the Fidelity funds, whether the Fidelity funds (including the fund) have appropriately benefited from any such economies of scale, and whether there is potential for realization of any further economies of scale. The Board considered the extent to which the fund will benefit from economies of scale through increased services to the fund, through waivers or reimbursements, or through fee or expense reductions. The Board also noted that in 2009, it and the board of other Fidelity funds created an ad hoc committee (the Economies of Scale Committee) to analyze whether FMR attains economies of scale in respect of the management and servicing of the Fidelity funds, whether the Fidelity funds have appropriately benefited from such economies of scale, and whether there is potential for realization of any further economies of scale.
The Board recognized that the fund's management contract incorporates a "group fee" structure, which provides for lower group fee rates as total fund assets under FMR's management increase, and for higher group fee rates as total fund assets under FMR's management decrease. FMR calculates the group fee rates based on a tiered asset "breakpoint" schedule that varies based on asset class. The Board considered that the group fee is designed to deliver the benefits of economies of scale to fund shareholders when total Fidelity fund assets increase, even if assets of any particular fund are unchanged or have declined, because some portion of Fidelity's costs are attributable to services provided to all Fidelity funds, and all funds benefit if those costs can be allocated among more assets. The Board concluded that, given the group fee structure, fund shareholders will benefit from lower management fees as assets under FMR's management increase at the fund complex level, regardless of whether Fidelity achieves any such economies of scale.
The Board concluded, taking into account the analysis of the Economies of Scale Committee, that any potential economies of scale are being appropriately shared between fund shareholders and Fidelity.
Additional Information Requested by the Board. In order to develop fully the factual basis for consideration of the Fidelity funds' Advisory Contracts, the Board requested and received additional information on certain topics, including (i) fund performance trends, actions to be taken by FMR to improve certain funds' overall performance, and Fidelity's long-term strategies for certain funds; (ii) portfolio manager changes that have occurred during the past year and length of portfolio manager tenure for different categories of funds over time; (iii) Fidelity's compensation structure for portfolio managers and other key personnel and strategies for attracting and retaining non-investment personnel; (iv) the amount of the investment that each portfolio manager has made in the Fidelity fund(s) that he or she manages; (v) historical trends in Fidelity's realization of fall-out benefits; (vi) Fidelity's group fee structures and the rationale for the individual fee rates of certain funds; (vii) fund profitability methodology and the impact of certain factors on fund profitability results; (viii) trends regarding industry use of performance fee structures and Fidelity's compliance practices with respect to performance adjustment calculations; (ix) the fee structures in place for certain other Fidelity clients; and (x) explanations regarding the relative total expense ratios of certain funds and classes, total expense competitive trends, and actions that might be taken by FMR to reduce total expense ratios for certain funds and classes.
Based on its evaluation of all of the conclusions noted above, and after considering all factors it believed relevant, the Board ultimately concluded that the advisory fee structures are fair and reasonable, and that the fund's Advisory Contracts should be renewed.
Annual Report
Annual Report
Investment Adviser
Fidelity Management & Research Company
Boston, MA
Investment Sub-Advisers
FMR Co., Inc.
Fidelity Management & Research
(U.K.) Inc.
FIL Investments (Japan) Limited
FIL Investment Advisors
FIL Investment Advisors
(UK) Limited
Fidelity Management & Research
(Japan) Inc.
Fidelity Management & Research
(Hong Kong) Limited
General Distributor
Fidelity Distributors Corporation
Boston, MA
Transfer and Service Agents
Fidelity Investments Institutional
Operations Company, Inc.
Boston, MA
Fidelity Service Company, Inc.
Boston, MA
Custodian
Brown Brothers Harriman & Co.,
Boston, MA

AHKC-UANN-1211
1.861458.103
Fidelity Advisor®
China Region Fund -
Institutional Class
Annual Report
October 31, 2011
Institutional Class is a class of
Fidelity® China Region Fund

Contents
Chairman's Message | (Click Here) | The Chairman's message to shareholders. |
Performance | (Click Here) | How the fund has done over time. |
Management's Discussion of Fund Performance | (Click Here) | The Portfolio Manager's review of fund performance and strategy. |
Shareholder Expense Example | (Click Here) | An example of shareholder expenses. |
Investment Changes | (Click Here) | A summary of major shifts in the fund's investments over the past six months. |
Investments | (Click Here) | A complete list of the fund's investments with their market values. |
Financial Statements | (Click Here) | Statements of assets and liabilities, operations, and changes in net assets, as well as financial highlights. |
Notes | (Click Here) | Notes to the financial statements. |
Report of Independent Registered Public Accounting Firm | (Click Here) | |
Trustees and Officers | (Click Here) | |
Distributions | (Click Here) | |
Board Approval of Investment Advisory Contracts and Management Fees | (Click Here) | |
To view a fund's proxy voting guidelines and proxy voting record for the 12-month period ended June 30, visit http://www.fidelity.com/proxyvotingresults or visit the Securities and Exchange Commission's (SEC) web site at http://www.sec.gov. You may also call 1-877-208-0098 to request a free copy of the proxy voting guidelines.
Standard & Poor's, S&P and S&P 500 are registered service marks of The McGraw-Hill Companies, Inc. and have been licensed for use by Fidelity Distributors Corporation.
Other third party marks appearing herein are the property of their respective owners.
All other marks appearing herein are registered or unregistered trademarks or service marks of FMR LLC or an affiliated company.
This report and the financial statements contained herein are submitted for the general information of the shareholders of the fund. This report is not authorized for distribution to prospective investors in the fund unless preceded or accompanied by an effective prospectus.
A fund files its complete schedule of portfolio holdings with the SEC for the first and third quarters of each fiscal year on Form N-Q. Forms N-Q are available on the SEC's web site at http://www.sec.gov. A fund's Forms N-Q may be reviewed and copied at the SEC's Public Reference Room in Washington, DC. Information regarding the operation of the SEC's Public Reference Room may be obtained by calling 1-800-SEC-0330. For a complete list of a fund's portfolio holdings, view the most recent holdings listing, semiannual report, or annual report on Fidelity's web site at http://www.fidelity.com, http://www.advisor.fidelity.com, or http://www.401k.com, as applicable.
NOT FDIC INSURED • MAY LOSE VALUE • NO BANK GUARANTEE
Neither the fund nor Fidelity Distributors Corporation is a bank.
Annual Report
Dear Shareholder:
(The Acting Chairman's photo appears here.)
Global equity markets began the fourth quarter on a strong note, sharply reversing course in October amid strong corporate earnings, better-than-expected economic news and the promise of a resolution to the sovereign debt crisis in Europe. The mini rally followed a third quarter marked by a significant downturn in July and August, which heightened investor anxiety and set off a wave of volatility that hampered most major asset classes through the end of September. Financial markets are difficult to predict, of course, but you can help put the odds in your favor by following these time-tested investment principles.
One of the basic tenets is to invest according to your time horizon. For long-term investors, riding out the markets' inevitable ups and downs has proven much more effective than making decisions based on short-term developments. If your goal is approaching, you can also benefit from patience and restraint, rather than attempting to time the market. No matter your time horizon, missing only a few of the markets' best days can significantly diminish returns. Patience also affords the benefits of compounding - earning interest on additional income or reinvested dividends and capital gains. While staying the course doesn't eliminate risk, it can considerably lessen the negative impact of short-term downturns.
Asset allocation is another principle to manage risk. As you spread your portfolio among the asset classes, be sure to consider your time horizon, risk tolerance and investment objectives. Younger investors may be better served by emphasizing equities, which historically have been the best-performing asset class over time. Investors who are nearing a specific goal, such as retirement or sending a child to college, may choose to favor bonds and other investments that have tended to be more stable. Studies indicate that asset allocation is the single most important determinant of a portfolio's long-term success. After deciding on a suitable allocation strategy, make sure your portfolio is adequately diversified, with exposure to stocks of small-, mid- and large-cap companies in a range of sectors, for example. And today, more than ever, geographic diversification should be taken into account.
Lastly, investing a certain amount of money on a regular basis - a principle known as dollar-cost averaging - can help lower the average cost of your purchases, while also giving you the discipline to avoid selling weak performers just prior to an upswing, or chasing a hot performer just before a correction.
We invite you to learn more by visiting us on the Internet, dropping by one of our Investor Centers or calling us by phone. It is our privilege to provide the resources you need to choose investments that are right for you.
Sincerely,
(The Acting Chairman's signature appears here.)
James C. Curvey
Acting Chairman
Annual Report
Performance: The Bottom Line
Average annual total return reflects the change in the value of an investment, assuming reinvestment of the class' distributions from dividend income and capital gains (the profits earned upon the sale of securities that have grown in value, if any) and assuming a constant rate of performance each year. The $10,000 table and the fund's returns do not reflect the deduction of taxes that a shareholder would pay on fund distributions or the redemption of fund shares. During periods of reimbursement by Fidelity, a fund's total return will be greater than it would be had the reimbursement not occurred. How a fund did yesterday is no guarantee of how it will do tomorrow.
Average Annual Total Returns
Periods ended October 31, 2011 | Past 1
year | Past 5
years | Past 10
years |
Institutional Class A | -12.56% | 7.76% | 12.27% |
A The initial offering of Institutional Class shares took place on May 9, 2008. Returns prior to May 9, 2008 are those of Fidelity® China Region Fund, the original class of the fund.
$10,000 Over 10 Years
Let's say hypothetically that $10,000 was invested in Fidelity Advisor® China Region Fund - Institutional Class on October 31, 2001. The chart shows how the value of your investment would have changed, and also shows how the MSCI® Golden Dragon Index performed over the same period. The initial offering of Institutional Class took place on May 9, 2008. See above for additional information regarding the performance of Institutional Class.
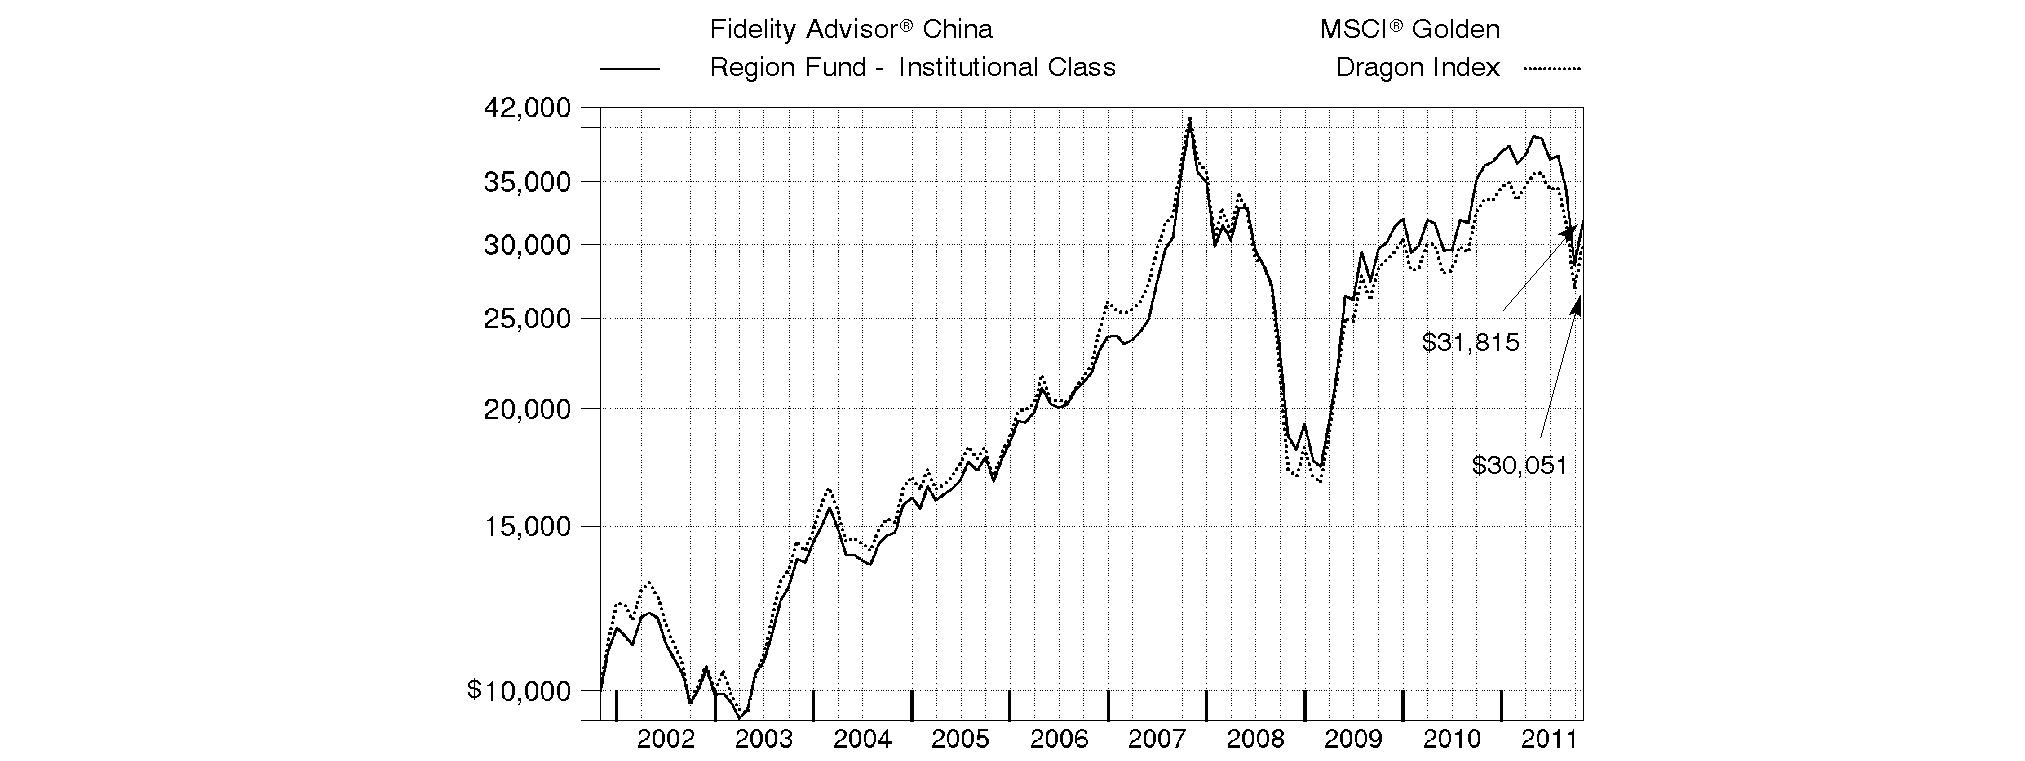
Annual Report
Market Recap: Emerging-markets stocks concluded the 12-month period ending October 31, 2011, on a strong note, reversing direction in October amid hope for a resolution to the sovereign debt crisis in Europe. The brief rally, on top of a robust first half of the period, could only partially offset the negative impact of a five-month downturn that began in May and intensified in August and September, as investors began to flee riskier securities due to the debt debacle, concern the U.S. economy may contract and worry about a significant slowdown in China. For the year, the MSCI® Emerging Markets Index declined 7.44%, hampered in part by global currency fluctuation. The index gained roughly 13% in October, after falling 9% in August and about 15% in September. For the full year, returns across the individual country components of the emerging-markets index were decidedly negative. Several of the largest countries in the index struggled, especially India (-20%), China (-17%) and Brazil (-12%), as did Turkey (-34%). Conversely, South Korea had the strongest result, gaining about 7%, while another sizable index component, Russia, returned roughly 1%. Smaller constituents Indonesia (+5%) and Malaysia (+4%) also finished in positive territory. A trio of countries had negative returns but outpaced the index: Mexico (-1%), Taiwan (-2%) and South Africa (-3%).
Comments from Joseph Tse, Portfolio Manager of Fidelity Advisor® China Region Fund for most of the period covered by this report: For the year, the fund's Institutional Class shares returned -12.56%, versus -10.33% for the MSCI® Golden Dragon Index. Stock selection and unrewarding industry weightings in financials hurt relative performance the most, followed by weak positioning in consumer staples and an underweighting in utilities. Geographically, stock picking in Hong Kong significantly curbed our results. Hong Kong Exchanges & Clearing, the fund's biggest relative detractor and one of its largest positions during the period, was hampered by the China region's weak markets and low trading volume. Bank of China (Hong Kong) and China Merchants Bank - the latter of which I sold - were two lagging bank holdings that hurt. Underweighting and eventually selling power utility CLP Holdings, a strong-performing Hong Kong-based benchmark component, detracted, as did scant exposure to Taiwanese integrated telecommunication services provider Chunghwa Telecom. Conversely, stock selection in technology added value, as did positioning in consumer discretionary and industrials. The fund's modest cash position also provided a lift. Geographically, security selection in China bolstered performance. Overweighting Taiwan-based handset maker HTC - the fund's top contributor - was timely. The stock bucked the downward market trend, riding the popularity of high-end smartphones designed to run Google's popular AndroidTM operating system. Hong Kong-based casino operator SJM Holdings and China Unicom (Hong Kong), an integrated telecom services provider, also contributed.
Notes to shareholders: Fidelity Advisor China Region Fund may invest up to 35% of its total assets in any industry that represents more than 20% of the Hong Kong, Taiwanese and Chinese market. As of October 31, 2011, the fund did not have more than 25% of its total assets invested in any one industry.
Robert Bao became Portfolio Manager of the fund on October 1, 2011.
The views expressed above reflect those of the portfolio manager(s) only through the end of the period as stated on the cover of this report and do not necessarily represent the views of Fidelity or any other person in the Fidelity organization. Any such views are subject to change at any time based upon market or other conditions and Fidelity disclaims any responsibility to update such views. These views may not be relied on as investment advice and, because investment decisions for a Fidelity fund are based on numerous factors, may not be relied on as an indication of trading intent on behalf of any Fidelity fund.
Annual Report
Fidelity China Region Fund
As a shareholder of the Fund, you incur two types of costs: (1) transaction costs, including sales charges (loads) on purchase payments or redemption proceeds, redemption fees, and (2) ongoing costs, including management fees, distribution and/or service (12b-1) fees and other Fund expenses. This Example is intended to help you understand your ongoing costs (in dollars) of investing in the Fund and to compare these costs with the ongoing costs of investing in other mutual funds.
The Example is based on an investment of $1,000 invested at the beginning of the period and held for the entire period (May 1, 2011 to October 31, 2011).
Actual Expenses
The first line of the accompanying table for each class of the Fund provides information about actual account values and actual expenses. You may use the information in this line, together with the amount you invested, to estimate the expenses that you paid over the period. Simply divide your account value by $1,000.00 (for example, an $8,600 account value divided by $1,000.00 = 8.6), then multiply the result by the number in the first line for a class of the Fund under the heading entitled "Expenses Paid During Period" to estimate the expenses you paid on your account during this period. A small balance maintenance fee of $12.00 that is charged once a year may apply for certain accounts with a value of less than $2,000. This fee is not included in the table below. If it was, the estimate of expenses you paid during the period would be higher, and your ending account value lower, by this amount. In addition, the Fund, as a shareholder in the underlying Fidelity Central Funds, will indirectly bear its pro-rata share of the fees and expenses incurred by the underlying Fidelity Central Funds. These fees and expenses are not included in the Fund's annualized expense ratio used to calculate the expense estimate in the table below.
Hypothetical Example for Comparison Purposes
The second line of the accompanying table for each class of the Fund provides information about hypothetical account values and hypothetical expenses based on a Class' actual expense ratio and an assumed rate of return of 5% per year before expenses, which is not the Class' actual return. The hypothetical account values and expenses may not be used to estimate the actual ending account balance or expenses you paid for the period. You may use this information to compare the ongoing costs of investing in the Fund and other funds. To do so, compare this 5% hypothetical example with the 5% hypothetical examples that appear in the shareholder reports of the other funds. A small balance maintenance fee of $12.00 that is charged once a year may apply for certain accounts with a value of less than $2,000. This fee is not included in the table below. If it was, the estimate of expenses you paid during the period would be higher, and your ending account value lower, by this amount. In addition, the Fund, as a shareholder in the underlying Fidelity Central Funds, will indirectly bear its pro-rata share of the fees and expenses incurred by the underlying Fidelity Central Funds. These fees and expenses are not included in the Fund's annualized expense ratio used to calculate the expense estimate in the table below.
Please note that the expenses shown in the table are meant to highlight your ongoing costs only and do not reflect any transaction costs. Therefore, the second line of the table is useful in comparing ongoing costs only, and will not help you determine the relative total costs of owning different funds. In addition, if these transactional costs were included, your costs would have been higher.
| Annualized
Expense Ratio | Beginning
Account Value
May 1, 2011 | Ending
Account Value
October 31, 2011 | Expenses Paid
During Period*
May 1, 2011 to
October 31, 2011 |
Class A | 1.36% | | | |
Actual | | $ 1,000.00 | $ 813.10 | $ 6.22 |
HypotheticalA | | $ 1,000.00 | $ 1,018.35 | $ 6.92 |
Class T | 1.63% | | | |
Actual | | $ 1,000.00 | $ 812.00 | $ 7.44 |
HypotheticalA | | $ 1,000.00 | $ 1,016.99 | $ 8.29 |
Class B | 2.11% | | | |
Actual | | $ 1,000.00 | $ 810.00 | $ 9.63 |
HypotheticalA | | $ 1,000.00 | $ 1,014.57 | $ 10.71 |
Class C | 2.11% | | | |
Actual | | $ 1,000.00 | $ 810.00 | $ 9.63 |
HypotheticalA | | $ 1,000.00 | $ 1,014.57 | $ 10.71 |
China Region | 1.04% | | | |
Actual | | $ 1,000.00 | $ 814.30 | $ 4.76 |
HypotheticalA | | $ 1,000.00 | $ 1,019.96 | $ 5.30 |
Institutional Class | 1.05% | | | |
Actual | | $ 1,000.00 | $ 814.10 | $ 4.80 |
HypotheticalA | | $ 1,000.00 | $ 1,019.91 | $ 5.35 |
A 5% return per year before expenses
* Expenses are equal to each Class' annualized expense ratio, multiplied by the average account value over the period, multiplied by 184/365 (to reflect the one-half year period).
Annual Report
Fidelity China Region Fund
Investment Changes (Unaudited)
Geographic Diversification (% of fund's net assets) |
As of October 31, 2011 |
 | Hong Kong | 32.9% | |
 | China | 28.9% | |
 | Taiwan | 19.6% | |
 | Cayman Islands | 10.1% | |
 | Bermuda | 2.6% | |
 | United States of America | 1.1% | |
 | Australia | 1.0% | |
 | Japan | 0.9% | |
 | Korea (South) | 0.7% | |
 | Other | 2.2% | |

Percentages are adjusted for the effect of futures contracts, if applicable. |
As of April 30, 2011 |
| Hong Kong | 32.7% | |
| China | 24.3% | |
| Taiwan | 23.1% | |
| Cayman Islands | 8.3% | |
| Bermuda | 5.5% | |
| United States of America | 1.9% | |
| United Kingdom | 1.6% | |
| Japan | 1.3% | |
| Australia | 1.1% | |
| Other | 0.2% | |

Percentages are adjusted for the effect of futures contracts, if applicable. |
Asset Allocation |
| % of fund's
net assets | % of fund's net assets
6 months ago |
Stocks | 98.9 | 98.4 |
Short-Term Investments and Net Other Assets | 1.1 | 1.6 |
Top Ten Stocks as of October 31, 2011 |
| % of fund's
net assets | % of fund's net assets
6 months ago |
Industrial & Commercial Bank of China Ltd. (H Shares) (Commercial Banks) | 6.0 | 3.6 |
Taiwan Semiconductor Manufacturing Co. Ltd. (Semiconductors & Semiconductor Equipment) | 5.5 | 3.5 |
China Construction Bank Corp. (H Shares) (Commercial Banks) | 3.5 | 3.1 |
Hutchison Whampoa Ltd. (Industrial Conglomerates) | 3.4 | 2.0 |
PetroChina Co. Ltd. (H Shares) (Oil, Gas & Consumable Fuels) | 2.9 | 1.6 |
China Mobile (Hong Kong) Ltd. (Wireless Telecommunication Services) | 2.9 | 1.3 |
AIA Group Ltd. (Insurance) | 2.6 | 0.0 |
BOC Hong Kong (Holdings) Ltd. (Commercial Banks) | 2.5 | 3.0 |
Cheung Kong Holdings Ltd. (Real Estate Management & Development) | 2.2 | 2.1 |
Hang Seng Bank Ltd. (Commercial Banks) | 2.1 | 1.8 |
| 33.6 | |
Market Sectors as of October 31, 2011 |
| % of fund's
net assets | % of fund's net assets
6 months ago |
Financials | 36.0 | 39.7 |
Information Technology | 15.7 | 16.8 |
Materials | 9.8 | 8.0 |
Consumer Discretionary | 9.3 | 10.0 |
Energy | 8.8 | 8.0 |
Telecommunication Services | 7.0 | 5.4 |
Industrials | 6.7 | 7.6 |
Consumer Staples | 4.5 | 2.3 |
Utilities | 0.8 | 0.6 |
Health Care | 0.3 | 0.0 |
Annual Report
Fidelity China Region Fund
Investments October 31, 2011
Showing Percentage of Net Assets
Common Stocks - 98.9% |
| Shares | | Value |
CONSUMER DISCRETIONARY - 9.3% |
Automobiles - 0.3% |
Kia Motors Corp. | 70,970 | | $ 4,533,047 |
Qingling Motors Co. Ltd. (H Shares) | 2,158,000 | | 593,524 |
| | 5,126,571 |
Distributors - 0.4% |
Silver Base Group Holdings Ltd. | 5,369,000 | | 5,717,928 |
Diversified Consumer Services - 0.5% |
New Oriental Education & Technology Group, Inc. sponsored ADR (a) | 265,164 | | 7,859,461 |
Hotels, Restaurants & Leisure - 1.1% |
Sands China Ltd. (a) | 4,103,600 | | 12,332,089 |
SJM Holdings Ltd. | 2,601,000 | | 4,458,256 |
| | 16,790,345 |
Media - 0.7% |
Television Broadcasts Ltd. | 1,977,000 | | 11,392,275 |
Multiline Retail - 2.5% |
Far East Department Stores Co. Ltd. | 7,497,311 | | 11,462,779 |
Golden Eagle Retail Group Ltd. (H Shares) | 4,124,000 | | 10,364,374 |
Lifestyle International Holdings Ltd. | 6,221,500 | | 16,655,201 |
| | 38,482,354 |
Specialty Retail - 3.2% |
Belle International Holdings Ltd. | 13,240,000 | | 25,966,643 |
China ZhengTong Auto Services Holdings Ltd. | 5,181,000 | | 5,610,053 |
Chow Sang Sang Holdings International Ltd. | 1,016,000 | | 3,133,570 |
Emperor Watch & Jewellery Ltd. | 49,570,000 | | 8,069,752 |
Luk Fook Holdings International Ltd. | 1,332,000 | | 5,710,818 |
| | 48,490,836 |
Textiles, Apparel & Luxury Goods - 0.6% |
International Taifeng Holdings Ltd. | 1,906,000 | | 890,781 |
Prada SpA | 1,777,600 | | 8,787,483 |
| | 9,678,264 |
TOTAL CONSUMER DISCRETIONARY | | 143,538,034 |
CONSUMER STAPLES - 4.5% |
Beverages - 1.6% |
Tsingtao Brewery Co. Ltd. (H Shares) | 1,270,000 | | 6,458,132 |
Wuliangye Yibin Co. Ltd. (BNP Paribas Warrant Program) warrants 5/5/15 (a) | 1,351,900 | | 7,718,970 |
Yantai Changyu Pioneer Wine Co. (B Shares) | 922,108 | | 10,374,625 |
| | 24,551,727 |
Food & Staples Retailing - 2.1% |
China Resources Enterprise Ltd. | 4,050,000 | | 14,790,795 |
Dairy Farm International Holdings Ltd. | 1,778,200 | | 14,408,234 |
President Chain Store Corp. | 601,000 | | 3,342,003 |
| | 32,541,032 |
|
| Shares | | Value |
Food Products - 0.8% |
China Mengniu Dairy Co. Ltd. | 1,368,000 | | $ 4,359,125 |
Uni-President China Holdings Ltd. | 12,383,000 | | 7,359,931 |
| | 11,719,056 |
TOTAL CONSUMER STAPLES | | 68,811,815 |
ENERGY - 8.8% |
Energy Equipment & Services - 0.4% |
China Oilfield Services Ltd. (H Shares) | 3,520,000 | | 5,863,167 |
Oil, Gas & Consumable Fuels - 8.4% |
China Petroleum & Chemical Corp. (H Shares) | 26,838,000 | | 25,381,510 |
China Shenhua Energy Co. Ltd. (H Shares) | 3,600,500 | | 16,471,539 |
CNOOC Ltd. | 13,661,000 | | 25,824,205 |
CNPC (Hong Kong) Ltd. | 13,232,000 | | 18,535,159 |
PetroChina Co. Ltd. (H Shares) | 34,272,000 | | 44,491,660 |
| | 130,704,073 |
TOTAL ENERGY | | 136,567,240 |
FINANCIALS - 36.0% |
Capital Markets - 0.6% |
Wuliangye Yibin Co. Ltd. (UBS Warrant Programme) warrants 4/22/13 (a) | 345,100 | | 1,970,424 |
Yuanta Financial Holding Co. Ltd. | 13,890,525 | | 7,918,254 |
| | 9,888,678 |
Commercial Banks - 18.9% |
Agricultural Bank China Ltd. (H Shares) | 43,876,000 | | 19,692,247 |
BOC Hong Kong (Holdings) Ltd. | 16,572,000 | | 39,407,649 |
China Construction Bank Corp. (H Shares) | 73,095,000 | | 53,705,474 |
Chinatrust Financial Holding Co. Ltd. | 34,785,446 | | 22,798,274 |
Hang Seng Bank Ltd. | 2,488,800 | | 32,091,693 |
Industrial & Commercial Bank of China Ltd. (H Shares) | 147,535,000 | | 92,130,181 |
Mega Financial Holding Co. Ltd. | 20,451,340 | | 15,720,889 |
Standard Chartered PLC (United Kingdom) | 362,520 | | 8,506,038 |
Wing Hang Bank Ltd. | 904,500 | | 8,168,379 |
| | 292,220,824 |
Diversified Financial Services - 1.1% |
Hong Kong Exchanges and Clearing Ltd. | 1,008,200 | | 17,090,902 |
Insurance - 7.0% |
AIA Group Ltd. | 12,948,000 | | 39,591,604 |
Cathay Financial Holding Co. Ltd. | 8,847,248 | | 10,550,709 |
China Life Insurance Co. Ltd. (H Shares) | 10,723,000 | | 27,723,214 |
Ping An Insurance Group Co. China Ltd. (H Shares) | 4,035,000 | | 29,925,173 |
| | 107,790,700 |
Real Estate Management & Development - 8.4% |
Cheung Kong Holdings Ltd. | 2,726,000 | | 33,791,308 |
Common Stocks - continued |
| Shares | | Value |
FINANCIALS - continued |
Real Estate Management & Development - continued |
China Overseas Land & Investment Ltd. | 9,146,000 | | $ 16,923,669 |
Kerry Properties Ltd. | 2,323,500 | | 8,527,084 |
Sun Hung Kai Properties Ltd. | 2,215,000 | | 30,497,845 |
Swire Pacific Ltd. (A Shares) | 1,300,000 | | 15,022,234 |
Wharf Holdings Ltd. | 4,624,000 | | 24,596,195 |
| | 129,358,335 |
TOTAL FINANCIALS | | 556,349,439 |
HEALTH CARE - 0.3% |
Pharmaceuticals - 0.3% |
China Medical System Holding Ltd. | 6,564,000 | | 4,819,634 |
INDUSTRIALS - 6.7% |
Airlines - 0.1% |
China Southern Airlines Ltd. (H Shares) (a) | 4,400,000 | | 2,455,465 |
Construction & Engineering - 0.9% |
China Communications Construction Co. Ltd. (H Shares) | 4,803,000 | | 3,622,694 |
China State Construction International Holdings Ltd. | 13,696,000 | | 10,548,476 |
| | 14,171,170 |
Industrial Conglomerates - 3.9% |
Hutchison Whampoa Ltd. | 5,748,000 | | 52,573,759 |
Shun Tak Holdings Ltd. | 15,278,000 | | 7,097,500 |
| | 59,671,259 |
Machinery - 0.8% |
Airtac International Group | 452,000 | | 2,529,876 |
China International Marine Containers (Group) Ltd. (B Shares) | 3,903,787 | | 4,699,480 |
China Yuchai International Ltd. | 126,300 | | 1,919,760 |
Sany Heavy Equipment International Holdings Co. Ltd. | 1,975,000 | | 1,739,972 |
Shanghai Zhenhua Port Machinery Co. Ltd. (B Shares) (a) | 1,664,991 | | 861,259 |
| | 11,750,347 |
Road & Rail - 0.5% |
MTR Corp. Ltd. | 2,265,000 | | 7,311,372 |
Transportation Infrastructure - 0.5% |
Jiangsu Expressway Co. Ltd. (H Shares) | 9,140,000 | | 7,877,871 |
TOTAL INDUSTRIALS | | 103,237,484 |
INFORMATION TECHNOLOGY - 15.7% |
Communications Equipment - 1.7% |
AAC Acoustic Technology Holdings, Inc. | 3,480,000 | | 7,965,765 |
HTC Corp. | 469,750 | | 10,556,952 |
ZTE Corp. (H Shares) | 2,745,200 | | 7,792,522 |
| | 26,315,239 |
|
| Shares | | Value |
Computers & Peripherals - 0.7% |
Lenovo Group Ltd. | 11,080,000 | | $ 7,449,133 |
Quanta Computer, Inc. | 1,391,000 | | 2,737,265 |
| | 10,186,398 |
Electronic Equipment & Components - 3.0% |
Chroma ATE, Inc. | 1,938,000 | | 3,866,724 |
Delta Electronics, Inc. | 1,475,000 | | 3,468,088 |
Foxconn International Holdings Ltd. (a) | 5,582,000 | | 3,738,843 |
Hon Hai Precision Industry Co. Ltd. (Foxconn) | 9,030,589 | | 24,756,253 |
Largan Precision Co. Ltd. | 156,000 | | 3,487,580 |
Unimicron Technology Corp. | 5,139,000 | | 6,672,696 |
| | 45,990,184 |
Internet Software & Services - 3.6% |
Baidu.com, Inc. sponsored ADR (a) | 143,900 | | 20,171,902 |
Qihoo 360 Technology Co. Ltd. ADR (d) | 250,400 | | 5,060,584 |
Tencent Holdings Ltd. | 1,317,900 | | 30,479,837 |
| | 55,712,323 |
Semiconductors & Semiconductor Equipment - 6.7% |
ASM Pacific Technology Ltd. | 283,900 | | 3,117,474 |
Hynix Semiconductor, Inc. | 286,800 | | 5,782,401 |
MediaTek, Inc. | 372,000 | | 3,903,867 |
Spreadtrum Communications, Inc. ADR (d) | 242,900 | | 6,453,853 |
Taiwan Semiconductor Manufacturing Co. Ltd. | 34,656,796 | | 84,454,335 |
| | 103,711,930 |
TOTAL INFORMATION TECHNOLOGY | | 241,916,074 |
MATERIALS - 9.8% |
Chemicals - 5.4% |
Formosa Chemicals & Fibre Corp. | 5,245,000 | | 15,179,377 |
Formosa Plastics Corp. | 10,557,250 | | 31,049,842 |
Incitec Pivot Ltd. | 1,375,004 | | 4,980,927 |
Nan Ya Plastics Corp. | 6,290,000 | | 14,150,148 |
Petronas Chemicals Group Bhd | 2,305,100 | | 4,808,734 |
PTT Global Chemical PCL (For. Reg.) (a) | 2,728,458 | | 5,753,520 |
Taiwan Fertilizer Co. Ltd. | 3,015,000 | | 7,770,996 |
| | 83,693,544 |
Construction Materials - 2.0% |
Anhui Conch Cement Co. Ltd. (H Shares) | 5,724,000 | | 20,813,948 |
China Resources Cement Holdings Ltd. | 4,942,000 | | 3,921,522 |
Taiwan Cement Corp. | 4,629,000 | | 5,781,070 |
| | 30,516,540 |
Metals & Mining - 2.4% |
Angang Steel Co. Ltd. (H Shares) | 14,518,000 | | 8,857,733 |
Kingsgate Consolidated NL | 1,376,993 | | 10,857,319 |
Maanshan Iron & Steel Ltd. (H Shares) | 13,770,000 | | 4,099,723 |
Common Stocks - continued |
| Shares | | Value |
MATERIALS - continued |
Metals & Mining - continued |
United Co. RUSAL Ltd. (a) | 6,434,000 | | $ 5,866,364 |
Zhaojin Mining Industry Co. Ltd. (H Shares) | 4,104,500 | | 7,328,110 |
| | 37,009,249 |
TOTAL MATERIALS | | 151,219,333 |
TELECOMMUNICATION SERVICES - 7.0% |
Diversified Telecommunication Services - 3.2% |
China Telecom Corp. Ltd. (H Shares) | 12,082,000 | | 7,459,515 |
China Unicom (Hong Kong) Ltd. | 14,148,000 | | 28,446,195 |
Chunghwa Telecom Co. Ltd. | 4,050,000 | | 13,549,803 |
| | 49,455,513 |
Wireless Telecommunication Services - 3.8% |
China Mobile (Hong Kong) Ltd. | 4,658,500 | | 44,275,976 |
SOFTBANK CORP. | 440,400 | | 14,295,291 |
| | 58,571,267 |
TOTAL TELECOMMUNICATION SERVICES | | 108,026,780 |
UTILITIES - 0.8% |
Electric Utilities - 0.6% |
Power Assets Holdings Ltd. | 1,173,500 | | 8,917,203 |
Independent Power Producers & Energy Traders - 0.2% |
China Resources Power Holdings Co. Ltd. | 2,084,000 | | 3,701,297 |
TOTAL UTILITIES | | 12,618,500 |
TOTAL COMMON STOCKS (Cost $1,352,590,394) | 1,527,104,333 |
Money Market Funds - 1.5% |
| Shares | | Value |
Fidelity Cash Central Fund, 0.12% (b) | 15,856,352 | | $ 15,856,352 |
Fidelity Securities Lending Cash Central Fund, 0.11% (b)(c) | 7,655,750 | | 7,655,750 |
TOTAL MONEY MARKET FUNDS (Cost $23,512,102) | 23,512,102 |
TOTAL INVESTMENT PORTFOLIO - 100.4% (Cost $1,376,102,496) | | 1,550,616,435 |
NET OTHER ASSETS (LIABILITIES) - (0.4)% | | (6,378,964) |
NET ASSETS - 100% | $ 1,544,237,471 |
Legend |
(a) Non-income producing |
(b) Affiliated fund that is available only to investment companies and other accounts managed by Fidelity Investments. The rate quoted is the annualized seven-day yield of the fund at period end. A complete unaudited listing of the fund's holdings as of its most recent quarter end is available upon request. In addition, each Fidelity Central Fund's financial statements, which are not covered by the Fund's Report of Independent Registered Public Accounting Firm, are available on the SEC's website or upon request. |
(c) Investment made with cash collateral received from securities on loan. |
(d) Security or a portion of the security is on loan at period end. |
Affiliated Central Funds |
Information regarding fiscal year to date income earned by the Fund from investments in Fidelity Central Funds is as follows: |
Fund | Income earned |
Fidelity Cash Central Fund | $ 54,497 |
Fidelity Securities Lending Cash Central Fund | 1,097,622 |
Total | $ 1,152,119 |
Other Information |
The following is a summary of the inputs used, as of October 31, 2011, involving the Fund's assets and liabilities carried at fair value. The inputs or methodology used for valuing securities may not be an indication of the risk associated with investing in those securities. For more information on valuation inputs, and their aggregation into the levels used in the table below, please refer to the Security Valuation section in the accompanying Notes to Financial Statements. |
Valuation Inputs at Reporting Date: |
Description | Total | Level 1 | Level 2 | Level 3 |
Investments in Securities: | | | | |
Equities: | | | | |
Consumer Discretionary | $ 143,538,034 | $ 7,859,461 | $ 135,678,573 | $ - |
Consumer Staples | 68,811,815 | - | 68,811,815 | - |
Energy | 136,567,240 | - | 136,567,240 | - |
Financials | 556,349,439 | 8,506,038 | 547,843,401 | - |
Health Care | 4,819,634 | - | 4,819,634 | - |
Industrials | 103,237,484 | 1,919,760 | 101,317,724 | - |
Information Technology | 241,916,074 | 31,686,339 | 210,229,735 | - |
Materials | 151,219,333 | - | 151,219,333 | - |
Telecommunication Services | 108,026,780 | - | 108,026,780 | - |
Utilities | 12,618,500 | - | 12,618,500 | - |
Money Market Funds | 23,512,102 | 23,512,102 | - | - |
Total Investments in Securities: | $ 1,550,616,435 | $ 73,483,700 | $ 1,477,132,735 | $ - |
Transfers from Level 1 to Level 2 during the period were $998,441,272. |
See accompanying notes which are an integral part of the financial statements.
Annual Report
Fidelity China Region Fund
Statement of Assets and Liabilities
| October 31, 2011 |
| | |
Assets | | |
Investment in securities, at value (including securities loaned of $7,414,695) - See accompanying schedule: Unaffiliated issuers (cost $1,352,590,394) | $ 1,527,104,333 | |
Fidelity Central Funds (cost $23,512,102) | 23,512,102 | |
Total Investments (cost $1,376,102,496) | | $ 1,550,616,435 |
Receivable for investments sold | | 3,096,945 |
Receivable for fund shares sold | | 2,387,894 |
Dividends receivable | | 27,878 |
Distributions receivable from Fidelity Central Funds | | 83,053 |
Prepaid expenses | | 6,519 |
Other receivables | | 332,497 |
Total assets | | 1,556,551,221 |
| | |
Liabilities | | |
Payable for fund shares redeemed | $ 3,233,655 | |
Accrued management fee | 866,875 | |
Distribution and service plan fees payable | 10,527 | |
Other affiliated payables | 377,917 | |
Other payables and accrued expenses | 169,026 | |
Collateral on securities loaned, at value | 7,655,750 | |
Total liabilities | | 12,313,750 |
| | |
Net Assets | | $ 1,544,237,471 |
Net Assets consist of: | | |
Paid in capital | | $ 1,349,632,104 |
Undistributed net investment income | | 15,589,239 |
Accumulated undistributed net realized gain (loss) on investments and foreign currency transactions | | 4,502,101 |
Net unrealized appreciation (depreciation) on investments and assets and liabilities in foreign currencies | | 174,514,027 |
Net Assets | | $ 1,544,237,471 |
Statement of Assets and Liabilities - continued
| October 31, 2011 |
| | |
Calculation of Maximum Offering Price Class A:
Net Asset Value and redemption price per share ($14,807,740 ÷ 542,844 shares) | | $ 27.28 |
| | |
Maximum offering price per share (100/94.25 of $27.28) | | $ 28.94 |
Class T:
Net Asset Value and redemption price per share ($5,280,845 ÷ 194,657 shares) | | $ 27.13 |
| | |
Maximum offering price per share (100/96.50 of $27.13) | | $ 28.11 |
Class B:
Net Asset Value and offering price per share ($1,801,156 ÷ 66,865 shares)A | | $ 26.94 |
| | |
Class C:
Net Asset Value and offering price per share ($5,229,585 ÷ 194,711 shares)A | | $ 26.86 |
| | |
China Region:
Net Asset Value, offering price and redemption price per share ($1,515,083,763 ÷ 55,117,459 shares) | | $ 27.49 |
| | |
Institutional Class:
Net Asset Value, offering price and redemption price per share ($2,034,382 ÷ 74,075 shares) | | $ 27.46 |
A Redemption price per share is equal to net asset value less any applicable contingent deferred sales charge.
See accompanying notes which are an integral part of the financial statements.
Annual Report
Fund Name
Financial Statements - continued
Statement of Operations
| Year ended October 31, 2011 |
| | |
Investment Income | | |
Dividends | | $ 51,665,043 |
Interest | | 492 |
Income from Fidelity Central Funds | | 1,152,119 |
Income before foreign taxes withheld | | 52,817,654 |
Less foreign taxes withheld | | (5,194,113) |
Total income | | 47,623,541 |
| | |
Expenses | | |
Management fee | $ 14,146,741 | |
Transfer agent fees | 4,525,375 | |
Distribution and service plan fees | 161,388 | |
Accounting and security lending fees | 885,629 | |
Custodian fees and expenses | 889,163 | |
Independent trustees' compensation | 11,248 | |
Registration fees | 120,675 | |
Audit | 77,247 | |
Legal | 8,300 | |
Interest | 23,240 | |
Miscellaneous | 22,470 | |
Total expenses before reductions | 20,871,476 | |
Expense reductions | (1,099,159) | 19,772,317 |
Net investment income (loss) | | 27,851,224 |
Realized and Unrealized Gain (Loss) Net realized gain (loss) on: | | |
Investment securities: | | |
Unaffiliated issuers | 125,171,768 | |
Foreign currency transactions | (727,560) | |
Total net realized gain (loss) | | 124,444,208 |
Change in net unrealized appreciation (depreciation) on: Investment securities | (389,938,527) | |
Assets and liabilities in foreign currencies | 138 | |
Total change in net unrealized appreciation (depreciation) | | (389,938,389) |
Net gain (loss) | | (265,494,181) |
Net increase (decrease) in net assets resulting from operations | | $ (237,642,957) |
Statement of Changes in Net Assets
| Year ended
October 31,
2011 | Year ended
October 31,
2010 |
Increase (Decrease) in Net Assets | | |
Operations | | |
Net investment income (loss) | $ 27,851,224 | $ 25,698,168 |
Net realized gain (loss) | 124,444,208 | 87,056,704 |
Change in net unrealized appreciation (depreciation) | (389,938,389) | 253,069,337 |
Net increase (decrease) in net assets resulting from operations | (237,642,957) | 365,824,209 |
Distributions to shareholders from net investment income | (25,544,611) | (17,788,313) |
Distributions to shareholders from net realized gain | (1,707,007) | (5,540,851) |
Total distributions | (27,251,618) | (23,329,164) |
Share transactions - net increase (decrease) | (353,944,406) | (341,589,636) |
Redemption fees | 551,160 | 1,093,238 |
Total increase (decrease) in net assets | (618,287,821) | 1,998,647 |
| | |
Net Assets | | |
Beginning of period | 2,162,525,292 | 2,160,526,645 |
End of period (including undistributed net investment income of $15,589,239 and undistributed net investment income of $25,575,304, respectively) | $ 1,544,237,471 | $ 2,162,525,292 |
See accompanying notes which are an integral part of the financial statements.
Annual Report
Financial Highlights - Class A
Years ended October 31, | 2011 | 2010 | 2009 | 2008 H |
Selected Per-Share Data | | | | |
Net asset value, beginning of period | $ 31.61 | $ 26.47 | $ 16.67 | $ 29.28 |
Income from Investment Operations | | | | |
Net investment income (loss) E | .33 | .25 | .30 | .28 |
Net realized and unrealized gain (loss) | (4.33) | 5.15 | 9.63 | (12.91) |
Total from investment operations | (4.00) | 5.40 | 9.93 | (12.63) |
Distributions from net investment income | (.31) | (.20) | (.16) | - |
Distributions from net realized gain | (.03) | (.07) | - | - |
Total distributions | (.34) | (.27) | (.16) | - |
Redemption fees added to paid in capital E | .01 | .01 | .03 | .02 |
Net asset value, end of period | $ 27.28 | $ 31.61 | $ 26.47 | $ 16.67 |
Total Return B,C,D | (12.79)% | 20.54% | 60.41% | (43.07)% |
Ratios to Average Net Assets F,I | | | | |
Expenses before reductions | 1.37% | 1.38% | 1.39% | 1.44% A |
Expenses net of fee waivers, if any | 1.37% | 1.38% | 1.39% | 1.44% A |
Expenses net of all reductions | 1.31% | 1.31% | 1.31% | 1.30% A |
Net investment income (loss) | 1.07% | .91% | 1.27% | 2.63% A |
Supplemental Data | | | | |
Net assets, end of period (000 omitted) | $ 14,808 | $ 16,047 | $ 11,842 | $ 340 |
Portfolio turnover rate G | 87% | 57% | 88% | 133% |
A Annualized B Total returns for periods of less than one year are not annualized. C Total returns would have been lower if certain expenses had not been reduced during the applicable periods shown. D Total returns do not include the effect of the sales charges. E Calculated based on average shares outstanding during the period. F Fees and expenses of any underlying Fidelity Central Funds are not included in the Fund's expense ratio. The Fund indirectly bears its proportionate share of the expenses of any underlying Fidelity Central Funds. G Amount does not include the portfolio activity of any underlying Fidelity Central Funds. H For the period May 9, 2008 (commencement of sale of shares) to October 31, 2008. I Expense ratios reflect operating expenses of the class. Expenses before reductions do not reflect amounts reimbursed by the investment adviser or reductions from brokerage service arrangements or reductions from other expense offset arrangements and do not represent the amount paid by the class during periods when reimbursements or reductions occur. Expense ratios before reductions for start-up periods may not be representative of longer-term operating periods. Expenses net of fee waivers reflect expenses after reimbursement by the investment adviser but prior to reductions from brokerage service arrangements or other expense offset arrangements. Expenses net of all reductions represent the net expenses paid by the class. |
Financial Highlights - Class T
Years ended October 31, | 2011 | 2010 | 2009 | 2008 H |
Selected Per-Share Data | | | | |
Net asset value, beginning of period | $ 31.48 | $ 26.40 | $ 16.65 | $ 29.28 |
Income from Investment Operations | | | | |
Net investment income (loss) E | .25 | .18 | .23 | .26 |
Net realized and unrealized gain (loss) | (4.32) | 5.13 | 9.64 | (12.91) |
Total from investment operations | (4.07) | 5.31 | 9.87 | (12.65) |
Distributions from net investment income | (.27) | (.18) | (.14) | - |
Distributions from net realized gain | (.03) | (.07) | - | - |
Total distributions | (.29) J | (.24) K | (.14) | - |
Redemption fees added to paid in capital E | .01 | .01 | .02 | .02 |
Net asset value, end of period | $ 27.13 | $ 31.48 | $ 26.40 | $ 16.65 |
Total Return B,C,D | (13.04)% | 20.27% | 59.92% | (43.14)% |
Ratios to Average Net Assets F,I | | | | |
Expenses before reductions | 1.63% | 1.64% | 1.66% | 1.68% A |
Expenses net of fee waivers, if any | 1.63% | 1.64% | 1.66% | 1.68% A |
Expenses net of all reductions | 1.57% | 1.58% | 1.58% | 1.53% A |
Net investment income (loss) | .81% | .64% | 1.00% | 2.40% A |
Supplemental Data | | | | |
Net assets, end of period (000 omitted) | $ 5,281 | $ 6,070 | $ 3,139 | $ 107 |
Portfolio turnover rate G | 87% | 57% | 88% | 133% |
A Annualized B Total returns for periods of less than one year are not annualized. C Total returns would have been lower if certain expenses had not been reduced during the applicable periods shown. D Total returns do not include the effect of the sales charges. E Calculated based on average shares outstanding during the period. F Fees and expenses of any underlying Fidelity Central Funds are not included in the Fund's expense ratio. The Fund indirectly bears its proportionate share of the expenses of any underlying Fidelity Central Funds. G Amount does not include the portfolio activity of any underlying Fidelity Central Funds. H For the period May 9, 2008 (commencement of sale of shares) to October 31, 2008. I Expense ratios reflect operating expenses of the class. Expenses before reductions do not reflect amounts reimbursed by the investment adviser or reductions from brokerage service arrangements or reductions from other expense offset arrangements and do not represent the amount paid by the class during periods when reimbursements or reductions occur. Expense ratios before reductions for start-up periods may not be representative of longer-term operating periods. Expenses net of fee waivers reflect expenses after reimbursement by the investment adviser but prior to reductions from brokerage service arrangements or other expense offset arrangements. Expenses net of all reductions represent the net expenses paid by the class. J Total distributions of $.29 per share is comprised of distributions from net investment income of $.268 and distributions from net realized gain of $.025 per share. K Total distributions of $.24 per share is comprised of distributions from net investment income of $.177 and distributions from net realized gain of $.065 per share. |
See accompanying notes which are an integral part of the financial statements.
Annual Report
Financial Highlights - Class B
Years ended October 31, | 2011 | 2010 | 2009 | 2008 H |
Selected Per-Share Data | | | | |
Net asset value, beginning of period | $ 31.23 | $ 26.28 | $ 16.61 | $ 29.28 |
Income from Investment Operations | | | | |
Net investment income (loss) E | .10 | .04 | .12 | .20 |
Net realized and unrealized gain (loss) | (4.29) | 5.09 | 9.63 | (12.89) |
Total from investment operations | (4.19) | 5.13 | 9.75 | (12.69) |
Distributions from net investment income | (.08) | (.12) | (.10) | - |
Distributions from net realized gain | (.03) | (.07) | - | - |
Total distributions | (.11) | (.19) | (.10) | - |
Redemption fees added to paid in capital E | .01 | . 01 | .02 | .02 |
Net asset value, end of period | $ 26.94 | $ 31.23 | $ 26.28 | $ 16.61 |
Total Return B,C,D | (13.45)% | 19.63% | 59.16% | (43.27)% |
Ratios to Average Net Assets F,I | | | | |
Expenses before reductions | 2.12% | 2.14% | 2.15% | 2.17% A |
Expenses net of fee waivers, if any | 2.12% | 2.14% | 2.15% | 2.17% A |
Expenses net of all reductions | 2.06% | 2.08% | 2.06% | 2.02% A |
Net investment income (loss) | .32% | .14% | .51% | 1.91% A |
Supplemental Data | | | | |
Net assets, end of period (000 omitted) | $ 1,801 | $ 2,496 | $ 1,915 | $ 155 |
Portfolio turnover rate G | 87% | 57% | 88% | 133% |
A Annualized B Total returns for periods of less than one year are not annualized. C Total returns would have been lower if certain expenses had not been reduced during the applicable periods shown. D Total returns do not include the effect of the contingent deferred sales charge. E Calculated based on average shares outstanding during the period. F Fees and expenses of any underlying Fidelity Central Funds are not included in the Fund's expense ratio. The Fund indirectly bears its proportionate share of the expenses of any underlying Fidelity Central Funds. G Amount does not include the portfolio activity of any underlying Fidelity Central Funds. H For the period May 9, 2008 (commencement of sale of shares) to October 31, 2008. I Expense ratios reflect operating expenses of the class. Expenses before reductions do not reflect amounts reimbursed by the investment adviser or reductions from brokerage service arrangements or reductions from other expense offset arrangements and do not represent the amount paid by the class during periods when reimbursements or reductions occur. Expense ratios before reductions for start-up periods may not be representative of longer-term operating periods. Expenses net of fee waivers reflect expenses after reimbursement by the investment adviser but prior to reductions from brokerage service arrangements or other expense offset arrangements. Expenses net of all reductions represent the net expenses paid by the class. |
Financial Highlights - Class C
Years ended October 31, | 2011 | 2010 | 2009 | 2008 H |
Selected Per-Share Data | | | | |
Net asset value, beginning of period | $ 31.19 | $ 26.25 | $ 16.61 | $ 29.28 |
Income from Investment Operations | | | | |
Net investment income (loss) E | .10 | .04 | .12 | .20 |
Net realized and unrealized gain (loss) | (4.28) | 5.09 | 9.62 | (12.89) |
Total from investment operations | (4.18) | 5.13 | 9.74 | (12.69) |
Distributions from net investment income | (.13) | (.13) | (.12) | - |
Distributions from net realized gain | (.03) | (.07) | - | - |
Total distributions | (.16) | (.20) | (.12) | - |
Redemption fees added to paid in capital E | .01 | .01 | .02 | .02 |
Net asset value, end of period | $ 26.86 | $ 31.19 | $ 26.25 | $ 16.61 |
Total Return B,C,D | (13.46)% | 19.66% | 59.18% | (43.27)% |
Ratios to Average Net Assets F,I | | | | |
Expenses before reductions | 2.12% | 2.14% | 2.15% | 2.13% A |
Expenses net of fee waivers, if any | 2.12% | 2.14% | 2.15% | 2.13% A |
Expenses net of all reductions | 2.06% | 2.07% | 2.07% | 1.98% A |
Net investment income (loss) | .32% | .15% | .51% | 1.95% A |
Supplemental Data | | | | |
Net assets, end of period (000 omitted) | $ 5,230 | $ 5,938 | $ 3,806 | $ 233 |
Portfolio turnover rate G | 87% | 57% | 88% | 133% |
A Annualized B Total returns for periods of less than one year are not annualized. C Total returns would have been lower if certain expenses had not been reduced during the applicable periods shown. D Total returns do not include the effect of the contingent deferred sales charge. E Calculated based on average shares outstanding during the period. F Fees and expenses of any underlying Fidelity Central Funds are not included in the Fund's expense ratio. The Fund indirectly bears its proportionate share of the expenses of any underlying Fidelity Central Funds. G Amount does not include the portfolio activity of any underlying Fidelity Central Funds. H For the period May 9, 2008 (commencement of sale of shares) to October 31, 2008. I Expense ratios reflect operating expenses of the class. Expenses before reductions do not reflect amounts reimbursed by the investment adviser or reductions from brokerage service arrangements or reductions from other expense offset arrangements and do not represent the amount paid by the class during periods when reimbursements or reductions occur. Expense ratios before reductions for start-up periods may not be representative of longer-term operating periods. Expenses net of fee waivers reflect expenses after reimbursement by the investment adviser but prior to reductions from brokerage service arrangements or other expense offset arrangements. Expenses net of all reductions represent the net expenses paid by the class. |
See accompanying notes which are an integral part of the financial statements.
Annual Report
Financial Highlights - China Region
Years ended October 31, | 2011 | 2010 | 2009 | 2008 | 2007 |
Selected Per-Share Data | | | | | |
Net asset value, beginning of period | $ 31.81 | $ 26.55 | $ 16.69 | $ 41.52 | $ 22.94 |
Income from Investment Operations | | | | | |
Net investment income (loss) B | .44 | .34 | .33 | .39 | .46 |
Net realized and unrealized gain (loss) | (4.37) | 5.18 | 9.68 | (20.42) | 18.58 |
Total from investment operations | (3.93) | 5.52 | 10.01 | (20.03) | 19.04 |
Distributions from net investment income | (.38) | (.21) | (.17) | (.32) | (.29) |
Distributions from net realized gain | (.03) | (.07) | - | (4.53) | (.20) |
Total distributions | (.40) F | (.27) G | (.17) | (4.85) | (.49) |
Redemption fees added to paid in capital B | .01 | .01 | .02 | .05 | .03 |
Net asset value, end of period | $ 27.49 | $ 31.81 | $ 26.55 | $ 16.69 | $ 41.52 |
Total Return A | (12.52)% | 20.97% | 60.77% | (53.75)% | 84.73% |
Ratios to Average Net Assets C,E | | | | | |
Expenses before reductions | 1.04% | 1.06% | 1.12% | 1.11% | 1.08% |
Expenses net of fee waivers, if any | 1.04% | 1.06% | 1.12% | 1.11% | 1.08% |
Expenses net of all reductions | .98% | 1.00% | 1.03% | .96% | .92% |
Net investment income (loss) | 1.40% | 1.22% | 1.54% | 1.45% | 1.64% |
Supplemental Data | | | | | |
Net assets, end of period (000 omitted) | $ 1,515,084 | $ 2,130,070 | $ 2,138,141 | $ 740,289 | $ 2,044,527 |
Portfolio turnover rate D | 87% | 57% | 88% | 133% | 173% |
A Total returns would have been lower if certain expenses had not been reduced during the applicable periods shown. B Calculated based on average shares outstanding during the period. C Fees and expenses of any underlying Fidelity Central Funds are not included in the Fund's expense ratio. The Fund indirectly bears its proportionate share of the expenses of any underlying Fidelity Central Funds. D Amount does not include the portfolio activity of any underlying Fidelity Central Funds. E Expense ratios reflect operating expenses of the class. Expenses before reductions do not reflect amounts reimbursed by the investment adviser or reductions from brokerage service arrangements or reductions from other expense offset arrangements and do not represent the amount paid by the class during periods when reimbursements or reductions occur. Expenses net of fee waivers reflect expenses after reimbursement by the investment adviser but prior to reductions from brokerage service arrangements or other expense offset arrangements. Expenses net of all reductions represent the net expenses paid by the class. F Total distributions of $.40 per share is comprised of distributions from net investment income of $.376 and distributions from net realized gain of $.025 per share. G Total distributions of $.27 per share is comprised of distributions from net investment income of $.209 and distributions from net realized gain of $.065 per share. |
Financial Highlights - Institutional Class
Years ended October 31, | 2011 | 2010 | 2009 | 2008 G |
Selected Per-Share Data | | | | |
Net asset value, beginning of period | $ 31.79 | $ 26.55 | $ 16.70 | $ 29.28 |
Income from Investment Operations | | | | |
Net investment income (loss) D | .43 | .33 | .37 | .34 |
Net realized and unrealized gain (loss) | (4.37) | 5.18 | 9.64 | (12.94) |
Total from investment operations | (3.94) | 5.51 | 10.01 | (12.60) |
Distributions from net investment income | (.37) | (.22) | (.18) | - |
Distributions from net realized gain | (.03) | (.07) | - | - |
Total distributions | (.40) | (.28) I | (.18) | - |
Redemption fees added to paid in capital D | .01 | .01 | .02 | .02 |
Net asset value, end of period | $ 27.46 | $ 31.79 | $ 26.55 | $ 16.70 |
Total Return B,C | (12.56)% | 20.92% | 60.78% | (42.96)% |
Ratios to Average Net Assets E,H | | | | |
Expenses before reductions | 1.06% | 1.11% | 1.08% | 1.05% A |
Expenses net of fee waivers, if any | 1.06% | 1.11% | 1.08% | 1.05% A |
Expenses net of all reductions | 1.01% | 1.04% | 1.00% | .91% A |
Net investment income (loss) | 1.38% | 1.18% | 1.58% | 3.02% A |
Supplemental Data | | | | |
Net assets, end of period (000 omitted) | $ 2,034 | $ 1,904 | $ 1,684 | $ 60 |
Portfolio turnover rate F | 87% | 57% | 88% | 133% |
A Annualized B Total returns for periods of less than one year are not annualized. C Total returns would have been lower if certain expenses had not been reduced during the applicable periods shown. D Calculated based on average shares outstanding during the period. E Fees and expenses of any underlying Fidelity Central Funds are not included in the Fund's expense ratio. The Fund indirectly bears its proportionate share of the expenses of any underlying Fidelity Central Funds. F Amount does not include the portfolio activity of any underlying Fidelity Central Funds. G For the period May 9, 2008 (commencement of sale of shares) to October 31, 2008. H Expense ratios reflect operating expenses of the class. Expenses before reductions do not reflect amounts reimbursed by the investment adviser or reductions from brokerage service arrangements or reductions from other expense offset arrangements and do not represent the amount paid by the class during periods when reimbursements or reductions occur. Expense ratios before reductions for start-up periods may not be representative of longer-term operating periods. Expenses net of fee waivers reflect expenses after reimbursement by the investment adviser but prior to reductions from brokerage service arrangements or other expense offset arrangements. Expenses net of all reductions represent the net expenses paid by the class. I Total distributions of $.28 per share is comprised of distributions from net investment income of $.216 and distributions from net realized gain of $.065 per share. |
See accompanying notes which are an integral part of the financial statements.
Annual Report
Notes to Financial Statements
For the period ended October 31, 2011
1. Organization.
Fidelity China Region Fund (the Fund) is a fund of Fidelity Investment Trust (the Trust) and is authorized to issue an unlimited number of shares. The Trust is registered under the Investment Company Act of 1940, as amended (the 1940 Act), as an open-end management investment company organized as a Massachusetts business trust. The Fund offers Class A, Class T, Class C, China Region, and Institutional Class shares, each of which, along with Class B shares, has equal rights as to assets and voting privileges. Effective after the close of business on September 1, 2010, Class B shares were closed to new accounts and additional purchases, except for exchanges and reinvestments by existing shareholders. Each class has exclusive voting rights with respect to matters that affect that class. Class B shares will automatically convert to Class A shares after a holding period of seven years from the initial date of purchase. Investment income, realized and unrealized capital gains and losses, the common expenses of the Fund, and certain fund-level expense reductions, if any, are allocated on a pro-rata basis to each class based on the relative net assets of each class to the total net assets of the Fund. Each class differs with respect to transfer agent and distribution and service plan fees incurred. Certain expense reductions may also differ by class. The Fund's investments in emerging markets can be subject to social, economic, regulatory, and political uncertainties and can be extremely volatile.
2. Investments in Fidelity Central Funds.
The Fund invests in Fidelity Central Funds, which are open-end investment companies available only to other investment companies and accounts managed by Fidelity Management & Research Company (FMR) and its affiliates. The Fund's Schedule of Investments lists each of the Fidelity Central Funds held as of period end, if any, as an investment of the Fund, but does not include the underlying holdings of each Fidelity Central Fund. As an Investing Fund, the Fund indirectly bears its proportionate share of the expenses of the underlying Fidelity Central Funds.
The Money Market Central Funds seek preservation of capital and current income and are managed by Fidelity Investments Money Management, Inc. (FIMM), an affiliate of FMR.
A complete unaudited list of holdings for each Fidelity Central Fund is available upon request or at the Securities and Exchange Commission (the SEC) web site at www.sec.gov. In addition, the financial statements of the Fidelity Central Funds, which are not covered by the Fund's Report of Independent Registered Public Accounting Firm are available on the SEC web site or upon request.
3. Significant Accounting Policies.
The financial statements have been prepared in conformity with accounting principles generally accepted in the United States of America (GAAP), which require management to make certain estimates and assumptions at the date of the financial statements. Actual results could differ from those estimates. Subsequent events, if any, through the date that the financial statements were issued have been evaluated in the preparation of the financial statements. The following summarizes the significant accounting policies of the Fund:
Security Valuation. Investments are valued as of 4:00 p.m. Eastern time on the last calendar day of the period. The Fund uses independent pricing services approved by the Board of Trustees to value its investments. When current market prices or quotations are not readily available or reliable, valuations may be determined in good faith in accordance with procedures adopted by the Board of Trustees. Factors used in determining value may include market or security specific events. The frequency with which these procedures are used cannot be predicted and they may be utilized to a significant extent. The value used for net asset value (NAV) calculation under these procedures may differ from published prices for the same securities.
The Fund categorizes the inputs to valuation techniques used to value its investments into a disclosure hierarchy consisting of three levels as shown below:
Level 1 - quoted prices in active markets for identical investments
Level 2 - other significant observable inputs (including quoted prices for similar investments, interest rates, prepayment speeds, etc.)
Level 3 - unobservable inputs (including the Fund's own assumptions based on the best information available)
Changes in valuation techniques may result in transfers in or out of an assigned level within the disclosure hierarchy. The aggregate value of investments by input level, as of October 31, 2011, is included at the end of the Fund's Schedule of Investments. Valuation techniques used to value the Fund's investments by major category are as follows:
Equity securities, including restricted securities, for which market quotations are readily available, are valued at the last reported sale price or official closing price as reported by an independent pricing service on the primary market or exchange on which they are traded and are categorized as Level 1 in the hierarchy. In the event there were no sales during the day or closing prices are not available, securities are valued at the last quoted bid price or may be valued using the last available price and are generally categorized as Level 2 in the hierarchy. For foreign equity securities, when significant market or security specific events arise, comparisons to the valuation of American Depositary Receipts (ADRs), futures contracts, Exchange-traded
Annual Report
Notes to Financial Statements - continued
3. Significant Accounting Policies - continued
Security Valuation - continued
funds (ETFs) and certain indexes as well as quoted prices for similar securities are used and are categorized as Level 2 in the hierarchy in these circumstances. Utilizing these techniques may result in transfers between Level 1 and Level 2. For restricted equity securities and private placements where observable inputs are limited, assumptions about market activity and risk are used and are categorized as Level 3 in the hierarchy.
Investments in open-end mutual funds, including the Fidelity Central Funds, are valued at their closing net asset value each business day and are categorized as Level 1 in the hierarchy.
Foreign Currency. The Fund may use foreign currency contracts to facilitate transactions in foreign-denominated securities. Gains and losses from these transactions may arise from changes in the value of the foreign currency or if the counterparties do not perform under the contracts' terms.
Foreign-denominated assets, including investment securities, and liabilities are translated into U.S. dollars at the exchange rate at period end. Purchases and sales of investment securities, income and dividends received and expenses denominated in foreign currencies are translated into U.S. dollars at the exchange rate in effect on the transaction date.
The effects of exchange rate fluctuations on investments are included with the net realized and unrealized gain (loss) on investment securities. Other foreign currency transactions resulting in realized and unrealized gain (loss) are disclosed separately.
Investment Transactions and Income. For financial reporting purposes, the Fund's investment holdings and NAV include trades executed through the end of the last business day of the period. The NAV per share for processing shareholder transactions is calculated as of the close of business of the New York Stock Exchange (NYSE), normally 4:00 p.m. Eastern time and includes trades executed through the end of the prior business day. Gains and losses on securities sold are determined on the basis of identified cost. Dividend income is recorded on the ex-dividend date, except for certain dividends from foreign securities where the ex-dividend date may have passed, which are recorded as soon as the Fund is informed of the ex-dividend date. Non-cash dividends included in dividend income, if any, are recorded at the fair market value of the securities received. Interest income and distributions from the Fidelity Central Funds are accrued as earned. Interest income includes coupon interest and amortization of premium and accretion of discount on debt securities. Investment income is recorded net of foreign taxes withheld where recovery of such taxes is uncertain.
Expenses. Expenses directly attributable to a fund are charged to that fund. Expenses attributable to more than one fund are allocated among the respective funds on the basis of relative net assets or other appropriate methods. Expense estimates are accrued in the period to which they relate and adjustments are made when actual amounts are known.
Income Tax Information and Distributions to Shareholders. Each year, the Fund intends to qualify as a regulated investment company, including distributing substantially all of its taxable income and realized gains under Subchapter M of the Internal Revenue Code and filing its U.S. federal tax return. As a result, no provision for income taxes is required. As of October 31, 2011, the Fund did not have any unrecognized tax benefits in the financial statements. A fund's federal tax return is subject to examination by the Internal Revenue Service (IRS) for a period of three years. Foreign taxes are provided for based on the Fund's understanding of the tax rules and rates that exist in the foreign markets in which it invests.
Distributions are declared and recorded on the ex-dividend date. Income dividends and capital gain distributions are declared separately for each class. Income and capital gain distributions are determined in accordance with income tax regulations, which may differ from GAAP. In addition, the Fund claimed a portion of the payment made to redeeming shareholders as a distribution for income tax purposes.
Capital accounts within the financial statements are adjusted for permanent book-tax differences. These adjustments have no impact on net assets or the results of operations. Temporary book-tax differences will reverse in a subsequent period.
Book-tax differences are primarily due to the foreign currency transactions, deferred trustees compensation, passive foreign investment companies (PFIC), capital loss carryforwards and losses deferred due to wash sales.
The federal tax cost of investment securities and unrealized appreciation (depreciation) as of period end were as follows:
Gross unrealized appreciation | $ 225,517,453 |
Gross unrealized depreciation | (65,204,838) |
Net unrealized appreciation (depreciation) on securities and other investments | $ 160,312,615 |
| |
Tax Cost | $ 1,390,303,820 |
Annual Report
3. Significant Accounting Policies - continued
Income Tax Information and Distributions to Shareholders - continued
The tax-based components of distributable earnings as of period end were as follows:
Undistributed ordinary income | $ 15,589,243 |
Undistributed long-term capital gain | $ 18,703,425 |
Net unrealized appreciation (depreciation) | $ 160,312,703 |
Under the recently enacted Regulated Investment Company Modernization Act of 2010 (the Act), the Fund will be permitted to carry forward capital losses incurred in taxable years beginning after December 22, 2010 for an unlimited period. However, any losses incurred during those future taxable years will be required to be utilized prior to any losses incurred in pre-enactment taxable years, which generally expire after eight years from when they are incurred. Additionally, post-enactment capital losses that are carried forward will retain their character as either short-term or long-term capital losses rather than being considered all short-term as under previous law. The Fund's first fiscal year end subject to the Act will be October 31, 2012.
The tax character of distributions paid was as follows:
| October 31, 2011 | October 31, 2010 |
Ordinary Income | $ 27,251,618 | $ 23,329,164 |
Short-Term Trading (Redemption) Fees. Shares held by investors in the Fund less than 90 days are subject to a redemption fee equal to 1.50% of the net asset value of shares redeemed. All redemption fees, which reduce the proceeds of the shareholder redemption, are retained by the Fund and accounted for as an addition to paid in capital.
New Accounting Pronouncement. In May 2011, the Financial Accounting Standards Board issued Accounting Standard Update No. 2011-04, Fair Value Measurement (Topic 820) - Amendments to Achieve Common Fair Value Measurement and Disclosure Requirements in U.S. GAAP and IFRSs. The update changes the wording used to describe the requirements in GAAP for measuring fair value and for disclosing information about fair value measurements. The update is effective during interim and annual periods beginning after December 15, 2011. Management is currently evaluating the impact of the update's adoption on the Fund's financial statement disclosures.
4. Purchases and Sales of Investments.
Purchases and sales of securities, other than short-term securities, aggregated $1,708,508,008 and $2,005,473,744, respectively.
5. Fees and Other Transactions with Affiliates.
Management Fee. FMR and its affiliates provide the Fund with investment management related services for which the Fund pays a monthly management fee. The management fee is the sum of an individual fund fee rate that is based on an annual rate of .45% of the Fund's average net assets and a group fee rate that averaged .26% during the period. The group fee rate is based upon the average net assets of all the mutual funds advised by FMR. The group fee rate decreases as assets under management increase and increases as assets under management decrease. For the period, the total annual management fee rate was .71% of the Fund's average net assets.
Distribution and Service Plan Fees. In accordance with Rule 12b-1 of the 1940 Act, the Fund has adopted separate Distribution and Service Plans for each class of shares. Certain classes pay Fidelity Distributors Corporation (FDC), an affiliate of FMR, separate Distribution and Service Fees, each of which is based on an annual percentage of each class' average net assets. In addition, FDC may pay financial intermediaries for selling shares of the Fund and providing shareholder support services. For the period, the Distribution and Service Fee rates, total fees and amounts retained by FDC were as follows:
| Distribution
Fee | Service
Fee | Total Fees | Retained
by FDC |
Class A | -% | .25% | $ 43,649 | $ 1,347 |
Class T | .25% | .25% | 31,332 | - |
Class B | .75% | .25% | 23,294 | 17,555 |
Class C | .75% | .25% | 63,113 | 18,988 |
| | | $ 161,388 | $ 37,890 |
Sales Load. FDC may receive a front-end sales charge of up to 5.75% for selling Class A shares, and 3.50% for selling Class T shares, some of which is paid to financial intermediaries for selling shares of the Fund. Depending on the holding period, FDC may receive contingent deferred sales charges levied on Class A, Class T, Class B, and Class C redemptions. The deferred sales charges range from 5% to 1% for Class B, 1% for Class C, 1.00% for certain purchases of Class A shares and .25% for certain purchases of Class T shares.
Annual Report
Notes to Financial Statements - continued
5. Fees and Other Transactions with Affiliates - continued
Sales Load - continued
For the period, sales charge amounts retained by FDC were as follows:
| Retained
by FDC |
Class A | $ 27,851 |
Class T | 4,413 |
Class B* | 6,044 |
Class C* | 2,133 |
| $ 40,441 |
* When Class B and Class C shares are initially sold, FDC pays commissions from its own resources to financial intermediaries through which the sales are made.
Transfer Agent Fees. Fidelity Investments Institutional Operations Company, Inc. (FIIOC), an affiliate of FMR, is the transfer, dividend disbursing and shareholder servicing agent for each class of the Fund. FIIOC receives account fees and asset-based fees that vary according to the account size and type of account of the shareholders of the respective classes of the Fund. FIIOC pays for typesetting, printing and mailing of shareholder reports, except proxy statements. For the period, transfer agent fees for each class were as follows:
| Amount | % of
Average
Net Assets |
Class A | $ 53,201 | .31 |
Class T | 19,843 | .32 |
Class B | 7,069 | .30 |
Class C | 19,240 | .31 |
China Region | 4,421,467 | .23 |
Institutional Class | 4,555 | .25 |
| $ 4,525,375 | |
Accounting and Security Lending Fees. Fidelity Service Company, Inc. (FSC), an affiliate of FMR, maintains the Fund's accounting records. The accounting fee is based on the level of average net assets for the month. Under a separate contract, FSC administers the security lending program. The security lending fee is based on the number and duration of lending transactions.
Brokerage Commissions. The Fund placed portion of its portfolio transactions with brokerage firms which are affiliates of the investment adviser. The commissions paid to these affiliated firms were $222 for the period.
Interfund Lending Program. Pursuant to an Exemptive Order issued by the SEC, the Fund, along with other registered investment companies having management contracts with FMR, may participate in an interfund lending program. This program provides an alternative credit facility allowing the funds to borrow from, or lend money to, other participating affiliated funds. At period end, there were no interfund loans outstanding. The Fund's activity in this program during the period for which loans were outstanding was as follows:
Borrower or Lender | Average Daily
Loan Balance | Weighted Average Interest Rate | Interest
Expense |
Borrower | $ 16,084,375 | .34% | $ 1,206 |
6. Committed Line of Credit.
The Fund participates with other funds managed by FMR or an affiliate in a $4.0 billion credit facility (the "line of credit") to be utilized for temporary or emergency purposes to fund shareholder redemptions or for other short-term liquidity purposes. The Fund has agreed to pay commitment fees on its pro-rata portion of the line of credit, which amounted to $6,361 and is reflected in Miscellaneous expenses on the Statement of Operations. During the period, there were no borrowings on this line of credit.
7. Security Lending.
The Fund lends portfolio securities through a lending agent from time to time in order to earn additional income. For equity securities, a lending agent is used and may loan securities to certain qualified borrowers, including Fidelity Capital Markets (FCM), a broker-dealer affiliated with the Fund. On the settlement date of the loan, the Fund receives collateral (in the form of U.S. Treasury obligations, letters of credit and/or cash) against the loaned securities and maintains collateral in an amount not less than 100% of the market value of the loaned securities during the period of the loan. The market value of the loaned securities is determined at the close of business of the Fund and any additional required collateral is delivered to the Fund
Annual Report
7. Security Lending - continued
on the next business day. If the borrower defaults on its obligation to return the securities loaned because of insolvency or other reasons, a fund could experience delays and costs in recovering the securities loaned or in gaining access to the collateral. Any cash collateral received is invested in the Fidelity Securities Lending Cash Central Fund. The value of loaned securities and cash collateral at period end are disclosed on the Fund's Statement of Assets and Liabilities. Security lending income represents the income earned on investing cash collateral, less rebates paid to borrowers and any lending agent fees associated with the loan, plus any premium payments received for lending certain types of securities. Security lending income is presented in the Statement of Operations as a component of income from Fidelity Central Funds. Total security lending income during the period amounted to $1,097,622, including $2,921 from securities loaned to FCM.
8. Bank Borrowings.
The Fund is permitted to have bank borrowings for temporary or emergency purposes to fund shareholder redemptions or for other short-term liquidity requirements. The Fund has established borrowing arrangements with certain banks. The interest rate on the borrowings is the bank's base rate, as revised from time to time. The average daily loan balance during the period for which loans were outstanding amounted to $347,907,000. The weighted average interest rate was .57%. The interest expense amounted to $22,034 under the bank borrowing program. At period end, there were no bank borrowings outstanding.
9. Expense Reductions.
Many of the brokers with whom FMR places trades on behalf of the Fund provided services to the Fund in addition to trade execution. These services included payments of certain expenses on behalf of the Fund totaling $1,098,595 for the period. In addition, through arrangements with the Fund's custodian, credits realized as a result of uninvested cash balances were used to reduce the Fund's expenses. During the period, these credits reduced the Fund' expenses by $564.
10. Distributions to Shareholders.
Distributions to shareholders of each class were as follows:
Years ended October 31, | 2011 | 2010 |
From net investment income | | |
Class A | $ 172,777 | $ 99,129 |
Class T | 55,512 | 24,223 |
Class B | 6,583 | 9,817 |
Class C | 25,937 | 22,748 |
China Region | 25,262,487 | 17,620,183 |
Institutional Class | 21,315 | 12,213 |
Total | $ 25,544,611 | $ 17,788,313 |
From net realized gain | | |
Class A | $ 13,756 | $ 32,057 |
Class T | 5,178 | 8,895 |
Class B | 2,007 | 5,146 |
Class C | 4,950 | 11,118 |
China Region | 1,679,687 | 5,479,960 |
Institutional Class | 1,429 | 3,675 |
Total | $ 1,707,007 | $ 5,540,851 |
11. Share Transactions.
Transactions for each class of shares were as follows:
| Shares | Dollars |
Years ended October 31, | 2011 | 2010 | 2011 | 2010 |
Class A | | | | |
Shares sold | 281,861 | 342,123 | $ 8,932,867 | $ 9,544,171 |
Reinvestment of distributions | 5,327 | 4,199 | 172,528 | 118,611 |
Shares redeemed | (251,952) | (286,153) | (7,835,006) | (7,654,399) |
Net increase (decrease) | 35,236 | 60,169 | $ 1,270,389 | $ 2,008,383 |
Annual Report
Notes to Financial Statements - continued
11. Share Transactions - continued
| Shares | Dollars |
Years ended October 31, | 2011 | 2010 | 2011 | 2010 |
Class T | | | | |
Shares sold | 75,956 | 132,233 | $ 2,390,903 | $ 3,681,750 |
Reinvestment of distributions | 1,832 | 1,158 | 59,161 | 32,661 |
Shares redeemed | (75,948) | (59,475) | (2,353,550) | (1,609,136) |
Net increase (decrease) | 1,840 | 73,916 | $ 96,514 | $ 2,105,275 |
Class B | | | | |
Shares sold | 8,058 | 41,380 | $ 255,784 | $ 1,126,249 |
Reinvestment of distributions | 239 | 486 | 7,684 | 13,648 |
Shares redeemed | (21,353) | (34,810) | (653,889) | (913,219) |
Net increase (decrease) | (13,056) | 7,056 | $ (390,421) | $ 226,678 |
Class C | | | | |
Shares sold | 88,544 | 121,441 | $ 2,766,692 | $ 3,346,120 |
Reinvestment of distributions | 892 | 1,162 | 28,631 | 32,596 |
Shares redeemed | (85,136) | (77,220) | (2,585,147) | (2,041,365) |
Net increase (decrease) | 4,300 | 45,383 | $ 210,176 | $ 1,337,351 |
China Region | | | | |
Shares sold | 12,355,142 | 29,402,822 | $ 393,844,409 | $ 826,039,335 |
Reinvestment of distributions | 794,988 | 782,007 | 25,868,885 | 22,169,887 |
Shares redeemed | (24,993,159) | (43,745,336) | (775,253,396) | (1,195,393,614) |
Net increase (decrease) | (11,843,029) | (13,560,507) | $ (355,540,102) | $ (347,184,392) |
Institutional Class | | | | |
Shares sold | 53,728 | 53,076 | $ 1,636,945 | $ 1,486,647 |
Reinvestment of distributions | 607 | 500 | 19,735 | 14,160 |
Shares redeemed | (40,146) | (57,102) | (1,247,642) | (1,583,738) |
Net increase (decrease) | 14,189 | (3,526) | $ 409,038 | $ (82,931) |
12. Other.
The Fund's organizational documents provide former and current trustees and officers with a limited indemnification against liabilities arising in connection with the performance of their duties to the Fund. In the normal course of business, the Fund may also enter into contracts that provide general indemnifications. The Fund's maximum exposure under these arrangements is unknown as this would be dependent on future claims that may be made against the Fund. The risk of material loss from such claims is considered remote.
Annual Report
Report of Independent Registered Public Accounting Firm
To the Trustees of Fidelity Investment Trust and the Shareholders of Fidelity China Region Fund:
In our opinion, the accompanying statement of assets and liabilities, including the schedule of investments, and the related statements of operations and of changes in net assets and the financial highlights present fairly, in all material respects, the financial position of Fidelity China Region Fund (a fund of Fidelity Investment Trust) at October 31, 2011, the results of its operations for the year then ended, the changes in its net assets for each of the two years in the period then ended and the financial highlights for each of the periods indicated, in conformity with accounting principles generally accepted in the United States of America. These financial statements and financial highlights (hereafter referred to as "financial statements") are the responsibility of the Fidelity China Region Fund's management. Our responsibility is to express an opinion on these financial statements based on our audits. We conducted our audits of these financial statements in accordance with the standards of the Public Company Accounting Oversight Board (United States). Those standards require that we plan and perform the audit to obtain reasonable assurance about whether the financial statements are free of material misstatement. An audit includes examining, on a test basis, evidence supporting the amounts and disclosures in the financial statements, assessing the accounting principles used and significant estimates made by management, and evaluating the overall financial statement presentation. We believe that our audits, which included confirmation of securities at October 31, 2011 by correspondence with the custodian and brokers, provide a reasonable basis for our opinion.
PricewaterhouseCoopers LLP
Boston, Massachusetts
December 16, 2011
Annual Report
The Trustees, Members of the Advisory Board, and executive officers of the trust and fund, as applicable, are listed below. The Board of Trustees governs the fund and is responsible for protecting the interests of shareholders. The Trustees are experienced executives who meet periodically throughout the year to oversee the fund's activities, review contractual arrangements with companies that provide services to the fund, oversee management of the risks associated with such activities and contractual arrangements, and review the fund's performance. Except for James C. Curvey, each of the Trustees oversees 226 funds advised by FMR or an affiliate. Mr. Curvey oversees 429 funds advised by FMR or an affiliate.
The Trustees hold office without limit in time except that (a) any Trustee may resign; (b) any Trustee may be removed by written instrument, signed by at least two-thirds of the number of Trustees prior to such removal; (c) any Trustee who requests to be retired or who has become incapacitated by illness or injury may be retired by written instrument signed by a majority of the other Trustees; and (d) any Trustee may be removed at any special meeting of shareholders by a two-thirds vote of the outstanding voting securities of the trust. Each Trustee who is not an interested person (as defined in the 1940 Act) (Independent Trustee), shall retire not later than the last day of the calendar year in which his or her 75th birthday occurs. The Independent Trustees may waive this mandatory retirement age policy with respect to individual Trustees. The executive officers and Advisory Board Members hold office without limit in time, except that any officer and Advisory Board Member may resign or may be removed by a vote of a majority of the Trustees at any regular meeting or any special meeting of the Trustees. Except as indicated, each individual has held the office shown or other offices in the same company for the past five years.
Experience, Skills, Attributes, and Qualifications of the Fund's Trustees. The Governance and Nominating Committee has adopted a statement of policy that describes the experience, qualifications, attributes, and skills that are necessary and desirable for potential Independent Trustee candidates (Statement of Policy). The Board believes that each Trustee satisfied at the time he or she was initially elected or appointed a Trustee, and continues to satisfy, the standards contemplated by the Statement of Policy. The Governance and Nominating Committee also engages professional search firms to help identify potential Independent Trustee candidates who have the experience, qualifications, attributes, and skills consistent with the Statement of Policy. From time to time, additional criteria based on the composition and skills of the current Independent Trustees, as well as experience or skills that may be appropriate in light of future changes to board composition, business conditions, and regulatory or other developments, have also been considered by the professional search firms and the Governance and Nominating Committee. In addition, the Board takes into account the Trustees' commitment and participation in Board and committee meetings, as well as their leadership of standing and ad hoc committees throughout their tenure.
In determining that a particular Trustee was and continues to be qualified to serve as a Trustee, the Board has considered a variety of criteria, none of which, in isolation, was controlling. The Board believes that, collectively, the Trustees have balanced and diverse experience, qualifications, attributes, and skills, which allow the Board to operate effectively in governing the fund and protecting the interests of shareholders. Information about the specific experience, skills, attributes, and qualifications of each Trustee, which in each case led to the Board's conclusion that the Trustee should serve (or continue to serve) as a trustee of the fund, is provided below.
Board Structure and Oversight Function. James C. Curvey is an interested person (as defined in the 1940 Act) and currently serves as Acting Chairman. The Trustees have determined that an interested Chairman is appropriate and benefits shareholders because an interested Chairman has a personal and professional stake in the quality and continuity of services provided to the fund. Independent Trustees exercise their informed business judgment to appoint an individual of their choosing to serve as Chairman, regardless of whether the Trustee happens to be independent or a member of management. The Independent Trustees have determined that they can act independently and effectively without having an Independent Trustee serve as Chairman and that a key structural component for assuring that they are in a position to do so is for the Independent Trustees to constitute a substantial majority for the Board. The Independent Trustees also regularly meet in executive session. Ned C. Lautenbach serves as Chairman of the Independent Trustees and as such (i) acts as a liaison between the Independent Trustees and management with respect to matters important to the Independent Trustees and (ii) with management prepares agendas for Board meetings.
Fidelity funds are overseen by different Boards of Trustees. The fund's Board oversees Fidelity's equity and high income funds and another Board oversees Fidelity's investment-grade bond, money market, and asset allocation funds. The asset allocation funds may invest in Fidelity funds overseen by the fund's Board. The use of separate Boards, each with its own committee structure, allows the Trustees of each group of Fidelity funds to focus on the unique issues of the funds they oversee, including common research, investment, and operational issues. On occasion, the separate Boards establish joint committees to address issues of overlapping consequences for the Fidelity funds overseen by each Board.
The Trustees operate using a system of committees to facilitate the timely and efficient consideration of all matters of importance to the Trustees, the fund, and fund shareholders and to facilitate compliance with legal and regulatory requirements and oversight of the fund's activities and associated risks. The Board, acting through its committees, has charged FMR and its affiliates with (i) identifying events or circumstances the occurrence of which could have demonstrably adverse effects on the fund's business and/or reputation; (ii) implementing processes and controls to lessen the possibility that such events or circumstances occur or to mitigate the effects of such events or circumstances if they do occur; and (iii) creating and maintaining a system designed to evaluate continuously business and market conditions in order to facilitate the identification and implementation processes described in (i) and (ii) above. Because the day-to-day operations and activities of the fund are carried out by or through FMR, its affiliates and other service providers, the fund's exposure to risks is mitigated but not eliminated by the processes overseen by the Trustees. While each of the Board's committees has responsibility for overseeing different aspects of the fund's activities, oversight is exercised primarily through the Operations, Audit, and Compliance Committees. In addition, the Independent Trustees have worked with FMR to enhance the Board's oversight of investment and financial risks, legal and regulatory risks, technology risks, and operational risks, including the development of additional risk reporting to the Board. For example, a working group comprised of Independent Trustees and FMR has worked and continues to work to review the Fidelity funds' valuation-related activities, reporting and risk management. Appropriate personnel, including but not limited to the fund's Chief Compliance Officer (CCO), FMR's internal auditor, the independent accountants, the fund's Treasurer and portfolio management personnel, make periodic reports to the Board's committees, as appropriate, including an annual review of FMR's risk management program for the Fidelity funds. The responsibilities of each standing committee, including their oversight responsibilities, are described further under "Standing Committees of the Fund's Trustees."
Annual Report
The fund's Statement of Additional Information (SAI) includes more information about the Trustees. To request a free copy, call Fidelity at 1-877-208-0098.
Interested Trustees*:
Correspondence intended for each Trustee who is an interested person may be sent to Fidelity Investments, 82 Devonshire Street, Boston, Massachusetts 02109.
Name, Age; Principal Occupations and Other Relevant Experience+ |
James C. Curvey (76) |
| Year of Election or Appointment: 2007 Mr. Curvey is Trustee and Acting Chairman of the Board of Trustees of certain Trusts. Mr. Curvey also serves as Trustee (2007-present) of other investment companies advised by FMR. Mr. Curvey is a Director of Fidelity Investments Money Management, Inc. (2009-present), Director of Fidelity Research & Analysis Co. (2009-present) and Director of FMR and FMR Co., Inc. (2007-present). Mr. Curvey is also Vice Chairman (2007-present) and Director of FMR LLC. In addition, Mr. Curvey serves as an Overseer for the Boston Symphony Orchestra and a member of the Trustees of Villanova University. Previously, Mr. Curvey was the Vice Chairman (2006-2007) and Director (2000-2007) of FMR Corp. |
Ronald P. O'Hanley (54) |
| Year of Election or Appointment: 2011 Mr. O'Hanley is Director of FMR Co., Inc. (2010-present), Director of Fidelity Investments Money Management, Inc. (2010-present), Director of Fidelity Research & Analysis Company (2010-present), President of Fidelity Asset Management and Corporate Services and a member of Fidelity's Executive Committee (2010-present). Previously, Mr. O'Hanley served as President and Chief Executive Officer of BNY Mellon Asset Management (2007-2010). Mr. O'Hanley also served as Vice Chairman of Bank New York Mellon Corp. and a member of that firm's Executive Committee. Prior to the 2007 merger of The Bank of New York and Mellon Financial Corporation, he was Vice Chairman of Mellon Financial Corporation and President and Chief Executive Officer of Mellon Asset Management. He joined Mellon in February 1997. Mr. O'Hanley currently serves as Chairman of the Boston Public Library Foundation Board of Directors and sits on the Board of Directors of Beth Israel Deaconess Medical Center, the Board of Trustees of the Marine Biological Laboratory and the Advisory Board of the Maxwell School of Citizenship and Public Administration at Syracuse University. Mr. O'Hanley also chairs the Council on Asset Management for the Financial Services Roundtable and is a member of the Board of Directors of Institutional Investor's U.S. Institute. |
* Trustees have been determined to be "Interested Trustees" by virtue of, among other things, their affiliation with the trust or various entities under common control with FMR.
+ The information above includes each Trustee's principal occupation during the last five years and other information relating to the experience, attributes, and skills relevant to each Trustee's qualifications to serve as a Trustee, which led to the conclusion that each Trustee should serve as a Trustee for the fund.
Independent Trustees:
Correspondence intended for each Independent Trustee (that is, the Trustees other than the Interested Trustees) may be sent to Fidelity Investments, P.O. Box 55235, Boston, Massachusetts 02205-5235.
Name, Age; Principal Occupations and Other Relevant Experience+ |
Dennis J. Dirks (63) |
| Year of Election or Appointment: 2005 Prior to his retirement in May 2003, Mr. Dirks was Chief Operating Officer and a member of the Board of The Depository Trust & Clearing Corporation (DTCC). He also served as President, Chief Operating Officer, and Board member of The Depository Trust Company (DTC) and President and Board member of the National Securities Clearing Corporation (NSCC). In addition, Mr. Dirks served as Chief Executive Officer and Board member of the Government Securities Clearing Corporation, Chief Executive Officer and Board member of the Mortgage-Backed Securities Clearing Corporation, as a Trustee and a member of the Finance Committee of Manhattan College (2005-2008), and as a Trustee and a member of the Finance Committee of AHRC of Nassau County (2006-2008). Mr. Dirks is a member of the Independent Directors Council (IDC) Governing Council (2010-Present) and Board of Directors for The Brookville Center for Children's Services, Inc. (2009-present). |
Alan J. Lacy (58) |
| Year of Election or Appointment: 2008 Mr. Lacy serves as Senior Adviser (2007-present) of Oak Hill Capital Partners, L.P. (private equity). Mr. Lacy also served as Chief Executive Officer (2000-2005) and Vice Chairman (2005-2006) of Sears Holdings Corporation and Sears, Roebuck and Co. (retail). In addition, Mr. Lacy serves as a member of the Board of Directors of Dave & Buster's, Inc. (restaurant and entertainment complexes, 2010-present), The Hillman Companies, Inc. (hardware wholesalers, 2010-present), and Bristol-Myers Squibb Company (global pharmaceuticals, 2007-present). Mr. Lacy is a member of the Board of Trustees of The National Parks Conservation Association (2006-Present). Previously, Mr. Lacy served as Chairman of the Board of Trustees of the National Parks Conservation Association (2008-2011) and as a member of the Board of Directors for the Western Union Company (global money transfer, 2006-2011). |
Ned C. Lautenbach (67) |
| Year of Election or Appointment: 2000 Mr. Lautenbach is Chairman of the Independent Trustees of the Equity and High Income Funds (2006-present). Mr. Lautenbach currently serves as the Lead Director of the Eaton Corporation Board of Directors (diversified industrial, 1997-present). Mr. Lautenbach is also a member of the Board of Directors of the Philharmonic Center for the Arts in Naples, Florida (1999-present); a member of the Board of Trustees of Fairfield University (2005-present); and a member of the Council on Foreign Relations (1994-present). Previously, Mr. Lautenbach was a Partner/Advisory Partner at Clayton, Dubilier & Rice, LLC (private equity investment, 1998-2010), as well as a Director of Sony Corporation (2006-2007). |
Joseph Mauriello (67) |
| Year of Election or Appointment: 2008 Prior to his retirement in January 2006, Mr. Mauriello served in numerous senior management positions including Deputy Chairman and Chief Operating Officer (2004-2005), and Vice Chairman of Financial Services (2002-2004) of KPMG LLP US (professional services, 1965-2005). Mr. Mauriello currently serves as a member of the Board of Directors of XL Group plc. (global insurance and re-insurance, 2006-present) and of Arcadia Resources Inc. (health care services and products, 2007-present). Previously, Mr. Mauriello served as a Director of the Hamilton Funds of the Bank of New York (2006-2007). |
Robert W. Selander (61) |
| Year of Election or Appointment: 2011 Previously, Mr. Selander served as a Member of the Advisory Board of Fidelity's Equity and High Income Funds (2011), Executive Vice Chairman (2010), Chief Executive Officer (2009-2010), and President and Chief Executive Officer (1997-2009) of Mastercard, Inc. |
Cornelia M. Small (67) |
| Year of Election or Appointment: 2005 Ms. Small is a member of the Board of Directors of the Teagle Foundation (2009-present). Ms. Small is also a member of the Investment Committee, and Chair (2008-present) and a member of the Board of Trustees of Smith College. In addition, Ms. Small serves on the Investment Committee of the Berkshire Taconic Community Foundation (2008-present). Previously, Ms. Small served as Chairperson of the Investment Committee (2002-2008) of Smith College. In addition, Ms. Small served as Chief Investment Officer, Director of Global Equity Investments, and a member of the Board of Directors of Scudder, Stevens & Clark and Scudder Kemper Investments. |
William S. Stavropoulos (72) |
| Year of Election or Appointment: 2001 Mr. Stavropoulos is Vice Chairman of the Independent Trustees of the Equity and High Income Funds (2006-present). Mr. Stavropoulos serves as President and Founder of the Michigan Baseball Foundation, the Great Lakes Loons (2007-present). Mr. Stavropoulos is Chairman Emeritus of the Board of Directors of The Dow Chemical Company, where he previously served in numerous senior management positions, including President, CEO (1995-2000; 2002-2004), Chairman of the Executive Committee (2000-2006), and as a member of the Board of Directors (1990-2006). Currently, Mr. Stavropoulos is Chairman of Univar (global distributor of commodity and specialty chemicals, 2010-present), a Director of Teradata Corporation (data warehousing and technology solutions, 2008-present), Chemical Financial Corporation, Maersk Inc. (industrial conglomerate), Tyco International, Inc. (multinational manufacturing and services, 2007-present), and a member of the Advisory Board for Metalmark Capital (private equity investment, 2005-present). Mr. Stavropoulos is a special advisor to Clayton, Dubilier & Rice, LLC (private equity investment). In addition, Mr. Stavropoulos is a member of the University of Notre Dame Advisory Council for the College of Science. |
David M. Thomas (62) |
| Year of Election or Appointment: 2008 Previously, Mr. Thomas served as Executive Chairman (2005-2006) and Chairman and Chief Executive Officer (2000-2005) of IMS Health, Inc. (pharmaceutical and healthcare information solutions). In addition, Mr. Thomas serves as a member of the Board of Directors of Fortune Brands, Inc. (consumer products), and Interpublic Group of Companies, Inc. (marketing communication, 2004-present). |
Michael E. Wiley (61) |
| Year of Election or Appointment: 2008 Mr. Wiley also serves as a Director of Asia Pacific Exploration Consolidated (international oil and gas exploration and production, 2008-present). Mr. Wiley serves as a Director of Tesoro Corporation (independent oil refiner and marketer, 2005-present), and a Director of Bill Barrett Corporation (exploration and production, 2005-present). In addition, Mr. Wiley also serves as a Director of Post Oak Bank (privately-held bank, 2004-present). Previously, Mr. Wiley served as a member of the Board of Trustees of the University of Tulsa (2000-2006; 2007-2010), as a Senior Energy Advisor of Katzenbach Partners, LLC (consulting, 2006-2007), as an Advisory Director of Riverstone Holdings (private investment), Chairman, President, and CEO of Baker Hughes, Inc. (oilfield services, 2000-2004), and as Director of Spinnaker Exploration Company (exploration and production, 2001-2005). |
+ The information above includes each Trustee's principal occupation during the last five years and other information relating to the experience, attributes, and skills relevant to each Trustee's qualifications to serve as a Trustee, which led to the conclusion that each Trustee should serve as a Trustee for the fund.
Advisory Board Members and Executive Officers:
Correspondence intended for each executive officer, Edward C. Johnson 3d, and Peter S. Lynch may be sent to Fidelity Investments, 82 Devonshire Street, Boston, Massachusetts 02109.
Name, Age; Principal Occupation |
Edward C. Johnson 3d (81) |
| Year of Election or Appointment: 2011 Member of the Advisory Board of Fidelity's Equity and High Income Funds. Mr. Johnson serves as Chief Executive Officer, Chairman, and a Director of FMR LLC, and also serves as Chairman and Director of FIL Limited. Previously, Mr. Johnson served as a Trustee and Chairman of the Board of certain Fidelity Trusts, Chairman and a Director of FMR, Chairman and a Director of FMR Co., Inc., and President of FMR LLC (2006-2007). |
Peter S. Lynch (67) |
| Year of Election or Appointment: 2003 Member of the Advisory Board of Fidelity's Equity and High Income Funds. Mr. Lynch is Vice Chairman and a Director of FMR and FMR Co., Inc. In addition, Mr. Lynch serves as a Trustee of Boston College and as the Chairman of the Inner-City Scholarship Fund. Previously, Mr. Lynch served on the Special Olympics International Board of Directors (1997-2006). |
Kenneth B. Robins (42) |
| Year of Election or Appointment: 2008 President and Treasurer of Fidelity's Equity and High Income Funds. Mr. Robins also serves as President and Treasurer (2010-present) and Assistant Treasurer (2009-present) of other Fidelity funds and is an employee of Fidelity Investments (2004-present). Previously, Mr. Robins served as Deputy Treasurer of the Fidelity funds (2005-2008) and Treasurer and Chief Financial Officer of The North Carolina Capital Management Trust: Cash and Term Portfolios (2006-2008). |
Bruce T. Herring (46) |
| Year of Election or Appointment: 2006 Vice President of certain Equity Funds. Mr. Herring also serves as Chief Investment Officer and Director of Fidelity Management & Research (U.K.) Inc. (2010-present) and Group Chief Investments Officer of FMR. Previously, Mr. Herring served as Vice President (2005-2006) and Senior Vice President (2006-2007) of Fidelity Management & Research Company, Vice President of FMR Co., Inc. (2001-2007) and as a portfolio manager for Fidelity U.S. Equity Funds. |
Brian B. Hogan (47) |
| Year of Election or Appointment: 2009 Vice President of Equity and High Income Funds. Mr. Hogan also serves as President of FMR's Equity Division (2009-present). Previously, Mr. Hogan served as Senior Vice President, Equity Research of FMR (2006-2009) and as a portfolio manager. |
Scott C. Goebel (43) |
| Year of Election or Appointment: 2008 Secretary and Chief Legal Officer (CLO) of the Fidelity funds. Mr. Goebel also serves as Secretary of Fidelity Investments Money Management, Inc. (FIMM) (2010-present) and Fidelity Research and Analysis Company (FRAC) (2010-present); Secretary and CLO of The North Carolina Capital Management Trust: Cash and Term Portfolios (2008-present); General Counsel, Secretary, and Senior Vice President of FMR (2008-present) and FMR Co., Inc. (2008-present); employed by FMR LLC or an affiliate (2001-present); Chief Legal Officer of Fidelity Management & Research (Hong Kong) Limited (2008-present) and Assistant Secretary of Fidelity Management & Research (Japan) Inc. (2008-present), and Fidelity Management & Research (U.K.) Inc. (2008-present). Previously, Mr. Goebel served as Assistant Secretary of FIMM (2008-2010), FRAC (2008-2010), and the Funds (2007-2008) and as Vice President and Secretary of Fidelity Distributors Corporation (FDC) (2005-2007). |
William C. Coffey (42) |
| Year of Election or Appointment: 2009 Assistant Secretary of Fidelity's Equity and High Income Funds. Mr. Coffey also serves as Senior Vice President and Deputy General Counsel of FMR LLC (2010-present), and is an employee of Fidelity Investments. Previously, Mr. Coffey served as Vice President and Associate General Counsel of FMR LLC (2005-2009). |
Holly C. Laurent (57) |
| Year of Election or Appointment: 2008 Anti-Money Laundering (AML) Officer of the Fidelity funds. Ms. Laurent also serves as AML Officer of The North Carolina Capital Management Trust: Cash and Term Portfolios (2008-present) and is an employee of Fidelity Investments. Previously, Ms. Laurent was Senior Vice President and Head of Legal for Fidelity Business Services India Pvt. Ltd. (2006-2008), and Senior Vice President, Deputy General Counsel and Group Head for FMR LLC (2005-2006). |
Christine Reynolds (53) |
| Year of Election or Appointment: 2008 Chief Financial Officer of the Fidelity funds. Ms. Reynolds became President of Fidelity Pricing and Cash Management Services (FPCMS) in August 2008. Ms. Reynolds served as Chief Operating Officer of FPCMS (2007-2008). Previously, Ms. Reynolds served as President, Treasurer, and Anti-Money Laundering officer of the Fidelity funds (2004-2007). |
Kenneth A. Rathgeber (64) |
| Year of Election or Appointment: 2004 Chief Compliance Officer of Fidelity's Equity and High Income Funds. Mr. Rathgeber is Chief Compliance Officer of Fidelity Management & Research (Hong Kong) Limited (2008-present), Fidelity Management & Research (Japan) Inc. (2008-present), FMR (2005-present), FMR Co., Inc. (2005-present), Fidelity Management & Research (U.K.) Inc. (2005-present), Fidelity Research & Analysis Company (2005-present), Fidelity Investments Money Management, Inc. (2005-present), Pyramis Global Advisors, LLC (2005-present), and Strategic Advisers, Inc. (2005-present). |
Jeffrey S. Christian (50) |
| Year of Election or Appointment: 2009 Deputy Treasurer of the Fidelity funds. Mr. Christian is an employee of Fidelity Investments. Previously, Mr. Christian served as Chief Financial Officer (2008-2009) of certain Fidelity funds and Senior Vice President of Fidelity Pricing and Cash Management Services (FPCMS) (2004-2009). |
Joseph F. Zambello (54) |
| Year of Election or Appointment: 2011 Deputy Treasurer of the Fidelity funds. Mr. Zambello is an employee of Fidelity Investments. Previously, Mr. Zambello served as Vice President of FMR's Program Management Group (2009-2011) and Vice President of the Transfer Agent Oversight Group (2005-2009). |
Adrien E. Deberghes (44) |
| Year of Election or Appointment: 2008 Deputy Treasurer of Fidelity's Equity and High Income Funds. Mr. Deberghes also serves as Vice President and Assistant Treasurer of Fidelity Rutland Square Trust II and Fidelity Commonwealth Trust II (2011-present), Assistant Treasurer of other Fidelity funds (2010-present), and is an employee of Fidelity Investments (2008-present). Previously, Mr. Deberghes served as Senior Vice President of Mutual Fund Administration at State Street Corporation (2007-2008), Senior Director of Mutual Fund Administration at Investors Bank & Trust (2005-2007), and Director of Finance for Dunkin' Brands (2000-2005). |
Stephanie J. Dorsey (42) |
| Year of Election or Appointment: 2010 Assistant Treasurer of Fidelity's Equity and High Income Funds. Ms. Dorsey also serves as Deputy Treasurer of other Fidelity funds (2008-present) and is an employee of Fidelity Investments (2008-present). Previously, Ms. Dorsey served as Treasurer (2004-2008) of the JPMorgan Mutual Funds and Vice President (2004-2008) of JPMorgan Chase Bank. |
John R. Hebble (53) |
| Year of Election or Appointment: 2009 Assistant Treasurer of Fidelity's Equity and High Income Funds. Mr. Hebble also serves as President (2011-present), Treasurer, and Chief Financial Officer of The North Carolina Capital Management Trust: Cash and Term Portfolios (2008-present), President and Treasurer of other Fidelity funds (2008-present) and is an employee of Fidelity Investments. |
Gary W. Ryan (53) |
| Year of Election or Appointment: 2005 Assistant Treasurer of the Fidelity funds. Mr. Ryan is an employee of Fidelity Investments. Previously, Mr. Ryan served as Vice President of Fund Reporting in Fidelity Pricing and Cash Management Services (FPCMS) (1999-2005). |
Jonathan Davis (43) |
| Year of Election or Appointment: 2010 Assistant Treasurer of the Fidelity funds. Mr. Davis is also Assistant Treasurer of Fidelity Rutland Square Trust II and Fidelity Commonwealth Trust II. Mr. Davis is an employee of Fidelity Investments. Previously, Mr. Davis served as Vice President and Associate General Counsel of FMR LLC (2003-2010). |
Annual Report
The Board of Trustees of Fidelity China Region Fund voted to pay to shareholders of record at the opening of business on record date, the following distributions per share derived from capital gains realized from sales of portfolio securities, and dividends derived from net investment income:
| Pay Date | Record Date | Dividends | Capital Gains |
Institutional Class | 12/5/11 | 12/2/11 | $0.306 | $0.339 |
The fund hereby designates as a capital gain dividend with respect to the taxable year ended October 31, 2011, $30,167,882 or, if subsequently determined to be different, the net capital gain of such year.
Institutional Class designates 48% of the dividends distributed during the fiscal year as amounts which may be taken into account as a dividend for the purposes of the maximum rate under section 1(h)(11) of the Internal Revenue Code.
The amounts per share which represent income derived from sources within, and taxes paid to, foreign countries or possessions of the United States are as follows:
| Pay Date | Income | Taxes |
Institutional Class | 12/06/10 | $0.460 | $0.0624 |
The fund will notify shareholders in January 2012 of amounts for use in preparing 2011 income tax returns.
Annual Report
Board Approval of Investment Advisory Contracts and Management Fees
Fidelity China Region Fund
Each year, the Board of Trustees, including the Independent Trustees (together, the Board), votes on the renewal of the management contract and sub-advisory agreements (together, the Advisory Contracts) for the fund. The Board, assisted by the advice of fund counsel and Independent Trustees' counsel, requests and considers a broad range of information relevant to the renewal of the Advisory Contracts throughout the year.
The Board meets regularly and considers at each of its meetings factors that are relevant to its annual consideration of the renewal of the fund's Advisory Contracts, including the services and support provided to the fund and its shareholders. The Board has established various standing committees, each composed of Independent Trustees with varying backgrounds, to which the Board has assigned specific subject matter responsibilities in order to enhance effective decision-making by the Board. The Board, acting directly and through its Committees, requests and receives information concerning the annual consideration of the renewal of the fund's Advisory Contracts. The Board also meets as needed to consider matters specifically related to the Board's annual consideration of the renewal of Advisory Contracts. Members of the Board may also meet with trustees of other Fidelity funds through ad hoc joint committees to discuss certain matters relevant to the Fidelity funds.
At its July 2011 meeting, the Board of Trustees, including the Independent Trustees, unanimously determined to renew the fund's Advisory Contracts. In reaching its determination, the Board considered all factors it believed relevant, including (i) the nature, extent, and quality of the services to be provided to the fund and its shareholders (including the investment performance of the fund); (ii) the competitiveness of the fund's management fee and total expense ratio; (iii) the total costs of the services to be provided by and the profits to be realized by Fidelity from its relationship with the fund; (iv) the extent to which economies of scale would be realized as the fund grows; and (v) whether fee levels reflect these economies of scale, if any, for the benefit of fund shareholders.
In considering whether to renew the Advisory Contracts for the fund, the Board reached a determination, with the assistance of fund counsel and Independent Trustees' counsel and through the exercise of its business judgment, that the renewal of the Advisory Contracts is in the best interests of the fund and its shareholders and that the compensation payable under the Advisory Contracts is fair and reasonable. The Board's decision to renew the Advisory Contracts was not based on any single factor, but rather was based on a comprehensive consideration of all the information provided to the Board at its meetings throughout the year. The Board, in reaching its determination to renew the Advisory Contracts, is aware that shareholders in the fund have a broad range of investment choices available to them, including a wide choice among mutual funds offered by Fidelity's competitors, and that the fund's shareholders, who have the opportunity to review and weigh the disclosure provided by the fund in its prospectus and other public disclosures, have chosen to invest in this fund, managed by Fidelity.
Nature, Extent, and Quality of Services Provided. The Board considered the staffing within the investment adviser, FMR, and the sub-advisers (together, the Investment Advisers), including the backgrounds of the fund's investment personnel and the fund's investment objective and discipline. The Independent Trustees also had discussions with senior management of Fidelity's investment operations and investment groups. The Board considered the structure of the portfolio manager compensation program and whether this structure provides appropriate incentives to act in the best interests of the fund.
Resources Dedicated to Investment Management and Support Services. The Board and the Fund Oversight and Research Committees reviewed the general qualifications and capabilities of the Investment Advisers' investment staff, including its size, education, experience, and resources, as well as the Investment Advisers' approach to recruiting, training, managing, and compensating investment personnel. The Board also noted that FMR has devoted increased resources to non-U.S. offices. The Board noted that Fidelity's analysts have extensive resources, tools and capabilities which allow them to conduct sophisticated quantitative and fundamental analysis, as well as credit analysis of issuers, counterparties and enhancers. The Board also believes that Fidelity's investment professionals have sufficient access to global information and data so as to provide competitive investment results over time, and that those professionals also have access to sophisticated tools which permit them to assess portfolio construction and risk and performance attribution characteristics continuously, as well as to transmit new information and research conclusions rapidly around the world. Additionally, in their deliberations, the Board considered the Investment Advisers' trading capabilities and resources which are an integral part of the investment management process.
Shareholder and Administrative Services. The Board considered (i) the nature, extent, quality, and cost of advisory, administrative, and shareholder services performed by the Investment Advisers and their affiliates under the Advisory Contracts and under separate agreements covering transfer agency, pricing and bookkeeping, and securities lending services for the fund; (ii) the nature and extent of the investment adviser's supervision of third party service providers, principally custodians and subcustodians; and (iii) the resources devoted to, and the record of compliance with, the fund's compliance policies and procedures. The Board also reviewed the allocation of fund brokerage, including allocations to brokers affiliated with the Investment Advisers, the use of brokerage commissions to pay fund expenses, and the use of "soft" commission dollars to pay for research services.
The Board noted that the growth of fund assets over time across the complex allows Fidelity to reinvest in the development of services designed to enhance the value or convenience of the Fidelity funds as investment vehicles. These services include 24-hour access to account information and market information through telephone representatives and over the Internet, investor education materials and asset allocation tools, and the expanded availability of Fidelity Investor Centers, with 35 new branches opening since 2010.
Annual Report
Board Approval of Investment Advisory Contracts and Management Fees - continued
Investment in a Large Fund Family. The Board considered the benefits to shareholders of investing in a Fidelity fund, including the benefits of investing in a fund that is part of a large family of funds offering a variety of investment disciplines and providing a large variety of mutual fund investor services. The Board noted that Fidelity had taken, or had made recommendations that resulted in the Fidelity funds taking, a number of actions over the previous year that benefited particular funds, including (i) continuing to dedicate additional resources to investment research and support of the senior management team that oversees asset management; (ii) rationalizing product lines through the mergers of six funds into other funds; (iii) continuing to migrate the Freedom Funds to dedicated lower cost underlying funds; (iv) obtaining shareholder approval to broaden the investment strategies for Fidelity Consumer Finance Portfolio, Fidelity Emerging Asia Fund, and Fidelity Environment and Alternative Energy Portfolio; (v) contractually agreeing to reduce the management fees and impose other expense limitations on Spartan 500 Index Fund and U.S. Bond Index Fund in connection with launching new institutional classes of these funds; (vi) changing the name, primary and supplemental benchmarks, and investment policies of Fidelity Global Strategies Fund to support the fund's flexible investment mandate and global orientation; and (vii) reducing the transfer agency account fee rates on certain accounts.
Investment Performance. The Board considered whether the fund has operated in accordance with its investment objective, as well as its record of compliance with its investment restrictions. It also reviewed the fund's absolute investment performance for each class, as well as the fund's relative investment performance for each class measured over multiple periods against a broad-based securities market index. The Board noted that FMR does not believe that a meaningful peer group exists against which to compare the fund's performance. The following charts considered by the Board show, over the one-, three-, and five-year periods ended December 31, 2010, as available, the cumulative total returns of the retail class and Class B of the fund and the cumulative total returns of a broad-based securities market index ("benchmark"). The returns of the retail class and Class B show the performance of the highest performing class (based on five-year performance) and the lowest performing class (based on one-year performance), respectively.
Fidelity China Region Fund

The Board noted that the investment performance of the retail class of the fund compared favorably to its benchmark for all the periods shown. The Board considered that the variations in performance among the fund's classes reflect the variations in class expenses, which result in lower performance for higher expense classes. The Board also reviewed the fund's performance since inception as well as performance in the current year.
Based on its review, the Board concluded that the nature, extent, and quality of services provided to the fund under the Advisory Contracts should benefit the fund's shareholders.
Competitiveness of Management Fee and Total Expense Ratio. The Board considered the fund's management fee and total expense ratio compared to "mapped groups" of competitive funds and classes. Fidelity creates "mapped groups" by combining similar Lipper investment objective categories that have comparable management fee characteristics. Combining Lipper investment objective categories aids the Board's management fee and total expense ratio comparisons by broadening the competitive group used for comparison and by reducing the number of universes to which various Fidelity funds are compared.
Management Fee. The Board considered two proprietary management fee comparisons for the 12-month periods shown in the chart below. The group of Lipper funds used by the Board for management fee comparisons is referred to below as the "Total Mapped Group." The Total Mapped Group comparison focuses on a fund's standing relative to the total universe of comparable funds available to investors in terms of gross management fees before expense reimbursements or caps. "TMG %" represents the percentage of funds in the Total Mapped Group that had management fees that were lower than the fund's. For example, a TMG % of 7% means that 93% of the funds in the Total Mapped Group had higher management fees than the fund. The "Asset-Size Peer Group" (ASPG) comparison focuses on a fund's standing relative to non-Fidelity funds similar in size to the fund within the Total Mapped Group. The ASPG represents at least 15% of the funds in the Total Mapped Group with comparable asset size and management fee characteristics, subject to a minimum of 50 funds (or all funds in the Total Mapped Group if fewer than 50). Additional information, such as the ASPG quartile in which the fund's management fee ranked, is also included in the chart and considered by the Board.
Annual Report
Fidelity China Region Fund

The Board noted that the fund's management fee ranked below the median of its Total Mapped Group and below the median of its ASPG for 2010.
Based on its review, the Board concluded that the fund's management fee is fair and reasonable in light of the services that the fund receives and the other factors considered.
Total Expense Ratio. In its review of each class's total expense ratio, the Board considered the fund's management fee as well as other fund or class expenses, as applicable, such as transfer agent fees, pricing and bookkeeping fees, fund-paid 12b-1 fees, and custodial, legal, and audit fees. The Board also noted the effects of any waivers and reimbursements on fees and expenses. As part of its review, the Board also considered the current and historical total expense ratios of each class of the fund compared to competitive fund median expenses. Each class of the fund is compared to those funds and classes in the Total Mapped Group (used by the Board for management fee comparisons) that have a similar sales load structure.
The Board noted that the total expense ratio of each class ranked below its competitive median for 2010. The Board considered that various factors, including 12b-1 fees, positive or negative performance adjustments, and relatively higher other expenses in the case of small fund size, can affect total expense ratios.
Fees Charged to Other Fidelity Clients. The Board also considered Fidelity fee structures and other information with respect to clients of FMR and its affiliates, such as other mutual funds advised or subadvised by FMR or its affiliates, pension plan clients, and other institutional clients. In March 2010, the Board created an ad hoc joint committee with the board of other Fidelity funds (the Committee) to review and compare Fidelity's institutional investment advisory business with its business of providing services to the Fidelity funds, including the differences in services provided, fees charged, and costs incurred, as well as competition in their respective marketplaces.
Based on its review of total expense ratios and fees charged to other Fidelity clients, the Board concluded that the total expense ratio of each class of the fund was reasonable in light of the services that the fund and its shareholders receive and the other factors considered, including the findings of the Committee.
Costs of the Services and Profitability. The Board considered the revenues earned and the expenses incurred by Fidelity in conducting the business of developing, marketing, distributing, managing, administering and servicing the fund and its shareholders. The Board also considered the level of Fidelity's profits in respect of all the Fidelity funds.
On an annual basis, FMR presents to the Board Fidelity's profitability for the fund. Fidelity calculates the profitability for each fund, as well as aggregate profitability for groups of Fidelity funds and all Fidelity funds, using a series of detailed revenue and cost allocation methodologies which originate with the books and records of Fidelity on which Fidelity's audited financial statements are based. The Audit Committee of the Board reviews any significant changes from the prior year's methodologies.
Annual Report
Board Approval of Investment Advisory Contracts and Management Fees - continued
PricewaterhouseCoopers LLP (PwC), independent registered public accounting firm and auditor to Fidelity and certain Fidelity funds, has been engaged annually by the Board as part of the Board's assessment of Fidelity's profitability analysis. PwC's engagement includes the review and assessment of Fidelity's methodologies used in determining the revenues and expenses attributable to Fidelity's mutual fund business, and completion of agreed-upon procedures surrounding the mathematical accuracy of fund profitability and its conformity to allocation methodologies. After considering PwC's reports issued under the engagement and information provided by Fidelity, the Board concluded that while other allocation methods may also be reasonable, Fidelity's profitability methodologies are reasonable in all material respects.
The Board also reviewed Fidelity's non-fund businesses and fall-out benefits related to the mutual fund business as well as cases where Fidelity's affiliates may benefit from or be related to the fund's business.
The Board considered the costs of the services provided by and the profits realized by Fidelity in connection with the operation of the fund and was satisfied that the profitability was not excessive in the circumstances.
Economies of Scale. The Board considered whether there have been economies of scale in respect of the management of the Fidelity funds, whether the Fidelity funds (including the fund) have appropriately benefited from any such economies of scale, and whether there is potential for realization of any further economies of scale. The Board considered the extent to which the fund will benefit from economies of scale through increased services to the fund, through waivers or reimbursements, or through fee or expense reductions. The Board also noted that in 2009, it and the board of other Fidelity funds created an ad hoc committee (the Economies of Scale Committee) to analyze whether FMR attains economies of scale in respect of the management and servicing of the Fidelity funds, whether the Fidelity funds have appropriately benefited from such economies of scale, and whether there is potential for realization of any further economies of scale.
The Board recognized that the fund's management contract incorporates a "group fee" structure, which provides for lower group fee rates as total fund assets under FMR's management increase, and for higher group fee rates as total fund assets under FMR's management decrease. FMR calculates the group fee rates based on a tiered asset "breakpoint" schedule that varies based on asset class. The Board considered that the group fee is designed to deliver the benefits of economies of scale to fund shareholders when total Fidelity fund assets increase, even if assets of any particular fund are unchanged or have declined, because some portion of Fidelity's costs are attributable to services provided to all Fidelity funds, and all funds benefit if those costs can be allocated among more assets. The Board concluded that, given the group fee structure, fund shareholders will benefit from lower management fees as assets under FMR's management increase at the fund complex level, regardless of whether Fidelity achieves any such economies of scale.
The Board concluded, taking into account the analysis of the Economies of Scale Committee, that any potential economies of scale are being appropriately shared between fund shareholders and Fidelity.
Additional Information Requested by the Board. In order to develop fully the factual basis for consideration of the Fidelity funds' Advisory Contracts, the Board requested and received additional information on certain topics, including (i) fund performance trends, actions to be taken by FMR to improve certain funds' overall performance, and Fidelity's long-term strategies for certain funds; (ii) portfolio manager changes that have occurred during the past year and length of portfolio manager tenure for different categories of funds over time; (iii) Fidelity's compensation structure for portfolio managers and other key personnel and strategies for attracting and retaining non-investment personnel; (iv) the amount of the investment that each portfolio manager has made in the Fidelity fund(s) that he or she manages; (v) historical trends in Fidelity's realization of fall-out benefits; (vi) Fidelity's group fee structures and the rationale for the individual fee rates of certain funds; (vii) fund profitability methodology and the impact of certain factors on fund profitability results; (viii) trends regarding industry use of performance fee structures and Fidelity's compliance practices with respect to performance adjustment calculations; (ix) the fee structures in place for certain other Fidelity clients; and (x) explanations regarding the relative total expense ratios of certain funds and classes, total expense competitive trends, and actions that might be taken by FMR to reduce total expense ratios for certain funds and classes.
Based on its evaluation of all of the conclusions noted above, and after considering all factors it believed relevant, the Board ultimately concluded that the advisory fee structures are fair and reasonable, and that the fund's Advisory Contracts should be renewed.
Annual Report
Annual Report
Investment Adviser
Fidelity Management & Research Company
Boston, MA
Investment Sub-Advisers
FMR Co., Inc.
Fidelity Management & Research
(U.K.) Inc.
FIL Investments (Japan) Limited
FIL Investment Advisors
FIL Investment Advisors
(UK) Limited
Fidelity Management & Research
(Hong Kong) Limited
Fidelity Management & Research
(Japan) Inc.
General Distributor
Fidelity Distributors Corporation
Boston, MA
Transfer and Service Agents
Fidelity Investments Institutional
Operations Company, Inc.
Boston, MA
Fidelity Service Company, Inc.
Boston, MA
Custodian
Brown Brothers Harriman & Co.,
Boston, MA

AHKCI-UANN-1211
1.861450.103
Fidelity®
Emerging Markets
Fund -
Class K
Annual Report
October 31, 2011

Contents
Chairman's Message | (Click Here) | The Chairman's message to shareholders. |
Performance | (Click Here) | How the fund has done over time. |
Management's Discussion of Fund Performance | (Click Here) | The Portfolio Manager's review of fund performance and strategy. |
Shareholder Expense Example | (Click Here) | An example of shareholder expenses. |
Investment Changes | (Click Here) | A summary of major shifts in the fund's investments over the past six months. |
Investments | (Click Here) | A complete list of the fund's investments with their market values. |
Financial Statements | (Click Here) | Statements of assets and liabilities, operations, and changes in net assets, as well as financial highlights. |
Notes | (Click Here) | Notes to the financial statements. |
Report of Independent Registered Public Accounting Firm | (Click Here) | |
Trustees and Officers | (Click Here) | |
Distributions | (Click Here) | |
Board Approval of Investment Advisory Contracts and Management Fees | (Click Here) | |
To view a fund's proxy voting guidelines and proxy voting record for the 12-month period ended June 30, visit http://www.fidelity.com/proxyvotingresults or visit the Securities and Exchange Commission's (SEC) web site at http://www.sec.gov. You may also call 1-800-835-5092 to request a free copy of the proxy voting guidelines.
Standard & Poor's, S&P and S&P 500 are registered service marks of The McGraw-Hill Companies, Inc. and have been licensed for use by Fidelity Distributors Corporation.
Other third party marks appearing herein are the property of their respective owners.
All other marks appearing herein are registered or unregistered trademarks or service marks of FMR LLC or an affiliated company.
This report and the financial statements contained herein are submitted for the general information of the shareholders of the fund. This report is not authorized for distribution to prospective investors in the fund unless preceded or accompanied by an effective prospectus.
A fund files its complete schedule of portfolio holdings with the SEC for the first and third quarters of each fiscal year on Form N-Q. Forms N-Q are available on the SEC's web site at http://www.sec.gov. A fund's Forms N-Q may be reviewed and copied at the SEC's Public Reference Room in Washington, DC. Information regarding the operation of the SEC's Public Reference Room may be obtained by calling 1-800-SEC-0330. For a complete list of a fund's portfolio holdings, view the most recent holdings listing, semiannual report, or annual report on Fidelity's web site at http://www.fidelity.com, http://www.advisor.fidelity.com, or http://www.401k.com, as applicable.
NOT FDIC INSURED • MAY LOSE VALUE • NO BANK GUARANTEE
Neither the fund nor Fidelity Distributors Corporation is a bank.
Annual Report
(The Acting Chairman's photo appears here.)
Dear Shareholder:
Global equity markets began the fourth quarter on a strong note, sharply reversing course in October amid strong corporate earnings, better-than-expected economic news and the promise of a resolution to the sovereign debt crisis in Europe. The mini rally followed a third quarter marked by a significant downturn in July and August, which heightened investor anxiety and set off a wave of volatility that hampered most major asset classes through the end of September. Financial markets are difficult to predict, of course, but you can help put the odds in your favor by following these time-tested investment principles.
One of the basic tenets is to invest according to your time horizon. For long-term investors, riding out the markets' inevitable ups and downs has proven much more effective than making decisions based on short-term developments. If your goal is approaching, you can also benefit from patience and restraint, rather than attempting to time the market. No matter your time horizon, missing only a few of the markets' best days can significantly diminish returns. Patience also affords the benefits of compounding - earning interest on additional income or reinvested dividends and capital gains. While staying the course doesn't eliminate risk, it can considerably lessen the negative impact of short-term downturns.
Asset allocation is another principle to manage risk. As you spread your portfolio among the asset classes, be sure to consider your time horizon, risk tolerance and investment objectives. Younger investors may be better served by emphasizing equities, which historically have been the best-performing asset class over time. Investors who are nearing a specific goal, such as retirement or sending a child to college, may choose to favor bonds and other investments that have tended to be more stable. Studies indicate that asset allocation is the single most important determinant of a portfolio's long-term success. After deciding on a suitable allocation strategy, make sure your portfolio is adequately diversified, with exposure to stocks of small-, mid- and large-cap companies in a range of sectors, for example. And today, more than ever, geographic diversification should be taken into account.
Lastly, investing a certain amount of money on a regular basis - a principle known as dollar-cost averaging - can help lower the average cost of your purchases, while also giving you the discipline to avoid selling weak performers just prior to an upswing, or chasing a hot performer just before a correction.
We invite you to learn more by visiting us on the Internet, dropping by one of our Investor Centers or calling us by phone. It is our privilege to provide the resources you need to choose investments that are right for you.
Sincerely,
(The Acting Chairman's signature appears here.)
James C. Curvey
Acting Chairman
Annual Report
Average annual total return reflects the change in the value of an investment, assuming reinvestment of the class' distributions from dividend income and capital gains (the profits earned upon the sale of securities that have grown in value, if any) and assuming a constant rate of performance each year. The $10,000 table and the fund's returns do not reflect the deduction of taxes that a shareholder would pay on fund distributions or the redemption of fund shares. During periods of reimbursement by Fidelity, a fund's total return will be greater than it would be had the reimbursement not occurred. How a fund did yesterday is no guarantee of how it will do tomorrow.
Average Annual Total Returns
Periods ended October 31, 2011 | Past 1
year | Past 5
years | Past 10
years |
Class K A | -12.17% | 2.32% | 14.74% |
A The initial offering of Class K shares took place on May 9, 2008. Returns prior to May 9, 2008, are those of Fidelity® Emerging Markets Fund, the original class of the fund.
$10,000 Over 10 Years
Let's say hypothetically that $10,000 was invested in Fidelity® Emerging Markets Fund - Class K on October 31, 2001. The chart shows how the value of your investment would have changed, and also shows how the MSCI® Emerging Markets Index performed over the same period. The initial offering of Class K took place on May 9, 2008. See above for additional information regarding the performance of Class K.
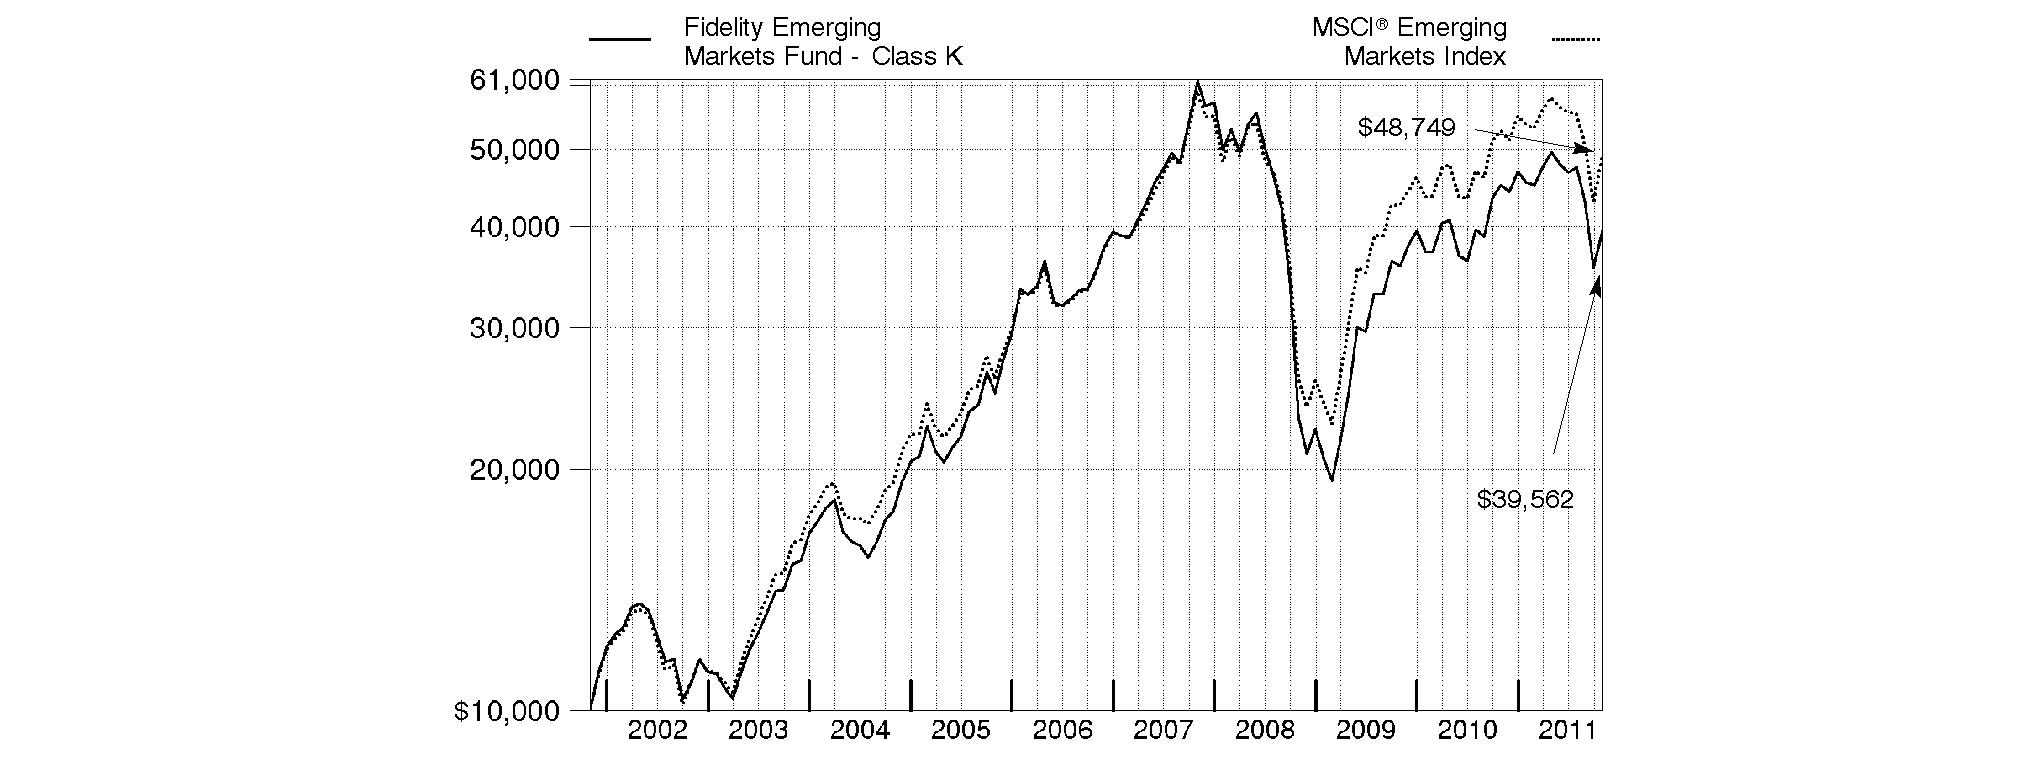
Annual Report
Market Recap: Emerging-markets stocks concluded the 12-month period ending October 31, 2011, on a strong note, reversing direction in October amid hope for a resolution to the sovereign debt crisis in Europe. The brief rally, on top of a robust first half of the period, could only partially offset the negative impact of a five-month downturn that began in May and intensified in August and September, as investors began to flee riskier securities due to the debt debacle, concern the U.S. economy may contract and worry about a significant slowdown in China. For the year, the MSCI® Emerging Markets Index declined 7.44%, hampered in part by global currency fluctuation. The index gained roughly 13% in October, after falling 9% in August and about 15% in September. For the full year, returns across the individual country components of the emerging-markets index were decidedly negative. Several of the largest countries in the index struggled, especially India (-20%), China (-17%) and Brazil (-12%), as did Turkey (-34%). Conversely, South Korea had the strongest result, gaining about 7%, while another sizable index component, Russia, returned roughly 1%. Smaller constituents Indonesia (+5%) and Malaysia (+4%) also finished in positive territory. A trio of countries had negative returns but outpaced the index: Mexico (-1%), Taiwan (-2%) and South Africa (-3%).
Comments from Robert von Rekowsky, Portfolio Manager of Fidelity® Emerging Markets Fund: During the year, the fund's Class K shares returned -12.17%, well behind the MSCI index. Relative performance was hurt the most by stock selection in energy, consumer staples and financials, followed by positioning in industrials and information technology. Geographically, security selection in China, India and South Africa weighed on the fund's results. Untimely ownership of wireless carrier and benchmark component China Mobile made it the fund's largest individual detractor. Similarly, underweighting Russian energy firm Gazprom when its stock was advancing early in the period dampened performance. Other key detractors were pork producer China Yurun Food Group - which I sold - and Turkish bank Turkiye Garanti Bankasi. Conversely, my picks in materials and positioning in the automobiles/components segment of consumer discretionary added value. Geographically, stock picking in Brazil and South Korea helped. Russian natural gas producer NOVATEK acquired additional acreage and added new customers, which bolstered its stock. Performance also benefited from Thai wireless carrier Advanced Info Service, as well as Korean automakers Kia Motors and Hyundai Motor.
The views expressed above reflect those of the portfolio manager(s) only through the end of the period as stated on the cover of this report and do not necessarily represent the views of Fidelity or any other person in the Fidelity organization. Any such views are subject to change at any time based upon market or other conditions and Fidelity disclaims any responsibility to update such views. These views may not be relied on as investment advice and, because investment decisions for a Fidelity fund are based on numerous factors, may not be relied on as an indication of trading intent on behalf of any Fidelity fund.
Annual Report
Fidelity Emerging Markets Fund
As a shareholder of the Fund, you incur two types of costs: (1) transaction costs, including redemption fees, and (2) ongoing costs, including management fees and other Fund expenses. This Example is intended to help you understand your ongoing costs (in dollars) of investing in the Fund and to compare these costs with the ongoing costs of investing in other mutual funds.
The Example is based on an investment of $1,000 invested at the beginning of the period and held for the entire period (May 1, 2011 to October 31, 2011).
Actual Expenses
The first line of the accompanying table for each class of the Fund provides information about actual account values and actual expenses. You may use the information in this line, together with the amount you invested, to estimate the expenses that you paid over the period. Simply divide your account value by $1,000.00 (for example, an $8,600 account value divided by $1,000.00 = 8.6), then multiply the result by the number in the first line for a class of the Fund under the heading entitled "Expenses Paid During Period" to estimate the expenses you paid on your account during this period. A small balance maintenance fee of $12.00 that is charged once a year may apply for certain accounts with a value of less than $2,000. This fee is not included in the table below. If it was, the estimate of expenses you paid during the period would be higher, and your ending account value lower, by this amount. In addition, the Fund, as a shareholder in the underlying Fidelity Central Funds, will indirectly bear its pro-rata share of the fees and expenses incurred by the underlying Fidelity Central Funds. These fees and expenses are not included in the Fund's annualized expense ratio used to calculate the expense estimate in the table below.
Hypothetical Example for Comparison Purposes
The second line of the accompanying table for each class of the Fund provides information about hypothetical account values and hypothetical expenses based on a Class' actual expense ratio and an assumed rate of return of 5% per year before expenses, which is not the Class' actual return. The hypothetical account values and expenses may not be used to estimate the actual ending account balance or expenses you paid for the period. You may use this information to compare the ongoing costs of investing in the Fund and other funds. To do so, compare this 5% hypothetical example with the 5% hypothetical examples that appear in the shareholder reports of the other funds. A small balance maintenance fee of $12.00 that is charged once a year may apply for certain accounts with a value of less than $2,000. This fee is not included in the table below. If it was, the estimate of expenses you paid during the period would be higher, and your ending account value lower, by this amount. In addition, the Fund, as a shareholder in the underlying Fidelity Central Funds, will indirectly bear its pro-rata share of the fees and expenses incurred by the underlying Fidelity Central Funds. These fees and expenses are not included in the Fund's annualized expense ratio used to calculate the expense estimate in the table below.
Please note that the expenses shown in the table are meant to highlight your ongoing costs only and do not reflect any transaction costs. Therefore, the second line of the table is useful in comparing ongoing costs only, and will not help you determine the relative total costs of owning different funds. In addition, if these transactional costs were included, your costs would have been higher.
| Annualized
Expense Ratio | Beginning
Account Value
May 1, 2011 | Ending
Account Value
October 31, 2011 | Expenses Paid
During Period*
May 1, 2011 to
October 31, 2011 |
Emerging Markets | 1.05% | | | |
Actual | | $ 1,000.00 | $ 798.50 | $ 4.76 |
Hypothetical A | | $ 1,000.00 | $ 1,019.91 | $ 5.35 |
Class K | .84% | | | |
Actual | | $ 1,000.00 | $ 799.40 | $ 3.81 |
Hypothetical A | | $ 1,000.00 | $ 1,020.97 | $ 4.28 |
A 5% return per year before expenses
* Expenses are equal to each Class' annualized expense ratio, multiplied by the average account value over the period, multiplied by 184/365 (to reflect the one-half year period).
Annual Report
Fidelity Emerging Markets Fund
Investment Changes (Unaudited)
Geographic Diversification (% of fund's net assets) |
As of October 31, 2011 |
 | Korea (South) | 20.5% | |
 | Brazil | 14.8% | |
 | China | 7.9% | |
 | Taiwan | 6.7% | |
 | Russia | 5.9% | |
 | Hong Kong | 5.6% | |
 | Indonesia | 5.4% | |
 | Thailand | 4.3% | |
 | India | 4.3% | |
 | Other | 24.6% | |

Percentages are adjusted for the effect of futures contracts, if applicable. |
As of April 30, 2011 |
| Korea (South) | 16.6% | |
| Brazil | 14.5% | |
| Taiwan | 10.6% | |
| Russia | 9.1% | |
| China | 8.7% | |
| South Africa | 5.1% | |
| Indonesia | 4.6% | |
| India | 4.5% | |
| Cayman Islands | 3.6% | |
| Other | 22.7% | |

Percentages are adjusted for the effect of futures contracts, if applicable. |
Asset Allocation |
| % of fund's
net assets | % of fund's net assets
6 months ago |
Stocks | 98.2 | 97.8 |
Short-Term Investments and Net Other Assets | 1.8 | 2.2 |
Top Ten Stocks as of October 31, 2011 |
| % of fund's
net assets | % of fund's net assets
6 months ago |
Samsung Electronics Co. Ltd. (Korea (South), Semiconductors & Semiconductor Equipment) | 4.3 | 2.5 |
China Mobile (Hong Kong) Ltd. (Hong Kong, Wireless Telecommunication Services) | 2.4 | 0.0 |
Hyundai Motor Co. (Korea (South), Automobiles) | 2.2 | 1.7 |
Banco Bradesco SA (PN) sponsored ADR (Brazil, Commercial Banks) | 2.1 | 1.5 |
Petroleo Brasileiro SA - Petrobras (PN) (Brazil, Oil, Gas & Consumable Fuels) | 2.0 | 2.1 |
CNOOC Ltd. (Hong Kong, Oil, Gas & Consumable Fuels) | 1.9 | 1.6 |
China Construction Bank Corp. (H Shares) (China, Commercial Banks) | 1.5 | 1.6 |
OAO NOVATEK GDR (Russia, Oil, Gas & Consumable Fuels) | 1.5 | 0.8 |
Taiwan Semiconductor Manufacturing Co. Ltd. (Taiwan, Semiconductors & Semiconductor Equipment) | 1.5 | 1.3 |
Vale SA (PN-A) sponsored ADR (Brazil, Metals & Mining) | 1.5 | 2.1 |
| 20.9 | |
Market Sectors as of October 31, 2011 |
| % of fund's
net assets | % of fund's net assets
6 months ago |
Financials | 23.3 | 23.8 |
Energy | 13.7 | 15.4 |
Information Technology | 11.5 | 13.4 |
Materials | 11.4 | 16.3 |
Consumer Discretionary | 10.7 | 8.2 |
Telecommunication Services | 9.1 | 5.6 |
Industrials | 7.7 | 6.7 |
Consumer Staples | 5.8 | 5.5 |
Utilities | 4.1 | 2.5 |
Health Care | 0.9 | 0.4 |
Annual Report
Fidelity Emerging Markets Fund
Investments October 31, 2011
Showing Percentage of Net Assets
Common Stocks - 98.2% |
| Shares | | Value |
Bailiwick of Jersey - 0.8% |
Randgold Resources Ltd. sponsored ADR | 236,900 | | $ 25,957,133 |
Bermuda - 1.5% |
Cheung Kong Infrastructure Holdings Ltd. | 3,450,000 | | 18,480,673 |
CNPC (Hong Kong) Ltd. | 11,710,000 | | 16,403,167 |
Great Eagle Holdings Ltd. | 3,869,888 | | 8,594,768 |
NWS Holdings Ltd. | 6,136,000 | | 9,304,472 |
TOTAL BERMUDA | | 52,783,080 |
Brazil - 14.8% |
Banco Bradesco SA (PN) sponsored ADR | 3,929,450 | | 71,515,990 |
Banco do Estado do Rio Grande do Sul SA | 1,982,300 | | 20,894,264 |
BR Malls Participacoes SA | 1,833,700 | | 19,808,488 |
Companhia de Bebidas das Americas (AmBev) (PN) sponsored ADR | 1,241,500 | | 41,863,380 |
Companhia de Saneamento Basico do Estado de Sao Paulo (SABESP) | 872,800 | | 23,939,483 |
Companhia de Saneamento de Minas Gerais | 308,900 | | 5,799,520 |
Eletropaulo Metropolitana SA (PN-B) | 1,139,200 | | 20,432,891 |
Embraer SA sponsored ADR | 526,400 | | 14,644,448 |
Gol Linhas Aereas Inteligentes SA sponsored ADR (d) | 2,014,300 | | 16,154,686 |
Klabin SA (PN) (non-vtg.) | 942,700 | | 3,469,522 |
Localiza Rent A Car SA | 397,500 | | 6,006,944 |
Marcopolo SA (PN) | 1,689,600 | | 7,477,848 |
Mills Estruturas e Servicos de Engenharia SA | 414,000 | | 4,134,696 |
Multiplus SA | 638,000 | | 10,774,517 |
OGX Petroleo e Gas Participacoes SA (a) | 4,250,600 | | 35,149,383 |
Petroleo Brasileiro SA - Petrobras: | | | |
(PN) (non-vtg.) | 778,300 | | 9,663,031 |
(PN) sponsored ADR (d) | 2,288,939 | | 57,887,267 |
Qualicorp SA | 656,400 | | 6,001,328 |
Tegma Gestao Logistica | 989,700 | | 12,852,498 |
Telefonica Brasil SA sponsored ADR (a) | 545,600 | | 15,833,312 |
TIM Participacoes SA sponsored ADR (d) | 1,252,433 | | 32,613,355 |
Ultrapar Participacoes SA | 1,053,900 | | 18,780,189 |
Vale SA (PN-A) sponsored ADR (d) | 2,104,698 | | 49,670,873 |
TOTAL BRAZIL | | 505,367,913 |
British Virgin Islands - 0.5% |
Mail.ru Group Ltd.: | | | |
GDR (a)(e) | 442,500 | | 15,244,125 |
GDR (Reg. S) | 40,000 | | 1,378,000 |
TOTAL BRITISH VIRGIN ISLANDS | | 16,622,125 |
Canada - 1.7% |
Eldorado Gold Corp. | 1,323,011 | | 24,858,300 |
First Quantum Minerals Ltd. | 902,200 | | 18,924,615 |
Petrominerales Ltd. | 535,800 | | 14,136,069 |
TOTAL CANADA | | 57,918,984 |
|
| Shares | | Value |
Cayman Islands - 3.4% |
Belle International Holdings Ltd. | 4,769,000 | | $ 9,353,091 |
Central China Real Estate Ltd. | 14,310,208 | | 3,231,432 |
China Shanshui Cement Group Ltd. | 24,730,000 | | 18,942,593 |
Country Garden Holdings Co. Ltd. | 36,851,000 | | 14,590,703 |
Eurasia Drilling Co. Ltd. GDR (Reg. S) | 808,700 | | 19,085,320 |
EVA Precision Industrial Holdings Ltd. | 37,790,000 | | 9,759,311 |
Haitian International Holdings Ltd. | 7,200,000 | | 6,397,165 |
Shenguan Holdings Group Ltd. | 20,996,000 | | 11,280,218 |
Silver Base Group Holdings Ltd. | 10,311,000 | | 10,981,105 |
SOHO China Ltd. | 19,398,500 | | 13,830,520 |
TOTAL CAYMAN ISLANDS | | 117,451,458 |
Chile - 1.1% |
CFR Pharmaceuticals SA | 61,972,153 | | 14,672,459 |
Empresa Nacional de Telecomunicaciones SA (ENTEL) | 1,068,744 | | 21,158,932 |
TOTAL CHILE | | 35,831,391 |
China - 7.9% |
Baidu.com, Inc. sponsored ADR (a) | 128,493 | | 18,012,149 |
China Communications Construction Co. Ltd. (H Shares) | 23,514,000 | | 17,735,585 |
China Communications Services Corp. Ltd. (H Shares) | 34,218,000 | | 15,780,865 |
China Construction Bank Corp. (H Shares) | 69,680,000 | | 51,196,353 |
China Minsheng Banking Corp. Ltd. (H Shares) | 34,434,500 | | 28,050,993 |
China National Building Materials Co. Ltd. (H Shares) | 11,408,000 | | 14,612,572 |
China Pacific Insurance Group Co. Ltd. (H Shares) | 3,380,000 | | 10,372,170 |
China Petroleum & Chemical Corp.: | | | |
(H Shares) | 17,218,000 | | 16,283,585 |
sponsored ADR (H Shares) (d) | 146,200 | | 13,801,280 |
China Southern Airlines Ltd. (H Shares) (a) | 25,102,000 | | 14,008,430 |
Great Wall Motor Co. Ltd. (H Shares) | 11,136,500 | | 15,122,391 |
Harbin Power Equipment Co. Ltd. (H Shares) | 18,078,000 | | 18,217,886 |
SINA Corp. (a)(d) | 116,700 | | 9,486,543 |
Sinopec Shanghai Petrochemical Co. Ltd. (H Shares) | 27,388,000 | | 10,055,483 |
Yantai Changyu Pioneer Wine Co. (B Shares) | 1,485,046 | | 16,708,233 |
TOTAL CHINA | | 269,444,518 |
Czech Republic - 1.7% |
Ceske Energeticke Zavody AS | 745,000 | | 31,506,316 |
Komercni Banka AS (d) | 77,600 | | 14,966,424 |
Philip Morris CR A/S | 14,961 | | 9,823,594 |
TOTAL CZECH REPUBLIC | | 56,296,334 |
Common Stocks - continued |
| Shares | | Value |
Egypt - 0.5% |
Commercial International Bank Ltd. sponsored GDR | 3,875,292 | | $ 17,121,040 |
Georgia - 0.2% |
Bank of Georgia GDR (Reg. S) | 480,001 | | 6,120,013 |
Hong Kong - 5.6% |
China Insurance International Holdings Co. Ltd. (a) | 7,614,400 | | 16,512,282 |
China Mobile (Hong Kong) Ltd. | 8,497,500 | | 80,763,144 |
China Power International Development Ltd. | 77,054,000 | | 16,304,575 |
CNOOC Ltd. | 28,270,000 | | 53,440,471 |
CNOOC Ltd. sponsored ADR | 66,600 | | 12,561,426 |
Dah Chong Hong Holdings Ltd. | 5,870,000 | | 7,128,738 |
Lenovo Group Ltd. | 6,000,000 | | 4,033,827 |
TOTAL HONG KONG | | 190,744,463 |
Hungary - 0.1% |
Magyar Telekom PLC | 1,380,700 | | 3,213,188 |
India - 4.3% |
Bank of Baroda | 1,412,618 | | 22,273,590 |
Bharti Airtel Ltd. | 2,706,596 | | 21,676,370 |
Housing Development Finance Corp. Ltd. | 2,541,720 | | 35,769,191 |
Indian Overseas Bank | 5,515,424 | | 11,558,726 |
ITC Ltd. | 3,000 | | 13,085 |
Jain Irrigation Systems Ltd. | 396,112 | | 1,009,312 |
Punjab National Bank | 357,790 | | 7,288,721 |
Tata Consultancy Services Ltd. | 1,174,258 | | 26,711,783 |
Tata Steel Ltd. | 763,513 | | 7,518,629 |
Ultratech Cement Ltd. | 551,743 | | 13,027,163 |
TOTAL INDIA | | 146,846,570 |
Indonesia - 5.4% |
PT Astra International Tbk | 5,076,500 | | 39,143,633 |
PT Bank Negara Indonesia (Persero) Tbk | 35,632,000 | | 15,968,902 |
PT Bank Rakyat Indonesia Tbk | 55,677,500 | | 41,860,950 |
PT Bank Tabungan Negara Tbk | 53,925,000 | | 8,680,322 |
PT Bumi Serpong Damai Tbk | 79,655,400 | | 8,196,748 |
PT Ciputra Development Tbk | 98,853,500 | | 5,420,035 |
PT Gadjah Tunggal Tbk | 18,599,500 | | 5,687,694 |
PT Indofood Sukses Makmur Tbk | 27,011,500 | | 16,034,011 |
PT Indosat Tbk | 26,279,700 | | 15,739,594 |
PT Summarecon Agung Tbk | 33,004,500 | | 4,319,137 |
PT Tower Bersama Infrastructure Tbk | 40,320,000 | | 9,383,810 |
PT XL Axiata Tbk | 26,029,500 | | 14,558,032 |
TOTAL INDONESIA | | 184,992,868 |
Israel - 0.5% |
Check Point Software Technologies Ltd. (a) | 269,700 | | 15,542,811 |
Kazakhstan - 0.5% |
KazMunaiGas Exploration & Production JSC (Reg. S) GDR | 1,026,911 | | 17,436,949 |
|
| Shares | | Value |
Korea (South) - 20.5% |
BS Financial Group, Inc. (a) | 1,415,610 | | $ 15,522,126 |
Cheil Worldwide, Inc. | 840,500 | | 13,711,056 |
CJ CheilJedang Corp. | 19,462 | | 5,350,808 |
CJ Corp. | 287,603 | | 20,528,220 |
Daum Communications Corp. | 84,360 | | 10,182,462 |
Doosan Co. Ltd. | 163,632 | | 20,613,962 |
GS Holdings Corp. | 374,573 | | 21,495,552 |
Hana Financial Group, Inc. | 877,450 | | 31,228,556 |
Hankook Tire Co. Ltd. | 297,050 | | 11,812,263 |
Hyundai Department Store Co. Ltd. | 149,034 | | 21,288,130 |
Hyundai Fire & Marine Insurance Co. Ltd. | 374,910 | | 10,815,329 |
Hyundai Heavy Industries Co. Ltd. | 116,377 | | 30,975,757 |
Hyundai Hysco Co. Ltd. | 363,390 | | 14,014,139 |
Hyundai Mobis | 125,135 | | 35,678,966 |
Hyundai Motor Co. | 364,582 | | 73,148,708 |
Industrial Bank of Korea | 2,000,080 | | 26,159,697 |
Kia Motors Corp. | 525,566 | | 33,569,327 |
Korea Zinc Co. Ltd. | 36,246 | | 10,584,368 |
KT&G Corp. | 552,295 | | 34,420,497 |
LG Chemical Ltd. | 40 | | 12,859 |
LIG Non-Life Insurance Co. Ltd. | 409,010 | | 8,674,196 |
Lotte Samkang Co. Ltd. | 13,049 | | 3,889,466 |
Nong Shim Co. Ltd. | 76,098 | | 14,856,286 |
Paradise Co. Ltd. | 1,823,471 | | 12,767,880 |
Samsung Card Co. Ltd. | 400,740 | | 14,960,937 |
Samsung Electronics Co. Ltd. | 171,704 | | 147,261,904 |
Shinhan Financial Group Co. Ltd. | 1,012,890 | | 40,200,111 |
SK Chemicals Co. Ltd. | 208,337 | | 13,278,653 |
TOTAL KOREA (SOUTH) | | 697,002,215 |
Luxembourg - 0.7% |
Millicom International Cellular SA (depositary receipt) | 217,800 | | 24,003,083 |
Malaysia - 0.7% |
Axiata Group Bhd | 14,916,300 | | 23,576,047 |
Mauritius - 0.0% |
Golden Agri-Resources Ltd. | 20,000 | | 10,235 |
Mexico - 0.3% |
Embotelladoras Arca SAB de CC | 2,439,900 | | 11,576,572 |
Netherlands - 0.2% |
Yandex NV | 260,800 | | 7,177,216 |
Nigeria - 0.4% |
Guaranty Trust Bank PLC GDR (Reg. S) | 2,921,542 | | 13,439,093 |
Panama - 0.5% |
Copa Holdings SA Class A | 251,300 | | 17,357,291 |
Peru - 0.8% |
Compania de Minas Buenaventura SA sponsored ADR | 626,941 | | 25,660,695 |
Philippines - 0.2% |
Globe Telecom, Inc. | 317,770 | | 6,775,019 |
Common Stocks - continued |
| Shares | | Value |
Poland - 0.7% |
Polska Grupa Energetyczna SA | 2,066,054 | | $ 12,732,568 |
TVN SA | 2,646,117 | | 10,591,457 |
TOTAL POLAND | | 23,324,025 |
Qatar - 0.1% |
Commercial Bank of Qatar GDR (Reg. S) | 463,393 | | 2,125,277 |
Russia - 5.9% |
Cherkizovo Group OJSC GDR (a) | 488,565 | | 6,813,728 |
Lukoil Oil Co. sponsored ADR | 675,221 | | 38,960,252 |
Mostotrest OAO (a) | 667,332 | | 3,836,000 |
Gazprom OAO sponsored ADR | 1,876,580 | | 21,787,094 |
NOVATEK OAO GDR | 360,758 | | 50,650,423 |
Rosneft Oil Co. OJSC GDR (Reg. S) | 1,212,900 | | 8,629,784 |
Sberbank of Russia (f) | 15,364,500 | | 41,692,026 |
TNK-BP Holding | 713,700 | | 1,952,700 |
Uralkali JSC GDR (Reg. S) | 581,400 | | 25,232,760 |
TOTAL RUSSIA | | 199,554,767 |
Singapore - 0.2% |
Sakari Resources Ltd. | 4,225,000 | | 7,889,375 |
Wilmar International Ltd. | 2,000 | | 8,633 |
TOTAL SINGAPORE | | 7,898,008 |
South Africa - 2.6% |
African Bank Investments Ltd. | 4,696,699 | | 20,381,577 |
Foschini Ltd. | 1,662,721 | | 20,980,165 |
Imperial Holdings Ltd. | 794,700 | | 11,765,842 |
Life Healthcare Group Holdings Ltd. | 5,279,500 | | 12,845,677 |
Mr Price Group Ltd. | 1,330,900 | | 12,812,111 |
Northam Platinum Ltd. | 2,277,300 | | 8,823,630 |
TOTAL SOUTH AFRICA | | 87,609,002 |
Taiwan - 6.7% |
Catcher Technology Co. Ltd. | 3,820,000 | | 21,283,155 |
Chroma ATE, Inc. | 4,069,786 | | 8,120,092 |
Formosa Chemicals & Fibre Corp. | 10,000 | | 28,941 |
Formosa Plastics Corp. | 9,830,000 | | 28,910,933 |
Hotai Motor Co. Ltd. | 414,000 | | 1,801,067 |
HTC Corp. | 1,105,305 | | 24,840,130 |
Kinsus Interconnect Technology Corp. | 3,034,000 | | 10,478,835 |
Leofoo Development Co. Ltd. (a) | 5,753,000 | | 3,786,567 |
President Chain Store Corp. | 3,024,000 | | 16,815,669 |
SIMPLO Technology Co. Ltd. | 1,341,900 | | 7,895,964 |
Taishin Financial Holdings Co. Ltd. | 62,126,146 | | 26,305,333 |
Taiwan Cement Corp. | 21,754,599 | | 27,168,905 |
Taiwan Semiconductor Manufacturing Co. Ltd. | 20,709,447 | | 50,466,367 |
TOTAL TAIWAN | | 227,901,958 |
|
| Shares | | Value |
Thailand - 4.3% |
Advanced Info Service PCL (For. Reg.) | 7,944,600 | | $ 33,377,793 |
Asian Property Development PCL (For. Reg.) | 54,389,540 | | 7,949,619 |
Bangkok Expressway PCL (For.Reg.) | 1,144,700 | | 604,381 |
Banpu PCL (For. Reg.) | 454,300 | | 9,222,464 |
Charoen Pokphand Foods PCL (For. Reg.) | 8,429,400 | | 8,209,130 |
Krung Thai Bank PCL (For. Reg.) | 22,145,500 | | 10,836,877 |
PTT Global Chemical PCL (For. Reg.) (a) | 1,402,718 | | 2,957,922 |
PTT PCL (For. Reg.) | 2,200,100 | | 21,673,993 |
Siam Cement PCL (For. Reg.) | 1,447,000 | | 17,348,927 |
Siam Commercial Bank PCL (For. Reg.) | 9,328,700 | | 35,288,571 |
Total Access Communication PCL (For. Reg.) | 105,200 | | 250,624 |
TOTAL THAILAND | | 147,720,301 |
Turkey - 1.5% |
Aygaz AS | 1,780,812 | | 9,728,627 |
Koc Holding AS | 2,227,630 | | 7,961,895 |
Tofas Turk Otomobil Fabrikasi AS | 2,747,735 | | 10,628,875 |
Turkiye Garanti Bankasi AS | 6,745,395 | | 23,803,911 |
TOTAL TURKEY | | 52,123,308 |
United Kingdom - 0.7% |
International Personal Finance PLC | 1,716,532 | | 7,569,364 |
Kazakhmys PLC | 1,130,800 | | 16,867,075 |
TOTAL UNITED KINGDOM | | 24,436,439 |
United States of America - 0.7% |
Cognizant Technology Solutions Corp. Class A (a) | 236,400 | | 17,198,100 |
Freeport-McMoRan Copper & Gold, Inc. | 164,500 | | 6,622,770 |
TOTAL UNITED STATES OF AMERICA | | 23,820,870 |
TOTAL COMMON STOCKS (Cost $3,014,558,536) | 3,342,782,259 |
Money Market Funds - 4.0% |
| Shares | | Value |
Fidelity Cash Central Fund, 0.12% (b) | 52,706,240 | | $ 52,706,240 |
Fidelity Securities Lending Cash Central Fund, 0.11% (b)(c) | 85,082,139 | | 85,082,139 |
TOTAL MONEY MARKET FUNDS (Cost $137,788,379) | 137,788,379 |
TOTAL INVESTMENT PORTFOLIO - 102.2% (Cost $3,152,346,915) | | 3,480,570,638 |
NET OTHER ASSETS (LIABILITIES) - (2.2)% | | (74,864,960) |
NET ASSETS - 100% | $ 3,405,705,678 |
Legend |
(a) Non-income producing |
(b) Affiliated fund that is available only to investment companies and other accounts managed by Fidelity Investments. The rate quoted is the annualized seven-day yield of the fund at period end. A complete unaudited listing of the fund's holdings as of its most recent quarter end is available upon request. In addition, each Fidelity Central Fund's financial statements, which are not covered by the Fund's Report of Independent Registered Public Accounting Firm, are available on the SEC's website or upon request. |
(c) Investment made with cash collateral received from securities on loan. |
(d) Security or a portion of the security is on loan at period end. |
(e) Security exempt from registration under Rule 144A of the Securities Act of 1933. These securities may be resold in transactions exempt from registration, normally to qualified institutional buyers. At the end of the period, the value of these securities amounted to $15,244,125 or 0.4% of net assets. |
(f) Security or a portion of the security purchased on a delayed delivery or when-issued basis. |
Affiliated Central Funds |
Information regarding fiscal year to date income earned by the Fund from investments in Fidelity Central Funds is as follows: |
Fund | Income earned |
Fidelity Cash Central Fund | $ 51,246 |
Fidelity Securities Lending Cash Central Fund | 1,194,501 |
Total | $ 1,245,747 |
Other Information |
The following is a summary of the inputs used, as of October 31, 2011, involving the Fund's assets and liabilities carried at fair value. The inputs or methodology used for valuing securities may not be an indication of the risk associated with investing in those securities. For more information on valuation inputs, and their aggregation into the levels used in the table below, please refer to the Security Valuation section in the accompanying Notes to Financial Statements. |
Valuation Inputs at Reporting Date: |
Description | Total | Level 1 | Level 2 | Level 3 |
Investments in Securities: | | | | |
Equities: | | | | |
Korea (South) | $ 697,002,215 | $ - | $ 697,002,215 | $ - |
Brazil | 505,367,913 | 505,367,913 | - | - |
China | 269,444,518 | 41,299,972 | 228,144,546 | - |
Taiwan | 227,901,958 | - | 227,901,958 | - |
Russia | 199,554,767 | 199,554,767 | - | - |
Hong Kong | 190,744,463 | 12,561,426 | 178,183,037 | - |
Indonesia | 184,992,868 | - | 184,992,868 | - |
Thailand | 147,720,301 | - | 147,720,301 | - |
India | 146,846,570 | - | 146,846,570 | - |
Other | 773,206,686 | 590,573,178 | 182,633,508 | - |
Money Market Funds | 137,788,379 | 137,788,379 | - | - |
Total Investments in Securities: | $ 3,480,570,638 | $ 1,487,145,635 | $ 1,993,425,003 | $ - |
Transfers from Level 1 to Level 2 during the period were $1,100,228,585. |
Income Tax Information |
At October 31, 2011, the Fund had a capital loss carryforward of approximately $300, 796,984 all of which will expire in fiscal 2017. Capital loss carryforwards are only available to offset future capital gains of the Fund to the extent provided by regulations and may be limited. |
See accompanying notes which are an integral part of the financial statements.
Annual Report
Fidelity Emerging Markets Fund
Statement of Assets and Liabilities
| October 31, 2011 |
| | |
Assets | | |
Investment in securities, at value (including securities loaned of $79,492,037) - See accompanying schedule: Unaffiliated issuers (cost $3,014,558,536) | $ 3,342,782,259 | |
Fidelity Central Funds (cost $137,788,379) | 137,788,379 | |
Total Investments (cost $3,152,346,915) | | $ 3,480,570,638 |
Cash | | 357,405 |
Foreign currency held at value (cost $4,182,807) | | 4,270,284 |
Receivable for investments sold | | 69,771,938 |
Receivable for fund shares sold | | 2,882,330 |
Dividends receivable | | 5,926,684 |
Distributions receivable from Fidelity Central Funds | | 15,956 |
Prepaid expenses | | 15,477 |
Other receivables | | 2,769,652 |
Total assets | | 3,566,580,364 |
| | |
Liabilities | | |
Regular delivery | | |
Payable for investments purchased | $ 64,620,126 | |
Delayed delivery | 1,292,781 | |
Payable for fund shares redeemed | 6,685,204 | |
Accrued management fee | 1,979,929 | |
Other affiliated payables | 812,583 | |
Other payables and accrued expenses | 401,924 | |
Collateral on securities loaned, at value | 85,082,139 | |
Total liabilities | | 160,874,686 |
| | |
Net Assets | | $ 3,405,705,678 |
Net Assets consist of: | | |
Paid in capital | | $ 3,393,247,624 |
Undistributed net investment income | | 36,916,001 |
Accumulated undistributed net realized gain (loss) on investments and foreign currency transactions | | (352,312,880) |
Net unrealized appreciation (depreciation) on investments and assets and liabilities in foreign currencies | | 327,854,933 |
Net Assets | | $ 3,405,705,678 |
Statement of Assets and Liabilities - continued
| October 31, 2011 |
| | |
Emerging Markets:
Net Asset Value, offering price and redemption price per share ($2,907,884,482 ÷ 130,829,897 shares) | | $ 22.23 |
| | |
Class K:
Net Asset Value, offering price and redemption price per share ($497,821,196 ÷ 22,393,784 shares) | | $ 22.23 |
See accompanying notes which are an integral part of the financial statements.
Annual Report
Fidelity Emerging Markets Fund
Financial Statements - continued
Statement of Operations
| Year ended October 31, 2011 |
| | |
Investment Income | | |
Dividends | | $ 118,482,469 |
Interest | | 30,085 |
Income from Fidelity Central Funds | | 1,245,747 |
Income before foreign taxes withheld | | 119,758,301 |
Less foreign taxes withheld | | (12,268,127) |
Total income | | 107,490,174 |
| | |
Expenses | | |
Management fee | $ 31,884,718 | |
Transfer agent fees | 9,712,570 | |
Accounting and security lending fees | 1,563,154 | |
Custodian fees and expenses | 2,995,129 | |
Independent trustees' compensation | 25,298 | |
Registration fees | 97,583 | |
Audit | 120,061 | |
Legal | 18,561 | |
Interest | 15,467 | |
Miscellaneous | 49,325 | |
Total expenses before reductions | 46,481,866 | |
Expense reductions | (2,922,454) | 43,559,412 |
Net investment income (loss) | | 63,930,762 |
Realized and Unrealized Gain (Loss) Net realized gain (loss) on: | | |
Investment securities: | | |
Unaffiliated issuers | 291,148,406 | |
Foreign currency transactions | (7,300,563) | |
Total net realized gain (loss) | | 283,847,843 |
Change in net unrealized appreciation (depreciation) on: Investment securities (net of decrease in deferred foreign taxes of $4,553,235) | (873,553,653) | |
Assets and liabilities in foreign currencies | (483,123) | |
Total change in net unrealized appreciation (depreciation) | | (874,036,776) |
Net gain (loss) | | (590,188,933) |
Net increase (decrease) in net assets resulting from operations | | $ (526,258,171) |
Statement of Changes in Net Assets
| Year ended
October 31,
2011 | Year ended
October 31,
2010 |
Increase (Decrease) in Net Assets | | |
Operations | | |
Net investment income (loss) | $ 63,930,762 | $ 44,633,525 |
Net realized gain (loss) | 283,847,843 | 524,250,063 |
Change in net unrealized appreciation (depreciation) | (874,036,776) | 400,552,581 |
Net increase (decrease) in net assets resulting from operations | (526,258,171) | 969,436,169 |
Distributions to shareholders from net investment income | (49,437,799) | (23,159,233) |
Distributions to shareholders from net realized gain | (24,690,435) | (26,416,955) |
Total distributions | (74,128,234) | (49,576,188) |
Share transactions - net increase (decrease) | (859,245,695) | 23,065,054 |
Redemption fees | 1,366,825 | 1,389,036 |
Total increase (decrease) in net assets | (1,458,265,275) | 944,314,071 |
| | |
Net Assets | | |
Beginning of period | 4,863,970,953 | 3,919,656,882 |
End of period (including undistributed net investment income of $36,916,001 and undistributed net investment income of $44,633,128, respectively) | $ 3,405,705,678 | $ 4,863,970,953 |
See accompanying notes which are an integral part of the financial statements.
Annual Report
Financial Highlights - Emerging Markets
Years ended October 31, | 2011 | 2010 | 2009 | 2008 | 2007 |
Selected Per-Share Data | | | | | |
Net asset value, beginning of period | $ 25.72 | $ 20.68 | $ 13.71 | $ 37.55 | $ 22.04 |
Income from Investment Operations | | | | | |
Net investment income (loss) B | .35 | .23 | .17 | .42 E | .25 |
Net realized and unrealized gain (loss) | (3.48) | 5.05 | 7.03 | (22.73) | 15.44 |
Total from investment operations | (3.13) | 5.28 | 7.20 | (22.31) | 15.69 |
Distributions from net investment income | (.24) | (.12) | (.24) | (.19) | (.20) |
Distributions from net realized gain | (.13) | (.14) | - | (1.37) | - |
Total distributions | (.37) | (.25) G | (.24) | (1.56) | (.20) |
Redemption fees added to paid in capital B | .01 | .01 | .01 | .03 | .02 |
Net asset value, end of period | $ 22.23 | $ 25.72 | $ 20.68 | $ 13.71 | $ 37.55 |
Total Return A | (12.33)% | 25.76% | 53.95% | (61.84)% | 71.81% |
Ratios to Average Net Assets C, F | | | | | |
Expenses before reductions | 1.07% | 1.14% | 1.16% | 1.07% | 1.05% |
Expenses net of fee waivers, if any | 1.07% | 1.14% | 1.16% | 1.07% | 1.05% |
Expenses net of all reductions | 1.01% | 1.09% | 1.10% | 1.02% | .99% |
Net investment income (loss) | 1.38% | 1.00% | 1.09% | 1.47% E | .89% |
Supplemental Data | | | | | |
Net assets, end of period (000 omitted) | $ 2,907,884 | $ 3,975,342 | $ 3,649,582 | $ 2,086,196 | $ 6,609,045 |
Portfolio turnover rate D | 122% | 85% | 88% | 63% | 52% |
A Total returns would have been lower if certain expenses had not been reduced during the applicable periods shown. B Calculated based on average shares outstanding during the period. C Fees and expenses of any underlying Fidelity Central Funds are not included in the Fund's expense ratio. The Fund indirectly bears its proportionate share of the expenses of any underlying Fidelity Central Funds. D Amount does not include the portfolio activity of any underlying Fidelity Central Funds. E Investment income per share reflects a special dividend which amounted to $.09 per share. Excluding the special dividend, the ratio of net investment income (loss) to average net assets would have been 1.17%. F Expense ratios reflect operating expenses of the class. Expenses before reductions do not reflect amounts reimbursed by the investment adviser or reductions from brokerage service arrangements or reductions from other expense offset arrangements and do not represent the amount paid by the class during periods when reimbursements or reductions occur. Expenses net of fee waivers reflect expenses after reimbursement by the investment adviser but prior to reductions from brokerage service arrangements or other expense offset arrangements. Expenses net of all reductions represent the net expenses paid by the class. G Total distributions of $.25 per share is comprised of distributions from net investment income of $.116 and distributions from net realized gain of $.135 per share. |
Financial Highlights - Class K
Years ended October 31, | 2011 | 2010 | 2009 | 2008 H |
Selected Per-Share Data | | | | |
Net asset value, beginning of period | $ 25.75 | $ 20.69 | $ 13.72 | $ 31.99 |
Income from Investment Operations | | | | |
Net investment income (loss) D | .40 | .28 | .22 | .15 G |
Net realized and unrealized gain (loss) | (3.48) | 5.05 | 7.02 | (18.43) |
Total from investment operations | (3.08) | 5.33 | 7.24 | (18.28) |
Distributions from net investment income | (.32) | (.15) | (.28) | - |
Distributions from net realized gain | (.13) | (.14) | - | - |
Total distributions | (.45) | (.28) J | (.28) | - |
Redemption fees added to paid in capital D | .01 | .01 | .01 | .01 |
Net asset value, end of period | $ 22.23 | $ 25.75 | $ 20.69 | $ 13.72 |
Total Return B, C | (12.17)% | 26.03% | 54.44% | (57.11)% |
Ratios to Average Net Assets E, I | | | | |
Expenses before reductions | .87% | .90% | .91% | .92% A |
Expenses net of fee waivers, if any | .87% | .90% | .91% | .92% A |
Expenses net of all reductions | .80% | .84% | .84% | .87% A |
Net investment income (loss) | 1.58% | 1.24% | 1.35% | 2.02% A, G |
Supplemental Data | | | | |
Net assets, end of period (000 omitted) | $ 497,821 | $ 888,629 | $ 270,075 | $ 87,427 |
Portfolio turnover rate F | 122% | 85% | 88% | 63% |
A Annualized B Total returns for periods of less than one year are not annualized. C Total returns would have been lower if certain expenses had not been reduced during the applicable periods shown. D Calculated based on average shares outstanding during the period. E Fees and expenses of any underlying Fidelity Central Funds are not included in the Fund's expense ratio. The Fund indirectly bears its proportionate share of the expenses of any underlying Fidelity Central Funds. F Amount does not include the portfolio activity of any underlying Fidelity Central Funds. G Investment income per share reflects a special dividend which amounted to $.02 per share. Excluding the special dividend, the ratio of net investment income (loss) to average net assets would have been 1.71%. H For the period May 9, 2008 (commencement of sale of shares) to October 31, 2008. I Expense ratios reflect operating expenses of the class. Expenses before reductions do not reflect amounts reimbursed by the investment adviser or reductions from brokerage service arrangements or reductions from other expense offset arrangements and do not represent the amount paid by the class during periods when reimbursements or reductions occur. Expense ratios before reductions for start-up periods may not be representative of longer-term operating periods. Expenses net of fee waivers reflect expenses after reimbursement by the investment adviser but prior to reductions from brokerage service arrangements or other expense offset arrangements. Expenses net of all reductions represent the net expenses paid by the class. J Total distributions of $.28 per share is comprised of distributions from net investment income of $.148 and distributions from net realized gain of $.135 per share. |
See accompanying notes which are an integral part of the financial statements.
Annual Report
Notes to Financial Statements
For the period ended October 31, 2011
1. Organization.
Fidelity Emerging Markets Fund (the Fund) is a fund of Fidelity Investment Trust (the Trust) and is authorized to issue an unlimited number of shares. The Trust is registered under the Investment Company Act of 1940, as amended (the 1940 Act), as an open-end management investment company organized as a Massachusetts business trust. The Fund offers Emerging Markets and Class K shares each of which has equal rights as to assets and voting privileges. Each class has exclusive voting rights with respect to matters that affect that class. Investment income, realized and unrealized capital gains and losses, the common expenses of the Fund, and certain fund-level expense reductions, if any, are allocated on a pro-rata basis to each class based on the relative net assets of each class to the total net assets of the Fund. Each class differs with respect to transfer agent fees incurred. Certain expense reductions may also differ by class. The Fund's investments in emerging markets can be subject to social, economic, regulatory, and political uncertainties and can be extremely volatile.
2. Investments in Fidelity Central Funds.
The Fund invests in Fidelity Central Funds, which are open-end investment companies available only to other investment companies and accounts managed by Fidelity Management & Research Company (FMR) and its affiliates. The Fund's Schedule of Investments lists each of the Fidelity Central Funds held as of period end, if any, as an investment of the Fund, but does not include the underlying holdings of each Fidelity Central Fund. As an Investing Fund, the Fund indirectly bears its proportionate share of the expenses of the underlying Fidelity Central Funds.
The Money Market Central Funds seek preservation of capital and current income and are managed by Fidelity Investments Money Management, Inc. (FIMM), an affiliate of FMR.
A complete unaudited list of holdings for each Fidelity Central Fund is available upon request or at the Securities and Exchange Commission (the SEC) web site at www.sec.gov. In addition, the financial statements of the Fidelity Central Funds, which are not covered by the Fund's Report of Independent Registered Public Accounting Firm are available on the SEC web site or upon request.
3. Significant Accounting Policies.
The financial statements have been prepared in conformity with accounting principles generally accepted in the United States of America (GAAP), which require management to make certain estimates and assumptions at the date of the financial statements. Actual results could differ from those estimates. Subsequent events, if any, through the date that the financial statements were issued have been evaluated in the preparation of the financial statements. The following summarizes the significant accounting policies of the Fund:
Security Valuation. Investments are valued as of 4:00 p.m. Eastern time on the last calendar day of the period. The Fund uses independent pricing services approved by the Board of Trustees to value its investments. When current market prices or quotations are not readily available or reliable, valuations may be determined in good faith in accordance with procedures adopted by the Board of Trustees. Factors used in determining value may include market or security specific events. The frequency with which these procedures are used cannot be predicted and they may be utilized to a significant extent. The value used for net asset value (NAV) calculation under these procedures may differ from published prices for the same securities.
The Fund categorizes the inputs to valuation techniques used to value its investments into a disclosure hierarchy consisting of three levels as shown below:
Level 1 - quoted prices in active markets for identical investments
Level 2 - other significant observable inputs (including quoted prices for similar investments, interest rates, prepayment speeds, etc.)
Level 3 - unobservable inputs (including the Fund's own assumptions based on the best information available)
Changes in valuation techniques may result in transfers in or out of an assigned level within the disclosure hierarchy. The aggregate value of investments by input level, as of October 31, 2011, is included at the end of the Fund's Schedule of Investments. Valuation techniques used to value the Fund's investments by major category are as follows:
Equity securities, including restricted securities, for which market quotations are readily available, are valued at the last reported sale price or official closing price as reported by an independent pricing service on the primary market or exchange on which they are traded and are categorized as Level 1 in the hierarchy. In the event there were no sales during the day or closing prices are not available, securities are valued at the last quoted bid price or may be valued using the last available price and are generally categorized as Level 2 in the hierarchy. For foreign equity securities, when significant market or security specific events arise, comparisons to the valuation of American Depositary Receipts (ADRs), futures contracts, Exchange-traded funds (ETFs) and certain indexes as well as quoted prices for similar securities are used and are categorized as Level 2 in the hierarchy in these circumstances. Utilizing these techniques may result in transfers between Level 1 and Level 2. For restricted equity securities and private placements where observable inputs are limited, assumptions about market activity and risk are used and are categorized as Level 3 in the hierarchy.
Annual Report
3. Significant Accounting Policies - continued
Security Valuation - continued
Investments in open-end mutual funds, including the Fidelity Central Funds, are valued at their closing net asset value each business day and are categorized as Level 1 in the hierarchy.
Foreign Currency. The Fund may use foreign currency contracts to facilitate transactions in foreign-denominated securities. Gains and losses from these transactions may arise from changes in the value of the foreign currency or if the counterparties do not perform under the contracts' terms.
Foreign-denominated assets, including investment securities, and liabilities are translated into U.S. dollars at the exchange rate at period end. Purchases and sales of investment securities, income and dividends received and expenses denominated in foreign currencies are translated into U.S. dollars at the exchange rate in effect on the transaction date.
The effects of exchange rate fluctuations on investments are included with the net realized and unrealized gain (loss) on investment securities. Other foreign currency transactions resulting in realized and unrealized gain (loss) are disclosed separately.
Investment Transactions and Income. For financial reporting purposes, the Fund's investment holdings and NAV include trades executed through the end of the last business day of the period. The NAV per share for processing shareholder transactions is calculated as of the close of business of the New York Stock Exchange (NYSE), normally 4:00 p.m. Eastern time and includes trades executed through the end of the prior business day. Gains and losses on securities sold are determined on the basis of identified cost and may include proceeds received from litigation. Dividend income is recorded on the ex-dividend date, except for certain dividends from foreign securities where the ex-dividend date may have passed, which are recorded as soon as the Fund is informed of the ex-dividend date. Non-cash dividends included in dividend income, if any, are recorded at the fair market value of the securities received. Distributions received on securities that represent a return of capital or capital gain are recorded as a reduction of cost of investments and/or as a realized gain. The Fund estimates the components of distributions received that may be considered return of capital distributions or capital gain distributions. Interest income and distributions from the Fidelity Central Funds are accrued as earned. Interest income includes coupon interest and amortization of premium and accretion of discount on debt securities. Investment income is recorded net of foreign taxes withheld where recovery of such taxes is uncertain.
Expenses. Expenses directly attributable to a fund are charged to that fund. Expenses attributable to more than one fund are allocated among the respective funds on the basis of relative net assets or other appropriate methods. Expense estimates are accrued in the period to which they relate and adjustments are made when actual amounts are known.
Income Tax Information and Distributions to Shareholders. Each year, the Fund intends to qualify as a regulated investment company, including distributing substantially all of its taxable income and realized gains under Subchapter M of the Internal Revenue Code and filing its U.S. federal tax return. As a result, no provision for income taxes is required. As of October 31, 2011, the Fund did not have any unrecognized tax benefits in the financial statements. A fund's federal tax return is subject to examination by the Internal Revenue Service (IRS) for a period of three years. Foreign taxes are provided for based on the Fund's understanding of the tax rules and rates that exist in the foreign markets in which it invests.
Distributions are declared and recorded on the ex-dividend date. Income dividends and capital gain distributions are declared separately for each class. Income and capital gain distributions are determined in accordance with income tax regulations, which may differ from GAAP. In addition, the Fund claimed a portion of the payment made to redeeming shareholders as a distribution for income tax purposes.
Capital accounts within the financial statements are adjusted for permanent book-tax differences. These adjustments have no impact on net assets or the results of operations. Temporary book-tax differences will reverse in a subsequent period.
Book-tax differences are primarily due to foreign currency transactions, passive foreign investment companies (PFIC), deferred trustees compensation, capital loss carryforwards and losses deferred due to wash sales.
The federal tax cost of investment securities and unrealized appreciation (depreciation) as of period end were as follows:
Gross unrealized appreciation | $ 495,347,698 |
Gross unrealized depreciation | (218,639,870) |
Net unrealized appreciation (depreciation) on securities and other investments | $ 276,707,828 |
| |
Tax Cost | $ 3,203,862,810 |
Annual Report
Notes to Financial Statements - continued
3. Significant Accounting Policies - continued
Income Tax Information and Distributions to Shareholders - continued
The tax-based components of distributable earnings as of period end were as follows:
Undistributed ordinary income | $ 36,916,395 |
Capital loss carryforward | $ (300,796,984) |
Net unrealized appreciation (depreciation) | $ 276,339,038 |
Under the recently enacted Regulated Investment Company Modernization Act of 2010 (the Act), the Fund will be permitted to carry forward capital losses incurred in taxable years beginning after December 22, 2010 for an unlimited period. However, any losses incurred during those future taxable years will be required to be utilized prior to any losses incurred in pre-enactment taxable years, which generally expire after eight years from when they are incurred. Additionally, post-enactment capital losses that are carried forward will retain their character as either short-term or long-term capital losses rather than being considered all short-term as under previous law. The Fund's first fiscal year end subject to the Act will be October 31, 2012.
The tax character of distributions paid was as follows:
| October 31, 2011 | October 31, 2010 |
Ordinary Income | $ 74,128,234 | $ 49,576,188 |
Short-Term Trading (Redemption) Fees. Shares held by investors in the Fund less than 90 days are subject to a redemption fee equal to 1.50% of the net asset value of shares redeemed. All redemption fees, which reduce the proceeds of the shareholder redemption, are retained by the Fund and accounted for as an addition to paid in capital.
New Accounting Pronouncement. In May 2011, the Financial Accounting Standards Board issued Accounting Standard Update No. 2011-04, Fair Value Measurement (Topic 820) - Amendments to Achieve Common Fair Value Measurement and Disclosure Requirements in U.S. GAAP and IFRSs. The update changes the wording used to describe the requirements in GAAP for measuring fair value and for disclosing information about fair value measurements. The update is effective during interim and annual periods beginning after December 15, 2011. Management is currently evaluating the impact of the update's adoption on the Fund's financial statement disclosures.
4. Operating Policies.
Delayed Delivery Transactions and When-Issued Securities. During the period, the Fund transacted in securities on a delayed delivery or when-issued basis. Payment and delivery may take place after the customary settlement period for that security. The price of the underlying securities and the date when the securities will be delivered and paid for are fixed at the time the transaction is negotiated. During the time a delayed delivery sell is outstanding, the contract is marked-to-market daily and equivalent deliverable securities are held for the transaction. The securities purchased on a delayed delivery or when-issued basis are identified as such in the Fund's Schedule of Investments. The Fund may receive compensation for interest forgone in the purchase of a delayed delivery or when-issued security. With respect to purchase commitments, the Fund identifies securities as segregated in its records with a value at least equal to the amount of the commitment. Losses may arise due to changes in the value of the underlying securities or if the counterparty does not perform under the contract's terms, or if the issuer does not issue the securities due to political, economic, or other factors.
Restricted Securities. The Fund may invest in securities that are subject to legal or contractual restrictions on resale. These securities generally may be resold in transactions exempt from registration or to the public if the securities are registered. Disposal of these securities may involve time-consuming negotiations and expense, and prompt sale at an acceptable price may be difficult. Information regarding restricted securities is included at the end of the Fund's Schedule of Investments.
5. Purchases and Sales of Investments.
Purchases and sales of securities, other than short-term securities, aggregated $5,419,965,479 and $6,262,037,839, respectively.
6. Fees and Other Transactions with Affiliates.
Management Fee. FMR and its affiliates provide the Fund with investment management related services for which the Fund pays a monthly management fee. The management fee is the sum of an individual fund fee rate that is based on an annual rate of .45% of the Fund's average net assets and a group fee rate that averaged .26% during the period. The group fee rate is based upon the average net assets of all the mutual funds advised by FMR. The group fee rate decreases as assets under management increase and increases as assets under management decrease. For the period, the total annual management fee rate was .71% of the Fund's average net assets.
Annual Report
6. Fees and Other Transactions with Affiliates - continued
Transfer Agent Fees. Fidelity Investments Institutional Operations Company, Inc. (FIIOC), an affiliate of FMR, is the transfer, dividend disbursing and shareholder servicing agent for each class of the Fund. FIIOC receives account fees and asset-based fees that vary according to the account size and type of account of the shareholders of Emerging Markets. FIIOC receives an asset based fee of Class K's average net assets. FIIOC pays for typesetting, printing and mailing of shareholder reports, except proxy statements. For the period, transfer agent fees for each class were as follows:
| Amount | % of
Average
Net Assets |
Emerging Markets | $ 9,274,632 | .25 |
Class K | 437,938 | .05 |
| $ 9,712,570 | |
Accounting and Security Lending Fees. Fidelity Service Company, Inc. (FSC), an affiliate of FMR, maintains the Fund's accounting records. The accounting fee is based on the level of average net assets for the month. Under a separate contract, FSC administers the security lending program. The security lending fee is based on the number and duration of lending transactions.
Brokerage Commissions. The Fund placed a portion of its portfolio transactions with brokerage firms which are affiliates of the investment adviser. The commissions paid to these affiliated firms were $2,431 for the period.
Interfund Lending Program. Pursuant to an Exemptive Order issued by the SEC, the Fund, along with other registered investment companies having management contracts with FMR, may participate in an interfund lending program. This program provides an alternative credit facility allowing the funds to borrow from, or lend money to, other participating affiliated funds. At period end, there were no interfund loans outstanding. The Fund's activity in this program during the period for which loans were outstanding was as follows:
Borrower or Lender | Average Daily
Loan Balance | Weighted Average Interest Rate | Interest
Expense |
Borrower | $ 11,313,279 | .39% | $ 5,301 |
7. Committed Line of Credit.
The Fund participates with other funds managed by FMR or an affiliate in a $4.0 billion credit facility (the "line of credit") to be utilized for temporary or emergency purposes to fund shareholder redemptions or for other short-term liquidity purposes. The Fund has agreed to pay commitment fees on its pro-rata portion of the line of credit, which amounted to $14,312 and is reflected in Miscellaneous expenses on the Statement of Operations. During the period, there were no borrowings on this line of credit.
8. Security Lending.
The Fund lends portfolio securities through a lending agent from time to time in order to earn additional income. For equity securities, a lending agent is used and may loan securities to certain qualified borrowers, including Fidelity Capital Markets (FCM), a broker-dealer affiliated with the Fund. On the settlement date of the loan, the Fund receives collateral (in the form of U.S. Treasury obligations, letters of credit and/or cash) against the loaned securities and maintains collateral in an amount not less than 100% of the market value of the loaned securities during the period of the loan. The market value of the loaned securities is determined at the close of business of the Fund and any additional required collateral is delivered to the Fund on the next business day. If the borrower defaults on its obligation to return the securities loaned because of insolvency or other reasons, a fund could experience delays and costs in recovering the securities loaned or in gaining access to the collateral. Any cash collateral received is invested in the Fidelity Securities Lending Cash Central Fund. The value of loaned securities and cash collateral at period end are disclosed on the Fund's Statement of Assets and Liabilities. Security lending income represents the income earned on investing cash collateral, less rebates paid to borrowers and any lending agent fees associated with the loan, plus any premium payments received for lending certain types of securities. Security lending income is presented in the Statement of Operations as a component of income from Fidelity Central Funds. Total security lending income during the period amounted to $1,194,501. During the period, there were no securities loaned to FCM.
9. Bank Borrowings.
The Fund is permitted to have bank borrowings for temporary or emergency purposes to fund shareholder redemptions or for other short-term liquidity requirements. The Fund has established borrowing arrangements with certain banks. The interest rate on the borrowings is the bank's base rate, as revised from time to time. The average daily loan balance during the period for which loans were outstanding amounted to $26,847,381. The weighted average interest rate was .65%. The interest expense amounted to $10,166 under the bank borrowing program. At period end, there were no bank borrowings outstanding.
Annual Report
Notes to Financial Statements - continued
10. Expense Reductions.
Many of the brokers with whom FMR places trades on behalf of the Fund provided services to the Fund in addition to trade execution. These services included payments of certain expenses on behalf of the Fund totaling $2,922,033 for the period. In addition, through arrangements with the Fund's custodian, credits realized as a result of uninvested cash balances were used to reduce the Fund's expenses. During the period, these credits reduced the Fund's custody expenses by $421.
11. Distributions to Shareholders.
Distributions to shareholders of each class were as follows:
Years ended October 31, | 2011 | 2010 |
From net investment income | | |
Emerging Markets | $ 38,140,950 | $ 21,030,807 |
Class K | 11,296,849 | 2,128,426 |
Total | $ 49,437,799 | $ 23,159,233 |
From net realized gain | | |
Emerging Markets | $ 20,164,680 | $ 24,475,486 |
Class K | 4,525,755 | 1,941,469 |
Total | $ 24,690,435 | $ 26,416,955 |
12. Share Transactions.
Transactions for each class of shares were as follows:
| Shares | Dollars |
Years ended October 31, | 2011 | 2010 | 2011 | 2010 |
Emerging Markets | | | | |
Shares sold | 35,985,818 | 69,154,267 | $ 924,231,122 | $ 1,590,197,264 |
Reinvestment of distributions | 2,151,168 | 1,952,719 | 55,865,828 | 43,877,566 |
Shares redeemed | (61,852,310) | (92,999,725) | (1,567,144,468) | (2,095,951,354) |
Net increase (decrease) | (23,715,324) | (21,892,739) | $ (587,047,518) | $ (461,876,524) |
Class K | | | | |
Shares sold | 11,514,792 | 28,708,422 | $ 289,925,357 | $ 648,209,971 |
Reinvestment of distributions | 610,205 | 181,368 | 15,822,605 | 4,069,895 |
Shares redeemed | (24,238,483) | (7,437,639) | (577,946,139) | (167,338,288) |
Net increase (decrease) | (12,113,486) | 21,452,151 | $ (272,198,177) | $ 484,941,578 |
13. Other.
The Fund's organizational documents provide former and current trustees and officers with a limited indemnification against liabilities arising in connection with the performance of their duties to the Fund. In the normal course of business, the Fund may also enter into contracts that provide general indemnifications. The Fund's maximum exposure under these arrangements is unknown as this would be dependent on future claims that may be made against the Fund. The risk of material loss from such claims is considered remote.
Annual Report
Report of Independent Registered Public Accounting Firm
To the Trustees of Fidelity Investment Trust and the Shareholders of Fidelity Emerging Markets Fund:
In our opinion, the accompanying statement of assets and liabilities, including the schedule of investments, and the related statements of operations and of changes in net assets and the financial highlights present fairly, in all material respects, the financial position of Fidelity Emerging Markets Fund (a fund of Fidelity Investment Trust) at October 31, 2011, the results of its operations for the year then ended, the changes in its net assets for each of the two years in the period then ended and the financial highlights for each of the periods indicated, in conformity with accounting principles generally accepted in the United States of America. These financial statements and financial highlights (hereafter referred to as "financial statements") are the responsibility of the Fidelity Emerging Markets Fund's management. Our responsibility is to express an opinion on these financial statements based on our audits. We conducted our audits of these financial statements in accordance with the standards of the Public Company Accounting Oversight Board (United States). Those standards require that we plan and perform the audit to obtain reasonable assurance about whether the financial statements are free of material misstatement. An audit includes examining, on a test basis, evidence supporting the amounts and disclosures in the financial statements, assessing the accounting principles used and significant estimates made by management, and evaluating the overall financial statement presentation. We believe that our audits, which included confirmation of securities at October 31, 2011 by correspondence with the custodian and brokers, provide a reasonable basis for our opinion.
PricewaterhouseCoopers LLP
Boston, Massachusetts
December 16, 2011
Annual Report
The Trustees, Members of the Advisory Board, and executive officers of the trust and fund, as applicable, are listed below. The Board of Trustees governs the fund and is responsible for protecting the interests of shareholders. The Trustees are experienced executives who meet periodically throughout the year to oversee the fund's activities, review contractual arrangements with companies that provide services to the fund, oversee management of the risks associated with such activities and contractual arrangements, and review the fund's performance. Except for James C. Curvey, each of the Trustees oversees 226 funds advised by FMR or an affiliate. Mr. Curvey oversees 429 funds advised by FMR or an affiliate.
The Trustees hold office without limit in time except that (a) any Trustee may resign; (b) any Trustee may be removed by written instrument, signed by at least two-thirds of the number of Trustees prior to such removal; (c) any Trustee who requests to be retired or who has become incapacitated by illness or injury may be retired by written instrument signed by a majority of the other Trustees; and (d) any Trustee may be removed at any special meeting of shareholders by a two-thirds vote of the outstanding voting securities of the trust. Each Trustee who is not an interested person (as defined in the 1940 Act) (Independent Trustee), shall retire not later than the last day of the calendar year in which his or her 75th birthday occurs. The Independent Trustees may waive this mandatory retirement age policy with respect to individual Trustees. The executive officers and Advisory Board Members hold office without limit in time, except that any officer and Advisory Board Member may resign or may be removed by a vote of a majority of the Trustees at any regular meeting or any special meeting of the Trustees. Except as indicated, each individual has held the office shown or other offices in the same company for the past five years.
Experience, Skills, Attributes, and Qualifications of the Fund's Trustees. The Governance and Nominating Committee has adopted a statement of policy that describes the experience, qualifications, attributes, and skills that are necessary and desirable for potential Independent Trustee candidates (Statement of Policy). The Board believes that each Trustee satisfied at the time he or she was initially elected or appointed a Trustee, and continues to satisfy, the standards contemplated by the Statement of Policy. The Governance and Nominating Committee also engages professional search firms to help identify potential Independent Trustee candidates who have the experience, qualifications, attributes, and skills consistent with the Statement of Policy. From time to time, additional criteria based on the composition and skills of the current Independent Trustees, as well as experience or skills that may be appropriate in light of future changes to board composition, business conditions, and regulatory or other developments, have also been considered by the professional search firms and the Governance and Nominating Committee. In addition, the Board takes into account the Trustees' commitment and participation in Board and committee meetings, as well as their leadership of standing and ad hoc committees throughout their tenure.
In determining that a particular Trustee was and continues to be qualified to serve as a Trustee, the Board has considered a variety of criteria, none of which, in isolation, was controlling. The Board believes that, collectively, the Trustees have balanced and diverse experience, qualifications, attributes, and skills, which allow the Board to operate effectively in governing the fund and protecting the interests of shareholders. Information about the specific experience, skills, attributes, and qualifications of each Trustee, which in each case led to the Board's conclusion that the Trustee should serve (or continue to serve) as a trustee of the fund, is provided below.
Board Structure and Oversight Function. James C. Curvey is an interested person (as defined in the 1940 Act) and currently serves as Acting Chairman. The Trustees have determined that an interested Chairman is appropriate and benefits shareholders because an interested Chairman has a personal and professional stake in the quality and continuity of services provided to the fund. Independent Trustees exercise their informed business judgment to appoint an individual of their choosing to serve as Chairman, regardless of whether the Trustee happens to be independent or a member of management. The Independent Trustees have determined that they can act independently and effectively without having an Independent Trustee serve as Chairman and that a key structural component for assuring that they are in a position to do so is for the Independent Trustees to constitute a substantial majority for the Board. The Independent Trustees also regularly meet in executive session. Ned C. Lautenbach serves as Chairman of the Independent Trustees and as such (i) acts as a liaison between the Independent Trustees and management with respect to matters important to the Independent Trustees and (ii) with management prepares agendas for Board meetings.
Fidelity funds are overseen by different Boards of Trustees. The fund's Board oversees Fidelity's equity and high income funds and another Board oversees Fidelity's investment-grade bond, money market, and asset allocation funds. The asset allocation funds may invest in Fidelity funds overseen by the fund's Board. The use of separate Boards, each with its own committee structure, allows the Trustees of each group of Fidelity funds to focus on the unique issues of the funds they oversee, including common research, investment, and operational issues. On occasion, the separate Boards establish joint committees to address issues of overlapping consequences for the Fidelity funds overseen by each Board.
The Trustees operate using a system of committees to facilitate the timely and efficient consideration of all matters of importance to the Trustees, the fund, and fund shareholders and to facilitate compliance with legal and regulatory requirements and oversight of the fund's activities and associated risks. The Board, acting through its committees, has charged FMR and its affiliates with (i) identifying events or circumstances the occurrence of which could have demonstrably adverse effects on the fund's business and/or reputation; (ii) implementing processes and controls to lessen the possibility that such events or circumstances occur or to mitigate the effects of such events or circumstances if they do occur; and (iii) creating and maintaining a system designed to evaluate continuously business and market conditions in order to facilitate the identification and implementation processes described in (i) and (ii) above. Because the day-to-day operations and activities of the fund are carried out by or through FMR, its affiliates and other service providers, the fund's exposure to risks is mitigated but not eliminated by the processes overseen by the Trustees. While each of the Board's committees has responsibility for overseeing different aspects of the fund's activities, oversight is exercised primarily through the Operations, Audit, and Compliance Committees. In addition, the Independent Trustees have worked with FMR to enhance the Board's oversight of investment and financial risks, legal and regulatory risks, technology risks, and operational risks, including the development of additional risk reporting to the Board. For example, a working group comprised of Independent Trustees and FMR has worked and continues to work to review the Fidelity funds' valuation-related activities, reporting and risk management. Appropriate personnel, including but not limited to the fund's Chief Compliance Officer (CCO), FMR's internal auditor, the independent accountants, the fund's Treasurer and portfolio management personnel, make periodic reports to the Board's committees, as appropriate, including an annual review of FMR's risk management program for the Fidelity funds. The responsibilities of each standing committee, including their oversight responsibilities, are described further under "Standing Committees of the Fund's Trustees."
Annual Report
The fund's Statement of Additional Information (SAI) includes more information about the Trustees. To request a free copy, call Fidelity at 1-800-835-5092.
Interested Trustees*:
Correspondence intended for each Trustee who is an interested person may be sent to Fidelity Investments, 82 Devonshire Street, Boston, Massachusetts 02109.
Name, Age; Principal Occupations and Other Relevant Experience+ |
James C. Curvey (76) |
| Year of Election or Appointment: 2007 Mr. Curvey is Trustee and Acting Chairman of the Board of Trustees of certain Trusts. Mr. Curvey also serves as Trustee (2007-present) of other investment companies advised by FMR. Mr. Curvey is a Director of Fidelity Investments Money Management, Inc. (2009-present), Director of Fidelity Research & Analysis Co. (2009-present) and Director of FMR and FMR Co., Inc. (2007-present). Mr. Curvey is also Vice Chairman (2007-present) and Director of FMR LLC. In addition, Mr. Curvey serves as an Overseer for the Boston Symphony Orchestra and a member of the Trustees of Villanova University. Previously, Mr. Curvey was the Vice Chairman (2006-2007) and Director (2000-2007) of FMR Corp. |
Ronald P. O'Hanley (54) |
| Year of Election or Appointment: 2011 Mr. O'Hanley is Director of FMR Co., Inc. (2010-present), Director of Fidelity Investments Money Management, Inc. (2010-present), Director of Fidelity Research & Analysis Company (2010-present), President of Fidelity Asset Management and Corporate Services and a member of Fidelity's Executive Committee (2010-present). Previously, Mr. O'Hanley served as President and Chief Executive Officer of BNY Mellon Asset Management (2007-2010). Mr. O'Hanley also served as Vice Chairman of Bank New York Mellon Corp. and a member of that firm's Executive Committee. Prior to the 2007 merger of The Bank of New York and Mellon Financial Corporation, he was Vice Chairman of Mellon Financial Corporation and President and Chief Executive Officer of Mellon Asset Management. He joined Mellon in February 1997. Mr. O'Hanley currently serves as Chairman of the Boston Public Library Foundation Board of Directors and sits on the Board of Directors of Beth Israel Deaconess Medical Center, the Board of Trustees of the Marine Biological Laboratory and the Advisory Board of the Maxwell School of Citizenship and Public Administration at Syracuse University. Mr. O'Hanley also chairs the Council on Asset Management for the Financial Services Roundtable and is a member of the Board of Directors of Institutional Investor's U.S. Institute. |
* Trustees have been determined to be "Interested Trustees" by virtue of, among other things, their affiliation with the trust or various entities under common control with FMR.
+ The information above includes each Trustee's principal occupation during the last five years and other information relating to the experience, attributes, and skills relevant to each Trustee's qualifications to serve as a Trustee, which led to the conclusion that each Trustee should serve as a Trustee for the fund.
Independent Trustees:
Correspondence intended for each Independent Trustee (that is, the Trustees other than the Interested Trustees) may be sent to Fidelity Investments, P.O. Box 55235, Boston, Massachusetts 02205-5235.
Name, Age; Principal Occupations and Other Relevant Experience+ |
Dennis J. Dirks (63) |
| Year of Election or Appointment: 2005 Prior to his retirement in May 2003, Mr. Dirks was Chief Operating Officer and a member of the Board of The Depository Trust & Clearing Corporation (DTCC). He also served as President, Chief Operating Officer, and Board member of The Depository Trust Company (DTC) and President and Board member of the National Securities Clearing Corporation (NSCC). In addition, Mr. Dirks served as Chief Executive Officer and Board member of the Government Securities Clearing Corporation, Chief Executive Officer and Board member of the Mortgage-Backed Securities Clearing Corporation, as a Trustee and a member of the Finance Committee of Manhattan College (2005-2008), and as a Trustee and a member of the Finance Committee of AHRC of Nassau County (2006-2008). Mr. Dirks is a member of the Independent Directors Council (IDC) Governing Council (2010-Present) and Board of Directors for The Brookville Center for Children's Services, Inc. (2009-present). |
Alan J. Lacy (58) |
| Year of Election or Appointment: 2008 Mr. Lacy serves as Senior Adviser (2007-present) of Oak Hill Capital Partners, L.P. (private equity). Mr. Lacy also served as Chief Executive Officer (2000-2005) and Vice Chairman (2005-2006) of Sears Holdings Corporation and Sears, Roebuck and Co. (retail). In addition, Mr. Lacy serves as a member of the Board of Directors of Dave & Buster's, Inc. (restaurant and entertainment complexes, 2010-present), The Hillman Companies, Inc. (hardware wholesalers, 2010-present), and Bristol-Myers Squibb Company (global pharmaceuticals, 2007-present). Mr. Lacy is a member of the Board of Trustees of The National Parks Conservation Association (2006-Present). Previously, Mr. Lacy served as Chairman of the Board of Trustees of the National Parks Conservation Association (2008-2011) and as a member of the Board of Directors for the Western Union Company (global money transfer, 2006-2011). |
Ned C. Lautenbach (67) |
| Year of Election or Appointment: 2000 Mr. Lautenbach is Chairman of the Independent Trustees of the Equity and High Income Funds (2006-present). Mr. Lautenbach currently serves as the Lead Director of the Eaton Corporation Board of Directors (diversified industrial, 1997-present). Mr. Lautenbach is also a member of the Board of Directors of the Philharmonic Center for the Arts in Naples, Florida (1999-present); a member of the Board of Trustees of Fairfield University (2005-present); and a member of the Council on Foreign Relations (1994-present). Previously, Mr. Lautenbach was a Partner/Advisory Partner at Clayton, Dubilier & Rice, LLC (private equity investment, 1998-2010), as well as a Director of Sony Corporation (2006-2007). |
Joseph Mauriello (67) |
| Year of Election or Appointment: 2008 Prior to his retirement in January 2006, Mr. Mauriello served in numerous senior management positions including Deputy Chairman and Chief Operating Officer (2004-2005), and Vice Chairman of Financial Services (2002-2004) of KPMG LLP US (professional services, 1965-2005). Mr. Mauriello currently serves as a member of the Board of Directors of XL Group plc. (global insurance and re-insurance, 2006-present) and of Arcadia Resources Inc. (health care services and products, 2007-present). Previously, Mr. Mauriello served as a Director of the Hamilton Funds of the Bank of New York (2006-2007). |
Robert W. Selander (61) |
| Year of Election or Appointment: 2011 Previously, Mr. Selander served as a Member of the Advisory Board of Fidelity's Equity and High Income Funds (2011), Executive Vice Chairman (2010), Chief Executive Officer (2009-2010), and President and Chief Executive Officer (1997-2009) of Mastercard, Inc. |
Cornelia M. Small (67) |
| Year of Election or Appointment: 2005 Ms. Small is a member of the Board of Directors of the Teagle Foundation (2009-present). Ms. Small is also a member of the Investment Committee, and Chair (2008-present) and a member of the Board of Trustees of Smith College. In addition, Ms. Small serves on the Investment Committee of the Berkshire Taconic Community Foundation (2008-present). Previously, Ms. Small served as Chairperson of the Investment Committee (2002-2008) of Smith College. In addition, Ms. Small served as Chief Investment Officer, Director of Global Equity Investments, and a member of the Board of Directors of Scudder, Stevens & Clark and Scudder Kemper Investments. |
William S. Stavropoulos (72) |
| Year of Election or Appointment: 2001 Mr. Stavropoulos is Vice Chairman of the Independent Trustees of the Equity and High Income Funds (2006-present). Mr. Stavropoulos serves as President and Founder of the Michigan Baseball Foundation, the Great Lakes Loons (2007-present). Mr. Stavropoulos is Chairman Emeritus of the Board of Directors of The Dow Chemical Company, where he previously served in numerous senior management positions, including President, CEO (1995-2000; 2002-2004), Chairman of the Executive Committee (2000-2006), and as a member of the Board of Directors (1990-2006). Currently, Mr. Stavropoulos is Chairman of Univar (global distributor of commodity and specialty chemicals, 2010-present), a Director of Teradata Corporation (data warehousing and technology solutions, 2008-present), Chemical Financial Corporation, Maersk Inc. (industrial conglomerate), Tyco International, Inc. (multinational manufacturing and services, 2007-present), and a member of the Advisory Board for Metalmark Capital (private equity investment, 2005-present). Mr. Stavropoulos is a special advisor to Clayton, Dubilier & Rice, LLC (private equity investment). In addition, Mr. Stavropoulos is a member of the University of Notre Dame Advisory Council for the College of Science. |
David M. Thomas (62) |
| Year of Election or Appointment: 2008 Previously, Mr. Thomas served as Executive Chairman (2005-2006) and Chairman and Chief Executive Officer (2000-2005) of IMS Health, Inc. (pharmaceutical and healthcare information solutions). In addition, Mr. Thomas serves as a member of the Board of Directors of Fortune Brands, Inc. (consumer products), and Interpublic Group of Companies, Inc. (marketing communication, 2004-present). |
Michael E. Wiley (61) |
| Year of Election or Appointment: 2008 Mr. Wiley also serves as a Director of Asia Pacific Exploration Consolidated (international oil and gas exploration and production, 2008-present). Mr. Wiley serves as a Director of Tesoro Corporation (independent oil refiner and marketer, 2005-present), and a Director of Bill Barrett Corporation (exploration and production, 2005-present). In addition, Mr. Wiley also serves as a Director of Post Oak Bank (privately-held bank, 2004-present). Previously, Mr. Wiley served as a member of the Board of Trustees of the University of Tulsa (2000-2006; 2007-2010), as a Senior Energy Advisor of Katzenbach Partners, LLC (consulting, 2006-2007), as an Advisory Director of Riverstone Holdings (private investment), Chairman, President, and CEO of Baker Hughes, Inc. (oilfield services, 2000-2004), and as Director of Spinnaker Exploration Company (exploration and production, 2001-2005). |
+ The information above includes each Trustee's principal occupation during the last five years and other information relating to the experience, attributes, and skills relevant to each Trustee's qualifications to serve as a Trustee, which led to the conclusion that each Trustee should serve as a Trustee for the fund.
Advisory Board Members and Executive Officers:
Correspondence intended for each executive officer, Edward C. Johnson 3d, and Peter S. Lynch may be sent to Fidelity Investments, 82 Devonshire Street, Boston, Massachusetts 02109.
Name, Age; Principal Occupation |
Edward C. Johnson 3d (81) |
| Year of Election or Appointment: 2011 Member of the Advisory Board of Fidelity's Equity and High Income Funds. Mr. Johnson serves as Chief Executive Officer, Chairman, and a Director of FMR LLC, and also serves as Chairman and Director of FIL Limited. Previously, Mr. Johnson served as a Trustee and Chairman of the Board of certain Fidelity Trusts, Chairman and a Director of FMR, Chairman and a Director of FMR Co., Inc., and President of FMR LLC (2006-2007). |
Peter S. Lynch (67) |
| Year of Election or Appointment: 2003 Member of the Advisory Board of Fidelity's Equity and High Income Funds. Mr. Lynch is Vice Chairman and a Director of FMR and FMR Co., Inc. In addition, Mr. Lynch serves as a Trustee of Boston College and as the Chairman of the Inner-City Scholarship Fund. Previously, Mr. Lynch served on the Special Olympics International Board of Directors (1997-2006). |
Kenneth B. Robins (42) |
| Year of Election or Appointment: 2008 President and Treasurer of Fidelity's Equity and High Income Funds. Mr. Robins also serves as President and Treasurer (2010-present) and Assistant Treasurer (2009-present) of other Fidelity funds and is an employee of Fidelity Investments (2004-present). Previously, Mr. Robins served as Deputy Treasurer of the Fidelity funds (2005-2008) and Treasurer and Chief Financial Officer of The North Carolina Capital Management Trust: Cash and Term Portfolios (2006-2008). |
Bruce T. Herring (46) |
| Year of Election or Appointment: 2006 Vice President of certain Equity Funds. Mr. Herring also serves as Chief Investment Officer and Director of Fidelity Management & Research (U.K.) Inc. (2010-present) and Group Chief Investments Officer of FMR. Previously, Mr. Herring served as Vice President (2005-2006) and Senior Vice President (2006-2007) of Fidelity Management & Research Company, Vice President of FMR Co., Inc. (2001-2007) and as a portfolio manager for Fidelity U.S. Equity Funds. |
Brian B. Hogan (47) |
| Year of Election or Appointment: 2009 Vice President of Equity and High Income Funds. Mr. Hogan also serves as President of FMR's Equity Division (2009-present). Previously, Mr. Hogan served as Senior Vice President, Equity Research of FMR (2006-2009) and as a portfolio manager. |
Scott C. Goebel (43) |
| Year of Election or Appointment: 2008 Secretary and Chief Legal Officer (CLO) of the Fidelity funds. Mr. Goebel also serves as Secretary of Fidelity Investments Money Management, Inc. (FIMM) (2010-present) and Fidelity Research and Analysis Company (FRAC) (2010-present); Secretary and CLO of The North Carolina Capital Management Trust: Cash and Term Portfolios (2008-present); General Counsel, Secretary, and Senior Vice President of FMR (2008-present) and FMR Co., Inc. (2008-present); employed by FMR LLC or an affiliate (2001-present); Chief Legal Officer of Fidelity Management & Research (Hong Kong) Limited (2008-present) and Assistant Secretary of Fidelity Management & Research (Japan) Inc. (2008-present), and Fidelity Management & Research (U.K.) Inc. (2008-present). Previously, Mr. Goebel served as Assistant Secretary of FIMM (2008-2010), FRAC (2008-2010), and the Funds (2007-2008) and as Vice President and Secretary of Fidelity Distributors Corporation (FDC) (2005-2007). |
William C. Coffey (42) |
| Year of Election or Appointment: 2009 Assistant Secretary of Fidelity's Equity and High Income Funds. Mr. Coffey also serves as Senior Vice President and Deputy General Counsel of FMR LLC (2010-present), and is an employee of Fidelity Investments. Previously, Mr. Coffey served as Vice President and Associate General Counsel of FMR LLC (2005-2009). |
Holly C. Laurent (57) |
| Year of Election or Appointment: 2008 Anti-Money Laundering (AML) Officer of the Fidelity funds. Ms. Laurent also serves as AML Officer of The North Carolina Capital Management Trust: Cash and Term Portfolios (2008-present) and is an employee of Fidelity Investments. Previously, Ms. Laurent was Senior Vice President and Head of Legal for Fidelity Business Services India Pvt. Ltd. (2006-2008), and Senior Vice President, Deputy General Counsel and Group Head for FMR LLC (2005-2006). |
Christine Reynolds (53) |
| Year of Election or Appointment: 2008 Chief Financial Officer of the Fidelity funds. Ms. Reynolds became President of Fidelity Pricing and Cash Management Services (FPCMS) in August 2008. Ms. Reynolds served as Chief Operating Officer of FPCMS (2007-2008). Previously, Ms. Reynolds served as President, Treasurer, and Anti-Money Laundering officer of the Fidelity funds (2004-2007). |
Kenneth A. Rathgeber (64) |
| Year of Election or Appointment: 2004 Chief Compliance Officer of Fidelity's Equity and High Income Funds. Mr. Rathgeber is Chief Compliance Officer of Fidelity Management & Research (Hong Kong) Limited (2008-present), Fidelity Management & Research (Japan) Inc. (2008-present), FMR (2005-present), FMR Co., Inc. (2005-present), Fidelity Management & Research (U.K.) Inc. (2005-present), Fidelity Research & Analysis Company (2005-present), Fidelity Investments Money Management, Inc. (2005-present), Pyramis Global Advisors, LLC (2005-present), and Strategic Advisers, Inc. (2005-present). |
Jeffrey S. Christian (50) |
| Year of Election or Appointment: 2009 Deputy Treasurer of the Fidelity funds. Mr. Christian is an employee of Fidelity Investments. Previously, Mr. Christian served as Chief Financial Officer (2008-2009) of certain Fidelity funds and Senior Vice President of Fidelity Pricing and Cash Management Services (FPCMS) (2004-2009). |
Joseph F. Zambello (54) |
| Year of Election or Appointment: 2011 Deputy Treasurer of the Fidelity funds. Mr. Zambello is an employee of Fidelity Investments. Previously, Mr. Zambello served as Vice President of FMR's Program Management Group (2009-2011) and Vice President of the Transfer Agent Oversight Group (2005-2009). |
Adrien E. Deberghes (44) |
| Year of Election or Appointment: 2008 Deputy Treasurer of Fidelity's Equity and High Income Funds. Mr. Deberghes also serves as Vice President and Assistant Treasurer of Fidelity Rutland Square Trust II and Fidelity Commonwealth Trust II (2011-present), Assistant Treasurer of other Fidelity funds (2010-present), and is an employee of Fidelity Investments (2008-present). Previously, Mr. Deberghes served as Senior Vice President of Mutual Fund Administration at State Street Corporation (2007-2008), Senior Director of Mutual Fund Administration at Investors Bank & Trust (2005-2007), and Director of Finance for Dunkin' Brands (2000-2005). |
Stephanie J. Dorsey (42) |
| Year of Election or Appointment: 2010 Assistant Treasurer of Fidelity's Equity and High Income Funds. Ms. Dorsey also serves as Deputy Treasurer of other Fidelity funds (2008-present) and is an employee of Fidelity Investments (2008-present). Previously, Ms. Dorsey served as Treasurer (2004-2008) of the JPMorgan Mutual Funds and Vice President (2004-2008) of JPMorgan Chase Bank. |
John R. Hebble (53) |
| Year of Election or Appointment: 2009 Assistant Treasurer of Fidelity's Equity and High Income Funds. Mr. Hebble also serves as President (2011-present), Treasurer, and Chief Financial Officer of The North Carolina Capital Management Trust: Cash and Term Portfolios (2008-present), President and Treasurer of other Fidelity funds (2008-present) and is an employee of Fidelity Investments. |
Gary W. Ryan (53) |
| Year of Election or Appointment: 2005 Assistant Treasurer of the Fidelity funds. Mr. Ryan is an employee of Fidelity Investments. Previously, Mr. Ryan served as Vice President of Fund Reporting in Fidelity Pricing and Cash Management Services (FPCMS) (1999-2005). |
Jonathan Davis (43) |
| Year of Election or Appointment: 2010 Assistant Treasurer of the Fidelity funds. Mr. Davis is also Assistant Treasurer of Fidelity Rutland Square Trust II and Fidelity Commonwealth Trust II. Mr. Davis is an employee of Fidelity Investments. Previously, Mr. Davis served as Vice President and Associate General Counsel of FMR LLC (2003-2010). |
Annual Report
The Board of Trustees of Fidelity Emerging Markets Fund voted to pay to shareholders of record at the opening of business on record date, the following distributions per share derived from capital gains realized from sales of portfolio securities and dividends derived from net investment income:
| Pay Date | Record Date | Dividends | Capital Gains |
Class K | 12/05/11 | 12/02/11 | $0.350 | - |
Class K designates 79% of the dividend distributed in December during the fiscal year as amounts which may be taken into account as a dividend for the purposes of the maximum rate under section 1(h)(11) of the Internal Revenue Code.
The amounts per share which represent income derived from sources within, and taxes paid to, foreign countries or possessions of the United States are $0.358 and $0.0586 for the dividend paid December 6, 2010.
The fund will notify shareholders in January 2012 of amounts for use in preparing 2011 income tax returns.
Annual Report
Board Approval of Investment Advisory Contracts and Management Fees
Fidelity Emerging Markets Fund
Each year, the Board of Trustees, including the Independent Trustees (together, the Board), votes on the renewal of the management contract and sub-advisory agreements (together, the Advisory Contracts) for the fund. The Board, assisted by the advice of fund counsel and Independent Trustees' counsel, requests and considers a broad range of information relevant to the renewal of the Advisory Contracts throughout the year.
The Board meets regularly and considers at each of its meetings factors that are relevant to its annual consideration of the renewal of the fund's Advisory Contracts, including the services and support provided to the fund and its shareholders. The Board has established various standing committees, each composed of Independent Trustees with varying backgrounds, to which the Board has assigned specific subject matter responsibilities in order to enhance effective decision-making by the Board. The Board, acting directly and through its Committees, requests and receives information concerning the annual consideration of the renewal of the fund's Advisory Contracts. The Board also meets as needed to consider matters specifically related to the Board's annual consideration of the renewal of Advisory Contracts. Members of the Board may also meet with trustees of other Fidelity funds through ad hoc joint committees to discuss certain matters relevant to the Fidelity funds.
At its July 2011 meeting, the Board of Trustees, including the Independent Trustees, unanimously determined to renew the fund's Advisory Contracts. In reaching its determination, the Board considered all factors it believed relevant, including (i) the nature, extent, and quality of the services to be provided to the fund and its shareholders (including the investment performance of the fund); (ii) the competitiveness of the fund's management fee and total expense ratio; (iii) the total costs of the services to be provided by and the profits to be realized by Fidelity from its relationship with the fund; (iv) the extent to which economies of scale would be realized as the fund grows; and (v) whether fee levels reflect these economies of scale, if any, for the benefit of fund shareholders.
In considering whether to renew the Advisory Contracts for the fund, the Board reached a determination, with the assistance of fund counsel and Independent Trustees' counsel and through the exercise of its business judgment, that the renewal of the Advisory Contracts is in the best interests of the fund and its shareholders and that the compensation payable under the Advisory Contracts is fair and reasonable. The Board's decision to renew the Advisory Contracts was not based on any single factor, but rather was based on a comprehensive consideration of all the information provided to the Board at its meetings throughout the year. The Board, in reaching its determination to renew the Advisory Contracts, is aware that shareholders in the fund have a broad range of investment choices available to them, including a wide choice among mutual funds offered by Fidelity's competitors, and that the fund's shareholders, who have the opportunity to review and weigh the disclosure provided by the fund in its prospectus and other public disclosures, have chosen to invest in this fund, managed by Fidelity.
Nature, Extent, and Quality of Services Provided. The Board considered the staffing within the investment adviser, FMR, and the sub-advisers (together, the Investment Advisers), including the backgrounds of the fund's investment personnel and the fund's investment objective and discipline. The Independent Trustees also had discussions with senior management of Fidelity's investment operations and investment groups. The Board considered the structure of the portfolio manager compensation program and whether this structure provides appropriate incentives to act in the best interests of the fund.
Resources Dedicated to Investment Management and Support Services. The Board and the Fund Oversight and Research Committees reviewed the general qualifications and capabilities of the Investment Advisers' investment staff, including its size, education, experience, and resources, as well as the Investment Advisers' approach to recruiting, training, managing, and compensating investment personnel. The Board also noted that FMR has devoted increased resources to non-U.S. offices. The Board noted that Fidelity's analysts have extensive resources, tools and capabilities which allow them to conduct sophisticated quantitative and fundamental analysis, as well as credit analysis of issuers, counterparties and enhancers. The Board also believes that Fidelity's investment professionals have sufficient access to global information and data so as to provide competitive investment results over time, and that those professionals also have access to sophisticated tools which permit them to assess portfolio construction and risk and performance attribution characteristics continuously, as well as to transmit new information and research conclusions rapidly around the world. Additionally, in their deliberations, the Board considered the Investment Advisers' trading capabilities and resources which are an integral part of the investment management process.
Shareholder and Administrative Services. The Board considered (i) the nature, extent, quality, and cost of advisory, administrative, and shareholder services performed by the Investment Advisers and their affiliates under the Advisory Contracts and under separate agreements covering transfer agency, pricing and bookkeeping, and securities lending services for the fund; (ii) the nature and extent of the investment adviser's supervision of third party service providers, principally custodians and subcustodians; and (iii) the resources devoted to, and the record of compliance with, the fund's compliance policies and procedures. The Board also reviewed the allocation of fund brokerage, including allocations to brokers affiliated with the Investment Advisers, the use of brokerage commissions to pay fund expenses, and the use of "soft" commission dollars to pay for research services.
The Board noted that the growth of fund assets over time across the complex allows Fidelity to reinvest in the development of services designed to enhance the value or convenience of the Fidelity funds as investment vehicles. These services include 24-hour access to account information and market information through telephone representatives and over the Internet, investor education materials and asset allocation tools, and the expanded availability of Fidelity Investor Centers, with 35 new branches opening since 2010.
Annual Report
Board Approval of Investment Advisory Contracts and Management Fees - continued
Investment in a Large Fund Family. The Board considered the benefits to shareholders of investing in a Fidelity fund, including the benefits of investing in a fund that is part of a large family of funds offering a variety of investment disciplines and providing a large variety of mutual fund investor services. The Board noted that Fidelity had taken, or had made recommendations that resulted in the Fidelity funds taking, a number of actions over the previous year that benefited particular funds, including (i) continuing to dedicate additional resources to investment research and support of the senior management team that oversees asset management; (ii) rationalizing product lines through the mergers of six funds into other funds; (iii) continuing to migrate the Freedom Funds to dedicated lower cost underlying funds; (iv) obtaining shareholder approval to broaden the investment strategies for Fidelity Consumer Finance Portfolio, Fidelity Emerging Asia Fund, and Fidelity Environment and Alternative Energy Portfolio; (v) contractually agreeing to reduce the management fees and impose other expense limitations on Spartan 500 Index Fund and U.S. Bond Index Fund in connection with launching new institutional classes of these funds; (vi) changing the name, primary and supplemental benchmarks, and investment policies of Fidelity Global Strategies Fund to support the fund's flexible investment mandate and global orientation; and (vii) reducing the transfer agency account fee rates on certain accounts.
Investment Performance. The Board considered whether the fund has operated in accordance with its investment objective, as well as its record of compliance with its investment restrictions. It also reviewed the fund's absolute investment performance for each class, as well as the fund's relative investment performance for each class measured over multiple periods against (i) a broad-based securities market index, and (ii) a peer group of mutual funds deemed appropriate by Fidelity and reviewed by the Board. The following charts considered by the Board show, over the one-, three-, and five-year periods ended December 31, 2010, as available, the cumulative total returns of Class K and the retail class of the fund, the cumulative total returns of a broad-based securities market index ("benchmark"), and a range of cumulative total returns of a peer group of mutual funds identified by Morningstar, Inc. as having an investment style similar to that of the fund based on underlying portfolio holdings. The box within each chart shows the 25th percentile return (bottom of box) and the 75th percentile return (top of box) of the peer group. Returns shown above the box are in the first quartile and returns shown below the box are in the fourth quartile. The percentage beaten numbers noted below each chart correspond to the percentile box and represent the percentage of funds in the peer group whose performance was equal to or lower than that of the class indicated.
Fidelity Emerging Markets Fund
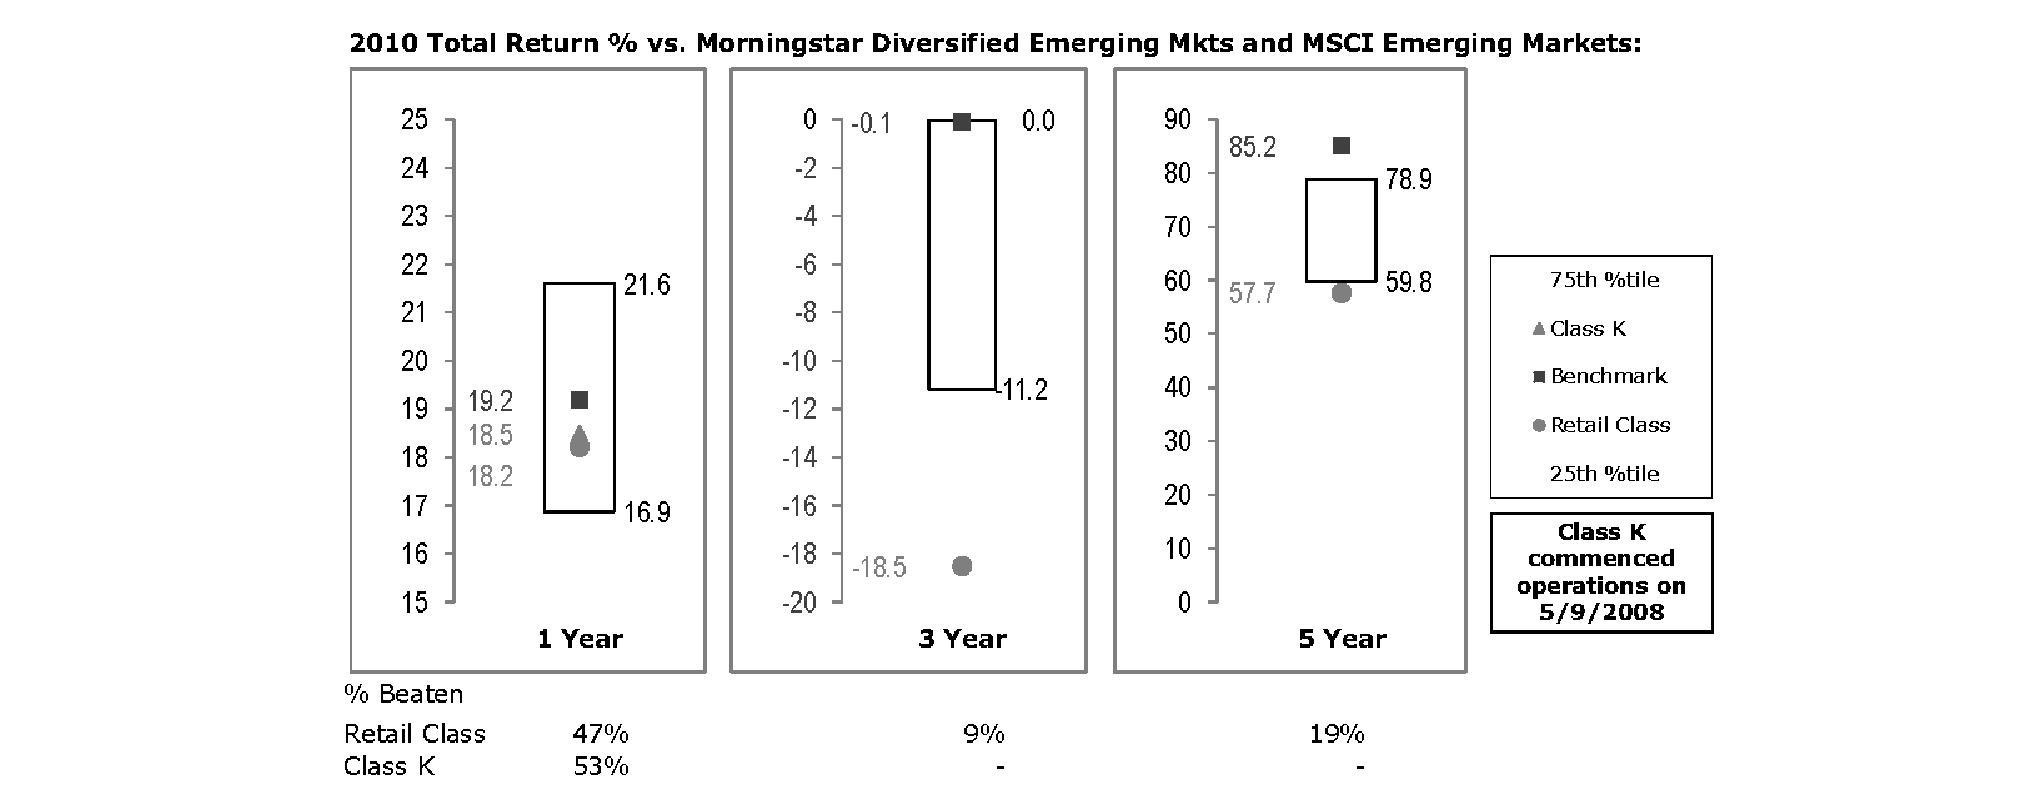
The Board reviewed the fund's relative investment performance against its peer group and noted that the performance of the retail class of the fund (the class with the longer performance record) was in the third quartile for the one-year period and the fourth quartile for the three- and five-year periods. The Board also noted that the investment performance of the fund was lower than its benchmark for all the periods shown. The Board considered that the variations in performance between the fund's classes reflect the variations in class expenses, which result in lower performance for the higher expense class. The Board discussed with FMR actions that have been taken by FMR to improve the fund's disappointing performance relative to its peer group and benchmark. The Board also reviewed the fund's performance since inception as well as performance in the current year. The Board will continue to closely monitor the performance of the fund in the coming year and discuss with FMR other appropriate actions to address the performance of the fund.
Based on its review, the Board concluded that the nature, extent, and quality of services provided to the fund under the Advisory Contracts should benefit the fund's shareholders.
Competitiveness of Management Fee and Total Expense Ratio. The Board considered the fund's management fee and total expense ratio compared to "mapped groups" of competitive funds and classes. Fidelity creates "mapped groups" by combining similar Lipper investment objective categories that have comparable management fee characteristics. Combining Lipper investment objective categories aids the Board's management fee and total expense ratio comparisons by broadening the competitive group used for comparison and by reducing the number of universes to which various Fidelity funds are compared.
Annual Report
Management Fee. The Board considered two proprietary management fee comparisons for the 12-month periods shown in the chart below. The group of Lipper funds used by the Board for management fee comparisons is referred to below as the "Total Mapped Group." The Total Mapped Group comparison focuses on a fund's standing relative to the total universe of comparable funds available to investors in terms of gross management fees before expense reimbursements or caps. "TMG %" represents the percentage of funds in the Total Mapped Group that had management fees that were lower than the fund's. For example, a TMG % of 7% means that 93% of the funds in the Total Mapped Group had higher management fees than the fund. The "Asset-Size Peer Group" (ASPG) comparison focuses on a fund's standing relative to non-Fidelity funds similar in size to the fund within the Total Mapped Group. The ASPG represents at least 15% of the funds in the Total Mapped Group with comparable asset size and management fee characteristics, subject to a minimum of 50 funds (or all funds in the Total Mapped Group if fewer than 50). Additional information, such as the ASPG quartile in which the fund's management fee ranked, is also included in the chart and considered by the Board.
Fidelity Emerging Markets Fund

The Board noted that the fund's management fee ranked below the median of its Total Mapped Group and below the median of its ASPG for 2010.
Based on its review, the Board concluded that the fund's management fee is fair and reasonable in light of the services that the fund receives and the other factors considered.
Total Expense Ratio. In its review of each class's total expense ratio, the Board considered the fund's management fee as well as other fund or class expenses, as applicable, such as transfer agent fees, pricing and bookkeeping fees, and custodial, legal, and audit fees. The Board also noted the effects of any waivers and reimbursements on fees and expenses. As part of its review, the Board also considered the current and historical total expense ratios of each class of the fund compared to competitive fund median expenses. Each class of the fund is compared to those funds and classes in the Total Mapped Group (used by the Board for management fee comparisons) that have a similar sales load structure.
The Board noted that the total expense ratio of each class ranked below its competitive median for 2010. The Board considered that various factors, including 12b-1 fees, positive or negative performance adjustments, and relatively higher other expenses in the case of small fund size, can affect total expense ratios.
Fees Charged to Other Fidelity Clients. The Board also considered Fidelity fee structures and other information with respect to clients of FMR and its affiliates, such as other mutual funds advised or subadvised by FMR or its affiliates, pension plan clients, and other institutional clients. In March 2010, the Board created an ad hoc joint committee with the board of other Fidelity funds (the Committee) to review and compare Fidelity's institutional investment advisory business with its business of providing services to the Fidelity funds, including the differences in services provided, fees charged, and costs incurred, as well as competition in their respective marketplaces.
Based on its review of total expense ratios and fees charged to other Fidelity clients, the Board concluded that the total expense ratio of each class of the fund was reasonable in light of the services that the fund and its shareholders receive and the other factors considered, including the findings of the Committee.
Annual Report
Board Approval of Investment Advisory Contracts and Management Fees - continued
Costs of the Services and Profitability. The Board considered the revenues earned and the expenses incurred by Fidelity in conducting the business of developing, marketing, distributing, managing, administering and servicing the fund and its shareholders. The Board also considered the level of Fidelity's profits in respect of all the Fidelity funds.
On an annual basis, FMR presents to the Board Fidelity's profitability for the fund. Fidelity calculates the profitability for each fund, as well as aggregate profitability for groups of Fidelity funds and all Fidelity funds, using a series of detailed revenue and cost allocation methodologies which originate with the books and records of Fidelity on which Fidelity's audited financial statements are based. The Audit Committee of the Board reviews any significant changes from the prior year's methodologies.
PricewaterhouseCoopers LLP (PwC), independent registered public accounting firm and auditor to Fidelity and certain Fidelity funds, has been engaged annually by the Board as part of the Board's assessment of Fidelity's profitability analysis. PwC's engagement includes the review and assessment of Fidelity's methodologies used in determining the revenues and expenses attributable to Fidelity's mutual fund business, and completion of agreed-upon procedures surrounding the mathematical accuracy of fund profitability and its conformity to allocation methodologies. After considering PwC's reports issued under the engagement and information provided by Fidelity, the Board concluded that while other allocation methods may also be reasonable, Fidelity's profitability methodologies are reasonable in all material respects.
The Board also reviewed Fidelity's non-fund businesses and fall-out benefits related to the mutual fund business as well as cases where Fidelity's affiliates may benefit from or be related to the fund's business.
The Board considered the costs of the services provided by and the profits realized by Fidelity in connection with the operation of the fund and was satisfied that the profitability was not excessive in the circumstances.
Economies of Scale. The Board considered whether there have been economies of scale in respect of the management of the Fidelity funds, whether the Fidelity funds (including the fund) have appropriately benefited from any such economies of scale, and whether there is potential for realization of any further economies of scale. The Board considered the extent to which the fund will benefit from economies of scale through increased services to the fund, through waivers or reimbursements, or through fee or expense reductions. The Board also noted that in 2009, it and the board of other Fidelity funds created an ad hoc committee (the Economies of Scale Committee) to analyze whether FMR attains economies of scale in respect of the management and servicing of the Fidelity funds, whether the Fidelity funds have appropriately benefited from such economies of scale, and whether there is potential for realization of any further economies of scale.
The Board recognized that the fund's management contract incorporates a "group fee" structure, which provides for lower group fee rates as total fund assets under FMR's management increase, and for higher group fee rates as total fund assets under FMR's management decrease. FMR calculates the group fee rates based on a tiered asset "breakpoint" schedule that varies based on asset class. The Board considered that the group fee is designed to deliver the benefits of economies of scale to fund shareholders when total Fidelity fund assets increase, even if assets of any particular fund are unchanged or have declined, because some portion of Fidelity's costs are attributable to services provided to all Fidelity funds, and all funds benefit if those costs can be allocated among more assets. The Board concluded that, given the group fee structure, fund shareholders will benefit from lower management fees as assets under FMR's management increase at the fund complex level, regardless of whether Fidelity achieves any such economies of scale.
The Board concluded, taking into account the analysis of the Economies of Scale Committee, that any potential economies of scale are being appropriately shared between fund shareholders and Fidelity.
Additional Information Requested by the Board. In order to develop fully the factual basis for consideration of the Fidelity funds' Advisory Contracts, the Board requested and received additional information on certain topics, including (i) fund performance trends, actions to be taken by FMR to improve certain funds' overall performance, and Fidelity's long-term strategies for certain funds; (ii) portfolio manager changes that have occurred during the past year and length of portfolio manager tenure for different categories of funds over time; (iii) Fidelity's compensation structure for portfolio managers and other key personnel and strategies for attracting and retaining non-investment personnel; (iv) the amount of the investment that each portfolio manager has made in the Fidelity fund(s) that he or she manages; (v) historical trends in Fidelity's realization of fall-out benefits; (vi) Fidelity's group fee structures and the rationale for the individual fee rates of certain funds; (vii) fund profitability methodology and the impact of certain factors on fund profitability results; (viii) trends regarding industry use of performance fee structures and Fidelity's compliance practices with respect to performance adjustment calculations; (ix) the fee structures in place for certain other Fidelity clients; and (x) explanations regarding the relative total expense ratios of certain funds and classes, total expense competitive trends, and actions that might be taken by FMR to reduce total expense ratios for certain funds and classes.
Based on its evaluation of all of the conclusions noted above, and after considering all factors it believed relevant, the Board ultimately concluded that the advisory fee structures are fair and reasonable, and that the fund's Advisory Contracts should be renewed.
Annual Report
Annual Report
Investment Adviser
Fidelity Management & Research Company
Boston, MA
Investment Sub-Advisers
FMR Co., Inc.
Fidelity Management & Research (U.K.) Inc.
FIL Investments (Japan) Limited
FIL Investment Advisors
FIL Investment Advisors
(U.K.) Limited
Fidelity Management & Research
(Hong Kong) Limited
Fidelity Management & Research
(Japan) Inc.
General Distributor
Fidelity Distributors Corporation
Boston, MA
Transfer and Service Agents
Fidelity Investments Institutional
Operations Company, Inc.
Boston, MA
Fidelity Service Company, Inc.
Boston, MA
Custodians
JPMorgan Chase Bank
New York, NY
Fidelity's International Equity Funds
Fidelity Canada Fund
Fidelity China Region Fund
Fidelity Diversified International Fund
Fidelity Emerging Asia Fund
Fidelity Emerging Europe, Middle East, Africa (EMEA) Fund
Fidelity Emerging Markets Fund
Fidelity Europe Capital Appreciation Fund
Fidelity Europe Fund
Fidelity Global Balanced Fund
Fidelity Global Commodity Stock Fund
Fidelity International Capital Appreciation Fund
Fidelity International Discovery Fund
Fidelity International Growth Fund
Fidelity International Small Cap Fund
Fidelity International Small Cap Opportunities Fund
Fidelity International Value Fund
Fidelity Japan Fund
Fidelity Japan Smaller Companies Fund
Fidelity Latin America Fund
Fidelity Nordic Fund
Fidelity Overseas Fund
Fidelity Pacific Basin Fund
Fidelity Total International Equity Fund
Fidelity Worldwide Fund
Corporate Headquarters
82 Devonshire Street
Boston, MA 02109
www.fidelity.com

EMF-K-UANN-1211
1.863014.103
Fidelity Advisor®
Japan
Fund - Class A, Class T, Class B, and Class C
Annual Report
October 31, 2011
Class A, Class T, Class B, and Class C are
classes of Fidelity® Japan Fund
Contents
Chairman's Message | (Click Here) | The Chairman's message to shareholders. |
Performance | (Click Here) | How the fund has done over time. |
Management's Discussion of Fund Performance | (Click Here) | The Portfolio Manager's review of fund performance and strategy. |
Shareholder Expense Example | (Click Here) | An example of shareholder expenses. |
Investment Changes | (Click Here) | A summary of major shifts in the fund's investments over the past six months. |
Investments | (Click Here) | A complete list of the fund's investments with their market values. |
Financial Statements | (Click Here) | Statements of assets and liabilities, operations, and changes in net assets, as well as financial highlights. |
Notes | (Click Here) | Notes to the financial statements. |
Report of Independent Registered Public Accounting Firm | (Click Here) | |
Trustees and Officers | (Click Here) | |
Distributions | (Click Here) | |
Board Approval of Investment Advisory Contracts and Management Fees | (Click Here) | |
To view a fund's proxy voting guidelines and proxy voting record for the 12-month period ended June 30, visit http://www.fidelity.com/proxyvotingresults or visit the Securities and Exchange Commission's (SEC) web site at http://www.sec.gov. You may also call 1-877-208-0098 to request a free copy of the proxy voting guidelines.
Standard & Poor's, S&P and S&P 500 are registered service marks of The McGraw-Hill Companies, Inc. and have been licensed for use by Fidelity Distributors Corporation.
Other third party marks appearing herein are the property of their respective owners.
All other marks appearing herein are registered or unregistered trademarks or service marks of FMR LLC or an affiliated company.
This report and the financial statements contained herein are submitted for the general information of the shareholders of the fund. This report is not authorized for distribution to prospective investors in the fund unless preceded or accompanied by an effective prospectus.
A fund files its complete schedule of portfolio holdings with the SEC for the first and third quarters of each fiscal year on Form N-Q. Forms N-Q are available on the SEC's web site at http://www.sec.gov. A fund's Forms N-Q may be reviewed and copied at the SEC's Public Reference Room in Washington, DC. Information regarding the operation of the SEC's Public Reference Room may be obtained by calling 1-800-SEC-0330. For a complete list of a fund's portfolio holdings, view the most recent holdings listing, semiannual report, or annual report on Fidelity's web site at http://www.fidelity.com, http://www.advisor.fidelity.com, or http://www.401k.com, as applicable.
NOT FDIC INSURED • MAY LOSE VALUE • NO BANK GUARANTEE
Neither the fund nor Fidelity Distributors Corporation is a bank.
Annual Report
(The Acting Chairman's photo appears here.)
Dear Shareholder:
Global equity markets began the fourth quarter on a strong note, sharply reversing course in October amid strong corporate earnings, better-than-expected economic news and the promise of a resolution to the sovereign debt crisis in Europe. The mini rally followed a third quarter marked by a significant downturn in July and August, which heightened investor anxiety and set off a wave of volatility that hampered most major asset classes through the end of September. Financial markets are difficult to predict, of course, but you can help put the odds in your favor by following these time-tested investment principles.
One of the basic tenets is to invest according to your time horizon. For long-term investors, riding out the markets' inevitable ups and downs has proven much more effective than making decisions based on short-term developments. If your goal is approaching, you can also benefit from patience and restraint, rather than attempting to time the market. No matter your time horizon, missing only a few of the markets' best days can significantly diminish returns. Patience also affords the benefits of compounding - earning interest on additional income or reinvested dividends and capital gains. While staying the course doesn't eliminate risk, it can considerably lessen the negative impact of short-term downturns.
Asset allocation is another principle to manage risk. As you spread your portfolio among the asset classes, be sure to consider your time horizon, risk tolerance and investment objectives. Younger investors may be better served by emphasizing equities, which historically have been the best-performing asset class over time. Investors who are nearing a specific goal, such as retirement or sending a child to college, may choose to favor bonds and other investments that have tended to be more stable. Studies indicate that asset allocation is the single most important determinant of a portfolio's long-term success. After deciding on a suitable allocation strategy, make sure your portfolio is adequately diversified, with exposure to stocks of small-, mid- and large-cap companies in a range of sectors, for example. And today, more than ever, geographic diversification should be taken into account.
Lastly, investing a certain amount of money on a regular basis - a principle known as dollar-cost averaging - can help lower the average cost of your purchases, while also giving you the discipline to avoid selling weak performers just prior to an upswing, or chasing a hot performer just before a correction.
We invite you to learn more by visiting us on the Internet, dropping by one of our Investor Centers or calling us by phone. It is our privilege to provide the resources you need to choose investments that are right for you.
Sincerely,
(The Acting Chairman's signature appears here.)
James C. Curvey
Acting Chairman
Annual Report
Average annual total return reflects the change in the value of an investment, assuming reinvestment of the class' distributions from dividend income and capital gains (the profits earned upon the sale of securities that have grown in value, if any) and assuming a constant rate of performance each year. The $10,000 table and the fund's returns do not reflect the deduction of taxes that a shareholder would pay on fund distributions or the redemption of fund shares. During periods of reimbursement by Fidelity, a fund's total return will be greater than it would be had the reimbursement not occurred. How a fund did yesterday is no guarantee of how it will do tomorrow.
Average Annual Total Returns
Periods ended October 31, 2011 | Past 1
year | Past 5
years | Past 10
years |
Class A (incl. 5.75% sales charge) A | -11.68% | -7.63% | 1.62% |
Class T (incl. 3.50% sales charge) B | -9.86% | -7.25% | 1.83% |
Class B (incl. contingent deferred sales charge) C | -11.46% | -6.97% | 2.15% |
Class C (incl. contingent deferred sales charge) D | -7.78% | -6.65% | 2.16% |
A Class A shares bear a 0.25% 12b-1 fee. The initial offering of Class A shares took place on December 14, 2010. Returns prior to December 14, 2010 are those of Fidelity® Japan Fund, the original class of the fund, which has no 12b-1 fee. Had Class A's 12b-1 fee been reflected, returns prior to December 14, 2010, would have been lower.
B Class T shares bear a 0.50% 12b-1 fee. The initial offering of Class T shares took place on December 14, 2010. Returns prior to December 14, 2010 are those of Fidelity Japan Fund, the original class of the fund, which has no 12b-1 fee. Had Class T's 12b-1 fee been reflected, returns prior to December 14, 2010, would have been lower.
C Class B shares bear a 1.00% 12b-1 fee. The initial offering of Class B shares took place on December 14, 2010. Returns prior to December 14, 2010 are those of Fidelity Japan Fund, the original class of the fund, which has no 12b-1 fee. Had Class B's 12b-1 fee been reflected, returns prior to December 14, 2010, would have been lower. Class B shares' contingent deferred sales charges included in the past one year, past five years, and past ten years total return figures are 5%, 2%, and 0%, respectively.
D Class C shares bear a 1.00% 12b-1 fee. The initial offering of Class C shares took place on December 14, 2010. Returns prior to December 14, 2010 are those of Fidelity Japan Fund, the original class of the fund, which has no 12b-1 fee. Had Class C's 12b-1 fee been reflected, returns prior to December 14, 2010, would have been lower. Class C shares' contingent deferred sales charges included in the past one year, past five years, and past ten years total return figures are 1%, 0%, and 0%, respectively.
$10,000 Over 10 Years
Let's say hypothetically that $10,000 was invested in Fidelity Advisor® Japan Fund - Class A, a class of the fund, on October 31, 2001. The chart shows how the value of your investment would have changed, and also shows how the Tokyo Stock Price Index (TOPIX) performed over the same period. The initial offering of Class A took place on December 14, 2010. See above for additional information regarding the performance of Class A.
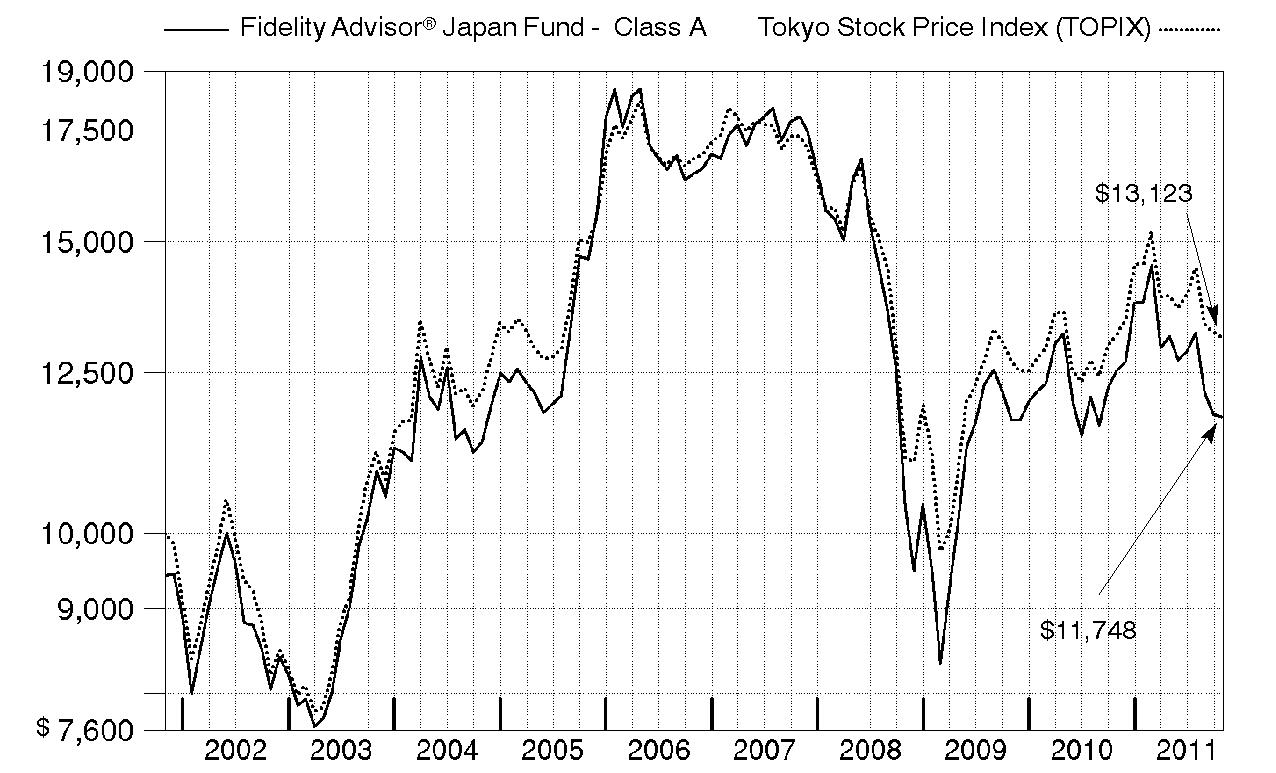
Annual Report
Market Recap: Beset by natural disaster and a fragile global economic climate, Japanese stocks were extremely volatile during the 12 months ending October 31, 2011. However, when the dust settled, share prices were essentially unchanged. For the year, the Tokyo Stock Price Index (TOPIX) returned -0.35%. Japanese equities mounted a strong advance during the first four months of the period, only to give back those gains and more within a few days following the mid-March tsunami and earthquake. Initially, the recovery from this plunge was relatively robust, as investors realized that supply and demand disruptions associated with the disaster would be resolved more quickly than originally feared. However, as the period progressed, Japanese stocks faced other challenges, such as the sovereign debt crisis in Europe and flood damage in Thailand. An appreciating yen - despite government intervention to contain it - aided Japanese equities quoted in U.S. dollars, while making it harder for Japanese exporters to remain competitive. The three smallest sectors within the index - energy, telecommunication services and consumer staples - were its strongest performers, each posting gains of more than 15%. By contrast, utilities sustained by far the biggest loss, weighed down by the company that owned the nuclear reactor damaged by the tsunami.
Comments from Rie Shigekawa, who became Portfolio Manager of Fidelity Advisor® Japan Fund on May 1, 2011: During the year, the fund's Class A, Class T, Class B and Class C shares returned -6.29%, -6.59%, -6.98% and -6.88%, respectively (excluding sales charges), significantly trailing the TOPIX. Positioning in consumer discretionary, information technology, industrials and telecommunication services detracted from performance versus the index. Video-game maker Nintendo was the largest individual detractor, as unimpressive software offerings for its latest game console resulted in disappointing earnings and a declining stock price. Automakers Honda and Toyota were hampered by extensive flooding in Thailand and further strength in the yen. Conversely, a large underweighting in utilities was beneficial, as this was the sector most hurt by the earthquake/tsunami. Positioning in consumer staples lifted performance as well. At the stock level, an overweighted stake in Japan Tobacco was the fund's largest contributor. Given the greater freedom it would provide for the firm's management, the market liked a proposal by the nation's ruling political party to sell the government's roughly 50% stake in the company. Software provider Otsuka and negligible exposure to Tokyo Electric Power, which owned the nuclear facility most devastated by the mid-March disaster, further added value. The fund did not own this security at period end.
The views expressed above reflect those of the portfolio manager(s) only through the end of the period as stated on the cover of this report and do not necessarily represent the views of Fidelity or any other person in the Fidelity organization. Any such views are subject to change at any time based upon market or other conditions and Fidelity disclaims any responsibility to update such views. These views may not be relied on as investment advice and, because investment decisions for a Fidelity fund are based on numerous factors, may not be relied on as an indication of trading intent on behalf of any Fidelity fund.
Annual Report
Fidelity Japan Fund
As a shareholder of the Fund, you incur two types of costs: (1) transaction costs, including sales charges (loads) on purchase payments or redemption proceeds, redemption fees, and (2) ongoing costs, including management fees, distribution and/or service (12b-1) fees and other Fund expenses. This Example is intended to help you understand your ongoing costs (in dollars) of investing in the Fund and to compare these costs with the ongoing costs of investing in other mutual funds.
The Example is based on an investment of $1,000 invested at the beginning of the period and held for the entire period (May 1, 2011 to October 31, 2011).
Actual Expenses
The first line of the accompanying table for each class of the Fund provides information about actual account values and actual expenses. You may use the information in this line, together with the amount you invested, to estimate the expenses that you paid over the period. Simply divide your account value by $1,000.00 (for example, an $8,600 account value divided by $1,000.00 = 8.6), then multiply the result by the number in the first line for a class of the Fund under the heading entitled "Expenses Paid During Period" to estimate the expenses you paid on your account during this period. A small balance maintenance fee of $12.00 that is charged once a year may apply for certain accounts with a value of less than $2,000. This fee is not included in the table below. If it was, the estimate of expenses you paid during the period would be higher, and your ending account value lower, by this amount. In addition, the Fund, as a shareholder in the underlying Fidelity Central Funds, will indirectly bear its pro-rata share of the fees and expenses incurred by the underlying Fidelity Central Funds. These fees and expenses are not included in the Fund's annualized expense ratio used to calculate the expense estimate in the table below.
Hypothetical Example for Comparison Purposes
The second line of the accompanying table for each class of the Fund provides information about hypothetical account values and hypothetical expenses based on a Class' actual expense ratio and an assumed rate of return of 5% per year before expenses, which is not the Class' actual return. The hypothetical account values and expenses may not be used to estimate the actual ending account balance or expenses you paid for the period. You may use this information to compare the ongoing costs of investing in the Fund and other funds. To do so, compare this 5% hypothetical example with the 5% hypothetical examples that appear in the shareholder reports of the other funds. A small balance maintenance fee of $12.00 that is charged once a year may apply for certain accounts with a value of less than $2,000. This fee is not included in the table below. If it was, the estimate of expenses you paid during the period would be higher, and your ending account value lower, by this amount. In addition, the Fund, as a shareholder in the underlying Fidelity Central Funds, will indirectly bear its pro-rata share of the fees and expenses incurred by the underlying Fidelity Central Funds. These fees and expenses are not included in the Fund's annualized expense ratio used to calculate the expense estimate in the table below.
Please note that the expenses shown in the table are meant to highlight your ongoing costs only and do not reflect any transaction costs. Therefore, the second line of the table is useful in comparing ongoing costs only, and will not help you determine the relative total costs of owning different funds. In addition, if these transactional costs were included, your costs would have been higher.
| Annualized
Expense Ratio | Beginning
Account Value
May 1, 2011 | Ending
Account Value
October 31, 2011 | Expenses Paid
During Period*
May 1, 2011 to
October 31, 2011 |
Class A | 1.19% | | | |
Actual | | $ 1,000.00 | $ 893.30 | $ 5.68 |
HypotheticalA | | $ 1,000.00 | $ 1,019.21 | $ 6.06 |
Class T | 1.47% | | | |
Actual | | $ 1,000.00 | $ 891.30 | $ 7.01 |
HypotheticalA | | $ 1,000.00 | $ 1,017.80 | $ 7.48 |
Class B | 1.92% | | | |
Actual | | $ 1,000.00 | $ 889.20 | $ 9.14 |
HypotheticalA | | $ 1,000.00 | $ 1,015.53 | $ 9.75 |
Class C | 1.90% | | | |
Actual | | $ 1,000.00 | $ 890.10 | $ 9.05 |
HypotheticalA | | $ 1,000.00 | $ 1,015.63 | $ 9.65 |
Japan | .84% | | | |
Actual | | $ 1,000.00 | $ 894.40 | $ 4.01 |
HypotheticalA | | $ 1,000.00 | $ 1,020.97 | $ 4.28 |
Institutional Class | .78% | | | |
Actual | | $ 1,000.00 | $ 894.40 | $ 3.72 |
HypotheticalA | | $ 1,000.00 | $ 1,021.27 | $ 3.97 |
A 5% return per year before expenses
* Expenses are equal to each Class' annualized expense ratio, multiplied by the average account value over the period, multiplied by 184/365 (to reflect the one-half year period).
Annual Report
Fidelity Japan Fund
Investment Changes (Unaudited)
Geographic Diversification (% of fund's net assets) |
As of October 31, 2011 |
 | Japan | 96.3% | |
 | United States of America | 3.7% | |

Percentages are adjusted for the effect of futures contracts, if applicable. |
As of April 30, 2011 |
| Japan | 94.9% | |
| United States of America | 5.1% | |

Percentages are adjusted for the effect of futures contracts, if applicable. |
Asset Allocation |
| % of fund's
net assets | % of fund's net assets
6 months ago |
Stocks | 96.3 | 94.9 |
Short-Term Investments and Net Other Assets | 3.7 | 5.1 |
Top Ten Stocks as of October 31, 2011 |
| % of fund's
net assets | % of fund's net assets
6 months ago |
Toyota Motor Corp. (Automobiles) | 5.6 | 3.5 |
Honda Motor Co. Ltd. (Automobiles) | 3.9 | 1.6 |
Otsuka Corp. (IT Services) | 3.4 | 0.0 |
Toshiba Corp. (Computers & Peripherals) | 3.4 | 0.4 |
Mitsubishi UFJ Financial Group, Inc. (Commercial Banks) | 3.3 | 2.9 |
Japan Tobacco, Inc. (Tobacco) | 3.3 | 0.0 |
Astellas Pharma, Inc. (Pharmaceuticals) | 3.1 | 0.0 |
Canon, Inc. (Office Electronics) | 3.0 | 4.1 |
Nomura Real Estate Holdings, Inc. (Real Estate Management & Development) | 3.0 | 0.0 |
Fujitsu Ltd. (Computers & Peripherals) | 2.8 | 0.4 |
| 34.8 | |
Market Sectors as of October 31, 2011 |
| % of fund's
net assets | % of fund's net assets
6 months ago |
Information Technology | 21.5 | 15.2 |
Consumer Discretionary | 21.5 | 19.3 |
Financials | 16.4 | 26.7 |
Consumer Staples | 10.5 | 5.0 |
Materials | 7.8 | 7.5 |
Industrials | 7.4 | 18.9 |
Health Care | 7.2 | 0.4 |
Telecommunication Services | 2.1 | 1.9 |
Energy | 1.1 | 0.0 |
Utilities | 0.8 | 0.0 |
Annual Report
Fidelity Japan Fund
Investments October 31, 2011
Showing Percentage of Net Assets
Common Stocks - 96.3% |
| Shares | | Value |
CONSUMER DISCRETIONARY - 21.5% |
Auto Components - 2.7% |
Denso Corp. | 243,000 | | $ 7,474,001 |
Yokohama Rubber Co. Ltd. | 1,005,000 | | 5,737,462 |
| | 13,211,463 |
Automobiles - 11.0% |
Honda Motor Co. Ltd. | 632,500 | | 18,916,540 |
Suzuki Motor Corp. | 335,300 | | 7,112,335 |
Toyota Motor Corp. | 816,300 | | 27,105,263 |
| | 53,134,138 |
Household Durables - 2.5% |
Funai Electric Co. Ltd. | 136,800 | | 2,689,100 |
Panasonic Corp. | 943,400 | | 9,538,137 |
| | 12,227,237 |
Leisure Equipment & Products - 0.9% |
SHIMANO, Inc. | 82,700 | | 4,088,402 |
Media - 1.2% |
Avex Group Holdings, Inc. | 476,800 | | 5,641,483 |
Multiline Retail - 2.1% |
Marui Group Co. Ltd. | 1,281,200 | | 9,961,645 |
Specialty Retail - 0.8% |
EDION Corp. | 455,300 | | 3,643,415 |
Textiles, Apparel & Luxury Goods - 0.3% |
Asics Corp. | 109,200 | | 1,447,867 |
TOTAL CONSUMER DISCRETIONARY | | 103,355,650 |
CONSUMER STAPLES - 10.5% |
Food & Staples Retailing - 2.1% |
Lawson, Inc. | 93,800 | | 5,278,772 |
Seven & i Holdings Co., Ltd. | 186,800 | | 4,985,534 |
| | 10,264,306 |
Food Products - 2.2% |
Nisshin Oillio Group Ltd. | 1,206,000 | | 5,392,785 |
Toyo Suisan Kaisha Ltd. | 206,000 | | 5,257,704 |
| | 10,650,489 |
Personal Products - 2.9% |
Kao Corp. | 189,600 | | 4,974,672 |
Shiseido Co. Ltd. | 480,800 | | 8,801,385 |
| | 13,776,057 |
Tobacco - 3.3% |
Japan Tobacco, Inc. | 3,146 | | 15,726,230 |
TOTAL CONSUMER STAPLES | | 50,417,082 |
ENERGY - 1.1% |
Oil, Gas & Consumable Fuels - 1.1% |
INPEX Corp. | 808 | | 5,335,164 |
|
| Shares | | Value |
FINANCIALS - 16.4% |
Commercial Banks - 7.5% |
Mitsubishi UFJ Financial Group, Inc. | 3,695,800 | | $ 16,063,770 |
Sumitomo Mitsui Financial Group, Inc. | 375,900 | | 10,508,323 |
Sumitomo Mitsui Trust Holdings, Inc. | 2,764,130 | | 9,460,406 |
| | 36,032,499 |
Insurance - 1.4% |
Tokio Marine Holdings, Inc. | 284,300 | | 6,779,854 |
Real Estate Investment Trusts - 3.0% |
Frontier Real Estate Investment Corp. | 844 | | 7,319,723 |
Japan Logistics Fund, Inc. | 856 | | 7,377,960 |
| | 14,697,683 |
Real Estate Management & Development - 4.5% |
Mitsui Fudosan Co. Ltd. | 438,000 | | 7,284,997 |
Nomura Real Estate Holdings, Inc. | 881,600 | | 14,213,755 |
| | 21,498,752 |
TOTAL FINANCIALS | | 79,008,788 |
HEALTH CARE - 7.2% |
Health Care Equipment & Supplies - 1.5% |
Terumo Corp. | 144,500 | | 7,342,989 |
Health Care Providers & Services - 1.6% |
Message Co. Ltd. | 2,320 | | 7,503,564 |
Pharmaceuticals - 4.1% |
Astellas Pharma, Inc. | 413,300 | | 15,117,730 |
Rohto Pharmaceutical Co. Ltd. | 418,000 | | 4,815,951 |
| | 19,933,681 |
TOTAL HEALTH CARE | | 34,780,234 |
INDUSTRIALS - 7.4% |
Building Products - 1.3% |
Daikin Industries Ltd. | 211,300 | | 6,253,951 |
Machinery - 1.2% |
Makita Corp. | 155,300 | | 5,798,643 |
Road & Rail - 1.2% |
Sankyu, Inc. | 1,370,000 | | 5,425,169 |
Trading Companies & Distributors - 3.7% |
Mitsui & Co. Ltd. | 609,100 | | 8,890,662 |
Sumitomo Corp. | 729,300 | | 9,030,728 |
| | 17,921,390 |
TOTAL INDUSTRIALS | | 35,399,153 |
INFORMATION TECHNOLOGY - 21.5% |
Computers & Peripherals - 6.2% |
Fujitsu Ltd. | 2,503,000 | | 13,386,871 |
Toshiba Corp. | 3,756,000 | | 16,383,497 |
| | 29,770,368 |
Common Stocks - continued |
| Shares | | Value |
INFORMATION TECHNOLOGY - continued |
Electronic Equipment & Components - 6.3% |
Daishinku Corp. | 523,000 | | $ 1,781,434 |
Fujifilm Holdings Corp. | 284,300 | | 6,958,905 |
Horiba Ltd. | 183,300 | | 5,815,349 |
Mitsumi Electric Co. Ltd. | 415,300 | | 3,296,100 |
Shimadzu Corp. | 1,468,000 | | 12,499,033 |
| | 30,350,821 |
Internet Software & Services - 1.3% |
Yahoo! Japan Corp. | 19,727 | | 6,336,334 |
IT Services - 3.4% |
Otsuka Corp. | 236,300 | | 16,416,472 |
Office Electronics - 3.0% |
Canon, Inc. | 315,200 | | 14,311,218 |
Semiconductors & Semiconductor Equipment - 0.6% |
ROHM Co. Ltd. | 59,600 | | 3,037,095 |
Software - 0.7% |
Nintendo Co. Ltd. | 21,200 | | 3,198,866 |
TOTAL INFORMATION TECHNOLOGY | | 103,421,174 |
MATERIALS - 7.8% |
Chemicals - 6.6% |
Asahi Kasei Corp. | 944,000 | | 5,598,953 |
JSP Corp. | 61,600 | | 904,290 |
Nippon Shokubai Co. Ltd. | 331,000 | | 3,376,378 |
Shin-Etsu Chemical Co., Ltd. | 189,200 | | 9,717,569 |
Toray Industries, Inc. | 1,688,000 | | 12,015,710 |
| | 31,612,900 |
Metals & Mining - 1.2% |
Hitachi Metals Ltd. | 520,000 | | 5,898,166 |
TOTAL MATERIALS | | 37,511,066 |
|
| Shares | | Value |
TELECOMMUNICATION SERVICES - 2.1% |
Wireless Telecommunication Services - 2.1% |
NTT DoCoMo, Inc. | 5,660 | | $ 10,053,689 |
UTILITIES - 0.8% |
Gas Utilities - 0.8% |
Osaka Gas Co. Ltd. | 997,000 | | 3,773,148 |
TOTAL COMMON STOCKS (Cost $539,552,123) | 463,055,148 |
Money Market Funds - 2.7% |
| | | |
Fidelity Cash Central Fund, 0.12% (a)
(Cost $13,103,924) | 13,103,924 | | 13,103,924 |
TOTAL INVESTMENT PORTFOLIO - 99.0% (Cost $552,656,047) | | 476,159,072 |
NET OTHER ASSETS (LIABILITIES) - 1.0% | | 5,031,379 |
NET ASSETS - 100% | $ 481,190,451 |
Legend |
(a) Affiliated fund that is available only to investment companies and other accounts managed by Fidelity Investments. The rate quoted is the annualized seven-day yield of the fund at period end. A complete unaudited listing of the fund's holdings as of its most recent quarter end is available upon request. In addition, each Fidelity Central Fund's financial statements, which are not covered by the Fund's Report of Independent Registered Public Accounting Firm, are available on the SEC's website or upon request. |
Affiliated Central Funds |
Information regarding fiscal year to date income earned by the Fund from investments in Fidelity Central Funds is as follows: |
Fund | Income earned |
Fidelity Cash Central Fund | $ 22,778 |
Fidelity Securities Lending Cash Central Fund | 6,193 |
Total | $ 28,971 |
Other Information |
The following is a summary of the inputs used, as of October 31, 2011, involving the Fund's assets and liabilities carried at fair value. The inputs or methodology used for valuing securities may not be an indication of the risk associated with investing in those securities. For more information on valuation inputs, and their aggregation into the levels used in the table below, please refer to the Security Valuation section in the accompanying Notes to Financial Statements. |
Valuation Inputs at Reporting Date: |
Description | Total | Level 1 | Level 2 | Level 3 |
Investments in Securities: | | | | |
Equities: | | | | |
Consumer Discretionary | $ 103,355,650 | $ - | $ 103,355,650 | $ - |
Consumer Staples | 50,417,082 | - | 50,417,082 | - |
Energy | 5,335,164 | - | 5,335,164 | - |
Financials | 79,008,788 | - | 79,008,788 | - |
Health Care | 34,780,234 | - | 34,780,234 | - |
Industrials | 35,399,153 | - | 35,399,153 | - |
Information Technology | 103,421,174 | - | 103,421,174 | - |
Materials | 37,511,066 | - | 37,511,066 | - |
Telecommunication Services | 10,053,689 | - | 10,053,689 | - |
Utilities | 3,773,148 | - | 3,773,148 | - |
Money Market Funds | 13,103,924 | 13,103,924 | - | - |
Total Investments in Securities: | $ 476,159,072 | $ 13,103,924 | $ 463,055,148 | $ - |
Income Tax Information |
At October 31, 2011, the Fund had a capital loss carryforward of $540,678,483 of which $6,632,380, $7,706,742, $161,194,648, $239,450,813, $26,887,863 and $98,806,037 will expire in fiscal 2014, 2015, 2016, 2017, 2018 and 2019 respectively. Capital loss carryforwards are only available to offset future capital gains of the Fund to the extent provided by regulations and may be limited. |
Included in the $540,678,483 of the Fund's capital loss carryforwards are $25,965,572 of capital loss carryforwards that were acquired from the Fidelity Advisor Japan Fund when it merged into the Fund on December 17, 2010 of which $6,632,380, $7,706,742, $10,009,147 and $1,617,303 will expire in fiscal 2014, 2015, 2016 and 2017 respectively. Under the Internal Revenue Code, the losses acquired from Fidelity Advisor Japan Fund that will be available to offset future capital gains of the Fund will be limited. As a result, at least $17,152,282 of the losses acquired from Fidelity Advisor Japan Fund will expire unused. |
See accompanying notes which are an integral part of the financial statements.
Annual Report
Fidelity Japan Fund
Statement of Assets and Liabilities
| October 31, 2011 |
| | |
Assets | | |
Investment in securities, at value - See accompanying schedule: Unaffiliated issuers (cost $539,552,123) | $ 463,055,148 | |
Fidelity Central Funds (cost $13,103,924) | 13,103,924 | |
Total Investments (cost $552,656,047) | | $ 476,159,072 |
Receivable for investments sold | | 8,279,738 |
Receivable for fund shares sold | | 218,365 |
Dividends receivable | | 4,287,974 |
Distributions receivable from Fidelity Central Funds | | 1,913 |
Prepaid expenses | | 892 |
Other receivables | | 33,572 |
Total assets | | 488,981,526 |
| | |
Liabilities | | |
Payable for investments purchased | $ 6,695,718 | |
Payable for fund shares redeemed | 648,418 | |
Accrued management fee | 251,540 | |
Distribution and service plan fees payable | 13,857 | |
Other affiliated payables | 116,658 | |
Other payables and accrued expenses | 64,884 | |
Total liabilities | | 7,791,075 |
| | |
Net Assets | | $ 481,190,451 |
Net Assets consist of: | | |
Paid in capital | | $ 1,079,805,300 |
Undistributed net investment income | | 7,491,842 |
Accumulated undistributed net realized gain (loss) on investments and foreign currency transactions | | (529,532,235) |
Net unrealized appreciation (depreciation) on investments and assets and liabilities in foreign currencies | | (76,574,456) |
Net Assets | | $ 481,190,451 |
Statement of Assets and Liabilities - continued
| October 31, 2011 |
| | |
Calculation of Maximum Offering Price Class A:
Net Asset Value and redemption price per share ($13,207,583 ÷ 1,385,059 shares) | | $ 9.54 |
| | |
Maximum offering price per share (100/94.25 of $9.54) | | $ 10.12 |
Class T:
Net Asset Value and redemption price per share ($4,642,769 ÷ 488,071 shares) | | $ 9.51 |
| | |
Maximum offering price per share (100/96.50 of $9.51) | | $ 9.85 |
Class B:
Net Asset Value and offering price per share ($1,458,218 ÷ 153,920 shares)A | | $ 9.47 |
| | |
Class C:
Net Asset Value and offering price per share ($8,749,997 ÷ 923,473 shares)A | | $ 9.48 |
| | |
Japan:
Net Asset Value, offering price and redemption price per share ($450,416,693 ÷ 47,072,045 shares) | | $ 9.57 |
| | |
Institutional Class:
Net Asset Value, offering price and redemption price per share ($2,715,191 ÷ 283,719 shares) | | $ 9.57 |
A Redemption price per share is equal to net asset value less any applicable contingent deferred sales charge.
See accompanying notes which are an integral part of the financial statements.
Annual Report
Statement of Operations
| Year ended October 31, 2011 |
| | |
Investment Income | | |
Dividends | | $ 13,038,354 |
Income from Fidelity Central Funds | | 28,971 |
Income before foreign taxes withheld | | 13,067,325 |
Less foreign taxes withheld | | (912,685) |
Total income | | 12,154,640 |
| | |
Expenses | | |
Management fee
Basic fee | $ 3,938,115 | |
Performance adjustment | (942,799) | |
Transfer agent fees | 1,199,596 | |
Distribution and service plan fees | 160,008 | |
Accounting and security lending fees | 282,827 | |
Custodian fees and expenses | 76,457 | |
Independent trustees' compensation | 3,303 | |
Registration fees | 111,372 | |
Audit | 62,837 | |
Legal | 10,741 | |
Miscellaneous | 35,194 | |
Total expenses before reductions | 4,937,651 | |
Expense reductions | (287,966) | 4,649,685 |
Net investment income (loss) | | 7,504,955 |
Realized and Unrealized Gain (Loss) Net realized gain (loss) on: | | |
Investment securities: | | |
Unaffiliated issuers | (69,086,349) | |
Foreign currency transactions | 373,429 | |
Total net realized gain (loss) | | (68,712,920) |
Change in net unrealized appreciation (depreciation) on: Investment securities | 32,202,153 | |
Assets and liabilities in foreign currencies | (372,358) | |
Total change in net unrealized appreciation (depreciation) | | 31,829,795 |
Net gain (loss) | | (36,883,125) |
Net increase (decrease) in net assets resulting from operations | | $ (29,378,170) |
Statement of Changes in Net Assets
| Year ended
October 31,
2011 | Year ended
October 31,
2010 |
Increase (Decrease) in Net Assets | | |
Operations | | |
Net investment income (loss) | $ 7,504,955 | $ 9,882,218 |
Net realized gain (loss) | (68,712,920) | (10,204,232) |
Change in net unrealized appreciation (depreciation) | 31,829,795 | 55,567,525 |
Net increase (decrease) in net assets resulting from operations | (29,378,170) | 55,245,511 |
Distributions to shareholders from net investment income | (9,748,982) | (6,665,780) |
Distributions to shareholders from net realized gain | (10,506,757) | (9,507,465) |
Total distributions | (20,255,739) | (16,173,245) |
Share transactions - net increase (decrease) | (153,265,919) | (305,864,432) |
Redemption fees | 492,971 | 107,736 |
Total increase (decrease) in net assets | (202,406,857) | (266,684,430) |
| | |
Net Assets | | |
Beginning of period | 683,597,308 | 950,281,738 |
End of period (including undistributed net investment income of $7,491,842 and undistributed net investment income of $9,735,869, respectively) | $ 481,190,451 | $ 683,597,308 |
See accompanying notes which are an integral part of the financial statements.
Annual Report
Financial Highlights - Class A
Years ended October 31, | 2011 H |
Selected Per-Share Data | |
Net asset value, beginning of period | $ 10.83 |
Income from Investment Operations | |
Net investment income (loss) E | .09 |
Net realized and unrealized gain (loss) | (1.39) |
Total from investment operations | (1.30) |
Redemption fees added to paid in capital E | .01 |
Net asset value, end of period | $ 9.54 |
Total Return B,C,D | (11.91)% |
Ratios to Average Net Assets F,I | |
Expenses before reductions | 1.20% A |
Expenses net of fee waivers, if any | 1.20% A |
Expenses net of all reductions | 1.16% A |
Net investment income (loss) | 1.02% A |
Supplemental Data | |
Net assets, end of period (000 omitted) | $ 13,208 |
Portfolio turnover rate G | 134% J |
A Annualized B Total returns for periods of less than one year are not annualized. C Total returns would have been lower if certain expenses had not been reduced during the applicable periods shown. D Total returns do not include the effect of the sales charges. ECalculated based on average shares outstanding during the period. F Fees and expenses of any underlying Fidelity Central Funds are not included in the Fund's expense ratio. The Fund indirectly bears its proportionate share of the expenses of any underlying Fidelity Central Funds. G Amount does not include the portfolio activity of any underlying Fidelity Central Funds. H For the period December 14, 2010 (commencement of sale of shares) to October 31, 2011. I Expense ratios reflect operating expenses of the class. Expenses before reductions do not reflect amounts reimbursed by the investment adviser or reductions from brokerage service arrangements or reductions from other expense offset arrangements and do not represent the amount paid by the class during periods when reimbursements or reductions occur. Expense ratios before reductions for start-up periods may not be representative of longer-term operating periods. Expenses net of fee waivers reflect expenses after reimbursement by the investment adviser but prior to reductions from brokerage service arrangements or other expense offset arrangements. Expenses net of all reductions represent the net expenses paid by the class. J The portfolio turnover rate does not include the assets acquired in the merger. |
Financial Highlights - Class T
Years ended October 31, | 2011 H |
Selected Per-Share Data | |
Net asset value, beginning of period | $ 10.83 |
Income from Investment Operations | |
Net investment income (loss) E | .07 |
Net realized and unrealized gain (loss) | (1.40) |
Total from investment operations | (1.33) |
Redemption fees added to paid in capital E | .01 |
Net asset value, end of period | $ 9.51 |
Total Return B,C,D | (12.19)% |
Ratios to Average Net Assets F,I | |
Expenses before reductions | 1.48% A |
Expenses net of fee waivers, if any | 1.48% A |
Expenses net of all reductions | 1.44% A |
Net investment income (loss) | .74% A |
Supplemental Data | |
Net assets, end of period (000 omitted) | $ 4,643 |
Portfolio turnover rate G | 134% J |
A Annualized B Total returns for periods of less than one year are not annualized. C Total returns would have been lower if certain expenses had not been reduced during the applicable periods shown. D Total returns do not include the effect of the sales charges. E Calculated based on average shares outstanding during the period. F Fees and expenses of any underlying Fidelity Central Funds are not included in the Fund's expense ratio. The Fund indirectly bears its proportionate share of the expenses of any underlying Fidelity Central Funds. G Amount does not include the portfolio activity of any underlying Fidelity Central Funds. H For the period December 14, 2010 (commencement of sale of shares) to October 31, 2011. I Expense ratios reflect operating expenses of the class. Expenses before reductions do not reflect amounts reimbursed by the investment adviser or reductions from brokerage service arrangements or reductions from other expense offset arrangements and do not represent the amount paid by the class during periods when reimbursements or reductions occur. Expense ratios before reductions for start-up periods may not be representative of longer-term operating periods. Expenses net of fee waivers reflect expenses after reimbursement by the investment adviser but prior to reductions from brokerage service arrangements or other expense offset arrangements. Expenses net of all reductions represent the net expenses paid by the class. J The portfolio turnover rate does not include the assets acquired in the merger. |
See accompanying notes which are an integral part of the financial statements.
Annual Report
Financial Highlights - Class B
Years ended October 31, | 2011 H |
Selected Per-Share Data | |
Net asset value, beginning of period | $ 10.83 |
Income from Investment Operations | |
Net investment income (loss) E | .02 |
Net realized and unrealized gain (loss) | (1.39) |
Total from investment operations | (1.37) |
Redemption fees added to paid in capital E | .01 |
Net asset value, end of period | $ 9.47 |
Total Return B,C,D | (12.56)% |
Ratios to Average Net Assets F,I | |
Expenses before reductions | 1.95% A |
Expenses net of fee waivers, if any | 1.95% A |
Expenses net of all reductions | 1.91% A |
Net investment income (loss) | .27% A |
Supplemental Data | |
Net assets, end of period (000 omitted) | $ 1,458 |
Portfolio turnover rate G | 134% J |
A Annualized B Total returns for periods of less than one year are not annualized. C Total returns would have been lower if certain expenses had not been reduced during the applicable periods shown. D Total returns do not include the effect of the contingent deferred sales charge. E Calculated based on average shares outstanding during the period. F Fees and expenses of any underlying Fidelity Central Funds are not included in the Fund's expense ratio. The Fund indirectly bears its proportionate share of the expenses of any underlying Fidelity Central Funds. G Amount does not include the portfolio activity of any underlying Fidelity Central Funds. H For the period December 14, 2010 (commencement of sale of shares) to October 31, 2011. I Expense ratios reflect operating expenses of the class. Expenses before reductions do not reflect amounts reimbursed by the investment adviser or reductions from brokerage service arrangements or reductions from other expense offset arrangements and do not represent the amount paid by the class during periods when reimbursements or reductions occur. Expense ratios before reductions for start-up periods may not be representative of longer-term operating periods. Expenses net of fee waivers reflect expenses after reimbursement by the investment adviser but prior to reductions from brokerage service arrangements or other expense offset arrangements. Expenses net of all reductions represent the net expenses paid by the class. J The portfolio turnover rate does not include the assets acquired in the merger. |
Financial Highlights - Class C
Years ended October 31, | 2011 H |
Selected Per-Share Data | |
Net asset value, beginning of period | $ 10.83 |
Income from Investment Operations | |
Net investment income (loss) E | .03 |
Net realized and unrealized gain (loss) | (1.39) |
Total from investment operations | (1.36) |
Redemption fees added to paid in capital E | .01 |
Net asset value, end of period | $ 9.48 |
Total Return B,C,D | (12.47)% |
Ratios to Average Net Assets F,I | |
Expenses before reductions | 1.92% A |
Expenses net of fee waivers, if any | 1.92% A |
Expenses net of all reductions | 1.88% A |
Net investment income (loss) | .30% A |
Supplemental Data | |
Net assets, end of period (000 omitted) | $ 8,750 |
Portfolio turnover rate G | 134% J |
A Annualized B Total returns for periods of less than one year are not annualized. C Total returns would have been lower if certain expenses had not been reduced during the applicable periods shown. D Total returns do not include the effect of the contingent deferred sales charge. E Calculated based on average shares outstanding during the period. F Fees and expenses of any underlying Fidelity Central Funds are not included in the Fund's expense ratio. The Fund indirectly bears its proportionate share of the expenses of any underlying Fidelity Central Funds. G Amount does not include the portfolio activity of any underlying Fidelity Central Funds. H For the period December 14, 2010 (commencement of sale of shares) to October 31, 2011. I Expense ratios reflect operating expenses of the class. Expenses before reductions do not reflect amounts reimbursed by the investment adviser or reductions from brokerage service arrangements or reductions from other expense offset arrangements and do not represent the amount paid by the class during periods when reimbursements or reductions occur. Expense ratios before reductions for start-up periods may not be representative of longer-term operating periods. Expenses net of fee waivers reflect expenses after reimbursement by the investment adviser but prior to reductions from brokerage service arrangements or other expense offset arrangements. Expenses net of all reductions represent the net expenses paid by the class. J The portfolio turnover rate does not include the assets acquired in the merger. |
See accompanying notes which are an integral part of the financial statements.
Annual Report
Financial Highlights - Japan
Years ended October 31, | 2011 | 2010 | 2009 | 2008 | 2007 |
Selected Per-Share Data | | | | | |
Net asset value, beginning of period | $ 10.57 | $ 10.03 | $ 9.03 | $ 18.00 | $ 16.85 |
Income from Investment Operations | | | | | |
Net investment income (loss) B | .15 | .10 | .08 | .10 | .04 |
Net realized and unrealized gain (loss) | (.75) | .61 | 1.04 | (6.64) | 1.35 |
Total from investment operations | (.60) | .71 | 1.12 | (6.54) | 1.39 |
Distributions from net investment income | (.20) | (.07) | (.11) | (.04) | (.01) |
Distributions from net realized gain | (.21) | (.10) | (.01) | (2.39) | (.23) |
Total distributions | (.41) | (.17) | (.12) | (2.43) | (.24) |
Redemption fees added to paid in capital B | .01 | - G | - G | - G | - G |
Net asset value, end of period | $ 9.57 | $ 10.57 | $ 10.03 | $ 9.03 | $ 18.00 |
Total Return A | (6.00)% | 7.12% | 12.84% | (41.88)% | 8.36% |
Ratios to Average Net Assets C,E | | | | | |
Expenses before reductions | .86% | .93% | .90% | 1.12% | 1.08% |
Expenses net of fee waivers, if any | .84% | .93% | .90% | 1.12% | 1.08% |
Expenses net of all reductions | .80% | .93% | .89% | 1.10% | 1.06% |
Net investment income (loss) | 1.38% | .97% | .90% | .72% | .24% |
Supplemental Data | | | | | |
Net assets, end of period (000 omitted) | $ 450,417 | $ 649,316 | $ 944,902 | $ 1,025,334 | $ 1,779,451 |
Portfolio turnover rate D | 134% F | 43% | 73% | 78% | 158% |
A Total returns would have been lower if certain expenses had not been reduced during the applicable periods shown. B Calculated based on average shares outstanding during the period. C Fees and expenses of any underlying Fidelity Central Funds are not included in the Fund's expense ratio. The Fund indirectly bears its proportionate share of the expenses of any underlying Fidelity Central Funds. D Amount does not include the portfolio activity of any underlying Fidelity Central Funds. E Expense ratios reflect operating expenses of the class. Expenses before reductions do not reflect amounts reimbursed by the investment adviser or reductions from brokerage service arrangements or reductions from other expense offset arrangements and do not represent the amount paid by the class during periods when reimbursements or reductions occur. Expenses net of fee waivers reflect expenses after reimbursement by the investment adviser but prior to reductions from brokerage service arrangements or other expense offset arrangements. Expenses net of all reductions represent the net expenses paid by the class. F The portfolio turnover rate does not include the assets acquired in the merger. G Amount represents less than $.01 per share. |
Financial Highlights - Institutional Class
Years ended October 31, | 2011 G |
Selected Per-Share Data | |
Net asset value, beginning of period | $ 10.83 |
Income from Investment Operations | |
Net investment income (loss) D | .13 |
Net realized and unrealized gain (loss) | (1.40) |
Total from investment operations | (1.27) |
Redemption fees added to paid in capital D | .01 |
Net asset value, end of period | $ 9.57 |
Total Return B,C | (11.63)% |
Ratios to Average Net Assets E,H | |
Expenses before reductions | .79% A |
Expenses net of fee waivers, if any | .79% A |
Expenses net of all reductions | .75% A |
Net investment income (loss) | 1.43% A |
Supplemental Data | |
Net assets, end of period (000 omitted) | $ 2,715 |
Portfolio turnover rate F | 134% I |
A Annualized B Total returns for periods of less than one year are not annualized. C Total returns would have been lower if certain expenses had not been reduced during the applicable periods shown. D Calculated based on average shares outstanding during the period. E Fees and expenses of any underlying Fidelity Central Funds are not included in the Fund's expense ratio. The Fund indirectly bears its proportionate share of the expenses of any underlying Fidelity Central Funds. F Amount does not include the portfolio activity of any underlying Fidelity Central Funds. G For the period December 14, 2010 (commencement of sale of shares) to October 31, 2011. H Expense ratios reflect operating expenses of the class. Expenses before reductions do not reflect amounts reimbursed by the investment adviser or reductions from brokerage service arrangements or reductions from other expense offset arrangements and do not represent the amount paid by the class during periods when reimbursements or reductions occur. Expense ratios before reductions for start-up periods may not be representative of longer-term operating periods. Expenses net of fee waivers reflect expenses after reimbursement by the investment adviser but prior to reductions from brokerage service arrangements or other expense offset arrangements. Expenses net of all reductions represent the net expenses paid by the class. I The portfolio turnover rate does not include the assets acquired in the merger. |
See accompanying notes which are an integral part of the financial statements.
Annual Report
Notes to Financial Statements
For the period ended October 31, 2011
1. Organization.
Fidelity Japan Fund (the Fund) is a fund of Fidelity Investment Trust (the Trust) and is authorized to issue an unlimited number of shares. The Trust is registered under the Investment Company Act of 1940, as amended (the 1940 Act), as an open-end management investment company organized as a Massachusetts business trust. The Fund launched shares of Class A, Class T, Class B, Class C and Institutional Class and the existing class was designated Japan on December 14, 2011. Each class has equal rights as to assets and voting privileges. Class B shares are closed to new accounts and additional purchases by existing shareholders. Each class has exclusive voting rights with respect to matters that affect that class. Class B shares automatically convert to Class A shares after a holding period of seven years from the initial date of purchase. Investment income, realized and unrealized capital gains and losses, the common expenses of the Fund, and certain fund-level expense reductions, if any, are allocated on a pro-rata basis to each class based on the relative net assets of each class to the total net assets of the Fund. Each class differs with respect to transfer agent and distribution and service plan fees incurred. Certain expense reductions may also differ by class. The Fund offered Class F shares during the period June 26, 2009 through December 15, 2010 and all outstanding shares were redeemed by December 15, 2010.
2. Investments in Fidelity Central Funds.
The Fund invests in Fidelity Central Funds, which are open-end investment companies available only to other investment companies and accounts managed by Fidelity Management & Research Company (FMR) and its affiliates. The Fund's Schedule of Investments lists each of the Fidelity Central Funds held as of period end, if any, as an investment of the Fund, but does not include the underlying holdings of each Fidelity Central Fund. As an Investing Fund, the Fund indirectly bears its proportionate share of the expenses of the underlying Fidelity Central Funds.
The Money Market Central Funds seek preservation of capital and current income and are managed by Fidelity Investments Money Management, Inc. (FIMM), an affiliate of FMR.
A complete unaudited list of holdings for each Fidelity Central Fund is available upon request or at the Securities and Exchange Commission (the SEC) web site at www.sec.gov. In addition, the financial statements of the Fidelity Central Funds, which are not covered by the Fund's Report of Independent Registered Public Accounting Firm are available on the SEC web site or upon request.
3. Significant Accounting Policies.
The financial statements have been prepared in conformity with accounting principles generally accepted in the United States of America (GAAP), which require management to make certain estimates and assumptions at the date of the financial statements. Actual results could differ from those estimates. Subsequent events, if any, through the date that the financial statements were issued have been evaluated in the preparation of the financial statements. The following summarizes the significant accounting policies of the Fund:
Security Valuation. Investments are valued as of 4:00 p.m. Eastern time on the last calendar day of the period. The Fund uses independent pricing services approved by the Board of Trustees to value its investments. When current market prices or quotations are not readily available or reliable, valuations may be determined in good faith in accordance with procedures adopted by the Board of Trustees. Factors used in determining value may include market or security specific events. The frequency with which these procedures are used cannot be predicted and they may be utilized to a significant extent. The value used for net asset value (NAV) calculation under these procedures may differ from published prices for the same securities.
The Fund categorizes the inputs to valuation techniques used to value its investments into a disclosure hierarchy consisting of three levels as shown below:
Level 1 - quoted prices in active markets for identical investments
Level 2 - other significant observable inputs (including quoted prices for similar investments, interest rates, prepayment speeds, etc.)
Level 3 - unobservable inputs (including the Fund's own assumptions based on the best information available)
Changes in valuation techniques may result in transfers in or out of an assigned level within the disclosure hierarchy. The aggregate value of investments by input level, as of October 31, 2011, is included at the end of the Fund's Schedule of Investments. Valuation techniques used to value the Fund's investments by major category are as follows:
Equity securities, including restricted securities, for which market quotations are readily available, are valued at the last reported sale price or official closing price as reported by an independent pricing service on the primary market or exchange on which they are traded and are categorized as Level 1 in the hierarchy. In the event there were no sales during the day or closing prices are not available, securities are valued at the last quoted bid price or may be valued using the last available price and are generally categorized as Level 2 in the hierarchy. For foreign equity securities, when significant market or security specific events arise, comparisons to the valuation of American Depositary Receipts (ADRs), futures contracts, Exchange-traded
Annual Report
Notes to Financial Statements - continued
3. Significant Accounting Policies - continued
Security Valuation - continued
funds (ETFs) and certain indexes as well as quoted prices for similar securities are used and are categorized as Level 2 in the hierarchy in these circumstances. Utilizing these techniques may result in transfers between Level 1 and Level 2. For restricted equity securities and private placements where observable inputs are limited, assumptions about market activity and risk are used and are categorized as Level 3 in the hierarchy.
Investments in open-end mutual funds, including the Fidelity Central Funds, are valued at their closing net asset value each business day and are categorized as Level 1 in the hierarchy.
Foreign Currency. The Fund may use foreign currency contracts to facilitate transactions in foreign-denominated securities. Gains and losses from these transactions may arise from changes in the value of the foreign currency or if the counterparties do not perform under the contracts' terms.
Foreign-denominated assets, including investment securities, and liabilities are translated into U.S. dollars at the exchange rate at period end. Purchases and sales of investment securities, income and dividends received and expenses denominated in foreign currencies are translated into U.S. dollars at the exchange rate in effect on the transaction date.
The effects of exchange rate fluctuations on investments are included with the net realized and unrealized gain (loss) on investment securities. Other foreign currency transactions resulting in realized and unrealized gain (loss) are disclosed separately.
Investment Transactions and Income. For financial reporting purposes, the Fund's investment holdings and NAV include trades executed through the end of the last business day of the period. The NAV per share for processing shareholder transactions is calculated as of the close of business of the New York Stock Exchange (NYSE), normally 4:00 p.m. Eastern time and includes trades executed through the end of the prior business day. Gains and losses on securities sold are determined on the basis of identified cost. Dividend income is recorded on the ex-dividend date, except for certain dividends from foreign securities where the ex-dividend date may have passed, which are recorded as soon as the Fund is informed of the ex-dividend date. Non-cash dividends included in dividend income, if any, are recorded at the fair market value of the securities received. Interest income and distributions from the Fidelity Central Funds are accrued as earned. Interest income includes coupon interest and amortization of premium and accretion of discount on debt securities. Investment income is recorded net of foreign taxes withheld where recovery of such taxes is uncertain.
Expenses. Expenses directly attributable to a fund are charged to that fund. Expenses attributable to more than one fund are allocated among the respective funds on the basis of relative net assets or other appropriate methods. Expense estimates are accrued in the period to which they relate and adjustments are made when actual amounts are known.
Income Tax Information and Distributions to Shareholders. Each year, the Fund intends to qualify as a regulated investment company, including distributing substantially all of its taxable income and realized gains under Subchapter M of the Internal Revenue Code and filing its U.S. federal tax return. As a result, no provision for income taxes is required. As of October 31, 2011, the Fund did not have any unrecognized tax benefits in the financial statements. A fund's federal tax return is subject to examination by the Internal Revenue Service (IRS) for a period of three years. Foreign taxes are provided for based on the Fund's understanding of the tax rules and rates that exist in the foreign markets in which it invests.
Distributions are declared and recorded on the ex-dividend date. Income dividends and capital gain distributions are declared separately for each class. Income and capital gain distributions are determined in accordance with income tax regulations, which may differ from GAAP.
Capital accounts within the financial statements are adjusted for permanent book-tax differences. These adjustments have no impact on net assets or the results of operations. Temporary book-tax differences will reverse in a subsequent period.
Book-tax differences are primarily due to the foreign currency transactions, passive foreign investment companies (PFIC), capital loss carryforwards and losses deferred due to wash sales.
The federal tax cost of investment securities and unrealized appreciation (depreciation) as of period end were as follows:
Gross unrealized appreciation | $ 9,010,731 |
Gross unrealized depreciation | (93,994,822) |
Net unrealized appreciation (depreciation) on securities and other investments | $ (84,984,091) |
| |
Tax Cost | $ 561,143,163 |
Annual Report
3. Significant Accounting Policies - continued
Income Tax Information and Distributions to Shareholders - continued
The tax-based components of distributable earnings as of period end were as follows:
Undistributed ordinary income | $ 9,973,043 |
Capital loss carryforward | $ (523,526,201) |
Net unrealized appreciation (depreciation) | $ (85,061,572) |
Under the recently enacted Regulated Investment Company Modernization Act of 2010 (the Act), the Fund will be permitted to carry forward capital losses incurred in taxable years beginning after December 22, 2010 for an unlimited period. However, any losses incurred during those future taxable years will be required to be utilized prior to any losses incurred in pre-enactment taxable years, which generally expire after eight years from when they are incurred. Additionally, post-enactment capital losses that are carried forward will retain their character as either short-term or long-term capital losses rather than being considered all short-term as under previous law. The Fund's first fiscal year end subject to the Act will be October 31, 2012.
The tax character of distributions paid was as follows:
| October 31, 2011 | October 31, 2010 |
Ordinary Income | $ 20,255,739 | $ 16,173,245 |
Short-Term Trading (Redemption) Fees. Shares held by investors in the Fund less than 90 days are subject to a redemption fee equal to 1.50% of the net asset value of shares redeemed. All redemption fees, which reduce the proceeds of the shareholder redemption, are retained by the Fund and accounted for as an addition to paid in capital.
New Accounting Pronouncement. In May 2011, the Financial Accounting Standards Board issued Accounting Standard Update No. 2011-04, Fair Value Measurement (Topic 820) - Amendments to Achieve Common Fair Value Measurement and Disclosure Requirements in U.S. GAAP and IFRSs. The update changes the wording used to describe the requirements in GAAP for measuring fair value and for disclosing information about fair value measurements. The update is effective during interim and annual periods beginning after December 15, 2011. Management is currently evaluating the impact of the update's adoption on the Fund's financial statement disclosures.
4. Purchases and Sales of Investments.
Purchases and sales of securities, other than short-term securities, aggregated $721,537,081 and $904,027,023, respectively.
5. Fees and Other Transactions with Affiliates.
Management Fee. FMR and its affiliates provide the Fund with investment management related services for which the Fund pays a monthly management fee. The management fee is the sum of an individual fund fee rate that is based on an annual rate of .45% of the Fund's average net assets and a group fee rate that averaged .26% during the period. The group fee rate is based upon the average net assets of all the mutual funds advised by FMR. The group fee rate decreases as assets under management increase and increases as assets under management decrease. In addition, the management fee is subject to a performance adjustment (up to a maximum of ± .20% of the Fund's average net assets over a 36 month performance period). The upward or downward adjustment to the management fee is based on the relative investment performance of Japan class of shares as compared to an appropriate benchmark index. For the period, the total annual management fee rate, including the performance adjustment, was .54% of the Fund's average net assets.
Distribution and Service Plan Fees. In accordance with Rule 12b-1 of the 1940 Act, the Fund has adopted separate Distribution and Service Plans for each class of shares. Certain classes pay Fidelity Distributors Corporation (FDC), an affiliate of FMR, separate Distribution and Service Fees, each of which is based on an annual percentage of each class' average net assets. In addition, FDC may pay financial intermediaries for selling shares of the Fund and providing shareholder support services. For the period, the Distribution and Service Fee rates, total fees and amounts retained by FDC were as follows:
| Distribution
Fee | Service
Fee | Total Fees | Retained
by FDC |
Class A | -% | .25% | $ 33,584 | $ 956 |
Class T | .25% | .25% | 21,758 | - |
Class B | .75% | .25% | 16,323 | 12,260 |
Class C | .75% | .25% | 88,343 | 36,106 |
| | | $ 160,008 | $ 49,322 |
Annual Report
Notes to Financial Statements - continued
5. Fees and Other Transactions with Affiliates - continued
Sales Load. FDC may receive a front-end sales charge of up to 5.75% for selling Class A shares, and 3.50% for selling Class T shares, some of which is paid to financial intermediaries for selling shares of the Fund. Depending on the holding period, FDC may receive contingent deferred sales charges levied on Class A, Class T, Class B, and Class C redemptions. The deferred sales charges range from 5% to 1% for Class B, 1% for Class C, 1.00% for certain purchases of Class A shares and .25% for certain purchases of Class T shares.
For the period, sales charge amounts retained by FDC were as follows:
| Retained
by FDC |
Class A | $ 14,607 |
Class T | 2,755 |
Class B* | 1,789 |
Class C* | 3,545 |
| $ 22,696 |
* When Class B and Class C shares are initially sold, FDC pays commissions from its own resources to financial intermediaries through which the sales are made.
Transfer Agent Fees. Fidelity Investments Institutional Operations Company, Inc. (FIIOC), an affiliate of FMR, is the transfer, dividend disbursing and shareholder servicing agent for each class of the Fund. FIIOC receives account fees and asset-based fees that vary according to the account size and type of account of the shareholders of the respective classes of the Fund. FIIOC pays for typesetting, printing and mailing of shareholder reports, except proxy statements. For the period, transfer agent fees for each class were as follows:
| Amount | % of
Average
Net Assets |
Class A | $ 40,772 | .30 |
Class T | 14,503 | .33 |
Class B | 4,919 | .30 |
Class C | 24,172 | .27 |
Japan | 1,110,816 | .21 |
Institutional Class | 4,414 | .15 |
| $ 1,199,596 | |
Accounting and Security Lending Fees. Fidelity Service Company, Inc. (FSC), an affiliate of FMR, maintains the Fund's accounting records. The accounting fee is based on the level of average net assets for the month. Under a separate contract, FSC administers the security lending program. The security lending fee is based on the number and duration of lending transactions.
6. Committed Line of Credit.
The Fund participates with other funds managed by FMR or an affiliate in a $4.0 billion credit facility (the "line of credit") to be utilized for temporary or emergency purposes to fund shareholder redemptions or for other short-term liquidity purposes. The Fund has agreed to pay commitment fees on its pro-rata portion of the line of credit, which amounted to $1,762 and is reflected in Miscellaneous expenses on the Statement of Operations. During the period, there were no borrowings on this line of credit.
7. Security Lending.
The Fund lends portfolio securities through a lending agent from time to time in order to earn additional income. For equity securities, a lending agent is used and may loan securities to certain qualified borrowers, including Fidelity Capital Markets (FCM), a broker-dealer affiliated with the Fund. On the settlement date of the loan, the Fund receives collateral (in the form of U.S. Treasury obligations, letters of credit and/or cash) against the loaned securities and maintains collateral in an amount not less than 100% of the market value of the loaned securities during the period of the loan. The market value of the loaned securities is determined at the close of business of the Fund and any additional required collateral is delivered to the Fund on the next business day. If the borrower defaults on its obligation to return the securities loaned because of insolvency or other reasons, a fund could experience delays and costs in recovering the securities loaned or in gaining access to the collateral. Any cash collateral received is invested in the Fidelity Securities Lending Cash Central Fund. At period end, there were no security loans outstanding. Security lending income represents the income earned on investing cash collateral, less rebates paid to borrowers and any lending agent fees associated with the loan, plus any premium payments received for lending certain types of securities. Security lending income is presented in the Statement of Operations as a component of income from Fidelity Central Funds. Total security lending income during the period amounted to $6,193. During the period, there were no securities loaned to FCM.
Annual Report
8. Expense Reductions.
FMR voluntarily agreed to reimburse a portion of Japan's operating expenses. During the period, this reimbursement reduced the class' expenses by $68,875.
Many of the brokers with whom FMR places trades on behalf of the Fund provided services in addition to trade execution. These services included payments of certain expenses on behalf of the Fund totaling $219,091 for the period.
9. Distributions to Shareholders.
Distributions to shareholders of each class were as follows:
Years ended October 31, | 2011A,B | 2010 |
From net investment income | | |
Class A | $ - | $ - |
Class T | - | - |
Class B | - | - |
Class C | - | - |
Japan | 9,544,936 | 6,581,344 |
Class F | 204,046 | 84,436 |
Institutional Class | - | - |
Total | $ 9,748,982 | $ 6,665,780 |
From net realized gain | | |
Class A | $ - | $ - |
Class T | - | - |
Class B | - | - |
Class C | - | - |
Japan | 10,328,111 | 9,401,920 |
Class F | 178,646 | 105,545 |
Institutional Class | - | - |
Total | $ 10,506,757 | $ 9,507,465 |
A Distributions for Class A, Class T, Class B, Class C and Institutional Class are for the period December 14, 2010 (commencement of sale of shares) to October 31, 2011.
B All Class F shares were redeemed on December 15, 2010.
10. Share Transactions.
Transactions for each class of shares were as follows:
| Shares | Dollars |
Years ended October 31, | 2011A,B | 2010 | 2011A,B | 2010 |
Class A | | | | |
Shares sold | 902,250 | - | $ 9,266,531 | $ - |
Issued in exchange for shares of Fidelity Advisor Japan Fund | 1,458,691 | - | 15,812,213 | - |
Shares redeemed | (975,882) | - | (10,202,627) | - |
Net increase (decrease) | 1,385,059 | - | $ 14,876,117 | $ - |
Class T | | | | |
Shares sold | 132,383 | - | $ 1,384,063 | $ - |
Issued in exchange for shares of Fidelity Advisor Japan Fund | 487,882 | - | 5,288,638 | - |
Shares redeemed | (132,194) | - | (1,415,637) | - |
Net increase (decrease) | 488,071 | - | $ 5,257,064 | $ - |
Class B | | | | |
Shares sold | 15,198 | - | $ 161,868 | $ - |
Issued in exchange for shares of Fidelity Advisor Japan Fund | 224,548 | - | 2,434,105 | - |
Shares redeemed | (85,826) | - | (926,239) | - |
Net increase (decrease) | 153,920 | - | $ 1,669,734 | $ - |
Class C | | | | |
Shares sold | 711,218 | - | $ 7,424,606 | $ - |
Issued in exchange for shares of Fidelity Advisor Japan Fund | 857,308 | - | 9,293,223 | - |
Shares redeemed | (645,053) | - | (6,643,542) | - |
Net increase (decrease) | 923,473 | - | $ 10,074,287 | $ - |
Annual Report
Notes to Financial Statements - continued
10. Share Transactions - continued
| Shares | Dollars |
Years ended October 31, | 2011A,B | 2010 | 2011A,B | 2010 |
Japan | | | | |
Shares sold | 16,755,813 | 20,810,343 | $ 180,371,996 | $ 217,088,312 |
Reinvestment of distributions | 1,718,167 | 1,440,939 | 18,229,748 | 14,827,260 |
Shares redeemed | (32,842,865) | (55,048,520) | (351,598,189) | (565,865,726) |
Net increase (decrease) | (14,368,885) | (32,797,238) | $ (152,996,445) | $ (333,950,154) |
Class F | | | | |
Shares sold | 346,757 | 8,109,487 | $ 3,766,116 | $ 83,695,320 |
Reinvestment of distributions | 36,103 | 18,463 | 382,692 | 189,982 |
Shares redeemed | (3,617,960) | (5,428,702) | (39,396,699) | (55,799,580) |
Net increase (decrease) | (3,235,100) | 2,699,248 | $ (35,247,891) | $ 28,085,722 |
Institutional Class | | | | |
Shares sold | 324,072 | - | $ 3,355,850 | $ - |
Issued in exchange for shares of Fidelity Advisor Japan Fund | 420,228 | - | 4,555,276 | - |
Shares redeemed | (460,581) | - | (4,809,911) | - |
Net increase (decrease) | 283,719 | - | $ 3,101,215 | $ - |
A Share transactions for Class A, Class T, Class B, Class C and Institutional Class are for the period December 14, 2010 (commencement of sale of shares) to October 31, 2011.
B All Class F shares were redeemed on December 15, 2010.
11. Other.
The Fund's organizational documents provide former and current trustees and officers with a limited indemnification against liabilities arising in connection with the performance of their duties to the Fund. In the normal course of business, the Fund may also enter into contracts that provide general indemnifications. The Fund's maximum exposure under these arrangements is unknown as this would be dependent on future claims that may be made against the Fund. The risk of material loss from such claims is considered remote.
At the end of the period, Strategic Advisors International Fund was the owner of record of approximately 31% of the total outstanding shares of the Fund. Mutual funds managed by Strategic Advisors, Inc., an affiliate of FMR, were the owners of record, in the aggregate, of approximately 36% of the total outstanding shares of the Fund.
12. Merger Information.
On December 17, 2010, the Fund acquired all of the assets and assumed all of the liabilities of the Fidelity Advisor Japan Fund ("Target Fund") pursuant to an agreement and plan of reorganization approved by the Board of Trustees ("The Board") on July 14, 2010. The reorganization provides shareholders of the Target Fund access to a larger portfolio with the same investment objective and lower expenses. The acquisition was accomplished by an exchange of 1,458,691 Class A shares, 487,882 Class T shares, 224,548 Class B shares, 857,308 Class C shares, and 420,228 Institutional Class shares of the Fund, respectively, for 1,347,662 Class A shares, 458,320 Class T shares, 220,839 Class B shares, 837,651 Class C shares, and 377,690 Institutional Class shares then outstanding (valued at $11.73, $11.54, $11.02, $11.09 and $12.06 per share for Class A, Class T, Class B, Class C, and Institutional Class, respectively) of the Target Fund. The reorganization qualified as a tax-free reorganization for federal income tax purposes with no gain or loss recognized to the funds or their shareholders. The Target Fund's net assets, including securities of $37,429,891, unrealized depreciation of $(2,434,247), cash of $6,456 and net other liabilities of $(52,892), were combined with the Fund's net assets of $515,046,445 for total net assets after the acquisition of $552,429,900.
Pro forma results of operations of the combined entity for the entire period ended October 31, 2011, as though the acquisition had occurred as of the beginning of the year (rather than on the actual acquisition date), are as follows:
Net investment income (loss) | $ 7,426,258 |
Total net realized gain (loss) | (68,640,546) |
Total change in net unrealized appreciation (depreciation) | 34,276,793 |
Net increase (decrease) in net assets resulting from operations | $ 26,937,495 |
Because the combined investment portfolios have been managed as a single portfolio since the acquisition was completed, it is not practicable to separate the amounts of revenue and earnings of the acquired fund that have been included in the Fund's accompanying Statement of Operations since December 17, 2010.
Annual Report
Report of Independent Registered Public Accounting Firm
To the Trustees of Fidelity Investment Trust and the Shareholders of Fidelity Japan Fund:
In our opinion, the accompanying statement of assets and liabilities, including the schedule of investments, and the related statements of operations and of changes in net assets and the financial highlights present fairly, in all material respects, the financial position of Fidelity Japan Fund (a fund of Fidelity Investment Trust) at October 31, 2011, the results of its operations for the year then ended, the changes in its net assets for each of the two years in the period then ended and the financial highlights for each of the periods indicated, in conformity with accounting principles generally accepted in the United States of America. These financial statements and financial highlights (hereafter referred to as "financial statements") are the responsibility of the Fidelity Japan Fund's management. Our responsibility is to express an opinion on these financial statements based on our audits. We conducted our audits of these financial statements in accordance with the standards of the Public Company Accounting Oversight Board (United States). Those standards require that we plan and perform the audit to obtain reasonable assurance about whether the financial statements are free of material misstatement. An audit includes examining, on a test basis, evidence supporting the amounts and disclosures in the financial statements, assessing the accounting principles used and significant estimates made by management, and evaluating the overall financial statement presentation. We believe that our audits, which included confirmation of securities at October 31, 2011 by correspondence with the custodian and brokers, provide a reasonable basis for our opinion.
PricewaterhouseCoopers LLP
Boston, Massachusetts
December 16, 2011
Annual Report
The Trustees, Members of the Advisory Board, and executive officers of the trust and fund, as applicable, are listed below. The Board of Trustees governs the fund and is responsible for protecting the interests of shareholders. The Trustees are experienced executives who meet periodically throughout the year to oversee the fund's activities, review contractual arrangements with companies that provide services to the fund, oversee management of the risks associated with such activities and contractual arrangements, and review the fund's performance. Except for James C. Curvey, each of the Trustees oversees 226 funds advised by FMR or an affiliate. Mr. Curvey oversees 429 funds advised by FMR or an affiliate.
The Trustees hold office without limit in time except that (a) any Trustee may resign; (b) any Trustee may be removed by written instrument, signed by at least two-thirds of the number of Trustees prior to such removal; (c) any Trustee who requests to be retired or who has become incapacitated by illness or injury may be retired by written instrument signed by a majority of the other Trustees; and (d) any Trustee may be removed at any special meeting of shareholders by a two-thirds vote of the outstanding voting securities of the trust. Each Trustee who is not an interested person (as defined in the 1940 Act) (Independent Trustee), shall retire not later than the last day of the calendar year in which his or her 75th birthday occurs. The Independent Trustees may waive this mandatory retirement age policy with respect to individual Trustees. The executive officers and Advisory Board Members hold office without limit in time, except that any officer and Advisory Board Member may resign or may be removed by a vote of a majority of the Trustees at any regular meeting or any special meeting of the Trustees. Except as indicated, each individual has held the office shown or other offices in the same company for the past five years.
Experience, Skills, Attributes, and Qualifications of the Fund's Trustees. The Governance and Nominating Committee has adopted a statement of policy that describes the experience, qualifications, attributes, and skills that are necessary and desirable for potential Independent Trustee candidates (Statement of Policy). The Board believes that each Trustee satisfied at the time he or she was initially elected or appointed a Trustee, and continues to satisfy, the standards contemplated by the Statement of Policy. The Governance and Nominating Committee also engages professional search firms to help identify potential Independent Trustee candidates who have the experience, qualifications, attributes, and skills consistent with the Statement of Policy. From time to time, additional criteria based on the composition and skills of the current Independent Trustees, as well as experience or skills that may be appropriate in light of future changes to board composition, business conditions, and regulatory or other developments, have also been considered by the professional search firms and the Governance and Nominating Committee. In addition, the Board takes into account the Trustees' commitment and participation in Board and committee meetings, as well as their leadership of standing and ad hoc committees throughout their tenure.
In determining that a particular Trustee was and continues to be qualified to serve as a Trustee, the Board has considered a variety of criteria, none of which, in isolation, was controlling. The Board believes that, collectively, the Trustees have balanced and diverse experience, qualifications, attributes, and skills, which allow the Board to operate effectively in governing the fund and protecting the interests of shareholders. Information about the specific experience, skills, attributes, and qualifications of each Trustee, which in each case led to the Board's conclusion that the Trustee should serve (or continue to serve) as a trustee of the fund, is provided below.
Board Structure and Oversight Function. James C. Curvey is an interested person (as defined in the 1940 Act) and currently serves as Acting Chairman. The Trustees have determined that an interested Chairman is appropriate and benefits shareholders because an interested Chairman has a personal and professional stake in the quality and continuity of services provided to the fund. Independent Trustees exercise their informed business judgment to appoint an individual of their choosing to serve as Chairman, regardless of whether the Trustee happens to be independent or a member of management. The Independent Trustees have determined that they can act independently and effectively without having an Independent Trustee serve as Chairman and that a key structural component for assuring that they are in a position to do so is for the Independent Trustees to constitute a substantial majority for the Board. The Independent Trustees also regularly meet in executive session. Ned C. Lautenbach serves as Chairman of the Independent Trustees and as such (i) acts as a liaison between the Independent Trustees and management with respect to matters important to the Independent Trustees and (ii) with management prepares agendas for Board meetings.
Fidelity funds are overseen by different Boards of Trustees. The fund's Board oversees Fidelity's equity and high income funds and another Board oversees Fidelity's investment-grade bond, money market, and asset allocation funds. The asset allocation funds may invest in Fidelity funds overseen by the fund's Board. The use of separate Boards, each with its own committee structure, allows the Trustees of each group of Fidelity funds to focus on the unique issues of the funds they oversee, including common research, investment, and operational issues. On occasion, the separate Boards establish joint committees to address issues of overlapping consequences for the Fidelity funds overseen by each Board.
The Trustees operate using a system of committees to facilitate the timely and efficient consideration of all matters of importance to the Trustees, the fund, and fund shareholders and to facilitate compliance with legal and regulatory requirements and oversight of the fund's activities and associated risks. The Board, acting through its committees, has charged FMR and its affiliates with (i) identifying events or circumstances the occurrence of which could have demonstrably adverse effects on the fund's business and/or reputation; (ii) implementing processes and controls to lessen the possibility that such events or circumstances occur or to mitigate the effects of such events or circumstances if they do occur; and (iii) creating and maintaining a system designed to evaluate continuously business and market conditions in order to facilitate the identification and implementation processes described in (i) and (ii) above. Because the day-to-day operations and activities of the fund are carried out by or through FMR, its affiliates and other service providers, the fund's exposure to risks is mitigated but not eliminated by the processes overseen by the Trustees. While each of the Board's committees has responsibility for overseeing different aspects of the fund's activities, oversight is exercised primarily through the Operations, Audit, and Compliance Committees. In addition, the Independent Trustees have worked with FMR to enhance the Board's oversight of investment and financial risks, legal and regulatory risks, technology risks, and operational risks, including the development of additional risk reporting to the Board. For example, a working group comprised of Independent Trustees and FMR has worked and continues to work to review the Fidelity funds' valuation-related activities, reporting and risk management. Appropriate personnel, including but not limited to the fund's Chief Compliance Officer (CCO), FMR's internal auditor, the independent accountants, the fund's Treasurer and portfolio management personnel, make periodic reports to the Board's committees, as appropriate, including an annual review of FMR's risk management program for the Fidelity funds. The responsibilities of each standing committee, including their oversight responsibilities, are described further under "Standing Committees of the Fund's Trustees."
Annual Report
Trustees and Officers - continued
The fund's Statement of Additional Information (SAI) includes more information about the Trustees. To request a free copy, call Fidelity at 1-877-208-0098.
Interested Trustees*:
Correspondence intended for each Trustee who is an interested person may be sent to Fidelity Investments, 82 Devonshire Street, Boston, Massachusetts 02109.
Name, Age; Principal Occupations and Other Relevant Experience+ |
James C. Curvey (76) |
| Year of Election or Appointment: 2007 Mr. Curvey is Trustee and Acting Chairman of the Board of Trustees of certain Trusts. Mr. Curvey also serves as Trustee (2007-present) of other investment companies advised by FMR. Mr. Curvey is a Director of Fidelity Investments Money Management, Inc. (2009-present), Director of Fidelity Research & Analysis Co. (2009-present) and Director of FMR and FMR Co., Inc. (2007-present). Mr. Curvey is also Vice Chairman (2007-present) and Director of FMR LLC. In addition, Mr. Curvey serves as an Overseer for the Boston Symphony Orchestra and a member of the Trustees of Villanova University. Previously, Mr. Curvey was the Vice Chairman (2006-2007) and Director (2000-2007) of FMR Corp. |
Ronald P. O'Hanley (54) |
| Year of Election or Appointment: 2011 Mr. O'Hanley is Director of FMR Co., Inc. (2010-present), Director of Fidelity Investments Money Management, Inc. (2010-present), Director of Fidelity Research & Analysis Company (2010-present), President of Fidelity Asset Management and Corporate Services and a member of Fidelity's Executive Committee (2010-present). Previously, Mr. O'Hanley served as President and Chief Executive Officer of BNY Mellon Asset Management (2007-2010). Mr. O'Hanley also served as Vice Chairman of Bank New York Mellon Corp. and a member of that firm's Executive Committee. Prior to the 2007 merger of The Bank of New York and Mellon Financial Corporation, he was Vice Chairman of Mellon Financial Corporation and President and Chief Executive Officer of Mellon Asset Management. He joined Mellon in February 1997. Mr. O'Hanley currently serves as Chairman of the Boston Public Library Foundation Board of Directors and sits on the Board of Directors of Beth Israel Deaconess Medical Center, the Board of Trustees of the Marine Biological Laboratory and the Advisory Board of the Maxwell School of Citizenship and Public Administration at Syracuse University. Mr. O'Hanley also chairs the Council on Asset Management for the Financial Services Roundtable and is a member of the Board of Directors of Institutional Investor's U.S. Institute. |
* Trustees have been determined to be "Interested Trustees" by virtue of, among other things, their affiliation with the trust or various entities under common control with FMR.
+ The information above includes each Trustee's principal occupation during the last five years and other information relating to the experience, attributes, and skills relevant to each Trustee's qualifications to serve as a Trustee, which led to the conclusion that each Trustee should serve as a Trustee for the fund.
Independent Trustees:
Correspondence intended for each Independent Trustee (that is, the Trustees other than the Interested Trustees) may be sent to Fidelity Investments, P.O. Box 55235, Boston, Massachusetts 02205-5235.
Name, Age; Principal Occupations and Other Relevant Experience+ |
Dennis J. Dirks (63) |
| Year of Election or Appointment: 2005 Prior to his retirement in May 2003, Mr. Dirks was Chief Operating Officer and a member of the Board of The Depository Trust & Clearing Corporation (DTCC). He also served as President, Chief Operating Officer, and Board member of The Depository Trust Company (DTC) and President and Board member of the National Securities Clearing Corporation (NSCC). In addition, Mr. Dirks served as Chief Executive Officer and Board member of the Government Securities Clearing Corporation, Chief Executive Officer and Board member of the Mortgage-Backed Securities Clearing Corporation, as a Trustee and a member of the Finance Committee of Manhattan College (2005-2008), and as a Trustee and a member of the Finance Committee of AHRC of Nassau County (2006-2008). Mr. Dirks is a member of the Independent Directors Council (IDC) Governing Council (2010-Present) and Board of Directors for The Brookville Center for Children's Services, Inc. (2009-present). |
Alan J. Lacy (58) |
| Year of Election or Appointment: 2008 Mr. Lacy serves as Senior Adviser (2007-present) of Oak Hill Capital Partners, L.P. (private equity). Mr. Lacy also served as Chief Executive Officer (2000-2005) and Vice Chairman (2005-2006) of Sears Holdings Corporation and Sears, Roebuck and Co. (retail). In addition, Mr. Lacy serves as a member of the Board of Directors of Dave & Buster's, Inc. (restaurant and entertainment complexes, 2010-present), The Hillman Companies, Inc. (hardware wholesalers, 2010-present), and Bristol-Myers Squibb Company (global pharmaceuticals, 2007-present). Mr. Lacy is a member of the Board of Trustees of The National Parks Conservation Association (2006-Present). Previously, Mr. Lacy served as Chairman of the Board of Trustees of the National Parks Conservation Association (2008-2011) and as a member of the Board of Directors for the Western Union Company (global money transfer, 2006-2011). |
Ned C. Lautenbach (67) |
| Year of Election or Appointment: 2000 Mr. Lautenbach is Chairman of the Independent Trustees of the Equity and High Income Funds (2006-present). Mr. Lautenbach currently serves as the Lead Director of the Eaton Corporation Board of Directors (diversified industrial, 1997-present). Mr. Lautenbach is also a member of the Board of Directors of the Philharmonic Center for the Arts in Naples, Florida (1999-present); a member of the Board of Trustees of Fairfield University (2005-present); and a member of the Council on Foreign Relations (1994-present). Previously, Mr. Lautenbach was a Partner/Advisory Partner at Clayton, Dubilier & Rice, LLC (private equity investment, 1998-2010), as well as a Director of Sony Corporation (2006-2007). |
Joseph Mauriello (67) |
| Year of Election or Appointment: 2008 Prior to his retirement in January 2006, Mr. Mauriello served in numerous senior management positions including Deputy Chairman and Chief Operating Officer (2004-2005), and Vice Chairman of Financial Services (2002-2004) of KPMG LLP US (professional services, 1965-2005). Mr. Mauriello currently serves as a member of the Board of Directors of XL Group plc. (global insurance and re-insurance, 2006-present) and of Arcadia Resources Inc. (health care services and products, 2007-present). Previously, Mr. Mauriello served as a Director of the Hamilton Funds of the Bank of New York (2006-2007). |
Robert W. Selander (61) |
| Year of Election or Appointment: 2011 Previously, Mr. Selander served as a Member of the Advisory Board of Fidelity's Equity and High Income Funds (2011), Executive Vice Chairman (2010), Chief Executive Officer (2009-2010), and President and Chief Executive Officer (1997-2009) of Mastercard, Inc. |
Cornelia M. Small (67) |
| Year of Election or Appointment: 2005 Ms. Small is a member of the Board of Directors of the Teagle Foundation (2009-present). Ms. Small is also a member of the Investment Committee, and Chair (2008-present) and a member of the Board of Trustees of Smith College. In addition, Ms. Small serves on the Investment Committee of the Berkshire Taconic Community Foundation (2008-present). Previously, Ms. Small served as Chairperson of the Investment Committee (2002-2008) of Smith College. In addition, Ms. Small served as Chief Investment Officer, Director of Global Equity Investments, and a member of the Board of Directors of Scudder, Stevens & Clark and Scudder Kemper Investments. |
William S. Stavropoulos (72) |
| Year of Election or Appointment: 2001 Mr. Stavropoulos is Vice Chairman of the Independent Trustees of the Equity and High Income Funds (2006-present). Mr. Stavropoulos serves as President and Founder of the Michigan Baseball Foundation, the Great Lakes Loons (2007-present). Mr. Stavropoulos is Chairman Emeritus of the Board of Directors of The Dow Chemical Company, where he previously served in numerous senior management positions, including President, CEO (1995-2000; 2002-2004), Chairman of the Executive Committee (2000-2006), and as a member of the Board of Directors (1990-2006). Currently, Mr. Stavropoulos is Chairman of Univar (global distributor of commodity and specialty chemicals, 2010-present), a Director of Teradata Corporation (data warehousing and technology solutions, 2008-present), Chemical Financial Corporation, Maersk Inc. (industrial conglomerate), Tyco International, Inc. (multinational manufacturing and services, 2007-present), and a member of the Advisory Board for Metalmark Capital (private equity investment, 2005-present). Mr. Stavropoulos is a special advisor to Clayton, Dubilier & Rice, LLC (private equity investment). In addition, Mr. Stavropoulos is a member of the University of Notre Dame Advisory Council for the College of Science. |
David M. Thomas (62) |
| Year of Election or Appointment: 2008 Previously, Mr. Thomas served as Executive Chairman (2005-2006) and Chairman and Chief Executive Officer (2000-2005) of IMS Health, Inc. (pharmaceutical and healthcare information solutions). In addition, Mr. Thomas serves as a member of the Board of Directors of Fortune Brands, Inc. (consumer products), and Interpublic Group of Companies, Inc. (marketing communication, 2004-present). |
Michael E. Wiley (61) |
| Year of Election or Appointment: 2008 Mr. Wiley also serves as a Director of Asia Pacific Exploration Consolidated (international oil and gas exploration and production, 2008-present). Mr. Wiley serves as a Director of Tesoro Corporation (independent oil refiner and marketer, 2005-present), and a Director of Bill Barrett Corporation (exploration and production, 2005-present). In addition, Mr. Wiley also serves as a Director of Post Oak Bank (privately-held bank, 2004-present). Previously, Mr. Wiley served as a member of the Board of Trustees of the University of Tulsa (2000-2006; 2007-2010), as a Senior Energy Advisor of Katzenbach Partners, LLC (consulting, 2006-2007), as an Advisory Director of Riverstone Holdings (private investment), Chairman, President, and CEO of Baker Hughes, Inc. (oilfield services, 2000-2004), and as Director of Spinnaker Exploration Company (exploration and production, 2001-2005). |
+ The information above includes each Trustee's principal occupation during the last five years and other information relating to the experience, attributes, and skills relevant to each Trustee's qualifications to serve as a Trustee, which led to the conclusion that each Trustee should serve as a Trustee for the fund.
Advisory Board Members and Executive Officers:
Correspondence intended for each executive officer, Edward C. Johnson 3d, and Peter S. Lynch may be sent to Fidelity Investments, 82 Devonshire Street, Boston, Massachusetts 02109.
Name, Age; Principal Occupation |
Edward C. Johnson 3d (81) |
| Year of Election or Appointment: 2011 Member of the Advisory Board of Fidelity's Equity and High Income Funds. Mr. Johnson serves as Chief Executive Officer, Chairman, and a Director of FMR LLC, and also serves as Chairman and Director of FIL Limited. Previously, Mr. Johnson served as a Trustee and Chairman of the Board of certain Fidelity Trusts, Chairman and a Director of FMR, Chairman and a Director of FMR Co., Inc., and President of FMR LLC (2006-2007). |
Peter S. Lynch (67) |
| Year of Election or Appointment: 2003 Member of the Advisory Board of Fidelity's Equity and High Income Funds. Mr. Lynch is Vice Chairman and a Director of FMR and FMR Co., Inc. In addition, Mr. Lynch serves as a Trustee of Boston College and as the Chairman of the Inner-City Scholarship Fund. Previously, Mr. Lynch served on the Special Olympics International Board of Directors (1997-2006). |
Kenneth B. Robins (42) |
| Year of Election or Appointment: 2008 President and Treasurer of Fidelity's Equity and High Income Funds. Mr. Robins also serves as President and Treasurer (2010-present) and Assistant Treasurer (2009-present) of other Fidelity funds and is an employee of Fidelity Investments (2004-present). Previously, Mr. Robins served as Deputy Treasurer of the Fidelity funds (2005-2008) and Treasurer and Chief Financial Officer of The North Carolina Capital Management Trust: Cash and Term Portfolios (2006-2008). |
Bruce T. Herring (46) |
| Year of Election or Appointment: 2006 Vice President of certain Equity Funds. Mr. Herring also serves as Chief Investment Officer and Director of Fidelity Management & Research (U.K.) Inc. (2010-present) and Group Chief Investments Officer of FMR. Previously, Mr. Herring served as Vice President (2005-2006) and Senior Vice President (2006-2007) of Fidelity Management & Research Company, Vice President of FMR Co., Inc. (2001-2007) and as a portfolio manager for Fidelity U.S. Equity Funds. |
Brian B. Hogan (47) |
| Year of Election or Appointment: 2009 Vice President of Equity and High Income Funds. Mr. Hogan also serves as President of FMR's Equity Division (2009-present). Previously, Mr. Hogan served as Senior Vice President, Equity Research of FMR (2006-2009) and as a portfolio manager. |
Scott C. Goebel (43) |
| Year of Election or Appointment: 2008 Secretary and Chief Legal Officer (CLO) of the Fidelity funds. Mr. Goebel also serves as Secretary of Fidelity Investments Money Management, Inc. (FIMM) (2010-present) and Fidelity Research and Analysis Company (FRAC) (2010-present); Secretary and CLO of The North Carolina Capital Management Trust: Cash and Term Portfolios (2008-present); General Counsel, Secretary, and Senior Vice President of FMR (2008-present) and FMR Co., Inc. (2008-present); employed by FMR LLC or an affiliate (2001-present); Chief Legal Officer of Fidelity Management & Research (Hong Kong) Limited (2008-present) and Assistant Secretary of Fidelity Management & Research (Japan) Inc. (2008-present), and Fidelity Management & Research (U.K.) Inc. (2008-present). Previously, Mr. Goebel served as Assistant Secretary of FIMM (2008-2010), FRAC (2008-2010), and the Funds (2007-2008) and as Vice President and Secretary of Fidelity Distributors Corporation (FDC) (2005-2007). |
William C. Coffey (42) |
| Year of Election or Appointment: 2009 Assistant Secretary of Fidelity's Equity and High Income Funds. Mr. Coffey also serves as Senior Vice President and Deputy General Counsel of FMR LLC (2010-present), and is an employee of Fidelity Investments. Previously, Mr. Coffey served as Vice President and Associate General Counsel of FMR LLC (2005-2009). |
Holly C. Laurent (57) |
| Year of Election or Appointment: 2008 Anti-Money Laundering (AML) Officer of the Fidelity funds. Ms. Laurent also serves as AML Officer of The North Carolina Capital Management Trust: Cash and Term Portfolios (2008-present) and is an employee of Fidelity Investments. Previously, Ms. Laurent was Senior Vice President and Head of Legal for Fidelity Business Services India Pvt. Ltd. (2006-2008), and Senior Vice President, Deputy General Counsel and Group Head for FMR LLC (2005-2006). |
Christine Reynolds (53) |
| Year of Election or Appointment: 2008 Chief Financial Officer of the Fidelity funds. Ms. Reynolds became President of Fidelity Pricing and Cash Management Services (FPCMS) in August 2008. Ms. Reynolds served as Chief Operating Officer of FPCMS (2007-2008). Previously, Ms. Reynolds served as President, Treasurer, and Anti-Money Laundering officer of the Fidelity funds (2004-2007). |
Kenneth A. Rathgeber (64) |
| Year of Election or Appointment: 2004 Chief Compliance Officer of Fidelity's Equity and High Income Funds. Mr. Rathgeber is Chief Compliance Officer of Fidelity Management & Research (Hong Kong) Limited (2008-present), Fidelity Management & Research (Japan) Inc. (2008-present), FMR (2005-present), FMR Co., Inc. (2005-present), Fidelity Management & Research (U.K.) Inc. (2005-present), Fidelity Research & Analysis Company (2005-present), Fidelity Investments Money Management, Inc. (2005-present), Pyramis Global Advisors, LLC (2005-present), and Strategic Advisers, Inc. (2005-present). |
Jeffrey S. Christian (50) |
| Year of Election or Appointment: 2009 Deputy Treasurer of the Fidelity funds. Mr. Christian is an employee of Fidelity Investments. Previously, Mr. Christian served as Chief Financial Officer (2008-2009) of certain Fidelity funds and Senior Vice President of Fidelity Pricing and Cash Management Services (FPCMS) (2004-2009). |
Joseph F. Zambello (54) |
| Year of Election or Appointment: 2011 Deputy Treasurer of the Fidelity funds. Mr. Zambello is an employee of Fidelity Investments. Previously, Mr. Zambello served as Vice President of FMR's Program Management Group (2009-2011) and Vice President of the Transfer Agent Oversight Group (2005-2009). |
Adrien E. Deberghes (44) |
| Year of Election or Appointment: 2008 Deputy Treasurer of Fidelity's Equity and High Income Funds. Mr. Deberghes also serves as Vice President and Assistant Treasurer of Fidelity Rutland Square Trust II and Fidelity Commonwealth Trust II (2011-present), Assistant Treasurer of other Fidelity funds (2010-present), and is an employee of Fidelity Investments (2008-present). Previously, Mr. Deberghes served as Senior Vice President of Mutual Fund Administration at State Street Corporation (2007-2008), Senior Director of Mutual Fund Administration at Investors Bank & Trust (2005-2007), and Director of Finance for Dunkin' Brands (2000-2005). |
Stephanie J. Dorsey (42) |
| Year of Election or Appointment: 2010 Assistant Treasurer of Fidelity's Equity and High Income Funds. Ms. Dorsey also serves as Deputy Treasurer of other Fidelity funds (2008-present) and is an employee of Fidelity Investments (2008-present). Previously, Ms. Dorsey served as Treasurer (2004-2008) of the JPMorgan Mutual Funds and Vice President (2004-2008) of JPMorgan Chase Bank. |
John R. Hebble (53) |
| Year of Election or Appointment: 2009 Assistant Treasurer of Fidelity's Equity and High Income Funds. Mr. Hebble also serves as President (2011-present), Treasurer, and Chief Financial Officer of The North Carolina Capital Management Trust: Cash and Term Portfolios (2008-present), President and Treasurer of other Fidelity funds (2008-present) and is an employee of Fidelity Investments. |
Gary W. Ryan (53) |
| Year of Election or Appointment: 2005 Assistant Treasurer of the Fidelity funds. Mr. Ryan is an employee of Fidelity Investments. Previously, Mr. Ryan served as Vice President of Fund Reporting in Fidelity Pricing and Cash Management Services (FPCMS) (1999-2005). |
Jonathan Davis (43) |
| Year of Election or Appointment: 2010 Assistant Treasurer of the Fidelity funds. Mr. Davis is also Assistant Treasurer of Fidelity Rutland Square Trust II and Fidelity Commonwealth Trust II. Mr. Davis is an employee of Fidelity Investments. Previously, Mr. Davis served as Vice President and Associate General Counsel of FMR LLC (2003-2010). |
Annual Report
The Board of Trustees of Fidelity Japan Fund voted to pay to shareholders of record at the opening of business on record date, the following distributions per share derived from capital gains realized from sales of portfolio securities, and dividends derived from net investment income:
| Pay Date | Record Date | Dividends | Capital Gains |
Class A | 12/12/11 | 12/09/11 | $0.127 | $0.052 |
Class T | 12/12/11 | 12/09/11 | $0.107 | $0.052 |
Class B | 12/12/11 | 12/09/11 | $0.041 | $0.052 |
Class C | 12/12/11 | 12/09/11 | $0.058 | $0.052 |
Annual Report
Board Approval of Investment Advisory Contracts and Management Fees
Fidelity Japan Fund
Each year, the Board of Trustees, including the Independent Trustees (together, the Board), votes on the renewal of the management contract and sub-advisory agreements (together, the Advisory Contracts) for the fund. The Board, assisted by the advice of fund counsel and Independent Trustees' counsel, requests and considers a broad range of information relevant to the renewal of the Advisory Contracts throughout the year.
The Board meets regularly and considers at each of its meetings factors that are relevant to its annual consideration of the renewal of the fund's Advisory Contracts, including the services and support provided to the fund and its shareholders. The Board has established various standing committees, each composed of Independent Trustees with varying backgrounds, to which the Board has assigned specific subject matter responsibilities in order to enhance effective decision-making by the Board. The Board, acting directly and through its Committees, requests and receives information concerning the annual consideration of the renewal of the fund's Advisory Contracts. The Board also meets as needed to consider matters specifically related to the Board's annual consideration of the renewal of Advisory Contracts. Members of the Board may also meet with trustees of other Fidelity funds through ad hoc joint committees to discuss certain matters relevant to the Fidelity funds.
At its July 2011 meeting, the Board of Trustees, including the Independent Trustees, unanimously determined to renew the fund's Advisory Contracts. In reaching its determination, the Board considered all factors it believed relevant, including (i) the nature, extent, and quality of the services to be provided to the fund and its shareholders (including the investment performance of the fund); (ii) the competitiveness of the fund's management fee and total expense ratio; (iii) the total costs of the services to be provided by and the profits to be realized by Fidelity from its relationship with the fund; (iv) the extent to which economies of scale would be realized as the fund grows; and (v) whether fee levels reflect these economies of scale, if any, for the benefit of fund shareholders.
In considering whether to renew the Advisory Contracts for the fund, the Board reached a determination, with the assistance of fund counsel and Independent Trustees' counsel and through the exercise of its business judgment, that the renewal of the Advisory Contracts is in the best interests of the fund and its shareholders and that the compensation payable under the Advisory Contracts is fair and reasonable. The Board's decision to renew the Advisory Contracts was not based on any single factor, but rather was based on a comprehensive consideration of all the information provided to the Board at its meetings throughout the year. The Board, in reaching its determination to renew the Advisory Contracts, is aware that shareholders in the fund have a broad range of investment choices available to them, including a wide choice among mutual funds offered by Fidelity's competitors, and that the fund's shareholders, who have the opportunity to review and weigh the disclosure provided by the fund in its prospectus and other public disclosures, have chosen to invest in this fund, managed by Fidelity.
Nature, Extent, and Quality of Services Provided. The Board considered the staffing within the investment adviser, FMR, and the sub-advisers (together, the Investment Advisers), including the backgrounds of the fund's investment personnel and the fund's investment objective and discipline. The Independent Trustees also had discussions with senior management of Fidelity's investment operations and investment groups. The Board considered the structure of the portfolio manager compensation program and whether this structure provides appropriate incentives to act in the best interests of the fund.
Resources Dedicated to Investment Management and Support Services. The Board and the Fund Oversight and Research Committees reviewed the general qualifications and capabilities of the Investment Advisers' investment staff, including its size, education, experience, and resources, as well as the Investment Advisers' approach to recruiting, training, managing, and compensating investment personnel. The Board also noted that FMR has devoted increased resources to non-U.S. offices. The Board noted that Fidelity's analysts have extensive resources, tools and capabilities which allow them to conduct sophisticated quantitative and fundamental analysis, as well as credit analysis of issuers, counterparties and enhancers. The Board also believes that Fidelity's investment professionals have sufficient access to global information and data so as to provide competitive investment results over time, and that those professionals also have access to sophisticated tools which permit them to assess portfolio construction and risk and performance attribution characteristics continuously, as well as to transmit new information and research conclusions rapidly around the world. Additionally, in their deliberations, the Board considered the Investment Advisers' trading capabilities and resources which are an integral part of the investment management process.
Shareholder and Administrative Services. The Board considered (i) the nature, extent, quality, and cost of advisory, administrative, and shareholder services performed by the Investment Advisers and their affiliates under the Advisory Contracts and under separate agreements covering transfer agency, pricing and bookkeeping, and securities lending services for the fund; (ii) the nature and extent of the investment adviser's supervision of third party service providers, principally custodians and subcustodians; and (iii) the resources devoted to, and the record of compliance with, the fund's compliance policies and procedures. The Board also reviewed the allocation of fund brokerage, including allocations to brokers affiliated with the Investment Advisers, the use of brokerage commissions to pay fund expenses, and the use of "soft" commission dollars to pay for research services.
The Board noted that the growth of fund assets over time across the complex allows Fidelity to reinvest in the development of services designed to enhance the value or convenience of the Fidelity funds as investment vehicles. These services include 24-hour access to account information and market information through telephone representatives and over the Internet, investor education materials and asset allocation tools, and the expanded availability of Fidelity Investor Centers, with 35 new branches opening since 2010.
Annual Report
Investment in a Large Fund Family. The Board considered the benefits to shareholders of investing in a Fidelity fund, including the benefits of investing in a fund that is part of a large family of funds offering a variety of investment disciplines and providing a large variety of mutual fund investor services. The Board noted that Fidelity had taken, or had made recommendations that resulted in the Fidelity funds taking, a number of actions over the previous year that benefited particular funds, including (i) continuing to dedicate additional resources to investment research and support of the senior management team that oversees asset management; (ii) rationalizing product lines through the mergers of six funds into other funds; (iii) continuing to migrate the Freedom Funds to dedicated lower cost underlying funds; (iv) obtaining shareholder approval to broaden the investment strategies for Fidelity Consumer Finance Portfolio, Fidelity Emerging Asia Fund, and Fidelity Environment and Alternative Energy Portfolio; (v) contractually agreeing to reduce the management fees and impose other expense limitations on Spartan 500 Index Fund and U.S. Bond Index Fund in connection with launching new institutional classes of these funds; (vi) changing the name, primary and supplemental benchmarks, and investment policies of Fidelity Global Strategies Fund to support the fund's flexible investment mandate and global orientation; and (vii) reducing the transfer agency account fee rates on certain accounts.
Investment Performance. The Board considered whether the fund has operated in accordance with its investment objective, as well as its record of compliance with its investment restrictions. It also reviewed the fund's absolute investment performance for the retail class, as well as the fund's relative investment performance for the retail class measured over multiple periods against (i) a broad-based securities market index, and (ii) a peer group of mutual funds deemed appropriate by Fidelity and reviewed by the Board. The following charts considered by the Board show, over the one-, three-, and five-year periods ended December 31, 2010, the cumulative total returns of the retail class of the fund, the cumulative total returns of a broad-based securities market index ("benchmark"), and a range of cumulative total returns of a peer group of mutual funds identified by Lipper, Inc. as having an investment objective similar to that of the fund. (The Advisor classes of the fund had less than one year of performance as of December 31, 2010.)
The box within each chart shows the 25th percentile return (bottom of box) and the 75th percentile return (top of box) of the peer group. Returns shown above the box are in the first quartile and returns shown below the box are in the fourth quartile. The percentage beaten numbers noted below each chart correspond to the percentile box and represent the percentage of funds in the peer group whose performance was equal to or lower than that of the fund or class indicated.
Fidelity Japan Fund
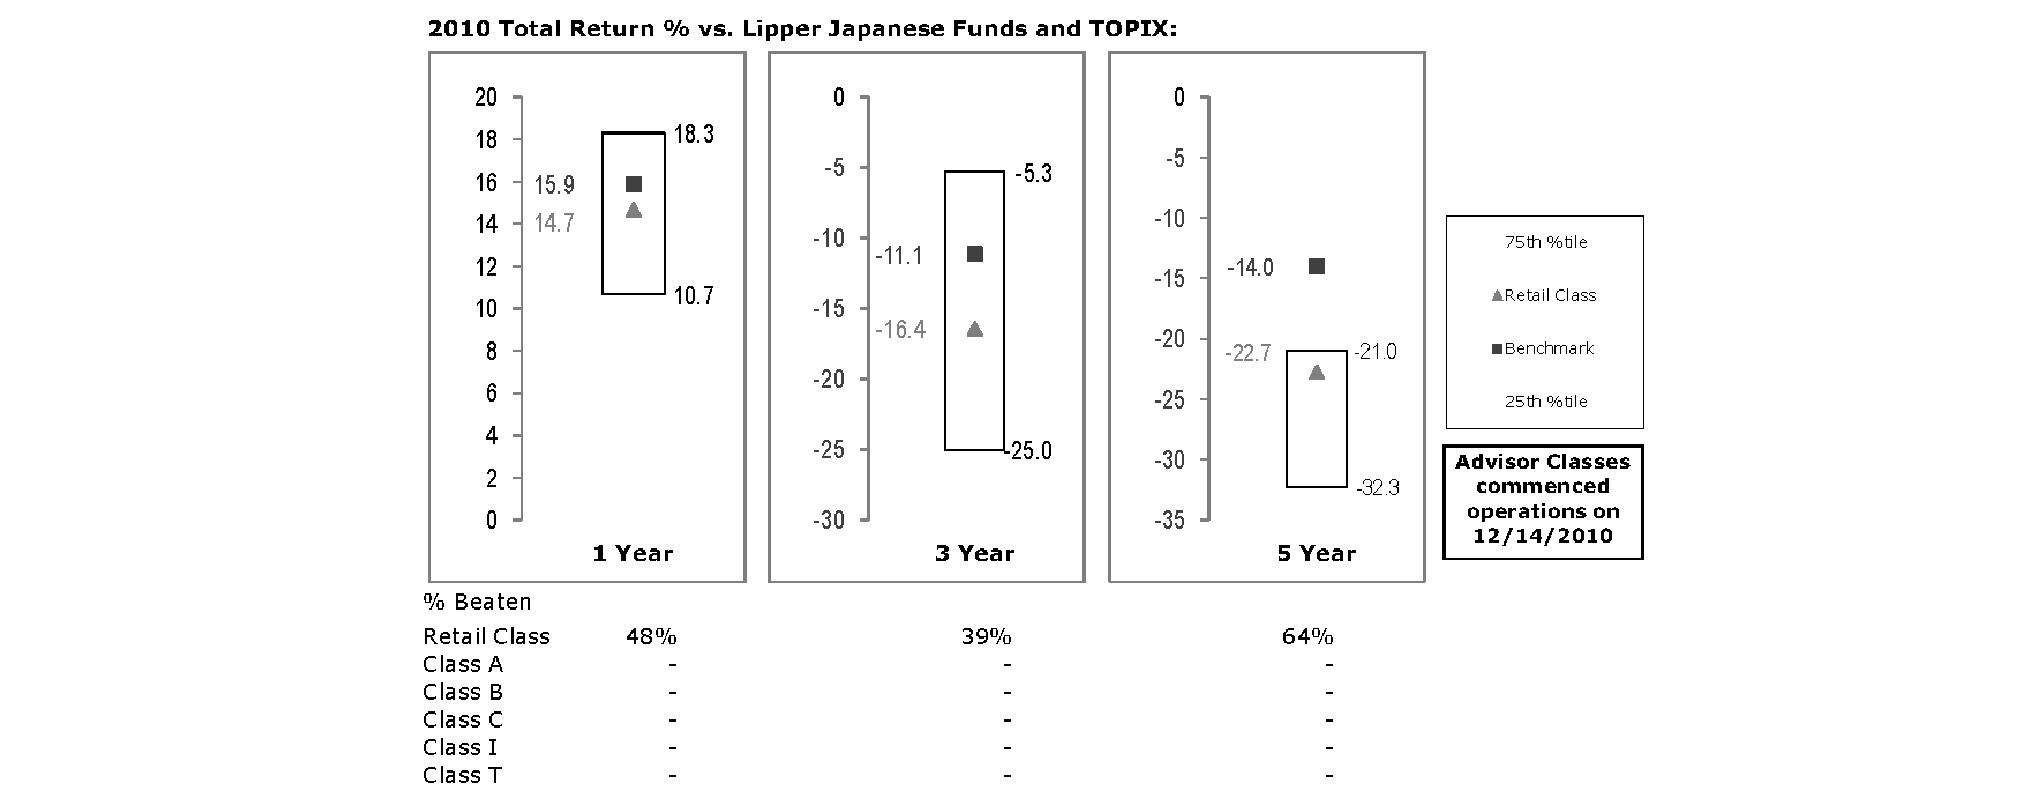
The Board reviewed the fund's relative investment performance against its peer group and noted that the performance of the retail class of the fund was in the third quartile for the one- and three-year periods and the second quartile for the five-year period. The Board also noted that the investment performance of the fund was lower than its benchmark for all the periods shown. The Board discussed with FMR actions that have been taken by FMR to improve the fund's disappointing performance relative to its peer group and benchmark. The Board also reviewed the fund's performance since inception as well as performance in the current year. The Board will continue to closely monitor the performance of the fund in the coming year and discuss with FMR other appropriate actions to address the performance of the fund.
The Board also considered that the fund's management fee is subject to upward or downward adjustment depending upon whether, and to what extent, the fund's investment performance for the performance period exceeds, or is exceeded by, the record (over the same period) of a Board-approved performance adjustment index. The Board noted that the performance adjustment provides FMR with a strong economic incentive to seek to achieve superior performance for the fund's shareholders and helps to more closely align the interests of FMR and the fund's shareholders.
Annual Report
Board Approval of Investment Advisory Contracts and Management Fees - continued
Based on its review, the Board concluded that the nature, extent, and quality of services provided to the fund under the Advisory Contracts should benefit the fund's shareholders.
Competitiveness of Management Fee and Total Expense Ratio. The Board considered the fund's management fee and total expense ratio compared to "mapped groups" of competitive funds and classes. Fidelity creates "mapped groups" by combining similar Lipper investment objective categories that have comparable management fee characteristics. Combining Lipper investment objective categories aids the Board's management fee and total expense ratio comparisons by broadening the competitive group used for comparison and by reducing the number of universes to which various Fidelity funds are compared.
Management Fee. The Board considered two proprietary management fee comparisons for the 12-month periods shown in the chart below. The group of Lipper funds used by the Board for management fee comparisons is referred to below as the "Total Mapped Group." The Total Mapped Group is broader than the Lipper peer group used by the Board for performance comparisons because the Total Mapped Group combines several Lipper investment objective categories while the Lipper peer group does not. The Total Mapped Group comparison focuses on a fund's standing relative to the total universe of comparable funds available to investors in terms of gross management fees before expense reimbursements or caps, and without giving effect to the fund's performance adjustment. "TMG %" represents the percentage of funds in the Total Mapped Group that had management fees that were lower than the fund's. For example, a TMG % of 16% means that 84% of the funds in the Total Mapped Group had higher management fees than the fund. The "Asset-Size Peer Group" (ASPG) comparison focuses on a fund's standing relative to non-Fidelity funds similar in size to the fund within the Total Mapped Group. The ASPG represents at least 15% of the funds in the Total Mapped Group with comparable asset size and management fee characteristics, subject to a minimum of 50 funds (or all funds in the Total Mapped Group if fewer than 50). Additional information, such as the ASPG quartile in which the fund's management fee ranked and the impact of the fund's performance adjustment, is also included in the chart and considered by the Board.
Fidelity Japan Fund
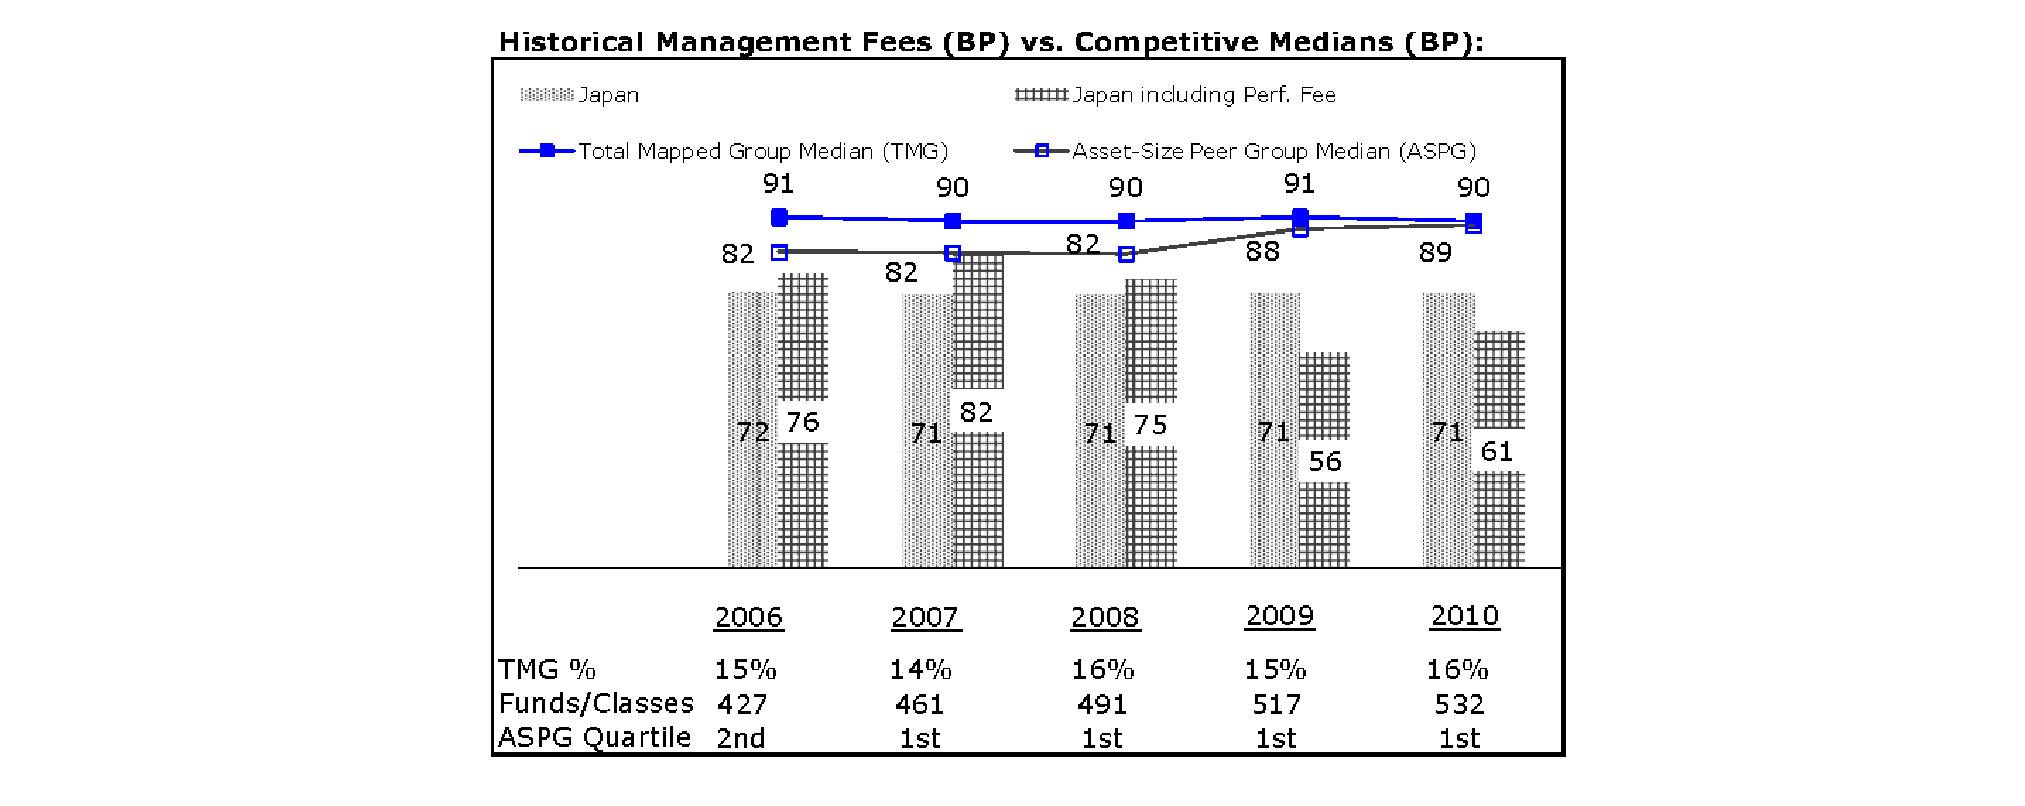
The Board noted that the fund's management fee ranked below the median of its Total Mapped Group and below the median of its ASPG for 2010. The Board also noted the effect of the fund's negative performance adjustment on the fund's management fee ranking. The Board noted that the performance adjustment for each year represents calculations for performance periods that differ from the periods shown in the performance charts above.
Based on its review, the Board concluded that the fund's management fee is fair and reasonable in light of the services that the fund receives and the other factors considered.
Total Expense Ratio. In its review of each class's total expense ratio, the Board considered the fund's management fee as well as other fund or class expenses, as applicable, such as transfer agent fees, pricing and bookkeeping fees, fund-paid 12b-1 fees, and custodial, legal, and audit fees. The Board also noted the effects of any waivers and reimbursements on fees and expenses, as well as the impact of the fund's performance adjustment. As part of its review, the Board also considered the current and historical total expense ratios of each class of the fund compared to competitive fund median expenses. Each class of the fund is compared to those funds and classes in the Total Mapped Group (used by the Board for management fee comparisons) that have a similar sales load structure.
Annual Report
The Board noted that the total expense ratio of each class ranked below its competitive median for the period. The Board considered that various factors, including 12b-1 fees, positive or negative performance adjustments, and relatively higher other expenses in the case of small fund size, can affect total expense ratios.
Fees Charged to Other Fidelity Clients. The Board also considered Fidelity fee structures and other information with respect to clients of FMR and its affiliates, such as other mutual funds advised or subadvised by FMR or its affiliates, pension plan clients, and other institutional clients. In March 2010, the Board created an ad hoc joint committee with the board of other Fidelity funds (the Committee) to review and compare Fidelity's institutional investment advisory business with its business of providing services to the Fidelity funds, including the differences in services provided, fees charged, and costs incurred, as well as competition in their respective marketplaces.
Based on its review of total expense ratios and fees charged to other Fidelity clients, the Board concluded that the total expense ratio of each class of the fund was reasonable in light of the services that the fund and its shareholders receive and the other factors considered, including the findings of the Committee.
Costs of the Services and Profitability. The Board considered the revenues earned and the expenses incurred by Fidelity in conducting the business of developing, marketing, distributing, managing, administering and servicing the fund and its shareholders. The Board also considered the level of Fidelity's profits in respect of all the Fidelity funds.
On an annual basis, FMR presents to the Board Fidelity's profitability for the fund. Fidelity calculates the profitability for each fund, as well as aggregate profitability for groups of Fidelity funds and all Fidelity funds, using a series of detailed revenue and cost allocation methodologies which originate with the books and records of Fidelity on which Fidelity's audited financial statements are based. The Audit Committee of the Board reviews any significant changes from the prior year's methodologies.
PricewaterhouseCoopers LLP (PwC), independent registered public accounting firm and auditor to Fidelity and certain Fidelity funds, has been engaged annually by the Board as part of the Board's assessment of Fidelity's profitability analysis. PwC's engagement includes the review and assessment of Fidelity's methodologies used in determining the revenues and expenses attributable to Fidelity's mutual fund business, and completion of agreed-upon procedures surrounding the mathematical accuracy of fund profitability and its conformity to allocation methodologies. After considering PwC's reports issued under the engagement and information provided by Fidelity, the Board concluded that while other allocation methods may also be reasonable, Fidelity's profitability methodologies are reasonable in all material respects.
The Board also reviewed Fidelity's non-fund businesses and fall-out benefits related to the mutual fund business as well as cases where Fidelity's affiliates may benefit from or be related to the fund's business.
The Board considered the costs of the services provided by and the profits realized by Fidelity in connection with the operation of the fund and was satisfied that the profitability was not excessive in the circumstances.
Economies of Scale. The Board considered whether there have been economies of scale in respect of the management of the Fidelity funds, whether the Fidelity funds (including the fund) have appropriately benefited from any such economies of scale, and whether there is potential for realization of any further economies of scale. The Board considered the extent to which the fund will benefit from economies of scale through increased services to the fund, through waivers or reimbursements, or through fee or expense reductions. The Board also noted that in 2009, it and the board of other Fidelity funds created an ad hoc committee (the Economies of Scale Committee) to analyze whether FMR attains economies of scale in respect of the management and servicing of the Fidelity funds, whether the Fidelity funds have appropriately benefited from such economies of scale, and whether there is potential for realization of any further economies of scale.
The Board recognized that the fund's management contract incorporates a "group fee" structure, which provides for lower group fee rates as total fund assets under FMR's management increase, and for higher group fee rates as total fund assets under FMR's management decrease. FMR calculates the group fee rates based on a tiered asset "breakpoint" schedule that varies based on asset class. The Board considered that the group fee is designed to deliver the benefits of economies of scale to fund shareholders when total Fidelity fund assets increase, even if assets of any particular fund are unchanged or have declined, because some portion of Fidelity's costs are attributable to services provided to all Fidelity funds, and all funds benefit if those costs can be allocated among more assets. The Board concluded that, given the group fee structure, fund shareholders will benefit from lower management fees as assets under FMR's management increase at the fund complex level, regardless of whether Fidelity achieves any such economies of scale.
The Board concluded, taking into account the analysis of the Economies of Scale Committee, that any potential economies of scale are being appropriately shared between fund shareholders and Fidelity.
Additional Information Requested by the Board. In order to develop fully the factual basis for consideration of the Fidelity funds' Advisory Contracts, the Board requested and received additional information on certain topics, including (i) fund performance trends, actions to be taken by FMR to improve certain funds' overall performance, and Fidelity's long-term strategies for certain funds; (ii) portfolio manager changes that have occurred during the past year and length of portfolio manager tenure for different categories of funds over time; (iii) Fidelity's compensation structure for portfolio managers and other key personnel and strategies for attracting and retaining non-investment personnel; (iv) the amount of the investment that each portfolio manager has made in the Fidelity fund(s) that he or she manages; (v) historical trends in Fidelity's realization of fall-out benefits; (vi) Fidelity's group fee structures and the rationale for the individual fee rates of certain funds; (vii) fund profitability methodology and the impact of certain factors on fund profitability results; (viii) trends regarding industry use of performance fee structures and Fidelity's compliance practices with respect to performance adjustment calculations; (ix) the fee structures in place for certain other Fidelity clients; and (x) explanations regarding the relative total expense ratios of certain funds and classes, total expense competitive trends, and actions that might be taken by FMR to reduce total expense ratios for certain funds and classes.
Annual Report
Board Approval of Investment Advisory Contracts and Management Fees - continued
Based on its evaluation of all of the conclusions noted above, and after considering all factors it believed relevant, the Board ultimately concluded that the advisory fee structures are fair and reasonable, and that the fund's Advisory Contracts should be renewed.
Annual Report
Annual Report
Investment Adviser
Fidelity Management & Research Company
Boston, MA
Investment Sub-Advisers
FMR Co., Inc.
Fidelity Management & Research
(U.K.) Inc.
Fidelity Management & Research
(Hong Kong) Limited
Fidelity Management & Research
(Japan) Inc.
FIL Investment Advisors
FIL Investments (Japan) Limited
FIL Investment Advisors (UK) Limited
General Distributor
Fidelity Distributors Corporation
Boston, MA
Transfer and Service Agents
Fidelity Investments Institutional Operations Company, Inc.
Boston, MA
Fidelity Service Company, Inc.
Boston, MA
Custodian
JPMorgan Chase Bank
New York, NY

AJPNA-UANN-1211
1.917388.100
Fidelity Advisor®
Japan
Fund - Institutional Class
Annual Report
October 31, 2011
Institutional Class is a class of
Fidelity® Japan Fund
Contents
Chairman's Message | (Click Here) | The Chairman's message to shareholders. |
Performance | (Click Here) | How the fund has done over time. |
Management's Discussion of Fund Performance | (Click Here) | The Portfolio Manager's review of fund performance and strategy. |
Shareholder Expense Example | (Click Here) | An example of shareholder expenses. |
Investment Changes | (Click Here) | A summary of major shifts in the fund's investments over the past six months. |
Investments | (Click Here) | A complete list of the fund's investments with their market values. |
Financial Statements | (Click Here) | Statements of assets and liabilities, operations, and changes in net assets, as well as financial highlights. |
Notes | (Click Here) | Notes to the financial statements. |
Report of Independent Registered Public Accounting Firm | (Click Here) | |
Trustees and Officers | (Click Here) | |
Distributions | (Click Here) | |
Board Approval of Investment Advisory Contracts and Management Fees | (Click Here) | |
To view a fund's proxy voting guidelines and proxy voting record for the 12-month period ended June 30, visit http://www.fidelity.com/proxyvotingresults or visit the Securities and Exchange Commission's (SEC) web site at http://www.sec.gov. You may also call 1-877-208-0098 to request a free copy of the proxy voting guidelines.
Standard & Poor's, S&P and S&P 500 are registered service marks of The McGraw-Hill Companies, Inc. and have been licensed for use by Fidelity Distributors Corporation.
Other third party marks appearing herein are the property of their respective owners.
All other marks appearing herein are registered or unregistered trademarks or service marks of FMR LLC or an affiliated company.
This report and the financial statements contained herein are submitted for the general information of the shareholders of the fund. This report is not authorized for distribution to prospective investors in the fund unless preceded or accompanied by an effective prospectus.
A fund files its complete schedule of portfolio holdings with the SEC for the first and third quarters of each fiscal year on Form N-Q. Forms N-Q are available on the SEC's web site at http://www.sec.gov. A fund's Forms N-Q may be reviewed and copied at the SEC's Public Reference Room in Washington, DC. Information regarding the operation of the SEC's Public Reference Room may be obtained by calling 1-800-SEC-0330. For a complete list of a fund's portfolio holdings, view the most recent holdings listing, semiannual report, or annual report on Fidelity's web site at http://www.fidelity.com, http://www.advisor.fidelity.com, or http://www.401k.com, as applicable.
NOT FDIC INSURED • MAY LOSE VALUE • NO BANK GUARANTEE
Neither the fund nor Fidelity Distributors Corporation is a bank.
Annual Report
(The Acting Chairman's photo appears here.)
Dear Shareholder:
Global equity markets began the fourth quarter on a strong note, sharply reversing course in October amid strong corporate earnings, better-than-expected economic news and the promise of a resolution to the sovereign debt crisis in Europe. The mini rally followed a third quarter marked by a significant downturn in July and August, which heightened investor anxiety and set off a wave of volatility that hampered most major asset classes through the end of September. Financial markets are difficult to predict, of course, but you can help put the odds in your favor by following these time-tested investment principles.
One of the basic tenets is to invest according to your time horizon. For long-term investors, riding out the markets' inevitable ups and downs has proven much more effective than making decisions based on short-term developments. If your goal is approaching, you can also benefit from patience and restraint, rather than attempting to time the market. No matter your time horizon, missing only a few of the markets' best days can significantly diminish returns. Patience also affords the benefits of compounding - earning interest on additional income or reinvested dividends and capital gains. While staying the course doesn't eliminate risk, it can considerably lessen the negative impact of short-term downturns.
Asset allocation is another principle to manage risk. As you spread your portfolio among the asset classes, be sure to consider your time horizon, risk tolerance and investment objectives. Younger investors may be better served by emphasizing equities, which historically have been the best-performing asset class over time. Investors who are nearing a specific goal, such as retirement or sending a child to college, may choose to favor bonds and other investments that have tended to be more stable. Studies indicate that asset allocation is the single most important determinant of a portfolio's long-term success. After deciding on a suitable allocation strategy, make sure your portfolio is adequately diversified, with exposure to stocks of small-, mid- and large-cap companies in a range of sectors, for example. And today, more than ever, geographic diversification should be taken into account.
Lastly, investing a certain amount of money on a regular basis - a principle known as dollar-cost averaging - can help lower the average cost of your purchases, while also giving you the discipline to avoid selling weak performers just prior to an upswing, or chasing a hot performer just before a correction.
We invite you to learn more by visiting us on the Internet, dropping by one of our Investor Centers or calling us by phone. It is our privilege to provide the resources you need to choose investments that are right for you.
Sincerely,
(The Acting Chairman's signature appears here.)
James C. Curvey
Acting Chairman
Annual Report
Average annual total return reflects the change in the value of an investment, assuming reinvestment of the class' distributions from dividend income and capital gains (the profits earned upon the sale of securities that have grown in value, if any) and assuming a constant rate of performance each year. The $10,000 table and the fund's returns do not reflect the deduction of taxes that a shareholder would pay on fund distributions or the redemption of fund shares. During periods of reimbursement by Fidelity, a fund's total return will be greater than it would be had the reimbursement not occurred. How a fund did yesterday is no guarantee of how it will do tomorrow.
Average Annual Total Returns
Periods ended October 31, 2011 | Past 1
year | Past 5
years | Past 10
years |
Institutional Class A | -6.00% | -6.47% | 2.26% |
A The initial offering of Institutional Class shares took place on December 14, 2010. Returns prior to December 14, 2010 are those of Fidelity® Japan Fund, the original class of the fund.
$10,000 Over 10 Years
Let's say hypothetically that $10,000 was invested in Fidelity Advisor® Japan Fund - Institutional Class on October 31, 2001. The chart shows how the value of your investment would have changed, and also shows how the Tokyo Stock Price Index (TOPIX) performed over the same period. The initial offering of Institutional Class took place on December 14, 2010. See above for additional information regarding the performance of Institutional Class.
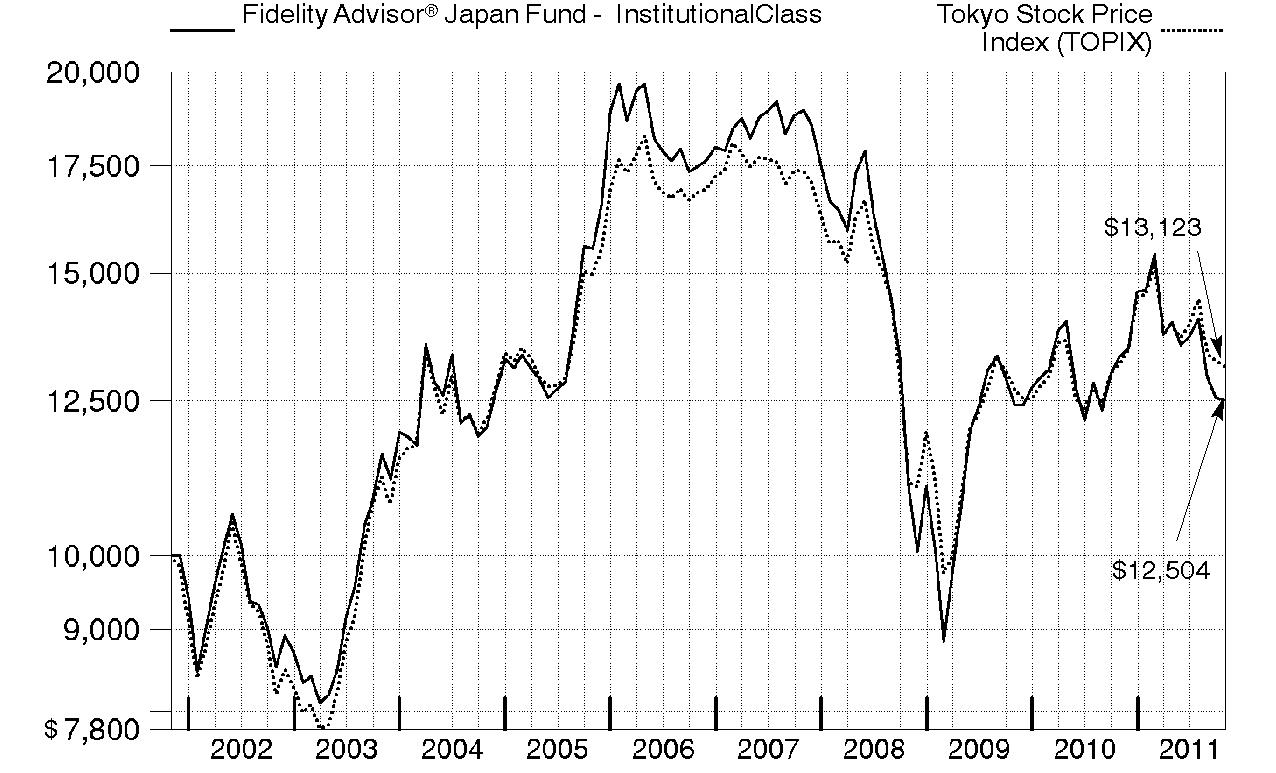
Annual Report
Market Recap: Beset by natural disaster and a fragile global economic climate, Japanese stocks were extremely volatile during the 12 months ending October 31, 2011. However, when the dust settled, share prices were essentially unchanged. For the year, the Tokyo Stock Price Index (TOPIX) returned -0.35%. Japanese equities mounted a strong advance during the first four months of the period, only to give back those gains and more within a few days following the mid-March tsunami and earthquake. Initially, the recovery from this plunge was relatively robust, as investors realized that supply and demand disruptions associated with the disaster would be resolved more quickly than originally feared. However, as the period progressed, Japanese stocks faced other challenges, such as the sovereign debt crisis in Europe and flood damage in Thailand. An appreciating yen - despite government intervention to contain it - aided Japanese equities quoted in U.S. dollars, while making it harder for Japanese exporters to remain competitive. The three smallest sectors within the index - energy, telecommunication services and consumer staples - were its strongest performers, each posting gains of more than 15%. By contrast, utilities sustained by far the biggest loss, weighed down by the company that owned the nuclear reactor damaged by the tsunami.
Comments from Rie Shigekawa, who became Portfolio Manager of Fidelity Advisor® Japan Fund on May 1, 2011: During the year, the fund's Institutional Class shares returned -6.00%, significantly trailing the TOPIX. Positioning in consumer discretionary, information technology, industrials and telecommunication services detracted from performance versus the index. Video-game maker Nintendo was the largest individual detractor, as unimpressive software offerings for its latest game console resulted in disappointing earnings and a declining stock price. Automakers Honda and Toyota were hampered by extensive flooding in Thailand and further strength in the yen. Conversely, a large underweighting in utilities was beneficial, as this was the sector most hurt by the earthquake/tsunami. Positioning in consumer staples lifted performance as well. At the stock level, an overweighted stake in Japan Tobacco was the fund's largest contributor. Given the greater freedom it would provide for the firm's management, the market liked a proposal by the nation's ruling political party to sell the government's roughly 50% stake in the company. Software provider Otsuka and negligible exposure to Tokyo Electric Power, which owned the nuclear facility most devastated by the mid-March disaster, further added value. The fund did not own this security at period end.
The views expressed above reflect those of the portfolio manager(s) only through the end of the period as stated on the cover of this report and do not necessarily represent the views of Fidelity or any other person in the Fidelity organization. Any such views are subject to change at any time based upon market or other conditions and Fidelity disclaims any responsibility to update such views. These views may not be relied on as investment advice and, because investment decisions for a Fidelity fund are based on numerous factors, may not be relied on as an indication of trading intent on behalf of any Fidelity fund.
Annual Report
Fidelity Japan Fund
As a shareholder of the Fund, you incur two types of costs: (1) transaction costs, including sales charges (loads) on purchase payments or redemption proceeds, redemption fees, and (2) ongoing costs, including management fees, distribution and/or service (12b-1) fees and other Fund expenses. This Example is intended to help you understand your ongoing costs (in dollars) of investing in the Fund and to compare these costs with the ongoing costs of investing in other mutual funds.
The Example is based on an investment of $1,000 invested at the beginning of the period and held for the entire period (May 1, 2011 to October 31, 2011).
Actual Expenses
The first line of the accompanying table for each class of the Fund provides information about actual account values and actual expenses. You may use the information in this line, together with the amount you invested, to estimate the expenses that you paid over the period. Simply divide your account value by $1,000.00 (for example, an $8,600 account value divided by $1,000.00 = 8.6), then multiply the result by the number in the first line for a class of the Fund under the heading entitled "Expenses Paid During Period" to estimate the expenses you paid on your account during this period. A small balance maintenance fee of $12.00 that is charged once a year may apply for certain accounts with a value of less than $2,000. This fee is not included in the table below. If it was, the estimate of expenses you paid during the period would be higher, and your ending account value lower, by this amount. In addition, the Fund, as a shareholder in the underlying Fidelity Central Funds, will indirectly bear its pro-rata share of the fees and expenses incurred by the underlying Fidelity Central Funds. These fees and expenses are not included in the Fund's annualized expense ratio used to calculate the expense estimate in the table below.
Hypothetical Example for Comparison Purposes
The second line of the accompanying table for each class of the Fund provides information about hypothetical account values and hypothetical expenses based on a Class' actual expense ratio and an assumed rate of return of 5% per year before expenses, which is not the Class' actual return. The hypothetical account values and expenses may not be used to estimate the actual ending account balance or expenses you paid for the period. You may use this information to compare the ongoing costs of investing in the Fund and other funds. To do so, compare this 5% hypothetical example with the 5% hypothetical examples that appear in the shareholder reports of the other funds. A small balance maintenance fee of $12.00 that is charged once a year may apply for certain accounts with a value of less than $2,000. This fee is not included in the table below. If it was, the estimate of expenses you paid during the period would be higher, and your ending account value lower, by this amount. In addition, the Fund, as a shareholder in the underlying Fidelity Central Funds, will indirectly bear its pro-rata share of the fees and expenses incurred by the underlying Fidelity Central Funds. These fees and expenses are not included in the Fund's annualized expense ratio used to calculate the expense estimate in the table below.
Please note that the expenses shown in the table are meant to highlight your ongoing costs only and do not reflect any transaction costs. Therefore, the second line of the table is useful in comparing ongoing costs only, and will not help you determine the relative total costs of owning different funds. In addition, if these transactional costs were included, your costs would have been higher.
| Annualized
Expense Ratio | Beginning
Account Value
May 1, 2011 | Ending
Account Value
October 31, 2011 | Expenses Paid
During Period*
May 1, 2011 to
October 31, 2011 |
Class A | 1.19% | | | |
Actual | | $ 1,000.00 | $ 893.30 | $ 5.68 |
HypotheticalA | | $ 1,000.00 | $ 1,019.21 | $ 6.06 |
Class T | 1.47% | | | |
Actual | | $ 1,000.00 | $ 891.30 | $ 7.01 |
HypotheticalA | | $ 1,000.00 | $ 1,017.80 | $ 7.48 |
Class B | 1.92% | | | |
Actual | | $ 1,000.00 | $ 889.20 | $ 9.14 |
HypotheticalA | | $ 1,000.00 | $ 1,015.53 | $ 9.75 |
Class C | 1.90% | | | |
Actual | | $ 1,000.00 | $ 890.10 | $ 9.05 |
HypotheticalA | | $ 1,000.00 | $ 1,015.63 | $ 9.65 |
Japan | .84% | | | |
Actual | | $ 1,000.00 | $ 894.40 | $ 4.01 |
HypotheticalA | | $ 1,000.00 | $ 1,020.97 | $ 4.28 |
Institutional Class | .78% | | | |
Actual | | $ 1,000.00 | $ 894.40 | $ 3.72 |
HypotheticalA | | $ 1,000.00 | $ 1,021.27 | $ 3.97 |
A 5% return per year before expenses
* Expenses are equal to each Class' annualized expense ratio, multiplied by the average account value over the period, multiplied by 184/365 (to reflect the one-half year period).
Annual Report
Fidelity Japan Fund
Investment Changes (Unaudited)
Geographic Diversification (% of fund's net assets) |
As of October 31, 2011 |
 | Japan | 96.3% | |
 | United States of America | 3.7% | |

Percentages are adjusted for the effect of futures contracts, if applicable. |
As of April 30, 2011 |
| Japan | 94.9% | |
| United States of America | 5.1% | |

Percentages are adjusted for the effect of futures contracts, if applicable. |
Asset Allocation |
| % of fund's
net assets | % of fund's net assets
6 months ago |
Stocks | 96.3 | 94.9 |
Short-Term Investments and Net Other Assets | 3.7 | 5.1 |
Top Ten Stocks as of October 31, 2011 |
| % of fund's
net assets | % of fund's net assets
6 months ago |
Toyota Motor Corp. (Automobiles) | 5.6 | 3.5 |
Honda Motor Co. Ltd. (Automobiles) | 3.9 | 1.6 |
Otsuka Corp. (IT Services) | 3.4 | 0.0 |
Toshiba Corp. (Computers & Peripherals) | 3.4 | 0.4 |
Mitsubishi UFJ Financial Group, Inc. (Commercial Banks) | 3.3 | 2.9 |
Japan Tobacco, Inc. (Tobacco) | 3.3 | 0.0 |
Astellas Pharma, Inc. (Pharmaceuticals) | 3.1 | 0.0 |
Canon, Inc. (Office Electronics) | 3.0 | 4.1 |
Nomura Real Estate Holdings, Inc. (Real Estate Management & Development) | 3.0 | 0.0 |
Fujitsu Ltd. (Computers & Peripherals) | 2.8 | 0.4 |
| 34.8 | |
Market Sectors as of October 31, 2011 |
| % of fund's
net assets | % of fund's net assets
6 months ago |
Information Technology | 21.5 | 15.2 |
Consumer Discretionary | 21.5 | 19.3 |
Financials | 16.4 | 26.7 |
Consumer Staples | 10.5 | 5.0 |
Materials | 7.8 | 7.5 |
Industrials | 7.4 | 18.9 |
Health Care | 7.2 | 0.4 |
Telecommunication Services | 2.1 | 1.9 |
Energy | 1.1 | 0.0 |
Utilities | 0.8 | 0.0 |
Annual Report
Fidelity Japan Fund
Investments October 31, 2011
Showing Percentage of Net Assets
Common Stocks - 96.3% |
| Shares | | Value |
CONSUMER DISCRETIONARY - 21.5% |
Auto Components - 2.7% |
Denso Corp. | 243,000 | | $ 7,474,001 |
Yokohama Rubber Co. Ltd. | 1,005,000 | | 5,737,462 |
| | 13,211,463 |
Automobiles - 11.0% |
Honda Motor Co. Ltd. | 632,500 | | 18,916,540 |
Suzuki Motor Corp. | 335,300 | | 7,112,335 |
Toyota Motor Corp. | 816,300 | | 27,105,263 |
| | 53,134,138 |
Household Durables - 2.5% |
Funai Electric Co. Ltd. | 136,800 | | 2,689,100 |
Panasonic Corp. | 943,400 | | 9,538,137 |
| | 12,227,237 |
Leisure Equipment & Products - 0.9% |
SHIMANO, Inc. | 82,700 | | 4,088,402 |
Media - 1.2% |
Avex Group Holdings, Inc. | 476,800 | | 5,641,483 |
Multiline Retail - 2.1% |
Marui Group Co. Ltd. | 1,281,200 | | 9,961,645 |
Specialty Retail - 0.8% |
EDION Corp. | 455,300 | | 3,643,415 |
Textiles, Apparel & Luxury Goods - 0.3% |
Asics Corp. | 109,200 | | 1,447,867 |
TOTAL CONSUMER DISCRETIONARY | | 103,355,650 |
CONSUMER STAPLES - 10.5% |
Food & Staples Retailing - 2.1% |
Lawson, Inc. | 93,800 | | 5,278,772 |
Seven & i Holdings Co., Ltd. | 186,800 | | 4,985,534 |
| | 10,264,306 |
Food Products - 2.2% |
Nisshin Oillio Group Ltd. | 1,206,000 | | 5,392,785 |
Toyo Suisan Kaisha Ltd. | 206,000 | | 5,257,704 |
| | 10,650,489 |
Personal Products - 2.9% |
Kao Corp. | 189,600 | | 4,974,672 |
Shiseido Co. Ltd. | 480,800 | | 8,801,385 |
| | 13,776,057 |
Tobacco - 3.3% |
Japan Tobacco, Inc. | 3,146 | | 15,726,230 |
TOTAL CONSUMER STAPLES | | 50,417,082 |
ENERGY - 1.1% |
Oil, Gas & Consumable Fuels - 1.1% |
INPEX Corp. | 808 | | 5,335,164 |
|
| Shares | | Value |
FINANCIALS - 16.4% |
Commercial Banks - 7.5% |
Mitsubishi UFJ Financial Group, Inc. | 3,695,800 | | $ 16,063,770 |
Sumitomo Mitsui Financial Group, Inc. | 375,900 | | 10,508,323 |
Sumitomo Mitsui Trust Holdings, Inc. | 2,764,130 | | 9,460,406 |
| | 36,032,499 |
Insurance - 1.4% |
Tokio Marine Holdings, Inc. | 284,300 | | 6,779,854 |
Real Estate Investment Trusts - 3.0% |
Frontier Real Estate Investment Corp. | 844 | | 7,319,723 |
Japan Logistics Fund, Inc. | 856 | | 7,377,960 |
| | 14,697,683 |
Real Estate Management & Development - 4.5% |
Mitsui Fudosan Co. Ltd. | 438,000 | | 7,284,997 |
Nomura Real Estate Holdings, Inc. | 881,600 | | 14,213,755 |
| | 21,498,752 |
TOTAL FINANCIALS | | 79,008,788 |
HEALTH CARE - 7.2% |
Health Care Equipment & Supplies - 1.5% |
Terumo Corp. | 144,500 | | 7,342,989 |
Health Care Providers & Services - 1.6% |
Message Co. Ltd. | 2,320 | | 7,503,564 |
Pharmaceuticals - 4.1% |
Astellas Pharma, Inc. | 413,300 | | 15,117,730 |
Rohto Pharmaceutical Co. Ltd. | 418,000 | | 4,815,951 |
| | 19,933,681 |
TOTAL HEALTH CARE | | 34,780,234 |
INDUSTRIALS - 7.4% |
Building Products - 1.3% |
Daikin Industries Ltd. | 211,300 | | 6,253,951 |
Machinery - 1.2% |
Makita Corp. | 155,300 | | 5,798,643 |
Road & Rail - 1.2% |
Sankyu, Inc. | 1,370,000 | | 5,425,169 |
Trading Companies & Distributors - 3.7% |
Mitsui & Co. Ltd. | 609,100 | | 8,890,662 |
Sumitomo Corp. | 729,300 | | 9,030,728 |
| | 17,921,390 |
TOTAL INDUSTRIALS | | 35,399,153 |
INFORMATION TECHNOLOGY - 21.5% |
Computers & Peripherals - 6.2% |
Fujitsu Ltd. | 2,503,000 | | 13,386,871 |
Toshiba Corp. | 3,756,000 | | 16,383,497 |
| | 29,770,368 |
Common Stocks - continued |
| Shares | | Value |
INFORMATION TECHNOLOGY - continued |
Electronic Equipment & Components - 6.3% |
Daishinku Corp. | 523,000 | | $ 1,781,434 |
Fujifilm Holdings Corp. | 284,300 | | 6,958,905 |
Horiba Ltd. | 183,300 | | 5,815,349 |
Mitsumi Electric Co. Ltd. | 415,300 | | 3,296,100 |
Shimadzu Corp. | 1,468,000 | | 12,499,033 |
| | 30,350,821 |
Internet Software & Services - 1.3% |
Yahoo! Japan Corp. | 19,727 | | 6,336,334 |
IT Services - 3.4% |
Otsuka Corp. | 236,300 | | 16,416,472 |
Office Electronics - 3.0% |
Canon, Inc. | 315,200 | | 14,311,218 |
Semiconductors & Semiconductor Equipment - 0.6% |
ROHM Co. Ltd. | 59,600 | | 3,037,095 |
Software - 0.7% |
Nintendo Co. Ltd. | 21,200 | | 3,198,866 |
TOTAL INFORMATION TECHNOLOGY | | 103,421,174 |
MATERIALS - 7.8% |
Chemicals - 6.6% |
Asahi Kasei Corp. | 944,000 | | 5,598,953 |
JSP Corp. | 61,600 | | 904,290 |
Nippon Shokubai Co. Ltd. | 331,000 | | 3,376,378 |
Shin-Etsu Chemical Co., Ltd. | 189,200 | | 9,717,569 |
Toray Industries, Inc. | 1,688,000 | | 12,015,710 |
| | 31,612,900 |
Metals & Mining - 1.2% |
Hitachi Metals Ltd. | 520,000 | | 5,898,166 |
TOTAL MATERIALS | | 37,511,066 |
|
| Shares | | Value |
TELECOMMUNICATION SERVICES - 2.1% |
Wireless Telecommunication Services - 2.1% |
NTT DoCoMo, Inc. | 5,660 | | $ 10,053,689 |
UTILITIES - 0.8% |
Gas Utilities - 0.8% |
Osaka Gas Co. Ltd. | 997,000 | | 3,773,148 |
TOTAL COMMON STOCKS (Cost $539,552,123) | 463,055,148 |
Money Market Funds - 2.7% |
| | | |
Fidelity Cash Central Fund, 0.12% (a)
(Cost $13,103,924) | 13,103,924 | | 13,103,924 |
TOTAL INVESTMENT PORTFOLIO - 99.0% (Cost $552,656,047) | | 476,159,072 |
NET OTHER ASSETS (LIABILITIES) - 1.0% | | 5,031,379 |
NET ASSETS - 100% | $ 481,190,451 |
Legend |
(a) Affiliated fund that is available only to investment companies and other accounts managed by Fidelity Investments. The rate quoted is the annualized seven-day yield of the fund at period end. A complete unaudited listing of the fund's holdings as of its most recent quarter end is available upon request. In addition, each Fidelity Central Fund's financial statements, which are not covered by the Fund's Report of Independent Registered Public Accounting Firm, are available on the SEC's website or upon request. |
Affiliated Central Funds |
Information regarding fiscal year to date income earned by the Fund from investments in Fidelity Central Funds is as follows: |
Fund | Income earned |
Fidelity Cash Central Fund | $ 22,778 |
Fidelity Securities Lending Cash Central Fund | 6,193 |
Total | $ 28,971 |
Other Information |
The following is a summary of the inputs used, as of October 31, 2011, involving the Fund's assets and liabilities carried at fair value. The inputs or methodology used for valuing securities may not be an indication of the risk associated with investing in those securities. For more information on valuation inputs, and their aggregation into the levels used in the table below, please refer to the Security Valuation section in the accompanying Notes to Financial Statements. |
Valuation Inputs at Reporting Date: |
Description | Total | Level 1 | Level 2 | Level 3 |
Investments in Securities: | | | | |
Equities: | | | | |
Consumer Discretionary | $ 103,355,650 | $ - | $ 103,355,650 | $ - |
Consumer Staples | 50,417,082 | - | 50,417,082 | - |
Energy | 5,335,164 | - | 5,335,164 | - |
Financials | 79,008,788 | - | 79,008,788 | - |
Health Care | 34,780,234 | - | 34,780,234 | - |
Industrials | 35,399,153 | - | 35,399,153 | - |
Information Technology | 103,421,174 | - | 103,421,174 | - |
Materials | 37,511,066 | - | 37,511,066 | - |
Telecommunication Services | 10,053,689 | - | 10,053,689 | - |
Utilities | 3,773,148 | - | 3,773,148 | - |
Money Market Funds | 13,103,924 | 13,103,924 | - | - |
Total Investments in Securities: | $ 476,159,072 | $ 13,103,924 | $ 463,055,148 | $ - |
Income Tax Information |
At October 31, 2011, the Fund had a capital loss carryforward of $540,678,483 of which $6,632,380, $7,706,742, $161,194,648, $239,450,813, $26,887,863 and $98,806,037 will expire in fiscal 2014, 2015, 2016, 2017, 2018 and 2019 respectively. Capital loss carryforwards are only available to offset future capital gains of the Fund to the extent provided by regulations and may be limited. |
Included in the $540,678,483 of the Fund's capital loss carryforwards are $25,965,572 of capital loss carryforwards that were acquired from the Fidelity Advisor Japan Fund when it merged into the Fund on December 17, 2010 of which $6,632,380, $7,706,742, $10,009,147 and $1,617,303 will expire in fiscal 2014, 2015, 2016 and 2017 respectively. Under the Internal Revenue Code, the losses acquired from Fidelity Advisor Japan Fund that will be available to offset future capital gains of the Fund will be limited. As a result, at least $17,152,282 of the losses acquired from Fidelity Advisor Japan Fund will expire unused. |
See accompanying notes which are an integral part of the financial statements.
Annual Report
Fidelity Japan Fund
Statement of Assets and Liabilities
| October 31, 2011 |
| | |
Assets | | |
Investment in securities, at value - See accompanying schedule: Unaffiliated issuers (cost $539,552,123) | $ 463,055,148 | |
Fidelity Central Funds (cost $13,103,924) | 13,103,924 | |
Total Investments (cost $552,656,047) | | $ 476,159,072 |
Receivable for investments sold | | 8,279,738 |
Receivable for fund shares sold | | 218,365 |
Dividends receivable | | 4,287,974 |
Distributions receivable from Fidelity Central Funds | | 1,913 |
Prepaid expenses | | 892 |
Other receivables | | 33,572 |
Total assets | | 488,981,526 |
| | |
Liabilities | | |
Payable for investments purchased | $ 6,695,718 | |
Payable for fund shares redeemed | 648,418 | |
Accrued management fee | 251,540 | |
Distribution and service plan fees payable | 13,857 | |
Other affiliated payables | 116,658 | |
Other payables and accrued expenses | 64,884 | |
Total liabilities | | 7,791,075 |
| | |
Net Assets | | $ 481,190,451 |
Net Assets consist of: | | |
Paid in capital | | $ 1,079,805,300 |
Undistributed net investment income | | 7,491,842 |
Accumulated undistributed net realized gain (loss) on investments and foreign currency transactions | | (529,532,235) |
Net unrealized appreciation (depreciation) on investments and assets and liabilities in foreign currencies | | (76,574,456) |
Net Assets | | $ 481,190,451 |
Statement of Assets and Liabilities - continued
| October 31, 2011 |
| | |
Calculation of Maximum Offering Price Class A:
Net Asset Value and redemption price per share ($13,207,583 ÷ 1,385,059 shares) | | $ 9.54 |
| | |
Maximum offering price per share (100/94.25 of $9.54) | | $ 10.12 |
Class T:
Net Asset Value and redemption price per share ($4,642,769 ÷ 488,071 shares) | | $ 9.51 |
| | |
Maximum offering price per share (100/96.50 of $9.51) | | $ 9.85 |
Class B:
Net Asset Value and offering price per share ($1,458,218 ÷ 153,920 shares)A | | $ 9.47 |
| | |
Class C:
Net Asset Value and offering price per share ($8,749,997 ÷ 923,473 shares)A | | $ 9.48 |
| | |
Japan:
Net Asset Value, offering price and redemption price per share ($450,416,693 ÷ 47,072,045 shares) | | $ 9.57 |
| | |
Institutional Class:
Net Asset Value, offering price and redemption price per share ($2,715,191 ÷ 283,719 shares) | | $ 9.57 |
A Redemption price per share is equal to net asset value less any applicable contingent deferred sales charge.
See accompanying notes which are an integral part of the financial statements.
Annual Report
Statement of Operations
| Year ended October 31, 2011 |
| | |
Investment Income | | |
Dividends | | $ 13,038,354 |
Income from Fidelity Central Funds | | 28,971 |
Income before foreign taxes withheld | | 13,067,325 |
Less foreign taxes withheld | | (912,685) |
Total income | | 12,154,640 |
| | |
Expenses | | |
Management fee
Basic fee | $ 3,938,115 | |
Performance adjustment | (942,799) | |
Transfer agent fees | 1,199,596 | |
Distribution and service plan fees | 160,008 | |
Accounting and security lending fees | 282,827 | |
Custodian fees and expenses | 76,457 | |
Independent trustees' compensation | 3,303 | |
Registration fees | 111,372 | |
Audit | 62,837 | |
Legal | 10,741 | |
Miscellaneous | 35,194 | |
Total expenses before reductions | 4,937,651 | |
Expense reductions | (287,966) | 4,649,685 |
Net investment income (loss) | | 7,504,955 |
Realized and Unrealized Gain (Loss) Net realized gain (loss) on: | | |
Investment securities: | | |
Unaffiliated issuers | (69,086,349) | |
Foreign currency transactions | 373,429 | |
Total net realized gain (loss) | | (68,712,920) |
Change in net unrealized appreciation (depreciation) on: Investment securities | 32,202,153 | |
Assets and liabilities in foreign currencies | (372,358) | |
Total change in net unrealized appreciation (depreciation) | | 31,829,795 |
Net gain (loss) | | (36,883,125) |
Net increase (decrease) in net assets resulting from operations | | $ (29,378,170) |
Statement of Changes in Net Assets
| Year ended
October 31,
2011 | Year ended
October 31,
2010 |
Increase (Decrease) in Net Assets | | |
Operations | | |
Net investment income (loss) | $ 7,504,955 | $ 9,882,218 |
Net realized gain (loss) | (68,712,920) | (10,204,232) |
Change in net unrealized appreciation (depreciation) | 31,829,795 | 55,567,525 |
Net increase (decrease) in net assets resulting from operations | (29,378,170) | 55,245,511 |
Distributions to shareholders from net investment income | (9,748,982) | (6,665,780) |
Distributions to shareholders from net realized gain | (10,506,757) | (9,507,465) |
Total distributions | (20,255,739) | (16,173,245) |
Share transactions - net increase (decrease) | (153,265,919) | (305,864,432) |
Redemption fees | 492,971 | 107,736 |
Total increase (decrease) in net assets | (202,406,857) | (266,684,430) |
| | |
Net Assets | | |
Beginning of period | 683,597,308 | 950,281,738 |
End of period (including undistributed net investment income of $7,491,842 and undistributed net investment income of $9,735,869, respectively) | $ 481,190,451 | $ 683,597,308 |
See accompanying notes which are an integral part of the financial statements.
Annual Report
Financial Highlights - Class A
Years ended October 31, | 2011 H |
Selected Per-Share Data | |
Net asset value, beginning of period | $ 10.83 |
Income from Investment Operations | |
Net investment income (loss) E | .09 |
Net realized and unrealized gain (loss) | (1.39) |
Total from investment operations | (1.30) |
Redemption fees added to paid in capital E | .01 |
Net asset value, end of period | $ 9.54 |
Total Return B,C,D | (11.91)% |
Ratios to Average Net Assets F,I | |
Expenses before reductions | 1.20% A |
Expenses net of fee waivers, if any | 1.20% A |
Expenses net of all reductions | 1.16% A |
Net investment income (loss) | 1.02% A |
Supplemental Data | |
Net assets, end of period (000 omitted) | $ 13,208 |
Portfolio turnover rate G | 134% J |
A Annualized B Total returns for periods of less than one year are not annualized. C Total returns would have been lower if certain expenses had not been reduced during the applicable periods shown. D Total returns do not include the effect of the sales charges. ECalculated based on average shares outstanding during the period. F Fees and expenses of any underlying Fidelity Central Funds are not included in the Fund's expense ratio. The Fund indirectly bears its proportionate share of the expenses of any underlying Fidelity Central Funds. G Amount does not include the portfolio activity of any underlying Fidelity Central Funds. H For the period December 14, 2010 (commencement of sale of shares) to October 31, 2011. I Expense ratios reflect operating expenses of the class. Expenses before reductions do not reflect amounts reimbursed by the investment adviser or reductions from brokerage service arrangements or reductions from other expense offset arrangements and do not represent the amount paid by the class during periods when reimbursements or reductions occur. Expense ratios before reductions for start-up periods may not be representative of longer-term operating periods. Expenses net of fee waivers reflect expenses after reimbursement by the investment adviser but prior to reductions from brokerage service arrangements or other expense offset arrangements. Expenses net of all reductions represent the net expenses paid by the class. J The portfolio turnover rate does not include the assets acquired in the merger. |
Financial Highlights - Class T
Years ended October 31, | 2011 H |
Selected Per-Share Data | |
Net asset value, beginning of period | $ 10.83 |
Income from Investment Operations | |
Net investment income (loss) E | .07 |
Net realized and unrealized gain (loss) | (1.40) |
Total from investment operations | (1.33) |
Redemption fees added to paid in capital E | .01 |
Net asset value, end of period | $ 9.51 |
Total Return B,C,D | (12.19)% |
Ratios to Average Net Assets F,I | |
Expenses before reductions | 1.48% A |
Expenses net of fee waivers, if any | 1.48% A |
Expenses net of all reductions | 1.44% A |
Net investment income (loss) | .74% A |
Supplemental Data | |
Net assets, end of period (000 omitted) | $ 4,643 |
Portfolio turnover rate G | 134% J |
A Annualized B Total returns for periods of less than one year are not annualized. C Total returns would have been lower if certain expenses had not been reduced during the applicable periods shown. D Total returns do not include the effect of the sales charges. E Calculated based on average shares outstanding during the period. F Fees and expenses of any underlying Fidelity Central Funds are not included in the Fund's expense ratio. The Fund indirectly bears its proportionate share of the expenses of any underlying Fidelity Central Funds. G Amount does not include the portfolio activity of any underlying Fidelity Central Funds. H For the period December 14, 2010 (commencement of sale of shares) to October 31, 2011. I Expense ratios reflect operating expenses of the class. Expenses before reductions do not reflect amounts reimbursed by the investment adviser or reductions from brokerage service arrangements or reductions from other expense offset arrangements and do not represent the amount paid by the class during periods when reimbursements or reductions occur. Expense ratios before reductions for start-up periods may not be representative of longer-term operating periods. Expenses net of fee waivers reflect expenses after reimbursement by the investment adviser but prior to reductions from brokerage service arrangements or other expense offset arrangements. Expenses net of all reductions represent the net expenses paid by the class. J The portfolio turnover rate does not include the assets acquired in the merger. |
See accompanying notes which are an integral part of the financial statements.
Annual Report
Financial Highlights - Class B
Years ended October 31, | 2011 H |
Selected Per-Share Data | |
Net asset value, beginning of period | $ 10.83 |
Income from Investment Operations | |
Net investment income (loss) E | .02 |
Net realized and unrealized gain (loss) | (1.39) |
Total from investment operations | (1.37) |
Redemption fees added to paid in capital E | .01 |
Net asset value, end of period | $ 9.47 |
Total Return B,C,D | (12.56)% |
Ratios to Average Net Assets F,I | |
Expenses before reductions | 1.95% A |
Expenses net of fee waivers, if any | 1.95% A |
Expenses net of all reductions | 1.91% A |
Net investment income (loss) | .27% A |
Supplemental Data | |
Net assets, end of period (000 omitted) | $ 1,458 |
Portfolio turnover rate G | 134% J |
A Annualized B Total returns for periods of less than one year are not annualized. C Total returns would have been lower if certain expenses had not been reduced during the applicable periods shown. D Total returns do not include the effect of the contingent deferred sales charge. E Calculated based on average shares outstanding during the period. F Fees and expenses of any underlying Fidelity Central Funds are not included in the Fund's expense ratio. The Fund indirectly bears its proportionate share of the expenses of any underlying Fidelity Central Funds. G Amount does not include the portfolio activity of any underlying Fidelity Central Funds. H For the period December 14, 2010 (commencement of sale of shares) to October 31, 2011. I Expense ratios reflect operating expenses of the class. Expenses before reductions do not reflect amounts reimbursed by the investment adviser or reductions from brokerage service arrangements or reductions from other expense offset arrangements and do not represent the amount paid by the class during periods when reimbursements or reductions occur. Expense ratios before reductions for start-up periods may not be representative of longer-term operating periods. Expenses net of fee waivers reflect expenses after reimbursement by the investment adviser but prior to reductions from brokerage service arrangements or other expense offset arrangements. Expenses net of all reductions represent the net expenses paid by the class. J The portfolio turnover rate does not include the assets acquired in the merger. |
Financial Highlights - Class C
Years ended October 31, | 2011 H |
Selected Per-Share Data | |
Net asset value, beginning of period | $ 10.83 |
Income from Investment Operations | |
Net investment income (loss) E | .03 |
Net realized and unrealized gain (loss) | (1.39) |
Total from investment operations | (1.36) |
Redemption fees added to paid in capital E | .01 |
Net asset value, end of period | $ 9.48 |
Total Return B,C,D | (12.47)% |
Ratios to Average Net Assets F,I | |
Expenses before reductions | 1.92% A |
Expenses net of fee waivers, if any | 1.92% A |
Expenses net of all reductions | 1.88% A |
Net investment income (loss) | .30% A |
Supplemental Data | |
Net assets, end of period (000 omitted) | $ 8,750 |
Portfolio turnover rate G | 134% J |
A Annualized B Total returns for periods of less than one year are not annualized. C Total returns would have been lower if certain expenses had not been reduced during the applicable periods shown. D Total returns do not include the effect of the contingent deferred sales charge. E Calculated based on average shares outstanding during the period. F Fees and expenses of any underlying Fidelity Central Funds are not included in the Fund's expense ratio. The Fund indirectly bears its proportionate share of the expenses of any underlying Fidelity Central Funds. G Amount does not include the portfolio activity of any underlying Fidelity Central Funds. H For the period December 14, 2010 (commencement of sale of shares) to October 31, 2011. I Expense ratios reflect operating expenses of the class. Expenses before reductions do not reflect amounts reimbursed by the investment adviser or reductions from brokerage service arrangements or reductions from other expense offset arrangements and do not represent the amount paid by the class during periods when reimbursements or reductions occur. Expense ratios before reductions for start-up periods may not be representative of longer-term operating periods. Expenses net of fee waivers reflect expenses after reimbursement by the investment adviser but prior to reductions from brokerage service arrangements or other expense offset arrangements. Expenses net of all reductions represent the net expenses paid by the class. J The portfolio turnover rate does not include the assets acquired in the merger. |
See accompanying notes which are an integral part of the financial statements.
Annual Report
Financial Highlights - Japan
Years ended October 31, | 2011 | 2010 | 2009 | 2008 | 2007 |
Selected Per-Share Data | | | | | |
Net asset value, beginning of period | $ 10.57 | $ 10.03 | $ 9.03 | $ 18.00 | $ 16.85 |
Income from Investment Operations | | | | | |
Net investment income (loss) B | .15 | .10 | .08 | .10 | .04 |
Net realized and unrealized gain (loss) | (.75) | .61 | 1.04 | (6.64) | 1.35 |
Total from investment operations | (.60) | .71 | 1.12 | (6.54) | 1.39 |
Distributions from net investment income | (.20) | (.07) | (.11) | (.04) | (.01) |
Distributions from net realized gain | (.21) | (.10) | (.01) | (2.39) | (.23) |
Total distributions | (.41) | (.17) | (.12) | (2.43) | (.24) |
Redemption fees added to paid in capital B | .01 | - G | - G | - G | - G |
Net asset value, end of period | $ 9.57 | $ 10.57 | $ 10.03 | $ 9.03 | $ 18.00 |
Total Return A | (6.00)% | 7.12% | 12.84% | (41.88)% | 8.36% |
Ratios to Average Net Assets C,E | | | | | |
Expenses before reductions | .86% | .93% | .90% | 1.12% | 1.08% |
Expenses net of fee waivers, if any | .84% | .93% | .90% | 1.12% | 1.08% |
Expenses net of all reductions | .80% | .93% | .89% | 1.10% | 1.06% |
Net investment income (loss) | 1.38% | .97% | .90% | .72% | .24% |
Supplemental Data | | | | | |
Net assets, end of period (000 omitted) | $ 450,417 | $ 649,316 | $ 944,902 | $ 1,025,334 | $ 1,779,451 |
Portfolio turnover rate D | 134% F | 43% | 73% | 78% | 158% |
A Total returns would have been lower if certain expenses had not been reduced during the applicable periods shown. B Calculated based on average shares outstanding during the period. C Fees and expenses of any underlying Fidelity Central Funds are not included in the Fund's expense ratio. The Fund indirectly bears its proportionate share of the expenses of any underlying Fidelity Central Funds. D Amount does not include the portfolio activity of any underlying Fidelity Central Funds. E Expense ratios reflect operating expenses of the class. Expenses before reductions do not reflect amounts reimbursed by the investment adviser or reductions from brokerage service arrangements or reductions from other expense offset arrangements and do not represent the amount paid by the class during periods when reimbursements or reductions occur. Expenses net of fee waivers reflect expenses after reimbursement by the investment adviser but prior to reductions from brokerage service arrangements or other expense offset arrangements. Expenses net of all reductions represent the net expenses paid by the class. F The portfolio turnover rate does not include the assets acquired in the merger. G Amount represents less than $.01 per share. |
Financial Highlights - Institutional Class
Years ended October 31, | 2011 G |
Selected Per-Share Data | |
Net asset value, beginning of period | $ 10.83 |
Income from Investment Operations | |
Net investment income (loss) D | .13 |
Net realized and unrealized gain (loss) | (1.40) |
Total from investment operations | (1.27) |
Redemption fees added to paid in capital D | .01 |
Net asset value, end of period | $ 9.57 |
Total Return B,C | (11.63)% |
Ratios to Average Net Assets E,H | |
Expenses before reductions | .79% A |
Expenses net of fee waivers, if any | .79% A |
Expenses net of all reductions | .75% A |
Net investment income (loss) | 1.43% A |
Supplemental Data | |
Net assets, end of period (000 omitted) | $ 2,715 |
Portfolio turnover rate F | 134% I |
A Annualized B Total returns for periods of less than one year are not annualized. C Total returns would have been lower if certain expenses had not been reduced during the applicable periods shown. D Calculated based on average shares outstanding during the period. E Fees and expenses of any underlying Fidelity Central Funds are not included in the Fund's expense ratio. The Fund indirectly bears its proportionate share of the expenses of any underlying Fidelity Central Funds. F Amount does not include the portfolio activity of any underlying Fidelity Central Funds. G For the period December 14, 2010 (commencement of sale of shares) to October 31, 2011. H Expense ratios reflect operating expenses of the class. Expenses before reductions do not reflect amounts reimbursed by the investment adviser or reductions from brokerage service arrangements or reductions from other expense offset arrangements and do not represent the amount paid by the class during periods when reimbursements or reductions occur. Expense ratios before reductions for start-up periods may not be representative of longer-term operating periods. Expenses net of fee waivers reflect expenses after reimbursement by the investment adviser but prior to reductions from brokerage service arrangements or other expense offset arrangements. Expenses net of all reductions represent the net expenses paid by the class. I The portfolio turnover rate does not include the assets acquired in the merger. |
See accompanying notes which are an integral part of the financial statements.
Annual Report
Notes to Financial Statements
For the period ended October 31, 2011
1. Organization.
Fidelity Japan Fund (the Fund) is a fund of Fidelity Investment Trust (the Trust) and is authorized to issue an unlimited number of shares. The Trust is registered under the Investment Company Act of 1940, as amended (the 1940 Act), as an open-end management investment company organized as a Massachusetts business trust. The Fund launched shares of Class A, Class T, Class B, Class C and Institutional Class and the existing class was designated Japan on December 14, 2011. Each class has equal rights as to assets and voting privileges. Class B shares are closed to new accounts and additional purchases by existing shareholders. Each class has exclusive voting rights with respect to matters that affect that class. Class B shares automatically convert to Class A shares after a holding period of seven years from the initial date of purchase. Investment income, realized and unrealized capital gains and losses, the common expenses of the Fund, and certain fund-level expense reductions, if any, are allocated on a pro-rata basis to each class based on the relative net assets of each class to the total net assets of the Fund. Each class differs with respect to transfer agent and distribution and service plan fees incurred. Certain expense reductions may also differ by class. The Fund offered Class F shares during the period June 26, 2009 through December 15, 2010 and all outstanding shares were redeemed by December 15, 2010.
2. Investments in Fidelity Central Funds.
The Fund invests in Fidelity Central Funds, which are open-end investment companies available only to other investment companies and accounts managed by Fidelity Management & Research Company (FMR) and its affiliates. The Fund's Schedule of Investments lists each of the Fidelity Central Funds held as of period end, if any, as an investment of the Fund, but does not include the underlying holdings of each Fidelity Central Fund. As an Investing Fund, the Fund indirectly bears its proportionate share of the expenses of the underlying Fidelity Central Funds.
The Money Market Central Funds seek preservation of capital and current income and are managed by Fidelity Investments Money Management, Inc. (FIMM), an affiliate of FMR.
A complete unaudited list of holdings for each Fidelity Central Fund is available upon request or at the Securities and Exchange Commission (the SEC) web site at www.sec.gov. In addition, the financial statements of the Fidelity Central Funds, which are not covered by the Fund's Report of Independent Registered Public Accounting Firm are available on the SEC web site or upon request.
3. Significant Accounting Policies.
The financial statements have been prepared in conformity with accounting principles generally accepted in the United States of America (GAAP), which require management to make certain estimates and assumptions at the date of the financial statements. Actual results could differ from those estimates. Subsequent events, if any, through the date that the financial statements were issued have been evaluated in the preparation of the financial statements. The following summarizes the significant accounting policies of the Fund:
Security Valuation. Investments are valued as of 4:00 p.m. Eastern time on the last calendar day of the period. The Fund uses independent pricing services approved by the Board of Trustees to value its investments. When current market prices or quotations are not readily available or reliable, valuations may be determined in good faith in accordance with procedures adopted by the Board of Trustees. Factors used in determining value may include market or security specific events. The frequency with which these procedures are used cannot be predicted and they may be utilized to a significant extent. The value used for net asset value (NAV) calculation under these procedures may differ from published prices for the same securities.
The Fund categorizes the inputs to valuation techniques used to value its investments into a disclosure hierarchy consisting of three levels as shown below:
Level 1 - quoted prices in active markets for identical investments
Level 2 - other significant observable inputs (including quoted prices for similar investments, interest rates, prepayment speeds, etc.)
Level 3 - unobservable inputs (including the Fund's own assumptions based on the best information available)
Changes in valuation techniques may result in transfers in or out of an assigned level within the disclosure hierarchy. The aggregate value of investments by input level, as of October 31, 2011, is included at the end of the Fund's Schedule of Investments. Valuation techniques used to value the Fund's investments by major category are as follows:
Equity securities, including restricted securities, for which market quotations are readily available, are valued at the last reported sale price or official closing price as reported by an independent pricing service on the primary market or exchange on which they are traded and are categorized as Level 1 in the hierarchy. In the event there were no sales during the day or closing prices are not available, securities are valued at the last quoted bid price or may be valued using the last available price and are generally categorized as Level 2 in the hierarchy. For foreign equity securities, when significant market or security specific events arise, comparisons to the valuation of American Depositary Receipts (ADRs), futures contracts, Exchange-traded
Annual Report
Notes to Financial Statements - continued
3. Significant Accounting Policies - continued
Security Valuation - continued
funds (ETFs) and certain indexes as well as quoted prices for similar securities are used and are categorized as Level 2 in the hierarchy in these circumstances. Utilizing these techniques may result in transfers between Level 1 and Level 2. For restricted equity securities and private placements where observable inputs are limited, assumptions about market activity and risk are used and are categorized as Level 3 in the hierarchy.
Investments in open-end mutual funds, including the Fidelity Central Funds, are valued at their closing net asset value each business day and are categorized as Level 1 in the hierarchy.
Foreign Currency. The Fund may use foreign currency contracts to facilitate transactions in foreign-denominated securities. Gains and losses from these transactions may arise from changes in the value of the foreign currency or if the counterparties do not perform under the contracts' terms.
Foreign-denominated assets, including investment securities, and liabilities are translated into U.S. dollars at the exchange rate at period end. Purchases and sales of investment securities, income and dividends received and expenses denominated in foreign currencies are translated into U.S. dollars at the exchange rate in effect on the transaction date.
The effects of exchange rate fluctuations on investments are included with the net realized and unrealized gain (loss) on investment securities. Other foreign currency transactions resulting in realized and unrealized gain (loss) are disclosed separately.
Investment Transactions and Income. For financial reporting purposes, the Fund's investment holdings and NAV include trades executed through the end of the last business day of the period. The NAV per share for processing shareholder transactions is calculated as of the close of business of the New York Stock Exchange (NYSE), normally 4:00 p.m. Eastern time and includes trades executed through the end of the prior business day. Gains and losses on securities sold are determined on the basis of identified cost. Dividend income is recorded on the ex-dividend date, except for certain dividends from foreign securities where the ex-dividend date may have passed, which are recorded as soon as the Fund is informed of the ex-dividend date. Non-cash dividends included in dividend income, if any, are recorded at the fair market value of the securities received. Interest income and distributions from the Fidelity Central Funds are accrued as earned. Interest income includes coupon interest and amortization of premium and accretion of discount on debt securities. Investment income is recorded net of foreign taxes withheld where recovery of such taxes is uncertain.
Expenses. Expenses directly attributable to a fund are charged to that fund. Expenses attributable to more than one fund are allocated among the respective funds on the basis of relative net assets or other appropriate methods. Expense estimates are accrued in the period to which they relate and adjustments are made when actual amounts are known.
Income Tax Information and Distributions to Shareholders. Each year, the Fund intends to qualify as a regulated investment company, including distributing substantially all of its taxable income and realized gains under Subchapter M of the Internal Revenue Code and filing its U.S. federal tax return. As a result, no provision for income taxes is required. As of October 31, 2011, the Fund did not have any unrecognized tax benefits in the financial statements. A fund's federal tax return is subject to examination by the Internal Revenue Service (IRS) for a period of three years. Foreign taxes are provided for based on the Fund's understanding of the tax rules and rates that exist in the foreign markets in which it invests.
Distributions are declared and recorded on the ex-dividend date. Income dividends and capital gain distributions are declared separately for each class. Income and capital gain distributions are determined in accordance with income tax regulations, which may differ from GAAP.
Capital accounts within the financial statements are adjusted for permanent book-tax differences. These adjustments have no impact on net assets or the results of operations. Temporary book-tax differences will reverse in a subsequent period.
Book-tax differences are primarily due to the foreign currency transactions, passive foreign investment companies (PFIC), capital loss carryforwards and losses deferred due to wash sales.
The federal tax cost of investment securities and unrealized appreciation (depreciation) as of period end were as follows:
Gross unrealized appreciation | $ 9,010,731 |
Gross unrealized depreciation | (93,994,822) |
Net unrealized appreciation (depreciation) on securities and other investments | $ (84,984,091) |
| |
Tax Cost | $ 561,143,163 |
Annual Report
3. Significant Accounting Policies - continued
Income Tax Information and Distributions to Shareholders - continued
The tax-based components of distributable earnings as of period end were as follows:
Undistributed ordinary income | $ 9,973,043 |
Capital loss carryforward | $ (523,526,201) |
Net unrealized appreciation (depreciation) | $ (85,061,572) |
Under the recently enacted Regulated Investment Company Modernization Act of 2010 (the Act), the Fund will be permitted to carry forward capital losses incurred in taxable years beginning after December 22, 2010 for an unlimited period. However, any losses incurred during those future taxable years will be required to be utilized prior to any losses incurred in pre-enactment taxable years, which generally expire after eight years from when they are incurred. Additionally, post-enactment capital losses that are carried forward will retain their character as either short-term or long-term capital losses rather than being considered all short-term as under previous law. The Fund's first fiscal year end subject to the Act will be October 31, 2012.
The tax character of distributions paid was as follows:
| October 31, 2011 | October 31, 2010 |
Ordinary Income | $ 20,255,739 | $ 16,173,245 |
Short-Term Trading (Redemption) Fees. Shares held by investors in the Fund less than 90 days are subject to a redemption fee equal to 1.50% of the net asset value of shares redeemed. All redemption fees, which reduce the proceeds of the shareholder redemption, are retained by the Fund and accounted for as an addition to paid in capital.
New Accounting Pronouncement. In May 2011, the Financial Accounting Standards Board issued Accounting Standard Update No. 2011-04, Fair Value Measurement (Topic 820) - Amendments to Achieve Common Fair Value Measurement and Disclosure Requirements in U.S. GAAP and IFRSs. The update changes the wording used to describe the requirements in GAAP for measuring fair value and for disclosing information about fair value measurements. The update is effective during interim and annual periods beginning after December 15, 2011. Management is currently evaluating the impact of the update's adoption on the Fund's financial statement disclosures.
4. Purchases and Sales of Investments.
Purchases and sales of securities, other than short-term securities, aggregated $721,537,081 and $904,027,023, respectively.
5. Fees and Other Transactions with Affiliates.
Management Fee. FMR and its affiliates provide the Fund with investment management related services for which the Fund pays a monthly management fee. The management fee is the sum of an individual fund fee rate that is based on an annual rate of .45% of the Fund's average net assets and a group fee rate that averaged .26% during the period. The group fee rate is based upon the average net assets of all the mutual funds advised by FMR. The group fee rate decreases as assets under management increase and increases as assets under management decrease. In addition, the management fee is subject to a performance adjustment (up to a maximum of ± .20% of the Fund's average net assets over a 36 month performance period). The upward or downward adjustment to the management fee is based on the relative investment performance of Japan class of shares as compared to an appropriate benchmark index. For the period, the total annual management fee rate, including the performance adjustment, was .54% of the Fund's average net assets.
Distribution and Service Plan Fees. In accordance with Rule 12b-1 of the 1940 Act, the Fund has adopted separate Distribution and Service Plans for each class of shares. Certain classes pay Fidelity Distributors Corporation (FDC), an affiliate of FMR, separate Distribution and Service Fees, each of which is based on an annual percentage of each class' average net assets. In addition, FDC may pay financial intermediaries for selling shares of the Fund and providing shareholder support services. For the period, the Distribution and Service Fee rates, total fees and amounts retained by FDC were as follows:
| Distribution
Fee | Service
Fee | Total Fees | Retained
by FDC |
Class A | -% | .25% | $ 33,584 | $ 956 |
Class T | .25% | .25% | 21,758 | - |
Class B | .75% | .25% | 16,323 | 12,260 |
Class C | .75% | .25% | 88,343 | 36,106 |
| | | $ 160,008 | $ 49,322 |
Annual Report
Notes to Financial Statements - continued
5. Fees and Other Transactions with Affiliates - continued
Sales Load. FDC may receive a front-end sales charge of up to 5.75% for selling Class A shares, and 3.50% for selling Class T shares, some of which is paid to financial intermediaries for selling shares of the Fund. Depending on the holding period, FDC may receive contingent deferred sales charges levied on Class A, Class T, Class B, and Class C redemptions. The deferred sales charges range from 5% to 1% for Class B, 1% for Class C, 1.00% for certain purchases of Class A shares and .25% for certain purchases of Class T shares.
For the period, sales charge amounts retained by FDC were as follows:
| Retained
by FDC |
Class A | $ 14,607 |
Class T | 2,755 |
Class B* | 1,789 |
Class C* | 3,545 |
| $ 22,696 |
* When Class B and Class C shares are initially sold, FDC pays commissions from its own resources to financial intermediaries through which the sales are made.
Transfer Agent Fees. Fidelity Investments Institutional Operations Company, Inc. (FIIOC), an affiliate of FMR, is the transfer, dividend disbursing and shareholder servicing agent for each class of the Fund. FIIOC receives account fees and asset-based fees that vary according to the account size and type of account of the shareholders of the respective classes of the Fund. FIIOC pays for typesetting, printing and mailing of shareholder reports, except proxy statements. For the period, transfer agent fees for each class were as follows:
| Amount | % of
Average
Net Assets |
Class A | $ 40,772 | .30 |
Class T | 14,503 | .33 |
Class B | 4,919 | .30 |
Class C | 24,172 | .27 |
Japan | 1,110,816 | .21 |
Institutional Class | 4,414 | .15 |
| $ 1,199,596 | |
Accounting and Security Lending Fees. Fidelity Service Company, Inc. (FSC), an affiliate of FMR, maintains the Fund's accounting records. The accounting fee is based on the level of average net assets for the month. Under a separate contract, FSC administers the security lending program. The security lending fee is based on the number and duration of lending transactions.
6. Committed Line of Credit.
The Fund participates with other funds managed by FMR or an affiliate in a $4.0 billion credit facility (the "line of credit") to be utilized for temporary or emergency purposes to fund shareholder redemptions or for other short-term liquidity purposes. The Fund has agreed to pay commitment fees on its pro-rata portion of the line of credit, which amounted to $1,762 and is reflected in Miscellaneous expenses on the Statement of Operations. During the period, there were no borrowings on this line of credit.
7. Security Lending.
The Fund lends portfolio securities through a lending agent from time to time in order to earn additional income. For equity securities, a lending agent is used and may loan securities to certain qualified borrowers, including Fidelity Capital Markets (FCM), a broker-dealer affiliated with the Fund. On the settlement date of the loan, the Fund receives collateral (in the form of U.S. Treasury obligations, letters of credit and/or cash) against the loaned securities and maintains collateral in an amount not less than 100% of the market value of the loaned securities during the period of the loan. The market value of the loaned securities is determined at the close of business of the Fund and any additional required collateral is delivered to the Fund on the next business day. If the borrower defaults on its obligation to return the securities loaned because of insolvency or other reasons, a fund could experience delays and costs in recovering the securities loaned or in gaining access to the collateral. Any cash collateral received is invested in the Fidelity Securities Lending Cash Central Fund. At period end, there were no security loans outstanding. Security lending income represents the income earned on investing cash collateral, less rebates paid to borrowers and any lending agent fees associated with the loan, plus any premium payments received for lending certain types of securities. Security lending income is presented in the Statement of Operations as a component of income from Fidelity Central Funds. Total security lending income during the period amounted to $6,193. During the period, there were no securities loaned to FCM.
Annual Report
8. Expense Reductions.
FMR voluntarily agreed to reimburse a portion of Japan's operating expenses. During the period, this reimbursement reduced the class' expenses by $68,875.
Many of the brokers with whom FMR places trades on behalf of the Fund provided services in addition to trade execution. These services included payments of certain expenses on behalf of the Fund totaling $219,091 for the period.
9. Distributions to Shareholders.
Distributions to shareholders of each class were as follows:
Years ended October 31, | 2011A,B | 2010 |
From net investment income | | |
Class A | $ - | $ - |
Class T | - | - |
Class B | - | - |
Class C | - | - |
Japan | 9,544,936 | 6,581,344 |
Class F | 204,046 | 84,436 |
Institutional Class | - | - |
Total | $ 9,748,982 | $ 6,665,780 |
From net realized gain | | |
Class A | $ - | $ - |
Class T | - | - |
Class B | - | - |
Class C | - | - |
Japan | 10,328,111 | 9,401,920 |
Class F | 178,646 | 105,545 |
Institutional Class | - | - |
Total | $ 10,506,757 | $ 9,507,465 |
A Distributions for Class A, Class T, Class B, Class C and Institutional Class are for the period December 14, 2010 (commencement of sale of shares) to October 31, 2011.
B All Class F shares were redeemed on December 15, 2010.
10. Share Transactions.
Transactions for each class of shares were as follows:
| Shares | Dollars |
Years ended October 31, | 2011A,B | 2010 | 2011A,B | 2010 |
Class A | | | | |
Shares sold | 902,250 | - | $ 9,266,531 | $ - |
Issued in exchange for shares of Fidelity Advisor Japan Fund | 1,458,691 | - | 15,812,213 | - |
Shares redeemed | (975,882) | - | (10,202,627) | - |
Net increase (decrease) | 1,385,059 | - | $ 14,876,117 | $ - |
Class T | | | | |
Shares sold | 132,383 | - | $ 1,384,063 | $ - |
Issued in exchange for shares of Fidelity Advisor Japan Fund | 487,882 | - | 5,288,638 | - |
Shares redeemed | (132,194) | - | (1,415,637) | - |
Net increase (decrease) | 488,071 | - | $ 5,257,064 | $ - |
Class B | | | | |
Shares sold | 15,198 | - | $ 161,868 | $ - |
Issued in exchange for shares of Fidelity Advisor Japan Fund | 224,548 | - | 2,434,105 | - |
Shares redeemed | (85,826) | - | (926,239) | - |
Net increase (decrease) | 153,920 | - | $ 1,669,734 | $ - |
Class C | | | | |
Shares sold | 711,218 | - | $ 7,424,606 | $ - |
Issued in exchange for shares of Fidelity Advisor Japan Fund | 857,308 | - | 9,293,223 | - |
Shares redeemed | (645,053) | - | (6,643,542) | - |
Net increase (decrease) | 923,473 | - | $ 10,074,287 | $ - |
Annual Report
Notes to Financial Statements - continued
10. Share Transactions - continued
| Shares | Dollars |
Years ended October 31, | 2011A,B | 2010 | 2011A,B | 2010 |
Japan | | | | |
Shares sold | 16,755,813 | 20,810,343 | $ 180,371,996 | $ 217,088,312 |
Reinvestment of distributions | 1,718,167 | 1,440,939 | 18,229,748 | 14,827,260 |
Shares redeemed | (32,842,865) | (55,048,520) | (351,598,189) | (565,865,726) |
Net increase (decrease) | (14,368,885) | (32,797,238) | $ (152,996,445) | $ (333,950,154) |
Class F | | | | |
Shares sold | 346,757 | 8,109,487 | $ 3,766,116 | $ 83,695,320 |
Reinvestment of distributions | 36,103 | 18,463 | 382,692 | 189,982 |
Shares redeemed | (3,617,960) | (5,428,702) | (39,396,699) | (55,799,580) |
Net increase (decrease) | (3,235,100) | 2,699,248 | $ (35,247,891) | $ 28,085,722 |
Institutional Class | | | | |
Shares sold | 324,072 | - | $ 3,355,850 | $ - |
Issued in exchange for shares of Fidelity Advisor Japan Fund | 420,228 | - | 4,555,276 | - |
Shares redeemed | (460,581) | - | (4,809,911) | - |
Net increase (decrease) | 283,719 | - | $ 3,101,215 | $ - |
A Share transactions for Class A, Class T, Class B, Class C and Institutional Class are for the period December 14, 2010 (commencement of sale of shares) to October 31, 2011.
B All Class F shares were redeemed on December 15, 2010.
11. Other.
The Fund's organizational documents provide former and current trustees and officers with a limited indemnification against liabilities arising in connection with the performance of their duties to the Fund. In the normal course of business, the Fund may also enter into contracts that provide general indemnifications. The Fund's maximum exposure under these arrangements is unknown as this would be dependent on future claims that may be made against the Fund. The risk of material loss from such claims is considered remote.
At the end of the period, Strategic Advisors International Fund was the owner of record of approximately 31% of the total outstanding shares of the Fund. Mutual funds managed by Strategic Advisors, Inc., an affiliate of FMR, were the owners of record, in the aggregate, of approximately 36% of the total outstanding shares of the Fund.
12. Merger Information.
On December 17, 2010, the Fund acquired all of the assets and assumed all of the liabilities of the Fidelity Advisor Japan Fund ("Target Fund") pursuant to an agreement and plan of reorganization approved by the Board of Trustees ("The Board") on July 14, 2010. The reorganization provides shareholders of the Target Fund access to a larger portfolio with the same investment objective and lower expenses. The acquisition was accomplished by an exchange of 1,458,691 Class A shares, 487,882 Class T shares, 224,548 Class B shares, 857,308 Class C shares, and 420,228 Institutional Class shares of the Fund, respectively, for 1,347,662 Class A shares, 458,320 Class T shares, 220,839 Class B shares, 837,651 Class C shares, and 377,690 Institutional Class shares then outstanding (valued at $11.73, $11.54, $11.02, $11.09 and $12.06 per share for Class A, Class T, Class B, Class C, and Institutional Class, respectively) of the Target Fund. The reorganization qualified as a tax-free reorganization for federal income tax purposes with no gain or loss recognized to the funds or their shareholders. The Target Fund's net assets, including securities of $37,429,891, unrealized depreciation of $(2,434,247), cash of $6,456 and net other liabilities of $(52,892), were combined with the Fund's net assets of $515,046,445 for total net assets after the acquisition of $552,429,900.
Pro forma results of operations of the combined entity for the entire period ended October 31, 2011, as though the acquisition had occurred as of the beginning of the year (rather than on the actual acquisition date), are as follows:
Net investment income (loss) | $ 7,426,258 |
Total net realized gain (loss) | (68,640,546) |
Total change in net unrealized appreciation (depreciation) | 34,276,793 |
Net increase (decrease) in net assets resulting from operations | $ 26,937,495 |
Because the combined investment portfolios have been managed as a single portfolio since the acquisition was completed, it is not practicable to separate the amounts of revenue and earnings of the acquired fund that have been included in the Fund's accompanying Statement of Operations since December 17, 2010.
Annual Report
Report of Independent Registered Public Accounting Firm
To the Trustees of Fidelity Investment Trust and the Shareholders of Fidelity Japan Fund:
In our opinion, the accompanying statement of assets and liabilities, including the schedule of investments, and the related statements of operations and of changes in net assets and the financial highlights present fairly, in all material respects, the financial position of Fidelity Japan Fund (a fund of Fidelity Investment Trust) at October 31, 2011, the results of its operations for the year then ended, the changes in its net assets for each of the two years in the period then ended and the financial highlights for each of the periods indicated, in conformity with accounting principles generally accepted in the United States of America. These financial statements and financial highlights (hereafter referred to as "financial statements") are the responsibility of the Fidelity Japan Fund's management. Our responsibility is to express an opinion on these financial statements based on our audits. We conducted our audits of these financial statements in accordance with the standards of the Public Company Accounting Oversight Board (United States). Those standards require that we plan and perform the audit to obtain reasonable assurance about whether the financial statements are free of material misstatement. An audit includes examining, on a test basis, evidence supporting the amounts and disclosures in the financial statements, assessing the accounting principles used and significant estimates made by management, and evaluating the overall financial statement presentation. We believe that our audits, which included confirmation of securities at October 31, 2011 by correspondence with the custodian and brokers, provide a reasonable basis for our opinion.
PricewaterhouseCoopers LLP
Boston, Massachusetts
December 16, 2011
Annual Report
The Trustees, Members of the Advisory Board, and executive officers of the trust and fund, as applicable, are listed below. The Board of Trustees governs the fund and is responsible for protecting the interests of shareholders. The Trustees are experienced executives who meet periodically throughout the year to oversee the fund's activities, review contractual arrangements with companies that provide services to the fund, oversee management of the risks associated with such activities and contractual arrangements, and review the fund's performance. Except for James C. Curvey, each of the Trustees oversees 226 funds advised by FMR or an affiliate. Mr. Curvey oversees 429 funds advised by FMR or an affiliate.
The Trustees hold office without limit in time except that (a) any Trustee may resign; (b) any Trustee may be removed by written instrument, signed by at least two-thirds of the number of Trustees prior to such removal; (c) any Trustee who requests to be retired or who has become incapacitated by illness or injury may be retired by written instrument signed by a majority of the other Trustees; and (d) any Trustee may be removed at any special meeting of shareholders by a two-thirds vote of the outstanding voting securities of the trust. Each Trustee who is not an interested person (as defined in the 1940 Act) (Independent Trustee), shall retire not later than the last day of the calendar year in which his or her 75th birthday occurs. The Independent Trustees may waive this mandatory retirement age policy with respect to individual Trustees. The executive officers and Advisory Board Members hold office without limit in time, except that any officer and Advisory Board Member may resign or may be removed by a vote of a majority of the Trustees at any regular meeting or any special meeting of the Trustees. Except as indicated, each individual has held the office shown or other offices in the same company for the past five years.
Experience, Skills, Attributes, and Qualifications of the Fund's Trustees. The Governance and Nominating Committee has adopted a statement of policy that describes the experience, qualifications, attributes, and skills that are necessary and desirable for potential Independent Trustee candidates (Statement of Policy). The Board believes that each Trustee satisfied at the time he or she was initially elected or appointed a Trustee, and continues to satisfy, the standards contemplated by the Statement of Policy. The Governance and Nominating Committee also engages professional search firms to help identify potential Independent Trustee candidates who have the experience, qualifications, attributes, and skills consistent with the Statement of Policy. From time to time, additional criteria based on the composition and skills of the current Independent Trustees, as well as experience or skills that may be appropriate in light of future changes to board composition, business conditions, and regulatory or other developments, have also been considered by the professional search firms and the Governance and Nominating Committee. In addition, the Board takes into account the Trustees' commitment and participation in Board and committee meetings, as well as their leadership of standing and ad hoc committees throughout their tenure.
In determining that a particular Trustee was and continues to be qualified to serve as a Trustee, the Board has considered a variety of criteria, none of which, in isolation, was controlling. The Board believes that, collectively, the Trustees have balanced and diverse experience, qualifications, attributes, and skills, which allow the Board to operate effectively in governing the fund and protecting the interests of shareholders. Information about the specific experience, skills, attributes, and qualifications of each Trustee, which in each case led to the Board's conclusion that the Trustee should serve (or continue to serve) as a trustee of the fund, is provided below.
Board Structure and Oversight Function. James C. Curvey is an interested person (as defined in the 1940 Act) and currently serves as Acting Chairman. The Trustees have determined that an interested Chairman is appropriate and benefits shareholders because an interested Chairman has a personal and professional stake in the quality and continuity of services provided to the fund. Independent Trustees exercise their informed business judgment to appoint an individual of their choosing to serve as Chairman, regardless of whether the Trustee happens to be independent or a member of management. The Independent Trustees have determined that they can act independently and effectively without having an Independent Trustee serve as Chairman and that a key structural component for assuring that they are in a position to do so is for the Independent Trustees to constitute a substantial majority for the Board. The Independent Trustees also regularly meet in executive session. Ned C. Lautenbach serves as Chairman of the Independent Trustees and as such (i) acts as a liaison between the Independent Trustees and management with respect to matters important to the Independent Trustees and (ii) with management prepares agendas for Board meetings.
Fidelity funds are overseen by different Boards of Trustees. The fund's Board oversees Fidelity's equity and high income funds and another Board oversees Fidelity's investment-grade bond, money market, and asset allocation funds. The asset allocation funds may invest in Fidelity funds overseen by the fund's Board. The use of separate Boards, each with its own committee structure, allows the Trustees of each group of Fidelity funds to focus on the unique issues of the funds they oversee, including common research, investment, and operational issues. On occasion, the separate Boards establish joint committees to address issues of overlapping consequences for the Fidelity funds overseen by each Board.
The Trustees operate using a system of committees to facilitate the timely and efficient consideration of all matters of importance to the Trustees, the fund, and fund shareholders and to facilitate compliance with legal and regulatory requirements and oversight of the fund's activities and associated risks. The Board, acting through its committees, has charged FMR and its affiliates with (i) identifying events or circumstances the occurrence of which could have demonstrably adverse effects on the fund's business and/or reputation; (ii) implementing processes and controls to lessen the possibility that such events or circumstances occur or to mitigate the effects of such events or circumstances if they do occur; and (iii) creating and maintaining a system designed to evaluate continuously business and market conditions in order to facilitate the identification and implementation processes described in (i) and (ii) above. Because the day-to-day operations and activities of the fund are carried out by or through FMR, its affiliates and other service providers, the fund's exposure to risks is mitigated but not eliminated by the processes overseen by the Trustees. While each of the Board's committees has responsibility for overseeing different aspects of the fund's activities, oversight is exercised primarily through the Operations, Audit, and Compliance Committees. In addition, the Independent Trustees have worked with FMR to enhance the Board's oversight of investment and financial risks, legal and regulatory risks, technology risks, and operational risks, including the development of additional risk reporting to the Board. For example, a working group comprised of Independent Trustees and FMR has worked and continues to work to review the Fidelity funds' valuation-related activities, reporting and risk management. Appropriate personnel, including but not limited to the fund's Chief Compliance Officer (CCO), FMR's internal auditor, the independent accountants, the fund's Treasurer and portfolio management personnel, make periodic reports to the Board's committees, as appropriate, including an annual review of FMR's risk management program for the Fidelity funds. The responsibilities of each standing committee, including their oversight responsibilities, are described further under "Standing Committees of the Fund's Trustees."
Annual Report
Trustees and Officers - continued
The fund's Statement of Additional Information (SAI) includes more information about the Trustees. To request a free copy, call Fidelity at 1-877-208-0098.
Interested Trustees*:
Correspondence intended for each Trustee who is an interested person may be sent to Fidelity Investments, 82 Devonshire Street, Boston, Massachusetts 02109.
Name, Age; Principal Occupations and Other Relevant Experience+ |
James C. Curvey (76) |
| Year of Election or Appointment: 2007 Mr. Curvey is Trustee and Acting Chairman of the Board of Trustees of certain Trusts. Mr. Curvey also serves as Trustee (2007-present) of other investment companies advised by FMR. Mr. Curvey is a Director of Fidelity Investments Money Management, Inc. (2009-present), Director of Fidelity Research & Analysis Co. (2009-present) and Director of FMR and FMR Co., Inc. (2007-present). Mr. Curvey is also Vice Chairman (2007-present) and Director of FMR LLC. In addition, Mr. Curvey serves as an Overseer for the Boston Symphony Orchestra and a member of the Trustees of Villanova University. Previously, Mr. Curvey was the Vice Chairman (2006-2007) and Director (2000-2007) of FMR Corp. |
Ronald P. O'Hanley (54) |
| Year of Election or Appointment: 2011 Mr. O'Hanley is Director of FMR Co., Inc. (2010-present), Director of Fidelity Investments Money Management, Inc. (2010-present), Director of Fidelity Research & Analysis Company (2010-present), President of Fidelity Asset Management and Corporate Services and a member of Fidelity's Executive Committee (2010-present). Previously, Mr. O'Hanley served as President and Chief Executive Officer of BNY Mellon Asset Management (2007-2010). Mr. O'Hanley also served as Vice Chairman of Bank New York Mellon Corp. and a member of that firm's Executive Committee. Prior to the 2007 merger of The Bank of New York and Mellon Financial Corporation, he was Vice Chairman of Mellon Financial Corporation and President and Chief Executive Officer of Mellon Asset Management. He joined Mellon in February 1997. Mr. O'Hanley currently serves as Chairman of the Boston Public Library Foundation Board of Directors and sits on the Board of Directors of Beth Israel Deaconess Medical Center, the Board of Trustees of the Marine Biological Laboratory and the Advisory Board of the Maxwell School of Citizenship and Public Administration at Syracuse University. Mr. O'Hanley also chairs the Council on Asset Management for the Financial Services Roundtable and is a member of the Board of Directors of Institutional Investor's U.S. Institute. |
* Trustees have been determined to be "Interested Trustees" by virtue of, among other things, their affiliation with the trust or various entities under common control with FMR.
+ The information above includes each Trustee's principal occupation during the last five years and other information relating to the experience, attributes, and skills relevant to each Trustee's qualifications to serve as a Trustee, which led to the conclusion that each Trustee should serve as a Trustee for the fund.
Independent Trustees:
Correspondence intended for each Independent Trustee (that is, the Trustees other than the Interested Trustees) may be sent to Fidelity Investments, P.O. Box 55235, Boston, Massachusetts 02205-5235.
Name, Age; Principal Occupations and Other Relevant Experience+ |
Dennis J. Dirks (63) |
| Year of Election or Appointment: 2005 Prior to his retirement in May 2003, Mr. Dirks was Chief Operating Officer and a member of the Board of The Depository Trust & Clearing Corporation (DTCC). He also served as President, Chief Operating Officer, and Board member of The Depository Trust Company (DTC) and President and Board member of the National Securities Clearing Corporation (NSCC). In addition, Mr. Dirks served as Chief Executive Officer and Board member of the Government Securities Clearing Corporation, Chief Executive Officer and Board member of the Mortgage-Backed Securities Clearing Corporation, as a Trustee and a member of the Finance Committee of Manhattan College (2005-2008), and as a Trustee and a member of the Finance Committee of AHRC of Nassau County (2006-2008). Mr. Dirks is a member of the Independent Directors Council (IDC) Governing Council (2010-Present) and Board of Directors for The Brookville Center for Children's Services, Inc. (2009-present). |
Alan J. Lacy (58) |
| Year of Election or Appointment: 2008 Mr. Lacy serves as Senior Adviser (2007-present) of Oak Hill Capital Partners, L.P. (private equity). Mr. Lacy also served as Chief Executive Officer (2000-2005) and Vice Chairman (2005-2006) of Sears Holdings Corporation and Sears, Roebuck and Co. (retail). In addition, Mr. Lacy serves as a member of the Board of Directors of Dave & Buster's, Inc. (restaurant and entertainment complexes, 2010-present), The Hillman Companies, Inc. (hardware wholesalers, 2010-present), and Bristol-Myers Squibb Company (global pharmaceuticals, 2007-present). Mr. Lacy is a member of the Board of Trustees of The National Parks Conservation Association (2006-Present). Previously, Mr. Lacy served as Chairman of the Board of Trustees of the National Parks Conservation Association (2008-2011) and as a member of the Board of Directors for the Western Union Company (global money transfer, 2006-2011). |
Ned C. Lautenbach (67) |
| Year of Election or Appointment: 2000 Mr. Lautenbach is Chairman of the Independent Trustees of the Equity and High Income Funds (2006-present). Mr. Lautenbach currently serves as the Lead Director of the Eaton Corporation Board of Directors (diversified industrial, 1997-present). Mr. Lautenbach is also a member of the Board of Directors of the Philharmonic Center for the Arts in Naples, Florida (1999-present); a member of the Board of Trustees of Fairfield University (2005-present); and a member of the Council on Foreign Relations (1994-present). Previously, Mr. Lautenbach was a Partner/Advisory Partner at Clayton, Dubilier & Rice, LLC (private equity investment, 1998-2010), as well as a Director of Sony Corporation (2006-2007). |
Joseph Mauriello (67) |
| Year of Election or Appointment: 2008 Prior to his retirement in January 2006, Mr. Mauriello served in numerous senior management positions including Deputy Chairman and Chief Operating Officer (2004-2005), and Vice Chairman of Financial Services (2002-2004) of KPMG LLP US (professional services, 1965-2005). Mr. Mauriello currently serves as a member of the Board of Directors of XL Group plc. (global insurance and re-insurance, 2006-present) and of Arcadia Resources Inc. (health care services and products, 2007-present). Previously, Mr. Mauriello served as a Director of the Hamilton Funds of the Bank of New York (2006-2007). |
Robert W. Selander (61) |
| Year of Election or Appointment: 2011 Previously, Mr. Selander served as a Member of the Advisory Board of Fidelity's Equity and High Income Funds (2011), Executive Vice Chairman (2010), Chief Executive Officer (2009-2010), and President and Chief Executive Officer (1997-2009) of Mastercard, Inc. |
Cornelia M. Small (67) |
| Year of Election or Appointment: 2005 Ms. Small is a member of the Board of Directors of the Teagle Foundation (2009-present). Ms. Small is also a member of the Investment Committee, and Chair (2008-present) and a member of the Board of Trustees of Smith College. In addition, Ms. Small serves on the Investment Committee of the Berkshire Taconic Community Foundation (2008-present). Previously, Ms. Small served as Chairperson of the Investment Committee (2002-2008) of Smith College. In addition, Ms. Small served as Chief Investment Officer, Director of Global Equity Investments, and a member of the Board of Directors of Scudder, Stevens & Clark and Scudder Kemper Investments. |
William S. Stavropoulos (72) |
| Year of Election or Appointment: 2001 Mr. Stavropoulos is Vice Chairman of the Independent Trustees of the Equity and High Income Funds (2006-present). Mr. Stavropoulos serves as President and Founder of the Michigan Baseball Foundation, the Great Lakes Loons (2007-present). Mr. Stavropoulos is Chairman Emeritus of the Board of Directors of The Dow Chemical Company, where he previously served in numerous senior management positions, including President, CEO (1995-2000; 2002-2004), Chairman of the Executive Committee (2000-2006), and as a member of the Board of Directors (1990-2006). Currently, Mr. Stavropoulos is Chairman of Univar (global distributor of commodity and specialty chemicals, 2010-present), a Director of Teradata Corporation (data warehousing and technology solutions, 2008-present), Chemical Financial Corporation, Maersk Inc. (industrial conglomerate), Tyco International, Inc. (multinational manufacturing and services, 2007-present), and a member of the Advisory Board for Metalmark Capital (private equity investment, 2005-present). Mr. Stavropoulos is a special advisor to Clayton, Dubilier & Rice, LLC (private equity investment). In addition, Mr. Stavropoulos is a member of the University of Notre Dame Advisory Council for the College of Science. |
David M. Thomas (62) |
| Year of Election or Appointment: 2008 Previously, Mr. Thomas served as Executive Chairman (2005-2006) and Chairman and Chief Executive Officer (2000-2005) of IMS Health, Inc. (pharmaceutical and healthcare information solutions). In addition, Mr. Thomas serves as a member of the Board of Directors of Fortune Brands, Inc. (consumer products), and Interpublic Group of Companies, Inc. (marketing communication, 2004-present). |
Michael E. Wiley (61) |
| Year of Election or Appointment: 2008 Mr. Wiley also serves as a Director of Asia Pacific Exploration Consolidated (international oil and gas exploration and production, 2008-present). Mr. Wiley serves as a Director of Tesoro Corporation (independent oil refiner and marketer, 2005-present), and a Director of Bill Barrett Corporation (exploration and production, 2005-present). In addition, Mr. Wiley also serves as a Director of Post Oak Bank (privately-held bank, 2004-present). Previously, Mr. Wiley served as a member of the Board of Trustees of the University of Tulsa (2000-2006; 2007-2010), as a Senior Energy Advisor of Katzenbach Partners, LLC (consulting, 2006-2007), as an Advisory Director of Riverstone Holdings (private investment), Chairman, President, and CEO of Baker Hughes, Inc. (oilfield services, 2000-2004), and as Director of Spinnaker Exploration Company (exploration and production, 2001-2005). |
+ The information above includes each Trustee's principal occupation during the last five years and other information relating to the experience, attributes, and skills relevant to each Trustee's qualifications to serve as a Trustee, which led to the conclusion that each Trustee should serve as a Trustee for the fund.
Advisory Board Members and Executive Officers:
Correspondence intended for each executive officer, Edward C. Johnson 3d, and Peter S. Lynch may be sent to Fidelity Investments, 82 Devonshire Street, Boston, Massachusetts 02109.
Name, Age; Principal Occupation |
Edward C. Johnson 3d (81) |
| Year of Election or Appointment: 2011 Member of the Advisory Board of Fidelity's Equity and High Income Funds. Mr. Johnson serves as Chief Executive Officer, Chairman, and a Director of FMR LLC, and also serves as Chairman and Director of FIL Limited. Previously, Mr. Johnson served as a Trustee and Chairman of the Board of certain Fidelity Trusts, Chairman and a Director of FMR, Chairman and a Director of FMR Co., Inc., and President of FMR LLC (2006-2007). |
Peter S. Lynch (67) |
| Year of Election or Appointment: 2003 Member of the Advisory Board of Fidelity's Equity and High Income Funds. Mr. Lynch is Vice Chairman and a Director of FMR and FMR Co., Inc. In addition, Mr. Lynch serves as a Trustee of Boston College and as the Chairman of the Inner-City Scholarship Fund. Previously, Mr. Lynch served on the Special Olympics International Board of Directors (1997-2006). |
Kenneth B. Robins (42) |
| Year of Election or Appointment: 2008 President and Treasurer of Fidelity's Equity and High Income Funds. Mr. Robins also serves as President and Treasurer (2010-present) and Assistant Treasurer (2009-present) of other Fidelity funds and is an employee of Fidelity Investments (2004-present). Previously, Mr. Robins served as Deputy Treasurer of the Fidelity funds (2005-2008) and Treasurer and Chief Financial Officer of The North Carolina Capital Management Trust: Cash and Term Portfolios (2006-2008). |
Bruce T. Herring (46) |
| Year of Election or Appointment: 2006 Vice President of certain Equity Funds. Mr. Herring also serves as Chief Investment Officer and Director of Fidelity Management & Research (U.K.) Inc. (2010-present) and Group Chief Investments Officer of FMR. Previously, Mr. Herring served as Vice President (2005-2006) and Senior Vice President (2006-2007) of Fidelity Management & Research Company, Vice President of FMR Co., Inc. (2001-2007) and as a portfolio manager for Fidelity U.S. Equity Funds. |
Brian B. Hogan (47) |
| Year of Election or Appointment: 2009 Vice President of Equity and High Income Funds. Mr. Hogan also serves as President of FMR's Equity Division (2009-present). Previously, Mr. Hogan served as Senior Vice President, Equity Research of FMR (2006-2009) and as a portfolio manager. |
Scott C. Goebel (43) |
| Year of Election or Appointment: 2008 Secretary and Chief Legal Officer (CLO) of the Fidelity funds. Mr. Goebel also serves as Secretary of Fidelity Investments Money Management, Inc. (FIMM) (2010-present) and Fidelity Research and Analysis Company (FRAC) (2010-present); Secretary and CLO of The North Carolina Capital Management Trust: Cash and Term Portfolios (2008-present); General Counsel, Secretary, and Senior Vice President of FMR (2008-present) and FMR Co., Inc. (2008-present); employed by FMR LLC or an affiliate (2001-present); Chief Legal Officer of Fidelity Management & Research (Hong Kong) Limited (2008-present) and Assistant Secretary of Fidelity Management & Research (Japan) Inc. (2008-present), and Fidelity Management & Research (U.K.) Inc. (2008-present). Previously, Mr. Goebel served as Assistant Secretary of FIMM (2008-2010), FRAC (2008-2010), and the Funds (2007-2008) and as Vice President and Secretary of Fidelity Distributors Corporation (FDC) (2005-2007). |
William C. Coffey (42) |
| Year of Election or Appointment: 2009 Assistant Secretary of Fidelity's Equity and High Income Funds. Mr. Coffey also serves as Senior Vice President and Deputy General Counsel of FMR LLC (2010-present), and is an employee of Fidelity Investments. Previously, Mr. Coffey served as Vice President and Associate General Counsel of FMR LLC (2005-2009). |
Holly C. Laurent (57) |
| Year of Election or Appointment: 2008 Anti-Money Laundering (AML) Officer of the Fidelity funds. Ms. Laurent also serves as AML Officer of The North Carolina Capital Management Trust: Cash and Term Portfolios (2008-present) and is an employee of Fidelity Investments. Previously, Ms. Laurent was Senior Vice President and Head of Legal for Fidelity Business Services India Pvt. Ltd. (2006-2008), and Senior Vice President, Deputy General Counsel and Group Head for FMR LLC (2005-2006). |
Christine Reynolds (53) |
| Year of Election or Appointment: 2008 Chief Financial Officer of the Fidelity funds. Ms. Reynolds became President of Fidelity Pricing and Cash Management Services (FPCMS) in August 2008. Ms. Reynolds served as Chief Operating Officer of FPCMS (2007-2008). Previously, Ms. Reynolds served as President, Treasurer, and Anti-Money Laundering officer of the Fidelity funds (2004-2007). |
Kenneth A. Rathgeber (64) |
| Year of Election or Appointment: 2004 Chief Compliance Officer of Fidelity's Equity and High Income Funds. Mr. Rathgeber is Chief Compliance Officer of Fidelity Management & Research (Hong Kong) Limited (2008-present), Fidelity Management & Research (Japan) Inc. (2008-present), FMR (2005-present), FMR Co., Inc. (2005-present), Fidelity Management & Research (U.K.) Inc. (2005-present), Fidelity Research & Analysis Company (2005-present), Fidelity Investments Money Management, Inc. (2005-present), Pyramis Global Advisors, LLC (2005-present), and Strategic Advisers, Inc. (2005-present). |
Jeffrey S. Christian (50) |
| Year of Election or Appointment: 2009 Deputy Treasurer of the Fidelity funds. Mr. Christian is an employee of Fidelity Investments. Previously, Mr. Christian served as Chief Financial Officer (2008-2009) of certain Fidelity funds and Senior Vice President of Fidelity Pricing and Cash Management Services (FPCMS) (2004-2009). |
Joseph F. Zambello (54) |
| Year of Election or Appointment: 2011 Deputy Treasurer of the Fidelity funds. Mr. Zambello is an employee of Fidelity Investments. Previously, Mr. Zambello served as Vice President of FMR's Program Management Group (2009-2011) and Vice President of the Transfer Agent Oversight Group (2005-2009). |
Adrien E. Deberghes (44) |
| Year of Election or Appointment: 2008 Deputy Treasurer of Fidelity's Equity and High Income Funds. Mr. Deberghes also serves as Vice President and Assistant Treasurer of Fidelity Rutland Square Trust II and Fidelity Commonwealth Trust II (2011-present), Assistant Treasurer of other Fidelity funds (2010-present), and is an employee of Fidelity Investments (2008-present). Previously, Mr. Deberghes served as Senior Vice President of Mutual Fund Administration at State Street Corporation (2007-2008), Senior Director of Mutual Fund Administration at Investors Bank & Trust (2005-2007), and Director of Finance for Dunkin' Brands (2000-2005). |
Stephanie J. Dorsey (42) |
| Year of Election or Appointment: 2010 Assistant Treasurer of Fidelity's Equity and High Income Funds. Ms. Dorsey also serves as Deputy Treasurer of other Fidelity funds (2008-present) and is an employee of Fidelity Investments (2008-present). Previously, Ms. Dorsey served as Treasurer (2004-2008) of the JPMorgan Mutual Funds and Vice President (2004-2008) of JPMorgan Chase Bank. |
John R. Hebble (53) |
| Year of Election or Appointment: 2009 Assistant Treasurer of Fidelity's Equity and High Income Funds. Mr. Hebble also serves as President (2011-present), Treasurer, and Chief Financial Officer of The North Carolina Capital Management Trust: Cash and Term Portfolios (2008-present), President and Treasurer of other Fidelity funds (2008-present) and is an employee of Fidelity Investments. |
Gary W. Ryan (53) |
| Year of Election or Appointment: 2005 Assistant Treasurer of the Fidelity funds. Mr. Ryan is an employee of Fidelity Investments. Previously, Mr. Ryan served as Vice President of Fund Reporting in Fidelity Pricing and Cash Management Services (FPCMS) (1999-2005). |
Jonathan Davis (43) |
| Year of Election or Appointment: 2010 Assistant Treasurer of the Fidelity funds. Mr. Davis is also Assistant Treasurer of Fidelity Rutland Square Trust II and Fidelity Commonwealth Trust II. Mr. Davis is an employee of Fidelity Investments. Previously, Mr. Davis served as Vice President and Associate General Counsel of FMR LLC (2003-2010). |
Annual Report
The Board of Trustees of Fidelity Japan Fund voted to pay to shareholders of record at the opening of business on record date, the following distributions per share derived from capital gains realized from sales of portfolio securities, and dividends derived from net investment income:
| Pay Date | Record Date | Dividends | Capital Gains |
Institutional Class | 12/12/11 | 12/09/11 | $0.170 | $0.052 |
Annual Report
Board Approval of Investment Advisory Contracts and Management Fees
Fidelity Japan Fund
Each year, the Board of Trustees, including the Independent Trustees (together, the Board), votes on the renewal of the management contract and sub-advisory agreements (together, the Advisory Contracts) for the fund. The Board, assisted by the advice of fund counsel and Independent Trustees' counsel, requests and considers a broad range of information relevant to the renewal of the Advisory Contracts throughout the year.
The Board meets regularly and considers at each of its meetings factors that are relevant to its annual consideration of the renewal of the fund's Advisory Contracts, including the services and support provided to the fund and its shareholders. The Board has established various standing committees, each composed of Independent Trustees with varying backgrounds, to which the Board has assigned specific subject matter responsibilities in order to enhance effective decision-making by the Board. The Board, acting directly and through its Committees, requests and receives information concerning the annual consideration of the renewal of the fund's Advisory Contracts. The Board also meets as needed to consider matters specifically related to the Board's annual consideration of the renewal of Advisory Contracts. Members of the Board may also meet with trustees of other Fidelity funds through ad hoc joint committees to discuss certain matters relevant to the Fidelity funds.
At its July 2011 meeting, the Board of Trustees, including the Independent Trustees, unanimously determined to renew the fund's Advisory Contracts. In reaching its determination, the Board considered all factors it believed relevant, including (i) the nature, extent, and quality of the services to be provided to the fund and its shareholders (including the investment performance of the fund); (ii) the competitiveness of the fund's management fee and total expense ratio; (iii) the total costs of the services to be provided by and the profits to be realized by Fidelity from its relationship with the fund; (iv) the extent to which economies of scale would be realized as the fund grows; and (v) whether fee levels reflect these economies of scale, if any, for the benefit of fund shareholders.
In considering whether to renew the Advisory Contracts for the fund, the Board reached a determination, with the assistance of fund counsel and Independent Trustees' counsel and through the exercise of its business judgment, that the renewal of the Advisory Contracts is in the best interests of the fund and its shareholders and that the compensation payable under the Advisory Contracts is fair and reasonable. The Board's decision to renew the Advisory Contracts was not based on any single factor, but rather was based on a comprehensive consideration of all the information provided to the Board at its meetings throughout the year. The Board, in reaching its determination to renew the Advisory Contracts, is aware that shareholders in the fund have a broad range of investment choices available to them, including a wide choice among mutual funds offered by Fidelity's competitors, and that the fund's shareholders, who have the opportunity to review and weigh the disclosure provided by the fund in its prospectus and other public disclosures, have chosen to invest in this fund, managed by Fidelity.
Nature, Extent, and Quality of Services Provided. The Board considered the staffing within the investment adviser, FMR, and the sub-advisers (together, the Investment Advisers), including the backgrounds of the fund's investment personnel and the fund's investment objective and discipline. The Independent Trustees also had discussions with senior management of Fidelity's investment operations and investment groups. The Board considered the structure of the portfolio manager compensation program and whether this structure provides appropriate incentives to act in the best interests of the fund.
Resources Dedicated to Investment Management and Support Services. The Board and the Fund Oversight and Research Committees reviewed the general qualifications and capabilities of the Investment Advisers' investment staff, including its size, education, experience, and resources, as well as the Investment Advisers' approach to recruiting, training, managing, and compensating investment personnel. The Board also noted that FMR has devoted increased resources to non-U.S. offices. The Board noted that Fidelity's analysts have extensive resources, tools and capabilities which allow them to conduct sophisticated quantitative and fundamental analysis, as well as credit analysis of issuers, counterparties and enhancers. The Board also believes that Fidelity's investment professionals have sufficient access to global information and data so as to provide competitive investment results over time, and that those professionals also have access to sophisticated tools which permit them to assess portfolio construction and risk and performance attribution characteristics continuously, as well as to transmit new information and research conclusions rapidly around the world. Additionally, in their deliberations, the Board considered the Investment Advisers' trading capabilities and resources which are an integral part of the investment management process.
Shareholder and Administrative Services. The Board considered (i) the nature, extent, quality, and cost of advisory, administrative, and shareholder services performed by the Investment Advisers and their affiliates under the Advisory Contracts and under separate agreements covering transfer agency, pricing and bookkeeping, and securities lending services for the fund; (ii) the nature and extent of the investment adviser's supervision of third party service providers, principally custodians and subcustodians; and (iii) the resources devoted to, and the record of compliance with, the fund's compliance policies and procedures. The Board also reviewed the allocation of fund brokerage, including allocations to brokers affiliated with the Investment Advisers, the use of brokerage commissions to pay fund expenses, and the use of "soft" commission dollars to pay for research services.
The Board noted that the growth of fund assets over time across the complex allows Fidelity to reinvest in the development of services designed to enhance the value or convenience of the Fidelity funds as investment vehicles. These services include 24-hour access to account information and market information through telephone representatives and over the Internet, investor education materials and asset allocation tools, and the expanded availability of Fidelity Investor Centers, with 35 new branches opening since 2010.
Annual Report
Investment in a Large Fund Family. The Board considered the benefits to shareholders of investing in a Fidelity fund, including the benefits of investing in a fund that is part of a large family of funds offering a variety of investment disciplines and providing a large variety of mutual fund investor services. The Board noted that Fidelity had taken, or had made recommendations that resulted in the Fidelity funds taking, a number of actions over the previous year that benefited particular funds, including (i) continuing to dedicate additional resources to investment research and support of the senior management team that oversees asset management; (ii) rationalizing product lines through the mergers of six funds into other funds; (iii) continuing to migrate the Freedom Funds to dedicated lower cost underlying funds; (iv) obtaining shareholder approval to broaden the investment strategies for Fidelity Consumer Finance Portfolio, Fidelity Emerging Asia Fund, and Fidelity Environment and Alternative Energy Portfolio; (v) contractually agreeing to reduce the management fees and impose other expense limitations on Spartan 500 Index Fund and U.S. Bond Index Fund in connection with launching new institutional classes of these funds; (vi) changing the name, primary and supplemental benchmarks, and investment policies of Fidelity Global Strategies Fund to support the fund's flexible investment mandate and global orientation; and (vii) reducing the transfer agency account fee rates on certain accounts.
Investment Performance. The Board considered whether the fund has operated in accordance with its investment objective, as well as its record of compliance with its investment restrictions. It also reviewed the fund's absolute investment performance for the retail class, as well as the fund's relative investment performance for the retail class measured over multiple periods against (i) a broad-based securities market index, and (ii) a peer group of mutual funds deemed appropriate by Fidelity and reviewed by the Board. The following charts considered by the Board show, over the one-, three-, and five-year periods ended December 31, 2010, the cumulative total returns of the retail class of the fund, the cumulative total returns of a broad-based securities market index ("benchmark"), and a range of cumulative total returns of a peer group of mutual funds identified by Lipper, Inc. as having an investment objective similar to that of the fund. (The Advisor classes of the fund had less than one year of performance as of December 31, 2010.)
The box within each chart shows the 25th percentile return (bottom of box) and the 75th percentile return (top of box) of the peer group. Returns shown above the box are in the first quartile and returns shown below the box are in the fourth quartile. The percentage beaten numbers noted below each chart correspond to the percentile box and represent the percentage of funds in the peer group whose performance was equal to or lower than that of the fund or class indicated.
Fidelity Japan Fund

The Board reviewed the fund's relative investment performance against its peer group and noted that the performance of the retail class of the fund was in the third quartile for the one- and three-year periods and the second quartile for the five-year period. The Board also noted that the investment performance of the fund was lower than its benchmark for all the periods shown. The Board discussed with FMR actions that have been taken by FMR to improve the fund's disappointing performance relative to its peer group and benchmark. The Board also reviewed the fund's performance since inception as well as performance in the current year. The Board will continue to closely monitor the performance of the fund in the coming year and discuss with FMR other appropriate actions to address the performance of the fund.
The Board also considered that the fund's management fee is subject to upward or downward adjustment depending upon whether, and to what extent, the fund's investment performance for the performance period exceeds, or is exceeded by, the record (over the same period) of a Board-approved performance adjustment index. The Board noted that the performance adjustment provides FMR with a strong economic incentive to seek to achieve superior performance for the fund's shareholders and helps to more closely align the interests of FMR and the fund's shareholders.
Annual Report
Board Approval of Investment Advisory Contracts and Management Fees - continued
Based on its review, the Board concluded that the nature, extent, and quality of services provided to the fund under the Advisory Contracts should benefit the fund's shareholders.
Competitiveness of Management Fee and Total Expense Ratio. The Board considered the fund's management fee and total expense ratio compared to "mapped groups" of competitive funds and classes. Fidelity creates "mapped groups" by combining similar Lipper investment objective categories that have comparable management fee characteristics. Combining Lipper investment objective categories aids the Board's management fee and total expense ratio comparisons by broadening the competitive group used for comparison and by reducing the number of universes to which various Fidelity funds are compared.
Management Fee. The Board considered two proprietary management fee comparisons for the 12-month periods shown in the chart below. The group of Lipper funds used by the Board for management fee comparisons is referred to below as the "Total Mapped Group." The Total Mapped Group is broader than the Lipper peer group used by the Board for performance comparisons because the Total Mapped Group combines several Lipper investment objective categories while the Lipper peer group does not. The Total Mapped Group comparison focuses on a fund's standing relative to the total universe of comparable funds available to investors in terms of gross management fees before expense reimbursements or caps, and without giving effect to the fund's performance adjustment. "TMG %" represents the percentage of funds in the Total Mapped Group that had management fees that were lower than the fund's. For example, a TMG % of 16% means that 84% of the funds in the Total Mapped Group had higher management fees than the fund. The "Asset-Size Peer Group" (ASPG) comparison focuses on a fund's standing relative to non-Fidelity funds similar in size to the fund within the Total Mapped Group. The ASPG represents at least 15% of the funds in the Total Mapped Group with comparable asset size and management fee characteristics, subject to a minimum of 50 funds (or all funds in the Total Mapped Group if fewer than 50). Additional information, such as the ASPG quartile in which the fund's management fee ranked and the impact of the fund's performance adjustment, is also included in the chart and considered by the Board.
Fidelity Japan Fund

The Board noted that the fund's management fee ranked below the median of its Total Mapped Group and below the median of its ASPG for 2010. The Board also noted the effect of the fund's negative performance adjustment on the fund's management fee ranking. The Board noted that the performance adjustment for each year represents calculations for performance periods that differ from the periods shown in the performance charts above.
Based on its review, the Board concluded that the fund's management fee is fair and reasonable in light of the services that the fund receives and the other factors considered.
Total Expense Ratio. In its review of each class's total expense ratio, the Board considered the fund's management fee as well as other fund or class expenses, as applicable, such as transfer agent fees, pricing and bookkeeping fees, fund-paid 12b-1 fees, and custodial, legal, and audit fees. The Board also noted the effects of any waivers and reimbursements on fees and expenses, as well as the impact of the fund's performance adjustment. As part of its review, the Board also considered the current and historical total expense ratios of each class of the fund compared to competitive fund median expenses. Each class of the fund is compared to those funds and classes in the Total Mapped Group (used by the Board for management fee comparisons) that have a similar sales load structure.
Annual Report
The Board noted that the total expense ratio of each class ranked below its competitive median for the period. The Board considered that various factors, including 12b-1 fees, positive or negative performance adjustments, and relatively higher other expenses in the case of small fund size, can affect total expense ratios.
Fees Charged to Other Fidelity Clients. The Board also considered Fidelity fee structures and other information with respect to clients of FMR and its affiliates, such as other mutual funds advised or subadvised by FMR or its affiliates, pension plan clients, and other institutional clients. In March 2010, the Board created an ad hoc joint committee with the board of other Fidelity funds (the Committee) to review and compare Fidelity's institutional investment advisory business with its business of providing services to the Fidelity funds, including the differences in services provided, fees charged, and costs incurred, as well as competition in their respective marketplaces.
Based on its review of total expense ratios and fees charged to other Fidelity clients, the Board concluded that the total expense ratio of each class of the fund was reasonable in light of the services that the fund and its shareholders receive and the other factors considered, including the findings of the Committee.
Costs of the Services and Profitability. The Board considered the revenues earned and the expenses incurred by Fidelity in conducting the business of developing, marketing, distributing, managing, administering and servicing the fund and its shareholders. The Board also considered the level of Fidelity's profits in respect of all the Fidelity funds.
On an annual basis, FMR presents to the Board Fidelity's profitability for the fund. Fidelity calculates the profitability for each fund, as well as aggregate profitability for groups of Fidelity funds and all Fidelity funds, using a series of detailed revenue and cost allocation methodologies which originate with the books and records of Fidelity on which Fidelity's audited financial statements are based. The Audit Committee of the Board reviews any significant changes from the prior year's methodologies.
PricewaterhouseCoopers LLP (PwC), independent registered public accounting firm and auditor to Fidelity and certain Fidelity funds, has been engaged annually by the Board as part of the Board's assessment of Fidelity's profitability analysis. PwC's engagement includes the review and assessment of Fidelity's methodologies used in determining the revenues and expenses attributable to Fidelity's mutual fund business, and completion of agreed-upon procedures surrounding the mathematical accuracy of fund profitability and its conformity to allocation methodologies. After considering PwC's reports issued under the engagement and information provided by Fidelity, the Board concluded that while other allocation methods may also be reasonable, Fidelity's profitability methodologies are reasonable in all material respects.
The Board also reviewed Fidelity's non-fund businesses and fall-out benefits related to the mutual fund business as well as cases where Fidelity's affiliates may benefit from or be related to the fund's business.
The Board considered the costs of the services provided by and the profits realized by Fidelity in connection with the operation of the fund and was satisfied that the profitability was not excessive in the circumstances.
Economies of Scale. The Board considered whether there have been economies of scale in respect of the management of the Fidelity funds, whether the Fidelity funds (including the fund) have appropriately benefited from any such economies of scale, and whether there is potential for realization of any further economies of scale. The Board considered the extent to which the fund will benefit from economies of scale through increased services to the fund, through waivers or reimbursements, or through fee or expense reductions. The Board also noted that in 2009, it and the board of other Fidelity funds created an ad hoc committee (the Economies of Scale Committee) to analyze whether FMR attains economies of scale in respect of the management and servicing of the Fidelity funds, whether the Fidelity funds have appropriately benefited from such economies of scale, and whether there is potential for realization of any further economies of scale.
The Board recognized that the fund's management contract incorporates a "group fee" structure, which provides for lower group fee rates as total fund assets under FMR's management increase, and for higher group fee rates as total fund assets under FMR's management decrease. FMR calculates the group fee rates based on a tiered asset "breakpoint" schedule that varies based on asset class. The Board considered that the group fee is designed to deliver the benefits of economies of scale to fund shareholders when total Fidelity fund assets increase, even if assets of any particular fund are unchanged or have declined, because some portion of Fidelity's costs are attributable to services provided to all Fidelity funds, and all funds benefit if those costs can be allocated among more assets. The Board concluded that, given the group fee structure, fund shareholders will benefit from lower management fees as assets under FMR's management increase at the fund complex level, regardless of whether Fidelity achieves any such economies of scale.
The Board concluded, taking into account the analysis of the Economies of Scale Committee, that any potential economies of scale are being appropriately shared between fund shareholders and Fidelity.
Additional Information Requested by the Board. In order to develop fully the factual basis for consideration of the Fidelity funds' Advisory Contracts, the Board requested and received additional information on certain topics, including (i) fund performance trends, actions to be taken by FMR to improve certain funds' overall performance, and Fidelity's long-term strategies for certain funds; (ii) portfolio manager changes that have occurred during the past year and length of portfolio manager tenure for different categories of funds over time; (iii) Fidelity's compensation structure for portfolio managers and other key personnel and strategies for attracting and retaining non-investment personnel; (iv) the amount of the investment that each portfolio manager has made in the Fidelity fund(s) that he or she manages; (v) historical trends in Fidelity's realization of fall-out benefits; (vi) Fidelity's group fee structures and the rationale for the individual fee rates of certain funds; (vii) fund profitability methodology and the impact of certain factors on fund profitability results; (viii) trends regarding industry use of performance fee structures and Fidelity's compliance practices with respect to performance adjustment calculations; (ix) the fee structures in place for certain other Fidelity clients; and (x) explanations regarding the relative total expense ratios of certain funds and classes, total expense competitive trends, and actions that might be taken by FMR to reduce total expense ratios for certain funds and classes.
Annual Report
Board Approval of Investment Advisory Contracts and Management Fees - continued
Based on its evaluation of all of the conclusions noted above, and after considering all factors it believed relevant, the Board ultimately concluded that the advisory fee structures are fair and reasonable, and that the fund's Advisory Contracts should be renewed.
Annual Report
Annual Report
Investment Adviser
Fidelity Management & Research Company
Boston, MA
Investment Sub-Advisers
FMR Co., Inc.
Fidelity Management & Research
(U.K.) Inc.
Fidelity Management & Research
(Hong Kong) Limited
Fidelity Management & Research
(Japan) Inc.
FIL Investment Advisors
FIL Investments (Japan) Limited
FIL Investment Advisors (UK) Limited
General Distributor
Fidelity Distributors Corporation
Boston, MA
Transfer and Service Agents
Fidelity Investments Institutional Operations Company, Inc.
Boston, MA
Fidelity Service Company, Inc.
Boston, MA
Custodian
JPMorgan Chase Bank
New York, NY

AJPNI-UANN-1211
1.917380.100
Fidelity Advisor®
Latin America Fund -
Class A, Class T, Class B and Class C
Annual Report
October 31, 2011
Class A, Class T, Class B, and Class C are
classes of Fidelity® Latin America Fund
Contents
Chairman's Message | (Click Here) | The Chairman's message to shareholders. |
Performance | (Click Here) | How the fund has done over time. |
Management's Discussion of Fund Performance | (Click Here) | The Portfolio Manager's review of fund performance and strategy. |
Shareholder Expense Example | (Click Here) | An example of shareholder expenses. |
Investment Changes | (Click Here) | A summary of major shifts in the fund's investments over the past six months. |
Investments | (Click Here) | A complete list of the fund's investments with their market values. |
Financial Statements | (Click Here) | Statements of assets and liabilities, operations, and changes in net assets, as well as financial highlights. |
Notes | (Click Here) | Notes to the financial statements. |
Report of Independent Registered Public Accounting Firm | (Click Here) | |
Trustees and Officers | (Click Here) | |
Distributions | (Click Here) | |
Board Approval of Investment Advisory Contracts and Management Fees | (Click Here) | |
To view a fund's proxy voting guidelines and proxy voting record for the 12-month period ended June 30, visit http://www.fidelity.com/proxyvotingresults or visit the Securities and Exchange Commission's (SEC) web site at http://www.sec.gov. You may also call 1-877-208-0098 to request a free copy of the proxy voting guidelines.
Standard & Poor's, S&P and S&P 500 are registered service marks of The McGraw-Hill Companies, Inc. and have been licensed for use by Fidelity Distributors Corporation.
Other third party marks appearing herein are the property of their respective owners.
All other marks appearing herein are registered or unregistered trademarks or service marks of FMR LLC or an affiliated company.
This report and the financial statements contained herein are submitted for the general information of the shareholders of the fund. This report is not authorized for distribution to prospective investors in the fund unless preceded or accompanied by an effective prospectus.
A fund files its complete schedule of portfolio holdings with the SEC for the first and third quarters of each fiscal year on Form N-Q. Forms N-Q are available on the SEC's web site at http://www.sec.gov. A fund's Forms N-Q may be reviewed and copied at the SEC's Public Reference Room in Washington, DC. Information regarding the operation of the SEC's Public Reference Room may be obtained by calling 1-800-SEC-0330. For a complete list of a fund's portfolio holdings, view each fund's most recent holdings listing, semiannual report, or annual report on Fidelity's web site at http://www.fidelity.com, http://www.advisor.fidelity.com, or http://www.401k.com, as applicable.
NOT FDIC INSURED • MAY LOSE VALUE • NO BANK GUARANTEE
Neither the fund nor Fidelity Distributors Corporation is a bank.
Annual Report
(The Acting Chairman's photo appears here.)
Dear Shareholder:
Global equity markets began the fourth quarter on a strong note, sharply reversing course in October amid strong corporate earnings, better-than-expected economic news and the promise of a resolution to the sovereign debt crisis in Europe. The mini rally followed a third quarter marked by a significant downturn in July and August, which heightened investor anxiety and set off a wave of volatility that hampered most major asset classes through the end of September. Financial markets are difficult to predict, of course, but you can help put the odds in your favor by following these time-tested investment principles.
One of the basic tenets is to invest according to your time horizon. For long-term investors, riding out the markets' inevitable ups and downs has proven much more effective than making decisions based on short-term developments. If your goal is approaching, you can also benefit from patience and restraint, rather than attempting to time the market. No matter your time horizon, missing only a few of the markets' best days can significantly diminish returns. Patience also affords the benefits of compounding - earning interest on additional income or reinvested dividends and capital gains. While staying the course doesn't eliminate risk, it can considerably lessen the negative impact of short-term downturns.
Asset allocation is another principle to manage risk. As you spread your portfolio among the asset classes, be sure to consider your time horizon, risk tolerance and investment objectives. Younger investors may be better served by emphasizing equities, which historically have been the best-performing asset class over time. Investors who are nearing a specific goal, such as retirement or sending a child to college, may choose to favor bonds and other investments that have tended to be more stable. Studies indicate that asset allocation is the single most important determinant of a portfolio's long-term success. After deciding on a suitable allocation strategy, make sure your portfolio is adequately diversified, with exposure to stocks of small-, mid- and large-cap companies in a range of sectors, for example. And today, more than ever, geographic diversification should be taken into account.
Lastly, investing a certain amount of money on a regular basis - a principle known as dollar-cost averaging - can help lower the average cost of your purchases, while also giving you the discipline to avoid selling weak performers just prior to an upswing, or chasing a hot performer just before a correction.
We invite you to learn more by visiting us on the Internet, dropping by one of our Investor Centers or calling us by phone. It is our privilege to provide the resources you need to choose investments that are right for you.
Sincerely,
(The Acting Chairman's signature appears here.)
James C. Curvey
Acting Chairman
Annual Report
Average annual total return reflects the change in the value of an investment, assuming reinvestment of the class' distributions from dividend income and capital gains (the profits earned upon the sale of securities that have grown in value, if any) and assuming a constant rate of performance each year. The $10,000 table and the fund's returns do not reflect the deduction of taxes that a shareholder would pay on fund distributions or the redemption of fund shares. During periods of reimbursement by Fidelity, a fund's total return will be greater than it would be had the reimbursement not occurred. How a fund did yesterday is no guarantee of how it will do tomorrow.
Average Annual Total Returns
Periods ended October 31, 2011 | Past 1
year | Past 5
years | Past 10
years |
Class A (incl. 5.75% sales charge ) A | -13.53% | 6.39% | 19.51% |
Class T (incl. 3.50% sales charge) B | -11.72% | 6.83% | 19.76% |
Class B (incl. contingent deferred sales charge) C | -13.49% | 7.18% | 20.12% |
Class C (incl. contingent deferred sales charge) D | -9.83% | 7.49% | 20.12% |
A Class A shares bear a 0.25% 12b-1 fee. The initial offering of Class A shares took place on September 28, 2010. Returns prior to September 28, 2010 are those of Fidelity® Latin America Fund, the original class of the fund, which has no 12b-1 fee. Had Class A's 12b-1 fee been reflected, returns prior to September 28, 2010, would have been lower.
B Class T shares bear a 0.50% 12b-1 fee. The initial offering of Class T shares took place on September 28, 2010. Returns prior to September 28, 2010 are those of Fidelity Latin America Fund, the original class of the fund, which has no 12b-1 fee. Had Class T's 12b-1 fee been reflected, returns prior to September 28, 2010, would have been lower.
C Class B shares bear a 1.00% 12b-1 fee. The initial offering of Class B shares took place on September 28, 2010. Returns prior to September 28, 2010 are those of Fidelity Latin America Fund, the original class of the fund, which has no 12b-1 fee. Had Class B's 12b-1 fee been reflected, returns prior to September 28, 2010, would have been lower. Class B shares' contingent deferred sales charges included in the past one year, past five years, and past ten years total return figures are 5%, 2%, and 0%, respectively.
D Class C shares bear a 1.00% 12b-1 fee. The initial offering of Class C shares took place on September 28, 2010. Returns prior to September 28, 2010 are those of Fidelity Latin America Fund, the original class of the fund, which has no 12b-1 fee. Had Class C's 12b-1 fee been reflected, returns prior to September 28, 2010, would have been lower. Class C shares' contingent deferred sales charges included in the past one year, past five years, and past ten years total return figures are 1%, 0%, and 0%, respectively.
$10,000 Over 10 Years
Let's say hypothetically that $10,000 was invested in Fidelity Advisor® Latin America Fund - Class A on October 31, 2001, and the current 5.75% sales charge was paid. The chart shows how the value of your investment would have changed, and also shows how the MSCI® EM (Emerging Markets) Latin America Index performed over the same period. The initial offering of Class A took place on September 28, 2010. See above for additional information regarding the performance of Class A.
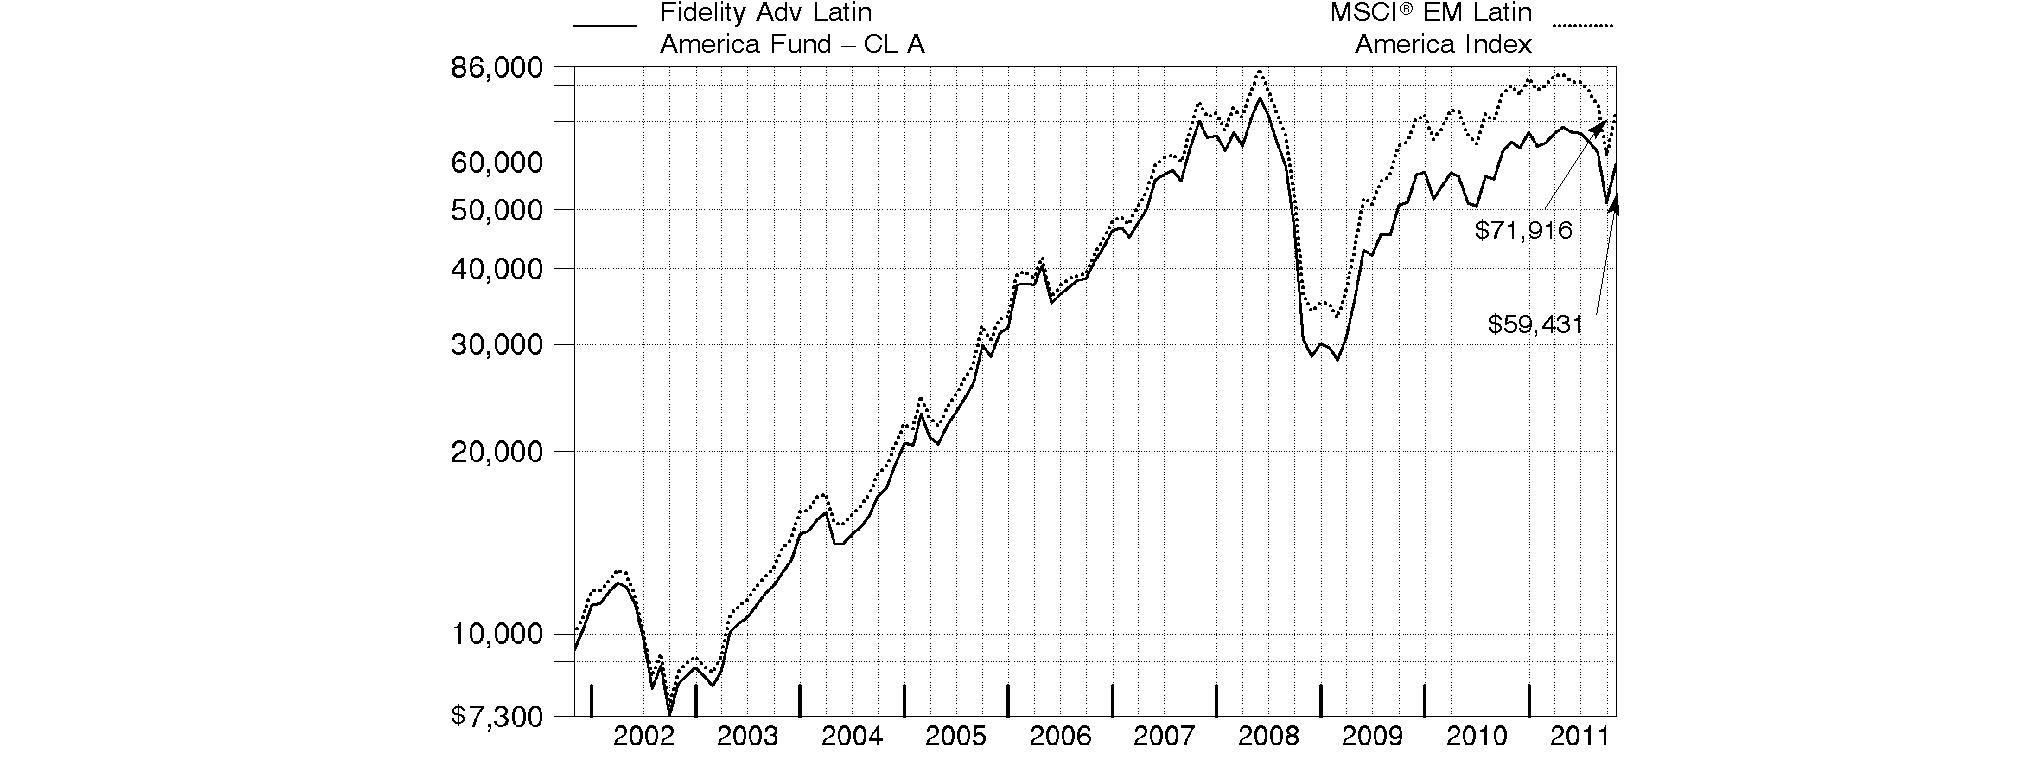
Annual Report
Market Recap: Emerging-markets stocks concluded the 12-month period ending October 31, 2011, on a strong note, reversing direction in October amid hope for a resolution to the sovereign debt crisis in Europe. The brief rally, on top of a robust first half of the period, could only partially offset the negative impact of a five-month downturn that began in May and intensified in August and September, as investors began to flee riskier securities due to the debt debacle, concern the U.S. economy may contract and worry about a significant slowdown in China. For the year, the MSCI® Emerging Markets Index declined 7.44%, hampered in part by global currency fluctuation. The index gained roughly 13% in October, after falling 9% in August and about 15% in September. For the full year, returns across the individual country components of the emerging-markets index were decidedly negative. Several of the largest countries in the index struggled, especially India (-20%), China (-17%) and Brazil (-12%), as did Turkey (-34%). Conversely, South Korea had the strongest result, gaining about 7%, while another sizable index component, Russia, returned roughly 1%. Smaller constituents Indonesia (+5%) and Malaysia (+4%) also finished in positive territory. A trio of countries had negative returns but outpaced the index: Mexico (-1%), Taiwan (-2%) and South Africa (-3%).
Comments from Adam Kutas, Portfolio Manager of Fidelity Advisor® Latin America Fund: For the year, the fund's Class A, Class T, Class B and Class C shares returned -8.26%, -8.52%, -8.96% and -8.93%, respectively (excluding sales charges), outperforming the -10.27% return of the MSCI® EM (Emerging Markets) Latin America Index. The fund benefited from strong market selection in telecommunication services and from overweighting consumer staples, particularly in the food, beverage and tobacco industry. Geographically, we were helped by very strong stock selection in Brazil. The top individual contributors all came from that country: telecom companies TIM Participacoes and Vivo Participacoes, the latter of which was no longer held at period end; tobacco company Souza Cruz and beverage distributor Bebidas das Americas; electric power producer AES Tiete; and not owning steel company and underperforming index component Siderurgica Nacional. Conversely, unfavorable security selection in the consumer discretionary sector hurt - although this was offset somewhat by underweighting this lagging group - particularly in consumer durables/apparel. Underweighting information technology also detracted. Weak market positioning in Mexico and the underperformance of our Chilean holdings proved problematic. Individual detractors included untimely ownership of beverage company Fomento Economico Mexicano; not owning outperforming index component and electronics retailer Grupo Elektra; underweighting two index heavyweights from Brazil - integrated oil company Petroleo Brasileiro (Petrobras) and iron ore producer Vale; and our investment in Chilean iron and steel manufacturer CAP.
Note to shareholders: Fidelity Advisor Latin America Fund may invest up to 35% of its total assets in any industry that represents more than 20% of the Latin American market. As of October 31, 2011, the fund did not have more than 25% of its total assets in any one industry.
The views expressed above reflect those of the portfolio manager(s) only through the end of the period as stated on the cover of this report and do not necessarily represent the views of Fidelity or any other person in the Fidelity organization. Any such views are subject to change at any time based upon market or other conditions and Fidelity disclaims any responsibility to update such views. These views may not be relied on as investment advice and, because investment decisions for a Fidelity fund are based on numerous factors, may not be relied on as an indication of trading intent on behalf of any Fidelity fund.
Annual Report
Fidelity Latin America Fund
As a shareholder of the Fund, you incur two types of costs: (1) transaction costs, including sales charges (loads) on purchase payments or redemption proceeds, redemption fees, and (2) ongoing costs, including management fees, distribution and/or service (12b-1) fees and other Fund expenses. This Example is intended to help you understand your ongoing costs (in dollars) of investing in the Fund and to compare these costs with the ongoing costs of investing in other mutual funds.
The Example is based on an investment of $1,000 invested at the beginning of the period and held for the entire period (May 1, 2011 to October 31, 2011).
Actual Expenses
The first line of the accompanying table for each class of the Fund provides information about actual account values and actual expenses. You may use the information in this line, together with the amount you invested, to estimate the expenses that you paid over the period. Simply divide your account value by $1,000.00 (for example, an $8,600 account value divided by $1,000.00 = 8.6), then multiply the result by the number in the first line for a class of the Fund under the heading entitled "Expenses Paid During Period" to estimate the expenses you paid on your account during this period. A small balance maintenance fee of $12.00 that is charged once a year may apply for certain accounts with a value of less than $2,000. This fee is not included in the table below. If it was, the estimate of expenses you paid during the period would be higher, and your ending account value lower, by this amount. In addition, the Fund, as a shareholder in the underlying Fidelity Central Funds, will indirectly bear its pro-rata share of the fees and expenses incurred by the underlying Fidelity Central Funds. These fees and expenses are not included in the Fund's annualized expense ratio used to calculate the expense estimate in the table below.
Hypothetical Example for Comparison Purposes
The second line of the accompanying table for each class of the Fund provides information about hypothetical account values and hypothetical expenses based on a Class' actual expense ratio and an assumed rate of return of 5% per year before expenses, which is not the Class' actual return. The hypothetical account values and expenses may not be used to estimate the actual ending account balance or expenses you paid for the period. You may use this information to compare the ongoing costs of investing in the Fund and other funds. To do so, compare this 5% hypothetical example with the 5% hypothetical examples that appear in the shareholder reports of the other funds. A small balance maintenance fee of $12.00 that is charged once a year may apply for certain accounts with a value of less than $2,000. This fee is not included in the table below. If it was, the estimate of expenses you paid during the period would be higher, and your ending account value lower, by this amount. In addition, the Fund, as a shareholder in the underlying Fidelity Central Funds, will indirectly bear its pro-rata share of the fees and expenses incurred by the underlying Fidelity Central Funds. These fees and expenses are not included in the Fund's annualized expense ratio used to calculate the expense estimate in the table below.
Please note that the expenses shown in the table are meant to highlight your ongoing costs only and do not reflect any transaction costs. Therefore, the second line of the table is useful in comparing ongoing costs only, and will not help you determine the relative total costs of owning different funds. In addition, if these transactional costs were included, your costs would have been higher.
| Annualized
Expense Ratio | Beginning
Account Value
May 1, 2011 | Ending
Account Value
October 31, 2011 | Expenses Paid
During Period*
May 1, 2011 to
October 31, 2011 |
Class A | 1.34% | | | |
Actual | | $ 1,000.00 | $ 869.80 | $ 6.32 |
HypotheticalA | | $ 1,000.00 | $ 1,018.45 | $ 6.82 |
Class T | 1.60% | | | |
Actual | | $ 1,000.00 | $ 868.70 | $ 7.54 |
HypotheticalA | | $ 1,000.00 | $ 1,017.14 | $ 8.13 |
Class B | 2.09% | | | |
Actual | | $ 1,000.00 | $ 866.70 | $ 9.83 |
HypotheticalA | | $ 1,000.00 | $ 1,014.67 | $ 10.61 |
Class C | 2.08% | | | |
Actual | | $ 1,000.00 | $ 866.60 | $ 9.79 |
HypotheticalA | | $ 1,000.00 | $ 1,014.72 | $ 10.56 |
Latin America | 1.00% | | | |
Actual | | $ 1,000.00 | $ 871.20 | $ 4.72 |
HypotheticalA | | $ 1,000.00 | $ 1,020.16 | $ 5.09 |
Institutional Class | 1.03% | | | |
Actual | | $ 1,000.00 | $ 871.10 | $ 4.86 |
HypotheticalA | | $ 1,000.00 | $ 1,020.01 | $ 5.24 |
A 5% return per year before expenses
* Expenses are equal to each Class' annualized expense ratio, multiplied by the average account value over the period, multiplied by 184/365 (to reflect the one-half year period).
Annual Report
Fidelity Latin America Fund
Investment Changes (Unaudited)
Geographic Diversification (% of fund's net assets) |
As of October 31, 2011 |
 | Brazil | 56.9% | |
 | Mexico | 19.5% | |
 | Chile | 12.4% | |
 | Colombia | 3.6% | |
 | United States of America | 2.8% | |
 | Peru | 2.3% | |
 | Luxembourg | 1.4% | |
 | Canada | 0.8% | |
 | Norway | 0.3% | |

Percentages are adjusted for the effect of futures contracts, if applicable. |
As of April 30, 2011 |
| Brazil | 60.1% | |
| Mexico | 17.7% | |
| Chile | 12.9% | |
| United States of America | 3.0% | |
| Colombia | 2.7% | |
| Peru | 1.7% | |
 | Luxembourg | 1.3% | |
| Canada | 0.6% | |

Percentages are adjusted for the effect of futures contracts, if applicable. |
Asset Allocation |
| % of fund's
net assets | % of fund's net assets
6 months ago |
Stocks | 98.0 | 98.4 |
Short-Term Investments and Net Other Assets | 2.0 | 1.6 |
Top Ten Stocks as of October 31, 2011 |
| % of fund's
net assets | % of fund's net assets
6 months ago |
America Movil SAB de CV Series L (Mexico, Wireless Telecommunication Services) | 9.2 | 8.3 |
Itau Unibanco Banco Multiplo SA (Brazil, Commercial Banks) | 8.5 | 8.5 |
Vale SA (PN-A) (Brazil, Metals & Mining) | 5.4 | 5.8 |
Companhia de Bebidas das Americas (AmBev) (PN) sponsored ADR (Brazil, Beverages) | 4.6 | 4.5 |
Wal-Mart de Mexico SA de CV Series V (Mexico, Food & Staples Retailing) | 4.6 | 4.6 |
Petroleo Brasileiro SA - Petrobras sponsored ADR (Brazil, Oil, Gas & Consumable Fuels) | 3.8 | 4.7 |
Petroleo Brasileiro SA - Petrobras (PN) (non-vtg.) (Brazil, Oil, Gas & Consumable Fuels) | 3.6 | 3.5 |
CAP SA (Chile, Metals & Mining) | 3.4 | 3.5 |
Banco Bradesco SA (PN) (Brazil, Commercial Banks) | 3.0 | 3.5 |
Vale SA sponsored ADR (Brazil, Metals & Mining) | 2.7 | 3.4 |
| 48.8 | |
Market Sectors as of October 31, 2011 |
| % of fund's
net assets | % of fund's net assets
6 months ago |
Consumer Staples | 18.4 | 19.5 |
Materials | 18.0 | 17.9 |
Financials | 17.9 | 18.4 |
Telecommunication Services | 16.1 | 14.4 |
Energy | 12.9 | 15.1 |
Utilities | 7.1 | 6.6 |
Industrials | 4.3 | 3.5 |
Consumer Discretionary | 3.2 | 3.0 |
Health Care | 0.1 | 0.0 |
Annual Report
Fidelity Latin America Fund
Investments October 31, 2011
Showing Percentage of Net Assets
Common Stocks - 98.0% |
| Shares | | Value |
Brazil - 56.9% |
AES Tiete SA (PN) (non-vtg.) | 4,965,445 | | $ 70,757,302 |
Banco Bradesco SA: | | | |
(PN) | 3,184,616 | | 57,583,465 |
(PN) sponsored ADR | 1,774,697 | | 32,299,485 |
Brasil Foods SA | 1,040,200 | | 21,655,690 |
Brasil Insurance Participacoes e Administracao SA | 780,000 | | 7,494,759 |
Braskem SA Class A sponsored ADR | 286,200 | | 5,163,048 |
Brookfield Incorporacoes SA | 5,954,800 | | 22,887,072 |
Companhia de Bebidas das Americas (AmBev): | | | |
(PN) sponsored ADR | 4,151,130 | | 139,976,104 |
sponsored ADR | 341,225 | | 9,189,189 |
Companhia de Concessoes Rodoviarias | 1,623,600 | | 44,674,528 |
CPFL Energia SA sponsored ADR (d) | 1,366,799 | | 35,523,106 |
Eletropaulo Metropolitana SA (PN-B) | 1,220,220 | | 21,886,080 |
Itau Unibanco Banco Multiplo SA | 3,470,631 | | 66,150,566 |
Itau Unibanco Banco Multiplo SA sponsored ADR | 10,085,003 | | 192,825,257 |
Itausa-Investimentos Itau SA (PN) | 4,827,500 | | 30,221,072 |
Light SA | 1,068,500 | | 16,644,756 |
Lojas Americanas SA (PN) | 3,561,037 | | 31,313,568 |
Lupatech SA (a) | 981,100 | | 5,142,034 |
Multiplus SA | 1,777,500 | | 30,018,344 |
OGX Petroleo e Gas Participacoes SA (a) | 1,674,600 | | 13,847,729 |
Petroleo Brasileiro SA - Petrobras: | | | |
(ON) | 908,128 | | 12,205,680 |
(PN) (non-vtg.) | 8,786,971 | | 109,095,168 |
(PN) sponsored ADR (d) | 2,847,161 | | 72,004,702 |
sponsored ADR | 4,254,220 | | 114,906,482 |
Souza Cruz Industria Comerico | 5,964,700 | | 73,151,981 |
TAM SA (PN) sponsored ADR (ltd. vtg.) (d) | 2,494,846 | | 50,121,456 |
Telefonica Brasil SA | 1,210,613 | | 35,214,372 |
Telefonica Brasil SA sponsored ADR (a) | 1,428,583 | | 41,457,479 |
TIM Participacoes SA | 5,577,495 | | 28,842,392 |
TIM Participacoes SA sponsored ADR (d) | 1,553,224 | | 40,445,953 |
Tractebel Energia SA | 776,000 | | 12,427,207 |
Usinas Siderurgicas de Minas Gerais SA - Usiminas | 1,684,750 | | 24,184,188 |
Usinas Siderurgicas de Minas Gerais SA - Usiminas (PN-A) (non-vtg.) | 3,539,400 | | 24,321,523 |
Vale SA: | | | |
(PN-A) | 1,755,200 | | 41,702,865 |
(PN-A) sponsored ADR | 5,163,929 | | 121,868,724 |
sponsored ADR | 3,257,362 | | 82,769,568 |
TOTAL BRAZIL | | 1,739,972,894 |
|
| Shares | | Value |
Canada - 0.8% |
Petrominerales Ltd. | 655,300 | | $ 17,288,850 |
Silver Standard Resources, Inc. (a) | 372,300 | | 7,293,360 |
TOTAL CANADA | | 24,582,210 |
Chile - 12.4% |
Banco Santander Chile sponsored ADR (d) | 995,186 | | 81,286,792 |
CAP SA | 2,723,464 | | 105,064,197 |
CFR Pharmaceuticals SA | 17,206,348 | | 4,073,756 |
Compania Cervecerias Unidas SA | 3,361,122 | | 38,073,744 |
Compania Cervecerias Unidas SA sponsored ADR (d) | 202,200 | | 11,582,016 |
Empresa Nacional de Electricidad SA | 5,333,893 | | 8,545,988 |
Empresa Nacional de Telecomunicaciones SA (ENTEL) | 1,795,610 | | 35,549,384 |
Enersis SA | 34,899,771 | | 14,167,907 |
Enersis SA sponsored ADR | 1,805,047 | | 35,433,073 |
SACI Falabella | 4,770,394 | | 44,787,870 |
TOTAL CHILE | | 378,564,727 |
Colombia - 3.6% |
BanColombia SA sponsored ADR (d) | 304,029 | | 18,965,329 |
Bolsa de Valores de Colombia | 576,460,285 | | 10,287,320 |
Ecopetrol SA | 25,394,899 | | 54,437,115 |
Empresa de Telecomunicaciones de Bogota | 34,198,589 | | 10,409,866 |
Grupo de Inversiones Surameric | 946,202 | | 16,621,929 |
Grupo de Inversiones Surameric rights 11/22/11 (a) | 275,614 | | 41,357 |
TOTAL COLOMBIA | | 110,762,916 |
Luxembourg - 1.4% |
Millicom International Cellular SA (depositary receipt) | 191,813 | | 21,139,134 |
Ternium SA sponsored ADR | 943,707 | | 23,158,570 |
TOTAL LUXEMBOURG | | 44,297,704 |
Mexico - 19.5% |
America Movil SAB de CV: | | | |
Series L | 5,073,400 | | 6,478,796 |
Series L sponsored ADR | 10,878,828 | | 276,539,807 |
Bolsa Mexicana de Valores SA de CV | 13,306,500 | | 21,757,681 |
Coca-Cola FEMSA SAB de CV sponsored ADR | 209,100 | | 18,724,905 |
Compartamos SAB de CV | 7,429,600 | | 11,484,515 |
Fomento Economico Mexicano SAB de CV sponsored ADR | 289,400 | | 19,404,270 |
Grupo Comercial Chedraui de CV | 5,604,100 | | 13,492,602 |
Grupo Modelo SAB de CV Series C | 3,093,800 | | 19,624,041 |
Industrias Penoles SA de CV | 712,955 | | 28,689,693 |
Common Stocks - continued |
| Shares | | Value |
Mexico - continued |
Kimberly-Clark de Mexico SA de CV Series A | 6,939,600 | | $ 39,501,092 |
Wal-Mart de Mexico SA de CV Series V | 54,347,670 | | 140,396,567 |
TOTAL MEXICO | | 596,093,969 |
Norway - 0.3% |
Copeinca ASA (a) | 1,297,051 | | 8,410,005 |
Peru - 2.3% |
Alicorp SA Class C | 3,055,222 | | 6,772,326 |
Compania de Minas Buenaventura SA sponsored ADR | 1,582,600 | | 64,775,818 |
TOTAL PERU | | 71,548,144 |
United States of America - 0.8% |
Southern Copper Corp. | 812,400 | | 24,924,432 |
TOTAL COMMON STOCKS (Cost $1,609,339,679) | 2,999,157,001 |
Money Market Funds - 5.8% |
| Shares | | Value |
Fidelity Cash Central Fund, 0.12% (b) | 38,877,614 | | $ 38,877,614 |
Fidelity Securities Lending Cash Central Fund, 0.11% (b)(c) | 138,971,400 | | 138,971,400 |
TOTAL MONEY MARKET FUNDS (Cost $177,849,014) | 177,849,014 |
TOTAL INVESTMENT PORTFOLIO - 103.8% (Cost $1,787,188,693) | | 3,177,006,015 |
NET OTHER ASSETS (LIABILITIES) - (3.8)% | | (116,357,760) |
NET ASSETS - 100% | $ 3,060,648,255 |
Legend |
(a) Non-income producing |
(b) Affiliated fund that is available only to investment companies and other accounts managed by Fidelity Investments. The rate quoted is the annualized seven-day yield of the fund at period end. A complete unaudited listing of the fund's holdings as of its most recent quarter end is available upon request. In addition, each Fidelity Central Fund's financial statements, which are not covered by the Fund's Report of Independent Registered Public Accounting Firm, are available on the SEC's website or upon request. |
(c) Investment made with cash collateral received from securities on loan. |
(d) Security or a portion of the security is on loan at period end. |
Affiliated Central Funds |
Information regarding fiscal year to date income earned by the Fund from investments in Fidelity Central Funds is as follows: |
Fund | Income earned |
Fidelity Cash Central Fund | $ 45,797 |
Fidelity Securities Lending Cash Central Fund | 397,722 |
Total | $ 443,519 |
Other Information |
The following is a summary of the inputs used, as of October 31, 2011, involving the Fund's assets and liabilities carried at fair value. The inputs or methodology used for valuing securities may not be an indication of the risk associated with investing in those securities. For more information on valuation inputs, and their aggregation into the levels used in the table below, please refer to the Security Valuation section in the accompanying Notes to Financial Statements. |
Valuation Inputs at Reporting Date: |
Description | Total | Level 1 | Level 2 | Level 3 |
Investments in Securities: | | | | |
Equities: | | | | |
Brazil | $ 1,739,972,894 | $ 1,739,972,894 | $ - | $ - |
Mexico | 596,093,969 | 596,093,969 | - | - |
Chile | 378,564,727 | 378,564,727 | - | - |
Colombia | 110,762,916 | 110,721,559 | 41,357 | - |
Peru | 71,548,144 | 71,548,144 | - | - |
Luxembourg | 44,297,704 | 44,297,704 | - | - |
United States of America | 24,924,432 | 24,924,432 | - | - |
Canada | 24,582,210 | 24,582,210 | - | - |
Norway | 8,410,005 | 8,410,005 | - | - |
Money Market Funds | 177,849,014 | 177,849,014 | - | - |
Total Investments in Securities: | $ 3,177,006,015 | $ 3,176,964,658 | $ 41,357 | $ - |
Income Tax Information |
At October 31, 2011, the Fund had a capital loss carryforward of approximately $96,320,870 of which $22,463,155 and $73,857,715 will expire in fiscal 2016 and 2017, respectively. Capital loss carryforwards are only available to offset future capital gains of the Fund to the extent provided by regulations and may be limited. |
The capital loss carryforward expiring October 31, 2016 was acquired from Fidelity Advisor Latin America Fund. |
See accompanying notes which are an integral part of the financial statements.
Annual Report
Fidelity Latin America Fund
Statement of Assets and Liabilities
| October 31, 2011 |
| | |
Assets | | |
Investment in securities, at value (including securities loaned of $132,968,419) - See accompanying schedule: Unaffiliated issuers (cost $1,609,339,679) | $ 2,999,157,001 | |
Fidelity Central Funds (cost $177,849,014) | 177,849,014 | |
Total Investments (cost $1,787,188,693) | | $ 3,177,006,015 |
Foreign currency held at value (cost $12,549,606) | | 12,617,377 |
Receivable for investments sold | | 2,097,234 |
Receivable for fund shares sold | | 2,521,871 |
Dividends receivable | | 17,868,344 |
Distributions receivable from Fidelity Central Funds | | 19,346 |
Prepaid expenses | | 11,748 |
Other receivables | | 251,992 |
Total assets | | 3,212,393,927 |
| | |
Liabilities | | |
Payable for investments purchased | $ 5,902,112 | |
Payable for fund shares redeemed | 4,206,545 | |
Accrued management fee | 1,696,988 | |
Distribution and service plan fees payable | 65,704 | |
Other affiliated payables | 671,439 | |
Other payables and accrued expenses | 231,484 | |
Collateral on securities loaned, at value | 138,971,400 | |
Total liabilities | | 151,745,672 |
| | |
Net Assets | | $ 3,060,648,255 |
Net Assets consist of: | | |
Paid in capital | | $ 1,744,785,826 |
Undistributed net investment income | | 34,016,290 |
Accumulated undistributed net realized gain (loss) on investments and foreign currency transactions | | (108,069,810) |
Net unrealized appreciation (depreciation) on investments and assets and liabilities in foreign currencies | | 1,389,915,949 |
Net Assets | | $ 3,060,648,255 |
Statement of Assets and Liabilities - continued
| October 31, 2011 |
| | |
Calculation of Maximum Offering Price Class A:
Net Asset Value and redemption price per share ($91,406,884 ÷ 1,745,019 shares) | | $ 52.38 |
| | |
Maximum offering price per share (100/94.25 of $52.38) | | $ 55.58 |
Class T:
Net Asset Value and redemption price per share ($26,020,229 ÷ 497,850 shares) | | $ 52.27 |
| | |
Maximum offering price per share (100/96.50 of $52.27) | | $ 54.17 |
Class B:
Net Asset Value and offering price per share ($14,113,935 ÷ 271,135 shares)A | | $ 52.06 |
| | |
Class C:
Net Asset Value and offering price per share ($35,203,130 ÷ 676,369 shares)A | | $ 52.05 |
| | |
Latin America:
Net Asset Value, offering price and redemption price per share ($2,884,301,428 ÷ 54,955,792 shares) | | $ 52.48 |
| | |
Institutional Class:
Net Asset Value, offering price and redemption price per share ($9,602,649 ÷ 182,860 shares) | | $ 52.51 |
A Redemption price per share is equal to net asset value less any applicable contingent deferred sales charge.
See accompanying notes which are an integral part of the financial statements.
Annual Report
Fidelity Latin America Fund
Financial Statements - continued
Statement of Operations
| Year ended October 31, 2011 |
| | |
Investment Income | | |
Dividends | | $ 140,014,056 |
Interest | | 157 |
Income from Fidelity Central Funds | | 443,519 |
Income before foreign taxes withheld | | 140,457,732 |
Less foreign taxes withheld | | (10,432,951) |
Total income | | 130,024,781 |
| | |
Expenses | | |
Management fee | $ 27,173,065 | |
Transfer agent fees | 8,141,717 | |
Distribution and service plan fees | 1,039,278 | |
Accounting and security lending fees | 1,494,378 | |
Custodian fees and expenses | 1,577,432 | |
Independent trustees' compensation | 21,700 | |
Registration fees | 137,345 | |
Audit | 65,324 | |
Legal | 31,816 | |
Interest | 8,383 | |
Miscellaneous | 44,176 | |
Total expenses before reductions | 39,734,614 | |
Expense reductions | (84,041) | 39,650,573 |
Net investment income (loss) | | 90,374,208 |
Realized and Unrealized Gain (Loss) Net realized gain (loss) on: | | |
Investment securities: | | |
Unaffiliated issuers | 338,788,328 | |
Foreign currency transactions | (764,969) | |
Total net realized gain (loss) | | 338,023,359 |
Change in net unrealized appreciation (depreciation) on: Investment securities | (733,223,257) | |
Assets and liabilities in foreign currencies | 84,819 | |
Total change in net unrealized appreciation (depreciation) | | (733,138,438) |
Net gain (loss) | | (395,115,079) |
Net increase (decrease) in net assets resulting from operations | | $ (304,740,871) |
Statement of Changes in Net Assets
| Year ended
October 31,
2011 | Year ended
October 31,
2010 |
Increase (Decrease) in Net Assets | | |
Operations | | |
Net investment income (loss) | $ 90,374,208 | $ 87,692,165 |
Net realized gain (loss) | 338,023,359 | 293,510,668 |
Change in net unrealized appreciation (depreciation) | (733,138,438) | 519,183,458 |
Net increase (decrease) in net assets resulting from operations | (304,740,871) | 900,386,291 |
Distributions to shareholders from net investment income | (22,292,136) | (118,560,409) |
Distributions to shareholders from net realized gain | (15,707,585) | (33,986,366) |
Total distributions | (37,999,721) | (152,546,775) |
Share transactions - net increase (decrease) | (1,114,870,853) | (275,675,234) |
Redemption fees | 763,732 | 1,583,234 |
Total increase (decrease) in net assets | (1,456,847,713) | 473,747,516 |
| | |
Net Assets | | |
Beginning of period | 4,517,495,968 | 4,043,748,452 |
End of period (including undistributed net investment income of $34,016,290 and undistributed net investment income of $12,014,368, respectively) | $ 3,060,648,255 | $ 4,517,495,968 |
See accompanying notes which are an integral part of the financial statements.
Annual Report
Financial Highlights - Class A
Years ended October 31, | 2011 | 2010 H |
Selected Per-Share Data | | |
Net asset value, beginning of period | $ 57.48 | $ 55.47 |
Income from Investment Operations | | |
Net investment income (loss) E | 1.15 | .02 |
Net realized and unrealized gain (loss) | (5.87) | 2.79 |
Total from investment operations | (4.72) | 2.81 |
Distributions from net investment income | (.19) | (.80) |
Distributions from net realized gain | (.20) | - |
Total distributions | (.39) | (.80) |
Redemption fees added to paid in capital E | .01 | - K |
Net asset value, end of period | $ 52.38 | $ 57.48 |
Total Return B, C, D | (8.26)% | 5.14% |
Ratios to Average Net Assets F, I | | |
Expenses before reductions | 1.34% | 1.37% A |
Expenses net of fee waivers, if any | 1.34% | 1.37% A |
Expenses net of all reductions | 1.34% | 1.34% A |
Net investment income (loss) | 2.05% | .39% A |
Supplemental Data | | |
Net assets, end of period (000 omitted) | $ 91,407 | $ 115,626 |
Portfolio turnover rate G | 11% | 56% J |
A Annualized B Total returns for periods of less than one year are not annualized. C Total returns would have been lower if certain expenses had not been reduced during the applicable periods shown. D Total returns do not include the effect of the sales charges. E Calculated based on average shares outstanding during the period. F Fees and expenses of any underlying Fidelity Central Funds are not included in the Fund's expense ratio. The Fund indirectly bears its proportionate share of the expenses of any underlying Fidelity Central Funds. G Amount does not include the portfolio activity of any underlying Fidelity Central Funds. H For the period September 28, 2010 (commencement of sale of shares) to October 31, 2010. I Expense ratios reflect operating expenses of the class. Expenses before reductions do not reflect amounts reimbursed by the investment adviser or reductions from brokerage service arrangements or reductions from other expense offset arrangements and do not represent the amount paid by the class during periods when reimbursements or reductions occur. Expense ratios before reductions for start-up periods may not be representative of longer-term operating periods. Expenses net of fee waivers reflect expenses after reimbursement by the investment adviser but prior to reductions from brokerage service arrangements or other expense offset arrangements. Expenses net of all reductions represent the net expenses paid by the class. J The portfolio turnover rate does not include the assets acquired in the merger. K Amount represents less than $.01 per share. |
Financial Highlights - Class T
Years ended October 31, | 2011 | 2010 H |
Selected Per-Share Data | | |
Net asset value, beginning of period | $ 57.47 | $ 55.47 |
Income from Investment Operations | | |
Net investment income (loss) E | .99 | .01 |
Net realized and unrealized gain (loss) | (5.85) | 2.79 |
Total from investment operations | (4.86) | 2.80 |
Distributions from net investment income | (.15) | (.80) |
Distributions from net realized gain | (.20) | - |
Total distributions | (.35) | (.80) |
Redemption fees added to paid in capital E | .01 | - K |
Net asset value, end of period | $ 52.27 | $ 57.47 |
Total Return B, C, D | (8.50)% | 5.12% |
Ratios to Average Net Assets F, I | | |
Expenses before reductions | 1.61% | 1.63% A |
Expenses net of fee waivers, if any | 1.61% | 1.63% A |
Expenses net of all reductions | 1.61% | 1.60% A |
Net investment income (loss) | 1.78% | .13% A |
Supplemental Data | | |
Net assets, end of period (000 omitted) | $ 26,020 | $ 36,820 |
Portfolio turnover rate G | 11% | 56% J |
A Annualized B Total returns for periods of less than one year are not annualized. C Total returns would have been lower if certain expenses had not been reduced during the applicable periods shown. D Total returns do not include the effect of the sales charges. E Calculated based on average shares outstanding during the period. F Fees and expenses of any underlying Fidelity Central Funds are not included in the Fund's expense ratio. The Fund indirectly bears its proportionate share of the expenses of any underlying Fidelity Central Funds. G Amount does not include the portfolio activity of any underlying Fidelity Central Funds. H For the period September 28, 2010 (commencement of sale of shares) to October 31, 2010. I Expense ratios reflect operating expenses of the class. Expenses before reductions do not reflect amounts reimbursed by the investment adviser or reductions from brokerage service arrangements or reductions from other expense offset arrangements and do not represent the amount paid by the class during periods when reimbursements or reductions occur. Expense ratios before reductions for start-up periods may not be representative of longer-term operating periods. Expenses net of fee waivers reflect expenses after reimbursement by the investment adviser but prior to reductions from brokerage service arrangements or other expense offset arrangements. Expenses net of all reductions represent the net expenses paid by the class. J The portfolio turnover rate does not include the assets acquired in the merger. K Amount represents less than $.01 per share. |
See accompanying notes which are an integral part of the financial statements.
Annual Report
Financial Highlights - Class B
Years ended October 31, | 2011 | 2010 H |
Selected Per-Share Data | | |
Net asset value, beginning of period | $ 57.44 | $ 55.47 |
Income from Investment Operations | | |
Net investment income (loss) E | .72 | (.02) |
Net realized and unrealized gain (loss) | (5.84) | 2.79 |
Total from investment operations | (5.12) | 2.77 |
Distributions from net investment income | (.07) | (.80) |
Distributions from net realized gain | (.20) | - |
Total distributions | (.27) | (.80) |
Redemption fees added to paid in capital E | .01 | - K |
Net asset value, end of period | $ 52.06 | $ 57.44 |
Total Return B, C, D | (8.94)% | 5.06% |
Ratios to Average Net Assets F, I | | |
Expenses before reductions | 2.10% | 2.12% A |
Expenses net of fee waivers, if any | 2.10% | 2.12% A |
Expenses net of all reductions | 2.10% | 2.10% A |
Net investment income (loss) | 1.29% | (.36)% A |
Supplemental Data | | |
Net assets, end of period (000 omitted) | $ 14,114 | $ 20,392 |
Portfolio turnover rate G | 11% | 56% J |
A Annualized B Total returns for periods of less than one year are not annualized. C Total returns would have been lower if certain expenses had not been reduced during the applicable periods shown. D Total returns do not include the effect of the contingent deferred sales charge. E Calculated based on average shares outstanding during the period. F Fees and expenses of any underlying Fidelity Central Funds are not included in the Fund's expense ratio. The Fund indirectly bears its proportionate share of the expenses of any underlying Fidelity Central Funds. G Amount does not include the portfolio activity of any underlying Fidelity Central Funds. H For the period September 28, 2010 (commencement of sale of shares) to October 31, 2010. I Expense ratios reflect operating expenses of the class. Expenses before reductions do not reflect amounts reimbursed by the investment adviser or reductions from brokerage service arrangements or reductions from other expense offset arrangements and do not represent the amount paid by the class during periods when reimbursements or reductions occur. Expense ratios before reductions for start-up periods may not be representative of longer-term operating periods. Expenses net of fee waivers reflect expenses after reimbursement by the investment adviser but prior to reductions from brokerage service arrangements or other expense offset arrangements. Expenses net of all reductions represent the net expenses paid by the class. J The portfolio turnover rate does not include the assets acquired in the merger. K Amount represents less than $.01 per share. |
Financial Highlights - Class C
Years ended October 31, | 2011 | 2010 H |
Selected Per-Share Data | | |
Net asset value, beginning of period | $ 57.44 | $ 55.47 |
Income from Investment Operations | | |
Net investment income (loss) E | .73 | (.02) |
Net realized and unrealized gain (loss) | (5.84) | 2.79 |
Total from investment operations | (5.11) | 2.77 |
Distributions from net investment income | (.09) | (.80) |
Distributions from net realized gain | (.20) | - |
Total distributions | (.29) | (.80) |
Redemption fees added to paid in capital E | .01 | - K |
Net asset value, end of period | $ 52.05 | $ 57.44 |
Total Return B, C, D | (8.93)% | 5.06% |
Ratios to Average Net Assets F, I | | |
Expenses before reductions | 2.08% | 2.09% A |
Expenses net of fee waivers, if any | 2.08% | 2.09% A |
Expenses net of all reductions | 2.08% | 2.07% A |
Net investment income (loss) | 1.31% | (.34)% A |
Supplemental Data | | |
Net assets, end of period (000 omitted) | $ 35,203 | $ 48,329 |
Portfolio turnover rate G | 11% | 56% J |
A Annualized B Total returns for periods of less than one year are not annualized. C Total returns would have been lower if certain expenses had not been reduced during the applicable periods shown. D Total returns do not include the effect of the contingent deferred sales charge. E Calculated based on average shares outstanding during the period. F Fees and expenses of any underlying Fidelity Central Funds are not included in the Fund's expense ratio. The Fund indirectly bears its proportionate share of the expenses of any underlying Fidelity Central Funds. G Amount does not include the portfolio activity of any underlying Fidelity Central Funds. H For the period September 28, 2010 (commencement of sale of shares) to October 31, 2010. I Expense ratios reflect operating expenses of the class. Expenses before reductions do not reflect amounts reimbursed by the investment adviser or reductions from brokerage service arrangements or reductions from other expense offset arrangements and do not represent the amount paid by the class during periods when reimbursements or reductions occur. Expense ratios before reductions for start-up periods may not be representative of longer-term operating periods. Expenses net of fee waivers reflect expenses after reimbursement by the investment adviser but prior to reductions from brokerage service arrangements or other expense offset arrangements. Expenses net of all reductions represent the net expenses paid by the class. J The portfolio turnover rate does not include the assets acquired in the merger. K Amount represents less than $.01 per share. |
See accompanying notes which are an integral part of the financial statements.
Annual Report
Financial Highlights - Latin America
Years ended October 31, | 2011 | 2010 | 2009 | 2008 | 2007 |
Selected Per-Share Data | | | | | |
Net asset value, beginning of period | $ 57.50 | $ 47.29 | $ 28.69 | $ 67.90 | $ 41.13 |
Income from Investment Operations | | | | | |
Net investment income (loss) B | 1.34 | 1.07 | .72 | .83 | .68 |
Net realized and unrealized gain (loss) | (5.88) | 11.00 | 18.32 | (37.74) | 27.43 |
Total from investment operations | (4.54) | 12.07 | 19.04 | (36.91) | 28.11 |
Distributions from net investment income | (.29) | (1.49) | (.46) | (.65) | (.61) |
Distributions from net realized gain | (.20) | (.39) | - | (1.72) | (.77) |
Total distributions | (.49) | (1.88) | (.46) | (2.37) | (1.38) |
Redemption fees added to paid in capital B | .01 | .02 | .02 | .07 | .04 |
Net asset value, end of period | $ 52.48 | $ 57.50 | $ 47.29 | $ 28.69 | $ 67.90 |
Total Return A | (7.96)% | 25.91% | 67.88% | (56.20)% | 70.35% |
Ratios to Average Net Assets C, E | | | | | |
Expenses before reductions | 1.00% | 1.03% | 1.07% | 1.02% | 1.00% |
Expenses net of fee waivers, if any | 1.00% | 1.03% | 1.07% | 1.02% | 1.00% |
Expenses net of all reductions | 1.00% | 1.01% | 1.05% | 1.00% | .98% |
Net investment income (loss) | 2.39% | 2.10% | 2.04% | 1.41% | 1.33% |
Supplemental Data | | | | | |
Net assets, end of period (000 omitted) | $ 2,884,301 | $ 4,283,462 | $ 4,043,748 | $ 2,225,606 | $ 6,219,690 |
Portfolio turnover rate D | 11% | 56% F | 52% | 51% | 52% |
A Total returns would have been lower if certain expenses had not been reduced during the applicable periods shown. B Calculated based on average shares outstanding during the period. C Fees and expenses of any underlying Fidelity Central Funds are not included in the Fund's expense ratio. The Fund indirectly bears its proportionate share of the expenses of any underlying Fidelity Central Funds. D Amount does not include the portfolio activity of any underlying Fidelity Central Funds. E Expense ratios reflect operating expenses of the class. Expenses before reductions do not reflect amounts reimbursed by the investment adviser or reductions from brokerage service arrangements or reductions from other expense offset arrangements and do not represent the amount paid by the class during periods when reimbursements or reductions occur. Expenses net of fee waivers reflect expenses after reimbursement by the investment adviser but prior to reductions from brokerage service arrangements or other expense offset arrangements. Expenses net of all reductions represent the net expenses paid by the class. F The portfolio turnover rate does not include the assets acquired in the merger. |
Financial Highlights - Institutional Class
Years ended October 31, | 2011 | 2010 G |
Selected Per-Share Data | | |
Net asset value, beginning of period | $ 57.49 | $ 55.47 |
Income from Investment Operations | | |
Net investment income (loss) D | 1.32 | .03 |
Net realized and unrealized gain (loss) | (5.88) | 2.79 |
Total from investment operations | (4.56) | 2.82 |
Distributions from net investment income | (.23) | (.80) |
Distributions from net realized gain | (.20) | - |
Total distributions | (.43) | (.80) |
Redemption fees added to paid in capital D | .01 | - J |
Net asset value, end of period | $ 52.51 | $ 57.49 |
Total Return B, C | (7.98)% | 5.15% |
Ratios to Average Net Assets E, H | | |
Expenses before reductions | 1.04% | 1.08% A |
Expenses net of fee waivers, if any | 1.04% | 1.08% A |
Expenses net of all reductions | 1.04% | 1.06% A |
Net investment income (loss) | 2.35% | .68% A |
Supplemental Data | | |
Net assets, end of period (000 omitted) | $ 9,603 | $ 12,868 |
Portfolio turnover rate F | 11% | 56% I |
A Annualized B Total returns for periods of less than one year are not annualized. C Total returns would have been lower if certain expenses had not been reduced during the applicable periods shown. D Calculated based on average shares outstanding during the period. E Fees and expenses of any underlying Fidelity Central Funds are not included in the Fund's expense ratio. The Fund indirectly bears its proportionate share of the expenses of any underlying Fidelity Central Funds. F Amount does not include the portfolio activity of any underlying Fidelity Central Funds. G For the period September 28, 2010 (commencement of sale of shares) to October 31, 2010. H Expense ratios reflect operating expenses of the class. Expenses before reductions do not reflect amounts reimbursed by the investment adviser or reductions from brokerage service arrangements or reductions from other expense offset arrangements and do not represent the amount paid by the class during periods when reimbursements or reductions occur. Expense ratios before reductions for start-up periods may not be representative of longer-term operating periods. Expenses net of fee waivers reflect expenses after reimbursement by the investment adviser but prior to reductions from brokerage service arrangements or other expense offset arrangements. Expenses net of all reductions represent the net expenses paid by the class. I The portfolio turnover rate does not include the assets acquired in the merger. J Amount represents less than $.01 per share. |
See accompanying notes which are an integral part of the financial statements.
Annual Report
Notes to Financial Statements
For the period ended October 31, 2011
1. Organization.
Fidelity Latin America Fund (the Fund) is a non-diversified fund of Fidelity Investment Trust (the Trust) and is authorized to issue an unlimited number of shares. The Trust is registered under the Investment Company Act of 1940, as amended (the 1940 Act), as an open-end management investment company organized as a Massachusetts business trust. The Fund offers Class A, Class T, Class C, Latin America and Institutional Class shares, each of which, along with Class B shares, has equal rights as to assets and voting privileges. Effective after the close of business on September 1, 2010, Class B shares were closed to new accounts and additional purchases, except for exchanges and reinvestments by existing shareholders. Each class has exclusive voting rights with respect to matters that affect that class. Class B shares automatically convert to Class A shares after a holding period of seven years from the initial date of purchase. Investment income, realized and unrealized capital gains and losses, the common expenses of the Fund, and certain fund-level expense reductions, if any, are allocated on a pro-rata basis to each class based on the relative net assets of each class to the total net assets of the Fund. Each class differs with respect to transfer agent and distribution and service plan fees incurred. Certain expense reductions may also differ by class. The Fund's investments in emerging markets can be subject to social, economic, regulatory, and political uncertainties and can be extremely volatile.
2. Investments in Fidelity Central Funds.
The Fund invests in Fidelity Central Funds, which are open-end investment companies available only to other investment companies and accounts managed by Fidelity Management & Research Company (FMR) and its affiliates. The Fund's Schedule of Investments lists each of the Fidelity Central Funds held as of period end, if any, as an investment of the Fund, but does not include the underlying holdings of each Fidelity Central Fund. As an Investing Fund, the Fund indirectly bears its proportionate share of the expenses of the underlying Fidelity Central Funds.
The Money Market Central Funds seek preservation of capital and current income and are managed by Fidelity Investments Money Management, Inc. (FIMM), an affiliate of FMR.
A complete unaudited list of holdings for each Fidelity Central Fund is available upon request or at the Securities and Exchange Commission (the SEC) web site at www.sec.gov. In addition, the financial statements of the Fidelity Central Funds, which are not covered by the Fund's Report of Independent Registered Public Accounting Firm are available on the SEC web site or upon request.
3. Significant Accounting Policies.
The financial statements have been prepared in conformity with accounting principles generally accepted in the United States of America (GAAP), which require management to make certain estimates and assumptions at the date of the financial statements. Actual results could differ from those estimates. Subsequent events, if any, through the date that the financial statements were issued have been evaluated in the preparation of the financial statements. The following summarizes the significant accounting policies of the Fund:
Security Valuation. Investments are valued as of 4:00 p.m. Eastern time on the last calendar day of the period. The Fund uses independent pricing services approved by the Board of Trustees to value its investments. When current market prices or quotations are not readily available or reliable, valuations may be determined in good faith in accordance with procedures adopted by the Board of Trustees. Factors used in determining value may include market or security specific events. The frequency with which these procedures are used cannot be predicted and they may be utilized to a significant extent. The value used for net asset value (NAV) calculation under these procedures may differ from published prices for the same securities.
The Fund categorizes the inputs to valuation techniques used to value its investments into a disclosure hierarchy consisting of three levels as shown below:
Level 1 - quoted prices in active markets for identical investments
Level 2 - other significant observable inputs (including quoted prices for similar investments, interest rates, prepayment speeds, etc.)
Level 3 - unobservable inputs (including the Fund's own assumptions based on the best information available)
Changes in valuation techniques may result in transfers in or out of an assigned level within the disclosure hierarchy. The aggregate value of investments by input level, as of October 31, 2011, is included at the end of the Fund's Schedule of Investments. Valuation techniques used to value the Fund's investments by major category are as follows:
Equity securities, including restricted securities, for which market quotations are readily available, are valued at the last reported sale price or official closing price as reported by an independent pricing service on the primary market or exchange on which they are traded and are categorized as Level 1 in the hierarchy. In the event there were no sales during the day or closing prices are not available, securities are valued at the last quoted bid price or may be valued using the last available price and are generally categorized as Level 2 in the hierarchy. For foreign equity securities, when significant market or security specific events arise, comparisons to the valuation of American Depositary Receipts (ADRs), futures contracts, Exchange-traded
Annual Report
Notes to Financial Statements - continued
3. Significant Accounting Policies - continued
Security Valuation - continued
funds (ETFs) and certain indexes as well as quoted prices for similar securities are used and are categorized as Level 2 in the hierarchy in these circumstances. Utilizing these techniques may result in transfers between Level 1 and Level 2. For restricted equity securities and private placements where observable inputs are limited, assumptions about market activity and risk are used and are categorized as Level 3 in the hierarchy.
Investments in open-end mutual funds, including the Fidelity Central Funds, are valued at their closing net asset value each business day and are categorized as Level 1 in the hierarchy.
Foreign Currency. The Fund may use foreign currency contracts to facilitate transactions in foreign-denominated securities. Gains and losses from these transactions may arise from changes in the value of the foreign currency or if the counterparties do not perform under the contracts' terms.
Foreign-denominated assets, including investment securities, and liabilities are translated into U.S. dollars at the exchange rate at period end. Purchases and sales of investment securities, income and dividends received and expenses denominated in foreign currencies are translated into U.S. dollars at the exchange rate in effect on the transaction date.
The effects of exchange rate fluctuations on investments are included with the net realized and unrealized gain (loss) on investment securities. Other foreign currency transactions resulting in realized and unrealized gain (loss) are disclosed separately.
Investment Transactions and Income. For financial reporting purposes, the Fund's investment holdings and NAV include trades executed through the end of the last business day of the period. The NAV per share for processing shareholder transactions is calculated as of the close of business of the New York Stock Exchange (NYSE), normally 4:00 p.m. Eastern time and includes trades executed through the end of the prior business day. Gains and losses on securities sold are determined on the basis of identified cost and may include proceeds received from litigation. Dividend income is recorded on the ex-dividend date, except for certain dividends from foreign securities where the ex-dividend date may have passed, which are recorded as soon as the Fund is informed of the ex-dividend date. Non-cash dividends included in dividend income, if any, are recorded at the fair market value of the securities received. Distributions received on securities that represent a return of capital or capital gain are recorded as a reduction of cost of investments and/or as a realized gain. The Fund estimates the components of distributions received that may be considered return of capital distributions or capital gain distributions. Interest income and distributions from the Fidelity Central Funds are accrued as earned. Interest income includes coupon interest and amortization of premium and accretion of discount on debt securities. Investment income is recorded net of foreign taxes withheld where recovery of such taxes is uncertain.
Expenses. Expenses directly attributable to a fund are charged to that fund. Expenses attributable to more than one fund are allocated among the respective funds on the basis of relative net assets or other appropriate methods. Expense estimates are accrued in the period to which they relate and adjustments are made when actual amounts are known.
Income Tax Information and Distributions to Shareholders. Each year, the Fund intends to qualify as a regulated investment company, including distributing substantially all of its taxable income and realized gains under Subchapter M of the Internal Revenue Code and filing its U.S. federal tax return. As a result, no provision for income taxes is required. As of October 31, 2011, the Fund did not have any unrecognized tax benefits in the financial statements. A fund's federal tax return is subject to examination by the Internal Revenue Service (IRS) for a period of three years. Foreign taxes are provided for based on the Fund's understanding of the tax rules and rates that exist in the foreign markets in which it invests.
Distributions are declared and recorded on the ex-dividend date. Income dividends and capital gain distributions are declared separately for each class. Income and capital gain distributions are determined in accordance with income tax regulations, which may differ from GAAP. In addition, the Fund claimed a portion of the payment made to redeeming shareholders as a distribution for income tax purposes.
Capital accounts within the financial statements are adjusted for permanent book-tax differences. These adjustments have no impact on net assets or the results of operations. Temporary book-tax differences will reverse in a subsequent period.
Book-tax differences are primarily due to foreign currency transactions, passive foreign investment companies (PFIC), deferred trustees compensation, capital loss carryforwards and losses deferred due to wash sales.
The federal tax cost of investment securities and unrealized appreciation (depreciation) as of period end were as follows:
Gross unrealized appreciation | $ 1,438,494,908 |
Gross unrealized depreciation | (60,426,525) |
Net unrealized appreciation (depreciation) on securities and other investments | $ 1,378,068,383 |
| |
Tax Cost | $ 1,798,937,632 |
Annual Report
3. Significant Accounting Policies - continued
Income Tax Information and Distributions to Shareholders - continued
The tax-based components of distributable earnings as of period end were as follows:
Undistributed ordinary income | $ 34,016,899 |
Capital loss carryforward | $ (96,320,871) |
Net unrealized appreciation (depreciation) | $ 1,378,167,010 |
Under the recently enacted Regulated Investment Company Modernization Act of 2010 (the Act), the Fund will be permitted to carry forward capital losses incurred in taxable years beginning after December 22, 2010 for an unlimited period. However, any losses incurred during those future taxable years will be required to be utilized prior to any losses incurred in pre-enactment taxable years, which generally expire after eight years from when they are incurred. Additionally, post-enactment capital losses that are carried forward will retain their character as either short-term or long-term capital losses rather than being considered all short-term as under previous law. The Fund's first fiscal year end subject to the Act will be October 31, 2012.
The tax character of distributions paid was as follows:
| October 31, 2011 | October 31, 2010 |
Ordinary Income | $ 37,999,721 | $ 152,546,775 |
Short-Term Trading (Redemption) Fees. Shares held by investors in the Fund less than 90 days are subject to a redemption fee equal to 1.50% of the net asset value of shares redeemed. All redemption fees, which reduce the proceeds of the shareholder redemption, are retained by the Fund and accounted for as an addition to paid in capital.
New Accounting Pronouncement. In May 2011, the Financial Accounting Standards Board issued Accounting Standard Update No. 2011-04, Fair Value Measurement (Topic 820) - Amendments to Achieve Common Fair Value Measurement and Disclosure Requirements in U.S. GAAP and IFRSs. The update changes the wording used to describe the requirements in GAAP for measuring fair value and for disclosing information about fair value measurements. The update is effective during interim and annual periods beginning after December 15, 2011. Management is currently evaluating the impact of the update's adoption on the Fund's financial statement disclosures.
4. Purchases and Sales of Investments.
Purchases and sales of securities, other than short-term securities, aggregated $432,655,967 and $1,472,546,394, respectively.
5. Fees and Other Transactions with Affiliates.
Management Fee. FMR and its affiliates provide the Fund with investment management related services for which the Fund pays a monthly management fee. The management fee is the sum of an individual fund fee rate that is based on an annual rate of .45% of the Fund's average net assets and a group fee rate that averaged .26% during the period. The group fee rate is based upon the average net assets of all the mutual funds advised by FMR. The group fee rate decreases as assets under management increase and increases as assets under management decrease. For the period, the total annual management fee rate was .71% of the Fund's average net assets.
Distribution and Service Plan Fees. In accordance with Rule 12b-1 of the 1940 Act, the Fund has adopted separate Distribution and Service Plans for each class of shares. Certain classes pay Fidelity Distributors Corporation (FDC), an affiliate of FMR, separate Distribution and Service Fees, each of which are based on an annual percentage of each class' average net assets. In addition, FDC may pay financial intermediaries for selling shares of the Fund and providing shareholder support services. For the period, the Distribution and Service Fee rates, total fees and amounts retained by FDC were as follows:
| Distribution
Fee | Service
Fee | Total Fees | Retained
by FDC |
Class A | -% | .25% | $ 267,457 | $ 5,858 |
Class T | .25% | .25% | 161,457 | 1,475 |
Class B | .75% | .25% | 173,640 | 130,230 |
Class C | .75% | .25% | 436,724 | 63,761 |
| | | $ 1,039,278 | $ 201,324 |
Annual Report
Notes to Financial Statements - continued
5. Fees and Other Transactions with Affiliates - continued
Sales Load. FDC may receive a front-end sales charge of up to 5.75% for selling Class A shares, and 3.50% for selling Class T shares, some of which is paid to financial intermediaries for selling shares of the Fund. Depending on the holding period, FDC may receive contingent deferred sales charges levied on Class A, Class T, Class B, and Class C redemptions. The deferred sales charges range from 5% to 1% for Class B, 1% for Class C, 1.00% for certain purchases of Class A shares and .25% for certain purchases of Class T shares.
For the period, sales charge amounts retained by FDC were as follows:
| Retained
by FDC |
Class A | $ 62,781 |
Class T | 8,150 |
Class B* | 14,426 |
Class C* | 5,552 |
| $ 90,909 |
* When Class B and Class C shares are initially sold, FDC pays commissions from its own resources to financial intermediaries through which the sales are made.
Transfer Agent Fees. Fidelity Investments Institutional Operations Company, Inc. (FIIOC), an affiliate of FMR, is the transfer, dividend disbursing and shareholder servicing agent for each class of the Fund. FIIOC receives account fees and asset-based fees that vary according to the account size and type of account of the shareholders of the respective classes of the Fund. FIIOC pays for typesetting, printing and mailing of shareholder reports, except proxy statements. For the period, transfer agent fees for each class were as follows:
| Amount | % of
Average
Net Assets |
Class A | $ 312,176 | .29 |
Class T | 101,225 | .31 |
Class B | 52,537 | .30 |
Class C | 122,538 | .28 |
Latin America | 7,524,751 | .21 |
Institutional Class | 28,490 | .24 |
| $ 8,141,717 | |
Accounting and Security Lending Fees. Fidelity Service Company, Inc. (FSC), an affiliate of FMR, maintains the Fund's accounting records. The accounting fee is based on the level of average net assets for the month. Under a separate contract, FSC administers the security lending program. The security lending fee is based on the number and duration of lending transactions.
Brokerage Commissions. The Fund placed a portion of its portfolio transactions with brokerage firms which are affiliates of the investment adviser. The commissions paid to these affiliated firms were $2,495 for the period.
Interfund Lending Program. Pursuant to an Exemptive Order issued by the SEC, the Fund, along with other registered investment companies having management contracts with FMR, may participate in an interfund lending program. This program provides an alternative credit facility allowing the funds to borrow from, or lend money to, other participating affiliated funds. At period end, there were no interfund loans outstanding. The Fund's activity in this program during the period for which loans were outstanding was as follows:
Borrower or Lender | Average Daily
Loan Balance | Weighted Average Interest Rate | Interest
Expense |
Borrower | $ 14,398,611 | .39% | $ 8,383 |
6. Committed Line of Credit.
The Fund participates with other funds managed by FMR or an affiliate in a $4.0 billion credit facility (the "line of credit") to be utilized for temporary or emergency purposes to fund shareholder redemptions or for other short-term liquidity purposes. The Fund has agreed to pay commitment fees on its pro-rata portion of the line of credit, which amounted to $12,344 and is reflected in Miscellaneous expenses on the Statement of Operations. During the period, there were no borrowings on this line of credit.
Annual Report
7. Security Lending.
The Fund lends portfolio securities through a lending agent from time to time in order to earn additional income. For equity securities, a lending agent is used and may loan securities to certain qualified borrowers, including Fidelity Capital Markets (FCM), a broker-dealer affiliated with the Fund. On the settlement date of the loan, the Fund receives collateral (in the form of U.S. Treasury obligations, letters of credit and/or cash) against the loaned securities and maintains collateral in an amount not less than 100% of the market value of the loaned securities during the period of the loan. The market value of the loaned securities is determined at the close of business of the Fund and any additional required collateral is delivered to the Fund on the next business day. If the borrower defaults on its obligation to return the securities loaned because of insolvency or other reasons, a fund could experience delays and costs in recovering the securities loaned or in gaining access to the collateral. Any cash collateral received is invested in the Fidelity Securities Lending Cash Central Fund. The value of loaned securities and cash collateral at period end are disclosed on the Fund's Statement of Assets and Liabilities. Security lending income represents the income earned on investing cash collateral, less rebates paid to borrowers and any lending agent fees associated with the loan, plus any premium payments received for lending certain types of securities. Security lending income is presented in the Statement of Operations as a component of income from Fidelity Central Funds. Total security lending income during the period amounted to $397,722. During the period, there were no securities loaned to FCM.
8. Expense Reductions.
FMR voluntarily agreed to reimburse a portion of Latin America's operating expenses. During the period, this reimbursement reduced the class' expenses by $45,747.
Many of the brokers with whom FMR places trades on behalf of the Fund provided services to the Fund in addition to trade execution. These services included payments of certain expenses on behalf of the Fund totaling $38,294 for the period.
9. Distributions to Shareholders.
Distributions to shareholders of each class were as follows:
Years ended October 31, | 2011 | 2010A |
From net investment income | | |
Class A | $ 387,219 | $ 1,442 |
Class T | 94,474 | 1,442 |
Class B | 23,836 | 1,442 |
Class C | 78,469 | 1,442 |
Latin America | 21,655,692 | 118,553,199 |
Institutional Class | 52,446 | 1,442 |
Total | $ 22,292,136 | $ 118,560,409 |
From net realized gain | | |
Class A | $ 407,401 | $ - |
Class T | 127,447 | - |
Class B | 68,279 | - |
Class C | 170,156 | - |
Latin America | 14,889,803 | 33,986,366 |
Institutional Class | 44,499 | - |
Total | $ 15,707,585 | $ 33,986,366 |
A Distributions for Class A, Class T, Class B, Class C and Institutional Class are for the period September 28, 2010 (commencement of sale of shares) to October 31, 2010.
10. Share Transactions.
Transactions for each class of shares were as follows:
| Shares | Dollars |
Years ended October 31, | 2011 | 2010A | 2011 | 2010A |
Class A | | | | |
Shares sold | 412,254 | 41,687 | $ 23,066,057 | $ 2,369,263 |
Issued in exchange of shares of Fidelity Advisor Latin America Fund | - | 2,023,866 | - | 113,640,086 |
Reinvestment of distributions | 12,195 | 26 | 706,536 | 1,442 |
Shares redeemed | (691,058) | (53,951) | (38,328,762) | (3,076,408) |
Net increase (decrease) | (266,609) | 2,011,628 | $ (14,556,169) | $ 112,934,383 |
Annual Report
Notes to Financial Statements - continued
10. Share Transactions - continued
| Shares | Dollars |
Years ended October 31, | 2011 | 2010A | 2011 | 2010A |
Class T | | | | |
Shares sold | 87,514 | 18,758 | $ 4,903,931 | $ 1,058,068 |
Issued in exchange of shares of Fidelity Advisor Latin America Fund | - | 637,585 | - | 35,800,407 |
Reinvestment of distributions | 3,721 | 26 | 215,680 | 1,442 |
Shares redeemed | (234,128) | (15,626) | (12,893,248) | (885,588) |
Net increase (decrease) | (142,893) | 640,743 | $ (7,773,637) | $ 35,974,329 |
Class B | | | | |
Shares sold | 11,256 | 3,456 | $ 626,261 | $ 192,197 |
Issued in exchange of shares of Fidelity Advisor Latin America Fund | - | 359,402 | - | 20,176,816 |
Reinvestment of distributions | 1,326 | 26 | 76,906 | 1,442 |
Shares redeemed | (96,470) | (7,861) | (5,351,844) | (450,086) |
Net increase (decrease) | (83,888) | 355,023 | $ (4,648,677) | $ 19,920,369 |
Class C | | | | |
Shares sold | 137,950 | 17,327 | $ 7,785,005 | $ 976,205 |
Issued in exchange of shares of Fidelity Advisor Latin America Fund | - | 840,828 | - | 47,204,057 |
Reinvestment of distributions | 3,829 | 26 | 222,012 | 1,442 |
Shares redeemed | (306,800) | (16,791) | (16,851,535) | (947,712) |
Net increase (decrease) | (165,021) | 841,390 | $ (8,844,518) | $ 47,233,992 |
Latin America | | | | |
Shares sold | 8,382,994 | 22,062,249 | $ 474,305,310 | $ 1,142,552,819 |
Reinvestment of distributions | 609,933 | 2,770,809 | 35,291,350 | 147,652,381 |
Shares redeemed | (28,534,583) | (35,850,914) | (1,586,342,682) | (1,794,503,952) |
Net increase (decrease) | (19,541,656) | (11,017,856) | $ (1,076,746,022) | $ (504,298,752) |
Institutional Class | | | | |
Shares sold | 72,884 | 3,784 | $ 4,108,817 | $ 212,699 |
Issued in exchange of shares of Fidelity Advisor Latin America Fund | - | 228,366 | - | 12,822,761 |
Reinvestment of distributions | 1,178 | 26 | 68,214 | 1,442 |
Shares redeemed | (115,010) | (8,368) | (6,478,861) | (476,457) |
Net increase (decrease) | (40,948) | 223,808 | $ (2,301,830) | $ 12,560,445 |
A Share transactions for Class A, Class T, Class B, Class C and Institutional Class are for the period September 28, 2010 (commencement of sale of shares) to October 31, 2010.
11. Other.
The Fund's organizational documents provide former and current trustees and officers with a limited indemnification against liabilities arising in connection with the performance of their duties to the Fund. In the normal course of business, the Fund may also enter into contracts that provide general indemnifications. The Fund's maximum exposure under these arrangements is unknown as this would be dependent on future claims that may be made against the Fund. The risk of material loss from such claims is considered remote.
12. Merger Information.
On October 1, 2010 the Fund acquired all of the assets and assumed all of the liabilities of the Fidelity Advisor Latin America Fund ("Target Fund") pursuant to an agreement and plan of reorganization approved by the Board of Trustees ("The Board") on July 6, 2010. The reorganization provides shareholders of the Target Fund access to a larger portfolio with the same investment objectives and lower expenses. The acquisition was accomplished by an exchange of 2,023,866 Class A shares, 637,585 Class T shares, 359,402 Class B shares, 840,828 Class C shares, and 228,366 Institutional Class shares of the Fund, respectively, for 2,219,330 Class A shares, 700,912 Class T shares, 400,205 Class B shares, 940,861 Class C shares, and 245,559 Institutional Class shares then outstanding (valued at $51.20, $51.08, $50.42, $50.17 and $52.22 per share for Class A, Class T, Class B, Class C, and Institutional Class, respectively) of the Target Fund. The reorganization qualified as a tax-free reorganization for federal income tax purposes with no gain or loss recognized to the funds or their shareholders. The Target Fund's net assets, including securities of $229,225,487, unrealized appreciation of $95,362,395, and net other assets of $418,642, were combined with the Fund's net assets of $4,149,781,255 for total net assets after the acquisition of $4,379,425,384.
Annual Report
12. Merger Information - continued
Pro forma results of operations of the combined entity for the entire year ended October 31, 2010, as though the acquisition had occurred as of the beginning of the year (rather than on the actual acquisition date), are as follows:
Net investment income (loss) | $ 90,969,628 |
Total net realized gain (loss) | 302,327,523 |
Total change in net unrealized appreciation (depreciation) | 548,871,563 |
Net increase (decrease) in net assets resulting from operations | $ 942,168,714 |
Because the combined investment portfolios have been managed as a single portfolio since the acquisition was completed, it is not practicable to separate the amounts of revenue and earnings of the acquired fund that have been included in the Fund's accompanying Statement of Operations since October 1, 2010.
Annual Report
Report of Independent Registered Public Accounting Firm
To the Trustees of Fidelity Investment Trust and the Shareholders of Fidelity Latin America Fund:
In our opinion, the accompanying statement of assets and liabilities, including the schedule of investments, and the related statements of operations and of changes in net assets and the financial highlights present fairly, in all material respects, the financial position of Fidelity Latin America Fund (a fund of Fidelity Investment Trust) at October 31, 2011, the results of its operations for the year then ended, the changes in its net assets for each of the two years in the period then ended and the financial highlights for each of the periods indicated, in conformity with accounting principles generally accepted in the United States of America. These financial statements and financial highlights (hereafter referred to as "financial statements") are the responsibility of the Fidelity Latin America Fund's management. Our responsibility is to express an opinion on these financial statements based on our audits. We conducted our audits of these financial statements in accordance with the standards of the Public Company Accounting Oversight Board (United States). Those standards require that we plan and perform the audit to obtain reasonable assurance about whether the financial statements are free of material misstatement. An audit includes examining, on a test basis, evidence supporting the amounts and disclosures in the financial statements, assessing the accounting principles used and significant estimates made by management, and evaluating the overall financial statement presentation. We believe that our audits, which included confirmation of securities at October 31, 2011 by correspondence with the custodian and brokers, provide a reasonable basis for our opinion.
PricewaterhouseCoopers LLP
Boston, Massachusetts
December 16, 2011
Annual Report
The Trustees, Members of the Advisory Board, and executive officers of the trust and fund, as applicable, are listed below. The Board of Trustees governs the fund and is responsible for protecting the interests of shareholders. The Trustees are experienced executives who meet periodically throughout the year to oversee the fund's activities, review contractual arrangements with companies that provide services to the fund, oversee management of the risks associated with such activities and contractual arrangements, and review the fund's performance. Except for James C. Curvey, each of the Trustees oversees 226 funds advised by FMR or an affiliate. Mr. Curvey oversees 429 funds advised by FMR or an affiliate.
The Trustees hold office without limit in time except that (a) any Trustee may resign; (b) any Trustee may be removed by written instrument, signed by at least two-thirds of the number of Trustees prior to such removal; (c) any Trustee who requests to be retired or who has become incapacitated by illness or injury may be retired by written instrument signed by a majority of the other Trustees; and (d) any Trustee may be removed at any special meeting of shareholders by a two-thirds vote of the outstanding voting securities of the trust. Each Trustee who is not an interested person (as defined in the 1940 Act) (Independent Trustee), shall retire not later than the last day of the calendar year in which his or her 75th birthday occurs. The Independent Trustees may waive this mandatory retirement age policy with respect to individual Trustees. The executive officers and Advisory Board Members hold office without limit in time, except that any officer and Advisory Board Member may resign or may be removed by a vote of a majority of the Trustees at any regular meeting or any special meeting of the Trustees. Except as indicated, each individual has held the office shown or other offices in the same company for the past five years.
Experience, Skills, Attributes, and Qualifications of the Fund's Trustees. The Governance and Nominating Committee has adopted a statement of policy that describes the experience, qualifications, attributes, and skills that are necessary and desirable for potential Independent Trustee candidates (Statement of Policy). The Board believes that each Trustee satisfied at the time he or she was initially elected or appointed a Trustee, and continues to satisfy, the standards contemplated by the Statement of Policy. The Governance and Nominating Committee also engages professional search firms to help identify potential Independent Trustee candidates who have the experience, qualifications, attributes, and skills consistent with the Statement of Policy. From time to time, additional criteria based on the composition and skills of the current Independent Trustees, as well as experience or skills that may be appropriate in light of future changes to board composition, business conditions, and regulatory or other developments, have also been considered by the professional search firms and the Governance and Nominating Committee. In addition, the Board takes into account the Trustees' commitment and participation in Board and committee meetings, as well as their leadership of standing and ad hoc committees throughout their tenure.
In determining that a particular Trustee was and continues to be qualified to serve as a Trustee, the Board has considered a variety of criteria, none of which, in isolation, was controlling. The Board believes that, collectively, the Trustees have balanced and diverse experience, qualifications, attributes, and skills, which allow the Board to operate effectively in governing the fund and protecting the interests of shareholders. Information about the specific experience, skills, attributes, and qualifications of each Trustee, which in each case led to the Board's conclusion that the Trustee should serve (or continue to serve) as a trustee of the fund, is provided below.
Board Structure and Oversight Function. James C. Curvey is an interested person (as defined in the 1940 Act) and currently serves as Acting Chairman. The Trustees have determined that an interested Chairman is appropriate and benefits shareholders because an interested Chairman has a personal and professional stake in the quality and continuity of services provided to the fund. Independent Trustees exercise their informed business judgment to appoint an individual of their choosing to serve as Chairman, regardless of whether the Trustee happens to be independent or a member of management. The Independent Trustees have determined that they can act independently and effectively without having an Independent Trustee serve as Chairman and that a key structural component for assuring that they are in a position to do so is for the Independent Trustees to constitute a substantial majority for the Board. The Independent Trustees also regularly meet in executive session. Ned C. Lautenbach serves as Chairman of the Independent Trustees and as such (i) acts as a liaison between the Independent Trustees and management with respect to matters important to the Independent Trustees and (ii) with management prepares agendas for Board meetings.
Fidelity funds are overseen by different Boards of Trustees. The fund's Board oversees Fidelity's equity and high income funds and another Board oversees Fidelity's investment-grade bond, money market, and asset allocation funds. The asset allocation funds may invest in Fidelity funds overseen by the fund's Board. The use of separate Boards, each with its own committee structure, allows the Trustees of each group of Fidelity funds to focus on the unique issues of the funds they oversee, including common research, investment, and operational issues. On occasion, the separate Boards establish joint committees to address issues of overlapping consequences for the Fidelity funds overseen by each Board.
The Trustees operate using a system of committees to facilitate the timely and efficient consideration of all matters of importance to the Trustees, the fund, and fund shareholders and to facilitate compliance with legal and regulatory requirements and oversight of the fund's activities and associated risks. The Board, acting through its committees, has charged FMR and its affiliates with (i) identifying events or circumstances the occurrence of which could have demonstrably adverse effects on the fund's business and/or reputation; (ii) implementing processes and controls to lessen the possibility that such events or circumstances occur or to mitigate the effects of such events or circumstances if they do occur; and (iii) creating and maintaining a system designed to evaluate continuously business and market conditions in order to facilitate the identification and implementation processes described in (i) and (ii) above. Because the day-to-day operations and activities of the fund are carried out by or through FMR, its affiliates and other service providers, the fund's exposure to risks is mitigated but not eliminated by the processes overseen by the Trustees. While each of the Board's committees has responsibility for overseeing different aspects of the fund's activities, oversight is exercised primarily through the Operations, Audit, and Compliance Committees. In addition, the Independent Trustees have worked with FMR to enhance the Board's oversight of investment and financial risks, legal and regulatory risks, technology risks, and operational risks, including the development of additional risk reporting to the Board. For example, a working group comprised of Independent Trustees and FMR has worked and continues to work to review the Fidelity funds' valuation-related activities, reporting and risk management. Appropriate personnel, including but not limited to the fund's Chief Compliance Officer (CCO), FMR's internal auditor, the independent accountants, the fund's Treasurer and portfolio management personnel, make periodic reports to the Board's committees, as appropriate, including an annual review of FMR's risk management program for the Fidelity funds. The responsibilities of each standing committee, including their oversight responsibilities, are described further under "Standing Committees of the Fund's Trustees."
Annual Report
Trustees and Officers - continued
The fund's Statement of Additional Information (SAI) includes more information about the Trustees. To request a free copy, call Fidelity at 1-877-208-0098.
Interested Trustees*:
Correspondence intended for each Trustee who is an interested person may be sent to Fidelity Investments, 82 Devonshire Street, Boston, Massachusetts 02109.
Name, Age; Principal Occupations and Other Relevant Experience+ |
James C. Curvey (76) |
| Year of Election or Appointment: 2007 Mr. Curvey is Trustee and Acting Chairman of the Board of Trustees of certain Trusts. Mr. Curvey also serves as Trustee (2007-present) of other investment companies advised by FMR. Mr. Curvey is a Director of Fidelity Investments Money Management, Inc. (2009-present), Director of Fidelity Research & Analysis Co. (2009-present) and Director of FMR and FMR Co., Inc. (2007-present). Mr. Curvey is also Vice Chairman (2007-present) and Director of FMR LLC. In addition, Mr. Curvey serves as an Overseer for the Boston Symphony Orchestra and a member of the Trustees of Villanova University. Previously, Mr. Curvey was the Vice Chairman (2006-2007) and Director (2000-2007) of FMR Corp. |
Ronald P. O'Hanley (54) |
| Year of Election or Appointment: 2011 Mr. O'Hanley is Director of FMR Co., Inc. (2010-present), Director of Fidelity Investments Money Management, Inc. (2010-present), Director of Fidelity Research & Analysis Company (2010-present), President of Fidelity Asset Management and Corporate Services and a member of Fidelity's Executive Committee (2010-present). Previously, Mr. O'Hanley served as President and Chief Executive Officer of BNY Mellon Asset Management (2007-2010). Mr. O'Hanley also served as Vice Chairman of Bank New York Mellon Corp. and a member of that firm's Executive Committee. Prior to the 2007 merger of The Bank of New York and Mellon Financial Corporation, he was Vice Chairman of Mellon Financial Corporation and President and Chief Executive Officer of Mellon Asset Management. He joined Mellon in February 1997. Mr. O'Hanley currently serves as Chairman of the Boston Public Library Foundation Board of Directors and sits on the Board of Directors of Beth Israel Deaconess Medical Center, the Board of Trustees of the Marine Biological Laboratory and the Advisory Board of the Maxwell School of Citizenship and Public Administration at Syracuse University. Mr. O'Hanley also chairs the Council on Asset Management for the Financial Services Roundtable and is a member of the Board of Directors of Institutional Investor's U.S. Institute. |
* Trustees have been determined to be "Interested Trustees" by virtue of, among other things, their affiliation with the trust or various entities under common control with FMR.
+ The information above includes each Trustee's principal occupation during the last five years and other information relating to the experience, attributes, and skills relevant to each Trustee's qualifications to serve as a Trustee, which led to the conclusion that each Trustee should serve as a Trustee for the fund.
Independent Trustees:
Correspondence intended for each Independent Trustee (that is, the Trustees other than the Interested Trustees) may be sent to Fidelity Investments, P.O. Box 55235, Boston, Massachusetts 02205-5235.
Name, Age; Principal Occupations and Other Relevant Experience+ |
Dennis J. Dirks (63) |
| Year of Election or Appointment: 2005 Prior to his retirement in May 2003, Mr. Dirks was Chief Operating Officer and a member of the Board of The Depository Trust & Clearing Corporation (DTCC). He also served as President, Chief Operating Officer, and Board member of The Depository Trust Company (DTC) and President and Board member of the National Securities Clearing Corporation (NSCC). In addition, Mr. Dirks served as Chief Executive Officer and Board member of the Government Securities Clearing Corporation, Chief Executive Officer and Board member of the Mortgage-Backed Securities Clearing Corporation, as a Trustee and a member of the Finance Committee of Manhattan College (2005-2008), and as a Trustee and a member of the Finance Committee of AHRC of Nassau County (2006-2008). Mr. Dirks is a member of the Independent Directors Council (IDC) Governing Council (2010-Present) and Board of Directors for The Brookville Center for Children's Services, Inc. (2009-present). |
Alan J. Lacy (58) |
| Year of Election or Appointment: 2008 Mr. Lacy serves as Senior Adviser (2007-present) of Oak Hill Capital Partners, L.P. (private equity). Mr. Lacy also served as Chief Executive Officer (2000-2005) and Vice Chairman (2005-2006) of Sears Holdings Corporation and Sears, Roebuck and Co. (retail). In addition, Mr. Lacy serves as a member of the Board of Directors of Dave & Buster's, Inc. (restaurant and entertainment complexes, 2010-present), The Hillman Companies, Inc. (hardware wholesalers, 2010-present), and Bristol-Myers Squibb Company (global pharmaceuticals, 2007-present). Mr. Lacy is a member of the Board of Trustees of The National Parks Conservation Association (2006-Present). Previously, Mr. Lacy served as Chairman of the Board of Trustees of the National Parks Conservation Association (2008-2011) and as a member of the Board of Directors for the Western Union Company (global money transfer, 2006-2011). |
Ned C. Lautenbach (67) |
| Year of Election or Appointment: 2000 Mr. Lautenbach is Chairman of the Independent Trustees of the Equity and High Income Funds (2006-present). Mr. Lautenbach currently serves as the Lead Director of the Eaton Corporation Board of Directors (diversified industrial, 1997-present). Mr. Lautenbach is also a member of the Board of Directors of the Philharmonic Center for the Arts in Naples, Florida (1999-present); a member of the Board of Trustees of Fairfield University (2005-present); and a member of the Council on Foreign Relations (1994-present). Previously, Mr. Lautenbach was a Partner/Advisory Partner at Clayton, Dubilier & Rice, LLC (private equity investment, 1998-2010), as well as a Director of Sony Corporation (2006-2007). |
Joseph Mauriello (67) |
| Year of Election or Appointment: 2008 Prior to his retirement in January 2006, Mr. Mauriello served in numerous senior management positions including Deputy Chairman and Chief Operating Officer (2004-2005), and Vice Chairman of Financial Services (2002-2004) of KPMG LLP US (professional services, 1965-2005). Mr. Mauriello currently serves as a member of the Board of Directors of XL Group plc. (global insurance and re-insurance, 2006-present) and of Arcadia Resources Inc. (health care services and products, 2007-present). Previously, Mr. Mauriello served as a Director of the Hamilton Funds of the Bank of New York (2006-2007). |
Robert W. Selander (61) |
| Year of Election or Appointment: 2011 Previously, Mr. Selander served as a Member of the Advisory Board of Fidelity's Equity and High Income Funds (2011), Executive Vice Chairman (2010), Chief Executive Officer (2009-2010), and President and Chief Executive Officer (1997-2009) of Mastercard, Inc. |
Cornelia M. Small (67) |
| Year of Election or Appointment: 2005 Ms. Small is a member of the Board of Directors of the Teagle Foundation (2009-present). Ms. Small is also a member of the Investment Committee, and Chair (2008-present) and a member of the Board of Trustees of Smith College. In addition, Ms. Small serves on the Investment Committee of the Berkshire Taconic Community Foundation (2008-present). Previously, Ms. Small served as Chairperson of the Investment Committee (2002-2008) of Smith College. In addition, Ms. Small served as Chief Investment Officer, Director of Global Equity Investments, and a member of the Board of Directors of Scudder, Stevens & Clark and Scudder Kemper Investments. |
William S. Stavropoulos (72) |
| Year of Election or Appointment: 2001 Mr. Stavropoulos is Vice Chairman of the Independent Trustees of the Equity and High Income Funds (2006-present). Mr. Stavropoulos serves as President and Founder of the Michigan Baseball Foundation, the Great Lakes Loons (2007-present). Mr. Stavropoulos is Chairman Emeritus of the Board of Directors of The Dow Chemical Company, where he previously served in numerous senior management positions, including President, CEO (1995-2000; 2002-2004), Chairman of the Executive Committee (2000-2006), and as a member of the Board of Directors (1990-2006). Currently, Mr. Stavropoulos is Chairman of Univar (global distributor of commodity and specialty chemicals, 2010-present), a Director of Teradata Corporation (data warehousing and technology solutions, 2008-present), Chemical Financial Corporation, Maersk Inc. (industrial conglomerate), Tyco International, Inc. (multinational manufacturing and services, 2007-present), and a member of the Advisory Board for Metalmark Capital (private equity investment, 2005-present). Mr. Stavropoulos is a special advisor to Clayton, Dubilier & Rice, LLC (private equity investment). In addition, Mr. Stavropoulos is a member of the University of Notre Dame Advisory Council for the College of Science. |
David M. Thomas (62) |
| Year of Election or Appointment: 2008 Previously, Mr. Thomas served as Executive Chairman (2005-2006) and Chairman and Chief Executive Officer (2000-2005) of IMS Health, Inc. (pharmaceutical and healthcare information solutions). In addition, Mr. Thomas serves as a member of the Board of Directors of Fortune Brands, Inc. (consumer products), and Interpublic Group of Companies, Inc. (marketing communication, 2004-present). |
Michael E. Wiley (61) |
| Year of Election or Appointment: 2008 Mr. Wiley also serves as a Director of Asia Pacific Exploration Consolidated (international oil and gas exploration and production, 2008-present). Mr. Wiley serves as a Director of Tesoro Corporation (independent oil refiner and marketer, 2005-present), and a Director of Bill Barrett Corporation (exploration and production, 2005-present). In addition, Mr. Wiley also serves as a Director of Post Oak Bank (privately-held bank, 2004-present). Previously, Mr. Wiley served as a member of the Board of Trustees of the University of Tulsa (2000-2006; 2007-2010), as a Senior Energy Advisor of Katzenbach Partners, LLC (consulting, 2006-2007), as an Advisory Director of Riverstone Holdings (private investment), Chairman, President, and CEO of Baker Hughes, Inc. (oilfield services, 2000-2004), and as Director of Spinnaker Exploration Company (exploration and production, 2001-2005). |
+ The information above includes each Trustee's principal occupation during the last five years and other information relating to the experience, attributes, and skills relevant to each Trustee's qualifications to serve as a Trustee, which led to the conclusion that each Trustee should serve as a Trustee for the fund.
Advisory Board Members and Executive Officers:
Correspondence intended for each executive officer, Edward C. Johnson 3d, and Peter S. Lynch may be sent to Fidelity Investments, 82 Devonshire Street, Boston, Massachusetts 02109.
Name, Age; Principal Occupation |
Edward C. Johnson 3d (81) |
| Year of Election or Appointment: 2011 Member of the Advisory Board of Fidelity's Equity and High Income Funds. Mr. Johnson serves as Chief Executive Officer, Chairman, and a Director of FMR LLC, and also serves as Chairman and Director of FIL Limited. Previously, Mr. Johnson served as a Trustee and Chairman of the Board of certain Fidelity Trusts, Chairman and a Director of FMR, Chairman and a Director of FMR Co., Inc., and President of FMR LLC (2006-2007). |
Peter S. Lynch (67) |
| Year of Election or Appointment: 2003 Member of the Advisory Board of Fidelity's Equity and High Income Funds. Mr. Lynch is Vice Chairman and a Director of FMR and FMR Co., Inc. In addition, Mr. Lynch serves as a Trustee of Boston College and as the Chairman of the Inner-City Scholarship Fund. Previously, Mr. Lynch served on the Special Olympics International Board of Directors (1997-2006). |
Kenneth B. Robins (42) |
| Year of Election or Appointment: 2008 President and Treasurer of Fidelity's Equity and High Income Funds. Mr. Robins also serves as President and Treasurer (2010-present) and Assistant Treasurer (2009-present) of other Fidelity funds and is an employee of Fidelity Investments (2004-present). Previously, Mr. Robins served as Deputy Treasurer of the Fidelity funds (2005-2008) and Treasurer and Chief Financial Officer of The North Carolina Capital Management Trust: Cash and Term Portfolios (2006-2008). |
Bruce T. Herring (46) |
| Year of Election or Appointment: 2006 Vice President of certain Equity Funds. Mr. Herring also serves as Chief Investment Officer and Director of Fidelity Management & Research (U.K.) Inc. (2010-present) and Group Chief Investments Officer of FMR. Previously, Mr. Herring served as Vice President (2005-2006) and Senior Vice President (2006-2007) of Fidelity Management & Research Company, Vice President of FMR Co., Inc. (2001-2007) and as a portfolio manager for Fidelity U.S. Equity Funds. |
Brian B. Hogan (47) |
| Year of Election or Appointment: 2009 Vice President of Equity and High Income Funds. Mr. Hogan also serves as President of FMR's Equity Division (2009-present). Previously, Mr. Hogan served as Senior Vice President, Equity Research of FMR (2006-2009) and as a portfolio manager. |
Scott C. Goebel (43) |
| Year of Election or Appointment: 2008 Secretary and Chief Legal Officer (CLO) of the Fidelity funds. Mr. Goebel also serves as Secretary of Fidelity Investments Money Management, Inc. (FIMM) (2010-present) and Fidelity Research and Analysis Company (FRAC) (2010-present); Secretary and CLO of The North Carolina Capital Management Trust: Cash and Term Portfolios (2008-present); General Counsel, Secretary, and Senior Vice President of FMR (2008-present) and FMR Co., Inc. (2008-present); employed by FMR LLC or an affiliate (2001-present); Chief Legal Officer of Fidelity Management & Research (Hong Kong) Limited (2008-present) and Assistant Secretary of Fidelity Management & Research (Japan) Inc. (2008-present), and Fidelity Management & Research (U.K.) Inc. (2008-present). Previously, Mr. Goebel served as Assistant Secretary of FIMM (2008-2010), FRAC (2008-2010), and the Funds (2007-2008) and as Vice President and Secretary of Fidelity Distributors Corporation (FDC) (2005-2007). |
William C. Coffey (42) |
| Year of Election or Appointment: 2009 Assistant Secretary of Fidelity's Equity and High Income Funds. Mr. Coffey also serves as Senior Vice President and Deputy General Counsel of FMR LLC (2010-present), and is an employee of Fidelity Investments. Previously, Mr. Coffey served as Vice President and Associate General Counsel of FMR LLC (2005-2009). |
Holly C. Laurent (57) |
| Year of Election or Appointment: 2008 Anti-Money Laundering (AML) Officer of the Fidelity funds. Ms. Laurent also serves as AML Officer of The North Carolina Capital Management Trust: Cash and Term Portfolios (2008-present) and is an employee of Fidelity Investments. Previously, Ms. Laurent was Senior Vice President and Head of Legal for Fidelity Business Services India Pvt. Ltd. (2006-2008), and Senior Vice President, Deputy General Counsel and Group Head for FMR LLC (2005-2006). |
Christine Reynolds (53) |
| Year of Election or Appointment: 2008 Chief Financial Officer of the Fidelity funds. Ms. Reynolds became President of Fidelity Pricing and Cash Management Services (FPCMS) in August 2008. Ms. Reynolds served as Chief Operating Officer of FPCMS (2007-2008). Previously, Ms. Reynolds served as President, Treasurer, and Anti-Money Laundering officer of the Fidelity funds (2004-2007). |
Kenneth A. Rathgeber (64) |
| Year of Election or Appointment: 2004 Chief Compliance Officer of Fidelity's Equity and High Income Funds. Mr. Rathgeber is Chief Compliance Officer of Fidelity Management & Research (Hong Kong) Limited (2008-present), Fidelity Management & Research (Japan) Inc. (2008-present), FMR (2005-present), FMR Co., Inc. (2005-present), Fidelity Management & Research (U.K.) Inc. (2005-present), Fidelity Research & Analysis Company (2005-present), Fidelity Investments Money Management, Inc. (2005-present), Pyramis Global Advisors, LLC (2005-present), and Strategic Advisers, Inc. (2005-present). |
Jeffrey S. Christian (50) |
| Year of Election or Appointment: 2009 Deputy Treasurer of the Fidelity funds. Mr. Christian is an employee of Fidelity Investments. Previously, Mr. Christian served as Chief Financial Officer (2008-2009) of certain Fidelity funds and Senior Vice President of Fidelity Pricing and Cash Management Services (FPCMS) (2004-2009). |
Joseph F. Zambello (54) |
| Year of Election or Appointment: 2011 Deputy Treasurer of the Fidelity funds. Mr. Zambello is an employee of Fidelity Investments. Previously, Mr. Zambello served as Vice President of FMR's Program Management Group (2009-2011) and Vice President of the Transfer Agent Oversight Group (2005-2009). |
Adrien E. Deberghes (44) |
| Year of Election or Appointment: 2008 Deputy Treasurer of Fidelity's Equity and High Income Funds. Mr. Deberghes also serves as Vice President and Assistant Treasurer of Fidelity Rutland Square Trust II and Fidelity Commonwealth Trust II (2011-present), Assistant Treasurer of other Fidelity funds (2010-present), and is an employee of Fidelity Investments (2008-present). Previously, Mr. Deberghes served as Senior Vice President of Mutual Fund Administration at State Street Corporation (2007-2008), Senior Director of Mutual Fund Administration at Investors Bank & Trust (2005-2007), and Director of Finance for Dunkin' Brands (2000-2005). |
Stephanie J. Dorsey (42) |
| Year of Election or Appointment: 2010 Assistant Treasurer of Fidelity's Equity and High Income Funds. Ms. Dorsey also serves as Deputy Treasurer of other Fidelity funds (2008-present) and is an employee of Fidelity Investments (2008-present). Previously, Ms. Dorsey served as Treasurer (2004-2008) of the JPMorgan Mutual Funds and Vice President (2004-2008) of JPMorgan Chase Bank. |
John R. Hebble (53) |
| Year of Election or Appointment: 2009 Assistant Treasurer of Fidelity's Equity and High Income Funds. Mr. Hebble also serves as President (2011-present), Treasurer, and Chief Financial Officer of The North Carolina Capital Management Trust: Cash and Term Portfolios (2008-present), President and Treasurer of other Fidelity funds (2008-present) and is an employee of Fidelity Investments. |
Gary W. Ryan (53) |
| Year of Election or Appointment: 2005 Assistant Treasurer of the Fidelity funds. Mr. Ryan is an employee of Fidelity Investments. Previously, Mr. Ryan served as Vice President of Fund Reporting in Fidelity Pricing and Cash Management Services (FPCMS) (1999-2005). |
Jonathan Davis (43) |
| Year of Election or Appointment: 2010 Assistant Treasurer of the Fidelity funds. Mr. Davis is also Assistant Treasurer of Fidelity Rutland Square Trust II and Fidelity Commonwealth Trust II. Mr. Davis is an employee of Fidelity Investments. Previously, Mr. Davis served as Vice President and Associate General Counsel of FMR LLC (2003-2010). |
Annual Report
The Board of Trustees of Fidelity Latin America Fund voted to pay to shareholders of record at the opening of business on record date, the following distributions per share derived from capital gains realized from sales of portfolio securities and dividends derived from net investment income:
| Pay Date | Record Date | Dividends | Capital Gains |
Class A | 12/05/2011 | 12/02/2011 | $0.683 | - |
| | | | |
Class T | 12/05/2011 | 12/02/2011 | $0.515 | - |
| | | | |
Class B | 12/05/2011 | 12/02/2011 | $0.231 | - |
| | | | |
Class C | 12/05/2011 | 12/02/2011 | $0.219 | - |
A percentage of the dividends distributed during fiscal year may be taken into account as a dividend for the purposes of the maximum rate under section 1(h)(11) of the Internal Revenue Code.
| December 3, 2010 | December 30, 2010 |
Class A | 49% | 92% |
Class T | 54% | 92% |
Class B | 69% | 92% |
Class C | 64% | 92% |
The amounts per share which represent income derived from sources within, and taxes paid to, foreign countries or possessions of the United States are as follows:
| Pay Date | Income | Taxes |
Class A | 12/06/2010 | $0.317 | $0.0538 |
Class A | 12/31/2010 | $0.023 | $0.0000 |
Class T | 12/06/2010 | $0.285 | $0.0538 |
Class T | 12/31/2010 | $0.023 | $0.0000 |
Class B | 12/06/2010 | $0.225 | $0.0538 |
Class B | 12/31/2010 | $0.023 | $0.0000 |
Class C | 12/06/2010 | $0.242 | $0.0538 |
Class C | 12/31/2010 | $0.023 | $0.0000 |
The fund will notify shareholders in January 2012 of amounts for use in preparing 2011 income tax returns.
Annual Report
Board Approval of Investment Advisory Contracts and Management Fees
Fidelity Latin America Fund
Each year, the Board of Trustees, including the Independent Trustees (together, the Board), votes on the renewal of the management contract and sub-advisory agreements (together, the Advisory Contracts) for the fund. The Board, assisted by the advice of fund counsel and Independent Trustees' counsel, requests and considers a broad range of information relevant to the renewal of the Advisory Contracts throughout the year.
The Board meets regularly and considers at each of its meetings factors that are relevant to its annual consideration of the renewal of the fund's Advisory Contracts, including the services and support provided to the fund and its shareholders. The Board has established various standing committees, each composed of Independent Trustees with varying backgrounds, to which the Board has assigned specific subject matter responsibilities in order to enhance effective decision-making by the Board. The Board, acting directly and through its Committees, requests and receives information concerning the annual consideration of the renewal of the fund's Advisory Contracts. The Board also meets as needed to consider matters specifically related to the Board's annual consideration of the renewal of Advisory Contracts. Members of the Board may also meet with trustees of other Fidelity funds through ad hoc joint committees to discuss certain matters relevant to the Fidelity funds.
At its July 2011 meeting, the Board of Trustees, including the Independent Trustees, unanimously determined to renew the fund's Advisory Contracts. In reaching its determination, the Board considered all factors it believed relevant, including (i) the nature, extent, and quality of the services to be provided to the fund and its shareholders (including the investment performance of the fund); (ii) the competitiveness of the fund's management fee and total expense ratio; (iii) the total costs of the services to be provided by and the profits to be realized by Fidelity from its relationship with the fund; (iv) the extent to which economies of scale would be realized as the fund grows; and (v) whether fee levels reflect these economies of scale, if any, for the benefit of fund shareholders.
In considering whether to renew the Advisory Contracts for the fund, the Board reached a determination, with the assistance of fund counsel and Independent Trustees' counsel and through the exercise of its business judgment, that the renewal of the Advisory Contracts is in the best interests of the fund and its shareholders and that the compensation payable under the Advisory Contracts is fair and reasonable. The Board's decision to renew the Advisory Contracts was not based on any single factor, but rather was based on a comprehensive consideration of all the information provided to the Board at its meetings throughout the year. The Board, in reaching its determination to renew the Advisory Contracts, is aware that shareholders in the fund have a broad range of investment choices available to them, including a wide choice among mutual funds offered by Fidelity's competitors, and that the fund's shareholders, who have the opportunity to review and weigh the disclosure provided by the fund in its prospectus and other public disclosures, have chosen to invest in this fund, managed by Fidelity.
Nature, Extent, and Quality of Services Provided. The Board considered the staffing within the investment adviser, FMR, and the sub-advisers (together, the Investment Advisers), including the backgrounds of the fund's investment personnel and the fund's investment objective and discipline. The Independent Trustees also had discussions with senior management of Fidelity's investment operations and investment groups. The Board considered the structure of the portfolio manager compensation program and whether this structure provides appropriate incentives to act in the best interests of the fund.
Resources Dedicated to Investment Management and Support Services. The Board and the Fund Oversight and Research Committees reviewed the general qualifications and capabilities of the Investment Advisers' investment staff, including its size, education, experience, and resources, as well as the Investment Advisers' approach to recruiting, training, managing, and compensating investment personnel. The Board also noted that FMR has devoted increased resources to non-U.S. offices. The Board noted that Fidelity's analysts have extensive resources, tools and capabilities which allow them to conduct sophisticated quantitative and fundamental analysis, as well as credit analysis of issuers, counterparties and enhancers. The Board also believes that Fidelity's investment professionals have sufficient access to global information and data so as to provide competitive investment results over time, and that those professionals also have access to sophisticated tools which permit them to assess portfolio construction and risk and performance attribution characteristics continuously, as well as to transmit new information and research conclusions rapidly around the world. Additionally, in their deliberations, the Board considered the Investment Advisers' trading capabilities and resources which are an integral part of the investment management process.
Shareholder and Administrative Services. The Board considered (i) the nature, extent, quality, and cost of advisory, administrative, and shareholder services performed by the Investment Advisers and their affiliates under the Advisory Contracts and under separate agreements covering transfer agency, pricing and bookkeeping, and securities lending services for the fund; (ii) the nature and extent of the investment adviser's supervision of third party service providers, principally custodians and subcustodians; and (iii) the resources devoted to, and the record of compliance with, the fund's compliance policies and procedures. The Board also reviewed the allocation of fund brokerage, including allocations to brokers affiliated with the Investment Advisers, the use of brokerage commissions to pay fund expenses, and the use of "soft" commission dollars to pay for research services.
The Board noted that the growth of fund assets over time across the complex allows Fidelity to reinvest in the development of services designed to enhance the value or convenience of the Fidelity funds as investment vehicles. These services include 24-hour access to account information and market information through telephone representatives and over the Internet, investor education materials and asset allocation tools, and the expanded availability of Fidelity Investor Centers, with 35 new branches opening since 2010.
Annual Report
Investment in a Large Fund Family. The Board considered the benefits to shareholders of investing in a Fidelity fund, including the benefits of investing in a fund that is part of a large family of funds offering a variety of investment disciplines and providing a large variety of mutual fund investor services. The Board noted that Fidelity had taken, or had made recommendations that resulted in the Fidelity funds taking, a number of actions over the previous year that benefited particular funds, including (i) continuing to dedicate additional resources to investment research and support of the senior management team that oversees asset management; (ii) rationalizing product lines through the mergers of six funds into other funds; (iii) continuing to migrate the Freedom Funds to dedicated lower cost underlying funds; (iv) obtaining shareholder approval to broaden the investment strategies for Fidelity Consumer Finance Portfolio, Fidelity Emerging Asia Fund, and Fidelity Environment and Alternative Energy Portfolio; (v) contractually agreeing to reduce the management fees and impose other expense limitations on Spartan 500 Index Fund and U.S. Bond Index Fund in connection with launching new institutional classes of these funds; (vi) changing the name, primary and supplemental benchmarks, and investment policies of Fidelity Global Strategies Fund to support the fund's flexible investment mandate and global orientation; and (vii) reducing the transfer agency account fee rates on certain accounts.
Investment Performance. The Board considered whether the fund has operated in accordance with its investment objective, as well as its record of compliance with its investment restrictions. It also reviewed the fund's absolute investment performance for the retail class, as well as the fund's relative investment performance for the retail class measured over multiple periods against a broad-based securities market index. The Board noted that FMR does not believe that a meaningful peer group exists against which to compare the fund's performance. The following charts considered by the Board show, over the one-, three-, and five-year periods ended December 31, 2010, the cumulative total returns of the retail class of the fund and the cumulative total returns of a broad-based securities market index ("benchmark"). (The Advisor classes of the fund had less than one year of performance as of December 31, 2010.)
Fidelity Latin America Fund
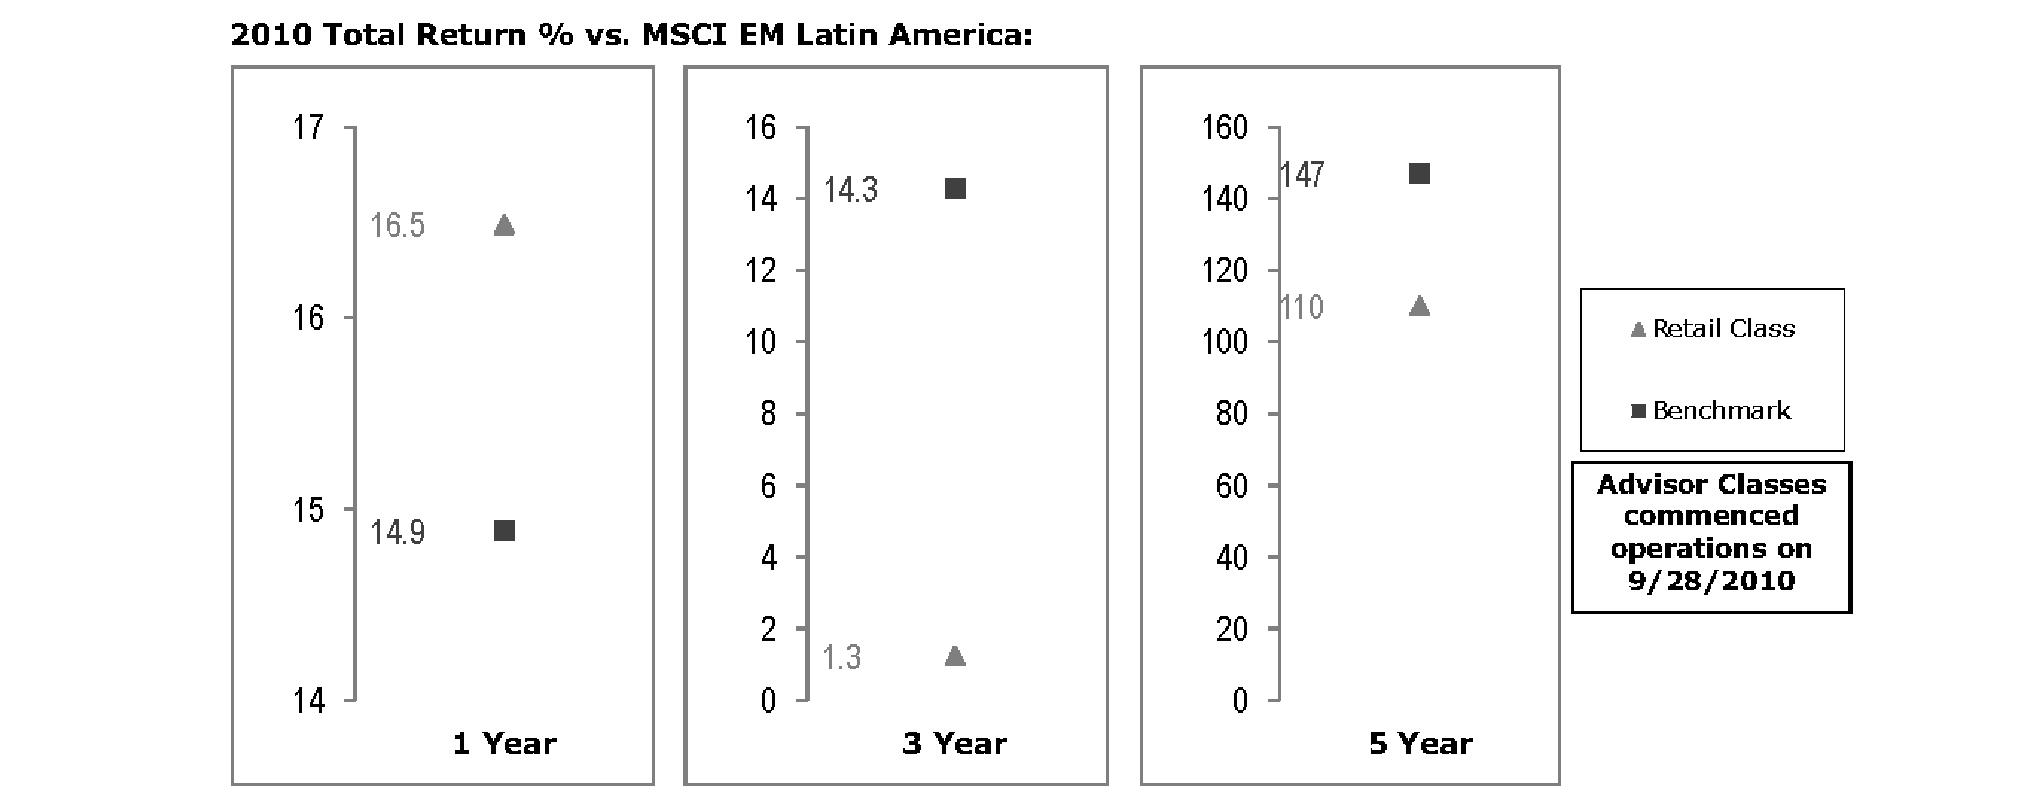
The Board noted that the investment performance of the fund was lower than its benchmark for the three- and five-year periods, although the one-year total return of the retail class compared favorably to its benchmark. The Board also reviewed the fund's performance since inception as well as performance in the current year.
Based on its review, the Board concluded that the nature, extent, and quality of services provided to the fund under the Advisory Contracts should benefit the fund's shareholders.
Competitiveness of Management Fee and Total Expense Ratio. The Board considered the fund's management fee and total expense ratio compared to "mapped groups" of competitive funds and classes. Fidelity creates "mapped groups" by combining similar Lipper investment objective categories that have comparable management fee characteristics. Combining Lipper investment objective categories aids the Board's management fee and total expense ratio comparisons by broadening the competitive group used for comparison and by reducing the number of universes to which various Fidelity funds are compared.
Management Fee. The Board considered two proprietary management fee comparisons for the 12-month periods shown in the chart below. The group of Lipper funds used by the Board for management fee comparisons is referred to below as the "Total Mapped Group." The Total Mapped Group comparison focuses on a fund's standing relative to the total universe of comparable funds available to investors in terms of gross management fees before expense reimbursements or caps, and without giving effect to the fund's performance adjustment. "TMG %" represents the percentage of funds in the Total Mapped Group that had management fees that were lower than the fund's. For example, a TMG % of 7% means that 93% of the funds in the Total Mapped Group had higher management fees than the fund. The "Asset-Size Peer Group" (ASPG) comparison focuses on a fund's standing relative to non-Fidelity funds similar in size to the fund within the Total Mapped Group. The ASPG represents at least 15% of the funds in the Total Mapped Group with comparable asset size and management fee characteristics, subject to a minimum of 50 funds (or all funds in the Total Mapped Group if fewer than 50). Additional information, such as the ASPG quartile in which the fund's management fee ranked and the impact of the fund's performance adjustment, is also included in the chart and considered by the Board.
Annual Report
Board Approval of Investment Advisory Contracts and Management Fees - continued
Fidelity Latin America Fund
The Board noted that the fund's management fee ranked below the median of its Total Mapped Group and below the median of its ASPG for 2010.
Based on its review, the Board concluded that the fund's management fee is fair and reasonable in light of the services that the fund receives and the other factors considered.
Total Expense Ratio. In its review of each class's total expense ratio, the Board considered the fund's management fee as well as other fund or class expenses, as applicable, such as transfer agent fees, pricing and bookkeeping fees, fund-paid 12b-1 fees, and custodial, legal, and audit fees. The Board also noted the effects of any waivers and reimbursements on fees and expenses, as well as the impact of the fund's performance adjustment. As part of its review, the Board also considered the current and historical total expense ratios of each class of the fund compared to competitive fund median expenses. Each class of the fund is compared to those funds and classes in the Total Mapped Group (used by the Board for management fee comparisons) that have a similar sales load structure.
The Board noted that the total expense ratio of each class ranked below its competitive median for the period. The Board considered that various factors, including 12b-1 fees, positive or negative performance adjustments, and relatively higher other expenses in the case of small fund size, can affect total expense ratios.
Fees Charged to Other Fidelity Clients. The Board also considered Fidelity fee structures and other information with respect to clients of FMR and its affiliates, such as other mutual funds advised or subadvised by FMR or its affiliates, pension plan clients, and other institutional clients. In March 2010, the Board created an ad hoc joint committee with the board of other Fidelity funds (the Committee) to review and compare Fidelity's institutional investment advisory business with its business of providing services to the Fidelity funds, including the differences in services provided, fees charged, and costs incurred, as well as competition in their respective marketplaces.
Based on its review of total expense ratios and fees charged to other Fidelity clients, the Board concluded that the total expense ratio of each class of the fund was reasonable in light of the services that the fund and its shareholders receive and the other factors considered, including the findings of the Committee.
Costs of the Services and Profitability. The Board considered the revenues earned and the expenses incurred by Fidelity in conducting the business of developing, marketing, distributing, managing, administering and servicing the fund and its shareholders. The Board also considered the level of Fidelity's profits in respect of all the Fidelity funds.
On an annual basis, FMR presents to the Board Fidelity's profitability for the fund. Fidelity calculates the profitability for each fund, as well as aggregate profitability for groups of Fidelity funds and all Fidelity funds, using a series of detailed revenue and cost allocation methodologies which originate with the books and records of Fidelity on which Fidelity's audited financial statements are based. The Audit Committee of the Board reviews any significant changes from the prior year's methodologies.
Annual Report
PricewaterhouseCoopers LLP (PwC), independent registered public accounting firm and auditor to Fidelity and certain Fidelity funds, has been engaged annually by the Board as part of the Board's assessment of Fidelity's profitability analysis. PwC's engagement includes the review and assessment of Fidelity's methodologies used in determining the revenues and expenses attributable to Fidelity's mutual fund business, and completion of agreed-upon procedures surrounding the mathematical accuracy of fund profitability and its conformity to allocation methodologies. After considering PwC's reports issued under the engagement and information provided by Fidelity, the Board concluded that while other allocation methods may also be reasonable, Fidelity's profitability methodologies are reasonable in all material respects.
The Board also reviewed Fidelity's non-fund businesses and fall-out benefits related to the mutual fund business as well as cases where Fidelity's affiliates may benefit from or be related to the fund's business.
The Board considered the costs of the services provided by and the profits realized by Fidelity in connection with the operation of the fund and was satisfied that the profitability was not excessive in the circumstances.
Economies of Scale. The Board considered whether there have been economies of scale in respect of the management of the Fidelity funds, whether the Fidelity funds (including the fund) have appropriately benefited from any such economies of scale, and whether there is potential for realization of any further economies of scale. The Board considered the extent to which the fund will benefit from economies of scale through increased services to the fund, through waivers or reimbursements, or through fee or expense reductions. The Board also noted that in 2009, it and the board of other Fidelity funds created an ad hoc committee (the Economies of Scale Committee) to analyze whether FMR attains economies of scale in respect of the management and servicing of the Fidelity funds, whether the Fidelity funds have appropriately benefited from such economies of scale, and whether there is potential for realization of any further economies of scale.
The Board recognized that the fund's management contract incorporates a "group fee" structure, which provides for lower group fee rates as total fund assets under FMR's management increase, and for higher group fee rates as total fund assets under FMR's management decrease. FMR calculates the group fee rates based on a tiered asset "breakpoint" schedule that varies based on asset class. The Board considered that the group fee is designed to deliver the benefits of economies of scale to fund shareholders when total Fidelity fund assets increase, even if assets of any particular fund are unchanged or have declined, because some portion of Fidelity's costs are attributable to services provided to all Fidelity funds, and all funds benefit if those costs can be allocated among more assets. The Board concluded that, given the group fee structure, fund shareholders will benefit from lower management fees as assets under FMR's management increase at the fund complex level, regardless of whether Fidelity achieves any such economies of scale.
The Board concluded, taking into account the analysis of the Economies of Scale Committee, that any potential economies of scale are being appropriately shared between fund shareholders and Fidelity.
Additional Information Requested by the Board. In order to develop fully the factual basis for consideration of the Fidelity funds' Advisory Contracts, the Board requested and received additional information on certain topics, including (i) fund performance trends, actions to be taken by FMR to improve certain funds' overall performance, and Fidelity's long-term strategies for certain funds; (ii) portfolio manager changes that have occurred during the past year and length of portfolio manager tenure for different categories of funds over time; (iii) Fidelity's compensation structure for portfolio managers and other key personnel and strategies for attracting and retaining non-investment personnel; (iv) the amount of the investment that each portfolio manager has made in the Fidelity fund(s) that he or she manages; (v) historical trends in Fidelity's realization of fall-out benefits; (vi) Fidelity's group fee structures and the rationale for the individual fee rates of certain funds; (vii) fund profitability methodology and the impact of certain factors on fund profitability results; (viii) trends regarding industry use of performance fee structures and Fidelity's compliance practices with respect to performance adjustment calculations; (ix) the fee structures in place for certain other Fidelity clients; and (x) explanations regarding the relative total expense ratios of certain funds and classes, total expense competitive trends, and actions that might be taken by FMR to reduce total expense ratios for certain funds and classes.
Based on its evaluation of all of the conclusions noted above, and after considering all factors it believed relevant, the Board ultimately concluded that the advisory fee structures are fair and reasonable, and that the fund's Advisory Contracts should be renewed.
Annual Report
Investment Adviser
Fidelity Management & Research Company
Boston, MA
Investment Sub-Advisers
FMR Co., Inc.
Fidelity Management & Research
(U.K.) Inc.
FIL Investment Advisors
FIL Investment Advisors
(UK) Limited
Fidelity Management & Research
(Hong Kong) Limited
Fidelity Management & Research
(Japan) Inc.
General Distributor
Fidelity Distributors Corporation
Boston, MA
Transfer and Service Agents
Fidelity Investments Institutional Operations Company, Inc.
Boston, MA
Fidelity Service Company, Inc.
Boston, MA
Custodian
Brown Brothers Harriman & Co.
Boston, MA

FALAA-UANN-1211
1.917416.101
Fidelity Advisor®
Latin America Fund
Institutional Class
Annual Report
October 31, 2011
Institutional Class is a class of
Fidelity® Latin America Fund
Contents
Chairman's Message | (Click Here) | The Chairman's message to shareholders. |
Performance | (Click Here) | How the fund has done over time. |
Management's Discussion of Fund Performance | (Click Here) | The Portfolio Manager's review of fund performance and strategy. |
Shareholder Expense Example | (Click Here) | An example of shareholder expenses. |
Investment Changes | (Click Here) | A summary of major shifts in the fund's investments over the past six months. |
Investments | (Click Here) | A complete list of the fund's investments with their market values. |
Financial Statements | (Click Here) | Statements of assets and liabilities, operations, and changes in net assets, as well as financial highlights. |
Notes | (Click Here) | Notes to the financial statements. |
Report of Independent Registered Public Accounting Firm | (Click Here) | |
Trustees and Officers | (Click Here) | |
Distributions | (Click Here) | |
Board Approval of Investment Advisory Contracts and Management Fees | (Click Here) | |
To view a fund's proxy voting guidelines and proxy voting record for the 12-month period ended June 30, visit http://www.fidelity.com/proxyvotingresults or visit the Securities and Exchange Commission's (SEC) web site at http://www.sec.gov. You may also call 1-877-208-0098 to request a free copy of the proxy voting guidelines.
Standard & Poor's, S&P and S&P 500 are registered service marks of The McGraw-Hill Companies, Inc. and have been licensed for use by Fidelity Distributors Corporation.
Other third party marks appearing herein are the property of their respective owners.
All other marks appearing herein are registered or unregistered trademarks or service marks of FMR LLC or an affiliated company.
This report and the financial statements contained herein are submitted for the general information of the shareholders of the fund. This report is not authorized for distribution to prospective investors in the fund unless preceded or accompanied by an effective prospectus.
A fund files its complete schedule of portfolio holdings with the SEC for the first and third quarters of each fiscal year on Form N-Q. Forms N-Q are available on the SEC's web site at http://www.sec.gov. A fund's Forms N-Q may be reviewed and copied at the SEC's Public Reference Room in Washington, DC. Information regarding the operation of the SEC's Public Reference Room may be obtained by calling 1-800-SEC-0330. For a complete list of a fund's portfolio holdings, view each fund's most recent holdings listing, semiannual report, or annual report on Fidelity's web site at http://www.fidelity.com, http://www.advisor.fidelity.com, or http://www.401k.com, as applicable.
NOT FDIC INSURED • MAY LOSE VALUE • NO BANK GUARANTEE
Neither the fund nor Fidelity Distributors Corporation is a bank.
Annual Report
(The Acting Chairman's photo appears here.)
Dear Shareholder:
Global equity markets began the fourth quarter on a strong note, sharply reversing course in October amid strong corporate earnings, better-than-expected economic news and the promise of a resolution to the sovereign debt crisis in Europe. The mini rally followed a third quarter marked by a significant downturn in July and August, which heightened investor anxiety and set off a wave of volatility that hampered most major asset classes through the end of September. Financial markets are difficult to predict, of course, but you can help put the odds in your favor by following these time-tested investment principles.
One of the basic tenets is to invest according to your time horizon. For long-term investors, riding out the markets' inevitable ups and downs has proven much more effective than making decisions based on short-term developments. If your goal is approaching, you can also benefit from patience and restraint, rather than attempting to time the market. No matter your time horizon, missing only a few of the markets' best days can significantly diminish returns. Patience also affords the benefits of compounding - earning interest on additional income or reinvested dividends and capital gains. While staying the course doesn't eliminate risk, it can considerably lessen the negative impact of short-term downturns.
Asset allocation is another principle to manage risk. As you spread your portfolio among the asset classes, be sure to consider your time horizon, risk tolerance and investment objectives. Younger investors may be better served by emphasizing equities, which historically have been the best-performing asset class over time. Investors who are nearing a specific goal, such as retirement or sending a child to college, may choose to favor bonds and other investments that have tended to be more stable. Studies indicate that asset allocation is the single most important determinant of a portfolio's long-term success. After deciding on a suitable allocation strategy, make sure your portfolio is adequately diversified, with exposure to stocks of small-, mid- and large-cap companies in a range of sectors, for example. And today, more than ever, geographic diversification should be taken into account.
Lastly, investing a certain amount of money on a regular basis - a principle known as dollar-cost averaging - can help lower the average cost of your purchases, while also giving you the discipline to avoid selling weak performers just prior to an upswing, or chasing a hot performer just before a correction.
We invite you to learn more by visiting us on the Internet, dropping by one of our Investor Centers or calling us by phone. It is our privilege to provide the resources you need to choose investments that are right for you.
Sincerely,
(The Acting Chairman's signature appears here.)
James C. Curvey
Acting Chairman
Annual Report
Average annual total return reflects the change in the value of an investment, assuming reinvestment of the class' distributions from dividend income and capital gains (the profits earned upon the sale of securities that have grown in value, if any) and assuming a constant rate of performance each year. The $10,000 table and the fund's returns do not reflect the deduction of taxes that a shareholder would pay on fund distributions or the redemption of fund shares. During periods of reimbursement by Fidelity, a fund's total return will be greater than it would be had the reimbursement not occurred. How a fund did yesterday is no guarantee of how it will do tomorrow.
Average Annual Total Returns
Periods ended October 31, 2011 | Past 1
year | Past 5
years | Past 10
years |
Institutional Class A | -7.98% | 7.73% | 20.26% |
A The initial offering of Institutional Class shares took place on September 28, 2010. Returns prior to September 28, 2010 are those of Fidelity® Latin America Fund, the original class of the fund.
$10,000 Over 10 Years
Let's say hypothetically that $10,000 was invested in Fidelity Advisor® Latin America Fund - Institutional Class on October 31, 2001. The chart shows how the value of your investment would have changed, and also shows how the MSCI® EM (Emerging Markets) Latin America Index performed over the same period. The initial offering of Institutional Class took place on September 28, 2010. See above for additional information regarding the performance of Institutional Class.

Annual Report
Market Recap: Emerging-markets stocks concluded the 12-month period ending October 31, 2011, on a strong note, reversing direction in October amid hope for a resolution to the sovereign debt crisis in Europe. The brief rally, on top of a robust first half of the period, could only partially offset the negative impact of a five-month downturn that began in May and intensified in August and September, as investors began to flee riskier securities due to the debt debacle, concern the U.S. economy may contract and worry about a significant slowdown in China. For the year, the MSCI® Emerging Markets Index declined 7.44%, hampered in part by global currency fluctuation. The index gained roughly 13% in October, after falling 9% in August and about 15% in September. For the full year, returns across the individual country components of the emerging-markets index were decidedly negative. Several of the largest countries in the index struggled, especially India (-20%), China (-17%) and Brazil (-12%), as did Turkey (-34%). Conversely, South Korea had the strongest result, gaining about 7%, while another sizable index component, Russia, returned roughly 1%. Smaller constituents Indonesia (+5%) and Malaysia (+4%) also finished in positive territory. A trio of countries had negative returns but outpaced the index: Mexico (-1%), Taiwan (-2%) and South Africa (-3%).
Comments from Adam Kutas, Portfolio Manager of Fidelity Advisor® Latin America Fund: For the year, the fund's Institutional Class shares returned -7.98%, outperforming the -10.27% return of the MSCI® EM (Emerging Markets) Latin America Index. The fund benefited from strong market selection in telecommunication services and from overweighting consumer staples, particularly in the food, beverage and tobacco industry. Geographically, we were helped by very strong stock selection in Brazil. The top individual contributors all came from that country: telecom companies TIM Participacoes and Vivo Participacoes, the latter of which was no longer held at period end; tobacco company Souza Cruz and beverage distributor Bebidas das Americas; electric power producer AES Tiete; and not owning steel company and underperforming index component Siderurgica Nacional. Conversely, unfavorable security selection in the consumer discretionary sector hurt - although this was offset somewhat by underweighting this lagging group - particularly in consumer durables/apparel. Underweighting information technology also detracted. Weak market positioning in Mexico and the underperformance of our Chilean holdings proved problematic. Individual detractors included untimely ownership of beverage company Fomento Economico Mexicano; not owning outperforming index component and electronics retailer Grupo Elektra; underweighting two index heavyweights from Brazil - integrated oil company Petroleo Brasileiro (Petrobras) and iron ore producer Vale; and our investment in Chilean iron and steel manufacturer CAP.
Note to shareholders: Fidelity Advisor Latin America Fund may invest up to 35% of its total assets in any industry that represents more than 20% of the Latin American market. As of October 31, 2011, the fund did not have more than 25% of its total assets in any one industry.
The views expressed above reflect those of the portfolio manager(s) only through the end of the period as stated on the cover of this report and do not necessarily represent the views of Fidelity or any other person in the Fidelity organization. Any such views are subject to change at any time based upon market or other conditions and Fidelity disclaims any responsibility to update such views. These views may not be relied on as investment advice and, because investment decisions for a Fidelity fund are based on numerous factors, may not be relied on as an indication of trading intent on behalf of any Fidelity fund.
Annual Report
Fidelity Latin America Fund
As a shareholder of the Fund, you incur two types of costs: (1) transaction costs, including sales charges (loads) on purchase payments or redemption proceeds, redemption fees, and (2) ongoing costs, including management fees, distribution and/or service (12b-1) fees and other Fund expenses. This Example is intended to help you understand your ongoing costs (in dollars) of investing in the Fund and to compare these costs with the ongoing costs of investing in other mutual funds.
The Example is based on an investment of $1,000 invested at the beginning of the period and held for the entire period (May 1, 2011 to October 31, 2011).
Actual Expenses
The first line of the accompanying table for each class of the Fund provides information about actual account values and actual expenses. You may use the information in this line, together with the amount you invested, to estimate the expenses that you paid over the period. Simply divide your account value by $1,000.00 (for example, an $8,600 account value divided by $1,000.00 = 8.6), then multiply the result by the number in the first line for a class of the Fund under the heading entitled "Expenses Paid During Period" to estimate the expenses you paid on your account during this period. A small balance maintenance fee of $12.00 that is charged once a year may apply for certain accounts with a value of less than $2,000. This fee is not included in the table below. If it was, the estimate of expenses you paid during the period would be higher, and your ending account value lower, by this amount. In addition, the Fund, as a shareholder in the underlying Fidelity Central Funds, will indirectly bear its pro-rata share of the fees and expenses incurred by the underlying Fidelity Central Funds. These fees and expenses are not included in the Fund's annualized expense ratio used to calculate the expense estimate in the table below.
Hypothetical Example for Comparison Purposes
The second line of the accompanying table for each class of the Fund provides information about hypothetical account values and hypothetical expenses based on a Class' actual expense ratio and an assumed rate of return of 5% per year before expenses, which is not the Class' actual return. The hypothetical account values and expenses may not be used to estimate the actual ending account balance or expenses you paid for the period. You may use this information to compare the ongoing costs of investing in the Fund and other funds. To do so, compare this 5% hypothetical example with the 5% hypothetical examples that appear in the shareholder reports of the other funds. A small balance maintenance fee of $12.00 that is charged once a year may apply for certain accounts with a value of less than $2,000. This fee is not included in the table below. If it was, the estimate of expenses you paid during the period would be higher, and your ending account value lower, by this amount. In addition, the Fund, as a shareholder in the underlying Fidelity Central Funds, will indirectly bear its pro-rata share of the fees and expenses incurred by the underlying Fidelity Central Funds. These fees and expenses are not included in the Fund's annualized expense ratio used to calculate the expense estimate in the table below.
Please note that the expenses shown in the table are meant to highlight your ongoing costs only and do not reflect any transaction costs. Therefore, the second line of the table is useful in comparing ongoing costs only, and will not help you determine the relative total costs of owning different funds. In addition, if these transactional costs were included, your costs would have been higher.
| Annualized
Expense Ratio | Beginning
Account Value
May 1, 2011 | Ending
Account Value
October 31, 2011 | Expenses Paid
During Period*
May 1, 2011 to
October 31, 2011 |
Class A | 1.34% | | | |
Actual | | $ 1,000.00 | $ 869.80 | $ 6.32 |
HypotheticalA | | $ 1,000.00 | $ 1,018.45 | $ 6.82 |
Class T | 1.60% | | | |
Actual | | $ 1,000.00 | $ 868.70 | $ 7.54 |
HypotheticalA | | $ 1,000.00 | $ 1,017.14 | $ 8.13 |
Class B | 2.09% | | | |
Actual | | $ 1,000.00 | $ 866.70 | $ 9.83 |
HypotheticalA | | $ 1,000.00 | $ 1,014.67 | $ 10.61 |
Class C | 2.08% | | | |
Actual | | $ 1,000.00 | $ 866.60 | $ 9.79 |
HypotheticalA | | $ 1,000.00 | $ 1,014.72 | $ 10.56 |
Latin America | 1.00% | | | |
Actual | | $ 1,000.00 | $ 871.20 | $ 4.72 |
HypotheticalA | | $ 1,000.00 | $ 1,020.16 | $ 5.09 |
Institutional Class | 1.03% | | | |
Actual | | $ 1,000.00 | $ 871.10 | $ 4.86 |
HypotheticalA | | $ 1,000.00 | $ 1,020.01 | $ 5.24 |
A 5% return per year before expenses
* Expenses are equal to each Class' annualized expense ratio, multiplied by the average account value over the period, multiplied by 184/365 (to reflect the one-half year period).
Annual Report
Fidelity Latin America Fund
Investment Changes (Unaudited)
Geographic Diversification (% of fund's net assets) |
As of October 31, 2011 |
 | Brazil | 56.9% | |
 | Mexico | 19.5% | |
 | Chile | 12.4% | |
 | Colombia | 3.6% | |
 | United States of America | 2.8% | |
 | Peru | 2.3% | |
 | Luxembourg | 1.4% | |
 | Canada | 0.8% | |
 | Norway | 0.3% | |

Percentages are adjusted for the effect of futures contracts, if applicable. |
As of April 30, 2011 |
| Brazil | 60.1% | |
| Mexico | 17.7% | |
| Chile | 12.9% | |
| United States of America | 3.0% | |
| Colombia | 2.7% | |
| Peru | 1.7% | |
 | Luxembourg | 1.3% | |
| Canada | 0.6% | |

Percentages are adjusted for the effect of futures contracts, if applicable. |
Asset Allocation |
| % of fund's
net assets | % of fund's net assets
6 months ago |
Stocks | 98.0 | 98.4 |
Short-Term Investments and Net Other Assets | 2.0 | 1.6 |
Top Ten Stocks as of October 31, 2011 |
| % of fund's
net assets | % of fund's net assets
6 months ago |
America Movil SAB de CV Series L (Mexico, Wireless Telecommunication Services) | 9.2 | 8.3 |
Itau Unibanco Banco Multiplo SA (Brazil, Commercial Banks) | 8.5 | 8.5 |
Vale SA (PN-A) (Brazil, Metals & Mining) | 5.4 | 5.8 |
Companhia de Bebidas das Americas (AmBev) (PN) sponsored ADR (Brazil, Beverages) | 4.6 | 4.5 |
Wal-Mart de Mexico SA de CV Series V (Mexico, Food & Staples Retailing) | 4.6 | 4.6 |
Petroleo Brasileiro SA - Petrobras sponsored ADR (Brazil, Oil, Gas & Consumable Fuels) | 3.8 | 4.7 |
Petroleo Brasileiro SA - Petrobras (PN) (non-vtg.) (Brazil, Oil, Gas & Consumable Fuels) | 3.6 | 3.5 |
CAP SA (Chile, Metals & Mining) | 3.4 | 3.5 |
Banco Bradesco SA (PN) (Brazil, Commercial Banks) | 3.0 | 3.5 |
Vale SA sponsored ADR (Brazil, Metals & Mining) | 2.7 | 3.4 |
| 48.8 | |
Market Sectors as of October 31, 2011 |
| % of fund's
net assets | % of fund's net assets
6 months ago |
Consumer Staples | 18.4 | 19.5 |
Materials | 18.0 | 17.9 |
Financials | 17.9 | 18.4 |
Telecommunication Services | 16.1 | 14.4 |
Energy | 12.9 | 15.1 |
Utilities | 7.1 | 6.6 |
Industrials | 4.3 | 3.5 |
Consumer Discretionary | 3.2 | 3.0 |
Health Care | 0.1 | 0.0 |
Annual Report
Fidelity Latin America Fund
Investments October 31, 2011
Showing Percentage of Net Assets
Common Stocks - 98.0% |
| Shares | | Value |
Brazil - 56.9% |
AES Tiete SA (PN) (non-vtg.) | 4,965,445 | | $ 70,757,302 |
Banco Bradesco SA: | | | |
(PN) | 3,184,616 | | 57,583,465 |
(PN) sponsored ADR | 1,774,697 | | 32,299,485 |
Brasil Foods SA | 1,040,200 | | 21,655,690 |
Brasil Insurance Participacoes e Administracao SA | 780,000 | | 7,494,759 |
Braskem SA Class A sponsored ADR | 286,200 | | 5,163,048 |
Brookfield Incorporacoes SA | 5,954,800 | | 22,887,072 |
Companhia de Bebidas das Americas (AmBev): | | | |
(PN) sponsored ADR | 4,151,130 | | 139,976,104 |
sponsored ADR | 341,225 | | 9,189,189 |
Companhia de Concessoes Rodoviarias | 1,623,600 | | 44,674,528 |
CPFL Energia SA sponsored ADR (d) | 1,366,799 | | 35,523,106 |
Eletropaulo Metropolitana SA (PN-B) | 1,220,220 | | 21,886,080 |
Itau Unibanco Banco Multiplo SA | 3,470,631 | | 66,150,566 |
Itau Unibanco Banco Multiplo SA sponsored ADR | 10,085,003 | | 192,825,257 |
Itausa-Investimentos Itau SA (PN) | 4,827,500 | | 30,221,072 |
Light SA | 1,068,500 | | 16,644,756 |
Lojas Americanas SA (PN) | 3,561,037 | | 31,313,568 |
Lupatech SA (a) | 981,100 | | 5,142,034 |
Multiplus SA | 1,777,500 | | 30,018,344 |
OGX Petroleo e Gas Participacoes SA (a) | 1,674,600 | | 13,847,729 |
Petroleo Brasileiro SA - Petrobras: | | | |
(ON) | 908,128 | | 12,205,680 |
(PN) (non-vtg.) | 8,786,971 | | 109,095,168 |
(PN) sponsored ADR (d) | 2,847,161 | | 72,004,702 |
sponsored ADR | 4,254,220 | | 114,906,482 |
Souza Cruz Industria Comerico | 5,964,700 | | 73,151,981 |
TAM SA (PN) sponsored ADR (ltd. vtg.) (d) | 2,494,846 | | 50,121,456 |
Telefonica Brasil SA | 1,210,613 | | 35,214,372 |
Telefonica Brasil SA sponsored ADR (a) | 1,428,583 | | 41,457,479 |
TIM Participacoes SA | 5,577,495 | | 28,842,392 |
TIM Participacoes SA sponsored ADR (d) | 1,553,224 | | 40,445,953 |
Tractebel Energia SA | 776,000 | | 12,427,207 |
Usinas Siderurgicas de Minas Gerais SA - Usiminas | 1,684,750 | | 24,184,188 |
Usinas Siderurgicas de Minas Gerais SA - Usiminas (PN-A) (non-vtg.) | 3,539,400 | | 24,321,523 |
Vale SA: | | | |
(PN-A) | 1,755,200 | | 41,702,865 |
(PN-A) sponsored ADR | 5,163,929 | | 121,868,724 |
sponsored ADR | 3,257,362 | | 82,769,568 |
TOTAL BRAZIL | | 1,739,972,894 |
|
| Shares | | Value |
Canada - 0.8% |
Petrominerales Ltd. | 655,300 | | $ 17,288,850 |
Silver Standard Resources, Inc. (a) | 372,300 | | 7,293,360 |
TOTAL CANADA | | 24,582,210 |
Chile - 12.4% |
Banco Santander Chile sponsored ADR (d) | 995,186 | | 81,286,792 |
CAP SA | 2,723,464 | | 105,064,197 |
CFR Pharmaceuticals SA | 17,206,348 | | 4,073,756 |
Compania Cervecerias Unidas SA | 3,361,122 | | 38,073,744 |
Compania Cervecerias Unidas SA sponsored ADR (d) | 202,200 | | 11,582,016 |
Empresa Nacional de Electricidad SA | 5,333,893 | | 8,545,988 |
Empresa Nacional de Telecomunicaciones SA (ENTEL) | 1,795,610 | | 35,549,384 |
Enersis SA | 34,899,771 | | 14,167,907 |
Enersis SA sponsored ADR | 1,805,047 | | 35,433,073 |
SACI Falabella | 4,770,394 | | 44,787,870 |
TOTAL CHILE | | 378,564,727 |
Colombia - 3.6% |
BanColombia SA sponsored ADR (d) | 304,029 | | 18,965,329 |
Bolsa de Valores de Colombia | 576,460,285 | | 10,287,320 |
Ecopetrol SA | 25,394,899 | | 54,437,115 |
Empresa de Telecomunicaciones de Bogota | 34,198,589 | | 10,409,866 |
Grupo de Inversiones Surameric | 946,202 | | 16,621,929 |
Grupo de Inversiones Surameric rights 11/22/11 (a) | 275,614 | | 41,357 |
TOTAL COLOMBIA | | 110,762,916 |
Luxembourg - 1.4% |
Millicom International Cellular SA (depositary receipt) | 191,813 | | 21,139,134 |
Ternium SA sponsored ADR | 943,707 | | 23,158,570 |
TOTAL LUXEMBOURG | | 44,297,704 |
Mexico - 19.5% |
America Movil SAB de CV: | | | |
Series L | 5,073,400 | | 6,478,796 |
Series L sponsored ADR | 10,878,828 | | 276,539,807 |
Bolsa Mexicana de Valores SA de CV | 13,306,500 | | 21,757,681 |
Coca-Cola FEMSA SAB de CV sponsored ADR | 209,100 | | 18,724,905 |
Compartamos SAB de CV | 7,429,600 | | 11,484,515 |
Fomento Economico Mexicano SAB de CV sponsored ADR | 289,400 | | 19,404,270 |
Grupo Comercial Chedraui de CV | 5,604,100 | | 13,492,602 |
Grupo Modelo SAB de CV Series C | 3,093,800 | | 19,624,041 |
Industrias Penoles SA de CV | 712,955 | | 28,689,693 |
Common Stocks - continued |
| Shares | | Value |
Mexico - continued |
Kimberly-Clark de Mexico SA de CV Series A | 6,939,600 | | $ 39,501,092 |
Wal-Mart de Mexico SA de CV Series V | 54,347,670 | | 140,396,567 |
TOTAL MEXICO | | 596,093,969 |
Norway - 0.3% |
Copeinca ASA (a) | 1,297,051 | | 8,410,005 |
Peru - 2.3% |
Alicorp SA Class C | 3,055,222 | | 6,772,326 |
Compania de Minas Buenaventura SA sponsored ADR | 1,582,600 | | 64,775,818 |
TOTAL PERU | | 71,548,144 |
United States of America - 0.8% |
Southern Copper Corp. | 812,400 | | 24,924,432 |
TOTAL COMMON STOCKS (Cost $1,609,339,679) | 2,999,157,001 |
Money Market Funds - 5.8% |
| Shares | | Value |
Fidelity Cash Central Fund, 0.12% (b) | 38,877,614 | | $ 38,877,614 |
Fidelity Securities Lending Cash Central Fund, 0.11% (b)(c) | 138,971,400 | | 138,971,400 |
TOTAL MONEY MARKET FUNDS (Cost $177,849,014) | 177,849,014 |
TOTAL INVESTMENT PORTFOLIO - 103.8% (Cost $1,787,188,693) | | 3,177,006,015 |
NET OTHER ASSETS (LIABILITIES) - (3.8)% | | (116,357,760) |
NET ASSETS - 100% | $ 3,060,648,255 |
Legend |
(a) Non-income producing |
(b) Affiliated fund that is available only to investment companies and other accounts managed by Fidelity Investments. The rate quoted is the annualized seven-day yield of the fund at period end. A complete unaudited listing of the fund's holdings as of its most recent quarter end is available upon request. In addition, each Fidelity Central Fund's financial statements, which are not covered by the Fund's Report of Independent Registered Public Accounting Firm, are available on the SEC's website or upon request. |
(c) Investment made with cash collateral received from securities on loan. |
(d) Security or a portion of the security is on loan at period end. |
Affiliated Central Funds |
Information regarding fiscal year to date income earned by the Fund from investments in Fidelity Central Funds is as follows: |
Fund | Income earned |
Fidelity Cash Central Fund | $ 45,797 |
Fidelity Securities Lending Cash Central Fund | 397,722 |
Total | $ 443,519 |
Other Information |
The following is a summary of the inputs used, as of October 31, 2011, involving the Fund's assets and liabilities carried at fair value. The inputs or methodology used for valuing securities may not be an indication of the risk associated with investing in those securities. For more information on valuation inputs, and their aggregation into the levels used in the table below, please refer to the Security Valuation section in the accompanying Notes to Financial Statements. |
Valuation Inputs at Reporting Date: |
Description | Total | Level 1 | Level 2 | Level 3 |
Investments in Securities: | | | | |
Equities: | | | | |
Brazil | $ 1,739,972,894 | $ 1,739,972,894 | $ - | $ - |
Mexico | 596,093,969 | 596,093,969 | - | - |
Chile | 378,564,727 | 378,564,727 | - | - |
Colombia | 110,762,916 | 110,721,559 | 41,357 | - |
Peru | 71,548,144 | 71,548,144 | - | - |
Luxembourg | 44,297,704 | 44,297,704 | - | - |
United States of America | 24,924,432 | 24,924,432 | - | - |
Canada | 24,582,210 | 24,582,210 | - | - |
Norway | 8,410,005 | 8,410,005 | - | - |
Money Market Funds | 177,849,014 | 177,849,014 | - | - |
Total Investments in Securities: | $ 3,177,006,015 | $ 3,176,964,658 | $ 41,357 | $ - |
Income Tax Information |
At October 31, 2011, the Fund had a capital loss carryforward of approximately $96,320,870 of which $22,463,155 and $73,857,715 will expire in fiscal 2016 and 2017, respectively. Capital loss carryforwards are only available to offset future capital gains of the Fund to the extent provided by regulations and may be limited. |
The capital loss carryforward expiring October 31, 2016 was acquired from Fidelity Advisor Latin America Fund. |
See accompanying notes which are an integral part of the financial statements.
Annual Report
Fidelity Latin America Fund
Statement of Assets and Liabilities
| October 31, 2011 |
| | |
Assets | | |
Investment in securities, at value (including securities loaned of $132,968,419) - See accompanying schedule: Unaffiliated issuers (cost $1,609,339,679) | $ 2,999,157,001 | |
Fidelity Central Funds (cost $177,849,014) | 177,849,014 | |
Total Investments (cost $1,787,188,693) | | $ 3,177,006,015 |
Foreign currency held at value (cost $12,549,606) | | 12,617,377 |
Receivable for investments sold | | 2,097,234 |
Receivable for fund shares sold | | 2,521,871 |
Dividends receivable | | 17,868,344 |
Distributions receivable from Fidelity Central Funds | | 19,346 |
Prepaid expenses | | 11,748 |
Other receivables | | 251,992 |
Total assets | | 3,212,393,927 |
| | |
Liabilities | | |
Payable for investments purchased | $ 5,902,112 | |
Payable for fund shares redeemed | 4,206,545 | |
Accrued management fee | 1,696,988 | |
Distribution and service plan fees payable | 65,704 | |
Other affiliated payables | 671,439 | |
Other payables and accrued expenses | 231,484 | |
Collateral on securities loaned, at value | 138,971,400 | |
Total liabilities | | 151,745,672 |
| | |
Net Assets | | $ 3,060,648,255 |
Net Assets consist of: | | |
Paid in capital | | $ 1,744,785,826 |
Undistributed net investment income | | 34,016,290 |
Accumulated undistributed net realized gain (loss) on investments and foreign currency transactions | | (108,069,810) |
Net unrealized appreciation (depreciation) on investments and assets and liabilities in foreign currencies | | 1,389,915,949 |
Net Assets | | $ 3,060,648,255 |
Statement of Assets and Liabilities - continued
| October 31, 2011 |
| | |
Calculation of Maximum Offering Price Class A:
Net Asset Value and redemption price per share ($91,406,884 ÷ 1,745,019 shares) | | $ 52.38 |
| | |
Maximum offering price per share (100/94.25 of $52.38) | | $ 55.58 |
Class T:
Net Asset Value and redemption price per share ($26,020,229 ÷ 497,850 shares) | | $ 52.27 |
| | |
Maximum offering price per share (100/96.50 of $52.27) | | $ 54.17 |
Class B:
Net Asset Value and offering price per share ($14,113,935 ÷ 271,135 shares)A | | $ 52.06 |
| | |
Class C:
Net Asset Value and offering price per share ($35,203,130 ÷ 676,369 shares)A | | $ 52.05 |
| | |
Latin America:
Net Asset Value, offering price and redemption price per share ($2,884,301,428 ÷ 54,955,792 shares) | | $ 52.48 |
| | |
Institutional Class:
Net Asset Value, offering price and redemption price per share ($9,602,649 ÷ 182,860 shares) | | $ 52.51 |
A Redemption price per share is equal to net asset value less any applicable contingent deferred sales charge.
See accompanying notes which are an integral part of the financial statements.
Annual Report
Fidelity Latin America Fund
Financial Statements - continued
Statement of Operations
| Year ended October 31, 2011 |
| | |
Investment Income | | |
Dividends | | $ 140,014,056 |
Interest | | 157 |
Income from Fidelity Central Funds | | 443,519 |
Income before foreign taxes withheld | | 140,457,732 |
Less foreign taxes withheld | | (10,432,951) |
Total income | | 130,024,781 |
| | |
Expenses | | |
Management fee | $ 27,173,065 | |
Transfer agent fees | 8,141,717 | |
Distribution and service plan fees | 1,039,278 | |
Accounting and security lending fees | 1,494,378 | |
Custodian fees and expenses | 1,577,432 | |
Independent trustees' compensation | 21,700 | |
Registration fees | 137,345 | |
Audit | 65,324 | |
Legal | 31,816 | |
Interest | 8,383 | |
Miscellaneous | 44,176 | |
Total expenses before reductions | 39,734,614 | |
Expense reductions | (84,041) | 39,650,573 |
Net investment income (loss) | | 90,374,208 |
Realized and Unrealized Gain (Loss) Net realized gain (loss) on: | | |
Investment securities: | | |
Unaffiliated issuers | 338,788,328 | |
Foreign currency transactions | (764,969) | |
Total net realized gain (loss) | | 338,023,359 |
Change in net unrealized appreciation (depreciation) on: Investment securities | (733,223,257) | |
Assets and liabilities in foreign currencies | 84,819 | |
Total change in net unrealized appreciation (depreciation) | | (733,138,438) |
Net gain (loss) | | (395,115,079) |
Net increase (decrease) in net assets resulting from operations | | $ (304,740,871) |
Statement of Changes in Net Assets
| Year ended
October 31,
2011 | Year ended
October 31,
2010 |
Increase (Decrease) in Net Assets | | |
Operations | | |
Net investment income (loss) | $ 90,374,208 | $ 87,692,165 |
Net realized gain (loss) | 338,023,359 | 293,510,668 |
Change in net unrealized appreciation (depreciation) | (733,138,438) | 519,183,458 |
Net increase (decrease) in net assets resulting from operations | (304,740,871) | 900,386,291 |
Distributions to shareholders from net investment income | (22,292,136) | (118,560,409) |
Distributions to shareholders from net realized gain | (15,707,585) | (33,986,366) |
Total distributions | (37,999,721) | (152,546,775) |
Share transactions - net increase (decrease) | (1,114,870,853) | (275,675,234) |
Redemption fees | 763,732 | 1,583,234 |
Total increase (decrease) in net assets | (1,456,847,713) | 473,747,516 |
| | |
Net Assets | | |
Beginning of period | 4,517,495,968 | 4,043,748,452 |
End of period (including undistributed net investment income of $34,016,290 and undistributed net investment income of $12,014,368, respectively) | $ 3,060,648,255 | $ 4,517,495,968 |
See accompanying notes which are an integral part of the financial statements.
Annual Report
Financial Highlights - Class A
Years ended October 31, | 2011 | 2010 H |
Selected Per-Share Data | | |
Net asset value, beginning of period | $ 57.48 | $ 55.47 |
Income from Investment Operations | | |
Net investment income (loss) E | 1.15 | .02 |
Net realized and unrealized gain (loss) | (5.87) | 2.79 |
Total from investment operations | (4.72) | 2.81 |
Distributions from net investment income | (.19) | (.80) |
Distributions from net realized gain | (.20) | - |
Total distributions | (.39) | (.80) |
Redemption fees added to paid in capital E | .01 | - K |
Net asset value, end of period | $ 52.38 | $ 57.48 |
Total Return B, C, D | (8.26)% | 5.14% |
Ratios to Average Net Assets F, I | | |
Expenses before reductions | 1.34% | 1.37% A |
Expenses net of fee waivers, if any | 1.34% | 1.37% A |
Expenses net of all reductions | 1.34% | 1.34% A |
Net investment income (loss) | 2.05% | .39% A |
Supplemental Data | | |
Net assets, end of period (000 omitted) | $ 91,407 | $ 115,626 |
Portfolio turnover rate G | 11% | 56% J |
A Annualized B Total returns for periods of less than one year are not annualized. C Total returns would have been lower if certain expenses had not been reduced during the applicable periods shown. D Total returns do not include the effect of the sales charges. E Calculated based on average shares outstanding during the period. F Fees and expenses of any underlying Fidelity Central Funds are not included in the Fund's expense ratio. The Fund indirectly bears its proportionate share of the expenses of any underlying Fidelity Central Funds. G Amount does not include the portfolio activity of any underlying Fidelity Central Funds. H For the period September 28, 2010 (commencement of sale of shares) to October 31, 2010. I Expense ratios reflect operating expenses of the class. Expenses before reductions do not reflect amounts reimbursed by the investment adviser or reductions from brokerage service arrangements or reductions from other expense offset arrangements and do not represent the amount paid by the class during periods when reimbursements or reductions occur. Expense ratios before reductions for start-up periods may not be representative of longer-term operating periods. Expenses net of fee waivers reflect expenses after reimbursement by the investment adviser but prior to reductions from brokerage service arrangements or other expense offset arrangements. Expenses net of all reductions represent the net expenses paid by the class. J The portfolio turnover rate does not include the assets acquired in the merger. K Amount represents less than $.01 per share. |
Financial Highlights - Class T
Years ended October 31, | 2011 | 2010 H |
Selected Per-Share Data | | |
Net asset value, beginning of period | $ 57.47 | $ 55.47 |
Income from Investment Operations | | |
Net investment income (loss) E | .99 | .01 |
Net realized and unrealized gain (loss) | (5.85) | 2.79 |
Total from investment operations | (4.86) | 2.80 |
Distributions from net investment income | (.15) | (.80) |
Distributions from net realized gain | (.20) | - |
Total distributions | (.35) | (.80) |
Redemption fees added to paid in capital E | .01 | - K |
Net asset value, end of period | $ 52.27 | $ 57.47 |
Total Return B, C, D | (8.50)% | 5.12% |
Ratios to Average Net Assets F, I | | |
Expenses before reductions | 1.61% | 1.63% A |
Expenses net of fee waivers, if any | 1.61% | 1.63% A |
Expenses net of all reductions | 1.61% | 1.60% A |
Net investment income (loss) | 1.78% | .13% A |
Supplemental Data | | |
Net assets, end of period (000 omitted) | $ 26,020 | $ 36,820 |
Portfolio turnover rate G | 11% | 56% J |
A Annualized B Total returns for periods of less than one year are not annualized. C Total returns would have been lower if certain expenses had not been reduced during the applicable periods shown. D Total returns do not include the effect of the sales charges. E Calculated based on average shares outstanding during the period. F Fees and expenses of any underlying Fidelity Central Funds are not included in the Fund's expense ratio. The Fund indirectly bears its proportionate share of the expenses of any underlying Fidelity Central Funds. G Amount does not include the portfolio activity of any underlying Fidelity Central Funds. H For the period September 28, 2010 (commencement of sale of shares) to October 31, 2010. I Expense ratios reflect operating expenses of the class. Expenses before reductions do not reflect amounts reimbursed by the investment adviser or reductions from brokerage service arrangements or reductions from other expense offset arrangements and do not represent the amount paid by the class during periods when reimbursements or reductions occur. Expense ratios before reductions for start-up periods may not be representative of longer-term operating periods. Expenses net of fee waivers reflect expenses after reimbursement by the investment adviser but prior to reductions from brokerage service arrangements or other expense offset arrangements. Expenses net of all reductions represent the net expenses paid by the class. J The portfolio turnover rate does not include the assets acquired in the merger. K Amount represents less than $.01 per share. |
See accompanying notes which are an integral part of the financial statements.
Annual Report
Financial Highlights - Class B
Years ended October 31, | 2011 | 2010 H |
Selected Per-Share Data | | |
Net asset value, beginning of period | $ 57.44 | $ 55.47 |
Income from Investment Operations | | |
Net investment income (loss) E | .72 | (.02) |
Net realized and unrealized gain (loss) | (5.84) | 2.79 |
Total from investment operations | (5.12) | 2.77 |
Distributions from net investment income | (.07) | (.80) |
Distributions from net realized gain | (.20) | - |
Total distributions | (.27) | (.80) |
Redemption fees added to paid in capital E | .01 | - K |
Net asset value, end of period | $ 52.06 | $ 57.44 |
Total Return B, C, D | (8.94)% | 5.06% |
Ratios to Average Net Assets F, I | | |
Expenses before reductions | 2.10% | 2.12% A |
Expenses net of fee waivers, if any | 2.10% | 2.12% A |
Expenses net of all reductions | 2.10% | 2.10% A |
Net investment income (loss) | 1.29% | (.36)% A |
Supplemental Data | | |
Net assets, end of period (000 omitted) | $ 14,114 | $ 20,392 |
Portfolio turnover rate G | 11% | 56% J |
A Annualized B Total returns for periods of less than one year are not annualized. C Total returns would have been lower if certain expenses had not been reduced during the applicable periods shown. D Total returns do not include the effect of the contingent deferred sales charge. E Calculated based on average shares outstanding during the period. F Fees and expenses of any underlying Fidelity Central Funds are not included in the Fund's expense ratio. The Fund indirectly bears its proportionate share of the expenses of any underlying Fidelity Central Funds. G Amount does not include the portfolio activity of any underlying Fidelity Central Funds. H For the period September 28, 2010 (commencement of sale of shares) to October 31, 2010. I Expense ratios reflect operating expenses of the class. Expenses before reductions do not reflect amounts reimbursed by the investment adviser or reductions from brokerage service arrangements or reductions from other expense offset arrangements and do not represent the amount paid by the class during periods when reimbursements or reductions occur. Expense ratios before reductions for start-up periods may not be representative of longer-term operating periods. Expenses net of fee waivers reflect expenses after reimbursement by the investment adviser but prior to reductions from brokerage service arrangements or other expense offset arrangements. Expenses net of all reductions represent the net expenses paid by the class. J The portfolio turnover rate does not include the assets acquired in the merger. K Amount represents less than $.01 per share. |
Financial Highlights - Class C
Years ended October 31, | 2011 | 2010 H |
Selected Per-Share Data | | |
Net asset value, beginning of period | $ 57.44 | $ 55.47 |
Income from Investment Operations | | |
Net investment income (loss) E | .73 | (.02) |
Net realized and unrealized gain (loss) | (5.84) | 2.79 |
Total from investment operations | (5.11) | 2.77 |
Distributions from net investment income | (.09) | (.80) |
Distributions from net realized gain | (.20) | - |
Total distributions | (.29) | (.80) |
Redemption fees added to paid in capital E | .01 | - K |
Net asset value, end of period | $ 52.05 | $ 57.44 |
Total Return B, C, D | (8.93)% | 5.06% |
Ratios to Average Net Assets F, I | | |
Expenses before reductions | 2.08% | 2.09% A |
Expenses net of fee waivers, if any | 2.08% | 2.09% A |
Expenses net of all reductions | 2.08% | 2.07% A |
Net investment income (loss) | 1.31% | (.34)% A |
Supplemental Data | | |
Net assets, end of period (000 omitted) | $ 35,203 | $ 48,329 |
Portfolio turnover rate G | 11% | 56% J |
A Annualized B Total returns for periods of less than one year are not annualized. C Total returns would have been lower if certain expenses had not been reduced during the applicable periods shown. D Total returns do not include the effect of the contingent deferred sales charge. E Calculated based on average shares outstanding during the period. F Fees and expenses of any underlying Fidelity Central Funds are not included in the Fund's expense ratio. The Fund indirectly bears its proportionate share of the expenses of any underlying Fidelity Central Funds. G Amount does not include the portfolio activity of any underlying Fidelity Central Funds. H For the period September 28, 2010 (commencement of sale of shares) to October 31, 2010. I Expense ratios reflect operating expenses of the class. Expenses before reductions do not reflect amounts reimbursed by the investment adviser or reductions from brokerage service arrangements or reductions from other expense offset arrangements and do not represent the amount paid by the class during periods when reimbursements or reductions occur. Expense ratios before reductions for start-up periods may not be representative of longer-term operating periods. Expenses net of fee waivers reflect expenses after reimbursement by the investment adviser but prior to reductions from brokerage service arrangements or other expense offset arrangements. Expenses net of all reductions represent the net expenses paid by the class. J The portfolio turnover rate does not include the assets acquired in the merger. K Amount represents less than $.01 per share. |
See accompanying notes which are an integral part of the financial statements.
Annual Report
Financial Highlights - Latin America
Years ended October 31, | 2011 | 2010 | 2009 | 2008 | 2007 |
Selected Per-Share Data | | | | | |
Net asset value, beginning of period | $ 57.50 | $ 47.29 | $ 28.69 | $ 67.90 | $ 41.13 |
Income from Investment Operations | | | | | |
Net investment income (loss) B | 1.34 | 1.07 | .72 | .83 | .68 |
Net realized and unrealized gain (loss) | (5.88) | 11.00 | 18.32 | (37.74) | 27.43 |
Total from investment operations | (4.54) | 12.07 | 19.04 | (36.91) | 28.11 |
Distributions from net investment income | (.29) | (1.49) | (.46) | (.65) | (.61) |
Distributions from net realized gain | (.20) | (.39) | - | (1.72) | (.77) |
Total distributions | (.49) | (1.88) | (.46) | (2.37) | (1.38) |
Redemption fees added to paid in capital B | .01 | .02 | .02 | .07 | .04 |
Net asset value, end of period | $ 52.48 | $ 57.50 | $ 47.29 | $ 28.69 | $ 67.90 |
Total Return A | (7.96)% | 25.91% | 67.88% | (56.20)% | 70.35% |
Ratios to Average Net Assets C, E | | | | | |
Expenses before reductions | 1.00% | 1.03% | 1.07% | 1.02% | 1.00% |
Expenses net of fee waivers, if any | 1.00% | 1.03% | 1.07% | 1.02% | 1.00% |
Expenses net of all reductions | 1.00% | 1.01% | 1.05% | 1.00% | .98% |
Net investment income (loss) | 2.39% | 2.10% | 2.04% | 1.41% | 1.33% |
Supplemental Data | | | | | |
Net assets, end of period (000 omitted) | $ 2,884,301 | $ 4,283,462 | $ 4,043,748 | $ 2,225,606 | $ 6,219,690 |
Portfolio turnover rate D | 11% | 56% F | 52% | 51% | 52% |
A Total returns would have been lower if certain expenses had not been reduced during the applicable periods shown. B Calculated based on average shares outstanding during the period. C Fees and expenses of any underlying Fidelity Central Funds are not included in the Fund's expense ratio. The Fund indirectly bears its proportionate share of the expenses of any underlying Fidelity Central Funds. D Amount does not include the portfolio activity of any underlying Fidelity Central Funds. E Expense ratios reflect operating expenses of the class. Expenses before reductions do not reflect amounts reimbursed by the investment adviser or reductions from brokerage service arrangements or reductions from other expense offset arrangements and do not represent the amount paid by the class during periods when reimbursements or reductions occur. Expenses net of fee waivers reflect expenses after reimbursement by the investment adviser but prior to reductions from brokerage service arrangements or other expense offset arrangements. Expenses net of all reductions represent the net expenses paid by the class. F The portfolio turnover rate does not include the assets acquired in the merger. |
Financial Highlights - Institutional Class
Years ended October 31, | 2011 | 2010 G |
Selected Per-Share Data | | |
Net asset value, beginning of period | $ 57.49 | $ 55.47 |
Income from Investment Operations | | |
Net investment income (loss) D | 1.32 | .03 |
Net realized and unrealized gain (loss) | (5.88) | 2.79 |
Total from investment operations | (4.56) | 2.82 |
Distributions from net investment income | (.23) | (.80) |
Distributions from net realized gain | (.20) | - |
Total distributions | (.43) | (.80) |
Redemption fees added to paid in capital D | .01 | - J |
Net asset value, end of period | $ 52.51 | $ 57.49 |
Total Return B, C | (7.98)% | 5.15% |
Ratios to Average Net Assets E, H | | |
Expenses before reductions | 1.04% | 1.08% A |
Expenses net of fee waivers, if any | 1.04% | 1.08% A |
Expenses net of all reductions | 1.04% | 1.06% A |
Net investment income (loss) | 2.35% | .68% A |
Supplemental Data | | |
Net assets, end of period (000 omitted) | $ 9,603 | $ 12,868 |
Portfolio turnover rate F | 11% | 56% I |
A Annualized B Total returns for periods of less than one year are not annualized. C Total returns would have been lower if certain expenses had not been reduced during the applicable periods shown. D Calculated based on average shares outstanding during the period. E Fees and expenses of any underlying Fidelity Central Funds are not included in the Fund's expense ratio. The Fund indirectly bears its proportionate share of the expenses of any underlying Fidelity Central Funds. F Amount does not include the portfolio activity of any underlying Fidelity Central Funds. G For the period September 28, 2010 (commencement of sale of shares) to October 31, 2010. H Expense ratios reflect operating expenses of the class. Expenses before reductions do not reflect amounts reimbursed by the investment adviser or reductions from brokerage service arrangements or reductions from other expense offset arrangements and do not represent the amount paid by the class during periods when reimbursements or reductions occur. Expense ratios before reductions for start-up periods may not be representative of longer-term operating periods. Expenses net of fee waivers reflect expenses after reimbursement by the investment adviser but prior to reductions from brokerage service arrangements or other expense offset arrangements. Expenses net of all reductions represent the net expenses paid by the class. I The portfolio turnover rate does not include the assets acquired in the merger. J Amount represents less than $.01 per share. |
See accompanying notes which are an integral part of the financial statements.
Annual Report
Notes to Financial Statements
For the period ended October 31, 2011
1. Organization.
Fidelity Latin America Fund (the Fund) is a non-diversified fund of Fidelity Investment Trust (the Trust) and is authorized to issue an unlimited number of shares. The Trust is registered under the Investment Company Act of 1940, as amended (the 1940 Act), as an open-end management investment company organized as a Massachusetts business trust. The Fund offers Class A, Class T, Class C, Latin America and Institutional Class shares, each of which, along with Class B shares, has equal rights as to assets and voting privileges. Effective after the close of business on September 1, 2010, Class B shares were closed to new accounts and additional purchases, except for exchanges and reinvestments by existing shareholders. Each class has exclusive voting rights with respect to matters that affect that class. Class B shares automatically convert to Class A shares after a holding period of seven years from the initial date of purchase. Investment income, realized and unrealized capital gains and losses, the common expenses of the Fund, and certain fund-level expense reductions, if any, are allocated on a pro-rata basis to each class based on the relative net assets of each class to the total net assets of the Fund. Each class differs with respect to transfer agent and distribution and service plan fees incurred. Certain expense reductions may also differ by class. The Fund's investments in emerging markets can be subject to social, economic, regulatory, and political uncertainties and can be extremely volatile.
2. Investments in Fidelity Central Funds.
The Fund invests in Fidelity Central Funds, which are open-end investment companies available only to other investment companies and accounts managed by Fidelity Management & Research Company (FMR) and its affiliates. The Fund's Schedule of Investments lists each of the Fidelity Central Funds held as of period end, if any, as an investment of the Fund, but does not include the underlying holdings of each Fidelity Central Fund. As an Investing Fund, the Fund indirectly bears its proportionate share of the expenses of the underlying Fidelity Central Funds.
The Money Market Central Funds seek preservation of capital and current income and are managed by Fidelity Investments Money Management, Inc. (FIMM), an affiliate of FMR.
A complete unaudited list of holdings for each Fidelity Central Fund is available upon request or at the Securities and Exchange Commission (the SEC) web site at www.sec.gov. In addition, the financial statements of the Fidelity Central Funds, which are not covered by the Fund's Report of Independent Registered Public Accounting Firm are available on the SEC web site or upon request.
3. Significant Accounting Policies.
The financial statements have been prepared in conformity with accounting principles generally accepted in the United States of America (GAAP), which require management to make certain estimates and assumptions at the date of the financial statements. Actual results could differ from those estimates. Subsequent events, if any, through the date that the financial statements were issued have been evaluated in the preparation of the financial statements. The following summarizes the significant accounting policies of the Fund:
Security Valuation. Investments are valued as of 4:00 p.m. Eastern time on the last calendar day of the period. The Fund uses independent pricing services approved by the Board of Trustees to value its investments. When current market prices or quotations are not readily available or reliable, valuations may be determined in good faith in accordance with procedures adopted by the Board of Trustees. Factors used in determining value may include market or security specific events. The frequency with which these procedures are used cannot be predicted and they may be utilized to a significant extent. The value used for net asset value (NAV) calculation under these procedures may differ from published prices for the same securities.
The Fund categorizes the inputs to valuation techniques used to value its investments into a disclosure hierarchy consisting of three levels as shown below:
Level 1 - quoted prices in active markets for identical investments
Level 2 - other significant observable inputs (including quoted prices for similar investments, interest rates, prepayment speeds, etc.)
Level 3 - unobservable inputs (including the Fund's own assumptions based on the best information available)
Changes in valuation techniques may result in transfers in or out of an assigned level within the disclosure hierarchy. The aggregate value of investments by input level, as of October 31, 2011, is included at the end of the Fund's Schedule of Investments. Valuation techniques used to value the Fund's investments by major category are as follows:
Equity securities, including restricted securities, for which market quotations are readily available, are valued at the last reported sale price or official closing price as reported by an independent pricing service on the primary market or exchange on which they are traded and are categorized as Level 1 in the hierarchy. In the event there were no sales during the day or closing prices are not available, securities are valued at the last quoted bid price or may be valued using the last available price and are generally categorized as Level 2 in the hierarchy. For foreign equity securities, when significant market or security specific events arise, comparisons to the valuation of American Depositary Receipts (ADRs), futures contracts, Exchange-traded
Annual Report
Notes to Financial Statements - continued
3. Significant Accounting Policies - continued
Security Valuation - continued
funds (ETFs) and certain indexes as well as quoted prices for similar securities are used and are categorized as Level 2 in the hierarchy in these circumstances. Utilizing these techniques may result in transfers between Level 1 and Level 2. For restricted equity securities and private placements where observable inputs are limited, assumptions about market activity and risk are used and are categorized as Level 3 in the hierarchy.
Investments in open-end mutual funds, including the Fidelity Central Funds, are valued at their closing net asset value each business day and are categorized as Level 1 in the hierarchy.
Foreign Currency. The Fund may use foreign currency contracts to facilitate transactions in foreign-denominated securities. Gains and losses from these transactions may arise from changes in the value of the foreign currency or if the counterparties do not perform under the contracts' terms.
Foreign-denominated assets, including investment securities, and liabilities are translated into U.S. dollars at the exchange rate at period end. Purchases and sales of investment securities, income and dividends received and expenses denominated in foreign currencies are translated into U.S. dollars at the exchange rate in effect on the transaction date.
The effects of exchange rate fluctuations on investments are included with the net realized and unrealized gain (loss) on investment securities. Other foreign currency transactions resulting in realized and unrealized gain (loss) are disclosed separately.
Investment Transactions and Income. For financial reporting purposes, the Fund's investment holdings and NAV include trades executed through the end of the last business day of the period. The NAV per share for processing shareholder transactions is calculated as of the close of business of the New York Stock Exchange (NYSE), normally 4:00 p.m. Eastern time and includes trades executed through the end of the prior business day. Gains and losses on securities sold are determined on the basis of identified cost and may include proceeds received from litigation. Dividend income is recorded on the ex-dividend date, except for certain dividends from foreign securities where the ex-dividend date may have passed, which are recorded as soon as the Fund is informed of the ex-dividend date. Non-cash dividends included in dividend income, if any, are recorded at the fair market value of the securities received. Distributions received on securities that represent a return of capital or capital gain are recorded as a reduction of cost of investments and/or as a realized gain. The Fund estimates the components of distributions received that may be considered return of capital distributions or capital gain distributions. Interest income and distributions from the Fidelity Central Funds are accrued as earned. Interest income includes coupon interest and amortization of premium and accretion of discount on debt securities. Investment income is recorded net of foreign taxes withheld where recovery of such taxes is uncertain.
Expenses. Expenses directly attributable to a fund are charged to that fund. Expenses attributable to more than one fund are allocated among the respective funds on the basis of relative net assets or other appropriate methods. Expense estimates are accrued in the period to which they relate and adjustments are made when actual amounts are known.
Income Tax Information and Distributions to Shareholders. Each year, the Fund intends to qualify as a regulated investment company, including distributing substantially all of its taxable income and realized gains under Subchapter M of the Internal Revenue Code and filing its U.S. federal tax return. As a result, no provision for income taxes is required. As of October 31, 2011, the Fund did not have any unrecognized tax benefits in the financial statements. A fund's federal tax return is subject to examination by the Internal Revenue Service (IRS) for a period of three years. Foreign taxes are provided for based on the Fund's understanding of the tax rules and rates that exist in the foreign markets in which it invests.
Distributions are declared and recorded on the ex-dividend date. Income dividends and capital gain distributions are declared separately for each class. Income and capital gain distributions are determined in accordance with income tax regulations, which may differ from GAAP. In addition, the Fund claimed a portion of the payment made to redeeming shareholders as a distribution for income tax purposes.
Capital accounts within the financial statements are adjusted for permanent book-tax differences. These adjustments have no impact on net assets or the results of operations. Temporary book-tax differences will reverse in a subsequent period.
Book-tax differences are primarily due to foreign currency transactions, passive foreign investment companies (PFIC), deferred trustees compensation, capital loss carryforwards and losses deferred due to wash sales.
The federal tax cost of investment securities and unrealized appreciation (depreciation) as of period end were as follows:
Gross unrealized appreciation | $ 1,438,494,908 |
Gross unrealized depreciation | (60,426,525) |
Net unrealized appreciation (depreciation) on securities and other investments | $ 1,378,068,383 |
| |
Tax Cost | $ 1,798,937,632 |
Annual Report
3. Significant Accounting Policies - continued
Income Tax Information and Distributions to Shareholders - continued
The tax-based components of distributable earnings as of period end were as follows:
Undistributed ordinary income | $ 34,016,899 |
Capital loss carryforward | $ (96,320,871) |
Net unrealized appreciation (depreciation) | $ 1,378,167,010 |
Under the recently enacted Regulated Investment Company Modernization Act of 2010 (the Act), the Fund will be permitted to carry forward capital losses incurred in taxable years beginning after December 22, 2010 for an unlimited period. However, any losses incurred during those future taxable years will be required to be utilized prior to any losses incurred in pre-enactment taxable years, which generally expire after eight years from when they are incurred. Additionally, post-enactment capital losses that are carried forward will retain their character as either short-term or long-term capital losses rather than being considered all short-term as under previous law. The Fund's first fiscal year end subject to the Act will be October 31, 2012.
The tax character of distributions paid was as follows:
| October 31, 2011 | October 31, 2010 |
Ordinary Income | $ 37,999,721 | $ 152,546,775 |
Short-Term Trading (Redemption) Fees. Shares held by investors in the Fund less than 90 days are subject to a redemption fee equal to 1.50% of the net asset value of shares redeemed. All redemption fees, which reduce the proceeds of the shareholder redemption, are retained by the Fund and accounted for as an addition to paid in capital.
New Accounting Pronouncement. In May 2011, the Financial Accounting Standards Board issued Accounting Standard Update No. 2011-04, Fair Value Measurement (Topic 820) - Amendments to Achieve Common Fair Value Measurement and Disclosure Requirements in U.S. GAAP and IFRSs. The update changes the wording used to describe the requirements in GAAP for measuring fair value and for disclosing information about fair value measurements. The update is effective during interim and annual periods beginning after December 15, 2011. Management is currently evaluating the impact of the update's adoption on the Fund's financial statement disclosures.
4. Purchases and Sales of Investments.
Purchases and sales of securities, other than short-term securities, aggregated $432,655,967 and $1,472,546,394, respectively.
5. Fees and Other Transactions with Affiliates.
Management Fee. FMR and its affiliates provide the Fund with investment management related services for which the Fund pays a monthly management fee. The management fee is the sum of an individual fund fee rate that is based on an annual rate of .45% of the Fund's average net assets and a group fee rate that averaged .26% during the period. The group fee rate is based upon the average net assets of all the mutual funds advised by FMR. The group fee rate decreases as assets under management increase and increases as assets under management decrease. For the period, the total annual management fee rate was .71% of the Fund's average net assets.
Distribution and Service Plan Fees. In accordance with Rule 12b-1 of the 1940 Act, the Fund has adopted separate Distribution and Service Plans for each class of shares. Certain classes pay Fidelity Distributors Corporation (FDC), an affiliate of FMR, separate Distribution and Service Fees, each of which are based on an annual percentage of each class' average net assets. In addition, FDC may pay financial intermediaries for selling shares of the Fund and providing shareholder support services. For the period, the Distribution and Service Fee rates, total fees and amounts retained by FDC were as follows:
| Distribution
Fee | Service
Fee | Total Fees | Retained
by FDC |
Class A | -% | .25% | $ 267,457 | $ 5,858 |
Class T | .25% | .25% | 161,457 | 1,475 |
Class B | .75% | .25% | 173,640 | 130,230 |
Class C | .75% | .25% | 436,724 | 63,761 |
| | | $ 1,039,278 | $ 201,324 |
Annual Report
Notes to Financial Statements - continued
5. Fees and Other Transactions with Affiliates - continued
Sales Load. FDC may receive a front-end sales charge of up to 5.75% for selling Class A shares, and 3.50% for selling Class T shares, some of which is paid to financial intermediaries for selling shares of the Fund. Depending on the holding period, FDC may receive contingent deferred sales charges levied on Class A, Class T, Class B, and Class C redemptions. The deferred sales charges range from 5% to 1% for Class B, 1% for Class C, 1.00% for certain purchases of Class A shares and .25% for certain purchases of Class T shares.
For the period, sales charge amounts retained by FDC were as follows:
| Retained
by FDC |
Class A | $ 62,781 |
Class T | 8,150 |
Class B* | 14,426 |
Class C* | 5,552 |
| $ 90,909 |
* When Class B and Class C shares are initially sold, FDC pays commissions from its own resources to financial intermediaries through which the sales are made.
Transfer Agent Fees. Fidelity Investments Institutional Operations Company, Inc. (FIIOC), an affiliate of FMR, is the transfer, dividend disbursing and shareholder servicing agent for each class of the Fund. FIIOC receives account fees and asset-based fees that vary according to the account size and type of account of the shareholders of the respective classes of the Fund. FIIOC pays for typesetting, printing and mailing of shareholder reports, except proxy statements. For the period, transfer agent fees for each class were as follows:
| Amount | % of
Average
Net Assets |
Class A | $ 312,176 | .29 |
Class T | 101,225 | .31 |
Class B | 52,537 | .30 |
Class C | 122,538 | .28 |
Latin America | 7,524,751 | .21 |
Institutional Class | 28,490 | .24 |
| $ 8,141,717 | |
Accounting and Security Lending Fees. Fidelity Service Company, Inc. (FSC), an affiliate of FMR, maintains the Fund's accounting records. The accounting fee is based on the level of average net assets for the month. Under a separate contract, FSC administers the security lending program. The security lending fee is based on the number and duration of lending transactions.
Brokerage Commissions. The Fund placed a portion of its portfolio transactions with brokerage firms which are affiliates of the investment adviser. The commissions paid to these affiliated firms were $2,495 for the period.
Interfund Lending Program. Pursuant to an Exemptive Order issued by the SEC, the Fund, along with other registered investment companies having management contracts with FMR, may participate in an interfund lending program. This program provides an alternative credit facility allowing the funds to borrow from, or lend money to, other participating affiliated funds. At period end, there were no interfund loans outstanding. The Fund's activity in this program during the period for which loans were outstanding was as follows:
Borrower or Lender | Average Daily
Loan Balance | Weighted Average Interest Rate | Interest
Expense |
Borrower | $ 14,398,611 | .39% | $ 8,383 |
6. Committed Line of Credit.
The Fund participates with other funds managed by FMR or an affiliate in a $4.0 billion credit facility (the "line of credit") to be utilized for temporary or emergency purposes to fund shareholder redemptions or for other short-term liquidity purposes. The Fund has agreed to pay commitment fees on its pro-rata portion of the line of credit, which amounted to $12,344 and is reflected in Miscellaneous expenses on the Statement of Operations. During the period, there were no borrowings on this line of credit.
Annual Report
7. Security Lending.
The Fund lends portfolio securities through a lending agent from time to time in order to earn additional income. For equity securities, a lending agent is used and may loan securities to certain qualified borrowers, including Fidelity Capital Markets (FCM), a broker-dealer affiliated with the Fund. On the settlement date of the loan, the Fund receives collateral (in the form of U.S. Treasury obligations, letters of credit and/or cash) against the loaned securities and maintains collateral in an amount not less than 100% of the market value of the loaned securities during the period of the loan. The market value of the loaned securities is determined at the close of business of the Fund and any additional required collateral is delivered to the Fund on the next business day. If the borrower defaults on its obligation to return the securities loaned because of insolvency or other reasons, a fund could experience delays and costs in recovering the securities loaned or in gaining access to the collateral. Any cash collateral received is invested in the Fidelity Securities Lending Cash Central Fund. The value of loaned securities and cash collateral at period end are disclosed on the Fund's Statement of Assets and Liabilities. Security lending income represents the income earned on investing cash collateral, less rebates paid to borrowers and any lending agent fees associated with the loan, plus any premium payments received for lending certain types of securities. Security lending income is presented in the Statement of Operations as a component of income from Fidelity Central Funds. Total security lending income during the period amounted to $397,722. During the period, there were no securities loaned to FCM.
8. Expense Reductions.
FMR voluntarily agreed to reimburse a portion of Latin America's operating expenses. During the period, this reimbursement reduced the class' expenses by $45,747.
Many of the brokers with whom FMR places trades on behalf of the Fund provided services to the Fund in addition to trade execution. These services included payments of certain expenses on behalf of the Fund totaling $38,294 for the period.
9. Distributions to Shareholders.
Distributions to shareholders of each class were as follows:
Years ended October 31, | 2011 | 2010A |
From net investment income | | |
Class A | $ 387,219 | $ 1,442 |
Class T | 94,474 | 1,442 |
Class B | 23,836 | 1,442 |
Class C | 78,469 | 1,442 |
Latin America | 21,655,692 | 118,553,199 |
Institutional Class | 52,446 | 1,442 |
Total | $ 22,292,136 | $ 118,560,409 |
From net realized gain | | |
Class A | $ 407,401 | $ - |
Class T | 127,447 | - |
Class B | 68,279 | - |
Class C | 170,156 | - |
Latin America | 14,889,803 | 33,986,366 |
Institutional Class | 44,499 | - |
Total | $ 15,707,585 | $ 33,986,366 |
A Distributions for Class A, Class T, Class B, Class C and Institutional Class are for the period September 28, 2010 (commencement of sale of shares) to October 31, 2010.
10. Share Transactions.
Transactions for each class of shares were as follows:
| Shares | Dollars |
Years ended October 31, | 2011 | 2010A | 2011 | 2010A |
Class A | | | | |
Shares sold | 412,254 | 41,687 | $ 23,066,057 | $ 2,369,263 |
Issued in exchange of shares of Fidelity Advisor Latin America Fund | - | 2,023,866 | - | 113,640,086 |
Reinvestment of distributions | 12,195 | 26 | 706,536 | 1,442 |
Shares redeemed | (691,058) | (53,951) | (38,328,762) | (3,076,408) |
Net increase (decrease) | (266,609) | 2,011,628 | $ (14,556,169) | $ 112,934,383 |
Annual Report
Notes to Financial Statements - continued
10. Share Transactions - continued
| Shares | Dollars |
Years ended October 31, | 2011 | 2010A | 2011 | 2010A |
Class T | | | | |
Shares sold | 87,514 | 18,758 | $ 4,903,931 | $ 1,058,068 |
Issued in exchange of shares of Fidelity Advisor Latin America Fund | - | 637,585 | - | 35,800,407 |
Reinvestment of distributions | 3,721 | 26 | 215,680 | 1,442 |
Shares redeemed | (234,128) | (15,626) | (12,893,248) | (885,588) |
Net increase (decrease) | (142,893) | 640,743 | $ (7,773,637) | $ 35,974,329 |
Class B | | | | |
Shares sold | 11,256 | 3,456 | $ 626,261 | $ 192,197 |
Issued in exchange of shares of Fidelity Advisor Latin America Fund | - | 359,402 | - | 20,176,816 |
Reinvestment of distributions | 1,326 | 26 | 76,906 | 1,442 |
Shares redeemed | (96,470) | (7,861) | (5,351,844) | (450,086) |
Net increase (decrease) | (83,888) | 355,023 | $ (4,648,677) | $ 19,920,369 |
Class C | | | | |
Shares sold | 137,950 | 17,327 | $ 7,785,005 | $ 976,205 |
Issued in exchange of shares of Fidelity Advisor Latin America Fund | - | 840,828 | - | 47,204,057 |
Reinvestment of distributions | 3,829 | 26 | 222,012 | 1,442 |
Shares redeemed | (306,800) | (16,791) | (16,851,535) | (947,712) |
Net increase (decrease) | (165,021) | 841,390 | $ (8,844,518) | $ 47,233,992 |
Latin America | | | | |
Shares sold | 8,382,994 | 22,062,249 | $ 474,305,310 | $ 1,142,552,819 |
Reinvestment of distributions | 609,933 | 2,770,809 | 35,291,350 | 147,652,381 |
Shares redeemed | (28,534,583) | (35,850,914) | (1,586,342,682) | (1,794,503,952) |
Net increase (decrease) | (19,541,656) | (11,017,856) | $ (1,076,746,022) | $ (504,298,752) |
Institutional Class | | | | |
Shares sold | 72,884 | 3,784 | $ 4,108,817 | $ 212,699 |
Issued in exchange of shares of Fidelity Advisor Latin America Fund | - | 228,366 | - | 12,822,761 |
Reinvestment of distributions | 1,178 | 26 | 68,214 | 1,442 |
Shares redeemed | (115,010) | (8,368) | (6,478,861) | (476,457) |
Net increase (decrease) | (40,948) | 223,808 | $ (2,301,830) | $ 12,560,445 |
A Share transactions for Class A, Class T, Class B, Class C and Institutional Class are for the period September 28, 2010 (commencement of sale of shares) to October 31, 2010.
11. Other.
The Fund's organizational documents provide former and current trustees and officers with a limited indemnification against liabilities arising in connection with the performance of their duties to the Fund. In the normal course of business, the Fund may also enter into contracts that provide general indemnifications. The Fund's maximum exposure under these arrangements is unknown as this would be dependent on future claims that may be made against the Fund. The risk of material loss from such claims is considered remote.
12. Merger Information.
On October 1, 2010 the Fund acquired all of the assets and assumed all of the liabilities of the Fidelity Advisor Latin America Fund ("Target Fund") pursuant to an agreement and plan of reorganization approved by the Board of Trustees ("The Board") on July 6, 2010. The reorganization provides shareholders of the Target Fund access to a larger portfolio with the same investment objectives and lower expenses. The acquisition was accomplished by an exchange of 2,023,866 Class A shares, 637,585 Class T shares, 359,402 Class B shares, 840,828 Class C shares, and 228,366 Institutional Class shares of the Fund, respectively, for 2,219,330 Class A shares, 700,912 Class T shares, 400,205 Class B shares, 940,861 Class C shares, and 245,559 Institutional Class shares then outstanding (valued at $51.20, $51.08, $50.42, $50.17 and $52.22 per share for Class A, Class T, Class B, Class C, and Institutional Class, respectively) of the Target Fund. The reorganization qualified as a tax-free reorganization for federal income tax purposes with no gain or loss recognized to the funds or their shareholders. The Target Fund's net assets, including securities of $229,225,487, unrealized appreciation of $95,362,395, and net other assets of $418,642, were combined with the Fund's net assets of $4,149,781,255 for total net assets after the acquisition of $4,379,425,384.
Annual Report
12. Merger Information - continued
Pro forma results of operations of the combined entity for the entire year ended October 31, 2010, as though the acquisition had occurred as of the beginning of the year (rather than on the actual acquisition date), are as follows:
Net investment income (loss) | $ 90,969,628 |
Total net realized gain (loss) | 302,327,523 |
Total change in net unrealized appreciation (depreciation) | 548,871,563 |
Net increase (decrease) in net assets resulting from operations | $ 942,168,714 |
Because the combined investment portfolios have been managed as a single portfolio since the acquisition was completed, it is not practicable to separate the amounts of revenue and earnings of the acquired fund that have been included in the Fund's accompanying Statement of Operations since October 1, 2010.
Annual Report
Report of Independent Registered Public Accounting Firm
To the Trustees of Fidelity Investment Trust and the Shareholders of Fidelity Latin America Fund:
In our opinion, the accompanying statement of assets and liabilities, including the schedule of investments, and the related statements of operations and of changes in net assets and the financial highlights present fairly, in all material respects, the financial position of Fidelity Latin America Fund (a fund of Fidelity Investment Trust) at October 31, 2011, the results of its operations for the year then ended, the changes in its net assets for each of the two years in the period then ended and the financial highlights for each of the periods indicated, in conformity with accounting principles generally accepted in the United States of America. These financial statements and financial highlights (hereafter referred to as "financial statements") are the responsibility of the Fidelity Latin America Fund's management. Our responsibility is to express an opinion on these financial statements based on our audits. We conducted our audits of these financial statements in accordance with the standards of the Public Company Accounting Oversight Board (United States). Those standards require that we plan and perform the audit to obtain reasonable assurance about whether the financial statements are free of material misstatement. An audit includes examining, on a test basis, evidence supporting the amounts and disclosures in the financial statements, assessing the accounting principles used and significant estimates made by management, and evaluating the overall financial statement presentation. We believe that our audits, which included confirmation of securities at October 31, 2011 by correspondence with the custodian and brokers, provide a reasonable basis for our opinion.
PricewaterhouseCoopers LLP
Boston, Massachusetts
December 16, 2011
Annual Report
The Trustees, Members of the Advisory Board, and executive officers of the trust and fund, as applicable, are listed below. The Board of Trustees governs the fund and is responsible for protecting the interests of shareholders. The Trustees are experienced executives who meet periodically throughout the year to oversee the fund's activities, review contractual arrangements with companies that provide services to the fund, oversee management of the risks associated with such activities and contractual arrangements, and review the fund's performance. Except for James C. Curvey, each of the Trustees oversees 226 funds advised by FMR or an affiliate. Mr. Curvey oversees 429 funds advised by FMR or an affiliate.
The Trustees hold office without limit in time except that (a) any Trustee may resign; (b) any Trustee may be removed by written instrument, signed by at least two-thirds of the number of Trustees prior to such removal; (c) any Trustee who requests to be retired or who has become incapacitated by illness or injury may be retired by written instrument signed by a majority of the other Trustees; and (d) any Trustee may be removed at any special meeting of shareholders by a two-thirds vote of the outstanding voting securities of the trust. Each Trustee who is not an interested person (as defined in the 1940 Act) (Independent Trustee), shall retire not later than the last day of the calendar year in which his or her 75th birthday occurs. The Independent Trustees may waive this mandatory retirement age policy with respect to individual Trustees. The executive officers and Advisory Board Members hold office without limit in time, except that any officer and Advisory Board Member may resign or may be removed by a vote of a majority of the Trustees at any regular meeting or any special meeting of the Trustees. Except as indicated, each individual has held the office shown or other offices in the same company for the past five years.
Experience, Skills, Attributes, and Qualifications of the Fund's Trustees. The Governance and Nominating Committee has adopted a statement of policy that describes the experience, qualifications, attributes, and skills that are necessary and desirable for potential Independent Trustee candidates (Statement of Policy). The Board believes that each Trustee satisfied at the time he or she was initially elected or appointed a Trustee, and continues to satisfy, the standards contemplated by the Statement of Policy. The Governance and Nominating Committee also engages professional search firms to help identify potential Independent Trustee candidates who have the experience, qualifications, attributes, and skills consistent with the Statement of Policy. From time to time, additional criteria based on the composition and skills of the current Independent Trustees, as well as experience or skills that may be appropriate in light of future changes to board composition, business conditions, and regulatory or other developments, have also been considered by the professional search firms and the Governance and Nominating Committee. In addition, the Board takes into account the Trustees' commitment and participation in Board and committee meetings, as well as their leadership of standing and ad hoc committees throughout their tenure.
In determining that a particular Trustee was and continues to be qualified to serve as a Trustee, the Board has considered a variety of criteria, none of which, in isolation, was controlling. The Board believes that, collectively, the Trustees have balanced and diverse experience, qualifications, attributes, and skills, which allow the Board to operate effectively in governing the fund and protecting the interests of shareholders. Information about the specific experience, skills, attributes, and qualifications of each Trustee, which in each case led to the Board's conclusion that the Trustee should serve (or continue to serve) as a trustee of the fund, is provided below.
Board Structure and Oversight Function. James C. Curvey is an interested person (as defined in the 1940 Act) and currently serves as Acting Chairman. The Trustees have determined that an interested Chairman is appropriate and benefits shareholders because an interested Chairman has a personal and professional stake in the quality and continuity of services provided to the fund. Independent Trustees exercise their informed business judgment to appoint an individual of their choosing to serve as Chairman, regardless of whether the Trustee happens to be independent or a member of management. The Independent Trustees have determined that they can act independently and effectively without having an Independent Trustee serve as Chairman and that a key structural component for assuring that they are in a position to do so is for the Independent Trustees to constitute a substantial majority for the Board. The Independent Trustees also regularly meet in executive session. Ned C. Lautenbach serves as Chairman of the Independent Trustees and as such (i) acts as a liaison between the Independent Trustees and management with respect to matters important to the Independent Trustees and (ii) with management prepares agendas for Board meetings.
Fidelity funds are overseen by different Boards of Trustees. The fund's Board oversees Fidelity's equity and high income funds and another Board oversees Fidelity's investment-grade bond, money market, and asset allocation funds. The asset allocation funds may invest in Fidelity funds overseen by the fund's Board. The use of separate Boards, each with its own committee structure, allows the Trustees of each group of Fidelity funds to focus on the unique issues of the funds they oversee, including common research, investment, and operational issues. On occasion, the separate Boards establish joint committees to address issues of overlapping consequences for the Fidelity funds overseen by each Board.
The Trustees operate using a system of committees to facilitate the timely and efficient consideration of all matters of importance to the Trustees, the fund, and fund shareholders and to facilitate compliance with legal and regulatory requirements and oversight of the fund's activities and associated risks. The Board, acting through its committees, has charged FMR and its affiliates with (i) identifying events or circumstances the occurrence of which could have demonstrably adverse effects on the fund's business and/or reputation; (ii) implementing processes and controls to lessen the possibility that such events or circumstances occur or to mitigate the effects of such events or circumstances if they do occur; and (iii) creating and maintaining a system designed to evaluate continuously business and market conditions in order to facilitate the identification and implementation processes described in (i) and (ii) above. Because the day-to-day operations and activities of the fund are carried out by or through FMR, its affiliates and other service providers, the fund's exposure to risks is mitigated but not eliminated by the processes overseen by the Trustees. While each of the Board's committees has responsibility for overseeing different aspects of the fund's activities, oversight is exercised primarily through the Operations, Audit, and Compliance Committees. In addition, the Independent Trustees have worked with FMR to enhance the Board's oversight of investment and financial risks, legal and regulatory risks, technology risks, and operational risks, including the development of additional risk reporting to the Board. For example, a working group comprised of Independent Trustees and FMR has worked and continues to work to review the Fidelity funds' valuation-related activities, reporting and risk management. Appropriate personnel, including but not limited to the fund's Chief Compliance Officer (CCO), FMR's internal auditor, the independent accountants, the fund's Treasurer and portfolio management personnel, make periodic reports to the Board's committees, as appropriate, including an annual review of FMR's risk management program for the Fidelity funds. The responsibilities of each standing committee, including their oversight responsibilities, are described further under "Standing Committees of the Fund's Trustees."
Annual Report
Trustees and Officers - continued
The fund's Statement of Additional Information (SAI) includes more information about the Trustees. To request a free copy, call Fidelity at 1-877-208-0098.
Interested Trustees*:
Correspondence intended for each Trustee who is an interested person may be sent to Fidelity Investments, 82 Devonshire Street, Boston, Massachusetts 02109.
Name, Age; Principal Occupations and Other Relevant Experience+ |
James C. Curvey (76) |
| Year of Election or Appointment: 2007 Mr. Curvey is Trustee and Acting Chairman of the Board of Trustees of certain Trusts. Mr. Curvey also serves as Trustee (2007-present) of other investment companies advised by FMR. Mr. Curvey is a Director of Fidelity Investments Money Management, Inc. (2009-present), Director of Fidelity Research & Analysis Co. (2009-present) and Director of FMR and FMR Co., Inc. (2007-present). Mr. Curvey is also Vice Chairman (2007-present) and Director of FMR LLC. In addition, Mr. Curvey serves as an Overseer for the Boston Symphony Orchestra and a member of the Trustees of Villanova University. Previously, Mr. Curvey was the Vice Chairman (2006-2007) and Director (2000-2007) of FMR Corp. |
Ronald P. O'Hanley (54) |
| Year of Election or Appointment: 2011 Mr. O'Hanley is Director of FMR Co., Inc. (2010-present), Director of Fidelity Investments Money Management, Inc. (2010-present), Director of Fidelity Research & Analysis Company (2010-present), President of Fidelity Asset Management and Corporate Services and a member of Fidelity's Executive Committee (2010-present). Previously, Mr. O'Hanley served as President and Chief Executive Officer of BNY Mellon Asset Management (2007-2010). Mr. O'Hanley also served as Vice Chairman of Bank New York Mellon Corp. and a member of that firm's Executive Committee. Prior to the 2007 merger of The Bank of New York and Mellon Financial Corporation, he was Vice Chairman of Mellon Financial Corporation and President and Chief Executive Officer of Mellon Asset Management. He joined Mellon in February 1997. Mr. O'Hanley currently serves as Chairman of the Boston Public Library Foundation Board of Directors and sits on the Board of Directors of Beth Israel Deaconess Medical Center, the Board of Trustees of the Marine Biological Laboratory and the Advisory Board of the Maxwell School of Citizenship and Public Administration at Syracuse University. Mr. O'Hanley also chairs the Council on Asset Management for the Financial Services Roundtable and is a member of the Board of Directors of Institutional Investor's U.S. Institute. |
* Trustees have been determined to be "Interested Trustees" by virtue of, among other things, their affiliation with the trust or various entities under common control with FMR.
+ The information above includes each Trustee's principal occupation during the last five years and other information relating to the experience, attributes, and skills relevant to each Trustee's qualifications to serve as a Trustee, which led to the conclusion that each Trustee should serve as a Trustee for the fund.
Independent Trustees:
Correspondence intended for each Independent Trustee (that is, the Trustees other than the Interested Trustees) may be sent to Fidelity Investments, P.O. Box 55235, Boston, Massachusetts 02205-5235.
Name, Age; Principal Occupations and Other Relevant Experience+ |
Dennis J. Dirks (63) |
| Year of Election or Appointment: 2005 Prior to his retirement in May 2003, Mr. Dirks was Chief Operating Officer and a member of the Board of The Depository Trust & Clearing Corporation (DTCC). He also served as President, Chief Operating Officer, and Board member of The Depository Trust Company (DTC) and President and Board member of the National Securities Clearing Corporation (NSCC). In addition, Mr. Dirks served as Chief Executive Officer and Board member of the Government Securities Clearing Corporation, Chief Executive Officer and Board member of the Mortgage-Backed Securities Clearing Corporation, as a Trustee and a member of the Finance Committee of Manhattan College (2005-2008), and as a Trustee and a member of the Finance Committee of AHRC of Nassau County (2006-2008). Mr. Dirks is a member of the Independent Directors Council (IDC) Governing Council (2010-Present) and Board of Directors for The Brookville Center for Children's Services, Inc. (2009-present). |
Alan J. Lacy (58) |
| Year of Election or Appointment: 2008 Mr. Lacy serves as Senior Adviser (2007-present) of Oak Hill Capital Partners, L.P. (private equity). Mr. Lacy also served as Chief Executive Officer (2000-2005) and Vice Chairman (2005-2006) of Sears Holdings Corporation and Sears, Roebuck and Co. (retail). In addition, Mr. Lacy serves as a member of the Board of Directors of Dave & Buster's, Inc. (restaurant and entertainment complexes, 2010-present), The Hillman Companies, Inc. (hardware wholesalers, 2010-present), and Bristol-Myers Squibb Company (global pharmaceuticals, 2007-present). Mr. Lacy is a member of the Board of Trustees of The National Parks Conservation Association (2006-Present). Previously, Mr. Lacy served as Chairman of the Board of Trustees of the National Parks Conservation Association (2008-2011) and as a member of the Board of Directors for the Western Union Company (global money transfer, 2006-2011). |
Ned C. Lautenbach (67) |
| Year of Election or Appointment: 2000 Mr. Lautenbach is Chairman of the Independent Trustees of the Equity and High Income Funds (2006-present). Mr. Lautenbach currently serves as the Lead Director of the Eaton Corporation Board of Directors (diversified industrial, 1997-present). Mr. Lautenbach is also a member of the Board of Directors of the Philharmonic Center for the Arts in Naples, Florida (1999-present); a member of the Board of Trustees of Fairfield University (2005-present); and a member of the Council on Foreign Relations (1994-present). Previously, Mr. Lautenbach was a Partner/Advisory Partner at Clayton, Dubilier & Rice, LLC (private equity investment, 1998-2010), as well as a Director of Sony Corporation (2006-2007). |
Joseph Mauriello (67) |
| Year of Election or Appointment: 2008 Prior to his retirement in January 2006, Mr. Mauriello served in numerous senior management positions including Deputy Chairman and Chief Operating Officer (2004-2005), and Vice Chairman of Financial Services (2002-2004) of KPMG LLP US (professional services, 1965-2005). Mr. Mauriello currently serves as a member of the Board of Directors of XL Group plc. (global insurance and re-insurance, 2006-present) and of Arcadia Resources Inc. (health care services and products, 2007-present). Previously, Mr. Mauriello served as a Director of the Hamilton Funds of the Bank of New York (2006-2007). |
Robert W. Selander (61) |
| Year of Election or Appointment: 2011 Previously, Mr. Selander served as a Member of the Advisory Board of Fidelity's Equity and High Income Funds (2011), Executive Vice Chairman (2010), Chief Executive Officer (2009-2010), and President and Chief Executive Officer (1997-2009) of Mastercard, Inc. |
Cornelia M. Small (67) |
| Year of Election or Appointment: 2005 Ms. Small is a member of the Board of Directors of the Teagle Foundation (2009-present). Ms. Small is also a member of the Investment Committee, and Chair (2008-present) and a member of the Board of Trustees of Smith College. In addition, Ms. Small serves on the Investment Committee of the Berkshire Taconic Community Foundation (2008-present). Previously, Ms. Small served as Chairperson of the Investment Committee (2002-2008) of Smith College. In addition, Ms. Small served as Chief Investment Officer, Director of Global Equity Investments, and a member of the Board of Directors of Scudder, Stevens & Clark and Scudder Kemper Investments. |
William S. Stavropoulos (72) |
| Year of Election or Appointment: 2001 Mr. Stavropoulos is Vice Chairman of the Independent Trustees of the Equity and High Income Funds (2006-present). Mr. Stavropoulos serves as President and Founder of the Michigan Baseball Foundation, the Great Lakes Loons (2007-present). Mr. Stavropoulos is Chairman Emeritus of the Board of Directors of The Dow Chemical Company, where he previously served in numerous senior management positions, including President, CEO (1995-2000; 2002-2004), Chairman of the Executive Committee (2000-2006), and as a member of the Board of Directors (1990-2006). Currently, Mr. Stavropoulos is Chairman of Univar (global distributor of commodity and specialty chemicals, 2010-present), a Director of Teradata Corporation (data warehousing and technology solutions, 2008-present), Chemical Financial Corporation, Maersk Inc. (industrial conglomerate), Tyco International, Inc. (multinational manufacturing and services, 2007-present), and a member of the Advisory Board for Metalmark Capital (private equity investment, 2005-present). Mr. Stavropoulos is a special advisor to Clayton, Dubilier & Rice, LLC (private equity investment). In addition, Mr. Stavropoulos is a member of the University of Notre Dame Advisory Council for the College of Science. |
David M. Thomas (62) |
| Year of Election or Appointment: 2008 Previously, Mr. Thomas served as Executive Chairman (2005-2006) and Chairman and Chief Executive Officer (2000-2005) of IMS Health, Inc. (pharmaceutical and healthcare information solutions). In addition, Mr. Thomas serves as a member of the Board of Directors of Fortune Brands, Inc. (consumer products), and Interpublic Group of Companies, Inc. (marketing communication, 2004-present). |
Michael E. Wiley (61) |
| Year of Election or Appointment: 2008 Mr. Wiley also serves as a Director of Asia Pacific Exploration Consolidated (international oil and gas exploration and production, 2008-present). Mr. Wiley serves as a Director of Tesoro Corporation (independent oil refiner and marketer, 2005-present), and a Director of Bill Barrett Corporation (exploration and production, 2005-present). In addition, Mr. Wiley also serves as a Director of Post Oak Bank (privately-held bank, 2004-present). Previously, Mr. Wiley served as a member of the Board of Trustees of the University of Tulsa (2000-2006; 2007-2010), as a Senior Energy Advisor of Katzenbach Partners, LLC (consulting, 2006-2007), as an Advisory Director of Riverstone Holdings (private investment), Chairman, President, and CEO of Baker Hughes, Inc. (oilfield services, 2000-2004), and as Director of Spinnaker Exploration Company (exploration and production, 2001-2005). |
+ The information above includes each Trustee's principal occupation during the last five years and other information relating to the experience, attributes, and skills relevant to each Trustee's qualifications to serve as a Trustee, which led to the conclusion that each Trustee should serve as a Trustee for the fund.
Advisory Board Members and Executive Officers:
Correspondence intended for each executive officer, Edward C. Johnson 3d, and Peter S. Lynch may be sent to Fidelity Investments, 82 Devonshire Street, Boston, Massachusetts 02109.
Name, Age; Principal Occupation |
Edward C. Johnson 3d (81) |
| Year of Election or Appointment: 2011 Member of the Advisory Board of Fidelity's Equity and High Income Funds. Mr. Johnson serves as Chief Executive Officer, Chairman, and a Director of FMR LLC, and also serves as Chairman and Director of FIL Limited. Previously, Mr. Johnson served as a Trustee and Chairman of the Board of certain Fidelity Trusts, Chairman and a Director of FMR, Chairman and a Director of FMR Co., Inc., and President of FMR LLC (2006-2007). |
Peter S. Lynch (67) |
| Year of Election or Appointment: 2003 Member of the Advisory Board of Fidelity's Equity and High Income Funds. Mr. Lynch is Vice Chairman and a Director of FMR and FMR Co., Inc. In addition, Mr. Lynch serves as a Trustee of Boston College and as the Chairman of the Inner-City Scholarship Fund. Previously, Mr. Lynch served on the Special Olympics International Board of Directors (1997-2006). |
Kenneth B. Robins (42) |
| Year of Election or Appointment: 2008 President and Treasurer of Fidelity's Equity and High Income Funds. Mr. Robins also serves as President and Treasurer (2010-present) and Assistant Treasurer (2009-present) of other Fidelity funds and is an employee of Fidelity Investments (2004-present). Previously, Mr. Robins served as Deputy Treasurer of the Fidelity funds (2005-2008) and Treasurer and Chief Financial Officer of The North Carolina Capital Management Trust: Cash and Term Portfolios (2006-2008). |
Bruce T. Herring (46) |
| Year of Election or Appointment: 2006 Vice President of certain Equity Funds. Mr. Herring also serves as Chief Investment Officer and Director of Fidelity Management & Research (U.K.) Inc. (2010-present) and Group Chief Investments Officer of FMR. Previously, Mr. Herring served as Vice President (2005-2006) and Senior Vice President (2006-2007) of Fidelity Management & Research Company, Vice President of FMR Co., Inc. (2001-2007) and as a portfolio manager for Fidelity U.S. Equity Funds. |
Brian B. Hogan (47) |
| Year of Election or Appointment: 2009 Vice President of Equity and High Income Funds. Mr. Hogan also serves as President of FMR's Equity Division (2009-present). Previously, Mr. Hogan served as Senior Vice President, Equity Research of FMR (2006-2009) and as a portfolio manager. |
Scott C. Goebel (43) |
| Year of Election or Appointment: 2008 Secretary and Chief Legal Officer (CLO) of the Fidelity funds. Mr. Goebel also serves as Secretary of Fidelity Investments Money Management, Inc. (FIMM) (2010-present) and Fidelity Research and Analysis Company (FRAC) (2010-present); Secretary and CLO of The North Carolina Capital Management Trust: Cash and Term Portfolios (2008-present); General Counsel, Secretary, and Senior Vice President of FMR (2008-present) and FMR Co., Inc. (2008-present); employed by FMR LLC or an affiliate (2001-present); Chief Legal Officer of Fidelity Management & Research (Hong Kong) Limited (2008-present) and Assistant Secretary of Fidelity Management & Research (Japan) Inc. (2008-present), and Fidelity Management & Research (U.K.) Inc. (2008-present). Previously, Mr. Goebel served as Assistant Secretary of FIMM (2008-2010), FRAC (2008-2010), and the Funds (2007-2008) and as Vice President and Secretary of Fidelity Distributors Corporation (FDC) (2005-2007). |
William C. Coffey (42) |
| Year of Election or Appointment: 2009 Assistant Secretary of Fidelity's Equity and High Income Funds. Mr. Coffey also serves as Senior Vice President and Deputy General Counsel of FMR LLC (2010-present), and is an employee of Fidelity Investments. Previously, Mr. Coffey served as Vice President and Associate General Counsel of FMR LLC (2005-2009). |
Holly C. Laurent (57) |
| Year of Election or Appointment: 2008 Anti-Money Laundering (AML) Officer of the Fidelity funds. Ms. Laurent also serves as AML Officer of The North Carolina Capital Management Trust: Cash and Term Portfolios (2008-present) and is an employee of Fidelity Investments. Previously, Ms. Laurent was Senior Vice President and Head of Legal for Fidelity Business Services India Pvt. Ltd. (2006-2008), and Senior Vice President, Deputy General Counsel and Group Head for FMR LLC (2005-2006). |
Christine Reynolds (53) |
| Year of Election or Appointment: 2008 Chief Financial Officer of the Fidelity funds. Ms. Reynolds became President of Fidelity Pricing and Cash Management Services (FPCMS) in August 2008. Ms. Reynolds served as Chief Operating Officer of FPCMS (2007-2008). Previously, Ms. Reynolds served as President, Treasurer, and Anti-Money Laundering officer of the Fidelity funds (2004-2007). |
Kenneth A. Rathgeber (64) |
| Year of Election or Appointment: 2004 Chief Compliance Officer of Fidelity's Equity and High Income Funds. Mr. Rathgeber is Chief Compliance Officer of Fidelity Management & Research (Hong Kong) Limited (2008-present), Fidelity Management & Research (Japan) Inc. (2008-present), FMR (2005-present), FMR Co., Inc. (2005-present), Fidelity Management & Research (U.K.) Inc. (2005-present), Fidelity Research & Analysis Company (2005-present), Fidelity Investments Money Management, Inc. (2005-present), Pyramis Global Advisors, LLC (2005-present), and Strategic Advisers, Inc. (2005-present). |
Jeffrey S. Christian (50) |
| Year of Election or Appointment: 2009 Deputy Treasurer of the Fidelity funds. Mr. Christian is an employee of Fidelity Investments. Previously, Mr. Christian served as Chief Financial Officer (2008-2009) of certain Fidelity funds and Senior Vice President of Fidelity Pricing and Cash Management Services (FPCMS) (2004-2009). |
Joseph F. Zambello (54) |
| Year of Election or Appointment: 2011 Deputy Treasurer of the Fidelity funds. Mr. Zambello is an employee of Fidelity Investments. Previously, Mr. Zambello served as Vice President of FMR's Program Management Group (2009-2011) and Vice President of the Transfer Agent Oversight Group (2005-2009). |
Adrien E. Deberghes (44) |
| Year of Election or Appointment: 2008 Deputy Treasurer of Fidelity's Equity and High Income Funds. Mr. Deberghes also serves as Vice President and Assistant Treasurer of Fidelity Rutland Square Trust II and Fidelity Commonwealth Trust II (2011-present), Assistant Treasurer of other Fidelity funds (2010-present), and is an employee of Fidelity Investments (2008-present). Previously, Mr. Deberghes served as Senior Vice President of Mutual Fund Administration at State Street Corporation (2007-2008), Senior Director of Mutual Fund Administration at Investors Bank & Trust (2005-2007), and Director of Finance for Dunkin' Brands (2000-2005). |
Stephanie J. Dorsey (42) |
| Year of Election or Appointment: 2010 Assistant Treasurer of Fidelity's Equity and High Income Funds. Ms. Dorsey also serves as Deputy Treasurer of other Fidelity funds (2008-present) and is an employee of Fidelity Investments (2008-present). Previously, Ms. Dorsey served as Treasurer (2004-2008) of the JPMorgan Mutual Funds and Vice President (2004-2008) of JPMorgan Chase Bank. |
John R. Hebble (53) |
| Year of Election or Appointment: 2009 Assistant Treasurer of Fidelity's Equity and High Income Funds. Mr. Hebble also serves as President (2011-present), Treasurer, and Chief Financial Officer of The North Carolina Capital Management Trust: Cash and Term Portfolios (2008-present), President and Treasurer of other Fidelity funds (2008-present) and is an employee of Fidelity Investments. |
Gary W. Ryan (53) |
| Year of Election or Appointment: 2005 Assistant Treasurer of the Fidelity funds. Mr. Ryan is an employee of Fidelity Investments. Previously, Mr. Ryan served as Vice President of Fund Reporting in Fidelity Pricing and Cash Management Services (FPCMS) (1999-2005). |
Jonathan Davis (43) |
| Year of Election or Appointment: 2010 Assistant Treasurer of the Fidelity funds. Mr. Davis is also Assistant Treasurer of Fidelity Rutland Square Trust II and Fidelity Commonwealth Trust II. Mr. Davis is an employee of Fidelity Investments. Previously, Mr. Davis served as Vice President and Associate General Counsel of FMR LLC (2003-2010). |
Annual Report
The Board of Trustees of Fidelity Latin America Fund voted to pay to shareholders of record at the opening of business on record date, the following distributions per share derived from capital gains realized from sales of portfolio securities and dividends derived from net investment income:
| Pay Date | Record Date | Dividends | Capital Gains |
Institutional Class | 12/05/2011 | 12/02/2011 | $0.845 | - |
A percentage of the dividends distributed during fiscal year may be taken into account as a dividend for the purposes of the the maximum rate under section 1(h)(11) of the Internal Revenue Code.
| December 3, 2010 | December 30, 2010 |
Institutional Class | 44% | 92% |
The amounts per share which represent income derived from sources within, and taxes paid to, foreign countries or possessions of the United States are as follows:
| Pay Date | Income | Taxes |
Institutional Class | 12/06/2010 | $0.350 | $0.0538 |
Institutional Class | 12/31/2010 | $0.023 | $0.0000 |
The fund will notify shareholders in January 2012 of amounts for use in preparing 2011 income tax returns.
Annual Report
Board Approval of Investment Advisory Contracts and Management Fees
Fidelity Latin America Fund
Each year, the Board of Trustees, including the Independent Trustees (together, the Board), votes on the renewal of the management contract and sub-advisory agreements (together, the Advisory Contracts) for the fund. The Board, assisted by the advice of fund counsel and Independent Trustees' counsel, requests and considers a broad range of information relevant to the renewal of the Advisory Contracts throughout the year.
The Board meets regularly and considers at each of its meetings factors that are relevant to its annual consideration of the renewal of the fund's Advisory Contracts, including the services and support provided to the fund and its shareholders. The Board has established various standing committees, each composed of Independent Trustees with varying backgrounds, to which the Board has assigned specific subject matter responsibilities in order to enhance effective decision-making by the Board. The Board, acting directly and through its Committees, requests and receives information concerning the annual consideration of the renewal of the fund's Advisory Contracts. The Board also meets as needed to consider matters specifically related to the Board's annual consideration of the renewal of Advisory Contracts. Members of the Board may also meet with trustees of other Fidelity funds through ad hoc joint committees to discuss certain matters relevant to the Fidelity funds.
At its July 2011 meeting, the Board of Trustees, including the Independent Trustees, unanimously determined to renew the fund's Advisory Contracts. In reaching its determination, the Board considered all factors it believed relevant, including (i) the nature, extent, and quality of the services to be provided to the fund and its shareholders (including the investment performance of the fund); (ii) the competitiveness of the fund's management fee and total expense ratio; (iii) the total costs of the services to be provided by and the profits to be realized by Fidelity from its relationship with the fund; (iv) the extent to which economies of scale would be realized as the fund grows; and (v) whether fee levels reflect these economies of scale, if any, for the benefit of fund shareholders.
In considering whether to renew the Advisory Contracts for the fund, the Board reached a determination, with the assistance of fund counsel and Independent Trustees' counsel and through the exercise of its business judgment, that the renewal of the Advisory Contracts is in the best interests of the fund and its shareholders and that the compensation payable under the Advisory Contracts is fair and reasonable. The Board's decision to renew the Advisory Contracts was not based on any single factor, but rather was based on a comprehensive consideration of all the information provided to the Board at its meetings throughout the year. The Board, in reaching its determination to renew the Advisory Contracts, is aware that shareholders in the fund have a broad range of investment choices available to them, including a wide choice among mutual funds offered by Fidelity's competitors, and that the fund's shareholders, who have the opportunity to review and weigh the disclosure provided by the fund in its prospectus and other public disclosures, have chosen to invest in this fund, managed by Fidelity.
Nature, Extent, and Quality of Services Provided. The Board considered the staffing within the investment adviser, FMR, and the sub-advisers (together, the Investment Advisers), including the backgrounds of the fund's investment personnel and the fund's investment objective and discipline. The Independent Trustees also had discussions with senior management of Fidelity's investment operations and investment groups. The Board considered the structure of the portfolio manager compensation program and whether this structure provides appropriate incentives to act in the best interests of the fund.
Resources Dedicated to Investment Management and Support Services. The Board and the Fund Oversight and Research Committees reviewed the general qualifications and capabilities of the Investment Advisers' investment staff, including its size, education, experience, and resources, as well as the Investment Advisers' approach to recruiting, training, managing, and compensating investment personnel. The Board also noted that FMR has devoted increased resources to non-U.S. offices. The Board noted that Fidelity's analysts have extensive resources, tools and capabilities which allow them to conduct sophisticated quantitative and fundamental analysis, as well as credit analysis of issuers, counterparties and enhancers. The Board also believes that Fidelity's investment professionals have sufficient access to global information and data so as to provide competitive investment results over time, and that those professionals also have access to sophisticated tools which permit them to assess portfolio construction and risk and performance attribution characteristics continuously, as well as to transmit new information and research conclusions rapidly around the world. Additionally, in their deliberations, the Board considered the Investment Advisers' trading capabilities and resources which are an integral part of the investment management process.
Shareholder and Administrative Services. The Board considered (i) the nature, extent, quality, and cost of advisory, administrative, and shareholder services performed by the Investment Advisers and their affiliates under the Advisory Contracts and under separate agreements covering transfer agency, pricing and bookkeeping, and securities lending services for the fund; (ii) the nature and extent of the investment adviser's supervision of third party service providers, principally custodians and subcustodians; and (iii) the resources devoted to, and the record of compliance with, the fund's compliance policies and procedures. The Board also reviewed the allocation of fund brokerage, including allocations to brokers affiliated with the Investment Advisers, the use of brokerage commissions to pay fund expenses, and the use of "soft" commission dollars to pay for research services.
The Board noted that the growth of fund assets over time across the complex allows Fidelity to reinvest in the development of services designed to enhance the value or convenience of the Fidelity funds as investment vehicles. These services include 24-hour access to account information and market information through telephone representatives and over the Internet, investor education materials and asset allocation tools, and the expanded availability of Fidelity Investor Centers, with 35 new branches opening since 2010.
Annual Report
Investment in a Large Fund Family. The Board considered the benefits to shareholders of investing in a Fidelity fund, including the benefits of investing in a fund that is part of a large family of funds offering a variety of investment disciplines and providing a large variety of mutual fund investor services. The Board noted that Fidelity had taken, or had made recommendations that resulted in the Fidelity funds taking, a number of actions over the previous year that benefited particular funds, including (i) continuing to dedicate additional resources to investment research and support of the senior management team that oversees asset management; (ii) rationalizing product lines through the mergers of six funds into other funds; (iii) continuing to migrate the Freedom Funds to dedicated lower cost underlying funds; (iv) obtaining shareholder approval to broaden the investment strategies for Fidelity Consumer Finance Portfolio, Fidelity Emerging Asia Fund, and Fidelity Environment and Alternative Energy Portfolio; (v) contractually agreeing to reduce the management fees and impose other expense limitations on Spartan 500 Index Fund and U.S. Bond Index Fund in connection with launching new institutional classes of these funds; (vi) changing the name, primary and supplemental benchmarks, and investment policies of Fidelity Global Strategies Fund to support the fund's flexible investment mandate and global orientation; and (vii) reducing the transfer agency account fee rates on certain accounts.
Investment Performance. The Board considered whether the fund has operated in accordance with its investment objective, as well as its record of compliance with its investment restrictions. It also reviewed the fund's absolute investment performance for the retail class, as well as the fund's relative investment performance for the retail class measured over multiple periods against a broad-based securities market index. The Board noted that FMR does not believe that a meaningful peer group exists against which to compare the fund's performance. The following charts considered by the Board show, over the one-, three-, and five-year periods ended December 31, 2010, the cumulative total returns of the retail class of the fund and the cumulative total returns of a broad-based securities market index ("benchmark"). (The Advisor classes of the fund had less than one year of performance as of December 31, 2010.)
Fidelity Latin America Fund

The Board noted that the investment performance of the fund was lower than its benchmark for the three- and five-year periods, although the one-year total return of the retail class compared favorably to its benchmark. The Board also reviewed the fund's performance since inception as well as performance in the current year.
Based on its review, the Board concluded that the nature, extent, and quality of services provided to the fund under the Advisory Contracts should benefit the fund's shareholders.
Competitiveness of Management Fee and Total Expense Ratio. The Board considered the fund's management fee and total expense ratio compared to "mapped groups" of competitive funds and classes. Fidelity creates "mapped groups" by combining similar Lipper investment objective categories that have comparable management fee characteristics. Combining Lipper investment objective categories aids the Board's management fee and total expense ratio comparisons by broadening the competitive group used for comparison and by reducing the number of universes to which various Fidelity funds are compared.
Management Fee. The Board considered two proprietary management fee comparisons for the 12-month periods shown in the chart below. The group of Lipper funds used by the Board for management fee comparisons is referred to below as the "Total Mapped Group." The Total Mapped Group comparison focuses on a fund's standing relative to the total universe of comparable funds available to investors in terms of gross management fees before expense reimbursements or caps, and without giving effect to the fund's performance adjustment. "TMG %" represents the percentage of funds in the Total Mapped Group that had management fees that were lower than the fund's. For example, a TMG % of 7% means that 93% of the funds in the Total Mapped Group had higher management fees than the fund. The "Asset-Size Peer Group" (ASPG) comparison focuses on a fund's standing relative to non-Fidelity funds similar in size to the fund within the Total Mapped Group. The ASPG represents at least 15% of the funds in the Total Mapped Group with comparable asset size and management fee characteristics, subject to a minimum of 50 funds (or all funds in the Total Mapped Group if fewer than 50). Additional information, such as the ASPG quartile in which the fund's management fee ranked and the impact of the fund's performance adjustment, is also included in the chart and considered by the Board.
Annual Report
Board Approval of Investment Advisory Contracts and Management Fees - continued
Fidelity Latin America Fund

The Board noted that the fund's management fee ranked below the median of its Total Mapped Group and below the median of its ASPG for 2010.
Based on its review, the Board concluded that the fund's management fee is fair and reasonable in light of the services that the fund receives and the other factors considered.
Total Expense Ratio. In its review of each class's total expense ratio, the Board considered the fund's management fee as well as other fund or class expenses, as applicable, such as transfer agent fees, pricing and bookkeeping fees, fund-paid 12b-1 fees, and custodial, legal, and audit fees. The Board also noted the effects of any waivers and reimbursements on fees and expenses, as well as the impact of the fund's performance adjustment. As part of its review, the Board also considered the current and historical total expense ratios of each class of the fund compared to competitive fund median expenses. Each class of the fund is compared to those funds and classes in the Total Mapped Group (used by the Board for management fee comparisons) that have a similar sales load structure.
The Board noted that the total expense ratio of each class ranked below its competitive median for the period. The Board considered that various factors, including 12b-1 fees, positive or negative performance adjustments, and relatively higher other expenses in the case of small fund size, can affect total expense ratios.
Fees Charged to Other Fidelity Clients. The Board also considered Fidelity fee structures and other information with respect to clients of FMR and its affiliates, such as other mutual funds advised or subadvised by FMR or its affiliates, pension plan clients, and other institutional clients. In March 2010, the Board created an ad hoc joint committee with the board of other Fidelity funds (the Committee) to review and compare Fidelity's institutional investment advisory business with its business of providing services to the Fidelity funds, including the differences in services provided, fees charged, and costs incurred, as well as competition in their respective marketplaces.
Based on its review of total expense ratios and fees charged to other Fidelity clients, the Board concluded that the total expense ratio of each class of the fund was reasonable in light of the services that the fund and its shareholders receive and the other factors considered, including the findings of the Committee.
Costs of the Services and Profitability. The Board considered the revenues earned and the expenses incurred by Fidelity in conducting the business of developing, marketing, distributing, managing, administering and servicing the fund and its shareholders. The Board also considered the level of Fidelity's profits in respect of all the Fidelity funds.
On an annual basis, FMR presents to the Board Fidelity's profitability for the fund. Fidelity calculates the profitability for each fund, as well as aggregate profitability for groups of Fidelity funds and all Fidelity funds, using a series of detailed revenue and cost allocation methodologies which originate with the books and records of Fidelity on which Fidelity's audited financial statements are based. The Audit Committee of the Board reviews any significant changes from the prior year's methodologies.
Annual Report
PricewaterhouseCoopers LLP (PwC), independent registered public accounting firm and auditor to Fidelity and certain Fidelity funds, has been engaged annually by the Board as part of the Board's assessment of Fidelity's profitability analysis. PwC's engagement includes the review and assessment of Fidelity's methodologies used in determining the revenues and expenses attributable to Fidelity's mutual fund business, and completion of agreed-upon procedures surrounding the mathematical accuracy of fund profitability and its conformity to allocation methodologies. After considering PwC's reports issued under the engagement and information provided by Fidelity, the Board concluded that while other allocation methods may also be reasonable, Fidelity's profitability methodologies are reasonable in all material respects.
The Board also reviewed Fidelity's non-fund businesses and fall-out benefits related to the mutual fund business as well as cases where Fidelity's affiliates may benefit from or be related to the fund's business.
The Board considered the costs of the services provided by and the profits realized by Fidelity in connection with the operation of the fund and was satisfied that the profitability was not excessive in the circumstances.
Economies of Scale. The Board considered whether there have been economies of scale in respect of the management of the Fidelity funds, whether the Fidelity funds (including the fund) have appropriately benefited from any such economies of scale, and whether there is potential for realization of any further economies of scale. The Board considered the extent to which the fund will benefit from economies of scale through increased services to the fund, through waivers or reimbursements, or through fee or expense reductions. The Board also noted that in 2009, it and the board of other Fidelity funds created an ad hoc committee (the Economies of Scale Committee) to analyze whether FMR attains economies of scale in respect of the management and servicing of the Fidelity funds, whether the Fidelity funds have appropriately benefited from such economies of scale, and whether there is potential for realization of any further economies of scale.
The Board recognized that the fund's management contract incorporates a "group fee" structure, which provides for lower group fee rates as total fund assets under FMR's management increase, and for higher group fee rates as total fund assets under FMR's management decrease. FMR calculates the group fee rates based on a tiered asset "breakpoint" schedule that varies based on asset class. The Board considered that the group fee is designed to deliver the benefits of economies of scale to fund shareholders when total Fidelity fund assets increase, even if assets of any particular fund are unchanged or have declined, because some portion of Fidelity's costs are attributable to services provided to all Fidelity funds, and all funds benefit if those costs can be allocated among more assets. The Board concluded that, given the group fee structure, fund shareholders will benefit from lower management fees as assets under FMR's management increase at the fund complex level, regardless of whether Fidelity achieves any such economies of scale.
The Board concluded, taking into account the analysis of the Economies of Scale Committee, that any potential economies of scale are being appropriately shared between fund shareholders and Fidelity.
Additional Information Requested by the Board. In order to develop fully the factual basis for consideration of the Fidelity funds' Advisory Contracts, the Board requested and received additional information on certain topics, including (i) fund performance trends, actions to be taken by FMR to improve certain funds' overall performance, and Fidelity's long-term strategies for certain funds; (ii) portfolio manager changes that have occurred during the past year and length of portfolio manager tenure for different categories of funds over time; (iii) Fidelity's compensation structure for portfolio managers and other key personnel and strategies for attracting and retaining non-investment personnel; (iv) the amount of the investment that each portfolio manager has made in the Fidelity fund(s) that he or she manages; (v) historical trends in Fidelity's realization of fall-out benefits; (vi) Fidelity's group fee structures and the rationale for the individual fee rates of certain funds; (vii) fund profitability methodology and the impact of certain factors on fund profitability results; (viii) trends regarding industry use of performance fee structures and Fidelity's compliance practices with respect to performance adjustment calculations; (ix) the fee structures in place for certain other Fidelity clients; and (x) explanations regarding the relative total expense ratios of certain funds and classes, total expense competitive trends, and actions that might be taken by FMR to reduce total expense ratios for certain funds and classes.
Based on its evaluation of all of the conclusions noted above, and after considering all factors it believed relevant, the Board ultimately concluded that the advisory fee structures are fair and reasonable, and that the fund's Advisory Contracts should be renewed.
Annual Report
Investment Adviser
Fidelity Management & Research Company
Boston, MA
Investment Sub-Advisers
FMR Co., Inc.
Fidelity Management & Research
(U.K.) Inc.
FIL Investment Advisors
FIL Investment Advisors
(UK) Limited
Fidelity Management & Research
(Hong Kong) Limited
Fidelity Management & Research
(Japan) Inc.
General Distributor
Fidelity Distributors Corporation
Boston, MA
Transfer and Service Agents
Fidelity Investments Institutional Operations Company, Inc.
Boston, MA
Fidelity Service Company, Inc.
Boston, MA
Custodian
Brown Brothers Harriman & Co.
Boston, MA

FALAI-UANN-1211
1.917407.101
Item 2. Code of Ethics
As of the end of the period, October 31, 2011, Fidelity Investment Trust (the trust) has adopted a code of ethics, as defined in Item 2 of Form N-CSR, that applies to its President and Treasurer and its Chief Financial Officer. A copy of the code of ethics is filed as an exhibit to this Form N-CSR.
Item 3. Audit Committee Financial Expert
The Board of Trustees of the trust has determined that Joseph Mauriello is an audit committee financial expert, as defined in Item 3 of Form N-CSR. Mr. Mauriello is independent for purposes of Item 3 of Form N-CSR.
Item 4. Principal Accountant Fees and Services
Fees and Services
The following table presents fees billed by Deloitte & Touche LLP, the member firms of Deloitte Touche Tohmatsu, and their respective affiliates (collectively, "Deloitte Entities") in each of the last two fiscal years for services rendered to Fidelity Europe Capital Appreciation Fund (the "Fund"):
Services Billed by Deloitte Entities
October 31, 2011 FeesA
| Audit Fees | Audit-Related Fees | Tax Fees | All Other Fees |
Fidelity Europe Capital Appreciation Fund | $43,000 | $- | $5,700 | $300 |
October 31, 2010 FeesA
| Audit Fees | Audit-Related Fees | Tax Fees | All Other Fees |
Fidelity Europe Capital Appreciation Fund | $42,000 | $- | $5,600 | $- |
A Amounts may reflect rounding.
The following table presents fees billed by PricewaterhouseCoopers LLP ("PwC") in each of the last two fiscal years for services rendered to Fidelity Canada Fund, Fidelity China Region Fund, Fidelity Emerging Asia Fund, Fidelity Emerging Markets Fund, Fidelity Europe Fund, Fidelity Japan Fund, Fidelity Japan Smaller Companies Fund, Fidelity Latin America Fund, Fidelity Nordic Fund and Fidelity Pacific Basin (the "Funds"):
Services Billed by PwC
October 31, 2011 FeesA
| Audit Fees | Audit-Related Fees | Tax Fees | All Other Fees |
Fidelity Canada Fund | $66,000 | $- | $5,100 | $3,900 |
Fidelity China Region Fund | $59,000 | $- | $5,100 | $2,600 |
Fidelity Emerging Asia Fund | $61,000 | $- | $5,100 | $2,500 |
Fidelity Emerging Markets Fund | $80,000 | $- | $5,300 | $3,800 |
Fidelity Europe Fund | $62,000 | $- | $8,300 | $2,100 |
Fidelity Japan Fund | $60,000 | $- | $5,100 | $2,000 |
Fidelity Japan Smaller Companies Fund | $49,000 | $- | $5,100 | $1,800 |
Fidelity Latin America Fund | $65,000 | $- | $5,100 | $3,500 |
Fidelity Nordic Fund | $50,000 | $- | $5,100 | $1,900 |
Fidelity Pacific Basin Fund | $62,000 | $- | $5,300 | $2,100 |
October 31, 2010 FeesA
| Audit Fees | Audit-Related Fees | Tax Fees | All Other Fees |
Fidelity Canada Fund | $62,000 | $- | $4,900 | $3,500 |
Fidelity China Region Fund | $57,000 | $- | $4,900 | $2,600 |
Fidelity Emerging Asia Fund | $59,000 | $- | $4,900 | $2,400 |
Fidelity Emerging Markets Fund | $78,000 | $- | $5,100 | $3,700 |
Fidelity Europe Fund | $61,000 | $- | $12,500 | $2,600 |
Fidelity Japan Fund | $58,000 | $- | $4,900 | $2,100 |
Fidelity Japan Smaller Companies Fund | $47,000 | $- | $4,900 | $1,800 |
Fidelity Latin America Fund | $63,000 | $- | $4,900 | $3,600 |
Fidelity Nordic Fund | $47,000 | $- | $4,900 | $1,800 |
Fidelity Pacific Basin Fund | $59,000 | $- | $5,100 | $2,000 |
A Amounts may reflect rounding.
The following table presents fees billed by PwC and Deloitte Entities that were required to be approved by the Audit Committee for services that relate directly to the operations and financial reporting of the Funds and that are rendered on behalf of Fidelity Management & Research Company ("FMR") and entities controlling, controlled by, or under common control with FMR (not including any sub-adviser whose role is primarily portfolio management and is subcontracted with or overseen by another investment adviser) that provide ongoing services to the Funds ("Fund Service Providers"):
Services Billed by Deloitte Entities
| October 31, 2011A | October 31, 2010A |
Audit-Related Fees | $440,000 | $720,000 |
Tax Fees | $- | $- |
All Other Fees | $430,000 | $790,000 |
A Amounts may reflect rounding.
Services Billed by PwC
| October 31, 2011A | October 31, 2010A |
Audit-Related Fees | $3,835,000 | $2,150,000 |
Tax Fees | $- | $- |
All Other Fees | $- | $510,000 |
A Amounts may reflect rounding.
"Audit-Related Fees" represent fees billed for assurance and related services that are reasonably related to the performance of the fund audit or the review of the fund's financial statements and that are not reported under Audit Fees.
"Tax Fees" represent fees billed for tax compliance, tax advice or tax planning that relate directly to the operations and financial reporting of the fund.
"All Other Fees" represent fees billed for services provided to the fund or Fund Service Provider, a significant portion of which are assurance related, that relate directly to the operations and financial reporting of the fund, excluding those services that are reported under Audit Fees, Audit-Related Fees or Tax Fees.
Assurance services must be performed by an independent public accountant.
* * *
The aggregate non-audit fees billed by PwC and Deloitte Entities for services rendered to the Funds, FMR (not including any sub-adviser whose role is primarily portfolio management and is subcontracted with or overseen by another investment adviser), and any Fund Service Provider for each of the last two fiscal years of the Funds are as follows:
Billed By | October 31, 2011 A | October 31, 2010 A |
PwC | $5,915,000 | $5,285,000 |
Deloitte Entities | $965,000 | $1,605,000 |
A Amounts may reflect rounding.
The trust's Audit Committee has considered non-audit services that were not pre-approved that were provided by PwC and Deloitte Entities to Fund Service Providers to be compatible with maintaining the independence of PwC and Deloitte Entities in their audits of the Funds, taking into account representations from PwC and Deloitte Entities, in accordance with Public Company Accounting Oversight Board rules, regarding their independence from the Funds and their related entities and FMR's review of the appropriateness and permissibility under applicable law of such non-audit services prior to their provision to the Fund Service Providers.
Audit Committee Pre-Approval Policies and Procedures
The trust's Audit Committee must pre-approve all audit and non-audit services provided by a fund's independent registered public accounting firm relating to the operations or financial reporting of the fund. Prior to the commencement of any audit or non-audit services to a fund, the Audit Committee reviews the services to determine whether they are appropriate and permissible under applicable law.
The Audit Committee has adopted policies and procedures to, among other purposes, provide a framework for the Committee's consideration of non-audit services by the audit firms that audit the Fidelity funds. The policies and procedures require that any non-audit service provided by a fund audit firm to a Fidelity fund and any non-audit service provided by a fund auditor to a Fund Service Provider that relates directly to the operations and financial reporting of a Fidelity fund ("Covered Service") are subject to approval by the Audit Committee before such service is provided.
All Covered Services must be approved in advance of provision of the service either: (i) by formal resolution of the Audit Committee, or (ii) by oral or written approval of the service by the Chair of the Audit Committee (or if the Chair is unavailable, such other member of the Audit Committee as may be designated by the Chair to act in the Chair's absence). The approval contemplated by (ii) above is permitted where the Treasurer determines that action on such an engagement is necessary before the next meeting of the Audit Committee.
Non-audit services provided by a fund audit firm to a Fund Service Provider that do not relate directly to the operations and financial reporting of a Fidelity fund are reported to the Audit Committee on a periodic basis.
Non-Audit Services Approved Pursuant to Rule 2-01(c)(7)(i)(C) and (ii) of Regulation S-X ("De Minimis Exception")
There were no non-audit services approved or required to be approved by the Audit Committee pursuant to the De Minimis Exception during the Funds' last two fiscal years relating to services provided to (i) the Funds or (ii) any Fund Service Provider that relate directly to the operations and financial reporting of the Funds.
Item 5. Audit Committee of Listed Registrants
Not applicable.
Item 6. Investments
(a) Not applicable.
(b) Not applicable
Item 7. Disclosure of Proxy Voting Policies and Procedures for Closed-End Management Investment Companies
Not applicable.
Item 8. Portfolio Managers of Closed-End Management Investment Companies
Not applicable.
Item 9. Purchase of Equity Securities by Closed-End Management Investment Company and Affiliated Purchasers
Not applicable.
Item 10. Submission of Matters to a Vote of Security Holders
There were no material changes to the procedures by which shareholders may recommend nominees to the trust's Board of Trustees.
Item 11. Controls and Procedures
(a)(i) The President and Treasurer and the Chief Financial Officer have concluded that the trust's disclosure controls and procedures (as defined in Rule 30a-3(c) under the Investment Company Act) provide reasonable assurances that material information relating to the trust is made known to them by the appropriate persons, based on their evaluation of these controls and procedures as of a date within 90 days of the filing date of this report.
(a)(ii) There was no change in the trust's internal control over financial reporting (as defined in Rule 30a-3(d) under the Investment Company Act) that occurred during the second fiscal quarter of the period covered by this report that has materially affected, or is reasonably likely to materially affect, the trust's internal control over financial reporting.
Item 12. Exhibits
(a) | (1) | Code of Ethics pursuant to Item 2 of Form N-CSR is filed and attached hereto as EX-99.CODE ETH. |
(a) | (2) | Certification pursuant to Rule 30a-2(a) under the Investment Company Act of 1940 (17 CFR 270.30a-2(a)) is filed and attached hereto as Exhibit 99.CERT. |
(a) | (3) | Not applicable. |
(b) | | Certification pursuant to Rule 30a-2(b) under the Investment Company Act of 1940 (17 CFR 270.30a-2(b)) is furnished and attached hereto as Exhibit 99.906CERT. |
SIGNATURES
Pursuant to the requirements of the Securities Exchange Act of 1934 and the Investment Company Act of 1940, the registrant has duly caused this report to be signed on its behalf by the undersigned, thereunto duly authorized.
Fidelity Investment Trust
By: | /s/Kenneth B. Robins |
| Kenneth B. Robins |
| President and Treasurer |
| |
Date: | December 30, 2011 |
Pursuant to the requirements of the Securities Exchange Act of 1934 and the Investment Company Act of 1940, this report has been signed below by the following persons on behalf of the registrant and in the capacities and on the dates indicated.
By: | /s/Kenneth B. Robins |
| Kenneth B. Robins |
| President and Treasurer |
| |
Date: | December 30, 2011 |
By: | /s/Christine Reynolds |
| Christine Reynolds |
| Chief Financial Officer |
| |
Date: | December 30, 2011 |