UNITED STATES
SECURITIES AND EXCHANGE COMMISSION
Washington, D.C. 20549
FORM N-CSR
CERTIFIED SHAREHOLDER REPORT OF REGISTERED
MANAGEMENT INVESTMENT COMPANIES
Investment Company Act file number 811-4008
Fidelity Investment Trust
(Exact name of registrant as specified in charter)
82 Devonshire St., Boston, Massachusetts 02109
(Address of principal executive offices) (Zip code)
Scott C. Goebel, Secretary
82 Devonshire St.
Boston, Massachusetts 02109
(Name and address of agent for service)
Registrant's telephone number, including area code: 617-563-7000
Date of fiscal year end: | October 31 |
| |
Date of reporting period: | October 31, 2012 |
This report on Form N-CSR relates solely to the Registrant's Fidelity Canada Fund, Fidelity China Region Fund, Fidelity Emerging Asia Fund, Fidelity Emerging Markets Fund, Fidelity Europe Fund, Fidelity Europe Capital Appreciation Fund, Fidelity Japan Fund, Fidelity Japan Smaller Companies Fund, Fidelity Latin America Fund, Fidelity Nordic Fund and Fidelity Pacific Basin series (each, a "Fund" and collectively, the "Funds").
Item 1. Reports to Stockholders
Fidelity's
Targeted International Equity
Funds®
Fidelity® Canada Fund
Fidelity China Region Fund
Fidelity Emerging Asia Fund
Fidelity Emerging Markets Fund
Fidelity Europe Capital Appreciation Fund
Fidelity Europe Fund
Fidelity Japan Fund
Fidelity Japan Smaller Companies Fund
Fidelity Latin America Fund
Fidelity Nordic Fund
Fidelity Pacific Basin Fund
Annual Report
October 31, 2012
(Fidelity Cover Art)
Contents
To view a fund's proxy voting guidelines and proxy voting record for the 12-month period ended June 30, visit http://www.fidelity.com/proxyvotingresults or visit the Securities and Exchange Commission's (SEC) web site at http://www.sec.gov. You may also call 1-800-544-8544 to request a free copy of the proxy voting guidelines.
Standard & Poor's, S&P and S&P 500 are registered service marks of The McGraw-Hill Companies, Inc. and have been licensed for use by Fidelity Distributors Corporation.
Other third party marks appearing herein are the property of their respective owners.
All other marks appearing herein are registered or unregistered trademarks or service marks of FMR LLC or an affiliated company. © 2012 FMR LLC. All rights reserved.
Annual Report
This report and the financial statements contained herein are submitted for the general information of the shareholders of the funds. This report is not authorized for distribution to prospective investors in the funds unless preceded or accompanied by an effective prospectus.
A fund files its complete schedule of portfolio holdings with the SEC for the first and third quarters of each fiscal year on Form N-Q. Forms N-Q are available on the SEC's web site at http://www.sec.gov. A fund's Forms N-Q may be reviewed and copied at the SEC's Public Reference Room in Washington, DC. Information regarding the operation of the SEC's Public Reference Room may be obtained by calling 1-800-SEC-0330. For a complete list of a fund's portfolio holdings, view the most recent holdings listing, semiannual report, or annual report on Fidelity's web site at http://www.fidelity.com, http://www.advisor.fidelity.com, or http://www.401k.com, as applicable.
NOT FDIC INSURED • MAY LOSE VALUE • NO BANK GUARANTEE
Neither the funds nor Fidelity Distributors Corporation is a bank.
Annual Report
Fidelity Canada Fund
Average annual total return reflects the change in the value of an investment, assuming reinvestment of the class' distributions from dividend income and capital gains (the profits earned upon the sale of securities that have grown in value, if any) and assuming a constant rate of performance each year. The $10,000 table and the fund's returns do not reflect the deduction of taxes that a shareholder would pay on fund distributions or the redemption of fund shares. During periods of reimbursement by Fidelity, a fund's total return will be greater than it would be had the reimbursement not occurred. How a fund did yesterday is no guarantee of how it will do tomorrow.
Average Annual Total Returns
Periods ended October 31, 2012 | Past 1
year | Past 5
years | Past 10
years |
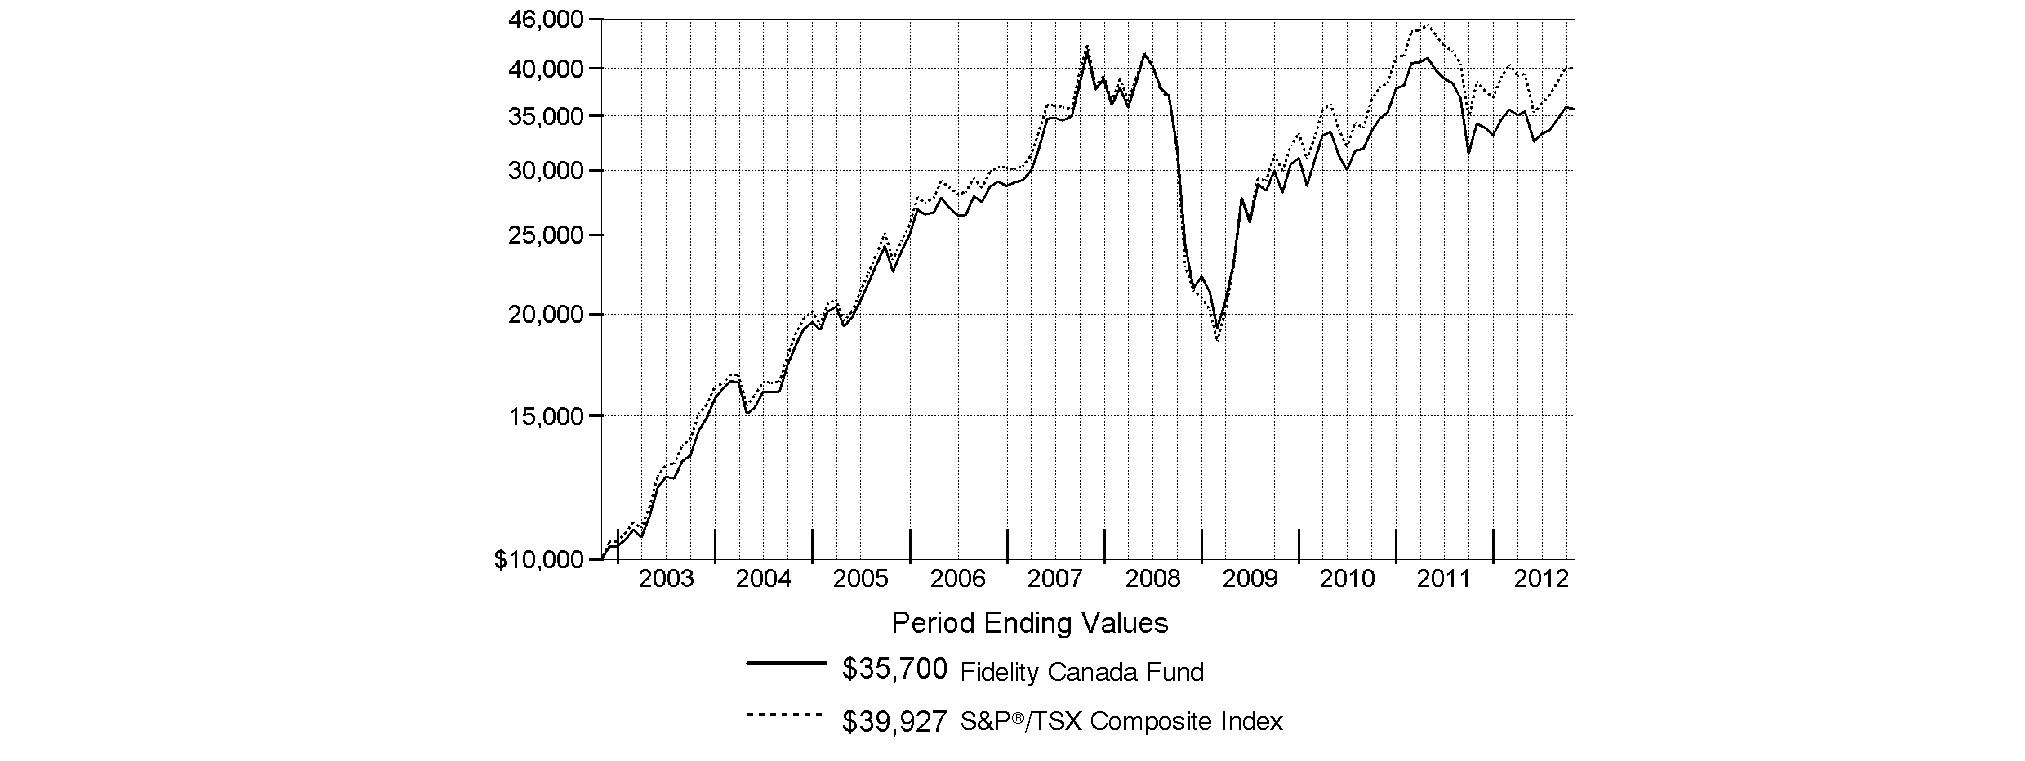
Fidelity® Canada Fund | 4.36% | -3.11% | 13.57% |
$10,000 Over 10 Years
Let's say hypothetically that $10,000 was invested in Fidelity® Canada Fund, a class of the fund, on October 31, 2002. The chart shows how the value of your investment would have changed, and also shows how the S&P®/TSX Composite Index performed over the same period.
Annual Report
Fidelity Canada Fund
Market Recap: Returns for most domestic and international equities fluctuated during the 12 months ending October 31, 2012, as investor sentiment towards risk vacillated amid a changing global economic landscape. U.S. stocks overcame bouts of volatility to post strong gains for the past year, extending an uptrend that began in March 2009. The broad-based S&P 500® Index advanced 15.21%, while the blue-chip-laden Dow Jones Industrial AverageSM and technology-heavy Nasdaq Composite® Index rose 12.56% and 12.21%, respectively. Performance outside of the U.S. was relatively weak, as the MSCI® ACWI® (All Country World Index) ex USA Index rose 4.11%, hampered in part by a stronger U.S. dollar. International developed-markets generally struggled during the period as macroeconomic concerns ebbed and flowed, finishing with only a modest gain. The MSCI® EAFE® Index rose 4.76% for the year, largely buttressed in the summertime by pledges of accommodative monetary action from eurozone officials, as well as signs that the U.S. housing market was on the mend. Within the index, Asia-Pacific ex Japan showed the most impressive gain, advancing roughly 10%. A number of core European components, including Germany (+11%) and Switzerland (+10%), and the U.K. (+9%), benefited from optimism about the eurozone's ability to resolve its debt woes, which helped the region outpace the index overall. Elsewhere, Japan was among the few benchmark constituents to finish in the red, returning about -3%. Emerging-markets stocks gained 2.98% for the year, as measured by the MSCI Emerging Markets Index. A general uptrend in the final five months of the period lifted the index into positive territory for the full 12 months.
Comments from Douglas Lober, Portfolio Manager of Fidelity® Canada Fund: For the year, the fund's Retail Class shares rose 4.36%, beating the 3.82% gain of the S&P/TSX Composite Index. The fund's outperformance was largely driven by solid picks and an overweighting in health care, a sector that makes up only small portion of the index but was its star performer this period. Our stake in pharmacy benefits manager SXC Health Solutions proved most rewarding, as the stock vaulted higher on the firm's April announcement of its plans to buy Catalyst Health Solutions. The market warmly welcomed the merger, which created the combined entity Catamaran in July. Unfortunately, Catamaran's stock didn't react quite as strongly to the big move as I had hoped, and it ended up our largest relative detractor. Also in health care, Valeant Pharmaceuticals International flexed its muscles for the fund, as its shares advanced on a number of accretive acquisitions this period. An overweighting in consumer discretionary, especially among retailers, provided an additional lift. Here, shares of discount store operator Dollarama steadily advanced, as the company continued to gain pricing power from increasing the average cost of its items from $1 to $2, while also opening new stores across Canada. In materials, the fund's limited stake in lagging index component Kinross Gold was a good call, as was scant exposure to weak-performing BlackBerry® mobile device maker Research In Motion among information technology names. Conversely, underweighting some beneficiaries of accretive acquisitions in the energy sector detracted the most from relative results, including our minimal position in index component Nexen, whose stock shot up in July on the announcement that China's CNOOC intended to acquire the firm. Positioning in financials, including an underweighting in rebounding index component Royal Bank of Canada, hurt, as did choices in industrials. Also, an overweighting in enterprise software firm Open Text notably detracted, as did holdings in Barrick Gold, which faltered in part on production missteps.
Note to shareholders: Fidelity Canada Fund may invest up to 35% of its total assets in any industry that represents more than 20% of the Canadian market. As of October 31, 2012, the fund did not have more than 25% of its assets invested in any one industry.
The views expressed above reflect those of the portfolio manager(s) only through the end of the period as stated on the cover of this report and do not necessarily represent the views of Fidelity or any other person in the Fidelity organization. Any such views are subject to change at any time based upon market or other conditions and Fidelity disclaims any responsibility to update such views. These views may not be relied on as investment advice and, because investment decisions for a Fidelity fund are based on numerous factors, may not be relied on as an indication of trading intent on behalf of any Fidelity fund.
Annual Report
Fidelity Canada Fund
As a shareholder of the Fund, you incur two types of costs: (1) transaction costs, including sales charges (loads) on purchase payments or redemption proceeds, redemption fees and (2) ongoing costs, including management fees, distribution and/or service (12b-1) fees and other Fund expenses. This Example is intended to help you understand your ongoing costs (in dollars) of investing in the Fund and to compare these costs with the ongoing costs of investing in other mutual funds.
The Example is based on an investment of $1,000 invested at the beginning of the period and held for the entire period (May 1, 2012 to October 31, 2012).
Actual Expenses
The first line of the accompanying table for each class of the Fund provides information about actual account values and actual expenses. You may use the information in this line, together with the amount you invested, to estimate the expenses that you paid over the period. Simply divide your account value by $1,000.00 (for example, an $8,600 account value divided by $1,000.00 = 8.6), then multiply the result by the number in the first line for a class of the Fund under the heading entitled "Expenses Paid During Period" to estimate the expenses you paid on your account during this period. A small balance maintenance fee of $12.00 that is charged once a year may apply for certain accounts with a value of less than $2,000. This fee is not included in the table below. If it was, the estimate of expenses you paid during the period would be higher, and your ending account value lower, by this amount. In addition, the Fund, as a shareholder in the underlying Fidelity Central Funds, will indirectly bear its pro-rata share of the fees and expenses incurred by the underlying Fidelity Central Funds. These fees and expenses are not included in the Fund's annualized expense ratio used to calculate the expense estimate in the table below.
Hypothetical Example for Comparison Purposes
The second line of the accompanying table for each class of the Fund provides information about hypothetical account values and hypothetical expenses based on a Class' actual expense ratio and an assumed rate of return of 5% per year before expenses, which is not the Class' actual return. The hypothetical account values and expenses may not be used to estimate the actual ending account balance or expenses you paid for the period. You may use this information to compare the ongoing costs of investing in the Fund and other funds. To do so, compare this 5% hypothetical example with the 5% hypothetical examples that appear in the shareholder reports of the other funds. A small balance maintenance fee of $12.00 that is charged once a year may apply for certain accounts with a value of less than $2,000. This fee is not included in the table below. If it was, the estimate of expenses you paid during the period would be higher, and your ending account value lower, by this amount. In addition, the Fund, as a shareholder in the underlying Fidelity Central Funds, will indirectly bear its pro-rata share of the fees and expenses incurred by the underlying Fidelity Central Funds. These fees and expenses are not included in the Fund's annualized expense ratio used to calculate the expense estimate in the table below.
Please note that the expenses shown in the table are meant to highlight your ongoing costs only and do not reflect any transaction costs. Therefore, the second line of the table is useful in comparing ongoing costs only, and will not help you determine the relative total costs of owning different funds. In addition, if these transactional costs were included, your costs would have been higher.
| Annualized
Expense Ratio | Beginning
Account Value
May 1, 2012 | Ending
Account Value
October 31, 2012 | Expenses Paid
During Period*
May 1, 2012
to October 31, 2012 |
Class A | 1.07% | | | |
Actual | | $ 1,000.00 | $ 1,006.00 | $ 5.40 |
Hypothetical A | | $ 1,000.00 | $ 1,019.76 | $ 5.43 |
Class T | 1.35% | | | |
Actual | | $ 1,000.00 | $ 1,004.50 | $ 6.80 |
Hypothetical A | | $ 1,000.00 | $ 1,018.35 | $ 6.85 |
Class B | 1.84% | | | |
Actual | | $ 1,000.00 | $ 1,002.30 | $ 9.26 |
Hypothetical A | | $ 1,000.00 | $ 1,015.89 | $ 9.32 |
Class C | 1.81% | | | |
Actual | | $ 1,000.00 | $ 1,002.30 | $ 9.11 |
Hypothetical A | | $ 1,000.00 | $ 1,016.04 | $ 9.17 |
Canada | .76% | | | |
Actual | | $ 1,000.00 | $ 1,007.60 | $ 3.84 |
Hypothetical A | | $ 1,000.00 | $ 1,021.32 | $ 3.86 |
Institutional Class | .75% | | | |
Actual | | $ 1,000.00 | $ 1,007.70 | $ 3.79 |
Hypothetical A | | $ 1,000.00 | $ 1,021.37 | $ 3.81 |
A 5% return per year before expenses
* Expenses are equal to each Class' annualized expense ratio, multiplied by the average account value over the period, multiplied by 184/366 (to reflect the one-half year period).
Annual Report
Fidelity Canada Fund
Investment Changes (Unaudited)
Geographic Diversification (% of fund's net assets) |
As of October 31, 2012 |
 | Canada | 97.1% | |
 | United States of America | 2.9% | |

Percentages are based on country or territory of incorporation and are adjusted for the effect of futures contracts, if applicable. |
As of April 30, 2012 |
 | Canada | 89.9% | |
| United States of America | 10.1% | |

Percentages are based on country or territory of incorporation and are adjusted for the effect of futures contracts, if applicable. |
Asset Allocation |
| % of fund's
net assets | % of fund's net assets
6 months ago |
Stocks | 99.3 | 99.8 |
Short-Term Investments and Net Other Assets (Liabilities) | 0.7 | 0.2 |
Top Ten Stocks as of October 31, 2012 |
| % of fund's
net assets | % of fund's net assets
6 months ago |
Royal Bank of Canada (Commercial Banks) | 5.9 | 5.9 |
The Toronto-Dominion Bank (Commercial Banks) | 5.5 | 6.4 |
Suncor Energy, Inc. (Oil, Gas & Consumable Fuels) | 4.2 | 4.2 |
Bank of Nova Scotia (Commercial Banks) | 4.1 | 4.2 |
Goldcorp, Inc. (Metals & Mining) | 3.5 | 2.1 |
Enbridge, Inc. (Oil, Gas & Consumable Fuels) | 3.3 | 3.8 |
Catamaran Corp. (Health Care Providers & Services) | 3.1 | 3.8 |
Valeant Pharmaceuticals International, Inc. (Canada) (Pharmaceuticals) | 3.1 | 4.1 |
Canadian National Railway Co. (Road & Rail) | 3.0 | 3.4 |
Cenovus Energy, Inc. (Oil, Gas & Consumable Fuels) | 2.9 | 2.7 |
| 38.6 | |
Market Sectors as of October 31, 2012 |
| % of fund's
net assets | % of fund's net assets
6 months ago |
Financials | 28.3 | 31.1 |
Energy | 24.6 | 19.1 |
Materials | 18.0 | 12.5 |
Health Care | 6.2 | 8.3 |
Telecommunication Services | 5.6 | 4.6 |
Consumer Discretionary | 5.5 | 9.9 |
Industrials | 4.8 | 6.0 |
Information Technology | 3.1 | 4.1 |
Consumer Staples | 3.0 | 4.0 |
Utilities | 0.2 | 0.2 |
Annual Report
Fidelity Canada Fund
Investments October 31, 2012
Showing Percentage of Net Assets
Common Stocks - 99.3% |
| Shares | | Value |
CONSUMER DISCRETIONARY - 5.5% |
Auto Components - 0.1% |
Magna International, Inc. Class A
(sub. vtg.) | 100,000 | | $ 4,445,557 |
Hotels, Restaurants & Leisure - 0.5% |
Tim Hortons, Inc. (Canada) | 310,300 | | 15,403,929 |
Media - 0.9% |
Cineplex, Inc. | 300,000 | | 9,311,640 |
Corus Entertainment, Inc. Class B (non-vtg.) | 550,000 | | 12,451,064 |
Quebecor, Inc. Class B (sub. vtg.) | 200,000 | | 6,976,721 |
| | 28,739,425 |
Multiline Retail - 2.3% |
Dollarama, Inc. | 1,203,467 | | 76,021,760 |
Specialty Retail - 0.8% |
Home Depot, Inc. | 320,000 | | 19,641,600 |
RONA, Inc. | 150,000 | | 1,540,926 |
TJX Companies, Inc. | 100,000 | | 4,163,000 |
| | 25,345,526 |
Textiles, Apparel & Luxury Goods - 0.9% |
Gildan Activewear, Inc. | 770,195 | | 26,227,116 |
lululemon athletica, Inc. (a) | 77,600 | | 5,355,176 |
| | 31,582,292 |
TOTAL CONSUMER DISCRETIONARY | | 181,538,489 |
CONSUMER STAPLES - 3.0% |
Food & Staples Retailing - 3.0% |
Alimentation Couche-Tard, Inc. Class B (sub. vtg.) | 990,200 | | 48,640,012 |
Jean Coutu Group, Inc. Class A
(sub. vtg.) | 600,000 | | 9,017,272 |
Metro, Inc. Class A (sub. vtg.) | 579,165 | | 34,167,111 |
Whole Foods Market, Inc. | 100,000 | | 9,473,000 |
| | 101,297,395 |
ENERGY - 24.6% |
Oil, Gas & Consumable Fuels - 24.6% |
ARC Resources Ltd. | 300,000 | | 7,284,105 |
Athabasca Oil Corp. (a) | 650,000 | | 7,868,335 |
Baytex Energy Corp. | 350,000 | | 15,927,409 |
Birchcliff Energy Ltd. (a) | 2,700 | | 22,141 |
Canadian Natural Resources Ltd. | 2,450,000 | | 73,837,297 |
Canadian Oil Sands Ltd. | 700,000 | | 14,858,573 |
Celtic Exploration Ltd. (a) | 500,000 | | 13,056,320 |
Celtic Exploration Ltd. (a)(e) | 200,000 | | 5,222,528 |
Cenovus Energy, Inc. | 2,700,000 | | 95,240,050 |
Crescent Point Energy Corp. | 1,383,400 | | 57,482,954 |
Crew Energy, Inc. (a) | 1,500,000 | | 11,549,437 |
Enbridge, Inc. | 2,737,800 | | 108,936,342 |
Encana Corp. | 700,000 | | 15,769,712 |
Imperial Oil Ltd. | 450,000 | | 19,910,388 |
|
| Shares | | Value |
Keyera Corp. | 152,302 | | $ 7,392,842 |
MEG Energy Corp. (a) | 400,000 | | 14,610,263 |
Nexen, Inc. | 600,000 | | 14,327,910 |
Pacific Rubiales Energy Corp. | 700,000 | | 16,463,579 |
Painted Pony Petroleum Ltd. (a)(e) | 113,000 | | 1,221,927 |
Pembina Pipeline Corp. | 250,000 | | 6,991,239 |
Penn West Petroleum Ltd. | 700,000 | | 9,090,363 |
PetroBakken Energy Ltd. Class A (d) | 700,000 | | 8,838,048 |
Peyto Exploration & Development Corp. | 300,000 | | 7,329,161 |
Progress Energy Resources Corp. | 300,000 | | 6,043,554 |
Suncor Energy, Inc. | 4,157,600 | | 139,537,173 |
Surge Energy, Inc. (a) | 250,000 | | 1,689,612 |
Surge Energy, Inc. (a)(e) | 632,000 | | 4,271,339 |
Talisman Energy, Inc. | 2,700,000 | | 30,602,253 |
Tourmaline Oil Corp. (a) | 400,000 | | 13,216,521 |
Tourmaline Oil Corp. (a)(e) | 80,000 | | 2,643,304 |
TransCanada Corp. | 1,400,000 | | 63,036,796 |
Trilogy Energy Corp. | 100,000 | | 2,737,422 |
Vermilion Energy, Inc. | 400,000 | | 19,123,905 |
| | 816,132,802 |
FINANCIALS - 28.3% |
Capital Markets - 0.7% |
CI Financial Corp. | 1,000,000 | | 23,369,212 |
Commercial Banks - 20.4% |
Bank of Montreal | 1,500,000 | | 88,640,801 |
Bank of Nova Scotia | 2,500,000 | | 135,794,743 |
Canadian Imperial Bank of Commerce | 654,600 | | 51,489,738 |
National Bank of Canada | 300,000 | | 23,182,979 |
Royal Bank of Canada | 3,430,000 | | 195,548,632 |
The Toronto-Dominion Bank | 2,263,800 | | 184,118,622 |
| | 678,775,515 |
Consumer Finance - 0.2% |
Discover Financial Services | 150,000 | | 6,150,000 |
Insurance - 3.1% |
Fairfax Financial Holdings Ltd. (sub. vtg.) | 40,000 | | 14,838,949 |
Intact Financial Corp. | 660,925 | | 40,532,322 |
Manulife Financial Corp. | 2,000,000 | | 24,710,889 |
Sun Life Financial, Inc. | 900,000 | | 22,320,901 |
| | 102,403,061 |
Real Estate Investment Trusts - 2.0% |
Boardwalk (REIT) | 200,000 | | 12,870,088 |
H&R REIT/H&R Finance Trust | 600,000 | | 14,496,120 |
RioCan (REIT) | 1,400,000 | | 38,183,730 |
| | 65,549,938 |
Real Estate Management & Development - 1.9% |
Brookfield Asset Management, Inc.
Class A | 1,550,000 | | 53,355,695 |
Brookfield Properties Corp. | 700,000 | | 10,779,474 |
| | 64,135,169 |
TOTAL FINANCIALS | | 940,382,895 |
Common Stocks - continued |
| Shares | | Value |
HEALTH CARE - 6.2% |
Health Care Providers & Services - 3.1% |
Catamaran Corp. (a) | 2,206,468 | | $ 103,612,865 |
Pharmaceuticals - 3.1% |
Valeant Pharmaceuticals International, Inc. (Canada) (a) | 1,831,471 | | 102,323,987 |
TOTAL HEALTH CARE | | 205,936,852 |
INDUSTRIALS - 4.8% |
Machinery - 0.1% |
Westport Innovations, Inc. (a)(d) | 100,000 | | 2,806,001 |
Road & Rail - 4.5% |
Canadian National Railway Co. | 1,140,000 | | 98,436,646 |
Canadian Pacific | 550,000 | | 50,597,247 |
| | 149,033,893 |
Trading Companies & Distributors - 0.2% |
Finning International, Inc. | 300,000 | | 7,043,805 |
TOTAL INDUSTRIALS | | 158,883,699 |
INFORMATION TECHNOLOGY - 3.1% |
Communications Equipment - 0.2% |
Research In Motion Ltd. (a) | 700,000 | | 5,551,002 |
Computers & Peripherals - 0.3% |
Apple, Inc. | 17,000 | | 10,116,700 |
Internet Software & Services - 0.9% |
eBay, Inc. (a) | 400,000 | | 19,316,000 |
Open Text Corp. (a) | 170,407 | | 9,158,896 |
| | 28,474,896 |
IT Services - 1.7% |
CGI Group, Inc. Class A (sub. vtg.) (a) | 2,190,000 | | 57,296,320 |
Software - 0.0% |
Constellation Software, Inc. | 10,000 | | 1,147,034 |
TOTAL INFORMATION TECHNOLOGY | | 102,585,952 |
MATERIALS - 18.0% |
Chemicals - 1.8% |
Agrium, Inc. | 500,000 | | 52,655,820 |
Methanex Corp. | 200,000 | | 5,995,494 |
| | 58,651,314 |
Metals & Mining - 16.2% |
Agnico-Eagle Mines Ltd. (Canada) | 900,000 | | 50,814,518 |
Alamos Gold, Inc. | 250,000 | | 4,893,617 |
Barrick Gold Corp. | 2,230,000 | | 90,182,428 |
Copper Mountain Mining Corp. (a) | 390,000 | | 1,577,572 |
Detour Gold Corp. (a) | 100,000 | | 2,817,522 |
Eldorado Gold Corp. | 2,005,000 | | 29,630,839 |
|
| Shares | | Value |
First Majestic Silver Corp. (a) | 100,000 | | $ 2,311,890 |
First Quantum Minerals Ltd. | 1,630,000 | | 36,639,299 |
Franco-Nevada Corp. | 500,000 | | 28,790,989 |
Goldcorp, Inc. | 2,550,000 | | 115,276,596 |
IAMGOLD Corp. | 700,000 | | 10,863,579 |
Kinross Gold Corp. | 2,800,000 | | 27,810,763 |
New Gold, Inc. (a) | 1,200,000 | | 14,045,557 |
Silver Wheaton Corp. | 1,125,900 | | 45,374,193 |
Tahoe Resources, Inc. (a) | 350,000 | | 7,134,919 |
Teck Resources Ltd. Class B
(sub. vtg.) | 600,000 | | 19,043,805 |
Turquoise Hill Resources Ltd. (a) | 100,000 | | 781,977 |
Yamana Gold, Inc. | 2,500,000 | | 50,488,110 |
| | 538,478,173 |
TOTAL MATERIALS | | 597,129,487 |
TELECOMMUNICATION SERVICES - 5.6% |
Diversified Telecommunication Services - 4.5% |
BCE, Inc. | 1,900,000 | | 83,057,822 |
Manitoba Telecom Services, Inc. | 150,000 | | 5,035,795 |
TELUS Corp. | 950,000 | | 61,675,094 |
| | 149,768,711 |
Wireless Telecommunication Services - 1.1% |
Rogers Communications, Inc.
Class B (non-vtg.) | 800,000 | | 35,115,895 |
TOTAL TELECOMMUNICATION SERVICES | | 184,884,606 |
UTILITIES - 0.2% |
Electric Utilities - 0.2% |
Fortis, Inc. | 200,000 | | 6,762,453 |
TOTAL COMMON STOCKS (Cost $2,549,774,434) |
3,295,534,630
|
Money Market Funds - 0.6% |
| | | |
Fidelity Cash Central Fund, 0.19% (b) | 13,194,244 | | 13,194,244 |
Fidelity Securities Lending Cash Central Fund, 0.19% (b)(c) | 5,266,702 | | 5,266,702 |
TOTAL MONEY MARKET FUNDS (Cost $18,460,946) |
18,460,946
|
TOTAL INVESTMENT PORTFOLIO - 99.9% (Cost $2,568,235,380) | | 3,313,995,576 |
NET OTHER ASSETS (LIABILITIES) - 0.1% | | 3,373,680 |
NET ASSETS - 100% | $ 3,317,369,256 |
Legend |
(a) Non-income producing |
(b) Affiliated fund that is available only to investment companies and other accounts managed by Fidelity Investments. The rate quoted is the annualized seven-day yield of the fund at period end. A complete unaudited listing of the fund's holdings as of its most recent quarter end is available upon request. In addition, each Fidelity Central Fund's financial statements, which are not covered by the Fund's Report of Independent Registered Public Accounting Firm, are available on the SEC's website or upon request. |
(c) Investment made with cash collateral received from securities on loan. |
(d) Security or a portion of the security is on loan at period end. |
(e) Security exempt from registration under Rule 144A of the Securities Act of 1933. These securities may be resold in transactions exempt from registration, normally to qualified institutional buyers. At the end of the period, the value of these securities amounted to $13,359,098 or 0.4% of net assets. |
Affiliated Central Funds |
Information regarding fiscal year to date income earned by the Fund from investments in Fidelity Central Funds is as follows: |
Fund | Income earned |
Fidelity Cash Central Fund | $ 44,834 |
Fidelity Securities Lending Cash Central Fund | 3,887,175 |
Total | $ 3,932,009 |
Other Information |
All investments are categorized as Level 1 under the Fair Value Hierarchy. The inputs or methodology used for valuing securities may not be an indication of the risk associated with investing in those securities. For more information on valuation inputs, please refer to the Security Valuation section in the accompanying Notes to Financial Statements. |
See accompanying notes which are an integral part of the financial statements.
Annual Report
Fidelity Canada Fund
Statement of Assets and Liabilities
| October 31, 2012 |
| | |
Assets | | |
Investment in securities, at value (including securities loaned of $5,503,902) - See accompanying schedule: Unaffiliated issuers (cost $2,549,774,434) | $ 3,295,534,630 | |
Fidelity Central Funds (cost $18,460,946) | 18,460,946 | |
Total Investments (cost $2,568,235,380) | | $ 3,313,995,576 |
Cash | | 21,250 |
Foreign currency held at value (cost $2,060,308) | | 2,060,332 |
Receivable for investments sold | | 9,935,950 |
Receivable for fund shares sold | | 1,517,468 |
Dividends receivable | | 4,109,324 |
Distributions receivable from Fidelity Central Funds | | 59,330 |
Other receivables | | 14,400 |
Total assets | | 3,331,713,630 |
| | |
Liabilities | | |
Payable for fund shares redeemed | 6,635,280 | |
Accrued management fee | 1,512,106 | |
Distribution and service plan fees payable | 111,491 | |
Other affiliated payables | 742,785 | |
Other payables and accrued expenses | 76,010 | |
Collateral on securities loaned, at value | 5,266,702 | |
Total liabilities | | 14,344,374 |
| | |
Net Assets | | $ 3,317,369,256 |
Net Assets consist of: | | |
Paid in capital | | $ 2,827,898,108 |
Undistributed net investment income | | 34,776,724 |
Accumulated undistributed net realized gain (loss) on investments and foreign currency transactions | | (291,046,123) |
Net unrealized appreciation (depreciation) on investments and assets and liabilities in foreign currencies | | 745,740,547 |
Net Assets | | $ 3,317,369,256 |
Statement of Assets and Liabilities - continued
| October 31, 2012 |
| | |
Calculation of Maximum Offering Price Class A:
Net Asset Value and redemption price per share ($159,597,483 ÷ 2,975,053 shares) | | $ 53.65 |
| | |
Maximum offering price per share (100/94.25 of $53.65) | | $ 56.92 |
Class T:
Net Asset Value and redemption price per share ($29,625,811 ÷ 553,936 shares) | | $ 53.48 |
| | |
Maximum offering price per share (100/96.50 of $53.48) | | $ 55.42 |
Class B:
Net Asset Value and offering price per share ($9,803,560 ÷ 185,371 shares)A | | $ 52.89 |
| | |
Class C:
Net Asset Value and offering price per share ($66,500,018 ÷ 1,263,941 shares)A | | $ 52.61 |
| | |
Canada:
Net Asset Value, offering price and redemption price per share ($2,992,597,323 ÷ 55,370,497 shares) | | $ 54.05 |
| | |
Institutional Class:
Net Asset Value, offering price and redemption price per share ($59,245,061 ÷ 1,098,973 shares) | | $ 53.91 |
A Redemption price per share is equal to net asset value less any applicable contingent deferred sales charge.
See accompanying notes which are an integral part of the financial statements.
Annual Report
Fidelity Canada Fund
Financial Statements - continued
Statement of Operations
| Year ended October 31, 2012 |
Investment Income | | |
Dividends | | $ 89,193,450 |
Interest | | 976 |
Income from Fidelity Central Funds | | 3,932,009 |
Income before foreign taxes withheld | | 93,126,435 |
Less foreign taxes withheld | | (13,007,969) |
Total income | | 80,118,466 |
| | |
Expenses | | |
Management fee | | |
Basic fee | $ 26,006,550 | |
Performance adjustment | (7,737,368) | |
Transfer agent fees | 8,217,902 | |
Distribution and service plan fees | 1,473,188 | |
Accounting and security lending fees | 1,518,335 | |
Custodian fees and expenses | 53,185 | |
Independent trustees' compensation | 24,641 | |
Registration fees | 118,560 | |
Audit | 72,750 | |
Legal | 19,835 | |
Interest | 4,274 | |
Miscellaneous | 47,776 | |
Total expenses before reductions | 29,819,628 | |
Expense reductions | (54,667) | 29,764,961 |
Net investment income (loss) | | 50,353,505 |
Realized and Unrealized Gain (Loss) Net realized gain (loss) on: | | |
Investment securities: | | |
Unaffiliated issuers | (17,620,339) | |
Foreign currency transactions | (450,336) | |
Total net realized gain (loss) | | (18,070,675) |
Change in net unrealized appreciation (depreciation) on: Investment securities | 100,622,640 | |
Assets and liabilities in foreign currencies | (46,625) | |
Total change in net unrealized appreciation (depreciation) | | 100,576,015 |
Net gain (loss) | | 82,505,340 |
Net increase (decrease) in net assets resulting from operations | | $ 132,858,845 |
Statement of Changes in Net Assets
| Year ended
October 31,
2012 | Year ended
October 31,
2011 |
Increase (Decrease) in Net Assets | | |
Operations | | |
Net investment income (loss) | $ 50,353,505 | $ 41,545,130 |
Net realized gain (loss) | (18,070,675) | 43,297,359 |
Change in net unrealized appreciation (depreciation) | 100,576,015 | (192,122,126) |
Net increase (decrease) in net assets resulting from operations | 132,858,845 | (107,279,637) |
Distributions to shareholders from net investment income | (36,731,380) | (35,317,815) |
Distributions to shareholders from net realized gain | (22,566,448) | (35,060,747) |
Total distributions | (59,297,828) | (70,378,562) |
Share transactions - net increase (decrease) | (952,875,100) | 103,024,419 |
Redemption fees | 257,398 | 1,146,266 |
Total increase (decrease) in net assets | (879,056,685) | (73,487,514) |
| | |
Net Assets | | |
Beginning of period | 4,196,425,941 | 4,269,913,455 |
End of period (including undistributed net investment income of $34,776,724 and undistributed net investment income of $25,762,870, respectively) | $ 3,317,369,256 | $ 4,196,425,941 |
See accompanying notes which are an integral part of the financial statements.
Annual Report
Financial Highlights - Class A
Years ended October 31, | 2012 | 2011 | 2010 | 2009 | 2008 |
Selected Per-Share Data | | | | | |
Net asset value, beginning of period | $ 52.20 | $ 53.81 | $ 44.24 | $ 38.20 | $ 70.16 |
Income from Investment Operations | | | | | |
Net investment income (loss) C | .57 | .34 | .31 | .38 | .39 |
Net realized and unrealized gain (loss) | 1.50 | (1.17) | 9.64 | 5.72 | (28.71) |
Total from investment operations | 2.07 | (.83) | 9.95 | 6.10 | (28.32) |
Distributions from net investment income | (.33) | (.35) | (.39) | (.07) | (.41) |
Distributions from net realized gain | (.29) | (.44) | - | - | (3.27) |
Total distributions | (.62) | (.79) | (.39) | (.07) | (3.68) |
Redemption fees added to paid in capital C | - G | .01 | .01 | .01 | .04 |
Net asset value, end of period | $ 53.65 | $ 52.20 | $ 53.81 | $ 44.24 | $ 38.20 |
Total Return A,B | 4.04% | (1.64)% | 22.62% | 16.08% | (42.23)% |
Ratios to Average Net Assets D,F | | | | | |
Expenses before reductions | 1.08% | 1.12% | 1.24% | 1.42% | 1.34% |
Expenses net of fee waivers, if any | 1.08% | 1.12% | 1.24% | 1.42% | 1.34% |
Expenses net of all reductions | 1.08% | 1.12% | 1.18% | 1.39% | 1.31% |
Net investment income (loss) | 1.11% | .59% | .63% | .98% | .69% |
Supplemental Data | | | | | |
Net assets, end of period (000 omitted) | $ 159,597 | $ 215,369 | $ 170,446 | $ 83,015 | $ 56,242 |
Portfolio turnover rate E | 86% | 104% | 143% | 123% | 63% |
A Total returns would have been lower if certain expenses had not been reduced during the applicable periods shown. B Total returns do not include the effect of the sales charges. C Calculated based on average shares outstanding during the period. D Fees and expenses of any underlying Fidelity Central Funds are not included in the Fund's expense ratio. The Fund indirectly bears its proportionate share of the expenses of any underlying Fidelity Central Funds. E Amount does not include the portfolio activity of any underlying Fidelity Central Funds. F Expense ratios reflect operating expenses of the class. Expenses before reductions do not reflect amounts reimbursed by the investment adviser or reductions from brokerage service arrangements or reductions from other expense offset arrangements and do not represent the amount paid by the class during periods when reimbursements or reductions occur. Expenses net of fee waivers reflect expenses after reimbursement by the investment adviser but prior to reductions from brokerage service arrangements or other expense offset arrangements. Expenses net of all reductions represent the net expenses paid by the class. G Amount represents less than $.01 per share. |
Financial Highlights - Class T
Years ended October 31, | 2012 | 2011 | 2010 | 2009 | 2008 |
Selected Per-Share Data | | | | | |
Net asset value, beginning of period | $ 52.01 | $ 53.64 | $ 44.11 | $ 38.10 | $ 70.09 |
Income from Investment Operations | | | | | |
Net investment income (loss) C | .43 | .17 | .18 | .27 | .23 |
Net realized and unrealized gain (loss) | 1.49 | (1.16) | 9.60 | 5.73 | (28.66) |
Total from investment operations | 1.92 | (.99) | 9.78 | 6.00 | (28.43) |
Distributions from net investment income | (.16) | (.21) | (.26) | - | (.33) |
Distributions from net realized gain | (.29) | (.44) | - | - | (3.27) |
Total distributions | (.45) | (.65) | (.26) | - | (3.60) |
Redemption fees added to paid in capital C | - G | .01 | .01 | .01 | .04 |
Net asset value, end of period | $ 53.48 | $ 52.01 | $ 53.64 | $ 44.11 | $ 38.10 |
Total Return A,B | 3.74% | (1.93)% | 22.27% | 15.77% | (42.40)% |
Ratios to Average Net Assets D,F | | | | | |
Expenses before reductions | 1.36% | 1.42% | 1.51% | 1.70% | 1.63% |
Expenses net of fee waivers, if any | 1.36% | 1.42% | 1.51% | 1.70% | 1.63% |
Expenses net of all reductions | 1.36% | 1.42% | 1.46% | 1.67% | 1.60% |
Net investment income (loss) | .83% | .30% | .36% | .71% | .40% |
Supplemental Data | | | | | |
Net assets, end of period (000 omitted) | $ 29,626 | $ 34,323 | $ 31,522 | $ 17,727 | $ 14,963 |
Portfolio turnover rate E | 86% | 104% | 143% | 123% | 63% |
A Total returns would have been lower if certain expenses had not been reduced during the applicable periods shown. B Total returns do not include the effect of the sales charges. C Calculated based on average shares outstanding during the period. D Fees and expenses of any underlying Fidelity Central Funds are not included in the Fund's expense ratio. The Fund indirectly bears its proportionate share of the expenses of any underlying Fidelity Central Funds. E Amount does not include the portfolio activity of any underlying Fidelity Central Funds. F Expense ratios reflect operating expenses of the class. Expenses before reductions do not reflect amounts reimbursed by the investment adviser or reductions from brokerage service arrangements or reductions from other expense offset arrangements and do not represent the amount paid by the class during periods when reimbursements or reductions occur. Expenses net of fee waivers reflect expenses after reimbursement by the investment adviser but prior to reductions from brokerage service arrangements or other expense offset arrangements. Expenses net of all reductions represent the net expenses paid by the class. G Amount represents less than $.01 per share. |
See accompanying notes which are an integral part of the financial statements.
Annual Report
Financial Highlights - Class B
Years ended October 31, | 2012 | 2011 | 2010 | 2009 | 2008 |
Selected Per-Share Data | | | | | |
Net asset value, beginning of period | $ 51.37 | $ 53.03 | $ 43.68 | $ 37.91 | $ 69.88 |
Income from Investment Operations | | | | | |
Net investment income (loss) C | .17 | (.11) | (.07) | .08 | (.06) |
Net realized and unrealized gain (loss) | 1.49 | (1.14) | 9.50 | 5.68 | (28.54) |
Total from investment operations | 1.66 | (1.25) | 9.43 | 5.76 | (28.60) |
Distributions from net investment income | - | (.01) | (.09) | - | (.14) |
Distributions from net realized gain | (.14) | (.41) | - | - | (3.27) |
Total distributions | (.14) | (.42) | (.09) | - | (3.41) |
Redemption fees added to paid in capital C | - G | .01 | .01 | .01 | .04 |
Net asset value, end of period | $ 52.89 | $ 51.37 | $ 53.03 | $ 43.68 | $ 37.91 |
Total Return A,B | 3.25% | (2.41)% | 21.64% | 15.22% | (42.68)% |
Ratios to Average Net Assets D,F | | | | | |
Expenses before reductions | 1.85% | 1.91% | 2.01% | 2.19% | 2.13% |
Expenses net of fee waivers, if any | 1.85% | 1.91% | 2.01% | 2.19% | 2.13% |
Expenses net of all reductions | 1.85% | 1.91% | 1.96% | 2.16% | 2.10% |
Net investment income (loss) | .34% | (.20)% | (.14)% | .21% | (.10)% |
Supplemental Data | | | | | |
Net assets, end of period (000 omitted) | $ 9,804 | $ 11,866 | $ 13,464 | $ 7,283 | $ 5,615 |
Portfolio turnover rate E | 86% | 104% | 143% | 123% | 63% |
A Total returns would have been lower if certain expenses had not been reduced during the applicable periods shown. B Total returns do not include the effect of the contingent deferred sales charge. C Calculated based on average shares outstanding during the period. D Fees and expenses of any underlying Fidelity Central Funds are not included in the Fund's expense ratio. The Fund indirectly bears its proportionate share of the expenses of any underlying Fidelity Central Funds. E Amount does not include the portfolio activity of any underlying Fidelity Central Funds. F Expense ratios reflect operating expenses of the class. Expenses before reductions do not reflect amounts reimbursed by the investment adviser or reductions from brokerage service arrangements or reductions from other expense offset arrangements and do not represent the amount paid by the class during periods when reimbursements or reductions occur. Expenses net of fee waivers reflect expenses after reimbursement by the investment adviser but prior to reductions from brokerage service arrangements or other expense offset arrangements. Expenses net of all reductions represent the net expenses paid by the class. G Amount represents less than $.01 per share. |
Financial Highlights - Class C
Years ended October 31, | 2012 | 2011 | 2010 | 2009 | 2008 |
Selected Per-Share Data | | | | | |
Net asset value, beginning of period | $ 51.19 | $ 52.87 | $ 43.60 | $ 37.84 | $ 69.91 |
Income from Investment Operations | | | | | |
Net investment income (loss) C | .19 | (.08) | (.06) | .09 | (.05) |
Net realized and unrealized gain (loss) | 1.46 | (1.14) | 9.48 | 5.66 | (28.52) |
Total from investment operations | 1.65 | (1.22) | 9.42 | 5.75 | (28.57) |
Distributions from net investment income | - | (.03) | (.16) | - | (.27) |
Distributions from net realized gain | (.23) | (.44) | - | - | (3.27) |
Total distributions | (.23) | (.47) | (.16) | - | (3.54) |
Redemption fees added to paid in capital C | - G | .01 | .01 | .01 | .04 |
Net asset value, end of period | $ 52.61 | $ 51.19 | $ 52.87 | $ 43.60 | $ 37.84 |
Total Return A,B | 3.26% | (2.36)% | 21.68% | 15.22% | (42.69)% |
Ratios to Average Net Assets D,F | | | | | |
Expenses before reductions | 1.82% | 1.86% | 1.99% | 2.18% | 2.13% |
Expenses net of fee waivers, if any | 1.82% | 1.86% | 1.99% | 2.18% | 2.13% |
Expenses net of all reductions | 1.82% | 1.86% | 1.94% | 2.15% | 2.10% |
Net investment income (loss) | .37% | (.15)% | (.12)% | .22% | (.10)% |
Supplemental Data | | | | | |
Net assets, end of period (000 omitted) | $ 66,500 | $ 87,990 | $ 54,052 | $ 24,848 | $ 16,716 |
Portfolio turnover rate E | 86% | 104% | 143% | 123% | 63% |
A Total returns would have been lower if certain expenses had not been reduced during the applicable periods shown. B Total returns do not include the effect of the contingent deferred sales charge. C Calculated based on average shares outstanding during the period. D Fees and expenses of any underlying Fidelity Central Funds are not included in the Fund's expense ratio. The Fund indirectly bears its proportionate share of the expenses of any underlying Fidelity Central Funds. E Amount does not include the portfolio activity of any underlying Fidelity Central Funds. F Expense ratios reflect operating expenses of the class. Expenses before reductions do not reflect amounts reimbursed by the investment adviser or reductions from brokerage service arrangements or reductions from other expense offset arrangements and do not represent the amount paid by the class during periods when reimbursements or reductions occur. Expenses net of fee waivers reflect expenses after reimbursement by the investment adviser but prior to reductions from brokerage service arrangements or other expense offset arrangements. Expenses net of all reductions represent the net expenses paid by the class. G Amount represents less than $.01 per share. |
See accompanying notes which are an integral part of the financial statements.
Annual Report
Financial Highlights - Canada
Years ended October 31, | 2012 | 2011 | 2010 | 2009 | 2008 |
Selected Per-Share Data | | | | | |
Net asset value, beginning of period | $ 52.59 | $ 54.14 | $ 44.46 | $ 38.37 | $ 70.25 |
Income from Investment Operations | | | | | |
Net investment income (loss) B | .73 | .52 | .46 | .48 | .58 |
Net realized and unrealized gain (loss) | 1.51 | (1.18) | 9.68 | 5.74 | (28.83) |
Total from investment operations | 2.24 | (.66) | 10.14 | 6.22 | (28.25) |
Distributions from net investment income | (.49) | (.46) | (.47) | (.14) | (.40) |
Distributions from net realized gain | (.29) | (.44) | - | - | (3.27) |
Total distributions | (.78) | (.90) | (.47) | (.14) | (3.67) |
Redemption fees added to paid in capital B | - F | .01 | .01 | .01 | .04 |
Net asset value, end of period | $ 54.05 | $ 52.59 | $ 54.14 | $ 44.46 | $ 38.37 |
Total Return A | 4.36% | (1.33)% | 22.97% | 16.40% | (42.06)% |
Ratios to Average Net Assets C,E | | | | | |
Expenses before reductions | .77% | .82% | .94% | 1.17% | 1.03% |
Expenses net of fee waivers, if any | .77% | .82% | .94% | 1.17% | 1.03% |
Expenses net of all reductions | .77% | .82% | .89% | 1.13% | 1.00% |
Net investment income (loss) | 1.42% | .90% | .93% | 1.24% | 1.00% |
Supplemental Data | | | | | |
Net assets, end of period (000 omitted) | $ 2,992,597 | $ 3,778,765 | $ 3,953,693 | $ 3,149,791 | $ 2,776,298 |
Portfolio turnover rate D | 86% | 104% | 143% | 123% | 63% |
A Total returns would have been lower if certain expenses had not been reduced during the applicable periods shown. B Calculated based on average shares outstanding during the period. C Fees and expenses of any underlying Fidelity Central Funds are not included in the Fund's expense ratio. The Fund indirectly bears its proportionate share of the expenses of any underlying Fidelity Central Funds. D Amount does not include the portfolio activity of any underlying Fidelity Central Funds. E Expense ratios reflect operating expenses of the class. Expenses before reductions do not reflect amounts reimbursed by the investment adviser or reductions from brokerage service arrangements or reductions from other expense offset arrangements and do not represent the amount paid by the class during periods when reimbursements or reductions occur. Expenses net of fee waivers reflect expenses after reimbursement by the investment adviser but prior to reductions from brokerage service arrangements or other expense offset arrangements. Expenses net of all reductions represent the net expenses paid by the class. F Amount represents less than $.01 per share. |
Financial Highlights - Institutional Class
Years ended October 31, | 2012 | 2011 | 2010 | 2009 | 2008 |
Selected Per-Share Data | | | | | |
Net asset value, beginning of period | $ 52.44 | $ 54.02 | $ 44.39 | $ 38.31 | $ 70.25 |
Income from Investment Operations | | | | | |
Net investment income (loss) B | .74 | .51 | .46 | .49 | .52 |
Net realized and unrealized gain (loss) | 1.50 | (1.18) | 9.65 | 5.72 | (28.78) |
Total from investment operations | 2.24 | (.67) | 10.11 | 6.21 | (28.26) |
Distributions from net investment income | (.48) | (.48) | (.49) | (.14) | (.45) |
Distributions from net realized gain | (.29) | (.44) | - | - | (3.27) |
Total distributions | (.77) | (.92) | (.49) | (.14) | (3.72) |
Redemption fees added to paid in capital B | - F | .01 | .01 | .01 | .04 |
Net asset value, end of period | $ 53.91 | $ 52.44 | $ 54.02 | $ 44.39 | $ 38.31 |
Total Return A | 4.38% | (1.35)% | 22.94% | 16.40% | (42.11)% |
Ratios to Average Net Assets C,E | | | | | |
Expenses before reductions | .76% | .82% | .95% | 1.17% | 1.11% |
Expenses net of fee waivers, if any | .76% | .82% | .95% | 1.17% | 1.11% |
Expenses net of all reductions | .76% | .82% | .90% | 1.14% | 1.08% |
Net investment income (loss) | 1.42% | .89% | .92% | 1.23% | .92% |
Supplemental Data | | | | | |
Net assets, end of period (000 omitted) | $ 59,245 | $ 68,112 | $ 46,737 | $ 17,956 | $ 8,870 |
Portfolio turnover rate D | 86% | 104% | 143% | 123% | 63% |
A Total returns would have been lower if certain expenses had not been reduced during the applicable periods shown. B Calculated based on average shares outstanding during the period. C Fees and expenses of any underlying Fidelity Central Funds are not included in the Fund's expense ratio. The Fund indirectly bears its proportionate share of the expenses of any underlying Fidelity Central Funds. D Amount does not include the portfolio activity of any underlying Fidelity Central Funds. E Expense ratios reflect operating expenses of the class. Expenses before reductions do not reflect amounts reimbursed by the investment adviser or reductions from brokerage service arrangements or reductions from other expense offset arrangements and do not represent the amount paid by the class during periods when reimbursements or reductions occur. Expenses net of fee waivers reflect expenses after reimbursement by the investment adviser but prior to reductions from brokerage service arrangements or other expense offset arrangements. Expenses net of all reductions represent the net expenses paid by the class. F Amount represents less than $.01 per share. |
See accompanying notes which are an integral part of the financial statements.
Annual Report
Notes to Financial Statements
For the period ended October 31, 2012
1. Organization.
Fidelity Canada Fund (the Fund) is a fund of Fidelity Investment Trust (the Trust) and is authorized to issue an unlimited number of shares. The Trust is registered under the Investment Company Act of 1940, as amended (the 1940 Act), as an open-end management investment company organized as a Massachusetts business trust. The Fund offers Class A, Class T, Class C, Canada, and Institutional Class shares, each of which, along with Class B shares, has equal rights as to assets and voting privileges. Effective after the close of business on September 1, 2010, Class B shares were closed to new accounts and additional purchases, except for exchanges and reinvestments. Each class has exclusive voting rights with respect to matters that affect that class. Class B shares will automatically convert to Class A shares after a holding period of seven years from the initial date of purchase. Investment income, realized and unrealized capital gains and losses, the common expenses of the Fund, and certain fund-level expense reductions, if any, are allocated on a pro-rata basis to each class based on the relative net assets of each class to the total net assets of the Fund. Each class differs with respect to transfer agent and distribution and service plan fees incurred. Certain expense reductions may also differ by class.
2. Investments in Fidelity Central Funds.
The Fund invests in Fidelity Central Funds, which are open-end investment companies available only to other investment companies and accounts managed by Fidelity Management & Research Company (FMR) and its affiliates. The Fund's Schedule of Investments lists each of the Fidelity Central Funds held as of period end, if any, as an investment of the Fund, but does not include the underlying holdings of each Fidelity Central Fund. As an Investing Fund, the Fund indirectly bears its proportionate share of the expenses of the underlying Fidelity Central Funds.
The Money Market Central Funds seek preservation of capital and current income and are managed by Fidelity Investments Money Management, Inc. (FIMM), an affiliate of FMR.
A complete unaudited list of holdings for each Fidelity Central Fund is available upon request or at the Securities and Exchange Commission (the SEC) web site at www.sec.gov. In addition, the financial statements of the Fidelity Central Funds, which are not covered by the Fund's Report of Independent Registered Public Accounting Firm, are available on the SEC web site or upon request.
3. Significant Accounting Policies.
The financial statements have been prepared in conformity with accounting principles generally accepted in the United States of America (GAAP), which require management to make certain estimates and assumptions at the date of the financial statements. Actual results could differ from those estimates. Subsequent events, if any, through the date that the financial statements were issued have been evaluated in the preparation of the financial statements. The following summarizes the significant accounting policies of the Fund:
Security Valuation. Investments are valued as of 4:00 p.m. Eastern time on the last calendar day of the period. In accordance with valuation policies and procedures approved by the Board of Trustees (the Board), the Fund attempts to obtain prices from one or more third party pricing vendors or brokers to value its investments. When current market prices, quotations or rates are not readily available or reliable, securities will be fair valued in good faith by the FMR Fair Value Committee (the Committee), in accordance with procedures adopted by the Fund's Board. Factors used in determining fair value vary by security type and may include market or security specific events. The frequency with which these procedures are used cannot be predicted and they may be utilized to a significant extent. The Committee oversees the Fund's valuation policies and procedures and is responsible for approving and reporting to the Board all fair value determinations.
The Fund categorizes the inputs to valuation techniques used to value its investments into a disclosure hierarchy consisting of three levels as shown below:
Level 1 - quoted prices in active markets for identical investments
Level 2 - other significant observable inputs (including quoted prices for similar investments, interest rates, prepayment speeds, etc.)
Level 3 - unobservable inputs (including the Fund's own assumptions based on the best information available)
Valuation techniques used to value the Fund's investments by major category are as follows:
Equity securities, including restricted securities, for which market quotations are readily available, are valued at the last reported sale price or official closing price as reported by a third party pricing vendor on the primary market or exchange on which they are traded and are categorized as Level 1 in the hierarchy. In the event there were no sales during the day or closing prices are not available, securities are valued at the last quoted bid price or may be valued using the last available price and are generally categorized as Level 2 in the hierarchy. For foreign equity securities, when significant market or security specific events arise, comparisons to the valuation of American Depositary Receipts (ADRs), futures contracts, Exchange-Traded Funds (ETFs) and certain indexes as well as quoted prices for similar securities are used and are categorized as Level 2 in the hierarchy. Utilizing these techniques may result in transfers between Level 1 and Level 2.
Annual Report
3. Significant Accounting Policies - continued
Security Valuation - continued
Investments in open-end mutual funds, including the Fidelity Central Funds, are valued at their closing net asset value (NAV) each business day and are categorized as Level 1 in the hierarchy.
Changes in valuation techniques may result in transfers in or out of an assigned level within the disclosure hierarchy.
Foreign Currency Translation. The Fund may use foreign currency contracts to facilitate transactions in foreign-denominated securities. Gains and losses from these transactions may arise from changes in the value of the foreign currency or if the counterparties do not perform under the contracts' terms.
Foreign-denominated assets, including investment securities, and liabilities are translated into U.S. dollars at the exchange rates at period end. Purchases and sales of investment securities, income and dividends received and expenses denominated in foreign currencies are translated into U.S. dollars at the exchange rate in effect on the transaction date.
The effects of exchange rate fluctuations on investments are included with the net realized and unrealized gain (loss) on investment securities. Other foreign currency transactions resulting in realized and unrealized gain (loss) are disclosed separately.
Investment Transactions and Income. For financial reporting purposes, the Fund's investment holdings and NAV include trades executed through the end of the last business day of the period. The NAV per share for processing shareholder transactions is calculated as of the close of business of the New York Stock Exchange (NYSE), normally 4:00 p.m. Eastern time and includes trades executed through the end of the prior business day. Gains and losses on securities sold are determined on the basis of identified cost and may include proceeds received from litigation. Dividend income is recorded on the ex-dividend date, except for certain dividends from foreign securities where the ex-dividend date may have passed, which are recorded as soon as the Fund is informed of the ex-dividend date. Non-cash dividends included in dividend income, if any, are recorded at the fair market value of the securities received. Distributions received on securities that represent a return of capital or capital gain are recorded as a reduction of cost of investments and/or as a realized gain. The Fund estimates the components of distributions received that may be considered return of capital distributions or capital gain distributions. Interest income and distributions from the Fidelity Central Funds are accrued as earned. Interest income includes coupon interest and amortization of premium and accretion of discount on debt securities. Investment income is recorded net of foreign taxes withheld where recovery of such taxes is uncertain.
Expenses. Expenses directly attributable to a fund are charged to that fund. Expenses attributable to more than one fund are allocated among the respective funds on the basis of relative net assets or other appropriate methods. Expense estimates are accrued in the period to which they relate and adjustments are made when actual amounts are known.
Income Tax Information and Distributions to Shareholders. Each year, the Fund intends to qualify as a regulated investment company under Subchapter M of the Internal Revenue Code, including distributing substantially all of its taxable income and realized gains. As a result, no provision for income taxes is required. As of October 31, 2012, the Fund did not have any unrecognized tax benefits in the financial statements; nor is the Fund aware of any tax positions for which it is reasonably possible that the total amounts of unrecognized tax benefits will significantly change in the next twelve months. The Fund files a U.S. federal tax return, in addition to state and local tax returns as required. A fund's federal income tax returns are subject to examination by the Internal Revenue Service (IRS) for a period of three fiscal years after they are filed. State and local tax returns may be subject to examination for an additional fiscal year depending on the jurisdiction. Foreign taxes are provided for based on the Fund's understanding of the tax rules and rates that exist in the foreign markets in which it invests.
Distributions are declared and recorded on the ex-dividend date. Income dividends and capital gain distributions are declared separately for each class. Income and capital gain distributions are determined in accordance with income tax regulations, which may differ from GAAP. In addition, the fund claimed a portion of the payment made to redeeming shareholders as a distribution for income tax purposes.
Capital accounts within the financial statements are adjusted for permanent book-tax differences. These adjustments have no impact on net assets or the results of operations. Temporary book-tax differences will reverse in a subsequent period.
Book-tax differences are primarily due to foreign currency transactions, passive foreign investment companies (PFIC), deferred trustees compensation, capital loss carryforwards and losses deferred due to wash sales.
The federal tax cost of investment securities and unrealized appreciation (depreciation) as of period end were as follows:
Gross unrealized appreciation | $ 769,644,661 |
Gross unrealized depreciation | (51,536,631) |
Net unrealized appreciation (depreciation) on securities and other investments | $ 718,108,030 |
| |
Tax Cost | $ 2,595,887,546 |
Annual Report
Notes to Financial Statements - continued
3. Significant Accounting Policies - continued
Income Tax Information and Distributions to Shareholders - continued
The tax-based components of distributable earnings as of period end were as follows:
Undistributed ordinary income | $ 34,776,967 |
Capital loss carryforward | $ (263,393,959) |
Net unrealized appreciation (depreciation) | $ 718,088,381 |
Capital loss carryforwards are only available to offset future capital gains of the Fund to the extent provided by regulations and may be limited. Under the Regulated Investment Company Modernization Act of 2010 (the Act), the Fund is permitted to carry forward capital losses incurred in taxable years beginning after December 22, 2010 for an unlimited period and such capital losses are required to be used prior to any losses that expire. Capital loss carryforwards were as follows:
Fiscal year of expiration | |
2016 | $ (79,471,942) |
2017 | (150,917,782) |
Total with expiration | (230,389,724) |
No expiration | |
Short-term | (33,004,235) |
Total capital loss carryforward | $ (263,393,959) |
The tax character of distributions paid was as follows:
| October 31, 2012 | October 31, 2011 |
Ordinary Income | $ 59,297,828 | $ 70,378,562 |
Short-Term Trading (Redemption) Fees. Shares held by investors in the Fund less than 90 days are subject to a redemption fee equal to 1.50% of the net asset value of shares redeemed. All redemption fees, which reduce the proceeds of the shareholder redemption, are retained by the Fund and accounted for as an addition to paid in capital.
Restricted Securities. The Fund may invest in securities that are subject to legal or contractual restrictions on resale. These securities generally may be resold in transactions exempt from registration or to the public if the securities are registered. Disposal of these securities may involve time-consuming negotiations and expense, and prompt sale at an acceptable price may be difficult. Information regarding restricted securities is included at the end of the Fund's Schedule of Investments.
New Accounting Pronouncement. In December 2011, the Financial Accounting Standards Board issued Accounting Standard Update No. 2011-11, Disclosures about Offsetting Assets and Liabilities. The update creates new disclosure requirements requiring entities to disclose both gross and net information for derivatives and other financial instruments that are either offset in the Statement of Assets and Liabilities or subject to an enforceable master netting arrangement or similar agreement. The disclosure requirements are effective for annual reporting periods beginning on or after January 1, 2013, and interim periods within those annual periods. Management is currently evaluating the impact of the update's adoption on the Fund's financial statement disclosures.
4. Purchases and Sales of Investments.
Purchases and sales of securities, other than short-term securities, aggregated $3,166,105,255 and $4,137,995,727, respectively.
5. Fees and Other Transactions with Affiliates.
Management Fee. FMR and its affiliates provide the Fund with investment management related services for which the Fund pays a monthly management fee. The management fee is the sum of an individual fund fee rate that is based on an annual rate of .45% of the Fund's average net assets and an annualized group fee rate that averaged .26% during the period. The group fee rate is based upon the average net assets of all the mutual funds advised by FMR. The group fee rate decreases as assets under management increase and increases as assets under management decrease. In addition, the management fee is subject to a performance adjustment (up to a maximum of ±.20% of the Fund's average net assets over a 36 month performance period). The upward or downward adjustment to the management fee is based on the relative investment performance of Canada as compared to an appropriate benchmark index. For the period, the total annual management fee rate, including the performance adjustment, was .50% of the Fund's average net assets.
Annual Report
5. Fees and Other Transactions with Affiliates - continued
Distribution and Service Plan Fees. In accordance with Rule 12b-1 of the 1940 Act, the Fund has adopted separate Distribution and Service Plans for each class of shares. Certain classes pay Fidelity Distributors Corporation (FDC), an affiliate of FMR, separate Distribution and Service Fees, each of which is based on an annual percentage of each class' average net assets. In addition, FDC may pay financial intermediaries for selling shares of the Fund and providing shareholder support services. For the period, the Distribution and Service Fee rates, total fees and amounts retained by FDC were as follows:
| Distribution
Fee | Service
Fee | Total Fees | Retained
by FDC |
Class A | -% | .25% | $ 453,416 | $ 24,371 |
Class T | .25% | .25% | 156,708 | 1,287 |
Class B | .75% | .25% | 106,696 | 80,189 |
Class C | .75% | .25% | 756,368 | 189,437 |
| | | $ 1,473,188 | $ 295,284 |
Sales Load. FDC may receive a front-end sales charge of up to 5.75% for selling Class A shares and 3.50% for selling Class T shares, some of which is paid to financial intermediaries for selling shares of the Fund. Depending on the holding period, FDC may receive contingent deferred sales charges levied on Class A, Class T, Class B and Class C redemptions. The deferred sales charges range from 5.00% to 1.00% for Class B shares, 1.00% for Class C shares, 1.00% for certain purchases of Class A shares and .25% for certain purchases of Class T shares.
For the period, sales charge amounts retained by FDC were as follows:
| Retained
by FDC |
Class A | $ 62,502 |
Class T | 9,357 |
Class B* | 21,585 |
Class C* | 22,491 |
| $ 115,935 |
* When Class B and Class C shares are initially sold, FDC pays commissions from its own resources to financial intermediaries through which the sales are made.
Transfer Agent Fees. Fidelity Investments Institutional Operations Company, Inc. (FIIOC), an affiliate of FMR, is the transfer, dividend disbursing and shareholder servicing agent for each class of the Fund. FIIOC receives account fees and asset-based fees that vary according to the account size and type of account of the shareholders of the respective classes of the Fund. FIIOC pays for typesetting, printing and mailing of shareholder reports, except proxy statements. For the period, transfer agent fees for each class were as follows:
| Amount | % of
Average
Net Assets |
Class A | $ 508,239 | .28 |
Class T | 96,227 | .31 |
Class B | 31,928 | .30 |
Class C | 201,488 | .27 |
Canada | 7,248,062 | .22 |
Institutional Class | 131,958 | .21 |
| $ 8,217,902 | |
Accounting and Security Lending Fees. Fidelity Service Company, Inc. (FSC), an affiliate of FMR, maintains the Fund's accounting records. The accounting fee is based on the level of average net assets for each month. Under a separate contract, FSC administers the security lending program. The security lending fee is based on the number and duration of lending transactions.
Brokerage Commissions. The Fund placed a portion of its portfolio transactions with brokerage firms which are affiliates of the investment adviser. The commissions paid to these affiliated firms were $18,194 for the period.
Annual Report
Notes to Financial Statements - continued
5. Fees and Other Transactions with Affiliates - continued
Interfund Lending Program. Pursuant to an Exemptive Order issued by the SEC, the Fund, along with other registered investment companies having management contracts with FMR, may participate in an interfund lending program. This program provides an alternative credit facility allowing the funds to borrow from, or lend money to, other participating affiliated funds. At period end, there were no interfund loans outstanding. The Fund's activity in this program during the period for which loans were outstanding was as follows:
Borrower or Lender | Average Loan
Balance | Weighted Average Interest Rate | Interest
Expense |
Borrower | $ 8,610,311 | .37% | $ 4,026 |
6. Committed Line of Credit.
The Fund participates with other funds managed by FMR or an affiliate in a $4.25 billion credit facility (the "line of credit") to be utilized for temporary or emergency purposes to fund shareholder redemptions or for other short-term liquidity purposes. The Fund has agreed to pay commitment fees on its pro-rata portion of the line of credit, which amounted to $10,364 and is reflected in Miscellaneous expenses on the Statement of Operations. During the period, there were no borrowings on this line of credit.
7. Security Lending.
The Fund lends portfolio securities through a lending agent from time to time in order to earn additional income. For equity securities, a lending agent is used and may loan securities to certain qualified borrowers, including Fidelity Capital Markets (FCM), a broker-dealer affiliated with the Fund. On the settlement date of the loan, the Fund receives collateral (in the form of U.S. Treasury obligations, letters of credit and/or cash) against the loaned securities and maintains collateral in an amount not less than 100% of the market value of the loaned securities during the period of the loan. The market value of the loaned securities is determined at the close of business of the Fund and any additional required collateral is delivered to the Fund on the next business day. If the borrower defaults on its obligation to return the securities loaned because of insolvency or other reasons, a fund could experience delays and costs in recovering the securities loaned or in gaining access to the collateral. Any cash collateral received is invested in the Fidelity Securities Lending Cash Central Fund. The value of loaned securities and cash collateral at period end are disclosed on the Fund's Statement of Assets and Liabilities. Security lending income represents the income earned on investing cash collateral, less rebates paid to borrowers and any lending agent fees associated with the loan, plus any premium payments received for lending certain types of securities. Security lending income is presented in the Statement of Operations as a component of income from Fidelity Central Funds. Total security lending income during the period amounted to $3,887,175. During the period, there were no securities loaned to FCM.
8. Bank Borrowings.
The Fund is permitted to have bank borrowings for temporary or emergency purposes to fund shareholder redemptions or for other short-term liquidity requirements. The Fund has established borrowing arrangements with certain banks. The interest rate on the borrowings is the bank's base rate, as revised from time to time. The average loan balance during the period for which loans were outstanding amounted to $7,821,000. The weighted average interest rate was .57%. The interest expense amounted to $248 under the bank borrowing program. At period end, there were no bank loans outstanding.
9. Expense Reductions.
Many of the brokers with whom FMR places trades on behalf of the Fund provided services to the Fund in addition to trade execution. These services included payments of certain expenses on behalf of the Fund totaling $54,667 for the period.
10. Distributions to Shareholders.
Distributions to shareholders of each class were as follows:
Years ended October 31, | 2012 | 2011 |
From net investment income | | |
Class A | $ 1,331,457 | $ 1,141,830 |
Class T | 100,888 | 123,341 |
Class B | - | 2,503 |
Class C | - | 36,231 |
Canada | 34,710,753 | 33,570,065 |
Institutional Class | 588,282 | 443,845 |
Total | $ 36,731,380 | $ 35,317,815 |
Annual Report
10. Distributions to Shareholders - continued
Years ended October 31, | 2012 | 2011 |
From net realized gain | | |
Class A | $ 1,169,578 | $ 1,445,324 |
Class T | 185,711 | 261,152 |
Class B | 32,050 | 101,491 |
Class C | 395,818 | 470,108 |
Canada | 20,430,566 | 32,375,322 |
Institutional Class | 352,725 | 407,350 |
Total | $ 22,566,448 | $ 35,060,747 |
11. Share Transactions.
Transactions for each class of shares were as follows:
| Shares | Dollars |
Years ended October 31, | 2012 | 2011 | 2012 | 2011 |
Class A | | | | |
Shares sold | 554,403 | 2,386,291 | $ 28,690,109 | $ 138,991,055 |
Reinvestment of distributions | 41,955 | 39,424 | 2,109,494 | 2,233,433 |
Shares redeemed | (1,747,243) | (1,467,607) | (89,985,257) | (82,665,471) |
Net increase (decrease) | (1,150,885) | 958,108 | $ (59,185,654) | $ 58,559,017 |
Class T | | | | |
Shares sold | 72,156 | 254,873 | $ 3,681,114 | $ 14,715,904 |
Reinvestment of distributions | 5,569 | 6,640 | 279,919 | 375,773 |
Shares redeemed | (183,751) | (189,243) | (9,407,140) | (10,669,184) |
Net increase (decrease) | (106,026) | 72,270 | $ (5,446,107) | $ 4,422,493 |
Class B | | | | |
Shares sold | 3,584 | 29,930 | $ 181,692 | $ 1,729,701 |
Reinvestment of distributions | 519 | 1,508 | 25,894 | 84,713 |
Shares redeemed | (49,710) | (54,348) | (2,528,127) | (3,060,843) |
Net increase (decrease) | (45,607) | (22,910) | $ (2,320,541) | $ (1,246,429) |
Class C | | | | |
Shares sold | 161,752 | 1,081,104 | $ 8,188,420 | $ 62,770,855 |
Reinvestment of distributions | 6,045 | 7,014 | 300,150 | 392,322 |
Shares redeemed | (622,861) | (391,485) | (31,505,606) | (21,249,300) |
Net increase (decrease) | (455,064) | 696,633 | $ (23,017,036) | $ 41,913,877 |
Canada | | | | |
Shares sold | 4,866,802 | 20,804,881 | $ 252,453,035 | $ 1,223,871,558 |
Reinvestment of distributions | 1,003,141 | 1,069,329 | 50,678,709 | 60,856,944 |
Shares redeemed | (22,354,268) | (23,043,159) | (1,155,960,861) | (1,313,818,426) |
Net increase (decrease) | (16,484,325) | (1,168,949) | $ (852,829,117) | $ (29,089,924) |
Institutional Class | | | | |
Shares sold | 561,510 | 1,331,261 | $ 29,055,185 | $ 79,262,853 |
Reinvestment of distributions | 13,162 | 10,934 | 663,252 | 620,606 |
Shares redeemed | (774,433) | (908,649) | (39,795,082) | (51,418,074) |
Net increase (decrease) | (199,761) | 433,546 | $ (10,076,645) | $ 28,465,385 |
12. Other.
The Fund's organizational documents provide former and current trustees and officers with a limited indemnification against liabilities arising in connection with the performance of their duties to the Fund. In the normal course of business, the Fund may also enter into contracts that provide general indemnifications. The Fund's maximum exposure under these arrangements is unknown as this would be dependent on future claims that may be made against the Fund. The risk of material loss from such claims is considered remote.
Annual Report
Fidelity China Region Fund
Average annual total return reflects the change in the value of an investment, assuming reinvestment of the class' distributions from dividend income and capital gains (the profits earned upon the sale of securities that have grown in value, if any) and assuming a constant rate of performance each year. The $10,000 table and the fund's returns do not reflect the deduction of taxes that a shareholder would pay on fund distributions or the redemption of fund shares. During periods of reimbursement by Fidelity, a fund's total return will be greater than it would be had the reimbursement not occurred. How a fund did yesterday is no guarantee of how it will do tomorrow.
Average Annual Total Returns
Periods ended October 31, 2012 | Past 1
year | Past 5
years | Past 10
years |
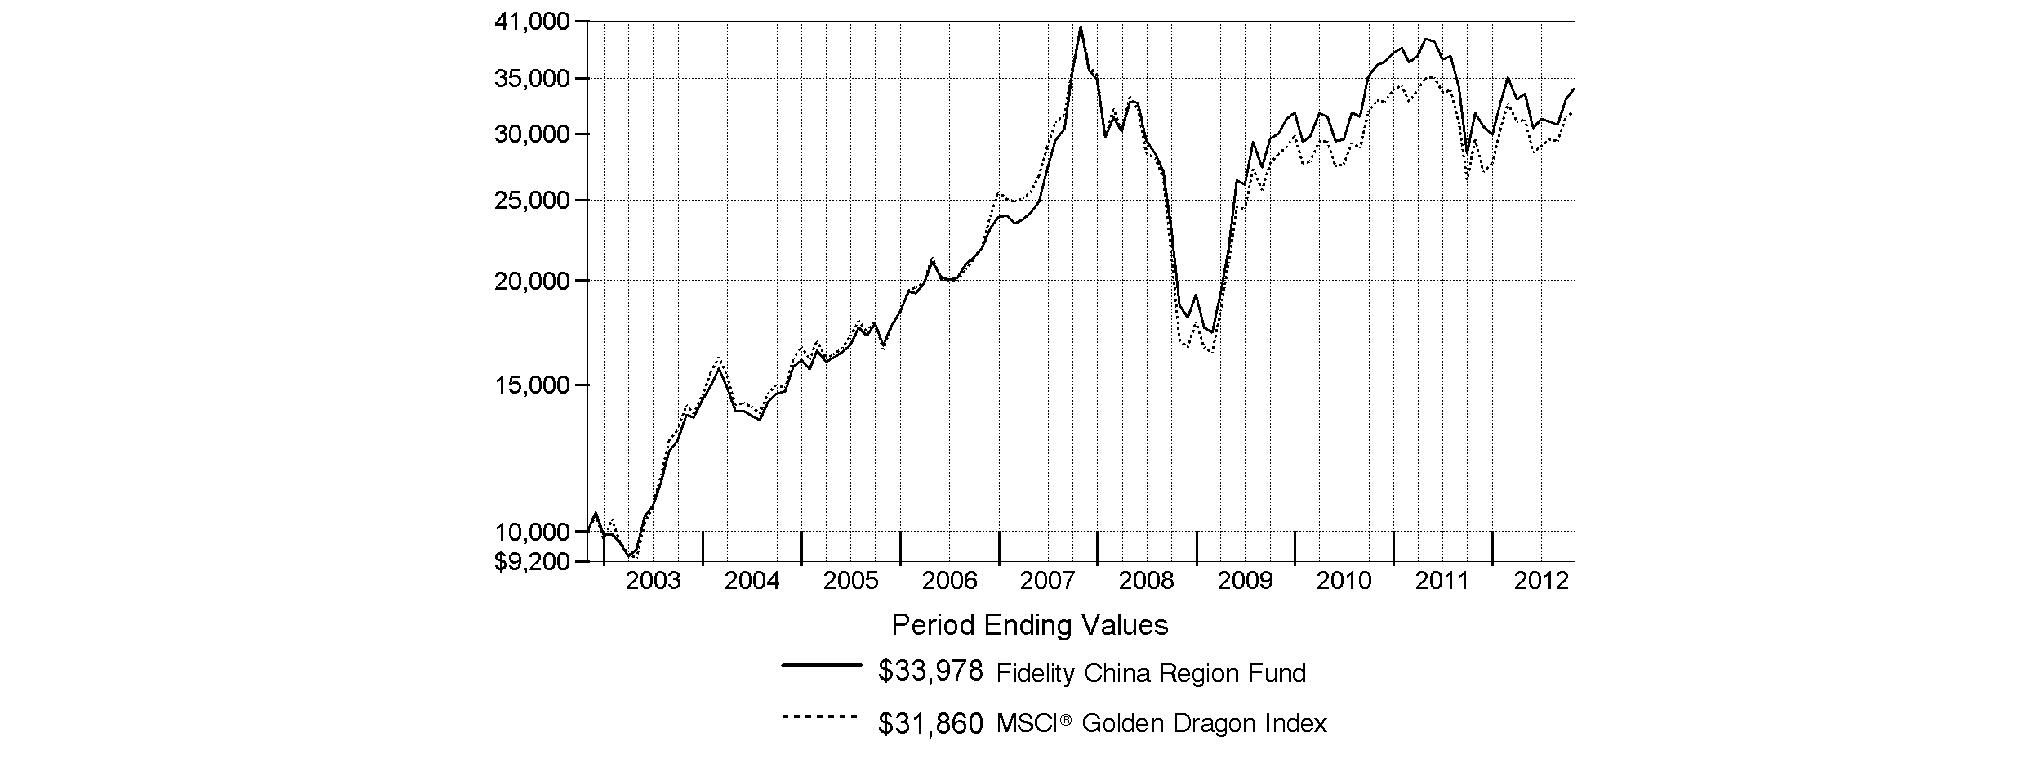
Fidelity China Region Fund | 7.01% | -3.38% | 13.01% |
$10,000 Over 10 Years
Let's say hypothetically that $10,000 was invested in Fidelity China Region Fund, a class of the fund, on October 31, 2002. The chart shows how the value of your investment would have changed, and also shows how the MSCI® Golden Dragon Index performed over the same period.
Annual Report
Fidelity China Region Fund
Market Recap: Returns for most domestic and international equities fluctuated during the 12 months ending October 31, 2012, as investor sentiment towards risk vacillated amid a changing global economic landscape. U.S. stocks overcame bouts of volatility to post strong gains for the past year, extending an uptrend that began in March 2009. The broad-based S&P 500® Index advanced 15.21%, while the blue-chip-laden Dow Jones Industrial AverageSM and technology-heavy Nasdaq Composite® Index rose 12.56% and 12.21%, respectively. Performance outside of the U.S. was relatively weak, as the MSCI® ACWI® (All Country World Index) ex USA Index rose 4.11%, hampered in part by a stronger U.S. dollar. International developed-markets generally struggled during the period as macroeconomic concerns ebbed and flowed, finishing with only a modest gain. The MSCI® EAFE® Index rose 4.76% for the year, largely buttressed in the summertime by pledges of accommodative monetary action from eurozone officials, as well as signs that the U.S. housing market was on the mend. Within the index, Asia-Pacific ex Japan showed the most impressive gain, advancing roughly 10%. A number of core European components, including Germany (+11%) and Switzerland (+10%), and the U.K. (+9%), benefited from optimism about the eurozone's ability to resolve its debt woes, which helped the region outpace the index overall. Elsewhere, Japan was among the few benchmark constituents to finish in the red, returning about -3%. Emerging-markets stocks gained 2.98% for the year, as measured by the MSCI Emerging Markets Index. A general uptrend in the final five months of the period lifted the index into positive territory for the full 12 months.
Comments from Robert Bao, Portfolio Manager of Fidelity® China Region Fund: For the year, the fund's Retail Class shares returned 7.01%, trailing the 8.02% gain of the MSCI® Golden Dragon Index. Versus the index, the biggest negative impact came from an overweighting and stock selection in China. Among sectors and industries, my picks in the retailing segment of consumer discretionary and the semiconductors/semiconductor equipment portion of information technology weighed on performance. Noteworthy individual detractors included Taiwan-based DRAM computer memory maker Inotera Memories. I thought the company might benefit from better industry supply discipline and firmer pricing following the bankruptcy of one of Inotera's major competitors, but a weak global economic environment prevented that from happening. China Shipping Container Lines, which I sold at what turned out to be an inopportune time, also hampered the fund's results, as did an out-of-index stake in jewelry retailer Luk Fook Holdings International, based in Hong Kong. Underweighting Taiwanese electronics contract manufacturer and benchmark component Hon Hai Precision Industry further worked against us, given the stock's robust performance. Conversely, a sizable underweighting in the weak-performing Taiwan market added value, along with my choices in the hardware/equipment area of information technology. Negligible exposure to Taiwan-headquartered HTC, a stock I sold early in the period, was the right decision, as the smartphone maker lost market share to rivals Apple and Samsung Electronics, which hampered its stock. China Overseas Land and Investment, one of the largest property developers in that nation, also contributed, as did BOC Hong Kong, one of my favorite banks, and Chinese power utility Huaneng Power International, whose stock rose as investors anticipated an earnings boost from lower coal prices.
Note to shareholders: Fidelity China Region Fund may invest up to 35% of its total assets in any industry that represents more than 20% of the Hong Kong, Taiwanese and Chinese market. As of October 31, 2012, the fund did not have more than 25% of its total assets invested in any one industry.
The views expressed above reflect those of the portfolio manager(s) only through the end of the period as stated on the cover of this report and do not necessarily represent the views of Fidelity or any other person in the Fidelity organization. Any such views are subject to change at any time based upon market or other conditions and Fidelity disclaims any responsibility to update such views. These views may not be relied on as investment advice and, because investment decisions for a Fidelity fund are based on numerous factors, may not be relied on as an indication of trading intent on behalf of any Fidelity fund.
Annual Report
Fidelity China Region Fund
As a shareholder of the Fund, you incur two types of costs: (1) transaction costs, including sales charges (loads) on purchase payments or redemption proceeds, redemption fees and (2) ongoing costs, including management fees, distribution and/or service (12b-1) fees and other Fund expenses. This Example is intended to help you understand your ongoing costs (in dollars) of investing in the Fund and to compare these costs with the ongoing costs of investing in other mutual funds.
The Example is based on an investment of $1,000 invested at the beginning of the period and held for the entire period (May 1, 2012 to October 31, 2012).
Actual Expenses
The first line of the accompanying table for each class of the Fund provides information about actual account values and actual expenses. You may use the information in this line, together with the amount you invested, to estimate the expenses that you paid over the period. Simply divide your account value by $1,000.00 (for example, an $8,600 account value divided by $1,000.00 = 8.6), then multiply the result by the number in the first line for a class of the Fund under the heading entitled "Expenses Paid During Period" to estimate the expenses you paid on your account during this period. A small balance maintenance fee of $12.00 that is charged once a year may apply for certain accounts with a value of less than $2,000. This fee is not included in the table below. If it was, the estimate of expenses you paid during the period would be higher, and your ending account value lower, by this amount. In addition, the Fund, as a shareholder in the underlying Fidelity Central Funds, will indirectly bear its pro-rata share of the fees and expenses incurred by the underlying Fidelity Central Funds. These fees and expenses are not included in the Fund's annualized expense ratio used to calculate the expense estimate in the table below.
Hypothetical Example for Comparison Purposes
The second line of the accompanying table for each class of the Fund provides information about hypothetical account values and hypothetical expenses based on a Class' actual expense ratio and an assumed rate of return of 5% per year before expenses, which is not the Class' actual return. The hypothetical account values and expenses may not be used to estimate the actual ending account balance or expenses you paid for the period. You may use this information to compare the ongoing costs of investing in the Fund and other funds. To do so, compare this 5% hypothetical example with the 5% hypothetical examples that appear in the shareholder reports of the other funds. A small balance maintenance fee of $12.00 that is charged once a year may apply for certain accounts with a value of less than $2,000. This fee is not included in the table below. If it was, the estimate of expenses you paid during the period would be higher, and your ending account value lower, by this amount. In addition, the Fund, as a shareholder in the underlying Fidelity Central Funds, will indirectly bear its pro-rata share of the fees and expenses incurred by the underlying Fidelity Central Funds. These fees and expenses are not included in the Fund's annualized expense ratio used to calculate the expense estimate in the table below.
Please note that the expenses shown in the table are meant to highlight your ongoing costs only and do not reflect any transaction costs. Therefore, the second line of the table is useful in comparing ongoing costs only, and will not help you determine the relative total costs of owning different funds. In addition, if these transactional costs were included, your costs would have been higher.
| Annualized
Expense Ratio | Beginning
Account Value
May 1, 2012 | Ending
Account Value
October 31, 2012 | Expenses Paid
During Period*
May 1, 2012
to October 31, 2012 |
Class A | 1.35% | | | |
Actual | | $ 1,000.00 | $ 1,013.10 | $ 6.83 |
HypotheticalA | | $ 1,000.00 | $ 1,018.35 | $ 6.85 |
Class T | 1.64% | | | |
Actual | | $ 1,000.00 | $ 1,011.80 | $ 8.29 |
HypotheticalA | | $ 1,000.00 | $ 1,016.89 | $ 8.31 |
Class B | 2.10% | | | |
Actual | | $ 1,000.00 | $ 1,009.70 | $ 10.61 |
HypotheticalA | | $ 1,000.00 | $ 1,014.58 | $ 10.63 |
Class C | 2.10% | | | |
Actual | | $ 1,000.00 | $ 1,009.30 | $ 10.61 |
HypotheticalA | | $ 1,000.00 | $ 1,014.58 | $ 10.63 |
China Region | 1.04% | | | |
Actual | | $ 1,000.00 | $ 1,014.80 | $ 5.27 |
HypotheticalA | | $ 1,000.00 | $ 1,019.91 | $ 5.28 |
Institutional Class | 1.05% | | | |
Actual | | $ 1,000.00 | $ 1,014.50 | $ 5.32 |
HypotheticalA | | $ 1,000.00 | $ 1,019.86 | $ 5.33 |
A 5% return per year before expenses
* Expenses are equal to each Class' annualized expense ratio, multiplied by the average account value over the period, multiplied by 184/366 (to reflect the one-half year period).
Annual Report
Fidelity China Region Fund
Investment Changes (Unaudited)
Geographic Diversification (% of fund's net assets) |
As of October 31, 2012 |
| Hong Kong | 29.3% | |
 | China | 23.4% | |
 | Cayman Islands | 18.9% | |
 | Taiwan | 18.8% | |
 | Bermuda | 8.1% | |
 | Netherlands | 0.6% | |
 | Italy | 0.5% | |
 | United States of America | 0.2% | |
| United Kingdom | 0.2% | |

Percentages are based on country or territory of incorporation and are adjusted for the effect of futures contracts, if applicable. |
As of April 30, 2012 |
| China | 28.3% | |
| Hong Kong | 27.1% | |
 | Taiwan | 21.6% | |
| Cayman Islands | 13.8% | |
| Bermuda | 5.7% | |
| United Kingdom | 0.9% | |
| United States of America | 0.6% | |
| Korea (South) | 0.5% | |
| Netherlands | 0.5% | |
| Other | 1.0% | |

Percentages are based on country or territory of incorporation and are adjusted for the effect of futures contracts, if applicable. |
Asset Allocation |
| % of fund's
net assets | % of fund's net assets
6 months ago |
Stocks | 99.8 | 99.4 |
Short-Term Investments and Net Other Assets (Liabilities) | 0.2 | 0.6 |
Top Ten Stocks as of October 31, 2012 |
| % of fund's
net assets | % of fund's net assets
6 months ago |
Taiwan Semiconductor Manufacturing Co. Ltd. (Semiconductors & Semiconductor Equipment) | 6.8 | 7.0 |
Tencent Holdings Ltd. (Internet Software & Services) | 4.7 | 2.8 |
Industrial & Commercial Bank of China Ltd. (H Shares) (Commercial Banks) | 4.1 | 4.9 |
China Overseas Land and Investment Ltd. (Real Estate Management & Development) | 2.8 | 1.6 |
Cheung Kong Holdings Ltd. (Real Estate Management & Development) | 2.7 | 2.1 |
AIA Group Ltd. (Insurance) | 2.7 | 4.2 |
China Construction Bank Corp. (H Shares) (Commercial Banks) | 2.6 | 2.6 |
BOC Hong Kong (Holdings) Ltd. (Commercial Banks) | 2.4 | 2.9 |
MediaTek, Inc. (Semiconductors & Semiconductor Equipment) | 2.4 | 0.7 |
Hon Hai Precision Industry Co. Ltd. (Foxconn) (Electronic Equipment & Components) | 2.3 | 3.0 |
| 33.5 | |
Market Sectors as of October 31, 2012 |
| % of fund's
net assets | % of fund's net assets
6 months ago |
Financials | 33.1 | 39.0 |
Information Technology | 24.0 | 18.6 |
Consumer Discretionary | 11.1 | 8.4 |
Materials | 10.6 | 7.1 |
Industrials | 8.1 | 10.7 |
Energy | 4.4 | 8.1 |
Telecommunication Services | 3.5 | 3.1 |
Utilities | 3.1 | 2.2 |
Consumer Staples | 1.5 | 1.9 |
Health Care | 0.4 | 0.3 |
Annual Report
Fidelity China Region Fund
Investments October 31, 2012
Showing Percentage of Net Assets
Common Stocks - 99.8% |
| Shares | | Value |
CONSUMER DISCRETIONARY - 11.1% |
Automobiles - 0.9% |
Brilliance China Automotive Holdings Ltd. (a) | 5,190,000 | | $ 6,482,436 |
Geely Automobile Holdings Ltd. | 11,915,000 | | 5,119,573 |
| | 11,602,009 |
Hotels, Restaurants & Leisure - 4.4% |
Galaxy Entertainment Group Ltd. (a) | 5,689,000 | | 19,562,693 |
Melco PBL Entertainment (Macau) Ltd. sponsored ADR (a) | 403,400 | | 5,853,334 |
Sands China Ltd. | 4,808,200 | | 18,084,920 |
SJM Holdings Ltd. | 2,601,000 | | 5,665,109 |
Wynn Macau Ltd. | 2,610,800 | | 7,394,412 |
| | 56,560,468 |
Household Durables - 1.7% |
Skyworth Digital Holdings Ltd. | 5,486,000 | | 2,965,960 |
Techtronic Industries Co. Ltd. | 9,863,500 | | 18,785,074 |
| | 21,751,034 |
Leisure Equipment & Products - 0.7% |
Merida Industry Co. Ltd. | 2,303,450 | | 8,832,126 |
Media - 0.9% |
Television Broadcasts Ltd. | 1,626,000 | | 12,116,244 |
Multiline Retail - 0.7% |
Lifestyle International Holdings Ltd. | 1,753,500 | | 3,746,809 |
Springland International Holdings Ltd. | 11,629,000 | | 5,716,930 |
| | 9,463,739 |
Specialty Retail - 0.8% |
Chow Tai Fook Jewellery Group Ltd. | 4,988,400 | | 6,153,393 |
Luk Fook Holdings International Ltd. | 1,834,000 | | 4,609,818 |
| | 10,763,211 |
Textiles, Apparel & Luxury Goods - 1.0% |
Prada SpA | 752,900 | | 6,139,738 |
Shenzhou International Group Holdings Ltd. | 3,459,000 | | 6,739,428 |
| | 12,879,166 |
TOTAL CONSUMER DISCRETIONARY | | 143,967,997 |
CONSUMER STAPLES - 1.5% |
Food & Staples Retailing - 0.2% |
President Chain Store Corp. | 601,000 | | 2,973,109 |
Food Products - 0.8% |
Want Want China Holdings Ltd. | 7,227,000 | | 9,884,607 |
Personal Products - 0.5% |
Hengan International Group Co. Ltd. | 676,500 | | 6,162,657 |
TOTAL CONSUMER STAPLES | | 19,020,373 |
ENERGY - 4.4% |
Energy Equipment & Services - 0.5% |
China Oilfield Services Ltd. (H Shares) | 3,520,000 | | 6,676,602 |
|
| Shares | | Value |
Oil, Gas & Consumable Fuels - 3.9% |
China Shenhua Energy Co. Ltd. (H Shares) | 4,588,500 | | $ 19,538,003 |
Kunlun Energy Co. Ltd. | 13,186,000 | | 24,500,281 |
Sinopec Kantons Holdings Ltd. | 8,596,000 | | 6,410,911 |
| | 50,449,195 |
TOTAL ENERGY | | 57,125,797 |
FINANCIALS - 33.1% |
Capital Markets - 2.8% |
CITIC Securities Co. Ltd. (H Shares) | 9,503,500 | | 17,829,677 |
Haitong Securities Co. Ltd. (H Shares) | 12,406,400 | | 15,912,106 |
Wuliangye Yibin Co. Ltd. (UBS Warrant Programme) warrants 4/22/13 (a) | 345,100 | | 1,859,050 |
| | 35,600,833 |
Commercial Banks - 12.5% |
BOC Hong Kong (Holdings) Ltd. | 10,152,000 | | 31,241,760 |
China Construction Bank Corp. (H Shares) | 43,679,000 | | 32,914,028 |
Chinatrust Financial Holding Co. Ltd. | 12,203,603 | | 6,726,395 |
Hang Seng Bank Ltd. | 1,319,700 | | 20,263,650 |
Industrial & Commercial Bank of China Ltd. (H Shares) | 80,562,000 | | 53,326,503 |
Wing Hang Bank Ltd. | 904,500 | | 9,593,474 |
Wuliangye Yibin Co. Ltd. (BNP Paribas Warrant Program) warrants 8/20/13 (a) | 1,351,900 | | 7,282,671 |
| | 161,348,481 |
Insurance - 3.2% |
AIA Group Ltd. | 8,697,000 | | 34,451,120 |
China Life Insurance Co. Ltd. (H Shares) | 2,372,000 | | 6,974,893 |
| | 41,426,013 |
Real Estate Management & Development - 14.6% |
Cheung Kong Holdings Ltd. | 2,337,000 | | 34,527,068 |
China Overseas Land and Investment Ltd. | 13,656,000 | | 35,769,679 |
Csi Properties Ltd. | 139,720,000 | | 5,678,905 |
Guangzhou R&F Properties Co. Ltd. (H Shares) | 10,685,600 | | 13,139,756 |
Henderson Land Development Co. Ltd. | 1,343,000 | | 9,305,630 |
Hopson Development Holdings Ltd. (a) | 16,090,000 | | 15,508,584 |
Hysan Development Co. Ltd. | 1,336,000 | | 5,904,220 |
KWG Property Holding Ltd. | 9,404,500 | | 5,606,259 |
Longfor Properties Co. Ltd. | 7,217,500 | | 12,739,969 |
New World Development Co. Ltd. | 6,432,000 | | 9,942,563 |
Shimao Property Holdings Ltd. | 3,908,500 | | 7,463,926 |
Sun Hung Kai Properties Ltd. | 1,656,000 | | 23,055,645 |
Wharf Holdings Ltd. | 1,448,000 | | 9,911,730 |
| | 188,553,934 |
TOTAL FINANCIALS | | 426,929,261 |
Common Stocks - continued |
| Shares | | Value |
HEALTH CARE - 0.4% |
Pharmaceuticals - 0.4% |
China Medical System Holdings Ltd. | 9,846,000 | | $ 5,678,882 |
INDUSTRIALS - 8.1% |
Construction & Engineering - 2.0% |
China Communications Construction Co. Ltd. (H Shares) | 4,803,000 | | 4,505,495 |
China Railway Group Ltd. (H Shares) | 8,253,000 | | 4,206,341 |
China State Construction International Holdings Ltd. | 13,696,000 | | 16,311,389 |
| | 25,023,225 |
Electrical Equipment - 0.4% |
Zhuzhou CSR Times Electric Co. Ltd. (H Shares) | 1,912,000 | | 5,624,944 |
Industrial Conglomerates - 1.8% |
Hutchison Whampoa Ltd. | 2,358,000 | | 23,199,528 |
Machinery - 0.3% |
HIWIN Technologies Corp. | 38,400 | | 247,148 |
Singamas Container Holdings Ltd. | 14,718,000 | | 3,722,206 |
| | 3,969,354 |
Marine - 2.7% |
China Shipping Development Co. Ltd. (H Shares) | 8,884,000 | | 4,665,503 |
Orient Overseas International Ltd. | 2,828,500 | | 17,883,304 |
Pacific Basin Shipping Ltd. | 22,304,000 | | 11,943,355 |
| | 34,492,162 |
Road & Rail - 0.7% |
MTR Corp. Ltd. | 2,265,000 | | 8,855,362 |
Transportation Infrastructure - 0.2% |
Jiangsu Expressway Co. Ltd. (H Shares) | 3,524,000 | | 3,037,441 |
TOTAL INDUSTRIALS | | 104,202,016 |
INFORMATION TECHNOLOGY - 24.0% |
Communications Equipment - 1.2% |
AAC Acoustic Technology Holdings, Inc. | 4,485,000 | | 16,030,155 |
Computers & Peripherals - 1.7% |
ASUSTeK Computer, Inc. | 616,000 | | 6,600,753 |
Lenovo Group Ltd. | 15,074,000 | | 12,117,473 |
Quanta Computer, Inc. | 1,391,000 | | 3,181,061 |
| | 21,899,287 |
Electronic Equipment & Components - 3.7% |
Chroma ATE, Inc. | 1,938,000 | | 3,688,901 |
Delta Electronics, Inc. | 1,475,000 | | 5,039,541 |
Hon Hai Precision Industry Co. Ltd. (Foxconn) | 9,711,047 | | 29,488,869 |
TPK Holding Co. Ltd. GDR (Reg. S) (a) | 727,542 | | 9,140,976 |
| | 47,358,287 |
Internet Software & Services - 4.7% |
Tencent Holdings Ltd. | 1,704,100 | | 60,247,792 |
|
| Shares | | Value |
Semiconductors & Semiconductor Equipment - 12.7% |
Advanced Semiconductor Engineering, Inc. sponsored ADR (d) | 1,694,111 | | $ 6,437,622 |
ASM Pacific Technology Ltd. | 283,900 | | 3,165,007 |
Inotera Memories, Inc. (a) | 42,209,000 | | 5,736,725 |
Kinsus Interconnect Technology Corp. | 2,131,000 | | 5,858,244 |
MediaTek, Inc. | 2,736,000 | | 30,394,796 |
Novatek Microelectronics Corp. | 2,979,000 | | 11,218,418 |
Spreadtrum Communications, Inc. ADR | 612,000 | | 14,106,600 |
Taiwan Semiconductor Manufacturing Co. Ltd. | 28,667,796 | | 87,359,967 |
| | 164,277,379 |
Software - 0.0% |
NetDragon WebSoft, Inc. | 464,000 | | 495,728 |
TOTAL INFORMATION TECHNOLOGY | | 310,308,628 |
MATERIALS - 10.6% |
Chemicals - 1.1% |
Formosa Chemicals & Fibre Corp. | 3,220,000 | | 7,628,346 |
Taiwan Fertilizer Co. Ltd. | 3,015,000 | | 7,183,978 |
| | 14,812,324 |
Construction Materials - 5.1% |
Anhui Conch Cement Co. Ltd. (H Shares) | 5,902,500 | | 20,411,094 |
BBMG Corp. (H Shares) | 16,845,000 | | 14,475,739 |
China National Building Materials Co. Ltd. (H Shares) | 12,214,000 | | 15,570,780 |
China Resources Cement Holdings Ltd. | 14,036,000 | | 9,544,418 |
Taiwan Cement Corp. | 4,629,000 | | 5,934,819 |
| | 65,936,850 |
Metals & Mining - 3.0% |
Aluminum Corp. of China Ltd. (H Shares) (a) | 15,936,000 | | 6,903,054 |
Jiangxi Copper Co. Ltd. (H Shares) | 9,581,000 | | 24,786,814 |
Maanshan Iron & Steel Ltd. (H Shares) (a) | 25,498,000 | | 6,580,087 |
| | 38,269,955 |
Paper & Forest Products - 1.4% |
Lee & Man Paper Manufacturing Ltd. | 15,012,000 | | 7,883,670 |
Nine Dragons Paper (Holdings) Ltd. | 13,664,000 | | 9,626,446 |
| | 17,510,116 |
TOTAL MATERIALS | | 136,529,245 |
TELECOMMUNICATION SERVICES - 3.5% |
Diversified Telecommunication Services - 0.9% |
China Unicom Ltd. | 6,946,000 | | 11,197,831 |
Wireless Telecommunication Services - 2.6% |
China Mobile Ltd. | 2,256,500 | | 25,028,527 |
Far EasTone Telecommunications Co. Ltd. | 3,710,000 | | 8,560,561 |
| | 33,589,088 |
TOTAL TELECOMMUNICATION SERVICES | | 44,786,919 |
Common Stocks - continued |
| Shares | | Value |
UTILITIES - 3.1% |
Electric Utilities - 0.8% |
Power Assets Holdings Ltd. | 1,173,500 | | $ 9,978,471 |
Independent Power Producers & Energy Traders - 2.3% |
China Resources Power Holdings Co. Ltd. | 2,084,000 | | 4,463,765 |
Huadian Power International Corp. Ltd. (H Shares) (a) | 9,798,000 | | 2,490,572 |
Huaneng Power International, Inc. (H Shares) | 29,620,000 | | 23,664,040 |
| | 30,618,377 |
TOTAL UTILITIES | | 40,596,848 |
TOTAL COMMON STOCKS (Cost $1,037,958,239) |
1,289,145,966
|
Money Market Funds - 1.3% |
| | | |
Fidelity Cash Central Fund, 0.19% (b) | 15,785,844 | | 15,785,844 |
Fidelity Securities Lending Cash Central Fund, 0.19% (b)(c) | 77,891 | | 77,891 |
TOTAL MONEY MARKET FUNDS (Cost $15,863,735) |
15,863,735
|
TOTAL INVESTMENT PORTFOLIO - 101.1% (Cost $1,053,821,974) | | 1,305,009,701 |
NET OTHER ASSETS (LIABILITIES) - (1.1)% | | (13,627,324) |
NET ASSETS - 100% | $ 1,291,382,377 |
Legend |
(a) Non-income producing |
(b) Affiliated fund that is available only to investment companies and other accounts managed by Fidelity Investments. The rate quoted is the annualized seven-day yield of the fund at period end. A complete unaudited listing of the fund's holdings as of its most recent quarter end is available upon request. In addition, each Fidelity Central Fund's financial statements, which are not covered by the Fund's Report of Independent Registered Public Accounting Firm, are available on the SEC's website or upon request. |
(c) Includes investment made with cash collateral received from securities on loan. |
(d) Security or a portion of the security is on loan at period end. |
Affiliated Central Funds |
Information regarding fiscal year to date income earned by the Fund from investments in Fidelity Central Funds is as follows: |
Fund | Income earned |
Fidelity Cash Central Fund | $ 26,173 |
Fidelity Securities Lending Cash Central Fund | 111,499 |
Total | $ 137,672 |
Other Information |
The following is a summary of the inputs used, as of October 31, 2012, involving the Fund's assets and liabilities carried at fair value. The inputs or methodology used for valuing securities may not be an indication of the risk associated with investing in those securities. For more information on valuation inputs, and their aggregation into the levels used in the tables below, please refer to the Security Valuation section in the accompanying Notes to Financial Statements. |
Valuation Inputs at Reporting Date: |
Description | Total | Level 1 | Level 2 | Level 3 |
Investments in Securities: | | | | |
Equities: | | | | |
Consumer Discretionary | $ 143,967,997 | $ 143,967,997 | $ - | $ - |
Consumer Staples | 19,020,373 | 19,020,373 | - | - |
Energy | 57,125,797 | 57,125,797 | - | - |
Financials | 426,929,261 | 410,812,647 | 16,116,614 | - |
Health Care | 5,678,882 | 5,678,882 | - | - |
Industrials | 104,202,016 | 104,202,016 | - | - |
Information Technology | 310,308,628 | 222,948,661 | 87,359,967 | - |
Materials | 136,529,245 | 129,626,191 | 6,903,054 | - |
Telecommunication Services | 44,786,919 | 8,560,561 | 36,226,358 | - |
Utilities | 40,596,848 | 16,932,808 | 23,664,040 | - |
Money Market Funds | 15,863,735 | 15,863,735 | - | - |
Total Investments in Securities: | $ 1,305,009,701 | $ 1,134,739,668 | $ 170,270,033 | $ - |
The following is a summary of transfers between Level 1 and Level 2 for the period ended October 31, 2012. Transfers are assumed to have occurred at the beginning of the period, and are primarily attributable to the valuation techniques used for foreign equity securities, as discussed in the accompanying Notes to Financial Statements: |
Transfers | Total |
Level 1 to Level 2 | $ 0 |
Level 2 to Level 1 | $ 741,933,610 |
See accompanying notes which are an integral part of the financial statements.
Annual Report
Fidelity China Region Fund
Statement of Assets and Liabilities
| October 31, 2012 |
| | |
Assets | | |
Investment in securities, at value (including securities loaned of $78,930) - See accompanying schedule: Unaffiliated issuers (cost $1,037,958,239) | $ 1,289,145,966 | |
Fidelity Central Funds (cost $15,863,735) | 15,863,735 | |
Total Investments (cost $1,053,821,974) | | $ 1,305,009,701 |
Receivable for investments sold | | 29,683,136 |
Receivable for fund shares sold | | 1,372,007 |
Dividends receivable | | 187,311 |
Distributions receivable from Fidelity Central Funds | | 772 |
Other receivables | | 280,271 |
Total assets | | 1,336,533,198 |
| | |
Liabilities | | |
Payable for investments purchased | $ 30,215,400 | |
Payable for fund shares redeemed | 13,622,794 | |
Accrued management fee | 754,511 | |
Distribution and service plan fees payable | 9,590 | |
Other affiliated payables | 299,717 | |
Other payables and accrued expenses | 170,918 | |
Collateral on securities loaned, at value | 77,891 | |
Total liabilities | | 45,150,821 |
| | |
Net Assets | | $ 1,291,382,377 |
Net Assets consist of: | | |
Paid in capital | | $ 1,051,109,763 |
Undistributed net investment income | | 19,540,796 |
Accumulated undistributed net realized gain (loss) on investments and foreign currency transactions | | (30,455,911) |
Net unrealized appreciation (depreciation) on investments and assets and liabilities in foreign currencies | | 251,187,729 |
Net Assets | | $ 1,291,382,377 |
Statement of Assets and Liabilities - continued
| October 31, 2012 |
| | |
Calculation of Maximum Offering Price Class A:
Net Asset Value and redemption price per share ($13,539,457 ÷ 474,618 shares) | | $ 28.53 |
| | |
Maximum offering price per share (100/94.25 of $28.53) | | $ 30.27 |
Class T:
Net Asset Value and redemption price per share ($4,348,975 ÷ 153,118 shares) | | $ 28.40 |
| | |
Maximum offering price per share (100/96.50 of $28.40) | | $ 29.43 |
Class B:
Net Asset Value and offering price per share ($1,532,663 ÷ 54,432 shares)A | | $ 28.16 |
| | |
Class C:
Net Asset Value and offering price per share ($4,515,324 ÷ 160,840 shares)A | | $ 28.07 |
| | |
China Region:
Net Asset Value, offering price and redemption price per share ($1,265,488,434 ÷ 44,044,355 shares) | | $ 28.73 |
| | |
Institutional Class:
Net Asset Value, offering price and redemption price per share ($1,957,524 ÷ 68,243 shares) | | $ 28.68 |
A Redemption price per share is equal to net asset value less any applicable contingent deferred sales charge.
See accompanying notes which are an integral part of the financial statements.
Annual Report
Statement of Operations
| Year ended October 31, 2012 |
| | |
Investment Income | | |
Dividends | | $ 39,489,882 |
Interest | | 86 |
Income from Fidelity Central Funds | | 137,672 |
Income before foreign taxes withheld | | 39,627,640 |
Less foreign taxes withheld | | (3,165,755) |
Total income | | 36,461,885 |
| | |
Expenses | | |
Management fee | $ 9,807,145 | |
Transfer agent fees | 3,322,107 | |
Distribution and service plan fees | 123,475 | |
Accounting and security lending fees | 628,178 | |
Custodian fees and expenses | 506,447 | |
Independent trustees' compensation | 9,256 | |
Registration fees | 88,369 | |
Audit | 76,960 | |
Legal | 7,477 | |
Interest | 2,622 | |
Miscellaneous | 17,419 | |
Total expenses before reductions | 14,589,455 | |
Expense reductions | (909,736) | 13,679,719 |
Net investment income (loss) | | 22,782,166 |
Realized and Unrealized Gain (Loss) Net realized gain (loss) on: | | |
Investment securities: | | |
Unaffiliated issuers | (16,254,587) | |
Foreign currency transactions | (261,369) | |
Total net realized gain (loss) | | (16,515,956) |
Change in net unrealized appreciation (depreciation) on: Investment securities | 76,673,788 | |
Assets and liabilities in foreign currencies | (86) | |
Total change in net unrealized appreciation (depreciation) | | 76,673,702 |
Net gain (loss) | | 60,157,746 |
Net increase (decrease) in net assets resulting from operations | | $ 82,939,912 |
Statement of Changes in Net Assets
| Year ended
October 31,
2012 | Year ended
October 31,
2011 |
Increase (Decrease) in Net Assets | | |
Operations | | |
Net investment income (loss) | $ 22,782,166 | $ 27,851,224 |
Net realized gain (loss) | (16,515,956) | 124,444,208 |
Change in net unrealized appreciation (depreciation) | 76,673,702 | (389,938,389) |
Net increase (decrease) in net assets resulting from operations | 82,939,912 | (237,642,957) |
Distributions to shareholders from net investment income | (15,687,379) | (25,544,611) |
Distributions to shareholders from net realized gain | (18,721,345) | (1,707,007) |
Total distributions | (34,408,724) | (27,251,618) |
Share transactions - net increase (decrease) | (301,570,428) | (353,944,406) |
Redemption fees | 184,146 | 551,160 |
Total increase (decrease) in net assets | (252,855,094) | (618,287,821) |
| | |
Net Assets | | |
Beginning of period | 1,544,237,471 | 2,162,525,292 |
End of period (including undistributed net investment income of $19,540,796 and undistributed net investment income of $15,589,239, respectively) | $ 1,291,382,377 | $ 1,544,237,471 |
See accompanying notes which are an integral part of the financial statements.
Annual Report
Financial Highlights - Class A
Years ended October 31, | 2012 | 2011 | 2010 | 2009 | 2008 H |
Selected Per-Share Data | | | | | |
Net asset value, beginning of period | $ 27.28 | $ 31.61 | $ 26.47 | $ 16.67 | $ 29.28 |
Income from Investment Operations | | | | | |
Net investment income (loss) E | .36 | .33 | .25 | .30 | .28 |
Net realized and unrealized gain (loss) | 1.42 | (4.33) | 5.15 | 9.63 | (12.91) |
Total from investment operations | 1.78 | (4.00) | 5.40 | 9.93 | (12.63) |
Distributions from net investment income | (.19) | (.31) | (.20) | (.16) | - |
Distributions from net realized gain | (.34) | (.03) | (.07) | - | - |
Total distributions | (.53) | (.34) | (.27) | (.16) | - |
Redemption fees added to paid in capital E | - J | .01 | .01 | .03 | .02 |
Net asset value, end of period | $ 28.53 | $ 27.28 | $ 31.61 | $ 26.47 | $ 16.67 |
Total Return B, C, D | 6.70% | (12.79)% | 20.54% | 60.41% | (43.07)% |
Ratios to Average Net Assets F, I | | | | | |
Expenses before reductions | 1.36% | 1.37% | 1.38% | 1.39% | 1.44% A |
Expenses net of fee waivers, if any | 1.36% | 1.37% | 1.38% | 1.39% | 1.44% A |
Expenses net of all reductions | 1.29% | 1.31% | 1.31% | 1.31% | 1.30% A |
Net investment income (loss) | 1.35% | 1.07% | .91% | 1.27% | 2.63% A |
Supplemental Data | | | | | |
Net assets, end of period (000 omitted) | $ 13,539 | $ 14,808 | $ 16,047 | $ 11,842 | $ 340 |
Portfolio turnover rate G | 107% | 87% | 57% | 88% | 133% |
A Annualized B Total returns for periods of less than one year are not annualized. C Total returns would have been lower if certain expenses had not been reduced during the applicable periods shown. D Total returns do not include the effect of the sales charges. E Calculated based on average shares outstanding during the period. F Fees and expenses of any underlying Fidelity Central Funds are not included in the Fund's expense ratio. The Fund indirectly bears its proportionate share of the expenses of any underlying Fidelity Central Funds. G Amount does not include the portfolio activity of any underlying Fidelity Central Funds. H For the period May 9, 2008 (commencement of sale of shares) to October 31, 2008. I Expense ratios reflect operating expenses of the class. Expenses before reductions do not reflect amounts reimbursed by the investment adviser or reductions from brokerage service arrangements or reductions from other expense offset arrangements and do not represent the amount paid by the class during periods when reimbursements or reductions occur. Expense ratios before reductions for start-up periods may not be representative of longer-term operating periods. Expenses net of fee waivers reflect expenses after reimbursement by the investment adviser but prior to reductions from brokerage service arrangements or other expense offset arrangements. Expenses net of all reductions represent the net expenses paid by the class. J Amount represents less than $.01 per share. |
Financial Highlights - Class T
Years ended October 31, | 2012 | 2011 | 2010 | 2009 | 2008 H |
Selected Per-Share Data | | | | | |
Net asset value, beginning of period | $ 27.13 | $ 31.48 | $ 26.40 | $ 16.65 | $ 29.28 |
Income from Investment Operations | | | | | |
Net investment income (loss) E | .29 | .25 | .18 | .23 | .26 |
Net realized and unrealized gain (loss) | 1.40 | (4.32) | 5.13 | 9.64 | (12.91) |
Total from investment operations | 1.69 | (4.07) | 5.31 | 9.87 | (12.65) |
Distributions from net investment income | (.08) | (.27) | (.18) | (.14) | - |
Distributions from net realized gain | (.34) | (.03) | (.07) | - | - |
Total distributions | (.42) | (.29) K | (.24) L | (.14) | - |
Redemption fees added to paid in capital E | - J | .01 | .01 | .02 | .02 |
Net asset value, end of period | $ 28.40 | $ 27.13 | $ 31.48 | $ 26.40 | $ 16.65 |
Total Return B, C, D | 6.38% | (13.04)% | 20.27% | 59.92% | (43.14)% |
Ratios to Average Net Assets F, I | | | | | |
Expenses before reductions | 1.64% | 1.63% | 1.64% | 1.66% | 1.68% A |
Expenses net of fee waivers, if any | 1.64% | 1.63% | 1.64% | 1.66% | 1.68% A |
Expenses net of all reductions | 1.57% | 1.57% | 1.58% | 1.58% | 1.53% A |
Net investment income (loss) | 1.06% | .81% | .64% | 1.00% | 2.40% A |
Supplemental Data | | | | | |
Net assets, end of period (000 omitted) | $ 4,349 | $ 5,281 | $ 6,070 | $ 3,139 | $ 107 |
Portfolio turnover rate G | 107% | 87% | 57% | 88% | 133% |
A Annualized B Total returns for periods of less than one year are not annualized. C Total returns would have been lower if certain expenses had not been reduced during the applicable periods shown. D Total returns do not include the effect of the sales charges. E Calculated based on average shares outstanding during the period. F Fees and expenses of any underlying Fidelity Central Funds are not included in the Fund's expense ratio. The Fund indirectly bears its proportionate share of the expenses of any underlying Fidelity Central Funds. G Amount does not include the portfolio activity of any underlying Fidelity Central Funds. H For the period May 9, 2008 (commencement of sale of shares) to October 31, 2008. I Expense ratios reflect operating expenses of the class. Expenses before reductions do not reflect amounts reimbursed by the investment adviser or reductions from brokerage service arrangements or reductions from other expense offset arrangements and do not represent the amount paid by the class during periods when reimbursements or reductions occur. Expense ratios before reductions for start-up periods may not be representative of longer-term operating periods. Expenses net of fee waivers reflect expenses after reimbursement by the investment adviser but prior to reductions from brokerage service arrangements or other expense offset arrangements. Expenses net of all reductions represent the net expenses paid by the class. J Amount represents less than $.01 per share. K Total distributions of $.29 per share is comprised of distributions from net investment income of $.268 and distributions from net realized gain of $.025 per share. L Total distributions of $.24 per share is comprised of distributions from net investment income of $.177 and distributions from net realized gain of $.065 per share. |
See accompanying notes which are an integral part of the financial statements.
Annual Report
Financial Highlights - Class B
Years ended October 31, | 2012 | 2011 | 2010 | 2009 | 2008 H |
Selected Per-Share Data | | | | | |
Net asset value, beginning of period | $ 26.94 | $ 31.23 | $ 26.28 | $ 16.61 | $ 29.28 |
Income from Investment Operations | | | | | |
Net investment income (loss) E | .16 | .10 | .04 | .12 | .20 |
Net realized and unrealized gain (loss) | 1.40 | (4.29) | 5.09 | 9.63 | (12.89) |
Total from investment operations | 1.56 | (4.19) | 5.13 | 9.75 | (12.69) |
Distributions from net investment income | - | (.08) | (.12) | (.10) | - |
Distributions from net realized gain | (.34) | (.03) | (.07) | - | - |
Total distributions | (.34) | (.11) | (.19) | (.10) | - |
Redemption fees added to paid in capital E | - J | .01 | .01 | .02 | .02 |
Net asset value, end of period | $ 28.16 | $ 26.94 | $ 31.23 | $ 26.28 | $ 16.61 |
Total Return B, C, D | 5.90% | (13.45)% | 19.63% | 59.16% | (43.27)% |
Ratios to Average Net Assets F, I | | | | | |
Expenses before reductions | 2.11% | 2.12% | 2.14% | 2.15% | 2.17% A |
Expenses net of fee waivers, if any | 2.11% | 2.12% | 2.14% | 2.15% | 2.17% A |
Expenses net of all reductions | 2.04% | 2.06% | 2.08% | 2.06% | 2.02% A |
Net investment income (loss) | .59% | .32% | .14% | .51% | 1.91% A |
Supplemental Data | | | | | |
Net assets, end of period (000 omitted) | $ 1,533 | $ 1,801 | $ 2,496 | $ 1,915 | $ 155 |
Portfolio turnover rate G | 107% | 87% | 57% | 88% | 133% |
A Annualized B Total returns for periods of less than one year are not annualized. C Total returns would have been lower if certain expenses had not been reduced during the applicable periods shown. D Total returns do not include the effect of the contingent deferred sales charge. E Calculated based on average shares outstanding during the period. F Fees and expenses of any underlying Fidelity Central Funds are not included in the Fund's expense ratio. The Fund indirectly bears its proportionate share of the expenses of any underlying Fidelity Central Funds. G Amount does not include the portfolio activity of any underlying Fidelity Central Funds. H For the period May 9, 2008 (commencement of sale of shares) to October 31, 2008. I Expense ratios reflect operating expenses of the class. Expenses before reductions do not reflect amounts reimbursed by the investment adviser or reductions from brokerage service arrangements or reductions from other expense offset arrangements and do not represent the amount paid by the class during periods when reimbursements or reductions occur. Expense ratios before reductions for start-up periods may not be representative of longer-term operating periods. Expenses net of fee waivers reflect expenses after reimbursement by the investment adviser but prior to reductions from brokerage service arrangements or other expense offset arrangements. Expenses net of all reductions represent the net expenses paid by the class. J Amount represents less than $.01 per share. |
Financial Highlights - Class C
Years ended October 31, | 2012 | 2011 | 2010 | 2009 | 2008 H |
Selected Per-Share Data | | | | | |
Net asset value, beginning of period | $ 26.86 | $ 31.19 | $ 26.25 | $ 16.61 | $ 29.28 |
Income from Investment Operations | | | | | |
Net investment income (loss) E | .16 | .10 | .04 | .12 | .20 |
Net realized and unrealized gain (loss) | 1.39 | (4.28) | 5.09 | 9.62 | (12.89) |
Total from investment operations | 1.55 | (4.18) | 5.13 | 9.74 | (12.69) |
Distributions from net investment income | - | (.13) | (.13) | (.12) | - |
Distributions from net realized gain | (.34) | (.03) | (.07) | - | - |
Total distributions | (.34) | (.16) | (.20) | (.12) | - |
Redemption fees added to paid in capital E | - J | .01 | .01 | .02 | .02 |
Net asset value, end of period | $ 28.07 | $ 26.86 | $ 31.19 | $ 26.25 | $ 16.61 |
Total Return B, C, D | 5.88% | (13.46)% | 19.66% | 59.18% | (43.27)% |
Ratios to Average Net Assets F, I | | | | | |
Expenses before reductions | 2.11% | 2.12% | 2.14% | 2.15% | 2.13% A |
Expenses net of fee waivers, if any | 2.11% | 2.12% | 2.14% | 2.15% | 2.13% A |
Expenses net of all reductions | 2.04% | 2.06% | 2.07% | 2.07% | 1.98% A |
Net investment income (loss) | .59% | .32% | .15% | .51% | 1.95% A |
Supplemental Data | | | | | |
Net assets, end of period (000 omitted) | $ 4,515 | $ 5,230 | $ 5,938 | $ 3,806 | $ 233 |
Portfolio turnover rate G | 107% | 87% | 57% | 88% | 133% |
A Annualized B Total returns for periods of less than one year are not annualized. C Total returns would have been lower if certain expenses had not been reduced during the applicable periods shown. D Total returns do not include the effect of the contingent deferred sales charge. E Calculated based on average shares outstanding during the period. F Fees and expenses of any underlying Fidelity Central Funds are not included in the Fund's expense ratio. The Fund indirectly bears its proportionate share of the expenses of any underlying Fidelity Central Funds. G Amount does not include the portfolio activity of any underlying Fidelity Central Funds. H For the period May 9, 2008 (commencement of sale of shares) to October 31, 2008. I Expense ratios reflect operating expenses of the class. Expenses before reductions do not reflect amounts reimbursed by the investment adviser or reductions from brokerage service arrangements or reductions from other expense offset arrangements and do not represent the amount paid by the class during periods when reimbursements or reductions occur. Expense ratios before reductions for start-up periods may not be representative of longer-term operating periods. Expenses net of fee waivers reflect expenses after reimbursement by the investment adviser but prior to reductions from brokerage service arrangements or other expense offset arrangements. Expenses net of all reductions represent the net expenses paid by the class. J Amount represents less than $.01 per share. |
See accompanying notes which are an integral part of the financial statements.
Annual Report
Financial Highlights - China Region
Years ended October 31, | 2012 | 2011 | 2010 | 2009 | 2008 |
Selected Per-Share Data | | | | | |
Net asset value, beginning of period | $ 27.49 | $ 31.81 | $ 26.55 | $ 16.69 | $ 41.52 |
Income from Investment Operations | | | | | |
Net investment income (loss) B | .45 | .44 | .34 | .33 | .39 |
Net realized and unrealized gain (loss) | 1.42 | (4.37) | 5.18 | 9.68 | (20.42) |
Total from investment operations | 1.87 | (3.93) | 5.52 | 10.01 | (20.03) |
Distributions from net investment income | (.29) | (.38) | (.21) | (.17) | (.32) |
Distributions from net realized gain | (.34) | (.03) | (.07) | - | (4.53) |
Total distributions | (.63) | (.40) G | (.27) H | (.17) | (4.85) |
Redemption fees added to paid in capital B | - F | .01 | .01 | .02 | .05 |
Net asset value, end of period | $ 28.73 | $ 27.49 | $ 31.81 | $ 26.55 | $ 16.69 |
Total Return A | 7.01% | (12.52)% | 20.97% | 60.77% | (53.75)% |
Ratios to Average Net Assets C, E | | | | | |
Expenses before reductions | 1.04% | 1.04% | 1.06% | 1.12% | 1.11% |
Expenses net of fee waivers, if any | 1.04% | 1.04% | 1.06% | 1.12% | 1.11% |
Expenses net of all reductions | .98% | .98% | 1.00% | 1.03% | .96% |
Net investment income (loss) | 1.66% | 1.40% | 1.22% | 1.54% | 1.45% |
Supplemental Data | | | | | |
Net assets, end of period (000 omitted) | $ 1,265,488 | $ 1,515,084 | $ 2,130,070 | $ 2,138,141 | $ 740,289 |
Portfolio turnover rate D | 107% | 87% | 57% | 88% | 133% |
A Total returns would have been lower if certain expenses had not been reduced during the applicable periods shown. B Calculated based on average shares outstanding during the period. C Fees and expenses of any underlying Fidelity Central Funds are not included in the Fund's expense ratio. The Fund indirectly bears its proportionate share of the expenses of any underlying Fidelity Central Funds. D Amount does not include the portfolio activity of any underlying Fidelity Central Funds. E Expense ratios reflect operating expenses of the class. Expenses before reductions do not reflect amounts reimbursed by the investment adviser or reductions from brokerage service arrangements or reductions from other expense offset arrangements and do not represent the amount paid by the class during periods when reimbursements or reductions occur. Expenses net of fee waivers reflect expenses after reimbursement by the investment adviser but prior to reductions from brokerage service arrangements or other expense offset arrangements. Expenses net of all reductions represent the net expenses paid by the class. F Amount represents less than $.01 per share. G Total distributions of $.40 per share is comprised of distributions from net investment income of $.376 and distributions from net realized gain of $.025 per share. H Total distributions of $.27 per share is comprised of distributions from net investment income of $.209 and distributions from net realized gain of $.065 per share. |
Financial Highlights - Institutional Class
Years ended October 31, | 2012 | 2011 | 2010 | 2009 | 2008 G |
Selected Per-Share Data | | | | | |
Net asset value, beginning of period | $ 27.46 | $ 31.79 | $ 26.55 | $ 16.70 | $ 29.28 |
Income from Investment Operations | | | | | |
Net investment income (loss) D | .45 | .43 | .33 | .37 | .34 |
Net realized and unrealized gain (loss) | 1.42 | (4.37) | 5.18 | 9.64 | (12.94) |
Total from investment operations | 1.87 | (3.94) | 5.51 | 10.01 | (12.60) |
Distributions from net investment income | (.31) | (.37) | (.22) | (.18) | - |
Distributions from net realized gain | (.34) | (.03) | (.07) | - | - |
Total distributions | (.65) | (.40) | (.28) J | (.18) | - |
Redemption fees added to paid in capital D | - I | .01 | .01 | .02 | .02 |
Net asset value, end of period | $ 28.68 | $ 27.46 | $ 31.79 | $ 26.55 | $ 16.70 |
Total Return B, C | 7.02% | (12.56)% | 20.92% | 60.78% | (42.96)% |
Ratios to Average Net Assets E, H | | | | | |
Expenses before reductions | 1.04% | 1.06% | 1.11% | 1.08% | 1.05% A |
Expenses net of fee waivers, if any | 1.04% | 1.06% | 1.11% | 1.08% | 1.05% A |
Expenses net of all reductions | .98% | 1.01% | 1.04% | 1.00% | .91% A |
Net investment income (loss) | 1.66% | 1.38% | 1.18% | 1.58% | 3.02% A |
Supplemental Data | | | | | |
Net assets, end of period (000 omitted) | $ 1,958 | $ 2,034 | $ 1,904 | $ 1,684 | $ 60 |
Portfolio turnover rate F | 107% | 87% | 57% | 88% | 133% |
A Annualized B Total returns for periods of less than one year are not annualized. C Total returns would have been lower if certain expenses had not been reduced during the applicable periods shown. D Calculated based on average shares outstanding during the period. E Fees and expenses of any underlying Fidelity Central Funds are not included in the Fund's expense ratio. The Fund indirectly bears its proportionate share of the expenses of any underlying Fidelity Central Funds. F Amount does not include the portfolio activity of any underlying Fidelity Central Funds. G For the period May 9, 2008 (commencement of sale of shares) to October 31, 2008. H Expense ratios reflect operating expenses of the class. Expenses before reductions do not reflect amounts reimbursed by the investment adviser or reductions from brokerage service arrangements or reductions from other expense offset arrangements and do not represent the amount paid by the class during periods when reimbursements or reductions occur. Expense ratios before reductions for start-up periods may not be representative of longer-term operating periods. Expenses net of fee waivers reflect expenses after reimbursement by the investment adviser but prior to reductions from brokerage service arrangements or other expense offset arrangements. Expenses net of all reductions represent the net expenses paid by the class. I Amount represents less than $.01 per share. J Total distributions of $.28 per share is comprised of distributions from net investment income of $.216 and distributions from net realized gain of $.065 per share. |
See accompanying notes which are an integral part of the financial statements.
Annual Report
Notes to Financial Statements
For the period ended October 31, 2012
1. Organization.
Fidelity China Region Fund (the Fund) is a fund of Fidelity Investment Trust (the Trust) and is authorized to issue an unlimited number of shares. The Trust is registered under the Investment Company Act of 1940, as amended (the 1940 Act), as an open-end management investment company organized as a Massachusetts business trust. The Fund offers Class A, Class T, Class C, China Region and Institutional Class shares, each of which, along with Class B shares, has equal rights as to assets and voting privileges. Effective after the close of business on September 1, 2010, Class B shares were closed to new accounts and additional purchases, except for exchanges and reinvestments. Each class has exclusive voting rights with respect to matters that affect that class. Class B shares will automatically convert to Class A shares after a holding period of seven years from the initial date of purchase. Investment income, realized and unrealized capital gains and losses, the common expenses of the Fund, and certain fund-level expense reductions, if any, are allocated on a pro-rata basis to each class based on the relative net assets of each class to the total net assets of the Fund. Each class differs with respect to transfer agent and distribution and service plan fees incurred. Certain expense reductions may also differ by class. The Fund's investments in emerging markets can be subject to social, economic, regulatory, and political uncertainties and can be extremely volatile.
2. Investments in Fidelity Central Funds.
The Fund invests in Fidelity Central Funds, which are open-end investment companies available only to other investment companies and accounts managed by Fidelity Management & Research Company (FMR) and its affiliates. The Fund's Schedule of Investments lists each of the Fidelity Central Funds held as of period end, if any, as an investment of the Fund, but does not include the underlying holdings of each Fidelity Central Fund. As an Investing Fund, the Fund indirectly bears its proportionate share of the expenses of the underlying Fidelity Central Funds.
The Money Market Central Funds seek preservation of capital and current income and are managed by Fidelity Investments Money Management, Inc. (FIMM), an affiliate of FMR.
A complete unaudited list of holdings for each Fidelity Central Fund is available upon request or at the Securities and Exchange Commission (the SEC) web site at www.sec.gov. In addition, the financial statements of the Fidelity Central Funds, which are not covered by the Fund's Report of Independent Registered Public Accounting Firm, are available on the SEC web site or upon request.
3. Significant Accounting Policies.
The financial statements have been prepared in conformity with accounting principles generally accepted in the United States of America (GAAP), which require management to make certain estimates and assumptions at the date of the financial statements. Actual results could differ from those estimates. Subsequent events, if any, through the date that the financial statements were issued have been evaluated in the preparation of the financial statements. The following summarizes the significant accounting policies of the Fund:
Security Valuation. Investments are valued as of 4:00 p.m. Eastern time on the last calendar day of the period. In accordance with valuation policies and procedures approved by the Board of Trustees (the Board), the Fund attempts to obtain prices from one or more third party pricing vendors or brokers to value its investments. When current market prices, quotations or rates are not readily available or reliable, securities will be fair valued in good faith by the FMR Fair Value Committee (the Committee), in accordance with procedures adopted by the Fund's Board. Factors used in determining fair value vary by security type and may include market or security specific events. The frequency with which these procedures are used cannot be predicted and they may be utilized to a significant extent. The Committee oversees the Fund's valuation policies and procedures and is responsible for approving and reporting to the Board all fair value determinations.
The Fund categorizes the inputs to valuation techniques used to value its investments into a disclosure hierarchy consisting of three levels as shown below:
Level 1 - quoted prices in active markets for identical investments
Level 2 - other significant observable inputs (including quoted prices for similar investments, interest rates, prepayment speeds, etc.)
Level 3 - unobservable inputs (including the Fund's own assumptions based on the best information available)
Valuation techniques used to value the Fund's investments by major category are as follows:
Equity securities, including restricted securities, for which market quotations are readily available, are valued at the last reported sale price or official closing price as reported by a third party pricing vendor on the primary market or exchange on which they are traded and are categorized as Level 1 in the hierarchy. In the event there were no sales during the day or closing prices are not available, securities are valued at the last quoted bid price or may be valued using the last available price and are generally categorized as Level 2 in the hierarchy. For foreign equity securities, when significant market or security specific events arise, comparisons to the valuation of American Depositary Receipts (ADRs), futures contracts, Exchange-Traded Funds (ETFs) and certain indexes as well as quoted prices for similar securities are used and are categorized as Level 2 in the hierarchy. Utilizing these techniques may result in transfers between Level 1 and Level 2.
Annual Report
3. Significant Accounting Policies - continued
Security Valuation - continued
Investments in open-end mutual funds, including the Fidelity Central Funds, are valued at their closing net asset value (NAV) each business day and are categorized as Level 1 in the hierarchy.
Changes in valuation techniques may result in transfers in or out of an assigned level within the disclosure hierarchy. The aggregate value of investments by input level, as of October 31, 2012, including information on transfers between Levels 1 and 2 securities, is included at the end of the Fund's Schedule of Investments.
Foreign Currency Translation. The Fund may use foreign currency contracts to facilitate transactions in foreign-denominated securities. Gains and losses from these transactions may arise from changes in the value of the foreign currency or if the counterparties do not perform under the contracts' terms.
Foreign-denominated assets, including investment securities, and liabilities are translated into U.S. dollars at the exchange rates at period end. Purchases and sales of investment securities, income and dividends received and expenses denominated in foreign currencies are translated into U.S. dollars at the exchange rate in effect on the transaction date.
The effects of exchange rate fluctuations on investments are included with the net realized and unrealized gain (loss) on investment securities. Other foreign currency transactions resulting in realized and unrealized gain (loss) are disclosed separately.
Investment Transactions and Income. For financial reporting purposes, the Fund's investment holdings and NAV include trades executed through the end of the last business day of the period. The NAV per share for processing shareholder transactions is calculated as of the close of business of the New York Stock Exchange (NYSE), normally 4:00 p.m. Eastern time and includes trades executed through the end of the prior business day. Gains and losses on securities sold are determined on the basis of identified cost. Dividend income is recorded on the ex-dividend date, except for certain dividends from foreign securities where the ex-dividend date may have passed, which are recorded as soon as the Fund is informed of the ex-dividend date. Non-cash dividends included in dividend income, if any, are recorded at the fair market value of the securities received. Interest income and distributions from the Fidelity Central Funds are accrued as earned. Interest income includes coupon interest and amortization of premium and accretion of discount on debt securities. Investment income is recorded net of foreign taxes withheld where recovery of such taxes is uncertain.
Expenses. Expenses directly attributable to a fund are charged to that fund. Expenses attributable to more than one fund are allocated among the respective funds on the basis of relative net assets or other appropriate methods. Expense estimates are accrued in the period to which they relate and adjustments are made when actual amounts are known.
Income Tax Information and Distributions to Shareholders. Each year, the Fund intends to qualify as a regulated investment company under Subchapter M of the Internal Revenue Code, including distributing substantially all of its taxable income and realized gains. As a result, no provision for income taxes is required. As of October 31, 2012, the Fund did not have any unrecognized tax benefits in the financial statements; nor is the Fund aware of any tax positions for which it is reasonably possible that the total amounts of unrecognized tax benefits will significantly change in the next twelve months. The Fund files a U.S. federal tax return, in addition to state and local tax returns as required. A fund's federal income tax returns are subject to examination by the Internal Revenue Service (IRS) for a period of three fiscal years after they are filed. State and local tax returns may be subject to examination for an additional fiscal year depending on the jurisdiction. Foreign taxes are provided for based on the Fund's understanding of the tax rules and rates that exist in the foreign markets in which it invests.
Distributions are declared and recorded on the ex-dividend date. Income dividends and capital gain distributions are declared separately for each class. Income and capital gain distributions are determined in accordance with income tax regulations, which may differ from GAAP. In addition, the Fund claimed a portion of the payment made to redeeming shareholders as a distribution for income tax purposes.
Capital accounts within the financial statements are adjusted for permanent book-tax differences. These adjustments have no impact on net assets or the results of operations. Temporary book-tax differences will reverse in a subsequent period.
Book-tax differences are primarily due to foreign currency transactions, deferred trustees compensation, capital loss carryforwards and losses deferred due to wash sales.
The federal tax cost of investment securities and unrealized appreciation (depreciation) as of period end were as follows:
Gross unrealized appreciation | $ 267,134,828 |
Gross unrealized depreciation | (22,561,736) |
Net unrealized appreciation (depreciation) on securities and other investments | $ 244,573,092 |
| |
Tax Cost | $ 1,060,436,609 |
Annual Report
Notes to Financial Statements - continued
3. Significant Accounting Policies - continued
Income Tax Information and Distributions to Shareholders - continued
The tax-based components of distributable earnings as of period end were as follows:
Undistributed ordinary income | $ 19,540,801 |
Capital loss carryforward | $ (23,841,276) |
Net unrealized appreciation (depreciation) | $ 244,573,094 |
Capital loss carryforwards are only available to offset future capital gains of the Fund to the extent provided by regulations and may be limited. Under the Regulated Investment Company Modernization Act of 2010 (the Act), the Fund is permitted to carry forward capital losses incurred in taxable years beginning after December 22, 2010 for an unlimited period and such capital losses are required to be used prior to any losses that expire. Capital loss carryforwards were as follows:
No expiration | |
Short-term | $ (23,841,276) |
The tax character of distributions paid was as follows:
| October 31, 2012 | October 31, 2011 |
Ordinary Income | $ 15,687,379 | $ 27,251,618 |
Long-term Capital Gains | 18,721,345 | - |
Total | $ 34,408,724 | $ 27,251,618 |
Short-Term Trading (Redemption) Fees. Shares held by investors in the Fund less than 90 days are subject to a redemption fee equal to 1.50% of the net asset value of shares redeemed. All redemption fees, which reduce the proceeds of the shareholder redemption, are retained by the Fund and accounted for as an addition to paid in capital.
New Accounting Pronouncement. In December 2011, the Financial Accounting Standards Board issued Accounting Standard Update No. 2011-11, Disclosures about Offsetting Assets and Liabilities. The update creates new disclosure requirements requiring entities to disclose both gross and net information for derivatives and other financial instruments that are either offset in the Statement of Assets and Liabilities or subject to an enforceable master netting arrangement or similar agreement. The disclosure requirements are effective for annual reporting periods beginning on or after January 1, 2013, and interim periods within those annual periods. Management is currently evaluating the impact of the update's adoption on the Fund's financial statement disclosures.
4. Purchases and Sales of Investments.
Purchases and sales of securities, other than short-term securities, aggregated $1,465,665,476 and $1,764,182,469, respectively.
5. Fees and Other Transactions with Affiliates.
Management Fee. FMR and its affiliates provide the Fund with investment management related services for which the Fund pays a monthly management fee. The management fee is the sum of an individual fund fee rate that is based on an annual rate of .45% of the Fund's average net assets and an annualized group fee rate that averaged .26% during the period. The group fee rate is based upon the average net assets of all the mutual funds advised by FMR. The group fee rate decreases as assets under management increase and increases as assets under management decrease. For the period, the total annual management fee rate was .71% of the Fund's average net assets.
Distribution and Service Plan Fees. In accordance with Rule 12b-1 of the 1940 Act, the Fund has adopted separate Distribution and Service Plans for each class of shares. Certain classes pay Fidelity Distributors Corporation (FDC), an affiliate of FMR, separate Distribution and Service Fees, each of which is based on an annual percentage of each class' average net assets. In addition, FDC may pay financial intermediaries for selling shares of the Fund and providing shareholder support services. For the period, the Distribution and Service Fee rates, total fees and amounts retained by FDC were as follows:
| Distribution
Fee | Service
Fee | Total Fees | Retained
by FDC |
Class A | -% | .25% | $ 35,281 | $ 524 |
Class T | .25% | .25% | 22,950 | - |
Class B | .75% | .25% | 16,491 | 12,400 |
Class C | .75% | .25% | 48,753 | 8,299 |
| | | $ 123,475 | $ 21,223 |
Annual Report
5. Fees and Other Transactions with Affiliates - continued
Sales Load. FDC may receive a front-end sales charge of up to 5.75% for selling Class A shares and 3.50% for selling Class T shares, some of which is paid to financial intermediaries for selling shares of the Fund. Depending on the holding period, FDC may receive contingent deferred sales charges levied on Class A, Class T, Class B, and Class C redemptions. The deferred sales charges range from 5.00% to 1.00% for Class B shares, 1.00% for Class C shares, 1.00% for certain purchases of Class A shares and .25% for certain purchases of Class T shares.
For the period, sales charge amounts retained by FDC were as follows:
| Retained
by FDC |
Class A | $ 10,963 |
Class T | 2,292 |
Class B* | 5,294 |
Class C* | 614 |
| $ 19,163 |
* When Class B and Class C shares are initially sold, FDC pays commissions from its own resources to financial intermediaries through which the sales are made.
Transfer Agent Fees. Fidelity Investments Institutional Operations Company, Inc. (FIIOC), an affiliate of FMR, is the transfer, dividend disbursing and shareholder servicing agent for each class of the Fund. FIIOC receives account fees and asset-based fees that vary according to the account size and type of account of the shareholders of the respective classes of the Fund. FIIOC pays for typesetting, printing and mailing of shareholder reports, except proxy statements. For the period, transfer agent fees for each class were as follows:
| Amount | % of
Average
Net Assets |
Class A | $ 42,267 | .30 |
Class T | 15,146 | .33 |
Class B | 4,929 | .30 |
Class C | 14,604 | .30 |
China Region | 3,240,864 | .24 |
Institutional Class | 4,297 | .24 |
| $ 3,322,107 | |
Accounting and Security Lending Fees. Fidelity Service Company, Inc. (FSC), an affiliate of FMR, maintains the Fund's accounting records. The accounting fee is based on the level of average net assets for each month. Under a separate contract, FSC administers the security lending program. The security lending fee is based on the number and duration of lending transactions.
Brokerage Commissions. The Fund placed a portion of its portfolio transactions with brokerage firms which are affiliates of the investment adviser. The commissions paid to these affiliated firms were $1,024 for the period.
Interfund Lending Program. Pursuant to an Exemptive Order issued by the SEC, the Fund, along with other registered investment companies having management contracts with FMR, may participate in an interfund lending program. This program provides an alternative credit facility allowing the funds to borrow from, or lend money to, other participating affiliated funds. At period end, there were no interfund loans outstanding. The Fund's activity in this program during the period for which loans were outstanding was as follows:
Borrower or Lender | Average Loan
Balance | Weighted Average Interest Rate | Interest
Expense |
Borrower | $ 5,482,818 | .39% | $ 2,622 |
6. Committed Line of Credit.
The Fund participates with other funds managed by FMR or an affiliate in a $4.25 billion credit facility (the "line of credit") to be utilized for temporary or emergency purposes to fund shareholder redemptions or for other short-term liquidity purposes. The Fund has agreed to pay commitment fees on its pro-rata portion of the line of credit, which amounted to $3,885 and is reflected in Miscellaneous expenses on the Statement of Operations. During the period, there were no borrowings on this line of credit.
Annual Report
Notes to Financial Statements - continued
7. Security Lending.
The Fund lends portfolio securities through a lending agent from time to time in order to earn additional income. For equity securities, a lending agent is used and may loan securities to certain qualified borrowers, including Fidelity Capital Markets (FCM), a broker-dealer affiliated with the Fund. On the settlement date of the loan, the Fund receives collateral (in the form of U.S. Treasury obligations, letters of credit and/or cash) against the loaned securities and maintains collateral in an amount not less than 100% of the market value of the loaned securities during the period of the loan. The market value of the loaned securities is determined at the close of business of the Fund and any additional required collateral is delivered to the Fund on the next business day. If the borrower defaults on its obligation to return the securities loaned because of insolvency or other reasons, a fund could experience delays and costs in recovering the securities loaned or in gaining access to the collateral. Any cash collateral received is invested in the Fidelity Securities Lending Cash Central Fund. The value of loaned securities and cash collateral at period end are disclosed on the Fund's Statement of Assets and Liabilities. Security lending income represents the income earned on investing cash collateral, less rebates paid to borrowers and any lending agent fees associated with the loan, plus any premium payments received for lending certain types of securities. Security lending income is presented in the Statement of Operations as a component of income from Fidelity Central Funds. Total security lending income during the period amounted to $111,499. During the period, there were no securities loaned to FCM.
8. Expense Reductions.
Many of the brokers with whom FMR places trades on behalf of the Fund provided services to the Fund in addition to trade execution. These services included payments of certain expenses on behalf of the Fund totaling $909,245 for the period. In addition, through arrangements with the Fund's custodian, credits realized as a result of uninvested cash balances were used to reduce the Fund's expenses. During the period, these credits reduced the Fund's custody expenses by $491.
9. Distributions to Shareholders.
Distributions to shareholders of each class were as follows:
Years ended October 31, | 2012 | 2011 |
From net investment income | | |
Class A | $ 100,983 | $ 172,777 |
Class T | 14,853 | 55,512 |
Class B | - | 6,583 |
Class C | - | 25,937 |
China Region | 15,549,167 | 25,262,487 |
Institutional Class | 22,376 | 21,315 |
Total | $ 15,687,379 | $ 25,544,611 |
From net realized gain | | |
Class A | $ 182,091 | $ 13,756 |
Class T | 60,664 | 5,178 |
Class B | 21,876 | 2,007 |
Class C | 65,490 | 4,950 |
China Region | 18,366,435 | 1,679,687 |
Institutional Class | 24,789 | 1,429 |
Total | $ 18,721,345 | $ 1,707,007 |
10. Share Transactions.
Transactions for each class of shares were as follows:
| Shares | Dollars |
Years ended October 31, | 2012 | 2011 | 2012 | 2011 |
Class A | | | | |
Shares sold | 128,967 | 281,861 | $ 3,497,936 | $ 8,932,867 |
Reinvestment of distributions | 10,227 | 5,327 | 266,217 | 172,528 |
Shares redeemed | (207,420) | (251,952) | (5,547,035) | (7,835,006) |
Net increase (decrease) | (68,226) | 35,236 | $ (1,782,882) | $ 1,270,389 |
Class T | | | | |
Shares sold | 40,215 | 75,956 | $ 1,078,486 | $ 2,390,903 |
Reinvestment of distributions | 2,834 | 1,832 | 73,623 | 59,161 |
Shares redeemed | (84,588) | (75,948) | (2,252,505) | (2,353,550) |
Net increase (decrease) | (41,539) | 1,840 | $ (1,100,396) | $ 96,514 |
Annual Report
10. Share Transactions - continued
| Shares | Dollars |
Years ended October 31, | 2012 | 2011 | 2012 | 2011 |
Class B | | | | |
Shares sold | 4,773 | 8,058 | $ 131,481 | $ 255,784 |
Reinvestment of distributions | 760 | 239 | 19,651 | 7,684 |
Shares redeemed | (17,966) | (21,353) | (477,343) | (653,889) |
Net increase (decrease) | (12,433) | (13,056) | $ (326,211) | $ (390,421) |
Class C | | | | |
Shares sold | 39,150 | 88,544 | $ 1,051,097 | $ 2,766,692 |
Reinvestment of distributions | 2,380 | 892 | 61,380 | 28,631 |
Shares redeemed | (75,401) | (85,136) | (1,981,464) | (2,585,147) |
Net increase (decrease) | (33,871) | 4,300 | $ (868,987) | $ 210,176 |
China Region | | | | |
Shares sold | 5,981,804 | 12,355,142 | $ 163,640,090 | $ 393,844,409 |
Reinvestment of distributions | 1,245,751 | 794,988 | 32,563,934 | 25,868,885 |
Shares redeemed | (18,300,659) | (24,993,159) | (493,563,874) | (775,253,396) |
Net increase (decrease) | (11,073,104) | (11,843,029) | $ (297,359,850) | $ (355,540,102) |
Institutional Class | | | | |
Shares sold | 33,539 | 53,728 | $ 913,352 | $ 1,636,945 |
Reinvestment of distributions | 1,708 | 607 | 44,574 | 19,735 |
Shares redeemed | (41,079) | (40,146) | (1,090,028) | (1,247,642) |
Net increase (decrease) | (5,832) | 14,189 | $ (132,102) | $ 409,038 |
11. Other.
The Fund's organizational documents provide former and current trustees and officers with a limited indemnification against liabilities arising in connection with the performance of their duties to the Fund. In the normal course of business, the Fund may also enter into contracts that provide general indemnifications. The Fund's maximum exposure under these arrangements is unknown as this would be dependent on future claims that may be made against the Fund. The risk of material loss from such claims is considered remote.
Annual Report
Fidelity Emerging Asia Fund
Average annual total return reflects the change in the value of an investment, assuming reinvestment of the fund's distributions from dividend income and capital gains (the profits earned upon the sale of securities that have grown in value, if any) and assuming a constant rate of performance each year. The $10,000 table and the fund's returns do not reflect the deduction of taxes that a shareholder would pay on fund distributions or the redemption of fund shares. During periods of reimbursement by Fidelity, a fund's total return will be greater than it would be had the reimbursement not occurred. How a fund did yesterday is no guarantee of how it will do tomorrow.
Average Annual Total Returns
Periods ended October 31, 2012 | Past 1
year | Past 5
years | Past 10
years |
Fidelity Emerging Asia Fund | 6.60% | -7.51% | 14.18% |
Prior to December 1, 2010, the fund operated under certain different investment policies. The fund's historical performance may not represent its current investment policies.
$10,000 Over 10 Years
Let's say hypothetically that $10,000 was invested in Fidelity Emerging Asia Fund on October 31, 2002. The chart shows how the value of your investment would have changed, and also shows how the MSCI AC (All Country) Asia ex Japan Index performed over the same period.
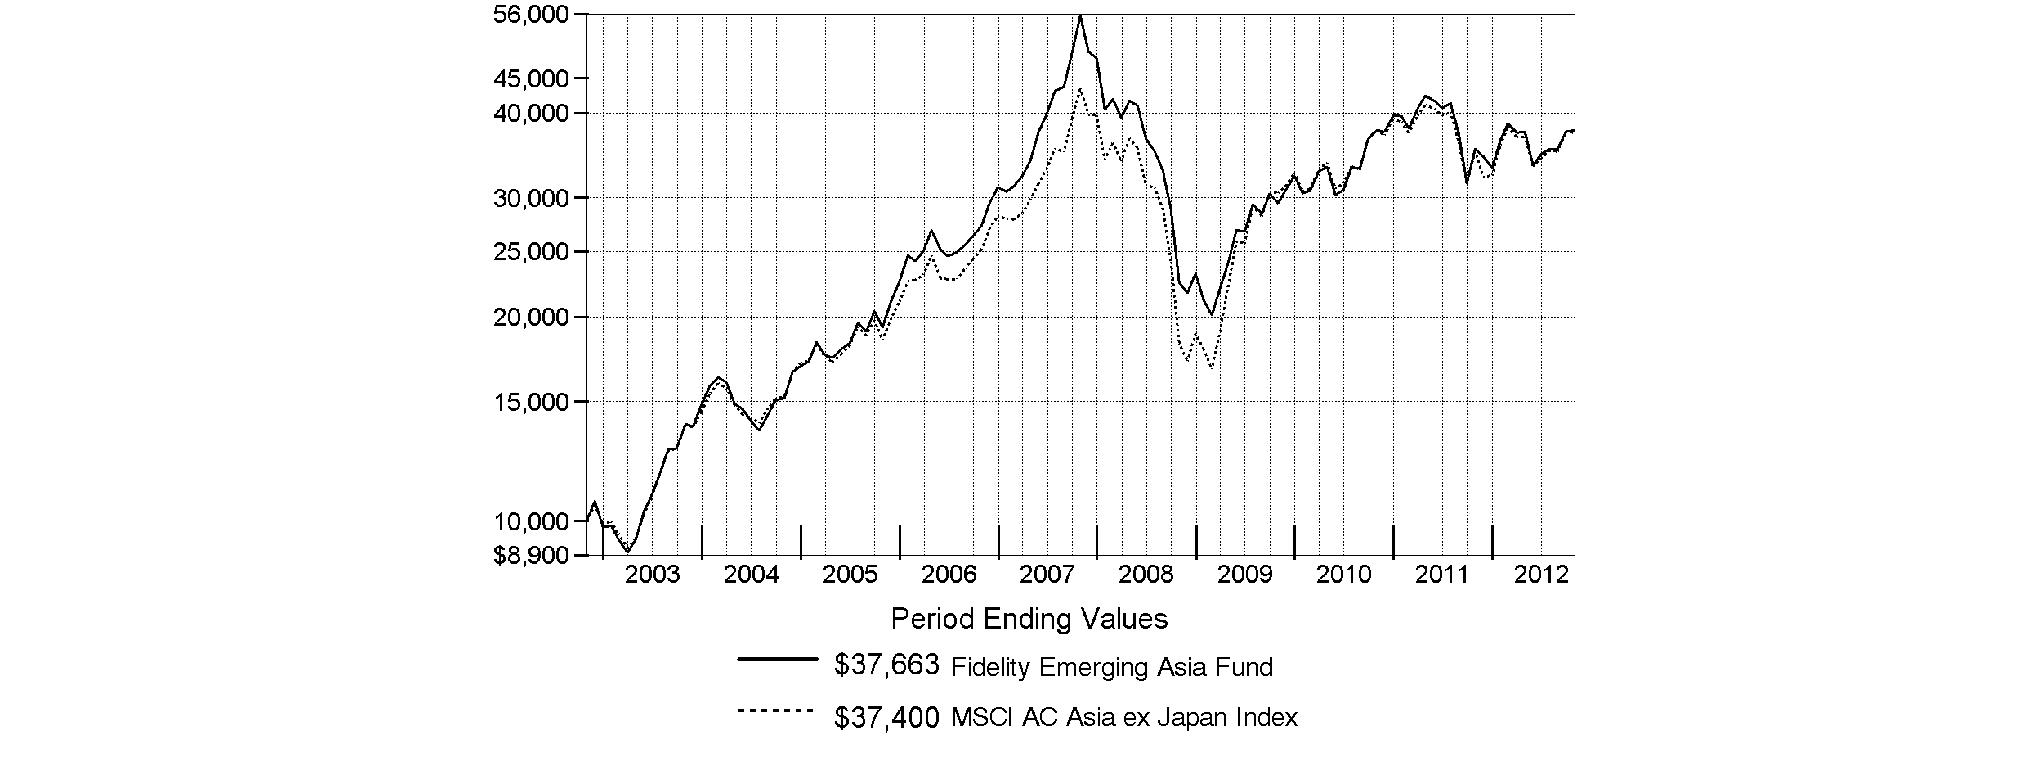
Annual Report
Fidelity Emerging Asia Fund
Market Recap: Returns for most domestic and international equities fluctuated during the 12 months ending October 31, 2012, as investor sentiment towards risk vacillated amid a changing global economic landscape. U.S. stocks overcame bouts of volatility to post strong gains for the past year, extending an uptrend that began in March 2009. The broad-based S&P 500® Index advanced 15.21%, while the blue-chip-laden Dow Jones Industrial AverageSM and technology-heavy Nasdaq Composite® Index rose 12.56% and 12.21%, respectively. Performance outside of the U.S. was relatively weak, as the MSCI® ACWI® (All Country World Index) ex USA Index rose 4.11%, hampered in part by a stronger U.S. dollar. International developed-markets generally struggled during the period as macroeconomic concerns ebbed and flowed, finishing with only a modest gain. The MSCI® EAFE® Index rose 4.76% for the year, largely buttressed in the summertime by pledges of accommodative monetary action from eurozone officials, as well as signs that the U.S. housing market was on the mend. Within the index, Asia-Pacific ex Japan showed the most impressive gain, advancing roughly 10%. A number of core European components, including Germany (+11%) and Switzerland (+10%), and the U.K. (+9%), benefited from optimism about the eurozone's ability to resolve its debt woes, which helped the region outpace the index overall. Elsewhere, Japan was among the few benchmark constituents to finish in the red, returning about -3%. Emerging-markets stocks gained 2.98% for the year, as measured by the MSCI Emerging Markets Index. A general uptrend in the final five months of the period lifted the index into positive territory for the full 12 months.
Comments from Colin Chickles, Portfolio Manager of Fidelity® Emerging Asia Fund: For the year, the fund returned 6.60%, compared with 6.50% for the MSCI® AC (All Country) Asia ex Japan Index. Versus the index, performance was especially helped by stock picking and an underweighting in Taiwan, security selection in Indonesia, and an overweighting in the strong-performing Thai market. Not owning Taiwan-based smartphone maker HTC and Indian IT services provider Infosys, two weak-performing benchmark components, paid off. An overweighting in benchmark heavyweight Samsung Electronics also contributed to relative performance and was the fund's top absolute contributor, as well as its largest position during the period. The company emerged as Apple's major competitor in the smartphone space. Conversely, positioning in Hong Kong, South Korea and China weighed on performance. At the stock level, Korean automaker Kia Motors was the biggest relative detractor. The company's third-quarter earnings fell short of forecasts, due in part to a nine-week strike that hampered production. Other detractors included Banpu, a Thailand-based thermal coal producer, and not owning strong-performing Chinese Internet stock Tencent Holdings until September.
The views expressed above reflect those of the portfolio manager(s) only through the end of the period as stated on the cover of this report and do not necessarily represent the views of Fidelity or any other person in the Fidelity organization. Any such views are subject to change at any time based upon market or other conditions and Fidelity disclaims any responsibility to update such views. These views may not be relied on as investment advice and, because investment decisions for a Fidelity fund are based on numerous factors, may not be relied on as an indication of trading intent on behalf of any Fidelity fund.
Annual Report
Fidelity Emerging Asia Fund
As a shareholder of the Fund, you incur two types of costs: (1) transaction costs, including redemption fees and (2) ongoing costs, including management fees and other Fund expenses. This Example is intended to help you understand your ongoing costs (in dollars) of investing in the Fund and to compare these costs with the ongoing costs of investing in other mutual funds.
The Example is based on an investment of $1,000 invested at the beginning of the period and held for the entire period (May 1, 2012 to October 31, 2012).
Actual Expenses
The first line of the accompanying table for each class of the Fund provides information about actual account values and actual expenses. You may use the information in this line, together with the amount you invested, to estimate the expenses that you paid over the period. Simply divide your account value by $1,000.00 (for example, an $8,600 account value divided by $1,000.00 = 8.6), then multiply the result by the number in the first line for a class of the Fund under the heading entitled "Expenses Paid During Period" to estimate the expenses you paid on your account during this period. A small balance maintenance fee of $12.00 that is charged once a year may apply for certain accounts with a value of less than $2,000. This fee is not included in the table below. If it was, the estimate of expenses you paid during the period would be higher, and your ending account value lower, by this amount. In addition, the Fund, as a shareholder in the underlying Fidelity Central Funds, will indirectly bear its pro-rata share of the fees and expenses incurred by the underlying Fidelity Central Funds. These fees and expenses are not included in the Fund's annualized expense ratio used to calculate the expense estimate in the table below.
Hypothetical Example for Comparison Purposes
The second line of the accompanying table for each class of the Fund provides information about hypothetical account values and hypothetical expenses based on a Class' actual expense ratio and an assumed rate of return of 5% per year before expenses, which is not the Class' actual return. The hypothetical account values and expenses may not be used to estimate the actual ending account balance or expenses you paid for the period. You may use this information to compare the ongoing costs of investing in the Fund and other funds. To do so, compare this 5% hypothetical example with the 5% hypothetical examples that appear in the shareholder reports of the other funds. A small balance maintenance fee of $12.00 that is charged once a year may apply for certain accounts with a value of less than $2,000. This fee is not included in the table below. If it was, the estimate of expenses you paid during the period would be higher, and your ending account value lower, by this amount. In addition, the Fund, as a shareholder in the underlying Fidelity Central Funds, will indirectly bear its pro-rata share of the fees and expenses incurred by the underlying Fidelity Central Funds. These fees and expenses are not included in the Fund's annualized expense ratio used to calculate the expense estimate in the table below.
Please note that the expenses shown in the table are meant to highlight your ongoing costs only and do not reflect any transaction costs. Therefore, the second line of the table is useful in comparing ongoing costs only, and will not help you determine the relative total costs of owning different funds. In addition, if these transactional costs were included, your costs would have been higher.
| Annualized
Expense Ratio | Beginning
Account Value
May 1, 2012 | Ending
Account Value
October 31, 2012 | Expenses Paid
During Period*
May 1, 2012
to October 31, 2012 |
Actual | 1.05% | $ 1,000.00 | $ 1,005.30 | $ 5.29 |
HypotheticalA | | $ 1,000.00 | $ 1,019.86 | $ 5.33 |
A 5% return per year before expenses
* Expenses are equal to each Class' annualized expense ratio, multiplied by the average account value over the period, multiplied by 184/366 (to reflect the one-half year period).
Annual Report
Fidelity Emerging Asia Fund
Investment Changes (Unaudited)
Geographic Diversification (% of fund's net assets) |
As of October 31, 2012 |
| Korea (South) | 20.9% | |
| Hong Kong | 14.6% | |
| China | 12.1% | |
| India | 11.4% | |
| Taiwan | 9.1% | |
| Thailand | 7.0% | |
| Cayman Islands | 6.8% | |
| Indonesia | 5.2% | |
| Singapore | 3.6% | |
| Other | 9.3% | |

Percentages are based on country or territory of incorporation and are adjusted for the effect of futures contracts, if applicable. |
As of April 30, 2012 |
| Korea (South) | 23.7% | |
| Hong Kong | 16.1% | |
| China | 14.2% | |
| Taiwan | 11.0% | |
| India | 7.9% | |
| Thailand | 6.3% | |
| Indonesia | 5.6% | |
| Singapore | 4.7% | |
| Cayman Islands | 3.5% | |
| Other | 7.0% | |

Percentages are based on country or territory of incorporation and are adjusted for the effect of futures contracts, if applicable. |
Asset Allocation |
| % of fund's
net assets | % of fund's net assets
6 months ago |
Stocks | 98.6 | 99.6 |
Short-Term Investments and Net Other Assets (Liabilities) | 1.4 | 0.4 |
Top Ten Stocks as of October 31, 2012 |
| % of fund's
net assets | % of fund's net assets
6 months ago |
Samsung Electronics Co. Ltd. (Korea (South), Semiconductors & Semiconductor Equipment) | 6.4 | 7.6 |
China Construction Bank Corp. (H Shares) (China, Commercial Banks) | 2.4 | 2.5 |
AIA Group Ltd. (Hong Kong, Insurance) | 2.2 | 1.8 |
Industrial & Commercial Bank of China Ltd. (H Shares) (China, Commercial Banks) | 2.2 | 1.9 |
Tencent Holdings Ltd. (Cayman Islands, Internet Software & Services) | 1.7 | 0.0 |
POSCO (Korea (South), Metals & Mining) | 1.6 | 1.4 |
Hyundai Motor Co. (Korea (South), Automobiles) | 1.5 | 2.0 |
Taiwan Semiconductor Manufacturing Co. Ltd. (Taiwan, Semiconductors & Semiconductor Equipment) | 1.5 | 4.3 |
Hon Hai Precision Industry Co. Ltd. (Foxconn) (Taiwan, Electronic Equipment & Components) | 1.5 | 1.3 |
China Petroleum & Chemical Corp. (H Shares) (China, Oil, Gas & Consumable Fuels) | 1.3 | 2.0 |
| 22.3 | |
Market Sectors as of October 31, 2012 |
| % of fund's
net assets | % of fund's net assets
6 months ago |
Financials | 31.2 | 28.2 |
Information Technology | 19.0 | 21.7 |
Industrials | 8.7 | 9.2 |
Consumer Discretionary | 8.3 | 9.1 |
Telecommunication Services | 7.3 | 7.9 |
Materials | 7.1 | 7.3 |
Consumer Staples | 5.8 | 4.9 |
Energy | 5.6 | 7.4 |
Utilities | 4.0 | 3.0 |
Health Care | 1.6 | 0.9 |
Annual Report
Fidelity Emerging Asia Fund
Investments October 31, 2012
Showing Percentage of Net Assets
Common Stocks - 98.6% |
| Shares | | Value |
Australia - 0.6% |
Origin Energy Ltd. | 337,235 | | $ 3,976,759 |
Spark Infrastructure Group unit | 2,634,208 | | 4,621,203 |
TOTAL AUSTRALIA | | 8,597,962 |
Bermuda - 1.2% |
BW Offshore Ltd. | 546,500 | | 321,115 |
Cafe de Coral Holdings Ltd. | 478,000 | | 1,415,488 |
Cheung Kong Infrastructure Holdings Ltd. | 954,000 | | 5,588,558 |
Genting Hong Kong Ltd. (a) | 1,921,000 | | 614,720 |
Kunlun Energy Co. Ltd. | 3,058,000 | | 5,681,925 |
Man Wah Holdings Ltd. | 2,042,800 | | 1,257,302 |
Oriental Watch Holdings Ltd. | 5,778,000 | | 1,729,661 |
TOTAL BERMUDA | | 16,608,769 |
Canada - 0.0% |
Turquoise Hill Resources Ltd. (a) | 57,400 | | 448,855 |
Cayman Islands - 6.8% |
7 Days Group Holdings Ltd. ADR (a) | 97,200 | | 1,171,260 |
AirMedia Group, Inc. ADR (a)(d) | 151,875 | | 344,756 |
Anta Sports Products Ltd. | 2,221,000 | | 1,891,420 |
Anton Oilfield Services Group | 2,830,000 | | 854,472 |
Baidu.com, Inc. sponsored ADR (a) | 13,000 | | 1,386,060 |
Chailease Holding Co. Ltd. | 386,000 | | 687,162 |
Changyou.com Ltd. (A Shares) ADR (d) | 81,600 | | 2,027,760 |
China Kanghui Holdings sponsored ADR (a) | 26,100 | | 798,660 |
China Lodging Group Ltd. ADR (a) | 79,300 | | 1,349,686 |
China Medical System Holdings Ltd. | 2,411,000 | | 1,390,594 |
China Metal Recycling (Holdings) Ltd. | 1,071,600 | | 1,071,593 |
China Shineway Pharmaceutical Group Ltd. | 1,565,000 | | 2,503,984 |
Chu Kong Petroleum & Natural Gas Steel Pipe Holdings Ltd. | 1,606,000 | | 652,757 |
Coastal Energy Co. (a) | 28,600 | | 537,494 |
ENN Energy Holdings Ltd. | 678,000 | | 2,821,337 |
Ginko International Co. Ltd. | 54,000 | | 662,752 |
Gourmet Master Co. Ltd. | 87,150 | | 617,598 |
HiSoft Technology International Ltd. ADR (a) | 46,700 | | 485,213 |
Hopefluent Group Holdings Ltd. | 2,108,000 | | 606,556 |
Ju Teng International Holdings Ltd. | 5,180,000 | | 2,071,987 |
Kingsoft Corp. Ltd. | 2,125,000 | | 1,233,863 |
KWG Property Holding Ltd. | 5,847,500 | | 3,485,842 |
Lee & Man Paper Manufacturing Ltd. | 7,427,000 | | 3,900,348 |
Longfor Properties Co. Ltd. | 3,826,500 | | 6,754,346 |
Melco PBL Entertainment (Macau) Ltd. sponsored ADR (a)(d) | 172,300 | | 2,500,073 |
Mindray Medical International Ltd. sponsored ADR | 18,300 | | 622,383 |
O-Net Communications Group Ltd. | 2,756,000 | | 729,002 |
Samson Holding Ltd. | 15,355,000 | | 2,199,218 |
Sands China Ltd. | 1,774,800 | | 6,675,495 |
SOHO China Ltd. | 3,003,000 | | 2,042,027 |
|
| Shares | | Value |
SouFun Holdings Ltd. ADR (d) | 141,700 | | $ 2,560,519 |
Tencent Holdings Ltd. | 627,600 | | 22,188,554 |
Tiangong International Co. Ltd. | 3,066,000 | | 739,791 |
Vinda International Holdings Ltd. | 299,000 | | 417,440 |
VST Holdings Ltd. | 3,510,000 | | 615,944 |
Wynn Macau Ltd. | 1,495,600 | | 4,235,898 |
Xueda Education Group sponsored ADR (a) | 345,700 | | 995,616 |
Yingde Gases Group Co. Ltd. | 1,411,500 | | 1,338,640 |
Youyuan International Holdings Ltd. | 7,891,000 | | 1,934,555 |
Zhen Ding Technology Holding Ltd. | 191,000 | | 504,800 |
TOTAL CAYMAN ISLANDS | | 89,607,455 |
China - 12.1% |
Air China Ltd. (H Shares) | 14,522,000 | | 10,305,869 |
Changsha Zoomlion Heavy Industry Science & Technology Development Co. Ltd. (H Shares) | 1,352,400 | | 1,821,802 |
China Communications Construction Co. Ltd. (H Shares) | 9,304,000 | | 8,727,696 |
China Communications Services Corp. Ltd. (H Shares) | 14,168,000 | | 7,988,872 |
China Construction Bank Corp. (H Shares) | 42,369,000 | | 31,926,886 |
China Longyuan Power Grid Corp. Ltd. (H Shares) | 2,857,000 | | 1,861,646 |
China Petroleum & Chemical Corp. (H Shares) | 16,632,000 | | 17,528,084 |
China Railway Construction Corp. Ltd. (H Shares) | 10,151,500 | | 10,085,941 |
China Railway Group Ltd. (H Shares) | 7,340,000 | | 3,741,008 |
China Southern Airlines Ltd. (H Shares) | 9,858,000 | | 4,668,210 |
China Suntien Green Energy Corp. Ltd. (H Shares) | 9,341,000 | | 1,904,346 |
Chongqing Machinery & Electric Co. Ltd. (H Shares) | 6,312,000 | | 961,047 |
CITIC Securities Co. Ltd. (H Shares) | 1,226,000 | | 2,300,119 |
Great Wall Motor Co. Ltd. (H Shares) | 1,419,500 | | 3,901,310 |
Guangshen Railway Co. Ltd. (H Shares) | 4,880,000 | | 1,681,228 |
Guangzhou R&F Properties Co. Ltd. (H Shares) | 1,700,800 | | 2,091,422 |
Harbin Power Equipment Co. Ltd. (H Shares) | 7,968,000 | | 6,590,265 |
Huaneng Renewables Corp. Ltd. (H Shares) (a) | 7,348,000 | | 929,160 |
Industrial & Commercial Bank of China Ltd. (H Shares) | 44,138,000 | | 29,216,320 |
Ping An Insurance Group Co. China Ltd. (H Shares) | 1,593,500 | | 12,624,551 |
TOTAL CHINA | | 160,855,782 |
Hong Kong - 14.6% |
AIA Group Ltd. | 7,451,400 | | 29,516,968 |
Beijing Enterprises Holdings Ltd. | 459,500 | | 2,967,462 |
BOC Hong Kong (Holdings) Ltd. | 4,997,500 | | 15,379,304 |
Cheung Kong Holdings Ltd. | 1,158,000 | | 17,108,406 |
China Everbright International | 3,485,000 | | 1,794,201 |
Common Stocks - continued |
| Shares | | Value |
Hong Kong - continued |
China Everbright Ltd. | 1,048,000 | | $ 1,525,337 |
China Mobile Ltd. | 1,545,000 | | 17,136,749 |
China Power International Development Ltd. | 8,587,000 | | 2,337,865 |
China Resources Power Holdings Co. Ltd. | 2,122,000 | | 4,545,158 |
CITIC Pacific Ltd. | 6,245,000 | | 7,961,316 |
City Telecom (HK) Ltd. (CTI) | 5,820,000 | | 1,334,698 |
CNOOC Ltd. | 4,700,000 | | 9,672,491 |
Galaxy Entertainment Group Ltd. (a) | 1,463,000 | | 5,030,800 |
HKT Trust / HKT Ltd. unit | 8,536,826 | | 7,919,920 |
Hysan Development Co. Ltd. | 1,231,000 | | 5,440,191 |
Lenovo Group Ltd. | 7,678,000 | | 6,172,081 |
Magnificent Estates Ltd. | 6,280,000 | | 303,869 |
New World Development Co. Ltd. | 5,980,206 | | 9,244,181 |
PCCW Ltd. | 30,520,000 | | 12,326,062 |
Power Assets Holdings Ltd. | 1,845,000 | | 15,688,350 |
Singamas Container Holdings Ltd. | 3,306,000 | | 836,093 |
Sun Hung Kai Properties Ltd. | 1,095,000 | | 15,245,128 |
Vitasoy International Holdings Ltd. | 1,546,000 | | 1,468,192 |
Wing Hang Bank Ltd. | 196,500 | | 2,084,154 |
TOTAL HONG KONG | | 193,038,976 |
India - 11.4% |
Aditya Birla Nuvo Ltd. | 144,331 | | 2,437,975 |
Apollo Tyres Ltd. (a) | 1,705,002 | | 2,718,877 |
Axis Bank Ltd. | 300,977 | | 6,615,285 |
Bajaj Auto Ltd. | 78,385 | | 2,646,268 |
Britannia Industries Ltd. (a) | 60,530 | | 544,101 |
Cairn India Ltd. | 432,799 | | 2,706,753 |
Cox & Kings India Ltd. | 272,710 | | 695,397 |
Dena Bank | 1,152,618 | | 2,276,102 |
Dish TV India Ltd. (a) | 720,138 | | 1,009,170 |
Gateway Distriparks Ltd. | 711,052 | | 1,890,456 |
Godrej Consumer Products Ltd. | 124,401 | | 1,667,928 |
Grasim Industries Ltd. | 188,398 | | 12,255,882 |
Hathway Cable & Datacom Ltd. (a) | 541,559 | | 2,359,790 |
HCL Infosystems Ltd. | 1,248,955 | | 986,536 |
Hindalco Industries Ltd. | 3,232,705 | | 7,002,542 |
Hindustan Unilever Ltd. | 1,043,982 | | 10,605,716 |
Housing Development Finance Corp. Ltd. | 986,440 | | 13,976,629 |
ICICI Bank Ltd. | 317,185 | | 6,171,672 |
IDBI Bank Ltd. | 773,872 | | 1,334,733 |
INFO Edge India Ltd. | 35,689 | | 232,421 |
Infotech Enterprises Ltd. | 332,382 | | 1,161,067 |
Ipca Laboratories Ltd. | 157,851 | | 1,346,890 |
ITC Ltd. | 1,516,701 | | 7,964,759 |
Jubilant Foodworks Ltd. (a) | 38,001 | | 892,022 |
Mahindra & Mahindra Financial Services Ltd. | 178,588 | | 2,876,560 |
Manappuram General Finance & Leasing Ltd. | 1,235,432 | | 846,123 |
|
| Shares | | Value |
Maruti Suzuki India Ltd. | 136,188 | | $ 3,639,526 |
McLeod Russel India Ltd. (a) | 326,072 | | 1,833,833 |
MindTree Consulting Ltd. | 86,420 | | 1,058,868 |
Muthoot Finance Ltd. (a) | 484,741 | | 1,669,859 |
NIIT Technologies Ltd. | 308,873 | | 1,689,459 |
NTPC Ltd. | 1,053,859 | | 3,238,650 |
Opto Circuits India Ltd. | 420,145 | | 938,211 |
Petronet LNG Ltd. | 1,529,759 | | 4,782,185 |
Power Grid Corp. of India Ltd. | 2,623,630 | | 5,558,848 |
Rolta India Ltd. | 1,314,463 | | 1,585,515 |
Shriram City Union Finance Ltd. (a) | 79,229 | | 1,149,818 |
Simplex Infrastructures Ltd. | 126,330 | | 477,920 |
SREI Infrastructure Finance Ltd. | 3,334,960 | | 1,664,226 |
Strides Arcolab Ltd. | 162,583 | | 2,701,860 |
Tata Chemicals Ltd. (a) | 498,327 | | 2,930,872 |
Tata Consultancy Services Ltd. | 347,941 | | 8,506,949 |
Tata Steel Ltd. | 1,085,009 | | 7,908,940 |
Tech Mahindra Ltd. (a) | 123,023 | | 2,168,593 |
TTK Prestige Ltd. (a) | 11,855 | | 706,331 |
Yes Bank Ltd. | 270,809 | | 2,071,647 |
Zydus Wellness Ltd. | 30,317 | | 247,134 |
TOTAL INDIA | | 151,750,898 |
Indonesia - 5.2% |
PT ACE Hardware Indonesia Tbk | 1,773,500 | | 1,292,498 |
PT Bank Bukopin Tbk | 30,934,000 | | 2,061,184 |
PT Bank Central Asia Tbk | 8,816,000 | | 7,526,381 |
PT Bank Rakyat Indonesia Tbk | 20,931,000 | | 16,125,845 |
PT BISI International Tbk | 6,945,000 | | 773,672 |
PT Ciputra Development Tbk | 17,100,500 | | 1,210,650 |
PT Global Mediacom Tbk | 21,033,500 | | 4,981,885 |
PT Kalbe Farma Tbk | 36,202,500 | | 3,656,041 |
PT Media Nusantara Citra Tbk | 2,771,000 | | 814,997 |
PT Pembangunan Perumahan Persero Tbk | 27,536,500 | | 2,207,498 |
PT Telkomunikasi Indonesia Tbk Series B | 15,118,000 | | 15,354,673 |
PT Tempo Scan Pacific Tbk | 4,818,500 | | 1,617,865 |
PT Unilever Indonesia Tbk | 3,008,000 | | 8,158,050 |
PT XL Axiata Tbk | 3,814,000 | | 2,720,020 |
TOTAL INDONESIA | | 68,501,259 |
Japan - 0.1% |
Suzuki Motor Corp. | 59,300 | | 1,343,034 |
Korea (South) - 20.9% |
AMOREPACIFIC Corp. | 2,676 | | 3,043,364 |
BS Financial Group, Inc. | 761,040 | | 8,620,263 |
Chong Kun Dang Pharmaceutical Corp. | 92,340 | | 2,938,769 |
CJ CheilJedang Corp. | 9,712 | | 3,050,811 |
CJ Corp. | 56,648 | | 5,533,249 |
DGB Financial Group Co. Ltd. | 604,730 | | 7,653,968 |
Dongbu Insurance Co. Ltd. | 40,760 | | 1,848,615 |
Hana Financial Group, Inc. | 305,950 | | 8,909,231 |
Hanjin Shipping Co. Ltd. (a) | 243,500 | | 2,713,447 |
Hotel Shilla Co. | 90,450 | | 3,816,036 |
Hyundai Hysco Co. Ltd. | 111,840 | | 4,472,287 |
Common Stocks - continued |
| Shares | | Value |
Korea (South) - continued |
Hyundai Merchant Marine Co. Ltd. (a) | 30,740 | | $ 740,081 |
Hyundai Motor Co. | 98,745 | | 20,331,879 |
Hyundai Steel Co. | 60,621 | | 4,364,543 |
Hyundai Wia Corp. | 28,562 | | 4,623,591 |
ICD Co. Ltd. | 111,899 | | 1,364,972 |
Industrial Bank of Korea | 378,810 | | 4,169,162 |
Jcontentree Corp. (a) | 579,339 | | 2,165,242 |
KCC Corp. | 5,567 | | 1,562,387 |
Kia Motors Corp. | 224,397 | | 12,471,989 |
Korea Zinc Co. Ltd. | 8,538 | | 3,508,167 |
LG International Corp. | 133,619 | | 4,852,991 |
LG Telecom Ltd. | 296,180 | | 1,893,366 |
LIG Non-Life Insurance Co. Ltd. | 43,060 | | 1,097,905 |
Lotte Samkang Co. Ltd. | 12,393 | | 8,308,830 |
Nong Shim Co. Ltd. | 13,593 | | 3,216,482 |
Osstem Implant Co. Ltd. (a) | 52,473 | | 1,520,789 |
Paradise Co. Ltd. | 35,062 | | 586,875 |
POSCO | 67,863 | | 21,338,524 |
Samsung Electronics Co. Ltd. | 70,359 | | 84,535,084 |
Samsung Fire & Marine Insurance Co. Ltd. | 41,508 | | 9,079,590 |
Samsung Heavy Industries Ltd. | 316,600 | | 9,683,956 |
SBS Contents Hub Co. Ltd. | 48,411 | | 725,952 |
SK Chemicals Co. Ltd. | 31,198 | | 1,922,835 |
SK Energy Co. Ltd. | 51,735 | | 7,615,625 |
SK Holdings Co. Ltd. | 54,679 | | 7,622,724 |
Soulbrain Co. Ltd. | 64,933 | | 2,614,424 |
Sungwoo Hitech Co. Ltd. | 305,435 | | 2,969,414 |
TOTAL KOREA (SOUTH) | | 277,487,419 |
Malaysia - 2.2% |
Bumiputra-Commerce Holdings Bhd | 3,949,300 | | 9,892,698 |
Glomac Bhd | 4,091,300 | | 1,134,980 |
Hong Leong Bank Bhd | 388,000 | | 1,869,941 |
Lafarge Malayan Cement Bhd | 904,100 | | 2,893,951 |
Malaysian Plantations Bhd | 1,991,300 | | 2,660,732 |
Maxis Bhd | 2,240,300 | | 5,119,005 |
Telekom Malaysia Bhd | 1,906,500 | | 3,742,899 |
TIME dotCom Bhd (a) | 1,149,500 | | 1,320,831 |
TOTAL MALAYSIA | | 28,635,037 |
Papua New Guinea - 0.0% |
Oil Search Ltd. ADR | 79,618 | | 614,897 |
Philippines - 1.2% |
Cebu Air, Inc. | 996,000 | | 1,386,161 |
Manila Water Co., Inc. | 8,153,200 | | 5,752,866 |
PUREGOLD Price Club, Inc. | 3,706,700 | | 2,701,111 |
Security Bank Corp. | 1,018,660 | | 4,012,678 |
Universal Robina Corp. | 975,000 | | 1,705,657 |
TOTAL PHILIPPINES | | 15,558,473 |
Singapore - 3.6% |
Ascendas Real Estate Investment Trust | 3,529,000 | | 6,827,709 |
|
| Shares | | Value |
Avago Technologies Ltd. | 156,100 | | $ 5,155,983 |
First Resources Ltd. | 1,846,000 | | 3,102,394 |
Global Logistic Properties Ltd. | 2,251,000 | | 4,742,638 |
Hutchison Port Holdings Trust | 4,654,000 | | 3,630,120 |
Mapletree Industrial (REIT) | 3,746,000 | | 4,299,393 |
Mapletree Logistics Trust (REIT) | 7,182,000 | | 6,535,514 |
Petra Foods Ltd. | 349,000 | | 749,615 |
StarHub Ltd. | 1,045,000 | | 3,152,648 |
UOL Group Ltd. | 1,588,000 | | 7,368,487 |
Yanlord Land Group Ltd. (a) | 1,528,000 | | 1,578,357 |
TOTAL SINGAPORE | | 47,142,858 |
Taiwan - 9.1% |
ASUSTeK Computer, Inc. | 936,000 | | 10,029,716 |
Chicony Electronics Co. Ltd. | 4,055,085 | | 8,898,697 |
Chinatrust Financial Holding Co. Ltd. | 16,316,736 | | 8,993,477 |
Chipbond Technology Corp. | 1,780,000 | | 3,016,433 |
ECLAT Textile Co. Ltd. | 52,000 | | 153,810 |
Far EasTone Telecommunications Co. Ltd. | 2,449,000 | | 5,650,894 |
FLEXium Interconnect, Inc. | 109,095 | | 444,447 |
Hon Hai Precision Industry Co. Ltd. (Foxconn) | 6,391,770 | | 19,409,449 |
Insyde Software Corp. | 526,928 | | 1,554,988 |
MediaTek, Inc. | 1,022,000 | | 11,353,612 |
Merida Industry Co. Ltd. | 160,000 | | 613,489 |
Novatek Microelectronics Corp. | 686,000 | | 2,583,362 |
Quanta Computer, Inc. | 2,135,000 | | 4,882,506 |
Radiant Opto-Electronics Corp. | 1,396,910 | | 5,810,495 |
Taiwan Semiconductor Manufacturing Co. Ltd. | 6,533,192 | | 19,908,730 |
Unified-President Enterprises Corp. | 5,177,030 | | 9,145,318 |
Wistron Corp. | 3,974,628 | | 3,816,786 |
Wowprime Corp. | 50,000 | | 701,814 |
Yang Ming Marine Transport Corp. | 8,016,000 | | 3,128,463 |
TOTAL TAIWAN | | 120,096,486 |
Thailand - 7.0% |
Advanced Info Service PCL (For. Reg.) | 1,204,800 | | 7,758,331 |
Bangchak Petroleum PCL (For. Reg.) | 1,184,500 | | 1,013,796 |
Bangkok Bank Public Co. Ltd. NVDR | 1,820,700 | | 10,507,463 |
Bangkok Expressway PCL (For.Reg.) | 1,500,100 | | 1,357,280 |
Banpu PCL: | | | |
(For. Reg.) | 14,300 | | 182,771 |
NVDR unit | 321,200 | | 4,105,328 |
Charoen Pokphand Foods PCL (For. Reg.) | 3,902,100 | | 4,484,807 |
Home Product Center PCL (For. Reg.) | 1,428,840 | | 531,098 |
LPN Development PCL unit | 7,334,400 | | 4,328,420 |
Preuksa Real Estate PCL (For. Reg.) | 3,560,400 | | 2,275,313 |
PTT Global Chemical PCL (For. Reg.) | 2,592,838 | | 5,156,933 |
PTT PCL (For. Reg.) | 1,401,600 | | 14,532,403 |
Robinsons Department Store PCL (For. Reg.) | 338,200 | | 669,894 |
Siam Commercial Bank PCL (For. Reg.) | 2,697,800 | | 14,161,911 |
Siam Makro PCL (For. Reg.) | 243,700 | | 3,655,103 |
Common Stocks - continued |
| Shares | | Value |
Thailand - continued |
Sino Thai Engineering & Construction PCL (For. Reg.) | 3,533,800 | | $ 2,465,710 |
Supalai PCL NVDR | 1,944,500 | | 1,217,294 |
Thai Tap Water Supply PCL | 5,834,000 | | 1,502,726 |
Thai Union Frozen Products PCL: | | | |
(For. Reg.) | 1,938,240 | | 4,550,156 |
NVDR | 537,040 | | 1,260,740 |
Thanachart Capital PCL (For. Reg.) | 2,122,700 | | 2,560,805 |
Total Access Communication PCL unit | 1,228,400 | | 3,474,526 |
Toyo-Thai Corp. PCL NVDR | 823,400 | | 731,583 |
TOTAL THAILAND | | 92,484,391 |
United Kingdom - 0.9% |
HSBC Holdings PLC (Hong Kong) | 382,289 | | 3,767,118 |
Standard Chartered PLC (Hong Kong) | 252,256 | | 6,028,066 |
Vedanta Resources PLC | 97,500 | | 1,784,243 |
TOTAL UNITED KINGDOM | | 11,579,427 |
United States of America - 1.7% |
China Natural Gas, Inc. (a)(d) | 84,700 | | 63,525 |
Citigroup, Inc. | 148,600 | | 5,556,154 |
Cognizant Technology Solutions Corp. Class A (a) | 121,400 | | 8,091,310 |
Freeport-McMoRan Copper & Gold, Inc. | 181,300 | | 7,048,944 |
Las Vegas Sands Corp. | 28,600 | | 1,328,184 |
Yum! Brands, Inc. | 6,000 | | 420,660 |
TOTAL UNITED STATES OF AMERICA | | 22,508,777 |
TOTAL COMMON STOCKS (Cost $1,242,533,145) |
1,306,860,755
|
Money Market Funds - 1.6% |
| Shares | | Value |
Fidelity Cash Central Fund, 0.19% (b) | 19,523,448 | | $ 19,523,448 |
Fidelity Securities Lending Cash Central Fund, 0.19% (b)(c) | 1,683,134 | | 1,683,134 |
TOTAL MONEY MARKET FUNDS (Cost $21,206,582) |
21,206,582
|
TOTAL INVESTMENT PORTFOLIO - 100.2% (Cost $1,263,739,727) | | 1,328,067,337 |
NET OTHER ASSETS (LIABILITIES) - (0.2)% | | (2,859,058) |
NET ASSETS - 100% | $ 1,325,208,279 |
Legend |
(a) Non-income producing |
(b) Affiliated fund that is available only to investment companies and other accounts managed by Fidelity Investments. The rate quoted is the annualized seven-day yield of the fund at period end. A complete unaudited listing of the fund's holdings as of its most recent quarter end is available upon request. In addition, each Fidelity Central Fund's financial statements, which are not covered by the Fund's Report of Independent Registered Public Accounting Firm, are available on the SEC's website or upon request. |
(c) Includes cash collateral received from securities on loan. |
(d) Security or a portion of the security is on loan at period end. |
Affiliated Central Funds |
Information regarding fiscal year to date income earned by the Fund from investments in Fidelity Central Funds is as follows: |
Fund | Income earned |
Fidelity Cash Central Fund | $ 22,150 |
Fidelity Securities Lending Cash Central Fund | 361,813 |
Total | $ 383,963 |
Other Information |
Categorizations in the Schedule of Investments are based on country or territory of incorporation. |
The following is a summary of the inputs used, as of October 31, 2012, involving the Fund's assets and liabilities carried at fair value. The inputs or methodology used for valuing securities may not be an indication of the risk associated with investing in those securities. For more information on valuation inputs, and their aggregation into the levels used in the tables below, please refer to the Security Valuation section in the accompanying Notes to Financial Statements. |
Valuation Inputs at Reporting Date: |
Description | Total | Level 1 | Level 2 | Level 3 |
Investments in Securities: | | | | |
Equities: | | | | |
Consumer Discretionary | $ 110,717,940 | $ 110,717,940 | $ - | $ - |
Consumer Staples | 82,655,213 | 82,655,213 | - | - |
Energy | 76,683,201 | 49,482,626 | 27,200,575 | - |
Financials | 406,553,496 | 396,614,706 | 9,938,790 | - |
Health Care | 20,698,798 | 20,698,798 | - | - |
Industrials | 114,564,139 | 114,564,139 | - | - |
Information Technology | 248,947,713 | 229,038,983 | 19,908,730 | - |
Materials | 94,636,869 | 61,042,463 | 33,594,406 | - |
Telecommunication Services | 96,893,494 | 63,067,374 | 33,826,120 | - |
Utilities | 54,509,892 | 54,509,892 | - | - |
Money Market Funds | 21,206,582 | 21,206,582 | - | - |
Total Investments in Securities: | $ 1,328,067,337 | $ 1,203,598,716 | $ 124,468,621 | $ - |
The following is a summary of transfers between Level 1 and Level 2 for the period ended October 31, 2012. Transfers are assumed to have occurred at the beginning of the period, and are primarily attributable to the valuation techniques used for foreign equity securities, as discussed in the accompanying Notes to Financial Statements: |
Transfers | Total |
Level 1 to Level 2 | $ 0 |
Level 2 to Level 1 | $ 669,874,650 |
See accompanying notes which are an integral part of the financial statements.
Annual Report
Fidelity Emerging Asia Fund
Statement of Assets and Liabilities
| October 31, 2012 |
| | |
Assets | | |
Investment in securities, at value (including securities loaned of $1,656,566) - See accompanying schedule: Unaffiliated issuers (cost $1,242,533,145) | $ 1,306,860,755 | |
Fidelity Central Funds (cost $21,206,582) | 21,206,582 | |
Total Investments (cost $1,263,739,727) | | $ 1,328,067,337 |
Foreign currency held at value (cost $45,861) | | 45,861 |
Receivable for investments sold | | 11,871,957 |
Receivable for fund shares sold | | 1,712,014 |
Dividends receivable | | 573,873 |
Distributions receivable from Fidelity Central Funds | | 5,166 |
Other receivables | | 703,407 |
Total assets | | 1,342,979,615 |
| | |
Liabilities | | |
Payable for investments purchased | $ 11,652,713 | |
Payable for fund shares redeemed | 2,622,582 | |
Accrued management fee | 941,781 | |
Other affiliated payables | 297,793 | |
Other payables and accrued expenses | 573,333 | |
Collateral on securities loaned, at value | 1,683,134 | |
Total liabilities | | 17,771,336 |
| | |
Net Assets | | $ 1,325,208,279 |
Net Assets consist of: | | |
Paid in capital | | $ 1,523,385,416 |
Undistributed net investment income | | 19,737,880 |
Accumulated undistributed net realized gain (loss) on investments and foreign currency transactions | | (281,847,197) |
Net unrealized appreciation (depreciation) on investments and assets and liabilities in foreign currencies | | 63,932,180 |
Net Assets, for 46,380,801 shares outstanding | | $ 1,325,208,279 |
Net Asset Value, offering price and redemption price per share ($1,325,208,279 ÷ 46,380,801 shares) | | $ 28.57 |
Statement of Operations
| Year ended October 31, 2012 |
| | |
Investment Income | | |
Dividends | | $ 39,387,497 |
Interest | | 16 |
Income from Fidelity Central Funds | | 383,963 |
Income before foreign taxes withheld | | 39,771,476 |
Less foreign taxes withheld | | (3,606,436) |
Total income | | 36,165,040 |
| | |
Expenses | | |
Management fee Basic fee | $ 9,884,490 | |
Performance adjustment | (1,552,044) | |
Transfer agent fees | 3,220,263 | |
Accounting and security lending fees | 631,708 | |
Custodian fees and expenses | 780,131 | |
Independent trustees' compensation | 9,365 | |
Registration fees | 32,100 | |
Audit | 97,238 | |
Legal | 7,412 | |
Interest | 2,593 | |
Miscellaneous | 17,033 | |
Total expenses before reductions | 13,130,289 | |
Expense reductions | (434,830) | 12,695,459 |
Net investment income (loss) | | 23,469,581 |
Realized and Unrealized Gain (Loss) Net realized gain (loss) on: | | |
Investment securities: | | |
Unaffiliated issuers | (11,879,084) | |
Foreign currency transactions | (559,956) | |
Total net realized gain (loss) | | (12,439,040) |
Change in net unrealized appreciation (depreciation) on: Investment securities (net of increase in deferred foreign taxes of $299,951) | 71,685,184 | |
Assets and liabilities in foreign currencies | (33,209) | |
Total change in net unrealized appreciation (depreciation) | | 71,651,975 |
Net gain (loss) | | 59,212,935 |
Net increase (decrease) in net assets resulting from operations | | $ 82,682,516 |
See accompanying notes which are an integral part of the financial statements.
Annual Report
Fidelity Emerging Asia Fund
Financial Statements - continued
Statement of Changes in Net Assets
| Year ended
October 31,
2012 | Year ended
October 31,
2011 |
Increase (Decrease) in Net Assets | | |
Operations | | |
Net investment income (loss) | $ 23,469,581 | $ 29,557,978 |
Net realized gain (loss) | (12,439,040) | 145,863,376 |
Change in net unrealized appreciation (depreciation) | 71,651,975 | (283,641,613) |
Net increase (decrease) in net assets resulting from operations | 82,682,516 | (108,220,259) |
Distributions to shareholders from net investment income | (28,292,736) | (28,179,915) |
Distributions to shareholders from net realized gain | - | (6,100,808) |
Total distributions | (28,292,736) | (34,280,723) |
Share transactions | | |
Proceeds from sale of shares | 151,864,540 | 468,544,331 |
Reinvestment of distributions | 26,918,231 | 32,690,177 |
Cost of shares redeemed | (433,734,675) | (551,098,679) |
Net increase (decrease) in net assets resulting from share transactions | (254,951,904) | (49,864,171) |
Redemption fees | 135,187 | 438,078 |
Total increase (decrease) in net assets | (200,426,937) | (191,927,075) |
| | |
Net Assets | | |
Beginning of period | 1,525,635,216 | 1,717,562,291 |
End of period (including undistributed net investment income of $19,737,880 and undistributed net investment income of $24,561,036, respectively) | $ 1,325,208,279 | $ 1,525,635,216 |
Other Information | | |
Shares | | |
Sold | 5,537,329 | 15,394,610 |
Issued in reinvestment of distributions | 1,017,318 | 1,090,764 |
Redeemed | (16,016,403) | (18,480,637) |
Net increase (decrease) | (9,461,756) | (1,995,263) |
Financial Highlights - Emerging Asia
Years ended October 31, | 2012 | 2011 | 2010 | 2009 | 2008 |
Selected Per-Share Data | | | | | |
Net asset value, beginning of period | $ 27.32 | $ 29.70 | $ 23.98 | $ 18.50 | $ 49.39 |
Income from Investment Operations | | | | | |
Net investment income (loss) B | .46 | .50 | .39 | .58 E | .44 |
Net realized and unrealized gain (loss) | 1.30 | (2.30) | 6.16 | 5.09 | (28.21) |
Total from investment operations | 1.76 | (1.80) | 6.55 | 5.67 | (27.77) |
Distributions from net investment income | (.51) | (.49) | (.43) | (.20) | (.28) |
Distributions from net realized gain | - | (.11) | (.40) | - | (2.89) |
Total distributions | (.51) | (.59) H | (.83) | (.20) | (3.17) |
Redemption fees added to paid in capital B | - G | .01 | - G | .01 | .05 |
Net asset value, end of period | $ 28.57 | $ 27.32 | $ 29.70 | $ 23.98 | $ 18.50 |
Total Return A | 6.60% | (6.20)% | 27.93% | 31.08% | (59.64)% |
Ratios to Average Net Assets C, F | | | | | |
Expenses before reductions | .94% | .82% | .78% | 1.14% | 1.18% |
Expenses net of fee waivers, if any | .94% | .82% | .78% | 1.14% | 1.18% |
Expenses net of all reductions | .91% | .78% | .74% | .99% | 1.04% |
Net investment income (loss) | 1.68% | 1.68% | 1.50% | 2.86% E | 1.34% |
Supplemental Data | | | | | |
Net assets, end of period (000 omitted) | $ 1,325,208 | $ 1,525,635 | $ 1,717,562 | $ 1,736,852 | $ 1,605,632 |
Portfolio turnover rate D | 94% | 115% | 105% | 220% | 147% |
A Total returns would have been lower if certain expenses had not been reduced during the applicable periods shown. B Calculated based on average shares outstanding during the period. C Fees and expenses of any underlying Fidelity Central Funds are not included in the Fund's expense ratio. The Fund indirectly bears its proportionate share of the expenses of any underlying Fidelity Central Funds. D Amount does not include the portfolio activity of any underlying Fidelity Central Funds. E Investment income per share reflects a large, non-recurring dividend which amounted to $.16 per share. Excluding this non-recurring dividend, the ratio of net investment income (loss) to average net assets would have been 2.09%. F Expense ratios reflect operating expenses of the class. Expenses before reductions do not reflect amounts reimbursed by the investment adviser or reductions from brokerage service arrangements or reductions from other expense offset arrangements and do not represent the amount paid by the class during periods when reimbursements or reductions occur. Expenses net of fee waivers reflect expenses after reimbursement by the investment adviser but prior to reductions from brokerage service arrangements or other expense offset arrangements. Expenses net of all reductions represent the net expenses paid by the class. G Amount represents less than $.01 per share. H Total distributions of $.59 per share is comprised of distributions from net investment income of $.485 and distributions from net realized gain of $.105 per share. |
See accompanying notes which are an integral part of the financial statements.
Annual Report
Notes to Financial Statements
For the period ended October 31, 2012
1. Organization.
Fidelity Emerging Asia Fund (the Fund) is a fund of Fidelity Investment Trust (the Trust) and is authorized to issue an unlimited number of shares. The Trust is registered under the Investment Company Act of 1940, as amended (the 1940 Act), as an open-end management investment company organized as a Massachusetts business trust. The Fund's investments in emerging markets can be subject to social, economic, regulatory, and political uncertainties and can be extremely volatile.
2. Investments in Fidelity Central Funds.
The Fund invests in Fidelity Central Funds, which are open-end investment companies available only to other investment companies and accounts managed by Fidelity Management & Research Company (FMR) and its affiliates. The Fund's Schedule of Investments lists each of the Fidelity Central Funds held as of period end, as an investment of the Fund, but does not include the underlying holdings of each Fidelity Central Fund. As an Investing Fund, the Fund indirectly bears its proportionate share of the expenses of the underlying Fidelity Central Funds.
The Money Market Central Funds seek preservation of capital and current income and are managed by Fidelity Investments Money Management, Inc. (FIMM), an affiliate of FMR.
A complete unaudited list of holdings for each Fidelity Central Fund is available upon request or at the Securities and Exchange Commission (the SEC) web site at www.sec.gov. In addition, the financial statements of the Fidelity Central Funds, which are not covered by the Fund's Report of Independent Registered Public Accounting Firm, are available on the SEC web site or upon request.
3. Significant Accounting Policies.
The financial statements have been prepared in conformity with accounting principles generally accepted in the United States of America (GAAP), which require management to make certain estimates and assumptions at the date of the financial statements. Actual results could differ from those estimates. Subsequent events, if any, through the date that the financial statements were issued have been evaluated in the preparation of the financial statements. The following summarizes the significant accounting policies of the Fund:
Security Valuation. Investments are valued as of 4:00 p.m. Eastern time on the last calendar day of the period. In accordance with valuation policies and procedures approved by the Board of Trustees (the Board), the Fund attempts to obtain prices from one or more third party pricing vendors or brokers to value its investments. When current market prices, quotations or rates are not readily available or reliable, securities will be fair valued in good faith by the FMR Fair Value Committee (the Committee), in accordance with procedures adopted by the Fund's Board. Factors used in determining fair value vary by security type and may include market or security specific events. The frequency with which these procedures are used cannot be predicted and they may be utilized to a significant extent. The Committee oversees the Fund's valuation policies and procedures and is responsible for approving and reporting to the Board all fair value determinations.
The Fund categorizes the inputs to valuation techniques used to value its investments into a disclosure hierarchy consisting of three levels as shown below:
Level 1 - quoted prices in active markets for identical investments
Level 2 - other significant observable inputs (including quoted prices for similar investments, interest rates, prepayment speeds, etc.)
Level 3 - unobservable inputs (including the Fund's own assumptions based on the best information available)
Valuation techniques used to value the Fund's investments by major category are as follows:
Equity securities, including restricted securities, for which market quotations are readily available, are valued at the last reported sale price or official closing price as reported by a third party pricing vendor on the primary market or exchange on which they are traded and are categorized as Level 1 in the hierarchy. In the event there were no sales during the day or closing prices are not available, securities are valued at the last quoted bid price or may be valued using the last available price and are generally categorized as Level 2 in the hierarchy. For foreign equity securities, when significant market or security specific events arise, comparisons to the valuation of American Depositary Receipts (ADRs), futures contracts, Exchange-Traded Funds (ETFs) and certain indexes as well as quoted prices for similar securities are used and are categorized as Level 2 in the hierarchy. Utilizing these techniques may result in transfers between Level 1 and Level 2.
Investments in open-end mutual funds, including the Fidelity Central Funds, are valued at their closing net asset value (NAV) each business day and are categorized as Level 1 in the hierarchy.
Changes in valuation techniques may result in transfers in or out of an assigned level within the disclosure hierarchy. The aggregate value of investments by input level, as of October 31, 2012, including information on transfers between Levels 1 and 2, is included at the end of the Fund's Schedule of Investments.
Annual Report
3. Significant Accounting Policies - continued
Foreign Currency Translation. The Fund may use foreign currency contracts to facilitate transactions in foreign-denominated securities. Gains and losses from these transactions may arise from changes in the value of the foreign currency or if the counterparties do not perform under the contracts' terms.
Foreign-denominated assets, including investment securities, and liabilities are translated into U.S. dollars at the exchange rates at period end. Purchases and sales of investment securities, income and dividends received and expenses denominated in foreign currencies are translated into U.S. dollars at the exchange rate in effect on the transaction date.
The effects of exchange rate fluctuations on investments are included with the net realized and unrealized gain (loss) on investment securities. Other foreign currency transactions resulting in realized and unrealized gain (loss) are disclosed separately.
Investment Transactions and Income. For financial reporting purposes, the Fund's investment holdings and NAV include trades executed through the end of the last business day of the period. The NAV per share for processing shareholder transactions is calculated as of the close of business of the New York Stock Exchange (NYSE), normally 4:00 p.m. Eastern time and includes trades executed through the end of the prior business day. Gains and losses on securities sold are determined on the basis of identified cost. Dividend income is recorded on the ex-dividend date, except for certain dividends from foreign securities where the ex-dividend date may have passed, which are recorded as soon as the Fund is informed of the ex-dividend date. Non-cash dividends included in dividend income, if any, are recorded at the fair market value of the securities received. Interest income and distributions from the Fidelity Central Funds are accrued as earned. Interest income includes coupon interest and amortization of premium and accretion of discount on debt securities. Investment income is recorded net of foreign taxes withheld where recovery of such taxes is uncertain.
Expenses. Expenses directly attributable to a fund are charged to that fund. Expenses attributable to more than one fund are allocated among the respective funds on the basis of relative net assets or other appropriate methods. Expense estimates are accrued in the period to which they relate and adjustments are made when actual amounts are known.
Income Tax Information and Distributions to Shareholders. Each year, the Fund intends to qualify as a regulated investment company under Subchapter M of the Internal Revenue Code, including distributing substantially all of its taxable income and realized gains. As a result, no provision for income taxes is required. As of October 31, 2012, the Fund did not have any unrecognized tax benefits in the financial statements; nor is the Fund aware of any tax positions for which it is reasonably possible that the total amounts of unrecognized tax benefits will significantly change in the next twelve months. The Fund files a U.S. federal tax return, in addition to state and local tax returns as required. A fund's federal income tax returns are subject to examination by the Internal Revenue Service (IRS) for a period of three fiscal years after they are filed. State and local tax returns may be subject to examination for an additional fiscal year depending on the jurisdiction. Foreign taxes are provided for based on the Fund's understanding of the tax rules and rates that exist in the foreign markets in which it invests. The Fund is subject to a tax imposed on capital gains by certain countries in which it invests. An estimated deferred tax liability for net unrealized appreciation on the applicable securities is included in Other payables and accrued expenses on the Statement of Assets & Liabilities.
The Fund received a final ruling from the Authority for Advance Ruling in India regarding the applicability of taxes imposed by the country on realized capital gains under the US/India tax treaty. The ruling entitled the Fund to a refund of capital gains taxes paid in prior years and exempts the Fund from taxes on future realized gains. The India Central Board of Direct Taxation may challenge the ruling at any time which could result in the reversal of some or all of the benefits recorded by the Fund.
Distributions are declared and recorded on the ex-dividend date. Income dividends and capital gain distributions are declared separately for each class. Income and capital gain distributions are determined in accordance with income tax regulations, which may differ from GAAP.
Capital accounts within the financial statements are adjusted for permanent book-tax differences. These adjustments have no impact on net assets or the results of operations. Temporary book-tax differences will reverse in a subsequent period.
Book-tax differences are primarily due to foreign currency transactions, passive foreign investment companies (PFIC), deferred trustees compensation, capital loss carryforwards and losses due to wash sales.
The federal tax cost of investment securities and unrealized appreciation (depreciation) as of period end were as follows:
Gross unrealized appreciation | $ 138,544,122 |
Gross unrealized depreciation | (80,845,617) |
Net unrealized appreciation (depreciation) on securities and other investments | $ 57,698,505 |
| |
Tax Cost | $ 1,270,368,832 |
Annual Report
Notes to Financial Statements - continued
3. Significant Accounting Policies - continued
Income Tax Information and Distributions to Shareholders - continued
The tax-based components of distributable earnings as of period end were as follows:
Undistributed ordinary income | $ 23,491,146 |
Capital loss carryforward | $ (278,970,970) |
Net unrealized appreciation (depreciation) | $ 57,603,026 |
Capital loss carryforwards are only available to offset future capital gains of the Fund to the extent provided by regulations and may be limited. Under the Regulated Investment Company Modernization Act of 2010 (the Act), the Fund is permitted to carry forward capital losses incurred in taxable years beginning after December 22, 2010 for an unlimited period and such capital losses are required to be used prior to any losses that expire. Capital loss carryforwards were as follows:
Fiscal year of expiration | |
2017 | $ (266,190,956) |
No expiration | |
Short-term | (12,780,014) |
Total capital loss carryforward | $ (278,970,970) |
The tax character of distributions paid was as follows:
| October 31, 2012 | October 31, 2011 |
Ordinary Income | $ 28,292,736 | $ 34,280,723 |
Short-Term Trading (Redemption) Fees. Shares held by investors in the Fund less than 90 days are subject to a redemption fee equal to 1.50% of the net asset value of shares redeemed. All redemption fees, which reduce the proceeds of the shareholder redemption, are retained by the Fund and accounted for as an addition to paid in capital.
New Accounting Pronouncement. In December 2011, the Financial Accounting Standards Board issued Accounting Standard Update No. 2011-11, Disclosures about Offsetting Assets and Liabilities. The update creates new disclosure requirements requiring entities to disclose both gross and net information for derivatives and other financial instruments that are either offset in the Statement of Assets and Liabilities or subject to an enforceable master netting arrangement or similar agreement. The disclosure requirements are effective for annual reporting periods beginning on or after January 1, 2013, and interim periods within those annual periods. Management is currently evaluating the impact of the update's adoption on the Fund's financial statement disclosures.
4. Purchases and Sales of Investments.
Purchases and sales of securities, other than short-term securities, aggregated $1,297,008,882 and $1,557,525,724, respectively.
5. Fees and Other Transactions with Affiliates.
Management Fee. FMR and its affiliates provide the Fund with investment management related services for which the Fund pays a monthly management fee. The management fee is the sum of an individual fund fee rate that is based on an annual rate of .45% of the Fund's average net assets and an annualized group fee rate that averaged .26% during the period. The group fee rate is based upon the average net assets of all the mutual funds advised by FMR. The group fee rate decreases as assets under management increase and increases as assets under management decrease. In addition, the management fee is subject to a performance adjustment (up to a maximum of ± .20% of the Fund's average net assets over a 36 month performance period). The upward or downward adjustment to the management fee is based on the relative investment performance as compared to an appropriate benchmark index. For the period, the total annual management fee rate, including the performance adjustment, was .60% of the Fund's average net assets.
Transfer Agent Fees. Fidelity Investments Institutional Operations Company, Inc. (FIIOC), an affiliate of FMR, is the Fund's transfer, dividend disbursing and shareholder servicing agent. FIIOC receives account fees and asset-based fees that vary according to account size and type of account. FIIOC pays for typesetting, printing and mailing of shareholder reports, except proxy statements. For the period, the transfer agent fees were equivalent to an annual rate of .23% of average net assets.
Annual Report
5. Fees and Other Transactions with Affiliates - continued
Accounting and Security Lending Fees. Fidelity Service Company, Inc. (FSC), an affiliate of FMR, maintains the Fund's accounting records. The accounting fee is based on the level of average net assets for each month. Under a separate contract, FSC administers the security lending program. The security lending fee is based on the number and duration of lending transactions.
Brokerage Commissions. The Fund placed a portion of its portfolio transactions with brokerage firms which are affiliates of the investment adviser. The commissions paid to these affiliated firms were $989 for the period.
Interfund Lending Program. Pursuant to an Exemptive Order issued by the SEC, the Fund, along with other registered investment companies having management contracts with FMR, may participate in an interfund lending program. This program provides an alternative credit facility allowing the funds to borrow from, or lend money to, other participating affiliated funds. At period end, there were no interfund loans outstanding. The Fund's activity in this program during the period for which loans were outstanding was as follows:
Borrower or Lender | Average Loan
Balance | Weighted Average
Interest Rate | Interest
Expense |
Borrower | $ 12,327,200 | .38% | $ 2,593 |
6. Committed Line of Credit.
The Fund participates with other funds managed by FMR or an affiliate in a $4.25 billion credit facility (the "line of credit") to be utilized for temporary or emergency purposes to fund shareholder redemptions or for other short-term liquidity purposes. The Fund has agreed to pay commitment fees on its pro-rata portion of the line of credit, which amounted to $3,898 and is reflected in Miscellaneous expenses on the Statement of Operations. During the period, there were no borrowings on this line of credit.
7. Security Lending.
The Fund lends portfolio securities through a lending agent from time to time in order to earn additional income. For equity securities, a lending agent is used and may loan securities to certain qualified borrowers, including Fidelity Capital Markets (FCM), a broker-dealer affiliated with the Fund. On the settlement date of the loan, the Fund receives collateral (in the form of U.S. Treasury obligations, letters of credit and/or cash) against the loaned securities and maintains collateral in an amount not less than 100% of the market value of the loaned securities during the period of the loan. The market value of the loaned securities is determined at the close of business of the Fund and any additional required collateral is delivered to the Fund on the next business day. If the borrower defaults on its obligation to return the securities loaned because of insolvency or other reasons, a fund could experience delays and costs in recovering the securities loaned or in gaining access to the collateral. Any cash collateral received is invested in the Fidelity Securities Lending Cash Central Fund. The value of loaned securities and cash collateral at period end are disclosed on the Fund's Statement of Assets and Liabilities. At period end, there were no security loans outstanding with FCM. Security lending income represents the income earned on investing cash collateral, less rebates paid to borrowers and any lending agent fees associated with the loan, plus any premium payments received for lending certain types of securities. Security lending income is presented in the Statement of Operations as a component of income from Fidelity Central Funds. Total security lending income during the period amounted to $361,813, including $106 from securities loaned to FCM.
8. Expense Reductions.
Many of the brokers with whom FMR places trades on behalf of the Fund provided services to the Fund in addition to trade execution. These services included payments of certain expenses on behalf of the Fund totaling $434,830 for the period.
9. Other.
The Fund's organizational documents provide former and current trustees and officers with a limited indemnification against liabilities arising in connection with the performance of their duties to the Fund. In the normal course of business, the Fund may also enter into contracts that provide general indemnifications. The Fund's maximum exposure under these arrangements is unknown as this would be dependent on future claims that may be made against the Fund. The risk of material loss from such claims is considered remote.
Annual Report
Fidelity Emerging Markets Fund
Average annual total return reflects the change in the value of an investment, assuming reinvestment of the class' distributions from dividend income and capital gains (the profits earned upon the sale of securities that have grown in value, if any) and assuming a constant rate of performance each year. The $10,000 table and the fund's returns do not reflect the deduction of taxes that a shareholder would pay on fund distributions or the redemption of fund shares. During periods of reimbursement by Fidelity, a fund's total return will be greater than it would be had the reimbursement not occurred. How a fund did yesterday is no guarantee of how it will do tomorrow.
Average Annual Total Returns
Periods ended October 31, 2012 | Past 1
year | Past 5
years | Past 10
years |
Fidelity Emerging Markets Fund | 1.03% | -8.13% | 13.86% |
$10,000 Over 10 Years
Let's say hypothetically that $10,000 was invested in Fidelity Emerging Markets Fund, a class of the fund, on October 31, 2002. The chart shows how the value of your investment would have changed, and also shows how the MSCI Emerging Markets Index performed over the same period.
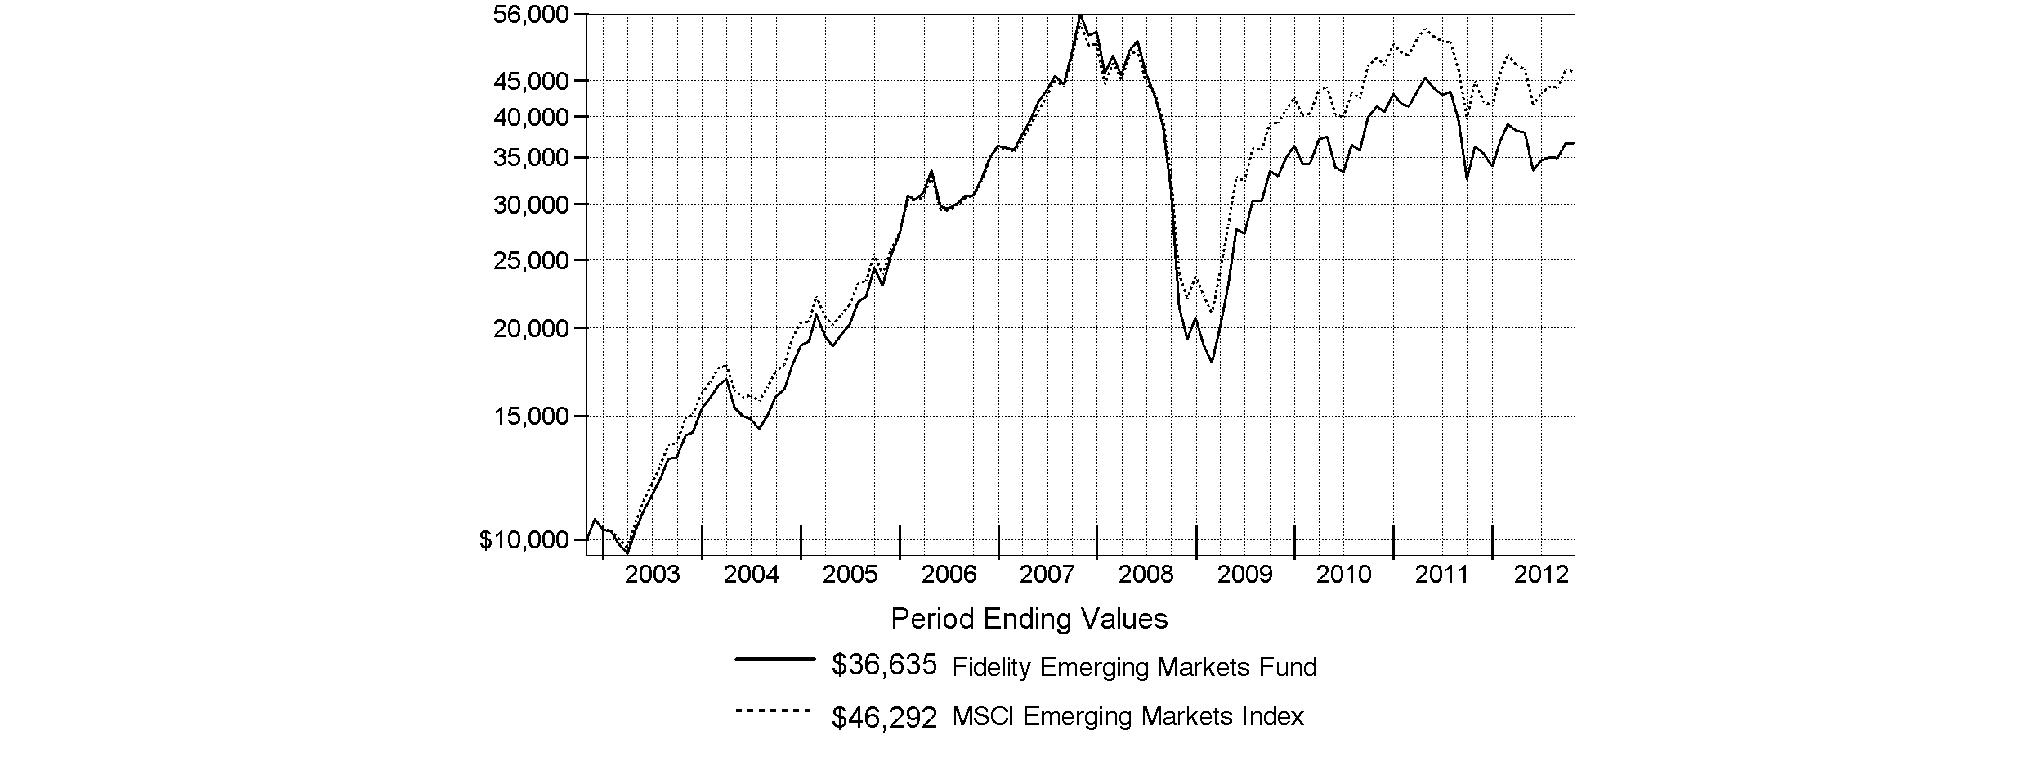
Annual Report
Fidelity Emerging Markets Fund
Market Recap: Emerging-markets stocks gained 2.98% for the year ending October 31, 2012, as measured by the MSCI® Emerging Markets Index. After some early choppiness, the index rallied strongly in the first two months of 2012 but retreated from March through May amid renewed concerns about Europe's sovereign debt crisis and continued economic sluggishness in key countries such as China and Brazil. A general uptrend in the final five months of the period lifted the index into positive territory for the full year, despite the head wind of a generally stronger U.S. dollar. Major benchmark component Brazil was a drag on performance, falling roughly 13%. The nation's inflation rate crept higher while economic growth ebbed, creating an unfavorable backdrop for stocks here. India's market retreated about 5%, while Russia gave up 4%. Conversely, Hong Kong advanced approximately 17%, aided by rebounding shares of property developers, while South Africa added 7%, China rose roughly 5% and South Korea and Taiwan gained about 4% and 1%, respectively. Sentiment about Chinese stocks improved following the government's September approval of massive outlays for infrastructure projects, in hopes of halting that nation's economic slowdown. However, China's ongoing transition to new Communist Party leadership created uncertainty that kept some investors on the sidelines.
Comments from Robert von Rekowsky, Portfolio Manager of Fidelity® Emerging Markets Fund for most of the period: For the year, the fund's Retail Class shares returned 1.03%, lagging the MSCI index. Relative performance was hurt the most by out-of-benchmark exposure to emerging-markets stocks listed in the United States, the United Kingdom and Canada, along with my picks in Taiwan and Hong Kong. Important individual detractors included OGX Petroleo e Gas Participacoes, a Brazilian producer of crude oil and natural gas. Given the company's significant downward revisions in its production and earnings targets, I sold the stock. Similar comments apply to an out-of-index position in Canadian gold-mining stock Eldorado Gold, which I also sold. Further weighing on our results was a non-index stake in China-based Yantai Changyu Pioneer Wine and underweighting the strong-performing shares of Taiwan Semiconductor Manufacturing. Conversely, stock selection in Indonesia helped. An out-of-benchmark stake in Indonesian cellular tower operator Tower Bersama Infrastructure paid off, as did underweighting Brazilian iron ore and nickel producer Vale and a sizable overweighting in Chinese automaker Great Wall Motor, which outperformed.
Note to shareholders: On October 1, 2012, Sammy Simnegar became Portfolio Manager of the fund.
The views expressed above reflect those of the portfolio manager(s) only through the end of the period as stated on the cover of this report and do not necessarily represent the views of Fidelity or any other person in the Fidelity organization. Any such views are subject to change at any time based upon market or other conditions and Fidelity disclaims any responsibility to update such views. These views may not be relied on as investment advice and, because investment decisions for a Fidelity fund are based on numerous factors, may not be relied on as an indication of trading intent on behalf of any Fidelity fund.
Annual Report
Fidelity Emerging Markets Fund
As a shareholder of the Fund, you incur two types of costs: (1) transaction costs, including redemption fees and (2) ongoing costs, including management fees and other Fund expenses. This Example is intended to help you understand your ongoing costs (in dollars) of investing in the Fund and to compare these costs with the ongoing costs of investing in other mutual funds.
The Example is based on an investment of $1,000 invested at the beginning of the period and held for the entire period (May 1, 2012 to October 31, 2012).
Actual Expenses
The first line of the accompanying table for each class of the Fund provides information about actual account values and actual expenses. You may use the information in this line, together with the amount you invested, to estimate the expenses that you paid over the period. Simply divide your account value by $1,000.00 (for example, an $8,600 account value divided by $1,000.00 = 8.6), then multiply the result by the number in the first line for a class of the Fund under the heading entitled "Expenses Paid During Period" to estimate the expenses you paid on your account during this period. A small balance maintenance fee of $12.00 that is charged once a year may apply for certain accounts with a value of less than $2,000. This fee is not included in the table below. If it was, the estimate of expenses you paid during the period would be higher, and your ending account value lower, by this amount. In addition, the Fund, as a shareholder in the underlying Fidelity Central Funds, will indirectly bear its pro-rata share of the fees and expenses incurred by the underlying Fidelity Central Funds. These fees and expenses are not included in the Fund's annualized expense ratio used to calculate the expense estimate in the table below.
Hypothetical Example for Comparison Purposes
The second line of the accompanying table for each class of the Fund provides information about hypothetical account values and hypothetical expenses based on a Class' actual expense ratio and an assumed rate of return of 5% per year before expenses, which is not the Class' actual return. The hypothetical account values and expenses may not be used to estimate the actual ending account balance or expenses you paid for the period. You may use this information to compare the ongoing costs of investing in the Fund and other funds. To do so, compare this 5% hypothetical example with the 5% hypothetical examples that appear in the shareholder reports of the other funds. A small balance maintenance fee of $12.00 that is charged once a year may apply for certain accounts with a value of less than $2,000. This fee is not included in the table below. If it was, the estimate of expenses you paid during the period would be higher, and your ending account value lower, by this amount. In addition, the Fund, as a shareholder in the underlying Fidelity Central Funds, will indirectly bear its pro-rata share of the fees and expenses incurred by the underlying Fidelity Central Funds. These fees and expenses are not included in the Fund's annualized expense ratio used to calculate the expense estimate in the table below.
Please note that the expenses shown in the table are meant to highlight your ongoing costs only and do not reflect any transaction costs. Therefore, the second line of the table is useful in comparing ongoing costs only, and will not help you determine the relative total costs of owning different funds. In addition, if these transactional costs were included, your costs would have been higher.
| Annualized
Expense Ratio | Beginning
Account Value
May 1, 2012 | Ending
Account Value
October 31, 2012 | Expenses Paid
During Period*
May 1, 2012
to October 31, 2012 |
Emerging Markets | 1.08% | | | |
Actual | | $ 1,000.00 | $ 965.10 | $ 5.33 |
HypotheticalA | | $ 1,000.00 | $ 1,019.71 | $ 5.48 |
Class K | .87% | | | |
Actual | | $ 1,000.00 | $ 966.00 | $ 4.30 |
HypotheticalA | | $ 1,000.00 | $ 1,020.76 | $ 4.42 |
A 5% return per year before expenses
* Expenses are equal to each Class' annualized expense ratio, multiplied by the average account value over the period, multiplied by 184/366 (to reflect the one-half year period).
Annual Report
Fidelity Emerging Markets Fund
Investment Changes (Unaudited)
Geographic Diversification (% of fund's net assets) |
As of October 31, 2012 |
| Korea (South) | 13.3% | |
| Brazil | 12.2% | |
| India | 7.8% | |
| Indonesia | 7.2% | |
| United States of America | 5.9% | |
| Cayman Islands | 5.8% | |
| South Africa | 5.6% | |
| Thailand | 4.0% | |
| Russia | 3.9% | |
| Other | 34.3% | |

Percentages are based on country or territory of incorporation and are adjusted for the effect of futures contracts, if applicable. |
As of April 30, 2012 |
| Korea (South) | 20.3% | |
| Brazil | 10.8% | |
| Indonesia | 7.1% | |
| Taiwan | 6.7% | |
| China | 6.4% | |
| South Africa | 6.2% | |
| Cayman Islands | 5.9% | |
| Russia | 5.3% | |
| Hong Kong | 4.9% | |
| Other | 26.4% | |

Percentages are based on country or territory of incorporation and are adjusted for the effect of futures contracts, if applicable. |
Asset Allocation |
| % of fund's
net assets | % of fund's net assets
6 months ago |
Stocks and Investment Companies | 98.4 | 99.3 |
Bonds | 0.0 | 0.1 |
Short-Term Investments and Net Other Assets (Liabilities) | 1.6 | 0.6 |
Top Ten Stocks as of October 31, 2012 |
| % of fund's
net assets | % of fund's net assets
6 months ago |
Samsung Electronics Co. Ltd. (Korea (South), Semiconductors & Semiconductor Equipment) | 4.4 | 5.1 |
iShares MSCI Emerging Markets Index ETF (United States of America, Investment Companies) | 2.0 | 0.0 |
Vale SA (PN-A) (Brazil, Metals & Mining) | 1.7 | 0.7 |
Hyundai Motor Co. (Korea (South), Automobiles) | 1.6 | 2.0 |
Sberbank (Savings Bank of the Russian Federation) (Russia, Commercial Banks) | 1.6 | 1.4 |
Tencent Holdings Ltd. (Cayman Islands, Internet Software & Services) | 1.6 | 0.0 |
Itau Unibanco Holdings SA sponsored ADR (Brazil, Commercial Banks) | 1.5 | 0.0 |
CNOOC Ltd. (Hong Kong, Oil, Gas & Consumable Fuels) | 1.5 | 1.4 |
Companhia de Bebidas das Americas (AmBev) (PN) sponsored ADR (Brazil, Beverages) | 1.4 | 1.0 |
Taiwan Semiconductor Manufacturing Co. Ltd. (Taiwan, Semiconductors & Semiconductor Equipment) | 1.2 | 1.6 |
| 18.5 | |
Market Sectors as of October 31, 2012 |
| % of fund's
net assets | % of fund's net assets
6 months ago |
Financials | 22.3 | 20.5 |
Consumer Discretionary | 17.8 | 12.7 |
Information Technology | 13.5 | 14.6 |
Consumer Staples | 11.0 | 9.7 |
Materials | 10.4 | 9.5 |
Industrials | 9.5 | 8.7 |
Energy | 6.4 | 13.8 |
Telecommunication Services | 2.9 | 4.6 |
Health Care | 1.4 | 1.4 |
Utilities | 1.2 | 3.9 |
Annual Report
Fidelity Emerging Markets Fund
Investments October 31, 2012
Showing Percentage of Net Assets
Common Stocks - 96.1% |
| Shares | | Value |
Australia - 0.3% |
Iluka Resources Ltd. | 834,598 | | $ 8,594,236 |
Bailiwick of Jersey - 0.2% |
Randgold Resources Ltd. sponsored ADR | 51,100 | | 6,111,049 |
Bermuda - 1.8% |
Brilliance China Automotive Holdings Ltd. (a) | 7,674,000 | | 9,585,012 |
Credicorp Ltd. (NY Shares) | 234,732 | | 30,360,237 |
Digital China Holdings Ltd. (H Shares) | 3,854,000 | | 6,484,624 |
Great Eagle Holdings Ltd. | 1,232,000 | | 3,656,234 |
Jardine Matheson Holdings Ltd. | 8,000 | | 492,800 |
TOTAL BERMUDA | | 50,578,907 |
Brazil - 12.2% |
BR Malls Participacoes SA | 1,346,200 | | 17,697,024 |
Brasil Foods SA | 561,934 | | 10,223,018 |
CCR SA | 1,867,700 | | 16,423,585 |
Cetip SA - Mercados Organizado | 787,433 | | 9,072,121 |
Cielo SA | 786,100 | | 19,448,820 |
Companhia Brasileira de Distribuicao Grupo Pao de Acucar sponsored ADR (d) | 323,819 | | 15,135,300 |
Companhia de Bebidas das Americas (AmBev) (PN) sponsored ADR | 974,334 | | 39,743,084 |
Companhia de Saneamento Basico do Estado de Sao Paulo (SABESP) | 227,355 | | 9,624,570 |
Companhia de Saneamento de Minas Gerais | 475,717 | | 11,228,612 |
Gerdau SA sponsored ADR | 1,561,874 | | 13,728,872 |
Itau Unibanco Holdings SA sponsored ADR | 2,893,600 | | 42,188,688 |
Localiza Rent A Car SA | 32,300 | | 566,151 |
Mills Estruturas e Servicos de Engenharia SA | 519,700 | | 7,968,025 |
Multiplan Empreendimentos Imobiliarios SA | 624,367 | | 18,290,951 |
Multiplus SA | 801,910 | | 18,631,808 |
Qualicorp SA (a) | 1,137,600 | | 11,672,575 |
Souza Cruz SA | 26,767 | | 349,241 |
Totvs SA | 228,374 | | 4,643,828 |
Ultrapar Participacoes SA | 957,700 | | 20,087,157 |
Usinas Siderurgicas de Minas Gerais SA - Usiminas (PN-A) (non-vtg.) | 1,623,461 | | 7,841,339 |
Vale SA (PN-A) | 2,636,723 | | 47,189,819 |
TOTAL BRAZIL | | 341,754,588 |
British Virgin Islands - 1.1% |
Arcos Dorados Holdings, Inc. Class A | 1,067,435 | | 13,780,586 |
Gem Diamonds Ltd. (a) | 759,283 | | 2,067,682 |
Mail.ru Group Ltd. GDR (e) | 442,500 | | 14,757,375 |
TOTAL BRITISH VIRGIN ISLANDS | | 30,605,643 |
Canada - 0.4% |
Africa Oil Corp. (a) | 29,951 | | 297,486 |
|
| Shares | | Value |
First Quantum Minerals Ltd. | 430,268 | | $ 9,671,606 |
Ivanplats Ltd. Class A (f) | 549,975 | | 2,299,570 |
TOTAL CANADA | | 12,268,662 |
Cayman Islands - 5.8% |
Anta Sports Products Ltd. | 4,438,000 | | 3,779,434 |
Baidu.com, Inc. sponsored ADR (a) | 128,900 | | 13,743,318 |
Belle International Holdings Ltd. | 4,010,000 | | 7,471,487 |
Chailease Holding Co. Ltd. | 2,784,000 | | 4,956,111 |
Changyou.com Ltd. (A Shares) ADR | 223,219 | | 5,546,992 |
Country Garden Holdings Co. Ltd. | 1,446,106 | | 580,305 |
ENN Energy Holdings Ltd. | 244,000 | | 1,015,348 |
Eurasia Drilling Co. Ltd. GDR (Reg. S) | 470,291 | | 16,272,069 |
Golden Eagle Retail Group Ltd. (H Shares) | 2,923,000 | | 6,411,701 |
Hengan International Group Co. Ltd. | 1,846,000 | | 16,816,356 |
Hengdeli Holdings Ltd. | 44,860,000 | | 14,123,573 |
Intime Department Store Group Co. Ltd. | 2,884,000 | | 3,416,122 |
KWG Property Holding Ltd. | 3,842,500 | | 2,290,611 |
MStar Semiconductor, Inc. | 216,000 | | 1,830,195 |
NetEase.com, Inc. sponsored ADR (a) | 153,152 | | 8,270,208 |
Sands China Ltd. | 856,000 | | 3,219,644 |
SINA Corp. (a) | 106,400 | | 5,812,632 |
Tencent Holdings Ltd. | 1,258,300 | | 44,486,707 |
Vinda International Holdings Ltd. | 3,041,000 | | 4,245,601 |
TOTAL CAYMAN ISLANDS | | 164,288,414 |
Chile - 0.7% |
CAP SA | 217,106 | | 7,484,438 |
Sociedad Quimica y Minera de Chile SA (PN-B) sponsored ADR (d) | 194,647 | | 11,260,329 |
TOTAL CHILE | | 18,744,767 |
China - 3.2% |
Air China Ltd. (H Shares) | 6,326,000 | | 4,489,390 |
China Communications Construction Co. Ltd. (H Shares) | 9,315,000 | | 8,738,015 |
China Communications Services Corp. Ltd. (H Shares) | 19,970,000 | | 11,260,431 |
China Minsheng Banking Corp. Ltd. (H Shares) | 15,847,000 | | 14,415,565 |
China Railway Construction Corp. Ltd. (H Shares) | 4,693,500 | | 4,663,189 |
China Shenhua Energy Co. Ltd. (H Shares) | 835,500 | | 3,557,590 |
Dongfeng Motor Group Co. Ltd. (H Shares) | 4,462,000 | | 5,527,087 |
Great Wall Motor Co. Ltd. (H Shares) | 8,433,500 | | 23,178,373 |
Huadian Power International Corp. Ltd. (H Shares) (a) | 12,364,000 | | 3,142,829 |
Tsingtao Brewery Co. Ltd. (H Shares) | 82,000 | | 443,326 |
Yantai Changyu Pioneer Wine Co. (B Shares) | 1,873,860 | | 9,499,805 |
TOTAL CHINA | | 88,915,600 |
Common Stocks - continued |
| Shares | | Value |
Colombia - 1.5% |
Almacenes Exito SA | 741,818 | | $ 14,141,719 |
BanColombia SA sponsored ADR | 174,049 | | 11,142,617 |
Ecopetrol SA ADR (d) | 296,500 | | 17,555,765 |
TOTAL COLOMBIA | | 42,840,101 |
Czech Republic - 0.3% |
Philip Morris CR A/S | 14,266 | | 7,643,421 |
Finland - 0.6% |
Kone Oyj (B Shares) (d) | 20,800 | | 1,489,536 |
Nokian Tyres PLC | 360,700 | | 14,960,682 |
TOTAL FINLAND | | 16,450,218 |
France - 0.5% |
LVMH Moet Hennessy - Louis Vuitton SA | 91,254 | | 14,832,171 |
Hong Kong - 2.6% |
AIA Group Ltd. | 125,400 | | 496,743 |
China Mobile Ltd. | 481,600 | | 5,341,785 |
CNOOC Ltd. | 20,334,000 | | 41,846,900 |
Dah Chong Hong Holdings Ltd. | 8,279,000 | | 7,808,916 |
Galaxy Entertainment Group Ltd. (a) | 1,617,000 | | 5,560,358 |
Guangdong Investment Ltd. | 9,818,000 | | 8,031,706 |
Shenzhen Investment Ltd. | 6,594,000 | | 1,752,716 |
Singamas Container Holdings Ltd. | 13,906,000 | | 3,516,850 |
TOTAL HONG KONG | | 74,355,974 |
India - 7.8% |
Axis Bank Ltd. | 534,804 | | 11,754,655 |
Bajaj Auto Ltd. | 325,108 | | 10,975,605 |
Bharat Heavy Electricals Ltd. | 1,834,291 | | 7,663,760 |
GlaxoSmithKline Pharmaceuticals Ltd. | 53,036 | | 1,976,344 |
HDFC Bank Ltd. | 1,040,389 | | 12,216,228 |
Hindustan Unilever Ltd. | 2,149,272 | | 21,834,254 |
Housing Development Finance Corp. Ltd. | 1,078,774 | | 15,284,887 |
ICICI Bank Ltd. | 1,222,397 | | 23,784,961 |
ITC Ltd. | 890,169 | | 4,674,607 |
Jaypee Infratech Ltd. | 2,914,167 | | 2,586,218 |
Larsen & Toubro Ltd. | 436,558 | | 13,199,784 |
Mahindra & Mahindra Financial Services Ltd. | 813,982 | | 13,111,002 |
Tata Consultancy Services Ltd. | 854,377 | | 20,889,005 |
Tata Motors Ltd. | 4,253,223 | | 20,225,370 |
Tata Steel Ltd. | 1,656,008 | | 12,071,115 |
Tech Mahindra Ltd. (a) | 245,142 | | 4,321,251 |
Titan Industries Ltd. | 1,632,955 | | 7,869,626 |
Ultratech Cemco Ltd. | 430,479 | | 15,971,047 |
TOTAL INDIA | | 220,409,719 |
Indonesia - 7.2% |
PT AKR Corporindo Tbk | 980,500 | | 454,264 |
PT Astra International Tbk | 35,143,500 | | 29,453,824 |
PT Bank Central Asia Tbk | 579,500 | | 494,730 |
PT Bank Mandiri (Persero) Tbk | 27,768,000 | | 23,850,602 |
|
| Shares | | Value |
PT Bank Rakyat Indonesia Tbk | 37,260,000 | | $ 28,706,177 |
PT Bank Tabungan Negara Tbk | 177,500 | | 28,089 |
PT Bumi Serpong Damai Tbk | 62,585,400 | | 8,079,705 |
PT Ciputra Development Tbk | 3,464,500 | | 245,273 |
PT Gadjah Tunggal Tbk | 6,986,500 | | 1,582,048 |
PT Global Mediacom Tbk | 56,864,000 | | 13,468,511 |
PT Indocement Tunggal Prakarsa Tbk | 8,437,500 | | 18,798,723 |
PT Indofood Sukses Makmur Tbk | 6,511,000 | | 4,846,794 |
PT Jasa Marga Tbk | 9,787,500 | | 5,910,178 |
PT Media Nusantara Citra Tbk | 3,430,000 | | 1,008,819 |
PT Mitra Adiperkasa Tbk | 19,720,000 | | 13,447,731 |
PT Pembangunan Perumahan Persero Tbk | 16,021,500 | | 1,284,383 |
PT Resource Alam Indonesia Tbk | 8,074,000 | | 2,395,711 |
PT Semen Gresik (Persero) Tbk | 9,173,000 | | 14,229,789 |
PT Summarecon Agung Tbk | 1,465,500 | | 267,008 |
PT Telkomunikasi Indonesia Tbk Series B | 5,655,500 | | 5,744,037 |
PT Tower Bersama Infrastructure Tbk (a) | 37,424,865 | | 19,481,888 |
PT United Tractors Tbk | 4,048,000 | | 8,892,497 |
PT Wijaya Karya Persero Tbk | 7,813,500 | | 1,114,466 |
TOTAL INDONESIA | | 203,785,247 |
Ireland - 0.3% |
Dragon Oil PLC | 870,100 | | 7,792,888 |
Israel - 1.0% |
Check Point Software Technologies Ltd. (a) | 338,460 | | 15,071,624 |
Israel Chemicals Ltd. | 1,067,200 | | 13,354,942 |
TOTAL ISRAEL | | 28,426,566 |
Italy - 0.4% |
Prada SpA | 1,450,500 | | 11,828,517 |
Japan - 0.0% |
Fanuc Corp. | 3,500 | | 557,247 |
Korea (South) - 13.3% |
Cheil Worldwide, Inc. | 25,820 | | 497,304 |
CJ Corp. | 24,943 | | 2,436,376 |
Cosmax, Inc. | 6,480 | | 289,137 |
DGB Financial Group Co. Ltd. | 393,540 | | 4,980,971 |
Dongbu Insurance Co. Ltd. | 267,210 | | 12,118,952 |
Grand Korea Leisure Co. Ltd. | 42,920 | | 1,208,493 |
Hana Financial Group, Inc. | 160,710 | | 4,679,858 |
Honam Petrochemical Corp. | 12,930 | | 2,644,536 |
Hotel Shilla Co. | 314,713 | | 13,277,569 |
Hyundai Glovis Co. Ltd. | 8,608 | | 1,792,149 |
Hyundai Heavy Industries Co. Ltd. | 88,694 | | 18,628,410 |
Hyundai Hysco Co. Ltd. | 388,360 | | 15,529,842 |
Hyundai Mobis | 44,867 | | 11,439,785 |
Hyundai Motor Co. | 220,399 | | 45,380,786 |
Hyundai Wia Corp. | 25,092 | | 4,061,870 |
Industrial Bank of Korea | 643,160 | | 7,078,583 |
Interflex Co. Ltd. | 4,601 | | 262,475 |
Kia Motors Corp. | 521,053 | | 28,960,135 |
Korea Zinc Co. Ltd. | 4,236 | | 1,740,524 |
Common Stocks - continued |
| Shares | | Value |
Korea (South) - continued |
KT Corp. | 12,310 | | $ 417,989 |
KT&G Corp. | 241,611 | | 18,414,663 |
LG Chemical Ltd. | 83,338 | | 23,388,941 |
LG Corp. | 75,855 | | 4,633,450 |
Lotte Samkang Co. Ltd. | 15,336 | | 10,281,951 |
NHN Corp. | 2,225 | | 515,273 |
Samsung C&T Corp. | 82,372 | | 4,480,024 |
Samsung Electronics Co. Ltd. | 102,273 | | 122,879,192 |
Samsung Heavy Industries Ltd. | 74,960 | | 2,292,828 |
Silicon Works Co. Ltd. | 87,326 | | 2,238,574 |
SK Energy Co. Ltd. | 2,948 | | 433,959 |
Sung Kwang Bend Co. Ltd. | 235,711 | | 5,707,289 |
TK Corp. (a) | 91,531 | | 2,321,183 |
TOTAL KOREA (SOUTH) | | 375,013,071 |
Luxembourg - 0.5% |
L'Occitane Ltd. | 4,051,000 | | 12,623,357 |
Malaysia - 0.3% |
Bumiputra-Commerce Holdings Bhd | 190,200 | | 476,437 |
Malayan Banking Bhd | 2,652,100 | | 7,862,266 |
TOTAL MALAYSIA | | 8,338,703 |
Mexico - 3.1% |
CEMEX SA de CV sponsored ADR | 1,749,940 | | 15,819,458 |
Coca-Cola FEMSA SAB de CV Series L | 322,685 | | 4,135,957 |
Fomento Economico Mexicano SAB de CV unit | 1,498,100 | | 13,491,366 |
Grupo Financiero Banorte SAB de CV Series O | 3,860,500 | | 21,448,860 |
Grupo Mexico SA de CV Series B | 2,869,031 | | 9,193,871 |
Grupo Televisa SA de CV | 5,127,457 | | 23,307,335 |
TOTAL MEXICO | | 87,396,847 |
Netherlands - 0.6% |
ASML Holding NV (Netherlands) | 77,500 | | 4,260,351 |
Yandex NV (a) | 529,500 | | 12,326,760 |
TOTAL NETHERLANDS | | 16,587,111 |
Nigeria - 0.6% |
Guaranty Trust Bank PLC GDR (Reg. S) | 2,876,489 | | 17,834,232 |
Panama - 0.9% |
Banco Latinoamericano de Exporaciones SA (BLADEX) Series E | 334,992 | | 7,537,320 |
Copa Holdings SA Class A | 177,200 | | 16,447,704 |
TOTAL PANAMA | | 23,985,024 |
Philippines - 2.6% |
Alliance Global Group, Inc. | 17,480,300 | | 6,328,634 |
Ayala Corp. | 471,140 | | 5,078,224 |
International Container Terminal Services, Inc. | 8,189,630 | | 14,147,536 |
Manila Water Co., Inc. | 2,015,100 | | 1,421,847 |
Metropolitan Bank & Trust Co. | 2,733,240 | | 6,317,708 |
|
| Shares | | Value |
Philippine National Bank (a) | 2,173,910 | | $ 3,808,309 |
PUREGOLD Price Club, Inc. | 6,059,500 | | 4,415,621 |
Security Bank Corp. | 4,334,780 | | 17,075,447 |
SM Investments Corp. | 338,620 | | 6,615,860 |
SM Prime Holdings, Inc. | 23,060,100 | | 8,135,558 |
TOTAL PHILIPPINES | | 73,344,744 |
Poland - 0.5% |
Bank Polska Kasa Opieki SA | 315,900 | | 15,168,424 |
Russia - 3.6% |
Magnit OJSC GDR (Reg. S) | 16,600 | | 589,300 |
Mechel Steel Group OAO sponsored ADR | 137,815 | | 875,125 |
Mobile TeleSystems OJSC sponsored ADR | 422,061 | | 7,234,126 |
NOVATEK OAO GDR (Reg. S) | 193,758 | | 22,088,412 |
Sberbank (Savings Bank of the Russian Federation) | 15,341,500 | | 44,911,019 |
Tatneft OAO sponsored ADR | 168,500 | | 6,527,690 |
TNK-BP Holding | 172,236 | | 351,605 |
Uralkali OJSC GDR (Reg. S) | 456,400 | | 17,881,752 |
TOTAL RUSSIA | | 100,459,029 |
Singapore - 0.4% |
Keppel Corp. Ltd. | 1,258,000 | | 10,993,835 |
South Africa - 5.6% |
African Bank Investments Ltd. | 4,768,962 | | 16,126,353 |
AVI Ltd. | 1,754,243 | | 11,568,638 |
Bidvest Group Ltd. | 380,600 | | 9,084,114 |
FirstRand Ltd. | 4,424,260 | | 14,685,197 |
Foschini Ltd. | 302,764 | | 4,395,860 |
Imperial Holdings Ltd. | 906,370 | | 20,590,932 |
Life Healthcare Group Holdings Ltd. | 4,987,200 | | 18,860,211 |
Mr Price Group Ltd. | 1,095,801 | | 16,928,667 |
Nampak Ltd. | 964,381 | | 3,214,362 |
Naspers Ltd. Class N | 426,880 | | 27,713,611 |
Shoprite Holdings Ltd. | 455,500 | | 9,366,731 |
Tongaat Hulett Ltd. | 306,300 | | 4,804,346 |
TOTAL SOUTH AFRICA | | 157,339,022 |
Switzerland - 1.0% |
Compagnie Financiere Richemont SA Series A | 115,158 | | 7,468,639 |
Dufry AG (a) | 90,900 | | 11,536,970 |
Swatch Group AG (Bearer) | 19,710 | | 8,156,592 |
TOTAL SWITZERLAND | | 27,162,201 |
Taiwan - 3.6% |
ASUSTeK Computer, Inc. | 923,000 | | 9,890,414 |
Chipbond Technology Corp. | 2,998,000 | | 5,080,486 |
Far EasTone Telecommunications Co. Ltd. | 3,567,000 | | 8,230,599 |
MediaTek, Inc. | 821,188 | | 9,122,749 |
Novatek Microelectronics Corp. | 2,370,000 | | 8,925,026 |
Radiant Opto-Electronics Corp. | 1,097,620 | | 4,565,588 |
Common Stocks - continued |
| Shares | | Value |
Taiwan - continued |
Taiwan Semiconductor Manufacturing Co. Ltd. | 11,416,000 | | $ 34,788,211 |
Unified-President Enterprises Corp. | 10,937,710 | | 19,321,665 |
TOTAL TAIWAN | | 99,924,738 |
Thailand - 4.0% |
Advanced Info Service PCL (For. Reg.) | 3,405,000 | | 21,926,557 |
Asian Property Development PCL (For. Reg.) | 22,831,800 | | 6,476,578 |
Bangkok Bank Public Co. Ltd. (For. Reg.) | 1,944,600 | | 11,476,120 |
Bangkok Expressway PCL (For.Reg.) | 7,473,700 | | 6,762,151 |
Bumrungrad Hospital PCL (For. Reg.) | 1,280,700 | | 3,163,124 |
C.P. ALL PCL (For. Reg.) | 8,367,800 | | 10,845,127 |
Hemaraj Land & Development PCL | 12,652,700 | | 1,295,386 |
Home Product Center PCL (For. Reg.) | 20,589,700 | | 7,653,165 |
Kasikornbank PCL (For. Reg.) | 82,500 | | 484,187 |
PTT PCL (For. Reg.) | 1,169,600 | | 12,126,925 |
Siam Commercial Bank PCL (For. Reg.) | 5,491,000 | | 28,824,617 |
TOTAL THAILAND | | 111,033,937 |
Turkey - 3.3% |
Coca-Cola Icecek A/S | 719,327 | | 13,965,177 |
Enka Insaat ve Sanayi A/S | 2,440,000 | | 6,479,442 |
TAV Havalimanlari Holding A/S | 729,000 | | 3,619,582 |
Turk Hava Yollari AO (a) | 3,616,000 | | 8,371,771 |
Turkiye Garanti Bankasi A/S | 5,569,395 | | 26,596,386 |
Turkiye Halk Bankasi A/S | 2,103,000 | | 18,536,904 |
Turkiye Is Bankasi A/S Series C | 4,367,000 | | 14,861,199 |
Turkiye Petrol Rafinerile A/S | 32,000 | | 781,925 |
TOTAL TURKEY | | 93,212,386 |
United Arab Emirates - 0.1% |
NMC Health PLC | 1,233,181 | | 3,601,983 |
United Kingdom - 1.9% |
Afren PLC (a) | 1,231,300 | | 2,736,113 |
Aggreko PLC | 313,500 | | 10,877,078 |
Antofagasta PLC | 143,400 | | 2,908,846 |
British American Tobacco PLC (United Kingdom) | 61,600 | | 3,055,336 |
Ophir Energy PLC (a) | 976,996 | | 8,742,398 |
Prudential PLC | 42,420 | | 582,579 |
Standard Chartered PLC (United Kingdom) | 549,760 | | 12,983,809 |
Tullow Oil PLC | 476,500 | | 10,796,084 |
TOTAL UNITED KINGDOM | | 52,682,243 |
United States of America - 2.3% |
Colgate-Palmolive Co. | 130,650 | | 13,713,024 |
Cummins, Inc. | 100,540 | | 9,408,533 |
Freeport-McMoRan Copper & Gold, Inc. | 14,000 | | 544,320 |
Mead Johnson Nutrition Co. Class A | 198,160 | | 12,218,546 |
Philip Morris International, Inc. | 96,640 | | 8,558,438 |
|
| Shares | | Value |
Rockwood Holdings, Inc. | 95,248 | | $ 4,371,883 |
Yum! Brands, Inc. | 206,420 | | 14,472,106 |
TOTAL UNITED STATES OF AMERICA | | 63,286,850 |
TOTAL COMMON STOCKS (Cost $2,408,789,180) |
2,700,771,672
|
Nonconvertible Preferred Stocks - 0.3% |
| | | |
Russia - 0.3% |
Surgutneftegaz JSC
(Cost $11,137,681) | 15,516,000 | |
9,610,219
|
Investment Companies - 2.0% |
| | | |
United States of America - 2.0% |
iShares MSCI Emerging Markets Index ETF
(Cost $56,917,403) | 1,364,100 | |
56,078,151
|
Money Market Funds - 2.4% |
| | | |
Fidelity Cash Central Fund, 0.19% (b) | 29,919,473 | | 29,919,473 |
Fidelity Securities Lending Cash Central Fund, 0.19% (b)(c) | 38,537,213 | | 38,537,213 |
TOTAL MONEY MARKET FUNDS (Cost $68,456,686) |
68,456,686
|
TOTAL INVESTMENT PORTFOLIO - 100.8% (Cost $2,545,300,950) | | 2,834,916,728 |
NET OTHER ASSETS (LIABILITIES) - (0.8)% | | (23,242,128) |
NET ASSETS - 100% | $ 2,811,674,600 |
Security Type Abbreviations |
ETF | - | Exchange-Traded Fund |
Legend |
(a) Non-income producing |
(b) Affiliated fund that is available only to investment companies and other accounts managed by Fidelity Investments. The rate quoted is the annualized seven-day yield of the fund at period end. A complete unaudited listing of the fund's holdings as of its most recent quarter end is available upon request. In addition, each Fidelity Central Fund's financial statements, which are not covered by the Fund's Report of Independent Registered Public Accounting Firm, are available on the SEC's website or upon request. |
(c) Investment made with cash collateral received from securities on loan. |
(d) Security or a portion of the security is on loan at period end. |
(e) Security exempt from registration under Rule 144A of the Securities Act of 1933. These securities may be resold in transactions exempt from registration, normally to qualified institutional buyers. At the end of the period, the value of these securities amounted to $14,757,375 or 0.5% of net assets. |
(f) Restricted securities - Investment in securities not registered under the Securities Act of 1933 (excluding 144A issues). At the end of the period, the value of restricted securities (excluding 144A issues) amounted to $2,299,570 or 0.1% of net assets. |
Additional information on each restricted holding is as follows: |
Security | Acquisition Date | Acquisition Cost |
Ivanplats Ltd. Class A | 10/23/12 | $ 2,663,584 |
Affiliated Central Funds |
Information regarding fiscal year to date income earned by the Fund from investments in Fidelity Central Funds is as follows: |
Fund | Income earned |
Fidelity Cash Central Fund | $ 45,641 |
Fidelity Securities Lending Cash Central Fund | 257,878 |
Total | $ 303,519 |
Other Information |
Categorizations in the Schedule of Investments are based on country or territory of incorporation. |
The following is a summary of the inputs used, as of October 31, 2012, involving the Fund's assets and liabilities carried at fair value. The inputs or methodology used for valuing securities may not be an indication of the risk associated with investing in those securities. For more information on valuation inputs, and their aggregation into the levels used in the tables below, please refer to the Security Valuation section in the accompanying Notes to Financial Statements. |
Valuation Inputs at Reporting Date: |
Description | Total | Level 1 | Level 2 | Level 3 |
Investments in Securities: | | | | |
Equities: | | | | |
Consumer Discretionary | $ 503,188,373 | $ 482,963,003 | $ 20,225,370 | $ - |
Consumer Staples | 308,631,549 | 305,576,213 | 3,055,336 | - |
Energy | 184,000,896 | 142,153,996 | 41,846,900 | - |
Financials | 632,164,723 | 595,580,955 | 36,583,768 | - |
Health Care | 39,274,237 | 39,274,237 | - | - |
Industrials | 260,070,095 | 260,070,095 | - | - |
Information Technology | 380,161,678 | 341,113,116 | 39,048,562 | - |
Materials | 288,788,016 | 286,488,446 | 2,299,570 | - |
Telecommunication Services | 79,637,412 | 68,133,601 | 11,503,811 | - |
Utilities | 34,464,912 | 34,464,912 | - | - |
Investment Companies | 56,078,151 | 56,078,151 | - | - |
Money Market Funds | 68,456,686 | 68,456,686 | - | - |
Total Investments in Securities: | $ 2,834,916,728 | $ 2,680,353,411 | $ 154,563,317 | $ - |
The following is a summary of transfers between Level 1 and Level 2 for the period ended October 31, 2012. Transfers are assumed to have occurred at the beginning of the period, and are primarily attributable to the valuation techniques used for foreign equity securities, as discussed in the accompanying Notes to Financial Statements: |
Transfers | Total |
Level 1 to Level 2 | $ 0 |
Level 2 to Level 1 | $ 928,909,440 |
See accompanying notes which are an integral part of the financial statements.
Annual Report
Fidelity Emerging Markets Fund
Statement of Assets and Liabilities
| October 31, 2012 |
| | |
Assets | | |
Investment in securities, at value (including securities loaned of $36,461,919) - See accompanying schedule: Unaffiliated issuers (cost $2,476,844,264) | $ 2,766,460,042 | |
Fidelity Central Funds (cost $68,456,686) | 68,456,686 | |
Total Investments (cost $2,545,300,950) | | $ 2,834,916,728 |
Cash | | 3,018,397 |
Foreign currency held at value (cost $12,706,460) | | 12,719,558 |
Receivable for investments sold | | 86,822,118 |
Receivable for fund shares sold | | 2,169,307 |
Dividends receivable | | 5,305,231 |
Distributions receivable from Fidelity Central Funds | | 26,243 |
Other receivables | | 2,320,404 |
Total assets | | 2,947,297,986 |
| | |
Liabilities | | |
Payable for investments purchased | $ 88,056,191 | |
Payable for fund shares redeemed | 6,240,218 | |
Accrued management fee | 1,669,645 | |
Other affiliated payables | 627,056 | |
Other payables and accrued expenses | 493,063 | |
Collateral on securities loaned, at value | 38,537,213 | |
Total liabilities | | 135,623,386 |
| | |
Net Assets | | $ 2,811,674,600 |
Net Assets consist of: | | |
Paid in capital | | $ 2,814,999,392 |
Undistributed net investment income | | 34,119,316 |
Accumulated undistributed net realized gain (loss) on investments and foreign currency transactions | | (326,713,001) |
Net unrealized appreciation (depreciation) on investments and assets and liabilities in foreign currencies | | 289,268,893 |
Net Assets | | $ 2,811,674,600 |
Statement of Assets and Liabilities - continued
| October 31, 2012 |
| | |
Emerging Markets:
Net Asset Value, offering price and redemption price per share ($2,203,756,037 ÷ 99,491,943 shares) | | $ 22.15 |
| | |
Class K:
Net Asset Value, offering price and redemption price per share ($607,918,563 ÷ 27,441,326 shares) | | $ 22.15 |
See accompanying notes which are an integral part of the financial statements.
Annual Report
Fidelity Emerging Markets Fund
Financial Statements - continued
Statement of Operations
| Year ended October 31, 2012 |
| | |
Investment Income | | |
Dividends | | $ 86,522,575 |
Interest | | 105,837 |
Income from Fidelity Central Funds | | 303,519 |
Income before foreign taxes withheld | | 86,931,931 |
Less foreign taxes withheld | | (8,754,391) |
Total income | | 78,177,540 |
| | |
Expenses | | |
Management fee | $ 21,897,795 | |
Transfer agent fees | 7,021,581 | |
Accounting and security lending fees | 1,347,028 | |
Custodian fees and expenses | 1,845,693 | |
Independent trustees' compensation | 20,683 | |
Registration fees | 86,128 | |
Audit | 118,130 | |
Legal | 16,723 | |
Interest | 4,699 | |
Miscellaneous | 40,045 | |
Total expenses before reductions | 32,398,505 | |
Expense reductions | (1,950,839) | 30,447,666 |
Net investment income (loss) | | 47,729,874 |
Realized and Unrealized Gain (Loss) Net realized gain (loss) on: | | |
Investment securities: | | |
Unaffiliated issuers | 26,412,836 | |
Foreign currency transactions | (4,436,506) | |
Total net realized gain (loss) | | 21,976,330 |
Change in net unrealized appreciation (depreciation) on: Investment securities | (38,607,945) | |
Assets and liabilities in foreign currencies | 21,905 | |
Total change in net unrealized appreciation (depreciation) | | (38,586,040) |
Net gain (loss) | | (16,609,710) |
Net increase (decrease) in net assets resulting from operations | | $ 31,120,164 |
Statement of Changes in Net Assets
| Year ended
October 31,
2012 | Year ended
October 31,
2011 |
Increase (Decrease) in Net Assets | | |
Operations | | |
Net investment income (loss) | $ 47,729,874 | $ 63,930,762 |
Net realized gain (loss) | 21,976,330 | 283,847,843 |
Change in net unrealized appreciation (depreciation) | (38,586,040) | (874,036,776) |
Net increase (decrease) in net assets resulting from operations | 31,120,164 | (526,258,171) |
Distributions to shareholders from net investment income | (46,903,179) | (49,437,799) |
Distributions to shareholders from net realized gain | - | (24,690,435) |
Total distributions | (46,903,179) | (74,128,234) |
Share transactions - net increase (decrease) | (578,640,528) | (859,245,695) |
Redemption fees | 392,465 | 1,366,825 |
Total increase (decrease) in net assets | (594,031,078) | (1,458,265,275) |
| | |
Net Assets | | |
Beginning of period | 3,405,705,678 | 4,863,970,953 |
End of period (including undistributed net investment income of $34,119,316 and undistributed net investment income of $36,916,001, respectively) | $ 2,811,674,600 | $ 3,405,705,678 |
See accompanying notes which are an integral part of the financial statements.
Annual Report
Financial Highlights - Emerging Markets
Years ended October 31, | 2012 | 2011 | 2010 | 2009 | 2008 |
Selected Per-Share Data | | | | | |
Net asset value, beginning of period | $ 22.23 | $ 25.72 | $ 20.68 | $ 13.71 | $ 37.55 |
Income from Investment Operations | | | | | |
Net investment income (loss) B | .33 | .35 | .23 | .17 | .42 E |
Net realized and unrealized gain (loss) | (.11) | (3.48) | 5.05 | 7.03 | (22.73) |
Total from investment operations | .22 | (3.13) | 5.28 | 7.20 | (22.31) |
Distributions from net investment income | (.30) | (.24) | (.12) | (.24) | (.19) |
Distributions from net realized gain | - | (.13) | (.14) | - | (1.37) |
Total distributions | (.30) | (.37) | (.25) H | (.24) | (1.56) |
Redemption fees added to paid in capital B | - G | .01 | .01 | .01 | .03 |
Net asset value, end of period | $ 22.15 | $ 22.23 | $ 25.72 | $ 20.68 | $ 13.71 |
Total Return A | 1.03% | (12.33)% | 25.76% | 53.95% | (61.84)% |
Ratios to Average Net Assets C, F | | | | | |
Expenses before reductions | 1.09% | 1.07% | 1.14% | 1.16% | 1.07% |
Expenses net of fee waivers, if any | 1.09% | 1.07% | 1.14% | 1.16% | 1.07% |
Expenses net of all reductions | 1.03% | 1.01% | 1.09% | 1.10% | 1.02% |
Net investment income (loss) | 1.50% | 1.38% | 1.00% | 1.09% | 1.47% E |
Supplemental Data | | | | | |
Net assets, end of period (000 omitted) | $ 2,203,756 | $ 2,907,884 | $ 3,975,342 | $ 3,649,582 | $ 2,086,196 |
Portfolio turnover rate D | 176% | 122% | 85% | 88% | 63% |
A Total returns would have been lower if certain expenses had not been reduced during the applicable periods shown. B Calculated based on average shares outstanding during the period. C Fees and expenses of any underlying Fidelity Central Funds are not included in the Fund's expense ratio. The Fund indirectly bears its proportionate share of the expenses of any underlying Fidelity Central Funds. D Amount does not include the portfolio activity of any underlying Fidelity Central Funds. E Investment income per share reflects a large, non-recurring dividend which amounted to $.09 per share. Excluding this non-recurring dividend, the ratio of net investment income (loss) to average net assets would have been 1.17%. F Expense ratios reflect operating expenses of the class. Expenses before reductions do not reflect amounts reimbursed by the investment adviser or reductions from brokerage service arrangements or reductions from other expense offset arrangements and do not represent the amount paid by the class during periods when reimbursements or reductions occur. Expenses net of fee waivers reflect expenses after reimbursement by the investment adviser but prior to reductions from brokerage service arrangements or other expense offset arrangements. Expenses net of all reductions represent the net expenses paid by the class. G Amount represents less than $.01 per share. H Total distributions of $.25 per share is comprised of distributions from net investment income of $.116 and distributions from net realized gain of $.135 per share. |
Financial Highlights - Class K
Years ended October 31, | 2012 | 2011 | 2010 | 2009 | 2008 H |
Selected Per-Share Data | | | | | |
Net asset value, beginning of period | $ 22.23 | $ 25.75 | $ 20.69 | $ 13.72 | $ 31.99 |
Income from Investment Operations | | | | | |
Net investment income (loss) D | .37 | .40 | .28 | .22 | .15 G |
Net realized and unrealized gain (loss) | (.10) | (3.48) | 5.05 | 7.02 | (18.43) |
Total from investment operations | .27 | (3.08) | 5.33 | 7.24 | (18.28) |
Distributions from net investment income | (.35) | (.32) | (.15) | (.28) | - |
Distributions from net realized gain | - | (.13) | (.14) | - | - |
Total distributions | (.35) | (.45) | (.28) K | (.28) | - |
Redemption fees added to paid in capital D | - J | .01 | .01 | .01 | .01 |
Net asset value, end of period | $ 22.15 | $ 22.23 | $ 25.75 | $ 20.69 | $ 13.72 |
Total Return B, C | 1.25% | (12.17)% | 26.03% | 54.44% | (57.11)% |
Ratios to Average Net Assets E, I | | | | | |
Expenses before reductions | .87% | .87% | .90% | .91% | .92% A |
Expenses net of fee waivers, if any | .87% | .87% | .90% | .91% | .92% A |
Expenses net of all reductions | .81% | .80% | .84% | .84% | .87% A |
Net investment income (loss) | 1.72% | 1.58% | 1.24% | 1.35% | 2.02% A, G |
Supplemental Data | | | | | |
Net assets, end of period (000 omitted) | $ 607,919 | $ 497,821 | $ 888,629 | $ 270,075 | $ 87,427 |
Portfolio turnover rate F | 176% | 122% | 85% | 88% | 63% |
A Annualized B Total returns for periods of less than one year are not annualized. C Total returns would have been lower if certain expenses had not been reduced during the applicable periods shown. D Calculated based on average shares outstanding during the period. E Fees and expenses of any underlying Fidelity Central Funds are not included in the Fund's expense ratio. The Fund indirectly bears its proportionate share of the expenses of any underlying Fidelity Central Funds. F Amount does not include the portfolio activity of any underlying Fidelity Central Funds. G Investment income per share reflects a large, non-recurring dividend which amounted to $.02 per share. Excluding this non-recurring dividend, the ratio of net investment income (loss) to average net assets would have been 1.71%. H For the period May 9, 2008 (commencement of sale of shares) to October 31, 2008. I Expense ratios reflect operating expenses of the class. Expenses before reductions do not reflect amounts reimbursed by the investment adviser or reductions from brokerage service arrangements or reductions from other expense offset arrangements and do not represent the amount paid by the class during periods when reimbursements or reductions occur. Expense ratios before reductions for start-up periods may not be representative of longer-term operating periods. Expenses net of fee waivers reflect expenses after reimbursement by the investment adviser but prior to reductions from brokerage service arrangements or other expense offset arrangements. Expenses net of all reductions represent the net expenses paid by the class. J Amount represents less than $.01 per share. K Total distributions of $.28 per share is comprised of distributions from net investment income of $.148 and distributions from net realized gain of $.135 per share. |
See accompanying notes which are an integral part of the financial statements.
Annual Report
Notes to Financial Statements
For the period ended October 31, 2012
1. Organization.
Fidelity Emerging Markets Fund (the Fund) is a fund of Fidelity Investment Trust (the Trust) and is authorized to issue an unlimited number of shares. The Trust is registered under the Investment Company Act of 1940, as amended (the 1940 Act), as an open-end management investment company organized as a Massachusetts business trust. The Fund offers Emerging Markets and Class K shares, each of which has equal rights as to assets and voting privileges. Each class has exclusive voting rights with respect to matters that affect that class. Investment income, realized and unrealized capital gains and losses, the common expenses of the Fund, and certain fund-level expense reductions, if any, are allocated on a pro-rata basis to each class based on the relative net assets of each class to the total net assets of the Fund. Each class differs with respect to transfer agent fees incurred. Certain expense reductions may also differ by class. The Fund's investments in emerging markets can be subject to social, economic, regulatory, and political uncertainties and can be extremely volatile.
2. Investments in Fidelity Central Funds.
The Fund invests in Fidelity Central Funds, which are open-end investment companies available only to other investment companies and accounts managed by Fidelity Management & Research Company (FMR) and its affiliates. The Fund's Schedule of Investments lists each of the Fidelity Central Funds held as of period end, if any, as an investment of the Fund, but does not include the underlying holdings of each Fidelity Central Fund. As an Investing Fund, the Fund indirectly bears its proportionate share of the expenses of the underlying Fidelity Central Funds.
The Money Market Central Funds seek preservation of capital and current income and are managed by Fidelity Investments Money Management, Inc. (FIMM), an affiliate of FMR.
A complete unaudited list of holdings for each Fidelity Central Fund is available upon request or at the Securities and Exchange Commission (the SEC) web site at www.sec.gov. In addition, the financial statements of the Fidelity Central Funds, which are not covered by the Fund's Report of Independent Registered Public Accounting Firm, are available on the SEC web site or upon request.
3. Significant Accounting Policies.
The financial statements have been prepared in conformity with accounting principles generally accepted in the United States of America (GAAP), which require management to make certain estimates and assumptions at the date of the financial statements. Actual results could differ from those estimates. Subsequent events, if any, through the date that the financial statements were issued have been evaluated in the preparation of the financial statements. The following summarizes the significant accounting policies of the Fund:
Security Valuation. Investments are valued as of 4:00 p.m. Eastern time on the last calendar day of the period. In accordance with valuation policies and procedures approved by the Board of Trustees (the Board), the Fund attempts to obtain prices from one or more third party pricing vendors or brokers to value its investments. When current market prices, quotations or rates are not readily available or reliable, securities will be fair valued in good faith by the FMR Fair Value Committee (the Committee), in accordance with procedures adopted by the Fund's Board. Factors used in determining fair value vary by security type and may include market or security specific events. The frequency with which these procedures are used cannot be predicted and they may be utilized to a significant extent. The Committee oversees the Fund's valuation policies and procedures and is responsible for approving and reporting to the Board all fair value determinations.
The Fund categorizes the inputs to valuation techniques used to value its investments into a disclosure hierarchy consisting of three levels as shown below:
Level 1 - quoted prices in active markets for identical investments
Level 2 - other significant observable inputs (including quoted prices for similar investments, interest rates, prepayment speeds, etc.)
Level 3 - unobservable inputs (including the Fund's own assumptions based on the best information available)
Valuation techniques used to value the Fund's investments by major category are as follows:
Equity securities, including restricted securities, for which market quotations are readily available, are valued at the last reported sale price or official closing price as reported by a third party pricing vendor on the primary market or exchange on which they are traded and are categorized as Level 1 in the hierarchy. In the event there were no sales during the day or closing prices are not available, securities are valued at the last quoted bid price or may be valued using the last available price and are generally categorized as Level 2 in the hierarchy. For foreign equity securities, when significant market or security specific events arise, comparisons to the valuation of American Depositary Receipts (ADRs), futures contracts, Exchange-Traded Funds (ETFs) and certain indexes as well as quoted prices for similar securities are used and are categorized as Level 2 in the hierarchy. Utilizing these techniques may result in transfers between Level 1 and Level 2. For restricted equity securities and private placements where observable inputs are limited, assumptions about market activity and risk are used and these securities are categorized as Level 3 in the hierarchy.
Annual Report
3. Significant Accounting Policies - continued
Security Valuation - continued
Investments in open-end mutual funds, including the Fidelity Central Funds, are valued at their closing net asset value (NAV) each business day and are categorized as Level 1 in the hierarchy.
Changes in valuation techniques may result in transfers in or out of an assigned level within the disclosure hierarchy. The aggregate value of investments by input level, as of October 31, 2012, including information on transfers between Levels 1 and 2, is included at the end of the Fund's Schedule of Investments.
Foreign Currency Translation. The Fund may use foreign currency contracts to facilitate transactions in foreign-denominated securities. Gains and losses from these transactions may arise from changes in the value of the foreign currency or if the counterparties do not perform under the contracts' terms.
Foreign-denominated assets, including investment securities, and liabilities are translated into U.S. dollars at the exchange rates at period end. Purchases and sales of investment securities, income and dividends received and expenses denominated in foreign currencies are translated into U.S. dollars at the exchange rate in effect on the transaction date.
The effects of exchange rate fluctuations on investments are included with the net realized and unrealized gain (loss) on investment securities. Other foreign currency transactions resulting in realized and unrealized gain (loss) are disclosed separately.
Investment Transactions and Income. For financial reporting purposes, the Fund's investment holdings and NAV include trades executed through the end of the last business day of the period. The NAV per share for processing shareholder transactions is calculated as of the close of business of the New York Stock Exchange (NYSE), normally 4:00 p.m. Eastern time and includes trades executed through the end of the prior business day. Gains and losses on securities sold are determined on the basis of identified cost and may include proceeds received from litigation. Dividend income is recorded on the ex-dividend date, except for certain dividends from foreign securities where the ex-dividend date may have passed, which are recorded as soon as the Fund is informed of the ex-dividend date. Non-cash dividends included in dividend income, if any, are recorded at the fair market value of the securities received. Interest income and distributions from the Fidelity Central Funds are accrued as earned. Interest income includes coupon interest and amortization of premium and accretion of discount on debt securities. Investment income is recorded net of foreign taxes withheld where recovery of such taxes is uncertain.
Expenses. Expenses directly attributable to a fund are charged to that fund. Expenses attributable to more than one fund are allocated among the respective funds on the basis of relative net assets or other appropriate methods. Expense estimates are accrued in the period to which they relate and adjustments are made when actual amounts are known.
Income Tax Information and Distributions to Shareholders. Each year, the Fund intends to qualify as a regulated investment company under Subchapter M of the Internal Revenue Code, including distributing substantially all of its taxable income and realized gains. As a result, no provision for income taxes is required. As of October 31, 2012, the Fund did not have any unrecognized tax benefits in the financial statements; nor is the Fund aware of any tax positions for which it is reasonably possible that the total amounts of unrecognized tax benefits will significantly change in the next twelve months. The Fund files a U.S. federal tax return, in addition to state and local tax returns as required. A fund's federal income tax returns are subject to examination by the Internal Revenue Service (IRS) for a period of three fiscal years after they are filed. State and local tax returns may be subject to examination for an additional fiscal year depending on the jurisdiction. Foreign taxes are provided for based on the Fund's understanding of the tax rules and rates that exist in the foreign markets in which it invests.
Distributions are declared and recorded on the ex-dividend date. Income dividends and capital gain distributions are declared separately for each class. Income and capital gain distributions are determined in accordance with income tax regulations, which may differ from GAAP.
Capital accounts within the financial statements are adjusted for permanent book-tax differences. These adjustments have no impact on net assets or the results of operations. Temporary book-tax differences will reverse in a subsequent period.
Book-tax differences are primarily due to foreign currency transactions, passive foreign investment companies (PFIC), deferred trustees compensation, capital loss carryforwards and losses deferred due to wash sales.
The federal tax cost of investment securities and unrealized appreciation (depreciation) as of period end were as follows:
Gross unrealized appreciation | $ 356,494,948 |
Gross unrealized depreciation | (80,646,374) |
Net unrealized appreciation (depreciation) on securities and other investments | $ 275,848,574 |
| |
Tax Cost | $ 2,559,068,154 |
Annual Report
Notes to Financial Statements - continued
3. Significant Accounting Policies - continued
Income Tax Information and Distributions to Shareholders - continued
The tax-based components of distributable earnings as of period end were as follows:
Undistributed ordinary income | $ 34,119,771 |
Capital loss carryforward | $ (312,945,798) |
Net unrealized appreciation (depreciation) | $ 275,501,689 |
Capital loss carryforwards are only available to offset future capital gains of the Fund to the extent provided by regulations and may be limited. Under the Regulated Investment Company Modernization Act of 2010 (the Act), the Fund is permitted to carry forward capital losses incurred in taxable years beginning after December 22, 2010 for an unlimited period and such capital losses are required to be used prior to any losses that expire. Capital loss carryforwards were as follows:
Fiscal year of expiration | |
2017 | $ (300,796,983) |
No expiration | |
Short-term | (12,148,815) |
Total capital loss carryforward | $ (312,945,798) |
The tax character of distributions paid was as follows:
| October 31, 2012 | October 31, 2011 |
Ordinary Income | $ 46,903,179 | $ 74,128,234 |
Short-Term Trading (Redemption) Fees. Shares held by investors in the Fund less than 90 days are subject to a redemption fee equal to 1.50% of the net asset value of shares redeemed. All redemption fees, which reduce the proceeds of the shareholder redemption, are retained by the Fund and accounted for as an addition to paid in capital.
Restricted Securities. The Fund may invest in securities that are subject to legal or contractual restrictions on resale. These securities generally may be resold in transactions exempt from registration or to the public if the securities are registered. Disposal of these securities may involve time-consuming negotiations and expense, and prompt sale at an acceptable price may be difficult. Information regarding restricted securities is included at the end of the Fund's Schedule of Investments.
New Accounting Pronouncement. In December 2011, the Financial Accounting Standards Board issued Accounting Standard Update No. 2011-11, Disclosures about Offsetting Assets and Liabilities. The update creates new disclosure requirements requiring entities to disclose both gross and net information for derivatives and other financial instruments that are either offset in the Statement of Assets and Liabilities or subject to an enforceable master netting arrangement or similar agreement. The disclosure requirements are effective for annual reporting periods beginning on or after January 1, 2013, and interim periods within those annual periods. Management is currently evaluating the impact of the update's adoption on the Fund's financial statement disclosures.
4. Purchases and Sales of Investments.
Purchases and sales of securities, other than short-term securities, aggregated $5,371,118,757 and $5,935,273,389, respectively.
5. Fees and Other Transactions with Affiliates.
Management Fee. FMR and its affiliates provide the Fund with investment management related services for which the Fund pays a monthly management fee. The management fee is the sum of an individual fund fee rate that is based on an annual rate of .45% of the Fund's average net assets and an annualized group fee rate that averaged .26% during the period. The group fee rate is based upon the average net assets of all the mutual funds advised by FMR. The group fee rate decreases as assets under management increase and increases as assets under management decrease. For the period, the total annual management fee rate was .71% of the Fund's average net assets.
Annual Report
5. Fees and Other Transactions with Affiliates - continued
Transfer Agent Fees. Fidelity Investments Institutional Operations Company, Inc. (FIIOC), an affiliate of FMR, is the transfer, dividend disbursing and shareholder servicing agent for each class of the Fund. FIIOC receives account fees and asset-based fees that vary according to the account size and type of account of the shareholders of Emerging Markets. FIIOC receives an asset-based fee of Class K's average net assets. FIIOC pays for typesetting, printing and mailing of shareholder reports, except proxy statements. For the period, transfer agent fees for each class were as follows:
| Amount | % of
Average
Net Assets |
Emerging Markets | $ 6,721,313 | .27 |
Class K | 300,268 | .05 |
| $ 7,021,581 | |
Accounting and Security Lending Fees. Fidelity Service Company, Inc. (FSC), an affiliate of FMR, maintains the Fund's accounting records. The accounting fee is based on the level of average net assets for each month. Under a separate contract, FSC administers the security lending program. The security lending fee is based on the number and duration of lending transactions.
Brokerage Commissions. The Fund placed a portion of its portfolio transactions with brokerage firms which are affiliates of the investment adviser. The commissions paid to these affiliated firms were $2,222 for the period.
Interfund Lending Program. Pursuant to an Exemptive Order issued by the SEC, the Fund, along with other registered investment companies having management contracts with FMR, may participate in an interfund lending program. This program provides an alternative credit facility allowing the funds to borrow from, or lend money to, other participating affiliated funds. At period end, there were no interfund loans outstanding. The Fund's activity in this program during the period for which loans were outstanding was as follows:
Borrower or Lender | Average Loan
Balance | Weighted Average Interest Rate | Interest
Expense |
Borrower | $ 15,311,759 | .38% | $ 4,699 |
6. Committed Line of Credit.
The Fund participates with other funds managed by FMR or an affiliate in a $4.25 billion credit facility (the "line of credit") to be utilized for temporary or emergency purposes to fund shareholder redemptions or for other short-term liquidity purposes. The Fund has agreed to pay commitment fees on its pro-rata portion of the line of credit, which amounted to $8,701 and is reflected in Miscellaneous expenses on the Statement of Operations. During the period, there were no borrowings on this line of credit.
7. Security Lending.
The Fund lends portfolio securities through a lending agent from time to time in order to earn additional income. For equity securities, a lending agent is used and may loan securities to certain qualified borrowers, including Fidelity Capital Markets (FCM), a broker-dealer affiliated with the Fund. On the settlement date of the loan, the Fund receives collateral (in the form of U.S. Treasury obligations, letters of credit and/or cash) against the loaned securities and maintains collateral in an amount not less than 100% of the market value of the loaned securities during the period of the loan. The market value of the loaned securities is determined at the close of business of the Fund and any additional required collateral is delivered to the Fund on the next business day. If the borrower defaults on its obligation to return the securities loaned because of insolvency or other reasons, a fund could experience delays and costs in recovering the securities loaned or in gaining access to the collateral. Any cash collateral received is invested in the Fidelity Securities Lending Cash Central Fund. The value of loaned securities and cash collateral at period end are disclosed on the Fund's Statement of Assets and Liabilities. Security lending income represents the income earned on investing cash collateral, less rebates paid to borrowers and any lending agent fees associated with the loan, plus any premium payments received for lending certain types of securities. Security lending income is presented in the Statement of Operations as a component of income from Fidelity Central Funds. Total security lending income during the period amounted to $257,878. During the period, there were no securities loaned to FCM.
8. Expense Reductions.
Many of the brokers with whom FMR places trades on behalf of the Fund provided services to the Fund in addition to trade execution. These services included payments of certain expenses on behalf of the Fund totaling $1,950,355 for the period. In addition, through arrangements with the Fund's custodian, credits realized as a result of uninvested cash balances were used to reduce the Fund's expenses. During the period, these credits reduced the Fund's custody expenses by $484.
Annual Report
Notes to Financial Statements - continued
9. Distributions to Shareholders.
Distributions to shareholders of each class were as follows:
Years ended October 31, | 2012 | 2011 |
From net investment income | | |
Emerging Markets | $ 38,359,433 | $ 38,140,950 |
Class K | 8,543,746 | 11,296,849 |
Total | $ 46,903,179 | $ 49,437,799 |
From net realized gain | | |
Emerging Markets | $ - | $ 20,164,680 |
Class K | - | 4,525,755 |
Total | $ - | $ 24,690,435 |
10. Share Transactions.
Transactions for each class of shares were as follows:
| Shares | Dollars |
Years ended October 31, | 2012 | 2011 | 2012 | 2011 |
Emerging Markets | | | | |
Shares sold | 17,560,683 | 35,985,818 | $ 382,055,836 | $ 924,231,122 |
Reinvestment of distributions | 1,697,255 | 2,151,168 | 36,745,572 | 55,865,828 |
Shares redeemed | (50,595,892) | (61,852,310) | (1,110,238,720) | (1,567,144,468) |
Net increase (decrease) | (31,337,954) | (23,715,324) | $ (691,437,312) | $ (587,047,518) |
Class K | | | | |
Shares sold | 14,677,576 | 11,514,792 | $ 321,820,048 | $ 289,925,357 |
Reinvestment of distributions | 395,361 | 610,205 | 8,543,746 | 15,822,605 |
Shares redeemed | (10,025,395) | (24,238,483) | (217,567,010) | (577,946,139) |
Net increase (decrease) | 5,047,542 | (12,113,486) | $ 112,796,784 | $ (272,198,177) |
11. Other.
The Fund's organizational documents provide former and current trustees and officers with a limited indemnification against liabilities arising in connection with the performance of their duties to the Fund. In the normal course of business, the Fund may also enter into contracts that provide general indemnifications. The Fund's maximum exposure under these arrangements is unknown as this would be dependent on future claims that may be made against the Fund. The risk of material loss from such claims is considered remote.
Annual Report
Fidelity Europe Capital Appreciation Fund
Average annual total return reflects the change in the value of an investment, assuming reinvestment of the fund's distributions from dividend income and capital gains (the profits earned upon the sale of securities that have grown in value, if any) and assuming a constant rate of performance each year. The $10,000 table and the fund's returns do not reflect the deduction of taxes that a shareholder would pay on fund distributions or the redemption of fund shares. During periods of reimbursement by Fidelity, a fund's total return will be greater than it would be had the reimbursement not occurred. How a fund did yesterday is no guarantee of how it will do tomorrow.
Average Annual Total Returns
Periods ended October 31, 2012 | Past 1
year | Past 5
years | Past 10
years |
Fidelity Europe Capital Appreciation Fund | 11.54% | -6.22% | 8.23% |
$10,000 Over 10 Years
Let's say hypothetically that $10,000 was invested in Fidelity Europe Capital Appreciation Fund on October 31, 2002. The chart shows how the value of your investment would have changed, and also shows how the MSCI Europe Index performed over the same period.
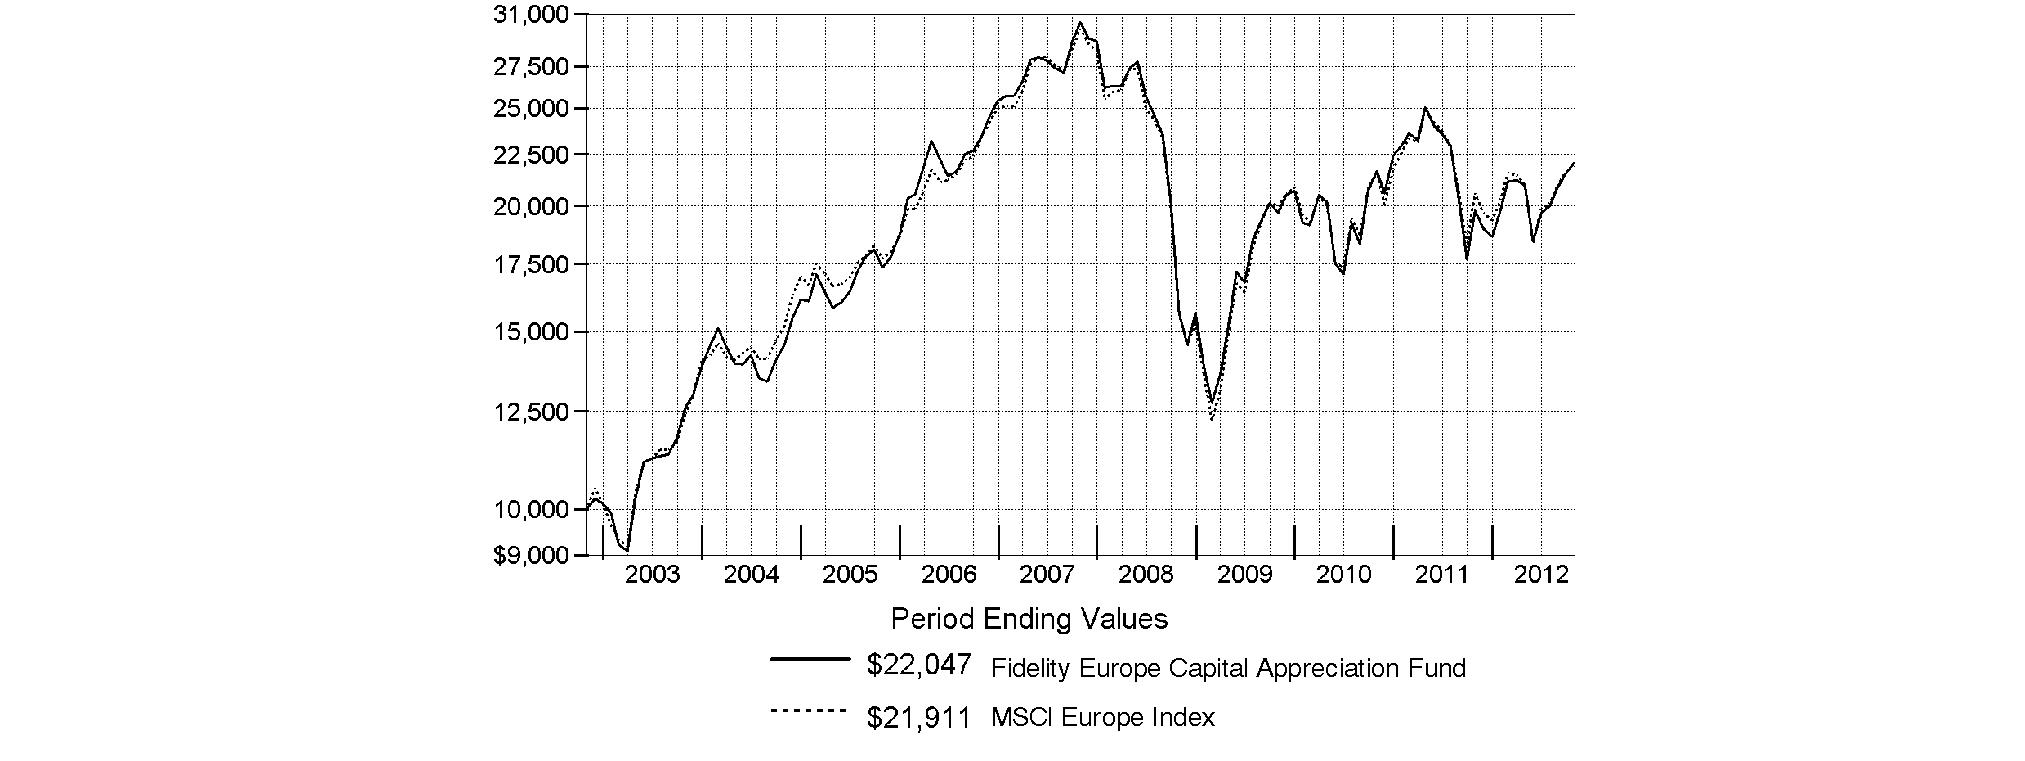
Annual Report
Fidelity Europe Capital Appreciation Fund
Market Recap: Returns for most domestic and international equities fluctuated during the 12 months ending October 31, 2012, as investor sentiment towards risk vacillated amid a changing global economic landscape. U.S. stocks overcame bouts of volatility to post strong gains for the past year, extending an uptrend that began in March 2009. The broad-based S&P 500® Index advanced 15.21%, while the blue-chip-laden Dow Jones Industrial AverageSM and technology-heavy Nasdaq Composite® Index rose 12.56% and 12.21%, respectively. Performance outside of the U.S. was relatively weak, as the MSCI® ACWI® (All Country World Index) ex USA Index rose 4.11%, hampered in part by a stronger U.S. dollar. International developed-markets generally struggled during the period as macroeconomic concerns ebbed and flowed, finishing with only a modest gain. The MSCI® EAFE® Index rose 4.76% for the year, largely buttressed in the summertime by pledges of accommodative monetary action from eurozone officials, as well as signs that the U.S. housing market was on the mend. Within the index, Asia-Pacific ex Japan showed the most impressive gain, advancing roughly 10%. A number of core European components, including Germany (+11%) and Switzerland (+10%), and the U.K. (+9%), benefited from optimism about the eurozone's ability to resolve its debt woes, which helped the region outpace the index overall. Elsewhere, Japan was among the few benchmark constituents to finish in the red, returning about -3%. Emerging-markets stocks gained 2.98% for the year, as measured by the MSCI Emerging Markets Index. A general uptrend in the final five months of the period lifted the index into positive territory for the full 12 months.
Comments from Melissa Reilly, Portfolio Manager of Fidelity® Europe Capital Appreciation Fund: For the year, the fund rose 11.54%, outperforming the 6.48% gain of the MSCI® Europe Index. Stock selection overall was beneficial, particularly in the consumer durables/apparel and media groups within consumer discretionary. Positioning in information technology, mostly within technology hardware/equipment, was additive. Stock selection in Spain, France and the U.K. also helped. Individual contributors included: an out-of-index position in U.K. marketing services company Aegis Group, which was sold; Spanish blood plasma developer Grifols; not owning index component Telefonica, a Spanish telecommunication firm, for nearly the entire period; and an out-of-benchmark stake in U.K. homebuilder Barratt Developments. Conversely, positioning in the food/beverage/tobacco and household/personal products segments of consumer staples hurt, as did positioning in the insurance area of financials. Also detrimental was a slight overweighting among banks, despite strong picks in this group. Out-of-index picks in the U.S., as well as positioning in Belgium and Switzerland, were negative. On an individual basis, untimely ownership of Anglo American, a U.K. mining company, was the most significant detractor. The stock was sold by period end. The fund also was hurt by underweighting two solidly performing index components, Belgian brewer Anheuser-Busch InBev, and Swiss pharmaceutical giant Roche Holding.
The views expressed above reflect those of the portfolio manager(s) only through the end of the period as stated on the cover of this report and do not necessarily represent the views of Fidelity or any other person in the Fidelity organization. Any such views are subject to change at any time based upon market or other conditions and Fidelity disclaims any responsibility to update such views. These views may not be relied on as investment advice and, because investment decisions for a Fidelity fund are based on numerous factors, may not be relied on as an indication of trading intent on behalf of any Fidelity fund.
Annual Report
Fidelity Europe Capital Appreciation Fund
As a shareholder of the Fund, you incur two types of costs: (1) transaction costs, including redemption fees and (2) ongoing costs, including management fees and other Fund expenses. This Example is intended to help you understand your ongoing costs (in dollars) of investing in the Fund and to compare these costs with the ongoing costs of investing in other mutual funds.
The Example is based on an investment of $1,000 invested at the beginning of the period and held for the entire period (May 1, 2012 to October 31, 2012).
Actual Expenses
The first line of the accompanying table provides information about actual account values and actual expenses. You may use the information in this line, together with the amount you invested, to estimate the expenses that you paid over the period. Simply divide your account value by $1,000.00 (for example, an $8,600 account value divided by $1,000.00 = 8.6), then multiply the result by the number in the first line under the heading entitled "Expenses Paid During Period" to estimate the expenses you paid on your account during this period. A small balance maintenance fee of $12.00 that is charged once a year may apply for certain accounts with a value of less than $2,000. This fee is not included in the table below. If it was, the estimate of expenses you paid during the period would be higher, and your ending account value lower, by this amount. In addition, the Fund, as a shareholder in the underlying Fidelity Central Funds, will indirectly bear its pro-rata share of the fees and expenses incurred by the underlying Fidelity Central Funds. These fees and expenses are not included in the Fund's annualized expense ratio used to calculate the expense estimate in the table below.
Hypothetical Example for Comparison Purposes
The second line of the accompanying table provides information about hypothetical account values and hypothetical expenses based on the Fund's actual expense ratio and an assumed rate of return of 5% per year before expenses, which is not the Fund's actual return. The hypothetical account values and expenses may not be used to estimate the actual ending account balance or expenses you paid for the period. You may use this information to compare the ongoing costs of investing in the Fund and other funds. To do so, compare this 5% hypothetical example with the 5% hypothetical examples that appear in the shareholder reports of the other funds. A small balance maintenance fee of $12.00 that is charged once a year may apply for certain accounts with a value of less than $2,000. This fee is not included in the table below. If it was, the estimate of expenses you paid during the period would be higher, and your ending account value lower, by this amount. In addition, the Fund, as a shareholder in the underlying Fidelity Central Funds, will indirectly bear its pro-rata share of the fees and expenses incurred by the underlying Fidelity Central Funds. These fees and expenses are not included in the Fund's annualized expense ratio used to calculate the expense estimate in the table below.
Please note that the expenses shown in the table are meant to highlight your ongoing costs only and do not reflect any transaction costs. Therefore, the second line of the table is useful in comparing ongoing costs only, and will not help you determine the relative total costs of owning different funds. In addition, if these transactional costs were included, your costs would have been higher.
| Annualized
Expense Ratio | Beginning
Account Value
May 1, 2012 | Ending
Account Value
October 31, 2012 | Expenses Paid
During Period*
May 1, 2012
to October 31, 2012 |
Actual | 1.02% | $ 1,000.00 | $ 1,053.50 | $ 5.27 |
Hypothetical (5% return per year before expenses) | | $ 1,000.00 | $ 1,020.01 | $ 5.18 |
* Expenses are equal to the Fund's annualized expense ratio, multiplied by the average account value over the period, multiplied by 184/366 (to reflect the one-half year period).
Annual Report
Fidelity Europe Capital Appreciation Fund
Investment Changes (Unaudited)
Geographic Diversification (% of fund's net assets) |
As of October 31, 2012 |
| United Kingdom | 37.2% | |
| France | 10.9% | |
| Germany | 10.1% | |
| Switzerland | 8.2% | |
| Spain | 6.8% | |
| United States of America | 4.8% | |
| Netherlands | 4.7% | |
| Italy | 3.8% | |
| Bailiwick of Jersey | 3.7% | |
| Other | 9.8% | |

Percentages are based on country or territory of incorporation and are adjusted for the effect of futures contracts, if applicable. |
As of April 30, 2012 |
| United Kingdom | 39.2% | |
| France | 13.2% | |
| Germany | 9.8% | |
| Switzerland | 7.3% | |
| United States of America | 5.7% | |
| Italy | 4.9% | |
| Spain | 3.2% | |
| Bailiwick of Jersey | 3.2% | |
| Netherlands | 3.0% | |
| Other | 10.5% | |

Percentages are based on country or territory of incorporation and are adjusted for the effect of futures contracts, if applicable. |
Asset Allocation |
| % of fund's
net assets | % of fund's net assets
6 months ago |
Stocks | 99.8 | 98.7 |
Short-Term Investments and Net Other Assets (Liabilities) | 0.2 | 1.3 |
Top Ten Stocks as of October 31, 2012 |
| % of fund's
net assets | % of fund's net assets
6 months ago |
Nestle SA (Switzerland, Food Products) | 3.6 | 3.6 |
Royal Dutch Shell PLC Class A (United Kingdom) (United Kingdom, Oil, Gas & Consumable Fuels) | 3.6 | 3.7 |
HSBC Holdings PLC (United Kingdom) (United Kingdom, Commercial Banks) | 3.2 | 2.1 |
Sanofi SA (France, Pharmaceuticals) | 3.1 | 2.6 |
Vodafone Group PLC (United Kingdom, Wireless Telecommunication Services) | 2.2 | 1.3 |
Unilever PLC (United Kingdom, Food Products) | 2.1 | 0.0 |
British American Tobacco PLC (United Kingdom) (United Kingdom, Tobacco) | 1.9 | 2.5 |
Bayer AG (Germany, Pharmaceuticals) | 1.7 | 1.4 |
Novo Nordisk A/S Series B (Denmark, Pharmaceuticals) | 1.7 | 1.8 |
BHP Billiton PLC (United Kingdom, Metals & Mining) | 1.6 | 0.0 |
| 24.7 | |
Market Sectors as of October 31, 2012 |
| % of fund's
net assets | % of fund's net assets
6 months ago |
Consumer Discretionary | 17.6 | 19.0 |
Financials | 17.2 | 17.6 |
Consumer Staples | 17.2 | 14.0 |
Health Care | 11.8 | 12.5 |
Industrials | 9.9 | 9.1 |
Energy | 8.5 | 9.1 |
Materials | 8.1 | 9.0 |
Information Technology | 5.5 | 6.3 |
Telecommunication Services | 4.0 | 2.1 |
Annual Report
Fidelity Europe Capital Appreciation Fund
Investments October 31, 2012
Showing Percentage of Net Assets
Common Stocks - 97.8% |
| Shares | | Value |
Bailiwick of Jersey - 3.7% |
Experian PLC | 257,100 | | $ 4,439,378 |
Randgold Resources Ltd. | 19,600 | | 2,342,936 |
Shire PLC | 72,782 | | 2,046,598 |
Wolseley PLC | 55,900 | | 2,443,752 |
TOTAL BAILIWICK OF JERSEY | | 11,272,664 |
Belgium - 2.2% |
Anheuser-Busch InBev SA NV | 50,600 | | 4,231,737 |
KBC Groupe SA | 76,795 | | 1,802,630 |
UCB SA | 13,400 | | 781,578 |
TOTAL BELGIUM | | 6,815,945 |
Canada - 0.5% |
Suncor Energy, Inc. | 46,300 | | 1,553,918 |
Denmark - 1.7% |
Novo Nordisk A/S Series B | 31,930 | | 5,118,874 |
Finland - 0.4% |
Sampo OYJ (A Shares) | 42,100 | | 1,319,452 |
France - 10.9% |
Arkema SA | 19,900 | | 1,814,307 |
Atos Origin SA | 21,727 | | 1,459,045 |
BNP Paribas SA | 85,860 | | 4,319,066 |
Carrefour SA | 72,303 | | 1,746,858 |
Christian Dior SA | 13,100 | | 1,880,487 |
Credit Agricole SA (a) | 169,600 | | 1,276,755 |
Dassault Systemes SA | 14,500 | | 1,527,778 |
Essilor International SA | 22,110 | | 1,993,155 |
Eurofins Scientific SA | 12,200 | | 1,886,494 |
PPR SA | 20,600 | | 3,621,949 |
Sanofi SA | 108,616 | | 9,539,469 |
Vivendi SA | 123,666 | | 2,530,173 |
TOTAL FRANCE | | 33,595,536 |
Germany - 8.1% |
adidas AG | 24,200 | | 2,061,742 |
BASF AG | 28,440 | | 2,356,620 |
Bayer AG | 59,800 | | 5,207,881 |
Brenntag AG | 13,400 | | 1,688,904 |
Deutsche Boerse AG | 25,400 | | 1,374,832 |
Fresenius Medical Care AG & Co. KGaA | 24,400 | | 1,714,448 |
GSW Immobilien AG | 41,000 | | 1,686,998 |
HeidelbergCement Finance AG | 45,300 | | 2,400,881 |
KUKA AG (a) | 23,400 | | 701,531 |
SAP AG | 48,994 | | 3,572,792 |
Software AG (Bearer) | 20,300 | | 813,299 |
Wirecard AG | 68,100 | | 1,556,162 |
TOTAL GERMANY | | 25,136,090 |
Greece - 0.2% |
Jumbo SA | 114,000 | | 753,582 |
|
| Shares | | Value |
Ireland - 1.6% |
Elan Corp. PLC (a) | 183,800 | | $ 2,000,320 |
Glanbia PLC | 125,500 | | 1,190,721 |
Ingersoll-Rand PLC | 39,000 | | 1,834,170 |
TOTAL IRELAND | | 5,025,211 |
Italy - 3.8% |
Brunello Cucinelli SpA | 36,200 | | 640,467 |
ENI SpA | 208,300 | | 4,793,176 |
Geox SpA (d) | 397,700 | | 1,133,023 |
Prada SpA | 248,400 | | 2,025,649 |
Prysmian SpA | 93,700 | | 1,802,307 |
Saipem SpA | 30,798 | | 1,383,587 |
TOTAL ITALY | | 11,778,209 |
Netherlands - 4.7% |
Aalberts Industries NV | 51,200 | | 929,080 |
AEGON NV | 358,400 | | 2,004,408 |
ASML Holding NV (Netherlands) | 19,600 | | 1,077,456 |
D.E Master Blenders 1753 NV (a) | 198,000 | | 2,419,837 |
Heineken NV (Bearer) | 27,800 | | 1,713,908 |
Koninklijke Philips Electronics NV | 78,700 | | 1,971,125 |
LyondellBasell Industries NV Class A | 38,400 | | 2,050,176 |
NXP Semiconductors NV (a) | 47,600 | | 1,154,776 |
Randstad Holding NV | 39,000 | | 1,273,098 |
TOTAL NETHERLANDS | | 14,593,864 |
Norway - 0.5% |
DnB NOR ASA | 124,200 | | 1,551,057 |
South Africa - 0.3% |
Naspers Ltd. Class N | 15,700 | | 1,019,265 |
Spain - 6.8% |
Amadeus IT Holding SA Class A | 49,000 | | 1,213,067 |
Banco Bilbao Vizcaya Argentaria SA | 521,438 | | 4,357,113 |
Distribuidora Internacional de Alimentacion SA | 140,800 | | 852,265 |
Grifols SA (a) | 55,700 | | 1,931,953 |
Grifols SA ADR | 68,500 | | 1,723,460 |
Inditex SA | 37,423 | | 4,774,913 |
Repsol YPF SA | 151,930 | | 3,036,569 |
Telefonica SA | 236,631 | | 3,123,246 |
TOTAL SPAIN | | 21,012,586 |
Sweden - 2.4% |
H&M Hennes & Mauritz AB (B Shares) | 74,114 | | 2,508,494 |
Swedbank AB (A Shares) | 151,958 | | 2,817,898 |
Swedish Match Co. AB | 61,800 | | 2,105,685 |
TOTAL SWEDEN | | 7,432,077 |
Switzerland - 8.2% |
Actelion Ltd. | 21,583 | | 1,041,027 |
Adecco SA (Reg.) | 25,048 | | 1,211,384 |
Credit Suisse Group | 42,556 | | 989,655 |
Credit Suisse Group sponsored ADR | 20,500 | | 478,470 |
Common Stocks - continued |
| Shares | | Value |
Switzerland - continued |
Nestle SA | 176,958 | | $ 11,229,696 |
Schindler Holding AG (participation certificate) | 19,666 | | 2,591,021 |
Syngenta AG (Switzerland) | 8,240 | | 3,212,690 |
UBS AG | 310,588 | | 4,659,936 |
TOTAL SWITZERLAND | | 25,413,879 |
United Kingdom - 37.2% |
Antofagasta PLC | 76,500 | | 1,551,790 |
ASOS PLC (a) | 19,400 | | 705,967 |
Barclays PLC | 984,014 | | 3,638,623 |
Barratt Developments PLC (a) | 1,129,500 | | 3,455,897 |
Bellway PLC | 148,900 | | 2,429,305 |
BG Group PLC | 121,441 | | 2,248,818 |
BHP Billiton PLC | 155,354 | | 4,979,291 |
British American Tobacco PLC (United Kingdom) | 116,300 | | 5,768,435 |
British Land Co. PLC | 279,952 | | 2,387,618 |
Ensco PLC Class A | 28,200 | | 1,630,524 |
Filtrona PLC | 250,200 | | 2,313,546 |
Hilton Food Group PLC | 172,000 | | 770,937 |
HSBC Holdings PLC (United Kingdom) | 990,900 | | 9,769,571 |
Intertek Group PLC | 33,100 | | 1,505,772 |
Kingfisher PLC | 418,900 | | 1,957,020 |
Lloyds Banking Group PLC (a) | 1,948,200 | | 1,282,896 |
Meggitt PLC | 379,700 | | 2,365,180 |
Michael Page International PLC | 308,600 | | 1,794,804 |
Next PLC | 50,300 | | 2,894,580 |
Old Mutual PLC | 812,437 | | 2,255,041 |
Persimmon PLC | 214,400 | | 2,750,605 |
Prudential PLC | 234,712 | | 3,223,441 |
Reckitt Benckiser Group PLC | 68,600 | | 4,151,372 |
Redrow PLC (a) | 870,500 | | 2,216,726 |
Rightmove PLC | 23,700 | | 616,141 |
Rolls-Royce Group PLC | 252,538 | | 3,482,371 |
Rolls-Royce Group PLC Class C | 19,192,888 | | 30,973 |
Royal Dutch Shell PLC Class A (United Kingdom) | 319,482 | | 10,962,306 |
SABMiller PLC | 94,100 | | 4,030,961 |
Serco Group PLC | 101,736 | | 930,060 |
Standard Chartered PLC (United Kingdom) | 103,871 | | 2,453,145 |
Taylor Wimpey PLC | 4,748,500 | | 4,682,027 |
Ted Baker PLC | 120,300 | | 1,840,392 |
Tesco PLC | 493,500 | | 2,547,239 |
Unilever PLC | 169,300 | | 6,315,430 |
Vodafone Group PLC | 2,453,700 | | 6,663,355 |
Whitbread PLC | 58,304 | | 2,211,070 |
TOTAL UNITED KINGDOM | | 114,813,229 |
United States of America - 4.6% |
Apple, Inc. | 1,600 | | 952,160 |
|
| Shares | | Value |
Beam, Inc. | 35,000 | | $ 1,944,600 |
Estee Lauder Companies, Inc. Class A | 21,600 | | 1,330,992 |
Freeport-McMoRan Copper & Gold, Inc. | 29,900 | | 1,162,512 |
Gilead Sciences, Inc. (a) | 18,400 | | 1,235,744 |
McGraw-Hill Companies, Inc. | 23,000 | | 1,271,440 |
Noble Energy, Inc. | 9,000 | | 855,090 |
salesforce.com, Inc. (a) | 8,800 | | 1,284,624 |
Theravance, Inc. (a) | 29,200 | | 657,292 |
Visa, Inc. Class A | 15,800 | | 2,192,408 |
Yum! Brands, Inc. | 17,700 | | 1,240,947 |
TOTAL UNITED STATES OF AMERICA | | 14,127,809 |
TOTAL COMMON STOCKS (Cost $275,776,633) |
302,333,247
|
Nonconvertible Preferred Stocks - 2.0% |
| | | |
Germany - 2.0% |
Porsche Automobil Holding SE (Germany) | 28,700 | | 1,905,359 |
ProSiebenSat.1 Media AG | 50,900 | | 1,418,442 |
Volkswagen AG | 13,200 | | 2,730,625 |
TOTAL NONCONVERTIBLE PREFERRED STOCKS (Cost $4,994,407) |
6,054,426
|
Money Market Funds - 0.5% |
| | | |
Fidelity Cash Central Fund, 0.19% (b) | 1,357,810 | | 1,357,810 |
Fidelity Securities Lending Cash Central Fund, 0.19% (b)(c) | 279,315 | | 279,315 |
TOTAL MONEY MARKET FUNDS (Cost $1,637,125) |
1,637,125
|
TOTAL INVESTMENT PORTFOLIO - 100.3% (Cost $282,408,165) | | 310,024,798 |
NET OTHER ASSETS (LIABILITIES) - (0.3)% | | (1,001,872) |
NET ASSETS - 100% | $ 309,022,926 |
Legend |
(a) Non-income producing |
(b) Affiliated fund that is available only to investment companies and other accounts managed by Fidelity Investments. The rate quoted is the annualized seven-day yield of the fund at period end. A complete unaudited listing of the fund's holdings as of its most recent quarter end is available upon request. In addition, each Fidelity Central Fund's financial statements, which are not covered by the Fund's Report of Independent Registered Public Accounting Firm, are available on the SEC's website or upon request. |
(c) Investment made with cash collateral received from securities on loan. |
(d) Security or a portion of the security is on loan at period end. |
Affiliated Central Funds |
Information regarding fiscal year to date income earned by the Fund from investments in Fidelity Central Funds is as follows: |
Fund | Income earned |
Fidelity Cash Central Fund | $ 6,839 |
Fidelity Securities Lending Cash Central Fund | 175,043 |
Total | $ 181,882 |
Other Information |
Categorizations in the Schedule of Investments are based on country or territory of incorporation. |
The following is a summary of the inputs used, as of October 31, 2012, involving the Fund's assets and liabilities carried at fair value. The inputs or methodology used for valuing securities may not be an indication of the risk associated with investing in those securities. For more information on valuation inputs, and their aggregation into the levels used in the tables below, please refer to the Security Valuation section in the accompanying Notes to Financial Statements. |
Valuation Inputs at Reporting Date: |
Description | Total | Level 1 | Level 2 | Level 3 |
Investments in Securities: | | | | |
Equities: | | | | |
Consumer Discretionary | $ 54,746,114 | $ 54,746,114 | $ - | $ - |
Consumer Staples | 52,350,673 | 36,035,071 | 16,315,602 | - |
Energy | 26,463,988 | 10,708,506 | 15,755,482 | - |
Financials | 53,648,605 | 23,722,962 | 29,925,643 | - |
Health Care | 36,878,293 | 16,458,584 | 20,419,709 | - |
Industrials | 30,994,910 | 29,023,785 | 1,971,125 | - |
Information Technology | 16,803,567 | 12,153,319 | 4,650,248 | - |
Materials | 24,184,749 | 13,649,832 | 10,534,917 | - |
Telecommunication Services | 12,316,774 | 2,530,173 | 9,786,601 | - |
Money Market Funds | 1,637,125 | 1,637,125 | - | - |
Total Investments in Securities: | $ 310,024,798 | $ 200,665,471 | $ 109,359,327 | $ - |
The following is a summary of transfers between Level 1 and Level 2 for the period ended October 31, 2012. Transfers are assumed to have occurred at the beginning of the period, and are primarily attributable to the valuation techniques used for foreign equity securities, as discussed in the accompanying Notes to Financial Statements: |
Transfers | Total |
Level 1 to Level 2 | $ 0 |
Level 2 to Level 1 | $ 3,366,986 |
See accompanying notes which are an integral part of the financial statements.
Annual Report
Fidelity Europe Capital Appreciation Fund
Statement of Assets and Liabilities
| October 31, 2012 |
| | |
Assets | | |
Investment in securities, at value (including securities loaned of $265,340) - See accompanying schedule: Unaffiliated issuers (cost $280,771,040) | $ 308,387,673 | |
Fidelity Central Funds (cost $1,637,125) | 1,637,125 | |
Total Investments (cost $282,408,165) | | $ 310,024,798 |
Receivable for investments sold | | 3,110,581 |
Receivable for fund shares sold | | 383,978 |
Dividends receivable | | 632,020 |
Distributions receivable from Fidelity Central Funds | | 2,026 |
Other receivables | | 18,380 |
Total assets | | 314,171,783 |
| | |
Liabilities | | |
Payable for investments purchased | $ 3,640,737 | |
Payable for fund shares redeemed | 894,711 | |
Accrued management fee | 205,992 | |
Other affiliated payables | 75,173 | |
Other payables and accrued expenses | 52,929 | |
Collateral on securities loaned, at value | 279,315 | |
Total liabilities | | 5,148,857 |
| | |
Net Assets | | $ 309,022,926 |
Net Assets consist of: | | |
Paid in capital | | $ 583,782,126 |
Undistributed net investment income | | 6,223,926 |
Accumulated undistributed net realized gain (loss) on investments and foreign currency transactions | | (308,597,894) |
Net unrealized appreciation (depreciation) on investments and assets and liabilities in foreign currencies | | 27,614,768 |
Net Assets, for 16,886,625 shares outstanding | | $ 309,022,926 |
Net Asset Value, offering price and redemption price per share ($309,022,926 ÷ 16,886,625 shares) | | $ 18.30 |
Statement of Operations
| Year ended October 31, 2012 |
| | |
Investment Income | | |
Dividends | | $ 10,185,510 |
Income from Fidelity Central Funds | | 181,882 |
Income before foreign taxes withheld | | 10,367,392 |
Less foreign taxes withheld | | (724,309) |
Total income | | 9,643,083 |
| | |
Expenses | | |
Management fee Basic fee | $ 2,159,585 | |
Performance adjustment | (342,635) | |
Transfer agent fees | 774,296 | |
Accounting and security lending fees | 159,114 | |
Custodian fees and expenses | 54,735 | |
Independent trustees' compensation | 2,075 | |
Registration fees | 20,389 | |
Audit | 55,197 | |
Legal | 2,451 | |
Miscellaneous | 3,158 | |
Total expenses before reductions | 2,888,365 | |
Expense reductions | (97,785) | 2,790,580 |
Net investment income (loss) | | 6,852,503 |
Realized and Unrealized Gain (Loss) Net realized gain (loss) on: | | |
Investment securities: | | |
Unaffiliated issuers | (20,223,212) | |
Foreign currency transactions | (52,814) | |
Total net realized gain (loss) | | (20,276,026) |
Change in net unrealized appreciation (depreciation) on: Investment securities | 45,263,976 | |
Assets and liabilities in foreign currencies | (68,206) | |
Total change in net unrealized appreciation (depreciation) | | 45,195,770 |
Net gain (loss) | | 24,919,744 |
Net increase (decrease) in net assets resulting from operations | | $ 31,772,247 |
See accompanying notes which are an integral part of the financial statements.
Annual Report
Fidelity Europe Capital Appreciation Fund
Financial Statements - continued
Statement of Changes in Net Assets
| Year ended
October 31,
2012 | Year ended
October 31,
2011 |
Increase (Decrease) in Net Assets | | |
Operations | | |
Net investment income (loss) | $ 6,852,503 | $ 6,789,622 |
Net realized gain (loss) | (20,276,026) | 41,416,667 |
Change in net unrealized appreciation (depreciation) | 45,195,770 | (77,765,188) |
Net increase (decrease) in net assets resulting from operations | 31,772,247 | (29,558,899) |
Distributions to shareholders from net investment income | (7,037,971) | (4,458,817) |
Distributions to shareholders from net realized gain | (136,470) | - |
Total distributions | (7,174,441) | (4,458,817) |
Share transactions Proceeds from sales of shares | 23,262,285 | 31,378,501 |
Reinvestment of distributions | 6,834,917 | 4,246,516 |
Cost of shares redeemed | (78,869,598) | (126,292,441) |
Net increase (decrease) in net assets resulting from share transactions | (48,772,396) | (90,667,424) |
Redemption fees | 4,159 | 29,241 |
Total increase (decrease) in net assets | (24,170,431) | (124,655,899) |
| | |
Net Assets | | |
Beginning of period | 333,193,357 | 457,849,256 |
End of period (including undistributed net investment income of $6,223,926 and undistributed net investment income of $6,439,498, respectively) | $ 309,022,926 | $ 333,193,357 |
Other Information Shares | | |
Sold | 1,368,457 | 1,658,219 |
Issued in reinvestment of distributions | 433,138 | 225,658 |
Redeemed | (4,755,853) | (6,711,062) |
Net increase (decrease) | (2,954,258) | (4,827,185) |
Financial Highlights
Years ended October 31, | 2012 | 2011 | 2010 | 2009 | 2008 |
Selected Per-Share Data | | | | | |
Net asset value, beginning of period | $ 16.79 | $ 18.56 | $ 17.16 | $ 14.27 | $ 32.66 |
Income from Investment Operations | | | | | |
Net investment income (loss) B | .38 | .31 | .19 | .31 | .50 |
Net realized and unrealized gain (loss) | 1.50 | (1.89) | 1.53 | 3.14 | (14.11) |
Total from investment operations | 1.88 | (1.58) | 1.72 | 3.45 | (13.61) |
Distributions from net investment income | (.36) | (.19) | (.32) | (.56) | (.56) |
Distributions from net realized gain | (.01) | - | - | - | (4.22) |
Total distributions | (.37) | (.19) | (.32) | (.56) | (4.78) |
Redemption fee added to paid in capital B, F | - | - | - | - | - |
Net asset value, end of period | $ 18.30 | $ 16.79 | $ 18.56 | $ 17.16 | $ 14.27 |
Total Return A | 11.54% | (8.65)% | 10.08% | 25.79% | (48.58)% |
Ratios to Average Net Assets C, E | | | | | |
Expenses before reductions | .95% | 1.02% | 1.03% | 1.10% | 1.16% |
Expenses net of fee waivers, if any | .95% | 1.02% | 1.03% | 1.10% | 1.16% |
Expenses net of all reductions | .92% | .98% | .96% | 1.07% | 1.12% |
Net investment income (loss) | 2.25% | 1.65% | 1.13% | 2.16% | 2.11% |
Supplemental Data | | | | | |
Net assets, end of period (000 omitted) | $ 309,023 | $ 333,193 | $ 457,849 | $ 520,984 | $ 493,654 |
Portfolio turnover rate D | 92% | 116% | 133% | 111% | 112% |
A Total returns would have been lower if certain expenses had not been reduced during the applicable periods shown. B Calculated based on average shares outstanding during the period. C Fees and expenses of any underlying Fidelity Central Funds are not included in the Fund's expense ratio. The Fund indirectly bears its proportionate share of the expenses of any underlying Fidelity Central Funds. D Amount does not include the portfolio activity of any underlying Fidelity Central Funds. E Expense ratios reflect operating expenses of the Fund. Expenses before reductions do not reflect amounts reimbursed by the investment adviser or reductions from brokerage service arrangements or reductions from other expense offset arrangements and do not represent the amount paid by the Fund during periods when reimbursements or reductions occur. Expenses net of fee waivers reflect expenses after reimbursement by the investment adviser but prior to reductions from brokerage service arrangements or other expense offset arrangements. Expenses net of all reductions represent the net expenses paid by the Fund. F Amount represents less than $.01 per share. |
See accompanying notes which are an integral part of the financial statements.
Annual Report
Notes to Financial Statements
For the period ended October 31, 2012
1. Organization.
Fidelity Europe Capital Appreciation Fund (the Fund) is a fund of Fidelity Investment Trust (the Trust) and is authorized to issue an unlimited number of shares. The Trust is registered under the Investment Company Act of 1940, as amended (the 1940 Act), as an open-end management investment company organized as a Massachusetts business trust.
2. Investments in Fidelity Central Funds.
The Fund invests in Fidelity Central Funds, which are open-end investment companies available only to other investment companies and accounts managed by Fidelity Management & Research Company (FMR) and its affiliates. The Fund's Schedule of Investments lists each of the Fidelity Central Funds held as of period end, if any, as an investment of the Fund, but does not include the underlying holdings of each Fidelity Central Fund. As an Investing Fund, the Fund indirectly bears its proportionate share of the expenses of the underlying Fidelity Central Funds.
The Money Market Central Funds seek preservation of capital and current income and are managed by Fidelity Investments Money Management, Inc. (FIMM), an affiliate of FMR.
A complete unaudited list of holdings for each Fidelity Central Fund is available upon request or at the Securities and Exchange Commission (the SEC) web site at www.sec.gov. In addition, the financial statements of the Fidelity Central Funds, which are not covered by the Fund's Report of Independent Registered Public Accounting Firm, are available on the SEC web site or upon request.
3. Significant Accounting Policies.
The financial statements have been prepared in conformity with accounting principles generally accepted in the United States of America (GAAP), which require management to make certain estimates and assumptions at the date of the financial statements. Actual results could differ from those estimates. Subsequent events, if any, through the date that the financial statements were issued have been evaluated in the preparation of the financial statements. The following summarizes the significant accounting policies of the Fund:
Security Valuation. Investments are valued as of 4:00 p.m. Eastern time on the last calendar day of the period. In accordance with valuation policies and procedures approved by the Board of Trustees (the Board), the Fund attempts to obtain prices from one or more third party pricing vendors or brokers to value its investments. When current market prices, quotations or rates are not readily available or reliable, securities will be fair valued in good faith by the FMR Fair Value Committee (the Committee), in accordance with procedures adopted by the Fund's Board. Factors used in determining fair value vary by security type and may include market or security specific events. The frequency with which these procedures are used cannot be predicted and they may be utilized to a significant extent. The Committee oversees the Fund's valuation policies and procedures and is responsible for approving and reporting to the Board all fair value determinations.
The Fund categorizes the inputs to valuation techniques used to value its investments into a disclosure hierarchy consisting of three levels as shown below:
Level 1 - quoted prices in active markets for identical investments
Level 2 - other significant observable inputs (including quoted prices for similar investments, interest rates, prepayment speeds, etc.)
Level 3 - unobservable inputs (including the Fund's own assumptions based on the best information available)
Valuation techniques used to value the Fund's investments by major category are as follows:
Equity securities, including restricted securities, for which market quotations are readily available, are valued at the last reported sale price or official closing price as reported by a third party pricing vendor on the primary market or exchange on which they are traded and are categorized as Level 1 in the hierarchy. In the event there were no sales during the day or closing prices are not available, securities are valued at the last quoted bid price or may be valued using the last available price and are generally categorized as Level 2 in the hierarchy. For foreign equity securities, when significant market or security specific events arise, comparisons to the valuation of American Depositary Receipts (ADRs), futures contracts, Exchange-Traded Funds (ETFs) and certain indexes as well as quoted prices for similar securities are used and are categorized as Level 2 in the hierarchy. Utilizing these techniques may result in transfers between Level 1 and Level 2.
Investments in open-end mutual funds, including the Fidelity Central Funds, are valued at their closing net asset value (NAV) each business day and are categorized as Level 1 in the hierarchy.
Changes in valuation techniques may result in transfers in or out of an assigned level within the disclosure hierarchy. The aggregate value of investments by input level, as of October 31, 2012, including information on transfers between Levels 1 and 2, is included at the end of the Fund's Schedule of Investments.
Annual Report
3. Significant Accounting Policies - continued
Foreign Currency Translation. The Fund may use foreign currency contracts to facilitate transactions in foreign-denominated securities. Gains and losses from these transactions may arise from changes in the value of the foreign currency or if the counterparties do not perform under the contracts' terms.
Foreign-denominated assets, including investment securities, and liabilities are translated into U.S. dollars at the exchange rates at period end. Purchases and sales of investment securities, income and dividends received and expenses denominated in foreign currencies are translated into U.S. dollars at the exchange rate in effect on the transaction date.
The effects of exchange rate fluctuations on investments are included with the net realized and unrealized gain (loss) on investment securities. Other foreign currency transactions resulting in realized and unrealized gain (loss) are disclosed separately.
Investment Transactions and Income. For financial reporting purposes, the Fund's investment holdings and NAV include trades executed through the end of the last business day of the period. The NAV per share for processing shareholder transactions is calculated as of the close of business of the New York Stock Exchange (NYSE), normally 4:00 p.m. Eastern time and includes trades executed through the end of the prior business day. Gains and losses on securities sold are determined on the basis of identified cost and may include proceeds received from litigation. Dividend income is recorded on the ex-dividend date, except for certain dividends from foreign securities where the ex-dividend date may have passed, which are recorded as soon as the Fund is informed of the ex-dividend date. Non-cash dividends included in dividend income, if any, are recorded at the fair market value of the securities received. Distributions received on securities that represent a return of capital or capital gain are recorded as a reduction of cost of investments and/or as a realized gain. The Fund estimates the components of distributions received that may be considered return of capital distributions or capital gain distributions. Interest income and distributions from the Fidelity Central Funds are accrued as earned. Investment income is recorded net of foreign taxes withheld where recovery of such taxes is uncertain.
Expenses. Expenses directly attributable to a fund are charged to that fund. Expenses attributable to more than one fund are allocated among the respective funds on the basis of relative net assets or other appropriate methods. Expense estimates are accrued in the period to which they relate and adjustments are made when actual amounts are known.
Income Tax Information and Distributions to Shareholders. Each year, the Fund intends to qualify as a regulated investment company under Subchapter M of the Internal Revenue Code, including distributing substantially all of its taxable income and realized gains. As a result, no provision for income taxes is required. As of October 31, 2012, the Fund did not have any unrecognized tax benefits in the financial statements; nor is the Fund aware of any tax positions for which it is reasonably possible that the total amounts of unrecognized tax benefits will significantly change in the next twelve months. The Fund files a U.S. federal tax return, in addition to state and local tax returns as required. A fund's federal income tax returns are subject to examination by the Internal Revenue Service (IRS) for a period of three fiscal years after they are filed. State and local tax returns may be subject to examination for an additional fiscal year depending on the jurisdiction. Foreign taxes are provided for based on the Fund's understanding of the tax rules and rates that exist in the foreign markets in which it invests.
Distributions are declared and recorded on the ex-dividend date. Income and capital gain distributions are determined in accordance with income tax regulations, which may differ from GAAP.
Capital accounts within the financial statements are adjusted for permanent book-tax differences. These adjustments have no impact on net assets or the results of operations. Temporary book-tax differences will reverse in a subsequent period.
Book-tax differences are primarily due to foreign currency transaction, passive foreign investment companies (PFIC), partnerships, deferred trustees compensation, capital loss carryforwards and losses deferred due to wash sales.
The federal tax cost of investment securities and unrealized appreciation (depreciation) as of period end were as follows:
Gross unrealized appreciation | $ 36,163,736 |
Gross unrealized depreciation | (11,400,138) |
Net unrealized appreciation (depreciation) on securities and other investments | $ 24,763,598 |
| |
Tax Cost | $ 285,261,200 |
The tax-based components of distributable earnings as of period end were as follows:
Undistributed ordinary income | $ 6,224,051 |
Capital loss carryforward | $ (305,744,860) |
Net unrealized appreciation (depreciation) | $ 24,761,733 |
Annual Report
Notes to Financial Statements - continued
3. Significant Accounting Policies - continued
Income Tax Information and Distributions to Shareholders - continued
Capital loss carryforwards are only available to offset future capital gains of the Fund to the extent provided by regulations and may be limited. Under the Regulated Investment Company Modernization Act of 2010 (the Act), the Fund is permitted to carry forward capital losses incurred in taxable years beginning after December 22, 2010 for an unlimited period and such capital losses are required to be used prior to any losses that expire. Capital loss carryforwards were as follows:
Fiscal year of expiration | |
2016 | $ (147,320,172) |
2017 | (137,143,469) |
Total with expiration | (284,463,641) |
No expiration | |
Short-term | (10,703,022) |
Long-term | (10,578,197) |
Total no expiration | (21,281,219) |
Total capital loss carryforward | $ (305,744,860) |
The tax character of distributions paid was as follows:
| October 31, 2012 | October 31, 2011 |
Ordinary Income | $ 7,174,441 | $ 4,458,817 |
Short-Term Trading (Redemption) Fees. Shares held by investors in the Fund less than 30 days are subject to a redemption fee equal to 1.00% of the net asset value of shares redeemed. All redemption fees, which reduce the proceeds of the shareholder redemption, are retained by the Fund and accounted for as an addition to paid in capital.
New Accounting Pronouncement. In December 2011, the Financial Accounting Standards Board issued Accounting Standard Update No. 2011-11, Disclosures about Offsetting Assets and Liabilities. The update creates new disclosure requirements requiring entities to disclose both gross and net information for derivatives and other financial instruments that are either offset in the Statement of Assets and Liabilities or subject to an enforceable master netting arrangement or similar agreement. The disclosure requirements are effective for annual reporting periods beginning on or after January 1, 2013, and interim periods within those annual periods. Management is currently evaluating the impact of the update's adoption on the Fund's financial statement disclosures.
4. Purchases and Sales of Investments.
Purchases and sales of securities, other than short-term securities, aggregated $276,747,829 and $322,200,824, respectively.
5. Fees and Other Transactions with Affiliates.
Management Fee. FMR and its affiliates provide the Fund with investment management related services for which the Fund pays a monthly management fee. The management fee is the sum of an individual fund fee rate that is based on an annual rate of .45% of the Fund's average net assets and an annualized group fee rate that averaged .26% during the period. The group fee rate is based upon the average net assets of all the mutual funds advised by FMR. The group fee rate decreases as assets under management increase and increases as assets under management decrease. In addition, the management fee is subject to a performance adjustment (up to a maximum of ± .20% of the Fund's average net assets over a 36 month performance period). The upward or downward adjustment to the management fee is based on the Fund's relative investment performance as compared to an appropriate benchmark index. For the period, the total annual management fee rate, including the performance adjustment, was .60% of the Fund's average net assets.
Transfer Agent Fees. Fidelity Investments Institutional Operations Company, Inc. (FIIOC), an affiliate of FMR, is the Fund's transfer, dividend disbursing and shareholder servicing agent. FIIOC receives account fees and asset-based fees that vary according to account size and type of account. FIIOC pays for typesetting, printing and mailing of shareholder reports, except proxy statements. For the period, the transfer agent fees were equivalent to an annual rate of .25% of average net assets.
Accounting and Security Lending Fees. Fidelity Service Company, Inc. (FSC), an affiliate of FMR, maintains the Fund's accounting records. The accounting fee is based on the level of average net assets for each month. Under a separate contract, FSC administers the security lending program. The security lending fee is based on the number and duration of lending transactions.
Annual Report
5. Fees and Other Transactions with Affiliates - continued
Brokerage Commissions. The Fund placed a portion of its portfolio transactions with brokerage firms which are affiliates of the investment adviser . The commissions paid to these affiliated firms were $784 for the period.
6. Committed Line of Credit.
The Fund participates with other funds managed by FMR or an affiliate in a $4.25 billion credit facility (the "line of credit") to be utilized for temporary or emergency purposes to fund shareholder redemptions or for other short-term liquidity purposes. The Fund has agreed to pay commitment fees on its pro-rata portion of the line of credit, which amounted to $845 and is reflected in Miscellaneous expenses on the Statement of Operations. During the period, there were no borrowings on this line of credit.
7. Security Lending.
The Fund lends portfolio securities through a lending agent from time to time in order to earn additional income. For equity securities, a lending agent is used and may loan securities to certain qualified borrowers, including Fidelity Capital Markets (FCM), a broker-dealer affiliated with the Fund. On the settlement date of the loan, the Fund receives collateral (in the form of U.S. Treasury obligations, letters of credit and/or cash) against the loaned securities and maintains collateral in an amount not less than 100% of the market value of the loaned securities during the period of the loan. The market value of the loaned securities is determined at the close of business of the Fund and any additional required collateral is delivered to the Fund on the next business day. If the borrower defaults on its obligation to return the securities loaned because of insolvency or other reasons, a fund could experience delays and costs in recovering the securities loaned or in gaining access to the collateral. Any cash collateral received is invested in the Fidelity Securities Lending Cash Central Fund. The value of loaned securities and cash collateral at period end are disclosed on the Fund's Statement of Assets and Liabilities. Security lending income represents the income earned on investing cash collateral, less rebates paid to borrowers and any lending agent fees associated with the loan, plus any premium payments received for lending certain types of securities. Security lending income is presented in the Statement of Operations as a component of income from Fidelity Central Funds. Total security lending income during the period amounted to $175,043. During the period, there were no securities loaned to FCM.
8. Expense Reductions.
Many of the brokers with whom FMR places trades on behalf of the Fund provided services to the Fund in addition to trade execution. These services included payments of certain expenses on behalf of the Fund totaling $97,785 for the period.
9. Other.
The Fund's organizational documents provide former and current trustees and officers with a limited indemnification against liabilities arising in connection with the performance of their duties to the Fund. In the normal course of business, the Fund may also enter into contracts that provide general indemnifications. The Fund's maximum exposure under these arrangements is unknown as this would be dependent on future claims that may be made against the Fund. The risk of material loss from such claims is considered remote.
Annual Report
Fidelity Europe Fund
Average annual total return reflects the change in the value of an investment, assuming reinvestment of the fund's distributions from dividend income and capital gains (the profits earned upon the sale of securities that have grown in value, if any) and assuming a constant rate of performance each year. The $10,000 table and the fund's returns do not reflect the deduction of taxes that a shareholder would pay on fund distributions or the redemption of fund shares. During periods of reimbursement by Fidelity, a fund's total return will be greater than it would be had the reimbursement not occurred. How a fund did yesterday is no guarantee of how it will do tomorrow.
Average Annual Total Returns
Periods ended October 31, 2012 | Past 1
year | Past 5
years | Past 10
years |
Fidelity Europe Fund | 11.53% | -5.31% | 9.99% |
$10,000 Over 10 Years
Let's say hypothetically that $10,000 was invested in Fidelity Europe Fund on October 31, 2002. The chart shows how the value of your investment would have changed, and also shows how the MSCI Europe Index performed over the same period.
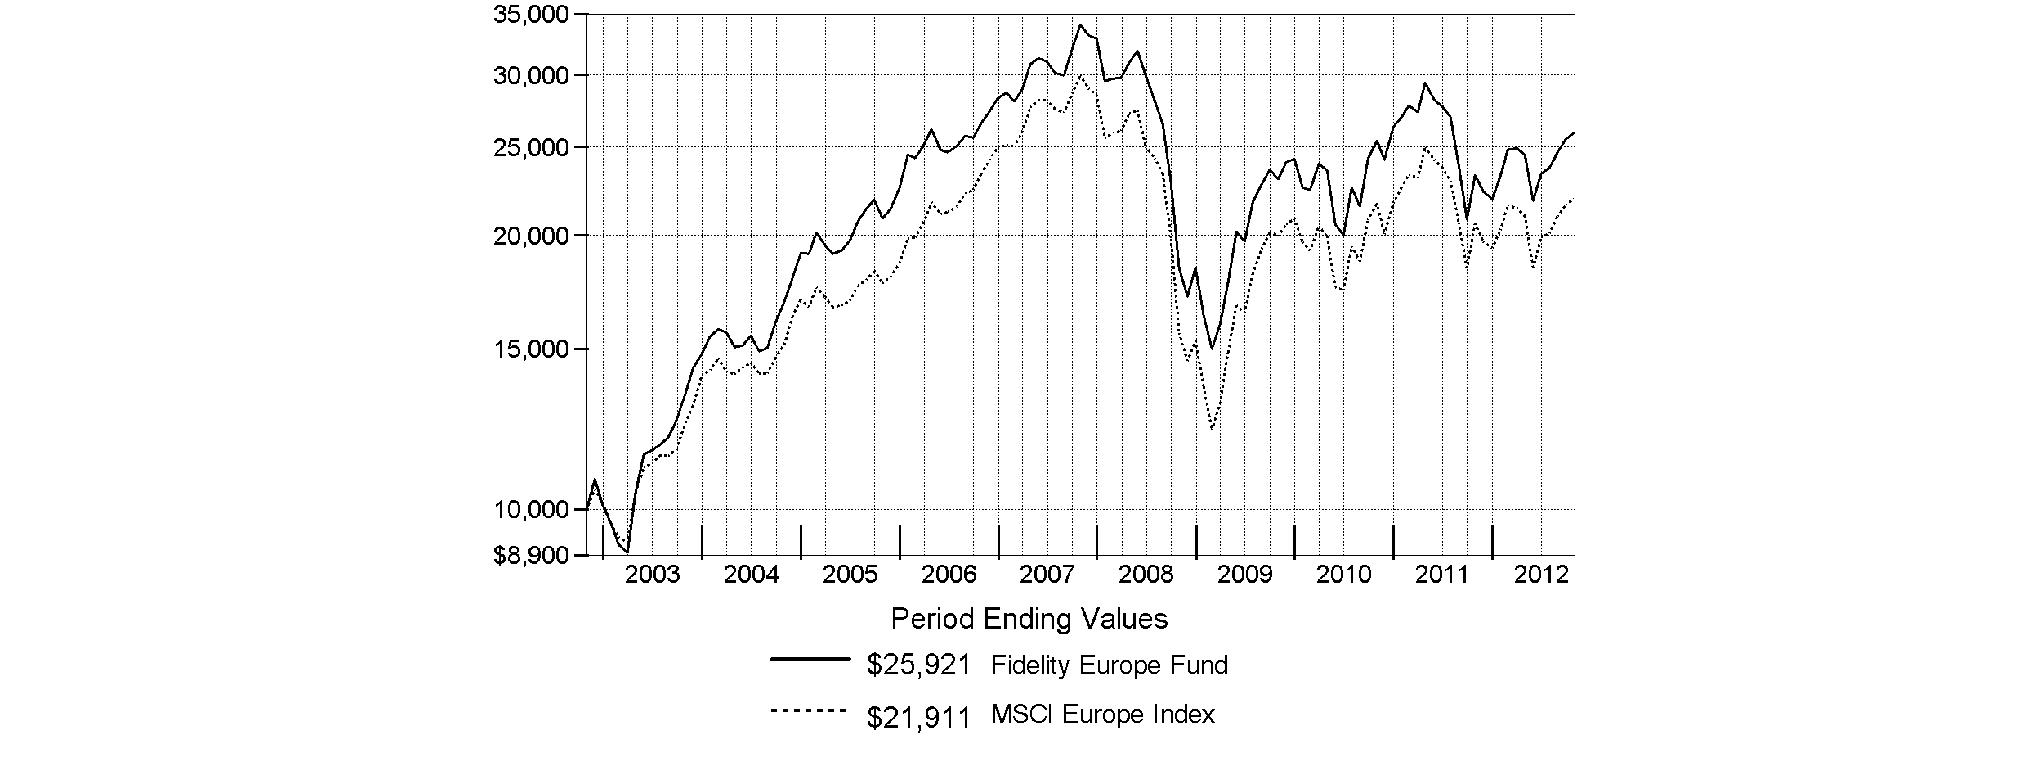
Annual Report
Fidelity Europe Fund
Market Recap: Returns for most domestic and international equities fluctuated during the 12 months ending October 31, 2012, as investor sentiment towards risk vacillated amid a changing global economic landscape. U.S. stocks overcame bouts of volatility to post strong gains for the past year, extending an uptrend that began in March 2009. The broad-based S&P 500® Index advanced 15.21%, while the blue-chip-laden Dow Jones Industrial AverageSM and technology-heavy Nasdaq Composite® Index rose 12.56% and 12.21%, respectively. Performance outside of the U.S. was relatively weak, as the MSCI® ACWI® (All Country World Index) ex USA Index rose 4.11%, hampered in part by a stronger U.S. dollar. International developed-markets generally struggled during the period as macroeconomic concerns ebbed and flowed, finishing with only a modest gain. The MSCI® EAFE® Index rose 4.76% for the year, largely buttressed in the summertime by pledges of accommodative monetary action from eurozone officials, as well as signs that the U.S. housing market was on the mend. Within the index, Asia-Pacific ex Japan showed the most impressive gain, advancing roughly 10%. A number of core European components, including Germany (+11%) and Switzerland (+10%), and the U.K. (+9%), benefited from optimism about the eurozone's ability to resolve its debt woes, which helped the region outpace the index overall. Elsewhere, Japan was among the few benchmark constituents to finish in the red, returning about -3%. Emerging-markets stocks gained 2.98% for the year, as measured by the MSCI Emerging Markets Index. A general uptrend in the final five months of the period lifted the index into positive territory for the full 12 months.
Comments from Risteard Hogan, who became Portfolio Manager of Fidelity® Europe Fund on April 25, 2012: For the year, the fund gained 11.53%, handily outpacing the 6.48% return of the MSCI® Europe Index. Stock selection was the fund's primary driver of performance versus the MSCI index. Specifically, holdings in consumer discretionary were most beneficial. Information technology was another area of success, where the fund benefited from avoiding poor-performing European companies in favor of stronger firms domiciled in the U.S., such as personal device manufacturer Apple, which the fund no longer held at period end. Positioning in telecommunication services also was additive, as was stock picking in the capital goods segment of industrials. Turning to individual stocks, an out-of-index position in U.K. media and digital communications firm Aegis Group was the biggest contributor. The stock shot up in July after a competitor announced plans to acquire the firm, and I sold the stock shortly after. In consumer discretionary, shares of Italian luxury retailer Prada gained, as strong demand from an emerging middle-class in developing nations held up. Prada was not in the index. Avoiding two weak-performing index components, Telefonica, a Spanish telecom company, and Finnish mobile device manufacturer Nokia, was beneficial. Spain's challenging economic situation and the company's high debt load weighed heavily on Telefonica, while Nokia remained challenged by its lack of a competitive smartphone to date. On the downside, positioning in the insurance segment of financials detracted, while the fund's slight underweighting in banks negated the boost from positive choices there. A slim overweighting in consumer staples' food/beverage/tobacco area also was detrimental, as was a modest underweighting in materials. Looking at individual detractors, untimely ownership of U.K. mining company Anglo American hurt the most. After the fund's position was established in February, Anglo's shares experienced a steady decline over fears of an economic slowdown in China. Unfavorable timing also hurt us on Swiss pharmaceuticals giant Roche Holding. Underweighting U.K. bank HSBC detracted. Here, I decreased the fund's stake to take advantage of other market opportunities, but the stock continued to gain.
The views expressed above reflect those of the portfolio manager(s) only through the end of the period as stated on the cover of this report and do not necessarily represent the views of Fidelity or any other person in the Fidelity organization. Any such views are subject to change at any time based upon market or other conditions and Fidelity disclaims any responsibility to update such views. These views may not be relied on as investment advice and, because investment decisions for a Fidelity fund are based on numerous factors, may not be relied on as an indication of trading intent on behalf of any Fidelity fund.
Annual Report
Fidelity Europe Fund
As a shareholder of the Fund, you incur two types of costs: (1) transaction costs, including redemption fees and (2) ongoing costs, including management fees and other Fund expenses. This Example is intended to help you understand your ongoing costs (in dollars) of investing in the Fund and to compare these costs with the ongoing costs of investing in other mutual funds.
The Example is based on an investment of $1,000 invested at the beginning of the period and held for the entire period (May 1, 2012 to October 31, 2012).
Actual Expenses
The first line of the accompanying table provides information about actual account values and actual expenses. You may use the information in this line, together with the amount you invested, to estimate the expenses that you paid over the period. Simply divide your account value by $1,000.00 (for example, an $8,600 account value divided by $1,000.00 = 8.6), then multiply the result by the number in the first line under the heading entitled "Expenses Paid During Period" to estimate the expenses you paid on your account during this period. A small balance maintenance fee of $12.00 that is charged once a year may apply for certain accounts with a value of less than $2,000. This fee is not included in the table below. If it was, the estimate of expenses you paid during the period would be higher, and your ending account value lower, by this amount. In addition, the Fund, as a shareholder in the underlying Fidelity Central Funds, will indirectly bear its pro-rata share of the fees and expenses incurred by the underlying Fidelity Central Funds. These fees and expenses are not included in the Fund's annualized expense ratio used to calculate the expense estimate in the table below.
Hypothetical Example for Comparison Purposes
The second line of the accompanying table provides information about hypothetical account values and hypothetical expenses based on the Fund's actual expense ratio and an assumed rate of return of 5% per year before expenses, which is not the Fund's actual return. The hypothetical account values and expenses may not be used to estimate the actual ending account balance or expenses you paid for the period. You may use this information to compare the ongoing costs of investing in the Fund and other funds. To do so, compare this 5% hypothetical example with the 5% hypothetical examples that appear in the shareholder reports of the other funds. A small balance maintenance fee of $12.00 that is charged once a year may apply for certain accounts with a value of less than $2,000. This fee is not included in the table below. If it was, the estimate of expenses you paid during the period would be higher, and your ending account value lower, by this amount. In addition, the Fund, as a shareholder in the underlying Fidelity Central Funds, will indirectly bear its pro-rata share of the fees and expenses incurred by the underlying Fidelity Central Funds. These fees and expenses are not included in the Fund's annualized expense ratio used to calculate the expense estimate in the table below.
Please note that the expenses shown in the table are meant to highlight your ongoing costs only and do not reflect any transaction costs. Therefore, the second line of the table is useful in comparing ongoing costs only, and will not help you determine the relative total costs of owning different funds. In addition, if these transactional costs were included, your costs would have been higher.
| Annualized
Expense Ratio | Beginning
Account Value
May 1, 2012 | Ending
Account Value
October 31, 2012 | Expenses Paid
During Period*
May 1, 2012
to October 31, 2012 |
Actual | 1.00% | $ 1,000.00 | $ 1,057.20 | $ 5.17 |
Hypothetical (5% return per year before expenses) | | $ 1,000.00 | $ 1,020.11 | $ 5.08 |
* Expenses are equal to the Fund's annualized expense ratio, multiplied by the average account value over the period, multiplied by 184/366 (to reflect the one-half year period).
Annual Report
Fidelity Europe Fund
Investment Changes (Unaudited)
Geographic Diversification (% of fund's net assets) |
As of October 31, 2012 |
| United Kingdom | 30.4% | |
| Germany | 14.4% | |
| Switzerland | 13.9% | |
| France | 12.9% | |
| Italy | 4.2% | |
| United States of America | 4.0% | |
| Norway | 3.2% | |
| Spain | 2.5% | |
| Netherlands | 2.4% | |
| Other | 12.1% | |

Percentages are based on country or territory of incorporation and are adjusted for the effect of futures contracts, if applicable. |
As of April 30, 2012 |
| United Kingdom | 31.8% | |
| Switzerland | 14.1% | |
| France | 12.6% | |
| Germany | 11.1% | |
| Italy | 5.6% | |
| United States of America | 3.6% | |
| Norway | 2.8% | |
| Denmark | 2.7% | |
| Sweden | 2.6% | |
| Other | 13.1% | |

Percentages are based on country or territory of incorporation and are adjusted for the effect of futures contracts, if applicable. |
Asset Allocation |
| % of fund's
net assets | % of fund's net assets
6 months ago |
Stocks | 97.2 | 98.8 |
Short-Term Investments and Net Other Assets (Liabilities) | 2.8 | 1.2 |
Top Ten Stocks as of October 31, 2012 |
| % of fund's
net assets | % of fund's net assets
6 months ago |
Nestle SA (Switzerland, Food Products) | 4.3 | 4.3 |
Roche Holding AG (participation certificate) (Switzerland, Pharmaceuticals) | 3.1 | 2.9 |
Royal Dutch Shell PLC Class B (United Kingdom) (United Kingdom, Oil, Gas & Consumable Fuels) | 2.8 | 2.8 |
Vodafone Group PLC (United Kingdom, Wireless Telecommunication Services) | 2.7 | 2.9 |
British American Tobacco PLC (United Kingdom) (United Kingdom, Tobacco) | 2.4 | 2.6 |
Sanofi SA (France, Pharmaceuticals) | 2.4 | 2.0 |
GlaxoSmithKline PLC (United Kingdom, Pharmaceuticals) | 2.2 | 2.4 |
ENI SpA (Italy, Oil, Gas & Consumable Fuels) | 2.0 | 2.0 |
Diageo PLC (United Kingdom, Beverages) | 1.9 | 1.7 |
BASF AG (Germany, Chemicals) | 1.9 | 1.6 |
| 25.7 | |
Market Sectors as of October 31, 2012 |
| % of fund's
net assets | % of fund's net assets
6 months ago |
Financials | 17.0 | 17.6 |
Consumer Staples | 16.6 | 16.3 |
Consumer Discretionary | 11.9 | 12.0 |
Health Care | 11.6 | 11.7 |
Industrials | 11.3 | 12.3 |
Materials | 9.8 | 10.1 |
Energy | 8.8 | 9.5 |
Telecommunication Services | 3.9 | 4.2 |
Information Technology | 3.8 | 3.5 |
Utilities | 2.5 | 1.6 |
Annual Report
Fidelity Europe Fund
Investments October 31, 2012
Showing Percentage of Net Assets
Common Stocks - 95.1% |
| Shares | | Value |
Australia - 0.4% |
Iluka Resources Ltd. | 233,307 | | $ 2,402,469 |
Bailiwick of Jersey - 0.5% |
Wolseley PLC | 74,800 | | 3,269,993 |
Belgium - 1.8% |
Anheuser-Busch InBev SA NV | 130,700 | | 10,930,592 |
Brazil - 0.3% |
Telefonica Brasil SA sponsored ADR | 71,000 | | 1,563,420 |
Canada - 0.5% |
Goldcorp, Inc. | 69,000 | | 3,119,249 |
Denmark - 1.7% |
Novo Nordisk A/S Series B | 64,301 | | 10,308,448 |
Finland - 0.8% |
Amer Group PLC (A Shares) | 10,700 | | 151,447 |
Sampo OYJ (A Shares) | 156,500 | | 4,904,852 |
TOTAL FINLAND | | 5,056,299 |
France - 12.9% |
Atos Origin SA | 52,676 | | 3,537,379 |
AXA SA | 353,200 | | 5,614,919 |
BNP Paribas SA | 177,661 | | 8,936,985 |
Bureau Veritas SA | 33,700 | | 3,578,723 |
Casino Guichard Perrachon SA | 26,501 | | 2,314,454 |
Christian Dior SA | 58,300 | | 8,368,884 |
Compagnie de St. Gobain | 102,800 | | 3,622,910 |
Credit Agricole SA (a) | 296,000 | | 2,228,300 |
JCDecaux SA | 137,500 | | 2,910,343 |
Natixis SA | 734,400 | | 2,406,384 |
PPR SA | 39,800 | | 6,997,745 |
Publicis Groupe SA | 73,700 | | 3,970,549 |
Sanofi SA | 161,895 | | 14,218,829 |
Schneider Electric SA | 110,400 | | 6,902,185 |
Technip SA | 18,600 | | 2,095,019 |
TOTAL FRANCE | | 77,703,608 |
Germany - 12.3% |
adidas AG | 57,800 | | 4,924,325 |
BASF AG | 136,471 | | 11,308,379 |
Bayer AG | 127,600 | | 11,112,469 |
Beiersdorf AG | 35,000 | | 2,545,444 |
Brenntag AG | 27,200 | | 3,428,223 |
Deutsche Beteiligungs AG | 29,968 | | 757,051 |
Deutsche Boerse AG | 74,500 | | 4,032,478 |
Deutsche Post AG | 229,057 | | 4,540,967 |
Deutsche Wohnen AG | 33,800 | | 619,472 |
ElringKlinger AG | 46,793 | | 1,299,139 |
GEA Group AG | 102,022 | | 3,185,561 |
GSW Immobilien AG | 56,900 | | 2,341,223 |
HeidelbergCement Finance AG | 62,900 | | 3,333,673 |
Linde AG | 37,400 | | 6,289,762 |
|
| Shares | | Value |
RWE AG | 112,300 | | $ 5,131,635 |
SAP AG | 127,422 | | 9,292,001 |
TOTAL GERMANY | | 74,141,802 |
Ireland - 2.0% |
DCC PLC (Ireland) | 129,800 | | 3,708,857 |
Elan Corp. PLC (a) | 189,300 | | 2,060,178 |
FBD Holdings PLC | 176,800 | | 2,211,387 |
Glanbia PLC | 142,800 | | 1,354,860 |
Ryanair Holdings PLC sponsored ADR | 92,900 | | 2,996,025 |
TOTAL IRELAND | | 12,331,307 |
Israel - 0.4% |
Israel Chemicals Ltd. | 172,000 | | 2,152,408 |
Italy - 4.2% |
Beni Stabili SpA SIIQ | 5,221,000 | | 2,934,934 |
ENI SpA | 514,500 | | 11,839,122 |
Prada SpA | 382,300 | | 3,117,575 |
Prysmian SpA | 189,800 | | 3,650,778 |
Saipem SpA | 80,196 | | 3,602,770 |
TOTAL ITALY | | 25,145,179 |
Netherlands - 2.4% |
ASML Holding NV (Netherlands) | 90,100 | | 4,953,001 |
D.E Master Blenders 1753 NV (a) | 135,900 | | 1,660,888 |
LyondellBasell Industries NV Class A | 61,200 | | 3,267,468 |
Reed Elsevier NV | 322,109 | | 4,327,404 |
TOTAL NETHERLANDS | | 14,208,761 |
Norway - 3.2% |
DnB NOR ASA | 397,800 | | 4,967,877 |
Merkantildata ASA | 267,700 | | 2,852,468 |
StatoilHydro ASA | 243,000 | | 5,984,837 |
Telenor ASA | 281,200 | | 5,529,006 |
TOTAL NORWAY | | 19,334,188 |
Poland - 0.4% |
Warsaw Stock Exchange | 208,900 | | 2,453,683 |
Russia - 0.4% |
Magnit OJSC GDR (Reg. S) | 61,600 | | 2,186,800 |
Spain - 2.5% |
Banco Bilbao Vizcaya Argentaria SA | 166,465 | | 1,390,974 |
Gas Natural SDG SA | 185,400 | | 2,876,465 |
Inditex SA | 49,301 | | 6,290,463 |
Repsol YPF SA | 212,495 | | 4,247,060 |
TOTAL SPAIN | | 14,804,962 |
Sweden - 2.1% |
ASSA ABLOY AB (B Shares) | 129,800 | | 4,326,732 |
Svenska Handelsbanken AB (A Shares) | 143,600 | | 4,918,802 |
Swedish Match Co. AB | 97,400 | | 3,318,669 |
TOTAL SWEDEN | | 12,564,203 |
Common Stocks - continued |
| Shares | | Value |
Switzerland - 13.9% |
Adecco SA (Reg.) | 85,743 | | $ 4,146,746 |
Aryzta AG | 79,000 | | 3,944,486 |
Nestle SA | 407,516 | | 25,860,836 |
Partners Group Holding AG | 17,940 | | 3,796,815 |
Roche Holding AG (participation certificate) | 95,840 | | 18,431,165 |
Schindler Holding AG (participation certificate) | 36,427 | | 4,799,305 |
Syngenta AG (Switzerland) | 20,710 | | 8,074,612 |
UBS AG (NY Shares) | 526,400 | | 7,906,528 |
Zurich Financial Services AG | 27,868 | | 6,867,503 |
TOTAL SWITZERLAND | | 83,827,996 |
Turkey - 0.8% |
Anadolu Efes Biracilik Ve Malt Sanayii A/S | 126,000 | | 1,890,879 |
Coca-Cola Icecek A/S | 138,000 | | 2,679,163 |
TOTAL TURKEY | | 4,570,042 |
United Kingdom - 30.4% |
Anglo American PLC (United Kingdom) | 248,900 | | 7,643,635 |
Ashmore Group PLC | 484,400 | | 2,843,045 |
Barclays PLC | 1,734,545 | | 6,413,888 |
BHP Billiton PLC | 344,356 | | 11,037,042 |
British American Tobacco PLC (United Kingdom) | 289,100 | | 14,339,247 |
British Land Co. PLC | 452,877 | | 3,862,438 |
Bunzl PLC | 171,300 | | 2,833,463 |
Centrica PLC | 1,311,200 | | 6,857,791 |
Compass Group PLC | 443,100 | | 4,862,358 |
Dechra Pharmaceuticals PLC | 83,000 | | 826,418 |
Diageo PLC | 400,200 | | 11,441,131 |
Galliford Try PLC | 79,796 | | 950,972 |
GlaxoSmithKline PLC | 587,300 | | 13,159,904 |
HSBC Holdings PLC (United Kingdom) | 1,022 | | 10,076 |
J Sainsbury PLC | 538,900 | | 3,083,778 |
Lloyds Banking Group PLC (a) | 3,685,900 | | 2,427,177 |
London Stock Exchange Group PLC | 202,000 | | 3,179,911 |
Meggitt PLC | 541,700 | | 3,374,290 |
Next PLC | 71,700 | | 4,126,072 |
Prudential PLC | 519,211 | | 7,130,638 |
Rolls-Royce Group PLC | 407,664 | | 5,621,480 |
Rolls-Royce Group PLC Class C | 30,982,464 | | 49,998 |
Royal Dutch Shell PLC: | | | |
Class A (Netherlands) | 250,945 | | 8,602,723 |
Class B (United Kingdom) | 472,621 | | 16,717,758 |
|
| Shares | | Value |
SIG PLC | 1,857,200 | | $ 3,137,918 |
Standard Chartered PLC (United Kingdom) | 332,883 | | 7,861,775 |
Taylor Wimpey PLC | 4,684,874 | | 4,619,292 |
Unilever PLC | 178,900 | | 6,673,541 |
Vodafone Group PLC | 6,066,400 | | 16,474,132 |
William Hill PLC | 598,000 | | 3,261,776 |
TOTAL UNITED KINGDOM | | 183,423,667 |
United States of America - 1.2% |
Colgate-Palmolive Co. | 20,700 | | 2,172,672 |
EMC Corp. (a) | 110,800 | | 2,705,736 |
Philip Morris International, Inc. | 27,100 | | 2,399,976 |
TOTAL UNITED STATES OF AMERICA | | 7,278,384 |
TOTAL COMMON STOCKS (Cost $539,438,071) |
572,777,460
|
Nonconvertible Preferred Stocks - 2.1% |
| | | |
Germany - 2.1% |
ProSiebenSat.1 Media AG | 129,690 | | 3,614,100 |
Volkswagen AG | 43,800 | | 9,060,711 |
TOTAL NONCONVERTIBLE PREFERRED STOCKS (Cost $9,915,138) |
12,674,811
|
Money Market Funds - 3.0% |
| | | |
Fidelity Cash Central Fund, 0.19% (b)
(Cost $18,089,888) | 18,089,888 | |
18,089,888
|
TOTAL INVESTMENT PORTFOLIO - 100.2% (Cost $567,443,097) | | 603,542,159 |
NET OTHER ASSETS (LIABILITIES) - (0.2)% | | (1,022,161) |
NET ASSETS - 100% | $ 602,519,998 |
Legend |
(a) Non-income producing |
(b) Affiliated fund that is available only to investment companies and other accounts managed by Fidelity Investments. The rate quoted is the annualized seven-day yield of the fund at period end. A complete unaudited listing of the fund's holdings as of its most recent quarter end is available upon request. In addition, each Fidelity Central Fund's financial statements, which are not covered by the Fund's Report of Independent Registered Public Accounting Firm, are available on the SEC's website or upon request. |
Affiliated Central Funds |
Information regarding fiscal year to date income earned by the Fund from investments in Fidelity Central Funds is as follows: |
Fund | Income earned |
Fidelity Cash Central Fund | $ 13,908 |
Fidelity Securities Lending Cash Central Fund | 252,258 |
Total | $ 266,166 |
Other Information |
Categorizations in the Schedule of Investments are based on country or territory of incorporation. |
The following is a summary of the inputs used, as of October 31, 2012, involving the Fund's assets and liabilities carried at fair value. The inputs or methodology used for valuing securities may not be an indication of the risk associated with investing in those securities. For more information on valuation inputs, and their aggregation into the levels used in the tables below, please refer to the Security Valuation section in the accompanying Notes to Financial Statements. |
Valuation Inputs at Reporting Date: |
Description | Total | Level 1 | Level 2 | Level 3 |
Investments in Securities: | | | | |
Equities: | | | | |
Consumer Discretionary | $ 71,902,183 | $ 71,902,183 | $ - | $ - |
Consumer Staples | 98,797,416 | 55,412,905 | 43,384,511 | - |
Energy | 53,089,289 | 9,944,849 | 43,144,440 | - |
Financials | 103,019,115 | 85,646,362 | 17,372,753 | - |
Health Care | 70,117,411 | 30,370,052 | 39,747,359 | - |
Industrials | 68,125,126 | 68,125,126 | - | - |
Information Technology | 23,340,585 | 9,095,583 | 14,245,002 | - |
Materials | 58,628,697 | 39,517,043 | 19,111,654 | - |
Telecommunication Services | 23,566,558 | 7,092,426 | 16,474,132 | - |
Utilities | 14,865,891 | 14,865,891 | - | - |
Money Market Funds | 18,089,888 | 18,089,888 | - | - |
Total Investments in Securities: | $ 603,542,159 | $ 410,062,308 | $ 193,479,851 | $ - |
The following is a summary of transfers between Level 1 and Level 2 for the period ended October 31, 2012. Transfers are assumed to have occurred at the beginning of the period, and are primarily attributable to the valuation techniques used for foreign equity securities, as discussed in the accompanying Notes to Financial Statements: |
Transfers | Total |
Level 1 to Level 2 | $ 0 |
Level 2 to Level 1 | $ 6,285,107 |
See accompanying notes which are an integral part of the financial statements.
Annual Report
Fidelity Europe Fund
Statement of Assets and Liabilities
| October 31, 2012 |
| | |
Assets | | |
Investment in securities, at value - See accompanying schedule: Unaffiliated issuers (cost $549,353,209) | $ 585,452,271 | |
Fidelity Central Funds (cost $18,089,888) | 18,089,888 | |
Total Investments (cost $567,443,097) | | $ 603,542,159 |
Foreign currency held at value (cost $62) | | 62 |
Receivable for investments sold | | 627,708 |
Receivable for fund shares sold | | 471,163 |
Dividends receivable | | 707,794 |
Distributions receivable from Fidelity Central Funds | | 2,334 |
Other receivables | | 19,928 |
Total assets | | 605,371,148 |
| | |
Liabilities | | |
Payable for investments purchased | $ 1,395,646 | |
Payable for fund shares redeemed | 813,257 | |
Accrued management fee | 428,107 | |
Other affiliated payables | 134,522 | |
Other payables and accrued expenses | 79,618 | |
Total liabilities | | 2,851,150 |
| | |
Net Assets | | $ 602,519,998 |
Net Assets consist of: | | |
Paid in capital | | $ 849,078,763 |
Undistributed net investment income | | 11,969,152 |
Accumulated undistributed net realized gain (loss) on investments and foreign currency transactions | | (294,619,942) |
Net unrealized appreciation (depreciation) on investments and assets and liabilities in foreign currencies | | 36,092,025 |
Net Assets, for 19,986,888 shares outstanding | | $ 602,519,998 |
Net Asset Value, offering price and redemption price per share ($602,519,998 ÷ 19,986,888 shares) | | $ 30.15 |
Statement of Operations
| Year ended October 31, 2012 |
| | |
Investment Income | | |
Dividends | | $ 19,478,236 |
Interest | | 184 |
Income from Fidelity Central Funds | | 266,166 |
Income before foreign taxes withheld | | 19,744,586 |
Less foreign taxes withheld | | (1,542,306) |
Total income | | 18,202,280 |
| | |
Expenses | | |
Management fee Basic fee | $ 4,121,886 | |
Performance adjustment | (1,113,749) | |
Transfer agent fees | 1,313,310 | |
Accounting and security lending fees | 294,833 | |
Custodian fees and expenses | 78,804 | |
Independent trustees' compensation | 4,088 | |
Registration fees | 23,467 | |
Audit | 72,378 | |
Legal | 4,329 | |
Miscellaneous | 4,919 | |
Total expenses before reductions | 4,804,265 | |
Expense reductions | (160,612) | 4,643,653 |
Net investment income (loss) | | 13,558,627 |
Realized and Unrealized Gain (Loss) Net realized gain (loss) on: | | |
Investment securities: | | |
Unaffiliated issuers | (8,961,575) | |
Foreign currency transactions | (134,823) | |
Total net realized gain (loss) | | (9,096,398) |
Change in net unrealized appreciation (depreciation) on: Investment securities | 57,841,088 | |
Assets and liabilities in foreign currencies | (15,079) | |
Total change in net unrealized appreciation (depreciation) | | 57,826,009 |
Net gain (loss) | | 48,729,611 |
Net increase (decrease) in net assets resulting from operations | | $ 62,288,238 |
See accompanying notes which are an integral part of the financial statements.
Annual Report
Fidelity Europe Fund
Financial Statements - continued
Statement of Changes in Net Assets
| Year ended
October 31,
2012 | Year ended
October 31,
2011 |
Increase (Decrease) in Net Assets | | |
Operations | | |
Net investment income (loss) | $ 13,558,627 | $ 11,712,167 |
Net realized gain (loss) | (9,096,398) | 59,327,258 |
Change in net unrealized appreciation (depreciation) | 57,826,009 | (126,169,969) |
Net increase (decrease) in net assets resulting from operations | 62,288,238 | (55,130,544) |
Distributions to shareholders from net investment income | (13,165,713) | (16,901,401) |
Distributions to shareholders from net realized gain | (376,163) | - |
Total distributions | (13,541,876) | (16,901,401) |
Share transactions Proceeds from sales of shares | 48,215,969 | 47,231,141 |
Reinvestment of distributions | 12,914,887 | 16,129,417 |
Cost of shares redeemed | (129,152,722) | (172,091,823) |
Net increase (decrease) in net assets resulting from share transactions | (68,021,866) | (108,731,265) |
Redemption fees | 17,058 | 14,873 |
Total increase (decrease) in net assets | (19,258,446) | (180,748,337) |
| | |
Net Assets | | |
Beginning of period | 621,778,444 | 802,526,781 |
End of period (including undistributed net investment income of $11,969,152 and undistributed net investment income of $11,598,984, respectively) | $ 602,519,998 | $ 621,778,444 |
Other Information Shares | | |
Sold | 1,722,766 | 1,519,828 |
Issued in reinvestment of distributions | 496,918 | 520,808 |
Redeemed | (4,702,289) | (5,604,701) |
Net increase (decrease) | (2,482,605) | (3,564,065) |
Financial Highlights
Years ended October 31, | 2012 | 2011 | 2010 | 2009 | 2008 |
Selected Per-Share Data | | | | | |
Net asset value, beginning of period | $ 27.67 | $ 30.83 | $ 28.52 | $ 23.57 | $ 47.46 |
Income from Investment Operations | | | | | |
Net investment income (loss) B | .64 | .48 | .33 | .52 | .68 |
Net realized and unrealized gain (loss) | 2.45 | (2.97) | 2.50 | 5.16 | (20.84) |
Total from investment operations | 3.09 | (2.49) | 2.83 | 5.68 | (20.16) |
Distributions from net investment income | (.60) | (.67) | (.52) | (.73) | (.65) |
Distributions from net realized gain | (.02) | - | - | - | (3.08) |
Total distributions | (.61) G | (.67) | (.52) | (.73) | (3.73) |
Redemption fees added to paid in capital B, F | - | - | - | - | - |
Net asset value, end of period | $ 30.15 | $ 27.67 | $ 30.83 | $ 28.52 | $ 23.57 |
Total Return A | 11.53% | (8.32)% | 10.01% | 25.36% | (46.03)% |
Ratios to Average Net Assets C, E | | | | | |
Expenses before reductions | .83% | 1.10% | 1.12% | 1.09% | 1.00% |
Expenses net of fee waivers, if any | .83% | 1.10% | 1.12% | 1.09% | 1.00% |
Expenses net of all reductions | .80% | 1.06% | 1.04% | 1.04% | .95% |
Net investment income (loss) | 2.33% | 1.56% | 1.15% | 2.22% | 1.82% |
Supplemental Data | | | | | |
Net assets, end of period (000 omitted) | $ 602,520 | $ 621,778 | $ 802,527 | $ 2,845,423 | $ 2,751,772 |
Portfolio turnover rate D | 127% | 117% | 136% | 135% | 100% |
A Total returns would have been lower if certain expenses had not been reduced during the applicable periods shown. B Calculated based on average shares outstanding during the period. C Fees and expenses of any underlying Fidelity Central Funds are not included in the Fund's expense ratio. The Fund indirectly bears its proportionate share of the expenses of any underlying Fidelity Central Funds. D Amount does not include the portfolio activity of any underlying Fidelity Central Funds. E Expense ratios reflect operating expenses of the Fund. Expenses before reductions do not reflect amounts reimbursed by the investment adviser or reductions from brokerage service arrangements or reductions from other expense offset arrangements and do not represent the amount paid by the Fund during periods when reimbursements or reductions occur. Expenses net of fee waivers reflect expenses after reimbursement by the investment adviser but prior to reductions from brokerage service arrangements or other expense offset arrangements. Expenses net of all reductions represent the net expenses paid by the Fund. F Amount represents less than $.01 per share. GTotal distributions of $.61 per share is comprised of distributions from net investment income of $.595 and distributions from net realized gain of $.017 per share. |
See accompanying notes which are an integral part of the financial statements.
Annual Report
Notes to Financial Statements
For the period ended October 31, 2012
1. Organization.
Fidelity Europe Fund (the Fund) is a fund of Fidelity Investment Trust (the Trust) and is authorized to issue an unlimited number of shares. The Trust is registered under the Investment Company Act of 1940, as amended (the 1940 Act), as an open-end management investment company organized as a Massachusetts business trust.
2. Investments in Fidelity Central Funds.
The Fund invests in Fidelity Central Funds, which are open-end investment companies available only to other investment companies and accounts managed by Fidelity Management & Research Company (FMR) and its affiliates. The Fund's Schedule of Investments lists each of the Fidelity Central Funds held as of period end, if any, as an investment of the Fund, but does not include the underlying holdings of each Fidelity Central Fund. As an Investing Fund, the Fund indirectly bears its proportionate share of the expenses of the underlying Fidelity Central Funds.
The Money Market Central Funds seek preservation of capital and current income and are managed by Fidelity Investments Money Management, Inc. (FIMM), an affiliate of FMR.
A complete unaudited list of holdings for each Fidelity Central Fund is available upon request or at the Securities and Exchange Commission (the SEC) web site at www.sec.gov. In addition, the financial statements of the Fidelity Central Funds, which are not covered by the Fund's Report of Independent Registered Public Accounting Firm, are available on the SEC web site or upon request.
3. Significant Accounting Policies.
The financial statements have been prepared in conformity with accounting principles generally accepted in the United States of America (GAAP), which require management to make certain estimates and assumptions at the date of the financial statements. Actual results could differ from those estimates. Subsequent events, if any, through the date that the financial statements were issued have been evaluated in the preparation of the financial statements. The following summarizes the significant accounting policies of the Fund:
Security Valuation. Investments are valued as of 4:00 p.m. Eastern time on the last calendar day of the period. In accordance with valuation policies and procedures approved by the Board of Trustees (the Board), the Fund attempts to obtain prices from one or more third party pricing vendors or brokers to value its investments. When current market prices, quotations or rates are not readily available or reliable, securities will be fair valued in good faith by the FMR Fair Value Committee (the Committee), in accordance with procedures adopted by the Fund's Board. Factors used in determining fair value vary by security type and may include market or security specific events. The frequency with which these procedures are used cannot be predicted and they may be utilized to a significant extent. The Committee oversees the Fund's valuation policies and procedures and is responsible for approving and reporting to the Board all fair value determinations.
The Fund categorizes the inputs to valuation techniques used to value its investments into a disclosure hierarchy consisting of three levels as shown below:
Level 1 - quoted prices in active markets for identical investments
Level 2 - other significant observable inputs (including quoted prices for similar investments, interest rates, prepayment speeds, etc.)
Level 3 - unobservable inputs (including the Fund's own assumptions based on the best information available)
Valuation techniques used to value the Fund's investments by major category are as follows:
Equity securities, including restricted securities, for which market quotations are readily available, are valued at the last reported sale price or official closing price as reported by a third party pricing vendor on the primary market or exchange on which they are traded and are categorized as Level 1 in the hierarchy. In the event there were no sales during the day or closing prices are not available, securities are valued at the last quoted bid price or may be valued using the last available price and are generally categorized as Level 2 in the hierarchy. For foreign equity securities, when significant market or security specific events arise, comparisons to the valuation of American Depositary Receipts (ADRs), futures contracts, Exchange-Traded Funds (ETFs) and certain indexes as well as quoted prices for similar securities are used and are categorized as Level 2 in the hierarchy. Utilizing these techniques may result in transfers between Level 1 and Level 2.
Investments in open-end mutual funds, including the Fidelity Central Funds, are valued at their closing net asset value (NAV) each business day and are categorized as Level 1 in the hierarchy.
Changes in valuation techniques may result in transfers in or out of an assigned level within the disclosure hierarchy. The aggregate value of investments by input level, as of October 31, 2012, including information on transfers between Levels 1 and 2 is included at the end of the Fund's Schedule of Investments.
Annual Report
3. Significant Accounting Policies - continued
Foreign Currency Translation. The Fund may use foreign currency contracts to facilitate transactions in foreign-denominated securities. Gains and losses from these transactions may arise from changes in the value of the foreign currency or if the counterparties do not perform under the contracts' terms.
Foreign-denominated assets, including investment securities, and liabilities are translated into U.S. dollars at the exchange rates at period end. Purchases and sales of investment securities, income and dividends received and expenses denominated in foreign currencies are translated into U.S. dollars at the exchange rate in effect on the transaction date.
The effects of exchange rate fluctuations on investments are included with the net realized and unrealized gain (loss) on investment securities. Other foreign currency transactions resulting in realized and unrealized gain (loss) are disclosed separately.
Investment Transactions and Income. For financial reporting purposes, the Fund's investment holdings and NAV include trades executed through the end of the last business day of the period. The NAV per share for processing shareholder transactions is calculated as of the close of business of the New York Stock Exchange (NYSE), normally 4:00 p.m. Eastern time and includes trades executed through the end of the prior business day. Gains and losses on securities sold are determined on the basis of identified cost and may include proceeds received from litigation. Dividend income is recorded on the ex-dividend date, except for certain dividends from foreign securities where the ex-dividend date may have passed, which are recorded as soon as the Fund is informed of the ex-dividend date. Non-cash dividends included in dividend income, if any, are recorded at the fair market value of the securities received. Distributions received on securities that represent a return of capital or capital gain are recorded as a reduction of cost of investments and/or as a realized gain. The Fund estimates the components of distributions received that may be considered return of capital distributions or capital gain distributions. Interest income and distributions from the Fidelity Central Funds are accrued as earned. Interest income includes coupon interest and amortization of premium and accretion of discount on debt securities. Investment income is recorded net of foreign taxes withheld where recovery of such taxes is uncertain.
Expenses. Expenses directly attributable to a fund are charged to that fund. Expenses attributable to more than one fund are allocated among the respective funds on the basis of relative net assets or other appropriate methods. Expense estimates are accrued in the period to which they relate and adjustments are made when actual amounts are known.
Income Tax Information and Distributions to Shareholders. Each year, the Fund intends to qualify as a regulated investment company under Subchapter M of the Internal Revenue Code, including distributing substantially all of its taxable income and realized gains. As a result, no provision for income taxes is required. As of October 31, 2012, the Fund did not have any unrecognized tax benefits in the financial statements; nor is the Fund aware of any tax positions for which it is reasonably possible that the total amounts of unrecognized tax benefits will significantly change in the next twelve months. The Fund files a U.S. federal tax return, in addition to state and local tax returns as required. A fund's federal income tax returns are subject to examination by the Internal Revenue Service (IRS) for a period of three fiscal years after they are filed. State and local tax returns may be subject to examination for an additional fiscal year depending on the jurisdiction. Foreign taxes are provided for based on the Fund's understanding of the tax rules and rates that exist in the foreign markets in which it invests.
Distributions are declared and recorded on the ex-dividend date. Income dividends and capital gain distributions are declared separately for each class. Income and capital gain distributions are determined in accordance with income tax regulations, which may differ from GAAP.
Capital accounts within the financial statements are adjusted for permanent book-tax differences. These adjustments have no impact on net assets or the results of operations. Temporary book-tax differences will reverse in a subsequent period.
Book-tax differences are primarily due to foreign currency transactions, passive foreign investment companies (PFIC), partnerships, deferred trustees compensation, capital loss carryforwards and losses deferred due to wash sales.
The federal tax cost of investment securities and unrealized appreciation (depreciation) as of period end were as follows:
Gross unrealized appreciation | $ 52,190,422 |
Gross unrealized depreciation | (18,543,132) |
Net unrealized appreciation (depreciation) on securities and other investments | $ 33,647,290 |
| |
Tax Cost | $ 569,894,869 |
Annual Report
Notes to Financial Statements - continued
3. Significant Accounting Policies - continued
Income Tax Information and Distributions to Shareholders - continued
The tax-based components of distributable earnings as of period end were as follows:
Undistributed ordinary income | $ 12,200,925 |
Capital loss carryforward | $ (292,399,199) |
Net unrealized appreciation (depreciation) | $ 33,640,253 |
Capital loss carryforwards are only available to offset future capital gains of the Fund to the extent provided by regulations and may be limited. Under the Regulated Investment Company Modernization Act of 2010 (the Act), the Fund is permitted to carry forward capital losses incurred in taxable years beginning after December 22, 2010 for an unlimited period and such capital losses are required to be used prior to any losses that expire. Capital loss carryforwards were as follows:
Fiscal year of expiration | |
2017 | $ (282,402,190) |
Short-term | (5,141,633) |
Long-term | (4,855,376) |
Total no expiration | (9,997,009) |
Total capital loss carryforward | $ (292,399,199) |
As a result of large redemptions in October 2010, the Fund had an "ownership change" under the Internal Revenue Code, which limits capital losses that will be available to offset future capital gains to approximately $32,000,000 per year plus certain gains in the Fund existing at the time of the ownership change. As a result, at least $582,385,647 of the Fund's capital loss carryforward will expire unused and is not included in the capital loss carryforward amounts disclosed above.
The tax character of distributions paid was as follows:
| October 31, 2012 | October 31, 2011 |
Ordinary Income | $ 13,541,876 | $ 16,901,401 |
Short-Term Trading (Redemption) Fees. Shares held by investors in the Fund less than 30 days are subject to a redemption fee equal to 1.00% of the net asset value of shares redeemed. All redemption fees, which reduce the proceeds of the shareholder redemption, are retained by the Fund and accounted for as an addition to paid in capital.
New Accounting Pronouncement. In December 2011, the Financial Accounting Standards Board issued Accounting Standard Update No. 2011-11, Disclosures about Offsetting Assets and Liabilities. The update creates new disclosure requirements requiring entities to disclose both gross and net information for derivatives and other financial instruments that are either offset in the Statement of Assets and Liabilities or subject to an enforceable master netting arrangement or similar agreement. The disclosure requirements are effective for annual reporting periods beginning on or after January 1, 2013, and interim periods within those annual periods. Management is currently evaluating the impact of the update's adoption on the Fund's financial statement disclosures.
4. Purchases and Sales of Investments.
Purchases and sales of securities, other than short-term securities, aggregated $728,306,402 and $808,081,607, respectively.
5. Fees and Other Transactions with Affiliates.
Management Fee. FMR and its affiliates provide the Fund with investment management related services for which the Fund pays a monthly management fee. The management fee is the sum of an individual fund fee rate that is based on an annual rate of .45% of the Fund's average net assets and an annualized group fee rate that averaged .26% during the period. The group fee rate is based upon the average net assets of all the mutual funds advised by FMR. The group fee rate decreases as assets under management increase and increases as assets under management decrease. In addition, the management fee is subject to a performance adjustment (up to a maximum of ± .20% of the Fund's average net assets over a 36 month performance period). The upward or downward adjustment to the management fee is based on the Fund's relative investment performance as compared to an appropriate benchmark index. For the period, the total annual management fee rate, including the performance adjustment, was .52% of the Fund's average net assets.
Annual Report
5. Fees and Other Transactions with Affiliates - continued
Transfer Agent Fees. Fidelity Investments Institutional Operations Company, Inc. (FIIOC), an affiliate of FMR, is the Fund's transfer, dividend disbursing and shareholder servicing agent. FIIOC receives account fees and asset-based fees that vary according to account size and type of account. FIIOC pays for typesetting, printing and mailing of shareholder reports, except proxy statements. For the period, the transfer agent fees were equivalent to an annual rate of .23% of average net assets.
Accounting and Security Lending Fees. Fidelity Service Company, Inc. (FSC), an affiliate of FMR, maintains the Fund's accounting records. The accounting fee is based on the level of average net assets for each month. Under a separate contract, FSC administers the security lending program. The security lending fee is based on the number and duration of lending transactions.
Brokerage Commissions. The Fund placed a portion of its portfolio transactions with brokerage firms which are affiliates of the investment adviser. The commissions paid to these affiliated firms were $1,516 for the period.
6. Committed Line of Credit.
The Fund participates with other funds managed by FMR or an affiliate in a $4.25 billion credit facility (the "line of credit") to be utilized for temporary or emergency purposes to fund shareholder redemptions or for other short-term liquidity purposes. The Fund has agreed to pay commitment fees on its pro-rata portion of the line of credit, which amounted to $1,605 and is reflected in Miscellaneous expenses on the Statement of Operations. During the period, there were no borrowings on this line of credit.
7. Security Lending.
The Fund lends portfolio securities through a lending agent from time to time in order to earn additional income. For equity securities, a lending agent is used and may loan securities to certain qualified borrowers, including Fidelity Capital Markets (FCM), a broker-dealer affiliated with the Fund. On the settlement date of the loan, the Fund receives collateral (in the form of U.S. Treasury obligations, letters of credit and/or cash) against the loaned securities and maintains collateral in an amount not less than 100% of the market value of the loaned securities during the period of the loan. The market value of the loaned securities is determined at the close of business of the Fund and any additional required collateral is delivered to the Fund on the next business day. If the borrower defaults on its obligation to return the securities loaned because of insolvency or other reasons, a fund could experience delays and costs in recovering the securities loaned or in gaining access to the collateral. Any cash collateral received is invested in the Fidelity Securities Lending Cash Central Fund. At period end, there were no security loans outstanding. Security lending income represents the income earned on investing cash collateral, less rebates paid to borrowers and any lending agent fees associated with the loan, plus any premium payments received for lending certain types of securities. Security lending income is presented in the Statement of Operations as a component of income from Fidelity Central Funds. Total security lending income during the period amounted to $252,258. During the period, there were no securities loaned to FCM.
8. Expense Reductions.
Many of the brokers with whom FMR places trades on behalf of the Fund provided services in addition to trade execution. These services included payments of certain expenses on behalf of the Fund totaling $160,612 for the period.
9. Other.
The Fund's organizational documents provide former and current trustees and officers with a limited indemnification against liabilities arising in connection with the performance of their duties to the Fund. In the normal course of business, the Fund may also enter into contracts that provide general indemnifications. The Fund's maximum exposure under these arrangements is unknown as this would be dependent on future claims that may be made against the Fund. The risk of material loss from such claims is considered remote.
Annual Report
Fidelity Japan Fund
Average annual total return reflects the change in the value of an investment, assuming reinvestment of the class' distributions from dividend income and capital gains (the profits earned upon the sale of securities that have grown in value, if any) and assuming a constant rate of performance each year. The $10,000 table and the fund's returns do not reflect the deduction of taxes that a shareholder would pay on fund distributions or the redemption of fund shares. During periods of reimbursement by Fidelity, a fund's total return will be greater than it would be had the reimbursement not occurred. How a fund did yesterday is no guarantee of how it will do tomorrow.
Average Annual Total Returns
Periods ended October 31, 2012 | Past 1
year | Past 5
years | Past 10
years |
Fidelity Japan Fund | -0.19% | -8.00% | 3.88% |
$10,000 Over 10 Years
Let's say hypothetically that $10,000 was invested in Fidelity Japan Fund, a class of the fund, on October 31, 2002. The chart shows how the value of your investment would have changed, and also shows how the Tokyo Stock Price Index (TOPIX) performed over the same period.
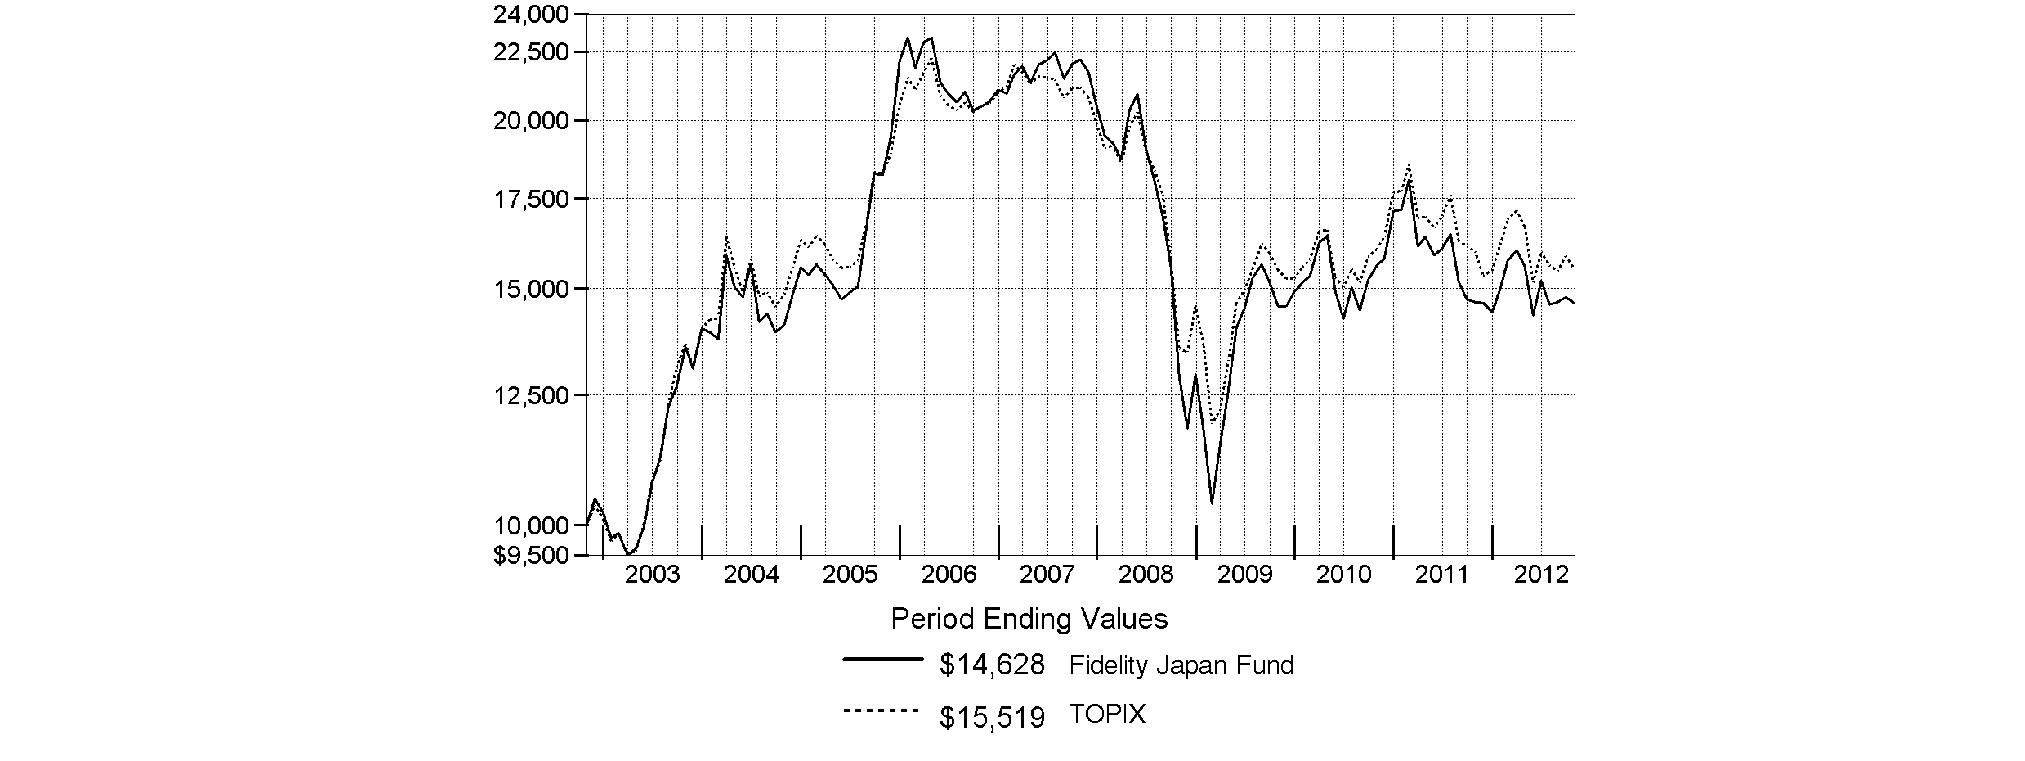
Annual Report
Fidelity Japan Fund
Market Recap: Returns for most domestic and international equities fluctuated during the 12 months ending October 31, 2012, as investor sentiment towards risk vacillated amid a changing global economic landscape. U.S. stocks overcame bouts of volatility to post strong gains for the past year, extending an uptrend that began in March 2009. The broad-based S&P 500® Index advanced 15.21%, while the blue-chip-laden Dow Jones Industrial AverageSM and technology-heavy Nasdaq Composite® Index rose 12.56% and 12.21%, respectively. Performance outside of the U.S. was relatively weak, as the MSCI® ACWI® (All Country World Index) ex USA Index rose 4.11%, hampered in part by a stronger U.S. dollar. International developed-markets generally struggled during the period as macroeconomic concerns ebbed and flowed, finishing with only a modest gain. The MSCI® EAFE® Index rose 4.76% for the year, largely buttressed in the summertime by pledges of accommodative monetary action from eurozone officials, as well as signs that the U.S. housing market was on the mend. Within the index, Asia-Pacific ex Japan showed the most impressive gain, advancing roughly 10%. A number of core European components, including Germany (+11%) and Switzerland (+10%), and the U.K. (+9%), benefited from optimism about the eurozone's ability to resolve its debt woes, which helped the region outpace the index overall. Elsewhere, Japan was among the few benchmark constituents to finish in the red, returning about -3%. Emerging-markets stocks gained 2.98% for the year, as measured by the MSCI Emerging Markets Index. A general uptrend in the final five months of the period lifted the index into positive territory for the full 12 months.
Comments from Rie Shigekawa, Portfolio Manager of Fidelity® Japan Fund: For the year, the fund's Retail Class shares returned -0.19%, well ahead of the TOPIX, which returned -2.93%. The fund got a sizable boost from stock selection in the consumer discretionary sector, especially the automobile/components and media groups. My choices in the pharmaceuticals, biotechnology and life science part of health care also lifted performance, and security selection in the software/services segment of information technology helped as well. In the latter two cases, though, the benefits were largely or entirely offset by unfavorable positioning elsewhere in the sector. The fund's biggest individual contributor was Astellas Pharma, one of the largest Japanese drug companies. Given the company's reinvigorated product pipeline and healthy dividend yield, the stock offered growth potential and relative safety, and investors rewarded it with roughly a 40% advance. Other strong performers were Otsuka, an IT services provider for small and medium-sized businesses, and So-net Entertainment, which provides Internet services to Sony customers and was partially owned by Sony. During the period, Sony acquired the remaining stake in So-net at a healthy premium to where the shares had been trading. Sony, a weak-performing benchmark component, contributed to performance because the fund didn't own it. Automaker Toyota, the fund's largest holding during the period, also contributed. Conversely, the biggest negative factors were stock selection and a large overweighting in technology hardware/equipment, a group that accounted for the four largest individual detractors from relative performance: Fujitsu, Canon, Shimadzu and Toshiba. All of these companies suffered from a weaker-than-expected global economic backdrop and a relatively expensive yen. In addition, Fujitsu and Toshiba were adversely affected by stiffer competition from South Korean and Taiwanese rivals.
The views expressed above reflect those of the portfolio manager(s) only through the end of the period as stated on the cover of this report and do not necessarily represent the views of Fidelity or any other person in the Fidelity organization. Any such views are subject to change at any time based upon market or other conditions and Fidelity disclaims any responsibility to update such views. These views may not be relied on as investment advice and, because investment decisions for a Fidelity fund are based on numerous factors, may not be relied on as an indication of trading intent on behalf of any Fidelity fund.
Annual Report
Fidelity Japan Fund
As a shareholder of the Fund, you incur two types of costs: (1) transaction costs, including sales charges (loads) on purchase payments or redemption proceeds, redemption fees and (2) ongoing costs, including management fees, distribution and/or service (12b-1) fees and other Fund expenses. This Example is intended to help you understand your ongoing costs (in dollars) of investing in the Fund and to compare these costs with the ongoing costs of investing in other mutual funds.
The Example is based on an investment of $1,000 invested at the beginning of the period and held for the entire period (May 1, 2012 to October 31, 2012).
Actual Expenses
The first line of the accompanying table for each class of the Fund provides information about actual account values and actual expenses. You may use the information in this line, together with the amount you invested, to estimate the expenses that you paid over the period. Simply divide your account value by $1,000.00 (for example, an $8,600 account value divided by $1,000.00 = 8.6), then multiply the result by the number in the first line for a class of the Fund under the heading entitled "Expenses Paid During Period" to estimate the expenses you paid on your account during this period. A small balance maintenance fee of $12.00 that is charged once a year may apply for certain accounts with a value of less than $2,000. This fee is not included in the table below. If it was, the estimate of expenses you paid during the period would be higher, and your ending account value lower, by this amount. In addition, the Fund, as a shareholder in the underlying Fidelity Central Funds, will indirectly bear its pro-rata share of the fees and expenses incurred by the underlying Fidelity Central Funds. These fees and expenses are not included in the Fund's annualized expense ratio used to calculate the expense estimate in the table below.
Hypothetical Example for Comparison Purposes
The second line of the accompanying table for each class of the Fund provides information about hypothetical account values and hypothetical expenses based on a Class' actual expense ratio and an assumed rate of return of 5% per year before expenses, which is not the Class' actual return. The hypothetical account values and expenses may not be used to estimate the actual ending account balance or expenses you paid for the period. You may use this information to compare the ongoing costs of investing in the Fund and other funds. To do so, compare this 5% hypothetical example with the 5% hypothetical examples that appear in the shareholder reports of the other funds. A small balance maintenance fee of $12.00 that is charged once a year may apply for certain accounts with a value of less than $2,000. This fee is not included in the table below. If it was, the estimate of expenses you paid during the period would be higher, and your ending account value lower, by this amount. In addition, the Fund, as a shareholder in the underlying Fidelity Central Funds, will indirectly bear its pro-rata share of the fees and expenses incurred by the underlying Fidelity Central Funds. These fees and expenses are not included in the Fund's annualized expense ratio used to calculate the expense estimate in the table below.
Please note that the expenses shown in the table are meant to highlight your ongoing costs only and do not reflect any transaction costs. Therefore, the second line of the table is useful in comparing ongoing costs only, and will not help you determine the relative total costs of owning different funds. In addition, if these transactional costs were included, your costs would have been higher.
| Annualized
Expense Ratio | Beginning
Account Value
May 1, 2012 | Ending
Account Value
October 31, 2012 | Expenses Paid
During Period*
May 1, 2012
to October 31, 2012 |
Class A | 1.27% | | | |
Actual | | $ 1,000.00 | $ 937.50 | $ 6.19 |
HypotheticalA | | $ 1,000.00 | $ 1,018.75 | $ 6.44 |
Class T | 1.56% | | | |
Actual | | $ 1,000.00 | $ 937.40 | $ 7.60 |
HypotheticalA | | $ 1,000.00 | $ 1,017.29 | $ 7.91 |
Class B | 2.02% | | | |
Actual | | $ 1,000.00 | $ 934.40 | $ 9.82 |
HypotheticalA | | $ 1,000.00 | $ 1,014.98 | $ 10.23 |
Class C | 2.01% | | | |
Actual | | $ 1,000.00 | $ 935.30 | $ 9.78 |
HypotheticalA | | $ 1,000.00 | $ 1,015.03 | $ 10.18 |
Japan | .95% | | | |
Actual | | $ 1,000.00 | $ 940.60 | $ 4.63 |
HypotheticalA | | $ 1,000.00 | $ 1,020.36 | $ 4.82 |
Institutional Class | .84% | | | |
Actual | | $ 1,000.00 | $ 939.60 | $ 4.10 |
HypotheticalA | | $ 1,000.00 | $ 1,020.91 | $ 4.27 |
A 5% return per year before expenses
* Expenses are equal to each Class' annualized expense ratio, multiplied by the average account value over the period, multiplied by 184/366 (to reflect the one-half year period).
Annual Report
Fidelity Japan Fund
Investment Changes (Unaudited)
Geographic Diversification (% of fund's net assets) |
As of October 31, 2012 |
| Japan | 98.9% | |
| United States of America | 1.1% | |

Percentages are based on country or territory of incorporation and are adjusted for the effect of futures contracts, if applicable. |
As of April 30, 2012 |
| Japan | 96.0% | |
| United States of America | 4.0% | |

Percentages are based on country or territory of incorporation and are adjusted for the effect of futures contracts, if applicable. |
Asset Allocation |
| % of fund's
net assets | % of fund's net assets
6 months ago |
Stocks | 98.9 | 96.0 |
Short-Term Investments and Net Other Assets (Liabilities) | 1.1 | 4.0 |
Top Ten Stocks as of October 31, 2012 |
| % of fund's
net assets | % of fund's net assets
6 months ago |
Toyota Motor Corp. (Automobiles) | 7.3 | 6.9 |
Honda Motor Co. Ltd. (Automobiles) | 4.5 | 4.7 |
Canon, Inc. (Office Electronics) | 4.4 | 4.1 |
Mitsubishi UFJ Financial Group, Inc. (Commercial Banks) | 4.1 | 3.5 |
Sumitomo Mitsui Financial Group, Inc. (Commercial Banks) | 3.4 | 3.3 |
Astellas Pharma, Inc. (Pharmaceuticals) | 3.0 | 2.7 |
Asahi Kasei Corp. (Chemicals) | 2.9 | 2.9 |
Nomura Real Estate Holdings, Inc. (Real Estate Management & Development) | 2.8 | 3.1 |
Toray Industries, Inc. (Chemicals) | 2.8 | 2.7 |
Shimadzu Corp. (Electronic Equipment & Components) | 2.6 | 2.5 |
| 37.8 | |
Market Sectors as of October 31, 2012 |
| % of fund's
net assets | % of fund's net assets
6 months ago |
Consumer Discretionary | 26.6 | 22.6 |
Financials | 20.5 | 18.3 |
Information Technology | 17.3 | 25.1 |
Health Care | 10.4 | 6.0 |
Materials | 10.1 | 9.9 |
Industrials | 8.5 | 7.6 |
Consumer Staples | 2.8 | 3.2 |
Telecommunication Services | 2.0 | 2.2 |
Utilities | 0.7 | 1.1 |
Annual Report
Fidelity Japan Fund
Investments October 31, 2012
Showing Percentage of Net Assets
Common Stocks - 98.9% |
| Shares | | Value |
CONSUMER DISCRETIONARY - 26.6% |
Auto Components - 4.7% |
Bridgestone Corp. | 280,900 | | $ 6,541,314 |
Denso Corp. | 282,500 | | 8,843,386 |
Keihin Corp. | 175,300 | | 2,112,472 |
| | 17,497,172 |
Automobiles - 15.1% |
Honda Motor Co. Ltd. | 567,900 | | 17,072,918 |
Nissan Motor Co. Ltd. | 727,500 | | 6,087,561 |
Suzuki Motor Corp. | 275,400 | | 6,237,294 |
Toyota Motor Corp. | 709,100 | | 27,340,884 |
| | 56,738,657 |
Household Durables - 1.6% |
Panasonic Corp. | 1,011,200 | | 6,133,496 |
Media - 2.0% |
Avex Group Holdings, Inc. | 193,400 | | 3,822,939 |
Jupiter Telecommunications Co. | 2,685 | | 3,649,286 |
| | 7,472,225 |
Multiline Retail - 1.7% |
Marui Group Co. Ltd. | 889,500 | | 6,395,753 |
Specialty Retail - 0.3% |
Arc Land Sakamoto Co. Ltd. | 86,200 | | 1,249,322 |
Textiles, Apparel & Luxury Goods - 1.2% |
Onward Holdings Co. Ltd. | 629,000 | | 4,656,633 |
TOTAL CONSUMER DISCRETIONARY | | 100,143,258 |
CONSUMER STAPLES - 2.8% |
Food & Staples Retailing - 1.0% |
Seven & i Holdings Co., Ltd. | 124,000 | | 3,824,226 |
Food Products - 0.6% |
Toyo Suisan Kaisha Ltd. | 91,000 | | 2,267,306 |
Personal Products - 1.2% |
Shiseido Co. Ltd. | 363,400 | | 4,597,695 |
TOTAL CONSUMER STAPLES | | 10,689,227 |
FINANCIALS - 20.5% |
Commercial Banks - 9.7% |
Mitsubishi UFJ Financial Group, Inc. | 3,437,800 | | 15,552,497 |
Mizuho Financial Group, Inc. | 5,340,800 | | 8,356,644 |
Sumitomo Mitsui Financial Group, Inc. | 411,100 | | 12,561,985 |
| | 36,471,126 |
Consumer Finance - 1.9% |
ACOM Co. Ltd. (a) | 85,750 | | 2,531,789 |
Aeon Credit Service Co. Ltd. | 226,400 | | 4,804,229 |
| | 7,336,018 |
Insurance - 1.5% |
MS&AD Insurance Group Holdings, Inc. | 322,900 | | 5,472,676 |
|
| Shares | | Value |
Real Estate Investment Trusts - 2.6% |
Frontier Real Estate Investment Corp. | 731 | | $ 6,455,656 |
Japan Logistics Fund, Inc. | 383 | | 3,497,520 |
| | 9,953,176 |
Real Estate Management & Development - 4.8% |
Mitsui Fudosan Co. Ltd. | 374,000 | | 7,556,833 |
Nomura Real Estate Holdings, Inc. | 583,600 | | 10,475,996 |
| | 18,032,829 |
TOTAL FINANCIALS | | 77,265,825 |
HEALTH CARE - 10.4% |
Health Care Equipment & Supplies - 2.0% |
ASAHI INTECC Co. Ltd. (d) | 88,000 | | 2,611,449 |
Terumo Corp. | 114,100 | | 4,916,748 |
| | 7,528,197 |
Health Care Providers & Services - 1.8% |
Message Co. Ltd. (d) | 2,198 | | 6,784,257 |
Pharmaceuticals - 6.6% |
Astellas Pharma, Inc. | 227,900 | | 11,319,347 |
Shionogi & Co. Ltd. | 251,600 | | 4,172,847 |
Takeda Pharmaceutical Co. Ltd. | 198,700 | | 9,234,335 |
| | 24,726,529 |
TOTAL HEALTH CARE | | 39,038,983 |
INDUSTRIALS - 8.5% |
Electrical Equipment - 0.8% |
Nidec Corp. (d) | 44,900 | | 3,194,689 |
Machinery - 3.7% |
Kubota Corp. | 679,000 | | 6,940,549 |
Makita Corp. | 73,000 | | 2,885,068 |
Mitsubishi Heavy Industries Ltd. | 956,000 | | 4,023,750 |
| | 13,849,367 |
Road & Rail - 2.2% |
East Japan Railway Co. | 101,500 | | 6,967,556 |
Hitachi Transport System Ltd. | 93,700 | | 1,404,972 |
| | 8,372,528 |
Trading Companies & Distributors - 1.8% |
Sumitomo Corp. | 486,400 | | 6,629,127 |
TOTAL INDUSTRIALS | | 32,045,711 |
INFORMATION TECHNOLOGY - 17.3% |
Computers & Peripherals - 4.0% |
Fujitsu Ltd. | 1,680,000 | | 6,460,729 |
Toshiba Corp. | 2,360,000 | | 8,750,595 |
| | 15,211,324 |
Electronic Equipment & Components - 5.1% |
Hamamatsu Photonics K.K. | 97,100 | | 3,363,165 |
Hitachi High-Technologies Corp. | 90,600 | | 1,982,691 |
Common Stocks - continued |
| Shares | | Value |
INFORMATION TECHNOLOGY - continued |
Electronic Equipment & Components - continued |
Horiba Ltd. | 153,400 | | $ 4,179,444 |
Shimadzu Corp. | 1,426,000 | | 9,592,409 |
| | 19,117,709 |
IT Services - 2.7% |
Otsuka Corp. | 88,500 | | 7,217,024 |
SCSK Corp. | 182,000 | | 3,096,029 |
| | 10,313,053 |
Office Electronics - 4.4% |
Canon, Inc. | 507,500 | | 16,493,586 |
Software - 1.1% |
Capcom Co. Ltd. | 209,500 | | 3,991,601 |
TOTAL INFORMATION TECHNOLOGY | | 65,127,273 |
MATERIALS - 10.1% |
Chemicals - 9.2% |
Asahi Kasei Corp. | 2,006,000 | | 11,031,367 |
Kaneka Corp. | 427,000 | | 2,080,709 |
Nippon Kayaku Co. Ltd. | 110,000 | | 1,223,600 |
Nippon Shokubai Co. Ltd. | 305,000 | | 2,991,545 |
Nitto Denko Corp. | 152,200 | | 6,901,716 |
Toray Industries, Inc. | 1,794,000 | | 10,472,304 |
| | 34,701,241 |
Metals & Mining - 0.9% |
Hitachi Metals Ltd. | 333,000 | | 3,116,009 |
TOTAL MATERIALS | | 37,817,250 |
TELECOMMUNICATION SERVICES - 2.0% |
Wireless Telecommunication Services - 2.0% |
NTT DoCoMo, Inc. | 5,200 | | 7,534,942 |
|
| Shares | | Value |
UTILITIES - 0.7% |
Electric Utilities - 0.7% |
Kansai Electric Power Co., Inc. | 330,300 | | $ 2,540,451 |
TOTAL COMMON STOCKS (Cost $445,663,766) |
372,202,920
|
Money Market Funds - 3.5% |
| | | |
Fidelity Cash Central Fund, 0.19% (b) | 9,391,664 | | 9,391,664 |
Fidelity Securities Lending Cash Central Fund, 0.19% (b)(c) | 3,921,508 | | 3,921,508 |
TOTAL MONEY MARKET FUNDS (Cost $13,313,172) |
13,313,172
|
TOTAL INVESTMENT PORTFOLIO - 102.4% (Cost $458,976,938) | | 385,516,092 |
NET OTHER ASSETS (LIABILITIES) - (2.4)% | | (9,021,583) |
NET ASSETS - 100% | $ 376,494,509 |
Legend |
(a) Non-income producing |
(b) Affiliated fund that is available only to investment companies and other accounts managed by Fidelity Investments. The rate quoted is the annualized seven-day yield of the fund at period end. A complete unaudited listing of the fund's holdings as of its most recent quarter end is available upon request. In addition, each Fidelity Central Fund's financial statements, which are not covered by the Fund's Report of Independent Registered Public Accounting Firm, are available on the SEC's website or upon request. |
(c) Investment made with cash collateral received from securities on loan. |
(d) Security or a portion of the security is on loan at period end. |
Affiliated Central Funds |
Information regarding fiscal year to date income earned by the Fund from investments in Fidelity Central Funds is as follows: |
Fund | Income earned |
Fidelity Cash Central Fund | $ 15,392 |
Fidelity Securities Lending Cash Central Fund | 57,669 |
Total | $ 73,061 |
Other Information |
The following is a summary of the inputs used, as of October 31, 2012, involving the Fund's assets and liabilities carried at fair value. The inputs or methodology used for valuing securities may not be an indication of the risk associated with investing in those securities. For more information on valuation inputs, and their aggregation into the levels used in the tables below, please refer to the Security Valuation section in the accompanying Notes to Financial Statements. |
Valuation Inputs at Reporting Date: |
Description | Total | Level 1 | Level 2 | Level 3 |
Investments in Securities: | | | | |
Equities: | | | | |
Consumer Discretionary | $ 100,143,258 | $ 49,595,960 | $ 50,547,298 | $ - |
Consumer Staples | 10,689,227 | 10,689,227 | - | - |
Financials | 77,265,825 | 40,794,699 | 36,471,126 | - |
Health Care | 39,038,983 | 39,038,983 | - | - |
Industrials | 32,045,711 | 32,045,711 | - | - |
Information Technology | 65,127,273 | 48,633,687 | 16,493,586 | - |
Materials | 37,817,250 | 37,817,250 | - | - |
Telecommunication Services | 7,534,942 | - | 7,534,942 | - |
Utilities | 2,540,451 | 2,540,451 | - | - |
Money Market Funds | 13,313,172 | 13,313,172 | - | - |
Total Investments in Securities: | $ 385,516,092 | $ 274,469,140 | $ 111,046,952 | $ - |
The following is a summary of transfers between Level 1 and Level 2 for the period ended October 31, 2012. Transfers are assumed to have occurred at the beginning of the period, and are primarily attributable to the valuation techniques used for foreign equity securities, as discussed in the accompanying Notes to Financial Statements: |
Transfers | Total |
Level 1 to Level 2 | $ 0 |
Level 2 to Level 1 | $ 221,614,606 |
See accompanying notes which are an integral part of the financial statements.
Annual Report
Fidelity Japan Fund
Statement of Assets and Liabilities
| October 31, 2012 |
| | |
Assets | | |
Investment in securities, at value (including securities loaned of $3,663,872) - See accompanying schedule: Unaffiliated issuers (cost $445,663,766) | $ 372,202,920 | |
Fidelity Central Funds (cost $13,313,172) | 13,313,172 | |
Total Investments (cost $458,976,938) | | $ 385,516,092 |
Receivable for investments sold | | 1,818,767 |
Receivable for fund shares sold | | 199,278 |
Dividends receivable | | 3,555,728 |
Distributions receivable from Fidelity Central Funds | | 5,293 |
Other receivables | | 32,231 |
Total assets | | 391,127,389 |
| | |
Liabilities | | |
Payable for investments purchased | $ 1,472,890 | |
Payable for fund shares redeemed | 8,839,933 | |
Accrued management fee | 226,105 | |
Distribution and service plan fees payable | 10,452 | |
Other affiliated payables | 92,408 | |
Other payables and accrued expenses | 69,584 | |
Collateral on securities loaned, at value | 3,921,508 | |
Total liabilities | | 14,632,880 |
| | |
Net Assets | | $ 376,494,509 |
Net Assets consist of: | | |
Paid in capital | | $ 662,035,138 |
Undistributed net investment income | | 5,171,198 |
Accumulated undistributed net realized gain (loss) on investments and foreign currency transactions | | (217,159,330) |
Net unrealized appreciation (depreciation) on investments and assets and liabilities in foreign currencies | | (73,552,497) |
Net Assets | | $ 376,494,509 |
Statement of Assets and Liabilities - continued
| October 31, 2012 |
| | |
Calculation of Maximum Offering Price Class A:
Net Asset Value and redemption price per share ($9,495,097 ÷ 1,020,459 shares) | | $ 9.30 |
| | |
Maximum offering price per share (100/94.25 of $9.30) | | $ 9.87 |
Class T:
Net Asset Value and redemption price per share ($3,933,511 ÷ 424,072 shares) | | $ 9.28 |
| | |
Maximum offering price per share (100/96.50 of $9.28) | | $ 9.62 |
Class B:
Net Asset Value and offering price per share ($1,012,233 ÷ 109,322 shares)A | | $ 9.26 |
| | |
Class C:
Net Asset Value and offering price per share ($7,015,255 ÷ 758,790 shares)A | | $ 9.25 |
| | |
Japan:
Net Asset Value, offering price and redemption price per share ($353,550,250 ÷ 37,872,939 shares) | | $ 9.34 |
| | |
Institutional Class:
Net Asset Value, offering price and redemption price per share ($1,488,163 ÷ 159,495 shares) | | $ 9.33 |
A Redemption price per share is equal to net asset value less any applicable contingent deferred sales charge.
See accompanying notes which are an integral part of the financial statements.
Annual Report
Fidelity Japan Fund
Financial Statements - continued
Statement of Operations
| Year ended October 31, 2012 |
| | |
Investment Income | | |
Dividends | | $ 10,808,030 |
Interest | | 66 |
Income from Fidelity Central Funds | | 73,061 |
Income before foreign taxes withheld | | 10,881,157 |
Less foreign taxes withheld | | (756,562) |
Total income | | 10,124,595 |
| | |
Expenses | | |
Management fee Basic fee | $ 3,118,883 | |
Performance adjustment | 256,814 | |
Transfer agent fees | 999,478 | |
Distribution and service plan fees | 143,002 | |
Accounting and security lending fees | 229,410 | |
Custodian fees and expenses | 50,443 | |
Independent trustees' compensation | 3,017 | |
Registration fees | 75,488 | |
Audit | 67,660 | |
Legal | 2,379 | |
Miscellaneous | 4,284 | |
Total expenses before reductions | 4,950,858 | |
Expense reductions | (194,406) | 4,756,452 |
Net investment income (loss) | | 5,368,143 |
Realized and Unrealized Gain (Loss) Net realized gain (loss) on: | | |
Investment securities: | | |
Unaffiliated issuers | (9,017,678) | |
Foreign currency transactions | 105,412 | |
Total net realized gain (loss) | | (8,912,266) |
Change in net unrealized appreciation (depreciation) on: Investment securities | 3,036,129 | |
Assets and liabilities in foreign currencies | (14,170) | |
Total change in net unrealized appreciation (depreciation) | | 3,021,959 |
Net gain (loss) | | (5,890,307) |
Net increase (decrease) in net assets resulting from operations | | $ (522,164) |
Statement of Changes in Net Assets
| Year ended
October 31,
2012 | Year ended
October 31,
2011 |
Increase (Decrease) in Net Assets | | |
Operations | | |
Net investment income (loss) | $ 5,368,143 | $ 7,504,955 |
Net realized gain (loss) | (8,912,266) | (68,712,920) |
Change in net unrealized appreciation (depreciation) | 3,021,959 | 31,829,795 |
Net increase (decrease) in net assets resulting from operations | (522,164) | (29,378,170) |
Distributions to shareholders from net investment income | (7,688,787) | (9,748,982) |
Distributions to shareholders from net realized gain | (2,570,905) | (10,506,757) |
Total distributions | (10,259,692) | (20,255,739) |
Share transactions - net increase (decrease) | (93,975,629) | (153,265,919) |
Redemption fees | 61,543 | 492,971 |
Total increase (decrease) in net assets | (104,695,942) | (202,406,857) |
| | |
Net Assets | | |
Beginning of period | 481,190,451 | 683,597,308 |
End of period (including undistributed net investment income of $5,171,198 and undistributed net investment income of $7,491,842, respectively) | $ 376,494,509 | $ 481,190,451 |
See accompanying notes which are an integral part of the financial statements.
Annual Report
Financial Highlights - Class A
Years ended October 31, | 2012 | 2011 H |
Selected Per-Share Data | | |
Net asset value, beginning of period | $ 9.54 | $ 10.83 |
Income from Investment Operations | | |
Net investment income (loss) E | .09 | .09 |
Net realized and unrealized gain (loss) | (.15) | (1.39) |
Total from investment operations | (.06) | (1.30) |
Distributions from net investment income | (.13) | - |
Distributions from net realized gain | (.05) | - |
Total distributions | (.18) | - |
Redemption fees added to paid in capital E | - K | .01 |
Net asset value, end of period | $ 9.30 | $ 9.54 |
Total Return B, C, D | (.64)% | (11.91)% |
Ratios to Average Net Assets F, I | | |
Expenses before reductions | 1.42% | 1.20% A |
Expenses net of fee waivers, if any | 1.38% | 1.20% A |
Expenses net of all reductions | 1.36% | 1.16% A |
Net investment income (loss) | .94% | 1.02% A |
Supplemental Data | | |
Net assets, end of period (000 omitted) | $ 9,495 | $ 13,208 |
Portfolio turnover rate G | 52% | 134% J |
A Annualized B Total returns for periods of less than one year are not annualized. C Total returns would have been lower if certain expenses had not been reduced during the applicable periods shown. D Total returns do not include the effect of the sales charges. E Calculated based on average shares outstanding during the period. F Fees and expenses of any underlying Fidelity Central Funds are not included in the Fund's expense ratio. The Fund indirectly bears its proportionate share of the expenses of any underlying Fidelity Central Funds. G Amount does not include the portfolio activity of any underlying Fidelity Central Funds. H For the period December 14, 2010 (commencement of sale of shares) to October 31, 2011. I Expense ratios reflect operating expenses of the class. Expenses before reductions do not reflect amounts reimbursed by the investment adviser or reductions from brokerage service arrangements or reductions from other expense offset arrangements and do not represent the amount paid by the class during periods when reimbursements or reductions occur. Expense ratios before reductions for start-up periods may not be representative of longer-term operating periods. Expenses net of fee waivers reflect expenses after reimbursement by the investment adviser but prior to reductions from brokerage service arrangements or other expense offset arrangements. Expenses net of all reductions represent the net expenses paid by the class. J The portfolio turnover rate does not include the assets acquired in the merger. K Amount represents less than $.01 per share. |
Financial Highlights - Class T
Years ended October 31, | 2012 | 2011 H |
Selected Per-Share Data | | |
Net asset value, beginning of period | $ 9.51 | $ 10.83 |
Income from Investment Operations | | |
Net investment income (loss) E | .06 | .07 |
Net realized and unrealized gain (loss) | (.13) | (1.40) |
Total from investment operations | (.07) | (1.33) |
Distributions from net investment income | (.11) | - |
Distributions from net realized gain | (.05) | - |
Total distributions | (.16) | - |
Redemption fees added to paid in capital E | - K | .01 |
Net asset value, end of period | $ 9.28 | $ 9.51 |
Total Return B, C, D | (.75)% | (12.19)% |
Ratios to Average Net Assets F, I | | |
Expenses before reductions | 1.70% | 1.48% A |
Expenses net of fee waivers, if any | 1.66% | 1.48% A |
Expenses net of all reductions | 1.64% | 1.44% A |
Net investment income (loss) | .66% | .74% A |
Supplemental Data | | |
Net assets, end of period (000 omitted) | $ 3,934 | $ 4,643 |
Portfolio turnover rate G | 52% | 134% J |
A Annualized B Total returns for periods of less than one year are not annualized. C Total returns would have been lower if certain expenses had not been reduced during the applicable periods shown. D Total returns do not include the effect of the sales charges. E Calculated based on average shares outstanding during the period. F Fees and expenses of any underlying Fidelity Central Funds are not included in the Fund's expense ratio. The Fund indirectly bears its proportionate share of the expenses of any underlying Fidelity Central Funds. G Amount does not include the portfolio activity of any underlying Fidelity Central Funds. H For the period December 14, 2010 (commencement of sale of shares) to October 31, 2011. I Expense ratios reflect operating expenses of the class. Expenses before reductions do not reflect amounts reimbursed by the investment adviser or reductions from brokerage service arrangements or reductions from other expense offset arrangements and do not represent the amount paid by the class during periods when reimbursements or reductions occur. Expense ratios before reductions for start-up periods may not be representative of longer-term operating periods. Expenses net of fee waivers reflect expenses after reimbursement by the investment adviser but prior to reductions from brokerage service arrangements or other expense offset arrangements. Expenses net of all reductions represent the net expenses paid by the class. J The portfolio turnover rate does not include the assets acquired in the merger. K Amount represents less than $.01 per share. |
See accompanying notes which are an integral part of the financial statements.
Annual Report
Financial Highlights - Class B
Years ended October 31, | 2012 | 2011 H |
Selected Per-Share Data | | |
Net asset value, beginning of period | $ 9.47 | $ 10.83 |
Income from Investment Operations | | |
Net investment income (loss) E | .02 | .02 |
Net realized and unrealized gain (loss) | (.14) | (1.39) |
Total from investment operations | (.12) | (1.37) |
Distributions from net investment income | (.04) | - |
Distributions from net realized gain | (.05) | - |
Total distributions | (.09) | - |
Redemption fees added to paid in capital E | - K | .01 |
Net asset value, end of period | $ 9.26 | $ 9.47 |
Total Return B, C, D | (1.24)% | (12.56)% |
Ratios to Average Net Assets F, I | | |
Expenses before reductions | 2.17% | 1.95% A |
Expenses net of fee waivers, if any | 2.13% | 1.95% A |
Expenses net of all reductions | 2.11% | 1.91% A |
Net investment income (loss) | .19% | .27% A |
Supplemental Data | | |
Net assets, end of period (000 omitted) | $ 1,012 | $ 1,458 |
Portfolio turnover rate G | 52% | 134% J |
A Annualized B Total returns for periods of less than one year are not annualized. C Total returns would have been lower if certain expenses had not been reduced during the applicable periods shown. D Total returns do not include the effect of the contingent deferred sales charge. E Calculated based on average shares outstanding during the period. F Fees and expenses of any underlying Fidelity Central Funds are not included in the Fund's expense ratio. The Fund indirectly bears its proportionate share of the expenses of any underlying Fidelity Central Funds. G Amount does not include the portfolio activity of any underlying Fidelity Central Funds. H For the period December 14, 2010 (commencement of sale of shares) to October 31, 2011. I Expense ratios reflect operating expenses of the class. Expenses before reductions do not reflect amounts reimbursed by the investment adviser or reductions from brokerage service arrangements or reductions from other expense offset arrangements and do not represent the amount paid by the class during periods when reimbursements or reductions occur. Expense ratios before reductions for start-up periods may not be representative of longer-term operating periods. Expenses net of fee waivers reflect expenses after reimbursement by the investment adviser but prior to reductions from brokerage service arrangements or other expense offset arrangements. Expenses net of all reductions represent the net expenses paid by the class. J The portfolio turnover rate does not include the assets acquired in the merger. K Amount represents less than $.01 per share. |
Financial Highlights - Class C
Years ended October 31, | 2012 | 2011 H |
Selected Per-Share Data | | |
Net asset value, beginning of period | $ 9.48 | $ 10.83 |
Income from Investment Operations | | |
Net investment income (loss) E | .02 | .03 |
Net realized and unrealized gain (loss) | (.14) | (1.39) |
Total from investment operations | (.12) | (1.36) |
Distributions from net investment income | (.06) | - |
Distributions from net realized gain | (.05) | - |
Total distributions | (.11) | - |
Redemption fees added to paid in capital E | - K | .01 |
Net asset value, end of period | $ 9.25 | $ 9.48 |
Total Return B, C, D | (1.27)% | (12.47)% |
Ratios to Average Net Assets F, I | | |
Expenses before reductions | 2.15% | 1.92% A |
Expenses net of fee waivers, if any | 2.11% | 1.92% A |
Expenses net of all reductions | 2.09% | 1.88% A |
Net investment income (loss) | .21% | .30% A |
Supplemental Data | | |
Net assets, end of period (000 omitted) | $ 7,015 | $ 8,750 |
Portfolio turnover rate G | 52% | 134% J |
A Annualized B Total returns for periods of less than one year are not annualized. C Total returns would have been lower if certain expenses had not been reduced during the applicable periods shown. D Total returns do not include the effect of the contingent deferred sales charge. E Calculated based on average shares outstanding during the period. F Fees and expenses of any underlying Fidelity Central Funds are not included in the Fund's expense ratio. The Fund indirectly bears its proportionate share of the expenses of any underlying Fidelity Central Funds. G Amount does not include the portfolio activity of any underlying Fidelity Central Funds. H For the period December 14, 2010 (commencement of sale of shares) to October 31, 2011. I Expense ratios reflect operating expenses of the class. Expenses before reductions do not reflect amounts reimbursed by the investment adviser or reductions from brokerage service arrangements or reductions from other expense offset arrangements and do not represent the amount paid by the class during periods when reimbursements or reductions occur. Expense ratios before reductions for start-up periods may not be representative of longer-term operating periods. Expenses net of fee waivers reflect expenses after reimbursement by the investment adviser but prior to reductions from brokerage service arrangements or other expense offset arrangements. Expenses net of all reductions represent the net expenses paid by the class. J The portfolio turnover rate does not include the assets acquired in the merger. K Amount represents less than $.01 per share. |
See accompanying notes which are an integral part of the financial statements.
Annual Report
Financial Highlights - Japan
Years ended October 31, | 2012 | 2011 | 2010 | 2009 | 2008 |
Selected Per-Share Data | | | | | |
Net asset value, beginning of period | $ 9.57 | $ 10.57 | $ 10.03 | $ 9.03 | $ 18.00 |
Income from Investment Operations | | | | | |
Net investment income (loss) B | .12 | .15 | .10 | .08 | .10 |
Net realized and unrealized gain (loss) | (.14) | (.75) | .61 | 1.04 | (6.64) |
Total from investment operations | (.02) | (.60) | .71 | 1.12 | (6.54) |
Distributions from net investment income | (.16) | (.20) | (.07) | (.11) | (.04) |
Distributions from net realized gain | (.05) | (.21) | (.10) | (.01) | (2.39) |
Total distributions | (.21) | (.41) | (.17) | (.12) | (2.43) |
Redemption fees added to paid in capital B | - G | .01 | - G | - G | - G |
Net asset value, end of period | $ 9.34 | $ 9.57 | $ 10.57 | $ 10.03 | $ 9.03 |
Total Return A | (.19)% | (6.00)% | 7.12% | 12.84% | (41.88)% |
Ratios to Average Net Assets C, E | | | | | |
Expenses before reductions | 1.09% | .86% | .93% | .90% | 1.12% |
Expenses net of fee waivers, if any | 1.06% | .84% | .93% | .90% | 1.12% |
Expenses net of all reductions | 1.04% | .80% | .93% | .89% | 1.10% |
Net investment income (loss) | 1.26% | 1.38% | .97% | .90% | .72% |
Supplemental Data | | | | | |
Net assets, end of period (000 omitted) | $ 353,550 | $ 450,417 | $ 649,316 | $ 944,902 | $ 1,025,334 |
Portfolio turnover rate D | 52% | 134% F | 43% | 73% | 78% |
A Total returns would have been lower if certain expenses had not been reduced during the applicable periods shown. B Calculated based on average shares outstanding during the period. C Fees and expenses of any underlying Fidelity Central Funds are not included in the Fund's expense ratio. The Fund indirectly bears its proportionate share of the expenses of any underlying Fidelity Central Funds. D Amount does not include the portfolio activity of any underlying Fidelity Central Funds. E Expense ratios reflect operating expenses of the class. Expenses before reductions do not reflect amounts reimbursed by the investment adviser or reductions from brokerage service arrangements or reductions from other expense offset arrangements and do not represent the amount paid by the class during periods when reimbursements or reductions occur. Expenses net of fee waivers reflect expenses after reimbursement by the investment adviser but prior to reductions from brokerage service arrangements or other expense offset arrangements. Expenses net of all reductions represent the net expenses paid by the class. F The portfolio turnover rate does not include the assets acquired in the merger. G Amount represents less than $.01 per share. |
Financial Highlights - Institutional Class
Years ended October 31, | 2012 | 2011 G |
Selected Per-Share Data | | |
Net asset value, beginning of period | $ 9.57 | $ 10.83 |
Income from Investment Operations | | |
Net investment income (loss) D | .12 | .13 |
Net realized and unrealized gain (loss) | (.14) | (1.40) |
Total from investment operations | (.02) | (1.27) |
Distributions from net investment income | (.17) | - |
Distributions from net realized gain | (.05) | - |
Total distributions | (.22) | - |
Redemption fees added to paid in capital D | - J | .01 |
Net asset value, end of period | $ 9.33 | $ 9.57 |
Total Return B, C | (.18)% | (11.63)% |
Ratios to Average Net Assets E, H | | |
Expenses before reductions | 1.03% | .79% A |
Expenses net of fee waivers, if any | 1.01% | .79% A |
Expenses net of all reductions | .99% | .75% A |
Net investment income (loss) | 1.31% | 1.43% A |
Supplemental Data | | |
Net assets, end of period (000 omitted) | $ 1,488 | $ 2,715 |
Portfolio turnover rate F | 52% | 134% I |
A Annualized B Total returns for periods of less than one year are not annualized. C Total returns would have been lower if certain expenses had not been reduced during the applicable periods shown. D Calculated based on average shares outstanding during the period. E Fees and expenses of any underlying Fidelity Central Funds are not included in the Fund's expense ratio. The Fund indirectly bears its proportionate share of the expenses of any underlying Fidelity Central Funds. F Amount does not include the portfolio activity of any underlying Fidelity Central Funds. G For the period December 14, 2010 (commencement of sale of shares) to October 31, 2011. H Expense ratios reflect operating expenses of the class. Expenses before reductions do not reflect amounts reimbursed by the investment adviser or reductions from brokerage service arrangements or reductions from other expense offset arrangements and do not represent the amount paid by the class during periods when reimbursements or reductions occur. Expense ratios before reductions for start-up periods may not be representative of longer-term operating periods. Expenses net of fee waivers reflect expenses after reimbursement by the investment adviser but prior to reductions from brokerage service arrangements or other expense offset arrangements. Expenses net of all reductions represent the net expenses paid by the class. I The portfolio turnover rate does not include the assets acquired in the merger. J Amount represents less than $.01 per share. |
See accompanying notes which are an integral part of the financial statements.
Annual Report
Notes to Financial Statements
For the period ended October 31, 2012
1. Organization.
Fidelity Japan Fund (the Fund) is a fund of Fidelity Investment Trust (the Trust) and is authorized to issue an unlimited number of shares. The Trust is registered under the Investment Company Act of 1940, as amended (the 1940 Act), as an open-end management investment company organized as a Massachusetts business trust. The Fund offers Class A, Class T, Class C, Japan and Institutional Class shares, each of which, along with Class B shares, has equal rights as to assets and voting privileges. Class B shares are closed to new accounts and additional purchases, except for exchanges and reinvestments. Each class has exclusive voting rights with respect to matters that affect that class. Class B shares automatically convert to Class A shares after a holding period of seven years from the initial date of purchase. Investment income, realized and unrealized capital gains and losses, the common expenses of the Fund, and certain fund-level expense reductions, if any, are allocated on a pro-rata basis to each class based on the relative net assets of each class to the total net assets of the Fund. Each class differs with respect to transfer agent and distribution and service plan fees incurred. Certain expense reductions may also differ by class. The Fund offered Class F shares during the period June 26, 2009 through December 15, 2010 and all outstanding shares were redeemed by December 15, 2010.
2. Investments in Fidelity Central Funds.
The Fund invests in Fidelity Central Funds, which are open-end investment companies available only to other investment companies and accounts managed by Fidelity Management & Research Company (FMR) and its affiliates. The Fund's Schedule of Investments lists each of the Fidelity Central Funds held as of period end, if any, as an investment of the Fund, but does not include the underlying holdings of each Fidelity Central Fund. As an Investing Fund, the Fund indirectly bears its proportionate share of the expenses of the underlying Fidelity Central Funds.
The Money Market Central Funds seek preservation of capital and current income and are managed by Fidelity Investments Money Management, Inc. (FIMM), an affiliate of FMR.
A complete unaudited list of holdings for each Fidelity Central Fund is available upon request or at the Securities and Exchange Commission (the SEC) web site at www.sec.gov. In addition, the financial statements of the Fidelity Central Funds, which are not covered by the Fund's Report of Independent Registered Public Accounting Firm, are available on the SEC web site or upon request.
3. Significant Accounting Policies.
The financial statements have been prepared in conformity with accounting principles generally accepted in the United States of America (GAAP), which require management to make certain estimates and assumptions at the date of the financial statements. Actual results could differ from those estimates. Subsequent events, if any, through the date that the financial statements were issued have been evaluated in the preparation of the financial statements. The following summarizes the significant accounting policies of the Fund:
Security Valuation. Investments are valued as of 4:00 p.m. Eastern time on the last calendar day of the period. In accordance with valuation policies and procedures approved by the Board of Trustees (the Board), the Fund attempts to obtain prices from one or more third party pricing vendors or brokers to value its investments. When current market prices, quotations or rates are not readily available or reliable, securities will be fair valued in good faith by the FMR Fair Value Committee (the Committee), in accordance with procedures adopted by the Fund's Board. Factors used in determining fair value vary by security type and may include market or security specific events. The frequency with which these procedures are used cannot be predicted and they may be utilized to a significant extent. The Committee oversees the Fund's valuation policies and procedures and is responsible for approving and reporting to the Board all fair value determinations.
The Fund categorizes the inputs to valuation techniques used to value its investments into a disclosure hierarchy consisting of three levels as shown below:
Level 1 - quoted prices in active markets for identical investments
Level 2 - other significant observable inputs (including quoted prices for similar investments, interest rates, prepayment speeds, etc.)
Level 3 - unobservable inputs (including the Fund's own assumptions based on the best information available)
Valuation techniques used to value the Fund's investments by major category are as follows:
Equity securities, including restricted securities, for which market quotations are readily available, are valued at the last reported sale price or official closing price as reported by a third party pricing vendor on the primary market or exchange on which they are traded and are categorized as Level 1 in the hierarchy. In the event there were no sales during the day or closing prices are not available, securities are valued at the last quoted bid price or may be valued using the last available price and are generally categorized as Level 2 in the hierarchy. For foreign equity securities, when significant market or security specific events arise, comparisons to the valuation of American Depositary Receipts (ADRs), futures contracts, Exchange-Traded Funds (ETFs) and certain indexes as well as quoted prices for similar securities are used and are categorized as Level 2 in the hierarchy. Utilizing these techniques may result in transfers between Level 1 and Level 2.
Annual Report
Notes to Financial Statements - continued
3. Significant Accounting Policies - continued
Security Valuation - continued
Investments in open-end mutual funds, including the Fidelity Central Funds, are valued at their closing net asset value (NAV) each business day and are categorized as Level 1 in the hierarchy.
Changes in valuation techniques may result in transfers in or out of an assigned level within the disclosure hierarchy. The aggregate value of investments by input level, as of October 31, 2012, including information on transfers between Levels 1 and 2, is included at the end of the Fund's Schedule of Investments.
Foreign Currency Translation. The Fund may use foreign currency contracts to facilitate transactions in foreign-denominated securities. Gains and losses from these transactions may arise from changes in the value of the foreign currency or if the counterparties do not perform under the contracts' terms.
Foreign-denominated assets, including investment securities, and liabilities are translated into U.S. dollars at the exchange rates at period end. Purchases and sales of investment securities, income and dividends received and expenses denominated in foreign currencies are translated into U.S. dollars at the exchange rate in effect on the transaction date.
The effects of exchange rate fluctuations on investments are included with the net realized and unrealized gain (loss) on investment securities. Other foreign currency transactions resulting in realized and unrealized gain (loss) are disclosed separately.
Investment Transactions and Income. For financial reporting purposes, the Fund's investment holdings and NAV include trades executed through the end of the last business day of the period. The NAV per share for processing shareholder transactions is calculated as of the close of business of the New York Stock Exchange (NYSE), normally 4:00 p.m. Eastern time and includes trades executed through the end of the prior business day. Gains and losses on securities sold are determined on the basis of identified cost. Dividend income is recorded on the ex-dividend date, except for certain dividends from foreign securities where the ex-dividend date may have passed, which are recorded as soon as the Fund is informed of the ex-dividend date. Non-cash dividends included in dividend income, if any, are recorded at the fair market value of the securities received. Interest income and distributions from the Fidelity Central Funds are accrued as earned. Interest income includes coupon interest and amortization of premium and accretion of discount on debt securities. Investment income is recorded net of foreign taxes withheld where recovery of such taxes is uncertain.
Expenses. Expenses directly attributable to a fund are charged to that fund. Expenses attributable to more than one fund are allocated among the respective funds on the basis of relative net assets or other appropriate methods. Expense estimates are accrued in the period to which they relate and adjustments are made when actual amounts are known.
Income Tax Information and Distributions to Shareholders. Each year, the Fund intends to qualify as a regulated investment company under Subchapter M of the Internal Revenue Code, including distributing substantially all of its taxable income and realized gains. As a result, no provision for income taxes is required. As of October 31, 2012, the Fund did not have any unrecognized tax benefits in the financial statements; nor is the Fund aware of any tax positions for which it is reasonably possible that the total amounts of unrecognized tax benefits will significantly change in the next twelve months. The Fund files a U.S. federal tax return, in addition to state and local tax returns as required. A fund's federal income tax returns are subject to examination by the Internal Revenue Service (IRS) for a period of three fiscal years after they are filed. State and local tax returns may be subject to examination for an additional fiscal year depending on the jurisdiction. Foreign taxes are provided for based on the Fund's understanding of the tax rules and rates that exist in the foreign markets in which it invests.
Distributions are declared and recorded on the ex-dividend date. Income dividends and capital gain distributions are declared separately for each class. Income and capital gain distributions are determined in accordance with income tax regulations, which may differ from GAAP.
Capital accounts within the financial statements are adjusted for permanent book-tax differences. These adjustments have no impact on net assets or the results of operations. Temporary book-tax differences will reverse in a subsequent period.
Book-tax differences are primarily due to the foreign currency transactions, passive foreign investment companies (PFIC), deferred trustees compensation, capital loss carryfowards and losses deferred due to wash sales.
The federal tax cost of investment securities and unrealized appreciation (depreciation) as of period end were as follows:
Gross unrealized appreciation | $ 13,646,950 |
Gross unrealized depreciation | (95,986,881) |
Net unrealized appreciation (depreciation) on securities and other investments | $ (82,339,931) |
| |
Tax Cost | $ 467,856,023 |
Annual Report
3. Significant Accounting Policies - continued
Income Tax Information and Distributions to Shareholders - continued
The tax-based components of distributable earnings as of period end were as follows:
Undistributed ordinary income | $ 8,180,595 |
Capital loss carryforward | $ (211,289,523) |
Net unrealized appreciation (depreciation) | $ (82,431,582) |
Capital loss carryforwards are only available to offset future capital gains of the Fund to the extent provided by regulations and may be limited. Under the Regulated Investment Company Modernization Act of 2010 (the Act), the Fund is permitted to carry forward capital losses incurred in taxable years beginning after December 22, 2010 for an unlimited period and such capital losses are required to be used prior to any losses that expire. Capital loss carryforwards were as follows:
Fiscal year of expiration | |
2016 | $ (7,195,987) |
2017 | (66,780,238) |
2018 | (26,887,863) |
2019 | (98,806,037) |
Total with expiration | (199,670,125) |
No expiration | |
Short-term | (2,193,630) |
Long-term | (9,425,768) |
Total no expiration | (11,619,398) |
Total capital loss carryforward | $ (211,289,523) |
At October 31, 2011, the Fund reported a total capital loss carryforward amount of $523,526,201. As a result of large redemptions in December 2010, the Fund had an "ownership change" under the Internal Revenue Code, which limits capital losses that would be available to offset future gains to $18,885,324 per year, including adjustments for certain gains and losses in the Fund existing at the time of the ownership change. The impact of this ownership change to the total capital loss carryforward amount reported at October 31, 2011 was not properly reflected in the Fund's financial statements. As a result, an adjustment of $323,400,279 was made between Accumulated Undistributed Net Realized Loss and Paid In Capital in the current period to reflect the amount of losses that will expire unused resulting from the ownership change. This adjustment was not considered material to the financial statements of the Fund.
In addition, the Fund acquired $25,965,572 of capital loss carryforwards from the Fidelity Advisor Japan Fund when it merged with that fund on December 17, 2010. Under the Internal Revenue Code, the losses acquired from the Fidelity Advisor Japan Fund that will be available to offset future capital gains of the Fund will be limited. As a result, at least $17,152,282 of the losses acquired from Fidelity Advisor Japan Fund will expire unused.
The total capital loss carryforward amounts reported in the table above reflect the deduction of amounts relating to the ownership change and merger that are expected to expire unused.
The tax character of distributions paid was as follows:
| October 31, 2012 | October 31, 2011 |
Ordinary Income | $ 10,259,692 | $ 20,255,739 |
Short-Term Trading (Redemption) Fees. Shares purchased by investors and held in the Fund less than 90 days are subject to a redemption fee equal to 1.50% of the net asset value of shares redeemed. All redemption fees, which reduce the proceeds of the shareholder redemption, are retained by the Fund and accounted for as an addition to paid in capital.
New Accounting Pronouncement. In December 2011, the Financial Accounting Standards Board issued Accounting Standard Update No. 2011-11, Disclosures about Offsetting Assets and Liabilities. The update creates new disclosure requirements requiring entities to disclose both gross and net information for derivatives and other financial instruments that are either offset in the Statement of Assets and Liabilities or subject to an enforceable master netting arrangement or similar agreement. The disclosure requirements are effective for annual reporting periods beginning on or after January 1, 2013, and interim periods within those annual periods. Management is currently evaluating the impact of the update's adoption on the Fund's financial statement disclosures.
4. Purchases and Sales of Investments.
Purchases and sales of securities, other than short sales and short-term securities, aggregated $221,392,251 and $306,262,922, respectively.
Annual Report
Notes to Financial Statements - continued
5. Fees and Other Transactions with Affiliates.
Management Fee. FMR and its affiliates provide the Fund with investment management related services for which the Fund pays a monthly management fee. The management fee is the sum of an individual fund fee rate that is based on an annual rate of .45% of the Fund's average net assets and an annualized group fee rate that averaged .26% during the period. The group fee rate is based upon the average net assets of all the mutual funds advised by FMR. The group fee rate decreases as assets under management increase and increases as assets under management decrease. In addition, the management fee is subject to a performance adjustment (up to a maximum of ± .20% of the Fund's average net assets over a 36 month performance period). The upward or downward adjustment to the management fee is based on the relative investment performance of Japan as compared to an appropriate benchmark index. For the period, the total annual management fee rate, including the performance adjustment, was .77% of the Fund's average net assets.
Distribution and Service Plan Fees. In accordance with Rule 12b-1 of the 1940 Act, the Fund has adopted separate Distribution and Service Plans for each class of shares. Certain classes pay Fidelity Distributors Corporation (FDC), an affiliate of FMR, separate Distribution and Service Fees, each of which is based on an annual percentage of each class' average net assets. In addition, FDC may pay financial intermediaries for selling shares of the Fund and providing shareholder support services. For the period, the Distribution and Service Fee rates, total fees and amounts retained by FDC were as follows:
| Distribution
Fee | Service
Fee | Total Fees | Retained
by FDC |
Class A | -% | .25% | $ 29,171 | $ 772 |
Class T | .25% | .25% | 21,850 | 83 |
Class B | .75% | .25% | 12,679 | 9,525 |
Class C | .75% | .25% | 79,302 | 21,124 |
| | | $ 143,002 | $ 31,504 |
Sales Load. FDC may receive a front-end sales charge of up to 5.75% for selling Class A shares and 3.50% for selling Class T shares, some of which is paid to financial intermediaries for selling shares of the Fund. Depending on the holding period, FDC may receive contingent deferred sales charges levied on Class A, Class T, Class B, and Class C redemptions. The deferred sales charges range from 5.00% to 1.00% for Class B shares, 1.00% for Class C shares, 1.00% for certain purchases of Class A shares and .25% for certain purchases of Class T shares.
For the period, sales charge amounts retained by FDC were as follows:
| Retained
by FDC |
Class A | $ 2,962 |
Class T | 1,060 |
Class B* | 1,711 |
Class C* | 2,026 |
| $ 7,759 |
* When Class B and Class C shares are initially sold, FDC pays commissions from its own resources to financial intermediaries through which the sales are made.
Transfer Agent Fees. Fidelity Investments Institutional Operations Company, Inc. (FIIOC), an affiliate of FMR, is the transfer, dividend disbursing and shareholder servicing agent for each class of the Fund. FIIOC receives account fees and asset-based fees that vary according to the account size and type of account. FIIOC pays for typesetting, printing and mailing of shareholder reports, except proxy statements. For the period, transfer agent fees for each class were as follows:
| Amount | % of
Average
Net Assets |
Class A | $ 35,249 | .30 |
Class T | 14,791 | .34 |
Class B | 3,843 | .30 |
Class C | 22,142 | .28 |
Japan | 920,315 | .22 |
Institutional Class | 3,138 | .16 |
| $ 999,478 | |
Accounting and Security Lending Fees. Fidelity Service Company, Inc. (FSC), an affiliate of FMR, maintains the Fund's accounting records. The accounting fee is based on the level of average net assets for each month. Under a separate contract, FSC administers the security lending program. The security lending fee is based on the number and duration of lending transactions.
Annual Report
6. Committed Line of Credit.
The Fund participates with other funds managed by FMR or an affiliate in a $4.25 billion credit facility (the "line of credit") to be utilized for temporary or emergency purposes to fund shareholder redemptions or for other short-term liquidity purposes. The Fund has agreed to pay commitment fees on its pro-rata portion of the line of credit, which amounted to $1,244 and is reflected in Miscellaneous expenses on the Statement of Operations. During the period, there were no borrowings on this line of credit.
7. Security Lending.
The Fund lends portfolio securities through a lending agent from time to time in order to earn additional income. For equity securities, a lending agent is used and may loan securities to certain qualified borrowers, including Fidelity Capital Markets (FCM), a broker-dealer affiliated with the Fund. On the settlement date of the loan, the Fund receives collateral (in the form of U.S. Treasury obligations, letters of credit and/or cash) against the loaned securities and maintains collateral in an amount not less than 100% of the market value of the loaned securities during the period of the loan. The market value of the loaned securities is determined at the close of business of the Fund and any additional required collateral is delivered to the Fund on the next business day. If the borrower defaults on its obligation to return the securities loaned because of insolvency or other reasons, a fund could experience delays and costs in recovering the securities loaned or in gaining access to the collateral. Any cash collateral received is invested in Fidelity Securities Lending Cash Central Fund. The value of loaned securities and cash collateral at period end are disclosed on the Fund's Statement of Assets and Liabilities. Security lending income represents the income earned on investing cash collateral, less rebates paid to borrowers and any lending agent fees associated with the loan, plus any premium payments received for lending certain types of securities. Security lending income is presented in the Statement of Operations as a component of income from Fidelity Central Funds. Total security lending income during the period amounted to $57,669. During the period, there were no securities loaned to FCM.
8. Expense Reductions.
FMR voluntarily agreed to reimburse each class to the extent annual operating expenses exceeded certain levels of average net assets as noted in the table below. Some expenses, for example interest expense, including commitment fees, are excluded from this reimbursement.
The following classes were in reimbursement during the period:
| Expense
Limitations | Reimbursement
from adviser |
Class A | 1.45% | $ 4,359 |
Class T | 1.70% | 1,853 |
Class B | 2.20% | 481 |
Class C | 2.20% | 2,553 |
Japan | 1.20% | 97,123 |
Institutional Class | 1.20% | 460 |
| | $ 106,829 |
Effective January 1, 2012 the expense limitations were discontinued.
Many of the brokers with whom FMR places trades on behalf of the Fund provided services in addition to trade execution. These services included payments of certain expenses on behalf of the Fund totaling $87,577 for the period.
9. Distributions to Shareholders.
Distributions to shareholders of each class were as follows:
Years ended October 31, | 2012 | 2011 A, B |
From net investment income | | |
Class A | $ 168,535 | $ - |
Class T | 50,833 | - |
Class B | 6,144 | - |
Class C | 52,214 | - |
Japan | 7,354,386 | 9,544,936 |
Class F | - | 204,046 |
Institutional Class | 56,675 | - |
Total | $ 7,688,787 | $ 9,748,982 |
Annual Report
Notes to Financial Statements - continued
9. Distributions to Shareholders - continued
Years ended October 31, | 2012 | 2011 A, B |
From net realized gain | | |
Class A | $ 69,007 | $ - |
Class T | 24,703 | - |
Class B | 7,792 | - |
Class C | 46,858 | - |
Japan | 2,405,209 | 10,328,111 |
Class F | - | 178,646 |
Institutional Class | 17,336 | - |
Total | $ 2,570,905 | $ 10,506,757 |
A Distributions for Class A, Class T, Class B, Class C and Institutional Class are for the period December 14, 2010 (commencement of sale of shares) to October 31, 2011.
B All Class F shares were redeemed on December 15, 2010.
10. Share Transactions.
Transactions for each class of shares were as follows:
| Shares | Dollars |
Years ended October 31, | 2012 | 2011 A, B | 2012 | 2011 A, B |
Class A | | | | |
Shares sold | 272,417 | 902,250 | $ 2,571,605 | $ 9,266,531 |
Issued in exchange for shares of Fidelity Advisor Japan Fund | - | 1,458,691 | - | 15,812,213 |
Reinvestment of distributions | 22,132 | - | 206,271 | - |
Shares redeemed | (659,149) | (975,882) | (6,253,228) | (10,202,627) |
Net increase (decrease) | (364,600) | 1,385,059 | $ (3,475,352) | $ 14,876,117 |
Class T | | | | |
Shares sold | 61,409 | 132,383 | $ 587,072 | $ 1,384,063 |
Issued in exchange for shares of Fidelity Advisor Japan Fund | - | 487,882 | - | 5,288,638 |
Reinvestment of distributions | 7,853 | - | 73,111 | - |
Shares redeemed | (133,261) | (132,194) | (1,264,265) | (1,415,637) |
Net increase (decrease) | (63,999) | 488,071 | $ (604,082) | $ 5,257,064 |
Class B | | | | |
Shares sold | 6,716 | 15,198 | $ 66,720 | $ 161,868 |
Issued in exchange for shares of Fidelity Advisor Japan Fund | - | 224,548 | - | 2,434,105 |
Reinvestment of distributions | 1,058 | - | 9,881 | - |
Shares redeemed | (52,372) | (85,826) | (495,118) | (926,239) |
Net increase (decrease) | (44,598) | 153,920 | $ (418,517) | $ 1,669,734 |
Class C | | | | |
Shares sold | 108,642 | 711,218 | $ 1,051,805 | $ 7,424,606 |
Issued in exchange for shares of Fidelity Advisor Japan Fund | - | 857,308 | - | 9,293,223 |
Reinvestment of distributions | 7,654 | - | 71,333 | - |
Shares redeemed | (280,979) | (645,053) | (2,637,126) | (6,643,542) |
Net increase (decrease) | (164,683) | 923,473 | $ (1,513,988) | $ 10,074,287 |
Japan | | | | |
Shares sold | 2,737,496 | 16,755,813 | $ 26,290,775 | $ 180,371,996 |
Reinvestment of distributions | 1,014,920 | 1,718,167 | 9,459,053 | 18,229,748 |
Shares redeemed | (12,951,522) | (32,842,865) | (122,521,103) | (351,598,189) |
Net increase (decrease) | (9,199,106) | (14,368,885) | $ (86,771,275) | $ (152,996,445) |
Class F | | | | |
Shares sold | - | 346,757 | $ - | $ 3,766,116 |
Reinvestment of distributions | - | 36,103 | - | 382,692 |
Shares redeemed | - | (3,617,960) | - | (39,396,699) |
Net increase (decrease) | - | (3,235,100) | $ - | $ (35,247,891) |
Annual Report
10. Share Transactions - continued
| Shares | Dollars |
Years ended October 31, | 2012 | 2011 A, B | 2012 | 2011 A, B |
Institutional Class | | | | |
Shares sold | 238,239 | 324,072 | $ 2,250,127 | $ 3,355,850 |
Issued in exchange for shares of Fidelity Advisor Japan Fund | - | 420,228 | - | 4,555,276 |
Reinvestment of distributions | 6,735 | - | 62,700 | - |
Shares redeemed | (369,198) | (460,581) | (3,505,242) | (4,809,911) |
Net increase (decrease) | (124,224) | 283,719 | $ (1,192,415) | $ 3,101,215 |
A Share transactions for Class A, Class T, Class B, Class C and Institutional Class are for the period December 14, 2010 (commencement of sale of shares) to October 31, 2011.
B All Class F shares were redeemed on December 15, 2010.
11. Other.
The Fund's organizational documents provide former and current trustees and officers with a limited indemnification against liabilities arising in connection with the performance of their duties to the Fund. In the normal course of business, the Fund may also enter into contracts that provide general indemnifications. The Fund's maximum exposure under these arrangements is unknown as this would be dependent on future claims that may be made against the Fund. The risk of material loss from such claims is considered remote.
At the end of the period, Strategic Advisors International Fund was the owner of record of approximately 40% of the total outstanding shares of the Fund. Mutual funds managed by Strategic Advisors, Inc., an affiliate of FMR, were the owners of record, in the aggregate, of approximately 46% of the total outstanding shares of the Fund.
12. Merger Information.
On December 17, 2010, the Fund acquired all of the assets and assumed all of the liabilities of the Fidelity Advisor Japan Fund ("Target Fund") pursuant to an agreement and plan of reorganization approved by the Board of Trustees ("The Board") on July 14, 2010. The reorganization provides shareholders of the Target Fund access to a larger portfolio with the same investment objective and lower expenses. The acquisition was accomplished by an exchange of 1,458,691 Class A shares, 487,882 Class T shares, 224,548 Class B shares, 857,308 Class C shares, and 420,228 Institutional Class shares of the Fund, respectively, for 1,347,662 Class A shares, 458,320 Class T shares, 220,839 Class B shares, 837,651 Class C shares, and 377,690 Institutional Class shares then outstanding (valued at $11.73, $11.54, $11.02, $11.09 and $12.06 per share for Class A, Class T, Class B, Class C, and Institutional Class, respectively) of the Target Fund. The reorganization qualified as a tax-free reorganization for federal income tax purposes with no gain or loss recognized to the funds or their shareholders. The Target Fund's net assets, including securities of $37,429,891 unrealized depreciation of $(2,434,247), cash of $6,456 and net other liabilities of $(52,892), were combined with the Fund's net assets of $515,046,445 for total net assets after the acquisition of $552,429,900.
Pro forma results of operations of the combined entity for the entire period ended October 31, 2011, as though the acquisition had occurred as of the beginning of the year (rather than on the actual acquisition date), are as follows:
Net investment income (loss) | $ 7,426,258 |
Total net realized gain (loss) | (68,640,546) |
Total change in net unrealized appreciation (depreciation) | 34,276,793 |
Net increase (decrease) in net assets resulting from operations | $ (26,937,495) |
Because the combined investment portfolios have been managed as a single portfolio since the acquisition was completed, it is not practicable to separate the amounts of revenue and earnings of the acquired fund that have been included in the Fund's accompanying Statement of Operations since December 17, 2010.
Annual Report
Fidelity Japan Smaller Companies Fund
Average annual total return reflects the change in the value of an investment, assuming reinvestment of the fund's distributions from dividend income and capital gains (the profits earned upon the sale of securities that have grown in value, if any) and assuming a constant rate of performance each year. The $10,000 table and the fund's returns do not reflect the deduction of taxes that a shareholder would pay on fund distributions or the redemption of fund shares. During periods of reimbursement by Fidelity, a fund's total return will be greater than it would be had the reimbursement not occurred. How a fund did yesterday is no guarantee of how it will do tomorrow.
Average Annual Total Returns
Periods ended October 31, 2012 | Past 1
year | Past 5
years | Past 10
years |
Fidelity Japan Smaller Companies Fund | 7.13% | -4.92% | 5.12% |
$10,000 Over 10 years
Let's say hypothetically that $10,000 was invested in Fidelity Japan Smaller Companies Fund on October 31, 2002. The chart shows how the value of your investment would have changed, and also shows how the Russell/Nomura Mid-Small CapTM Index performed over the same period.
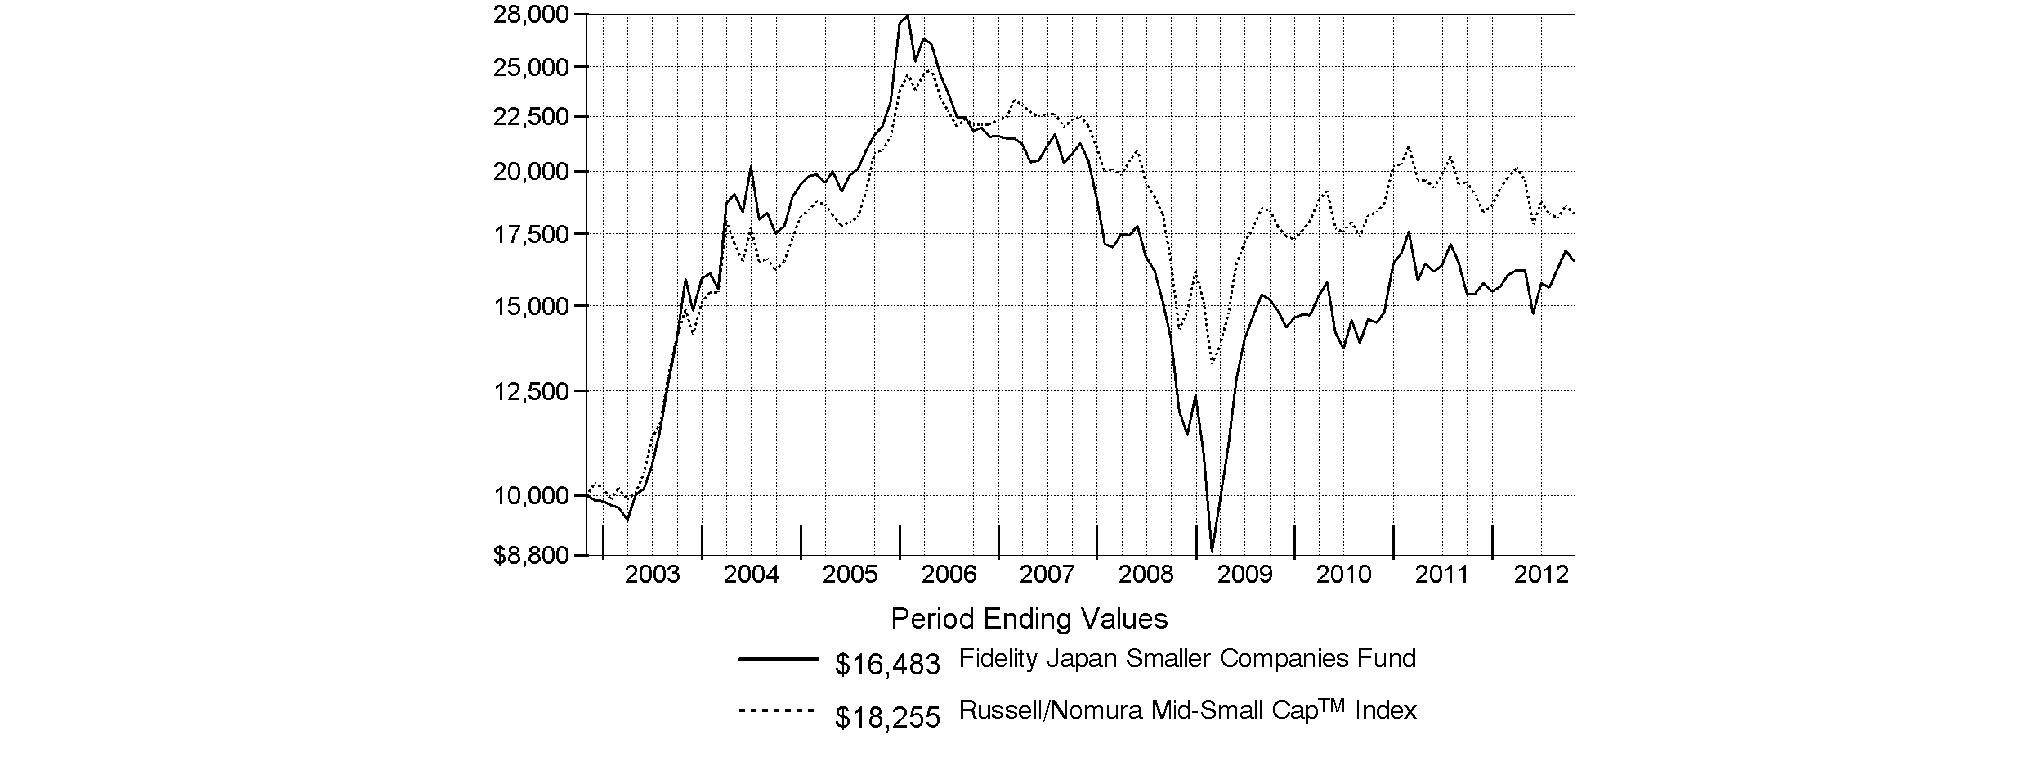
Annual Report
Fidelity Japan Smaller Companies Fund
Market Recap: Returns for most domestic and international equities fluctuated during the 12 months ending October 31, 2012, as investor sentiment towards risk vacillated amid a changing global economic landscape. U.S. stocks overcame bouts of volatility to post strong gains for the past year, extending an uptrend that began in March 2009. The broad-based S&P 500® Index advanced 15.21%, while the blue-chip-laden Dow Jones Industrial AverageSM and technology-heavy Nasdaq Composite® Index rose 12.56% and 12.21%, respectively. Performance outside of the U.S. was relatively weak, as the MSCI® ACWI® (All Country World Index) ex USA Index rose 4.11%, hampered in part by a stronger U.S. dollar. International developed-markets generally struggled during the period as macroeconomic concerns ebbed and flowed, finishing with only a modest gain. The MSCI® EAFE® Index rose 4.76% for the year, largely buttressed in the summertime by pledges of accommodative monetary action from eurozone officials, as well as signs that the U.S. housing market was on the mend. Within the index, Asia-Pacific ex Japan showed the most impressive gain, advancing roughly 10%. A number of core European components, including Germany (+11%) and Switzerland (+10%), and the U.K. (+9%), benefited from optimism about the eurozone's ability to resolve its debt woes, which helped the region outpace the index overall. Elsewhere, Japan was among the few benchmark constituents to finish in the red, returning about -3%. Emerging-markets stocks gained 2.98% for the year, as measured by the MSCI Emerging Markets Index. A general uptrend in the final five months of the period lifted the index into positive territory for the full 12 months.
Comments from Nicholas Price, Portfolio Manager of Fidelity® Japan Smaller Companies Fund: For the year, the fund returned 7.13%, significantly outpacing the -3.99% return of the Russell/Nomura Mid-Small CapTM Index. Investments in non-bank financials - including stock selection and overweightings in real estate and financial services - accounted for much of the fund's relative outperformance. The fund also benefited from positive stock picking in the consumer discretionary sector, notably in automobiles/components and consumer durables/apparel. Exposure to small-cap growth stocks in the health care and consumer staples sectors also added value. Among individual stocks, condominium developer Takara Leben, credit card firm AEON Credit Service and Osaka Securities Exchange were top performers among financials, while biopharmaceuticals firm Sosei Group and baby goods maker Pigeon also contributed. I sold Osaka Securities Exchange by period end. Conversely, the fund was hurt by its significant stake in social networking service (SNS) stocks in the software/services and media segments. Low relative weightings in defensive areas such as food/beverage/tobacco and food/staples retailing also crimped performance. Individual detractors included mobile SNS provider GREE, which saw its shares fall sharply after its "kompu gacha" sales methods, which encourage players to buy virtual items, came under legal scrutiny. Online advertising agency CyberAgent also was dragged down by concerns over regulatory risk, despite mobile gaming accounting for only a small portion of its overall business. In materials, profit growth at Osaka Titanium Technologies fell short of expectations, due to rising material costs. It was sold from the fund by period end.
The views expressed above reflect those of the portfolio manager(s) only through the end of the period as stated on the cover of this report and do not necessarily represent the views of Fidelity or any other person in the Fidelity organization. Any such views are subject to change at any time based upon market or other conditions and Fidelity disclaims any responsibility to update such views. These views may not be relied on as investment advice and, because investment decisions for a Fidelity fund are based on numerous factors, may not be relied on as an indication of trading intent on behalf of any Fidelity fund.
Annual Report
Fidelity Japan Smaller Companies Fund
As a shareholder of the Fund, you incur two types of costs: (1) transaction costs, including redemption fees and (2) ongoing costs, including management fees and other Fund expenses. This Example is intended to help you understand your ongoing costs (in dollars) of investing in the Fund and to compare these costs with the ongoing costs of investing in other mutual funds.
The Example is based on an investment of $1,000 invested at the beginning of the period and held for the entire period (May 1, 2012 to October 31, 2012).
Actual Expenses
The first line of the accompanying table provides information about actual account values and actual expenses. You may use the information in this line, together with the amount you invested, to estimate the expenses that you paid over the period. Simply divide your account value by $1,000.00 (for example, an $8,600 account value divided by $1,000.00 = 8.6), then multiply the result by the number in the first line under the heading entitled "Expenses Paid During Period" to estimate the expenses you paid on your account during this period. A small balance maintenance fee of $12.00 that is charged once a year may apply for certain accounts with a value of less than $2,000. This fee is not included in the table below. If it was, the estimate of expenses you paid during the period would be higher, and your ending account value lower, by this amount. In addition, the Fund, as a shareholder in the underlying Fidelity Central Funds, will indirectly bear its pro-rata share of the fees and expenses incurred by the underlying Fidelity Central Funds. These fees and expenses are not included in the Fund's annualized expense ratio used to calculate the expense estimate in the table below.
Hypothetical Example for Comparison Purposes
The second line of the accompanying table provides information about hypothetical account values and hypothetical expenses based on the Fund's actual expense ratio and an assumed rate of return of 5% per year before expenses, which is not the Fund's actual return. The hypothetical account values and expenses may not be used to estimate the actual ending account balance or expenses you paid for the period. You may use this information to compare the ongoing costs of investing in the Fund and other funds. To do so, compare this 5% hypothetical example with the 5% hypothetical examples that appear in the shareholder reports of the other funds. A small balance maintenance fee of $12.00 that is charged once a year may apply for certain accounts with a value of less than $2,000. This fee is not included in the table below. If it was, the estimate of expenses you paid during the period would be higher, and your ending account value lower, by this amount. In addition, the Fund, as a shareholder in the underlying Fidelity Central Funds, will indirectly bear its pro-rata share of the fees and expenses incurred by the underlying Fidelity Central Funds. These fees and expenses are not included in the Fund's annualized expense ratio used to calculate the expense estimate in the table below.
Please note that the expenses shown in the table are meant to highlight your ongoing costs only and do not reflect any transaction costs. Therefore, the second line of the table is useful in comparing ongoing costs only, and will not help you determine the relative total costs of owning different funds. In addition, if these transactional costs were included, your costs would have been higher.
| Annualized
Expense Ratio | Beginning
Account Value
May 1, 2012 | Ending
Account Value
October 31, 2012 | Expenses Paid
During Period*
May 1, 2012
to October 31, 2012 |
Actual | 1.06% | $ 1,000.00 | $ 1,017.90 | $ 5.38 |
Hypothetical (5% return per year before expenses) | | $ 1,000.00 | $ 1,019.81 | $ 5.38 |
* Expenses are equal to the Fund's annualized expense ratio, multiplied by the average account value over the period, multiplied by 184/366 (to reflect the one-half year period).
Annual Report
Fidelity Japan Smaller Companies Fund
Investment Changes (Unaudited)
Geographic Diversification (% of fund's net assets) |
As of October 31, 2012 |
| Japan | 102.4% | |
 | United States of America † | (2.4)% | |

† United States of America is not included in the pie chart. |
Percentages are based on country or territory of incorporation and are adjusted for the effect of futures contracts, if applicable. |
As of April 30, 2012 |
| Japan | 99.2% | |
| United States of America | 0.8% | |

Percentages are based on country or territory of incorporation and are adjusted for the effect of futures contracts, if applicable. |
Asset Allocation |
| % of fund's
net assets | % of fund's net assets
6 months ago |
Stocks | 102.4 | 99.2 |
Short-Term Investments and Net Other Assets (Liabilities) | (2.4) | 0.8 |
Top Ten Stocks as of October 31, 2012 |
| % of fund's
net assets | % of fund's net assets
6 months ago |
Nintendo Co. Ltd. (Software) | 8.7 | 6.7 |
Kakaku.com, Inc. (Internet Software & Services) | 6.4 | 5.4 |
Pigeon Corp. (Household Products) | 6.2 | 4.5 |
ORIX Corp. (Diversified Financial Services) | 5.9 | 6.5 |
Kubota Corp. (Machinery) | 4.3 | 3.8 |
AEON Credit Service Co. Ltd. (Consumer Finance) | 3.7 | 2.7 |
Sosei Group Corp. (Biotechnology) | 3.7 | 2.6 |
Nikkiso Co. Ltd. (Health Care Equipment & Supplies) | 3.6 | 2.7 |
Pal Co. Ltd. (Specialty Retail) | 3.2 | 2.6 |
CyberAgent, Inc. (Media) | 3.1 | 3.2 |
| 48.8 | |
Market Sectors as of October 31, 2012 |
| % of fund's
net assets | % of fund's net assets
6 months ago |
Information Technology | 25.9 | 24.0 |
Consumer Discretionary | 20.4 | 17.4 |
Financials | 15.7 | 19.0 |
Industrials | 14.7 | 15.2 |
Health Care | 10.6 | 8.1 |
Consumer Staples | 8.2 | 5.1 |
Materials | 6.5 | 10.1 |
Energy | 0.4 | 0.3 |
Annual Report
Fidelity Japan Smaller Companies Fund
Investments October 31, 2012
Showing Percentage of Net Assets
Common Stocks - 102.4% |
| Shares | | Value |
CONSUMER DISCRETIONARY - 20.4% |
Auto Components - 2.7% |
Nippon Seiki Co. Ltd. | 33,000 | | $ 317,061 |
Stanley Electric Co. Ltd. | 444,100 | | 6,119,379 |
| | 6,436,440 |
Automobiles - 2.4% |
Honda Motor Co. Ltd. | 188,300 | | 5,660,910 |
Hotels, Restaurants & Leisure - 0.8% |
Koshidaka Holdings Co. Ltd. | 57,500 | | 1,577,415 |
Round One Corp. | 84,100 | | 425,609 |
| | 2,003,024 |
Household Durables - 1.2% |
ARNEST ONE Corp. | 45,800 | | 679,857 |
Hajime Construction Co. Ltd. | 58,900 | | 1,854,874 |
West Holdings Corp. (d) | 17,200 | | 218,474 |
| | 2,753,205 |
Leisure Equipment & Products - 1.6% |
Fields Corp. | 97,800 | | 1,406,419 |
KAWAI Musical Instruments Manufacturing Co. Ltd. | 704,000 | | 1,472,730 |
SHIMANO, Inc. | 14,600 | | 919,930 |
| | 3,799,079 |
Media - 4.2% |
Avex Group Holdings, Inc. | 136,300 | | 2,694,243 |
CyberAgent, Inc. (d) | 3,639 | | 7,275,265 |
| | 9,969,508 |
Multiline Retail - 0.2% |
Ryohin Keikaku Co. Ltd. | 7,700 | | 510,247 |
Specialty Retail - 5.3% |
Chiyoda Co. Ltd. | 80,800 | | 2,311,752 |
Fuji Corp. | 44,700 | | 654,570 |
K'S Denki Corp. (d) | 49,100 | | 1,314,377 |
Otsuka Kagu Ltd. | 67,500 | | 659,527 |
Pal Co. Ltd. | 151,150 | | 7,715,599 |
| | 12,655,825 |
Textiles, Apparel & Luxury Goods - 2.0% |
Fuji Spinning Co. Ltd. | 766,000 | | 3,166,479 |
GOLDWIN, Inc. (d) | 259,000 | | 1,586,509 |
| | 4,752,988 |
TOTAL CONSUMER DISCRETIONARY | | 48,541,226 |
CONSUMER STAPLES - 8.2% |
Food & Staples Retailing - 0.6% |
Kobe Bussan Co. Ltd. | 9,200 | | 241,899 |
Seven & i Holdings Co., Ltd. | 9,100 | | 280,649 |
Sugi Holdings Co. Ltd. | 800 | | 28,911 |
Yamaya Corp. | 56,800 | | 815,393 |
| | 1,366,852 |
|
| Shares | | Value |
Food Products - 0.8% |
Ajinomoto Co., Inc. | 122,000 | | $ 1,862,934 |
Household Products - 6.3% |
Pigeon Corp. | 317,500 | | 14,636,102 |
Unicharm Corp. | 4,500 | | 243,517 |
| | 14,879,619 |
Personal Products - 0.5% |
Kao Corp. | 45,800 | | 1,286,278 |
TOTAL CONSUMER STAPLES | | 19,395,683 |
ENERGY - 0.4% |
Energy Equipment & Services - 0.4% |
Toyo Kanetsu KK | 433,000 | | 840,724 |
FINANCIALS - 15.7% |
Capital Markets - 0.2% |
Sawada Holdings Co. Ltd. (a) | 78,600 | | 432,236 |
Commercial Banks - 0.1% |
Mizuho Financial Group, Inc. | 234,100 | | 366,292 |
Consumer Finance - 4.6% |
ACOM Co. Ltd. (a) | 72,500 | | 2,140,580 |
AEON Credit Service Co. Ltd. | 413,900 | | 8,782,996 |
| | 10,923,576 |
Diversified Financial Services - 5.9% |
ORIX Corp. | 135,760 | | 13,945,033 |
Real Estate Management & Development - 4.9% |
Aeon Mall Co. Ltd. | 61,200 | | 1,587,689 |
Airport Facilities Co. Ltd. | 164,300 | | 757,389 |
Iida Home Max Co., Ltd. | 140,400 | | 1,238,151 |
Takara Leben Co. Ltd. | 675,900 | | 7,239,064 |
Toho Real Estate Co. Ltd. | 46,000 | | 251,234 |
Tokyu Land Corp. | 90,000 | | 505,073 |
| | 11,578,600 |
TOTAL FINANCIALS | | 37,245,737 |
HEALTH CARE - 10.6% |
Biotechnology - 3.7% |
Sosei Group Corp. (a) | 3,160 | | 8,728,298 |
Health Care Equipment & Supplies - 5.4% |
Nikkiso Co. Ltd. | 723,000 | | 8,612,965 |
Olympus Corp. (a) | 249,400 | | 4,355,049 |
Sysmex Corp. | 600 | | 28,222 |
| | 12,996,236 |
Health Care Providers & Services - 0.4% |
Tsukui Corp. | 35,600 | | 827,233 |
Uchiyama Holdings Co. Ltd. | 5,100 | | 93,273 |
| | 920,506 |
Common Stocks - continued |
| Shares | | Value |
HEALTH CARE - continued |
Pharmaceuticals - 1.1% |
Rohto Pharmaceutical Co. Ltd. | 195,000 | | $ 2,691,845 |
TOTAL HEALTH CARE | | 25,336,885 |
INDUSTRIALS - 14.7% |
Building Products - 2.1% |
Nichias Corp. | 733,000 | | 3,590,167 |
Shinko Kogyo Co. Ltd. | 289,600 | | 1,509,127 |
| | 5,099,294 |
Construction & Engineering - 1.6% |
Toyo Engineering Corp. | 924,000 | | 3,819,617 |
Machinery - 10.2% |
HIRANO TECSEED Co. Ltd. | 211,500 | | 1,168,377 |
Hoshizaki Electric Co. Ltd. | 152,700 | | 4,156,546 |
Kitz Corp. | 49,200 | | 207,696 |
Kubota Corp. | 1,009,000 | | 10,313,717 |
Makita Corp. | 121,200 | | 4,790,004 |
Nitta Corp. | 232,100 | | 3,570,322 |
| | 24,206,662 |
Road & Rail - 0.8% |
Hitachi Transport System Ltd. | 130,800 | | 1,961,263 |
TOTAL INDUSTRIALS | | 35,086,836 |
INFORMATION TECHNOLOGY - 25.9% |
Electronic Equipment & Components - 5.0% |
Citizen Holdings Co. Ltd. | 836,900 | | 4,245,829 |
ITC Networks Corp. | 32,800 | | 262,959 |
Maruwa Ceramic Co. Ltd. | 12,900 | | 379,744 |
Origin Electric Co. Ltd. | 569,000 | | 2,202,443 |
Shimadzu Corp. | 311,000 | | 2,092,033 |
Shinko Shoji Co. Ltd. | 45,300 | | 392,112 |
Topcon Corp. (d) | 465,500 | | 2,204,171 |
| | 11,779,291 |
Internet Software & Services - 11.2% |
DeNA Co. Ltd. | 146,100 | | 4,558,876 |
Enigmo, Inc. | 23,300 | | 2,194,864 |
GMO Internet, Inc. | 210,300 | | 1,469,966 |
GREE, Inc. (d) | 159,600 | | 2,782,954 |
Kakaku.com, Inc. | 445,800 | | 15,273,243 |
WebCrew, Inc. | 64,600 | | 404,610 |
| | 26,684,513 |
IT Services - 0.2% |
CAC Corp. | 68,200 | | 574,100 |
Semiconductors & Semiconductor Equipment - 0.6% |
Megachips Corp. | 67,300 | | 1,502,300 |
|
| Shares | | Value |
Software - 8.9% |
Nintendo Co. Ltd. | 160,200 | | $ 20,629,534 |
NSD Co. Ltd. | 44,400 | | 424,923 |
| | 21,054,457 |
TOTAL INFORMATION TECHNOLOGY | | 61,594,661 |
MATERIALS - 6.5% |
Chemicals - 1.8% |
Hitachi Chemical Co. Ltd. | 145,300 | | 2,047,632 |
JSP Corp. | 40,500 | | 523,563 |
Mitsubishi Gas Chemical Co., Inc. | 6,000 | | 29,613 |
Nitta Gelatin, Inc. | 139,700 | | 1,133,980 |
Shin-Etsu Chemical Co., Ltd. | 4,300 | | 242,390 |
STELLA CHEMIFA Corp. | 12,300 | | 231,116 |
Sumitomo Chemical Co. Ltd. | 10,000 | | 28,060 |
| | 4,236,354 |
Construction Materials - 0.4% |
Taiheiyo Cement Corp. | 505,000 | | 1,075,410 |
Metals & Mining - 4.3% |
Asahi Holdings, Inc. (d) | 88,200 | | 1,487,125 |
Hitachi Metals Ltd. | 520,000 | | 4,865,840 |
Pacific Metals Co. Ltd. | 141,000 | | 478,655 |
Sumitomo Metal Mining Co. Ltd. | 256,000 | | 3,370,362 |
Yamato Kogyo Co. Ltd. | 1,800 | | 50,530 |
| | 10,252,512 |
TOTAL MATERIALS | | 15,564,276 |
TOTAL COMMON STOCKS (Cost $228,413,207) |
243,606,028
|
Money Market Funds - 4.1% |
| | | |
Fidelity Cash Central Fund, 0.19% (b) | 237,550 | | 237,550 |
Fidelity Securities Lending Cash Central Fund, 0.19% (b)(c) | 9,445,077 | | 9,445,077 |
TOTAL MONEY MARKET FUNDS (Cost $9,682,627) |
9,682,627
|
TOTAL INVESTMENT PORTFOLIO - 106.5% (Cost $238,095,834) | | 253,288,655 |
NET OTHER ASSETS (LIABILITIES) - (6.5)% | | (15,395,336) |
NET ASSETS - 100% | $ 237,893,319 |
Legend |
(a) Non-income producing |
(b) Affiliated fund that is available only to investment companies and other accounts managed by Fidelity Investments. The rate quoted is the annualized seven-day yield of the fund at period end. A complete unaudited listing of the fund's holdings as of its most recent quarter end is available upon request. In addition, each Fidelity Central Fund's financial statements, which are not covered by the Fund's Report of Independent Registered Public Accounting Firm, are available on the SEC's website or upon request. |
(c) Includes cash collateral received from securities on loan. |
(d) Security or a portion of the security is on loan at period end. |
Affiliated Central Funds |
Information regarding fiscal year to date income earned by the Fund from investments in Fidelity Central Funds is as follows: |
Fund | Income earned |
Fidelity Cash Central Fund | $ 506 |
Fidelity Securities Lending Cash Central Fund | 172,725 |
Total | $ 173,231 |
Other Affiliated Issuers |
An affiliated company is a company in which the Fund has ownership of at least 5% of the voting securities. Fiscal year to date transactions with companies which are or were affiliates are as follows: |
Affiliate | Value,
beginning of
period | Purchases | Sales
Proceeds | Dividend
Income | Value,
end of
period |
Takara Leben Co. Ltd. | $ 10,582,018 | $ - | $ 11,260,919 | $ 196,556 | $ - |
Other Information |
The following is a summary of the inputs used, as of October 31, 2012, involving the Fund's assets and liabilities carried at fair value. The inputs or methodology used for valuing securities may not be an indication of the risk associated with investing in those securities. For more information on valuation inputs, and their aggregation into the levels used in the tables below, please refer to the Security Valuation section in the accompanying Notes to Financial Statements. |
Valuation Inputs at Reporting Date: |
Description | Total | Level 1 | Level 2 | Level 3 |
Investments in Securities: | | | | |
Equities: | | | | |
Consumer Discretionary | $ 48,541,226 | $ 42,880,316 | $ 5,660,910 | $ - |
Consumer Staples | 19,395,683 | 19,395,683 | - | - |
Energy | 840,724 | 840,724 | - | - |
Financials | 37,245,737 | 36,879,445 | 366,292 | - |
Health Care | 25,336,885 | 25,336,885 | - | - |
Industrials | 35,086,836 | 35,086,836 | - | - |
Information Technology | 61,594,661 | 61,594,661 | - | - |
Materials | 15,564,276 | 15,564,276 | - | - |
Money Market Funds | 9,682,627 | 9,682,627 | - | - |
Total Investments in Securities: | $ 253,288,655 | $ 247,261,453 | $ 6,027,202 | $ - |
The following is a summary of transfers between Level 1 and Level 2 for the period ended October 31, 2012. Transfers are assumed to have occurred at the beginning of the period, and are primarily attributable to the valuation techniques used for foreign equity securities, as discussed in the accompanying Notes to Financial Statements: |
Transfers | Total |
Level 1 to Level 2 | $ 0 |
Level 2 to Level 1 | $ 201,246,740 |
See accompanying notes which are an integral part of the financial statements.
Annual Report
Fidelity Japan Smaller Companies Fund
Statement of Assets and Liabilities
| October 31, 2012 |
| | |
Assets | | |
Investment in securities, at value (including securities loaned of $8,817,326) - See accompanying schedule: Unaffiliated issuers (cost $228,413,207) | $ 243,606,028 | |
Fidelity Central Funds (cost $9,682,627) | 9,682,627 | |
Total Investments (cost $238,095,834) | | $ 253,288,655 |
Receivable for investments sold | | 1,604,933 |
Receivable for fund shares sold | | 61,074 |
Dividends receivable | | 1,277,183 |
Distributions receivable from Fidelity Central Funds | | 18,846 |
Other receivables | | 23,775 |
Total assets | | 256,274,466 |
| | |
Liabilities | | |
Payable to custodian bank | $ 165,034 | |
Payable for investments purchased | 1,321,962 | |
Payable for fund shares redeemed | 7,171,644 | |
Accrued management fee | 151,488 | |
Other affiliated payables | 61,874 | |
Other payables and accrued expenses | 64,068 | |
Collateral on securities loaned, at value | 9,445,077 | |
Total liabilities | | 18,381,147 |
| | |
Net Assets | | $ 237,893,319 |
Net Assets consist of: | | |
Paid in capital | | $ 302,841,294 |
Undistributed net investment income | | 1,851,362 |
Accumulated undistributed net realized gain (loss) on investments and foreign currency transactions | | (81,960,700) |
Net unrealized appreciation (depreciation) on investments and assets and liabilities in foreign currencies | | 15,161,363 |
Net Assets, for 26,088,268 shares outstanding | | $ 237,893,319 |
Net Asset Value, offering price and redemption price per share ($237,893,319 ÷ 26,088,268 shares) | | $ 9.12 |
Statement of Operations
| Year ended October 31, 2012 |
| | |
Investment Income | | |
Dividends (including $196,556 earned from other affiliated issuers) | | $ 4,850,348 |
Income from Fidelity Central Funds | | 173,231 |
Income before foreign taxes withheld | | 5,023,579 |
Less foreign taxes withheld | | (339,524) |
Total income | | 4,684,055 |
| | |
Expenses | | |
Management fee | $ 1,962,428 | |
Transfer agent fees | 650,053 | |
Accounting and security lending fees | 147,051 | |
Custodian fees and expenses | 74,942 | |
Independent trustees' compensation | 1,935 | |
Registration fees | 21,797 | |
Audit | 57,184 | |
Legal | 1,475 | |
Interest | 233 | |
Miscellaneous | 2,798 | |
Total expenses before reductions | 2,919,896 | |
Expense reductions | (95,353) | 2,824,543 |
Net investment income (loss) | | 1,859,512 |
Realized and Unrealized Gain (Loss) Net realized gain (loss) on: | | |
Investment securities: | | |
Unaffiliated issuers | 1,361,914 | |
Other affiliated issuers | 4,435,974 | |
Foreign currency transactions | 94,003 | |
Total net realized gain (loss) | | 5,891,891 |
Change in net unrealized appreciation (depreciation) on: Investment securities | 11,406,140 | |
Assets and liabilities in foreign currencies | (1,914) | |
Total change in net unrealized appreciation (depreciation) | | 11,404,226 |
Net gain (loss) | | 17,296,117 |
Net increase (decrease) in net assets resulting from operations | | $ 19,155,629 |
See accompanying notes which are an integral part of the financial statements.
Annual Report
Statement of Changes in Net Assets
| Year ended
October 31,
2012 | Year ended
October 31,
2011 |
Increase (Decrease) in Net Assets | | |
Operations | | |
Net investment income (loss) | $ 1,859,512 | $ 2,836,322 |
Net realized gain (loss) | 5,891,891 | 23,210,552 |
Change in net unrealized appreciation (depreciation) | 11,404,226 | (10,169,674) |
Net increase (decrease) in net assets resulting from operations | 19,155,629 | 15,877,200 |
Distributions to shareholders from net investment income | (2,759,893) | (1,489,334) |
Distributions to shareholders from net realized gain | (1,096,879) | (3,144,149) |
Total distributions | (3,856,772) | (4,633,483) |
Share transactions Proceeds from sales of shares | 24,562,052 | 121,909,283 |
Reinvestment of distributions | 3,393,514 | 3,574,551 |
Cost of shares redeemed | (109,014,492) | (118,866,572) |
Net increase (decrease) in net assets resulting from share transactions | (81,058,926) | 6,617,262 |
Redemption fees | 34,784 | 154,525 |
Total increase (decrease) in net assets | (65,725,285) | 18,015,504 |
| | |
Net Assets | | |
Beginning of period | 303,618,604 | 285,603,100 |
End of period (including undistributed net investment income of $1,851,362 and undistributed net investment income of $2,751,743, respectively) | $ 237,893,319 | $ 303,618,604 |
Other Information Shares | | |
Sold | 2,831,264 | 13,512,424 |
Issued in reinvestment of distributions | 392,314 | 415,163 |
Redeemed | (12,377,356) | (13,376,811) |
Net increase (decrease) | (9,153,778) | 550,776 |
Financial Highlights
Years ended October 31, | 2012 | 2011 | 2010 | 2009 | 2008 |
Selected Per-Share Data | | | | | |
Net asset value, beginning of period | $ 8.62 | $ 8.23 | $ 8.59 | $ 6.99 | $ 12.63 |
Income from Investment Operations | | | | | |
Net investment income (loss) B | .06 | .08 | .04 | .02 | .04 |
Net realized and unrealized gain (loss) | .55 | .45 | (.25) | 1.63 | (5.45) |
Total from investment operations | .61 | .53 | (.21) | 1.65 | (5.41) |
Distributions from net investment income | (.08) | (.05) | (.03) | (.04) | (.02) |
Distributions from net realized gain | (.03) | (.10) | (.12) | (.01) | (.21) |
Total distributions | (.11) | (.14) G | (.15) | (.05) | (.23) |
Redemption fees added to paid in capital B, F | - | - | - | - | - |
Net asset value, end of period | $ 9.12 | $ 8.62 | $ 8.23 | $ 8.59 | $ 6.99 |
Total Return A | 7.13% | 6.44% | (2.50)% | 23.84% | (43.58)% |
Ratios to Average Net Assets C, E | | | | | |
Expenses before reductions | 1.05% | 1.05% | 1.09% | 1.16% | 1.05% |
Expenses net of fee waivers, if any | 1.05% | 1.05% | 1.09% | 1.16% | 1.05% |
Expenses net of all reductions | 1.02% | 1.01% | 1.09% | 1.14% | 1.03% |
Net investment income (loss) | .67% | .88% | .43% | .33% | .44% |
Supplemental Data | | | | | |
Net assets, end of period (000 omitted) | $ 237,893 | $ 303,619 | $ 285,603 | $ 395,714 | $ 393,934 |
Portfolio turnover rate D | 86% | 133% | 78% | 183% | 86% |
A Total returns would have been lower if certain expenses had not been reduced during the applicable periods shown. B Calculated based on average shares outstanding during the period. C Fees and expenses of any underlying Fidelity Central Funds are not included in the Fund's expense ratio. The Fund indirectly bears its proportionate share of the expenses of any underlying Fidelity Central Funds. D Amount does not include the portfolio activity of any underlying Fidelity Central Funds. E Expense ratios reflect operating expenses of the Fund. Expenses before reductions do not reflect amounts reimbursed by the investment adviser or reductions from brokerage service arrangements or reductions from other expense offset arrangements and do not represent the amount paid by the Fund during periods when reimbursements or reductions occur. Expenses net of fee waivers reflect expenses after reimbursement by the investment adviser but prior to reductions from brokerage service arrangements or other expense offset arrangements. Expenses net of all reductions represent the net expenses paid by the Fund. F Amount represents less than $.01 per share. G Total distributions of $.14 per share is comprised of distributions from net investment income of $.045 and distributions from net realized gain of $.095 per share. |
See accompanying notes which are an integral part of the financial statements.
Annual Report
Notes to Financial Statements
For the period ended October 31, 2012
1. Organization.
Fidelity Japan Smaller Companies Fund (the Fund) is a fund of Fidelity Investment Trust (the Trust) and is authorized to issue an unlimited number of shares. The Trust is registered under the Investment Company Act of 1940, as amended (the 1940 Act), as an open-end management investment company organized as a Massachusetts business trust.
2. Investments in Fidelity Central Funds.
The Fund invests in Fidelity Central Funds, which are open-end investment companies available only to other investment companies and accounts managed by Fidelity Management & Research Company (FMR) and its affiliates. The Fund's Schedule of Investments lists each of the Fidelity Central Funds held as of period end, as an investment of the Fund, but does not include the underlying holdings of each Fidelity Central Fund. As an Investing Fund, the Fund indirectly bears its proportionate share of the expenses of the underlying Fidelity Central Funds.
The Money Market Central Funds seek preservation of capital and current income and are managed by Fidelity Investments Money Management, Inc. (FIMM), an affiliate of FMR.
A complete unaudited list of holdings for each Fidelity Central Fund is available upon request or at the Securities and Exchange Commission (the SEC) web site at www.sec.gov. In addition, the financial statements of the Fidelity Central Funds, which are not covered by the Fund's Report of Independent Registered Public Accounting Firm, are available on the SEC web site or upon request.
3. Significant Accounting Policies.
The financial statements have been prepared in conformity with accounting principles generally accepted in the United States of America (GAAP), which require management to make certain estimates and assumptions at the date of the financial statements. Actual results could differ from those estimates. Subsequent events, if any, through the date that the financial statements were issued have been evaluated in the preparation of the financial statements. The following summarizes the significant accounting policies of the Fund:
Security Valuation. Investments are valued as of 4:00 p.m. Eastern time on the last calendar day of the period. In accordance with valuation policies and procedures approved by the Board of Trustees (the Board), the Fund attempts to obtain prices from one or more third party pricing vendors or brokers to value its investments. When current market prices, quotations or rates are not readily available or reliable, securities will be fair valued in good faith by the Fidelity Management & Research Company (FMR) Fair Value Committee (the Committee), in accordance with procedures adopted by the Fund's Board. Factors used in determining fair value vary by security type and may include market or security specific events. The frequency with which these procedures are used cannot be predicted and they may be utilized to a significant extent. The Committee oversees the Fund's valuation policies and procedures and is responsible for approving and reporting to the Board all fair value determinations.
The Fund categorizes the inputs to valuation techniques used to value its investments into a disclosure hierarchy consisting of three levels as shown below:
Level 1 - quoted prices in active markets for identical investments
Level 2 - other significant observable inputs (including quoted prices for similar investments, interest rates, prepayment speeds, etc.)
Level 3 - unobservable inputs (including the Fund's own assumptions based on the best information available)
Valuation techniques used to value the Fund's investments by major category are as follows:
Equity securities, including restricted securities, for which market quotations are readily available, are valued at the last reported sale price or official closing price as reported by a third party pricing vendor on the primary market or exchange on which they are traded and are categorized as Level 1 in the hierarchy. In the event there were no sales during the day or closing prices are not available, securities are valued at the last quoted bid price or may be valued using the last available price and are generally categorized as Level 2 in the hierarchy. For foreign equity securities, when significant market or security specific events arise, comparisons to the valuation of American Depositary Receipts (ADRs), futures contracts, Exchange-Traded Funds (ETFs) and certain indexes as well as quoted prices for similar securities are used and are categorized as Level 2 in the hierarchy. Utilizing these techniques may result in transfers between Level 1 and Level 2.
Investments in open-end mutual funds, including the Fidelity Central Funds, are valued at their closing net asset value (NAV) each business day and are categorized as Level 1 in the hierarchy.
Changes in valuation techniques may result in transfers in or out of an assigned level within the disclosure hierarchy. The aggregate value of investments by input level, as of October 31, 2012, including information on transfers between Levels 1 and 2, is included at the end of the Fund's Schedule of Investments.
Annual Report
Notes to Financial Statements - continued
3. Significant Accounting Policies - continued
Foreign Currency Translation. The Fund may use foreign currency contracts to facilitate transactions in foreign-denominated securities. Gains and losses from these transactions may arise from changes in the value of the foreign currency or if the counterparties do not perform under the contracts' terms.
Foreign-denominated assets, including investment securities, and liabilities are translated into U.S. dollars at the exchange rates at period end. Purchases and sales of investment securities, income and dividends received and expenses denominated in foreign currencies are translated into U.S. dollars at the exchange rate in effect on the transaction date.
The effects of exchange rate fluctuations on investments are included with the net realized and unrealized gain (loss) on investment securities. Other foreign currency transactions resulting in realized and unrealized gain (loss) are disclosed separately.
Investment Transactions and Income. For financial reporting purposes, the Fund's investment holdings and NAV include trades executed through the end of the last business day of the period. The NAV per share for processing shareholder transactions is calculated as of the close of business of the New York Stock Exchange (NYSE), normally 4:00 p.m. Eastern time and includes trades executed through the end of the prior business day. Gains and losses on securities sold are determined on the basis of identified cost. Dividend income is recorded on the ex-dividend date, except for certain dividends from foreign securities where the ex-dividend date may have passed, which are recorded as soon as the Fund is informed of the ex-dividend date. Non-cash dividends included in dividend income, if any, are recorded at the fair market value of the securities received. Interest income and distributions from the Fidelity Central Funds are accrued as earned. Investment income is recorded net of foreign taxes withheld where recovery of such taxes is uncertain.
Expenses. Expenses directly attributable to a fund are charged to that fund. Expenses attributable to more than one fund are allocated among the respective funds on the basis of relative net assets or other appropriate methods. Expense estimates are accrued in the period to which they relate and adjustments are made when actual amounts are known.
Income Tax Information and Distributions to Shareholders. Each year, the Fund intends to qualify as a regulated investment company under Subchapter M of the Internal Revenue Code, including distributing substantially all of its taxable income and realized gains. As a result, no provision for income taxes is required. As of October 31, 2012, the Fund did not have any unrecognized tax benefits in the financial statements; nor is the Fund aware of any tax positions for which it is reasonably possible that the total amounts of unrecognized tax benefits will significantly change in the next twelve months. The Fund files a U.S. federal tax return, in addition to state and local tax returns as required. A fund's federal income tax returns are subject to examination by the Internal Revenue Service (IRS) for a period of three fiscal years after they are filed. State and local tax returns may be subject to examination for an additional fiscal year depending on the jurisdiction. Foreign taxes are provided for based on the Fund's understanding of the tax rules and rates that exist in the foreign markets in which it invests.
Distributions are declared and recorded on the ex-dividend date. Income and capital gain distributions are determined in accordance with income tax regulations, which may differ from GAAP.
Capital accounts within the financial statements are adjusted for permanent book-tax differences. These adjustments have no impact on net assets or the results of operations. Temporary book-tax differences will reverse in a subsequent period.
Book-tax differences are primarily due to foreign currency transactions, passive foreign investment companies (PFIC), deferred trustees compensation, capital Loss carryforwards and losses deferred due to wash sales.
The federal tax cost of investment securities and unrealized appreciation (depreciation) as of period end were as follows:
Gross unrealized appreciation | $ 28,097,900 |
Gross unrealized depreciation | (22,923,545) |
Net unrealized appreciation (depreciation) on securities and other investments | $ 5,174,355 |
| |
Tax Cost | $ 248,114,300 |
The tax-based components of distributable earnings as of period end were as follows:
Undistributed ordinary income | $ 5,589,847 |
Capital loss carryforward | $ (75,680,703) |
Net unrealized appreciation (depreciation) | $ 5,142,897 |
Annual Report
3. Significant Accounting Policies - continued
Income Tax Information and Distributions to Shareholders - continued
Capital loss carryforwards are only available to offset future capital gains of the Fund to the extent provided by regulations and may be limited. Under the Regulated Investment Company Modernization Act of 2010 (the Act), the Fund is permitted to carry forward capital losses incurred in taxable years beginning after December 22, 2010 for an unlimited period and such capital losses are required to be used prior to any losses that expire. Capital loss carryforwards were as follows:
Fiscal year of expiration | |
2016 | $ (10,300,659) |
2017 | (65,380,044) |
Total capital loss carryforward | $ (75,680,703) |
The tax character of distributions paid was as follows:
| October 31, 2012 | October 31, 2011 |
Ordinary Income | $ 3,856,772 | $ 4,633,483 |
Short-Term Trading (Redemption) Fees. Shares held by investors in the Fund less than 90 days are subject to a redemption fee equal to 1.50% of the net asset value of shares redeemed. All redemption fees, which reduce the proceeds of the shareholder redemption, are retained by the Fund and accounted for as an addition to paid in capital.
New Accounting Pronouncement. In December 2011, the Financial Accounting Standards Board issued Accounting Standard Update No. 2011-11, Disclosures about Offsetting Assets and Liabilities. The update creates new disclosure requirements requiring entities to disclose both gross and net information for derivatives and other financial instruments that are either offset in the Statement of Assets and Liabilities or subject to an enforceable master netting arrangement or similar agreement. The disclosure requirements are effective for annual reporting periods beginning on or after January 1, 2013, and interim periods within those annual periods. Management is currently evaluating the impact of the update's adoption on the Fund's financial statement disclosures.
4. Purchases and Sales of Investments.
Purchases and sales of securities, other than short-term securities, aggregated $239,034,195 and $314,422,424, respectively.
5. Fees and Other Transactions with Affiliates.
Management Fee. FMR and its affiliates provide the Fund with investment management related services for which the Fund pays a monthly management fee. The management fee is the sum of an individual fund fee rate that is based on an annual rate of .45% of the Fund's average net assets and an annualized group fee rate that averaged .26% during the period. The group fee rate is based upon the average net assets of all the mutual funds advised by FMR. The group fee rate decreases as assets under management increase and increases as assets under management decrease. For the period, the total annual management fee rate was .71% of the Fund's average net assets.
Transfer Agent Fees. Fidelity Investments Institutional Operations Company, Inc. (FIIOC), an affiliate of FMR, is the Fund's transfer, dividend disbursing and shareholder servicing agent. FIIOC receives account fees and asset-based fees that vary according to account size and type of account, excluding exchange-traded funds. FIIOC pays for typesetting, printing and mailing of shareholder reports, except proxy statements. For the period, the transfer agent fees were equivalent to an annual rate of .23% of average net assets.
Accounting and Security Lending Fees. Fidelity Service Company, Inc. (FSC), an affiliate of FMR, maintains the Fund's accounting records. The accounting fee is based on the level of average net assets for each month. Under a separate contract, FSC administers the security lending program. The security lending fee is based on the number and duration of lending transactions.
Interfund Lending Program. Pursuant to an Exemptive Order issued by the SEC, the Fund, along with other registered investment companies having management contracts with FMR, may participate in an interfund lending program. This program provides an alternative credit facility allowing the funds to borrow from, or lend money to, other participating affiliated funds. At period end, there were no interfund loans outstanding. The Fund's activity in this program during the period for which loans were outstanding was as follows:
Borrower or Lender | Average Loan
Balance | Weighted Average
Interest Rate | Interest
Expense |
Borrower | $ 5,129,000 | .41% | $ 233 |
Annual Report
Notes to Financial Statements - continued
6. Committed Line of Credit.
The Fund participates with other funds managed by FMR or an affiliate in a $4.25 billion credit facility (the "line of credit") to be utilized for temporary or emergency purposes to fund shareholder redemptions or for other short-term liquidity purposes. The Fund has agreed to pay commitment fees on its pro-rata portion of the line of credit, which amounted to $783 and is reflected in Miscellaneous expenses on the Statement of Operations. During the period, there were no borrowings on this line of credit.
7. Security Lending.
The Fund lends portfolio securities through a lending agent from time to time in order to earn additional income. For equity securities, a lending agent is used and may loan securities to certain qualified borrowers, including Fidelity Capital Markets (FCM), a broker-dealer affiliated with the Fund. On the settlement date of the loan, the Fund receives collateral (in the form of U.S. Treasury obligations, letters of credit and/or cash) against the loaned securities and maintains collateral in an amount not less than 100% of the market value of the loaned securities during the period of the loan. The market value of the loaned securities is determined at the close of business of the Fund and any additional required collateral is delivered to the Fund on the next business day. If the borrower defaults on its obligation to return the securities loaned because of insolvency or other reasons, a fund could experience delays and costs in recovering the securities loaned or in gaining access to the collateral. Any cash collateral received is invested in the Fidelity Securities Lending Cash Central Fund. The value of loaned securities and cash collateral at period end are disclosed on the Fund's Statement of Assets and Liabilities. Security lending income represents the income earned on investing cash collateral, less rebates paid to borrowers, plus any premium payments received for lending certain types of securities. Security lending income is presented in the Statement of Operations as a component of income from Fidelity Central Funds. Total security lending income during the period amounted to $172,725. During the period, there were no securities loaned to FCM.
8. Expense Reductions.
Many of the brokers with whom FMR places trades on behalf of the Fund provided services to the Fund in addition to trade execution. These services included payments of certain expenses on behalf of the Fund totaling $95,353 for the period.
9. Other.
The Fund's organizational documents provide former and current trustees and officers with a limited indemnification against liabilities arising in connection with the performance of their duties to the Fund. In the normal course of business, the Fund may also enter into contracts that provide general indemnifications. The Fund's maximum exposure under these arrangements is unknown as this would be dependent on future claims that may be made against the Fund. The risk of material loss from such claims is considered remote.
At the end of the period, Strategic Advisers International Fund was the owner of record of approximately 24% of the total outstanding shares of the Fund. Mutual funds managed by FMR or its affiliates were the owners of record, in the aggregate, of approximately 36% of the total outstanding shares of the Fund.
Annual Report
Fidelity Latin America Fund
Average annual total return reflects the change in the value of an investment, assuming reinvestment of the class' distributions from dividend income and capital gains (the profits earned upon the sale of securities that have grown in value, if any) and assuming a constant rate of performance each year. The $10,000 table and the fund's returns do not reflect the deduction of taxes that a shareholder would pay on fund distributions or the redemption of fund shares. During periods of reimbursement by Fidelity, a fund's total return will be greater than it would be had the reimbursement not occurred. How a fund did yesterday is no guarantee of how it will do tomorrow.
Average Annual Total Returns
Periods ended October 31, 2012 | Past 1
year | Past 5
years | Past 10
years |
Fidelity Latin America Fund | -4.91% | -4.12% | 21.25% |
$10,000 Over 10 Years
Let's say hypothetically that $10,000 was invested in Fidelity Latin America Fund, a class of the fund, on October 31, 2002. The chart shows how the value of your investment would have changed, and also shows how the MSCI EM (Emerging Markets) Latin America Index performed over the same period.
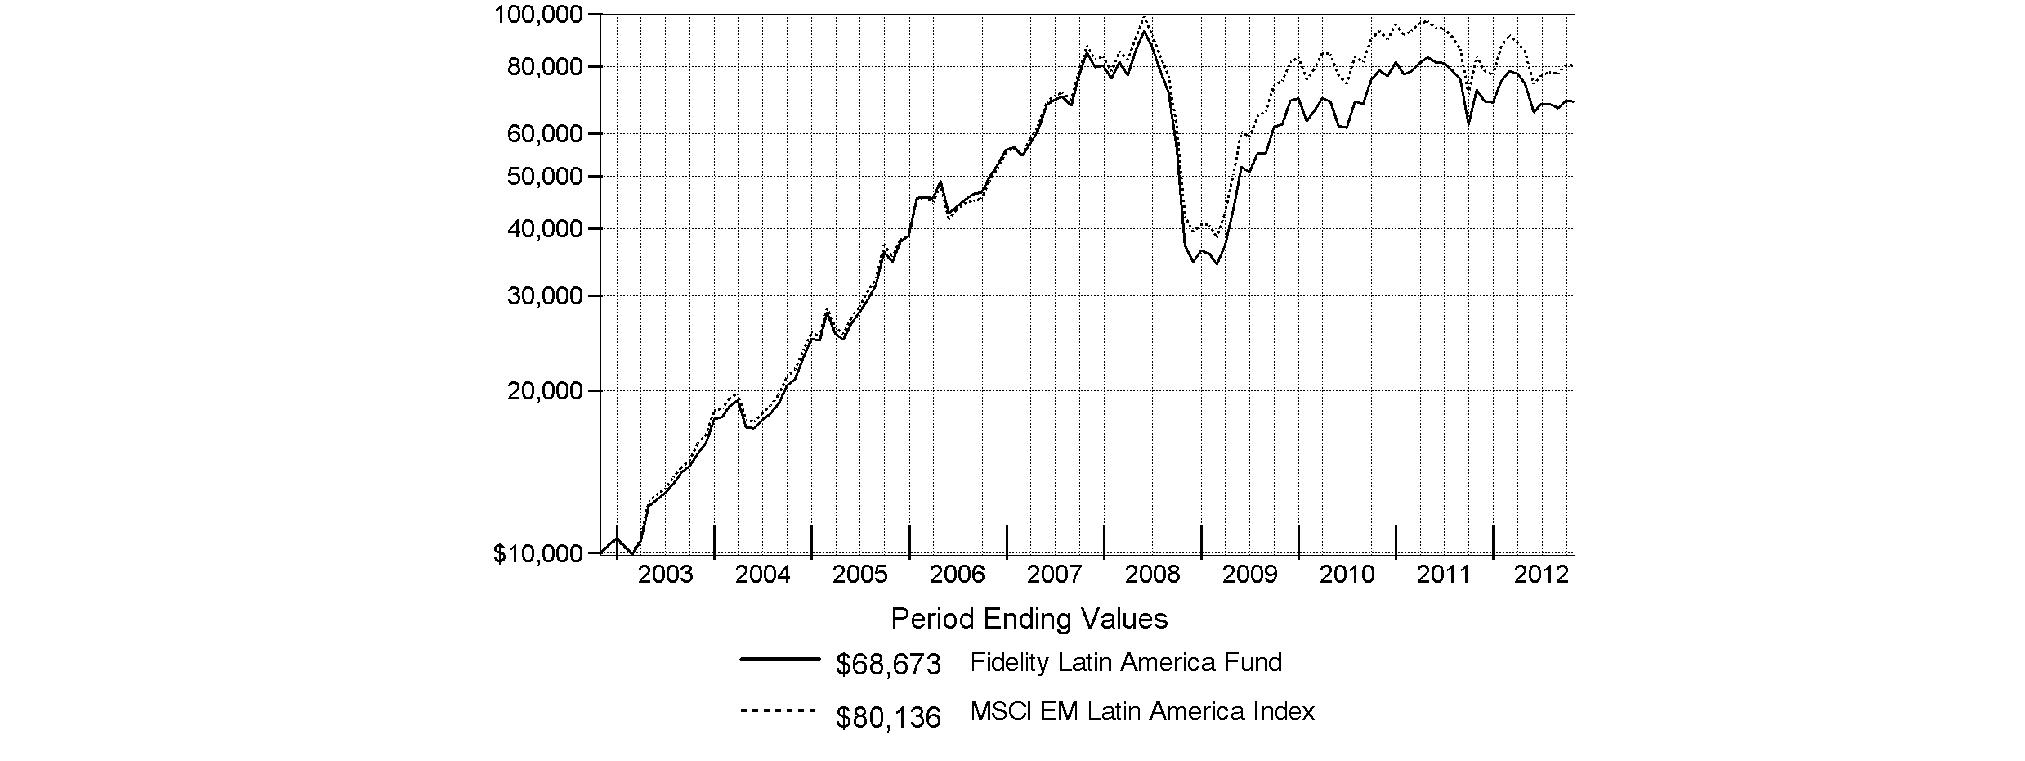
Annual Report
Fidelity Latin America Fund
Market Recap: Returns for most domestic and international equities fluctuated during the 12 months ending October 31, 2012, as investor sentiment towards risk vacillated amid a changing global economic landscape. U.S. stocks overcame bouts of volatility to post strong gains for the past year, extending an uptrend that began in March 2009. The broad-based S&P 500® Index advanced 15.21%, while the blue-chip-laden Dow Jones Industrial AverageSM and technology-heavy Nasdaq Composite® Index rose 12.56% and 12.21%, respectively. Performance outside of the U.S. was relatively weak, as the MSCI® ACWI® (All Country World Index) ex USA Index rose 4.11%, hampered in part by a stronger U.S. dollar. International developed-markets generally struggled during the period as macroeconomic concerns ebbed and flowed, finishing with only a modest gain. The MSCI® EAFE® Index rose 4.76% for the year, largely buttressed in the summertime by pledges of accommodative monetary action from eurozone officials, as well as signs that the U.S. housing market was on the mend. Within the index, Asia-Pacific ex Japan showed the most impressive gain, advancing roughly 10%. A number of core European components, including Germany (+11%) and Switzerland (+10%), and the U.K. (+9%), benefited from optimism about the eurozone's ability to resolve its debt woes, which helped the region outpace the index overall. Elsewhere, Japan was among the few benchmark constituents to finish in the red, returning about -3%. Emerging-markets stocks gained 2.98% for the year, as measured by the MSCI Emerging Markets Index. A general uptrend in the final five months of the period lifted the index into positive territory for the full 12 months.
Comments from Adam Kutas, Portfolio Manager of Fidelity® Latin America Fund: For the year, the fund's Retail Class shares returned -4.91%, underperforming the -3.76% return of the MSCI® EM (Emerging Markets) Latin America Index. The fund was hurt relative to the index by stock selection in materials, banks and utilities, and, geographically, the fund suffered from security selection in Brazil and Mexico, and from an underweighting in Chile. Individual detractors included not owning Mexican cement company and index component CEMEX, investments in Brazilian bank Itau Unibanco Holding and steel manufacturer Usinas Siderurgicas de Minas Gerais, largely avoiding Mexican bank Grupo Financiero Banorte and an out-of-benchmark position in Colombian energy company Petrominerales. Conversely, positioning in consumer staples helped - particularly in food/beverage/tobacco - as did security selection in industrials and, geographically, stock selection in Chile. Among the top contributors were underweightings in energy firm OGX Petroleo E Gas and iron ore supplier Vale - both located in Brazil - an overweighting in Wal-Mart de Mexico and investments in Multiplus, the company that runs the frequent-flier loyalty program for Brazilian airline TAM, and timely ownership of TAM itself. Some stocks mentioned here were sold from the fund before period end.
Note to shareholders: Fidelity® Latin America Fund may invest up to 35% of its total assets in any industry that represents more than 20% of the Latin American market. As of October 31, 2012, the fund did not have more than 25% of its total assets invested in any one industry.
The views expressed above reflect those of the portfolio manager(s) only through the end of the period as stated on the cover of this report and do not necessarily represent the views of Fidelity or any other person in the Fidelity organization. Any such views are subject to change at any time based upon market or other conditions and Fidelity disclaims any responsibility to update such views. These views may not be relied on as investment advice and, because investment decisions for a Fidelity fund are based on numerous factors, may not be relied on as an indication of trading intent on behalf of any Fidelity fund.
Annual Report
Fidelity Latin America Fund
As a shareholder of the Fund, you incur two types of costs: (1) transaction costs, including sales charges (loads) on purchase payments or redemption proceeds, redemption fees and (2) ongoing costs, including management fees, distribution and/or service (12b-1) fees and other Fund expenses. This Example is intended to help you understand your ongoing costs (in dollars) of investing in the Fund and to compare these costs with the ongoing costs of investing in other mutual funds.
The Example is based on an investment of $1,000 invested at the beginning of the period and held for the entire period (May 1, 2012 to October 31, 2012).
Actual Expenses
The first line of the accompanying table for each class of the Fund provides information about actual account values and actual expenses. You may use the information in this line, together with the amount you invested, to estimate the expenses that you paid over the period. Simply divide your account value by $1,000.00 (for example, an $8,600 account value divided by $1,000.00 = 8.6), then multiply the result by the number in the first line for a class of the Fund under the heading entitled "Expenses Paid During Period" to estimate the expenses you paid on your account during this period. A small balance maintenance fee of $12.00 that is charged once a year may apply for certain accounts with a value of less than $2,000. This fee is not included in the table below. If it was, the estimate of expenses you paid during the period would be higher, and your ending account value lower, by this amount. In addition, the Fund, as a shareholder in the underlying Fidelity Central Funds, will indirectly bear its pro-rata share of the fees and expenses incurred by the underlying Fidelity Central Funds. These fees and expenses are not included in the Fund's annualized expense ratio used to calculate the expense estimate in the table below.
Hypothetical Example for Comparison Purposes
The second line of the accompanying table for each class of the Fund provides information about hypothetical account values and hypothetical expenses based on a Class' actual expense ratio and an assumed rate of return of 5% per year before expenses, which is not the Class' actual return. The hypothetical account values and expenses may not be used to estimate the actual ending account balance or expenses you paid for the period. You may use this information to compare the ongoing costs of investing in the Fund and other funds. To do so, compare this 5% hypothetical example with the 5% hypothetical examples that appear in the shareholder reports of the other funds. A small balance maintenance fee of $12.00 that is charged once a year may apply for certain accounts with a value of less than $2,000. This fee is not included in the table below. If it was, the estimate of expenses you paid during the period would be higher, and your ending account value lower, by this amount. In addition, the Fund, as a shareholder in the underlying Fidelity Central Funds, will indirectly bear its pro-rata share of the fees and expenses incurred by the underlying Fidelity Central Funds. These fees and expenses are not included in the Fund's annualized expense ratio used to calculate the expense estimate in the table below.
Please note that the expenses shown in the table are meant to highlight your ongoing costs only and do not reflect any transaction costs. Therefore, the second line of the table is useful in comparing ongoing costs only, and will not help you determine the relative total costs of owning different funds. In addition, if these transactional costs were included, your costs would have been higher.
| Annualized
Expense Ratio | Beginning
Account Value
May 1, 2012 | Ending
Account Value
October 31, 2012 | Expenses Paid
During Period*
May 1, 2012
to October 31, 2012 |
Class A | 1.35% | | | |
Actual | | $ 1,000.00 | $ 925.20 | $ 6.53 |
Hypothetical A | | $ 1,000.00 | $ 1,018.35 | $ 6.85 |
Class T | 1.61% | | | |
Actual | | $ 1,000.00 | $ 924.00 | $ 7.79 |
Hypothetical A | | $ 1,000.00 | $ 1,017.04 | $ 8.16 |
Class B | 2.10% | | | |
Actual | | $ 1,000.00 | $ 921.70 | $ 10.14 |
Hypothetical A | | $ 1,000.00 | $ 1,014.58 | $ 10.63 |
Class C | 2.10% | | | |
Actual | | $ 1,000.00 | $ 921.70 | $ 10.14 |
Hypothetical A | | $ 1,000.00 | $ 1,014.58 | $ 10.63 |
Latin America | 1.02% | | | |
Actual | | $ 1,000.00 | $ 926.80 | $ 4.94 |
Hypothetical A | | $ 1,000.00 | $ 1,020.01 | $ 5.18 |
Institutional Class | 1.04% | | | |
Actual | | $ 1,000.00 | $ 926.50 | $ 5.04 |
Hypothetical A | | $ 1,000.00 | $ 1,019.91 | $ 5.28 |
A 5% return per year before expenses
* Expenses are equal to each Class' annualized expense ratio, multiplied by the average account value over the period, multiplied by 184/366 (to reflect the one-half year period).
Annual Report
Fidelity Latin America Fund
Investment Changes (Unaudited)
Geographic Diversification (% of fund's net assets) |
As of October 31, 2012 |
| Brazil | 46.5% | |
| Mexico | 23.6% | |
| Chile | 14.8% | |
| Colombia | 6.8% | |
| United States of America | 4.6% | |
 | Peru | 3.2% | |
| Canada | 0.5% | |

Percentages are based on country or territory of incorporation and are adjusted for the effect of futures contracts, if applicable. |
As of April 30, 2012 |
| Brazil | 53.2% | |
| Mexico | 21.4% | |
| Chile | 13.1% | |
| Colombia | 5.7% | |
| United States of America | 2.9% | |
| Peru | 2.7% | |
| Canada | 0.7% | |
| Luxembourg | 0.3% | |

Percentages are based on country or territory of incorporation and are adjusted for the effect of futures contracts, if applicable. |
Asset Allocation |
| % of fund's
net assets | % of fund's net assets
6 months ago |
Stocks | 99.1 | 98.9 |
Short-Term Investments and Net Other Assets (Liabilities) | 0.9 | 1.1 |
Top Ten Stocks as of October 31, 2012 |
| % of fund's
net assets | % of fund's net assets
6 months ago |
America Movil SAB de CV Series L (Mexico, Wireless Telecommunication Services) | 9.9 | 9.8 |
Petroleo Brasileiro SA - Petrobras (PN) (non-vtg.) (Brazil, Oil, Gas & Consumable Fuels) | 6.6 | 6.0 |
Itau Unibanco Holding SA (Brazil, Commercial Banks) | 6.2 | 7.0 |
Wal-Mart de Mexico SA de CV Series V (Mexico, Food & Staples Retailing) | 5.2 | 4.5 |
Petroleo Brasileiro SA - Petrobras (Brazil, Oil, Gas & Consumable Fuels) | 5.1 | 4.5 |
Companhia de Bebidas das Americas (AmBev) (PN) sponsored ADR (Brazil, Beverages) | 5.0 | 5.0 |
Vale SA (PN-A) (Brazil, Metals & Mining) | 3.4 | 4.3 |
Fomento Economico Mexicano SAB de CV sponsored ADR (Mexico, Beverages) | 2.9 | 1.6 |
Telefonica Brasil SA (Brazil, Diversified Telecommunication Services) | 2.7 | 2.7 |
Banco Santander Chile sponsored ADR (Chile, Commercial Banks) | 2.7 | 2.5 |
| 49.7 | |
Market Sectors as of October 31, 2012 |
| % of fund's
net assets | % of fund's net assets
6 months ago |
Consumer Staples | 22.6 | 19.3 |
Telecommunication Services | 16.4 | 16.1 |
Financials | 15.8 | 17.0 |
Energy | 15.2 | 14.4 |
Materials | 14.3 | 16.5 |
Utilities | 7.0 | 7.6 |
Industrials | 5.2 | 5.1 |
Consumer Discretionary | 2.6 | 2.9 |
Annual Report
Fidelity Latin America Fund
Investments October 31, 2012
Showing Percentage of Net Assets
Common Stocks - 99.0% |
| Shares | | Value |
Brazil - 46.5% |
AES Tiete SA (PN) (non-vtg.) | 4,090,245 | | $ 46,459,689 |
Banco Bradesco SA (PN) | 1,108,016 | | 17,457,232 |
CCR SA | 6,112,300 | | 53,748,395 |
Companhia de Bebidas das Americas (AmBev): | | | |
(PN) sponsored ADR | 2,981,030 | | 121,596,214 |
sponsored ADR | 345,425 | | 11,765,176 |
Companhia Energetica de Sao Paulo Series A | 921,200 | | 8,277,443 |
CPFL Energia SA sponsored ADR (d) | 992,149 | | 23,107,150 |
Eletropaulo Metropolitana SA (PN-B) | 1,784,420 | | 14,171,337 |
Itau Unibanco Holding SA | 3,511,400 | | 51,347,126 |
Itau Unibanco Holding SA sponsored ADR | 6,746,858 | | 98,369,190 |
Itausa-Investimentos Itau SA (PN) | 5,372,620 | | 23,542,659 |
Light SA | 2,222,800 | | 23,912,843 |
Lupatech SA (a) | 1,356,700 | | 1,723,387 |
Lupatech SA (Subscription Receipts) (a) | 4,975,704 | | 6,320,530 |
M. Dias Branco SA | 576,700 | | 19,364,831 |
Multiplus SA | 1,486,300 | | 34,533,122 |
Petroleo Brasileiro SA - Petrobras: | | | |
(ON) | 919,228 | | 9,730,633 |
(PN) (non-vtg.) | 8,998,371 | | 92,152,392 |
(PN) sponsored ADR (non-vtg.) | 3,282,376 | | 67,387,179 |
sponsored ADR | 5,276,220 | | 111,908,626 |
Souza Cruz SA | 3,533,000 | | 46,096,600 |
Telefonica Brasil SA | 1,239,613 | | 27,464,900 |
Telefonica Brasil SA sponsored ADR (d) | 1,706,883 | | 37,585,564 |
TIM Participacoes SA | 6,632,495 | | 23,511,959 |
TIM Participacoes SA sponsored ADR | 792,304 | | 13,770,244 |
Tractebel Energia SA | 1,024,800 | | 17,659,831 |
Usinas Siderurgicas de Minas Gerais SA - Usiminas | 1,385,750 | | 7,245,841 |
Vale SA: | | | |
(PN-A) | 1,797,500 | | 32,170,121 |
(PN-A) sponsored ADR | 2,746,620 | | 48,862,370 |
sponsored ADR | 1,614,493 | | 29,577,512 |
TOTAL BRAZIL | | 1,120,820,096 |
Canada - 0.5% |
Petrominerales Ltd. (d) | 858,100 | | 6,881,984 |
Silver Standard Resources, Inc. (a) | 330,800 | | 5,038,083 |
TOTAL CANADA | | 11,920,067 |
Chile - 14.8% |
Banco de Chile | 29,536,944 | | 4,407,061 |
Banco de Chile sponsored ADR (d) | 113,767 | | 10,059,278 |
Banco Santander Chile sponsored ADR (d) | 2,381,499 | | 64,752,958 |
CAP SA | 1,651,960 | | 56,949,104 |
Compania Cervecerias Unidas SA | 3,379,403 | | 49,165,170 |
|
| Shares | | Value |
Compania Cervecerias Unidas SA sponsored ADR | 8,028 | | $ 569,426 |
Compania Sudamericana de Vapores (a) | 36,530,345 | | 3,490,939 |
Embotelladora Andina SA: | | | |
Class A | 1,336,236 | | 6,720,755 |
Class B | 2,819,596 | | 17,814,761 |
Empresa Nacional de Electricidad SA | 5,398,806 | | 8,690,378 |
Empresa Nacional de Telecomunicaciones SA (ENTEL) | 1,984,478 | | 40,419,588 |
Empresas La Polar SA (a) | 5,500,872 | | 2,652,400 |
Enersis SA | 35,324,499 | | 12,091,749 |
Enersis SA sponsored ADR | 849,447 | | 14,389,632 |
Inversiones La Construccion SA | 362,646 | | 6,406,508 |
SACI Falabella | 5,150,235 | | 52,824,297 |
Sociedad Matriz SAAM SA | 48,961,581 | | 5,723,972 |
TOTAL CHILE | | 357,127,976 |
Colombia - 6.7% |
BanColombia SA sponsored ADR | 419,321 | | 26,844,930 |
Bolsa de Valores de Colombia | 592,791,382 | | 10,420,495 |
Ecopetrol SA | 12,622,088 | | 37,554,182 |
Ecopetrol SA ADR | 150,000 | | 8,881,500 |
Empresa de Telecomunicaciones de Bogota (a) | 40,480,188 | | 10,055,056 |
Grupo de Inversiones Suramerica | 1,624,314 | | 31,710,135 |
Inversiones Argos SA | 3,136,005 | | 35,849,576 |
TOTAL COLOMBIA | | 161,315,874 |
Mexico - 23.6% |
America Movil SAB de CV: | | | |
Series L | 5,073,400 | | 6,443,458 |
Series L sponsored ADR | 9,200,234 | | 232,673,915 |
Bolsa Mexicana de Valores SA de CV | 4,499,683 | | 9,962,258 |
Consorcio ARA SA de CV (a)(d) | 20,968,721 | | 6,581,751 |
Corporacion Inmobiliaria Vesta SAB de CV | 4,313,500 | | 6,492,980 |
Embotelladoras Arca SAB de CC | 1,379,708 | | 10,011,155 |
Fibra Uno Administracion SA de CV | 2,829,900 | | 7,456,205 |
Fomento Economico Mexicano SAB de CV sponsored ADR | 757,860 | | 68,669,695 |
Grupo Modelo SAB de CV Series C | 1,316,300 | | 11,600,811 |
Industrias Penoles SA de CV | 730,155 | | 36,376,708 |
Kimberly-Clark de Mexico SA de CV Series A | 19,110,900 | | 45,887,177 |
Wal-Mart de Mexico SA de CV Series V | 42,363,570 | | 125,110,681 |
TOTAL MEXICO | | 567,266,794 |
Peru - 3.2% |
Alicorp SA Class C | 4,479,951 | | 12,706,016 |
Compania de Minas Buenaventura SA sponsored ADR | 1,783,600 | | 63,781,536 |
TOTAL PERU | | 76,487,552 |
United States of America - 3.7% |
BPZ Energy, Inc. (a)(d) | 3,583,700 | | 10,321,056 |
Common Stocks - continued |
| Shares | | Value |
United States of America - continued |
First Cash Financial Services, Inc. (a) | 222,745 | | $ 9,947,792 |
Gran Tierra Energy, Inc. (Canada) (a) | 1,649,500 | | 8,307,369 |
LATAM Airlines Group SA sponsored ADR (d) | 1,296,540 | | 32,141,227 |
Southern Copper Corp. | 743,351 | | 28,321,673 |
TOTAL UNITED STATES OF AMERICA | | 89,039,117 |
TOTAL COMMON STOCKS (Cost $1,502,331,972) |
2,383,977,476
|
Nonconvertible Preferred Stocks - 0.1% |
| | | |
Colombia - 0.1% |
Grupo de Inversiones Suramerica
(Cost $2,763,035) | 161,141 | |
3,316,485
|
Money Market Funds - 2.9% |
| Shares | | Value |
Fidelity Cash Central Fund, 0.19% (b) | 13,182,131 | | $ 13,182,131 |
Fidelity Securities Lending Cash Central Fund, 0.19% (b)(c) | 55,587,141 | | 55,587,141 |
TOTAL MONEY MARKET FUNDS (Cost $68,769,272) |
68,769,272
|
TOTAL INVESTMENT PORTFOLIO - 102.0% (Cost $1,573,864,279) | | 2,456,063,233 |
NET OTHER ASSETS (LIABILITIES) - (2.0)% | | (47,648,097) |
NET ASSETS - 100% | $ 2,408,415,136 |
Legend |
(a) Non-income producing |
(b) Affiliated fund that is available only to investment companies and other accounts managed by Fidelity Investments. The rate quoted is the annualized seven-day yield of the fund at period end. A complete unaudited listing of the fund's holdings as of its most recent quarter end is available upon request. In addition, each Fidelity Central Fund's financial statements, which are not covered by the Fund's Report of Independent Registered Public Accounting Firm, are available on the SEC's website or upon request. |
(c) Includes cash collateral received from securities on loan. |
(d) Security or a portion of the security is on loan at period end. |
Affiliated Central Funds |
Information regarding fiscal year to date income earned by the Fund from investments in Fidelity Central Funds is as follows: |
Fund | Income earned |
Fidelity Cash Central Fund | $ 23,517 |
Fidelity Securities Lending Cash Central Fund | 729,136 |
Total | $ 752,653 |
Other Information |
Categorizations in the Schedule of Investments are based on country or territory of incorporation. |
The following is a summary of the inputs used, as of October 31, 2012, involving the Fund's assets and liabilities carried at fair value. The inputs or methodology used for valuing securities may not be an indication of the risk associated with investing in those securities. For more information on valuation inputs, and their aggregation into the levels used in the table below, please refer to the Security Valuation section in the accompanying Notes to Financial Statements. |
Valuation Inputs at Reporting Date: |
Description | Total | Level 1 | Level 2 | Level 3 |
Investments in Securities: | | | | |
Equities: | | | | |
Consumer Discretionary | $ 62,058,448 | $ 62,058,448 | $ - | $ - |
Consumer Staples | 547,078,468 | 547,078,468 | - | - |
Energy | 361,168,838 | 361,168,838 | - | - |
Financials | 382,493,292 | 382,493,292 | - | - |
Industrials | 129,637,655 | 129,637,655 | - | - |
Materials | 344,172,524 | 344,172,524 | - | - |
Telecommunication Services | 391,924,684 | 391,924,684 | - | - |
Utilities | 168,760,052 | 168,760,052 | - | - |
Money Market Funds | 68,769,272 | 68,769,272 | - | - |
Total Investments in Securities: | $ 2,456,063,233 | $ 2,456,063,233 | $ - | $ - |
See accompanying notes which are an integral part of the financial statements.
Annual Report
Fidelity Latin America Fund
Statement of Assets and Liabilities
| October 31, 2012 |
| | |
Assets | | |
Investment in securities, at value (including securities loaned of $54,129,152) - See accompanying schedule: Unaffiliated issuers (cost $1,505,095,007) | $ 2,387,293,961 | |
Fidelity Central Funds (cost $68,769,272) | 68,769,272 | |
Total Investments (cost $1,573,864,279) | | $ 2,456,063,233 |
Foreign currency held at value (cost $2,696,024) | | 2,696,024 |
Receivable for investments sold | | 3,500,639 |
Receivable for fund shares sold | | 1,291,956 |
Dividends receivable | | 7,735,466 |
Distributions receivable from Fidelity Central Funds | | 77,876 |
Other receivables | | 139,075 |
Total assets | | 2,471,504,269 |
| | |
Liabilities | | |
Payable for fund shares redeemed | $ 5,116,221 | |
Accrued management fee | 1,447,471 | |
Distribution and service plan fees payable | 54,506 | |
Other affiliated payables | 557,201 | |
Other payables and accrued expenses | 326,593 | |
Collateral on securities loaned, at value | 55,587,141 | |
Total liabilities | | 63,089,133 |
| | |
Net Assets | | $ 2,408,415,136 |
Net Assets consist of: | | |
Paid in capital | | $ 1,333,456,047 |
Undistributed net investment income | | 34,109,670 |
Accumulated undistributed net realized gain (loss) on investments and foreign currency transactions | | 158,698,415 |
Net unrealized appreciation (depreciation) on investments and assets and liabilities in foreign currencies | | 882,151,004 |
Net Assets | | $ 2,408,415,136 |
Statement of Assets and Liabilities - continued
| October 31, 2012 |
| | |
Calculation of Maximum Offering Price Class A:
Net Asset Value and redemption price per share ($69,654,164 ÷ 1,422,951 shares) | | $ 48.95 |
| | |
Maximum offering price per share (100/94.25 of $48.95) | | $ 51.94 |
Class T:
Net Asset Value and redemption price per share ($19,334,062 ÷ 395,559 shares) | | $ 48.88 |
| | |
Maximum offering price per share (100/96.50 of $48.88) | | $ 50.65 |
Class B:
Net Asset Value and offering price per share ($9,492,370 ÷ 194,835 shares)A | | $ 48.72 |
| | |
Class C:
Net Asset Value and offering price per share ($27,404,926 ÷ 562,422 shares)A | | $ 48.73 |
| | |
Latin America:
Net Asset Value, offering price and redemption price per share ($2,274,601,476 ÷ 46,335,920 shares) | | $ 49.09 |
| | |
Institutional Class:
Net Asset Value, offering price and redemption price per share ($7,928,138 ÷ 161,568 shares) | | $ 49.07 |
A Redemption price per share is equal to net asset value less any applicable contingent deferred sales charge.
See accompanying notes which are an integral part of the financial statements.
Annual Report
Statement of Operations
| Year ended October 31, 2012 |
| | |
Investment Income | | |
Dividends | | $ 94,540,068 |
Interest | | 2,557 |
Income from Fidelity Central Funds | | 752,653 |
Income before foreign taxes withheld | | 95,295,278 |
Less foreign taxes withheld | | (7,079,604) |
Total income | | 88,215,674 |
| | |
Expenses | | |
Management fee | $ 19,821,507 | |
Transfer agent fees | 6,191,998 | |
Distribution and service plan fees | 761,401 | |
Accounting and security lending fees | 1,233,628 | |
Custodian fees and expenses | 1,099,392 | |
Independent trustees' compensation | 18,758 | |
Registration fees | 107,722 | |
Audit | 72,875 | |
Legal | 15,046 | |
Interest | 409 | |
Miscellaneous | 32,900 | |
Total expenses before reductions | 29,355,636 | |
Expense reductions | (32,251) | 29,323,385 |
Net investment income (loss) | | 58,892,289 |
Realized and Unrealized Gain (Loss) Net realized gain (loss) on: | | |
Investment securities: | | |
Unaffiliated issuers | 297,029,381 | |
Foreign currency transactions | (2,004,709) | |
Total net realized gain (loss) | | 295,024,672 |
Change in net unrealized appreciation (depreciation) on: Investment securities | (507,618,368) | |
Assets and liabilities in foreign currencies | (146,577) | |
Total change in net unrealized appreciation (depreciation) | | (507,764,945) |
Net gain (loss) | | (212,740,273) |
Net increase (decrease) in net assets resulting from operations | | $ (153,847,984) |
Statement of Changes in Net Assets
| Year ended
October 31,
2012 | Year ended
October 31,
2011 |
Increase (Decrease) in Net Assets | | |
Operations | | |
Net investment income (loss) | $ 58,892,289 | $ 90,374,208 |
Net realized gain (loss) | 295,024,672 | 338,023,359 |
Change in net unrealized appreciation (depreciation) | (507,764,945) | (733,138,438) |
Net increase (decrease) in net assets resulting from operations | (153,847,984) | (304,740,871) |
Distributions to shareholders from net investment income | (46,233,461) | (22,292,136) |
Distributions to shareholders from net realized gain | - | (15,707,585) |
Total distributions | (46,233,461) | (37,999,721) |
Share transactions - net increase (decrease) | (452,506,012) | (1,114,870,853) |
Redemption fees | 354,338 | 763,732 |
Total increase (decrease) in net assets | (652,233,119) | (1,456,847,713) |
| | |
Net Assets | | |
Beginning of period | 3,060,648,255 | 4,517,495,968 |
End of period (including undistributed net investment income of $34,109,670 and undistributed net investment income of $34,016,290, respectively) | $ 2,408,415,136 | $ 3,060,648,255 |
See accompanying notes which are an integral part of the financial statements.
Annual Report
Financial Highlights - Class A
Years ended October 31, | 2012 | 2011 | 2010 H |
Selected Per-Share Data | | | |
Net asset value, beginning of period | $ 52.38 | $ 57.48 | $ 55.47 |
Income from Investment Operations | | | |
Net investment income (loss) E | .92 | 1.15 | .02 |
Net realized and unrealized gain (loss) | (3.66) | (5.87) | 2.79 |
Total from investment operations | (2.74) | (4.72) | 2.81 |
Distributions from net investment income | (.70) | (.19) | (.80) |
Distributions from net realized gain | - | (.20) | - |
Total distributions | (.70) | (.39) | (.80) |
Redemption fees added to paid in capital E | .01 | .01 | - K |
Net asset value, end of period | $ 48.95 | $ 52.38 | $ 57.48 |
Total Return B, C, D | (5.23)% | (8.26)% | 5.14% |
Ratios to Average Net Assets F, I | | | |
Expenses before reductions | 1.35% | 1.34% | 1.37% A |
Expenses net of fee waivers, if any | 1.35% | 1.34% | 1.37% A |
Expenses net of all reductions | 1.35% | 1.34% | 1.34% A |
Net investment income (loss) | 1.80% | 2.05% | .39% A |
Supplemental Data | | | |
Net assets, end of period (000 omitted) | $ 69,654 | $ 91,407 | $ 115,626 |
Portfolio turnover rate G | 23% | 11% | 56% J |
A Annualized B Total returns for periods of less than one year are not annualized. C Total returns would have been lower if certain expenses had not been reduced during the applicable periods shown. D Total returns do not include the effect of the sales charges. E Calculated based on average shares outstanding during the period. F Fees and expenses of any underlying Fidelity Central Funds are not included in the Fund's expense ratio. The Fund indirectly bears its proportionate share of the expenses of any underlying Fidelity Central Funds. G Amount does not include the portfolio activity of any underlying Fidelity Central Funds. H For the period September 28, 2010 (commencement of sale of shares) to October 31, 2010. I Expense ratios reflect operating expenses of the class. Expenses before reductions do not reflect amounts reimbursed by the investment adviser or reductions from brokerage service arrangements or reductions from other expense offset arrangements and do not represent the amount paid by the class during periods when reimbursements or reductions occur. Expense ratios before reductions for start-up periods may not be representative of longer-term operating periods. Expenses net of fee waivers reflect expenses after reimbursement by the investment adviser but prior to reductions from brokerage service arrangements or other expense offset arrangements. Expenses net of all reductions represent the net expenses paid by the class. J The portfolio turnover rate does not include the assets acquired in the merger. K Amount represents less than $.01 per share. |
Financial Highlights - Class T
Years ended October 31, | 2012 | 2011 | 2010 H |
Selected Per-Share Data | | | |
Net asset value, beginning of period | $ 52.27 | $ 57.47 | $ 55.47 |
Income from Investment Operations | | | |
Net investment income (loss) E | .78 | .99 | .01 |
Net realized and unrealized gain (loss) | (3.65) | (5.85) | 2.79 |
Total from investment operations | (2.87) | (4.86) | 2.80 |
Distributions from net investment income | (.53) | (.15) | (.80) |
Distributions from net realized gain | - | (.20) | - |
Total distributions | (.53) | (.35) | (.80) |
Redemption fees added to paid in capital E | .01 | .01 | - K |
Net asset value, end of period | $ 48.88 | $ 52.27 | $ 57.47 |
Total Return B, C, D | (5.49)% | (8.50)% | 5.12% |
Ratios to Average Net Assets F, I | | | |
Expenses before reductions | 1.61% | 1.61% | 1.63% A |
Expenses net of fee waivers, if any | 1.61% | 1.61% | 1.63% A |
Expenses net of all reductions | 1.61% | 1.61% | 1.60% A |
Net investment income (loss) | 1.54% | 1.78% | .13% A |
Supplemental Data | | | |
Net assets, end of period (000 omitted) | $ 19,334 | $ 26,020 | $ 36,820 |
Portfolio turnover rate G | 23% | 11% | 56% J |
A Annualized B Total returns for periods of less than one year are not annualized. C Total returns would have been lower if certain expenses had not been reduced during the applicable periods shown. D Total returns do not include the effect of the sales charges. E Calculated based on average shares outstanding during the period. F Fees and expenses of any underlying Fidelity Central Funds are not included in the Fund's expense ratio. The Fund indirectly bears its proportionate share of the expenses of any underlying Fidelity Central Funds. G Amount does not include the portfolio activity of any underlying Fidelity Central Funds. H For the period September 28, 2010 (commencement of sale of shares) to October 31, 2010. I Expense ratios reflect operating expenses of the class. Expenses before reductions do not reflect amounts reimbursed by the investment adviser or reductions from brokerage service arrangements or reductions from other expense offset arrangements and do not represent the amount paid by the class during periods when reimbursements or reductions occur. Expense ratios before reductions for start-up periods may not be representative of longer-term operating periods. Expenses net of fee waivers reflect expenses after reimbursement by the investment adviser but prior to reductions from brokerage service arrangements or other expense offset arrangements. Expenses net of all reductions represent the net expenses paid by the class. J The portfolio turnover rate does not include the assets acquired in the merger. K Amount represents less than $.01 per share. |
See accompanying notes which are an integral part of the financial statements.
Annual Report
Financial Highlights - Class B
Years ended October 31, | 2012 | 2011 | 2010 H |
Selected Per-Share Data | | | |
Net asset value, beginning of period | $ 52.06 | $ 57.44 | $ 55.47 |
Income from Investment Operations | | | |
Net investment income (loss) E | .53 | .72 | (.02) |
Net realized and unrealized gain (loss) | (3.63) | (5.84) | 2.79 |
Total from investment operations | (3.10) | (5.12) | 2.77 |
Distributions from net investment income | (.25) | (.07) | (.80) |
Distributions from net realized gain | - | (.20) | - |
Total distributions | (.25) | (.27) | (.80) |
Redemption fees added to paid in capital E | .01 | .01 | - K |
Net asset value, end of period | $ 48.72 | $ 52.06 | $ 57.44 |
Total Return B, C, D | (5.95)% | (8.94)% | 5.06% |
Ratios to Average Net Assets F, I | | | |
Expenses before reductions | 2.10% | 2.10% | 2.12% A |
Expenses net of fee waivers, if any | 2.10% | 2.10% | 2.12% A |
Expenses net of all reductions | 2.10% | 2.10% | 2.10% A |
Net investment income (loss) | 1.05% | 1.29% | (.36)% A |
Supplemental Data | | | |
Net assets, end of period (000 omitted) | $ 9,492 | $ 14,114 | $ 20,392 |
Portfolio turnover rate G | 23% | 11% | 56% J |
A Annualized B Total returns for periods of less than one year are not annualized. C Total returns would have been lower if certain expenses had not been reduced during the applicable periods shown. D Total returns do not include the effect of the contingent deferred sales charge. E Calculated based on average shares outstanding during the period. F Fees and expenses of any underlying Fidelity Central Funds are not included in the Fund's expense ratio. The Fund indirectly bears its proportionate share of the expenses of any underlying Fidelity Central Funds. G Amount does not include the portfolio activity of any underlying Fidelity Central Funds. H For the period September 28, 2010 (commencement of sale of shares) to October 31, 2010. I Expense ratios reflect operating expenses of the class. Expenses before reductions do not reflect amounts reimbursed by the investment adviser or reductions from brokerage service arrangements or reductions from other expense offset arrangements and do not represent the amount paid by the class during periods when reimbursements or reductions occur. Expense ratios before reductions for start-up periods may not be representative of longer-term operating periods. Expenses net of fee waivers reflect expenses after reimbursement by the investment adviser but prior to reductions from brokerage service arrangements or other expense offset arrangements. Expenses net of all reductions represent the net expenses paid by the class. J The portfolio turnover rate does not include the assets acquired in the merger. K Amount represents less than $.01 per share. |
Financial Highlights - Class C
Years ended October 31, | 2012 | 2011 | 2010 H |
Selected Per-Share Data | | | |
Net asset value, beginning of period | $ 52.05 | $ 57.44 | $ 55.47 |
Income from Investment Operations | | | |
Net investment income (loss) E | .54 | .73 | (.02) |
Net realized and unrealized gain (loss) | (3.64) | (5.84) | 2.79 |
Total from investment operations | (3.10) | (5.11) | 2.77 |
Distributions from net investment income | (.23) | (.09) | (.80) |
Distributions from net realized gain | - | (.20) | - |
Total distributions | (.23) | (.29) | (.80) |
Redemption fees added to paid in capital E | .01 | .01 | - K |
Net asset value, end of period | $ 48.73 | $ 52.05 | $ 57.44 |
Total Return B, C, D | (5.94)% | (8.93)% | 5.06% |
Ratios to Average Net Assets F, I | | | |
Expenses before reductions | 2.10% | 2.08% | 2.09% A |
Expenses net of fee waivers, if any | 2.10% | 2.08% | 2.09% A |
Expenses net of all reductions | 2.10% | 2.08% | 2.07% A |
Net investment income (loss) | 1.06% | 1.31% | (.34)% A |
Supplemental Data | | | |
Net assets, end of period (000 omitted) | $ 27,405 | $ 35,203 | $ 48,329 |
Portfolio turnover rate G | 23% | 11% | 56% J |
A Annualized B Total returns for periods of less than one year are not annualized. C Total returns would have been lower if certain expenses had not been reduced during the applicable periods shown. D Total returns do not include the effect of the contingent deferred sales charge. E Calculated based on average shares outstanding during the period. F Fees and expenses of any underlying Fidelity Central Funds are not included in the Fund's expense ratio. The Fund indirectly bears its proportionate share of the expenses of any underlying Fidelity Central Funds. G Amount does not include the portfolio activity of any underlying Fidelity Central Funds. H For the period September 28, 2010 (commencement of sale of shares) to October 31, 2010. I Expense ratios reflect operating expenses of the class. Expenses before reductions do not reflect amounts reimbursed by the investment adviser or reductions from brokerage service arrangements or reductions from other expense offset arrangements and do not represent the amount paid by the class during periods when reimbursements or reductions occur. Expense ratios before reductions for start-up periods may not be representative of longer-term operating periods. Expenses net of fee waivers reflect expenses after reimbursement by the investment adviser but prior to reductions from brokerage service arrangements or other expense offset arrangements. Expenses net of all reductions represent the net expenses paid by the class. J The portfolio turnover rate does not include the assets acquired in the merger. K Amount represents less than $.01 per share. |
See accompanying notes which are an integral part of the financial statements.
Annual Report
Financial Highlights - Latin America
Years ended October 31, | 2012 | 2011 | 2010 | 2009 | 2008 |
Selected Per-Share Data | | | | | |
Net asset value, beginning of period | $ 52.48 | $ 57.50 | $ 47.29 | $ 28.69 | $ 67.90 |
Income from Investment Operations | | | | | |
Net investment income (loss) B | 1.09 | 1.34 | 1.07 | .72 | .83 |
Net realized and unrealized gain (loss) | (3.67) | (5.88) | 11.00 | 18.32 | (37.74) |
Total from investment operations | (2.58) | (4.54) | 12.07 | 19.04 | (36.91) |
Distributions from net investment income | (.82) | (.29) | (1.49) | (.46) | (.65) |
Distributions from net realized gain | - | (.20) | (.39) | - | (1.72) |
Total distributions | (.82) | (.49) | (1.88) | (.46) | (2.37) |
Redemption fees added to paid in capital B | .01 | .01 | .02 | .02 | .07 |
Net asset value, end of period | $ 49.09 | $ 52.48 | $ 57.50 | $ 47.29 | $ 28.69 |
Total Return A | (4.91)% | (7.96)% | 25.91% | 67.88% | (56.20)% |
Ratios to Average Net Assets C, E | | | | | |
Expenses before reductions | 1.02% | 1.00% | 1.03% | 1.07% | 1.02% |
Expenses net of fee waivers, if any | 1.02% | 1.00% | 1.03% | 1.07% | 1.02% |
Expenses net of all reductions | 1.02% | 1.00% | 1.01% | 1.05% | 1.00% |
Net investment income (loss) | 2.14% | 2.39% | 2.10% | 2.04% | 1.41% |
Supplemental Data | | | | | |
Net assets, end of period (000 omitted) | $ 2,274,601 | $ 2,884,301 | $ 4,283,462 | $ 4,043,748 | $ 2,225,606 |
Portfolio turnover rate D | 23% | 11% | 56% F | 52% | 51% |
A Total returns would have been lower if certain expenses had not been reduced during the applicable periods shown. B Calculated based on average shares outstanding during the period. C Fees and expenses of any underlying Fidelity Central Funds are not included in the Fund's expense ratio. The Fund indirectly bears its proportionate share of the expenses of any underlying Fidelity Central Funds. D Amount does not include the portfolio activity of any underlying Fidelity Central Funds. E Expense ratios reflect operating expenses of the class. Expenses before reductions do not reflect amounts reimbursed by the investment adviser or reductions from brokerage service arrangements or reductions from other expense offset arrangements and do not represent the amount paid by the class during periods when reimbursements or reductions occur. Expenses net of fee waivers reflect expenses after reimbursement by the investment adviser but prior to reductions from brokerage service arrangements or other expense offset arrangements. Expenses net of all reductions represent the net expenses paid by the class. F The portfolio turnover rate does not include the assets acquired in the merger. |
Financial Highlights - Institutional Class
Years ended October 31, | 2012 | 2011 | 2010 G |
Selected Per-Share Data | | | |
Net asset value, beginning of period | $ 52.51 | $ 57.49 | $ 55.47 |
Income from Investment Operations | | | |
Net investment income (loss) D | 1.08 | 1.32 | .03 |
Net realized and unrealized gain (loss) | (3.67) | (5.88) | 2.79 |
Total from investment operations | (2.59) | (4.56) | 2.82 |
Distributions from net investment income | (.86) | (.23) | (.80) |
Distributions from net realized gain | - | (.20) | - |
Total distributions | (.86) | (.43) | (.80) |
Redemption fees added to paid in capital D | .01 | .01 | - J |
Net asset value, end of period | $ 49.07 | $ 52.51 | $ 57.49 |
Total Return B, C | (4.93)% | (7.98)% | 5.15% |
Ratios to Average Net Assets E, H | | | |
Expenses before reductions | 1.04% | 1.04% | 1.08% A |
Expenses net of fee waivers, if any | 1.04% | 1.04% | 1.08% A |
Expenses net of all reductions | 1.04% | 1.04% | 1.06% A |
Net investment income (loss) | 2.12% | 2.35% | .68% A |
Supplemental Data | | | |
Net assets, end of period (000 omitted) | $ 7,928 | $ 9,603 | $ 12,868 |
Portfolio turnover rate F | 23% | 11% | 56% I |
A Annualized B Total returns for periods of less than one year are not annualized. C Total returns would have been lower if certain expenses had not been reduced during the applicable periods shown. D Calculated based on average shares outstanding during the period. E Fees and expenses of any underlying Fidelity Central Funds are not included in the Fund's expense ratio. The Fund indirectly bears its proportionate share of the expenses of any underlying Fidelity Central Funds. F Amount does not include the portfolio activity of any underlying Fidelity Central Funds. G For the period September 28, 2010 (commencement of sale of shares) to October 31, 2010. H Expense ratios reflect operating expenses of the class. Expenses before reductions do not reflect amounts reimbursed by the investment adviser or reductions from brokerage service arrangements or reductions from other expense offset arrangements and do not represent the amount paid by the class during periods when reimbursements or reductions occur. Expense ratios before reductions for start-up periods may not be representative of longer-term operating periods. Expenses net of fee waivers reflect expenses after reimbursement by the investment adviser but prior to reductions from brokerage service arrangements or other expense offset arrangements. Expenses net of all reductions represent the net expenses paid by the class. I The portfolio turnover rate does not include the assets acquired in the merger. J Amount represents less than $.01 per share. |
See accompanying notes which are an integral part of the financial statements.
Annual Report
Notes to Financial Statements
For the period ended October 31, 2012
1. Organization.
Fidelity Latin America Fund (the Fund) is a non-diversified fund of Fidelity Investment Trust (the Trust) and is authorized to issue an unlimited number of shares. The Trust is registered under the Investment Company Act of 1940, as amended (the 1940 Act), as an open-end management investment company organized as a Massachusetts business trust. The Fund offers Class A, Class T, Class C, Latin America and Institutional Class shares, each of which, along with Class B shares, has equal rights as to assets and voting privileges. Class B shares are closed to new accounts and additional purchases, except for exchanges and reinvestments. Each class has exclusive voting rights with respect to matters that affect that class. Investment income, realized and unrealized capital gains and losses, the common expenses of the Fund, and certain fund-level expense reductions, if any, are allocated on a pro-rata basis to each class based on the relative net assets of each class to the total net assets of the Fund. Each class differs with respect to transfer agent and distribution and service plan fees incurred. Certain expense reductions may also differ by class. The Fund's investments in emerging markets can be subject to social, economic, regulatory, and political uncertainties and can be extremely volatile.
2. Investments in Fidelity Central Funds.
The Fund invests in Fidelity Central Funds, which are open-end investment companies available only to other investment companies and accounts managed by Fidelity Management & Research Company (FMR) and its affiliates. The Fund's Schedule of Investments lists each of the Fidelity Central Funds held as of period end, as an investment of the Fund, but does not include the underlying holdings of each Fidelity Central Fund. As an Investing Fund, the Fund indirectly bears its proportionate share of the expenses of the underlying Fidelity Central Funds.
The Money Market Central Funds seek preservation of capital and current income and are managed by Fidelity Investments Money Management, Inc. (FIMM), an affiliate of FMR.
A complete unaudited list of holdings for each Fidelity Central Fund is available upon request or at the Securities and Exchange Commission (the SEC) web site at www.sec.gov. In addition, the financial statements of the Fidelity Central Funds, which are not covered by the Fund's Report of Independent Registered Public Accounting Firm, are available on the SEC web site or upon request.
3. Significant Accounting Policies.
The financial statements have been prepared in conformity with accounting principles generally accepted in the United States of America (GAAP), which require management to make certain estimates and assumptions at the date of the financial statements. Actual results could differ from those estimates. Subsequent events, if any, through the date that the financial statements were issued have been evaluated in the preparation of the financial statements. The following summarizes the significant accounting policies of the Fund:
Security Valuation. Investments are valued as of 4:00 p.m. Eastern time on the last calendar day of the period. In accordance with valuation policies and procedures approved by the Board of Trustees (the Board), the Fund attempts to obtain prices from one or more third party pricing vendors or brokers to value its investments. When current market prices, quotations or rates are not readily available or reliable, securities will be fair valued in good faith by the FMR Fair Value Committee (the Committee), in accordance with procedures adopted by the Fund's Board. Factors used in determining fair value vary by security type and may include market or security specific events. The frequency with which these procedures are used cannot be predicted and they may be utilized to a significant extent. The Committee oversees the Fund's valuation policies and procedures and is responsible for approving and reporting to the Board all fair value determinations.
The Fund categorizes the inputs to valuation techniques used to value its investments into a disclosure hierarchy consisting of three levels as shown below:
Level 1 - quoted prices in active markets for identical investments
Level 2 - other significant observable inputs (including quoted prices for similar investments, interest rates, prepayment speeds, etc.)
Level 3 - unobservable inputs (including the Fund's own assumptions based on the best information available)
Valuation techniques used to value the Fund's investments by major category are as follows:
Equity securities, including restricted securities, for which market quotations are readily available, are valued at the last reported sale price or official closing price as reported by a third party pricing vendor on the primary market or exchange on which they are traded and are categorized as Level 1 in the hierarchy. In the event there were no sales during the day or closing prices are not available, securities are valued at the last quoted bid price or may be valued using the last available price and are generally categorized as Level 2 in the hierarchy. For foreign equity securities, when significant market or security specific events arise, comparisons to the valuation of American Depositary Receipts (ADRs), futures contracts, Exchange-Traded Funds (ETFs) and certain indexes as well as quoted prices for similar securities are used and are categorized as Level 2 in the hierarchy. Utilizing these techniques may result in transfers between Level 1 and Level 2.
Annual Report
3. Significant Accounting Policies - continued
Security Valuation - continued
Investments in open-end mutual funds, including the Fidelity Central Funds, are valued at their closing net asset value (NAV) each business day and are categorized as Level 1 in the hierarchy.
Changes in valuation techniques may result in transfers in or out of an assigned level within the disclosure hierarchy. The aggregate value of investments by input level, as of October 31, 2012, is included at the end of the Fund's Schedule of Investments.
Foreign Currency Translation. The Fund may use foreign currency contracts to facilitate transactions in foreign-denominated securities. Gains and losses from these transactions may arise from changes in the value of the foreign currency or if the counterparties do not perform under the contracts' terms.
Foreign-denominated assets, including investment securities, and liabilities are translated into U.S. dollars at the exchange rates at period end. Purchases and sales of investment securities, income and dividends received and expenses denominated in foreign currencies are translated into U.S. dollars at the exchange rate in effect on the transaction date.
The effects of exchange rate fluctuations on investments are included with the net realized and unrealized gain (loss) on investment securities. Other foreign currency transactions resulting in realized and unrealized gain (loss) are disclosed separately.
Investment Transactions and Income. For financial reporting purposes, the Fund's investment holdings and NAV include trades executed through the end of the last business day of the period. The NAV per share for processing shareholder transactions is calculated as of the close of business of the New York Stock Exchange (NYSE), normally 4:00 p.m. Eastern time and includes trades executed through the end of the prior business day. Gains and losses on securities sold are determined on the basis of identified cost. Dividend income is recorded on the ex-dividend date, except for certain dividends from foreign securities where the ex-dividend date may have passed, which are recorded as soon as the Fund is informed of the ex-dividend date. Non-cash dividends included in dividend income, if any, are recorded at the fair market value of the securities received. Distributions received on securities that represent a return of capital or capital gain are recorded as a reduction of cost of investments and/or as a realized gain. The Fund estimates the components of distributions received that may be considered return of capital distributions or capital gain distributions. Interest income and distributions from the Fidelity Central Funds are accrued as earned. Interest income includes coupon interest and amortization of premium and accretion of discount on debt securities. Investment income is recorded net of foreign taxes withheld where recovery of such taxes is uncertain.
Expenses. Expenses directly attributable to a fund are charged to that fund. Expenses attributable to more than one fund are allocated among the respective funds on the basis of relative net assets or other appropriate methods. Expense estimates are accrued in the period to which they relate and adjustments are made when actual amounts are known.
Income Tax Information and Distributions to Shareholders. Each year, the Fund intends to qualify as a regulated investment company under Subchapter M of the Internal Revenue Code, including distributing substantially all of its taxable income and realized gains. As a result, no provision for income taxes is required. As of October 31, 2012, the Fund did not have any unrecognized tax benefits in the financial statements; nor is the Fund aware of any tax positions for which it is reasonably possible that the total amounts of unrecognized tax benefits will significantly change in the next twelve months. The Fund files a U.S. federal tax return, in addition to state and local tax returns as required. A fund's federal income tax returns are subject to examination by the Internal Revenue Service (IRS) for a period of three fiscal years after they are filed. State and local tax returns may be subject to examination for an additional fiscal year depending on the jurisdiction. Foreign taxes are provided for based on the Fund's understanding of the tax rules and rates that exist in the foreign markets in which it invests.
Distributions are declared and recorded on the ex-dividend date. Income dividends and capital gain distributions are declared separately for each class. Income and capital gain distributions are determined in accordance with income tax regulations, which may differ from GAAP. In addition, the Fund claimed a portion of the payment made to redeeming shareholders as a distribution for income tax purposes.
Capital accounts within the financial statements are adjusted for permanent book-tax differences. These adjustments have no impact on net assets or the results of operations. Temporary book-tax differences will reverse in a subsequent period.
Book-tax differences are primarily due to foreign currency transactions, passive foreign investment companies (PFIC), deferred trustees compensation, capital loss carryforwards and losses deferred due to wash sales.
The federal tax cost of investment securities and unrealized appreciation (depreciation) as of period end were as follows:
Gross unrealized appreciation | $ 1,012,238,931 |
Gross unrealized depreciation | (135,807,314) |
Net unrealized appreciation (depreciation) on securities and other investments | $ 876,431,617 |
| |
Tax Cost | $ 1,579,631,616 |
Annual Report
Notes to Financial Statements - continued
3. Significant Accounting Policies - continued
Income Tax Information and Distributions to Shareholders - continued
The tax-based components of distributable earnings as of period end were as follows:
Undistributed ordinary income | $ 34,110,342 |
Undistributed long-term capital gain | $ 164,465,752 |
Net unrealized appreciation (depreciation) | $ 876,383,667 |
The tax character of distributions paid was as follows:
| October 31, 2012 | October 31, 2011 |
Ordinary Income | $ 46,233,461 | $ 37,999,721 |
Short-Term Trading (Redemption) Fees. Shares held by investors in the Fund less than 90 days are subject to a redemption fee equal to 1.50% of the net asset value of shares redeemed. All redemption fees, which reduce the proceeds of the shareholder redemption, are retained by the Fund and accounted for as an addition to paid in capital.
New Accounting Pronouncement. In December 2011, the Financial Accounting Standards Board issued Accounting Standard Update No. 2011-11, Disclosures about Offsetting Assets and Liabilities. The update creates new disclosure requirements requiring entities to disclose both gross and net information for derivatives and other financial instruments that are either offset in the Statement of Assets and Liabilities or subject to an enforceable master netting arrangement or similar agreement. The disclosure requirements are effective for annual reporting periods beginning on or after January 1, 2013, and interim periods within those annual periods. Management is currently evaluating the impact of the update's adoption on the Fund's financial statement disclosures.
4. Purchases and Sales of Investments.
Purchases and sales of securities, other than short-term securities, aggregated $631,783,120 and $1,035,360,910, respectively.
5. Fees and Other Transactions with Affiliates.
Management Fee. FMR and its affiliates provide the Fund with investment management related services for which the Fund pays a monthly management fee. The management fee is the sum of an individual fund fee rate that is based on an annual rate of .45% of the Fund's average net assets and an annualized group fee rate that averaged .26% during the period. The group fee rate is based upon the average net assets of all the mutual funds advised by FMR. The group fee rate decreases as assets under management increase and increases as assets under management decrease. For the period, the total annual management fee rate was .71% of the Fund's average net assets.
Distribution and Service Plan Fees. In accordance with Rule 12b-1 of the 1940 Act, the Fund has adopted separate Distribution and Service Plans for each class of shares. Certain classes pay Fidelity Distributors Corporation (FDC), an affiliate of FMR, separate Distribution and Service Fees, each of which is based on an annual percentage of each class' average net assets. In addition, FDC may pay financial intermediaries for selling shares of the Fund and providing shareholder support services. For the period, the Distribution and Service Fee rates, total fees and amounts retained by FDC were as follows:
| Distribution
Fee | Service
Fee | Total Fees | Retained
by FDC |
Class A | -% | .25% | $ 205,957 | $ 4,047 |
Class T | .25% | .25% | 115,866 | 2,034 |
Class B | .75% | .25% | 119,367 | 89,525 |
Class C | .75% | .25% | 320,211 | 31,231 |
| | | $ 761,401 | $ 126,837 |
Sales Load. FDC may receive a front-end sales charge of up to 5.75% for selling Class A shares and 3.50% for selling Class T shares, some of which is paid to financial intermediaries for selling shares of the Fund. Depending on the holding period, FDC may receive contingent deferred sales charges levied on Class A, Class T, Class B, and Class C redemptions. The deferred sales charges range from 5.00% to 1.00% for Class B shares, 1.00% for Class C shares, 1.00% for certain purchases of Class A shares and .25% for certain purchases of Class T shares.
Annual Report
5. Fees and Other Transactions with Affiliates - continued
Sales Load - continued
For the period, sales charge amounts retained by FDC were as follows:
| Retained
by FDC |
Class A | $ 30,084 |
Class T | 4,827 |
Class B* | 6,323 |
Class C* | 3,913 |
| $ 45,147 |
* When Class B and Class C shares are initially sold, FDC pays commissions from its own resources to financial intermediaries through which the sales are made.
Transfer Agent Fees. Fidelity Investments Institutional Operations Company, Inc. (FIIOC), an affiliate of FMR, is the transfer, dividend disbursing and shareholder servicing agent for each class of the Fund. FIIOC receives account fees and asset-based fees that vary according to the account size and type of account of the shareholders of the respective classes of the Fund. FIIOC pays for typesetting, printing and mailing of shareholder reports, except proxy statements. For the period, transfer agent fees for each class were as follows:
| Amount | % of
Average
Net Assets |
Class A | $ 246,709 | .30 |
Class T | 72,147 | .31 |
Class B | 35,775 | .30 |
Class C | 94,503 | .30 |
Latin America | 5,720,698 | .22 |
Institutional Class | 22,166 | .24 |
| $ 6,191,998 | |
Accounting and Security Lending Fees. Fidelity Service Company, Inc. (FSC), an affiliate of FMR, maintains the Fund's accounting records. The accounting fee is based on the level of average net assets for each month. Under a separate contract, FSC administers the security lending program. The security lending fee is based on the number and duration of lending transactions.
Brokerage Commissions. The Fund placed a portion of its portfolio transactions with brokerage firms which are affiliates of the investment adviser. The commissions paid to these affiliated firms were $4,272 for the period.
Interfund Lending Program. Pursuant to an Exemptive Order issued by the SEC, the Fund, along with other registered investment companies having management contracts with FMR, may participate in an interfund lending program. This program provides an alternative credit facility allowing the funds to borrow from, or lend money to, other participating affiliated funds. At period end, there were no interfund loans outstanding. The Fund's activity in this program during the period for which loans were outstanding was as follows:
Borrower or Lender | Average Loan
Balance | Weighted Average Interest Rate | Interest
Expense |
Borrower | $ 3,888,444 | .42% | $ 409 |
6. Committed Line of Credit.
The Fund participates with other funds managed by FMR or an affiliate in a $4.25 billion credit facility (the "line of credit") to be utilized for temporary or emergency purposes to fund shareholder redemptions or for other short-term liquidity purposes. The Fund has agreed to pay commitment fees on its pro-rata portion of the line of credit, which amounted to $7,849 and is reflected in Miscellaneous expenses on the Statement of Operations. During the period, there were no borrowings on this line of credit.
7. Security Lending.
The Fund lends portfolio securities through a lending agent from time to time in order to earn additional income. For equity securities, a lending agent is used and may loan securities to certain qualified borrowers, including Fidelity Capital Markets (FCM), a broker-dealer affiliated with the Fund. On the settlement date of the loan, the Fund receives collateral (in the form of U.S. Treasury obligations, letters of credit and/or cash) against the loaned securities and maintains collateral in an amount not less than 100% of the market value of the loaned securities during the period of the loan. The
Annual Report
Notes to Financial Statements - continued
7. Security Lending - continued
market value of the loaned securities is determined at the close of business of the Fund and any additional required collateral is delivered to the Fund on the next business day. If the borrower defaults on its obligation to return the securities loaned because of insolvency or other reasons, a fund could experience delays and costs in recovering the securities loaned or in gaining access to the collateral. Any cash collateral received is invested in the Fidelity Securities Lending Cash Central Fund. The value of loaned securities and cash collateral at period end are disclosed on the Fund's Statement of Assets and Liabilities. Security lending income represents the income earned on investing cash collateral, less rebates paid to borrowers and any lending agent fees associated with the loan, plus any premium payments received for lending certain types of securities. Security lending income is presented in the Statement of Operations as a component of income from Fidelity Central Funds. Total security lending income during the period amounted to $729,136. During the period, there were no securities loaned to FCM.
8. Expense Reductions.
Many of the brokers with whom FMR places trades on behalf of the Fund provided services to the Fund in addition to trade execution. These services included payments of certain expenses on behalf of the Fund totaling $32,182 for the period. In addition, through arrangements with the Fund's custodian, credits realized as a result of uninvested cash balances were used to reduce the Fund's expenses. During the period, these credits reduced the Fund's custody expenses by $69.
9. Distributions to Shareholders.
Distributions to shareholders of each class were as follows:
Years ended October 31, | 2012 | 2011 |
From net investment income | | |
Class A | $ 1,209,540 | $ 387,219 |
Class T | 259,191 | 94,474 |
Class B | 65,750 | 23,836 |
Class C | 156,473 | 78,469 |
Latin America | 44,398,764 | 21,655,692 |
Institutional Class | 143,743 | 52,446 |
Total | $ 46,233,461 | $ 22,292,136 |
From net realized gain | | |
Class A | $ - | $ 407,401 |
Class T | - | 127,447 |
Class B | - | 68,279 |
Class C | - | 170,156 |
Latin America | - | 14,889,803 |
Institutional Class | - | 44,499 |
Total | $ - | $ 15,707,585 |
10. Share Transactions.
Transactions for each class of shares were as follows:
| Shares | Dollars |
Years ended October 31, | 2012 | 2011 | 2012 | 2011 |
Class A | | | | |
Shares sold | 250,504 | 412,254 | $ 12,951,683 | $ 23,066,057 |
Reinvestment of distributions | 21,636 | 12,195 | 1,072,283 | 706,536 |
Shares redeemed | (594,208) | (691,058) | (30,101,636) | (38,328,762) |
Net increase (decrease) | (322,068) | (266,609) | $ (16,077,670) | $ (14,556,169) |
Class T | | | | |
Shares sold | 45,016 | 87,514 | $ 2,321,071 | $ 4,903,931 |
Reinvestment of distributions | 5,062 | 3,721 | 251,031 | 215,680 |
Shares redeemed | (152,369) | (234,128) | (7,641,343) | (12,893,248) |
Net increase (decrease) | (102,291) | (142,893) | $ (5,069,241) | $ (7,773,637) |
Annual Report
10. Share Transactions - continued
| Shares | Dollars |
Years ended October 31, | 2012 | 2011 | 2012 | 2011 |
Class B | | | | |
Shares sold | 3,378 | 11,256 | $ 173,307 | $ 626,261 |
Reinvestment of distributions | 1,105 | 1,326 | 54,795 | 76,906 |
Shares redeemed | (80,783) | (96,470) | (4,111,766) | (5,351,844) |
Net increase (decrease) | (76,300) | (83,888) | $ (3,883,664) | $ (4,648,677) |
Class C | | | | |
Shares sold | 55,877 | 137,950 | $ 2,923,684 | $ 7,785,005 |
Reinvestment of distributions | 2,881 | 3,829 | 142,933 | 222,012 |
Shares redeemed | (172,705) | (306,800) | (8,681,626) | (16,851,535) |
Net increase (decrease) | (113,947) | (165,021) | $ (5,615,009) | $ (8,844,518) |
Latin America | | | | |
Shares sold | 6,405,350 | 8,382,994 | $ 336,749,510 | $ 474,305,310 |
Reinvestment of distributions | 860,999 | 609,933 | 42,666,908 | 35,291,350 |
Shares redeemed | (15,886,221) | (28,534,583) | (800,304,511) | (1,586,342,682) |
Net increase (decrease) | (8,619,872) | (19,541,656) | $ (420,888,093) | $ (1,076,746,022) |
Institutional Class | | | | |
Shares sold | 84,374 | 72,884 | $ 4,329,443 | $ 4,108,817 |
Reinvestment of distributions | 2,228 | 1,178 | 110,408 | 68,214 |
Shares redeemed | (107,894) | (115,010) | (5,412,186) | (6,478,861) |
Net increase (decrease) | (21,292) | (40,948) | $ (972,335) | $ (2,301,830) |
11. Other.
The Fund's organizational documents provide former and current trustees and officers with a limited indemnification against liabilities arising in connection with the performance of their duties to the Fund. In the normal course of business, the Fund may also enter into contracts that provide general indemnifications. The Fund's maximum exposure under these arrangements is unknown as this would be dependent on future claims that may be made against the Fund. The risk of material loss from such claims is considered remote.
Annual Report
Fidelity Nordic Fund
Average annual total return reflects the change in the value of an investment, assuming reinvestment of the fund's distributions from dividend income and capital gains (the profits earned upon the sale of securities that have grown in value, if any) and assuming a constant rate of performance each year. The $10,000 table and the fund's returns do not reflect the deduction of taxes that a shareholder would pay on fund distributions or the redemption of fund shares. During periods of reimbursement by Fidelity, a fund's total return will be greater than it would be had the reimbursement not occurred. How a fund did yesterday is no guarantee of how it will do tomorrow.
Average Annual Total Returns
Periods ended October 31, 2012 | Past 1
year | Past 5
years | Past 10
years |
Fidelity Nordic Fund | 5.69% | -6.93% | 10.64% |
$10,000 Over 10 Years
Let's say hypothetically that $10,000 was invested in Fidelity Nordic Fund on October 31, 2002. The chart shows how the value of your investment would have changed, and also shows how the FTSE Capped Nordic Index performed over the same period. Returns shown for the FTSE Capped Nordic Index for periods prior to October 1, 2009 (its inception date) are returns of the uncapped FTSE Nordic Index.
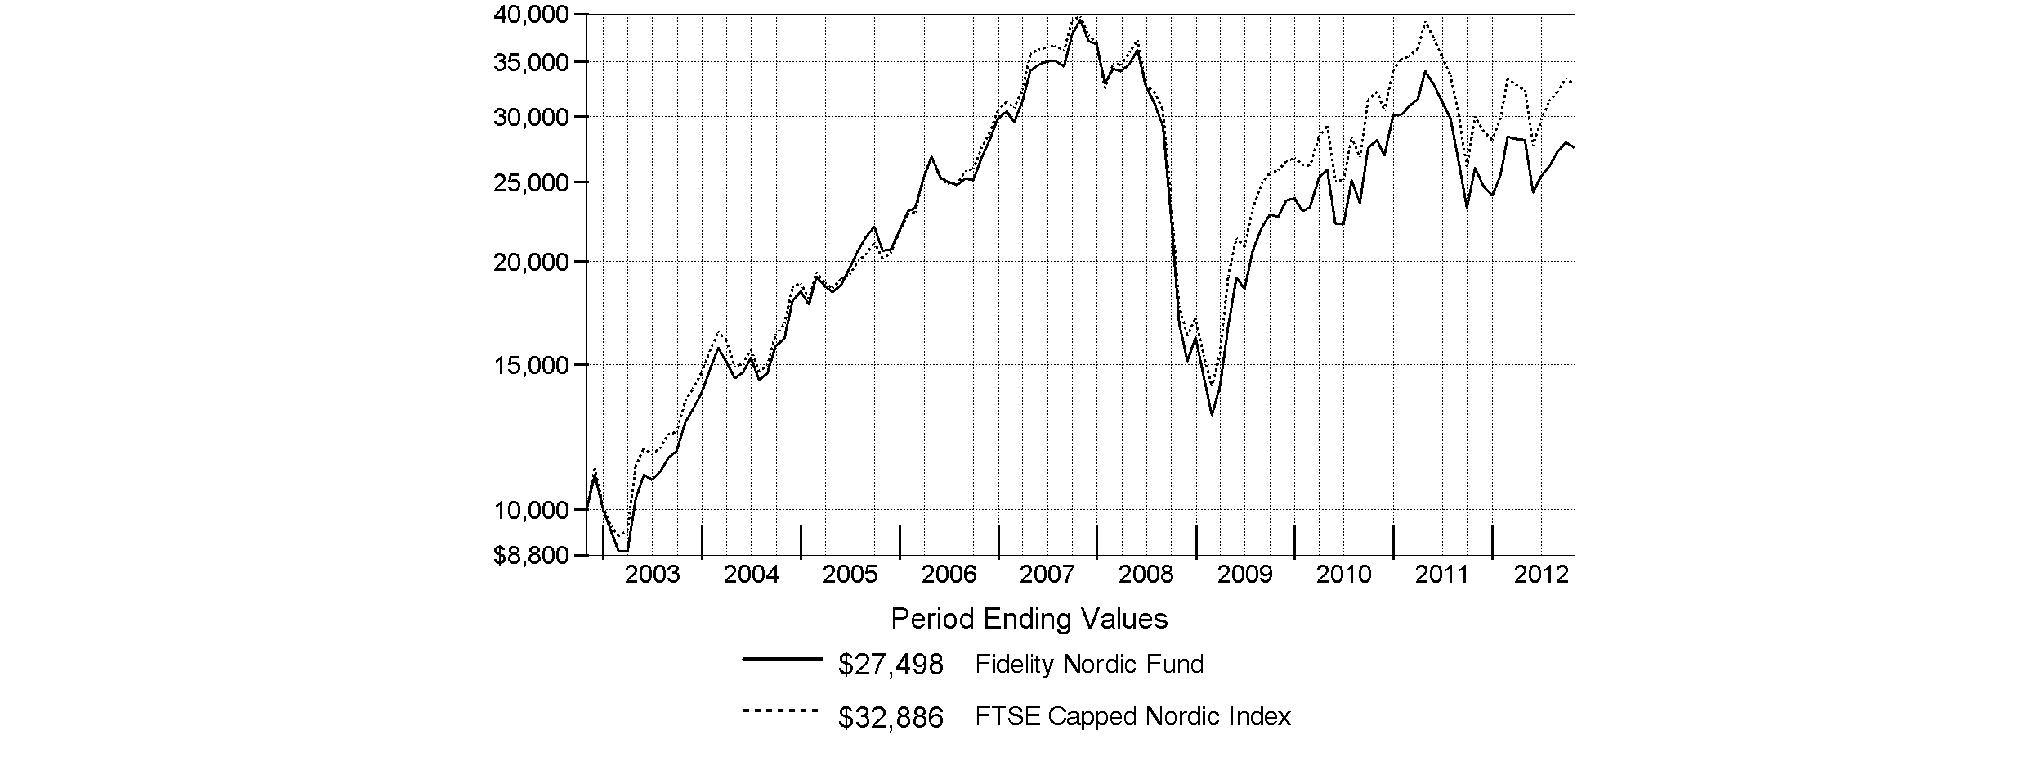
Annual Report
Fidelity Nordic Fund
Market Recap: Returns for most domestic and international equities fluctuated during the 12 months ending October 31, 2012, as investor sentiment towards risk vacillated amid a changing global economic landscape. U.S. stocks overcame bouts of volatility to post strong gains for the past year, extending an uptrend that began in March 2009. The broad-based S&P 500® Index advanced 15.21%, while the blue-chip-laden Dow Jones Industrial AverageSM and technology-heavy Nasdaq Composite® Index rose 12.56% and 12.21%, respectively. Performance outside of the U.S. was relatively weak, as the MSCI® ACWI® (All Country World Index) ex USA Index rose 4.11%, hampered in part by a stronger U.S. dollar. International developed-markets generally struggled during the period as macroeconomic concerns ebbed and flowed, finishing with only a modest gain. The MSCI® EAFE® Index rose 4.76% for the year, largely buttressed in the summertime by pledges of accommodative monetary action from eurozone officials, as well as signs that the U.S. housing market was on the mend. Within the index, Asia-Pacific ex Japan showed the most impressive gain, advancing roughly 10%. A number of core European components, including Germany (+11%) and Switzerland (+10%), and the U.K. (+9%), benefited from optimism about the eurozone's ability to resolve its debt woes, which helped the region outpace the index overall. Elsewhere, Japan was among the few benchmark constituents to finish in the red, returning about -3%. Emerging-markets stocks gained 2.98% for the year, as measured by the MSCI Emerging Markets Index. A general uptrend in the final five months of the period lifted the index into positive territory for the full 12 months.
Comments from Per Johansson, Portfolio Manager of Fidelity® Nordic Fund: For the year, the fund gained 5.69%, lagging the 9.59% gain of the FTSE® Capped Nordic Index. Stock selection in financials - especially banks and diversified financials - was the most detrimental. Holdings in energy also hurt. Despite a boost from overweighting consumer durables/apparel names in the consumer discretionary sector, the fund's security selection here was unfavorable. The fund's most significant individual detractor was BW Offshore, a Norwegian company that provides floating production services to the oil industry. This company, which is registered in Bermuda, experienced issues with its legacy contracts, which hurt profitability. In consumer discretionary, Sweden's Nobia, a kitchen manufacturer that suffered from diminishing demand in its French and U.K. markets, also detracted. Intrum Justitia, a Sweden-based debt management company, did not fare as well as expected in buying debt from European banks. The fund's position in Sweden's CDON Group, an e-commerce company, also detracted. BW, Nobia, Intrum Justitia and CDON were not in the index. Untimely ownership of Telenor, a Norwegian telecom company, also dragged down relative performance. On the positive side, underweighting technology hardware/equipment names within information technology was beneficial, as were stock picks in materials. Stock selection among media names in consumer discretionary also was a positive, but an overweighting here negated some of the benefit. On an individual basis, underweighting Finland's Nokia - a personal device manufacturer - was helpful, as the company suffered from its lack of a competitive smartphone. A smaller-than-index stake in Swedish communications technology firm Ericsson, which struggled with profitability issues, also provided a boost. Among media names, Norway's Schibsted was helpful. The company benefited from its growing online classified business in the Nordic region and mainland Europe. In industrials, shares of environmental waste management services company Lassila & Tikahoja gained because the company streamlined and refocused its business model, aiding the fund's performance. Schibsted and Lassila were not in the index.
Note to shareholders: Fidelity Nordic Fund may invest up to 35% of its total assets in any industry that represents more than 20% of the Nordic market. As of October 31, 2012, the fund did not have more than 25% of its assets in any one industry.
The views expressed above reflect those of the portfolio manager(s) only through the end of the period as stated on the cover of this report and do not necessarily represent the views of Fidelity or any other person in the Fidelity organization. Any such views are subject to change at any time based upon market or other conditions and Fidelity disclaims any responsibility to update such views. These views may not be relied on as investment advice and, because investment decisions for a Fidelity fund are based on numerous factors, may not be relied on as an indication of trading intent on behalf of any Fidelity fund.
Annual Report
Fidelity Nordic Fund
As a shareholder of the Fund, you incur two types of costs: (1) transaction costs, including redemption fees and (2) ongoing costs, including management fees and other Fund expenses. This Example is intended to help you understand your ongoing costs (in dollars) of investing in the Fund and to compare these costs with the ongoing costs of investing in other mutual funds.
The Example is based on an investment of $1,000 invested at the beginning of the period and held for the entire period (May 1, 2012 to October 31, 2012).
Actual Expenses
The first line of the accompanying table provides information about actual account values and actual expenses. You may use the information in this line, together with the amount you invested, to estimate the expenses that you paid over the period. Simply divide your account value by $1,000.00 (for example, an $8,600 account value divided by $1,000.00 = 8.6), then multiply the result by the number in the first line under the heading entitled "Expenses Paid During Period" to estimate the expenses you paid on your account during this period. A small balance maintenance fee of $12.00 that is charged once a year may apply for certain accounts with a value of less than $2,000. This fee is not included in the table below. If it was, the estimate of expenses you paid during the period would be higher, and your ending account value lower, by this amount. In addition, the Fund, as a shareholder in the underlying Fidelity Central Funds, will indirectly bear its pro-rata share of the fees and expenses incurred by the underlying Fidelity Central Funds. These fees and expenses are not included in the Fund's annualized expense ratio used to calculate the expense estimate in the table below.
Hypothetical Example for Comparison Purposes
The second line of the accompanying table provides information about hypothetical account values and hypothetical expenses based on the Fund's actual expense ratio and an assumed rate of return of 5% per year before expenses, which is not the Fund's actual return. The hypothetical account values and expenses may not be used to estimate the actual ending account balance or expenses you paid for the period. You may use this information to compare the ongoing costs of investing in the Fund and other funds. To do so, compare this 5% hypothetical example with the 5% hypothetical examples that appear in the shareholder reports of the other funds. A small balance maintenance fee of $12.00 that is charged once a year may apply for certain accounts with a value of less than $2,000. This fee is not included in the table below. If it was, the estimate of expenses you paid during the period would be higher, and your ending account value lower, by this amount. In addition, the Fund, as a shareholder in the underlying Fidelity Central Funds, will indirectly bear its pro-rata share of the fees and expenses incurred by the underlying Fidelity Central Funds. These fees and expenses are not included in the Fund's annualized expense ratio used to calculate the expense estimate in the table below.
Please note that the expenses shown in the table are meant to highlight your ongoing costs only and do not reflect any transaction costs. Therefore, the second line of the table is useful in comparing ongoing costs only, and will not help you determine the relative total costs of owning different funds. In addition, if these transactional costs were included, your costs would have been higher.
| Annualized
Expense Ratio | Beginning
Account Value
May 1, 2012 | Ending
Account Value
October 31, 2012 | Expenses Paid
During Period*
May 1, 2012
to October 31, 2012 |
Actual | 1.07% | $ 1,000.00 | $ 978.60 | $ 5.32 |
Hypothetical (5% return per year before expenses) | | $ 1,000.00 | $ 1,019.76 | $ 5.43 |
* Expenses are equal to the Fund's annualized expense ratio, multiplied by the average account value over the period, multiplied by 184/366 (to reflect the one-half year period).
Annual Report
Fidelity Nordic Fund
Investment Changes (Unaudited)
Geographic Diversification (% of fund's net assets) |
As of October 31, 2012 |
| Sweden | 44.8% | |
| Denmark | 19.2% | |
| Finland | 14.9% | |
| Norway | 14.3% | |
| Bermuda | 2.8% | |
| United States of America | 2.2% | |
| Malta | 1.8% | |

Percentages are based on country or territory of incorporation and are adjusted for the effect of futures contracts, if applicable. |
As of April 30, 2012 |
| Sweden | 43.6% | |
| Denmark | 28.3% | |
| Norway | 17.4% | |
| Finland | 7.4% | |
| Bermuda | 2.0% | |
| United States of America | 1.3% | |

Percentages are based on country or territory of incorporation and are adjusted for the effect of futures contracts, if applicable. |
Asset Allocation |
| % of fund's
net assets | % of fund's net assets
6 months ago |
Stocks | 97.8 | 98.7 |
Short-Term Investments and Net Other Assets (Liabilities) | 2.2 | 1.3 |
Top Ten Stocks as of October 31, 2012 |
| % of fund's
net assets | % of fund's net assets
6 months ago |
Novo Nordisk A/S Series B (Denmark, Pharmaceuticals) | 7.0 | 13.2 |
Schibsted ASA (B Shares) (Norway, Media) | 5.9 | 6.4 |
Svenska Handelsbanken AB (A Shares) (Sweden, Commercial Banks) | 5.3 | 4.0 |
ASSA ABLOY AB (B Shares) (Sweden, Building Products) | 5.3 | 0.0 |
Jyske Bank A/S (Reg.) (Denmark, Commercial Banks) | 5.1 | 4.4 |
Sampo OYJ (A Shares) (Finland, Insurance) | 4.8 | 4.0 |
Atlas Copco AB (A Shares) (Sweden, Machinery) | 4.7 | 0.0 |
Swedish Match Co. AB (Sweden, Tobacco) | 4.7 | 5.5 |
Lassila & Tikahoja Oyj (Finland, Commercial Services & Supplies) | 4.5 | 0.0 |
Intrum Justitia AB (Sweden, Commercial Services & Supplies) | 3.7 | 4.3 |
| 51.0 | |
Market Sectors as of October 31, 2012 |
| % of fund's
net assets | % of fund's net assets
6 months ago |
Industrials | 25.4 | 6.5 |
Financials | 24.6 | 28.1 |
Consumer Discretionary | 13.2 | 19.4 |
Information Technology | 9.8 | 9.4 |
Health Care | 9.1 | 18.4 |
Consumer Staples | 7.8 | 5.5 |
Energy | 4.7 | 2.0 |
Materials | 3.2 | 5.8 |
Telecommunication Services | 0.0 | 3.6 |
Annual Report
Fidelity Nordic Fund
Investments October 31, 2012
Showing Percentage of Net Assets
Common Stocks - 97.8% |
| Shares | | Value |
Bermuda - 2.8% |
BW Offshore Ltd. | 6,304,100 | | $ 3,704,196 |
Vostok Nafta Investment Ltd. SDR | 1,865,600 | | 4,612,740 |
TOTAL BERMUDA | | 8,316,936 |
Denmark - 19.2% |
A.P. Moller - Maersk A/S Series B | 412 | | 2,874,876 |
Christian Hansen Holding A/S | 305,500 | | 9,575,821 |
Danske Bank A/S (a) | 550,401 | | 8,606,964 |
Jyske Bank A/S (Reg.) (a) | 499,580 | | 15,233,876 |
Novo Nordisk A/S Series B | 129,101 | | 20,696,893 |
TOTAL DENMARK | | 56,988,430 |
Finland - 14.9% |
Amer Group PLC (A Shares) | 736,900 | | 10,430,052 |
Lassila & Tikahoja Oyj | 879,500 | | 13,485,773 |
Nokia Corp. (d) | 1,412,300 | | 3,796,957 |
Raisio Group PLC (V Shares) | 593,500 | | 2,346,258 |
Sampo OYJ (A Shares) | 450,100 | | 14,106,542 |
TOTAL FINLAND | | 44,165,582 |
Malta - 1.8% |
Unibet Group PLC unit | 190,100 | | 5,359,451 |
Norway - 14.3% |
ElectroMagnetic GeoServices ASA (a) | 1,854,300 | | 4,032,996 |
Gjensidige Forsikring ASA | 435,400 | | 6,361,500 |
Merkantildata ASA | 782,300 | | 8,335,770 |
Schibsted ASA (B Shares) | 463,400 | | 17,353,218 |
TGS Nopec Geophysical Co. ASA | 187,000 | | 6,363,110 |
TOTAL NORWAY | | 42,446,594 |
Sweden - 44.8% |
AarhusKarlshamn AB | 173,100 | | 6,811,365 |
ASSA ABLOY AB (B Shares) | 467,600 | | 15,586,902 |
Atlas Copco AB (A Shares) | 564,900 | | 13,890,635 |
Avanza Bank Holding AB | 306,000 | | 6,008,910 |
BioGaia AB | 228,623 | | 5,928,501 |
CDON Group AB (a)(d) | 1,065,053 | | 5,973,250 |
DIBS Payment Services AB (e) | 822,870 | | 6,451,061 |
Industrial & Financial Systems AB (IFS) | 490,200 | | 7,556,717 |
|
| Shares | | Value |
Intrum Justitia AB | 761,400 | | $ 11,019,976 |
Meda AB (A Shares) | 38,400 | | 392,806 |
Saab AB (B Shares) | 416,900 | | 7,919,522 |
Sandvik AB | 756,300 | | 10,490,072 |
Svenska Handelsbanken AB (A Shares) | 461,900 | | 15,821,689 |
Swedbank AB (A Shares) | 135,900 | | 2,520,119 |
Swedish Match Co. AB | 406,400 | | 13,847,096 |
Telefonaktiebolaget LM Ericsson
(B Shares) | 328,200 | | 2,907,549 |
TOTAL SWEDEN | | 133,126,170 |
TOTAL COMMON STOCKS (Cost $286,496,059) |
290,403,163
|
Money Market Funds - 1.5% |
| | | |
Fidelity Cash Central Fund, 0.19% (b) | 558,179 | | 558,179 |
Fidelity Securities Lending Cash Central Fund, 0.19% (b)(c) | 4,032,600 | | 4,032,600 |
TOTAL MONEY MARKET FUNDS (Cost $4,590,779) |
4,590,779
|
TOTAL INVESTMENT PORTFOLIO - 99.3% (Cost $291,086,838) | | 294,993,942 |
NET OTHER ASSETS (LIABILITIES) - 0.7% | | 1,956,737 |
NET ASSETS - 100% | $ 296,950,679 |
Legend |
(a) Non-income producing |
(b) Affiliated fund that is available only to investment companies and other accounts managed by Fidelity Investments. The rate quoted is the annualized seven-day yield of the fund at period end. A complete unaudited listing of the fund's holdings as of its most recent quarter end is available upon request. In addition, each Fidelity Central Fund's financial statements, which are not covered by the Fund's Report of Independent Registered Public Accounting Firm, are available on the SEC's website or upon request. |
(c) Investment made with cash collateral received from securities on loan. |
(d) Security or a portion of the security is on loan at period end. |
(e) Affiliated company |
Affiliated Central Funds |
Information regarding fiscal year to date income earned by the Fund from investments in Fidelity Central Funds is as follows: |
Fund | Income earned |
Fidelity Cash Central Fund | $ 8,108 |
Fidelity Securities Lending Cash Central Fund | 474,480 |
Total | $ 482,588 |
Other Affiliated Issuers |
An affiliated company is a company in which the Fund has ownership of at least 5% of the voting securities. Fiscal year to date transactions with companies which are or were affiliates are as follows: |
Affiliate | Value, beginning of period | Purchases | Sales Proceeds | Dividend Income | Value,
end of
period |
DIBS Payment Services AB | $ - | $ 6,344,096 | $ 189,684 | $ 180,999 | $ 6,451,061 |
Total | $ - | $ 6,344,096 | $ 189,684 | $ 180,999 | $ 6,451,061 |
Other Information |
Categorizations in the Schedule of Investments are based on country or territory of incorporation. |
The following is a summary of the inputs used, as of October 31, 2012, involving the Fund's assets and liabilities carried at fair value. The inputs or methodology used for valuing securities may not be an indication of the risk associated with investing in those securities. For more information on valuation inputs, and their aggregation into the levels used in the table below, please refer to the Security Valuation section in the accompanying Notes to Financial Statements. |
Valuation Inputs at Reporting Date: |
Description | Total | Level 1 | Level 2 | Level 3 |
Investments in Securities: | | | | |
Equities: | | | | |
Consumer Discretionary | $ 39,115,971 | $ 39,115,971 | $ - | $ - |
Consumer Staples | 23,004,719 | 23,004,719 | - | - |
Energy | 14,100,302 | 14,100,302 | - | - |
Financials | 73,272,340 | 73,272,340 | - | - |
Health Care | 27,018,200 | 6,321,307 | 20,696,893 | - |
Industrials | 75,267,756 | 75,267,756 | - | - |
Information Technology | 29,048,054 | 22,343,548 | 6,704,506 | - |
Materials | 9,575,821 | 9,575,821 | - | - |
Money Market Funds | 4,590,779 | 4,590,779 | - | - |
Total Investments in Securities: | $ 294,993,942 | $ 267,592,543 | $ 27,401,399 | $ - |
See accompanying notes which are an integral part of the financial statements.
Annual Report
Fidelity Nordic Fund
Statement of Assets and Liabilities
| October 31, 2012 |
| | |
Assets | | |
Investment in securities, at value (including securities loaned of $3,733,097) - See accompanying schedule: Unaffiliated issuers (cost $280,333,709) | $ 283,952,102 | |
Fidelity Central Funds (cost $4,590,779) | 4,590,779 | |
Other affiliated issuers (cost $6,162,350) | 6,451,061 | |
Total Investments (cost $291,086,838) | | $ 294,993,942 |
Receivable for investments sold | | 8,730,104 |
Receivable for fund shares sold | | 325,880 |
Distributions receivable from Fidelity Central Funds | | 4,253 |
Other receivables | | 15,865 |
Total assets | | 304,070,044 |
| | |
Liabilities | | |
Payable for investments purchased | $ 2,267,070 | |
Payable for fund shares redeemed | 501,933 | |
Accrued management fee | 178,075 | |
Other affiliated payables | 77,522 | |
Other payables and accrued expenses | 62,165 | |
Collateral on securities loaned, at value | 4,032,600 | |
Total liabilities | | 7,119,365 |
| | |
Net Assets | | $ 296,950,679 |
Net Assets consist of: | | |
Paid in capital | | $ 426,795,089 |
Undistributed net investment income | | 5,914,425 |
Accumulated undistributed net realized gain (loss) on investments and foreign currency transactions | | (139,666,205) |
Net unrealized appreciation (depreciation) on investments and assets and liabilities in foreign currencies | | 3,907,370 |
Net Assets, for 9,703,260 shares outstanding | | $ 296,950,679 |
Net Asset Value, offering price and redemption price per share ($296,950,679 ÷ 9,703,260 shares) | | $ 30.60 |
Statement of Operations
| Year ended October 31, 2012 |
| | |
Investment Income | | |
Dividends (including $180,999 earned from other affiliated issuers) | | $ 10,529,418 |
Special dividends | | 1,798,037 |
Income from Fidelity Central Funds | | 482,588 |
Income before foreign taxes withheld | | 12,810,043 |
Less foreign taxes withheld | | (2,025,234) |
Total income | | 10,784,809 |
| | |
Expenses | | |
Management fee | $ 2,218,508 | |
Transfer agent fees | 829,592 | |
Accounting and security lending fees | 163,298 | |
Custodian fees and expenses | 80,776 | |
Independent trustees' compensation | 2,100 | |
Registration fees | 24,047 | |
Audit | 67,688 | |
Legal | 1,666 | |
Interest | 1,418 | |
Miscellaneous | 3,778 | |
Total expenses before reductions | 3,392,871 | |
Expense reductions | (133,651) | 3,259,220 |
Net investment income (loss) | | 7,525,589 |
Realized and Unrealized Gain (Loss) Net realized gain (loss) on: | | |
Investment securities: | | |
Unaffiliated issuers | (12,762,951) | |
Other affiliated issuers | 7,938 | |
Foreign currency transactions | (433,674) | |
Total net realized gain (loss) | | (13,188,687) |
Change in net unrealized appreciation (depreciation) on: Investment securities | 20,469,114 | |
Assets and liabilities in foreign currencies | (1,989) | |
Total change in net unrealized appreciation (depreciation) | | 20,467,125 |
Net gain (loss) | | 7,278,438 |
Net increase (decrease) in net assets resulting from operations | | $ 14,804,027 |
See accompanying notes which are an integral part of the financial statements.
Annual Report
Statement of Changes in Net Assets
| Year ended
October 31,
2012 | Year ended
October 31,
2011 |
Increase (Decrease) in Net Assets | | |
Operations | | |
Net investment income (loss) | $ 7,525,589 | $ 6,405,898 |
Net realized gain (loss) | (13,188,687) | 59,260,117 |
Change in net unrealized appreciation (depreciation) | 20,467,125 | (98,663,142) |
Net increase (decrease) in net assets resulting from operations | 14,804,027 | (32,997,127) |
Distributions to shareholders from net investment income | (7,290,470) | (4,111,279) |
Share transactions | | |
Proceeds from sales of shares | 33,108,526 | 107,813,311 |
Reinvestment of distributions | 7,043,836 | 3,976,175 |
Cost of shares redeemed | (111,655,692) | (171,718,515) |
Net increase (decrease) in net assets resulting from share transactions | (71,503,330) | (59,929,029) |
Redemption fees | 40,364 | 162,955 |
Total increase (decrease) in net assets | (63,949,409) | (96,874,480) |
| | |
Net Assets | | |
Beginning of period | 360,900,088 | 457,774,568 |
End of period (including undistributed net investment income of $5,914,425 and undistributed net investment income of $6,065,540, respectively) | $ 296,950,679 | $ 360,900,088 |
Other Information Shares | | |
Sold | 1,108,092 | 3,156,914 |
Issued in reinvestment of distributions | 258,205 | 119,440 |
Redeemed | (3,857,413) | (5,268,807) |
Net increase (decrease) | (2,491,116) | (1,992,453) |
Financial Highlights
Years ended October 31, | 2012 | 2011 | 2010 | 2009 | 2008 |
Selected Per-Share Data | | | | | |
Net asset value, beginning of period | $ 29.60 | $ 32.27 | $ 26.33 | $ 20.75 | $ 52.81 |
Income from Investment Operations | | | | | |
Net investment income (loss) B | .70 E | .47 | .33 | .35 | .85 |
Net realized and unrealized gain (loss) | .91 | (2.86) | 5.94 | 6.29 | (28.93) |
Total from investment operations | 1.61 | (2.39) | 6.27 | 6.64 | (28.08) |
Distributions from net investment income | (.61) | (.29) | (.34) | (1.06) | (1.73) |
Distributions from net realized gain | - | - | - | - | (2.28) |
Total distributions | (.61) | (.29) | (.34) | (1.06) | (4.01) |
Redemption fees added to paid in capital B | - G | .01 | .01 | - G | .03 |
Net asset value, end of period | $ 30.60 | $ 29.60 | $ 32.27 | $ 26.33 | $ 20.75 |
Total Return A | 5.69% | (7.49)% | 24.05% | 34.90% | (57.32)% |
Ratios to Average Net Assets C, F | | | | | |
Expenses before reductions | 1.08% | 1.05% | 1.12% | 1.15% | 1.09% |
Expenses net of fee waivers, if any | 1.08% | 1.05% | 1.12% | 1.15% | 1.09% |
Expenses net of all reductions | 1.04% | .99% | 1.10% | 1.12% | 1.07% |
Net investment income (loss) | 2.40% E | 1.40% | 1.16% | 1.71% | 2.10% |
Supplemental Data | | | | | |
Net assets, end of period (000 omitted) | $ 296,951 | $ 360,900 | $ 457,775 | $ 334,414 | $ 290,401 |
Portfolio turnover rate D | 193% | 265% | 80% | 107% | 72% |
A Total returns would have been lower if certain expenses had not been reduced during the applicable periods shown. B Calculated based on average shares outstanding during the period. C Fees and expenses of any underlying Fidelity Central Funds are not included in the Fund's expense ratio. The Fund indirectly bears its proportionate share of the expenses of any underlying Fidelity Central Funds. D Amount does not include the portfolio activity of any underlying Fidelity Central Funds. E Investment income per share reflects a large, non-recurring dividend which amounted to $.17 per share. Excluding this non-recurring dividend, the ratio of net investment income (loss) to average net assets would have been 1.83%. F Expense ratios reflect operating expenses of the Fund. Expenses before reductions do not reflect amounts reimbursed by the investment adviser or reductions from brokerage service arrangements or reductions from other expense offset arrangements and do not represent the amount paid by the Fund during periods when reimbursements or reductions occur. Expenses net of fee waivers reflect expenses after reimbursement by the investment adviser but prior to reductions from brokerage service arrangements or other expense offset arrangements. Expenses net of all reductions represent the net expenses paid by the Fund. G Amount represents less than $.01 per share. |
See accompanying notes which are an integral part of the financial statements.
Annual Report
Notes to Financial Statements
For the period ended October 31, 2012
1. Organization.
Fidelity Nordic Fund (the Fund) is a fund of Fidelity Investment Trust (the Trust) and is authorized to issue an unlimited number of shares. The Trust is registered under the Investment Company Act of 1940, as amended (the 1940 Act), as an open-end management investment company organized as a Massachusetts business trust.
2. Investments in Fidelity Central Funds.
The Fund invests in Fidelity Central Funds, which are open-end investment companies available only to other investment companies and accounts managed by Fidelity Management & Research Company (FMR) and its affiliates. The Fund's Schedule of Investments lists each of the Fidelity Central Funds held as of period end, if any, as an investment of the Fund, but does not include the underlying holdings of each Fidelity Central Fund. As an Investing Fund, the Fund indirectly bears its proportionate share of the expenses of the underlying Fidelity Central Funds.
The Money Market Central Funds seek preservation of capital and current income and are managed by Fidelity Investments Money Management, Inc. (FIMM), an affiliate of FMR.
A complete unaudited list of holdings for each Fidelity Central Fund is available upon request or at the Securities and Exchange Commission (the SEC) web site at www.sec.gov. In addition, the financial statements of the Fidelity Central Funds, which are not covered by the Fund's Report of Independent Registered Public Accounting Firm, are available on the SEC web site or upon request.
3. Significant Accounting Policies.
The financial statements have been prepared in conformity with accounting principles generally accepted in the United States of America (GAAP), which require management to make certain estimates and assumptions at the date of the financial statements. Actual results could differ from those estimates. Subsequent events, if any, through the date that the financial statements were issued have been evaluated in the preparation of the financial statements. The following summarizes the significant accounting policies of the Fund:
Security Valuation. Investments are valued as of 4:00 p.m. Eastern time on the last calendar day of the period. In accordance with valuation policies and procedures approved by the Board of Trustees (the Board), the Fund attempts to obtain prices from one or more third party pricing vendors or brokers to value its investments. When current market prices, quotations or rates are not readily available or reliable, securities will be fair valued in good faith by the FMR Fair Value Committee (the Committee), in accordance with procedures adopted by the Fund's Board. Factors used in determining fair value vary by security type and may include market or security specific events. The frequency with which these procedures are used cannot be predicted and they may be utilized to a significant extent. The Committee oversees the Fund's valuation policies and procedures and is responsible for approving and reporting to the Board all fair value determinations.
The Fund categorizes the inputs to valuation techniques used to value its investments into a disclosure hierarchy consisting of three levels as shown below:
Level 1 - quoted prices in active markets for identical investments
Level 2 - other significant observable inputs (including quoted prices for similar investments, interest rates, prepayment speeds, etc.)
Level 3 - unobservable inputs (including the Fund's own assumptions based on the best information available)
Valuation techniques used to value the Fund's investments by major category are as follows:
Equity securities, including restricted securities, for which market quotations are readily available, are valued at the last reported sale price or official closing price as reported by a third party pricing vendor on the primary market or exchange on which they are traded and are categorized as Level 1 in the hierarchy. In the event there were no sales during the day or closing prices are not available, securities are valued at the last quoted bid price or may be valued using the last available price and are generally categorized as Level 2 in the hierarchy. For foreign equity securities, when significant market or security specific events arise, comparisons to the valuation of American Depositary Receipts (ADRs), futures contracts, Exchange-Traded Funds (ETFs) and certain indexes as well as quoted prices for similar securities are used and are categorized as Level 2 in the hierarchy. Utilizing these techniques may result in transfers between Level 1 and Level 2.
Investments in open-end mutual funds, including the Fidelity Central Funds, are valued at their closing net asset value (NAV) each business day and are categorized as Level 1 in the hierarchy.
Changes in valuation techniques may result in transfers in or out of an assigned level within the disclosure hierarchy. The aggregate value of investments by input level, as of October 31, 2012, is included at the end of the Fund's Schedule of Investments.
Annual Report
Notes to Financial Statements - continued
3. Significant Accounting Policies - continued
Foreign Currency Translation. The Fund may use foreign currency contracts to facilitate transactions in foreign-denominated securities. Gains and losses from these transactions may arise from changes in the value of the foreign currency or if the counterparties do not perform under the contracts' terms.
Foreign-denominated assets, including investment securities, and liabilities are translated into U.S. dollars at the exchange rates at period end. Purchases and sales of investment securities, income and dividends received and expenses denominated in foreign currencies are translated into U.S. dollars at the exchange rate in effect on the transaction date.
The effects of exchange rate fluctuations on investments are included with the net realized and unrealized gain (loss) on investment securities. Other foreign currency transactions resulting in realized and unrealized gain (loss) are disclosed separately.
Investment Transactions and Income. For financial reporting purposes, the Fund's investment holdings and NAV include trades executed through the end of the last business day of the period. The NAV per share for processing shareholder transactions is calculated as of the close of business of the New York Stock Exchange (NYSE), normally 4:00 p.m. Eastern time and includes trades executed through the end of the prior business day. Gains and losses on securities sold are determined on the basis of identified cost. Dividend income is recorded on the ex-dividend date, except for certain dividends from foreign securities where the ex-dividend date may have passed, which are recorded as soon as the Fund is informed of the ex-dividend date. Non-cash dividends included in dividend income, if any, are recorded at the fair market value of the securities received. Large, non-recurring dividends recognized by the Fund are presented separately on the Statement of Operations as "Special Dividends" and the impact of these dividends is presented in the Financial Highlights. Interest income and distributions from the Fidelity Central Funds are accrued as earned. Investment income is recorded net of foreign taxes withheld where recovery of such taxes is uncertain.
Expenses. Expenses directly attributable to a fund are charged to that fund. Expenses attributable to more than one fund are allocated among the respective funds on the basis of relative net assets or other appropriate methods. Expense estimates are accrued in the period to which they relate and adjustments are made when actual amounts are known.
Income Tax Information and Distributions to Shareholders. Each year, the Fund intends to qualify as a regulated investment company under Subchapter M of the Internal Revenue Code, including distributing substantially all of its taxable income and realized gains. As a result, no provision for income taxes is required. As of October 31, 2012, the Fund did not have any unrecognized tax benefits in the financial statements; nor is the Fund aware of any tax positions for which it is reasonably possible that the total amounts of unrecognized tax benefits will significantly change in the next twelve months. The Fund files a U.S. federal tax return, in addition to state and local tax returns as required. A fund's federal income tax returns are subject to examination by the Internal Revenue Service (IRS) for a period of three fiscal years after they are filed. State and local tax returns may be subject to examination for an additional fiscal year depending on the jurisdiction. Foreign taxes are provided for based on the Fund's understanding of the tax rules and rates that exist in the foreign markets in which it invests.
Distributions are declared and recorded on the ex-dividend date. Income and capital gain distributions are determined in accordance with income tax regulations, which may differ from GAAP.
Capital accounts within the financial statements are adjusted for permanent book-tax differences. These adjustments have no impact on net assets or the results of operations. Temporary book-tax differences will reverse in a subsequent period.
Book-tax differences are primarily due to foreign currency transactions, passive foreign investment companies (PFIC), deferred trustees compensation, capital loss carryforwards and losses deferred due to wash sales.
The federal tax cost of investment securities and unrealized appreciation (depreciation) as of period end were as follows:
Gross unrealized appreciation | $ 20,626,053 |
Gross unrealized depreciation | (21,824,062) |
Net unrealized appreciation (depreciation) on securities and other investments | $ (1,198,009) |
| |
Tax Cost | $ 296,191,951 |
The tax-based components of distributable earnings as of period end were as follows:
Undistributed ordinary income | $ 5,914,428 |
Capital loss carryforward | $ (134,561,093) |
Net unrealized appreciation (depreciation) | $ (1,197,743) |
Annual Report
3. Significant Accounting Policies - continued
Income Tax Information and Distributions to Shareholders - continued
Capital loss carryforwards are only available to offset future capital gains of the Fund to the extent provided by regulations and may be limited. Under the Regulated Investment Company Modernization Act of 2010 (the Act), the Fund is permitted to carry forward capital losses incurred in taxable years beginning after December 22, 2010 for an unlimited period and such capital losses are required to be used prior to any losses that expire. Capital loss carryforwards were as follows:
Fiscal year of expiration | |
2017 | $ (116,424,475) |
No expiration | |
Short-term | (18,136,618) |
Total capital loss carryforward | $ (134,561,093) |
The tax character of distributions paid was as follows:
| October 31, 2012 | October 31, 2011 |
Ordinary Income | $ 7,290,470 | $ 4,111,279 |
Short-Term Trading (Redemption) Fees. Shares held by investors in the Fund less than 90 days are subject to a redemption fee equal to 1.50% of the net asset value of shares redeemed. All redemption fees, which reduce the proceeds of the shareholder redemption, are retained by the Fund and accounted for as an addition to paid in capital.
New Accounting Pronouncement. In December 2011, the Financial Accounting Standards Board issued Accounting Standard Update No. 2011-11, Disclosures about Offsetting Assets and Liabilities. The update creates new disclosure requirements requiring entities to disclose both gross and net information for derivatives and other financial instruments that are either offset in the Statement of Assets and Liabilities or subject to an enforceable master netting arrangement or similar agreement. The disclosure requirements are effective for annual reporting periods beginning on or after January 1, 2013, and interim periods within those annual periods. Management is currently evaluating the impact of the update's adoption on the Fund's financial statement disclosures.
4. Purchases and Sales of Investments.
Purchases and sales of securities, other than short-term securities, aggregated $597,699,007 and $669,989,792, respectively.
5. Fees and Other Transactions with Affiliates.
Management Fee. FMR and its affiliates provide the Fund with investment management related services for which the Fund pays a monthly management fee. The management fee is the sum of an individual fund fee rate that is based on an annual rate of .45% of the Fund's average net assets and an annualized group fee rate that averaged .26% during the period. The group fee rate is based upon the average net assets of all the mutual funds advised by FMR. The group fee rate decreases as assets under management increase and increases as assets under management decrease. For the period, the total annual management fee rate was .71% of the Fund's average net assets.
Transfer Agent Fees. Fidelity Investments Institutional Operations Company, Inc. (FIIOC), an affiliate of FMR, is the Fund's transfer, dividend disbursing and shareholder servicing agent. FIIOC receives account fees and asset-based fees that vary according to account size and type of account. FIIOC pays for typesetting, printing and mailing of shareholder reports, except proxy statements. For the period, the transfer agent fees were equivalent to an annual rate of .26% of average net assets.
Accounting and Security Lending Fees. Fidelity Service Company, Inc. (FSC), an affiliate of FMR, maintains the Fund's accounting records. The accounting fee is based on the level of average net assets for each month. Under a separate contract, FSC administers the security lending program. The security lending fee is based on the number and duration of lending transactions.
Annual Report
Notes to Financial Statements - continued
5. Fees and Other Transactions with Affiliates - continued
Interfund Lending Program. Pursuant to an Exemptive Order issued by the SEC, the Fund, along with other registered investment companies having management contracts with FMR, may participate in an interfund lending program. This program provides an alternative credit facility allowing the funds to borrow from, or lend money to, other participating affiliated funds. At period end, there were no interfund loans outstanding. The Fund's activity in this program during the period for which loans were outstanding was as follows:
Borrower or Lender | Average Loan
Balance | Weighted Average Interest Rate | Interest
Expense |
Borrower | $ 10,713,846 | .37% | $ 1,418 |
6. Committed Line of Credit.
The Fund participates with other funds managed by FMR or an affiliate in a $4.25 billion credit facility (the "line of credit") to be utilized for temporary or emergency purposes to fund shareholder redemptions or for other short-term liquidity purposes. The Fund has agreed to pay commitment fees on its pro-rata portion of the line of credit, which amounted to $878 and is reflected in Miscellaneous expenses on the Statement of Operations. During the period, there were no borrowings on this line of credit.
7. Security Lending.
The Fund lends portfolio securities through a lending agent from time to time in order to earn additional income. For equity securities, a lending agent is used and may loan securities to certain qualified borrowers, including Fidelity Capital Markets (FCM), a broker-dealer affiliated with the Fund. On the settlement date of the loan, the Fund receives collateral (in the form of U.S. Treasury obligations, letters of credit and/or cash) against the loaned securities and maintains collateral in an amount not less than 100% of the market value of the loaned securities during the period of the loan. The market value of the loaned securities is determined at the close of business of the Fund and any additional required collateral is delivered to the Fund on the next business day. If the borrower defaults on its obligation to return the securities loaned because of insolvency or other reasons, a fund could experience delays and costs in recovering the securities loaned or in gaining access to the collateral. Any cash collateral received is invested in the Fidelity Securities Lending Cash Central Fund. The value of loaned securities and cash collateral at period end are disclosed on the Fund's Statement of Assets and Liabilities. Security lending income represents the income earned on investing cash collateral, less rebates paid to borrowers and any lending agent fees associated with the loan, plus any premium payments received for lending certain types of securities. Security lending income is presented in the Statement of Operations as a component of income from Fidelity Central Funds. Total security lending income during the period amounted to $474,480. During the period, there were no securities loaned to FCM.
8. Expense Reductions.
Many of the brokers with whom FMR places trades on behalf of the Fund provided services to the Fund in addition to trade execution. These services included payments of certain expenses on behalf of the Fund totaling $131,207 for the period. In addition, through arrangements with the Fund's custodian, credits realized as a result of uninvested cash balances were used to reduce the Fund's expenses. During the period, these credits reduced the Fund's custody expenses by $2,444.
9. Other.
The Fund's organizational documents provide former and current trustees and officers with a limited indemnification against liabilities arising in connection with the performance of their duties to the Fund. In the normal course of business, the Fund may also enter into contracts that provide general indemnifications. The Fund's maximum exposure under these arrangements is unknown as this would be dependent on future claims that may be made against the Fund. The risk of material loss from such claims is considered remote.
At the end of the period, Fidelity VIP FundsManager 60% was the owner of record of approximately 12% of the total outstanding shares of the Fund.
Annual Report
Fidelity Pacific Basin Fund
Average annual total return reflects the change in the value of an investment, assuming reinvestment of the fund's distributions from dividend income and capital gains (the profits earned upon the sale of securities that have grown in value, if any) and assuming a constant rate of performance each year. The $10,000 table and the fund's returns do not reflect the deduction of taxes that a shareholder would pay on fund distributions or the redemption of fund shares. During periods of reimbursement by Fidelity, a fund's total return will be greater than it would be had the reimbursement not occurred. How a fund did yesterday is no guarantee of how it will do tomorrow.
Average Annual Total Returns
Periods ended October 31, 2012 | Past 1
year | Past 5
years | Past 10
years |
Fidelity Pacific Basin Fund | 9.22% | -3.76% | 10.66% |
$10,000 Over 10 Years
Let's say hypothetically that $10,000 was invested in Fidelity Pacific Basin Fund on October 31, 2002. The chart shows how the value of your investment would have changed, and also shows how the MSCI AC (All Country) Pacific Index performed over the same period.

Annual Report
Fidelity Pacific Basin Fund
Market Recap: Returns for most domestic and international equities fluctuated during the 12 months ending October 31, 2012, as investor sentiment towards risk vacillated amid a changing global economic landscape. U.S. stocks overcame bouts of volatility to post strong gains for the past year, extending an uptrend that began in March 2009. The broad-based S&P 500® Index advanced 15.21%, while the blue-chip-laden Dow Jones Industrial AverageSM and technology-heavy Nasdaq Composite® Index rose 12.56% and 12.21%, respectively. Performance outside of the U.S. was relatively weak, as the MSCI® ACWI® (All Country World Index) ex USA Index rose 4.11%, hampered in part by a stronger U.S. dollar. International developed-markets generally struggled during the period as macroeconomic concerns ebbed and flowed, finishing with only a modest gain. The MSCI® EAFE® Index rose 4.76% for the year, largely buttressed in the summertime by pledges of accommodative monetary action from eurozone officials, as well as signs that the U.S. housing market was on the mend. Within the index, Asia-Pacific ex Japan showed the most impressive gain, advancing roughly 10%. A number of core European components, including Germany (+11%) and Switzerland (+10%), and the U.K. (+9%), benefited from optimism about the eurozone's ability to resolve its debt woes, which helped the region outpace the index overall. Elsewhere, Japan was among the few benchmark constituents to finish in the red, returning about -3%. Emerging-markets stocks gained 2.98% for the year, as measured by the MSCI Emerging Markets Index. A general uptrend in the final five months of the period lifted the index into positive territory for the full 12 months.
Comments from Dale Nicholls, Portfolio Manager of Fidelity® Pacific Basin Fund: For the year, the fund returned 9.22%, handily beating the 3.29% gain of the MSCI® AC (All Country) Pacific Index. Favorable stock selection was the driving force behind the fund's relative outperformance, with information technology, consumer discretionary and industrials standing out as sectors that contributed the most. Primarily, the stocks in these groups that had the most positive impact were mid- and small-cap shares that were not part of the index. I continued to look for opportunities in smaller-cap stocks because that's where I saw the most dynamic growth potential. Geographically, the fund was helped most by stock picking in Japan, which added more than eight percentage points to our return versus the index. Security selection in South Korea, Indonesia and Thailand also bolstered performance. At the stock level, performance was lifted by Toyo-Thai, a Thailand-based construction and engineering firm. The value of the fund's position in this stock almost tripled on strong growth in new orders, which boosted earnings expectations. Also contributing were Japan's Fujibo Holdings, a manufacturer of industrial textiles and polishing materials, and So-net Entertainment, a Japanese provider of Internet services that was acquired during the period. Conversely, the fund's large underweighting in banks had a negative impact, as more-accommodative actions by global central banks in the second half of the period aided the group. Stock picking in health care also hurt, and an overweighting in consumer discretionary dampened our strong picks there. Geographically, my choices in China and Australia limited the fund's gain. Noteworthy individual detractors included Hong Kong-based EVA Precision Industrial Holdings, a supplier of molded metal and plastic components. Slowing economic growth in China depressed the company's orders. Hong Kong-based Royale Furniture Holdings detracted as well. None of the stocks I've mentioned in this report were part of the index.
The views expressed above reflect those of the portfolio manager(s) only through the end of the period as stated on the cover of this report and do not necessarily represent the views of Fidelity or any other person in the Fidelity organization. Any such views are subject to change at any time based upon market or other conditions and Fidelity disclaims any responsibility to update such views. These views may not be relied on as investment advice and, because investment decisions for a Fidelity fund are based on numerous factors, may not be relied on as an indication of trading intent on behalf of any Fidelity fund.
Annual Report
Fidelity Pacific Basin Fund
As a shareholder of the Fund, you incur two types of costs: (1) transaction costs, including redemption fees and (2) ongoing costs, including management fees and other Fund expenses. This Example is intended to help you understand your ongoing costs (in dollars) of investing in the Fund and to compare these costs with the ongoing costs of investing in other mutual funds.
The Example is based on an investment of $1,000 invested at the beginning of the period and held for the entire period (May 1, 2012 to October 31, 2012).
Actual Expenses
The first line of the accompanying table provides information about actual account values and actual expenses. You may use the information in this line, together with the amount you invested, to estimate the expenses that you paid over the period. Simply divide your account value by $1,000.00 (for example, an $8,600 account value divided by $1,000.00 = 8.6), then multiply the result by the number in the first line under the heading entitled "Expenses Paid During Period" to estimate the expenses you paid on your account during this period. A small balance maintenance fee of $12.00 that is charged once a year may apply for certain accounts with a value of less than $2,000. This fee is not included in the table below. If it was, the estimate of expenses you paid during the period would be higher, and your ending account value lower, by this amount. In addition, the Fund, as a shareholder in the underlying Fidelity Central Funds, will indirectly bear its pro-rata share of the fees and expenses incurred by the underlying Fidelity Central Funds. These fees and expenses are not included in the Fund's annualized expense ratio used to calculate the expense estimate in the table below.
Hypothetical Example for Comparison Purposes
The second line of the accompanying table provides information about hypothetical account values and hypothetical expenses based on the Fund's actual expense ratio and an assumed rate of return of 5% per year before expenses, which is not the Fund's actual return. The hypothetical account values and expenses may not be used to estimate the actual ending account balance or expenses you paid for the period. You may use this information to compare the ongoing costs of investing in the Fund and other funds. To do so, compare this 5% hypothetical example with the 5% hypothetical examples that appear in the shareholder reports of the other funds. A small balance maintenance fee of $12.00 that is charged once a year may apply for certain accounts with a value of less than $2,000. This fee is not included in the table below. If it was, the estimate of expenses you paid during the period would be higher, and your ending account value lower, by this amount. In addition, the Fund, as a shareholder in the underlying Fidelity Central Funds, will indirectly bear its pro-rata share of the fees and expenses incurred by the underlying Fidelity Central Funds. These fees and expenses are not included in the Fund's annualized expense ratio used to calculate the expense estimate in the table below.
Please note that the expenses shown in the table are meant to highlight your ongoing costs only and do not reflect any transaction costs. Therefore, the second line of the table is useful in comparing ongoing costs only, and will not help you determine the relative total costs of owning different funds. In addition, if these transactional costs were included, your costs would have been higher.
| Annualized
Expense Ratio | Beginning
Account Value
May 1, 2012 | Ending
Account Value
October 31, 2012 | Expenses Paid
During Period*
May 1, 2012
to October 31, 2012 |
Actual | 1.29% | $ 1,000.00 | $ 1,025.20 | $ 6.57 |
Hypothetical (5% return per year before expenses) | | $ 1,000.00 | $ 1,018.65 | $ 6.55 |
* Expenses are equal to the Fund's annualized expense ratio, multiplied by the average account value over the period, multiplied by 184/366 (to reflect the one-half year period).
Annual Report
Fidelity Pacific Basin Fund
Investment Changes (Unaudited)
Geographic Diversification (% of fund's net assets) |
As of October 31, 2012 |
| Japan | 35.4% | |
| Cayman Islands | 16.8% | |
| Korea (South) | 9.7% | |
| Australia | 7.7% | |
| Indonesia | 5.1% | |
| Bermuda | 4.2% | |
| Singapore | 4.0% | |
| Hong Kong | 3.2% | |
| China | 2.7% | |
| Other | 11.2% | |

Percentages are based on country or territory of incorporation and are adjusted for the effect of futures contracts, if applicable. |
As of April 30, 2012 |
| Japan | 37.7% | |
| Cayman Islands | 18.0% | |
| Korea (South) | 9.2% | |
| Australia | 7.4% | |
| Bermuda | 4.8% | |
| Indonesia | 4.3% | |
| China | 3.3% | |
| Singapore | 2.9% | |
| India | 2.4% | |
| Other | 10.0% | |

Percentages are based on country or territory of incorporation and are adjusted for the effect of futures contracts, if applicable. |
Asset Allocation |
| % of fund's
net assets | % of fund's net assets
6 months ago |
Stocks | 99.5 | 99.6 |
Short-Term Investments and Net Other Assets (Liabilities) | 0.5 | 0.4 |
Top Ten Stocks as of October 31, 2012 |
| % of fund's
net assets | % of fund's net assets
6 months ago |
ORIX Corp. (Japan, Diversified Financial Services) | 3.4 | 3.4 |
Samsung Electronics Co. Ltd. (Korea (South), Semiconductors & Semiconductor Equipment) | 2.6 | 2.4 |
Aeon Credit Service Co. Ltd. (Japan, Consumer Finance) | 2.2 | 1.9 |
Toyo-Thai Corp. PCL (Thailand, Construction & Engineering) | 2.1 | 0.7 |
Daou Technology, Inc. (Korea (South), Internet Software & Services) | 1.9 | 1.4 |
Softbank Corp. (Japan, Wireless Telecommunication Services) | 1.9 | 1.7 |
Fujibo Holdings, Inc. (Japan, Textiles, Apparel & Luxury Goods) | 1.8 | 1.4 |
Goodpack Ltd. (Singapore, Air Freight & Logistics) | 1.6 | 1.3 |
Rohto Pharmaceutical Co. Ltd. (Japan, Pharmaceuticals) | 1.6 | 1.4 |
Ping An Insurance Group Co. China Ltd. (H Shares) (China, Insurance) | 1.5 | 1.7 |
| 20.6 | |
Market Sectors as of October 31, 2012 |
| % of fund's
net assets | % of fund's net assets
6 months ago |
Information Technology | 22.7 | 22.3 |
Consumer Discretionary | 20.2 | 18.5 |
Industrials | 16.9 | 18.8 |
Financials | 16.7 | 16.1 |
Consumer Staples | 6.5 | 5.9 |
Health Care | 6.1 | 6.1 |
Materials | 4.7 | 6.2 |
Telecommunication Services | 2.3 | 1.7 |
Utilities | 1.9 | 1.8 |
Energy | 1.5 | 2.2 |
Annual Report
Fidelity Pacific Basin Fund
Investments October 31, 2012
Showing Percentage of Net Assets
Common Stocks - 99.5% |
| Shares | | Value |
Australia - 7.7% |
Acrux Ltd. | 564,305 | | $ 1,897,917 |
Alkane Resources Ltd. | 1,142,478 | | 1,008,057 |
Austal Ltd. | 1,485,537 | | 1,889,026 |
Carsales.com Ltd. | 302,468 | | 2,342,268 |
Goodman Group unit | 1,166,245 | | 5,363,049 |
Iluka Resources Ltd. | 240,403 | | 2,475,539 |
Karoon Gas Australia Ltd. (a) | 443,513 | | 2,568,969 |
Linc Energy Ltd. (a)(d) | 1,019,471 | | 582,044 |
Mesoblast Ltd. (a)(d) | 438,761 | | 2,627,980 |
Navitas Ltd. (d) | 794,644 | | 3,398,506 |
Newcrest Mining Ltd. | 171,361 | | 4,701,402 |
Origin Energy Ltd. | 487,107 | | 5,744,087 |
realestate.com.au Ltd. | 136,145 | | 2,437,862 |
SEEK Ltd. | 372,891 | | 2,589,562 |
Starpharma Holdings Ltd. (a) | 1,005,390 | | 1,695,923 |
Sydney Airport unit | 896,974 | | 3,156,442 |
TOTAL AUSTRALIA | | 44,478,633 |
Bermuda - 4.2% |
Biosensors International Group Ltd. (a) | 4,772,000 | | 4,244,647 |
Cheung Kong Infrastructure Holdings
Ltd. | 467,000 | | 2,735,698 |
China Animal Healthcare Ltd. | 11,668,000 | | 2,487,031 |
China Foods Ltd. | 2,510,000 | | 2,539,132 |
China Resources Gas Group Ltd. | 1,064,000 | | 2,358,633 |
China Singyes Solar Tech Holdings Ltd. | 3,334,000 | | 1,974,576 |
Imagi International Holdings Ltd. (a) | 61,928,000 | | 886,963 |
REXLot Holdings Ltd. | 49,186,967 | | 3,554,132 |
Vtech Holdings Ltd. | 327,600 | | 3,891,017 |
TOTAL BERMUDA | | 24,671,829 |
Cayman Islands - 16.8% |
21Vianet Group, Inc. ADR (a)(d) | 156,400 | | 1,732,912 |
3SBio, Inc. sponsored ADR (a) | 178,100 | | 2,388,321 |
51job, Inc. sponsored ADR (a)(d) | 99,400 | | 4,674,782 |
AirMedia Group, Inc. ADR (a) | 968,100 | | 2,197,587 |
Airtac International Group | 469,000 | | 2,199,692 |
AMVIG Holdings Ltd. | 9,052,000 | | 2,686,383 |
AutoNavi Holdings Ltd. ADR (a) | 154,800 | | 1,661,004 |
Baidu.com, Inc. sponsored ADR (a) | 60,800 | | 6,482,496 |
Bitauto Holdings Ltd. ADR (a) | 344,670 | | 1,737,137 |
China Automation Group Ltd. | 6,268,000 | | 1,488,135 |
China Dongxiang Group Co. Ltd. | 4,546,000 | | 568,980 |
China High Precision Automation Group Ltd. | 4,875,000 | | 701,995 |
China Lilang Ltd. | 2,082,000 | | 1,184,718 |
China Lodging Group Ltd. ADR (a)(d) | 97,400 | | 1,657,748 |
China Mengniu Dairy Co. Ltd. | 1,905,000 | | 5,776,414 |
China Metal Recycling (Holdings) Ltd. | 2,572,200 | | 2,572,183 |
China State Construction International Holdings Ltd. | 2,947,302 | | 3,510,119 |
China ZhengTong Auto Services Holdings Ltd. (a) | 2,597,000 | | 1,759,247 |
|
| Shares | | Value |
CNinsure, Inc. ADR (a)(d) | 178,700 | | $ 1,050,756 |
EVA Precision Industrial Holdings Ltd. | 48,434,000 | | 5,124,597 |
Fook Woo Group Holdings Ltd. (a) | 11,590,000 | | 1,024,400 |
Greatview Aseptic Pack Co. Ltd. | 2,779,000 | | 1,455,828 |
Haitian International Holdings Ltd. | 2,294,000 | | 2,832,702 |
Hutchison China Meditech Ltd. (a) | 196,669 | | 1,417,078 |
Jiayuan.com International Ltd. sponsored ADR (a) | 201,300 | | 1,085,007 |
Kingdee International Software Group Co. Ltd. (a) | 6,925,513 | | 1,438,710 |
Kingsoft Corp. Ltd. | 2,830,000 | | 1,643,215 |
KongZhong Corp. sponsored ADR (a) | 351,200 | | 2,068,568 |
Minth Group Ltd. | 2,122,000 | | 2,143,891 |
New Oriental Education & Technology Group, Inc. sponsored ADR | 91,600 | | 1,544,376 |
Perfect World Co. Ltd. sponsored ADR Class B | 216,775 | | 2,304,318 |
Royale Furniture Holdings Ltd. | 22,347,910 | | 1,874,329 |
Shenguan Holdings Group Ltd. | 9,116,000 | | 5,022,590 |
SINA Corp. (a) | 33,500 | | 1,830,105 |
SOHO China Ltd. | 697,000 | | 473,957 |
SouFun Holdings Ltd. ADR (d) | 293,300 | | 5,299,931 |
Tencent Holdings Ltd. | 232,500 | | 8,219,947 |
VanceInfo Technologies, Inc. ADR (a) | 176,700 | | 1,346,454 |
VisionChina Media, Inc. ADR (a)(d) | 538,250 | | 118,415 |
WuXi PharmaTech Cayman, Inc. sponsored ADR (a) | 240,300 | | 3,409,857 |
TOTAL CAYMAN ISLANDS | | 97,708,884 |
China - 2.7% |
China Southern Airlines Ltd. (H Shares) | 1,358,000 | | 643,075 |
Guangshen Railway Co. Ltd. (H Shares) | 4,784,000 | | 1,648,155 |
NQ Mobile, Inc. ADR (a)(d) | 201,200 | | 1,400,352 |
Ping An Insurance Group Co. China Ltd. (H Shares) | 1,097,500 | | 8,694,976 |
Travelsky Technology Ltd. (H Shares) | 2,582,000 | | 1,332,637 |
Yantai Changyu Pioneer Wine Co. (B Shares) | 406,510 | | 2,060,861 |
TOTAL CHINA | | 15,780,056 |
Hong Kong - 3.2% |
China Everbright International | 2,775,000 | | 1,428,668 |
China Overseas Grand Oceans Group Ltd. | 276,000 | | 288,819 |
China Unicom Ltd. | 1,494,000 | | 2,408,517 |
Galaxy Entertainment Group Ltd. (a) | 394,000 | | 1,354,843 |
Lenovo Group Ltd. | 2,474,000 | | 1,988,764 |
Magnificent Estates Ltd. | 56,182,000 | | 2,718,466 |
Techtronic Industries Co. Ltd. | 2,154,500 | | 4,103,254 |
Tian An China Investments Co. Ltd. | 4,830,800 | | 2,798,729 |
YGM Trading Ltd. | 501,000 | | 1,203,685 |
TOTAL HONG KONG | | 18,293,745 |
India - 2.5% |
Britannia Industries Ltd. (a) | 146,278 | | 1,314,884 |
Common Stocks - continued |
| Shares | | Value |
India - continued |
Educomp Solutions Ltd. | 349,410 | | $ 957,541 |
Financial Technologies India Ltd. | 168,768 | | 3,121,918 |
Geodesic Ltd. | 1,605,385 | | 1,184,533 |
Housing Development Finance Corp. Ltd. | 111,051 | | 1,573,455 |
IndusInd Bank Ltd. | 256,372 | | 1,803,838 |
INFO Edge India Ltd. | 350,752 | | 2,284,239 |
Shriram City Union Finance Ltd. (a) | 587 | | 8,519 |
United Spirits Ltd. | 106,839 | | 2,334,652 |
TOTAL INDIA | | 14,583,579 |
Indonesia - 5.1% |
PT Bank Rakyat Indonesia Tbk | 4,261,000 | | 3,282,797 |
PT Ciputra Development Tbk | 59,580,000 | | 4,218,035 |
PT Jasa Marga Tbk | 3,158,000 | | 1,906,957 |
PT Lippo Karawaci Tbk | 19,571,000 | | 1,894,946 |
PT Media Nusantara Citra Tbk | 23,850,000 | | 7,014,676 |
PT Mitra Adiperkasa Tbk | 5,334,500 | | 3,637,775 |
PT MNC Sky Vision Tbk | 8,196,000 | | 1,855,932 |
PT Nippon Indosari Corpindo Tbk | 5,250,000 | | 3,279,528 |
PT Pembangunan Perumahan Persero Tbk | 10,797,000 | | 865,555 |
PT Tiga Pilar Sejahtera Food Tbk | 20,140,000 | | 1,887,134 |
TOTAL INDONESIA | | 29,843,335 |
Japan - 35.4% |
ACOM Co. Ltd. (a) | 75,320 | | 2,223,841 |
Aeon Credit Service Co. Ltd. | 614,000 | | 13,029,137 |
Aeon Mall Co. Ltd. | 104,100 | | 2,700,628 |
Asahi Diamond Industrial Co. Ltd. | 151,300 | | 1,338,066 |
Avex Group Holdings, Inc. | 87,500 | | 1,729,613 |
Calbee, Inc. (d) | 35,000 | | 3,213,704 |
Chiyoda Co. Ltd. | 96,200 | | 2,752,359 |
DeNA Co. Ltd. (d) | 104,600 | | 3,263,918 |
Digital Garage, Inc. (d) | 840 | | 1,622,548 |
Fuji Heavy Industries Ltd. | 602,000 | | 5,783,966 |
Fujibo Holdings, Inc. (d) | 2,491,000 | | 10,297,257 |
Fujitsu Ltd. | 717,000 | | 2,757,347 |
GMO Internet, Inc. | 819,600 | | 5,728,884 |
Hamakyorex Co. Ltd. | 84,200 | | 2,625,251 |
Haseko Corp. (a) | 2,931,500 | | 1,872,811 |
Hikari Tsushin, Inc. | 58,300 | | 3,220,631 |
Honeys Co. Ltd. (d) | 170,010 | | 2,706,786 |
Horiba Ltd. | 73,100 | | 1,991,638 |
Internet Initiative Japan, Inc. | 129,000 | | 3,369,222 |
ISE Chemical Corp. (d) | 456,000 | | 2,861,781 |
Japan Tobacco, Inc. | 260,200 | | 7,190,294 |
Kenedix Realty Investment Corp. | 1,610 | | 5,501,791 |
Message Co. Ltd. | 1,308 | | 4,037,219 |
Micronics Japan Co. Ltd. | 339,900 | | 1,234,761 |
MS&AD Insurance Group Holdings, Inc. | 265,600 | | 4,501,526 |
Nihon M&A Center, Inc. | 133,800 | | 4,014,168 |
Nihon Parkerizing Co. Ltd. | 109,000 | | 1,645,309 |
Nintendo Co. Ltd. | 21,500 | | 2,768,633 |
|
| Shares | | Value |
Nippon Seiki Co. Ltd. | 684,000 | | $ 6,571,815 |
Nitta Corp. | 333,800 | | 5,134,741 |
NSD Co. Ltd. | 200,300 | | 1,916,938 |
ORIX Corp. | 195,610 | | 20,092,717 |
Osaka Securities Exchange Co. Ltd. (d) | 928 | | 3,458,349 |
Point, Inc. | 33,180 | | 1,263,525 |
Proto Corp. | 65,600 | | 1,079,775 |
Rakuten, Inc. | 296,300 | | 2,664,956 |
Rohto Pharmaceutical Co. Ltd. | 673,000 | | 9,290,317 |
Round One Corp. | 234,400 | | 1,186,241 |
Saizeriya Co. Ltd. | 157,900 | | 2,219,263 |
Sankyo Seiko Co. Ltd. | 650,000 | | 2,190,279 |
Shinsei Bank Ltd. | 3,137,000 | | 4,597,632 |
SHO-BOND Holdings Co. Ltd. | 80,900 | | 2,445,343 |
Softbank Corp. | 344,300 | | 10,898,736 |
Sony Financial Holdings, Inc. | 191,500 | | 3,415,959 |
Start Today Co. Ltd. (d) | 107,300 | | 1,177,437 |
Suzuki Motor Corp. | 39,200 | | 887,807 |
Toridoll Corp. | 182,400 | | 2,748,681 |
Toyo Engineering Corp. | 701,000 | | 2,897,783 |
Universal Entertainment Corp. | 180,300 | | 3,877,929 |
Wacom Co. Ltd. | 779 | | 2,262,935 |
Xebio Co. Ltd. | 50,000 | | 978,329 |
Yamato Kogyo Co. Ltd. | 234,600 | | 6,585,727 |
TOTAL JAPAN | | 205,826,303 |
Korea (South) - 9.7% |
Daou Technology, Inc. | 794,850 | | 11,299,596 |
Duksan Hi-Metal Co. Ltd. (a) | 169,183 | | 3,165,432 |
Hyundai Home Shopping Network Corp. | 21,378 | | 2,539,118 |
Hyundai Wia Corp. | 3,493 | | 565,444 |
Korea Electric Power Corp. (a) | 215,170 | | 5,582,510 |
Korea Plant Service & Engineering Co. Ltd. | 42,977 | | 2,365,012 |
Lotte Chilsung Beverage Co. Ltd. | 919 | | 1,201,092 |
Mando Corp. | 13,957 | | 1,843,320 |
NCSOFT Corp. | 8,463 | | 1,622,246 |
NHN Corp. | 14,080 | | 3,260,694 |
Samsung Electronics Co. Ltd. | 12,581 | | 15,115,848 |
Sapphire Technology Co. Ltd. | 51,480 | | 1,709,201 |
Soulbrain Co. Ltd. | 47,213 | | 1,900,956 |
TK Corp. (a) | 160,368 | | 4,066,857 |
TOTAL KOREA (SOUTH) | | 56,237,326 |
Luxembourg - 0.8% |
Samsonite International SA | 2,115,600 | | 4,394,960 |
Malaysia - 1.5% |
IJM Land Bhd warrants 9/11/13 (a) | 116,970 | | 31,873 |
JobStreet Corp. Bhd | 7,040,150 | | 5,269,712 |
Muhibbah Engineering (M) Bhd | 4,491,400 | | 1,363,935 |
WCT Bhd | 2,340,600 | | 2,120,833 |
TOTAL MALAYSIA | | 8,786,353 |
Common Stocks - continued |
| Shares | | Value |
Philippines - 0.5% |
Alliance Global Group, Inc. | 8,365,142 | | $ 3,028,548 |
Singapore - 4.0% |
CSE Global Ltd. | 7,480,500 | | 5,304,667 |
Global Logistic Properties Ltd. | 1,881,000 | | 3,963,084 |
Goodpack Ltd. | 6,087,000 | | 9,680,915 |
Goodpack Ltd. warrants 11/30/12 (a) | 2,233,800 | | 2,270,792 |
OSIM International Ltd. | 1,668,000 | | 2,222,086 |
Tat Hong Holdings Ltd. warrants 8/2/13 (a) | 125,700 | | 3,710 |
TOTAL SINGAPORE | | 23,445,254 |
Taiwan - 2.1% |
LITE-ON Technology Corp. | 2,240,269 | | 2,853,064 |
Lung Yen Life Service Co. Ltd. | 542,000 | | 1,671,832 |
Pacific Hospital Supply Co. Ltd. | 485,100 | | 1,413,283 |
PChome Online, Inc. | 116,768 | | 527,675 |
Tong Hsing Electronics Industries Ltd. | 1,157,096 | | 4,020,720 |
WPG Holding Co. Ltd. | 1,525,000 | | 1,842,948 |
TOTAL TAIWAN | | 12,329,522 |
Thailand - 2.1% |
Toyo-Thai Corp. PCL | 13,563,726 | | 12,051,240 |
United Kingdom - 0.3% |
SAIC Motor Corp. Ltd. Class A (UBS Warrant Programme) warrants 9/16/14 (a) | 844,282 | | 1,754,282 |
United States of America - 0.9% |
GI Dynamics, Inc. CDI (a) | 2,123,464 | | 1,322,557 |
YOU On Demand Holdings, Inc. (a) | 440,068 | | 1,527,036 |
Zhongpin, Inc. (a)(d) | 181,600 | | 2,092,032 |
TOTAL UNITED STATES OF AMERICA | | 4,941,625 |
TOTAL COMMON STOCKS (Cost $503,167,360) |
578,155,474
|
Money Market Funds - 3.6% |
| Shares | | Value |
Fidelity Cash Central Fund, 0.19% (b) | 1,471,592 | | $ 1,471,592 |
Fidelity Securities Lending Cash Central Fund, 0.19% (b)(c) | 19,610,760 | | 19,610,760 |
TOTAL MONEY MARKET FUNDS (Cost $21,082,352) |
21,082,352
|
TOTAL INVESTMENT PORTFOLIO - 103.1% (Cost $524,249,712) | | 599,237,826 |
NET OTHER ASSETS (LIABILITIES) - (3.1)% | | (17,984,165) |
NET ASSETS - 100% | $ 581,253,661 |
Legend |
(a) Non-income producing |
(b) Affiliated fund that is available only to investment companies and other accounts managed by Fidelity Investments. The rate quoted is the annualized seven-day yield of the fund at period end. A complete unaudited listing of the fund's holdings as of its most recent quarter end is available upon request. In addition, each Fidelity Central Fund's financial statements, which are not covered by the Fund's Report of Independent Registered Public Accounting Firm, are available on the SEC's website or upon request. |
(c) Investment made with cash collateral received from securities on loan. |
(d) Security or a portion of the security is on loan at period end. |
Affiliated Central Funds |
Information regarding fiscal year to date income earned by the Fund from investments in Fidelity Central Funds is as follows: |
Fund | Income earned |
Fidelity Cash Central Fund | $ 1,428 |
Fidelity Securities Lending Cash Central Fund | 883,529 |
Total | $ 884,957 |
Other Information |
Categorizations in the Schedule of Investments are based on country or territory of incorporation. |
The following is a summary of the inputs used, as of October 31, 2012, involving the Fund's assets and liabilities carried at fair value. The inputs or methodology used for valuing securities may not be an indication of the risk associated with investing in those securities. For more information on valuation inputs, and their aggregation into the levels used in the tables below, please refer to the Security Valuation section at the end of this in the accompanying Notes to Financial Statements. |
Valuation Inputs at Reporting Date: |
Description | Total | Level 1 | Level 2 | Level 3 |
Investments in Securities: | | | | |
Equities: | | | | |
Consumer Discretionary | $ 116,146,182 | $ 116,146,182 | $ - | $ - |
Consumer Staples | 37,912,317 | 37,912,317 | - | - |
Energy | 8,895,100 | 8,895,100 | - | - |
Financials | 96,722,695 | 93,164,575 | 3,558,120 | - |
Health Care | 36,232,130 | 36,232,130 | - | - |
Industrials | 97,633,349 | 96,608,949 | - | 1,024,400 |
Information Technology | 132,736,442 | 132,034,447 | - | 701,995 |
Materials | 27,893,165 | 27,893,165 | - | - |
Telecommunication Services | 13,307,253 | 10,898,736 | 2,408,517 | - |
Utilities | 10,676,841 | 5,094,331 | 5,582,510 | - |
Money Market Funds | 21,082,352 | 21,082,352 | - | - |
Total Investments in Securities: | $ 599,237,826 | $ 585,962,284 | $ 11,549,147 | $ 1,726,395 |
The following is a summary of transfers between Level 1 and Level 2 for the period ended October 31, 2012. Transfers are assumed to have occurred at the beginning of the period, and are primarily attributable to the valuation techniques used for foreign equity securities, as discussed in the accompanying Notes to Financial Statements. |
Transfers | Total |
Level 1 to Level 2 | $ 0 |
Level 2 to Level 1 | $ 474,625,120 |
See accompanying notes which are an integral part of the financial statements.
Annual Report
Fidelity Pacific Basin Fund
Statement of Assets and Liabilities
| October 31, 2012 |
| | |
Assets | | |
Investment in securities, at value (including securities loaned of $18,638,571) - See accompanying schedule: Unaffiliated issuers (cost $503,167,360) | $ 578,155,474 | |
Fidelity Central Funds (cost $21,082,352) | 21,082,352 | |
Total Investments (cost $524,249,712) | | $ 599,237,826 |
Receivable for investments sold | | 2,288,423 |
Receivable for fund shares sold | | 1,163,991 |
Dividends receivable | | 1,352,155 |
Distributions receivable from Fidelity Central Funds | | 51,346 |
Other receivables | | 55,068 |
Total assets | | 604,148,809 |
| | |
Liabilities | | |
Payable for investments purchased | $ 1,706,428 | |
Payable for fund shares redeemed | 797,233 | |
Accrued management fee | 464,873 | |
Other affiliated payables | 129,755 | |
Other payables and accrued expenses | 186,099 | |
Collateral on securities loaned, at value | 19,610,760 | |
Total liabilities | | 22,895,148 |
| | |
Net Assets | | $ 581,253,661 |
Net Assets consist of: | | |
Paid in capital | | $ 531,762,899 |
Undistributed net investment income | | 6,554,336 |
Accumulated undistributed net realized gain (loss) on investments and foreign currency transactions | | (31,939,512) |
Net unrealized appreciation (depreciation) on investments and assets and liabilities in foreign currencies | | 74,875,938 |
Net Assets, for 23,386,994 shares outstanding | | $ 581,253,661 |
Net Asset Value, offering price and redemption price per share ($581,253,661 ÷ 23,386,994 shares) | | $ 24.85 |
Statement of Operations
| Year ended October 31, 2012 |
| | |
Investment Income | | |
Dividends | | $ 15,446,330 |
Interest | | 65 |
Income from Fidelity Central Funds (including $883,529 from security lending) | | 884,957 |
Income before foreign taxes withheld | | 16,331,352 |
Less foreign taxes withheld | | (728,144) |
Total income | | 15,603,208 |
| | |
Expenses | | |
Management fee Basic fee | $ 4,338,839 | |
Performance adjustment | 1,440,623 | |
Transfer agent fees | 1,375,185 | |
Accounting and security lending fees | 312,038 | |
Custodian fees and expenses | 213,302 | |
Independent trustees' compensation | 4,214 | |
Registration fees | 25,189 | |
Audit | 85,929 | |
Legal | 5,019 | |
Interest | 1,065 | |
Miscellaneous | 8,182 | |
Total expenses before reductions | 7,809,585 | |
Expense reductions | (97,881) | 7,711,704 |
Net investment income (loss) | | 7,891,504 |
Realized and Unrealized Gain (Loss) Net realized gain (loss) on: | | |
Investment securities: | | |
Unaffiliated issuers | 3,765,973 | |
Foreign currency transactions | (116,468) | |
Total net realized gain (loss) | | 3,649,505 |
Change in net unrealized appreciation (depreciation) on: Investment securities (net of increase in deferred foreign taxes of $76,609) | 37,678,619 | |
Assets and liabilities in foreign currencies | 5,440 | |
Total change in net unrealized appreciation (depreciation) | | 37,684,059 |
Net gain (loss) | | 41,333,564 |
Net increase (decrease) in net assets resulting from operations | | $ 49,225,068 |
See accompanying notes which are an integral part of the financial statements.
Annual Report
Statement of Changes in Net Assets
| Year ended
October 31,
2012 | Year ended
October 31,
2011 |
Increase (Decrease) in Net Assets | | |
Operations | | |
Net investment income (loss) | $ 7,891,504 | $ 7,186,444 |
Net realized gain (loss) | 3,649,505 | 81,039,756 |
Change in net unrealized appreciation (depreciation) | 37,684,059 | (130,837,860) |
Net increase (decrease) in net assets resulting from operations | 49,225,068 | (42,611,660) |
Distributions to shareholders from net investment income | (3,487,165) | (6,798,978) |
Distributions to shareholders from net realized gain | (2,493,225) | (22,436,616) |
Total distributions | (5,980,390) | (29,235,594) |
Share transactions Proceeds from sales of shares | 39,444,014 | 325,706,660 |
Reinvestment of distributions | 5,724,533 | 27,290,655 |
Cost of shares redeemed | (229,658,785) | (396,071,405) |
Net increase (decrease) in net assets resulting from share transactions | (184,490,238) | (43,074,090) |
Redemption fees | 45,917 | 461,937 |
Total increase (decrease) in net assets | (141,199,643) | (114,459,407) |
| | |
Net Assets | | |
Beginning of period | 722,453,304 | 836,912,711 |
End of period (including undistributed net investment income of $6,554,336 and undistributed net investment income of $2,372,302, respectively) | $ 581,253,661 | $ 722,453,304 |
Other Information Shares | | |
Sold | 1,702,098 | 12,640,955 |
Issued in reinvestment of distributions | 257,613 | 1,082,533 |
Redeemed | (10,038,333) | (15,582,896) |
Net increase (decrease) | (8,078,622) | (1,859,408) |
Financial Highlights
Years ended October 31, | 2012 | 2011 | 2010 | 2009 | 2008 |
Selected Per-Share Data | | | | | |
Net asset value, beginning of period | $ 22.96 | $ 25.11 | $ 19.88 | $ 12.84 | $ 37.32 |
Income from Investment Operations | | | | | |
Net investment income (loss) B | .30 | .21 | .21 | .20 | .22 |
Net realized and unrealized gain (loss) | 1.79 | (1.51) | 5.86 | 6.90 | (20.61) |
Total from investment operations | 2.09 | (1.30) | 6.07 | 7.10 | (20.39) |
Distributions from net investment income | (.12) | (.20) | (.15) | (.07) | (.22) |
Distributions from net realized gain | (.08) | (.66) | (.70) | - | (3.88) |
Total distributions | (.20) | (.86) | (.85) | (.07) | (4.10) |
Redemption fees added to paid in capital B | - F | .01 | .01 | .01 | .01 |
Net asset value, end of period | $ 24.85 | $ 22.96 | $ 25.11 | $ 19.88 | $ 12.84 |
Total Return A | 9.22% | (5.44)% | 31.65% | 55.77% | (61.02)% |
Ratios to Average Net Assets C, E | | | | | |
Expenses before reductions | 1.28% | 1.14% | 1.07% | .90% | 1.22% |
Expenses net of fee waivers, if any | 1.28% | 1.13% | 1.07% | .90% | 1.22% |
Expenses net of all reductions | 1.26% | 1.10% | 1.03% | .85% | 1.17% |
Net investment income (loss) | 1.29% | .81% | .95% | 1.30% | .89% |
Supplemental Data | | | | | |
Net assets, end of period (000 omitted) | $ 581,254 | $ 722,453 | $ 836,913 | $ 609,209 | $ 392,393 |
Portfolio turnover rate D | 26% | 59% | 66% | 91% | 73% |
A Total returns would have been lower if certain expenses had not been reduced during the applicable periods shown. B Calculated based on average shares outstanding during the period. C Fees and expenses of any underlying Fidelity Central Funds are not included in the Fund's expense ratio. The Fund indirectly bears its proportionate share of the expenses of any underlying Fidelity Central Funds. D Amount does not include the portfolio activity of any underlying Fidelity Central Funds. E Expense ratios reflect operating expenses of the Fund. Expenses before reductions do not reflect amounts reimbursed by the investment adviser or reductions from brokerage service arrangements or reductions from other expense offset arrangements and do not represent the amount paid by the Fund during periods when reimbursements or reductions occur. Expenses net of fee waivers reflect expenses after reimbursement by the investment adviser but prior to reductions from brokerage service arrangements or other expense offset arrangements. Expenses net of all reductions represent the net expenses paid by the Fund. F Amount represents less than $.01 per share. |
See accompanying notes which are an integral part of the financial statements.
Annual Report
Notes to Financial Statements
For the period ended October 31, 2012
1. Organization.
Fidelity Pacific Basin Fund (the Fund) is a fund of Fidelity Investment Trust (the Trust) and is authorized to issue an unlimited number of shares. The Trust is registered under the Investment Company Act of 1940, as amended (the 1940 Act), as an open-end management investment company organized as a Massachusetts business trust. The Fund's investments in emerging markets can be subject to social, economic, regulatory, and political uncertainties and can be extremely volatile.
2. Investments in Fidelity Central Funds.
The Fund invests in Fidelity Central Funds, which are open-end investment companies available only to other investment companies and accounts managed by Fidelity Management & Research Company (FMR) and its affiliates. The Fund's Schedule of Investments lists each of the Fidelity Central Funds held as of period end, if any, as an investment of the Fund, but does not include the underlying holdings of each Fidelity Central Fund. As an Investing Fund, the Fund indirectly bears its proportionate share of the expenses of the underlying Fidelity Central Funds.
The Money Market Central Funds seek preservation of capital and current income and are managed by Fidelity Investments Money Management, Inc. (FIMM), an affiliate of FMR.
A complete unaudited list of holdings for each Fidelity Central Fund is available upon request or at the Securities and Exchange Commission (the SEC) web site at www.sec.gov. In addition, the financial statements of the Fidelity Central Funds, which are not covered by the Fund's Report of Independent Registered Public Accounting Firm, are available on the SEC web site or upon request.
3. Significant Accounting Policies.
The financial statements have been prepared in conformity with accounting principles generally accepted in the United States of America (GAAP), which require management to make certain estimates and assumptions at the date of the financial statements. Actual results could differ from those estimates. Subsequent events, if any, through the date that the financial statements were issued have been evaluated in the preparation of the financial statements. The following summarizes the significant accounting policies of the Fund:
Security Valuation. Investments are valued as of 4:00 p.m. Eastern time on the last calendar day of the period. In accordance with valuation policies and procedures approved by the Board of Trustees (the Board), the Fund attempts to obtain prices from one or more third party pricing vendors or brokers to value its investments. When current market prices, quotations or rates are not readily available or reliable, securities will be fair valued in good faith by the FMR Fair Value Committee (the Committee), in accordance with procedures adopted by the Fund's Board. Factors used in determining fair value vary by security type and may include market or security specific events. The frequency with which these procedures are used cannot be predicted and they may be utilized to a significant extent. The Committee oversees the Fund's valuation policies and procedures and is responsible for approving and reporting to the Board all fair value determinations.
The Fund categorizes the inputs to valuation techniques used to value its investments into a disclosure hierarchy consisting of three levels as shown below:
Level 1 - quoted prices in active markets for identical investments
Level 2 - other significant observable inputs (including quoted prices for similar investments, interest rates, prepayment speeds, etc.)
Level 3 - unobservable inputs (including the Fund's own assumptions based on the best information available)
Valuation techniques used to value the Fund's investments by major category are as follows:
Equity securities, including restricted securities, for which market quotations are readily available, are valued at the last reported sale price or official closing price as reported by a third party pricing vendor on the primary market or exchange on which they are traded and are categorized as Level 1 in the hierarchy. In the event there were no sales during the day or closing prices are not available, securities are valued at the last quoted bid price or may be valued using the last available price and are generally categorized as Level 2 in the hierarchy. For foreign equity securities, when significant market or security specific events arise, comparisons to the valuation of American Depositary Receipts (ADRs), futures contracts, Exchange-Traded Funds (ETFs) and certain indexes as well as quoted prices for similar securities are used and are categorized as Level 2 in the hierarchy. Utilizing these techniques may result in transfers between Level 1 and Level 2.
Investments in open-end mutual funds, including the Fidelity Central Funds, are valued at their closing net asset value (NAV) each business day and are categorized as Level 1 in the hierarchy.
Changes in valuation techniques may result in transfers in or out of an assigned level within the disclosure hierarchy. The aggregate value of investments by input level, as of October 31, 2012, including information on transfers between Levels 1 and 2, is included at the end of the Fund's Schedule of Investments.
Annual Report
Notes to Financial Statements - continued
3. Significant Accounting Policies - continued
Foreign Currency Translation. The Fund may use foreign currency contracts to facilitate transactions in foreign-denominated securities. Gains and losses from these transactions may arise from changes in the value of the foreign currency or if the counterparties do not perform under the contracts' terms.
Foreign-denominated assets, including investment securities, and liabilities are translated into U.S. dollars at the exchange rates at period end. Purchases and sales of investment securities, income and dividends received and expenses denominated in foreign currencies are translated into U.S. dollars at the exchange rate in effect on the transaction date.
The effects of exchange rate fluctuations on investments are included with the net realized and unrealized gain (loss) on investment securities. Other foreign currency transactions resulting in realized and unrealized gain (loss) are disclosed separately.
Investment Transactions and Income. For financial reporting purposes, the Fund's investment holdings and NAV include trades executed through the end of the last business day of the period. The NAV per share for processing shareholder transactions is calculated as of the close of business of the New York Stock Exchange (NYSE), normally 4:00 p.m. Eastern time and includes trades executed through the end of the prior business day. Gains and losses on securities sold are determined on the basis of identified cost. Dividend income is recorded on the ex-dividend date, except for certain dividends from foreign securities where the ex-dividend date may have passed, which are recorded as soon as the Fund is informed of the ex-dividend date. Non-cash dividends included in dividend income, if any, are recorded at the fair market value of the securities received. Distributions received on securities that represent a return of capital or capital gain are recorded as a reduction of cost of investments and/or as a realized gain. The Fund estimates the components of distributions received that may be considered return of capital distributions or capital gain distributions. Interest income and distributions from the Fidelity Central Funds are accrued as earned. Interest income includes coupon interest and amortization of premium and accretion of discount on debt securities. Investment income is recorded net of foreign taxes withheld where recovery of such taxes is uncertain.
Expenses. Expenses directly attributable to a fund are charged to that fund. Expenses attributable to more than one fund are allocated among the respective funds on the basis of relative net assets or other appropriate methods. Expense estimates are accrued in the period to which they relate and adjustments are made when actual amounts are known.
Income Tax Information and Distributions to Shareholders. Each year, the Fund intends to qualify as a regulated investment company under Subchapter M of the Internal Revenue Code, including distributing substantially all of its taxable income and realized gains. As a result, no provision for income taxes is required. As of October 31, 2012, the Fund did not have any unrecognized tax benefits in the financial statements; nor is the Fund aware of any tax positions for which it is reasonably possible that the total amounts of unrecognized tax benefits will significantly change in the next twelve months. The Fund files a U.S. federal tax return, in addition to state and local tax returns as required. A fund's federal income tax returns are subject to examination by the Internal Revenue Service (IRS) for a period of three fiscal years after they are filed. State and local tax returns may be subject to examination for an additional fiscal year depending on the jurisdiction. Foreign taxes are provided for based on the Fund's understanding of the tax rules and rates that exist in the foreign markets in which it invests. The Fund is subject to a tax imposed on capital gains by certain countries in which it invests. An estimated deferred tax liability for net unrealized appreciation on the applicable securities is included in Other payables and accrued expenses on the Statement of Assets & Liabilities.
Distributions are declared and recorded on the ex-dividend date. Income and capital gain distributions are determined in accordance with income tax regulations, which may differ from GAAP. In addition, the Fund claimed a portion of the payment made to redeeming shareholders as a distribution for income tax purposes.
Capital accounts within the financial statements are adjusted for permanent book-tax differences. These adjustments have no impact on net assets or the results of operations. Temporary book-tax differences will reverse in a subsequent period.
Book-tax differences are primarily due to foreign currency transactions, certain foreign taxes, passive foreign investment companies (PFIC), deferred trustees compensation, capital loss carryfowards and losses deferred due to wash sales.
The federal tax cost of investment securities and unrealized appreciation (depreciation) as of period end were as follows:
Gross unrealized appreciation | $ 139,232,833 |
Gross unrealized depreciation | (93,134,182) |
Net unrealized appreciation (depreciation) on securities and other investments | $ 46,098,651 |
| |
Tax Cost | $ 553,139,175 |
Annual Report
3. Significant Accounting Policies - continued
Income Tax Information and Distributions to Shareholders - continued
The tax-based components of distributable earnings as of period end were as follows:
Undistributed ordinary income | $ 17,311,351 |
Capital loss carryforward | $ (13,806,649) |
Net unrealized appreciation (depreciation) | $ 46,063,084 |
Capital loss carryforwards are only available to offset future capital gains of the Fund to the extent provided by regulations and may be limited. Under the Regulated Investment Company Modernization Act of 2010 (the Act), the Fund is permitted to carry forward capital losses incurred in taxable years beginning after December 22, 2010 for an unlimited period and such capital losses are required to be used prior to any losses that expire. Capital loss carryforwards were as follows:
Fiscal year of expiration | |
2017 | $ (13,028,843) |
No expiration | |
Short-term | (777,806) |
Total capital loss carryforward | $ (13,806,649) |
The tax character of distributions paid was as follows:
| October 31, 2012 | October 31, 2011 |
Ordinary Income | $ 5,980,390 | $ 29,235,594 |
Short-Term Trading (Redemption) Fees. Shares held by investors in the Fund less than 90 days are subject to a redemption fee equal to 1.50% of the net asset value of shares redeemed. All redemption fees, which reduce the proceeds of the shareholder redemption, are retained by the Fund and accounted for as an addition to paid in capital.
New Accounting Pronouncement. In December 2011, the Financial Accounting Standards Board issued Accounting Standard Update No. 2011-11, Disclosures about Offsetting Assets and Liabilities. The update creates new disclosure requirements requiring entities to disclose both gross and net information for derivatives and other financial instruments that are either offset in the Statement of Assets and Liabilities or subject to an enforceable master netting arrangement or similar agreement. The disclosure requirements are effective for annual reporting periods beginning on or after January 1, 2013, and interim periods within those annual periods. Management is currently evaluating the impact of the update's adoption on the Fund's financial statement disclosures.
4. Purchases and Sales of Investments.
Purchases and sales of securities, other than short-term securities, aggregated $162,655,706 and $347,764,382, respectively.
5. Fees and Other Transactions with Affiliates.
Management Fee. FMR and its affiliates provide the Fund with investment management related services for which the Fund pays a monthly management fee. The management fee is the sum of an individual fund fee rate that is based on an annual rate of .45% of the Fund's average net assets and an annualized group fee rate that averaged .26% during the period. The group fee rate is based upon the average net assets of all the mutual funds advised by FMR. The group fee rate decreases as assets under management increase and increases as assets under management decrease. In addition, the management fee is subject to a performance adjustment (up to a maximum of ± .20% of the Fund's average net assets over a 36 month performance period). The upward or downward adjustment to the management fee is based on the Fund's relative investment performance as compared to an appropriate benchmark index. For the period, the total annual management fee rate, including the performance adjustment, was .94% of the Fund's average net assets.
Transfer Agent Fees. Fidelity Investments Institutional Operations Company, Inc. (FIIOC), an affiliate of FMR, is the Fund's transfer, dividend disbursing and shareholder servicing agent. FIIOC receives account fees and asset-based fees that vary according to account size and type of account. FIIOC pays for typesetting, printing and mailing of shareholder reports, except proxy statements. For the period, the transfer agent fees were equivalent to an annual rate of .22% of average net assets.
Annual Report
Notes to Financial Statements - continued
5. Fees and Other Transactions with Affiliates - continued
Accounting and Security Lending Fees. Fidelity Service Company, Inc.(FSC),an affiliate of FMR, maintains the Fund's accounting records. The fee is based on the level of average net assets for each month. Under a separate contract, FSC administers the security lending program. The security lending fee is based on the number and duration of lending transactions.
Brokerage Commissions. The Fund placed a portion of its portfolio transactions with brokerage firms which are affiliates of the investment adviser. The commissions paid to these affiliated firms were $263 for the period.
Interfund Lending Program. Pursuant to an Exemptive Order issued by the SEC, the Fund, along with other registered investment companies having management contracts with FMR, may participate in an interfund lending program. This program provides an alternative credit facility allowing the funds to borrow from, or lend money to, other participating affiliated funds. At period end, there were no interfund loans outstanding. The Fund's activity in this program during the period for which loans were outstanding was as follows:
Borrower or Lender | Average Loan
Balance | Weighted Average Interest Rate | Interest
Expense |
Borrower | $ 9,235,900 | .32% | $ 826 |
6. Committed Line of Credit.
The Fund participates with other funds managed by FMR or an affiliate in a $4.25 billion credit facility (the "line of credit") to be utilized for temporary or emergency purposes to fund shareholder redemptions or for other short-term liquidity purposes. The Fund has agreed to pay commitment fees on its pro-rata portion of the line of credit, which amounted to $1,729 and is reflected in Miscellaneous expenses on the Statement of Operations. During the period, there were no borrowings on this line of credit.
7. Security Lending.
The Fund lends portfolio securities through a lending agent from time to time in order to earn additional income. For equity securities, a lending agent is used and may loan securities to certain qualified borrowers, including Fidelity Capital Markets (FCM), a broker-dealer affiliated with the Fund. On the settlement date of the loan, the Fund receives collateral (in the form of U.S. Treasury obligations, letters of credit and/or cash) against the loaned securities and maintains collateral in an amount not less than 100% of the market value of the loaned securities during the period of the loan. The market value of the loaned securities is determined at the close of business of the Fund and any additional required collateral is delivered to the Fund on the next business day. If the borrower defaults on its obligation to return the securities loaned because of insolvency or other reasons, a fund could experience delays and costs in recovering the securities loaned or in gaining access to the collateral. Any cash collateral received is invested in the Fidelity Securities Lending Cash Central Fund. The value of loaned securities and cash collateral at period end are disclosed on the Fund's Statement of Assets and Liabilities. The value of securities loaned to FCM at period end was $301,828. Security lending income represents the income earned on investing cash collateral, less rebates paid to borrowers and any lending agent fees associated with the loan, plus any premium payments received for lending certain types of securities. Security lending income is presented in the Statement of Operations as a component of income from Fidelity Central Funds, and includes $22,166 from securities loaned to FCM.
8. Bank Borrowings.
The Fund is permitted to have bank borrowings for temporary or emergency purposes to fund shareholder redemptions or for other short-term liquidity requirements. The Fund has established borrowing arrangements with certain banks. The interest rate on the borrowings is the bank's base rate, as revised from time to time. The average loan balance during the period for which loans were outstanding amounted to $3,752,250. The weighted average interest rate was .57%. The interest expense amounted to $239 under the bank borrowing program. At period end, there were no bank borrowings outstanding.
9. Expense Reductions.
Many of the brokers with whom FMR places trades on behalf of the Fund provided services to the Fund in addition to trade execution. These services included payments of certain expenses on behalf of the Fund totaling $97,881 for the period.
10. Other.
The Fund's organizational documents provide former and current trustees and officers with a limited indemnification against liabilities arising in connection with the performance of their duties to the Fund. In the normal course of business, the Fund may also enter into contracts that provide general indemnifications. The Fund's maximum exposure under these arrangements is unknown as this would be dependent on future claims that may be made against the Fund. The risk of material loss from such claims is considered remote.
Annual Report
Report of Independent Registered Public Accounting Firm
To the Trustees of Fidelity Investment Trust and the Shareholders of:
Fidelity Canada Fund,
Fidelity China Region Fund,
Fidelity Emerging Asia Fund,
Fidelity Emerging Markets Fund,
Fidelity Europe Fund,
Fidelity Japan Fund,
Fidelity Japan Smaller Companies Fund,
Fidelity Latin America Fund,
Fidelity Nordic Fund,
Fidelity Pacific Basin Fund
In our opinion, the accompanying statements of assets and liabilities, including the schedules of investments, and the related statements of operations and of changes in net assets and the financial highlights present fairly, in all material respects, the financial position of Fidelity Canada Fund, Fidelity China Region Fund, Fidelity Emerging Asia Fund, Fidelity Emerging Markets Fund, Fidelity Europe Fund, Fidelity Japan Fund, Fidelity Japan Smaller Companies Fund, Fidelity Latin America Fund, Fidelity Nordic Fund and Fidelity Pacific Basin Fund (each a fund of Fidelity Investment Trust) at October 31, 2012, the results of their operations for the year then ended, the changes in their net assets for each of the two years in the period then ended and the financial highlights for each of the periods indicated, in conformity with accounting principles generally accepted in the United States of America. These financial statements and financial highlights (hereafter referred to as "financial statements") are the responsibility of the Fidelity Investment Trust's management. Our responsibility is to express an opinion on these financial statements based on our audits. We conducted our audits of these financial statements in accordance with the standards of the Public Company Accounting Oversight Board (United States). Those standards require that we plan and perform the audit to obtain reasonable assurance about whether the financial statements are free of material misstatement. An audit includes examining, on a test basis, evidence supporting the amounts and disclosures in the financial statements, assessing the accounting principles used and significant estimates made by management, and evaluating the overall financial statement presentation. We believe that our audits, which included confirmation of securities at October 31, 2012 by correspondence with the custodian and brokers, provide a reasonable basis for our opinion.
PricewaterhouseCoopers LLP
Boston, Massachusetts
December 18, 2012
Annual Report
Report of Independent Registered Public Accounting Firm
To the Trustees of Fidelity Investment Trust and Shareholders of Fidelity Europe Capital Appreciation Fund:
We have audited the accompanying statement of assets and liabilities of Fidelity Europe Capital Appreciation Fund (the Fund), a fund of Fidelity Investment Trust, including the schedule of investments, as of October 31, 2012, and the related statement of operations for the year then ended, the statement of changes in net assets for each of the two years in the period then ended, and the financial highlights for each of the five years in the period then ended. These financial statements and financial highlights are the responsibility of the Fund's management. Our responsibility is to express an opinion on these financial statements and financial highlights based on our audits.
We conducted our audits in accordance with the standards of the Public Company Accounting Oversight Board (United States). Those standards require that we plan and perform the audit to obtain reasonable assurance about whether the financial statements and financial highlights are free of material misstatement. The Fund is not required to have, nor were we engaged to perform, an audit of its internal control over financial reporting. Our audits included consideration of internal control over financial reporting as a basis for designing audit procedures that are appropriate in the circumstances, but not for the purpose of expressing an opinion on the effectiveness of the Fund's internal control over financial reporting. Accordingly, we express no such opinion. An audit also includes examining, on a test basis, evidence supporting the amounts and disclosures in the financial statements, assessing the accounting principles used and significant estimates made by management, as well as evaluating the overall financial statement presentation. Our procedures included confirmation of securities owned as of October 31, 2012, by correspondence with the custodians and brokers; where replies were not received from brokers, we performed other auditing procedures. We believe that our audits provide a reasonable basis for our opinion.
In our opinion, the financial statements and financial highlights referred to above present fairly, in all material respects, the financial position of Fidelity Europe Capital Appreciation Fund as of October 31, 2012, the results of its operations for the year then ended, the changes in its net assets for each of the two years in the period then ended, and the financial highlights for each of the five years in the period then ended, in conformity with accounting principles generally accepted in the United States of America.
DELOITTE & TOUCHE LLP
Boston, Massachusetts
December 18, 2012
Annual Report
The Trustees, Members of the Advisory Board, and executive officers of the trust and funds, as applicable, are listed below. The Board of Trustees governs each fund and is responsible for protecting the interests of shareholders. The Trustees are experienced executives who meet periodically throughout the year to oversee each fund's activities, review contractual arrangements with companies that provide services to each fund, oversee management of the risks associated with such activities and contractual arrangements, and review each fund's performance. Except for James C. Curvey, each of the Trustees oversees 236 funds advised by FMR or an affiliate. Mr. Curvey oversees 443 funds advised by FMR or an affiliate.
The Trustees hold office without limit in time except that (a) any Trustee may resign; (b) any Trustee may be removed by written instrument, signed by at least two-thirds of the number of Trustees prior to such removal; (c) any Trustee who requests to be retired or who has become incapacitated by illness or injury may be retired by written instrument signed by a majority of the other Trustees; and (d) any Trustee may be removed at any special meeting of shareholders by a two-thirds vote of the outstanding voting securities of the trust. Each Trustee who is not an interested person (as defined in the 1940 Act) (Independent Trustee), shall retire not later than the last day of the calendar year in which his or her 75th birthday occurs. The Independent Trustees may waive this mandatory retirement age policy with respect to individual Trustees. The executive officers and Advisory Board Members hold office without limit in time, except that any officer and Advisory Board Member may resign or may be removed by a vote of a majority of the Trustees at any regular meeting or any special meeting of the Trustees. Except as indicated, each individual has held the office shown or other offices in the same company for the past five years.
Experience, Skills, Attributes, and Qualifications of the Funds' Trustees. The Governance and Nominating Committee has adopted a statement of policy that describes the experience, qualifications, attributes, and skills that are necessary and desirable for potential Independent Trustee candidates (Statement of Policy). The Board believes that each Trustee satisfied at the time he or she was initially elected or appointed a Trustee, and continues to satisfy, the standards contemplated by the Statement of Policy. The Governance and Nominating Committee also engages professional search firms to help identify potential Independent Trustee candidates who have the experience, qualifications, attributes, and skills consistent with the Statement of Policy. From time to time, additional criteria based on the composition and skills of the current Independent Trustees, as well as experience or skills that may be appropriate in light of future changes to board composition, business conditions, and regulatory or other developments, have also been considered by the professional search firms and the Governance and Nominating Committee. In addition, the Board takes into account the Trustees' commitment and participation in Board and committee meetings, as well as their leadership of standing and ad hoc committees throughout their tenure.
In determining that a particular Trustee was and continues to be qualified to serve as a Trustee, the Board has considered a variety of criteria, none of which, in isolation, was controlling. The Board believes that, collectively, the Trustees have balanced and diverse experience, qualifications, attributes, and skills, which allow the Board to operate effectively in governing each fund and protecting the interests of shareholders. Information about the specific experience, skills, attributes, and qualifications of each Trustee, which in each case led to the Board's conclusion that the Trustee should serve (or continue to serve) as a trustee of the funds, is provided below.
Board Structure and Oversight Function. James C. Curvey is an interested person (as defined in the 1940 Act) and currently serves as Chairman. The Trustees have determined that an interested Chairman is appropriate and benefits shareholders because an interested Chairman has a personal and professional stake in the quality and continuity of services provided to the funds. Independent Trustees exercise their informed business judgment to appoint an individual of their choosing to serve as Chairman, regardless of whether the Trustee happens to be independent or a member of management. The Independent Trustees have determined that they can act independently and effectively without having an Independent Trustee serve as Chairman and that a key structural component for assuring that they are in a position to do so is for the Independent Trustees to constitute a substantial majority for the Board. The Independent Trustees also regularly meet in executive session. Ned C. Lautenbach serves as Chairman of the Independent Trustees and as such (i) acts as a liaison between the Independent Trustees and management with respect to matters important to the Independent Trustees and (ii) with management prepares agendas for Board meetings.
Fidelity funds are overseen by different Boards of Trustees. The funds' Board oversees Fidelity's equity and high income funds and another Board oversees Fidelity's investment-grade bond, money market, and asset allocation funds. The asset allocation funds may invest in Fidelity funds overseen by the funds' Board. The use of separate Boards, each with its own committee structure, allows the Trustees of each group of Fidelity funds to focus on the unique issues of the funds they oversee, including common research, investment, and operational issues. On occasion, the separate Boards establish joint committees to address issues of overlapping consequences for the Fidelity funds overseen by each Board.
The Trustees operate using a system of committees to facilitate the timely and efficient consideration of all matters of importance to the Trustees, each fund, and fund shareholders and to facilitate compliance with legal and regulatory requirements and oversight of the funds' activities and associated risks. The Board, acting through its committees, has charged FMR and its affiliates with (i) identifying events or circumstances the occurrence of which could have demonstrably adverse effects on the funds' business and/or reputation; (ii) implementing processes and controls to lessen the possibility that such events or circumstances occur or to mitigate the effects of such events or circumstances if they do occur; and (iii) creating and maintaining a system designed to evaluate continuously business and market conditions in order to facilitate the identification and implementation processes described in (i) and (ii) above. Because the day-to-day operations and activities of the funds are carried out by or through FMR, its affiliates and other service providers, the funds' exposure to risks is mitigated but not eliminated by the processes overseen by the Trustees. While each of the Board's committees has responsibility for overseeing different aspects of the funds' activities, oversight is exercised primarily through the Operations, Audit, and Compliance Committees. In addition, the Independent Trustees have worked with FMR to enhance the Board's oversight of investment and financial risks, legal and regulatory risks, technology risks, and operational risks, including the development of additional risk reporting to the Board. For example, a working group comprised of Independent Trustees and FMR has worked and continues to work to review the Fidelity funds' valuation-related activities, reporting and risk management. Appropriate personnel, including but not limited to the funds' Chief Compliance Officer (CCO), FMR's internal auditor, the independent accountants, the funds' Treasurer and portfolio management personnel, make periodic reports to the Board's committees, as appropriate, including an annual review of FMR's risk management program for the Fidelity funds. The responsibilities of each standing committee, including their oversight responsibilities, are described further under "Standing Committees of the Funds' Trustees."
Annual Report
Trustees and Officers - continued
The funds' Statement of Additional Information (SAI) includes more information about the Trustees. To request a free copy, call Fidelity at 1-800-544-8544.
Interested Trustees*:
Correspondence intended for each Trustee who is an interested person may be sent to Fidelity Investments, 82 Devonshire Street, Boston, Massachusetts 02109.
Name, Age; Principal Occupations and Other Relevant Experience+ |
James C. Curvey (77) |
| Year of Election or Appointment: 2007 Mr. Curvey is Trustee and Chairman of the Board of Trustees of certain Trusts. Mr. Curvey also serves as Trustee (2007-present) of other investment companies advised by FMR. Mr. Curvey is a Director of Fidelity Investments Money Management, Inc. (2009-present), Director of Fidelity Research & Analysis Co. (2009-present) and Director of FMR and FMR Co., Inc. (2007-present). Mr. Curvey is also Vice Chairman (2007-present) and Director of FMR LLC. In addition, Mr. Curvey serves as an Overseer for the Boston Symphony Orchestra and a member of the Trustees of Villanova University. Previously, Mr. Curvey was the Vice Chairman (2006-2007) and Director (2000-2007) of FMR Corp. |
Ronald P. O'Hanley (55) |
| Year of Election or Appointment: 2011 Mr. O'Hanley is Director of FMR Co., Inc. (2010-present), Director of Fidelity Investments Money Management, Inc. (2010-present), Director of Fidelity Research & Analysis Company (2010-present), President of Fidelity Asset Management and Corporate Services and a member of Fidelity's Executive Committee (2010-present). Previously, Mr. O'Hanley served as President and Chief Executive Officer of BNY Mellon Asset Management (2007-2010). Mr. O'Hanley also served as Vice Chairman of Bank New York Mellon Corp. and a member of that firm's Executive Committee. Prior to the 2007 merger of The Bank of New York and Mellon Financial Corporation, he was Vice Chairman of Mellon Financial Corporation and President and Chief Executive Officer of Mellon Asset Management. He joined Mellon in February 1997. Mr. O'Hanley currently serves as Chairman of the Boston Public Library Foundation Board of Directors and sits on the Board of Directors of Beth Israel Deaconess Medical Center, the Board of Trustees of the Marine Biological Laboratory and the Advisory Board of the Maxwell School of Citizenship and Public Administration at Syracuse University. Mr. O'Hanley also chairs the Council on Asset Management for the Financial Services Roundtable and is a member of the Board of Directors of Institutional Investor's U.S. Institute. |
* Trustees have been determined to be "Interested Trustees" by virtue of, among other things, their affiliation with the trust or various entities under common control with FMR.
+ The information above includes each Trustee's principal occupation during the last five years and other information relating to the experience, attributes, and skills relevant to each Trustee's qualifications to serve as a Trustee, which led to the conclusion that each Trustee should serve as a Trustee for each fund.
Independent Trustees:
Correspondence intended for each Independent Trustee (that is, the Trustees other than the Interested Trustees) may be sent to Fidelity Investments, P.O. Box 55235, Boston, Massachusetts 02205-5235.
Name, Age; Principal Occupations and Other Relevant Experience+ |
Dennis J. Dirks (64) |
| Year of Election or Appointment: 2005 Prior to his retirement in May 2003, Mr. Dirks was Chief Operating Officer and a member of the Board of The Depository Trust & Clearing Corporation (DTCC). He also served as President, Chief Operating Officer, and Board member of The Depository Trust Company (DTC) and President and Board member of the National Securities Clearing Corporation (NSCC). In addition, Mr. Dirks served as Chief Executive Officer and Board member of the Government Securities Clearing Corporation, Chief Executive Officer and Board member of the Mortgage-Backed Securities Clearing Corporation, as a Trustee and a member of the Finance Committee of Manhattan College (2005-2008), and as a Trustee and a member of the Finance Committee of AHRC of Nassau County (2006-2008). Mr. Dirks is a member of the Independent Directors Council (IDC) Governing Council (2010-present) and Board of Directors for The Brookville Center for Children's Services, Inc. (2009-present). |
Alan J. Lacy (59) |
| Year of Election or Appointment: 2008 Mr. Lacy serves as Senior Adviser (2007-present) of Oak Hill Capital Partners, L.P. (private equity). Mr. Lacy also served as Chief Executive Officer (2000-2005) and Vice Chairman (2005-2006) of Sears Holdings Corporation and Sears, Roebuck and Co. (retail). In addition, Mr. Lacy serves as a member of the Board of Directors of Dave & Buster's Entertainment, Inc. (restaurant and entertainment complexes, 2010-present), Earth Fare, Inc. (retail grocery, 2012-present), The Hillman Companies, Inc. (hardware wholesalers, 2010-present), and Bristol-Myers Squibb Company (global pharmaceuticals, 2008-present). Mr. Lacy is a member of the Board of Trustees of The National Parks Conservation Association (2006-present). Previously, Mr. Lacy served as Chairman of the Board of Trustees of the National Parks Conservation Association (2008-2011) and as a member of the Board of Directors for the Western Union Company (global money transfer, 2006-2011). |
Ned C. Lautenbach (68) |
| Year of Election or Appointment: 2000 Mr. Lautenbach is Chairman of the Independent Trustees of the Equity and High Income Funds (2006-present). Mr. Lautenbach currently serves as the Lead Director of the Eaton Corporation Board of Directors (diversified industrial, 1997-present). Mr. Lautenbach is Chairman of the Board of Directors of the Philharmonic Center for the Arts in Naples, Florida (2012-present) and a member of the Council on Foreign Relations (1994-present). Previously, Mr. Lautenbach was a Partner/Advisory Partner at Clayton, Dubilier & Rice, LLC (private equity investment, 1998-2010), as well as a Director of Sony Corporation (2006-2007). |
Joseph Mauriello (68) |
| Year of Election or Appointment: 2008 Prior to his retirement in January 2006, Mr. Mauriello served in numerous senior management positions including Deputy Chairman and Chief Operating Officer (2004-2005), and Vice Chairman of Financial Services (2002-2004) of KPMG LLP US (professional services, 1965-2005). Mr. Mauriello currently serves as a member of the Board of Directors of XL Group plc. (global insurance and re-insurance, 2006-present). Previously, Mr. Mauriello served as a Director of the Hamilton Funds of the Bank of New York (2006-2007) and of Arcadia Resources Inc. (health care services and products, 2007-2012). |
Robert W. Selander (62) |
| Year of Election or Appointment: 2011 Previously, Mr. Selander served as a Member of the Advisory Board of Fidelity's Equity and High Income Funds (2011), Executive Vice Chairman (2010), Chief Executive Officer (2009-2010), and President and Chief Executive Officer (1997-2009) of Mastercard, Inc. |
Cornelia M. Small (68) |
| Year of Election or Appointment: 2005 Ms. Small is a member of the Board of Directors (2009-present) and Chair of the Investment Committee (2010-present) of the Teagle Foundation. Ms. Small also serves on the Investment Committee of the Berkshire Taconic Community Foundation (2008-present). Previously, Ms. Small served as Chairperson (2002-2008) and a member of the Investment Committee and Chairperson (2008-2012) and a member of the Board of Trustees of Smith College. In addition, Ms. Small served as Chief Investment Officer, Director of Global Equity Investments, and a member of the Board of Directors of Scudder, Stevens & Clark and Scudder Kemper Investments. |
William S. Stavropoulos (73) |
| Year of Election or Appointment: 2001 Mr. Stavropoulos is Vice Chairman of the Independent Trustees of the Equity and High Income Funds (2006-present). Mr. Stavropoulos serves as President and Founder of the Michigan Baseball Foundation, the Great Lakes Loons (2007-present). Mr. Stavropoulos is Chairman Emeritus of the Board of Directors of The Dow Chemical Company, where he previously served in numerous senior management positions, including President, CEO (1995-2000; 2002-2004), Chairman of the Executive Committee (2000-2006), and as a member of the Board of Directors (1990-2006). Currently, Mr. Stavropoulos is a Director of Univar Inc. (global distributor of commodity and specialty chemicals, Chairman from 2010-May 2012 and Lead Director from May 2012-present), Teradata Corporation (data warehousing and technology solutions, 2008-present), Maersk Inc. (industrial conglomerate), and Tyco International, Ltd. (multinational manufacturing and services, 2007-present), and a member of the Advisory Board for Metalmark Capital LLC (private equity investment, 2005-present). Mr. Stavropoulos is an operating advisor to Clayton, Dubilier & Rice, LLC (private equity investment). In addition, Mr. Stavropoulos is a member of the University of Notre Dame Advisory Council for the College of Science, a Trustee of the Rollin L. Gerstacker Foundation, and a Director of the Naples Philharmonic Center for the Arts. Previously, Mr. Stavropoulos served as a Director of Chemical Financial Corporation (bank holding company, 1993-2012). |
David M. Thomas (63) |
| Year of Election or Appointment: 2008 Previously, Mr. Thomas served as Executive Chairman (2005-2006) and Chairman and Chief Executive Officer (2000-2005) of IMS Health, Inc. (pharmaceutical and healthcare information solutions), and a Director of Fortune Brands, Inc. (consumer products, 2000-2011). In addition, Mr. Thomas serves as Non-Executive Chairman of the Board of Directors of Fortune Brands Home and Security (home and security products, 2011-present), and as a member of the Board of Directors of Interpublic Group of Companies, Inc. (marketing communication, 2004-present). |
Michael E. Wiley (62) |
| Year of Election or Appointment: 2008 Mr. Wiley also serves as a Director of Asia Pacific Exploration Consolidated (international oil and gas exploration and production, 2008-present). Mr. Wiley serves as a Director of Tesoro Corporation (independent oil refiner and marketer, 2005-present), and a Director of Bill Barrett Corporation (exploration and production, 2005-present). In addition, Mr. Wiley also serves as a Director of Post Oak Bank (privately-held bank, 2004-present). Previously, Mr. Wiley served as a member of the Board of Trustees of the University of Tulsa (2000-2006; 2007-2010), as a Senior Energy Advisor of Katzenbach Partners, LLC (consulting, 2006-2007), as an Advisory Director of Riverstone Holdings (private investment), Chairman, President, and CEO of Baker Hughes, Inc. (oilfield services, 2000-2004), and as Director of Spinnaker Exploration Company (exploration and production, 2001-2005). |
+ The information above includes each Trustee's principal occupation during the last five years and other information relating to the experience, attributes, and skills relevant to each Trustee's qualifications to serve as a Trustee, which led to the conclusion that each Trustee should serve as a Trustee for each fund.
Advisory Board Members and Executive Officers:
Correspondence intended for David A. Rosow and Garnett A. Smith may be sent to Fidelity Investments, P.O. Box 55235, Boston, Massachusetts 02205-5235. Correspondence intended for each executive officer, Edward C. Johnson 3d, and Peter S. Lynch may be sent to Fidelity Investments, 82 Devonshire Street, Boston, Massachusetts 02109.
Name, Age; Principal Occupation |
Edward C. Johnson 3d (82) |
| Year of Election or Appointment: 2011 Member of the Advisory Board of Fidelity's Equity and High Income Funds. Mr. Johnson serves as Chief Executive Officer, Chairman, and a Director of FMR LLC, and also serves as Chairman and Director of FIL Limited. Previously, Mr. Johnson served as a Trustee and Chairman of the Board of certain Fidelity Trusts, Chairman and a Director of FMR, Chairman and a Director of FMR Co., Inc., and President of FMR LLC (2006-2007). |
Peter S. Lynch (68) |
| Year of Election or Appointment: 2003 Member of the Advisory Board of Fidelity's Equity and High Income Funds. Mr. Lynch is Vice Chairman and a Director of FMR and FMR Co., Inc. In addition, Mr. Lynch serves as a Trustee of Boston College and as the Chairman of the Inner-City Scholarship Fund. Previously, Mr. Lynch served on the Special Olympics International Board of Directors (1997-2006). |
David A. Rosow (70) |
| Year of Election or Appointment: 2012 Member of the Advisory Board of Fidelity's Equity and High Income Funds. Chairman and Chief Executive Officer of International Golf Group, Inc. (golf course development, 1989-present). Previously, Mr. Rosow served as Chairman and Chief Executive Officer of Rosow & Company, Inc. (private investment company, 1989-2011), a Lead Director of Hudson United Bancorp (2001-2006) and as a Director of TD Banknorth (1996-2006). In addition, Mr. Rosow is a member (2008-present) and President (2009-present) of the Town Council of Palm Beach, Florida. |
Garnett A. Smith (65) |
| Year of Election or Appointment: 2012 Member of the Advisory Board of Fidelity's Equity and High Income Funds. Prior to Mr. Smith's retirement, he served as Chairman and Chief Executive Officer of Inbrand Corp. (manufacturer of personal absorbent products, 1990-1997). He also served as President (1986-1990) of Inbrand Corp. Prior to his employment with Inbrand Corp., he was employed by a retail fabric chain and North Carolina National Bank. In addition, Mr. Smith is a board member of the Jackson Hole Land Trust (2009-present). |
Kenneth B. Robins (43) |
| Year of Election or Appointment: 2008 President and Treasurer of Fidelity's Equity and High Income Funds. Mr. Robins also serves as President and Treasurer (2010-present) and Assistant Treasurer (2009-present) of other Fidelity funds and is an employee of Fidelity Investments (2004-present). Previously, Mr. Robins served as Deputy Treasurer of the Fidelity funds (2005-2008) and Treasurer and Chief Financial Officer of The North Carolina Capital Management Trust: Cash and Term Portfolios (2006-2008). |
Bruce T. Herring (47) |
| Year of Election or Appointment: 2006 Vice President of certain Equity Funds. Mr. Herring also serves as President of Fidelity Research & Analysis Company (2010-present), Chief Investment Officer and Director of Fidelity Management & Research (U.K.) Inc. (2010-present) and Group Chief Investment Officer of FMR. Previously, Mr. Herring served as Vice President (2005-2006) and Senior Vice President (2006-2007) of Fidelity Management & Research Company, Vice President of FMR Co., Inc. (2001-2007) and as a portfolio manager for Fidelity U.S. Equity Funds. |
Brian B. Hogan (48) |
| Year of Election or Appointment: 2009 Vice President of Equity and High Income Funds. Mr. Hogan also serves as President of FMR's Equity Division (2009-present). Previously, Mr. Hogan served as Senior Vice President, Equity Research of FMR (2006-2009) and as a portfolio manager. |
Scott C. Goebel (44) |
| Year of Election or Appointment: 2008 Secretary and Chief Legal Officer (CLO) of the Fidelity funds. Mr. Goebel also serves as Secretary of Fidelity Investments Money Management, Inc. (FIMM) (2010-present) and Fidelity Research and Analysis Company (FRAC) (2010-present); Secretary and CLO of The North Carolina Capital Management Trust: Cash and Term Portfolios (2008-present); General Counsel, Secretary, and Senior Vice President of FMR (2008-present) and FMR Co., Inc. (2008-present); employed by FMR LLC or an affiliate (2001-present); Chief Legal Officer of Fidelity Management & Research (Hong Kong) Limited (2008-present) and Assistant Secretary of Fidelity Management & Research (Japan) Inc. (2008-present), and Fidelity Management & Research (U.K.) Inc. (2008-present). Previously, Mr. Goebel served as Assistant Secretary of FIMM (2008-2010), FRAC (2008-2010), and the Funds (2007-2008) and as Vice President and Secretary of Fidelity Distributors Corporation (FDC) (2005-2007). |
William C. Coffey (43) |
| Year of Election or Appointment: 2009 Assistant Secretary of Fidelity's Equity and High Income Funds. Mr. Coffey also serves as Senior Vice President and Deputy General Counsel of FMR LLC (2010-present), and is an employee of Fidelity Investments. Previously, Mr. Coffey served as Vice President and Associate General Counsel of FMR LLC (2005-2009). |
Elizabeth Paige Baumann (44) |
| Year of Election or Appointment: 2012 Anti-Money Laundering (AML) Officer of the Fidelity funds. Ms. Baumann also serves as AML Officer of The North Carolina Capital Management Trust: Cash and Term Portfolios (2012-present), Chief AML Officer of FMR LLC (2012-present), and is an employee of Fidelity Investments. Previously, Ms. Baumann served as Vice President and Deputy Anti-Money Laundering Officer (2007-2012). |
Christine Reynolds (54) |
| Year of Election or Appointment: 2008 Chief Financial Officer of the Fidelity funds. Ms. Reynolds became President of Fidelity Pricing and Cash Management Services (FPCMS) in August 2008. Ms. Reynolds served as Chief Operating Officer of FPCMS (2007-2008). Previously, Ms. Reynolds served as President, Treasurer, and Anti-Money Laundering officer of the Fidelity funds (2004-2007). |
Joseph A. Hanlon (44) |
| Year of Election or Appointment: 2012 Chief Compliance Officer of Fidelity's Equity and High Income Funds. Mr. Hanlon serves as Compliance Officer of FMR, FMR Co., Inc., Fidelity Investments Money Management, Inc. (FIMM), Fidelity Research and Analysis Company (FRAC), Fidelity Management & Research (Japan) Inc., Fidelity Management & Research (U.K.) Inc., Fidelity Management & Research (Hong Kong), and Strategic Advisers, Inc. (2009-present), as Senior Vice President of the Fidelity Asset Management Division (2009-present), and is an employee of Fidelity Investments. |
Joseph F. Zambello (55) |
| Year of Election or Appointment: 2011 Deputy Treasurer of the Fidelity funds. Mr. Zambello is an employee of Fidelity Investments. Previously, Mr. Zambello served as Vice President of FMR's Program Management Group (2009-2011) and Vice President of the Transfer Agent Oversight Group (2005-2009). |
Adrien E. Deberghes (45) |
| Year of Election or Appointment: 2008 Deputy Treasurer of Fidelity's Equity and High Income Funds. Mr. Deberghes also serves as Vice President (2011-present) and Assistant Treasurer (2010-present) of other Fidelity funds, and is an employee of Fidelity Investments (2008-present). Previously, Mr. Deberghes served as Senior Vice President of Mutual Fund Administration at State Street Corporation (2007-2008), Senior Director of Mutual Fund Administration at Investors Bank & Trust (2005-2007), and Director of Finance for Dunkin' Brands (2000-2005). |
Stephen Sadoski (41) |
| Year of Election or Appointment: 2012 Deputy Treasurer of Fidelity's Equity and High Income Funds.Mr. Sadoski also serves as Assistant Treasurer of other Fidelity funds (2012-present) and is an employee of Fidelity Investments (2012-present). Previously, Mr. Sadoski served as an assistant chief accountant in the Division of Investment Management of the Securities and ExchangeCommission (SEC) (2009-2012) and as a senior manager at Deloitte & Touche (1997-2009). |
Stephanie J. Dorsey (43) |
| Year of Election or Appointment: 2010 Assistant Treasurer of Fidelity's Equity and High Income Funds. Ms. Dorsey also serves as Deputy Treasurer of other Fidelity funds (2008-present) and is an employee of Fidelity Investments (2008-present). Previously, Ms. Dorsey served as Treasurer (2004-2008) of the JPMorgan Mutual Funds and Vice President (2004-2008) of JPMorgan Chase Bank. |
John R. Hebble (54) |
| Year of Election or Appointment: 2009 Assistant Treasurer of Fidelity's Equity and High Income Funds. Mr. Hebble also serves as President (2011-present), Treasurer, and Chief Financial Officer of The North Carolina Capital Management Trust: Cash and Term Portfolios (2008-present), President and Treasurer of other Fidelity funds (2008-present) and is an employee of Fidelity Investments. |
Gary W. Ryan (54) |
| Year of Election or Appointment: 2005 Assistant Treasurer of the Fidelity funds. Mr. Ryan is an employee of Fidelity Investments. Previously, Mr. Ryan served as Vice President of Fund Reporting in Fidelity Pricing and Cash Management Services (FPCMS) (1999-2005). |
Jonathan Davis (44) |
| Year of Election or Appointment: 2010 Assistant Treasurer of the Fidelity funds. Mr. Davis is also Assistant Treasurer of Fidelity Rutland Square Trust II and Fidelity Commonwealth Trust II. Mr. Davis is an employee of Fidelity Investments. Previously, Mr. Davis served as Vice President and Associate General Counsel of FMR LLC (2003-2010). |
Annual Report
The Board of Trustees of each fund voted to pay to shareholders of record at the opening of business on record date, the following distributions per share derived from capital gains realized from sales of portfolio securities, and dividends derived from net investment income:
| Pay Date | Record Date | Dividends | Capital Gains |
Fidelity Canada Fund | 12/10/12 | 12/07/12 | $0.757 | - |
Fidelity China Region Fund | 12/10/12 | 12/07/12 | $0.430 | - |
Fidelity Emerging Markets Fund | 12/10/12 | 12/07/12 | $0.293 | - |
Fidelity Europe Fund | 12/10/12 | 12/07/12 | $0.700 | $0.012 |
Fidelity Europe Capital Appreciation Fund | 12/10/12 | 12/07/12 | $0.409 | - |
Fidelity Japan Fund | 12/10/12 | 12/07/12 | $0.148 | $0.079 |
Fidelity Japan Smaller Companies Fund | 12/10/12 | 12/07/12 | $0.074 | $0.149 |
Fidelity Latin America Fund | 12/10/12 | 12/07/12 | $0.976 | $3.450 |
Fidelity Nordic Fund | 12/10/12 | 12/07/12 | $0.630 | - |
Fidelity Pacific Basin Fund | 12/10/12 | 12/07/12 | $0.293 | $0.466 |
Fidelity Emerging Asia Fund | 12/10/12 | 12/07/12 | $0.456 | $0.081 |
The funds hereby designate as capital gain dividend the amounts noted below for the taxable year ended October 31, 2012, or, if subsequently determined to be different, the net capital gain of such year.
Fidelity Latin America Fund | $198,275,480 |
A percentage of the dividends distributed during the fiscal year for the following funds qualifies for the dividends-received deduction for corporate shareholders:
| December 2, 2011 | December 28, 2011 |
Fidelity Canada Fund | 2% | - |
Fidelity China Region Fund | - | - |
Fidelity Emerging Markets Fund | 2% | - |
Fidelity Europe Fund | - | - |
Fidelity Europe Capital Appreciation Fund | 1% | - |
Fidelity Japan Fund | - | - |
Fidelity Japan Smaller Companies Fund | - | - |
Fidelity Latin America Fund | 1% | 4% |
Fidelity Nordic Fund | - | - |
Fidelity Pacific Basin Fund | - | - |
Fidelity Emerging Asia Fund | - | - |
A percentage of the dividends distributed during the fiscal year for the following funds may be taken into account as a dividend for purposes of the maximum rate under section 1(h)(11) of the Internal Revenue Code.
| December 2, 2011 | December 9, 2011 | December 28, 2011 |
Fidelity Canada Fund | 90% | - | - |
Fidelity China Region Fund | 67% | - | - |
Fidelity Emerging Markets Fund | 100% | - | - |
Fidelity Europe Fund | 100% | - | - |
Fidelity Europe Capital Appreciation Fund | 100% | - | - |
Fidelity Japan Fund | - | 100% | - |
Fidelity Japan Smaller Companies Fund | 100% | - | - |
Fidelity Latin America Fund | 91% | - | 65% |
Fidelity Nordic Fund | 62% | - | - |
Fidelity Pacific Basin Fund | 94% | - | 52% |
Fidelity Emerging Asia Fund | 67% | - | - |
Annual Report
Distributions (Unaudited) - continued
The amounts per share which represent income derived from sources within, and taxes paid to, foreign countries or possessions of the United States are as follows:
Fund | Pay Date | Income | Taxes |
Fidelity Canada Fund | 12/05/2011 | $0.759 | $0.1110 |
Fidelity China Region Fund | 12/05/2011 | $0.373 | $0.0863 |
Fidelity Emerging Markets Fund | 12/05/2011 | $0.364 | $0.0618 |
Fidelity Europe Fund | 12/05/2011 | $0.506 | $0.0490 |
Fidelity Europe Capital Appreciation Fund | 12/05/2011 | $0.303 | $0.0354 |
Fidelity Japan Fund | 12/12/2011 | $0.114 | $0.0181 |
Fidelity Japan Smaller Companies Fund | 12/05/2011 | $0.083 | $0.0121 |
Fidelity Latin America Fund | 12/05/2011 | $0.987 | $0.1806 |
| 12/29/2011 | $0.015 | - |
Fidelity Nordic Fund | 12/05/2011 | $0.691 | $0.0823 |
Fidelity Pacific Basin Fund | 12/05/2011 | $0.224 | $0.0365 |
| 12/29/2011 | $0.015 | - |
Fidelity Emerging Asia Fund | 12/05/2011 | $0.594 | $0.0846 |
The fund will notify shareholders in January 2013 of amounts for use in preparing 2012 income tax returns.
Annual Report
Board Approval of Investment Advisory Contracts and Management Fees
Targeted International Equity Funds
Each year, the Board of Trustees, including the Independent Trustees (together, the Board), votes on the renewal of the management contract and sub-advisory agreements (together, the Advisory Contracts) for each fund. The Board, assisted by the advice of fund counsel and Independent Trustees' counsel, requests and considers a broad range of information relevant to the renewal of the Advisory Contracts throughout the year.
The Board meets regularly and, at each of its meetings, considers factors that are relevant to its annual consideration of the renewal of each fund's Advisory Contracts, including the services and support provided to each fund and its shareholders. The Board has established various standing committees, each composed of and chaired by Independent Trustees with varying backgrounds, to which the Board has assigned specific subject matter responsibilities in order to enhance effective decision-making by the Board. The Board, acting directly and through its Committees, requests and receives information concerning the annual consideration of the renewal of each fund's Advisory Contracts. The Board also meets as needed to consider matters specifically related to the Board's annual consideration of the renewal of Advisory Contracts. Members of the Board may also meet with trustees of other Fidelity funds through ad hoc joint committees to discuss certain matters relevant to the Fidelity funds.
At its July 2012 meeting, the Board of Trustees, including the Independent Trustees, unanimously determined to renew each fund's Advisory Contracts. In reaching its determination, the Board considered all factors it believed relevant, including (i) the nature, extent, and quality of the services to be provided to each fund and its shareholders (including the investment performance of each fund); (ii) the competitiveness of each fund's management fee and total expense ratio relative to peer funds; (iii) the total costs of the services to be provided by and the profits to be realized by Fidelity from its relationship with each fund; (iv) the extent to which economies of scale exist and would be realized as each fund grows; and (v) whether fee levels reflect these economies of scale, if any, for the benefit of fund shareholders.
In considering whether to renew the Advisory Contracts for each fund, the Board reached a determination, with the assistance of fund counsel and Independent Trustees' counsel and through the exercise of its business judgment, that the renewal of the Advisory Contracts is in the best interests of each fund and its shareholders and that the compensation payable under the Advisory Contracts is fair and reasonable. The Board's decision to renew the Advisory Contracts was not based on any single factor, but rather was based on a comprehensive consideration of all the information provided to the Board at its meetings throughout the year. The Board, in reaching its determination to renew the Advisory Contracts, is aware that shareholders in each fund have a broad range of investment choices available to them, including a wide choice among mutual funds offered by Fidelity's competitors, and that each fund's shareholders, who have the opportunity to review and weigh the disclosure provided by the fund in its prospectus and other public disclosures, have chosen to invest in that fund, managed by Fidelity.
Nature, Extent, and Quality of Services Provided. The Board considered the staffing within the investment adviser, FMR, and the sub-advisers (together, the Investment Advisers), including the backgrounds of the funds' investment personnel, and also considered the funds' investment objectives, strategies, and related investment philosophies. The Independent Trustees also had discussions with senior management of Fidelity's investment operations and investment groups. The Board considered the structure of the portfolio manager compensation program and whether this structure provides appropriate incentives to act in the best interests of each fund.
Resources Dedicated to Investment Management and Support Services. The Board and the Fund Oversight and Research Committees reviewed the general qualifications and capabilities of the Investment Advisers' investment staff, including its size, education, experience, and resources, as well as the Investment Advisers' approach to recruiting, training, managing, and compensating investment personnel. The Board also noted that FMR has continued to increase the resources devoted to non-U.S. offices, including expansion of Fidelity's global investment organization. The Board noted that Fidelity's analysts have extensive resources, tools and capabilities that allow them to conduct sophisticated quantitative and fundamental analysis, as well as credit analysis of issuers, counterparties and guarantors. The Board also believes that Fidelity's investment professionals have sufficient access to global information and data so as to provide competitive investment results over time, and that those professionals also have access to sophisticated tools that permit them to assess portfolio construction and risk and performance attribution characteristics continuously, as well as to transmit new information and research conclusions rapidly around the world. Additionally, in its deliberations, the Board considered the Investment Advisers' trading and risk management capabilities and resources, which are an integral part of the investment management process.
Shareholder and Administrative Services. The Board considered (i) the nature, extent, quality, and cost of advisory, administrative, and shareholder services performed by the Investment Advisers and their affiliates under the Advisory Contracts and under separate agreements covering transfer agency, pricing and bookkeeping, and securities lending services for each fund; (ii) the nature and extent of the supervision of third party service providers, principally custodians and subcustodians; and (iii) the resources devoted to, and the record of compliance with, each fund's compliance policies and procedures. The Board also reviewed the allocation of fund brokerage, including allocations to brokers affiliated with the Investment Advisers, the use of brokerage commissions to pay fund expenses, and the use of "soft" commission dollars to pay for research services.
The Board noted that the growth of fund assets over time across the complex allows Fidelity to reinvest in the development of services designed to enhance the value or convenience of the Fidelity funds as investment vehicles. These services include 24-hour access to account information and market information through telephone representatives and over the Internet, investor education materials and asset allocation tools, and the expanded availability of Fidelity Investor Centers.
Annual Report
Board Approval of Investment Advisory Contracts and Management Fees - continued
Investment in a Large Fund Family. The Board considered the benefits to shareholders of investing in a Fidelity fund, including the benefits of investing in a fund that is part of a large family of funds offering a variety of investment disciplines and providing a large variety of mutual fund investor services. The Board noted that Fidelity had taken, or had made recommendations that resulted in the Fidelity funds taking, a number of actions over the previous year that benefited particular funds, including (i) continuing to dedicate additional resources to investment research and support of the senior management team that oversees asset management; (ii) persisting in efforts to enhance Fidelity's research capabilities, in particular, international research; (iii) launching new funds and making other enhancements to meet client needs for global and income-oriented solutions; (iv) continuing to launch dedicated lower cost underlying funds to meet investment management's portfolio construction needs related to expanding underlying fund options, specifically for the Freedom Fund product lines; (v) adopting a "Stock Selector" sector neutral investment approach and employing a team of portfolio managers who are sector specialists to manage certain funds; (vi) rationalizing product lines and gaining increased efficiencies through the mergers of several funds into other funds; (vii) strengthening the Spartan Index Fund product line by adding new funds and/or new low-cost institutional share classes, restructuring fund expenses to accommodate new classes, and reducing investment minimums for certain classes of shares; (viii) modifying the eligibility criteria for Institutional Class shares to increase their appeal to government entities and charitable investors; and (ix) reducing certain transfer agent fee rates.
Investment Performance (Canada Fund, China Region Fund, Emerging Asia Fund, Japan Smaller Companies Fund, Latin America Fund, Nordic Fund, and Pacific Basin Fund). The Board considered whether each fund has operated in accordance with its investment objective, as well as its record of compliance with its investment restrictions. It also reviewed each fund's absolute investment performance (for each class, in the case of Canada Fund, China Region Fund, and Latin America Fund), as well as each fund's relative investment performance (for each class, in the case of Canada Fund, China Region Fund, and Latin America Fund) measured over multiple periods against a broad-based securities market index. The Board noted that FMR believes that no meaningful peer group exists for the funds principally because most other funds in each fund's third-party peer group have different and/or broader investment mandates than the fund's more specialized strategies.
For each of Canada Fund, China Region Fund, and Latin America Fund, the following charts considered by the Board show, over the one-, three-, and five-year periods ended December 31, 2011, as available, the cumulative total returns of the retail class and Class B of the fund and the cumulative total returns of a broad-based securities market index ("benchmark"). The returns of the retail class and Class B show the performance of the highest performing class (based on five-year performance) and the lowest performing class (based on three-year performance for Canada Fund and China Region Fund and one-year performance for Latin America Fund), respectively.
For each of Emerging Asia Fund, Japan Smaller Companies Fund, Nordic Fund, and Pacific Basin Fund, the following charts considered by the Board show, over the one-, three-, and five-year periods ended December 31, 2011, the fund's cumulative total returns and the cumulative total returns of a broad-based securities market index ("benchmark").
Fidelity Canada Fund

The Board noted that the investment performance of the fund was lower than its benchmark for all the periods shown. The Board considered that the variations in performance among the fund's classes reflect the variations in class expenses, which result in lower performance for higher expense classes. The Board discussed with FMR actions to improve the fund's below-benchmark performance. The Board noted that this fund had underperformed in the past and discussed with FMR its disappointment with the continued underperformance of the fund. The Board also reviewed the fund's performance since inception as well as performance in the current year. The Board will continue to closely monitor the performance of the fund in the coming year and discuss with FMR other appropriate actions to address the performance of the fund.
Annual Report
Fidelity China Region Fund
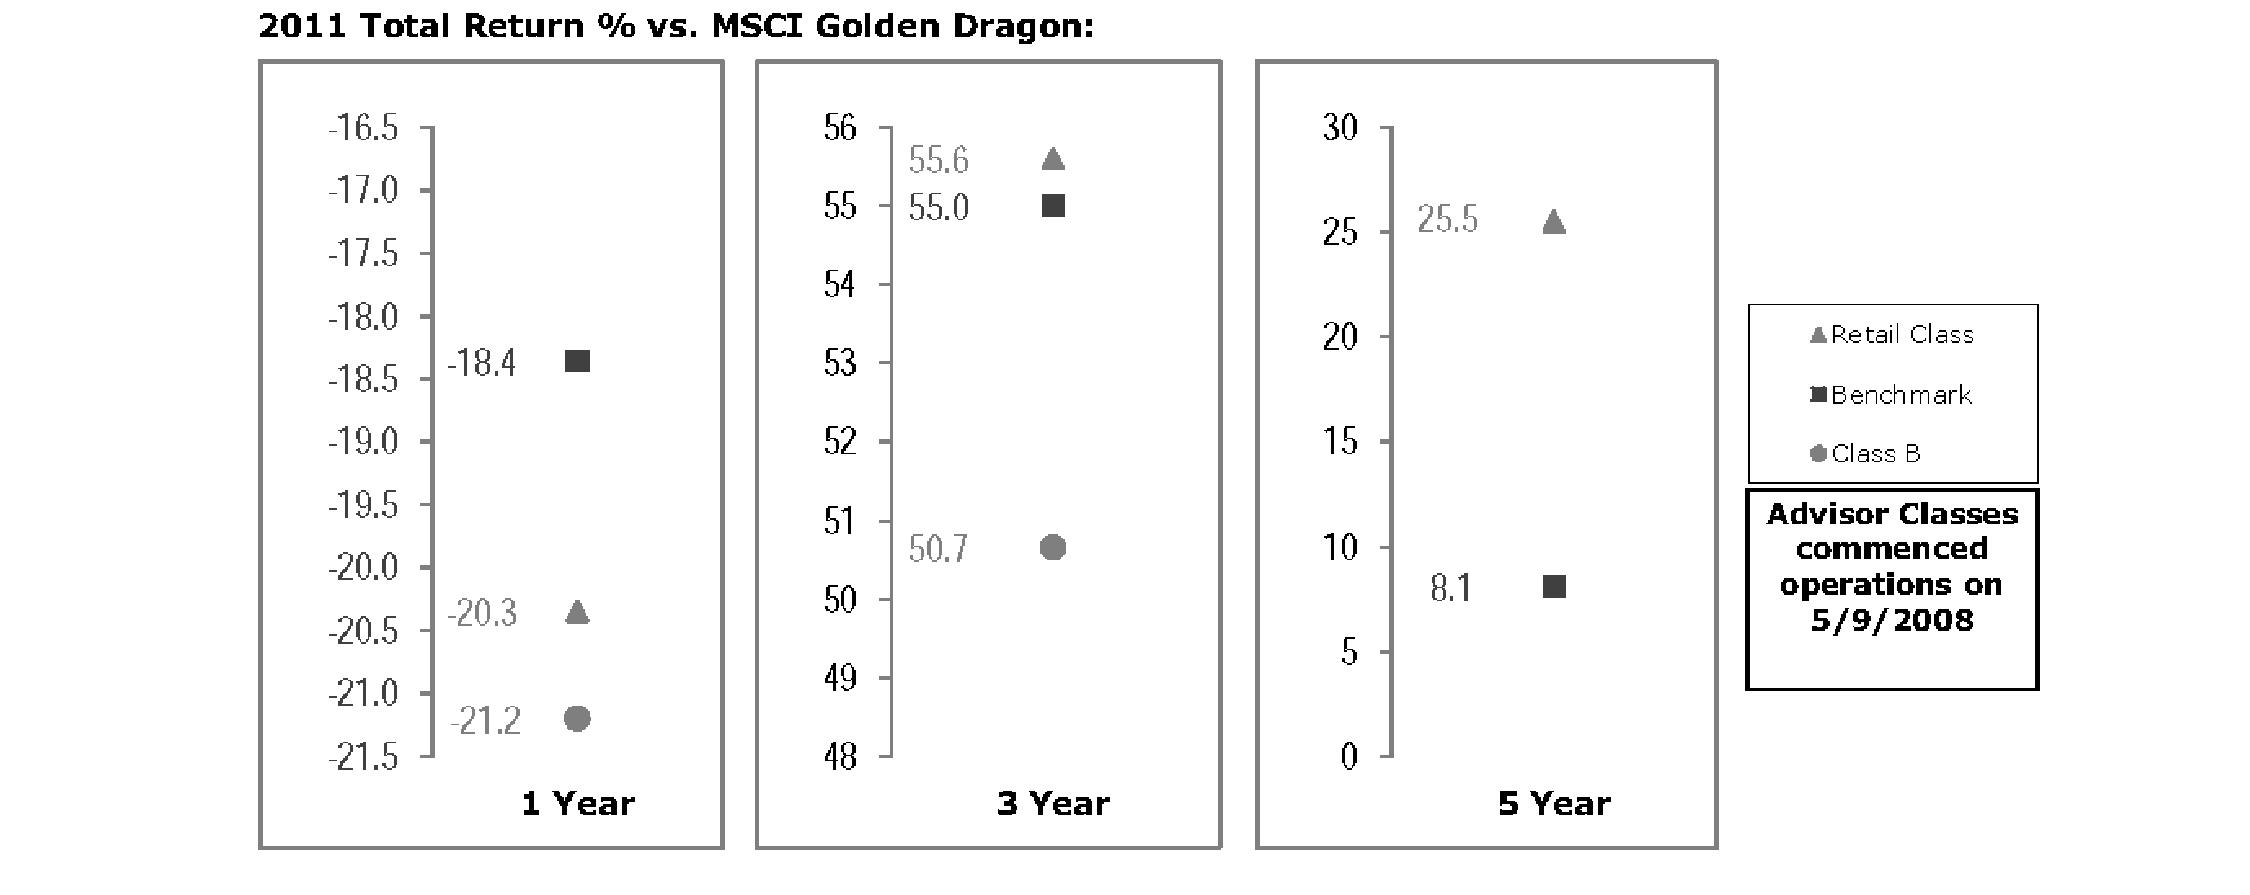
The Board noted that the investment performance of the retail class of the fund compared favorably to its benchmark for the three- and five-year periods, although the fund's one-year total return was lower than its benchmark. The Board considered that the variations in performance among the fund's classes reflect the variations in class expenses, which result in lower performance for higher expense classes. The Board noted that there was a portfolio management change for the fund in October 2011. The Board also reviewed the fund's performance since inception as well as performance in the current year.
Fidelity Emerging Asia Fund

The Board noted that the investment performance of the fund was lower than its benchmark for the three- and five-year periods, although the fund's one-year total return compared favorably to its benchmark. The Board also reviewed the fund's performance since inception as well as performance in the current year.
Annual Report
Board Approval of Investment Advisory Contracts and Management Fees - continued
Fidelity Japan Smaller Companies Fund
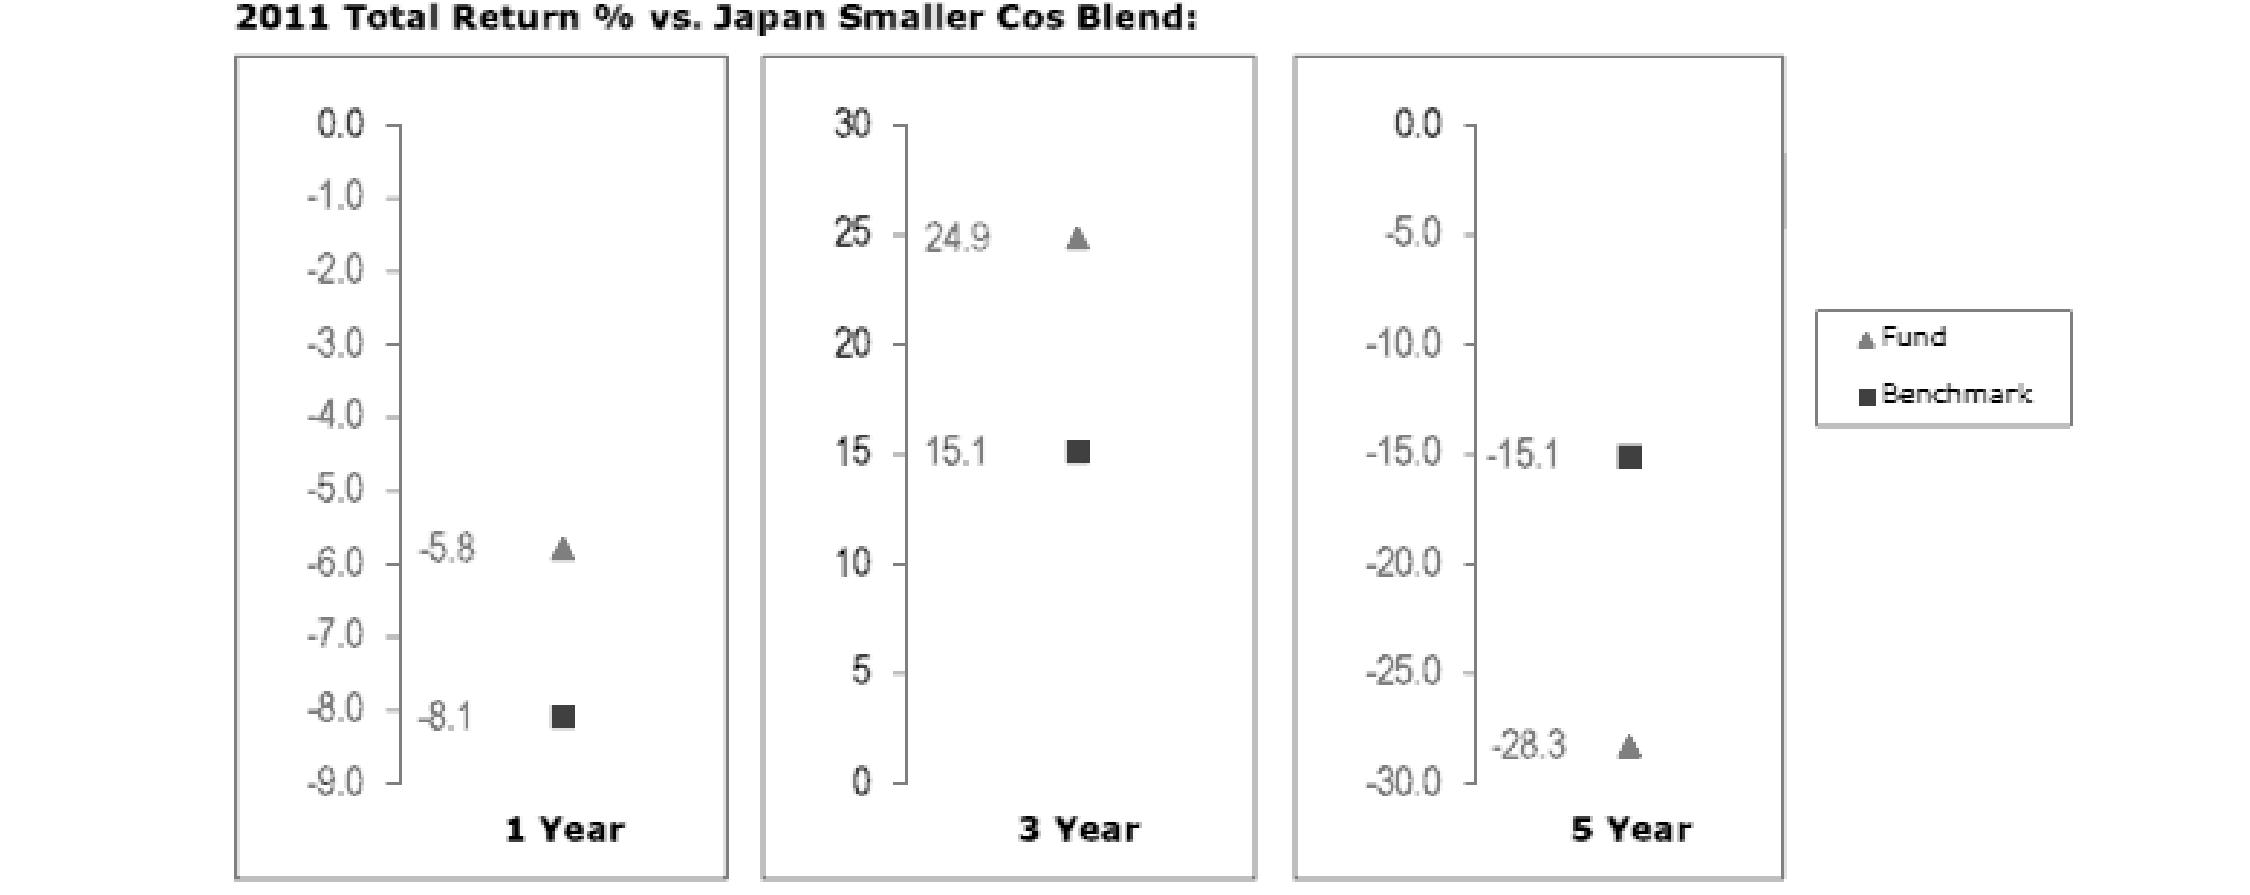
The Board noted that the investment performance of the fund compared favorably to its benchmark for the one- and three-year periods, although the fund's five-year cumulative total return was lower than its benchmark. The Board also reviewed the fund's performance since inception as well as performance in the current year.
Fidelity Latin America Fund

The Board noted that the investment performance of the fund was lower than its benchmark for the three- and five-year periods, although the one-year total return of the retail class compared favorably to its benchmark. The Board considered that the variations in performance among the fund's classes reflect the variations in class expenses, which result in lower performance for higher expense classes. The Board also reviewed the fund's performance since inception as well as performance in the current year.
Annual Report
Fidelity Nordic Fund
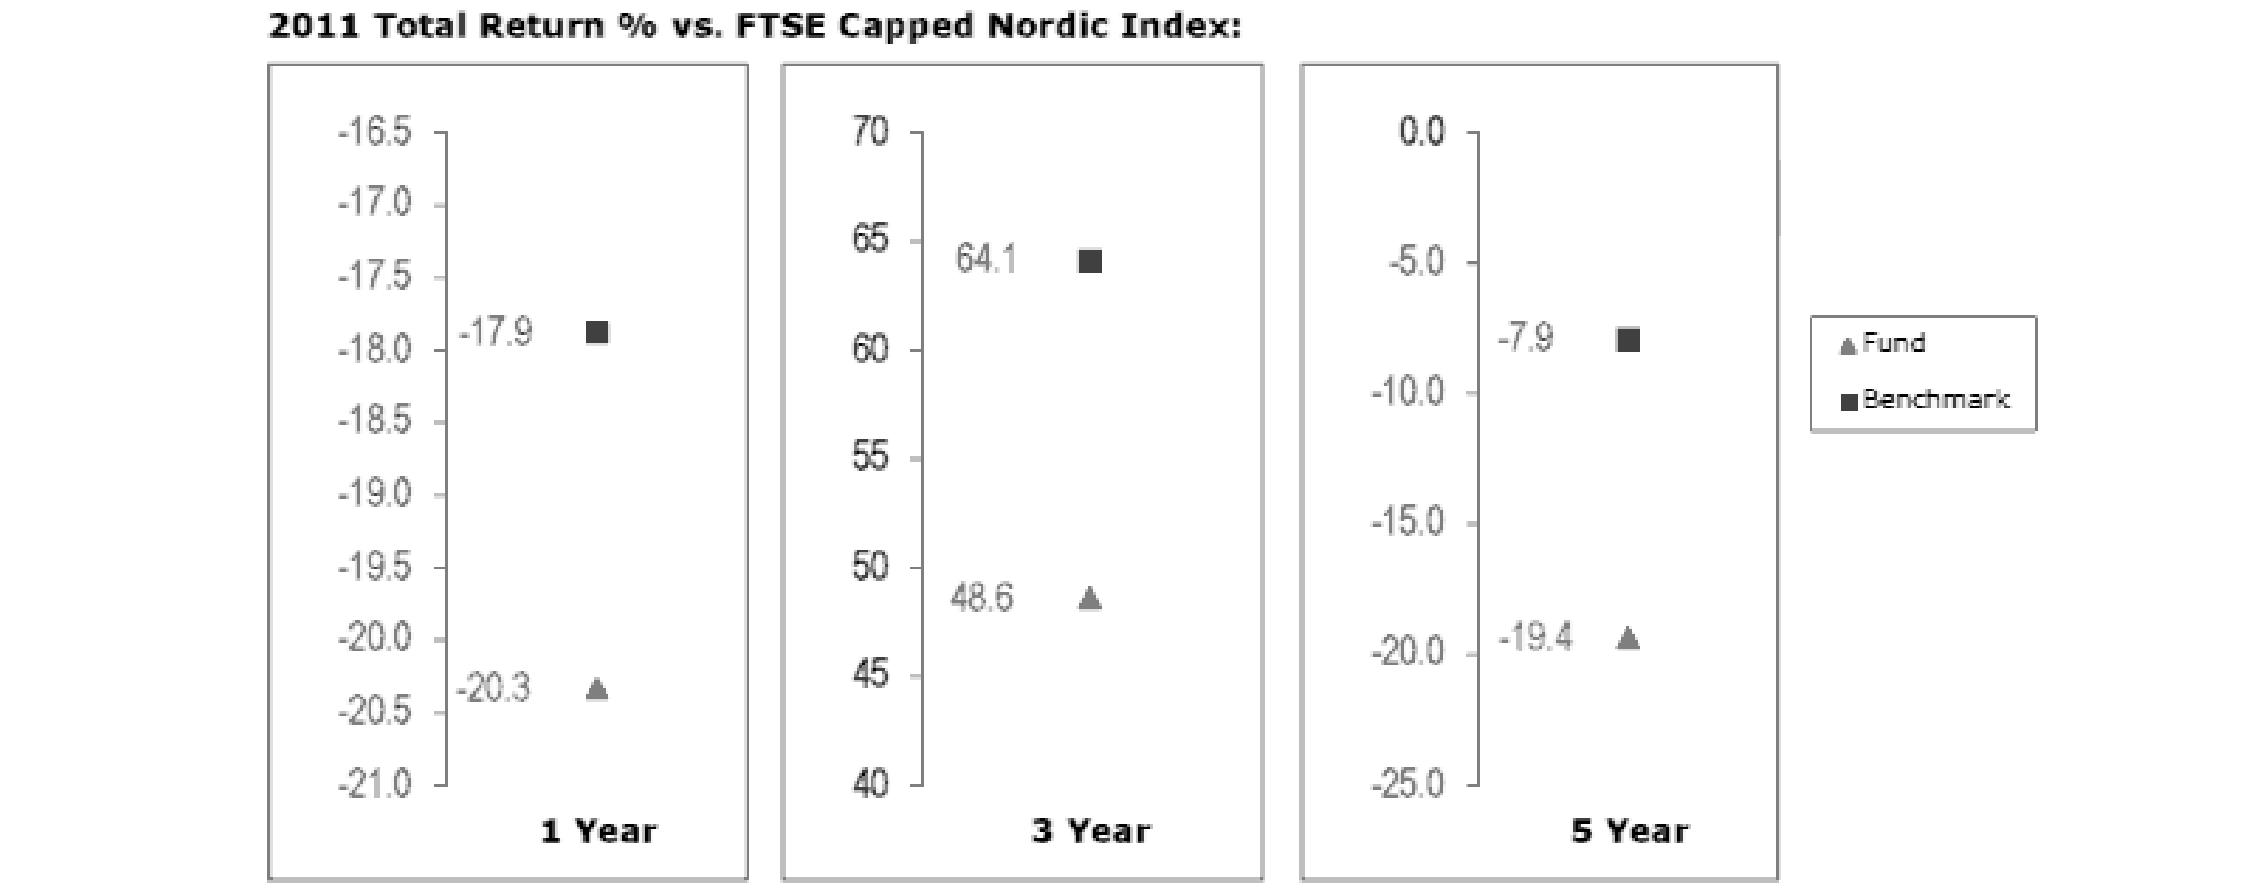
The Board noted that the investment performance of the fund was lower than its benchmark for all the periods shown. The Board discussed with FMR actions to improve the fund's below-benchmark performance. The Board noted that this fund had underperformed in the past and discussed with FMR its disappointment with the continued underperformance of the fund. The Board also reviewed the fund's performance since inception as well as performance in the current year. The Board will continue to closely monitor the performance of the fund in the coming year and discuss with FMR other appropriate actions to address the performance of the fund.
Fidelity Pacific Basin Fund
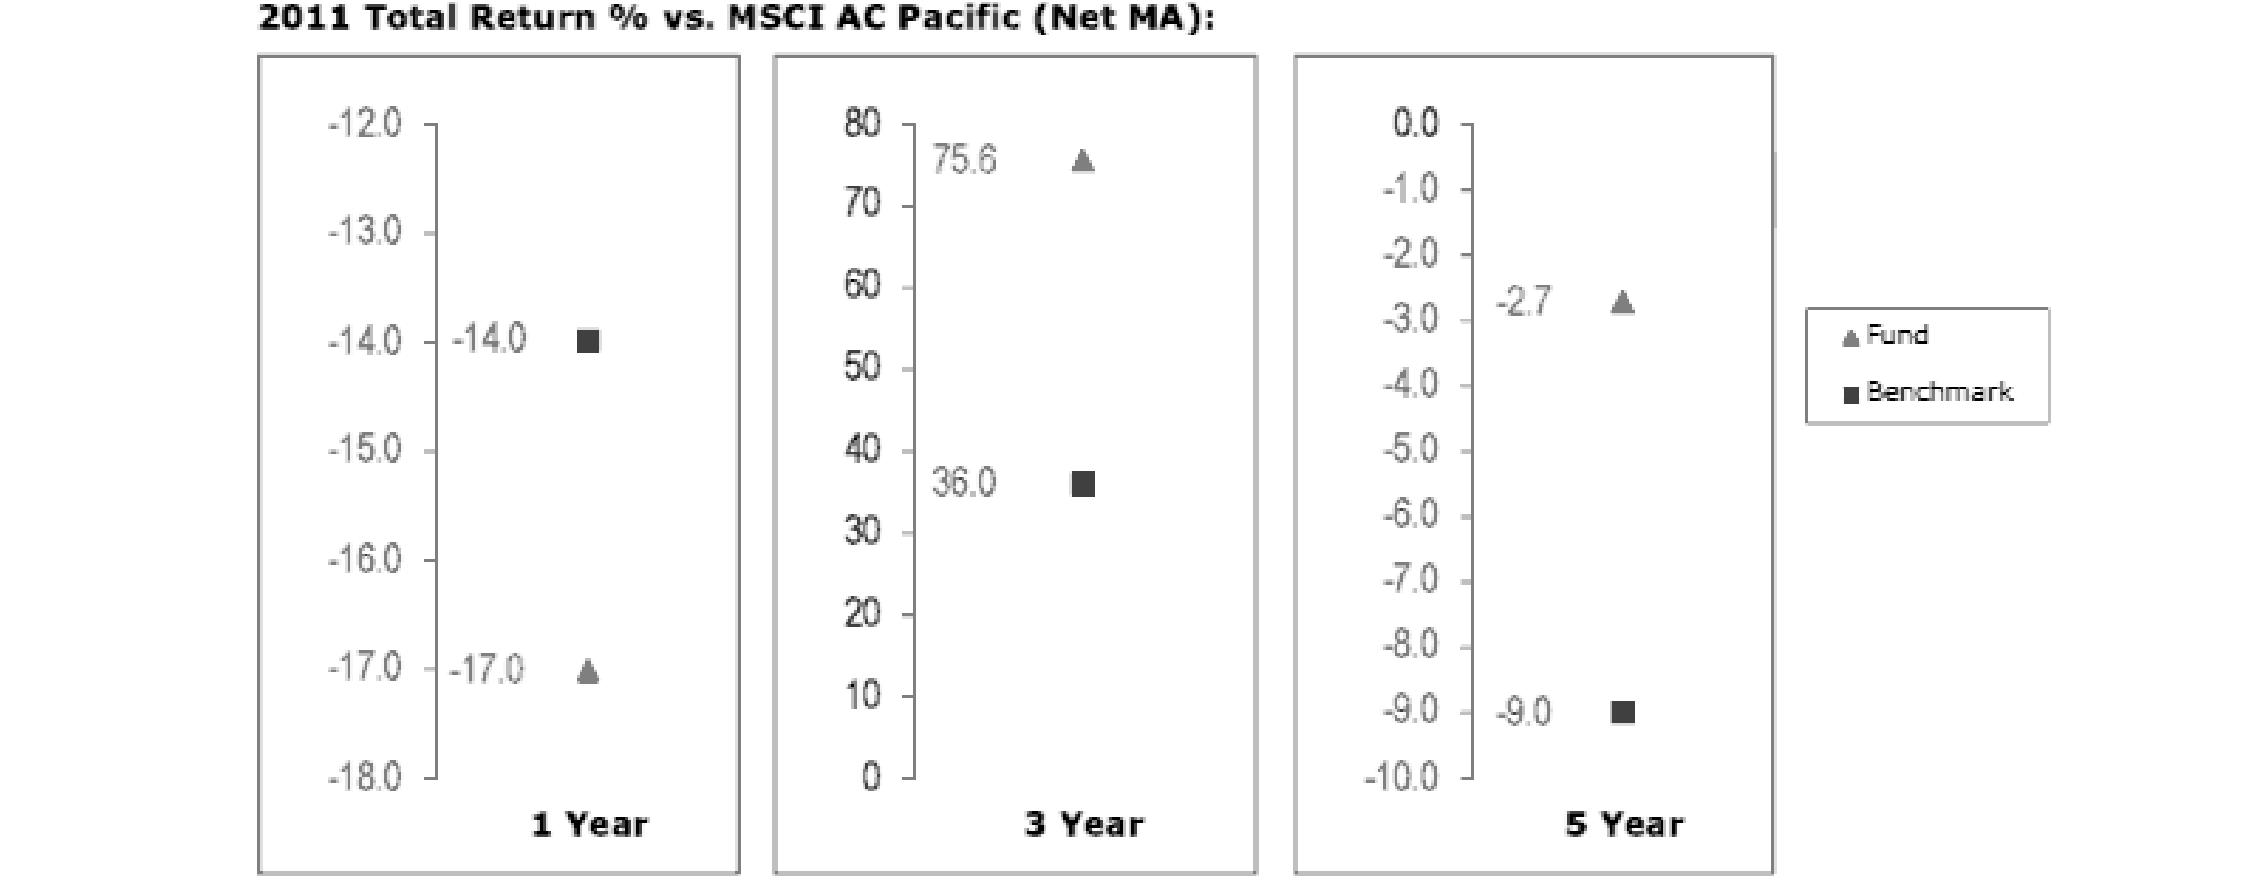
The Board noted that the investment performance of the fund compared favorably to its benchmark for the three- and five-year periods, although the fund's one-year total return was lower than its benchmark. The Board also reviewed the fund's performance since inception as well as performance in the current year.
The Board also considered that each of Canada Fund's, Emerging Asia Fund's, and Pacific Basin Fund's management fee is subject to upward or downward adjustment depending upon whether, and to what extent, the fund's investment performance for the performance period exceeds, or is exceeded by, the record (over the same period) of a Board-approved performance adjustment index. The Board noted that the performance adjustment provides FMR with a strong economic incentive to seek to achieve superior performance for each fund's shareholders and helps to more closely align the interests of FMR and each fund's shareholders.
Annual Report
Board Approval of Investment Advisory Contracts and Management Fees - continued
Based on its review, the Board concluded that the nature, extent, and quality of services provided to each fund under the Advisory Contracts should benefit each fund's shareholders.
Investment Performance (Emerging Markets Fund, Europe Fund, Europe Capital Appreciation Fund, and Japan Fund). The Board considered whether each fund has operated in accordance with its investment objective, as well as its record of compliance with its investment restrictions. It also reviewed each fund's absolute investment performance (for each class, in the case of Emerging Markets Fund and Japan Fund), as well as each fund's relative investment performance (for each class, in the case of Emerging Markets Fund and Japan Fund) measured over multiple periods against (i) a broad-based securities market index, and (ii) a peer group of mutual funds deemed appropriate by Fidelity and reviewed by the Board.
For Emerging Markets Fund, the following charts considered by the Board show, over the one-, three-, and five-year periods ended December 31, 2011, as available, the cumulative total returns of Class K and the retail class of the fund, the cumulative total returns of a broad-based securities market index ("benchmark"), and a range of cumulative total returns of a peer group of mutual funds identified by Morningstar, Inc. as having an investment style similar to that of the fund based on underlying portfolio holdings.
For each of Europe Fund and Europe Capital Appreciation Fund, the following charts considered by the Board show, over the one-, three-, and five-year periods ended December 31, 2011, the fund's cumulative total returns, the cumulative total returns of a broad-based securities market index ("benchmark"), and a range of cumulative total returns of a peer group of mutual funds identified by Morningstar, Inc. as having an investment style similar to that of the fund based on underlying portfolio holdings.
For Japan Fund, the following charts considered by the Board show, over the one-, three-, and five-year periods ended December 31, 2011, as available, the cumulative total returns of the retail class and Class C of the fund, the cumulative total returns of a broad-based securities market index ("benchmark"), and a range of cumulative total returns of a peer group of mutual funds identified by Lipper, Inc. as having an investment objective similar to that of the fund. The returns of the retail class and Class C show the performance of the highest performing class (based on five-year performance) and the lowest performing class (based on one-year performance), respectively.
The box within each chart shows the 25th percentile return (top of box) and the 75th percentile return (bottom of box) of the peer group. Returns shown above the box are in the first quartile and returns shown below the box are in the fourth quartile. The percentage beaten numbers noted below each chart correspond to the percentile box and represent the percentage of funds in the peer group whose performance was equal to or lower than that of the fund or class indicated.
Fidelity Emerging Markets Fund
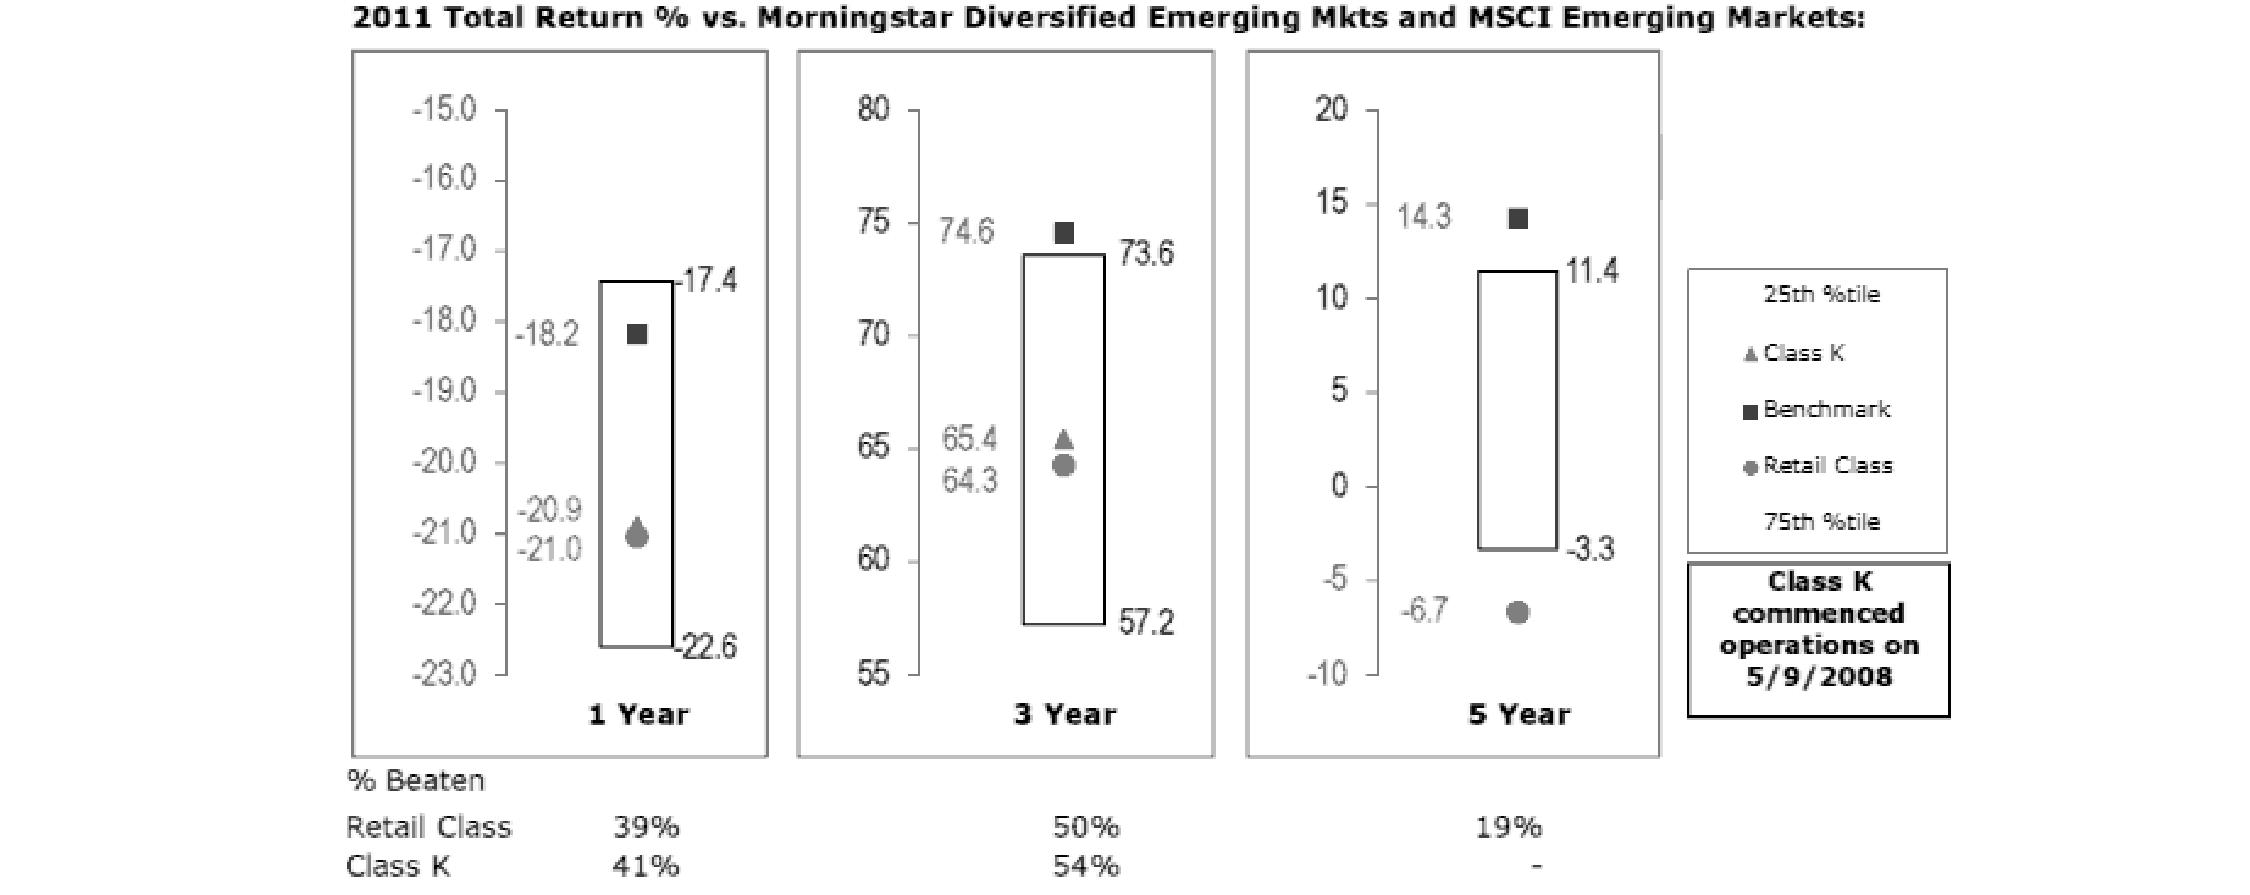
The Board reviewed the fund's relative investment performance against its peer group and noted that the performance of the retail class of the fund (the class with the longer performance record) was in the third quartile for the one-year period, the second quartile for the three-year period, and the fourth quartile for the five-year period. The Board also noted that the investment performance of the fund was lower than its benchmark for all the periods shown. The Board considered that the variations in performance between the fund's classes reflect the variations in class expenses, which result in lower performance for the higher expense class. The Board discussed with FMR the fact that the fund underperformed its benchmark for each period measured. The Board also reviewed the fund's performance since inception as well as performance in the current year. The Board will continue to closely monitor performance of the fund in the coming year and discuss with FMR if other actions to address performance are appropriate.
Annual Report
Fidelity Europe Fund
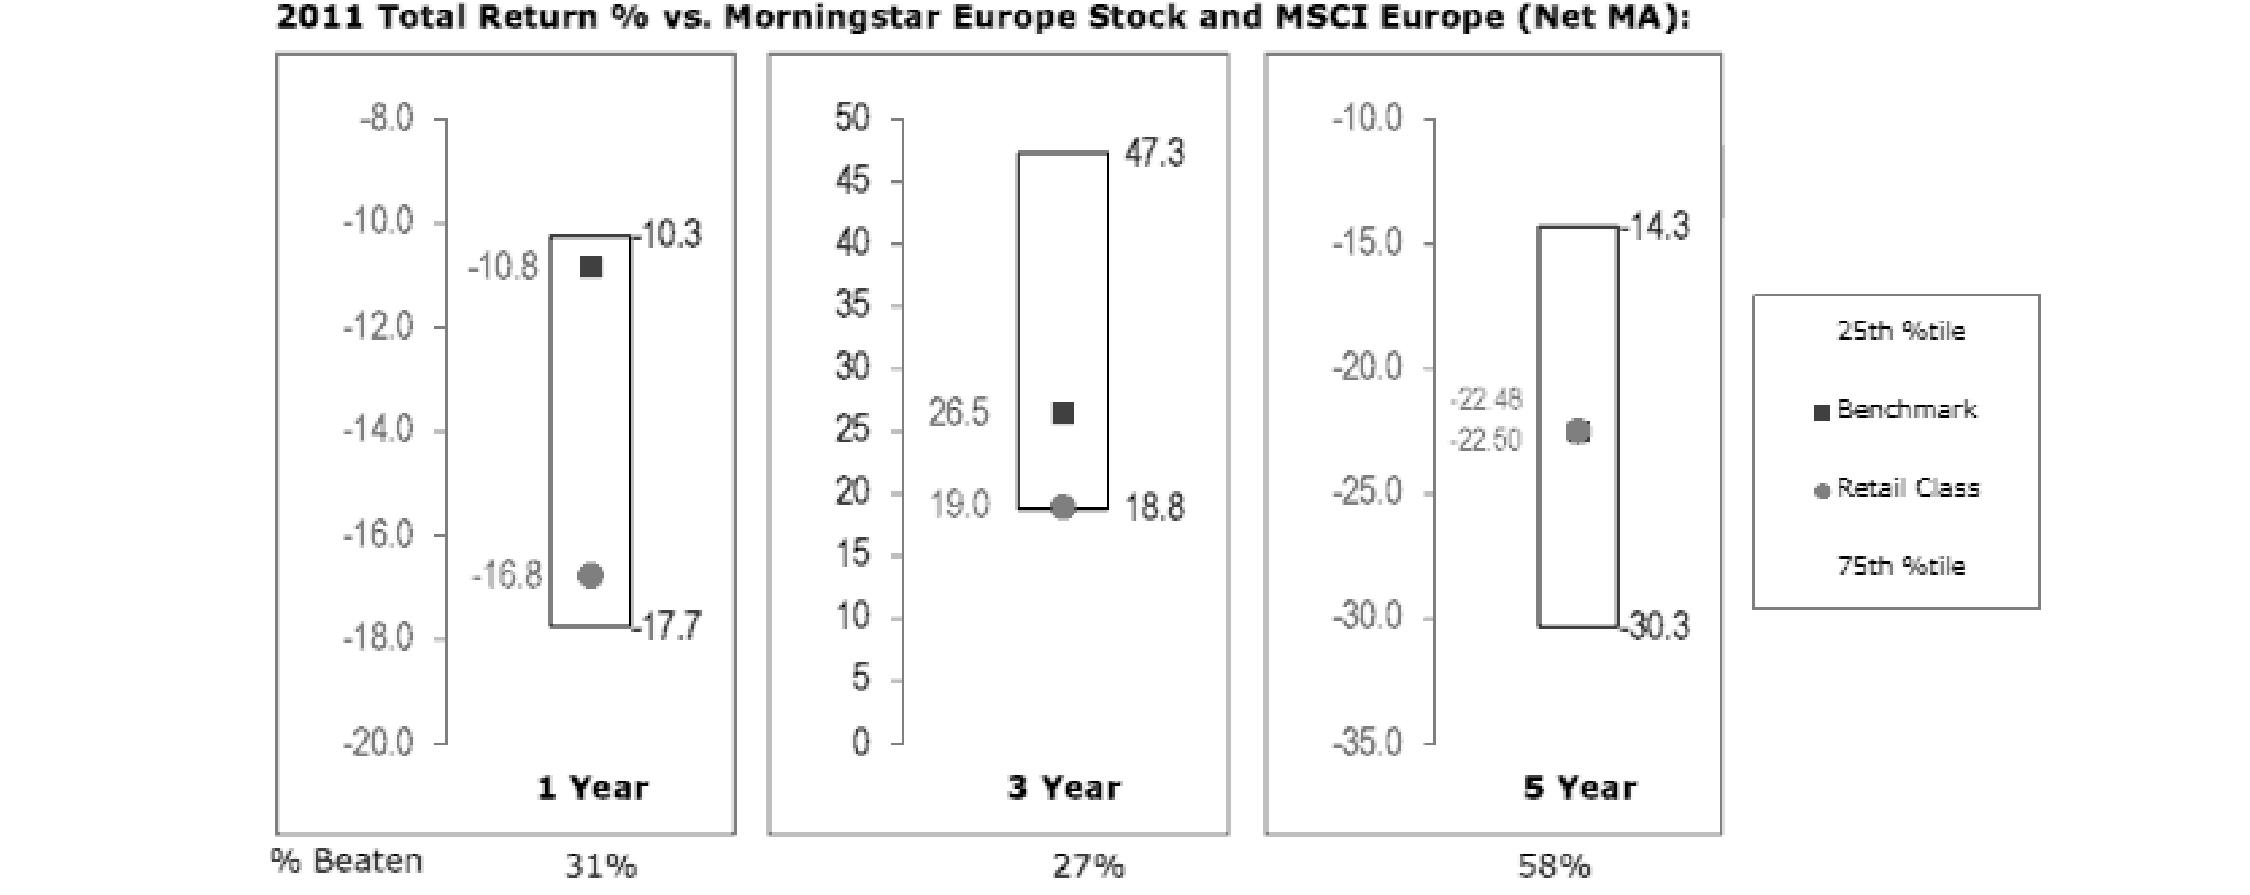
The Board reviewed the fund's relative investment performance against its peer group and noted that the performance of the fund was in the third quartile for the one- and three-year periods and the second quartile for the five-year period. The Board also noted that the investment performance of the fund was lower than its benchmark for the one- and three-year periods, although the fund's five-year cumulative total return was comparable to its benchmark. The Board discussed with FMR actions to improve the fund's disappointing performance relative to its peer group and benchmark. The Board noted that there was a portfolio management change for the fund in April 2012. The Board also reviewed the fund's performance since inception as well as performance in the current year. The Board will continue to closely monitor the performance of the fund in the coming year and discuss with FMR other appropriate actions to address the performance of the fund.
Fidelity Europe Capital Appreciation Fund
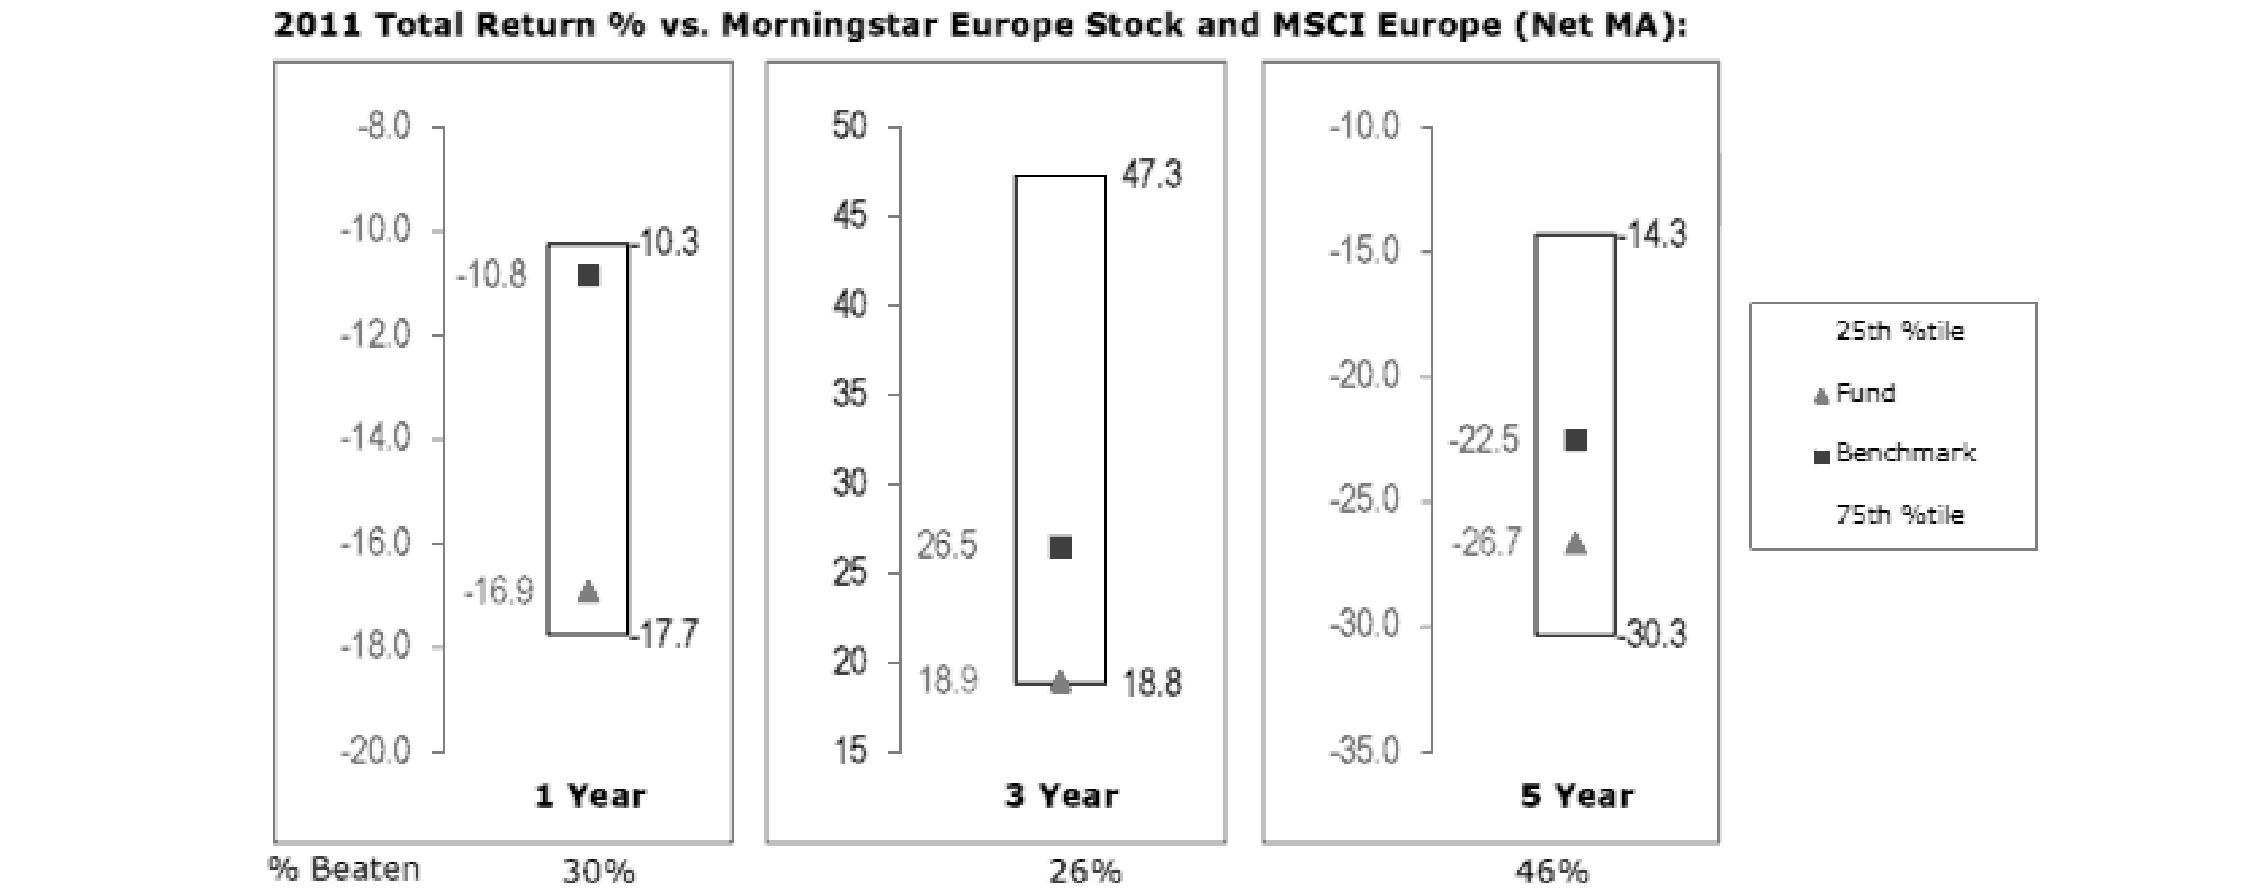
The Board reviewed the fund's relative investment performance against its peer group and noted that the performance of the fund was in the third quartile for all the periods shown. The Board also noted that the investment performance of the fund was lower than its benchmark for all the periods shown. The Board discussed with FMR actions to improve the fund's disappointing performance relative to its peer group and benchmark. The Board also reviewed the fund's performance since inception as well as performance in the current year. The Board will continue to closely monitor the performance of the fund in the coming year and discuss with FMR other appropriate actions to address the performance of the fund.
Annual Report
Board Approval of Investment Advisory Contracts and Management Fees - continued
Fidelity Japan Fund

The Board reviewed the fund's relative investment performance against its peer group and noted that the performance of the retail class of the fund was in the fourth quartile for the one- and five-year periods and the second quartile for the three-year period. The Board also noted that the investment performance of the fund was lower than its benchmark for the one- and five-year periods, although the three-year cumulative total return of the retail class compared favorably to its benchmark. The Board considered that the variations in performance among the fund's classes reflect the variations in class expenses, which result in lower performance for higher expense classes. The Board also reviewed the fund's performance since inception as well as performance in the current year. The Board will closely monitor the performance of the fund in the coming year.
The Board also considered that Europe Fund's, Europe Capital Appreciation Fund's, and Japan Fund's management fee is subject to upward or downward adjustment depending upon whether, and to what extent, the fund's investment performance for the performance period exceeds, or is exceeded by, the record (over the same period) of a Board-approved performance adjustment index. The Board noted that the performance adjustment provides FMR with a strong economic incentive to seek to achieve superior performance for each fund's shareholders and helps to more closely align the interests of FMR and each fund's shareholders.
Based on its review, the Board concluded that the nature, extent, and quality of services provided to each fund under the Advisory Contracts should benefit each fund's shareholders.
Competitiveness of Management Fee and Total Expense Ratio. The Board considered each fund's management fee and total expense ratio compared to "mapped groups" of competitive funds and classes. Fidelity creates "mapped groups" by combining similar Lipper investment objective categories that have comparable management fee characteristics. Combining Lipper investment objective categories aids the Board's management fee and total expense ratio comparisons by broadening the competitive group used for comparison and by reducing the number of universes to which various Fidelity funds are compared.
Management Fee. The Board considered two proprietary management fee comparisons for the 12-month periods shown in the charts below. The group of Lipper funds used by the Board for management fee comparisons is referred to below as the "Total Mapped Group". For Japan Fund, the Total Mapped Group is broader than the Lipper peer group used by the Board for performance comparisons because the Total Mapped Group combines several Lipper investment objective categories while the Lipper peer group does not. The Total Mapped Group comparison focuses on a fund's standing relative to the total universe of comparable funds available to investors in terms of gross management fees before expense reimbursements or caps, and without giving effect to a fund's performance adjustment (if applicable). "TMG %" represents the percentage of funds in the Total Mapped Group that had management fees that were lower than a fund's. For example, a TMG % of 17% would mean that 83% of the funds in the Total Mapped Group had higher management fees than a fund. The "Asset-Size Peer Group" (ASPG) comparison focuses on a fund's standing relative to non-Fidelity funds similar in size to the fund within the Total Mapped Group. The ASPG represents at least 15% of the funds in the Total Mapped Group with comparable asset size and management fee characteristics, subject to a minimum of 50 funds (or all funds in the Total Mapped Group if fewer than 50). Additional information, such as the ASPG quartile in which a fund's management fee ranked and the impact of a fund's performance adjustment (if applicable), is also included in the charts and considered by the Board.
Annual Report
Fidelity Canada Fund

The Board noted that the fund's management fee ranked below the median of its Total Mapped Group and below the median of its ASPG for 2011. The Board also noted the effect of the fund's negative performance adjustment on the fund's management fee ranking. The Board noted that the performance adjustment for each year represents calculations for performance periods that differ from the periods shown in the performance charts above.
Fidelity China Region Fund

The Board noted that the fund's management fee ranked below the median of its Total Mapped Group and below the median of its ASPG for 2011.
Annual Report
Board Approval of Investment Advisory Contracts and Management Fees - continued
Fidelity Emerging Asia Fund
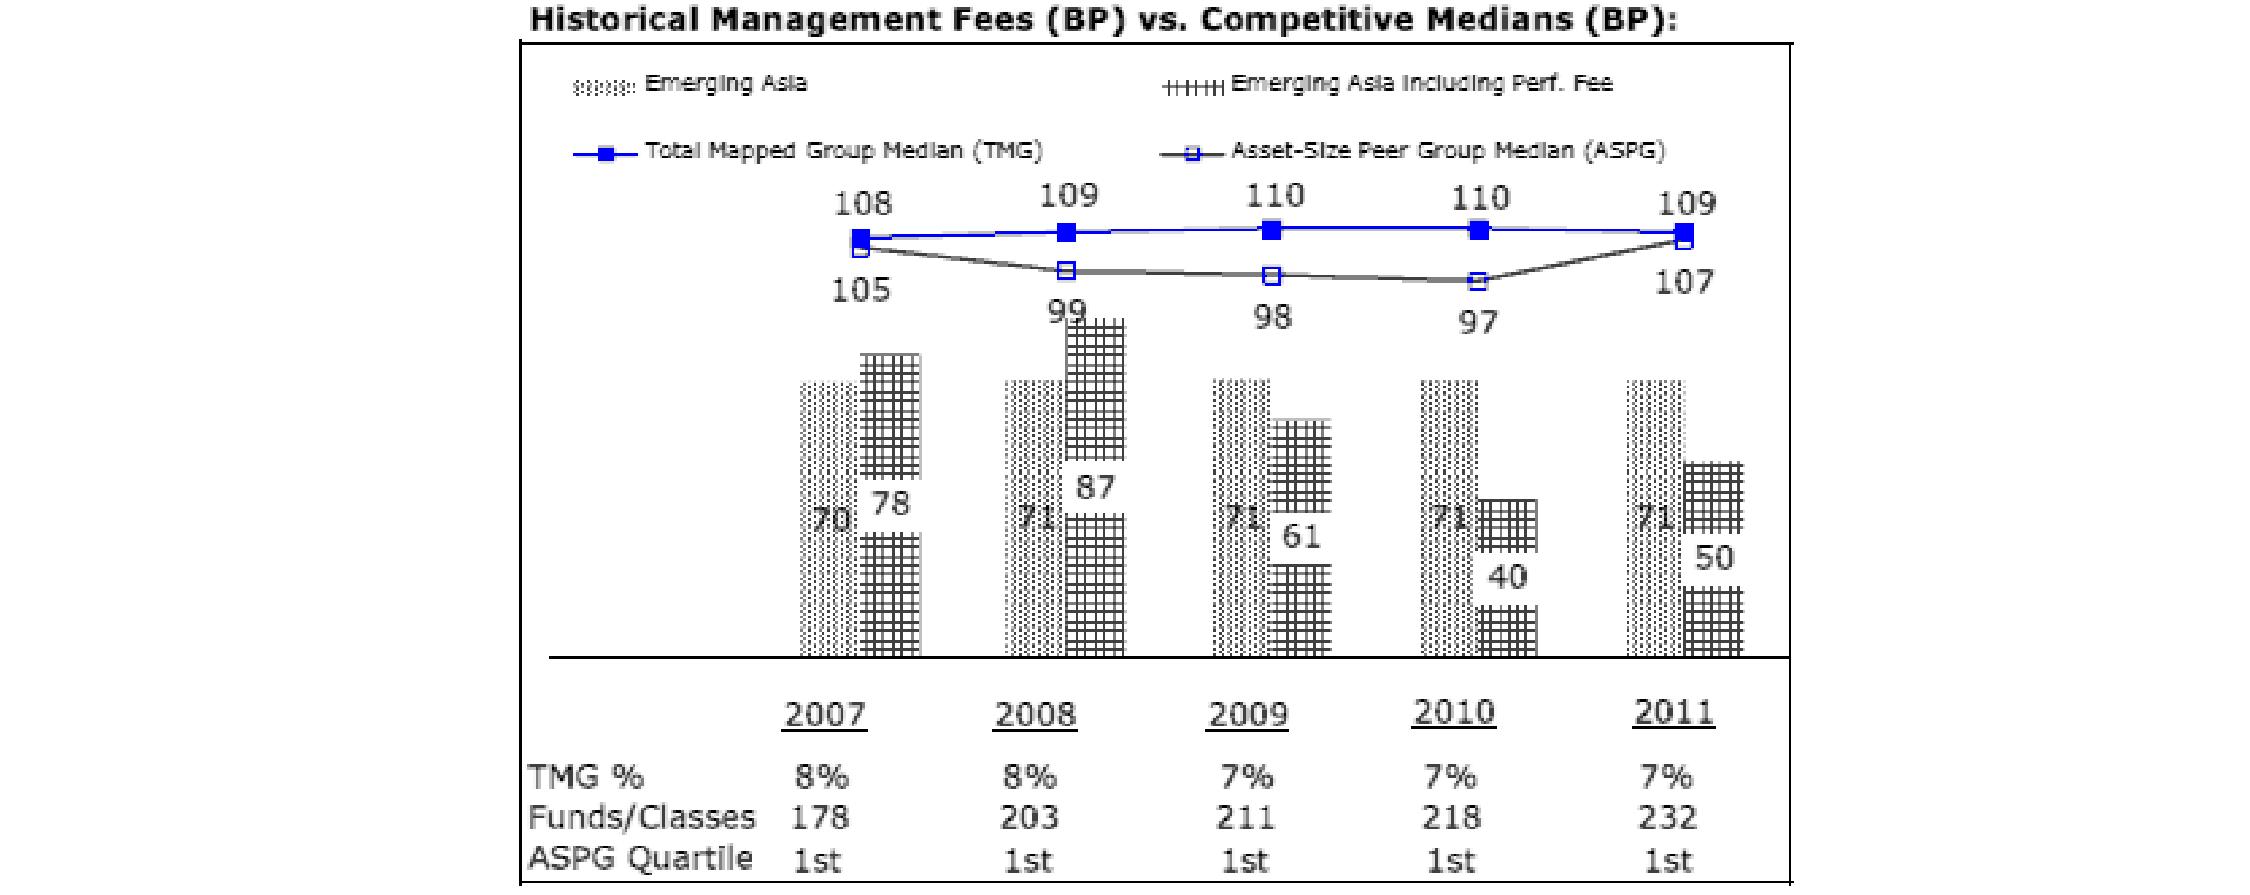
The Board noted that the fund's management fee ranked below the median of its Total Mapped Group and below the median of its ASPG for 2011. The Board also noted the effect of the fund's negative performance adjustment on the fund's management fee ranking. The Board noted that the performance adjustment for each year represents calculations for performance periods that differ from the periods shown in the performance charts above.
Furthermore, the Board considered that shareholders of Emerging Asia Fund approved a change in the index used to calculate the fund's performance adjustment, beginning December 1, 2010. The Board also considered that, because the performance adjustment is based on a rolling 36-month measurement period, during a transition period the fund's performance is compared to a blended index return that reflects the performance of the former index for the portion of the measurement period prior to December 1, 2010 and the performance of the current index for the remainder of the measurement period. The Board noted that the fund's performance adjustments for 2010 and 2011 shown in the chart above reflect the effect of using the blended index return to calculate the fund's performance adjustment.
Fidelity Emerging Markets Fund

The Board noted that the fund's management fee ranked below the median of its Total Mapped Group and below the median of its ASPG for 2011.
Annual Report
Fidelity Europe Fund
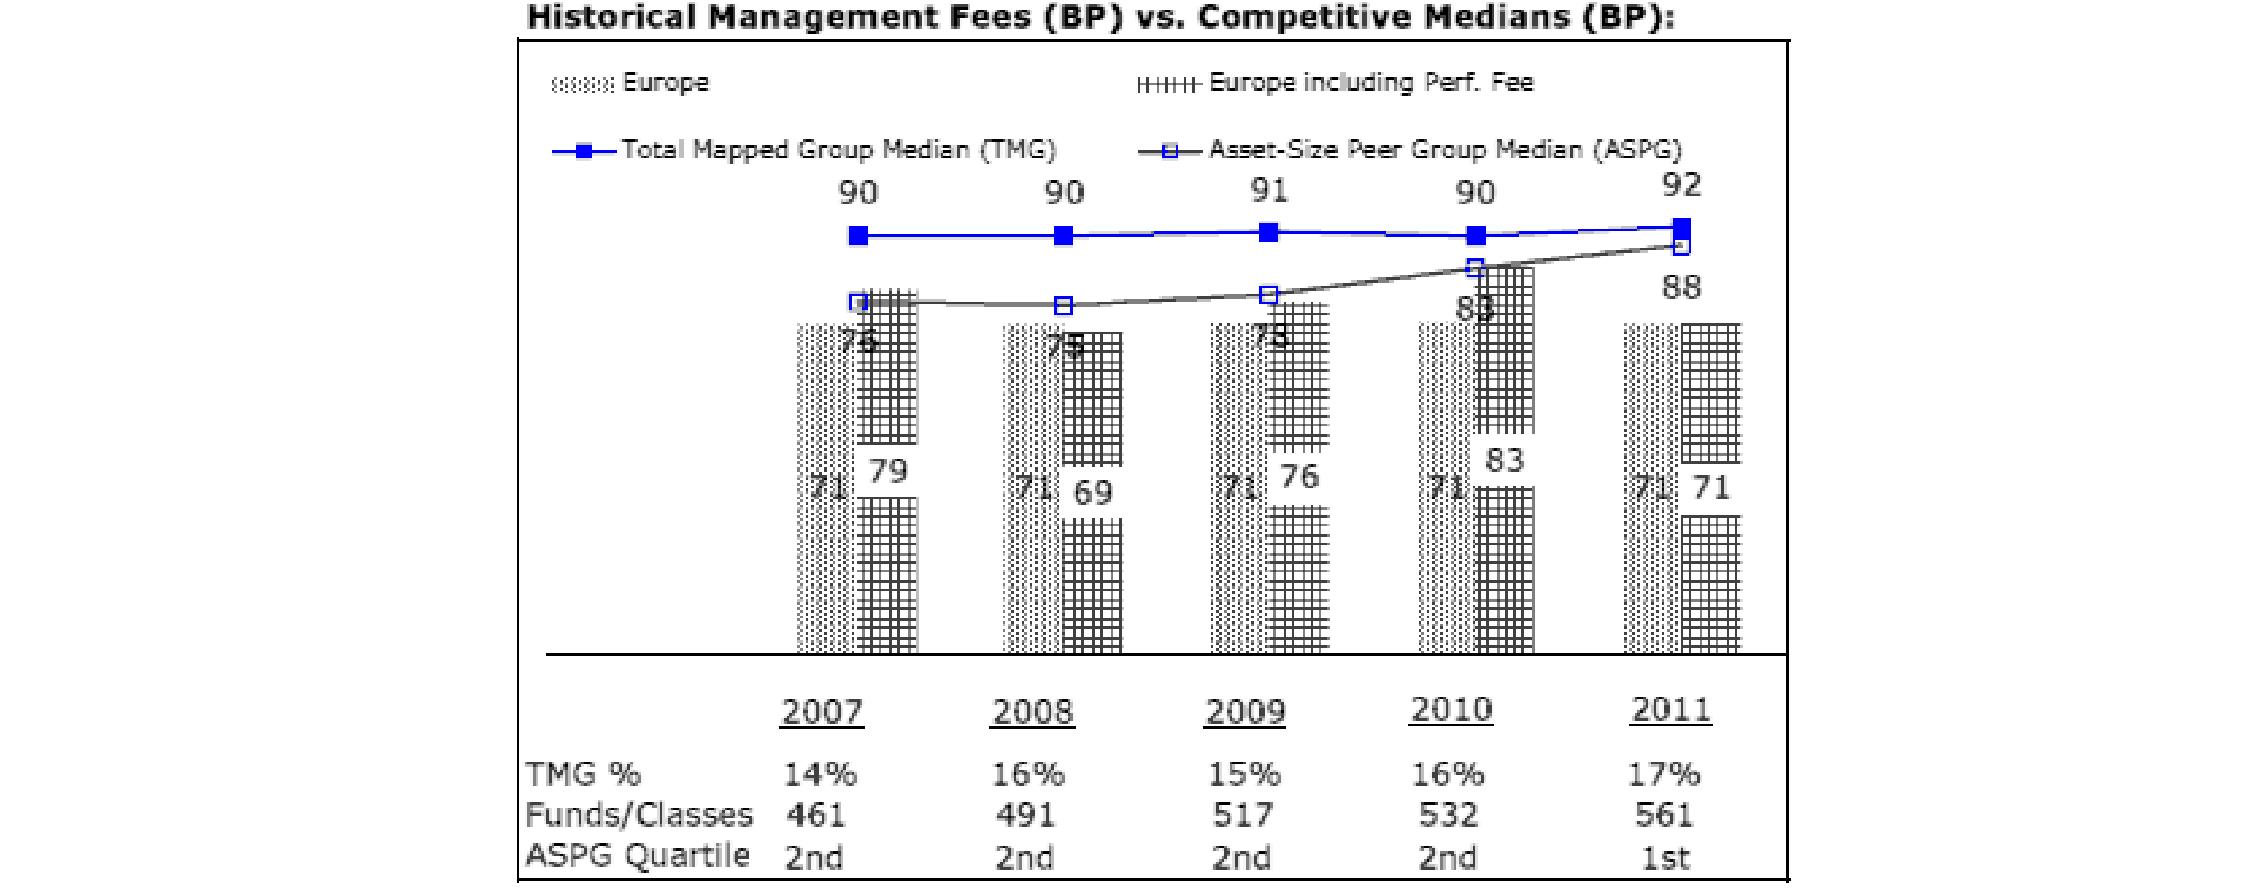
The Board noted that the fund's management fee ranked below the median of its Total Mapped Group and below the median of its ASPG for 2011. The Board also noted the effect of the fund's performance adjustment on the fund's management fee ranking. The Board noted that the performance adjustment for each year represents calculations for performance periods that differ from the periods shown in the performance charts above.
Fidelity Europe Capital Appreciation Fund
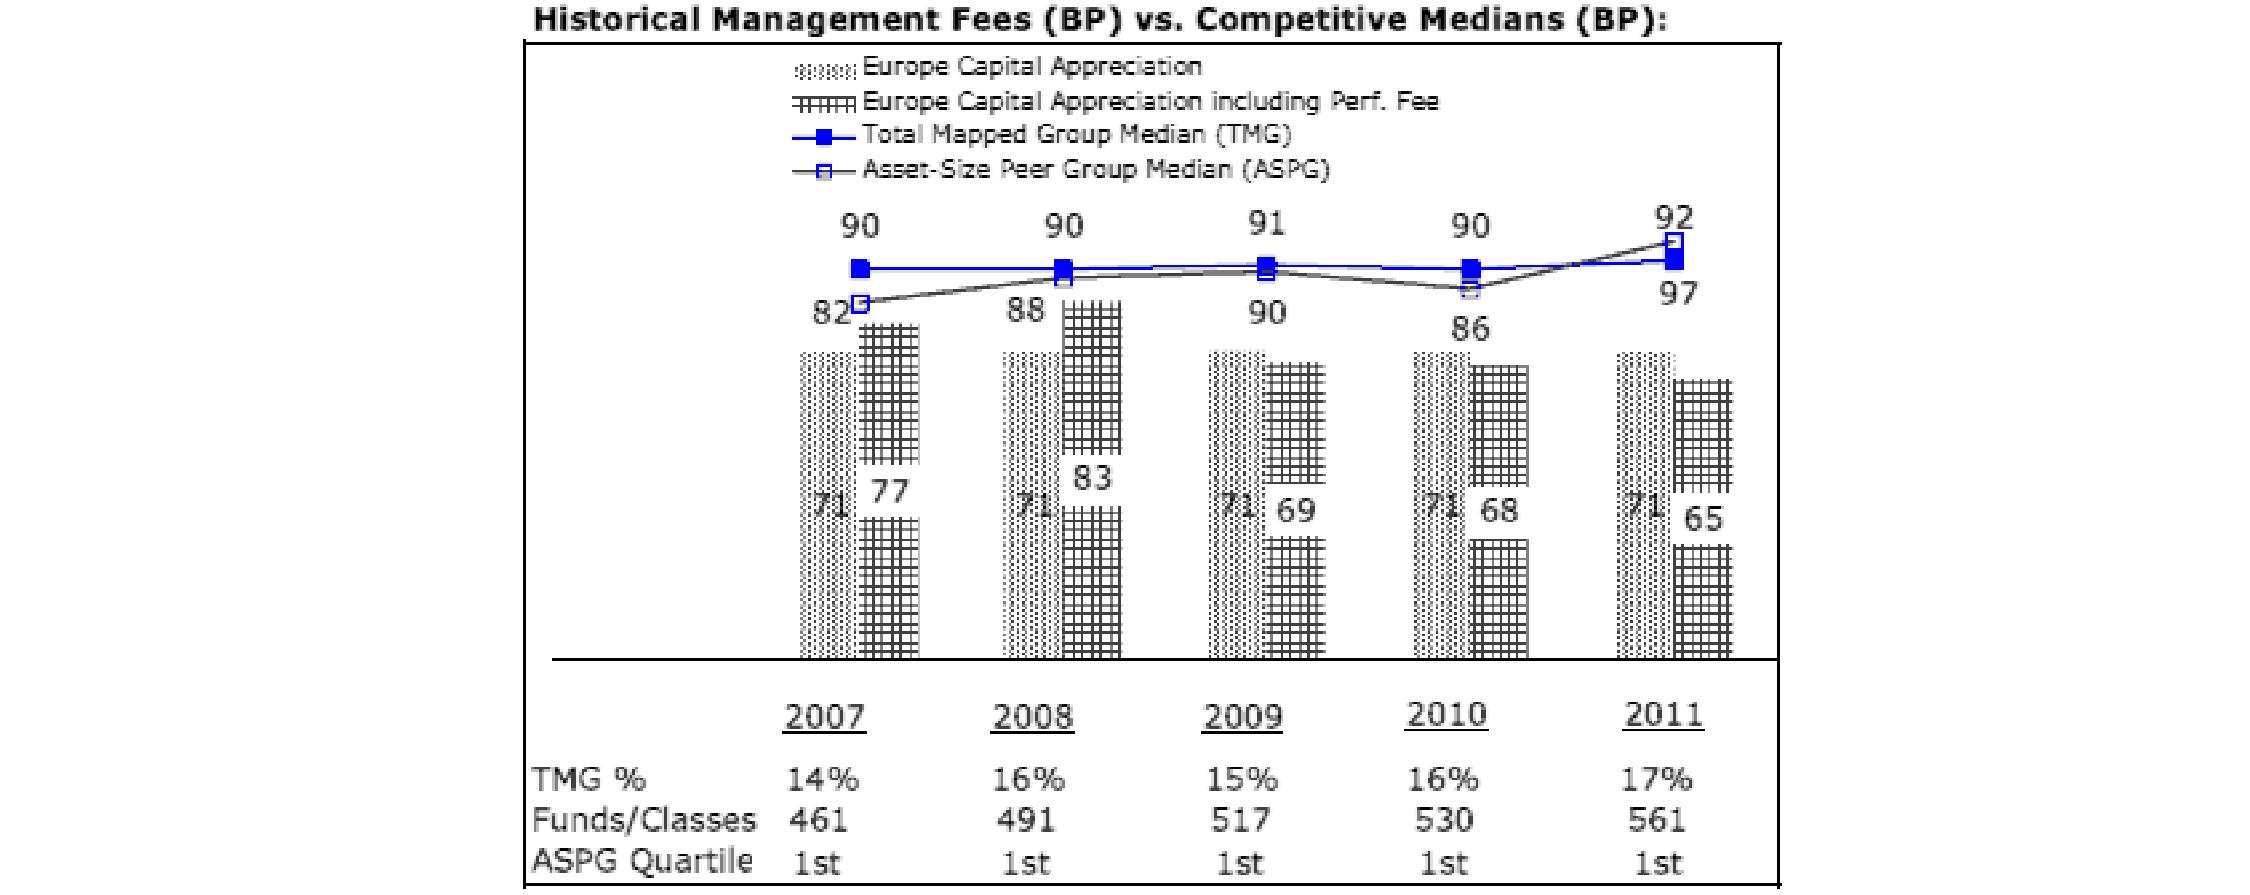
The Board noted that the fund's management fee ranked below the median of its Total Mapped Group and below the median of its ASPG for 2011. The Board also noted the effect of the fund's negative performance adjustment on the fund's management fee ranking. The Board noted that the performance adjustment for each year represents calculations for performance periods that differ from the periods shown in the performance charts above.
Annual Report
Board Approval of Investment Advisory Contracts and Management Fees - continued
Fidelity Japan Fund

The Board noted that the fund's management fee ranked below the median of its Total Mapped Group and below the median of its ASPG for 2011. The Board also noted the effect of the fund's negative performance adjustment on the fund's management fee ranking. The Board noted that the performance adjustment for each year represents calculations for performance periods that differ from the periods shown in the performance charts above.
Fidelity Japan Smaller Companies Fund

The Board noted that the fund's management fee ranked below the median of its Total Mapped Group and below the median of its ASPG for 2011.
Annual Report
Fidelity Latin America Fund

The Board noted that the fund's management fee ranked below the median of its Total Mapped Group and below the median of its ASPG for 2011.
Fidelity Nordic Fund

The Board noted that the fund's management fee ranked below the median of its Total Mapped Group and below the median of its ASPG for 2011.
Annual Report
Board Approval of Investment Advisory Contracts and Management Fees - continued
Fidelity Pacific Basin Fund
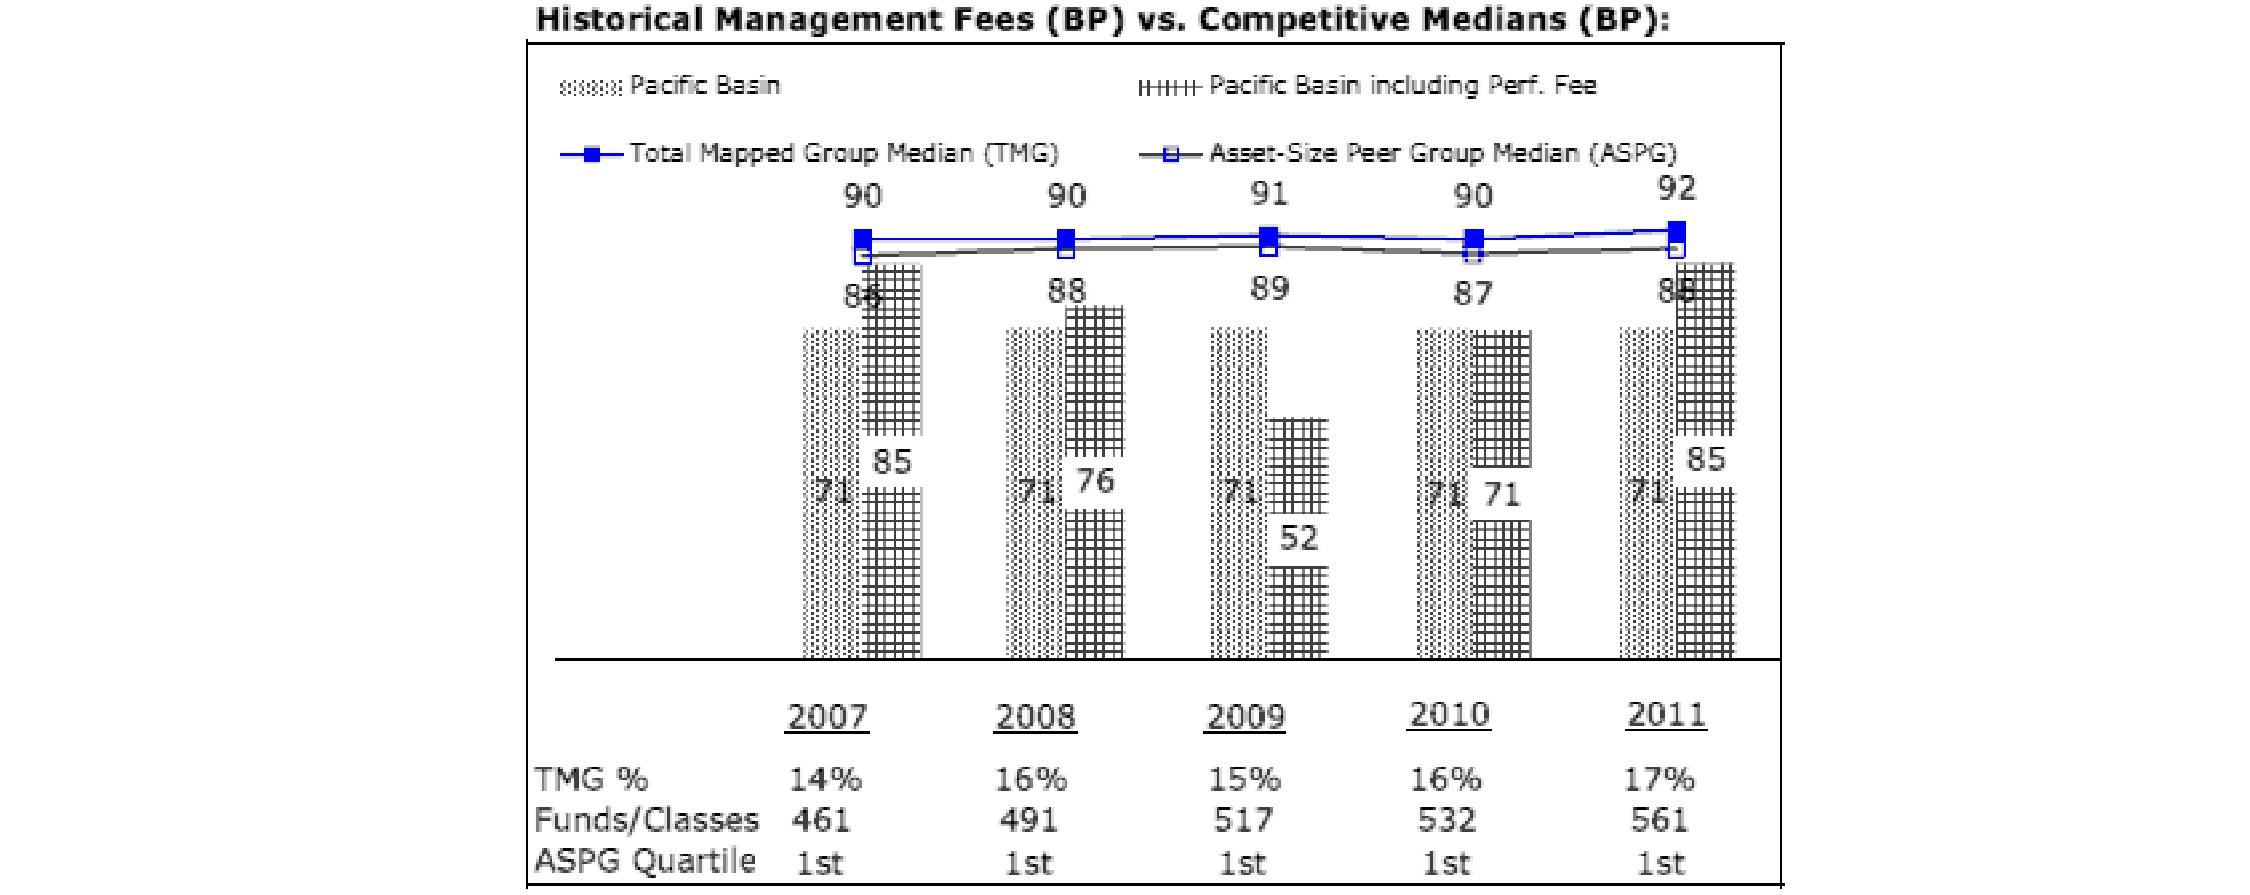
The Board noted that the fund's management fee ranked below the median of its Total Mapped Group and below the median of its ASPG for 2011. The Board also noted the effect of the fund's positive performance adjustment on the fund's management fee ranking. The Board noted that the performance adjustment for each year represents calculations for performance periods that differ from the periods shown in the performance charts above.
Based on its review, the Board concluded that each fund's management fee is fair and reasonable in light of the services that the fund receives and the other factors considered.
Total Expense Ratio (Canada Fund, China Region Fund, Emerging Markets Fund, Japan Fund, and Latin America Fund). In its review of the total expense ratio of each class of each fund, the Board considered the fund's management fee as well as other fund expenses, such as transfer agent fees, pricing and bookkeeping fees, fund-paid 12b-1 fees, and custodial, legal, and audit fees. The Board also noted the effects of any waivers and reimbursements on fees and expenses, as well as the impact of Canada Fund's and Japan Fund's performance adjustment. As part of its review, the Board also considered the current and historical total expense ratios of each class of each fund compared to competitive fund median expenses. Each class of each fund is compared to those funds and classes in the Total Mapped Group (used by the Board for management fee comparisons) that have a similar sales load structure.
The Board noted that the total expense ratio of each of Class A, Class B, Class C, Institutional Class, and the retail class of Japan Fund ranked below its competitive median for 2011 and the total expense ratio of Class T ranked above its competitive median for 2011. The Board considered that various factors, including 12b-1 fees, positive or negative performance adjustments, and relatively higher other expenses in the case of small fund size, can affect total expense ratios. The Board noted that the total expense ratio of Class T was above the competitive median primarily because of higher 12b-1 fees on Class T, Class T has a higher 12b-1 fee, but a lower front-end sales charge, than traditionally priced front-end sales charge classes. The Board considered that Class T is primarily sold load-waived in the retirement plan market where its 0.50% 12b-1 fee is comparable to competing no-load, higher 12b-1 fee classes designed specifically for retirement plans. The Board noted that the fund offers multiple classes, each of which has a different sales load and 12b-1 fee structure, and that the multiple structures are intended to offer a range of pricing options for the intermediary market. The Board also noted that the total expense ratios of the classes vary primarily by the level of their 12b-1 fees, although differences in transfer agent fees may also cause expenses to vary from class to class.
The Board noted that the total expense ratio of each class of Canada Fund, China Region Fund, Emerging Markets Fund, and Latin America Fund ranked below its competitive median for 2011.
Total Expense Ratio (Emerging Asia Fund, Europe Fund, Europe Capital Appreciation Fund, Japan Smaller Companies Fund, Nordic Fund, and Pacific Basin Fund). In its review of each fund's total expense ratio, the Board considered the fund's management fee as well as other fund expenses, such as transfer agent fees, pricing and bookkeeping fees, and custodial, legal, and audit fees. The Board also noted the effects of any waivers and reimbursements on fees and expenses, as well as the impact of Emerging Asia Fund's, Europe Fund's, Europe Capital Appreciation Fund's, and Pacific Basin Fund's performance adjustment. As part of its review, the Board also considered the current and historical total expense ratios of each fund compared to competitive fund median expenses. Each fund is compared to those funds and classes in the Total Mapped Group (used by the Board for management fee comparisons) that have a similar sales load structure.
The Board noted that each fund's total expense ratio ranked below its competitive median for 2011.
Annual Report
Fees Charged to Other Fidelity Clients. The Board also considered Fidelity fee structures and other information with respect to clients of FMR and its affiliates, such as other mutual funds advised or subadvised by FMR or its affiliates, pension plan clients, and other institutional clients. The Board noted the findings of the 2010 ad hoc joint committee (created with the board of other Fidelity funds), which reviewed and compared Fidelity's institutional investment advisory business with its business of providing services to the Fidelity funds, including the differences in services provided, fees charged, and costs incurred, as well as competition in their respective marketplaces.
Based on its review of total expense ratios and fees charged to other Fidelity clients, the Board concluded that the total expense ratio of each class of each fund was reasonable, although Class T of Japan Fund was above the median of the universe presented for comparison, in light of the services that the fund and its shareholders receive and the other factors considered.
Costs of the Services and Profitability. The Board considered the revenues earned and the expenses incurred by Fidelity in conducting the business of developing, marketing, distributing, managing, administering and servicing each fund and its shareholders. The Board also considered the level of Fidelity's profits in respect of all the Fidelity funds.
On an annual basis, FMR presents to the Board Fidelity's profitability for each fund. Fidelity calculates the profitability for each fund, as well as aggregate profitability for groups of Fidelity funds and all Fidelity funds, using a series of detailed revenue and cost allocation methodologies which originate with the books and records of Fidelity on which Fidelity's audited financial statements are based. The Audit Committee of the Board reviews any significant changes from the prior year's methodologies.
PricewaterhouseCoopers LLP (PwC), independent registered public accounting firm and auditor to Fidelity and certain Fidelity funds, has been engaged annually by the Board as part of the Board's assessment of Fidelity's profitability analysis. PwC's engagement includes the review and assessment of Fidelity's methodologies used in determining the revenues and expenses attributable to Fidelity's mutual fund business, and completion of agreed-upon procedures surrounding the mathematical accuracy of fund profitability and its conformity to allocation methodologies. After considering PwC's reports issued under the engagement and information provided by Fidelity, the Board concluded that while other allocation methods may also be reasonable, Fidelity's profitability methodologies are reasonable in all material respects.
The Board also reviewed Fidelity's non-fund businesses and fall-out benefits related to the mutual fund business as well as cases where Fidelity's affiliates may benefit from or be related to the funds' business.
The Board considered the costs of the services provided by and the profits realized by Fidelity in connection with the operation of each fund and was satisfied that the profitability was not excessive in the circumstances.
Economies of Scale. The Board considered whether there have been economies of scale in respect of the management of the Fidelity funds, whether the Fidelity funds (including each fund) have appropriately benefited from any such economies of scale, and whether there is potential for realization of any further economies of scale. The Board considered the extent to which each fund will benefit from economies of scale through increased services to the fund, through waivers or reimbursements, or through fee or expense reductions. The Board also noted that in 2009, it and the board of other Fidelity funds created an ad hoc committee (the Economies of Scale Committee) to analyze whether FMR attains economies of scale in respect of the management and servicing of the Fidelity funds, whether the Fidelity funds have appropriately benefited from such economies of scale, and whether there is potential for realization of any further economies of scale.
The Board recognized that each fund's management contract incorporates a "group fee" structure, which provides for lower group fee rates as total fund assets under FMR's management increase, and for higher group fee rates as total fund assets under FMR's management decrease. FMR calculates the group fee rates based on a tiered asset "breakpoint" schedule that varies based on asset class. The Board considered that the group fee is designed to deliver the benefits of economies of scale to fund shareholders when total Fidelity fund assets increase, even if assets of any particular fund are unchanged or have declined, because some portion of Fidelity's costs are attributable to services provided to all Fidelity funds, and all funds benefit if those costs can be allocated among more assets. The Board concluded that, given the group fee structure, fund shareholders will benefit from lower management fees as assets under FMR's management increase at the fund complex level, regardless of whether Fidelity achieves any such economies of scale.
The Board concluded, taking into account the analysis of the Economies of Scale Committee, that economies of scale, if any, are being appropriately shared between fund shareholders and Fidelity.
Additional Information Requested by the Board. In order to develop fully the factual basis for consideration of the Fidelity funds' Advisory Contracts, the Board requested and received additional information on certain topics, including (i) fund performance trends, actions to be taken by FMR to improve certain funds' overall performance, and Fidelity's long-term strategies for certain funds; (ii) the potential to further rationalize the Fidelity fund lineup with the possibility of achieving savings for the funds and Fidelity; (iii) Fidelity's compensation structure for portfolio managers and other key investment personnel; (iv) the amount of the investment that each portfolio manager has made in the Fidelity fund(s) that he or she manages; (v) the realization of fall-out benefits in certain Fidelity business units; (vi) Fidelity's group fee structures, the potential impact of regulatory changes on such structures, and the rationale for the individual fee rates of certain funds; (vii) fund profitability methodology, including Fidelity's cost allocation methodology, and the impact of certain factors on fund profitability results; (viii) trends regarding industry use of performance fee structures and the possibility of implementing performance fee structures for additional funds; and (ix) the impact of net redemptions from the Fidelity funds.
Annual Report
Board Approval of Investment Advisory Contracts and Management Fees - continued
Based on its evaluation of all of the conclusions noted above, and after considering all factors it believed relevant, the Board ultimately concluded that the advisory fee structures are fair and reasonable, and that each fund's Advisory Contracts should be renewed.
Annual Report
Investment Adviser
Fidelity Management & Research Company
Boston, MA
Investment Sub-Advisers
FMR Co., Inc.
Fidelity Management & Research
(U.K.) Inc.
Fidelity Management & Research
(Hong Kong) Limited
Fidelity Management & Research
(Japan) Inc.
FIL Investments (Japan) Limited
FIL Investment Advisors
FIL Investment Advisors
(UK) Limited
General Distributor
Fidelity Distributors Corporation
Smithfield, RI
Transfer and Service Agents
Fidelity Investments Institutional
Operations Company, Inc.
Boston, MA
Fidelity Service Company, Inc.
Boston, MA
Custodians
JPMorgan Chase Bank
New York, NY
Fidelity Emerging Markets Fund, Fidelity Japan Fund,
Fidelity Pacific Basin Fund
Brown Brothers Harriman & Co.
Boston, MA
Fidelity China Region Fund, Fidelity Latin America Fund,
Fidelity Nordic Fund
State Street Bank and Trust Company
Quincy, MA
Fidelity Canada Fund, Fidelity Europe Fund
The Northern Trust Company
Chicago, IL
Fidelity Emerging Asia Fund,
Fidelity Europe Capital Appreciation Fund,
Fidelity Japan Smaller Companies Fund
Fidelity's International Equity Funds
Fidelity Canada Fund
Fidelity China Region Fund
Fidelity Diversified International Fund
Fidelity Emerging Asia Fund
Fidelity Emerging Europe, Middle East, Africa (EMEA) Fund
Fidelity Emerging Markets Fund
Fidelity Europe Capital Appreciation Fund
Fidelity Europe Fund
Fidelity Global Balanced Fund
Fidelity Global Commodity Stock Fund
Fidelity Global Strategies Fund
Fidelity International Capital Appreciation Fund
Fidelity International Discovery Fund
Fidelity International Growth Fund
Fidelity International Small Cap Fund
Fidelity International Small Cap Opportunities Fund
Fidelity International Value Fund
Fidelity Japan Fund
Fidelity Japan Smaller Companies Fund
Fidelity Latin America Fund
Fidelity Nordic Fund
Fidelity Overseas Fund
Fidelity Pacific Basin Fund
Fidelity Total International Equity Fund
Fidelity Worldwide Fund
Corporate Headquarters
82 Devonshire Street
Boston, MA 02109
www.fidelity.com
The Fidelity Telephone Connection
Mutual Fund 24-Hour Service
Exchanges/Redemptions
and Account Assistance 1-800-544-6666
Product Information 1-800-544-6666
Retirement Accounts 1-800-544-4774
(8 a.m. - 9 p.m.)
TDD Service 1-800-544-0118
for the deaf and hearing impaired
(9 a.m. - 9 p.m. Eastern time)
Fidelity Automated Service
Telephone (FAST®)
1-800-544-5555
Automated line for quickest service
TIF-UANNPRO-1212
1.784781.109
Fidelity Advisor®
Canada Fund -
Class A, Class T, Class B, and Class C
Annual Report
October 31, 2012
Class A, Class T, Class B, and Class C are
classes of Fidelity® Canada Fund
(Fidelity Cover Art)
Contents
Performance | (Click Here) | How the fund has done over time. |
Management's Discussion of Fund Performance | (Click Here) | The Portfolio Manager's review of fund performance and strategy. |
Shareholder Expense Example | (Click Here) | An example of shareholder expenses. |
Investment Changes | (Click Here) | A summary of major shifts in the fund's investments over the past six months. |
Investments | (Click Here) | A complete list of the fund's investments with their market values. |
Financial Statements | (Click Here) | Statements of assets and liabilities, operations, and changes in net assets, as well as financial highlights. |
Notes | (Click Here) | Notes to the financial statements. |
Report of Independent Registered Public Accounting Firm | (Click Here) | |
Trustees and Officers | (Click Here) | |
Distributions | (Click Here) | |
Board Approval of Investment Advisory Contracts and Management Fees | (Click Here) | |
To view a fund's proxy voting guidelines and proxy voting record for the 12-month period ended June 30, visit http://www.fidelity.com/proxyvotingresults or visit the Securities and Exchange Commission's (SEC) web site at http://www.sec.gov. You may also call 1-877-208-0098 to request a free copy of the proxy voting guidelines.
Standard & Poor's, S&P and S&P 500 are registered service marks of The McGraw-Hill Companies, Inc. and have been licensed for use by Fidelity Distributors Corporation.
Other third party marks appearing herein are the property of their respective owners.
All other marks appearing herein are registered or unregistered trademarks or service marks of FMR LLC or an affiliated company. © 2012 FMR LLC. All rights reserved.
This report and the financial statements contained herein are submitted for the general information of the shareholders of the fund. This report is not authorized for distribution to prospective investors in the fund unless preceded or accompanied by an effective prospectus.
A fund files its complete schedule of portfolio holdings with the SEC for the first and third quarters of each fiscal year on Form N-Q. Forms N-Q are available on the SEC's web site at http://www.sec.gov. A fund's Forms N-Q may be reviewed and copied at the SEC's Public Reference Room in Washington, DC. Information regarding the operation of the SEC's Public Reference Room may be obtained by calling 1-800-SEC-0330. For a complete list of a fund's portfolio holdings, view the most recent holdings listing, semiannual report, or annual report on Fidelity's web site at http://www.fidelity.com, http://www.advisor.fidelity.com, or http://www.401k.com, as applicable.
NOT FDIC INSURED • MAY LOSE VALUE • NO BANK GUARANTEE
Neither the fund nor Fidelity Distributors Corporation is a bank.
Annual Report
Average annual total return reflects the change in the value of an investment, assuming reinvestment of the class' distributions from dividend income and capital gains (the profits earned upon the sale of securities that have grown in value, if any) and assuming a constant rate of performance each year. The $10,000 table and the fund's returns do not reflect the deduction of taxes that a shareholder would pay on fund distributions or the redemption of fund shares. During periods of reimbursement by Fidelity, a fund's total return will be greater than it would be had the reimbursement not occurred. How a fund did yesterday is no guarantee of how it will do tomorrow.
Average Annual Total Returns
Periods ended October 31, 2012 | Past 1
year | Past 5
years | Past 10
years |
Class A (incl. 5.75% sales charge)A | -1.94% | -4.53% | 12.72% |
Class T (incl. 3.50% sales charge) B | 0.11% | -4.35% | 12.81% |
Class B (incl. contingent deferred sales charge) C | -1.75% | -4.50% | 12.90% |
Class C (incl. contingent deferred sales charge) D | 2.26% | -4.12% | 12.92% |
A Class A shares bear a 0.25% 12b-1 fee. The initial offering of Class A shares took place on May 2, 2007. Returns prior to May 2, 2007 are those of Fidelity® Canada Fund, the original class of the fund, which has no 12b-1 fee. Had Class A shares' 12b-1 fee been reflected, returns prior to May 2, 2007 would have been lower.
B Class T shares bear a 0.50% 12b-1 fee. The initial offering of Class T shares took place on May 2, 2007. Returns prior to May 2, 2007 are those of Fidelity® Canada Fund, the original class of the fund, which has no 12b-1 fee. Had Class T shares' 12b-1 fee been reflected, returns prior to May 2, 2007 would have been lower.
C Class B shares bear a 1.00% 12b-1 fee. The initial offering of Class B shares took place on May 2, 2007. Returns prior to May 2, 2007 are those of Fidelity Canada Fund, the original class of the fund, which has no 12b-1 fee. Had Class B shares' 12b-1 fee been reflected, returns prior to May 2, 2007 would have been lower. Class B shares' contingent deferred sales charge included in the past one year, past five years, and past 10 years total return figures are 5%, 2%, and 0%, respectively.
D Class C shares bear a 1.00% 12b-1 fee. The initial offering of Class C shares took place on May 2, 2007. Returns prior to May 2, 2007 are those of Fidelity Canada Fund, the original class of the fund, which has no 12b-1 fee. Had Class C shares' 12b-1 fee been reflected, returns prior to May 2, 2007 would have been lower. Class C shares' contingent deferred sales charge included in the past one year, past five years, and past 10 years total return figures are 1%, 0%, and 0%, respectively.
$10,000 Over 10 Years
Let's say hypothetically that $10,000 was invested in Fidelity Advisor® Canada Fund - Class A on October 31, 2002, and the current 5.75% sales charge was paid. The chart shows how the value of your investment would have changed, and also shows how the S&P®/TSX Composite Index performed over the same period. The initial offering of Class A took place on May 2, 2007. See above for additional information regarding the performance of Class A.
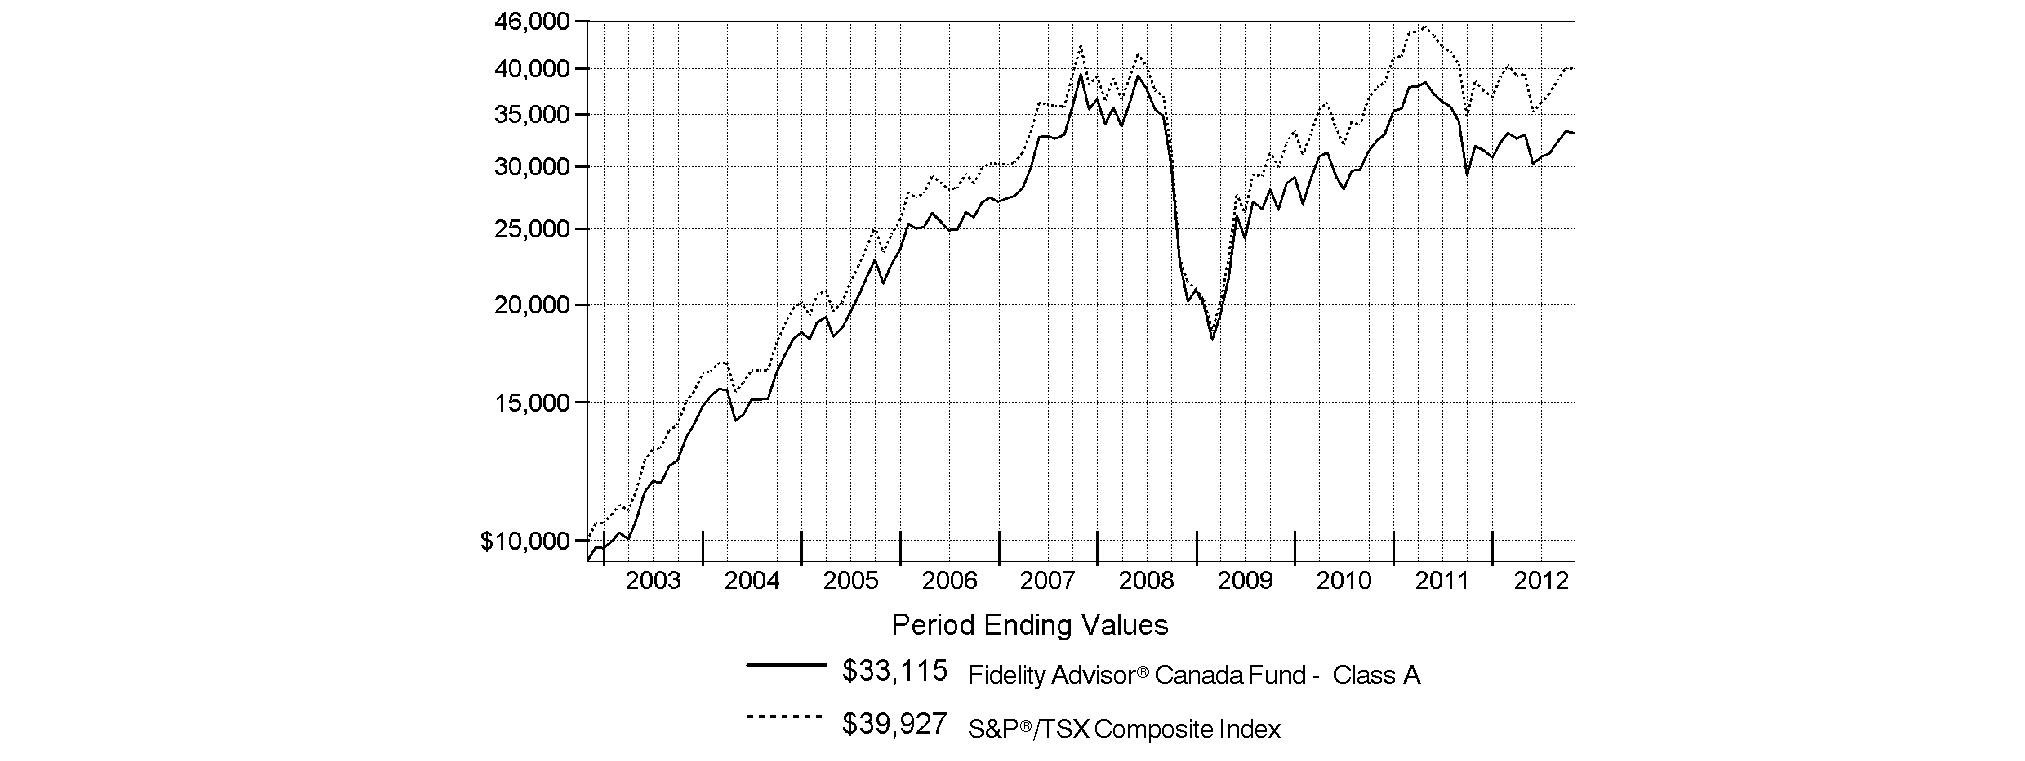
Annual Report
Market Recap: Returns for most domestic and international equities fluctuated during the 12 months ending October 31, 2012, as investor sentiment towards risk vacillated amid a changing global economic landscape. U.S. stocks overcame bouts of volatility to post strong gains for the past year, extending an uptrend that began in March 2009. The broad-based S&P 500® Index advanced 15.21%, while the blue-chip-laden Dow Jones Industrial AverageSM and technology-heavy Nasdaq Composite® Index rose 12.56% and 12.21%, respectively. Performance outside of the U.S. was relatively weak, as the MSCI® ACWI® (All Country World Index) ex USA Index rose 4.11%, hampered in part by a stronger U.S. dollar. International developed-markets generally struggled during the period as macroeconomic concerns ebbed and flowed, finishing with only a modest gain. The MSCI® EAFE® Index rose 4.76% for the year, largely buttressed in the summertime by pledges of accommodative monetary action from eurozone officials, as well as signs that the U.S. housing market was on the mend. Within the index, Asia-Pacific ex Japan showed the most impressive gain, advancing roughly 10%. A number of core European components, including Germany (+11%) and Switzerland (+10%), and the U.K. (+9%), benefited from optimism about the eurozone's ability to resolve its debt woes, which helped the region outpace the index overall. Elsewhere, Japan was among the few benchmark constituents to finish in the red, returning about -3%. Emerging-markets stocks gained 2.98% for the year, as measured by the MSCI Emerging Markets Index. A general uptrend in the final five months of the period lifted the index into positive territory for the full 12 months.
Comments from Douglas Lober, Portfolio Manager of Fidelity Advisor® Canada Fund: For the year, the fund's Class A, Class T, Class B and Class C shares rose 4.04%, 3.74%, 3.25% and 3.26%, respectively (excluding sales charges), straddling the 3.82% gain of the S&P/TSX Composite Index. The fund's outperformance was largely driven by solid picks and an overweighting in health care, a sector that makes up only small portion of the index but was its star performer this period. Our stake in pharmacy benefits manager SXC Health Solutions proved most rewarding, as the stock vaulted higher on the firm's April announcement of its plans to buy Catalyst Health Solutions. The market warmly welcomed the merger, which created the combined entity Catamaran in July. Unfortunately, Catamaran's stock didn't react quite as strongly to the big move as I had hoped, and it ended up our largest relative detractor. Also in health care, Valeant Pharmaceuticals International flexed its muscles for the fund, as its shares advanced on a number of accretive acquisitions this period. An overweighting in consumer discretionary, especially among retailers, provided an additional lift. Here, shares of discount store operator Dollarama steadily advanced, as the company continued to gain pricing power from increasing the average cost of its items from $1 to $2, while also opening new stores across Canada. In materials, the fund's limited stake in lagging index component Kinross Gold was a good call, as was scant exposure to weak-performing BlackBerry® mobile device maker Research In Motion among information technology names. Conversely, underweighting some beneficiaries of accretive acquisitions in the energy sector detracted the most from relative results, including our minimal position in index component Nexen, whose stock shot up in July on the announcement that China's CNOOC intended to acquire the firm. Positioning in financials, including an underweighting in rebounding index component Royal Bank of Canada, hurt, as did choices in industrials. Also, an underweighting in enterprise software firm Open Text notably detracted, as did holdings in Barrick Gold, which faltered in part on production missteps.
Note to shareholders: Fidelity Advisor Canada Fund may invest up to 35% of its total assets in any industry that represents more than 20% of the Canadian market. As of October 31, 2012, the fund did not have more than 25% of its assets invested in any one industry.
The views expressed above reflect those of the portfolio manager(s) only through the end of the period as stated on the cover of this report and do not necessarily represent the views of Fidelity or any other person in the Fidelity organization. Any such views are subject to change at any time based upon market or other conditions and Fidelity disclaims any responsibility to update such views. These views may not be relied on as investment advice and, because investment decisions for a Fidelity fund are based on numerous factors, may not be relied on as an indication of trading intent on behalf of any Fidelity fund.
Annual Report
Fidelity Canada Fund
As a shareholder of the Fund, you incur two types of costs: (1) transaction costs, including sales charges (loads) on purchase payments or redemption proceeds, redemption fees and (2) ongoing costs, including management fees, distribution and/or service (12b-1) fees and other Fund expenses. This Example is intended to help you understand your ongoing costs (in dollars) of investing in the Fund and to compare these costs with the ongoing costs of investing in other mutual funds.
The Example is based on an investment of $1,000 invested at the beginning of the period and held for the entire period (May 1, 2012 to October 31, 2012).
Actual Expenses
The first line of the accompanying table for each class of the Fund provides information about actual account values and actual expenses. You may use the information in this line, together with the amount you invested, to estimate the expenses that you paid over the period. Simply divide your account value by $1,000.00 (for example, an $8,600 account value divided by $1,000.00 = 8.6), then multiply the result by the number in the first line for a class of the Fund under the heading entitled "Expenses Paid During Period" to estimate the expenses you paid on your account during this period. A small balance maintenance fee of $12.00 that is charged once a year may apply for certain accounts with a value of less than $2,000. This fee is not included in the table below. If it was, the estimate of expenses you paid during the period would be higher, and your ending account value lower, by this amount. In addition, the Fund, as a shareholder in the underlying Fidelity Central Funds, will indirectly bear its pro-rata share of the fees and expenses incurred by the underlying Fidelity Central Funds. These fees and expenses are not included in the Fund's annualized expense ratio used to calculate the expense estimate in the table below.
Hypothetical Example for Comparison Purposes
The second line of the accompanying table for each class of the Fund provides information about hypothetical account values and hypothetical expenses based on a Class' actual expense ratio and an assumed rate of return of 5% per year before expenses, which is not the Class' actual return. The hypothetical account values and expenses may not be used to estimate the actual ending account balance or expenses you paid for the period. You may use this information to compare the ongoing costs of investing in the Fund and other funds. To do so, compare this 5% hypothetical example with the 5% hypothetical examples that appear in the shareholder reports of the other funds. A small balance maintenance fee of $12.00 that is charged once a year may apply for certain accounts with a value of less than $2,000. This fee is not included in the table below. If it was, the estimate of expenses you paid during the period would be higher, and your ending account value lower, by this amount. In addition, the Fund, as a shareholder in the underlying Fidelity Central Funds, will indirectly bear its pro-rata share of the fees and expenses incurred by the underlying Fidelity Central Funds. These fees and expenses are not included in the Fund's annualized expense ratio used to calculate the expense estimate in the table below.
Please note that the expenses shown in the table are meant to highlight your ongoing costs only and do not reflect any transaction costs. Therefore, the second line of the table is useful in comparing ongoing costs only, and will not help you determine the relative total costs of owning different funds. In addition, if these transactional costs were included, your costs would have been higher.
| Annualized
Expense Ratio | Beginning
Account Value
May 1, 2012 | Ending
Account Value
October 31, 2012 | Expenses Paid
During Period*
May 1, 2012
to October 31, 2012 |
Class A | 1.07% | | | |
Actual | | $ 1,000.00 | $ 1,006.00 | $ 5.40 |
Hypothetical A | | $ 1,000.00 | $ 1,019.76 | $ 5.43 |
Class T | 1.35% | | | |
Actual | | $ 1,000.00 | $ 1,004.50 | $ 6.80 |
Hypothetical A | | $ 1,000.00 | $ 1,018.35 | $ 6.85 |
Class B | 1.84% | | | |
Actual | | $ 1,000.00 | $ 1,002.30 | $ 9.26 |
Hypothetical A | | $ 1,000.00 | $ 1,015.89 | $ 9.32 |
Class C | 1.81% | | | |
Actual | | $ 1,000.00 | $ 1,002.30 | $ 9.11 |
Hypothetical A | | $ 1,000.00 | $ 1,016.04 | $ 9.17 |
Canada | .76% | | | |
Actual | | $ 1,000.00 | $ 1,007.60 | $ 3.84 |
Hypothetical A | | $ 1,000.00 | $ 1,021.32 | $ 3.86 |
Institutional Class | .75% | | | |
Actual | | $ 1,000.00 | $ 1,007.70 | $ 3.79 |
Hypothetical A | | $ 1,000.00 | $ 1,021.37 | $ 3.81 |
A 5% return per year before expenses
* Expenses are equal to each Class' annualized expense ratio, multiplied by the average account value over the period, multiplied by 184/366 (to reflect the one-half year period).
Annual Report
Fidelity Canada Fund
Investment Changes (Unaudited)
Geographic Diversification (% of fund's net assets) |
As of October 31, 2012 |
 | Canada | 97.1% | |
 | United States of America | 2.9% | |

Percentages are based on country or territory of incorporation and are adjusted for the effect of futures contracts, if applicable. |
As of April 30, 2012 |
| Canada | 89.9% | |
| United States of America | 10.1% | |

Percentages are based on country or territory of incorporation and are adjusted for the effect of futures contracts, if applicable. |
Asset Allocation |
| % of fund's
net assets | % of fund's net assets
6 months ago |
Stocks | 99.3 | 99.8 |
Short-Term Investments and Net Other Assets (Liabilities) | 0.7 | 0.2 |
Top Ten Stocks as of October 31, 2012 |
| % of fund's
net assets | % of fund's net assets
6 months ago |
Royal Bank of Canada (Commercial Banks) | 5.9 | 5.9 |
The Toronto-Dominion Bank (Commercial Banks) | 5.5 | 6.4 |
Suncor Energy, Inc. (Oil, Gas & Consumable Fuels) | 4.2 | 4.2 |
Bank of Nova Scotia (Commercial Banks) | 4.1 | 4.2 |
Goldcorp, Inc. (Metals & Mining) | 3.5 | 2.1 |
Enbridge, Inc. (Oil, Gas & Consumable Fuels) | 3.3 | 3.8 |
Catamaran Corp. (Health Care Providers & Services) | 3.1 | 3.8 |
Valeant Pharmaceuticals International, Inc. (Canada) (Pharmaceuticals) | 3.1 | 4.1 |
Canadian National Railway Co. (Road & Rail) | 3.0 | 3.4 |
Cenovus Energy, Inc. (Oil, Gas & Consumable Fuels) | 2.9 | 2.7 |
| 38.6 | |
Market Sectors as of October 31, 2012 |
| % of fund's
net assets | % of fund's net assets
6 months ago |
Financials | 28.3 | 31.1 |
Energy | 24.6 | 19.1 |
Materials | 18.0 | 12.5 |
Health Care | 6.2 | 8.3 |
Telecommunication Services | 5.6 | 4.6 |
Consumer Discretionary | 5.5 | 9.9 |
Industrials | 4.8 | 6.0 |
Information Technology | 3.1 | 4.1 |
Consumer Staples | 3.0 | 4.0 |
Utilities | 0.2 | 0.2 |
Annual Report
Fidelity Canada Fund
Investments October 31, 2012
Showing Percentage of Net Assets
Common Stocks - 99.3% |
| Shares | | Value |
CONSUMER DISCRETIONARY - 5.5% |
Auto Components - 0.1% |
Magna International, Inc. Class A
(sub. vtg.) | 100,000 | | $ 4,445,557 |
Hotels, Restaurants & Leisure - 0.5% |
Tim Hortons, Inc. (Canada) | 310,300 | | 15,403,929 |
Media - 0.9% |
Cineplex, Inc. | 300,000 | | 9,311,640 |
Corus Entertainment, Inc. Class B (non-vtg.) | 550,000 | | 12,451,064 |
Quebecor, Inc. Class B (sub. vtg.) | 200,000 | | 6,976,721 |
| | 28,739,425 |
Multiline Retail - 2.3% |
Dollarama, Inc. | 1,203,467 | | 76,021,760 |
Specialty Retail - 0.8% |
Home Depot, Inc. | 320,000 | | 19,641,600 |
RONA, Inc. | 150,000 | | 1,540,926 |
TJX Companies, Inc. | 100,000 | | 4,163,000 |
| | 25,345,526 |
Textiles, Apparel & Luxury Goods - 0.9% |
Gildan Activewear, Inc. | 770,195 | | 26,227,116 |
lululemon athletica, Inc. (a) | 77,600 | | 5,355,176 |
| | 31,582,292 |
TOTAL CONSUMER DISCRETIONARY | | 181,538,489 |
CONSUMER STAPLES - 3.0% |
Food & Staples Retailing - 3.0% |
Alimentation Couche-Tard, Inc. Class B (sub. vtg.) | 990,200 | | 48,640,012 |
Jean Coutu Group, Inc. Class A
(sub. vtg.) | 600,000 | | 9,017,272 |
Metro, Inc. Class A (sub. vtg.) | 579,165 | | 34,167,111 |
Whole Foods Market, Inc. | 100,000 | | 9,473,000 |
| | 101,297,395 |
ENERGY - 24.6% |
Oil, Gas & Consumable Fuels - 24.6% |
ARC Resources Ltd. | 300,000 | | 7,284,105 |
Athabasca Oil Corp. (a) | 650,000 | | 7,868,335 |
Baytex Energy Corp. | 350,000 | | 15,927,409 |
Birchcliff Energy Ltd. (a) | 2,700 | | 22,141 |
Canadian Natural Resources Ltd. | 2,450,000 | | 73,837,297 |
Canadian Oil Sands Ltd. | 700,000 | | 14,858,573 |
Celtic Exploration Ltd. (a) | 500,000 | | 13,056,320 |
Celtic Exploration Ltd. (a)(e) | 200,000 | | 5,222,528 |
Cenovus Energy, Inc. | 2,700,000 | | 95,240,050 |
Crescent Point Energy Corp. | 1,383,400 | | 57,482,954 |
Crew Energy, Inc. (a) | 1,500,000 | | 11,549,437 |
Enbridge, Inc. | 2,737,800 | | 108,936,342 |
Encana Corp. | 700,000 | | 15,769,712 |
Imperial Oil Ltd. | 450,000 | | 19,910,388 |
|
| Shares | | Value |
Keyera Corp. | 152,302 | | $ 7,392,842 |
MEG Energy Corp. (a) | 400,000 | | 14,610,263 |
Nexen, Inc. | 600,000 | | 14,327,910 |
Pacific Rubiales Energy Corp. | 700,000 | | 16,463,579 |
Painted Pony Petroleum Ltd. (a)(e) | 113,000 | | 1,221,927 |
Pembina Pipeline Corp. | 250,000 | | 6,991,239 |
Penn West Petroleum Ltd. | 700,000 | | 9,090,363 |
PetroBakken Energy Ltd. Class A (d) | 700,000 | | 8,838,048 |
Peyto Exploration & Development Corp. | 300,000 | | 7,329,161 |
Progress Energy Resources Corp. | 300,000 | | 6,043,554 |
Suncor Energy, Inc. | 4,157,600 | | 139,537,173 |
Surge Energy, Inc. (a) | 250,000 | | 1,689,612 |
Surge Energy, Inc. (a)(e) | 632,000 | | 4,271,339 |
Talisman Energy, Inc. | 2,700,000 | | 30,602,253 |
Tourmaline Oil Corp. (a) | 400,000 | | 13,216,521 |
Tourmaline Oil Corp. (a)(e) | 80,000 | | 2,643,304 |
TransCanada Corp. | 1,400,000 | | 63,036,796 |
Trilogy Energy Corp. | 100,000 | | 2,737,422 |
Vermilion Energy, Inc. | 400,000 | | 19,123,905 |
| | 816,132,802 |
FINANCIALS - 28.3% |
Capital Markets - 0.7% |
CI Financial Corp. | 1,000,000 | | 23,369,212 |
Commercial Banks - 20.4% |
Bank of Montreal | 1,500,000 | | 88,640,801 |
Bank of Nova Scotia | 2,500,000 | | 135,794,743 |
Canadian Imperial Bank of Commerce | 654,600 | | 51,489,738 |
National Bank of Canada | 300,000 | | 23,182,979 |
Royal Bank of Canada | 3,430,000 | | 195,548,632 |
The Toronto-Dominion Bank | 2,263,800 | | 184,118,622 |
| | 678,775,515 |
Consumer Finance - 0.2% |
Discover Financial Services | 150,000 | | 6,150,000 |
Insurance - 3.1% |
Fairfax Financial Holdings Ltd. (sub. vtg.) | 40,000 | | 14,838,949 |
Intact Financial Corp. | 660,925 | | 40,532,322 |
Manulife Financial Corp. | 2,000,000 | | 24,710,889 |
Sun Life Financial, Inc. | 900,000 | | 22,320,901 |
| | 102,403,061 |
Real Estate Investment Trusts - 2.0% |
Boardwalk (REIT) | 200,000 | | 12,870,088 |
H&R REIT/H&R Finance Trust | 600,000 | | 14,496,120 |
RioCan (REIT) | 1,400,000 | | 38,183,730 |
| | 65,549,938 |
Real Estate Management & Development - 1.9% |
Brookfield Asset Management, Inc.
Class A | 1,550,000 | | 53,355,695 |
Brookfield Properties Corp. | 700,000 | | 10,779,474 |
| | 64,135,169 |
TOTAL FINANCIALS | | 940,382,895 |
Common Stocks - continued |
| Shares | | Value |
HEALTH CARE - 6.2% |
Health Care Providers & Services - 3.1% |
Catamaran Corp. (a) | 2,206,468 | | $ 103,612,865 |
Pharmaceuticals - 3.1% |
Valeant Pharmaceuticals International, Inc. (Canada) (a) | 1,831,471 | | 102,323,987 |
TOTAL HEALTH CARE | | 205,936,852 |
INDUSTRIALS - 4.8% |
Machinery - 0.1% |
Westport Innovations, Inc. (a)(d) | 100,000 | | 2,806,001 |
Road & Rail - 4.5% |
Canadian National Railway Co. | 1,140,000 | | 98,436,646 |
Canadian Pacific | 550,000 | | 50,597,247 |
| | 149,033,893 |
Trading Companies & Distributors - 0.2% |
Finning International, Inc. | 300,000 | | 7,043,805 |
TOTAL INDUSTRIALS | | 158,883,699 |
INFORMATION TECHNOLOGY - 3.1% |
Communications Equipment - 0.2% |
Research In Motion Ltd. (a) | 700,000 | | 5,551,002 |
Computers & Peripherals - 0.3% |
Apple, Inc. | 17,000 | | 10,116,700 |
Internet Software & Services - 0.9% |
eBay, Inc. (a) | 400,000 | | 19,316,000 |
Open Text Corp. (a) | 170,407 | | 9,158,896 |
| | 28,474,896 |
IT Services - 1.7% |
CGI Group, Inc. Class A (sub. vtg.) (a) | 2,190,000 | | 57,296,320 |
Software - 0.0% |
Constellation Software, Inc. | 10,000 | | 1,147,034 |
TOTAL INFORMATION TECHNOLOGY | | 102,585,952 |
MATERIALS - 18.0% |
Chemicals - 1.8% |
Agrium, Inc. | 500,000 | | 52,655,820 |
Methanex Corp. | 200,000 | | 5,995,494 |
| | 58,651,314 |
Metals & Mining - 16.2% |
Agnico-Eagle Mines Ltd. (Canada) | 900,000 | | 50,814,518 |
Alamos Gold, Inc. | 250,000 | | 4,893,617 |
Barrick Gold Corp. | 2,230,000 | | 90,182,428 |
Copper Mountain Mining Corp. (a) | 390,000 | | 1,577,572 |
Detour Gold Corp. (a) | 100,000 | | 2,817,522 |
Eldorado Gold Corp. | 2,005,000 | | 29,630,839 |
|
| Shares | | Value |
First Majestic Silver Corp. (a) | 100,000 | | $ 2,311,890 |
First Quantum Minerals Ltd. | 1,630,000 | | 36,639,299 |
Franco-Nevada Corp. | 500,000 | | 28,790,989 |
Goldcorp, Inc. | 2,550,000 | | 115,276,596 |
IAMGOLD Corp. | 700,000 | | 10,863,579 |
Kinross Gold Corp. | 2,800,000 | | 27,810,763 |
New Gold, Inc. (a) | 1,200,000 | | 14,045,557 |
Silver Wheaton Corp. | 1,125,900 | | 45,374,193 |
Tahoe Resources, Inc. (a) | 350,000 | | 7,134,919 |
Teck Resources Ltd. Class B
(sub. vtg.) | 600,000 | | 19,043,805 |
Turquoise Hill Resources Ltd. (a) | 100,000 | | 781,977 |
Yamana Gold, Inc. | 2,500,000 | | 50,488,110 |
| | 538,478,173 |
TOTAL MATERIALS | | 597,129,487 |
TELECOMMUNICATION SERVICES - 5.6% |
Diversified Telecommunication Services - 4.5% |
BCE, Inc. | 1,900,000 | | 83,057,822 |
Manitoba Telecom Services, Inc. | 150,000 | | 5,035,795 |
TELUS Corp. | 950,000 | | 61,675,094 |
| | 149,768,711 |
Wireless Telecommunication Services - 1.1% |
Rogers Communications, Inc.
Class B (non-vtg.) | 800,000 | | 35,115,895 |
TOTAL TELECOMMUNICATION SERVICES | | 184,884,606 |
UTILITIES - 0.2% |
Electric Utilities - 0.2% |
Fortis, Inc. | 200,000 | | 6,762,453 |
TOTAL COMMON STOCKS (Cost $2,549,774,434) |
3,295,534,630
|
Money Market Funds - 0.6% |
| | | |
Fidelity Cash Central Fund, 0.19% (b) | 13,194,244 | | 13,194,244 |
Fidelity Securities Lending Cash Central Fund, 0.19% (b)(c) | 5,266,702 | | 5,266,702 |
TOTAL MONEY MARKET FUNDS (Cost $18,460,946) |
18,460,946
|
TOTAL INVESTMENT PORTFOLIO - 99.9% (Cost $2,568,235,380) | | 3,313,995,576 |
NET OTHER ASSETS (LIABILITIES) - 0.1% | | 3,373,680 |
NET ASSETS - 100% | $ 3,317,369,256 |
Legend |
(a) Non-income producing |
(b) Affiliated fund that is available only to investment companies and other accounts managed by Fidelity Investments. The rate quoted is the annualized seven-day yield of the fund at period end. A complete unaudited listing of the fund's holdings as of its most recent quarter end is available upon request. In addition, each Fidelity Central Fund's financial statements, which are not covered by the Fund's Report of Independent Registered Public Accounting Firm, are available on the SEC's website or upon request. |
(c) Investment made with cash collateral received from securities on loan. |
(d) Security or a portion of the security is on loan at period end. |
(e) Security exempt from registration under Rule 144A of the Securities Act of 1933. These securities may be resold in transactions exempt from registration, normally to qualified institutional buyers. At the end of the period, the value of these securities amounted to $13,359,098 or 0.4% of net assets. |
Affiliated Central Funds |
Information regarding fiscal year to date income earned by the Fund from investments in Fidelity Central Funds is as follows: |
Fund | Income earned |
Fidelity Cash Central Fund | $ 44,834 |
Fidelity Securities Lending Cash Central Fund | 3,887,175 |
Total | $ 3,932,009 |
Other Information |
All investments are categorized as Level 1 under the Fair Value Hierarchy. The inputs or methodology used for valuing securities may not be an indication of the risk associated with investing in those securities. For more information on valuation inputs, please refer to the Security Valuation section in the accompanying Notes to Financial Statements. |
See accompanying notes which are an integral part of the financial statements.
Annual Report
Fidelity Canada Fund
Statement of Assets and Liabilities
| October 31, 2012 |
| | |
Assets | | |
Investment in securities, at value (including securities loaned of $5,503,902) - See accompanying schedule: Unaffiliated issuers (cost $2,549,774,434) | $ 3,295,534,630 | |
Fidelity Central Funds (cost $18,460,946) | 18,460,946 | |
Total Investments (cost $2,568,235,380) | | $ 3,313,995,576 |
Cash | | 21,250 |
Foreign currency held at value (cost $2,060,308) | | 2,060,332 |
Receivable for investments sold | | 9,935,950 |
Receivable for fund shares sold | | 1,517,468 |
Dividends receivable | | 4,109,324 |
Distributions receivable from Fidelity Central Funds | | 59,330 |
Other receivables | | 14,400 |
Total assets | | 3,331,713,630 |
| | |
Liabilities | | |
Payable for fund shares redeemed | 6,635,280 | |
Accrued management fee | 1,512,106 | |
Distribution and service plan fees payable | 111,491 | |
Other affiliated payables | 742,785 | |
Other payables and accrued expenses | 76,010 | |
Collateral on securities loaned, at value | 5,266,702 | |
Total liabilities | | 14,344,374 |
| | |
Net Assets | | $ 3,317,369,256 |
Net Assets consist of: | | |
Paid in capital | | $ 2,827,898,108 |
Undistributed net investment income | | 34,776,724 |
Accumulated undistributed net realized gain (loss) on investments and foreign currency transactions | | (291,046,123) |
Net unrealized appreciation (depreciation) on investments and assets and liabilities in foreign currencies | | 745,740,547 |
Net Assets | | $ 3,317,369,256 |
Statement of Assets and Liabilities - continued
| October 31, 2012 |
| | |
Calculation of Maximum Offering Price Class A:
Net Asset Value and redemption price per share ($159,597,483 ÷ 2,975,053 shares) | | $ 53.65 |
| | |
Maximum offering price per share (100/94.25 of $53.65) | | $ 56.92 |
Class T:
Net Asset Value and redemption price per share ($29,625,811 ÷ 553,936 shares) | | $ 53.48 |
| | |
Maximum offering price per share (100/96.50 of $53.48) | | $ 55.42 |
Class B:
Net Asset Value and offering price per share ($9,803,560 ÷ 185,371 shares)A | | $ 52.89 |
| | |
Class C:
Net Asset Value and offering price per share ($66,500,018 ÷ 1,263,941 shares)A | | $ 52.61 |
| | |
Canada:
Net Asset Value, offering price and redemption price per share ($2,992,597,323 ÷ 55,370,497 shares) | | $ 54.05 |
| | |
Institutional Class:
Net Asset Value, offering price and redemption price per share ($59,245,061 ÷ 1,098,973 shares) | | $ 53.91 |
A Redemption price per share is equal to net asset value less any applicable contingent deferred sales charge.
See accompanying notes which are an integral part of the financial statements.
Annual Report
Statement of Operations
| Year ended October 31, 2012 |
Investment Income | | |
Dividends | | $ 89,193,450 |
Interest | | 976 |
Income from Fidelity Central Funds | | 3,932,009 |
Income before foreign taxes withheld | | 93,126,435 |
Less foreign taxes withheld | | (13,007,969) |
Total income | | 80,118,466 |
| | |
Expenses | | |
Management fee | | |
Basic fee | $ 26,006,550 | |
Performance adjustment | (7,737,368) | |
Transfer agent fees | 8,217,902 | |
Distribution and service plan fees | 1,473,188 | |
Accounting and security lending fees | 1,518,335 | |
Custodian fees and expenses | 53,185 | |
Independent trustees' compensation | 24,641 | |
Registration fees | 118,560 | |
Audit | 72,750 | |
Legal | 19,835 | |
Interest | 4,274 | |
Miscellaneous | 47,776 | |
Total expenses before reductions | 29,819,628 | |
Expense reductions | (54,667) | 29,764,961 |
Net investment income (loss) | | 50,353,505 |
Realized and Unrealized Gain (Loss) Net realized gain (loss) on: | | |
Investment securities: | | |
Unaffiliated issuers | (17,620,339) | |
Foreign currency transactions | (450,336) | |
Total net realized gain (loss) | | (18,070,675) |
Change in net unrealized appreciation (depreciation) on: Investment securities | 100,622,640 | |
Assets and liabilities in foreign currencies | (46,625) | |
Total change in net unrealized appreciation (depreciation) | | 100,576,015 |
Net gain (loss) | | 82,505,340 |
Net increase (decrease) in net assets resulting from operations | | $ 132,858,845 |
Statement of Changes in Net Assets
| Year ended
October 31,
2012 | Year ended
October 31,
2011 |
Increase (Decrease) in Net Assets | | |
Operations | | |
Net investment income (loss) | $ 50,353,505 | $ 41,545,130 |
Net realized gain (loss) | (18,070,675) | 43,297,359 |
Change in net unrealized appreciation (depreciation) | 100,576,015 | (192,122,126) |
Net increase (decrease) in net assets resulting from operations | 132,858,845 | (107,279,637) |
Distributions to shareholders from net investment income | (36,731,380) | (35,317,815) |
Distributions to shareholders from net realized gain | (22,566,448) | (35,060,747) |
Total distributions | (59,297,828) | (70,378,562) |
Share transactions - net increase (decrease) | (952,875,100) | 103,024,419 |
Redemption fees | 257,398 | 1,146,266 |
Total increase (decrease) in net assets | (879,056,685) | (73,487,514) |
| | |
Net Assets | | |
Beginning of period | 4,196,425,941 | 4,269,913,455 |
End of period (including undistributed net investment income of $34,776,724 and undistributed net investment income of $25,762,870, respectively) | $ 3,317,369,256 | $ 4,196,425,941 |
See accompanying notes which are an integral part of the financial statements.
Annual Report
Financial Highlights - Class A
Years ended October 31, | 2012 | 2011 | 2010 | 2009 | 2008 |
Selected Per-Share Data | | | | | |
Net asset value, beginning of period | $ 52.20 | $ 53.81 | $ 44.24 | $ 38.20 | $ 70.16 |
Income from Investment Operations | | | | | |
Net investment income (loss) C | .57 | .34 | .31 | .38 | .39 |
Net realized and unrealized gain (loss) | 1.50 | (1.17) | 9.64 | 5.72 | (28.71) |
Total from investment operations | 2.07 | (.83) | 9.95 | 6.10 | (28.32) |
Distributions from net investment income | (.33) | (.35) | (.39) | (.07) | (.41) |
Distributions from net realized gain | (.29) | (.44) | - | - | (3.27) |
Total distributions | (.62) | (.79) | (.39) | (.07) | (3.68) |
Redemption fees added to paid in capital C | - G | .01 | .01 | .01 | .04 |
Net asset value, end of period | $ 53.65 | $ 52.20 | $ 53.81 | $ 44.24 | $ 38.20 |
Total Return A,B | 4.04% | (1.64)% | 22.62% | 16.08% | (42.23)% |
Ratios to Average Net Assets D,F | | | | | |
Expenses before reductions | 1.08% | 1.12% | 1.24% | 1.42% | 1.34% |
Expenses net of fee waivers, if any | 1.08% | 1.12% | 1.24% | 1.42% | 1.34% |
Expenses net of all reductions | 1.08% | 1.12% | 1.18% | 1.39% | 1.31% |
Net investment income (loss) | 1.11% | .59% | .63% | .98% | .69% |
Supplemental Data | | | | | |
Net assets, end of period (000 omitted) | $ 159,597 | $ 215,369 | $ 170,446 | $ 83,015 | $ 56,242 |
Portfolio turnover rate E | 86% | 104% | 143% | 123% | 63% |
A Total returns would have been lower if certain expenses had not been reduced during the applicable periods shown. B Total returns do not include the effect of the sales charges. C Calculated based on average shares outstanding during the period. D Fees and expenses of any underlying Fidelity Central Funds are not included in the Fund's expense ratio. The Fund indirectly bears its proportionate share of the expenses of any underlying Fidelity Central Funds. E Amount does not include the portfolio activity of any underlying Fidelity Central Funds. F Expense ratios reflect operating expenses of the class. Expenses before reductions do not reflect amounts reimbursed by the investment adviser or reductions from brokerage service arrangements or reductions from other expense offset arrangements and do not represent the amount paid by the class during periods when reimbursements or reductions occur. Expenses net of fee waivers reflect expenses after reimbursement by the investment adviser but prior to reductions from brokerage service arrangements or other expense offset arrangements. Expenses net of all reductions represent the net expenses paid by the class. G Amount represents less than $.01 per share. |
Financial Highlights - Class T
Years ended October 31, | 2012 | 2011 | 2010 | 2009 | 2008 |
Selected Per-Share Data | | | | | |
Net asset value, beginning of period | $ 52.01 | $ 53.64 | $ 44.11 | $ 38.10 | $ 70.09 |
Income from Investment Operations | | | | | |
Net investment income (loss) C | .43 | .17 | .18 | .27 | .23 |
Net realized and unrealized gain (loss) | 1.49 | (1.16) | 9.60 | 5.73 | (28.66) |
Total from investment operations | 1.92 | (.99) | 9.78 | 6.00 | (28.43) |
Distributions from net investment income | (.16) | (.21) | (.26) | - | (.33) |
Distributions from net realized gain | (.29) | (.44) | - | - | (3.27) |
Total distributions | (.45) | (.65) | (.26) | - | (3.60) |
Redemption fees added to paid in capital C | - G | .01 | .01 | .01 | .04 |
Net asset value, end of period | $ 53.48 | $ 52.01 | $ 53.64 | $ 44.11 | $ 38.10 |
Total Return A,B | 3.74% | (1.93)% | 22.27% | 15.77% | (42.40)% |
Ratios to Average Net Assets D,F | | | | | |
Expenses before reductions | 1.36% | 1.42% | 1.51% | 1.70% | 1.63% |
Expenses net of fee waivers, if any | 1.36% | 1.42% | 1.51% | 1.70% | 1.63% |
Expenses net of all reductions | 1.36% | 1.42% | 1.46% | 1.67% | 1.60% |
Net investment income (loss) | .83% | .30% | .36% | .71% | .40% |
Supplemental Data | | | | | |
Net assets, end of period (000 omitted) | $ 29,626 | $ 34,323 | $ 31,522 | $ 17,727 | $ 14,963 |
Portfolio turnover rate E | 86% | 104% | 143% | 123% | 63% |
A Total returns would have been lower if certain expenses had not been reduced during the applicable periods shown. B Total returns do not include the effect of the sales charges. C Calculated based on average shares outstanding during the period. D Fees and expenses of any underlying Fidelity Central Funds are not included in the Fund's expense ratio. The Fund indirectly bears its proportionate share of the expenses of any underlying Fidelity Central Funds. E Amount does not include the portfolio activity of any underlying Fidelity Central Funds. F Expense ratios reflect operating expenses of the class. Expenses before reductions do not reflect amounts reimbursed by the investment adviser or reductions from brokerage service arrangements or reductions from other expense offset arrangements and do not represent the amount paid by the class during periods when reimbursements or reductions occur. Expenses net of fee waivers reflect expenses after reimbursement by the investment adviser but prior to reductions from brokerage service arrangements or other expense offset arrangements. Expenses net of all reductions represent the net expenses paid by the class. G Amount represents less than $.01 per share. |
See accompanying notes which are an integral part of the financial statements.
Annual Report
Financial Highlights - Class B
Years ended October 31, | 2012 | 2011 | 2010 | 2009 | 2008 |
Selected Per-Share Data | | | | | |
Net asset value, beginning of period | $ 51.37 | $ 53.03 | $ 43.68 | $ 37.91 | $ 69.88 |
Income from Investment Operations | | | | | |
Net investment income (loss) C | .17 | (.11) | (.07) | .08 | (.06) |
Net realized and unrealized gain (loss) | 1.49 | (1.14) | 9.50 | 5.68 | (28.54) |
Total from investment operations | 1.66 | (1.25) | 9.43 | 5.76 | (28.60) |
Distributions from net investment income | - | (.01) | (.09) | - | (.14) |
Distributions from net realized gain | (.14) | (.41) | - | - | (3.27) |
Total distributions | (.14) | (.42) | (.09) | - | (3.41) |
Redemption fees added to paid in capital C | - G | .01 | .01 | .01 | .04 |
Net asset value, end of period | $ 52.89 | $ 51.37 | $ 53.03 | $ 43.68 | $ 37.91 |
Total Return A,B | 3.25% | (2.41)% | 21.64% | 15.22% | (42.68)% |
Ratios to Average Net Assets D,F | | | | | |
Expenses before reductions | 1.85% | 1.91% | 2.01% | 2.19% | 2.13% |
Expenses net of fee waivers, if any | 1.85% | 1.91% | 2.01% | 2.19% | 2.13% |
Expenses net of all reductions | 1.85% | 1.91% | 1.96% | 2.16% | 2.10% |
Net investment income (loss) | .34% | (.20)% | (.14)% | .21% | (.10)% |
Supplemental Data | | | | | |
Net assets, end of period (000 omitted) | $ 9,804 | $ 11,866 | $ 13,464 | $ 7,283 | $ 5,615 |
Portfolio turnover rate E | 86% | 104% | 143% | 123% | 63% |
A Total returns would have been lower if certain expenses had not been reduced during the applicable periods shown. B Total returns do not include the effect of the contingent deferred sales charge. C Calculated based on average shares outstanding during the period. D Fees and expenses of any underlying Fidelity Central Funds are not included in the Fund's expense ratio. The Fund indirectly bears its proportionate share of the expenses of any underlying Fidelity Central Funds. E Amount does not include the portfolio activity of any underlying Fidelity Central Funds. F Expense ratios reflect operating expenses of the class. Expenses before reductions do not reflect amounts reimbursed by the investment adviser or reductions from brokerage service arrangements or reductions from other expense offset arrangements and do not represent the amount paid by the class during periods when reimbursements or reductions occur. Expenses net of fee waivers reflect expenses after reimbursement by the investment adviser but prior to reductions from brokerage service arrangements or other expense offset arrangements. Expenses net of all reductions represent the net expenses paid by the class. G Amount represents less than $.01 per share. |
Financial Highlights - Class C
Years ended October 31, | 2012 | 2011 | 2010 | 2009 | 2008 |
Selected Per-Share Data | | | | | |
Net asset value, beginning of period | $ 51.19 | $ 52.87 | $ 43.60 | $ 37.84 | $ 69.91 |
Income from Investment Operations | | | | | |
Net investment income (loss) C | .19 | (.08) | (.06) | .09 | (.05) |
Net realized and unrealized gain (loss) | 1.46 | (1.14) | 9.48 | 5.66 | (28.52) |
Total from investment operations | 1.65 | (1.22) | 9.42 | 5.75 | (28.57) |
Distributions from net investment income | - | (.03) | (.16) | - | (.27) |
Distributions from net realized gain | (.23) | (.44) | - | - | (3.27) |
Total distributions | (.23) | (.47) | (.16) | - | (3.54) |
Redemption fees added to paid in capital C | - G | .01 | .01 | .01 | .04 |
Net asset value, end of period | $ 52.61 | $ 51.19 | $ 52.87 | $ 43.60 | $ 37.84 |
Total Return A,B | 3.26% | (2.36)% | 21.68% | 15.22% | (42.69)% |
Ratios to Average Net Assets D,F | | | | | |
Expenses before reductions | 1.82% | 1.86% | 1.99% | 2.18% | 2.13% |
Expenses net of fee waivers, if any | 1.82% | 1.86% | 1.99% | 2.18% | 2.13% |
Expenses net of all reductions | 1.82% | 1.86% | 1.94% | 2.15% | 2.10% |
Net investment income (loss) | .37% | (.15)% | (.12)% | .22% | (.10)% |
Supplemental Data | | | | | |
Net assets, end of period (000 omitted) | $ 66,500 | $ 87,990 | $ 54,052 | $ 24,848 | $ 16,716 |
Portfolio turnover rate E | 86% | 104% | 143% | 123% | 63% |
A Total returns would have been lower if certain expenses had not been reduced during the applicable periods shown. B Total returns do not include the effect of the contingent deferred sales charge. C Calculated based on average shares outstanding during the period. D Fees and expenses of any underlying Fidelity Central Funds are not included in the Fund's expense ratio. The Fund indirectly bears its proportionate share of the expenses of any underlying Fidelity Central Funds. E Amount does not include the portfolio activity of any underlying Fidelity Central Funds. F Expense ratios reflect operating expenses of the class. Expenses before reductions do not reflect amounts reimbursed by the investment adviser or reductions from brokerage service arrangements or reductions from other expense offset arrangements and do not represent the amount paid by the class during periods when reimbursements or reductions occur. Expenses net of fee waivers reflect expenses after reimbursement by the investment adviser but prior to reductions from brokerage service arrangements or other expense offset arrangements. Expenses net of all reductions represent the net expenses paid by the class. G Amount represents less than $.01 per share. |
See accompanying notes which are an integral part of the financial statements.
Annual Report
Financial Highlights - Canada
Years ended October 31, | 2012 | 2011 | 2010 | 2009 | 2008 |
Selected Per-Share Data | | | | | |
Net asset value, beginning of period | $ 52.59 | $ 54.14 | $ 44.46 | $ 38.37 | $ 70.25 |
Income from Investment Operations | | | | | |
Net investment income (loss) B | .73 | .52 | .46 | .48 | .58 |
Net realized and unrealized gain (loss) | 1.51 | (1.18) | 9.68 | 5.74 | (28.83) |
Total from investment operations | 2.24 | (.66) | 10.14 | 6.22 | (28.25) |
Distributions from net investment income | (.49) | (.46) | (.47) | (.14) | (.40) |
Distributions from net realized gain | (.29) | (.44) | - | - | (3.27) |
Total distributions | (.78) | (.90) | (.47) | (.14) | (3.67) |
Redemption fees added to paid in capital B | - F | .01 | .01 | .01 | .04 |
Net asset value, end of period | $ 54.05 | $ 52.59 | $ 54.14 | $ 44.46 | $ 38.37 |
Total Return A | 4.36% | (1.33)% | 22.97% | 16.40% | (42.06)% |
Ratios to Average Net Assets C,E | | | | | |
Expenses before reductions | .77% | .82% | .94% | 1.17% | 1.03% |
Expenses net of fee waivers, if any | .77% | .82% | .94% | 1.17% | 1.03% |
Expenses net of all reductions | .77% | .82% | .89% | 1.13% | 1.00% |
Net investment income (loss) | 1.42% | .90% | .93% | 1.24% | 1.00% |
Supplemental Data | | | | | |
Net assets, end of period (000 omitted) | $ 2,992,597 | $ 3,778,765 | $ 3,953,693 | $ 3,149,791 | $ 2,776,298 |
Portfolio turnover rate D | 86% | 104% | 143% | 123% | 63% |
A Total returns would have been lower if certain expenses had not been reduced during the applicable periods shown. B Calculated based on average shares outstanding during the period. C Fees and expenses of any underlying Fidelity Central Funds are not included in the Fund's expense ratio. The Fund indirectly bears its proportionate share of the expenses of any underlying Fidelity Central Funds. D Amount does not include the portfolio activity of any underlying Fidelity Central Funds. E Expense ratios reflect operating expenses of the class. Expenses before reductions do not reflect amounts reimbursed by the investment adviser or reductions from brokerage service arrangements or reductions from other expense offset arrangements and do not represent the amount paid by the class during periods when reimbursements or reductions occur. Expenses net of fee waivers reflect expenses after reimbursement by the investment adviser but prior to reductions from brokerage service arrangements or other expense offset arrangements. Expenses net of all reductions represent the net expenses paid by the class. F Amount represents less than $.01 per share. |
Financial Highlights - Institutional Class
Years ended October 31, | 2012 | 2011 | 2010 | 2009 | 2008 |
Selected Per-Share Data | | | | | |
Net asset value, beginning of period | $ 52.44 | $ 54.02 | $ 44.39 | $ 38.31 | $ 70.25 |
Income from Investment Operations | | | | | |
Net investment income (loss) B | .74 | .51 | .46 | .49 | .52 |
Net realized and unrealized gain (loss) | 1.50 | (1.18) | 9.65 | 5.72 | (28.78) |
Total from investment operations | 2.24 | (.67) | 10.11 | 6.21 | (28.26) |
Distributions from net investment income | (.48) | (.48) | (.49) | (.14) | (.45) |
Distributions from net realized gain | (.29) | (.44) | - | - | (3.27) |
Total distributions | (.77) | (.92) | (.49) | (.14) | (3.72) |
Redemption fees added to paid in capital B | - F | .01 | .01 | .01 | .04 |
Net asset value, end of period | $ 53.91 | $ 52.44 | $ 54.02 | $ 44.39 | $ 38.31 |
Total Return A | 4.38% | (1.35)% | 22.94% | 16.40% | (42.11)% |
Ratios to Average Net Assets C,E | | | | | |
Expenses before reductions | .76% | .82% | .95% | 1.17% | 1.11% |
Expenses net of fee waivers, if any | .76% | .82% | .95% | 1.17% | 1.11% |
Expenses net of all reductions | .76% | .82% | .90% | 1.14% | 1.08% |
Net investment income (loss) | 1.42% | .89% | .92% | 1.23% | .92% |
Supplemental Data | | | | | |
Net assets, end of period (000 omitted) | $ 59,245 | $ 68,112 | $ 46,737 | $ 17,956 | $ 8,870 |
Portfolio turnover rate D | 86% | 104% | 143% | 123% | 63% |
A Total returns would have been lower if certain expenses had not been reduced during the applicable periods shown. B Calculated based on average shares outstanding during the period. C Fees and expenses of any underlying Fidelity Central Funds are not included in the Fund's expense ratio. The Fund indirectly bears its proportionate share of the expenses of any underlying Fidelity Central Funds. D Amount does not include the portfolio activity of any underlying Fidelity Central Funds. E Expense ratios reflect operating expenses of the class. Expenses before reductions do not reflect amounts reimbursed by the investment adviser or reductions from brokerage service arrangements or reductions from other expense offset arrangements and do not represent the amount paid by the class during periods when reimbursements or reductions occur. Expenses net of fee waivers reflect expenses after reimbursement by the investment adviser but prior to reductions from brokerage service arrangements or other expense offset arrangements. Expenses net of all reductions represent the net expenses paid by the class. F Amount represents less than $.01 per share. |
See accompanying notes which are an integral part of the financial statements.
Annual Report
Notes to Financial Statements
For the period ended October 31, 2012
1. Organization.
Fidelity Canada Fund (the Fund) is a fund of Fidelity Investment Trust (the Trust) and is authorized to issue an unlimited number of shares. The Trust is registered under the Investment Company Act of 1940, as amended (the 1940 Act), as an open-end management investment company organized as a Massachusetts business trust. The Fund offers Class A, Class T, Class C, Canada, and Institutional Class shares, each of which, along with Class B shares, has equal rights as to assets and voting privileges. Effective after the close of business on September 1, 2010, Class B shares were closed to new accounts and additional purchases, except for exchanges and reinvestments. Each class has exclusive voting rights with respect to matters that affect that class. Class B shares will automatically convert to Class A shares after a holding period of seven years from the initial date of purchase. Investment income, realized and unrealized capital gains and losses, the common expenses of the Fund, and certain fund-level expense reductions, if any, are allocated on a pro-rata basis to each class based on the relative net assets of each class to the total net assets of the Fund. Each class differs with respect to transfer agent and distribution and service plan fees incurred. Certain expense reductions may also differ by class.
2. Investments in Fidelity Central Funds.
The Fund invests in Fidelity Central Funds, which are open-end investment companies available only to other investment companies and accounts managed by Fidelity Management & Research Company (FMR) and its affiliates. The Fund's Schedule of Investments lists each of the Fidelity Central Funds held as of period end, if any, as an investment of the Fund, but does not include the underlying holdings of each Fidelity Central Fund. As an Investing Fund, the Fund indirectly bears its proportionate share of the expenses of the underlying Fidelity Central Funds.
The Money Market Central Funds seek preservation of capital and current income and are managed by Fidelity Investments Money Management, Inc. (FIMM), an affiliate of FMR.
A complete unaudited list of holdings for each Fidelity Central Fund is available upon request or at the Securities and Exchange Commission (the SEC) web site at www.sec.gov. In addition, the financial statements of the Fidelity Central Funds, which are not covered by the Fund's Report of Independent Registered Public Accounting Firm, are available on the SEC web site or upon request.
3. Significant Accounting Policies.
The financial statements have been prepared in conformity with accounting principles generally accepted in the United States of America (GAAP), which require management to make certain estimates and assumptions at the date of the financial statements. Actual results could differ from those estimates. Subsequent events, if any, through the date that the financial statements were issued have been evaluated in the preparation of the financial statements. The following summarizes the significant accounting policies of the Fund:
Security Valuation. Investments are valued as of 4:00 p.m. Eastern time on the last calendar day of the period. In accordance with valuation policies and procedures approved by the Board of Trustees (the Board), the Fund attempts to obtain prices from one or more third party pricing vendors or brokers to value its investments. When current market prices, quotations or rates are not readily available or reliable, securities will be fair valued in good faith by the FMR Fair Value Committee (the Committee), in accordance with procedures adopted by the Fund's Board. Factors used in determining fair value vary by security type and may include market or security specific events. The frequency with which these procedures are used cannot be predicted and they may be utilized to a significant extent. The Committee oversees the Fund's valuation policies and procedures and is responsible for approving and reporting to the Board all fair value determinations.
The Fund categorizes the inputs to valuation techniques used to value its investments into a disclosure hierarchy consisting of three levels as shown below:
Level 1 - quoted prices in active markets for identical investments
Level 2 - other significant observable inputs (including quoted prices for similar investments, interest rates, prepayment speeds, etc.)
Level 3 - unobservable inputs (including the Fund's own assumptions based on the best information available)
Valuation techniques used to value the Fund's investments by major category are as follows:
Equity securities, including restricted securities, for which market quotations are readily available, are valued at the last reported sale price or official closing price as reported by a third party pricing vendor on the primary market or exchange on which they are traded and are categorized as Level 1 in the hierarchy. In the event there were no sales during the day or closing prices are not available, securities are valued at the last quoted bid price or may be valued using the last available price and are generally categorized as Level 2 in the hierarchy. For foreign equity securities, when significant market or security specific events arise, comparisons to the valuation of American Depositary Receipts (ADRs), futures contracts, Exchange-Traded Funds (ETFs) and certain indexes as well as quoted prices for similar securities are used and are categorized as Level 2 in the hierarchy. Utilizing these techniques may result in transfers between Level 1 and Level 2.
Annual Report
3. Significant Accounting Policies - continued
Security Valuation - continued
Investments in open-end mutual funds, including the Fidelity Central Funds, are valued at their closing net asset value (NAV) each business day and are categorized as Level 1 in the hierarchy.
Changes in valuation techniques may result in transfers in or out of an assigned level within the disclosure hierarchy.
Foreign Currency Translation. The Fund may use foreign currency contracts to facilitate transactions in foreign-denominated securities. Gains and losses from these transactions may arise from changes in the value of the foreign currency or if the counterparties do not perform under the contracts' terms.
Foreign-denominated assets, including investment securities, and liabilities are translated into U.S. dollars at the exchange rates at period end. Purchases and sales of investment securities, income and dividends received and expenses denominated in foreign currencies are translated into U.S. dollars at the exchange rate in effect on the transaction date.
The effects of exchange rate fluctuations on investments are included with the net realized and unrealized gain (loss) on investment securities. Other foreign currency transactions resulting in realized and unrealized gain (loss) are disclosed separately.
Investment Transactions and Income. For financial reporting purposes, the Fund's investment holdings and NAV include trades executed through the end of the last business day of the period. The NAV per share for processing shareholder transactions is calculated as of the close of business of the New York Stock Exchange (NYSE), normally 4:00 p.m. Eastern time and includes trades executed through the end of the prior business day. Gains and losses on securities sold are determined on the basis of identified cost and may include proceeds received from litigation. Dividend income is recorded on the ex-dividend date, except for certain dividends from foreign securities where the ex-dividend date may have passed, which are recorded as soon as the Fund is informed of the ex-dividend date. Non-cash dividends included in dividend income, if any, are recorded at the fair market value of the securities received. Distributions received on securities that represent a return of capital or capital gain are recorded as a reduction of cost of investments and/or as a realized gain. The Fund estimates the components of distributions received that may be considered return of capital distributions or capital gain distributions. Interest income and distributions from the Fidelity Central Funds are accrued as earned. Interest income includes coupon interest and amortization of premium and accretion of discount on debt securities. Investment income is recorded net of foreign taxes withheld where recovery of such taxes is uncertain.
Expenses. Expenses directly attributable to a fund are charged to that fund. Expenses attributable to more than one fund are allocated among the respective funds on the basis of relative net assets or other appropriate methods. Expense estimates are accrued in the period to which they relate and adjustments are made when actual amounts are known.
Income Tax Information and Distributions to Shareholders. Each year, the Fund intends to qualify as a regulated investment company under Subchapter M of the Internal Revenue Code, including distributing substantially all of its taxable income and realized gains. As a result, no provision for income taxes is required. As of October 31, 2012, the Fund did not have any unrecognized tax benefits in the financial statements; nor is the Fund aware of any tax positions for which it is reasonably possible that the total amounts of unrecognized tax benefits will significantly change in the next twelve months. The Fund files a U.S. federal tax return, in addition to state and local tax returns as required. A fund's federal income tax returns are subject to examination by the Internal Revenue Service (IRS) for a period of three fiscal years after they are filed. State and local tax returns may be subject to examination for an additional fiscal year depending on the jurisdiction. Foreign taxes are provided for based on the Fund's understanding of the tax rules and rates that exist in the foreign markets in which it invests.
Distributions are declared and recorded on the ex-dividend date. Income dividends and capital gain distributions are declared separately for each class. Income and capital gain distributions are determined in accordance with income tax regulations, which may differ from GAAP. In addition, the fund claimed a portion of the payment made to redeeming shareholders as a distribution for income tax purposes.
Capital accounts within the financial statements are adjusted for permanent book-tax differences. These adjustments have no impact on net assets or the results of operations. Temporary book-tax differences will reverse in a subsequent period.
Book-tax differences are primarily due to foreign currency transactions, passive foreign investment companies (PFIC), deferred trustees compensation, capital loss carryforwards and losses deferred due to wash sales.
The federal tax cost of investment securities and unrealized appreciation (depreciation) as of period end were as follows:
Gross unrealized appreciation | $ 769,644,661 |
Gross unrealized depreciation | (51,536,631) |
Net unrealized appreciation (depreciation) on securities and other investments | $ 718,108,030 |
| |
Tax Cost | $ 2,595,887,546 |
Annual Report
Notes to Financial Statements - continued
3. Significant Accounting Policies - continued
Income Tax Information and Distributions to Shareholders - continued
The tax-based components of distributable earnings as of period end were as follows:
Undistributed ordinary income | $ 34,776,967 |
Capital loss carryforward | $ (263,393,959) |
Net unrealized appreciation (depreciation) | $ 718,088,381 |
Capital loss carryforwards are only available to offset future capital gains of the Fund to the extent provided by regulations and may be limited. Under the Regulated Investment Company Modernization Act of 2010 (the Act), the Fund is permitted to carry forward capital losses incurred in taxable years beginning after December 22, 2010 for an unlimited period and such capital losses are required to be used prior to any losses that expire. Capital loss carryforwards were as follows:
Fiscal year of expiration | |
2016 | $ (79,471,942) |
2017 | (150,917,782) |
Total with expiration | (230,389,724) |
No expiration | |
Short-term | (33,004,235) |
Total capital loss carryforward | $ (263,393,959) |
The tax character of distributions paid was as follows:
| October 31, 2012 | October 31, 2011 |
Ordinary Income | $ 59,297,828 | $ 70,378,562 |
Short-Term Trading (Redemption) Fees. Shares held by investors in the Fund less than 90 days are subject to a redemption fee equal to 1.50% of the net asset value of shares redeemed. All redemption fees, which reduce the proceeds of the shareholder redemption, are retained by the Fund and accounted for as an addition to paid in capital.
Restricted Securities. The Fund may invest in securities that are subject to legal or contractual restrictions on resale. These securities generally may be resold in transactions exempt from registration or to the public if the securities are registered. Disposal of these securities may involve time-consuming negotiations and expense, and prompt sale at an acceptable price may be difficult. Information regarding restricted securities is included at the end of the Fund's Schedule of Investments.
New Accounting Pronouncement. In December 2011, the Financial Accounting Standards Board issued Accounting Standard Update No. 2011-11, Disclosures about Offsetting Assets and Liabilities. The update creates new disclosure requirements requiring entities to disclose both gross and net information for derivatives and other financial instruments that are either offset in the Statement of Assets and Liabilities or subject to an enforceable master netting arrangement or similar agreement. The disclosure requirements are effective for annual reporting periods beginning on or after January 1, 2013, and interim periods within those annual periods. Management is currently evaluating the impact of the update's adoption on the Fund's financial statement disclosures.
4. Purchases and Sales of Investments.
Purchases and sales of securities, other than short-term securities, aggregated $3,166,105,255 and $4,137,995,727, respectively.
5. Fees and Other Transactions with Affiliates.
Management Fee. FMR and its affiliates provide the Fund with investment management related services for which the Fund pays a monthly management fee. The management fee is the sum of an individual fund fee rate that is based on an annual rate of .45% of the Fund's average net assets and an annualized group fee rate that averaged .26% during the period. The group fee rate is based upon the average net assets of all the mutual funds advised by FMR. The group fee rate decreases as assets under management increase and increases as assets under management decrease. In addition, the management fee is subject to a performance adjustment (up to a maximum of ±.20% of the Fund's average net assets over a 36 month performance period). The upward or downward adjustment to the management fee is based on the relative investment performance of Canada as compared to an appropriate benchmark index. For the period, the total annual management fee rate, including the performance adjustment, was .50% of the Fund's average net assets.
Annual Report
5. Fees and Other Transactions with Affiliates - continued
Distribution and Service Plan Fees. In accordance with Rule 12b-1 of the 1940 Act, the Fund has adopted separate Distribution and Service Plans for each class of shares. Certain classes pay Fidelity Distributors Corporation (FDC), an affiliate of FMR, separate Distribution and Service Fees, each of which is based on an annual percentage of each class' average net assets. In addition, FDC may pay financial intermediaries for selling shares of the Fund and providing shareholder support services. For the period, the Distribution and Service Fee rates, total fees and amounts retained by FDC were as follows:
| Distribution
Fee | Service
Fee | Total Fees | Retained
by FDC |
Class A | -% | .25% | $ 453,416 | $ 24,371 |
Class T | .25% | .25% | 156,708 | 1,287 |
Class B | .75% | .25% | 106,696 | 80,189 |
Class C | .75% | .25% | 756,368 | 189,437 |
| | | $ 1,473,188 | $ 295,284 |
Sales Load. FDC may receive a front-end sales charge of up to 5.75% for selling Class A shares and 3.50% for selling Class T shares, some of which is paid to financial intermediaries for selling shares of the Fund. Depending on the holding period, FDC may receive contingent deferred sales charges levied on Class A, Class T, Class B and Class C redemptions. The deferred sales charges range from 5.00% to 1.00% for Class B shares, 1.00% for Class C shares, 1.00% for certain purchases of Class A shares and .25% for certain purchases of Class T shares.
For the period, sales charge amounts retained by FDC were as follows:
| Retained
by FDC |
Class A | $ 62,502 |
Class T | 9,357 |
Class B* | 21,585 |
Class C* | 22,491 |
| $ 115,935 |
* When Class B and Class C shares are initially sold, FDC pays commissions from its own resources to financial intermediaries through which the sales are made.
Transfer Agent Fees. Fidelity Investments Institutional Operations Company, Inc. (FIIOC), an affiliate of FMR, is the transfer, dividend disbursing and shareholder servicing agent for each class of the Fund. FIIOC receives account fees and asset-based fees that vary according to the account size and type of account of the shareholders of the respective classes of the Fund. FIIOC pays for typesetting, printing and mailing of shareholder reports, except proxy statements. For the period, transfer agent fees for each class were as follows:
| Amount | % of
Average
Net Assets |
Class A | $ 508,239 | .28 |
Class T | 96,227 | .31 |
Class B | 31,928 | .30 |
Class C | 201,488 | .27 |
Canada | 7,248,062 | .22 |
Institutional Class | 131,958 | .21 |
| $ 8,217,902 | |
Accounting and Security Lending Fees. Fidelity Service Company, Inc. (FSC), an affiliate of FMR, maintains the Fund's accounting records. The accounting fee is based on the level of average net assets for each month. Under a separate contract, FSC administers the security lending program. The security lending fee is based on the number and duration of lending transactions.
Brokerage Commissions. The Fund placed a portion of its portfolio transactions with brokerage firms which are affiliates of the investment adviser. The commissions paid to these affiliated firms were $18,194 for the period.
Annual Report
Notes to Financial Statements - continued
5. Fees and Other Transactions with Affiliates - continued
Interfund Lending Program. Pursuant to an Exemptive Order issued by the SEC, the Fund, along with other registered investment companies having management contracts with FMR, may participate in an interfund lending program. This program provides an alternative credit facility allowing the funds to borrow from, or lend money to, other participating affiliated funds. At period end, there were no interfund loans outstanding. The Fund's activity in this program during the period for which loans were outstanding was as follows:
Borrower or Lender | Average Loan
Balance | Weighted Average Interest Rate | Interest
Expense |
Borrower | $ 8,610,311 | .37% | $ 4,026 |
6. Committed Line of Credit.
The Fund participates with other funds managed by FMR or an affiliate in a $4.25 billion credit facility (the "line of credit") to be utilized for temporary or emergency purposes to fund shareholder redemptions or for other short-term liquidity purposes. The Fund has agreed to pay commitment fees on its pro-rata portion of the line of credit, which amounted to $10,364 and is reflected in Miscellaneous expenses on the Statement of Operations. During the period, there were no borrowings on this line of credit.
7. Security Lending.
The Fund lends portfolio securities through a lending agent from time to time in order to earn additional income. For equity securities, a lending agent is used and may loan securities to certain qualified borrowers, including Fidelity Capital Markets (FCM), a broker-dealer affiliated with the Fund. On the settlement date of the loan, the Fund receives collateral (in the form of U.S. Treasury obligations, letters of credit and/or cash) against the loaned securities and maintains collateral in an amount not less than 100% of the market value of the loaned securities during the period of the loan. The market value of the loaned securities is determined at the close of business of the Fund and any additional required collateral is delivered to the Fund on the next business day. If the borrower defaults on its obligation to return the securities loaned because of insolvency or other reasons, a fund could experience delays and costs in recovering the securities loaned or in gaining access to the collateral. Any cash collateral received is invested in the Fidelity Securities Lending Cash Central Fund. The value of loaned securities and cash collateral at period end are disclosed on the Fund's Statement of Assets and Liabilities. Security lending income represents the income earned on investing cash collateral, less rebates paid to borrowers and any lending agent fees associated with the loan, plus any premium payments received for lending certain types of securities. Security lending income is presented in the Statement of Operations as a component of income from Fidelity Central Funds. Total security lending income during the period amounted to $3,887,175. During the period, there were no securities loaned to FCM.
8. Bank Borrowings.
The Fund is permitted to have bank borrowings for temporary or emergency purposes to fund shareholder redemptions or for other short-term liquidity requirements. The Fund has established borrowing arrangements with certain banks. The interest rate on the borrowings is the bank's base rate, as revised from time to time. The average loan balance during the period for which loans were outstanding amounted to $7,821,000. The weighted average interest rate was .57%. The interest expense amounted to $248 under the bank borrowing program. At period end, there were no bank loans outstanding.
9. Expense Reductions.
Many of the brokers with whom FMR places trades on behalf of the Fund provided services to the Fund in addition to trade execution. These services included payments of certain expenses on behalf of the Fund totaling $54,667 for the period.
10. Distributions to Shareholders.
Distributions to shareholders of each class were as follows:
Years ended October 31, | 2012 | 2011 |
From net investment income | | |
Class A | $ 1,331,457 | $ 1,141,830 |
Class T | 100,888 | 123,341 |
Class B | - | 2,503 |
Class C | - | 36,231 |
Canada | 34,710,753 | 33,570,065 |
Institutional Class | 588,282 | 443,845 |
Total | $ 36,731,380 | $ 35,317,815 |
Annual Report
10. Distributions to Shareholders - continued
Years ended October 31, | 2012 | 2011 |
From net realized gain | | |
Class A | $ 1,169,578 | $ 1,445,324 |
Class T | 185,711 | 261,152 |
Class B | 32,050 | 101,491 |
Class C | 395,818 | 470,108 |
Canada | 20,430,566 | 32,375,322 |
Institutional Class | 352,725 | 407,350 |
Total | $ 22,566,448 | $ 35,060,747 |
11. Share Transactions.
Transactions for each class of shares were as follows:
| Shares | Dollars |
Years ended October 31, | 2012 | 2011 | 2012 | 2011 |
Class A | | | | |
Shares sold | 554,403 | 2,386,291 | $ 28,690,109 | $ 138,991,055 |
Reinvestment of distributions | 41,955 | 39,424 | 2,109,494 | 2,233,433 |
Shares redeemed | (1,747,243) | (1,467,607) | (89,985,257) | (82,665,471) |
Net increase (decrease) | (1,150,885) | 958,108 | $ (59,185,654) | $ 58,559,017 |
Class T | | | | |
Shares sold | 72,156 | 254,873 | $ 3,681,114 | $ 14,715,904 |
Reinvestment of distributions | 5,569 | 6,640 | 279,919 | 375,773 |
Shares redeemed | (183,751) | (189,243) | (9,407,140) | (10,669,184) |
Net increase (decrease) | (106,026) | 72,270 | $ (5,446,107) | $ 4,422,493 |
Class B | | | | |
Shares sold | 3,584 | 29,930 | $ 181,692 | $ 1,729,701 |
Reinvestment of distributions | 519 | 1,508 | 25,894 | 84,713 |
Shares redeemed | (49,710) | (54,348) | (2,528,127) | (3,060,843) |
Net increase (decrease) | (45,607) | (22,910) | $ (2,320,541) | $ (1,246,429) |
Class C | | | | |
Shares sold | 161,752 | 1,081,104 | $ 8,188,420 | $ 62,770,855 |
Reinvestment of distributions | 6,045 | 7,014 | 300,150 | 392,322 |
Shares redeemed | (622,861) | (391,485) | (31,505,606) | (21,249,300) |
Net increase (decrease) | (455,064) | 696,633 | $ (23,017,036) | $ 41,913,877 |
Canada | | | | |
Shares sold | 4,866,802 | 20,804,881 | $ 252,453,035 | $ 1,223,871,558 |
Reinvestment of distributions | 1,003,141 | 1,069,329 | 50,678,709 | 60,856,944 |
Shares redeemed | (22,354,268) | (23,043,159) | (1,155,960,861) | (1,313,818,426) |
Net increase (decrease) | (16,484,325) | (1,168,949) | $ (852,829,117) | $ (29,089,924) |
Institutional Class | | | | |
Shares sold | 561,510 | 1,331,261 | $ 29,055,185 | $ 79,262,853 |
Reinvestment of distributions | 13,162 | 10,934 | 663,252 | 620,606 |
Shares redeemed | (774,433) | (908,649) | (39,795,082) | (51,418,074) |
Net increase (decrease) | (199,761) | 433,546 | $ (10,076,645) | $ 28,465,385 |
12. Other.
The Fund's organizational documents provide former and current trustees and officers with a limited indemnification against liabilities arising in connection with the performance of their duties to the Fund. In the normal course of business, the Fund may also enter into contracts that provide general indemnifications. The Fund's maximum exposure under these arrangements is unknown as this would be dependent on future claims that may be made against the Fund. The risk of material loss from such claims is considered remote.
Annual Report
Report of Independent Registered Public Accounting Firm
To the Trustees of Fidelity Investment Trust and the Shareholders of Fidelity Canada Fund:
In our opinion, the accompanying statement of assets and liabilities, including the schedule of investments, and the related statements of operations and of changes in net assets and the financial highlights present fairly, in all material respects, the financial position of Fidelity Canada Fund (a fund of Fidelity Investment Trust) at October 31, 2012, the results of its operations for the year then ended, the changes in its net assets for each of the two years in the period then ended and the financial highlights for each of the five years in the period then ended, in conformity with accounting principles generally accepted in the United States of America. These financial statements and financial highlights (hereafter referred to as "financial statements") are the responsibility of the Fidelity Canada Fund's management. Our responsibility is to express an opinion on these financial statements based on our audits. We conducted our audits of these financial statements in accordance with the standards of the Public Company Accounting Oversight Board (United States). Those standards require that we plan and perform the audit to obtain reasonable assurance about whether the financial statements are free of material misstatement. An audit includes examining, on a test basis, evidence supporting the amounts and disclosures in the financial statements, assessing the accounting principles used and significant estimates made by management, and evaluating the overall financial statement presentation. We believe that our audits, which included confirmation of securities at October 31, 2012 by correspondence with the custodian and brokers, provide a reasonable basis for our opinion.
PricewaterhouseCoopers LLP
Boston, Massachusetts
December 18, 2012
Annual Report
The Trustees, Members of the Advisory Board, and executive officers of the trust and fund, as applicable, are listed below. The Board of Trustees governs the fund and is responsible for protecting the interests of shareholders. The Trustees are experienced executives who meet periodically throughout the year to oversee the fund's activities, review contractual arrangements with companies that provide services to the fund, oversee management of the risks associated with such activities and contractual arrangements, and review the fund's performance. Except for James C. Curvey, each of the Trustees oversees 236 funds advised by FMR or an affiliate. Mr. Curvey oversees 443 funds advised by FMR or an affiliate.
The Trustees hold office without limit in time except that (a) any Trustee may resign; (b) any Trustee may be removed by written instrument, signed by at least two-thirds of the number of Trustees prior to such removal; (c) any Trustee who requests to be retired or who has become incapacitated by illness or injury may be retired by written instrument signed by a majority of the other Trustees; and (d) any Trustee may be removed at any special meeting of shareholders by a two-thirds vote of the outstanding voting securities of the trust. Each Trustee who is not an interested person (as defined in the 1940 Act) (Independent Trustee), shall retire not later than the last day of the calendar year in which his or her 75th birthday occurs. The Independent Trustees may waive this mandatory retirement age policy with respect to individual Trustees. The executive officers and Advisory Board Members hold office without limit in time, except that any officer and Advisory Board Member may resign or may be removed by a vote of a majority of the Trustees at any regular meeting or any special meeting of the Trustees. Except as indicated, each individual has held the office shown or other offices in the same company for the past five years.
Experience, Skills, Attributes, and Qualifications of the Fund's Trustees. The Governance and Nominating Committee has adopted a statement of policy that describes the experience, qualifications, attributes, and skills that are necessary and desirable for potential Independent Trustee candidates (Statement of Policy). The Board believes that each Trustee satisfied at the time he or she was initially elected or appointed a Trustee, and continues to satisfy, the standards contemplated by the Statement of Policy. The Governance and Nominating Committee also engages professional search firms to help identify potential Independent Trustee candidates who have the experience, qualifications, attributes, and skills consistent with the Statement of Policy. From time to time, additional criteria based on the composition and skills of the current Independent Trustees, as well as experience or skills that may be appropriate in light of future changes to board composition, business conditions, and regulatory or other developments, have also been considered by the professional search firms and the Governance and Nominating Committee. In addition, the Board takes into account the Trustees' commitment and participation in Board and committee meetings, as well as their leadership of standing and ad hoc committees throughout their tenure.
In determining that a particular Trustee was and continues to be qualified to serve as a Trustee, the Board has considered a variety of criteria, none of which, in isolation, was controlling. The Board believes that, collectively, the Trustees have balanced and diverse experience, qualifications, attributes, and skills, which allow the Board to operate effectively in governing the fund and protecting the interests of shareholders. Information about the specific experience, skills, attributes, and qualifications of each Trustee, which in each case led to the Board's conclusion that the Trustee should serve (or continue to serve) as a trustee of the fund, is provided below.
Board Structure and Oversight Function. James C. Curvey is an interested person (as defined in the 1940 Act) and currently serves as Chairman. The Trustees have determined that an interested Chairman is appropriate and benefits shareholders because an interested Chairman has a personal and professional stake in the quality and continuity of services provided to the fund. Independent Trustees exercise their informed business judgment to appoint an individual of their choosing to serve as Chairman, regardless of whether the Trustee happens to be independent or a member of management. The Independent Trustees have determined that they can act independently and effectively without having an Independent Trustee serve as Chairman and that a key structural component for assuring that they are in a position to do so is for the Independent Trustees to constitute a substantial majority for the Board. The Independent Trustees also regularly meet in executive session. Ned C. Lautenbach serves as Chairman of the Independent Trustees and as such (i) acts as a liaison between the Independent Trustees and management with respect to matters important to the Independent Trustees and (ii) with management prepares agendas for Board meetings.
Fidelity funds are overseen by different Boards of Trustees. The fund's Board oversees Fidelity's equity and high income funds and another Board oversees Fidelity's investment-grade bond, money market, and asset allocation funds. The asset allocation funds may invest in Fidelity funds overseen by the fund's Board. The use of separate Boards, each with its own committee structure, allows the Trustees of each group of Fidelity funds to focus on the unique issues of the funds they oversee, including common research, investment, and operational issues. On occasion, the separate Boards establish joint committees to address issues of overlapping consequences for the Fidelity funds overseen by each Board.
The Trustees operate using a system of committees to facilitate the timely and efficient consideration of all matters of importance to the Trustees, the fund, and fund shareholders and to facilitate compliance with legal and regulatory requirements and oversight of the fund's activities and associated risks. The Board, acting through its committees, has charged FMR and its affiliates with (i) identifying events or circumstances the occurrence of which could have demonstrably adverse effects on the fund's business and/or reputation; (ii) implementing processes and controls to lessen the possibility that such events or circumstances occur or to mitigate the effects of such events or circumstances if they do occur; and (iii) creating and maintaining a system designed to evaluate continuously business and market conditions in order to facilitate the identification and implementation processes described in (i) and (ii) above. Because the day-to-day operations and activities of the fund are carried out by or through FMR, its affiliates and other service providers, the fund's exposure to risks is mitigated but not eliminated by the processes overseen by the Trustees. While each of the Board's committees has responsibility for overseeing different aspects of the fund's activities, oversight is exercised primarily through the Operations, Audit, and Compliance Committees. In addition, the Independent Trustees have worked with FMR to enhance the Board's oversight of investment and financial risks, legal and regulatory risks, technology risks, and operational risks, including the development of additional risk reporting to the Board. For example, a working group comprised of Independent Trustees and FMR has worked and continues to work to review the Fidelity funds' valuation-related activities, reporting and risk management. Appropriate personnel, including but not limited to the fund's Chief Compliance Officer (CCO), FMR's internal auditor, the independent accountants, the fund's Treasurer and portfolio management personnel, make periodic reports to the Board's committees, as appropriate, including an annual review of FMR's risk management program for the Fidelity funds. The responsibilities of each standing committee, including their oversight responsibilities, are described further under "Standing Committees of the Fund's Trustees."
Annual Report
Trustees and Officers - continued
The fund's Statement of Additional Information (SAI) includes more information about the Trustees. To request a free copy, call Fidelity at 1-877-208-0098.
Interested Trustees*:
Correspondence intended for each Trustee who is an interested person may be sent to Fidelity Investments, 82 Devonshire Street, Boston, Massachusetts 02109.
Name, Age; Principal Occupations and Other Relevant Experience+ |
James C. Curvey (77) |
| Year of Election or Appointment: 2007 Mr. Curvey is Trustee and Chairman of the Board of Trustees of certain Trusts. Mr. Curvey also serves as Trustee (2007-present) of other investment companies advised by FMR. Mr. Curvey is a Director of Fidelity Investments Money Management, Inc. (2009-present), Director of Fidelity Research & Analysis Co. (2009-present) and Director of FMR and FMR Co., Inc. (2007-present). Mr. Curvey is also Vice Chairman (2007-present) and Director of FMR LLC. In addition, Mr. Curvey serves as an Overseer for the Boston Symphony Orchestra and a member of the Trustees of Villanova University. Previously, Mr. Curvey was the Vice Chairman (2006-2007) and Director (2000-2007) of FMR Corp. |
Ronald P. O'Hanley (55) |
| Year of Election or Appointment: 2011 Mr. O'Hanley is Director of FMR Co., Inc. (2010-present), Director of Fidelity Investments Money Management, Inc. (2010-present), Director of Fidelity Research & Analysis Company (2010-present), President of Fidelity Asset Management and Corporate Services and a member of Fidelity's Executive Committee (2010-present). Previously, Mr. O'Hanley served as President and Chief Executive Officer of BNY Mellon Asset Management (2007-2010). Mr. O'Hanley also served as Vice Chairman of Bank New York Mellon Corp. and a member of that firm's Executive Committee. Prior to the 2007 merger of The Bank of New York and Mellon Financial Corporation, he was Vice Chairman of Mellon Financial Corporation and President and Chief Executive Officer of Mellon Asset Management. He joined Mellon in February 1997. Mr. O'Hanley currently serves as Chairman of the Boston Public Library Foundation Board of Directors and sits on the Board of Directors of Beth Israel Deaconess Medical Center, the Board of Trustees of the Marine Biological Laboratory and the Advisory Board of the Maxwell School of Citizenship and Public Administration at Syracuse University. Mr. O'Hanley also chairs the Council on Asset Management for the Financial Services Roundtable and is a member of the Board of Directors of Institutional Investor's U.S. Institute. |
* Trustees have been determined to be "Interested Trustees" by virtue of, among other things, their affiliation with the trust or various entities under common control with FMR.
+ The information above includes each Trustee's principal occupation during the last five years and other information relating to the experience, attributes, and skills relevant to each Trustee's qualifications to serve as a Trustee, which led to the conclusion that each Trustee should serve as a Trustee for the fund.
Independent Trustees:
Correspondence intended for each Independent Trustee (that is, the Trustees other than the Interested Trustees) may be sent to Fidelity Investments, P.O. Box 55235, Boston, Massachusetts 02205-5235.
Name, Age; Principal Occupations and Other Relevant Experience+ |
Dennis J. Dirks (64) |
| Year of Election or Appointment: 2005 Prior to his retirement in May 2003, Mr. Dirks was Chief Operating Officer and a member of the Board of The Depository Trust & Clearing Corporation (DTCC). He also served as President, Chief Operating Officer, and Board member of The Depository Trust Company (DTC) and President and Board member of the National Securities Clearing Corporation (NSCC). In addition, Mr. Dirks served as Chief Executive Officer and Board member of the Government Securities Clearing Corporation, Chief Executive Officer and Board member of the Mortgage-Backed Securities Clearing Corporation, as a Trustee and a member of the Finance Committee of Manhattan College (2005-2008), and as a Trustee and a member of the Finance Committee of AHRC of Nassau County (2006-2008). Mr. Dirks is a member of the Independent Directors Council (IDC) Governing Council (2010-present) and Board of Directors for The Brookville Center for Children's Services, Inc. (2009-present). |
Alan J. Lacy (59) |
| Year of Election or Appointment: 2008 Mr. Lacy serves as Senior Adviser (2007-present) of Oak Hill Capital Partners, L.P. (private equity). Mr. Lacy also served as Chief Executive Officer (2000-2005) and Vice Chairman (2005-2006) of Sears Holdings Corporation and Sears, Roebuck and Co. (retail). In addition, Mr. Lacy serves as a member of the Board of Directors of Dave & Buster's Entertainment, Inc. (restaurant and entertainment complexes, 2010-present), Earth Fare, Inc. (retail grocery, 2012-present), The Hillman Companies, Inc. (hardware wholesalers, 2010-present), and Bristol-Myers Squibb Company (global pharmaceuticals, 2008-present). Mr. Lacy is a member of the Board of Trustees of The National Parks Conservation Association (2006-present). Previously, Mr. Lacy served as Chairman of the Board of Trustees of the National Parks Conservation Association (2008-2011) and as a member of the Board of Directors for the Western Union Company (global money transfer, 2006-2011). |
Ned C. Lautenbach (68) |
| Year of Election or Appointment: 2000 Mr. Lautenbach is Chairman of the Independent Trustees of the Equity and High Income Funds (2006-present). Mr. Lautenbach currently serves as the Lead Director of the Eaton Corporation Board of Directors (diversified industrial, 1997-present). Mr. Lautenbach is Chairman of the Board of Directors of the Philharmonic Center for the Arts in Naples, Florida (2012-present) and a member of the Council on Foreign Relations (1994-present). Previously, Mr. Lautenbach was a Partner/Advisory Partner at Clayton, Dubilier & Rice, LLC (private equity investment, 1998-2010), as well as a Director of Sony Corporation (2006-2007). |
Joseph Mauriello (68) |
| Year of Election or Appointment: 2008 Prior to his retirement in January 2006, Mr. Mauriello served in numerous senior management positions including Deputy Chairman and Chief Operating Officer (2004-2005), and Vice Chairman of Financial Services (2002-2004) of KPMG LLP US (professional services, 1965-2005). Mr. Mauriello currently serves as a member of the Board of Directors of XL Group plc. (global insurance and re-insurance, 2006-present). Previously, Mr. Mauriello served as a Director of the Hamilton Funds of the Bank of New York (2006-2007) and of Arcadia Resources Inc. (health care services and products, 2007-2012). |
Robert W. Selander (62) |
| Year of Election or Appointment: 2011 Previously, Mr. Selander served as a Member of the Advisory Board of Fidelity's Equity and High Income Funds (2011), Executive Vice Chairman (2010), Chief Executive Officer (2009-2010), and President and Chief Executive Officer (1997-2009) of Mastercard, Inc. |
Cornelia M. Small (68) |
| Year of Election or Appointment: 2005 Ms. Small is a member of the Board of Directors (2009-present) and Chair of the Investment Committee (2010-present) of the Teagle Foundation. Ms. Small also serves on the Investment Committee of the Berkshire Taconic Community Foundation (2008-present). Previously, Ms. Small served as Chairperson (2002-2008) and a member of the Investment Committee and Chairperson (2008-2012) and a member of the Board of Trustees of Smith College. In addition, Ms. Small served as Chief Investment Officer, Director of Global Equity Investments, and a member of the Board of Directors of Scudder, Stevens & Clark and Scudder Kemper Investments. |
William S. Stavropoulos (73) |
| Year of Election or Appointment: 2001 Mr. Stavropoulos is Vice Chairman of the Independent Trustees of the Equity and High Income Funds (2006-present). Mr. Stavropoulos serves as President and Founder of the Michigan Baseball Foundation, the Great Lakes Loons (2007-present). Mr. Stavropoulos is Chairman Emeritus of the Board of Directors of The Dow Chemical Company, where he previously served in numerous senior management positions, including President, CEO (1995-2000; 2002-2004), Chairman of the Executive Committee (2000-2006), and as a member of the Board of Directors (1990-2006). Currently, Mr. Stavropoulos is a Director of Univar Inc. (global distributor of commodity and specialty chemicals, Chairman from 2010-May 2012 and Lead Director from May 2012-present), Teradata Corporation (data warehousing and technology solutions, 2008-present), Maersk Inc. (industrial conglomerate), and Tyco International, Ltd. (multinational manufacturing and services, 2007-present), and a member of the Advisory Board for Metalmark Capital LLC (private equity investment, 2005-present). Mr. Stavropoulos is an operating advisor to Clayton, Dubilier & Rice, LLC (private equity investment). In addition, Mr. Stavropoulos is a member of the University of Notre Dame Advisory Council for the College of Science, a Trustee of the Rollin L. Gerstacker Foundation, and a Director of the Naples Philharmonic Center for the Arts. Previously, Mr. Stavropoulos served as a Director of Chemical Financial Corporation (bank holding company, 1993-2012). |
David M. Thomas (63) |
| Year of Election or Appointment: 2008 Previously, Mr. Thomas served as Executive Chairman (2005-2006) and Chairman and Chief Executive Officer (2000-2005) of IMS Health, Inc. (pharmaceutical and healthcare information solutions), and a Director of Fortune Brands, Inc. (consumer products, 2000-2011). In addition, Mr. Thomas serves as Non-Executive Chairman of the Board of Directors of Fortune Brands Home and Security (home and security products, 2011-present), and as a member of the Board of Directors of Interpublic Group of Companies, Inc. (marketing communication, 2004-present). |
Michael E. Wiley (62) |
| Year of Election or Appointment: 2008 Mr. Wiley also serves as a Director of Asia Pacific Exploration Consolidated (international oil and gas exploration and production, 2008-present). Mr. Wiley serves as a Director of Tesoro Corporation (independent oil refiner and marketer, 2005-present), and a Director of Bill Barrett Corporation (exploration and production, 2005-present). In addition, Mr. Wiley also serves as a Director of Post Oak Bank (privately-held bank, 2004-present). Previously, Mr. Wiley served as a member of the Board of Trustees of the University of Tulsa (2000-2006; 2007-2010), as a Senior Energy Advisor of Katzenbach Partners, LLC (consulting, 2006-2007), as an Advisory Director of Riverstone Holdings (private investment), Chairman, President, and CEO of Baker Hughes, Inc. (oilfield services, 2000-2004), and as Director of Spinnaker Exploration Company (exploration and production, 2001-2005). |
+ The information above includes each Trustee's principal occupation during the last five years and other information relating to the experience, attributes, and skills relevant to each Trustee's qualifications to serve as a Trustee, which led to the conclusion that each Trustee should serve as a Trustee for the fund.
Advisory Board Members and Executive Officers:
Correspondence intended for David A. Rosow and Garnett A. Smith may be sent to Fidelity Investments, P.O. Box 55235, Boston, Massachusetts 02205-5235. Correspondence intended for each executive officer Edward C. Johnson 3d and Peter S. Lynch may be sent to Fidelity Investments, 82 Devonshire Street, Boston, Massachusetts 02109.
Name, Age; Principal Occupation |
Edward C. Johnson 3d (82) |
| Year of Election or Appointment: 2011 Member of the Advisory Board of Fidelity's Equity and High Income Funds. Mr. Johnson serves as Chief Executive Officer, Chairman, and a Director of FMR LLC, and also serves as Chairman and Director of FIL Limited. Previously, Mr. Johnson served as a Trustee and Chairman of the Board of certain Fidelity Trusts, Chairman and a Director of FMR, Chairman and a Director of FMR Co., Inc., and President of FMR LLC (2006-2007). |
Peter S. Lynch (68) |
| Year of Election or Appointment: 2003 Member of the Advisory Board of Fidelity's Equity and High Income Funds. Mr. Lynch is Vice Chairman and a Director of FMR and FMR Co., Inc. In addition, Mr. Lynch serves as a Trustee of Boston College and as the Chairman of the Inner-City Scholarship Fund. Previously, Mr. Lynch served on the Special Olympics International Board of Directors (1997-2006). |
David A. Rosow (70) |
| Year of Election or Appointment: 2012 Member of the Advisory Board of Fidelity's Equity and High Income Funds. Chairman and Chief Executive Officer of International Golf Group, Inc. (golf course development, 1989-present). Previously, Mr. Rosow served as Chairman and Chief Executive Officer of Rosow & Company, Inc. (private investment company, 1989-2011), a Lead Director of Hudson United Bancorp (2001-2006) and as a Director of TD Banknorth (1996-2006). In addition, Mr. Rosow is a member (2008-present) and President (2009-present) of the Town Council of Palm Beach, Florida. |
Garnett A. Smith (65) |
| Year of Election or Appointment: 2012 Member of the Advisory Board of Fidelity's Equity and High Income Funds. Prior to Mr. Smith's retirement, he served as Chairman and Chief Executive Officer of Inbrand Corp. (manufacturer of personal absorbent products, 1990-1997). He also served as President (1986-1990) of Inbrand Corp. Prior to his employment with Inbrand Corp., he was employed by a retail fabric chain and North Carolina National Bank. In addition, Mr. Smith is a board member of the Jackson Hole Land Trust (2009-present). |
Kenneth B. Robins (43) |
| Year of Election or Appointment: 2008 President and Treasurer of Fidelity's Equity and High Income Funds. Mr. Robins also serves as President and Treasurer (2010-present) and Assistant Treasurer (2009-present) of other Fidelity funds and is an employee of Fidelity Investments (2004-present). Previously, Mr. Robins served as Deputy Treasurer of the Fidelity funds (2005-2008) and Treasurer and Chief Financial Officer of The North Carolina Capital Management Trust: Cash and Term Portfolios (2006-2008). |
Bruce T. Herring (47) |
| Year of Election or Appointment: 2006 Vice President of certain Equity Funds. Mr. Herring also serves as President of Fidelity Research & Analysis Company (2010-present), Chief Investment Officer and Director of Fidelity Management & Research (U.K.) Inc. (2010-present) and Group Chief Investment Officer of FMR. Previously, Mr. Herring served as Vice President (2005-2006) and Senior Vice President (2006-2007) of Fidelity Management & Research Company, Vice President of FMR Co., Inc. (2001-2007) and as a portfolio manager for Fidelity U.S. Equity Funds. |
Brian B. Hogan (48) |
| Year of Election or Appointment: 2009 Vice President of Equity and High Income Funds. Mr. Hogan also serves as President of FMR's Equity Division (2009-present). Previously, Mr. Hogan served as Senior Vice President, Equity Research of FMR (2006-2009) and as a portfolio manager. |
Scott C. Goebel (44) |
| Year of Election or Appointment: 2008 Secretary and Chief Legal Officer (CLO) of the Fidelity funds. Mr. Goebel also serves as Secretary of Fidelity Investments Money Management, Inc. (FIMM) (2010-present) and Fidelity Research and Analysis Company (FRAC) (2010-present); Secretary and CLO of The North Carolina Capital Management Trust: Cash and Term Portfolios (2008-present); General Counsel, Secretary, and Senior Vice President of FMR (2008-present) and FMR Co., Inc. (2008-present); employed by FMR LLC or an affiliate (2001-present); Chief Legal Officer of Fidelity Management & Research (Hong Kong) Limited (2008-present) and Assistant Secretary of Fidelity Management & Research (Japan) Inc. (2008-present), and Fidelity Management & Research (U.K.) Inc. (2008-present). Previously, Mr. Goebel served as Assistant Secretary of FIMM (2008-2010), FRAC (2008-2010), and the Funds (2007-2008) and as Vice President and Secretary of Fidelity Distributors Corporation (FDC) (2005-2007). |
William C. Coffey (43) |
| Year of Election or Appointment: 2009 Assistant Secretary of Fidelity's Equity and High Income Funds. Mr. Coffey also serves as Senior Vice President and Deputy General Counsel of FMR LLC (2010-present), and is an employee of Fidelity Investments. Previously, Mr. Coffey served as Vice President and Associate General Counsel of FMR LLC (2005-2009). |
Elizabeth Paige Baumann (44) |
| Year of Election or Appointment: 2012 Anti-Money Laundering (AML) Officer of the Fidelity funds. Ms. Baumann also serves as AML Officer of The North Carolina Capital Management Trust: Cash and Term Portfolios (2012-present), Chief AML Officer of FMR LLC (2012-present), and is an employee of Fidelity Investments. Previously, Ms. Baumann served as Vice President and Deputy Anti-Money Laundering Officer (2007-2012). |
Christine Reynolds (54) |
| Year of Election or Appointment: 2008 Chief Financial Officer of the Fidelity funds. Ms. Reynolds became President of Fidelity Pricing and Cash Management Services (FPCMS) in August 2008. Ms. Reynolds served as Chief Operating Officer of FPCMS (2007-2008). Previously, Ms. Reynolds served as President, Treasurer, and Anti-Money Laundering officer of the Fidelity funds (2004-2007). |
Joseph A. Hanlon (44) |
| Year of Election or Appointment: 2012 Chief Compliance Officer of Fidelity's Equity and High Income Funds. Mr. Hanlon serves as Compliance Officer of FMR, FMR Co., Inc., Fidelity Investments Money Management, Inc. (FIMM), Fidelity Research and Analysis Company (FRAC), Fidelity Management & Research (Japan) Inc., Fidelity Management & Research (U.K.) Inc., Fidelity Management & Research (Hong Kong), and Strategic Advisers, Inc. (2009-present), as Senior Vice President of the Fidelity Asset Management Division (2009-present), and is an employee of Fidelity Investments. |
Joseph F. Zambello (55) |
| Year of Election or Appointment: 2011 Deputy Treasurer of the Fidelity funds. Mr. Zambello is an employee of Fidelity Investments. Previously, Mr. Zambello served as Vice President of FMR's Program Management Group (2009-2011) and Vice President of the Transfer Agent Oversight Group (2005-2009). |
Adrien E. Deberghes (45) |
| Year of Election or Appointment: 2008 Deputy Treasurer of Fidelity's Equity and High Income Funds. Mr. Deberghes also serves as Vice President (2011-present) and Assistant Treasurer (2010-present) of other Fidelity funds, and is an employee of Fidelity Investments (2008-present). Previously, Mr. Deberghes served as Senior Vice President of Mutual Fund Administration at State Street Corporation (2007-2008), Senior Director of Mutual Fund Administration at Investors Bank & Trust (2005-2007), and Director of Finance for Dunkin' Brands (2000-2005). |
Stephen Sadoski (41) |
<R> | Year of Election or Appointment: 2012</R> Deputy Treasurer of Fidelity's Equity and High Income Funds. Mr. Sadoski also serves as Assistant Treasurer of other Fidelity funds (2012-present) and is an employee of Fidelity Investments (2012-present). Previously, Mr. Sadoski served as an assistant chief accountant in the Division of Investment Management of the Securities and Exchange Commission (SEC) (2009-2012) and as a senior manager at Deloitte & Touche (1997-2009). |
Stephanie J. Dorsey (43) |
| Year of Election or Appointment: 2010 Assistant Treasurer of Fidelity's Equity and High Income Funds. Ms. Dorsey also serves as Deputy Treasurer of other Fidelity funds (2008-present) and is an employee of Fidelity Investments (2008-present). Previously, Ms. Dorsey served as Treasurer (2004-2008) of the JPMorgan Mutual Funds and Vice President (2004-2008) of JPMorgan Chase Bank. |
John R. Hebble (54) |
| Year of Election or Appointment: 2009 Assistant Treasurer of Fidelity's Equity and High Income Funds. Mr. Hebble also serves as President (2011-present), Treasurer, and Chief Financial Officer of The North Carolina Capital Management Trust: Cash and Term Portfolios (2008-present), President and Treasurer of other Fidelity funds (2008-present) and is an employee of Fidelity Investments. |
Gary W. Ryan (54) |
| Year of Election or Appointment: 2005 Assistant Treasurer of the Fidelity funds. Mr. Ryan is an employee of Fidelity Investments. Previously, Mr. Ryan served as Vice President of Fund Reporting in Fidelity Pricing and Cash Management Services (FPCMS) (1999-2005). |
Jonathan Davis (44) |
| Year of Election or Appointment: 2010 Assistant Treasurer of the Fidelity funds. Mr. Davis is also Assistant Treasurer of Fidelity Rutland Square Trust II and Fidelity Commonwealth Trust II. Mr. Davis is an employee of Fidelity Investments. Previously, Mr. Davis served as Vice President and Associate General Counsel of FMR LLC (2003-2010). |
Annual Report
A percentage of the dividends distributed during the fiscal year for the following funds may be taken into account as a dividend for purposes of the maximum rate under section 1(h)(11) of the Internal Revenue Code.
| December 02, 2011 |
Class A | 100% |
Class T | 100% |
Class B | 100% |
Class C | 100% |
A percentage of the dividends distributed during the fiscal year for the following funds qualifies for the dividends-received deduction for corporate shareholders:
| December 02, 2011 |
Class A | 2% |
Class T | 3% |
Class B | 7% |
Class C | 5% |
The amounts per share which represent income derived from sources within, and taxes paid to, foreign countries or possessions of the United States are as follows:
| Pay Date | Income | Taxes |
Class A | 12/05/2011 | $0.621 | $0.111 |
Class T | 12/05/2011 | $0.475 | $0.111 |
Class B | 12/05/2011 | $0.215 | $0.111 |
Class C | 12/05/2011 | $0.294 | $0.111 |
The fund will notify shareholders in January 2013 of amounts for use in preparing 2012 income tax returns.
Annual Report
Board Approval of Investment Advisory Contracts and Management Fees
Fidelity Canada Fund
Each year, the Board of Trustees, including the Independent Trustees (together, the Board), votes on the renewal of the management contract and sub-advisory agreements (together, the Advisory Contracts) for the fund. The Board, assisted by the advice of fund counsel and Independent Trustees' counsel, requests and considers a broad range of information relevant to the renewal of the Advisory Contracts throughout the year.
The Board meets regularly and, at each of its meetings, considers factors that are relevant to its annual consideration of the renewal of the fund's Advisory Contracts, including the services and support provided to the fund and its shareholders. The Board has established various standing committees, each composed of and chaired by Independent Trustees with varying backgrounds, to which the Board has assigned specific subject matter responsibilities in order to enhance effective decision-making by the Board. The Board, acting directly and through its Committees, requests and receives information concerning the annual consideration of the renewal of the fund's Advisory Contracts. The Board also meets as needed to consider matters specifically related to the Board's annual consideration of the renewal of Advisory Contracts. Members of the Board may also meet with trustees of other Fidelity funds through ad hoc joint committees to discuss certain matters relevant to the Fidelity funds.
At its July 2012 meeting, the Board of Trustees, including the Independent Trustees, unanimously determined to renew the fund's Advisory Contracts. In reaching its determination, the Board considered all factors it believed relevant, including (i) the nature, extent, and quality of the services to be provided to the fund and its shareholders (including the investment performance of the fund); (ii) the competitiveness of the fund's management fee and total expense ratio relative to peer funds; (iii) the total costs of the services to be provided by and the profits to be realized by Fidelity from its relationship with the fund; (iv) the extent to which economies of scale exist and would be realized as the fund grows; and (v) whether fee levels reflect these economies of scale, if any, for the benefit of fund shareholders.
In considering whether to renew the Advisory Contracts for the fund, the Board reached a determination, with the assistance of fund counsel and Independent Trustees' counsel and through the exercise of its business judgment, that the renewal of the Advisory Contracts is in the best interests of the fund and its shareholders and that the compensation payable under the Advisory Contracts is fair and reasonable. The Board's decision to renew the Advisory Contracts was not based on any single factor, but rather was based on a comprehensive consideration of all the information provided to the Board at its meetings throughout the year. The Board, in reaching its determination to renew the Advisory Contracts, is aware that shareholders in the fund have a broad range of investment choices available to them, including a wide choice among mutual funds offered by Fidelity's competitors, and that the fund's shareholders, who have the opportunity to review and weigh the disclosure provided by the fund in its prospectus and other public disclosures, have chosen to invest in this fund, managed by Fidelity.
Nature, Extent, and Quality of Services Provided. The Board considered the staffing within the investment adviser, FMR, and the sub-advisers (together, the Investment Advisers), including the backgrounds of the fund's investment personnel, and also considered the fund's investment objective, strategies, and related investment philosophy. The Independent Trustees also had discussions with senior management of Fidelity's investment operations and investment groups. The Board considered the structure of the portfolio manager compensation program and whether this structure provides appropriate incentives to act in the best interests of the fund.
Resources Dedicated to Investment Management and Support Services. The Board and the Fund Oversight and Research Committees reviewed the general qualifications and capabilities of the Investment Advisers' investment staff, including its size, education, experience, and resources, as well as the Investment Advisers' approach to recruiting, training, managing, and compensating investment personnel. The Board also noted that FMR has continued to increase the resources devoted to non-U.S. offices, including expansion of Fidelity's global investment organization. The Board noted that Fidelity's analysts have extensive resources, tools and capabilities that allow them to conduct sophisticated quantitative and fundamental analysis, as well as credit analysis of issuers, counterparties and guarantors. The Board also believes that Fidelity's investment professionals have sufficient access to global information and data so as to provide competitive investment results over time, and that those professionals also have access to sophisticated tools that permit them to assess portfolio construction and risk and performance attribution characteristics continuously, as well as to transmit new information and research conclusions rapidly around the world. Additionally, in its deliberations, the Board considered the Investment Advisers' trading and risk management capabilities and resources, which are an integral part of the investment management process.
Shareholder and Administrative Services. The Board considered (i) the nature, extent, quality, and cost of advisory, administrative, and shareholder services performed by the Investment Advisers and their affiliates under the Advisory Contracts and under separate agreements covering transfer agency, pricing and bookkeeping, and securities lending services for the fund; (ii) the nature and extent of the supervision of third party service providers, principally custodians and subcustodians; and (iii) the resources devoted to, and the record of compliance with, the fund's compliance policies and procedures. The Board also reviewed the allocation of fund brokerage, including allocations to brokers affiliated with the Investment Advisers, the use of brokerage commissions to pay fund expenses, and the use of "soft" commission dollars to pay for research services.
The Board noted that the growth of fund assets over time across the complex allows Fidelity to reinvest in the development of services designed to enhance the value or convenience of the Fidelity funds as investment vehicles. These services include 24-hour access to account information and market information through telephone representatives and over the Internet, investor education materials and asset allocation tools, and the expanded availability of Fidelity Investor Centers.
Annual Report
Investment in a Large Fund Family. The Board considered the benefits to shareholders of investing in a Fidelity fund, including the benefits of investing in a fund that is part of a large family of funds offering a variety of investment disciplines and providing a large variety of mutual fund investor services. The Board noted that Fidelity had taken, or had made recommendations that resulted in the Fidelity funds taking, a number of actions over the previous year that benefited particular funds, including (i) continuing to dedicate additional resources to investment research and support of the senior management team that oversees asset management; (ii) persisting in efforts to enhance Fidelity's research capabilities, in particular, international research; (iii) launching new funds and making other enhancements to meet client needs for global and income-oriented solutions; (iv) continuing to launch dedicated lower cost underlying funds to meet investment management's portfolio construction needs related to expanding underlying fund options, specifically for the Freedom Fund product lines; (v) adopting a "Stock Selector" sector neutral investment approach and employing a team of portfolio managers who are sector specialists to manage certain funds; (vi) rationalizing product lines and gaining increased efficiencies through the mergers of several funds into other funds; (vii) strengthening the Spartan Index Fund product line by adding new funds and/or new low-cost institutional share classes, restructuring fund expenses to accommodate new classes, and reducing investment minimums for certain classes of shares; (viii) modifying the eligibility criteria for Institutional Class shares to increase their appeal to government entities and charitable investors; and (ix) reducing certain transfer agent fee rates.
Investment Performance. The Board considered whether the fund has operated in accordance with its investment objective, as well as its record of compliance with its investment restrictions. It also reviewed the fund's absolute investment performance for each class, as well as the fund's relative investment performance for each class measured over multiple periods against a broad-based securities market index. The Board noted that FMR believes that no meaningful peer group exists for the fund. The following charts considered by the Board show, over the one-, three-, and five-year periods ended December 31, 2011, as available, the cumulative total returns of the retail class and Class B of the fund and the cumulative total returns of a broad-based securities market index ("benchmark"). The returns of the retail class and Class B show the performance of the highest performing class (based on five-year performance) and the lowest performing class (based on three-year performance), respectively.
Fidelity Canada Fund
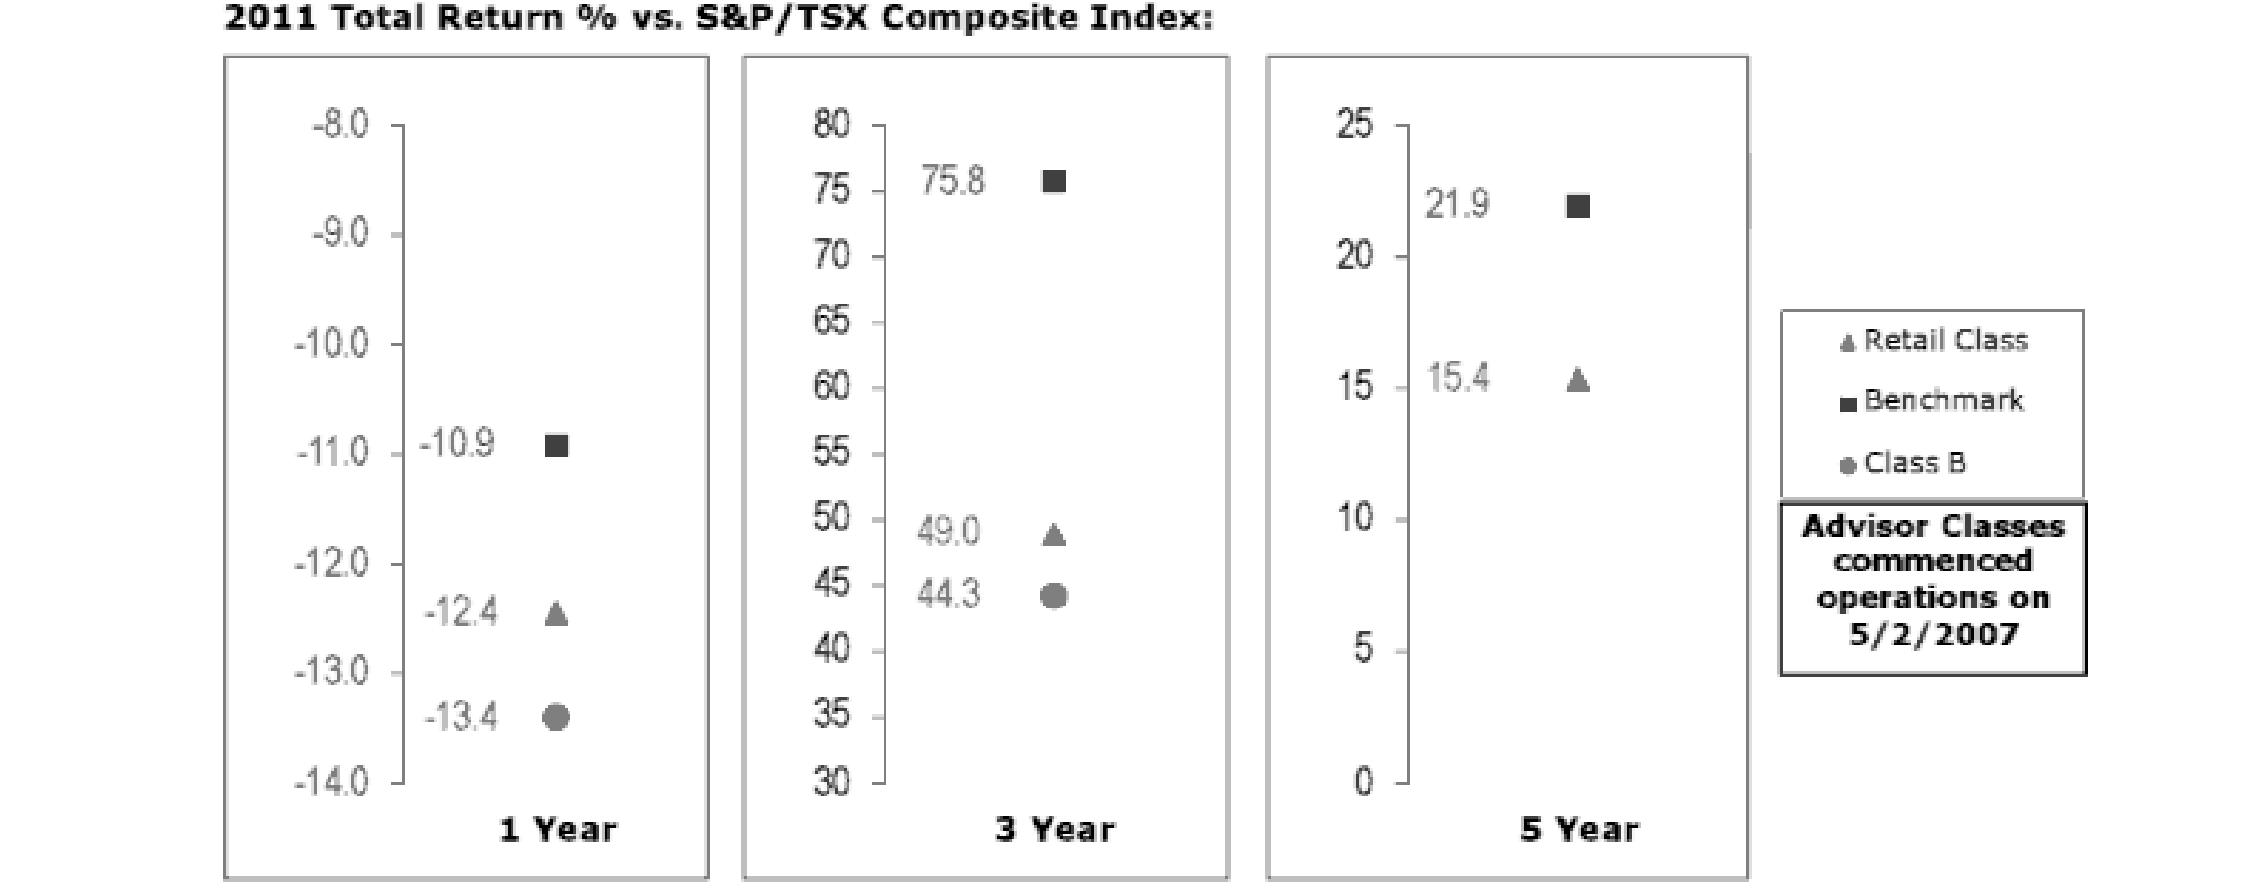
The Board noted that the investment performance of the fund was lower than its benchmark for all the periods shown. The Board considered that the variations in performance among the fund's classes reflect the variations in class expenses, which result in lower performance for higher expense classes. The Board discussed with FMR actions to improve the fund's below-benchmark performance. The Board noted that this fund had underperformed in the past and discussed with FMR its disappointment with the continued underperformance of the fund. The Board also reviewed the fund's performance since inception as well as performance in the current year. The Board will continue to closely monitor the performance of the fund in the coming year and discuss with FMR other appropriate actions to address the performance of the fund.
The Board also considered that the fund's management fee is subject to upward or downward adjustment depending upon whether, and to what extent, the fund's investment performance for the performance period exceeds, or is exceeded by, the record (over the same period) of a Board-approved performance adjustment index. The Board noted that the performance adjustment provides FMR with a strong economic incentive to seek to achieve superior performance for the fund's shareholders and helps to more closely align the interests of FMR and the fund's shareholders.
Based on its review, the Board concluded that the nature, extent, and quality of services provided to the fund under the Advisory Contracts should benefit the fund's shareholders.
Annual Report
Board Approval of Investment Advisory Contracts and Management Fees - continued
Competitiveness of Management Fee and Total Expense Ratio. The Board considered the fund's management fee and total expense ratio compared to "mapped groups" of competitive funds and classes. Fidelity creates "mapped groups" by combining similar Lipper investment objective categories that have comparable management fee characteristics. Combining Lipper investment objective categories aids the Board's management fee and total expense ratio comparisons by broadening the competitive group used for comparison and by reducing the number of universes to which various Fidelity funds are compared.
Management Fee. The Board considered two proprietary management fee comparisons for the 12-month periods shown in the chart below. The group of Lipper funds used by the Board for management fee comparisons is referred to below as the "Total Mapped Group." The Total Mapped Group comparison focuses on a fund's standing relative to the total universe of comparable funds available to investors in terms of gross management fees before expense reimbursements or caps, and without giving effect to the fund's performance adjustment. "TMG %" represents the percentage of funds in the Total Mapped Group that had management fees that were lower than the fund's. For example, a TMG % of 17% means that 83% of the funds in the Total Mapped Group had higher management fees than the fund. The "Asset-Size Peer Group" (ASPG) comparison focuses on a fund's standing relative to non-Fidelity funds similar in size to the fund within the Total Mapped Group. The ASPG represents at least 15% of the funds in the Total Mapped Group with comparable asset size and management fee characteristics, subject to a minimum of 50 funds (or all funds in the Total Mapped Group if fewer than 50). Additional information, such as the ASPG quartile in which the fund's management fee ranked and the impact of the fund's performance adjustment, is also included in the chart and considered by the Board.
Fidelity Canada Fund

The Board noted that the fund's management fee ranked below the median of its Total Mapped Group and below the median of its ASPG for 2011. The Board also noted the effect of the fund's negative performance adjustment on the fund's management fee ranking. The Board noted that the performance adjustment for each year represents calculations for performance periods that differ from the periods shown in the performance charts above.
Based on its review, the Board concluded that the fund's management fee is fair and reasonable in light of the services that the fund receives and the other factors considered.
Total Expense Ratio. In its review of each class's total expense ratio, the Board considered the fund's management fee as well as other fund or class expenses, as applicable, such as transfer agent fees, pricing and bookkeeping fees, fund-paid 12b-1 fees, and custodial, legal, and audit fees. The Board also noted the effects of any waivers and reimbursements on fees and expenses, as well as the impact of the fund's performance adjustment. As part of its review, the Board also considered the current and historical total expense ratios of each class of the fund compared to competitive fund median expenses. Each class of the fund is compared to those funds and classes in the Total Mapped Group (used by the Board for management fee comparisons) that have a similar sales load structure.
The Board noted that the total expense ratio of each class ranked below its competitive median for 2011.
Fees Charged to Other Fidelity Clients. The Board also considered Fidelity fee structures and other information with respect to clients of FMR and its affiliates, such as other mutual funds advised or subadvised by FMR or its affiliates, pension plan clients, and other institutional clients. The Board noted the findings of the 2010 ad hoc joint committee (created with the board of other Fidelity funds), which reviewed and compared Fidelity's institutional investment advisory business with its business of providing services to the Fidelity funds, including the differences in services provided, fees charged, and costs incurred, as well as competition in their respective marketplaces.
Annual Report
Based on its review of total expense ratios and fees charged to other Fidelity clients, the Board concluded that the total expense ratio of each class of the fund was reasonable in light of the services that the fund and its shareholders receive and the other factors considered.
Costs of the Services and Profitability. The Board considered the revenues earned and the expenses incurred by Fidelity in conducting the business of developing, marketing, distributing, managing, administering and servicing the fund and its shareholders. The Board also considered the level of Fidelity's profits in respect of all the Fidelity funds.
On an annual basis, FMR presents to the Board Fidelity's profitability for the fund. Fidelity calculates the profitability for each fund, as well as aggregate profitability for groups of Fidelity funds and all Fidelity funds, using a series of detailed revenue and cost allocation methodologies which originate with the books and records of Fidelity on which Fidelity's audited financial statements are based. The Audit Committee of the Board reviews any significant changes from the prior year's methodologies.
PricewaterhouseCoopers LLP (PwC), independent registered public accounting firm and auditor to Fidelity and certain Fidelity funds, has been engaged annually by the Board as part of the Board's assessment of Fidelity's profitability analysis. PwC's engagement includes the review and assessment of Fidelity's methodologies used in determining the revenues and expenses attributable to Fidelity's mutual fund business, and completion of agreed-upon procedures surrounding the mathematical accuracy of fund profitability and its conformity to allocation methodologies. After considering PwC's reports issued under the engagement and information provided by Fidelity, the Board concluded that while other allocation methods may also be reasonable, Fidelity's profitability methodologies are reasonable in all material respects.
The Board also reviewed Fidelity's non-fund businesses and fall-out benefits related to the mutual fund business as well as cases where Fidelity's affiliates may benefit from or be related to the fund's business.
The Board considered the costs of the services provided by and the profits realized by Fidelity in connection with the operation of the fund and was satisfied that the profitability was not excessive in the circumstances.
Economies of Scale. The Board considered whether there have been economies of scale in respect of the management of the Fidelity funds, whether the Fidelity funds (including the fund) have appropriately benefited from any such economies of scale, and whether there is potential for realization of any further economies of scale. The Board considered the extent to which the fund will benefit from economies of scale through increased services to the fund, through waivers or reimbursements, or through fee or expense reductions. The Board also noted that in 2009, it and the board of other Fidelity funds created an ad hoc committee (the Economies of Scale Committee) to analyze whether FMR attains economies of scale in respect of the management and servicing of the Fidelity funds, whether the Fidelity funds have appropriately benefited from such economies of scale, and whether there is potential for realization of any further economies of scale.
The Board recognized that the fund's management contract incorporates a "group fee" structure, which provides for lower group fee rates as total fund assets under FMR's management increase, and for higher group fee rates as total fund assets under FMR's management decrease. FMR calculates the group fee rates based on a tiered asset "breakpoint" schedule that varies based on asset class. The Board considered that the group fee is designed to deliver the benefits of economies of scale to fund shareholders when total Fidelity fund assets increase, even if assets of any particular fund are unchanged or have declined, because some portion of Fidelity's costs are attributable to services provided to all Fidelity funds, and all funds benefit if those costs can be allocated among more assets. The Board concluded that, given the group fee structure, fund shareholders will benefit from lower management fees as assets under FMR's management increase at the fund complex level, regardless of whether Fidelity achieves any such economies of scale.
The Board concluded, taking into account the analysis of the Economies of Scale Committee, that economies of scale, if any, are being appropriately shared between fund shareholders and Fidelity.
Additional Information Requested by the Board. In order to develop fully the factual basis for consideration of the Fidelity funds' Advisory Contracts, the Board requested and received additional information on certain topics, including (i) fund performance trends, actions to be taken by FMR to improve certain funds' overall performance, and Fidelity's long-term strategies for certain funds; (ii) the potential to further rationalize the Fidelity fund lineup with the possibility of achieving savings for the funds and Fidelity; (iii) Fidelity's compensation structure for portfolio managers and other key investment personnel; (iv) the amount of the investment that each portfolio manager has made in the Fidelity fund(s) that he or she manages; (v) the realization of fall-out benefits in certain Fidelity business units; (vi) Fidelity's group fee structures, the potential impact of regulatory changes on such structures, and the rationale for the individual fee rates of certain funds; (vii) fund profitability methodology, including Fidelity's cost allocation methodology, and the impact of certain factors on fund profitability results; (viii) trends regarding industry use of performance fee structures and the possibility of implementing performance fee structures for additional funds; and (ix) the impact of net redemptions from the Fidelity funds.
Based on its evaluation of all of the conclusions noted above, and after considering all factors it believed relevant, the Board ultimately concluded that the advisory fee structures are fair and reasonable, and that the fund's Advisory Contracts should be renewed.
Annual Report
Investment Adviser
Fidelity Management & Research Company
Boston, MA
Investment Sub-Advisers
FMR Co., Inc.
Fidelity Management & Research
(U.K.) Inc.
Fidelity Management & Research
(Hong Kong) Limited
Fidelity Management & Research
(Japan) Inc.
FIL Investment Advisors
FIL Investment Advisors
(UK) Limited
General Distributor
Fidelity Distributors Corporation
Smithfield, RI
Transfer and Service Agents
Fidelity Investments Institutional
Operations Company, Inc.
Boston, MA
Fidelity Service Company, Inc.
Boston, MA
Custodian
State Street Bank and Trust Company
Quincy, MA
(Fidelity Investment logo)(registered trademark)
Corporate Headquarters
82 Devonshire St., Boston, MA 02109
www.fidelity.com
ACAN-UANN-1212
1.843164.105
Fidelity Advisor®
Canada Fund -
Institutional Class
Annual Report
October 31, 2012
Institutional Class is a class of
Fidelity® Canada Fund
(Fidelity Cover Art)
Contents
Performance | (Click Here) | How the fund has done over time. |
Management's Discussion of Fund Performance | (Click Here) | The Portfolio Manager's review of fund performance and strategy. |
Shareholder Expense Example | (Click Here) | An example of shareholder expenses. |
Investment Changes | (Click Here) | A summary of major shifts in the fund's investments over the past six months. |
Investments | (Click Here) | A complete list of the fund's investments with their market values. |
Financial Statements | (Click Here) | Statements of assets and liabilities, operations, and changes in net assets, as well as financial highlights. |
Notes | (Click Here) | Notes to the financial statements. |
Report of Independent Registered Public Accounting Firm | (Click Here) | |
Trustees and Officers | (Click Here) | |
Distributions | (Click Here) | |
Board Approval of Investment Advisory Contracts and Management Fees | (Click Here) | |
To view a fund's proxy voting guidelines and proxy voting record for the 12-month period ended June 30, visit http://www.fidelity.com/proxyvotingresults or visit the Securities and Exchange Commission's (SEC) web site at http://www.sec.gov. You may also call 1-877-208-0098 to request a free copy of the proxy voting guidelines.
Standard & Poor's, S&P and S&P 500 are registered service marks of The McGraw-Hill Companies, Inc. and have been licensed for use by Fidelity Distributors Corporation.
Other third party marks appearing herein are the property of their respective owners.
All other marks appearing herein are registered or unregistered trademarks or service marks of FMR LLC or an affiliated company. © 2012 FMR LLC. All rights reserved.
This report and the financial statements contained herein are submitted for the general information of the shareholders of the fund. This report is not authorized for distribution to prospective investors in the fund unless preceded or accompanied by an effective prospectus.
A fund files its complete schedule of portfolio holdings with the SEC for the first and third quarters of each fiscal year on Form N-Q. Forms N-Q are available on the SEC's web site at http://www.sec.gov. A fund's Forms N-Q may be reviewed and copied at the SEC's Public Reference Room in Washington, DC. Information regarding the operation of the SEC's Public Reference Room may be obtained by calling 1-800-SEC-0330. For a complete list of a fund's portfolio holdings, view the most recent holdings listing, semiannual report, or annual report on Fidelity's web site at http://www.fidelity.com, http://www.advisor.fidelity.com, or http://www.401k.com, as applicable.
NOT FDIC INSURED • MAY LOSE VALUE • NO BANK GUARANTEE
Neither the fund nor Fidelity Distributors Corporation is a bank.
Annual Report
Average annual total return reflects the change in the value of an investment, assuming reinvestment of the class' distributions from dividend income and capital gains (the profits earned upon the sale of securities that have grown in value, if any) and assuming a constant rate of performance each year. The $10,000 table and the fund's returns do not reflect the deduction of taxes that a shareholder would pay on fund distributions or the redemption of fund shares. During periods of reimbursement by Fidelity, a fund's total return will be greater than it would be had the reimbursement not occurred. How a fund did yesterday is no guarantee of how it will do tomorrow.
Average Annual Total Returns
Periods ended October 31, 2012 | Past 1
year | Past 5
years | Past 10
years |
Institutional ClassA | 4.38% | -3.13% | 13.56% |
A The initial offering of Institutional Class shares took place on May 2, 2007. Returns prior to May 2, 2007 are those of Fidelity® Canada Fund, the original class of the fund.
$10,000 Over 10 Years
Let's say hypothetically that $10,000 was invested in Fidelity Advisor® Canada Fund - Institutional Class on October 31, 2002. The chart shows how the value of your investment would have changed, and also shows how the S&P®/TSX Composite Index performed over the same period. The inital offering of Institutional Class took place on May 2, 2007. See above for additional information regarding the performance of Institutional Class.
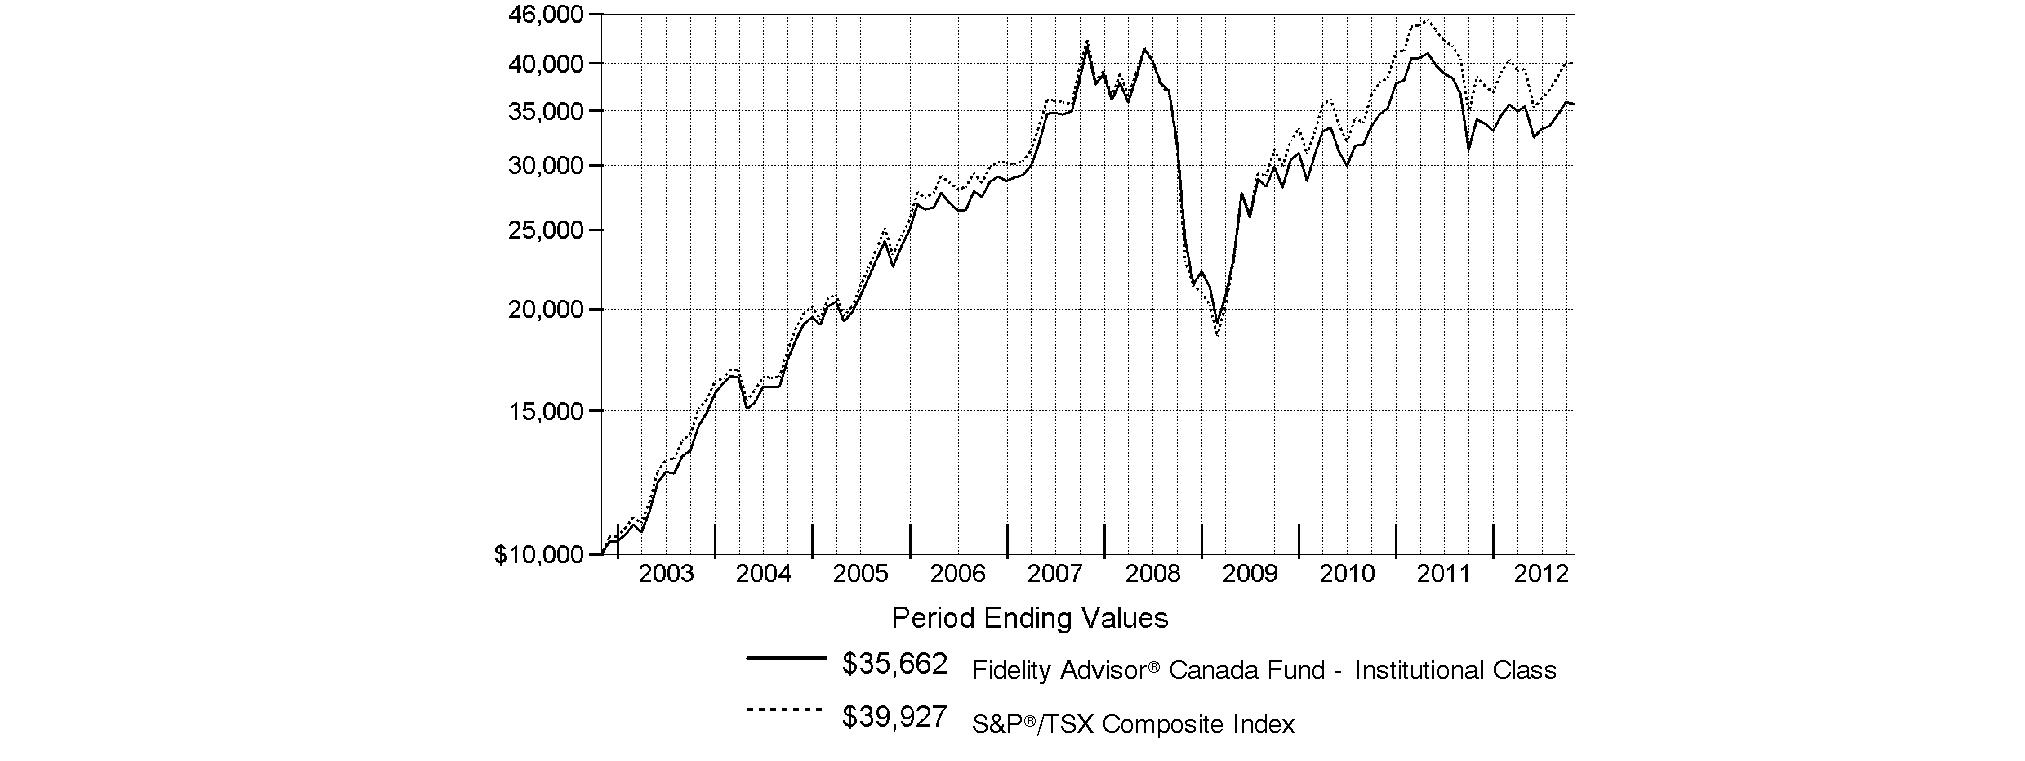
Annual Report
Market Recap: Returns for most domestic and international equities fluctuated during the 12 months ending October 31, 2012, as investor sentiment towards risk vacillated amid a changing global economic landscape. U.S. stocks overcame bouts of volatility to post strong gains for the past year, extending an uptrend that began in March 2009. The broad-based S&P 500® Index advanced 15.21%, while the blue-chip-laden Dow Jones Industrial AverageSM and technology-heavy Nasdaq Composite® Index rose 12.56% and 12.21%, respectively. Performance outside of the U.S. was relatively weak, as the MSCI® ACWI® (All Country World Index) ex USA Index rose 4.11%, hampered in part by a stronger U.S. dollar. International developed-markets generally struggled during the period as macroeconomic concerns ebbed and flowed, finishing with only a modest gain. The MSCI® EAFE® Index rose 4.76% for the year, largely buttressed in the summertime by pledges of accommodative monetary action from eurozone officials, as well as signs that the U.S. housing market was on the mend. Within the index, Asia-Pacific ex Japan showed the most impressive gain, advancing roughly 10%. A number of core European components, including Germany (+11%) and Switzerland (+10%), and the U.K. (+9%), benefited from optimism about the eurozone's ability to resolve its debt woes, which helped the region outpace the index overall. Elsewhere, Japan was among the few benchmark constituents to finish in the red, returning about -3%. Emerging-markets stocks gained 2.98% for the year, as measured by the MSCI Emerging Markets Index. A general uptrend in the final five months of the period lifted the index into positive territory for the full 12 months.
Comments from Douglas Lober, Portfolio Manager of Fidelity Advisor® Canada Fund: For the year, the fund's Institutional Class shares rose 4.38%, beating the 3.82% gain of the S&P/TSX Composite Index. The fund's outperformance was largely driven by solid picks and an overweighting in health care, a sector that makes up only small portion of the index but was its star performer this period. Our stake in pharmacy benefits manager SXC Health Solutions proved most rewarding, as the stock vaulted higher on the firm's April announcement of its plans to buy Catalyst Health Solutions. The market warmly welcomed the merger, which created the combined entity Catamaran in July. Unfortunately, Catamaran's stock didn't react quite as strongly to the big move as I had hoped, and it ended up our largest relative detractor. Also in health care, Valeant Pharmaceuticals International flexed its muscles for the fund, as its shares advanced on a number of accretive acquisitions this period. An overweighting in consumer discretionary, especially among retailers, provided an additional lift. Here, shares of discount store operator Dollarama steadily advanced, as the company continued to gain pricing power from increasing the average cost of its items from $1 to $2, while also opening new stores across Canada. In materials, the fund's limited stake in lagging index component Kinross Gold was a good call, as was scant exposure to weak-performing BlackBerry® mobile device maker Research In Motion among information technology names. Conversely, underweighting some beneficiaries of accretive acquisitions in the energy sector detracted the most from relative results, including our minimal position in index component Nexen, whose stock shot up in July on the announcement that China's CNOOC intended to acquire the firm. Positioning in financials, including an underweighting in rebounding index component Royal Bank of Canada, hurt, as did choices in industrials. Also, an overweighting in enterprise software firm Open Text notably detracted, as did holdings in Barrick Gold, which faltered in part on production missteps.
Note to shareholders: Fidelity Advisor Canada Fund may invest up to 35% of its total assets in any industry that represents more than 20% of the Canadian market. As of October 31, 2012, the fund did not have more than 25% of its assets invested in any one industry.
The views expressed above reflect those of the portfolio manager(s) only through the end of the period as stated on the cover of this report and do not necessarily represent the views of Fidelity or any other person in the Fidelity organization. Any such views are subject to change at any time based upon market or other conditions and Fidelity disclaims any responsibility to update such views. These views may not be relied on as investment advice and, because investment decisions for a Fidelity fund are based on numerous factors, may not be relied on as an indication of trading intent on behalf of any Fidelity fund.
Annual Report
Fidelity Canada Fund
As a shareholder of the Fund, you incur two types of costs: (1) transaction costs, including sales charges (loads) on purchase payments or redemption proceeds, redemption fees and (2) ongoing costs, including management fees, distribution and/or service (12b-1) fees and other Fund expenses. This Example is intended to help you understand your ongoing costs (in dollars) of investing in the Fund and to compare these costs with the ongoing costs of investing in other mutual funds.
The Example is based on an investment of $1,000 invested at the beginning of the period and held for the entire period (May 1, 2012 to October 31, 2012).
Actual Expenses
The first line of the accompanying table for each class of the Fund provides information about actual account values and actual expenses. You may use the information in this line, together with the amount you invested, to estimate the expenses that you paid over the period. Simply divide your account value by $1,000.00 (for example, an $8,600 account value divided by $1,000.00 = 8.6), then multiply the result by the number in the first line for a class of the Fund under the heading entitled "Expenses Paid During Period" to estimate the expenses you paid on your account during this period. A small balance maintenance fee of $12.00 that is charged once a year may apply for certain accounts with a value of less than $2,000. This fee is not included in the table below. If it was, the estimate of expenses you paid during the period would be higher, and your ending account value lower, by this amount. In addition, the Fund, as a shareholder in the underlying Fidelity Central Funds, will indirectly bear its pro-rata share of the fees and expenses incurred by the underlying Fidelity Central Funds. These fees and expenses are not included in the Fund's annualized expense ratio used to calculate the expense estimate in the table below.
Hypothetical Example for Comparison Purposes
The second line of the accompanying table for each class of the Fund provides information about hypothetical account values and hypothetical expenses based on a Class' actual expense ratio and an assumed rate of return of 5% per year before expenses, which is not the Class' actual return. The hypothetical account values and expenses may not be used to estimate the actual ending account balance or expenses you paid for the period. You may use this information to compare the ongoing costs of investing in the Fund and other funds. To do so, compare this 5% hypothetical example with the 5% hypothetical examples that appear in the shareholder reports of the other funds. A small balance maintenance fee of $12.00 that is charged once a year may apply for certain accounts with a value of less than $2,000. This fee is not included in the table below. If it was, the estimate of expenses you paid during the period would be higher, and your ending account value lower, by this amount. In addition, the Fund, as a shareholder in the underlying Fidelity Central Funds, will indirectly bear its pro-rata share of the fees and expenses incurred by the underlying Fidelity Central Funds. These fees and expenses are not included in the Fund's annualized expense ratio used to calculate the expense estimate in the table below.
Please note that the expenses shown in the table are meant to highlight your ongoing costs only and do not reflect any transaction costs. Therefore, the second line of the table is useful in comparing ongoing costs only, and will not help you determine the relative total costs of owning different funds. In addition, if these transactional costs were included, your costs would have been higher.
| Annualized
Expense Ratio | Beginning
Account Value
May 1, 2012 | Ending
Account Value
October 31, 2012 | Expenses Paid
During Period*
May 1, 2012
to October 31, 2012 |
Class A | 1.07% | | | |
Actual | | $ 1,000.00 | $ 1,006.00 | $ 5.40 |
Hypothetical A | | $ 1,000.00 | $ 1,019.76 | $ 5.43 |
Class T | 1.35% | | | |
Actual | | $ 1,000.00 | $ 1,004.50 | $ 6.80 |
Hypothetical A | | $ 1,000.00 | $ 1,018.35 | $ 6.85 |
Class B | 1.84% | | | |
Actual | | $ 1,000.00 | $ 1,002.30 | $ 9.26 |
Hypothetical A | | $ 1,000.00 | $ 1,015.89 | $ 9.32 |
Class C | 1.81% | | | |
Actual | | $ 1,000.00 | $ 1,002.30 | $ 9.11 |
Hypothetical A | | $ 1,000.00 | $ 1,016.04 | $ 9.17 |
Canada | .76% | | | |
Actual | | $ 1,000.00 | $ 1,007.60 | $ 3.84 |
Hypothetical A | | $ 1,000.00 | $ 1,021.32 | $ 3.86 |
Institutional Class | .75% | | | |
Actual | | $ 1,000.00 | $ 1,007.70 | $ 3.79 |
Hypothetical A | | $ 1,000.00 | $ 1,021.37 | $ 3.81 |
A 5% return per year before expenses
* Expenses are equal to each Class' annualized expense ratio, multiplied by the average account value over the period, multiplied by 184/366 (to reflect the one-half year period).
Annual Report
Fidelity Canada Fund
Investment Changes (Unaudited)
Geographic Diversification (% of fund's net assets) |
As of October 31, 2012 |
 | Canada | 97.1% | |
 | United States of America | 2.9% | |

Percentages are based on country or territory of incorporation and are adjusted for the effect of futures contracts, if applicable. |
As of April 30, 2012 |
| Canada | 89.9% | |
| United States of America | 10.1% | |

Percentages are based on country or territory of incorporation and are adjusted for the effect of futures contracts, if applicable. |
Asset Allocation |
| % of fund's
net assets | % of fund's net assets
6 months ago |
Stocks | 99.3 | 99.8 |
Short-Term Investments and Net Other Assets (Liabilities) | 0.7 | 0.2 |
Top Ten Stocks as of October 31, 2012 |
| % of fund's
net assets | % of fund's net assets
6 months ago |
Royal Bank of Canada (Commercial Banks) | 5.9 | 5.9 |
The Toronto-Dominion Bank (Commercial Banks) | 5.5 | 6.4 |
Suncor Energy, Inc. (Oil, Gas & Consumable Fuels) | 4.2 | 4.2 |
Bank of Nova Scotia (Commercial Banks) | 4.1 | 4.2 |
Goldcorp, Inc. (Metals & Mining) | 3.5 | 2.1 |
Enbridge, Inc. (Oil, Gas & Consumable Fuels) | 3.3 | 3.8 |
Catamaran Corp. (Health Care Providers & Services) | 3.1 | 3.8 |
Valeant Pharmaceuticals International, Inc. (Canada) (Pharmaceuticals) | 3.1 | 4.1 |
Canadian National Railway Co. (Road & Rail) | 3.0 | 3.4 |
Cenovus Energy, Inc. (Oil, Gas & Consumable Fuels) | 2.9 | 2.7 |
| 38.6 | |
Market Sectors as of October 31, 2012 |
| % of fund's
net assets | % of fund's net assets
6 months ago |
Financials | 28.3 | 31.1 |
Energy | 24.6 | 19.1 |
Materials | 18.0 | 12.5 |
Health Care | 6.2 | 8.3 |
Telecommunication Services | 5.6 | 4.6 |
Consumer Discretionary | 5.5 | 9.9 |
Industrials | 4.8 | 6.0 |
Information Technology | 3.1 | 4.1 |
Consumer Staples | 3.0 | 4.0 |
Utilities | 0.2 | 0.2 |
Annual Report
Fidelity Canada Fund
Investments October 31, 2012
Showing Percentage of Net Assets
Common Stocks - 99.3% |
| Shares | | Value |
CONSUMER DISCRETIONARY - 5.5% |
Auto Components - 0.1% |
Magna International, Inc. Class A
(sub. vtg.) | 100,000 | | $ 4,445,557 |
Hotels, Restaurants & Leisure - 0.5% |
Tim Hortons, Inc. (Canada) | 310,300 | | 15,403,929 |
Media - 0.9% |
Cineplex, Inc. | 300,000 | | 9,311,640 |
Corus Entertainment, Inc. Class B (non-vtg.) | 550,000 | | 12,451,064 |
Quebecor, Inc. Class B (sub. vtg.) | 200,000 | | 6,976,721 |
| | 28,739,425 |
Multiline Retail - 2.3% |
Dollarama, Inc. | 1,203,467 | | 76,021,760 |
Specialty Retail - 0.8% |
Home Depot, Inc. | 320,000 | | 19,641,600 |
RONA, Inc. | 150,000 | | 1,540,926 |
TJX Companies, Inc. | 100,000 | | 4,163,000 |
| | 25,345,526 |
Textiles, Apparel & Luxury Goods - 0.9% |
Gildan Activewear, Inc. | 770,195 | | 26,227,116 |
lululemon athletica, Inc. (a) | 77,600 | | 5,355,176 |
| | 31,582,292 |
TOTAL CONSUMER DISCRETIONARY | | 181,538,489 |
CONSUMER STAPLES - 3.0% |
Food & Staples Retailing - 3.0% |
Alimentation Couche-Tard, Inc. Class B (sub. vtg.) | 990,200 | | 48,640,012 |
Jean Coutu Group, Inc. Class A
(sub. vtg.) | 600,000 | | 9,017,272 |
Metro, Inc. Class A (sub. vtg.) | 579,165 | | 34,167,111 |
Whole Foods Market, Inc. | 100,000 | | 9,473,000 |
| | 101,297,395 |
ENERGY - 24.6% |
Oil, Gas & Consumable Fuels - 24.6% |
ARC Resources Ltd. | 300,000 | | 7,284,105 |
Athabasca Oil Corp. (a) | 650,000 | | 7,868,335 |
Baytex Energy Corp. | 350,000 | | 15,927,409 |
Birchcliff Energy Ltd. (a) | 2,700 | | 22,141 |
Canadian Natural Resources Ltd. | 2,450,000 | | 73,837,297 |
Canadian Oil Sands Ltd. | 700,000 | | 14,858,573 |
Celtic Exploration Ltd. (a) | 500,000 | | 13,056,320 |
Celtic Exploration Ltd. (a)(e) | 200,000 | | 5,222,528 |
Cenovus Energy, Inc. | 2,700,000 | | 95,240,050 |
Crescent Point Energy Corp. | 1,383,400 | | 57,482,954 |
Crew Energy, Inc. (a) | 1,500,000 | | 11,549,437 |
Enbridge, Inc. | 2,737,800 | | 108,936,342 |
Encana Corp. | 700,000 | | 15,769,712 |
Imperial Oil Ltd. | 450,000 | | 19,910,388 |
|
| Shares | | Value |
Keyera Corp. | 152,302 | | $ 7,392,842 |
MEG Energy Corp. (a) | 400,000 | | 14,610,263 |
Nexen, Inc. | 600,000 | | 14,327,910 |
Pacific Rubiales Energy Corp. | 700,000 | | 16,463,579 |
Painted Pony Petroleum Ltd. (a)(e) | 113,000 | | 1,221,927 |
Pembina Pipeline Corp. | 250,000 | | 6,991,239 |
Penn West Petroleum Ltd. | 700,000 | | 9,090,363 |
PetroBakken Energy Ltd. Class A (d) | 700,000 | | 8,838,048 |
Peyto Exploration & Development Corp. | 300,000 | | 7,329,161 |
Progress Energy Resources Corp. | 300,000 | | 6,043,554 |
Suncor Energy, Inc. | 4,157,600 | | 139,537,173 |
Surge Energy, Inc. (a) | 250,000 | | 1,689,612 |
Surge Energy, Inc. (a)(e) | 632,000 | | 4,271,339 |
Talisman Energy, Inc. | 2,700,000 | | 30,602,253 |
Tourmaline Oil Corp. (a) | 400,000 | | 13,216,521 |
Tourmaline Oil Corp. (a)(e) | 80,000 | | 2,643,304 |
TransCanada Corp. | 1,400,000 | | 63,036,796 |
Trilogy Energy Corp. | 100,000 | | 2,737,422 |
Vermilion Energy, Inc. | 400,000 | | 19,123,905 |
| | 816,132,802 |
FINANCIALS - 28.3% |
Capital Markets - 0.7% |
CI Financial Corp. | 1,000,000 | | 23,369,212 |
Commercial Banks - 20.4% |
Bank of Montreal | 1,500,000 | | 88,640,801 |
Bank of Nova Scotia | 2,500,000 | | 135,794,743 |
Canadian Imperial Bank of Commerce | 654,600 | | 51,489,738 |
National Bank of Canada | 300,000 | | 23,182,979 |
Royal Bank of Canada | 3,430,000 | | 195,548,632 |
The Toronto-Dominion Bank | 2,263,800 | | 184,118,622 |
| | 678,775,515 |
Consumer Finance - 0.2% |
Discover Financial Services | 150,000 | | 6,150,000 |
Insurance - 3.1% |
Fairfax Financial Holdings Ltd. (sub. vtg.) | 40,000 | | 14,838,949 |
Intact Financial Corp. | 660,925 | | 40,532,322 |
Manulife Financial Corp. | 2,000,000 | | 24,710,889 |
Sun Life Financial, Inc. | 900,000 | | 22,320,901 |
| | 102,403,061 |
Real Estate Investment Trusts - 2.0% |
Boardwalk (REIT) | 200,000 | | 12,870,088 |
H&R REIT/H&R Finance Trust | 600,000 | | 14,496,120 |
RioCan (REIT) | 1,400,000 | | 38,183,730 |
| | 65,549,938 |
Real Estate Management & Development - 1.9% |
Brookfield Asset Management, Inc.
Class A | 1,550,000 | | 53,355,695 |
Brookfield Properties Corp. | 700,000 | | 10,779,474 |
| | 64,135,169 |
TOTAL FINANCIALS | | 940,382,895 |
Common Stocks - continued |
| Shares | | Value |
HEALTH CARE - 6.2% |
Health Care Providers & Services - 3.1% |
Catamaran Corp. (a) | 2,206,468 | | $ 103,612,865 |
Pharmaceuticals - 3.1% |
Valeant Pharmaceuticals International, Inc. (Canada) (a) | 1,831,471 | | 102,323,987 |
TOTAL HEALTH CARE | | 205,936,852 |
INDUSTRIALS - 4.8% |
Machinery - 0.1% |
Westport Innovations, Inc. (a)(d) | 100,000 | | 2,806,001 |
Road & Rail - 4.5% |
Canadian National Railway Co. | 1,140,000 | | 98,436,646 |
Canadian Pacific | 550,000 | | 50,597,247 |
| | 149,033,893 |
Trading Companies & Distributors - 0.2% |
Finning International, Inc. | 300,000 | | 7,043,805 |
TOTAL INDUSTRIALS | | 158,883,699 |
INFORMATION TECHNOLOGY - 3.1% |
Communications Equipment - 0.2% |
Research In Motion Ltd. (a) | 700,000 | | 5,551,002 |
Computers & Peripherals - 0.3% |
Apple, Inc. | 17,000 | | 10,116,700 |
Internet Software & Services - 0.9% |
eBay, Inc. (a) | 400,000 | | 19,316,000 |
Open Text Corp. (a) | 170,407 | | 9,158,896 |
| | 28,474,896 |
IT Services - 1.7% |
CGI Group, Inc. Class A (sub. vtg.) (a) | 2,190,000 | | 57,296,320 |
Software - 0.0% |
Constellation Software, Inc. | 10,000 | | 1,147,034 |
TOTAL INFORMATION TECHNOLOGY | | 102,585,952 |
MATERIALS - 18.0% |
Chemicals - 1.8% |
Agrium, Inc. | 500,000 | | 52,655,820 |
Methanex Corp. | 200,000 | | 5,995,494 |
| | 58,651,314 |
Metals & Mining - 16.2% |
Agnico-Eagle Mines Ltd. (Canada) | 900,000 | | 50,814,518 |
Alamos Gold, Inc. | 250,000 | | 4,893,617 |
Barrick Gold Corp. | 2,230,000 | | 90,182,428 |
Copper Mountain Mining Corp. (a) | 390,000 | | 1,577,572 |
Detour Gold Corp. (a) | 100,000 | | 2,817,522 |
Eldorado Gold Corp. | 2,005,000 | | 29,630,839 |
|
| Shares | | Value |
First Majestic Silver Corp. (a) | 100,000 | | $ 2,311,890 |
First Quantum Minerals Ltd. | 1,630,000 | | 36,639,299 |
Franco-Nevada Corp. | 500,000 | | 28,790,989 |
Goldcorp, Inc. | 2,550,000 | | 115,276,596 |
IAMGOLD Corp. | 700,000 | | 10,863,579 |
Kinross Gold Corp. | 2,800,000 | | 27,810,763 |
New Gold, Inc. (a) | 1,200,000 | | 14,045,557 |
Silver Wheaton Corp. | 1,125,900 | | 45,374,193 |
Tahoe Resources, Inc. (a) | 350,000 | | 7,134,919 |
Teck Resources Ltd. Class B
(sub. vtg.) | 600,000 | | 19,043,805 |
Turquoise Hill Resources Ltd. (a) | 100,000 | | 781,977 |
Yamana Gold, Inc. | 2,500,000 | | 50,488,110 |
| | 538,478,173 |
TOTAL MATERIALS | | 597,129,487 |
TELECOMMUNICATION SERVICES - 5.6% |
Diversified Telecommunication Services - 4.5% |
BCE, Inc. | 1,900,000 | | 83,057,822 |
Manitoba Telecom Services, Inc. | 150,000 | | 5,035,795 |
TELUS Corp. | 950,000 | | 61,675,094 |
| | 149,768,711 |
Wireless Telecommunication Services - 1.1% |
Rogers Communications, Inc.
Class B (non-vtg.) | 800,000 | | 35,115,895 |
TOTAL TELECOMMUNICATION SERVICES | | 184,884,606 |
UTILITIES - 0.2% |
Electric Utilities - 0.2% |
Fortis, Inc. | 200,000 | | 6,762,453 |
TOTAL COMMON STOCKS (Cost $2,549,774,434) |
3,295,534,630
|
Money Market Funds - 0.6% |
| | | |
Fidelity Cash Central Fund, 0.19% (b) | 13,194,244 | | 13,194,244 |
Fidelity Securities Lending Cash Central Fund, 0.19% (b)(c) | 5,266,702 | | 5,266,702 |
TOTAL MONEY MARKET FUNDS (Cost $18,460,946) |
18,460,946
|
TOTAL INVESTMENT PORTFOLIO - 99.9% (Cost $2,568,235,380) | | 3,313,995,576 |
NET OTHER ASSETS (LIABILITIES) - 0.1% | | 3,373,680 |
NET ASSETS - 100% | $ 3,317,369,256 |
Legend |
(a) Non-income producing |
(b) Affiliated fund that is available only to investment companies and other accounts managed by Fidelity Investments. The rate quoted is the annualized seven-day yield of the fund at period end. A complete unaudited listing of the fund's holdings as of its most recent quarter end is available upon request. In addition, each Fidelity Central Fund's financial statements, which are not covered by the Fund's Report of Independent Registered Public Accounting Firm, are available on the SEC's website or upon request. |
(c) Investment made with cash collateral received from securities on loan. |
(d) Security or a portion of the security is on loan at period end. |
(e) Security exempt from registration under Rule 144A of the Securities Act of 1933. These securities may be resold in transactions exempt from registration, normally to qualified institutional buyers. At the end of the period, the value of these securities amounted to $13,359,098 or 0.4% of net assets. |
Affiliated Central Funds |
Information regarding fiscal year to date income earned by the Fund from investments in Fidelity Central Funds is as follows: |
Fund | Income earned |
Fidelity Cash Central Fund | $ 44,834 |
Fidelity Securities Lending Cash Central Fund | 3,887,175 |
Total | $ 3,932,009 |
Other Information |
All investments are categorized as Level 1 under the Fair Value Hierarchy. The inputs or methodology used for valuing securities may not be an indication of the risk associated with investing in those securities. For more information on valuation inputs, please refer to the Security Valuation section in the accompanying Notes to Financial Statements. |
See accompanying notes which are an integral part of the financial statements.
Annual Report
Fidelity Canada Fund
Statement of Assets and Liabilities
| October 31, 2012 |
| | |
Assets | | |
Investment in securities, at value (including securities loaned of $5,503,902) - See accompanying schedule: Unaffiliated issuers (cost $2,549,774,434) | $ 3,295,534,630 | |
Fidelity Central Funds (cost $18,460,946) | 18,460,946 | |
Total Investments (cost $2,568,235,380) | | $ 3,313,995,576 |
Cash | | 21,250 |
Foreign currency held at value (cost $2,060,308) | | 2,060,332 |
Receivable for investments sold | | 9,935,950 |
Receivable for fund shares sold | | 1,517,468 |
Dividends receivable | | 4,109,324 |
Distributions receivable from Fidelity Central Funds | | 59,330 |
Other receivables | | 14,400 |
Total assets | | 3,331,713,630 |
| | |
Liabilities | | |
Payable for fund shares redeemed | 6,635,280 | |
Accrued management fee | 1,512,106 | |
Distribution and service plan fees payable | 111,491 | |
Other affiliated payables | 742,785 | |
Other payables and accrued expenses | 76,010 | |
Collateral on securities loaned, at value | 5,266,702 | |
Total liabilities | | 14,344,374 |
| | |
Net Assets | | $ 3,317,369,256 |
Net Assets consist of: | | |
Paid in capital | | $ 2,827,898,108 |
Undistributed net investment income | | 34,776,724 |
Accumulated undistributed net realized gain (loss) on investments and foreign currency transactions | | (291,046,123) |
Net unrealized appreciation (depreciation) on investments and assets and liabilities in foreign currencies | | 745,740,547 |
Net Assets | | $ 3,317,369,256 |
Statement of Assets and Liabilities - continued
| October 31, 2012 |
| | |
Calculation of Maximum Offering Price Class A:
Net Asset Value and redemption price per share ($159,597,483 ÷ 2,975,053 shares) | | $ 53.65 |
| | |
Maximum offering price per share (100/94.25 of $53.65) | | $ 56.92 |
Class T:
Net Asset Value and redemption price per share ($29,625,811 ÷ 553,936 shares) | | $ 53.48 |
| | |
Maximum offering price per share (100/96.50 of $53.48) | | $ 55.42 |
Class B:
Net Asset Value and offering price per share ($9,803,560 ÷ 185,371 shares)A | | $ 52.89 |
| | |
Class C:
Net Asset Value and offering price per share ($66,500,018 ÷ 1,263,941 shares)A | | $ 52.61 |
| | |
Canada:
Net Asset Value, offering price and redemption price per share ($2,992,597,323 ÷ 55,370,497 shares) | | $ 54.05 |
| | |
Institutional Class:
Net Asset Value, offering price and redemption price per share ($59,245,061 ÷ 1,098,973 shares) | | $ 53.91 |
A Redemption price per share is equal to net asset value less any applicable contingent deferred sales charge.
See accompanying notes which are an integral part of the financial statements.
Annual Report
Statement of Operations
| Year ended October 31, 2012 |
Investment Income | | |
Dividends | | $ 89,193,450 |
Interest | | 976 |
Income from Fidelity Central Funds | | 3,932,009 |
Income before foreign taxes withheld | | 93,126,435 |
Less foreign taxes withheld | | (13,007,969) |
Total income | | 80,118,466 |
| | |
Expenses | | |
Management fee | | |
Basic fee | $ 26,006,550 | |
Performance adjustment | (7,737,368) | |
Transfer agent fees | 8,217,902 | |
Distribution and service plan fees | 1,473,188 | |
Accounting and security lending fees | 1,518,335 | |
Custodian fees and expenses | 53,185 | |
Independent trustees' compensation | 24,641 | |
Registration fees | 118,560 | |
Audit | 72,750 | |
Legal | 19,835 | |
Interest | 4,274 | |
Miscellaneous | 47,776 | |
Total expenses before reductions | 29,819,628 | |
Expense reductions | (54,667) | 29,764,961 |
Net investment income (loss) | | 50,353,505 |
Realized and Unrealized Gain (Loss) Net realized gain (loss) on: | | |
Investment securities: | | |
Unaffiliated issuers | (17,620,339) | |
Foreign currency transactions | (450,336) | |
Total net realized gain (loss) | | (18,070,675) |
Change in net unrealized appreciation (depreciation) on: Investment securities | 100,622,640 | |
Assets and liabilities in foreign currencies | (46,625) | |
Total change in net unrealized appreciation (depreciation) | | 100,576,015 |
Net gain (loss) | | 82,505,340 |
Net increase (decrease) in net assets resulting from operations | | $ 132,858,845 |
Statement of Changes in Net Assets
| Year ended
October 31,
2012 | Year ended
October 31,
2011 |
Increase (Decrease) in Net Assets | | |
Operations | | |
Net investment income (loss) | $ 50,353,505 | $ 41,545,130 |
Net realized gain (loss) | (18,070,675) | 43,297,359 |
Change in net unrealized appreciation (depreciation) | 100,576,015 | (192,122,126) |
Net increase (decrease) in net assets resulting from operations | 132,858,845 | (107,279,637) |
Distributions to shareholders from net investment income | (36,731,380) | (35,317,815) |
Distributions to shareholders from net realized gain | (22,566,448) | (35,060,747) |
Total distributions | (59,297,828) | (70,378,562) |
Share transactions - net increase (decrease) | (952,875,100) | 103,024,419 |
Redemption fees | 257,398 | 1,146,266 |
Total increase (decrease) in net assets | (879,056,685) | (73,487,514) |
| | |
Net Assets | | |
Beginning of period | 4,196,425,941 | 4,269,913,455 |
End of period (including undistributed net investment income of $34,776,724 and undistributed net investment income of $25,762,870, respectively) | $ 3,317,369,256 | $ 4,196,425,941 |
See accompanying notes which are an integral part of the financial statements.
Annual Report
Financial Highlights - Class A
Years ended October 31, | 2012 | 2011 | 2010 | 2009 | 2008 |
Selected Per-Share Data | | | | | |
Net asset value, beginning of period | $ 52.20 | $ 53.81 | $ 44.24 | $ 38.20 | $ 70.16 |
Income from Investment Operations | | | | | |
Net investment income (loss) C | .57 | .34 | .31 | .38 | .39 |
Net realized and unrealized gain (loss) | 1.50 | (1.17) | 9.64 | 5.72 | (28.71) |
Total from investment operations | 2.07 | (.83) | 9.95 | 6.10 | (28.32) |
Distributions from net investment income | (.33) | (.35) | (.39) | (.07) | (.41) |
Distributions from net realized gain | (.29) | (.44) | - | - | (3.27) |
Total distributions | (.62) | (.79) | (.39) | (.07) | (3.68) |
Redemption fees added to paid in capital C | - G | .01 | .01 | .01 | .04 |
Net asset value, end of period | $ 53.65 | $ 52.20 | $ 53.81 | $ 44.24 | $ 38.20 |
Total Return A,B | 4.04% | (1.64)% | 22.62% | 16.08% | (42.23)% |
Ratios to Average Net Assets D,F | | | | | |
Expenses before reductions | 1.08% | 1.12% | 1.24% | 1.42% | 1.34% |
Expenses net of fee waivers, if any | 1.08% | 1.12% | 1.24% | 1.42% | 1.34% |
Expenses net of all reductions | 1.08% | 1.12% | 1.18% | 1.39% | 1.31% |
Net investment income (loss) | 1.11% | .59% | .63% | .98% | .69% |
Supplemental Data | | | | | |
Net assets, end of period (000 omitted) | $ 159,597 | $ 215,369 | $ 170,446 | $ 83,015 | $ 56,242 |
Portfolio turnover rate E | 86% | 104% | 143% | 123% | 63% |
A Total returns would have been lower if certain expenses had not been reduced during the applicable periods shown. B Total returns do not include the effect of the sales charges. C Calculated based on average shares outstanding during the period. D Fees and expenses of any underlying Fidelity Central Funds are not included in the Fund's expense ratio. The Fund indirectly bears its proportionate share of the expenses of any underlying Fidelity Central Funds. E Amount does not include the portfolio activity of any underlying Fidelity Central Funds. F Expense ratios reflect operating expenses of the class. Expenses before reductions do not reflect amounts reimbursed by the investment adviser or reductions from brokerage service arrangements or reductions from other expense offset arrangements and do not represent the amount paid by the class during periods when reimbursements or reductions occur. Expenses net of fee waivers reflect expenses after reimbursement by the investment adviser but prior to reductions from brokerage service arrangements or other expense offset arrangements. Expenses net of all reductions represent the net expenses paid by the class. G Amount represents less than $.01 per share. |
Financial Highlights - Class T
Years ended October 31, | 2012 | 2011 | 2010 | 2009 | 2008 |
Selected Per-Share Data | | | | | |
Net asset value, beginning of period | $ 52.01 | $ 53.64 | $ 44.11 | $ 38.10 | $ 70.09 |
Income from Investment Operations | | | | | |
Net investment income (loss) C | .43 | .17 | .18 | .27 | .23 |
Net realized and unrealized gain (loss) | 1.49 | (1.16) | 9.60 | 5.73 | (28.66) |
Total from investment operations | 1.92 | (.99) | 9.78 | 6.00 | (28.43) |
Distributions from net investment income | (.16) | (.21) | (.26) | - | (.33) |
Distributions from net realized gain | (.29) | (.44) | - | - | (3.27) |
Total distributions | (.45) | (.65) | (.26) | - | (3.60) |
Redemption fees added to paid in capital C | - G | .01 | .01 | .01 | .04 |
Net asset value, end of period | $ 53.48 | $ 52.01 | $ 53.64 | $ 44.11 | $ 38.10 |
Total Return A,B | 3.74% | (1.93)% | 22.27% | 15.77% | (42.40)% |
Ratios to Average Net Assets D,F | | | | | |
Expenses before reductions | 1.36% | 1.42% | 1.51% | 1.70% | 1.63% |
Expenses net of fee waivers, if any | 1.36% | 1.42% | 1.51% | 1.70% | 1.63% |
Expenses net of all reductions | 1.36% | 1.42% | 1.46% | 1.67% | 1.60% |
Net investment income (loss) | .83% | .30% | .36% | .71% | .40% |
Supplemental Data | | | | | |
Net assets, end of period (000 omitted) | $ 29,626 | $ 34,323 | $ 31,522 | $ 17,727 | $ 14,963 |
Portfolio turnover rate E | 86% | 104% | 143% | 123% | 63% |
A Total returns would have been lower if certain expenses had not been reduced during the applicable periods shown. B Total returns do not include the effect of the sales charges. C Calculated based on average shares outstanding during the period. D Fees and expenses of any underlying Fidelity Central Funds are not included in the Fund's expense ratio. The Fund indirectly bears its proportionate share of the expenses of any underlying Fidelity Central Funds. E Amount does not include the portfolio activity of any underlying Fidelity Central Funds. F Expense ratios reflect operating expenses of the class. Expenses before reductions do not reflect amounts reimbursed by the investment adviser or reductions from brokerage service arrangements or reductions from other expense offset arrangements and do not represent the amount paid by the class during periods when reimbursements or reductions occur. Expenses net of fee waivers reflect expenses after reimbursement by the investment adviser but prior to reductions from brokerage service arrangements or other expense offset arrangements. Expenses net of all reductions represent the net expenses paid by the class. G Amount represents less than $.01 per share. |
See accompanying notes which are an integral part of the financial statements.
Annual Report
Financial Highlights - Class B
Years ended October 31, | 2012 | 2011 | 2010 | 2009 | 2008 |
Selected Per-Share Data | | | | | |
Net asset value, beginning of period | $ 51.37 | $ 53.03 | $ 43.68 | $ 37.91 | $ 69.88 |
Income from Investment Operations | | | | | |
Net investment income (loss) C | .17 | (.11) | (.07) | .08 | (.06) |
Net realized and unrealized gain (loss) | 1.49 | (1.14) | 9.50 | 5.68 | (28.54) |
Total from investment operations | 1.66 | (1.25) | 9.43 | 5.76 | (28.60) |
Distributions from net investment income | - | (.01) | (.09) | - | (.14) |
Distributions from net realized gain | (.14) | (.41) | - | - | (3.27) |
Total distributions | (.14) | (.42) | (.09) | - | (3.41) |
Redemption fees added to paid in capital C | - G | .01 | .01 | .01 | .04 |
Net asset value, end of period | $ 52.89 | $ 51.37 | $ 53.03 | $ 43.68 | $ 37.91 |
Total Return A,B | 3.25% | (2.41)% | 21.64% | 15.22% | (42.68)% |
Ratios to Average Net Assets D,F | | | | | |
Expenses before reductions | 1.85% | 1.91% | 2.01% | 2.19% | 2.13% |
Expenses net of fee waivers, if any | 1.85% | 1.91% | 2.01% | 2.19% | 2.13% |
Expenses net of all reductions | 1.85% | 1.91% | 1.96% | 2.16% | 2.10% |
Net investment income (loss) | .34% | (.20)% | (.14)% | .21% | (.10)% |
Supplemental Data | | | | | |
Net assets, end of period (000 omitted) | $ 9,804 | $ 11,866 | $ 13,464 | $ 7,283 | $ 5,615 |
Portfolio turnover rate E | 86% | 104% | 143% | 123% | 63% |
A Total returns would have been lower if certain expenses had not been reduced during the applicable periods shown. B Total returns do not include the effect of the contingent deferred sales charge. C Calculated based on average shares outstanding during the period. D Fees and expenses of any underlying Fidelity Central Funds are not included in the Fund's expense ratio. The Fund indirectly bears its proportionate share of the expenses of any underlying Fidelity Central Funds. E Amount does not include the portfolio activity of any underlying Fidelity Central Funds. F Expense ratios reflect operating expenses of the class. Expenses before reductions do not reflect amounts reimbursed by the investment adviser or reductions from brokerage service arrangements or reductions from other expense offset arrangements and do not represent the amount paid by the class during periods when reimbursements or reductions occur. Expenses net of fee waivers reflect expenses after reimbursement by the investment adviser but prior to reductions from brokerage service arrangements or other expense offset arrangements. Expenses net of all reductions represent the net expenses paid by the class. G Amount represents less than $.01 per share. |
Financial Highlights - Class C
Years ended October 31, | 2012 | 2011 | 2010 | 2009 | 2008 |
Selected Per-Share Data | | | | | |
Net asset value, beginning of period | $ 51.19 | $ 52.87 | $ 43.60 | $ 37.84 | $ 69.91 |
Income from Investment Operations | | | | | |
Net investment income (loss) C | .19 | (.08) | (.06) | .09 | (.05) |
Net realized and unrealized gain (loss) | 1.46 | (1.14) | 9.48 | 5.66 | (28.52) |
Total from investment operations | 1.65 | (1.22) | 9.42 | 5.75 | (28.57) |
Distributions from net investment income | - | (.03) | (.16) | - | (.27) |
Distributions from net realized gain | (.23) | (.44) | - | - | (3.27) |
Total distributions | (.23) | (.47) | (.16) | - | (3.54) |
Redemption fees added to paid in capital C | - G | .01 | .01 | .01 | .04 |
Net asset value, end of period | $ 52.61 | $ 51.19 | $ 52.87 | $ 43.60 | $ 37.84 |
Total Return A,B | 3.26% | (2.36)% | 21.68% | 15.22% | (42.69)% |
Ratios to Average Net Assets D,F | | | | | |
Expenses before reductions | 1.82% | 1.86% | 1.99% | 2.18% | 2.13% |
Expenses net of fee waivers, if any | 1.82% | 1.86% | 1.99% | 2.18% | 2.13% |
Expenses net of all reductions | 1.82% | 1.86% | 1.94% | 2.15% | 2.10% |
Net investment income (loss) | .37% | (.15)% | (.12)% | .22% | (.10)% |
Supplemental Data | | | | | |
Net assets, end of period (000 omitted) | $ 66,500 | $ 87,990 | $ 54,052 | $ 24,848 | $ 16,716 |
Portfolio turnover rate E | 86% | 104% | 143% | 123% | 63% |
A Total returns would have been lower if certain expenses had not been reduced during the applicable periods shown. B Total returns do not include the effect of the contingent deferred sales charge. C Calculated based on average shares outstanding during the period. D Fees and expenses of any underlying Fidelity Central Funds are not included in the Fund's expense ratio. The Fund indirectly bears its proportionate share of the expenses of any underlying Fidelity Central Funds. E Amount does not include the portfolio activity of any underlying Fidelity Central Funds. F Expense ratios reflect operating expenses of the class. Expenses before reductions do not reflect amounts reimbursed by the investment adviser or reductions from brokerage service arrangements or reductions from other expense offset arrangements and do not represent the amount paid by the class during periods when reimbursements or reductions occur. Expenses net of fee waivers reflect expenses after reimbursement by the investment adviser but prior to reductions from brokerage service arrangements or other expense offset arrangements. Expenses net of all reductions represent the net expenses paid by the class. G Amount represents less than $.01 per share. |
See accompanying notes which are an integral part of the financial statements.
Annual Report
Financial Highlights - Canada
Years ended October 31, | 2012 | 2011 | 2010 | 2009 | 2008 |
Selected Per-Share Data | | | | | |
Net asset value, beginning of period | $ 52.59 | $ 54.14 | $ 44.46 | $ 38.37 | $ 70.25 |
Income from Investment Operations | | | | | |
Net investment income (loss) B | .73 | .52 | .46 | .48 | .58 |
Net realized and unrealized gain (loss) | 1.51 | (1.18) | 9.68 | 5.74 | (28.83) |
Total from investment operations | 2.24 | (.66) | 10.14 | 6.22 | (28.25) |
Distributions from net investment income | (.49) | (.46) | (.47) | (.14) | (.40) |
Distributions from net realized gain | (.29) | (.44) | - | - | (3.27) |
Total distributions | (.78) | (.90) | (.47) | (.14) | (3.67) |
Redemption fees added to paid in capital B | - F | .01 | .01 | .01 | .04 |
Net asset value, end of period | $ 54.05 | $ 52.59 | $ 54.14 | $ 44.46 | $ 38.37 |
Total Return A | 4.36% | (1.33)% | 22.97% | 16.40% | (42.06)% |
Ratios to Average Net Assets C,E | | | | | |
Expenses before reductions | .77% | .82% | .94% | 1.17% | 1.03% |
Expenses net of fee waivers, if any | .77% | .82% | .94% | 1.17% | 1.03% |
Expenses net of all reductions | .77% | .82% | .89% | 1.13% | 1.00% |
Net investment income (loss) | 1.42% | .90% | .93% | 1.24% | 1.00% |
Supplemental Data | | | | | |
Net assets, end of period (000 omitted) | $ 2,992,597 | $ 3,778,765 | $ 3,953,693 | $ 3,149,791 | $ 2,776,298 |
Portfolio turnover rate D | 86% | 104% | 143% | 123% | 63% |
A Total returns would have been lower if certain expenses had not been reduced during the applicable periods shown. B Calculated based on average shares outstanding during the period. C Fees and expenses of any underlying Fidelity Central Funds are not included in the Fund's expense ratio. The Fund indirectly bears its proportionate share of the expenses of any underlying Fidelity Central Funds. D Amount does not include the portfolio activity of any underlying Fidelity Central Funds. E Expense ratios reflect operating expenses of the class. Expenses before reductions do not reflect amounts reimbursed by the investment adviser or reductions from brokerage service arrangements or reductions from other expense offset arrangements and do not represent the amount paid by the class during periods when reimbursements or reductions occur. Expenses net of fee waivers reflect expenses after reimbursement by the investment adviser but prior to reductions from brokerage service arrangements or other expense offset arrangements. Expenses net of all reductions represent the net expenses paid by the class. F Amount represents less than $.01 per share. |
Financial Highlights - Institutional Class
Years ended October 31, | 2012 | 2011 | 2010 | 2009 | 2008 |
Selected Per-Share Data | | | | | |
Net asset value, beginning of period | $ 52.44 | $ 54.02 | $ 44.39 | $ 38.31 | $ 70.25 |
Income from Investment Operations | | | | | |
Net investment income (loss) B | .74 | .51 | .46 | .49 | .52 |
Net realized and unrealized gain (loss) | 1.50 | (1.18) | 9.65 | 5.72 | (28.78) |
Total from investment operations | 2.24 | (.67) | 10.11 | 6.21 | (28.26) |
Distributions from net investment income | (.48) | (.48) | (.49) | (.14) | (.45) |
Distributions from net realized gain | (.29) | (.44) | - | - | (3.27) |
Total distributions | (.77) | (.92) | (.49) | (.14) | (3.72) |
Redemption fees added to paid in capital B | - F | .01 | .01 | .01 | .04 |
Net asset value, end of period | $ 53.91 | $ 52.44 | $ 54.02 | $ 44.39 | $ 38.31 |
Total Return A | 4.38% | (1.35)% | 22.94% | 16.40% | (42.11)% |
Ratios to Average Net Assets C,E | | | | | |
Expenses before reductions | .76% | .82% | .95% | 1.17% | 1.11% |
Expenses net of fee waivers, if any | .76% | .82% | .95% | 1.17% | 1.11% |
Expenses net of all reductions | .76% | .82% | .90% | 1.14% | 1.08% |
Net investment income (loss) | 1.42% | .89% | .92% | 1.23% | .92% |
Supplemental Data | | | | | |
Net assets, end of period (000 omitted) | $ 59,245 | $ 68,112 | $ 46,737 | $ 17,956 | $ 8,870 |
Portfolio turnover rate D | 86% | 104% | 143% | 123% | 63% |
A Total returns would have been lower if certain expenses had not been reduced during the applicable periods shown. B Calculated based on average shares outstanding during the period. C Fees and expenses of any underlying Fidelity Central Funds are not included in the Fund's expense ratio. The Fund indirectly bears its proportionate share of the expenses of any underlying Fidelity Central Funds. D Amount does not include the portfolio activity of any underlying Fidelity Central Funds. E Expense ratios reflect operating expenses of the class. Expenses before reductions do not reflect amounts reimbursed by the investment adviser or reductions from brokerage service arrangements or reductions from other expense offset arrangements and do not represent the amount paid by the class during periods when reimbursements or reductions occur. Expenses net of fee waivers reflect expenses after reimbursement by the investment adviser but prior to reductions from brokerage service arrangements or other expense offset arrangements. Expenses net of all reductions represent the net expenses paid by the class. F Amount represents less than $.01 per share. |
See accompanying notes which are an integral part of the financial statements.
Annual Report
Notes to Financial Statements
For the period ended October 31, 2012
1. Organization.
Fidelity Canada Fund (the Fund) is a fund of Fidelity Investment Trust (the Trust) and is authorized to issue an unlimited number of shares. The Trust is registered under the Investment Company Act of 1940, as amended (the 1940 Act), as an open-end management investment company organized as a Massachusetts business trust. The Fund offers Class A, Class T, Class C, Canada, and Institutional Class shares, each of which, along with Class B shares, has equal rights as to assets and voting privileges. Effective after the close of business on September 1, 2010, Class B shares were closed to new accounts and additional purchases, except for exchanges and reinvestments. Each class has exclusive voting rights with respect to matters that affect that class. Class B shares will automatically convert to Class A shares after a holding period of seven years from the initial date of purchase. Investment income, realized and unrealized capital gains and losses, the common expenses of the Fund, and certain fund-level expense reductions, if any, are allocated on a pro-rata basis to each class based on the relative net assets of each class to the total net assets of the Fund. Each class differs with respect to transfer agent and distribution and service plan fees incurred. Certain expense reductions may also differ by class.
2. Investments in Fidelity Central Funds.
The Fund invests in Fidelity Central Funds, which are open-end investment companies available only to other investment companies and accounts managed by Fidelity Management & Research Company (FMR) and its affiliates. The Fund's Schedule of Investments lists each of the Fidelity Central Funds held as of period end, if any, as an investment of the Fund, but does not include the underlying holdings of each Fidelity Central Fund. As an Investing Fund, the Fund indirectly bears its proportionate share of the expenses of the underlying Fidelity Central Funds.
The Money Market Central Funds seek preservation of capital and current income and are managed by Fidelity Investments Money Management, Inc. (FIMM), an affiliate of FMR.
A complete unaudited list of holdings for each Fidelity Central Fund is available upon request or at the Securities and Exchange Commission (the SEC) web site at www.sec.gov. In addition, the financial statements of the Fidelity Central Funds, which are not covered by the Fund's Report of Independent Registered Public Accounting Firm, are available on the SEC web site or upon request.
3. Significant Accounting Policies.
The financial statements have been prepared in conformity with accounting principles generally accepted in the United States of America (GAAP), which require management to make certain estimates and assumptions at the date of the financial statements. Actual results could differ from those estimates. Subsequent events, if any, through the date that the financial statements were issued have been evaluated in the preparation of the financial statements. The following summarizes the significant accounting policies of the Fund:
Security Valuation. Investments are valued as of 4:00 p.m. Eastern time on the last calendar day of the period. In accordance with valuation policies and procedures approved by the Board of Trustees (the Board), the Fund attempts to obtain prices from one or more third party pricing vendors or brokers to value its investments. When current market prices, quotations or rates are not readily available or reliable, securities will be fair valued in good faith by the FMR Fair Value Committee (the Committee), in accordance with procedures adopted by the Fund's Board. Factors used in determining fair value vary by security type and may include market or security specific events. The frequency with which these procedures are used cannot be predicted and they may be utilized to a significant extent. The Committee oversees the Fund's valuation policies and procedures and is responsible for approving and reporting to the Board all fair value determinations.
The Fund categorizes the inputs to valuation techniques used to value its investments into a disclosure hierarchy consisting of three levels as shown below:
Level 1 - quoted prices in active markets for identical investments
Level 2 - other significant observable inputs (including quoted prices for similar investments, interest rates, prepayment speeds, etc.)
Level 3 - unobservable inputs (including the Fund's own assumptions based on the best information available)
Valuation techniques used to value the Fund's investments by major category are as follows:
Equity securities, including restricted securities, for which market quotations are readily available, are valued at the last reported sale price or official closing price as reported by a third party pricing vendor on the primary market or exchange on which they are traded and are categorized as Level 1 in the hierarchy. In the event there were no sales during the day or closing prices are not available, securities are valued at the last quoted bid price or may be valued using the last available price and are generally categorized as Level 2 in the hierarchy. For foreign equity securities, when significant market or security specific events arise, comparisons to the valuation of American Depositary Receipts (ADRs), futures contracts, Exchange-Traded Funds (ETFs) and certain indexes as well as quoted prices for similar securities are used and are categorized as Level 2 in the hierarchy. Utilizing these techniques may result in transfers between Level 1 and Level 2.
Annual Report
3. Significant Accounting Policies - continued
Security Valuation - continued
Investments in open-end mutual funds, including the Fidelity Central Funds, are valued at their closing net asset value (NAV) each business day and are categorized as Level 1 in the hierarchy.
Changes in valuation techniques may result in transfers in or out of an assigned level within the disclosure hierarchy.
Foreign Currency Translation. The Fund may use foreign currency contracts to facilitate transactions in foreign-denominated securities. Gains and losses from these transactions may arise from changes in the value of the foreign currency or if the counterparties do not perform under the contracts' terms.
Foreign-denominated assets, including investment securities, and liabilities are translated into U.S. dollars at the exchange rates at period end. Purchases and sales of investment securities, income and dividends received and expenses denominated in foreign currencies are translated into U.S. dollars at the exchange rate in effect on the transaction date.
The effects of exchange rate fluctuations on investments are included with the net realized and unrealized gain (loss) on investment securities. Other foreign currency transactions resulting in realized and unrealized gain (loss) are disclosed separately.
Investment Transactions and Income. For financial reporting purposes, the Fund's investment holdings and NAV include trades executed through the end of the last business day of the period. The NAV per share for processing shareholder transactions is calculated as of the close of business of the New York Stock Exchange (NYSE), normally 4:00 p.m. Eastern time and includes trades executed through the end of the prior business day. Gains and losses on securities sold are determined on the basis of identified cost and may include proceeds received from litigation. Dividend income is recorded on the ex-dividend date, except for certain dividends from foreign securities where the ex-dividend date may have passed, which are recorded as soon as the Fund is informed of the ex-dividend date. Non-cash dividends included in dividend income, if any, are recorded at the fair market value of the securities received. Distributions received on securities that represent a return of capital or capital gain are recorded as a reduction of cost of investments and/or as a realized gain. The Fund estimates the components of distributions received that may be considered return of capital distributions or capital gain distributions. Interest income and distributions from the Fidelity Central Funds are accrued as earned. Interest income includes coupon interest and amortization of premium and accretion of discount on debt securities. Investment income is recorded net of foreign taxes withheld where recovery of such taxes is uncertain.
Expenses. Expenses directly attributable to a fund are charged to that fund. Expenses attributable to more than one fund are allocated among the respective funds on the basis of relative net assets or other appropriate methods. Expense estimates are accrued in the period to which they relate and adjustments are made when actual amounts are known.
Income Tax Information and Distributions to Shareholders. Each year, the Fund intends to qualify as a regulated investment company under Subchapter M of the Internal Revenue Code, including distributing substantially all of its taxable income and realized gains. As a result, no provision for income taxes is required. As of October 31, 2012, the Fund did not have any unrecognized tax benefits in the financial statements; nor is the Fund aware of any tax positions for which it is reasonably possible that the total amounts of unrecognized tax benefits will significantly change in the next twelve months. The Fund files a U.S. federal tax return, in addition to state and local tax returns as required. A fund's federal income tax returns are subject to examination by the Internal Revenue Service (IRS) for a period of three fiscal years after they are filed. State and local tax returns may be subject to examination for an additional fiscal year depending on the jurisdiction. Foreign taxes are provided for based on the Fund's understanding of the tax rules and rates that exist in the foreign markets in which it invests.
Distributions are declared and recorded on the ex-dividend date. Income dividends and capital gain distributions are declared separately for each class. Income and capital gain distributions are determined in accordance with income tax regulations, which may differ from GAAP. In addition, the fund claimed a portion of the payment made to redeeming shareholders as a distribution for income tax purposes.
Capital accounts within the financial statements are adjusted for permanent book-tax differences. These adjustments have no impact on net assets or the results of operations. Temporary book-tax differences will reverse in a subsequent period.
Book-tax differences are primarily due to foreign currency transactions, passive foreign investment companies (PFIC), deferred trustees compensation, capital loss carryforwards and losses deferred due to wash sales.
The federal tax cost of investment securities and unrealized appreciation (depreciation) as of period end were as follows:
Gross unrealized appreciation | $ 769,644,661 |
Gross unrealized depreciation | (51,536,631) |
Net unrealized appreciation (depreciation) on securities and other investments | $ 718,108,030 |
| |
Tax Cost | $ 2,595,887,546 |
Annual Report
Notes to Financial Statements - continued
3. Significant Accounting Policies - continued
Income Tax Information and Distributions to Shareholders - continued
The tax-based components of distributable earnings as of period end were as follows:
Undistributed ordinary income | $ 34,776,967 |
Capital loss carryforward | $ (263,393,959) |
Net unrealized appreciation (depreciation) | $ 718,088,381 |
Capital loss carryforwards are only available to offset future capital gains of the Fund to the extent provided by regulations and may be limited. Under the Regulated Investment Company Modernization Act of 2010 (the Act), the Fund is permitted to carry forward capital losses incurred in taxable years beginning after December 22, 2010 for an unlimited period and such capital losses are required to be used prior to any losses that expire. Capital loss carryforwards were as follows:
Fiscal year of expiration | |
2016 | $ (79,471,942) |
2017 | (150,917,782) |
Total with expiration | (230,389,724) |
No expiration | |
Short-term | (33,004,235) |
Total capital loss carryforward | $ (263,393,959) |
The tax character of distributions paid was as follows:
| October 31, 2012 | October 31, 2011 |
Ordinary Income | $ 59,297,828 | $ 70,378,562 |
Short-Term Trading (Redemption) Fees. Shares held by investors in the Fund less than 90 days are subject to a redemption fee equal to 1.50% of the net asset value of shares redeemed. All redemption fees, which reduce the proceeds of the shareholder redemption, are retained by the Fund and accounted for as an addition to paid in capital.
Restricted Securities. The Fund may invest in securities that are subject to legal or contractual restrictions on resale. These securities generally may be resold in transactions exempt from registration or to the public if the securities are registered. Disposal of these securities may involve time-consuming negotiations and expense, and prompt sale at an acceptable price may be difficult. Information regarding restricted securities is included at the end of the Fund's Schedule of Investments.
New Accounting Pronouncement. In December 2011, the Financial Accounting Standards Board issued Accounting Standard Update No. 2011-11, Disclosures about Offsetting Assets and Liabilities. The update creates new disclosure requirements requiring entities to disclose both gross and net information for derivatives and other financial instruments that are either offset in the Statement of Assets and Liabilities or subject to an enforceable master netting arrangement or similar agreement. The disclosure requirements are effective for annual reporting periods beginning on or after January 1, 2013, and interim periods within those annual periods. Management is currently evaluating the impact of the update's adoption on the Fund's financial statement disclosures.
4. Purchases and Sales of Investments.
Purchases and sales of securities, other than short-term securities, aggregated $3,166,105,255 and $4,137,995,727, respectively.
5. Fees and Other Transactions with Affiliates.
Management Fee. FMR and its affiliates provide the Fund with investment management related services for which the Fund pays a monthly management fee. The management fee is the sum of an individual fund fee rate that is based on an annual rate of .45% of the Fund's average net assets and an annualized group fee rate that averaged .26% during the period. The group fee rate is based upon the average net assets of all the mutual funds advised by FMR. The group fee rate decreases as assets under management increase and increases as assets under management decrease. In addition, the management fee is subject to a performance adjustment (up to a maximum of ±.20% of the Fund's average net assets over a 36 month performance period). The upward or downward adjustment to the management fee is based on the relative investment performance of Canada as compared to an appropriate benchmark index. For the period, the total annual management fee rate, including the performance adjustment, was .50% of the Fund's average net assets.
Annual Report
5. Fees and Other Transactions with Affiliates - continued
Distribution and Service Plan Fees. In accordance with Rule 12b-1 of the 1940 Act, the Fund has adopted separate Distribution and Service Plans for each class of shares. Certain classes pay Fidelity Distributors Corporation (FDC), an affiliate of FMR, separate Distribution and Service Fees, each of which is based on an annual percentage of each class' average net assets. In addition, FDC may pay financial intermediaries for selling shares of the Fund and providing shareholder support services. For the period, the Distribution and Service Fee rates, total fees and amounts retained by FDC were as follows:
| Distribution
Fee | Service
Fee | Total Fees | Retained
by FDC |
Class A | -% | .25% | $ 453,416 | $ 24,371 |
Class T | .25% | .25% | 156,708 | 1,287 |
Class B | .75% | .25% | 106,696 | 80,189 |
Class C | .75% | .25% | 756,368 | 189,437 |
| | | $ 1,473,188 | $ 295,284 |
Sales Load. FDC may receive a front-end sales charge of up to 5.75% for selling Class A shares and 3.50% for selling Class T shares, some of which is paid to financial intermediaries for selling shares of the Fund. Depending on the holding period, FDC may receive contingent deferred sales charges levied on Class A, Class T, Class B and Class C redemptions. The deferred sales charges range from 5.00% to 1.00% for Class B shares, 1.00% for Class C shares, 1.00% for certain purchases of Class A shares and .25% for certain purchases of Class T shares.
For the period, sales charge amounts retained by FDC were as follows:
| Retained
by FDC |
Class A | $ 62,502 |
Class T | 9,357 |
Class B* | 21,585 |
Class C* | 22,491 |
| $ 115,935 |
* When Class B and Class C shares are initially sold, FDC pays commissions from its own resources to financial intermediaries through which the sales are made.
Transfer Agent Fees. Fidelity Investments Institutional Operations Company, Inc. (FIIOC), an affiliate of FMR, is the transfer, dividend disbursing and shareholder servicing agent for each class of the Fund. FIIOC receives account fees and asset-based fees that vary according to the account size and type of account of the shareholders of the respective classes of the Fund. FIIOC pays for typesetting, printing and mailing of shareholder reports, except proxy statements. For the period, transfer agent fees for each class were as follows:
| Amount | % of
Average
Net Assets |
Class A | $ 508,239 | .28 |
Class T | 96,227 | .31 |
Class B | 31,928 | .30 |
Class C | 201,488 | .27 |
Canada | 7,248,062 | .22 |
Institutional Class | 131,958 | .21 |
| $ 8,217,902 | |
Accounting and Security Lending Fees. Fidelity Service Company, Inc. (FSC), an affiliate of FMR, maintains the Fund's accounting records. The accounting fee is based on the level of average net assets for each month. Under a separate contract, FSC administers the security lending program. The security lending fee is based on the number and duration of lending transactions.
Brokerage Commissions. The Fund placed a portion of its portfolio transactions with brokerage firms which are affiliates of the investment adviser. The commissions paid to these affiliated firms were $18,194 for the period.
Annual Report
Notes to Financial Statements - continued
5. Fees and Other Transactions with Affiliates - continued
Interfund Lending Program. Pursuant to an Exemptive Order issued by the SEC, the Fund, along with other registered investment companies having management contracts with FMR, may participate in an interfund lending program. This program provides an alternative credit facility allowing the funds to borrow from, or lend money to, other participating affiliated funds. At period end, there were no interfund loans outstanding. The Fund's activity in this program during the period for which loans were outstanding was as follows:
Borrower or Lender | Average Loan
Balance | Weighted Average Interest Rate | Interest
Expense |
Borrower | $ 8,610,311 | .37% | $ 4,026 |
6. Committed Line of Credit.
The Fund participates with other funds managed by FMR or an affiliate in a $4.25 billion credit facility (the "line of credit") to be utilized for temporary or emergency purposes to fund shareholder redemptions or for other short-term liquidity purposes. The Fund has agreed to pay commitment fees on its pro-rata portion of the line of credit, which amounted to $10,364 and is reflected in Miscellaneous expenses on the Statement of Operations. During the period, there were no borrowings on this line of credit.
7. Security Lending.
The Fund lends portfolio securities through a lending agent from time to time in order to earn additional income. For equity securities, a lending agent is used and may loan securities to certain qualified borrowers, including Fidelity Capital Markets (FCM), a broker-dealer affiliated with the Fund. On the settlement date of the loan, the Fund receives collateral (in the form of U.S. Treasury obligations, letters of credit and/or cash) against the loaned securities and maintains collateral in an amount not less than 100% of the market value of the loaned securities during the period of the loan. The market value of the loaned securities is determined at the close of business of the Fund and any additional required collateral is delivered to the Fund on the next business day. If the borrower defaults on its obligation to return the securities loaned because of insolvency or other reasons, a fund could experience delays and costs in recovering the securities loaned or in gaining access to the collateral. Any cash collateral received is invested in the Fidelity Securities Lending Cash Central Fund. The value of loaned securities and cash collateral at period end are disclosed on the Fund's Statement of Assets and Liabilities. Security lending income represents the income earned on investing cash collateral, less rebates paid to borrowers and any lending agent fees associated with the loan, plus any premium payments received for lending certain types of securities. Security lending income is presented in the Statement of Operations as a component of income from Fidelity Central Funds. Total security lending income during the period amounted to $3,887,175. During the period, there were no securities loaned to FCM.
8. Bank Borrowings.
The Fund is permitted to have bank borrowings for temporary or emergency purposes to fund shareholder redemptions or for other short-term liquidity requirements. The Fund has established borrowing arrangements with certain banks. The interest rate on the borrowings is the bank's base rate, as revised from time to time. The average loan balance during the period for which loans were outstanding amounted to $7,821,000. The weighted average interest rate was .57%. The interest expense amounted to $248 under the bank borrowing program. At period end, there were no bank loans outstanding.
9. Expense Reductions.
Many of the brokers with whom FMR places trades on behalf of the Fund provided services to the Fund in addition to trade execution. These services included payments of certain expenses on behalf of the Fund totaling $54,667 for the period.
10. Distributions to Shareholders.
Distributions to shareholders of each class were as follows:
Years ended October 31, | 2012 | 2011 |
From net investment income | | |
Class A | $ 1,331,457 | $ 1,141,830 |
Class T | 100,888 | 123,341 |
Class B | - | 2,503 |
Class C | - | 36,231 |
Canada | 34,710,753 | 33,570,065 |
Institutional Class | 588,282 | 443,845 |
Total | $ 36,731,380 | $ 35,317,815 |
Annual Report
10. Distributions to Shareholders - continued
Years ended October 31, | 2012 | 2011 |
From net realized gain | | |
Class A | $ 1,169,578 | $ 1,445,324 |
Class T | 185,711 | 261,152 |
Class B | 32,050 | 101,491 |
Class C | 395,818 | 470,108 |
Canada | 20,430,566 | 32,375,322 |
Institutional Class | 352,725 | 407,350 |
Total | $ 22,566,448 | $ 35,060,747 |
11. Share Transactions.
Transactions for each class of shares were as follows:
| Shares | Dollars |
Years ended October 31, | 2012 | 2011 | 2012 | 2011 |
Class A | | | | |
Shares sold | 554,403 | 2,386,291 | $ 28,690,109 | $ 138,991,055 |
Reinvestment of distributions | 41,955 | 39,424 | 2,109,494 | 2,233,433 |
Shares redeemed | (1,747,243) | (1,467,607) | (89,985,257) | (82,665,471) |
Net increase (decrease) | (1,150,885) | 958,108 | $ (59,185,654) | $ 58,559,017 |
Class T | | | | |
Shares sold | 72,156 | 254,873 | $ 3,681,114 | $ 14,715,904 |
Reinvestment of distributions | 5,569 | 6,640 | 279,919 | 375,773 |
Shares redeemed | (183,751) | (189,243) | (9,407,140) | (10,669,184) |
Net increase (decrease) | (106,026) | 72,270 | $ (5,446,107) | $ 4,422,493 |
Class B | | | | |
Shares sold | 3,584 | 29,930 | $ 181,692 | $ 1,729,701 |
Reinvestment of distributions | 519 | 1,508 | 25,894 | 84,713 |
Shares redeemed | (49,710) | (54,348) | (2,528,127) | (3,060,843) |
Net increase (decrease) | (45,607) | (22,910) | $ (2,320,541) | $ (1,246,429) |
Class C | | | | |
Shares sold | 161,752 | 1,081,104 | $ 8,188,420 | $ 62,770,855 |
Reinvestment of distributions | 6,045 | 7,014 | 300,150 | 392,322 |
Shares redeemed | (622,861) | (391,485) | (31,505,606) | (21,249,300) |
Net increase (decrease) | (455,064) | 696,633 | $ (23,017,036) | $ 41,913,877 |
Canada | | | | |
Shares sold | 4,866,802 | 20,804,881 | $ 252,453,035 | $ 1,223,871,558 |
Reinvestment of distributions | 1,003,141 | 1,069,329 | 50,678,709 | 60,856,944 |
Shares redeemed | (22,354,268) | (23,043,159) | (1,155,960,861) | (1,313,818,426) |
Net increase (decrease) | (16,484,325) | (1,168,949) | $ (852,829,117) | $ (29,089,924) |
Institutional Class | | | | |
Shares sold | 561,510 | 1,331,261 | $ 29,055,185 | $ 79,262,853 |
Reinvestment of distributions | 13,162 | 10,934 | 663,252 | 620,606 |
Shares redeemed | (774,433) | (908,649) | (39,795,082) | (51,418,074) |
Net increase (decrease) | (199,761) | 433,546 | $ (10,076,645) | $ 28,465,385 |
12. Other.
The Fund's organizational documents provide former and current trustees and officers with a limited indemnification against liabilities arising in connection with the performance of their duties to the Fund. In the normal course of business, the Fund may also enter into contracts that provide general indemnifications. The Fund's maximum exposure under these arrangements is unknown as this would be dependent on future claims that may be made against the Fund. The risk of material loss from such claims is considered remote.
Annual Report
Report of Independent Registered Public Accounting Firm
To the Trustees of Fidelity Investment Trust and the Shareholders of Fidelity Canada Fund:
In our opinion, the accompanying statement of assets and liabilities, including the schedule of investments, and the related statements of operations and of changes in net assets and the financial highlights present fairly, in all material respects, the financial position of Fidelity Canada Fund (a fund of Fidelity Investment Trust) at October 31, 2012, the results of its operations for the year then ended, the changes in its net assets for each of the two years in the period then ended and the financial highlights for each of the five years in the period then ended, in conformity with accounting principles generally accepted in the United States of America. These financial statements and financial highlights (hereafter referred to as "financial statements") are the responsibility of the Fidelity Canada Fund's management. Our responsibility is to express an opinion on these financial statements based on our audits. We conducted our audits of these financial statements in accordance with the standards of the Public Company Accounting Oversight Board (United States). Those standards require that we plan and perform the audit to obtain reasonable assurance about whether the financial statements are free of material misstatement. An audit includes examining, on a test basis, evidence supporting the amounts and disclosures in the financial statements, assessing the accounting principles used and significant estimates made by management, and evaluating the overall financial statement presentation. We believe that our audits, which included confirmation of securities at October 31, 2012 by correspondence with the custodian and brokers, provide a reasonable basis for our opinion.
PricewaterhouseCoopers LLP
Boston, Massachusetts
December 18, 2012
Annual Report
The Trustees, Members of the Advisory Board, and executive officers of the trust and fund, as applicable, are listed below. The Board of Trustees governs the fund and is responsible for protecting the interests of shareholders. The Trustees are experienced executives who meet periodically throughout the year to oversee the fund's activities, review contractual arrangements with companies that provide services to the fund, oversee management of the risks associated with such activities and contractual arrangements, and review the fund's performance. Except for James C. Curvey, each of the Trustees oversees 236 funds advised by FMR or an affiliate. Mr. Curvey oversees 443 funds advised by FMR or an affiliate.
The Trustees hold office without limit in time except that (a) any Trustee may resign; (b) any Trustee may be removed by written instrument, signed by at least two-thirds of the number of Trustees prior to such removal; (c) any Trustee who requests to be retired or who has become incapacitated by illness or injury may be retired by written instrument signed by a majority of the other Trustees; and (d) any Trustee may be removed at any special meeting of shareholders by a two-thirds vote of the outstanding voting securities of the trust. Each Trustee who is not an interested person (as defined in the 1940 Act) (Independent Trustee), shall retire not later than the last day of the calendar year in which his or her 75th birthday occurs. The Independent Trustees may waive this mandatory retirement age policy with respect to individual Trustees. The executive officers and Advisory Board Members hold office without limit in time, except that any officer and Advisory Board Member may resign or may be removed by a vote of a majority of the Trustees at any regular meeting or any special meeting of the Trustees. Except as indicated, each individual has held the office shown or other offices in the same company for the past five years.
Experience, Skills, Attributes, and Qualifications of the Fund's Trustees. The Governance and Nominating Committee has adopted a statement of policy that describes the experience, qualifications, attributes, and skills that are necessary and desirable for potential Independent Trustee candidates (Statement of Policy). The Board believes that each Trustee satisfied at the time he or she was initially elected or appointed a Trustee, and continues to satisfy, the standards contemplated by the Statement of Policy. The Governance and Nominating Committee also engages professional search firms to help identify potential Independent Trustee candidates who have the experience, qualifications, attributes, and skills consistent with the Statement of Policy. From time to time, additional criteria based on the composition and skills of the current Independent Trustees, as well as experience or skills that may be appropriate in light of future changes to board composition, business conditions, and regulatory or other developments, have also been considered by the professional search firms and the Governance and Nominating Committee. In addition, the Board takes into account the Trustees' commitment and participation in Board and committee meetings, as well as their leadership of standing and ad hoc committees throughout their tenure.
In determining that a particular Trustee was and continues to be qualified to serve as a Trustee, the Board has considered a variety of criteria, none of which, in isolation, was controlling. The Board believes that, collectively, the Trustees have balanced and diverse experience, qualifications, attributes, and skills, which allow the Board to operate effectively in governing the fund and protecting the interests of shareholders. Information about the specific experience, skills, attributes, and qualifications of each Trustee, which in each case led to the Board's conclusion that the Trustee should serve (or continue to serve) as a trustee of the fund, is provided below.
Board Structure and Oversight Function. James C. Curvey is an interested person (as defined in the 1940 Act) and currently serves as Chairman. The Trustees have determined that an interested Chairman is appropriate and benefits shareholders because an interested Chairman has a personal and professional stake in the quality and continuity of services provided to the fund. Independent Trustees exercise their informed business judgment to appoint an individual of their choosing to serve as Chairman, regardless of whether the Trustee happens to be independent or a member of management. The Independent Trustees have determined that they can act independently and effectively without having an Independent Trustee serve as Chairman and that a key structural component for assuring that they are in a position to do so is for the Independent Trustees to constitute a substantial majority for the Board. The Independent Trustees also regularly meet in executive session. Ned C. Lautenbach serves as Chairman of the Independent Trustees and as such (i) acts as a liaison between the Independent Trustees and management with respect to matters important to the Independent Trustees and (ii) with management prepares agendas for Board meetings.
Fidelity funds are overseen by different Boards of Trustees. The fund's Board oversees Fidelity's equity and high income funds and another Board oversees Fidelity's investment-grade bond, money market, and asset allocation funds. The asset allocation funds may invest in Fidelity funds overseen by the fund's Board. The use of separate Boards, each with its own committee structure, allows the Trustees of each group of Fidelity funds to focus on the unique issues of the funds they oversee, including common research, investment, and operational issues. On occasion, the separate Boards establish joint committees to address issues of overlapping consequences for the Fidelity funds overseen by each Board.
The Trustees operate using a system of committees to facilitate the timely and efficient consideration of all matters of importance to the Trustees, the fund, and fund shareholders and to facilitate compliance with legal and regulatory requirements and oversight of the fund's activities and associated risks. The Board, acting through its committees, has charged FMR and its affiliates with (i) identifying events or circumstances the occurrence of which could have demonstrably adverse effects on the fund's business and/or reputation; (ii) implementing processes and controls to lessen the possibility that such events or circumstances occur or to mitigate the effects of such events or circumstances if they do occur; and (iii) creating and maintaining a system designed to evaluate continuously business and market conditions in order to facilitate the identification and implementation processes described in (i) and (ii) above. Because the day-to-day operations and activities of the fund are carried out by or through FMR, its affiliates and other service providers, the fund's exposure to risks is mitigated but not eliminated by the processes overseen by the Trustees. While each of the Board's committees has responsibility for overseeing different aspects of the fund's activities, oversight is exercised primarily through the Operations, Audit, and Compliance Committees. In addition, the Independent Trustees have worked with FMR to enhance the Board's oversight of investment and financial risks, legal and regulatory risks, technology risks, and operational risks, including the development of additional risk reporting to the Board. For example, a working group comprised of Independent Trustees and FMR has worked and continues to work to review the Fidelity funds' valuation-related activities, reporting and risk management. Appropriate personnel, including but not limited to the fund's Chief Compliance Officer (CCO), FMR's internal auditor, the independent accountants, the fund's Treasurer and portfolio management personnel, make periodic reports to the Board's committees, as appropriate, including an annual review of FMR's risk management program for the Fidelity funds. The responsibilities of each standing committee, including their oversight responsibilities, are described further under "Standing Committees of the Fund's Trustees."
Annual Report
Trustees and Officers - continued
The fund's Statement of Additional Information (SAI) includes more information about the Trustees. To request a free copy, call Fidelity at 1-877-208-0098.
Interested Trustees*:
Correspondence intended for each Trustee who is an interested person may be sent to Fidelity Investments, 82 Devonshire Street, Boston, Massachusetts 02109.
Name, Age; Principal Occupations and Other Relevant Experience+ |
James C. Curvey (77) |
| Year of Election or Appointment: 2007 Mr. Curvey is Trustee and Chairman of the Board of Trustees of certain Trusts. Mr. Curvey also serves as Trustee (2007-present) of other investment companies advised by FMR. Mr. Curvey is a Director of Fidelity Investments Money Management, Inc. (2009-present), Director of Fidelity Research & Analysis Co. (2009-present) and Director of FMR and FMR Co., Inc. (2007-present). Mr. Curvey is also Vice Chairman (2007-present) and Director of FMR LLC. In addition, Mr. Curvey serves as an Overseer for the Boston Symphony Orchestra and a member of the Trustees of Villanova University. Previously, Mr. Curvey was the Vice Chairman (2006-2007) and Director (2000-2007) of FMR Corp. |
Ronald P. O'Hanley (55) |
| Year of Election or Appointment: 2011 Mr. O'Hanley is Director of FMR Co., Inc. (2010-present), Director of Fidelity Investments Money Management, Inc. (2010-present), Director of Fidelity Research & Analysis Company (2010-present), President of Fidelity Asset Management and Corporate Services and a member of Fidelity's Executive Committee (2010-present). Previously, Mr. O'Hanley served as President and Chief Executive Officer of BNY Mellon Asset Management (2007-2010). Mr. O'Hanley also served as Vice Chairman of Bank New York Mellon Corp. and a member of that firm's Executive Committee. Prior to the 2007 merger of The Bank of New York and Mellon Financial Corporation, he was Vice Chairman of Mellon Financial Corporation and President and Chief Executive Officer of Mellon Asset Management. He joined Mellon in February 1997. Mr. O'Hanley currently serves as Chairman of the Boston Public Library Foundation Board of Directors and sits on the Board of Directors of Beth Israel Deaconess Medical Center, the Board of Trustees of the Marine Biological Laboratory and the Advisory Board of the Maxwell School of Citizenship and Public Administration at Syracuse University. Mr. O'Hanley also chairs the Council on Asset Management for the Financial Services Roundtable and is a member of the Board of Directors of Institutional Investor's U.S. Institute. |
* Trustees have been determined to be "Interested Trustees" by virtue of, among other things, their affiliation with the trust or various entities under common control with FMR.
+ The information above includes each Trustee's principal occupation during the last five years and other information relating to the experience, attributes, and skills relevant to each Trustee's qualifications to serve as a Trustee, which led to the conclusion that each Trustee should serve as a Trustee for the fund.
Independent Trustees:
Correspondence intended for each Independent Trustee (that is, the Trustees other than the Interested Trustees) may be sent to Fidelity Investments, P.O. Box 55235, Boston, Massachusetts 02205-5235.
Name, Age; Principal Occupations and Other Relevant Experience+ |
Dennis J. Dirks (64) |
| Year of Election or Appointment: 2005 Prior to his retirement in May 2003, Mr. Dirks was Chief Operating Officer and a member of the Board of The Depository Trust & Clearing Corporation (DTCC). He also served as President, Chief Operating Officer, and Board member of The Depository Trust Company (DTC) and President and Board member of the National Securities Clearing Corporation (NSCC). In addition, Mr. Dirks served as Chief Executive Officer and Board member of the Government Securities Clearing Corporation, Chief Executive Officer and Board member of the Mortgage-Backed Securities Clearing Corporation, as a Trustee and a member of the Finance Committee of Manhattan College (2005-2008), and as a Trustee and a member of the Finance Committee of AHRC of Nassau County (2006-2008). Mr. Dirks is a member of the Independent Directors Council (IDC) Governing Council (2010-present) and Board of Directors for The Brookville Center for Children's Services, Inc. (2009-present). |
Alan J. Lacy (59) |
| Year of Election or Appointment: 2008 Mr. Lacy serves as Senior Adviser (2007-present) of Oak Hill Capital Partners, L.P. (private equity). Mr. Lacy also served as Chief Executive Officer (2000-2005) and Vice Chairman (2005-2006) of Sears Holdings Corporation and Sears, Roebuck and Co. (retail). In addition, Mr. Lacy serves as a member of the Board of Directors of Dave & Buster's Entertainment, Inc. (restaurant and entertainment complexes, 2010-present), Earth Fare, Inc. (retail grocery, 2012-present), The Hillman Companies, Inc. (hardware wholesalers, 2010-present), and Bristol-Myers Squibb Company (global pharmaceuticals, 2008-present). Mr. Lacy is a member of the Board of Trustees of The National Parks Conservation Association (2006-present). Previously, Mr. Lacy served as Chairman of the Board of Trustees of the National Parks Conservation Association (2008-2011) and as a member of the Board of Directors for the Western Union Company (global money transfer, 2006-2011). |
Ned C. Lautenbach (68) |
| Year of Election or Appointment: 2000 Mr. Lautenbach is Chairman of the Independent Trustees of the Equity and High Income Funds (2006-present). Mr. Lautenbach currently serves as the Lead Director of the Eaton Corporation Board of Directors (diversified industrial, 1997-present). Mr. Lautenbach is Chairman of the Board of Directors of the Philharmonic Center for the Arts in Naples, Florida (2012-present) and a member of the Council on Foreign Relations (1994-present). Previously, Mr. Lautenbach was a Partner/Advisory Partner at Clayton, Dubilier & Rice, LLC (private equity investment, 1998-2010), as well as a Director of Sony Corporation (2006-2007). |
Joseph Mauriello (68) |
| Year of Election or Appointment: 2008 Prior to his retirement in January 2006, Mr. Mauriello served in numerous senior management positions including Deputy Chairman and Chief Operating Officer (2004-2005), and Vice Chairman of Financial Services (2002-2004) of KPMG LLP US (professional services, 1965-2005). Mr. Mauriello currently serves as a member of the Board of Directors of XL Group plc. (global insurance and re-insurance, 2006-present). Previously, Mr. Mauriello served as a Director of the Hamilton Funds of the Bank of New York (2006-2007) and of Arcadia Resources Inc. (health care services and products, 2007-2012). |
Robert W. Selander (62) |
| Year of Election or Appointment: 2011 Previously, Mr. Selander served as a Member of the Advisory Board of Fidelity's Equity and High Income Funds (2011), Executive Vice Chairman (2010), Chief Executive Officer (2009-2010), and President and Chief Executive Officer (1997-2009) of Mastercard, Inc. |
Cornelia M. Small (68) |
| Year of Election or Appointment: 2005 Ms. Small is a member of the Board of Directors (2009-present) and Chair of the Investment Committee (2010-present) of the Teagle Foundation. Ms. Small also serves on the Investment Committee of the Berkshire Taconic Community Foundation (2008-present). Previously, Ms. Small served as Chairperson (2002-2008) and a member of the Investment Committee and Chairperson (2008-2012) and a member of the Board of Trustees of Smith College. In addition, Ms. Small served as Chief Investment Officer, Director of Global Equity Investments, and a member of the Board of Directors of Scudder, Stevens & Clark and Scudder Kemper Investments. |
William S. Stavropoulos (73) |
| Year of Election or Appointment: 2001 Mr. Stavropoulos is Vice Chairman of the Independent Trustees of the Equity and High Income Funds (2006-present). Mr. Stavropoulos serves as President and Founder of the Michigan Baseball Foundation, the Great Lakes Loons (2007-present). Mr. Stavropoulos is Chairman Emeritus of the Board of Directors of The Dow Chemical Company, where he previously served in numerous senior management positions, including President, CEO (1995-2000; 2002-2004), Chairman of the Executive Committee (2000-2006), and as a member of the Board of Directors (1990-2006). Currently, Mr. Stavropoulos is a Director of Univar Inc. (global distributor of commodity and specialty chemicals, Chairman from 2010-May 2012 and Lead Director from May 2012-present), Teradata Corporation (data warehousing and technology solutions, 2008-present), Maersk Inc. (industrial conglomerate), and Tyco International, Ltd. (multinational manufacturing and services, 2007-present), and a member of the Advisory Board for Metalmark Capital LLC (private equity investment, 2005-present). Mr. Stavropoulos is an operating advisor to Clayton, Dubilier & Rice, LLC (private equity investment). In addition, Mr. Stavropoulos is a member of the University of Notre Dame Advisory Council for the College of Science, a Trustee of the Rollin L. Gerstacker Foundation, and a Director of the Naples Philharmonic Center for the Arts. Previously, Mr. Stavropoulos served as a Director of Chemical Financial Corporation (bank holding company, 1993-2012). |
David M. Thomas (63) |
| Year of Election or Appointment: 2008 Previously, Mr. Thomas served as Executive Chairman (2005-2006) and Chairman and Chief Executive Officer (2000-2005) of IMS Health, Inc. (pharmaceutical and healthcare information solutions), and a Director of Fortune Brands, Inc. (consumer products, 2000-2011). In addition, Mr. Thomas serves as Non-Executive Chairman of the Board of Directors of Fortune Brands Home and Security (home and security products, 2011-present), and as a member of the Board of Directors of Interpublic Group of Companies, Inc. (marketing communication, 2004-present). |
Michael E. Wiley (62) |
| Year of Election or Appointment: 2008 Mr. Wiley also serves as a Director of Asia Pacific Exploration Consolidated (international oil and gas exploration and production, 2008-present). Mr. Wiley serves as a Director of Tesoro Corporation (independent oil refiner and marketer, 2005-present), and a Director of Bill Barrett Corporation (exploration and production, 2005-present). In addition, Mr. Wiley also serves as a Director of Post Oak Bank (privately-held bank, 2004-present). Previously, Mr. Wiley served as a member of the Board of Trustees of the University of Tulsa (2000-2006; 2007-2010), as a Senior Energy Advisor of Katzenbach Partners, LLC (consulting, 2006-2007), as an Advisory Director of Riverstone Holdings (private investment), Chairman, President, and CEO of Baker Hughes, Inc. (oilfield services, 2000-2004), and as Director of Spinnaker Exploration Company (exploration and production, 2001-2005). |
+ The information above includes each Trustee's principal occupation during the last five years and other information relating to the experience, attributes, and skills relevant to each Trustee's qualifications to serve as a Trustee, which led to the conclusion that each Trustee should serve as a Trustee for the fund.
Advisory Board Members and Executive Officers:
Correspondence intended for David A. Rosow and Garnett A. Smith may be sent to Fidelity Investments, P.O. Box 55235, Boston, Massachusetts 02205-5235. Correspondence intended for each executive officer Edward C. Johnson 3d and Peter S. Lynch may be sent to Fidelity Investments, 82 Devonshire Street, Boston, Massachusetts 02109.
Name, Age; Principal Occupation |
Edward C. Johnson 3d (82) |
| Year of Election or Appointment: 2011 Member of the Advisory Board of Fidelity's Equity and High Income Funds. Mr. Johnson serves as Chief Executive Officer, Chairman, and a Director of FMR LLC, and also serves as Chairman and Director of FIL Limited. Previously, Mr. Johnson served as a Trustee and Chairman of the Board of certain Fidelity Trusts, Chairman and a Director of FMR, Chairman and a Director of FMR Co., Inc., and President of FMR LLC (2006-2007). |
Peter S. Lynch (68) |
| Year of Election or Appointment: 2003 Member of the Advisory Board of Fidelity's Equity and High Income Funds. Mr. Lynch is Vice Chairman and a Director of FMR and FMR Co., Inc. In addition, Mr. Lynch serves as a Trustee of Boston College and as the Chairman of the Inner-City Scholarship Fund. Previously, Mr. Lynch served on the Special Olympics International Board of Directors (1997-2006). |
David A. Rosow (70) |
| Year of Election or Appointment: 2012 Member of the Advisory Board of Fidelity's Equity and High Income Funds. Chairman and Chief Executive Officer of International Golf Group, Inc. (golf course development, 1989-present). Previously, Mr. Rosow served as Chairman and Chief Executive Officer of Rosow & Company, Inc. (private investment company, 1989-2011), a Lead Director of Hudson United Bancorp (2001-2006) and as a Director of TD Banknorth (1996-2006). In addition, Mr. Rosow is a member (2008-present) and President (2009-present) of the Town Council of Palm Beach, Florida. |
Garnett A. Smith (65) |
| Year of Election or Appointment: 2012 Member of the Advisory Board of Fidelity's Equity and High Income Funds. Prior to Mr. Smith's retirement, he served as Chairman and Chief Executive Officer of Inbrand Corp. (manufacturer of personal absorbent products, 1990-1997). He also served as President (1986-1990) of Inbrand Corp. Prior to his employment with Inbrand Corp., he was employed by a retail fabric chain and North Carolina National Bank. In addition, Mr. Smith is a board member of the Jackson Hole Land Trust (2009-present). |
Kenneth B. Robins (43) |
| Year of Election or Appointment: 2008 President and Treasurer of Fidelity's Equity and High Income Funds. Mr. Robins also serves as President and Treasurer (2010-present) and Assistant Treasurer (2009-present) of other Fidelity funds and is an employee of Fidelity Investments (2004-present). Previously, Mr. Robins served as Deputy Treasurer of the Fidelity funds (2005-2008) and Treasurer and Chief Financial Officer of The North Carolina Capital Management Trust: Cash and Term Portfolios (2006-2008). |
Bruce T. Herring (47) |
| Year of Election or Appointment: 2006 Vice President of certain Equity Funds. Mr. Herring also serves as President of Fidelity Research & Analysis Company (2010-present), Chief Investment Officer and Director of Fidelity Management & Research (U.K.) Inc. (2010-present) and Group Chief Investment Officer of FMR. Previously, Mr. Herring served as Vice President (2005-2006) and Senior Vice President (2006-2007) of Fidelity Management & Research Company, Vice President of FMR Co., Inc. (2001-2007) and as a portfolio manager for Fidelity U.S. Equity Funds. |
Brian B. Hogan (48) |
| Year of Election or Appointment: 2009 Vice President of Equity and High Income Funds. Mr. Hogan also serves as President of FMR's Equity Division (2009-present). Previously, Mr. Hogan served as Senior Vice President, Equity Research of FMR (2006-2009) and as a portfolio manager. |
Scott C. Goebel (44) |
| Year of Election or Appointment: 2008 Secretary and Chief Legal Officer (CLO) of the Fidelity funds. Mr. Goebel also serves as Secretary of Fidelity Investments Money Management, Inc. (FIMM) (2010-present) and Fidelity Research and Analysis Company (FRAC) (2010-present); Secretary and CLO of The North Carolina Capital Management Trust: Cash and Term Portfolios (2008-present); General Counsel, Secretary, and Senior Vice President of FMR (2008-present) and FMR Co., Inc. (2008-present); employed by FMR LLC or an affiliate (2001-present); Chief Legal Officer of Fidelity Management & Research (Hong Kong) Limited (2008-present) and Assistant Secretary of Fidelity Management & Research (Japan) Inc. (2008-present), and Fidelity Management & Research (U.K.) Inc. (2008-present). Previously, Mr. Goebel served as Assistant Secretary of FIMM (2008-2010), FRAC (2008-2010), and the Funds (2007-2008) and as Vice President and Secretary of Fidelity Distributors Corporation (FDC) (2005-2007). |
William C. Coffey (43) |
| Year of Election or Appointment: 2009 Assistant Secretary of Fidelity's Equity and High Income Funds. Mr. Coffey also serves as Senior Vice President and Deputy General Counsel of FMR LLC (2010-present), and is an employee of Fidelity Investments. Previously, Mr. Coffey served as Vice President and Associate General Counsel of FMR LLC (2005-2009). |
Elizabeth Paige Baumann (44) |
| Year of Election or Appointment: 2012 Anti-Money Laundering (AML) Officer of the Fidelity funds. Ms. Baumann also serves as AML Officer of The North Carolina Capital Management Trust: Cash and Term Portfolios (2012-present), Chief AML Officer of FMR LLC (2012-present), and is an employee of Fidelity Investments. Previously, Ms. Baumann served as Vice President and Deputy Anti-Money Laundering Officer (2007-2012). |
Christine Reynolds (54) |
| Year of Election or Appointment: 2008 Chief Financial Officer of the Fidelity funds. Ms. Reynolds became President of Fidelity Pricing and Cash Management Services (FPCMS) in August 2008. Ms. Reynolds served as Chief Operating Officer of FPCMS (2007-2008). Previously, Ms. Reynolds served as President, Treasurer, and Anti-Money Laundering officer of the Fidelity funds (2004-2007). |
Joseph A. Hanlon (44) |
| Year of Election or Appointment: 2012 Chief Compliance Officer of Fidelity's Equity and High Income Funds. Mr. Hanlon serves as Compliance Officer of FMR, FMR Co., Inc., Fidelity Investments Money Management, Inc. (FIMM), Fidelity Research and Analysis Company (FRAC), Fidelity Management & Research (Japan) Inc., Fidelity Management & Research (U.K.) Inc., Fidelity Management & Research (Hong Kong), and Strategic Advisers, Inc. (2009-present), as Senior Vice President of the Fidelity Asset Management Division (2009-present), and is an employee of Fidelity Investments. |
Joseph F. Zambello (55) |
| Year of Election or Appointment: 2011 Deputy Treasurer of the Fidelity funds. Mr. Zambello is an employee of Fidelity Investments. Previously, Mr. Zambello served as Vice President of FMR's Program Management Group (2009-2011) and Vice President of the Transfer Agent Oversight Group (2005-2009). |
Adrien E. Deberghes (45) |
| Year of Election or Appointment: 2008 Deputy Treasurer of Fidelity's Equity and High Income Funds. Mr. Deberghes also serves as Vice President (2011-present) and Assistant Treasurer (2010-present) of other Fidelity funds, and is an employee of Fidelity Investments (2008-present). Previously, Mr. Deberghes served as Senior Vice President of Mutual Fund Administration at State Street Corporation (2007-2008), Senior Director of Mutual Fund Administration at Investors Bank & Trust (2005-2007), and Director of Finance for Dunkin' Brands (2000-2005). |
Stephen Sadoski (41) |
<R> | Year of Election or Appointment: 2012</R> Deputy Treasurer of Fidelity's Equity and High Income Funds. Mr. Sadoski also serves as Assistant Treasurer of other Fidelity funds (2012-present) and is an employee of Fidelity Investments (2012-present). Previously, Mr. Sadoski served as an assistant chief accountant in the Division of Investment Management of the Securities and Exchange Commission (SEC) (2009-2012) and as a senior manager at Deloitte & Touche (1997-2009). |
Stephanie J. Dorsey (43) |
| Year of Election or Appointment: 2010 Assistant Treasurer of Fidelity's Equity and High Income Funds. Ms. Dorsey also serves as Deputy Treasurer of other Fidelity funds (2008-present) and is an employee of Fidelity Investments (2008-present). Previously, Ms. Dorsey served as Treasurer (2004-2008) of the JPMorgan Mutual Funds and Vice President (2004-2008) of JPMorgan Chase Bank. |
John R. Hebble (54) |
| Year of Election or Appointment: 2009 Assistant Treasurer of Fidelity's Equity and High Income Funds. Mr. Hebble also serves as President (2011-present), Treasurer, and Chief Financial Officer of The North Carolina Capital Management Trust: Cash and Term Portfolios (2008-present), President and Treasurer of other Fidelity funds (2008-present) and is an employee of Fidelity Investments. |
Gary W. Ryan (54) |
| Year of Election or Appointment: 2005 Assistant Treasurer of the Fidelity funds. Mr. Ryan is an employee of Fidelity Investments. Previously, Mr. Ryan served as Vice President of Fund Reporting in Fidelity Pricing and Cash Management Services (FPCMS) (1999-2005). |
Jonathan Davis (44) |
| Year of Election or Appointment: 2010 Assistant Treasurer of the Fidelity funds. Mr. Davis is also Assistant Treasurer of Fidelity Rutland Square Trust II and Fidelity Commonwealth Trust II. Mr. Davis is an employee of Fidelity Investments. Previously, Mr. Davis served as Vice President and Associate General Counsel of FMR LLC (2003-2010). |
Annual Report
Institutional Class designates 91% of the dividends distributed during the fiscal year as amounts which may be taken into account as a dividend for the purposes of the maximum rate under section 1(h)(11) of the Internal Revenue Code.
A percentage of the dividends distributed during the fiscal year for the following funds qualifies for the dividends-received deduction for corporate shareholders:
| December 02, 2011 |
Institutional Class | 2% |
The amounts per share which represent income derived from sources within, and taxes paid to, foreign countries or possessions of the United States are as follows:
| Pay Date | Income | Taxes |
Institutional Class | 12/05/2011 | $0.752 | $0.1110 |
The fund will notify shareholders in January 2013 of amounts for use in preparing 2012 income tax returns.
Annual Report
Board Approval of Investment Advisory Contracts and Management Fees
Fidelity Canada Fund
Each year, the Board of Trustees, including the Independent Trustees (together, the Board), votes on the renewal of the management contract and sub-advisory agreements (together, the Advisory Contracts) for the fund. The Board, assisted by the advice of fund counsel and Independent Trustees' counsel, requests and considers a broad range of information relevant to the renewal of the Advisory Contracts throughout the year.
The Board meets regularly and, at each of its meetings, considers factors that are relevant to its annual consideration of the renewal of the fund's Advisory Contracts, including the services and support provided to the fund and its shareholders. The Board has established various standing committees, each composed of and chaired by Independent Trustees with varying backgrounds, to which the Board has assigned specific subject matter responsibilities in order to enhance effective decision-making by the Board. The Board, acting directly and through its Committees, requests and receives information concerning the annual consideration of the renewal of the fund's Advisory Contracts. The Board also meets as needed to consider matters specifically related to the Board's annual consideration of the renewal of Advisory Contracts. Members of the Board may also meet with trustees of other Fidelity funds through ad hoc joint committees to discuss certain matters relevant to the Fidelity funds.
At its July 2012 meeting, the Board of Trustees, including the Independent Trustees, unanimously determined to renew the fund's Advisory Contracts. In reaching its determination, the Board considered all factors it believed relevant, including (i) the nature, extent, and quality of the services to be provided to the fund and its shareholders (including the investment performance of the fund); (ii) the competitiveness of the fund's management fee and total expense ratio relative to peer funds; (iii) the total costs of the services to be provided by and the profits to be realized by Fidelity from its relationship with the fund; (iv) the extent to which economies of scale exist and would be realized as the fund grows; and (v) whether fee levels reflect these economies of scale, if any, for the benefit of fund shareholders.
In considering whether to renew the Advisory Contracts for the fund, the Board reached a determination, with the assistance of fund counsel and Independent Trustees' counsel and through the exercise of its business judgment, that the renewal of the Advisory Contracts is in the best interests of the fund and its shareholders and that the compensation payable under the Advisory Contracts is fair and reasonable. The Board's decision to renew the Advisory Contracts was not based on any single factor, but rather was based on a comprehensive consideration of all the information provided to the Board at its meetings throughout the year. The Board, in reaching its determination to renew the Advisory Contracts, is aware that shareholders in the fund have a broad range of investment choices available to them, including a wide choice among mutual funds offered by Fidelity's competitors, and that the fund's shareholders, who have the opportunity to review and weigh the disclosure provided by the fund in its prospectus and other public disclosures, have chosen to invest in this fund, managed by Fidelity.
Nature, Extent, and Quality of Services Provided. The Board considered the staffing within the investment adviser, FMR, and the sub-advisers (together, the Investment Advisers), including the backgrounds of the fund's investment personnel, and also considered the fund's investment objective, strategies, and related investment philosophy. The Independent Trustees also had discussions with senior management of Fidelity's investment operations and investment groups. The Board considered the structure of the portfolio manager compensation program and whether this structure provides appropriate incentives to act in the best interests of the fund.
Resources Dedicated to Investment Management and Support Services. The Board and the Fund Oversight and Research Committees reviewed the general qualifications and capabilities of the Investment Advisers' investment staff, including its size, education, experience, and resources, as well as the Investment Advisers' approach to recruiting, training, managing, and compensating investment personnel. The Board also noted that FMR has continued to increase the resources devoted to non-U.S. offices, including expansion of Fidelity's global investment organization. The Board noted that Fidelity's analysts have extensive resources, tools and capabilities that allow them to conduct sophisticated quantitative and fundamental analysis, as well as credit analysis of issuers, counterparties and guarantors. The Board also believes that Fidelity's investment professionals have sufficient access to global information and data so as to provide competitive investment results over time, and that those professionals also have access to sophisticated tools that permit them to assess portfolio construction and risk and performance attribution characteristics continuously, as well as to transmit new information and research conclusions rapidly around the world. Additionally, in its deliberations, the Board considered the Investment Advisers' trading and risk management capabilities and resources, which are an integral part of the investment management process.
Shareholder and Administrative Services. The Board considered (i) the nature, extent, quality, and cost of advisory, administrative, and shareholder services performed by the Investment Advisers and their affiliates under the Advisory Contracts and under separate agreements covering transfer agency, pricing and bookkeeping, and securities lending services for the fund; (ii) the nature and extent of the supervision of third party service providers, principally custodians and subcustodians; and (iii) the resources devoted to, and the record of compliance with, the fund's compliance policies and procedures. The Board also reviewed the allocation of fund brokerage, including allocations to brokers affiliated with the Investment Advisers, the use of brokerage commissions to pay fund expenses, and the use of "soft" commission dollars to pay for research services.
The Board noted that the growth of fund assets over time across the complex allows Fidelity to reinvest in the development of services designed to enhance the value or convenience of the Fidelity funds as investment vehicles. These services include 24-hour access to account information and market information through telephone representatives and over the Internet, investor education materials and asset allocation tools, and the expanded availability of Fidelity Investor Centers.
Annual Report
Investment in a Large Fund Family. The Board considered the benefits to shareholders of investing in a Fidelity fund, including the benefits of investing in a fund that is part of a large family of funds offering a variety of investment disciplines and providing a large variety of mutual fund investor services. The Board noted that Fidelity had taken, or had made recommendations that resulted in the Fidelity funds taking, a number of actions over the previous year that benefited particular funds, including (i) continuing to dedicate additional resources to investment research and support of the senior management team that oversees asset management; (ii) persisting in efforts to enhance Fidelity's research capabilities, in particular, international research; (iii) launching new funds and making other enhancements to meet client needs for global and income-oriented solutions; (iv) continuing to launch dedicated lower cost underlying funds to meet investment management's portfolio construction needs related to expanding underlying fund options, specifically for the Freedom Fund product lines; (v) adopting a "Stock Selector" sector neutral investment approach and employing a team of portfolio managers who are sector specialists to manage certain funds; (vi) rationalizing product lines and gaining increased efficiencies through the mergers of several funds into other funds; (vii) strengthening the Spartan Index Fund product line by adding new funds and/or new low-cost institutional share classes, restructuring fund expenses to accommodate new classes, and reducing investment minimums for certain classes of shares; (viii) modifying the eligibility criteria for Institutional Class shares to increase their appeal to government entities and charitable investors; and (ix) reducing certain transfer agent fee rates.
Investment Performance. The Board considered whether the fund has operated in accordance with its investment objective, as well as its record of compliance with its investment restrictions. It also reviewed the fund's absolute investment performance for each class, as well as the fund's relative investment performance for each class measured over multiple periods against a broad-based securities market index. The Board noted that FMR believes that no meaningful peer group exists for the fund. The following charts considered by the Board show, over the one-, three-, and five-year periods ended December 31, 2011, as available, the cumulative total returns of the retail class and Class B of the fund and the cumulative total returns of a broad-based securities market index ("benchmark"). The returns of the retail class and Class B show the performance of the highest performing class (based on five-year performance) and the lowest performing class (based on three-year performance), respectively.
Fidelity Canada Fund

The Board noted that the investment performance of the fund was lower than its benchmark for all the periods shown. The Board considered that the variations in performance among the fund's classes reflect the variations in class expenses, which result in lower performance for higher expense classes. The Board discussed with FMR actions to improve the fund's below-benchmark performance. The Board noted that this fund had underperformed in the past and discussed with FMR its disappointment with the continued underperformance of the fund. The Board also reviewed the fund's performance since inception as well as performance in the current year. The Board will continue to closely monitor the performance of the fund in the coming year and discuss with FMR other appropriate actions to address the performance of the fund.
The Board also considered that the fund's management fee is subject to upward or downward adjustment depending upon whether, and to what extent, the fund's investment performance for the performance period exceeds, or is exceeded by, the record (over the same period) of a Board-approved performance adjustment index. The Board noted that the performance adjustment provides FMR with a strong economic incentive to seek to achieve superior performance for the fund's shareholders and helps to more closely align the interests of FMR and the fund's shareholders.
Based on its review, the Board concluded that the nature, extent, and quality of services provided to the fund under the Advisory Contracts should benefit the fund's shareholders.
Annual Report
Board Approval of Investment Advisory Contracts and Management Fees - continued
Competitiveness of Management Fee and Total Expense Ratio. The Board considered the fund's management fee and total expense ratio compared to "mapped groups" of competitive funds and classes. Fidelity creates "mapped groups" by combining similar Lipper investment objective categories that have comparable management fee characteristics. Combining Lipper investment objective categories aids the Board's management fee and total expense ratio comparisons by broadening the competitive group used for comparison and by reducing the number of universes to which various Fidelity funds are compared.
Management Fee. The Board considered two proprietary management fee comparisons for the 12-month periods shown in the chart below. The group of Lipper funds used by the Board for management fee comparisons is referred to below as the "Total Mapped Group." The Total Mapped Group comparison focuses on a fund's standing relative to the total universe of comparable funds available to investors in terms of gross management fees before expense reimbursements or caps, and without giving effect to the fund's performance adjustment. "TMG %" represents the percentage of funds in the Total Mapped Group that had management fees that were lower than the fund's. For example, a TMG % of 17% means that 83% of the funds in the Total Mapped Group had higher management fees than the fund. The "Asset-Size Peer Group" (ASPG) comparison focuses on a fund's standing relative to non-Fidelity funds similar in size to the fund within the Total Mapped Group. The ASPG represents at least 15% of the funds in the Total Mapped Group with comparable asset size and management fee characteristics, subject to a minimum of 50 funds (or all funds in the Total Mapped Group if fewer than 50). Additional information, such as the ASPG quartile in which the fund's management fee ranked and the impact of the fund's performance adjustment, is also included in the chart and considered by the Board.
Fidelity Canada Fund
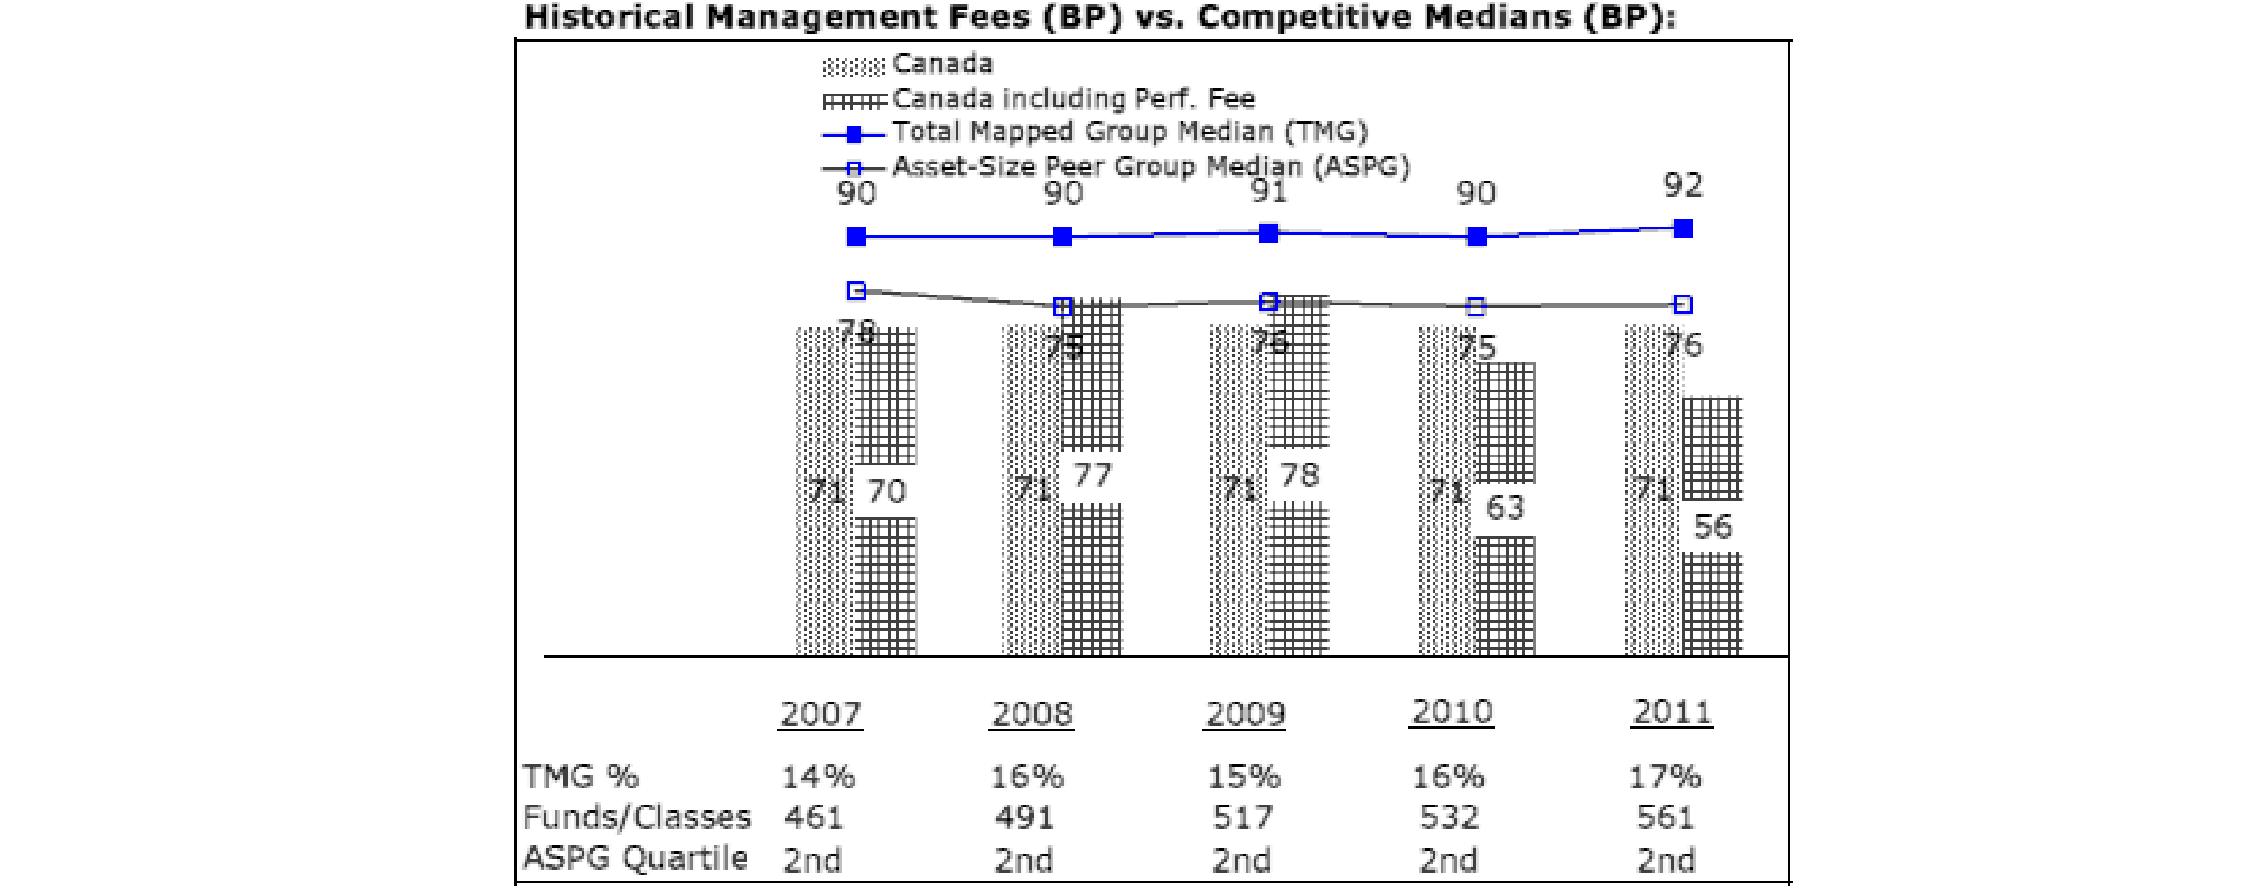
The Board noted that the fund's management fee ranked below the median of its Total Mapped Group and below the median of its ASPG for 2011. The Board also noted the effect of the fund's negative performance adjustment on the fund's management fee ranking. The Board noted that the performance adjustment for each year represents calculations for performance periods that differ from the periods shown in the performance charts above.
Based on its review, the Board concluded that the fund's management fee is fair and reasonable in light of the services that the fund receives and the other factors considered.
Total Expense Ratio. In its review of each class's total expense ratio, the Board considered the fund's management fee as well as other fund or class expenses, as applicable, such as transfer agent fees, pricing and bookkeeping fees, fund-paid 12b-1 fees, and custodial, legal, and audit fees. The Board also noted the effects of any waivers and reimbursements on fees and expenses, as well as the impact of the fund's performance adjustment. As part of its review, the Board also considered the current and historical total expense ratios of each class of the fund compared to competitive fund median expenses. Each class of the fund is compared to those funds and classes in the Total Mapped Group (used by the Board for management fee comparisons) that have a similar sales load structure.
The Board noted that the total expense ratio of each class ranked below its competitive median for 2011.
Fees Charged to Other Fidelity Clients. The Board also considered Fidelity fee structures and other information with respect to clients of FMR and its affiliates, such as other mutual funds advised or subadvised by FMR or its affiliates, pension plan clients, and other institutional clients. The Board noted the findings of the 2010 ad hoc joint committee (created with the board of other Fidelity funds), which reviewed and compared Fidelity's institutional investment advisory business with its business of providing services to the Fidelity funds, including the differences in services provided, fees charged, and costs incurred, as well as competition in their respective marketplaces.
Annual Report
Based on its review of total expense ratios and fees charged to other Fidelity clients, the Board concluded that the total expense ratio of each class of the fund was reasonable in light of the services that the fund and its shareholders receive and the other factors considered.
Costs of the Services and Profitability. The Board considered the revenues earned and the expenses incurred by Fidelity in conducting the business of developing, marketing, distributing, managing, administering and servicing the fund and its shareholders. The Board also considered the level of Fidelity's profits in respect of all the Fidelity funds.
On an annual basis, FMR presents to the Board Fidelity's profitability for the fund. Fidelity calculates the profitability for each fund, as well as aggregate profitability for groups of Fidelity funds and all Fidelity funds, using a series of detailed revenue and cost allocation methodologies which originate with the books and records of Fidelity on which Fidelity's audited financial statements are based. The Audit Committee of the Board reviews any significant changes from the prior year's methodologies.
PricewaterhouseCoopers LLP (PwC), independent registered public accounting firm and auditor to Fidelity and certain Fidelity funds, has been engaged annually by the Board as part of the Board's assessment of Fidelity's profitability analysis. PwC's engagement includes the review and assessment of Fidelity's methodologies used in determining the revenues and expenses attributable to Fidelity's mutual fund business, and completion of agreed-upon procedures surrounding the mathematical accuracy of fund profitability and its conformity to allocation methodologies. After considering PwC's reports issued under the engagement and information provided by Fidelity, the Board concluded that while other allocation methods may also be reasonable, Fidelity's profitability methodologies are reasonable in all material respects.
The Board also reviewed Fidelity's non-fund businesses and fall-out benefits related to the mutual fund business as well as cases where Fidelity's affiliates may benefit from or be related to the fund's business.
The Board considered the costs of the services provided by and the profits realized by Fidelity in connection with the operation of the fund and was satisfied that the profitability was not excessive in the circumstances.
Economies of Scale. The Board considered whether there have been economies of scale in respect of the management of the Fidelity funds, whether the Fidelity funds (including the fund) have appropriately benefited from any such economies of scale, and whether there is potential for realization of any further economies of scale. The Board considered the extent to which the fund will benefit from economies of scale through increased services to the fund, through waivers or reimbursements, or through fee or expense reductions. The Board also noted that in 2009, it and the board of other Fidelity funds created an ad hoc committee (the Economies of Scale Committee) to analyze whether FMR attains economies of scale in respect of the management and servicing of the Fidelity funds, whether the Fidelity funds have appropriately benefited from such economies of scale, and whether there is potential for realization of any further economies of scale.
The Board recognized that the fund's management contract incorporates a "group fee" structure, which provides for lower group fee rates as total fund assets under FMR's management increase, and for higher group fee rates as total fund assets under FMR's management decrease. FMR calculates the group fee rates based on a tiered asset "breakpoint" schedule that varies based on asset class. The Board considered that the group fee is designed to deliver the benefits of economies of scale to fund shareholders when total Fidelity fund assets increase, even if assets of any particular fund are unchanged or have declined, because some portion of Fidelity's costs are attributable to services provided to all Fidelity funds, and all funds benefit if those costs can be allocated among more assets. The Board concluded that, given the group fee structure, fund shareholders will benefit from lower management fees as assets under FMR's management increase at the fund complex level, regardless of whether Fidelity achieves any such economies of scale.
The Board concluded, taking into account the analysis of the Economies of Scale Committee, that economies of scale, if any, are being appropriately shared between fund shareholders and Fidelity.
Additional Information Requested by the Board. In order to develop fully the factual basis for consideration of the Fidelity funds' Advisory Contracts, the Board requested and received additional information on certain topics, including (i) fund performance trends, actions to be taken by FMR to improve certain funds' overall performance, and Fidelity's long-term strategies for certain funds; (ii) the potential to further rationalize the Fidelity fund lineup with the possibility of achieving savings for the funds and Fidelity; (iii) Fidelity's compensation structure for portfolio managers and other key investment personnel; (iv) the amount of the investment that each portfolio manager has made in the Fidelity fund(s) that he or she manages; (v) the realization of fall-out benefits in certain Fidelity business units; (vi) Fidelity's group fee structures, the potential impact of regulatory changes on such structures, and the rationale for the individual fee rates of certain funds; (vii) fund profitability methodology, including Fidelity's cost allocation methodology, and the impact of certain factors on fund profitability results; (viii) trends regarding industry use of performance fee structures and the possibility of implementing performance fee structures for additional funds; and (ix) the impact of net redemptions from the Fidelity funds.
Based on its evaluation of all of the conclusions noted above, and after considering all factors it believed relevant, the Board ultimately concluded that the advisory fee structures are fair and reasonable, and that the fund's Advisory Contracts should be renewed.
Annual Report
Investment Adviser
Fidelity Management & Research Company
Boston, MA
Investment Sub-Advisers
FMR Co., Inc.
Fidelity Management & Research
(U.K.) Inc.
Fidelity Management & Research
(Hong Kong) Limited
Fidelity Management & Research
(Japan) Inc.
FIL Investment Advisors
FIL Investment Advisors
(UK) Limited
General Distributor
Fidelity Distributors Corporation
Smithfield, RI
Transfer and Service Agents
Fidelity Investments Institutional
Operations Company, Inc.
Boston, MA
Fidelity Service Company, Inc.
Boston, MA
Custodian
State Street Bank and Trust Company
Quincy, MA
(Fidelity Investment logo)(registered trademark)
Corporate Headquarters
82 Devonshire St., Boston, MA 02109
www.fidelity.com
ACANI-UANN-1212
1.843157.105
Fidelity Advisor®
China Region Fund -
Class A, Class T, Class B, and Class C
Annual Report
October 31, 2012
Class A, Class T, Class B, and Class C are
classes of Fidelity® China Region Fund
(Fidelity Cover Art)
Contents
Performance | (Click Here) | How the fund has done over time. |
Management's Discussion of Fund Performance | (Click Here) | The Portfolio Manager's review of fund performance and strategy. |
Shareholder Expense Example | (Click Here) | An example of shareholder expenses. |
Investment Changes | (Click Here) | A summary of major shifts in the fund's investments over the past six months. |
Investments | (Click Here) | A complete list of the fund's investments with their market values. |
Financial Statements | (Click Here) | Statements of assets and liabilities, operations, and changes in net assets, as well as financial highlights. |
Notes | (Click Here) | Notes to the financial statements. |
Report of Independent Registered Public Accounting Firm | (Click Here) | |
Trustees and Officers | (Click Here) | |
Distributions | (Click Here) | |
Board Approval of Investment Advisory Contracts and Management Fees | (Click Here) | |
To view a fund's proxy voting guidelines and proxy voting record for the 12-month period ended June 30, visit http://www.fidelity.com/proxyvotingresults or visit the Securities and Exchange Commission's (SEC) web site at http://www.sec.gov. You may also call 1-877-208-0098 to request a free copy of the proxy voting guidelines.
Standard & Poor's, S&P and S&P 500 are registered service marks of The McGraw-Hill Companies, Inc. and have been licensed for use by Fidelity Distributors Corporation.
Other third party marks appearing herein are the property of their respective owners.
All other marks appearing herein are registered or unregistered trademarks or service marks of FMR LLC or an affiliated company. © 2012 FMR LLC. All rights reserved.
This report and the financial statements contained herein are submitted for the general information of the shareholders of the fund. This report is not authorized for distribution to prospective investors in the fund unless preceded or accompanied by an effective prospectus.
A fund files its complete schedule of portfolio holdings with the SEC for the first and third quarters of each fiscal year on Form N-Q. Forms N-Q are available on the SEC's web site at http://www.sec.gov. A fund's Forms N-Q may be reviewed and copied at the SEC's Public Reference Room in Washington, DC. Information regarding the operation of the SEC's Public Reference Room may be obtained by calling 1-800-SEC-0330. For a complete list of a fund's portfolio holdings, view the most recent holdings listing, semiannual report, or annual report on Fidelity's web site at http://www.fidelity.com, http://www.advisor.fidelity.com, or http://www.401k.com, as applicable.
NOT FDIC INSURED • MAY LOSE VALUE • NO BANK GUARANTEE
Neither the fund nor Fidelity Distributors Corporation is a bank.
Annual Report
Performance: The Bottom Line
Average annual total return reflects the change in the value of an investment, assuming reinvestment of the class' distributions from dividend income and capital gains (the profits earned upon the sale of securities that have grown in value, if any) and assuming a constant rate of performance each year. The $10,000 table and the fund's returns do not reflect the deduction of taxes that a shareholder would pay on fund distributions or the redemption of fund shares. During periods of reimbursement by Fidelity, a fund's total return will be greater than it would be had the reimbursement not occurred. How a fund did yesterday is no guarantee of how it will do tomorrow.
Average Annual Total Returns
Periods ended October 31, 2012 | Past 1
year | Past 5
years | Past 10
years |
Class A (incl. 5.75% sales charge) A | 0.56% | -4.77% | 12.20% |
Class T (incl. 3.50% sales charge) B | 2.66% | -4.55% | 12.32% |
Class B (incl. contingent deferred sales charge) C | 0.90% | -4.61% | 12.48% |
Class C (incl. contingent deferred sales charge) D | 4.88% | -4.29% | 12.48% |
A Class A shares bear a 0.25% 12b-1 fee. The initial offering of Class A shares took place on May 9, 2008. Returns prior to May 9, 2008 are those of Fidelity® China Region Fund, the original class of the fund, which has no 12b-1 fee. Had Class A shares' 12b-1 fee been reflected, returns prior to May 9, 2008 would have been lower.
B Class T shares bear a 0.50% 12b-1 fee. The initial offering of Class T shares took place on May 9, 2008. Returns prior to May 9, 2008 are those of Fidelity China Region Fund, the original class of the fund, which has no 12b-1 fee. Had Class T shares' 12b-1 fee been reflected, returns prior to May 9, 2008 would have been lower.
C Class B shares bear a 1.00% 12b-1 fee. The initial offering of Class B shares took place on May 9, 2008. Returns prior to May 9, 2008 are those of Fidelity China Region Fund, the original class of the fund, which has no 12b-1 fee. Had Class B shares' 12b-1 fee been reflected, returns prior to May 9, 2008 would have been lower. Class B shares' contingent deferred sales charge included in the past one year, past five years, and past ten years total return figures are 5%, 2%, and 0% respectively.
D Class C shares bear a 1.00% 12b-1 fee. The initial offering of Class C shares took place on May 9, 2008. Returns prior to May 9, 2008 are those of Fidelity China Region Fund, the original class of the fund, which has no 12b-1 fee. Had Class C shares' 12b-1 fee been reflected, returns prior to May 9, 2008 would have been lower. Class C shares' contingent deferred sales charge included in the past one year, past five years, and past ten years total return figures are 1%, 0%, and 0%, respectively.
$10,000 Over 10 Years
Let's say hypothetically that $10,000 was invested in Fidelity Advisor® China Region Fund - Class A on October 31, 2002, and the current 5.75% sales charge was paid. The chart shows how the value of your investment would have changed, and also shows how the MSCI® Golden Dragon Index performed over the same period. The initial offering of Class A took place on May 9, 2008. See above for additional information regarding the performance of Class A.
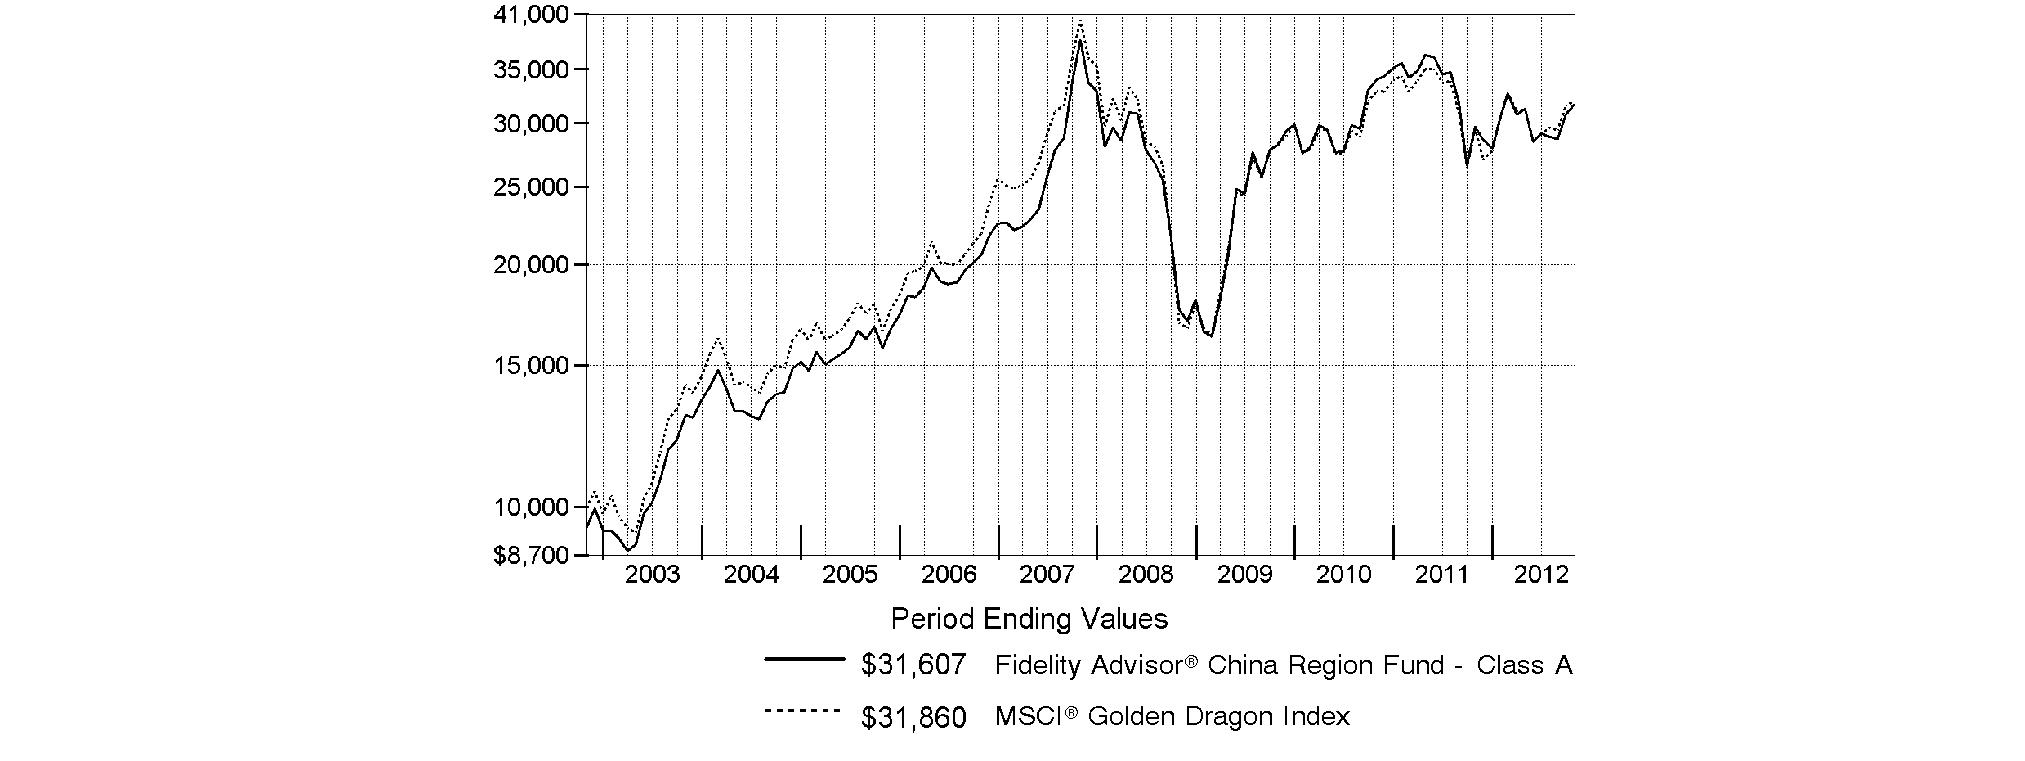
Annual Report
Market Recap: Returns for most domestic and international equities fluctuated during the 12 months ending October 31, 2012, as investor sentiment towards risk vacillated amid a changing global economic landscape. U.S. stocks overcame bouts of volatility to post strong gains for the past year, extending an uptrend that began in March 2009. The broad-based S&P 500® Index advanced 15.21%, while the blue-chip-laden Dow Jones Industrial AverageSM and technology-heavy Nasdaq Composite® Index rose 12.56% and 12.21%, respectively. Performance outside of the U.S. was relatively weak, as the MSCI® ACWI® (All Country World Index) ex USA Index rose 4.11%, hampered in part by a stronger U.S. dollar. International developed-markets generally struggled during the period as macroeconomic concerns ebbed and flowed, finishing with only a modest gain. The MSCI® EAFE® Index rose 4.76% for the year, largely buttressed in the summertime by pledges of accommodative monetary action from eurozone officials, as well as signs that the U.S. housing market was on the mend. Within the index, Asia-Pacific ex Japan showed the most impressive gain, advancing roughly 10%. A number of core European components, including Germany (+11%) and Switzerland (+10%), and the U.K. (+9%), benefited from optimism about the eurozone's ability to resolve its debt woes, which helped the region outpace the index overall. Elsewhere, Japan was among the few benchmark constituents to finish in the red, returning about -3%. Emerging-markets stocks gained 2.98% for the year, as measured by the MSCI Emerging Markets Index. A general uptrend in the final five months of the period lifted the index into positive territory for the full 12 months.
Comments from Robert Bao, Portfolio Manager of Fidelity Advisor® China Region Fund: For the year, the fund's Class A, Class T, Class B and Class C shares returned 6.70%, 6.38%, 5.90% and 5.88%, respectively (excluding sales charges), trailing the 8.02% gain of the MSCI® Golden Dragon Index. Versus the index, the biggest negative impact came from an overweighting and stock selection in China. Among sectors and industries, my picks in the retailing segment of consumer discretionary and the semiconductors/semiconductor equipment portion of information technology weighed on performance. Noteworthy individual detractors included Taiwan-based DRAM computer memory maker Inotera Memories. I thought the company might benefit from better industry supply discipline and firmer pricing following the bankruptcy of one of Inotera's major competitors, but a weak global economic environment prevented that from happening. China Shipping Container Lines, which I sold at what turned out to be an inopportune time, also hampered the fund's results, as did an out-of-index stake in jewelry retailer Luk Fook Holdings International, based in Hong Kong. Underweighting Taiwanese electronics contract manufacturer and benchmark component Hon Hai Precision Industry further worked against us, given the stock's robust performance. Conversely, a sizable underweighting in the weak-performing Taiwan market added value, along with my choices in the hardware/equipment area of information technology. Negligible exposure to Taiwan-headquartered HTC, a stock I sold early in the period, was the right decision, as the smartphone maker lost market share to rivals Apple and Samsung Electronics, which hampered its stock. China Overseas Land and Investment, one of the largest property developers in that nation, also contributed, as did BOC Hong Kong, one of my favorite banks, and Chinese power utility Huaneng Power International, whose stock rose as investors anticipated an earnings boost from lower coal prices.
Note to shareholders: Fidelity Advisor China Region Fund may invest up to 35% of its total assets in any industry that represents more than 20% of the Hong Kong, Taiwanese and Chinese market. As of October 31, 2012, the fund did not have more than 25% of its total assets invested in any one industry.
The views expressed above reflect those of the portfolio manager(s) only through the end of the period as stated on the cover of this report and do not necessarily represent the views of Fidelity or any other person in the Fidelity organization. Any such views are subject to change at any time based upon market or other conditions and Fidelity disclaims any responsibility to update such views. These views may not be relied on as investment advice and, because investment decisions for a Fidelity fund are based on numerous factors, may not be relied on as an indication of trading intent on behalf of any Fidelity fund.
Annual Report
Fidelity China Region Fund
As a shareholder of the Fund, you incur two types of costs: (1) transaction costs, including sales charges (loads) on purchase payments or redemption proceeds, redemption fees and (2) ongoing costs, including management fees, distribution and/or service (12b-1) fees and other Fund expenses. This Example is intended to help you understand your ongoing costs (in dollars) of investing in the Fund and to compare these costs with the ongoing costs of investing in other mutual funds.
The Example is based on an investment of $1,000 invested at the beginning of the period and held for the entire period (May 1, 2012 to October 31, 2012).
Actual Expenses
The first line of the accompanying table for each class of the Fund provides information about actual account values and actual expenses. You may use the information in this line, together with the amount you invested, to estimate the expenses that you paid over the period. Simply divide your account value by $1,000.00 (for example, an $8,600 account value divided by $1,000.00 = 8.6), then multiply the result by the number in the first line for a class of the Fund under the heading entitled "Expenses Paid During Period" to estimate the expenses you paid on your account during this period. A small balance maintenance fee of $12.00 that is charged once a year may apply for certain accounts with a value of less than $2,000. This fee is not included in the table below. If it was, the estimate of expenses you paid during the period would be higher, and your ending account value lower, by this amount. In addition, the Fund, as a shareholder in the underlying Fidelity Central Funds, will indirectly bear its pro-rata share of the fees and expenses incurred by the underlying Fidelity Central Funds. These fees and expenses are not included in the Fund's annualized expense ratio used to calculate the expense estimate in the table below.
Hypothetical Example for Comparison Purposes
The second line of the accompanying table for each class of the Fund provides information about hypothetical account values and hypothetical expenses based on a Class' actual expense ratio and an assumed rate of return of 5% per year before expenses, which is not the Class' actual return. The hypothetical account values and expenses may not be used to estimate the actual ending account balance or expenses you paid for the period. You may use this information to compare the ongoing costs of investing in the Fund and other funds. To do so, compare this 5% hypothetical example with the 5% hypothetical examples that appear in the shareholder reports of the other funds. A small balance maintenance fee of $12.00 that is charged once a year may apply for certain accounts with a value of less than $2,000. This fee is not included in the table below. If it was, the estimate of expenses you paid during the period would be higher, and your ending account value lower, by this amount. In addition, the Fund, as a shareholder in the underlying Fidelity Central Funds, will indirectly bear its pro-rata share of the fees and expenses incurred by the underlying Fidelity Central Funds. These fees and expenses are not included in the Fund's annualized expense ratio used to calculate the expense estimate in the table below.
Please note that the expenses shown in the table are meant to highlight your ongoing costs only and do not reflect any transaction costs. Therefore, the second line of the table is useful in comparing ongoing costs only, and will not help you determine the relative total costs of owning different funds. In addition, if these transactional costs were included, your costs would have been higher.
| Annualized
Expense Ratio | Beginning
Account Value
May 1, 2012 | Ending
Account Value
October 31, 2012 | Expenses Paid
During Period*
May 1, 2012
to October 31, 2012 |
Class A | 1.35% | | | |
Actual | | $ 1,000.00 | $ 1,013.10 | $ 6.83 |
HypotheticalA | | $ 1,000.00 | $ 1,018.35 | $ 6.85 |
Class T | 1.64% | | | |
Actual | | $ 1,000.00 | $ 1,011.80 | $ 8.29 |
HypotheticalA | | $ 1,000.00 | $ 1,016.89 | $ 8.31 |
Class B | 2.10% | | | |
Actual | | $ 1,000.00 | $ 1,009.70 | $ 10.61 |
HypotheticalA | | $ 1,000.00 | $ 1,014.58 | $ 10.63 |
Class C | 2.10% | | | |
Actual | | $ 1,000.00 | $ 1,009.30 | $ 10.61 |
HypotheticalA | | $ 1,000.00 | $ 1,014.58 | $ 10.63 |
China Region | 1.04% | | | |
Actual | | $ 1,000.00 | $ 1,014.80 | $ 5.27 |
HypotheticalA | | $ 1,000.00 | $ 1,019.91 | $ 5.28 |
Institutional Class | 1.05% | | | |
Actual | | $ 1,000.00 | $ 1,014.50 | $ 5.32 |
HypotheticalA | | $ 1,000.00 | $ 1,019.86 | $ 5.33 |
A 5% return per year before expenses
* Expenses are equal to each Class' annualized expense ratio, multiplied by the average account value over the period, multiplied by 184/366 (to reflect the one-half year period).
Annual Report
Fidelity China Region Fund
Investment Changes (Unaudited)
Geographic Diversification (% of fund's net assets) |
As of October 31, 2012 |
 | Hong Kong | 29.3% | |
 | China | 23.4% | |
 | Cayman Islands | 18.9% | |
 | Taiwan | 18.8% | |
 | Bermuda | 8.1% | |
 | Netherlands | 0.6% | |
 | Italy | 0.5% | |
 | United States of America | 0.2% | |
 | United Kingdom | 0.2% | |

Percentages are based on country or territory of incorporation and are adjusted for the effect of futures contracts, if applicable. |
As of April 30, 2012 |
| China | 28.3% | |
| Hong Kong | 27.1% | |
 | Taiwan | 21.6% | |
| Cayman Islands | 13.8% | |
| Bermuda | 5.7% | |
| United Kingdom | 0.9% | |
| United States of America | 0.6% | |
| Korea (South) | 0.5% | |
| Netherlands | 0.5% | |
| Other | 1.0% | |

Percentages are based on country or territory of incorporation and are adjusted for the effect of futures contracts, if applicable. |
Asset Allocation |
| % of fund's
net assets | % of fund's net assets
6 months ago |
Stocks | 99.8 | 99.4 |
Short-Term Investments and Net Other Assets (Liabilities) | 0.2 | 0.6 |
Top Ten Stocks as of October 31, 2012 |
| % of fund's
net assets | % of fund's net assets
6 months ago |
Taiwan Semiconductor Manufacturing Co. Ltd. (Semiconductors & Semiconductor Equipment) | 6.8 | 7.0 |
Tencent Holdings Ltd. (Internet Software & Services) | 4.7 | 2.8 |
Industrial & Commercial Bank of China Ltd. (H Shares) (Commercial Banks) | 4.1 | 4.9 |
China Overseas Land and Investment Ltd. (Real Estate Management & Development) | 2.8 | 1.6 |
Cheung Kong Holdings Ltd. (Real Estate Management & Development) | 2.7 | 2.1 |
AIA Group Ltd. (Insurance) | 2.7 | 4.2 |
China Construction Bank Corp. (H Shares) (Commercial Banks) | 2.6 | 2.6 |
BOC Hong Kong (Holdings) Ltd. (Commercial Banks) | 2.4 | 2.9 |
MediaTek, Inc. (Semiconductors & Semiconductor Equipment) | 2.4 | 0.7 |
Hon Hai Precision Industry Co. Ltd. (Foxconn) (Electronic Equipment & Components) | 2.3 | 3.0 |
| 33.5 | |
Market Sectors as of October 31, 2012 |
| % of fund's
net assets | % of fund's net assets
6 months ago |
Financials | 33.1 | 39.0 |
Information Technology | 24.0 | 18.6 |
Consumer Discretionary | 11.1 | 8.4 |
Materials | 10.6 | 7.1 |
Industrials | 8.1 | 10.7 |
Energy | 4.4 | 8.1 |
Telecommunication Services | 3.5 | 3.1 |
Utilities | 3.1 | 2.2 |
Consumer Staples | 1.5 | 1.9 |
Health Care | 0.4 | 0.3 |
Annual Report
Fidelity China Region Fund
Investments October 31, 2012
Showing Percentage of Net Assets
Common Stocks - 99.8% |
| Shares | | Value |
CONSUMER DISCRETIONARY - 11.1% |
Automobiles - 0.9% |
Brilliance China Automotive Holdings Ltd. (a) | 5,190,000 | | $ 6,482,436 |
Geely Automobile Holdings Ltd. | 11,915,000 | | 5,119,573 |
| | 11,602,009 |
Hotels, Restaurants & Leisure - 4.4% |
Galaxy Entertainment Group Ltd. (a) | 5,689,000 | | 19,562,693 |
Melco PBL Entertainment (Macau) Ltd. sponsored ADR (a) | 403,400 | | 5,853,334 |
Sands China Ltd. | 4,808,200 | | 18,084,920 |
SJM Holdings Ltd. | 2,601,000 | | 5,665,109 |
Wynn Macau Ltd. | 2,610,800 | | 7,394,412 |
| | 56,560,468 |
Household Durables - 1.7% |
Skyworth Digital Holdings Ltd. | 5,486,000 | | 2,965,960 |
Techtronic Industries Co. Ltd. | 9,863,500 | | 18,785,074 |
| | 21,751,034 |
Leisure Equipment & Products - 0.7% |
Merida Industry Co. Ltd. | 2,303,450 | | 8,832,126 |
Media - 0.9% |
Television Broadcasts Ltd. | 1,626,000 | | 12,116,244 |
Multiline Retail - 0.7% |
Lifestyle International Holdings Ltd. | 1,753,500 | | 3,746,809 |
Springland International Holdings Ltd. | 11,629,000 | | 5,716,930 |
| | 9,463,739 |
Specialty Retail - 0.8% |
Chow Tai Fook Jewellery Group Ltd. | 4,988,400 | | 6,153,393 |
Luk Fook Holdings International Ltd. | 1,834,000 | | 4,609,818 |
| | 10,763,211 |
Textiles, Apparel & Luxury Goods - 1.0% |
Prada SpA | 752,900 | | 6,139,738 |
Shenzhou International Group Holdings Ltd. | 3,459,000 | | 6,739,428 |
| | 12,879,166 |
TOTAL CONSUMER DISCRETIONARY | | 143,967,997 |
CONSUMER STAPLES - 1.5% |
Food & Staples Retailing - 0.2% |
President Chain Store Corp. | 601,000 | | 2,973,109 |
Food Products - 0.8% |
Want Want China Holdings Ltd. | 7,227,000 | | 9,884,607 |
Personal Products - 0.5% |
Hengan International Group Co. Ltd. | 676,500 | | 6,162,657 |
TOTAL CONSUMER STAPLES | | 19,020,373 |
ENERGY - 4.4% |
Energy Equipment & Services - 0.5% |
China Oilfield Services Ltd. (H Shares) | 3,520,000 | | 6,676,602 |
|
| Shares | | Value |
Oil, Gas & Consumable Fuels - 3.9% |
China Shenhua Energy Co. Ltd. (H Shares) | 4,588,500 | | $ 19,538,003 |
Kunlun Energy Co. Ltd. | 13,186,000 | | 24,500,281 |
Sinopec Kantons Holdings Ltd. | 8,596,000 | | 6,410,911 |
| | 50,449,195 |
TOTAL ENERGY | | 57,125,797 |
FINANCIALS - 33.1% |
Capital Markets - 2.8% |
CITIC Securities Co. Ltd. (H Shares) | 9,503,500 | | 17,829,677 |
Haitong Securities Co. Ltd. (H Shares) | 12,406,400 | | 15,912,106 |
Wuliangye Yibin Co. Ltd. (UBS Warrant Programme) warrants 4/22/13 (a) | 345,100 | | 1,859,050 |
| | 35,600,833 |
Commercial Banks - 12.5% |
BOC Hong Kong (Holdings) Ltd. | 10,152,000 | | 31,241,760 |
China Construction Bank Corp. (H Shares) | 43,679,000 | | 32,914,028 |
Chinatrust Financial Holding Co. Ltd. | 12,203,603 | | 6,726,395 |
Hang Seng Bank Ltd. | 1,319,700 | | 20,263,650 |
Industrial & Commercial Bank of China Ltd. (H Shares) | 80,562,000 | | 53,326,503 |
Wing Hang Bank Ltd. | 904,500 | | 9,593,474 |
Wuliangye Yibin Co. Ltd. (BNP Paribas Warrant Program) warrants 8/20/13 (a) | 1,351,900 | | 7,282,671 |
| | 161,348,481 |
Insurance - 3.2% |
AIA Group Ltd. | 8,697,000 | | 34,451,120 |
China Life Insurance Co. Ltd. (H Shares) | 2,372,000 | | 6,974,893 |
| | 41,426,013 |
Real Estate Management & Development - 14.6% |
Cheung Kong Holdings Ltd. | 2,337,000 | | 34,527,068 |
China Overseas Land and Investment Ltd. | 13,656,000 | | 35,769,679 |
Csi Properties Ltd. | 139,720,000 | | 5,678,905 |
Guangzhou R&F Properties Co. Ltd. (H Shares) | 10,685,600 | | 13,139,756 |
Henderson Land Development Co. Ltd. | 1,343,000 | | 9,305,630 |
Hopson Development Holdings Ltd. (a) | 16,090,000 | | 15,508,584 |
Hysan Development Co. Ltd. | 1,336,000 | | 5,904,220 |
KWG Property Holding Ltd. | 9,404,500 | | 5,606,259 |
Longfor Properties Co. Ltd. | 7,217,500 | | 12,739,969 |
New World Development Co. Ltd. | 6,432,000 | | 9,942,563 |
Shimao Property Holdings Ltd. | 3,908,500 | | 7,463,926 |
Sun Hung Kai Properties Ltd. | 1,656,000 | | 23,055,645 |
Wharf Holdings Ltd. | 1,448,000 | | 9,911,730 |
| | 188,553,934 |
TOTAL FINANCIALS | | 426,929,261 |
Common Stocks - continued |
| Shares | | Value |
HEALTH CARE - 0.4% |
Pharmaceuticals - 0.4% |
China Medical System Holdings Ltd. | 9,846,000 | | $ 5,678,882 |
INDUSTRIALS - 8.1% |
Construction & Engineering - 2.0% |
China Communications Construction Co. Ltd. (H Shares) | 4,803,000 | | 4,505,495 |
China Railway Group Ltd. (H Shares) | 8,253,000 | | 4,206,341 |
China State Construction International Holdings Ltd. | 13,696,000 | | 16,311,389 |
| | 25,023,225 |
Electrical Equipment - 0.4% |
Zhuzhou CSR Times Electric Co. Ltd. (H Shares) | 1,912,000 | | 5,624,944 |
Industrial Conglomerates - 1.8% |
Hutchison Whampoa Ltd. | 2,358,000 | | 23,199,528 |
Machinery - 0.3% |
HIWIN Technologies Corp. | 38,400 | | 247,148 |
Singamas Container Holdings Ltd. | 14,718,000 | | 3,722,206 |
| | 3,969,354 |
Marine - 2.7% |
China Shipping Development Co. Ltd. (H Shares) | 8,884,000 | | 4,665,503 |
Orient Overseas International Ltd. | 2,828,500 | | 17,883,304 |
Pacific Basin Shipping Ltd. | 22,304,000 | | 11,943,355 |
| | 34,492,162 |
Road & Rail - 0.7% |
MTR Corp. Ltd. | 2,265,000 | | 8,855,362 |
Transportation Infrastructure - 0.2% |
Jiangsu Expressway Co. Ltd. (H Shares) | 3,524,000 | | 3,037,441 |
TOTAL INDUSTRIALS | | 104,202,016 |
INFORMATION TECHNOLOGY - 24.0% |
Communications Equipment - 1.2% |
AAC Acoustic Technology Holdings, Inc. | 4,485,000 | | 16,030,155 |
Computers & Peripherals - 1.7% |
ASUSTeK Computer, Inc. | 616,000 | | 6,600,753 |
Lenovo Group Ltd. | 15,074,000 | | 12,117,473 |
Quanta Computer, Inc. | 1,391,000 | | 3,181,061 |
| | 21,899,287 |
Electronic Equipment & Components - 3.7% |
Chroma ATE, Inc. | 1,938,000 | | 3,688,901 |
Delta Electronics, Inc. | 1,475,000 | | 5,039,541 |
Hon Hai Precision Industry Co. Ltd. (Foxconn) | 9,711,047 | | 29,488,869 |
TPK Holding Co. Ltd. GDR (Reg. S) (a) | 727,542 | | 9,140,976 |
| | 47,358,287 |
Internet Software & Services - 4.7% |
Tencent Holdings Ltd. | 1,704,100 | | 60,247,792 |
|
| Shares | | Value |
Semiconductors & Semiconductor Equipment - 12.7% |
Advanced Semiconductor Engineering, Inc. sponsored ADR (d) | 1,694,111 | | $ 6,437,622 |
ASM Pacific Technology Ltd. | 283,900 | | 3,165,007 |
Inotera Memories, Inc. (a) | 42,209,000 | | 5,736,725 |
Kinsus Interconnect Technology Corp. | 2,131,000 | | 5,858,244 |
MediaTek, Inc. | 2,736,000 | | 30,394,796 |
Novatek Microelectronics Corp. | 2,979,000 | | 11,218,418 |
Spreadtrum Communications, Inc. ADR | 612,000 | | 14,106,600 |
Taiwan Semiconductor Manufacturing Co. Ltd. | 28,667,796 | | 87,359,967 |
| | 164,277,379 |
Software - 0.0% |
NetDragon WebSoft, Inc. | 464,000 | | 495,728 |
TOTAL INFORMATION TECHNOLOGY | | 310,308,628 |
MATERIALS - 10.6% |
Chemicals - 1.1% |
Formosa Chemicals & Fibre Corp. | 3,220,000 | | 7,628,346 |
Taiwan Fertilizer Co. Ltd. | 3,015,000 | | 7,183,978 |
| | 14,812,324 |
Construction Materials - 5.1% |
Anhui Conch Cement Co. Ltd. (H Shares) | 5,902,500 | | 20,411,094 |
BBMG Corp. (H Shares) | 16,845,000 | | 14,475,739 |
China National Building Materials Co. Ltd. (H Shares) | 12,214,000 | | 15,570,780 |
China Resources Cement Holdings Ltd. | 14,036,000 | | 9,544,418 |
Taiwan Cement Corp. | 4,629,000 | | 5,934,819 |
| | 65,936,850 |
Metals & Mining - 3.0% |
Aluminum Corp. of China Ltd. (H Shares) (a) | 15,936,000 | | 6,903,054 |
Jiangxi Copper Co. Ltd. (H Shares) | 9,581,000 | | 24,786,814 |
Maanshan Iron & Steel Ltd. (H Shares) (a) | 25,498,000 | | 6,580,087 |
| | 38,269,955 |
Paper & Forest Products - 1.4% |
Lee & Man Paper Manufacturing Ltd. | 15,012,000 | | 7,883,670 |
Nine Dragons Paper (Holdings) Ltd. | 13,664,000 | | 9,626,446 |
| | 17,510,116 |
TOTAL MATERIALS | | 136,529,245 |
TELECOMMUNICATION SERVICES - 3.5% |
Diversified Telecommunication Services - 0.9% |
China Unicom Ltd. | 6,946,000 | | 11,197,831 |
Wireless Telecommunication Services - 2.6% |
China Mobile Ltd. | 2,256,500 | | 25,028,527 |
Far EasTone Telecommunications Co. Ltd. | 3,710,000 | | 8,560,561 |
| | 33,589,088 |
TOTAL TELECOMMUNICATION SERVICES | | 44,786,919 |
Common Stocks - continued |
| Shares | | Value |
UTILITIES - 3.1% |
Electric Utilities - 0.8% |
Power Assets Holdings Ltd. | 1,173,500 | | $ 9,978,471 |
Independent Power Producers & Energy Traders - 2.3% |
China Resources Power Holdings Co. Ltd. | 2,084,000 | | 4,463,765 |
Huadian Power International Corp. Ltd. (H Shares) (a) | 9,798,000 | | 2,490,572 |
Huaneng Power International, Inc. (H Shares) | 29,620,000 | | 23,664,040 |
| | 30,618,377 |
TOTAL UTILITIES | | 40,596,848 |
TOTAL COMMON STOCKS (Cost $1,037,958,239) |
1,289,145,966
|
Money Market Funds - 1.3% |
| | | |
Fidelity Cash Central Fund, 0.19% (b) | 15,785,844 | | 15,785,844 |
Fidelity Securities Lending Cash Central Fund, 0.19% (b)(c) | 77,891 | | 77,891 |
TOTAL MONEY MARKET FUNDS (Cost $15,863,735) |
15,863,735
|
TOTAL INVESTMENT PORTFOLIO - 101.1% (Cost $1,053,821,974) | | 1,305,009,701 |
NET OTHER ASSETS (LIABILITIES) - (1.1)% | | (13,627,324) |
NET ASSETS - 100% | $ 1,291,382,377 |
Legend |
(a) Non-income producing |
(b) Affiliated fund that is available only to investment companies and other accounts managed by Fidelity Investments. The rate quoted is the annualized seven-day yield of the fund at period end. A complete unaudited listing of the fund's holdings as of its most recent quarter end is available upon request. In addition, each Fidelity Central Fund's financial statements, which are not covered by the Fund's Report of Independent Registered Public Accounting Firm, are available on the SEC's website or upon request. |
(c) Includes investment made with cash collateral received from securities on loan. |
(d) Security or a portion of the security is on loan at period end. |
Affiliated Central Funds |
Information regarding fiscal year to date income earned by the Fund from investments in Fidelity Central Funds is as follows: |
Fund | Income earned |
Fidelity Cash Central Fund | $ 26,173 |
Fidelity Securities Lending Cash Central Fund | 111,499 |
Total | $ 137,672 |
Other Information |
The following is a summary of the inputs used, as of October 31, 2012, involving the Fund's assets and liabilities carried at fair value. The inputs or methodology used for valuing securities may not be an indication of the risk associated with investing in those securities. For more information on valuation inputs, and their aggregation into the levels used in the tables below, please refer to the Security Valuation section in the accompanying Notes to Financial Statements. |
Valuation Inputs at Reporting Date: |
Description | Total | Level 1 | Level 2 | Level 3 |
Investments in Securities: | | | | |
Equities: | | | | |
Consumer Discretionary | $ 143,967,997 | $ 143,967,997 | $ - | $ - |
Consumer Staples | 19,020,373 | 19,020,373 | - | - |
Energy | 57,125,797 | 57,125,797 | - | - |
Financials | 426,929,261 | 410,812,647 | 16,116,614 | - |
Health Care | 5,678,882 | 5,678,882 | - | - |
Industrials | 104,202,016 | 104,202,016 | - | - |
Information Technology | 310,308,628 | 222,948,661 | 87,359,967 | - |
Materials | 136,529,245 | 129,626,191 | 6,903,054 | - |
Telecommunication Services | 44,786,919 | 8,560,561 | 36,226,358 | - |
Utilities | 40,596,848 | 16,932,808 | 23,664,040 | - |
Money Market Funds | 15,863,735 | 15,863,735 | - | - |
Total Investments in Securities: | $ 1,305,009,701 | $ 1,134,739,668 | $ 170,270,033 | $ - |
The following is a summary of transfers between Level 1 and Level 2 for the period ended October 31, 2012. Transfers are assumed to have occurred at the beginning of the period, and are primarily attributable to the valuation techniques used for foreign equity securities, as discussed in the accompanying Notes to Financial Statements: |
Transfers | Total |
Level 1 to Level 2 | $ 0 |
Level 2 to Level 1 | $ 741,933,610 |
See accompanying notes which are an integral part of the financial statements.
Annual Report
Fidelity China Region Fund
Statement of Assets and Liabilities
| October 31, 2012 |
| | |
Assets | | |
Investment in securities, at value (including securities loaned of $78,930) - See accompanying schedule: Unaffiliated issuers (cost $1,037,958,239) | $ 1,289,145,966 | |
Fidelity Central Funds (cost $15,863,735) | 15,863,735 | |
Total Investments (cost $1,053,821,974) | | $ 1,305,009,701 |
Receivable for investments sold | | 29,683,136 |
Receivable for fund shares sold | | 1,372,007 |
Dividends receivable | | 187,311 |
Distributions receivable from Fidelity Central Funds | | 772 |
Other receivables | | 280,271 |
Total assets | | 1,336,533,198 |
| | |
Liabilities | | |
Payable for investments purchased | $ 30,215,400 | |
Payable for fund shares redeemed | 13,622,794 | |
Accrued management fee | 754,511 | |
Distribution and service plan fees payable | 9,590 | |
Other affiliated payables | 299,717 | |
Other payables and accrued expenses | 170,918 | |
Collateral on securities loaned, at value | 77,891 | |
Total liabilities | | 45,150,821 |
| | |
Net Assets | | $ 1,291,382,377 |
Net Assets consist of: | | |
Paid in capital | | $ 1,051,109,763 |
Undistributed net investment income | | 19,540,796 |
Accumulated undistributed net realized gain (loss) on investments and foreign currency transactions | | (30,455,911) |
Net unrealized appreciation (depreciation) on investments and assets and liabilities in foreign currencies | | 251,187,729 |
Net Assets | | $ 1,291,382,377 |
Statement of Assets and Liabilities - continued
| October 31, 2012 |
| | |
Calculation of Maximum Offering Price Class A:
Net Asset Value and redemption price per share ($13,539,457 ÷ 474,618 shares) | | $ 28.53 |
| | |
Maximum offering price per share (100/94.25 of $28.53) | | $ 30.27 |
Class T:
Net Asset Value and redemption price per share ($4,348,975 ÷ 153,118 shares) | | $ 28.40 |
| | |
Maximum offering price per share (100/96.50 of $28.40) | | $ 29.43 |
Class B:
Net Asset Value and offering price per share ($1,532,663 ÷ 54,432 shares)A | | $ 28.16 |
| | |
Class C:
Net Asset Value and offering price per share ($4,515,324 ÷ 160,840 shares)A | | $ 28.07 |
| | |
China Region:
Net Asset Value, offering price and redemption price per share ($1,265,488,434 ÷ 44,044,355 shares) | | $ 28.73 |
| | |
Institutional Class:
Net Asset Value, offering price and redemption price per share ($1,957,524 ÷ 68,243 shares) | | $ 28.68 |
A Redemption price per share is equal to net asset value less any applicable contingent deferred sales charge.
See accompanying notes which are an integral part of the financial statements.
Annual Report
Fidelity China Region Fund
Financial Statements - continued
Statement of Operations
| Year ended October 31, 2012 |
| | |
Investment Income | | |
Dividends | | $ 39,489,882 |
Interest | | 86 |
Income from Fidelity Central Funds | | 137,672 |
Income before foreign taxes withheld | | 39,627,640 |
Less foreign taxes withheld | | (3,165,755) |
Total income | | 36,461,885 |
| | |
Expenses | | |
Management fee | $ 9,807,145 | |
Transfer agent fees | 3,322,107 | |
Distribution and service plan fees | 123,475 | |
Accounting and security lending fees | 628,178 | |
Custodian fees and expenses | 506,447 | |
Independent trustees' compensation | 9,256 | |
Registration fees | 88,369 | |
Audit | 76,960 | |
Legal | 7,477 | |
Interest | 2,622 | |
Miscellaneous | 17,419 | |
Total expenses before reductions | 14,589,455 | |
Expense reductions | (909,736) | 13,679,719 |
Net investment income (loss) | | 22,782,166 |
Realized and Unrealized Gain (Loss) Net realized gain (loss) on: | | |
Investment securities: | | |
Unaffiliated issuers | (16,254,587) | |
Foreign currency transactions | (261,369) | |
Total net realized gain (loss) | | (16,515,956) |
Change in net unrealized appreciation (depreciation) on: Investment securities | 76,673,788 | |
Assets and liabilities in foreign currencies | (86) | |
Total change in net unrealized appreciation (depreciation) | | 76,673,702 |
Net gain (loss) | | 60,157,746 |
Net increase (decrease) in net assets resulting from operations | | $ 82,939,912 |
Statement of Changes in Net Assets
| Year ended
October 31,
2012 | Year ended
October 31,
2011 |
Increase (Decrease) in Net Assets | | |
Operations | | |
Net investment income (loss) | $ 22,782,166 | $ 27,851,224 |
Net realized gain (loss) | (16,515,956) | 124,444,208 |
Change in net unrealized appreciation (depreciation) | 76,673,702 | (389,938,389) |
Net increase (decrease) in net assets resulting from operations | 82,939,912 | (237,642,957) |
Distributions to shareholders from net investment income | (15,687,379) | (25,544,611) |
Distributions to shareholders from net realized gain | (18,721,345) | (1,707,007) |
Total distributions | (34,408,724) | (27,251,618) |
Share transactions - net increase (decrease) | (301,570,428) | (353,944,406) |
Redemption fees | 184,146 | 551,160 |
Total increase (decrease) in net assets | (252,855,094) | (618,287,821) |
| | |
Net Assets | | |
Beginning of period | 1,544,237,471 | 2,162,525,292 |
End of period (including undistributed net investment income of $19,540,796 and undistributed net investment income of $15,589,239, respectively) | $ 1,291,382,377 | $ 1,544,237,471 |
See accompanying notes which are an integral part of the financial statements.
Annual Report
Financial Highlights - Class A
Years ended October 31, | 2012 | 2011 | 2010 | 2009 | 2008 H |
Selected Per-Share Data | | | | | |
Net asset value, beginning of period | $ 27.28 | $ 31.61 | $ 26.47 | $ 16.67 | $ 29.28 |
Income from Investment Operations | | | | | |
Net investment income (loss) E | .36 | .33 | .25 | .30 | .28 |
Net realized and unrealized gain (loss) | 1.42 | (4.33) | 5.15 | 9.63 | (12.91) |
Total from investment operations | 1.78 | (4.00) | 5.40 | 9.93 | (12.63) |
Distributions from net investment income | (.19) | (.31) | (.20) | (.16) | - |
Distributions from net realized gain | (.34) | (.03) | (.07) | - | - |
Total distributions | (.53) | (.34) | (.27) | (.16) | - |
Redemption fees added to paid in capital E | - J | .01 | .01 | .03 | .02 |
Net asset value, end of period | $ 28.53 | $ 27.28 | $ 31.61 | $ 26.47 | $ 16.67 |
Total Return B, C, D | 6.70% | (12.79)% | 20.54% | 60.41% | (43.07)% |
Ratios to Average Net Assets F, I | | | | | |
Expenses before reductions | 1.36% | 1.37% | 1.38% | 1.39% | 1.44% A |
Expenses net of fee waivers, if any | 1.36% | 1.37% | 1.38% | 1.39% | 1.44% A |
Expenses net of all reductions | 1.29% | 1.31% | 1.31% | 1.31% | 1.30% A |
Net investment income (loss) | 1.35% | 1.07% | .91% | 1.27% | 2.63% A |
Supplemental Data | | | | | |
Net assets, end of period (000 omitted) | $ 13,539 | $ 14,808 | $ 16,047 | $ 11,842 | $ 340 |
Portfolio turnover rate G | 107% | 87% | 57% | 88% | 133% |
A Annualized B Total returns for periods of less than one year are not annualized. C Total returns would have been lower if certain expenses had not been reduced during the applicable periods shown. D Total returns do not include the effect of the sales charges. E Calculated based on average shares outstanding during the period. F Fees and expenses of any underlying Fidelity Central Funds are not included in the Fund's expense ratio. The Fund indirectly bears its proportionate share of the expenses of any underlying Fidelity Central Funds. G Amount does not include the portfolio activity of any underlying Fidelity Central Funds. H For the period May 9, 2008 (commencement of sale of shares) to October 31, 2008. I Expense ratios reflect operating expenses of the class. Expenses before reductions do not reflect amounts reimbursed by the investment adviser or reductions from brokerage service arrangements or reductions from other expense offset arrangements and do not represent the amount paid by the class during periods when reimbursements or reductions occur. Expense ratios before reductions for start-up periods may not be representative of longer-term operating periods. Expenses net of fee waivers reflect expenses after reimbursement by the investment adviser but prior to reductions from brokerage service arrangements or other expense offset arrangements. Expenses net of all reductions represent the net expenses paid by the class. J Amount represents less than $.01 per share. |
Financial Highlights - Class T
Years ended October 31, | 2012 | 2011 | 2010 | 2009 | 2008 H |
Selected Per-Share Data | | | | | |
Net asset value, beginning of period | $ 27.13 | $ 31.48 | $ 26.40 | $ 16.65 | $ 29.28 |
Income from Investment Operations | | | | | |
Net investment income (loss) E | .29 | .25 | .18 | .23 | .26 |
Net realized and unrealized gain (loss) | 1.40 | (4.32) | 5.13 | 9.64 | (12.91) |
Total from investment operations | 1.69 | (4.07) | 5.31 | 9.87 | (12.65) |
Distributions from net investment income | (.08) | (.27) | (.18) | (.14) | - |
Distributions from net realized gain | (.34) | (.03) | (.07) | - | - |
Total distributions | (.42) | (.29) K | (.24) L | (.14) | - |
Redemption fees added to paid in capital E | - J | .01 | .01 | .02 | .02 |
Net asset value, end of period | $ 28.40 | $ 27.13 | $ 31.48 | $ 26.40 | $ 16.65 |
Total Return B, C, D | 6.38% | (13.04)% | 20.27% | 59.92% | (43.14)% |
Ratios to Average Net Assets F, I | | | | | |
Expenses before reductions | 1.64% | 1.63% | 1.64% | 1.66% | 1.68% A |
Expenses net of fee waivers, if any | 1.64% | 1.63% | 1.64% | 1.66% | 1.68% A |
Expenses net of all reductions | 1.57% | 1.57% | 1.58% | 1.58% | 1.53% A |
Net investment income (loss) | 1.06% | .81% | .64% | 1.00% | 2.40% A |
Supplemental Data | | | | | |
Net assets, end of period (000 omitted) | $ 4,349 | $ 5,281 | $ 6,070 | $ 3,139 | $ 107 |
Portfolio turnover rate G | 107% | 87% | 57% | 88% | 133% |
A Annualized B Total returns for periods of less than one year are not annualized. C Total returns would have been lower if certain expenses had not been reduced during the applicable periods shown. D Total returns do not include the effect of the sales charges. E Calculated based on average shares outstanding during the period. F Fees and expenses of any underlying Fidelity Central Funds are not included in the Fund's expense ratio. The Fund indirectly bears its proportionate share of the expenses of any underlying Fidelity Central Funds. G Amount does not include the portfolio activity of any underlying Fidelity Central Funds. H For the period May 9, 2008 (commencement of sale of shares) to October 31, 2008. I Expense ratios reflect operating expenses of the class. Expenses before reductions do not reflect amounts reimbursed by the investment adviser or reductions from brokerage service arrangements or reductions from other expense offset arrangements and do not represent the amount paid by the class during periods when reimbursements or reductions occur. Expense ratios before reductions for start-up periods may not be representative of longer-term operating periods. Expenses net of fee waivers reflect expenses after reimbursement by the investment adviser but prior to reductions from brokerage service arrangements or other expense offset arrangements. Expenses net of all reductions represent the net expenses paid by the class. J Amount represents less than $.01 per share. K Total distributions of $.29 per share is comprised of distributions from net investment income of $.268 and distributions from net realized gain of $.025 per share. L Total distributions of $.24 per share is comprised of distributions from net investment income of $.177 and distributions from net realized gain of $.065 per share. |
See accompanying notes which are an integral part of the financial statements.
Annual Report
Financial Highlights - Class B
Years ended October 31, | 2012 | 2011 | 2010 | 2009 | 2008 H |
Selected Per-Share Data | | | | | |
Net asset value, beginning of period | $ 26.94 | $ 31.23 | $ 26.28 | $ 16.61 | $ 29.28 |
Income from Investment Operations | | | | | |
Net investment income (loss) E | .16 | .10 | .04 | .12 | .20 |
Net realized and unrealized gain (loss) | 1.40 | (4.29) | 5.09 | 9.63 | (12.89) |
Total from investment operations | 1.56 | (4.19) | 5.13 | 9.75 | (12.69) |
Distributions from net investment income | - | (.08) | (.12) | (.10) | - |
Distributions from net realized gain | (.34) | (.03) | (.07) | - | - |
Total distributions | (.34) | (.11) | (.19) | (.10) | - |
Redemption fees added to paid in capital E | - J | .01 | .01 | .02 | .02 |
Net asset value, end of period | $ 28.16 | $ 26.94 | $ 31.23 | $ 26.28 | $ 16.61 |
Total Return B, C, D | 5.90% | (13.45)% | 19.63% | 59.16% | (43.27)% |
Ratios to Average Net Assets F, I | | | | | |
Expenses before reductions | 2.11% | 2.12% | 2.14% | 2.15% | 2.17% A |
Expenses net of fee waivers, if any | 2.11% | 2.12% | 2.14% | 2.15% | 2.17% A |
Expenses net of all reductions | 2.04% | 2.06% | 2.08% | 2.06% | 2.02% A |
Net investment income (loss) | .59% | .32% | .14% | .51% | 1.91% A |
Supplemental Data | | | | | |
Net assets, end of period (000 omitted) | $ 1,533 | $ 1,801 | $ 2,496 | $ 1,915 | $ 155 |
Portfolio turnover rate G | 107% | 87% | 57% | 88% | 133% |
A Annualized B Total returns for periods of less than one year are not annualized. C Total returns would have been lower if certain expenses had not been reduced during the applicable periods shown. D Total returns do not include the effect of the contingent deferred sales charge. E Calculated based on average shares outstanding during the period. F Fees and expenses of any underlying Fidelity Central Funds are not included in the Fund's expense ratio. The Fund indirectly bears its proportionate share of the expenses of any underlying Fidelity Central Funds. G Amount does not include the portfolio activity of any underlying Fidelity Central Funds. H For the period May 9, 2008 (commencement of sale of shares) to October 31, 2008. I Expense ratios reflect operating expenses of the class. Expenses before reductions do not reflect amounts reimbursed by the investment adviser or reductions from brokerage service arrangements or reductions from other expense offset arrangements and do not represent the amount paid by the class during periods when reimbursements or reductions occur. Expense ratios before reductions for start-up periods may not be representative of longer-term operating periods. Expenses net of fee waivers reflect expenses after reimbursement by the investment adviser but prior to reductions from brokerage service arrangements or other expense offset arrangements. Expenses net of all reductions represent the net expenses paid by the class. J Amount represents less than $.01 per share. |
Financial Highlights - Class C
Years ended October 31, | 2012 | 2011 | 2010 | 2009 | 2008 H |
Selected Per-Share Data | | | | | |
Net asset value, beginning of period | $ 26.86 | $ 31.19 | $ 26.25 | $ 16.61 | $ 29.28 |
Income from Investment Operations | | | | | |
Net investment income (loss) E | .16 | .10 | .04 | .12 | .20 |
Net realized and unrealized gain (loss) | 1.39 | (4.28) | 5.09 | 9.62 | (12.89) |
Total from investment operations | 1.55 | (4.18) | 5.13 | 9.74 | (12.69) |
Distributions from net investment income | - | (.13) | (.13) | (.12) | - |
Distributions from net realized gain | (.34) | (.03) | (.07) | - | - |
Total distributions | (.34) | (.16) | (.20) | (.12) | - |
Redemption fees added to paid in capital E | - J | .01 | .01 | .02 | .02 |
Net asset value, end of period | $ 28.07 | $ 26.86 | $ 31.19 | $ 26.25 | $ 16.61 |
Total Return B, C, D | 5.88% | (13.46)% | 19.66% | 59.18% | (43.27)% |
Ratios to Average Net Assets F, I | | | | | |
Expenses before reductions | 2.11% | 2.12% | 2.14% | 2.15% | 2.13% A |
Expenses net of fee waivers, if any | 2.11% | 2.12% | 2.14% | 2.15% | 2.13% A |
Expenses net of all reductions | 2.04% | 2.06% | 2.07% | 2.07% | 1.98% A |
Net investment income (loss) | .59% | .32% | .15% | .51% | 1.95% A |
Supplemental Data | | | | | |
Net assets, end of period (000 omitted) | $ 4,515 | $ 5,230 | $ 5,938 | $ 3,806 | $ 233 |
Portfolio turnover rate G | 107% | 87% | 57% | 88% | 133% |
A Annualized B Total returns for periods of less than one year are not annualized. C Total returns would have been lower if certain expenses had not been reduced during the applicable periods shown. D Total returns do not include the effect of the contingent deferred sales charge. E Calculated based on average shares outstanding during the period. F Fees and expenses of any underlying Fidelity Central Funds are not included in the Fund's expense ratio. The Fund indirectly bears its proportionate share of the expenses of any underlying Fidelity Central Funds. G Amount does not include the portfolio activity of any underlying Fidelity Central Funds. H For the period May 9, 2008 (commencement of sale of shares) to October 31, 2008. I Expense ratios reflect operating expenses of the class. Expenses before reductions do not reflect amounts reimbursed by the investment adviser or reductions from brokerage service arrangements or reductions from other expense offset arrangements and do not represent the amount paid by the class during periods when reimbursements or reductions occur. Expense ratios before reductions for start-up periods may not be representative of longer-term operating periods. Expenses net of fee waivers reflect expenses after reimbursement by the investment adviser but prior to reductions from brokerage service arrangements or other expense offset arrangements. Expenses net of all reductions represent the net expenses paid by the class. J Amount represents less than $.01 per share. |
See accompanying notes which are an integral part of the financial statements.
Annual Report
Financial Highlights - China Region
Years ended October 31, | 2012 | 2011 | 2010 | 2009 | 2008 |
Selected Per-Share Data | | | | | |
Net asset value, beginning of period | $ 27.49 | $ 31.81 | $ 26.55 | $ 16.69 | $ 41.52 |
Income from Investment Operations | | | | | |
Net investment income (loss) B | .45 | .44 | .34 | .33 | .39 |
Net realized and unrealized gain (loss) | 1.42 | (4.37) | 5.18 | 9.68 | (20.42) |
Total from investment operations | 1.87 | (3.93) | 5.52 | 10.01 | (20.03) |
Distributions from net investment income | (.29) | (.38) | (.21) | (.17) | (.32) |
Distributions from net realized gain | (.34) | (.03) | (.07) | - | (4.53) |
Total distributions | (.63) | (.40) G | (.27) H | (.17) | (4.85) |
Redemption fees added to paid in capital B | - F | .01 | .01 | .02 | .05 |
Net asset value, end of period | $ 28.73 | $ 27.49 | $ 31.81 | $ 26.55 | $ 16.69 |
Total Return A | 7.01% | (12.52)% | 20.97% | 60.77% | (53.75)% |
Ratios to Average Net Assets C, E | | | | | |
Expenses before reductions | 1.04% | 1.04% | 1.06% | 1.12% | 1.11% |
Expenses net of fee waivers, if any | 1.04% | 1.04% | 1.06% | 1.12% | 1.11% |
Expenses net of all reductions | .98% | .98% | 1.00% | 1.03% | .96% |
Net investment income (loss) | 1.66% | 1.40% | 1.22% | 1.54% | 1.45% |
Supplemental Data | | | | | |
Net assets, end of period (000 omitted) | $ 1,265,488 | $ 1,515,084 | $ 2,130,070 | $ 2,138,141 | $ 740,289 |
Portfolio turnover rate D | 107% | 87% | 57% | 88% | 133% |
A Total returns would have been lower if certain expenses had not been reduced during the applicable periods shown. B Calculated based on average shares outstanding during the period. C Fees and expenses of any underlying Fidelity Central Funds are not included in the Fund's expense ratio. The Fund indirectly bears its proportionate share of the expenses of any underlying Fidelity Central Funds. D Amount does not include the portfolio activity of any underlying Fidelity Central Funds. E Expense ratios reflect operating expenses of the class. Expenses before reductions do not reflect amounts reimbursed by the investment adviser or reductions from brokerage service arrangements or reductions from other expense offset arrangements and do not represent the amount paid by the class during periods when reimbursements or reductions occur. Expenses net of fee waivers reflect expenses after reimbursement by the investment adviser but prior to reductions from brokerage service arrangements or other expense offset arrangements. Expenses net of all reductions represent the net expenses paid by the class. F Amount represents less than $.01 per share. G Total distributions of $.40 per share is comprised of distributions from net investment income of $.376 and distributions from net realized gain of $.025 per share. H Total distributions of $.27 per share is comprised of distributions from net investment income of $.209 and distributions from net realized gain of $.065 per share. |
Financial Highlights - Institutional Class
Years ended October 31, | 2012 | 2011 | 2010 | 2009 | 2008 G |
Selected Per-Share Data | | | | | |
Net asset value, beginning of period | $ 27.46 | $ 31.79 | $ 26.55 | $ 16.70 | $ 29.28 |
Income from Investment Operations | | | | | |
Net investment income (loss) D | .45 | .43 | .33 | .37 | .34 |
Net realized and unrealized gain (loss) | 1.42 | (4.37) | 5.18 | 9.64 | (12.94) |
Total from investment operations | 1.87 | (3.94) | 5.51 | 10.01 | (12.60) |
Distributions from net investment income | (.31) | (.37) | (.22) | (.18) | - |
Distributions from net realized gain | (.34) | (.03) | (.07) | - | - |
Total distributions | (.65) | (.40) | (.28) J | (.18) | - |
Redemption fees added to paid in capital D | - I | .01 | .01 | .02 | .02 |
Net asset value, end of period | $ 28.68 | $ 27.46 | $ 31.79 | $ 26.55 | $ 16.70 |
Total Return B, C | 7.02% | (12.56)% | 20.92% | 60.78% | (42.96)% |
Ratios to Average Net Assets E, H | | | | | |
Expenses before reductions | 1.04% | 1.06% | 1.11% | 1.08% | 1.05% A |
Expenses net of fee waivers, if any | 1.04% | 1.06% | 1.11% | 1.08% | 1.05% A |
Expenses net of all reductions | .98% | 1.01% | 1.04% | 1.00% | .91% A |
Net investment income (loss) | 1.66% | 1.38% | 1.18% | 1.58% | 3.02% A |
Supplemental Data | | | | | |
Net assets, end of period (000 omitted) | $ 1,958 | $ 2,034 | $ 1,904 | $ 1,684 | $ 60 |
Portfolio turnover rate F | 107% | 87% | 57% | 88% | 133% |
A Annualized B Total returns for periods of less than one year are not annualized. C Total returns would have been lower if certain expenses had not been reduced during the applicable periods shown. D Calculated based on average shares outstanding during the period. E Fees and expenses of any underlying Fidelity Central Funds are not included in the Fund's expense ratio. The Fund indirectly bears its proportionate share of the expenses of any underlying Fidelity Central Funds. F Amount does not include the portfolio activity of any underlying Fidelity Central Funds. G For the period May 9, 2008 (commencement of sale of shares) to October 31, 2008. H Expense ratios reflect operating expenses of the class. Expenses before reductions do not reflect amounts reimbursed by the investment adviser or reductions from brokerage service arrangements or reductions from other expense offset arrangements and do not represent the amount paid by the class during periods when reimbursements or reductions occur. Expense ratios before reductions for start-up periods may not be representative of longer-term operating periods. Expenses net of fee waivers reflect expenses after reimbursement by the investment adviser but prior to reductions from brokerage service arrangements or other expense offset arrangements. Expenses net of all reductions represent the net expenses paid by the class. I Amount represents less than $.01 per share. J Total distributions of $.28 per share is comprised of distributions from net investment income of $.216 and distributions from net realized gain of $.065 per share. |
See accompanying notes which are an integral part of the financial statements.
Annual Report
Notes to Financial Statements
For the period ended October 31, 2012
1. Organization.
Fidelity China Region Fund (the Fund) is a fund of Fidelity Investment Trust (the Trust) and is authorized to issue an unlimited number of shares. The Trust is registered under the Investment Company Act of 1940, as amended (the 1940 Act), as an open-end management investment company organized as a Massachusetts business trust. The Fund offers Class A, Class T, Class C, China Region and Institutional Class shares, each of which, along with Class B shares, has equal rights as to assets and voting privileges. Effective after the close of business on September 1, 2010, Class B shares were closed to new accounts and additional purchases, except for exchanges and reinvestments. Each class has exclusive voting rights with respect to matters that affect that class. Class B shares will automatically convert to Class A shares after a holding period of seven years from the initial date of purchase. Investment income, realized and unrealized capital gains and losses, the common expenses of the Fund, and certain fund-level expense reductions, if any, are allocated on a pro-rata basis to each class based on the relative net assets of each class to the total net assets of the Fund. Each class differs with respect to transfer agent and distribution and service plan fees incurred. Certain expense reductions may also differ by class. The Fund's investments in emerging markets can be subject to social, economic, regulatory, and political uncertainties and can be extremely volatile.
2. Investments in Fidelity Central Funds.
The Fund invests in Fidelity Central Funds, which are open-end investment companies available only to other investment companies and accounts managed by Fidelity Management & Research Company (FMR) and its affiliates. The Fund's Schedule of Investments lists each of the Fidelity Central Funds held as of period end, if any, as an investment of the Fund, but does not include the underlying holdings of each Fidelity Central Fund. As an Investing Fund, the Fund indirectly bears its proportionate share of the expenses of the underlying Fidelity Central Funds.
The Money Market Central Funds seek preservation of capital and current income and are managed by Fidelity Investments Money Management, Inc. (FIMM), an affiliate of FMR.
A complete unaudited list of holdings for each Fidelity Central Fund is available upon request or at the Securities and Exchange Commission (the SEC) web site at www.sec.gov. In addition, the financial statements of the Fidelity Central Funds, which are not covered by the Fund's Report of Independent Registered Public Accounting Firm, are available on the SEC web site or upon request.
3. Significant Accounting Policies.
The financial statements have been prepared in conformity with accounting principles generally accepted in the United States of America (GAAP), which require management to make certain estimates and assumptions at the date of the financial statements. Actual results could differ from those estimates. Subsequent events, if any, through the date that the financial statements were issued have been evaluated in the preparation of the financial statements. The following summarizes the significant accounting policies of the Fund:
Security Valuation. Investments are valued as of 4:00 p.m. Eastern time on the last calendar day of the period. In accordance with valuation policies and procedures approved by the Board of Trustees (the Board), the Fund attempts to obtain prices from one or more third party pricing vendors or brokers to value its investments. When current market prices, quotations or rates are not readily available or reliable, securities will be fair valued in good faith by the FMR Fair Value Committee (the Committee), in accordance with procedures adopted by the Fund's Board. Factors used in determining fair value vary by security type and may include market or security specific events. The frequency with which these procedures are used cannot be predicted and they may be utilized to a significant extent. The Committee oversees the Fund's valuation policies and procedures and is responsible for approving and reporting to the Board all fair value determinations.
The Fund categorizes the inputs to valuation techniques used to value its investments into a disclosure hierarchy consisting of three levels as shown below:
Level 1 - quoted prices in active markets for identical investments
Level 2 - other significant observable inputs (including quoted prices for similar investments, interest rates, prepayment speeds, etc.)
Level 3 - unobservable inputs (including the Fund's own assumptions based on the best information available)
Valuation techniques used to value the Fund's investments by major category are as follows:
Equity securities, including restricted securities, for which market quotations are readily available, are valued at the last reported sale price or official closing price as reported by a third party pricing vendor on the primary market or exchange on which they are traded and are categorized as Level 1 in the hierarchy. In the event there were no sales during the day or closing prices are not available, securities are valued at the last quoted bid price or may be valued using the last available price and are generally categorized as Level 2 in the hierarchy. For foreign equity securities, when significant market or security specific events arise, comparisons to the valuation of American Depositary Receipts (ADRs), futures contracts, Exchange-Traded Funds (ETFs) and certain indexes as well as quoted prices for similar securities are used and are categorized as Level 2 in the hierarchy. Utilizing these techniques may result in transfers between Level 1 and Level 2.
Annual Report
Notes to Financial Statements - continued
3. Significant Accounting Policies - continued
Security Valuation - continued
Investments in open-end mutual funds, including the Fidelity Central Funds, are valued at their closing net asset value (NAV) each business day and are categorized as Level 1 in the hierarchy.
Changes in valuation techniques may result in transfers in or out of an assigned level within the disclosure hierarchy. The aggregate value of investments by input level, as of October 31, 2012, including information on transfers between Levels 1 and 2 securities, is included at the end of the Fund's Schedule of Investments.
Foreign Currency Translation. The Fund may use foreign currency contracts to facilitate transactions in foreign-denominated securities. Gains and losses from these transactions may arise from changes in the value of the foreign currency or if the counterparties do not perform under the contracts' terms.
Foreign-denominated assets, including investment securities, and liabilities are translated into U.S. dollars at the exchange rates at period end. Purchases and sales of investment securities, income and dividends received and expenses denominated in foreign currencies are translated into U.S. dollars at the exchange rate in effect on the transaction date.
The effects of exchange rate fluctuations on investments are included with the net realized and unrealized gain (loss) on investment securities. Other foreign currency transactions resulting in realized and unrealized gain (loss) are disclosed separately.
Investment Transactions and Income. For financial reporting purposes, the Fund's investment holdings and NAV include trades executed through the end of the last business day of the period. The NAV per share for processing shareholder transactions is calculated as of the close of business of the New York Stock Exchange (NYSE), normally 4:00 p.m. Eastern time and includes trades executed through the end of the prior business day. Gains and losses on securities sold are determined on the basis of identified cost. Dividend income is recorded on the ex-dividend date, except for certain dividends from foreign securities where the ex-dividend date may have passed, which are recorded as soon as the Fund is informed of the ex-dividend date. Non-cash dividends included in dividend income, if any, are recorded at the fair market value of the securities received. Interest income and distributions from the Fidelity Central Funds are accrued as earned. Interest income includes coupon interest and amortization of premium and accretion of discount on debt securities. Investment income is recorded net of foreign taxes withheld where recovery of such taxes is uncertain.
Expenses. Expenses directly attributable to a fund are charged to that fund. Expenses attributable to more than one fund are allocated among the respective funds on the basis of relative net assets or other appropriate methods. Expense estimates are accrued in the period to which they relate and adjustments are made when actual amounts are known.
Income Tax Information and Distributions to Shareholders. Each year, the Fund intends to qualify as a regulated investment company under Subchapter M of the Internal Revenue Code, including distributing substantially all of its taxable income and realized gains. As a result, no provision for income taxes is required. As of October 31, 2012, the Fund did not have any unrecognized tax benefits in the financial statements; nor is the Fund aware of any tax positions for which it is reasonably possible that the total amounts of unrecognized tax benefits will significantly change in the next twelve months. The Fund files a U.S. federal tax return, in addition to state and local tax returns as required. A fund's federal income tax returns are subject to examination by the Internal Revenue Service (IRS) for a period of three fiscal years after they are filed. State and local tax returns may be subject to examination for an additional fiscal year depending on the jurisdiction. Foreign taxes are provided for based on the Fund's understanding of the tax rules and rates that exist in the foreign markets in which it invests.
Distributions are declared and recorded on the ex-dividend date. Income dividends and capital gain distributions are declared separately for each class. Income and capital gain distributions are determined in accordance with income tax regulations, which may differ from GAAP. In addition, the Fund claimed a portion of the payment made to redeeming shareholders as a distribution for income tax purposes.
Capital accounts within the financial statements are adjusted for permanent book-tax differences. These adjustments have no impact on net assets or the results of operations. Temporary book-tax differences will reverse in a subsequent period.
Book-tax differences are primarily due to foreign currency transactions, deferred trustees compensation, capital loss carryforwards and losses deferred due to wash sales.
The federal tax cost of investment securities and unrealized appreciation (depreciation) as of period end were as follows:
Gross unrealized appreciation | $ 267,134,828 |
Gross unrealized depreciation | (22,561,736) |
Net unrealized appreciation (depreciation) on securities and other investments | $ 244,573,092 |
| |
Tax Cost | $ 1,060,436,609 |
Annual Report
3. Significant Accounting Policies - continued
Income Tax Information and Distributions to Shareholders - continued
The tax-based components of distributable earnings as of period end were as follows:
Undistributed ordinary income | $ 19,540,801 |
Capital loss carryforward | $ (23,841,276) |
Net unrealized appreciation (depreciation) | $ 244,573,094 |
Capital loss carryforwards are only available to offset future capital gains of the Fund to the extent provided by regulations and may be limited. Under the Regulated Investment Company Modernization Act of 2010 (the Act), the Fund is permitted to carry forward capital losses incurred in taxable years beginning after December 22, 2010 for an unlimited period and such capital losses are required to be used prior to any losses that expire. Capital loss carryforwards were as follows:
No expiration | |
Short-term | $ (23,841,276) |
The tax character of distributions paid was as follows:
| October 31, 2012 | October 31, 2011 |
Ordinary Income | $ 15,687,379 | $ 27,251,618 |
Long-term Capital Gains | 18,721,345 | - |
Total | $ 34,408,724 | $ 27,251,618 |
Short-Term Trading (Redemption) Fees. Shares held by investors in the Fund less than 90 days are subject to a redemption fee equal to 1.50% of the net asset value of shares redeemed. All redemption fees, which reduce the proceeds of the shareholder redemption, are retained by the Fund and accounted for as an addition to paid in capital.
New Accounting Pronouncement. In December 2011, the Financial Accounting Standards Board issued Accounting Standard Update No. 2011-11, Disclosures about Offsetting Assets and Liabilities. The update creates new disclosure requirements requiring entities to disclose both gross and net information for derivatives and other financial instruments that are either offset in the Statement of Assets and Liabilities or subject to an enforceable master netting arrangement or similar agreement. The disclosure requirements are effective for annual reporting periods beginning on or after January 1, 2013, and interim periods within those annual periods. Management is currently evaluating the impact of the update's adoption on the Fund's financial statement disclosures.
4. Purchases and Sales of Investments.
Purchases and sales of securities, other than short-term securities, aggregated $1,465,665,476 and $1,764,182,469, respectively.
5. Fees and Other Transactions with Affiliates.
Management Fee. FMR and its affiliates provide the Fund with investment management related services for which the Fund pays a monthly management fee. The management fee is the sum of an individual fund fee rate that is based on an annual rate of .45% of the Fund's average net assets and an annualized group fee rate that averaged .26% during the period. The group fee rate is based upon the average net assets of all the mutual funds advised by FMR. The group fee rate decreases as assets under management increase and increases as assets under management decrease. For the period, the total annual management fee rate was .71% of the Fund's average net assets.
Distribution and Service Plan Fees. In accordance with Rule 12b-1 of the 1940 Act, the Fund has adopted separate Distribution and Service Plans for each class of shares. Certain classes pay Fidelity Distributors Corporation (FDC), an affiliate of FMR, separate Distribution and Service Fees, each of which is based on an annual percentage of each class' average net assets. In addition, FDC may pay financial intermediaries for selling shares of the Fund and providing shareholder support services. For the period, the Distribution and Service Fee rates, total fees and amounts retained by FDC were as follows:
| Distribution
Fee | Service
Fee | Total Fees | Retained
by FDC |
Class A | -% | .25% | $ 35,281 | $ 524 |
Class T | .25% | .25% | 22,950 | - |
Class B | .75% | .25% | 16,491 | 12,400 |
Class C | .75% | .25% | 48,753 | 8,299 |
| | | $ 123,475 | $ 21,223 |
Annual Report
Notes to Financial Statements - continued
5. Fees and Other Transactions with Affiliates - continued
Sales Load. FDC may receive a front-end sales charge of up to 5.75% for selling Class A shares and 3.50% for selling Class T shares, some of which is paid to financial intermediaries for selling shares of the Fund. Depending on the holding period, FDC may receive contingent deferred sales charges levied on Class A, Class T, Class B, and Class C redemptions. The deferred sales charges range from 5.00% to 1.00% for Class B shares, 1.00% for Class C shares, 1.00% for certain purchases of Class A shares and .25% for certain purchases of Class T shares.
For the period, sales charge amounts retained by FDC were as follows:
| Retained
by FDC |
Class A | $ 10,963 |
Class T | 2,292 |
Class B* | 5,294 |
Class C* | 614 |
| $ 19,163 |
* When Class B and Class C shares are initially sold, FDC pays commissions from its own resources to financial intermediaries through which the sales are made.
Transfer Agent Fees. Fidelity Investments Institutional Operations Company, Inc. (FIIOC), an affiliate of FMR, is the transfer, dividend disbursing and shareholder servicing agent for each class of the Fund. FIIOC receives account fees and asset-based fees that vary according to the account size and type of account of the shareholders of the respective classes of the Fund. FIIOC pays for typesetting, printing and mailing of shareholder reports, except proxy statements. For the period, transfer agent fees for each class were as follows:
| Amount | % of
Average
Net Assets |
Class A | $ 42,267 | .30 |
Class T | 15,146 | .33 |
Class B | 4,929 | .30 |
Class C | 14,604 | .30 |
China Region | 3,240,864 | .24 |
Institutional Class | 4,297 | .24 |
| $ 3,322,107 | |
Accounting and Security Lending Fees. Fidelity Service Company, Inc. (FSC), an affiliate of FMR, maintains the Fund's accounting records. The accounting fee is based on the level of average net assets for each month. Under a separate contract, FSC administers the security lending program. The security lending fee is based on the number and duration of lending transactions.
Brokerage Commissions. The Fund placed a portion of its portfolio transactions with brokerage firms which are affiliates of the investment adviser. The commissions paid to these affiliated firms were $1,024 for the period.
Interfund Lending Program. Pursuant to an Exemptive Order issued by the SEC, the Fund, along with other registered investment companies having management contracts with FMR, may participate in an interfund lending program. This program provides an alternative credit facility allowing the funds to borrow from, or lend money to, other participating affiliated funds. At period end, there were no interfund loans outstanding. The Fund's activity in this program during the period for which loans were outstanding was as follows:
Borrower or Lender | Average Loan
Balance | Weighted Average Interest Rate | Interest
Expense |
Borrower | $ 5,482,818 | .39% | $ 2,622 |
6. Committed Line of Credit.
The Fund participates with other funds managed by FMR or an affiliate in a $4.25 billion credit facility (the "line of credit") to be utilized for temporary or emergency purposes to fund shareholder redemptions or for other short-term liquidity purposes. The Fund has agreed to pay commitment fees on its pro-rata portion of the line of credit, which amounted to $3,885 and is reflected in Miscellaneous expenses on the Statement of Operations. During the period, there were no borrowings on this line of credit.
Annual Report
7. Security Lending.
The Fund lends portfolio securities through a lending agent from time to time in order to earn additional income. For equity securities, a lending agent is used and may loan securities to certain qualified borrowers, including Fidelity Capital Markets (FCM), a broker-dealer affiliated with the Fund. On the settlement date of the loan, the Fund receives collateral (in the form of U.S. Treasury obligations, letters of credit and/or cash) against the loaned securities and maintains collateral in an amount not less than 100% of the market value of the loaned securities during the period of the loan. The market value of the loaned securities is determined at the close of business of the Fund and any additional required collateral is delivered to the Fund on the next business day. If the borrower defaults on its obligation to return the securities loaned because of insolvency or other reasons, a fund could experience delays and costs in recovering the securities loaned or in gaining access to the collateral. Any cash collateral received is invested in the Fidelity Securities Lending Cash Central Fund. The value of loaned securities and cash collateral at period end are disclosed on the Fund's Statement of Assets and Liabilities. Security lending income represents the income earned on investing cash collateral, less rebates paid to borrowers and any lending agent fees associated with the loan, plus any premium payments received for lending certain types of securities. Security lending income is presented in the Statement of Operations as a component of income from Fidelity Central Funds. Total security lending income during the period amounted to $111,499. During the period, there were no securities loaned to FCM.
8. Expense Reductions.
Many of the brokers with whom FMR places trades on behalf of the Fund provided services to the Fund in addition to trade execution. These services included payments of certain expenses on behalf of the Fund totaling $909,245 for the period. In addition, through arrangements with the Fund's custodian, credits realized as a result of uninvested cash balances were used to reduce the Fund's expenses. During the period, these credits reduced the Fund's custody expenses by $491.
9. Distributions to Shareholders.
Distributions to shareholders of each class were as follows:
Years ended October 31, | 2012 | 2011 |
From net investment income | | |
Class A | $ 100,983 | $ 172,777 |
Class T | 14,853 | 55,512 |
Class B | - | 6,583 |
Class C | - | 25,937 |
China Region | 15,549,167 | 25,262,487 |
Institutional Class | 22,376 | 21,315 |
Total | $ 15,687,379 | $ 25,544,611 |
From net realized gain | | |
Class A | $ 182,091 | $ 13,756 |
Class T | 60,664 | 5,178 |
Class B | 21,876 | 2,007 |
Class C | 65,490 | 4,950 |
China Region | 18,366,435 | 1,679,687 |
Institutional Class | 24,789 | 1,429 |
Total | $ 18,721,345 | $ 1,707,007 |
10. Share Transactions.
Transactions for each class of shares were as follows:
| Shares | Dollars |
Years ended October 31, | 2012 | 2011 | 2012 | 2011 |
Class A | | | | |
Shares sold | 128,967 | 281,861 | $ 3,497,936 | $ 8,932,867 |
Reinvestment of distributions | 10,227 | 5,327 | 266,217 | 172,528 |
Shares redeemed | (207,420) | (251,952) | (5,547,035) | (7,835,006) |
Net increase (decrease) | (68,226) | 35,236 | $ (1,782,882) | $ 1,270,389 |
Class T | | | | |
Shares sold | 40,215 | 75,956 | $ 1,078,486 | $ 2,390,903 |
Reinvestment of distributions | 2,834 | 1,832 | 73,623 | 59,161 |
Shares redeemed | (84,588) | (75,948) | (2,252,505) | (2,353,550) |
Net increase (decrease) | (41,539) | 1,840 | $ (1,100,396) | $ 96,514 |
Annual Report
Notes to Financial Statements - continued
10. Share Transactions - continued
| Shares | Dollars |
Years ended October 31, | 2012 | 2011 | 2012 | 2011 |
Class B | | | | |
Shares sold | 4,773 | 8,058 | $ 131,481 | $ 255,784 |
Reinvestment of distributions | 760 | 239 | 19,651 | 7,684 |
Shares redeemed | (17,966) | (21,353) | (477,343) | (653,889) |
Net increase (decrease) | (12,433) | (13,056) | $ (326,211) | $ (390,421) |
Class C | | | | |
Shares sold | 39,150 | 88,544 | $ 1,051,097 | $ 2,766,692 |
Reinvestment of distributions | 2,380 | 892 | 61,380 | 28,631 |
Shares redeemed | (75,401) | (85,136) | (1,981,464) | (2,585,147) |
Net increase (decrease) | (33,871) | 4,300 | $ (868,987) | $ 210,176 |
China Region | | | | |
Shares sold | 5,981,804 | 12,355,142 | $ 163,640,090 | $ 393,844,409 |
Reinvestment of distributions | 1,245,751 | 794,988 | 32,563,934 | 25,868,885 |
Shares redeemed | (18,300,659) | (24,993,159) | (493,563,874) | (775,253,396) |
Net increase (decrease) | (11,073,104) | (11,843,029) | $ (297,359,850) | $ (355,540,102) |
Institutional Class | | | | |
Shares sold | 33,539 | 53,728 | $ 913,352 | $ 1,636,945 |
Reinvestment of distributions | 1,708 | 607 | 44,574 | 19,735 |
Shares redeemed | (41,079) | (40,146) | (1,090,028) | (1,247,642) |
Net increase (decrease) | (5,832) | 14,189 | $ (132,102) | $ 409,038 |
11. Other.
The Fund's organizational documents provide former and current trustees and officers with a limited indemnification against liabilities arising in connection with the performance of their duties to the Fund. In the normal course of business, the Fund may also enter into contracts that provide general indemnifications. The Fund's maximum exposure under these arrangements is unknown as this would be dependent on future claims that may be made against the Fund. The risk of material loss from such claims is considered remote.
Annual Report
Report of Independent Registered Public Accounting Firm
To the Trustees of Fidelity Investment Trust and the Shareholders of Fidelity China Region Fund:
In our opinion, the accompanying statement of assets and liabilities, including the schedule of investments, and the related statements of operations and of changes in net assets and the financial highlights present fairly, in all material respects, the financial position of Fidelity China Region Fund (a fund of Fidelity Investment Trust) at October 31, 2012, the results of its operations for the year then ended, the changes in its net assets for each of the two years in the period then ended and the financial highlights for each of the five years in the period then ended, in conformity with accounting principles generally accepted in the United States of America. These financial statements and financial highlights (hereafter referred to as "financial statements") are the responsibility of the Fidelity China Region Fund's management. Our responsibility is to express an opinion on these financial statements based on our audits. We conducted our audits of these financial statements in accordance with the standards of the Public Company Accounting Oversight Board (United States). Those standards require that we plan and perform the audit to obtain reasonable assurance about whether the financial statements are free of material misstatement. An audit includes examining, on a test basis, evidence supporting the amounts and disclosures in the financial statements, assessing the accounting principles used and significant estimates made by management, and evaluating the overall financial statement presentation. We believe that our audits, which included confirmation of securities at October 31, 2012 by correspondence with the custodian and brokers, provide a reasonable basis for our opinion.
PricewaterhouseCoopers LLP
Boston, Massachusetts
December 18, 2012
Annual Report
The Trustees, Members of the Advisory Board, and executive officers of the trust and fund, as applicable, are listed below. The Board of Trustees governs the fund and is responsible for protecting the interests of shareholders. The Trustees are experienced executives who meet periodically throughout the year to oversee the fund's activities, review contractual arrangements with companies that provide services to the fund, oversee management of the risks associated with such activities and contractual arrangements, and review the fund's performance. Except for James C. Curvey, each of the Trustees oversees 236 funds advised by FMR or an affiliate. Mr. Curvey oversees 443 funds advised by FMR or an affiliate.
The Trustees hold office without limit in time except that (a) any Trustee may resign; (b) any Trustee may be removed by written instrument, signed by at least two-thirds of the number of Trustees prior to such removal; (c) any Trustee who requests to be retired or who has become incapacitated by illness or injury may be retired by written instrument signed by a majority of the other Trustees; and (d) any Trustee may be removed at any special meeting of shareholders by a two-thirds vote of the outstanding voting securities of the trust. Each Trustee who is not an interested person (as defined in the 1940 Act) (Independent Trustee), shall retire not later than the last day of the calendar year in which his or her 75th birthday occurs. The Independent Trustees may waive this mandatory retirement age policy with respect to individual Trustees. The executive officers and Advisory Board Members hold office without limit in time, except that any officer and Advisory Board Member may resign or may be removed by a vote of a majority of the Trustees at any regular meeting or any special meeting of the Trustees. Except as indicated, each individual has held the office shown or other offices in the same company for the past five years.
Experience, Skills, Attributes, and Qualifications of the Fund's Trustees. The Governance and Nominating Committee has adopted a statement of policy that describes the experience, qualifications, attributes, and skills that are necessary and desirable for potential Independent Trustee candidates (Statement of Policy). The Board believes that each Trustee satisfied at the time he or she was initially elected or appointed a Trustee, and continues to satisfy, the standards contemplated by the Statement of Policy. The Governance and Nominating Committee also engages professional search firms to help identify potential Independent Trustee candidates who have the experience, qualifications, attributes, and skills consistent with the Statement of Policy. From time to time, additional criteria based on the composition and skills of the current Independent Trustees, as well as experience or skills that may be appropriate in light of future changes to board composition, business conditions, and regulatory or other developments, have also been considered by the professional search firms and the Governance and Nominating Committee. In addition, the Board takes into account the Trustees' commitment and participation in Board and committee meetings, as well as their leadership of standing and ad hoc committees throughout their tenure.
In determining that a particular Trustee was and continues to be qualified to serve as a Trustee, the Board has considered a variety of criteria, none of which, in isolation, was controlling. The Board believes that, collectively, the Trustees have balanced and diverse experience, qualifications, attributes, and skills, which allow the Board to operate effectively in governing the fund and protecting the interests of shareholders. Information about the specific experience, skills, attributes, and qualifications of each Trustee, which in each case led to the Board's conclusion that the Trustee should serve (or continue to serve) as a trustee of the fund, is provided below.
Board Structure and Oversight Function. James C. Curvey is an interested person (as defined in the 1940 Act) and currently serves as Chairman. The Trustees have determined that an interested Chairman is appropriate and benefits shareholders because an interested Chairman has a personal and professional stake in the quality and continuity of services provided to the fund. Independent Trustees exercise their informed business judgment to appoint an individual of their choosing to serve as Chairman, regardless of whether the Trustee happens to be independent or a member of management. The Independent Trustees have determined that they can act independently and effectively without having an Independent Trustee serve as Chairman and that a key structural component for assuring that they are in a position to do so is for the Independent Trustees to constitute a substantial majority for the Board. The Independent Trustees also regularly meet in executive session. Ned C. Lautenbach serves as Chairman of the Independent Trustees and as such (i) acts as a liaison between the Independent Trustees and management with respect to matters important to the Independent Trustees and (ii) with management prepares agendas for Board meetings.
Fidelity funds are overseen by different Boards of Trustees. The fund's Board oversees Fidelity's equity and high income funds and another Board oversees Fidelity's investment-grade bond, money market, and asset allocation funds. The asset allocation funds may invest in Fidelity funds overseen by the fund's Board. The use of separate Boards, each with its own committee structure, allows the Trustees of each group of Fidelity funds to focus on the unique issues of the funds they oversee, including common research, investment, and operational issues. On occasion, the separate Boards establish joint committees to address issues of overlapping consequences for the Fidelity funds overseen by each Board.
The Trustees operate using a system of committees to facilitate the timely and efficient consideration of all matters of importance to the Trustees, the fund, and fund shareholders and to facilitate compliance with legal and regulatory requirements and oversight of the fund's activities and associated risks. The Board, acting through its committees, has charged FMR and its affiliates with (i) identifying events or circumstances the occurrence of which could have demonstrably adverse effects on the fund's business and/or reputation; (ii) implementing processes and controls to lessen the possibility that such events or circumstances occur or to mitigate the effects of such events or circumstances if they do occur; and (iii) creating and maintaining a system designed to evaluate continuously business and market conditions in order to facilitate the identification and implementation processes described in (i) and (ii) above. Because the day-to-day operations and activities of the fund are carried out by or through FMR, its affiliates and other service providers, the fund's exposure to risks is mitigated but not eliminated by the processes overseen by the Trustees. While each of the Board's committees has responsibility for overseeing different aspects of the fund's activities, oversight is exercised primarily through the Operations, Audit, and Compliance Committees. In addition, the Independent Trustees have worked with FMR to enhance the Board's oversight of investment and financial risks, legal and regulatory risks, technology risks, and operational risks, including the development of additional risk reporting to the Board. For example, a working group comprised of Independent Trustees and FMR has worked and continues to work to review the Fidelity funds' valuation-related activities, reporting and risk management. Appropriate personnel, including but not limited to the fund's Chief Compliance Officer (CCO), FMR's internal auditor, the independent accountants, the fund's Treasurer and portfolio management personnel, make periodic reports to the Board's committees, as appropriate, including an annual review of FMR's risk management program for the Fidelity funds. The responsibilities of each standing committee, including their oversight responsibilities, are described further under "Standing Committees of the Fund's Trustees."
Annual Report
Trustees and Officers - continued
The fund's Statement of Additional Information (SAI) includes more information about the Trustees. To request a free copy, call Fidelity at 1-877-208-0098.
Interested Trustees*:
Correspondence intended for each Trustee who is an interested person may be sent to Fidelity Investments, 82 Devonshire Street, Boston, Massachusetts 02109.
Name, Age; Principal Occupations and Other Relevant Experience+ |
James C. Curvey (77) |
| Year of Election or Appointment: 2007 Mr. Curvey is Trustee and Chairman of the Board of Trustees of certain Trusts. Mr. Curvey also serves as Trustee (2007-present) of other investment companies advised by FMR. Mr. Curvey is a Director of Fidelity Investments Money Management, Inc. (2009-present), Director of Fidelity Research & Analysis Co. (2009-present) and Director of FMR and FMR Co., Inc. (2007-present). Mr. Curvey is also Vice Chairman (2007-present) and Director of FMR LLC. In addition, Mr. Curvey serves as an Overseer for the Boston Symphony Orchestra and a member of the Trustees of Villanova University. Previously, Mr. Curvey was the Vice Chairman (2006-2007) and Director (2000-2007) of FMR Corp. |
Ronald P. O'Hanley (55) |
| Year of Election or Appointment: 2011 Mr. O'Hanley is Director of FMR Co., Inc. (2010-present), Director of Fidelity Investments Money Management, Inc. (2010-present), Director of Fidelity Research & Analysis Company (2010-present), President of Fidelity Asset Management and Corporate Services and a member of Fidelity's Executive Committee (2010-present). Previously, Mr. O'Hanley served as President and Chief Executive Officer of BNY Mellon Asset Management (2007-2010). Mr. O'Hanley also served as Vice Chairman of Bank New York Mellon Corp. and a member of that firm's Executive Committee. Prior to the 2007 merger of The Bank of New York and Mellon Financial Corporation, he was Vice Chairman of Mellon Financial Corporation and President and Chief Executive Officer of Mellon Asset Management. He joined Mellon in February 1997. Mr. O'Hanley currently serves as Chairman of the Boston Public Library Foundation Board of Directors and sits on the Board of Directors of Beth Israel Deaconess Medical Center, the Board of Trustees of the Marine Biological Laboratory and the Advisory Board of the Maxwell School of Citizenship and Public Administration at Syracuse University. Mr. O'Hanley also chairs the Council on Asset Management for the Financial Services Roundtable and is a member of the Board of Directors of Institutional Investor's U.S. Institute. |
* Trustees have been determined to be "Interested Trustees" by virtue of, among other things, their affiliation with the trust or various entities under common control with FMR.
+ The information above includes each Trustee's principal occupation during the last five years and other information relating to the experience, attributes, and skills relevant to each Trustee's qualifications to serve as a Trustee, which led to the conclusion that each Trustee should serve as a Trustee for the fund.
Independent Trustees:
Correspondence intended for each Independent Trustee (that is, the Trustees other than the Interested Trustees) may be sent to Fidelity Investments, P.O. Box 55235, Boston, Massachusetts 02205-5235.
Name, Age; Principal Occupations and Other Relevant Experience+ |
Dennis J. Dirks (64) |
| Year of Election or Appointment: 2005 Prior to his retirement in May 2003, Mr. Dirks was Chief Operating Officer and a member of the Board of The Depository Trust & Clearing Corporation (DTCC). He also served as President, Chief Operating Officer, and Board member of The Depository Trust Company (DTC) and President and Board member of the National Securities Clearing Corporation (NSCC). In addition, Mr. Dirks served as Chief Executive Officer and Board member of the Government Securities Clearing Corporation, Chief Executive Officer and Board member of the Mortgage-Backed Securities Clearing Corporation, as a Trustee and a member of the Finance Committee of Manhattan College (2005-2008), and as a Trustee and a member of the Finance Committee of AHRC of Nassau County (2006-2008). Mr. Dirks is a member of the Independent Directors Council (IDC) Governing Council (2010-present) and Board of Directors for The Brookville Center for Children's Services, Inc. (2009-present). |
Alan J. Lacy (59) |
| Year of Election or Appointment: 2008 Mr. Lacy serves as Senior Adviser (2007-present) of Oak Hill Capital Partners, L.P. (private equity). Mr. Lacy also served as Chief Executive Officer (2000-2005) and Vice Chairman (2005-2006) of Sears Holdings Corporation and Sears, Roebuck and Co. (retail). In addition, Mr. Lacy serves as a member of the Board of Directors of Dave & Buster's Entertainment, Inc. (restaurant and entertainment complexes, 2010-present), Earth Fare, Inc. (retail grocery, 2012-present), The Hillman Companies, Inc. (hardware wholesalers, 2010-present), and Bristol-Myers Squibb Company (global pharmaceuticals, 2008-present). Mr. Lacy is a member of the Board of Trustees of The National Parks Conservation Association (2006-present). Previously, Mr. Lacy served as Chairman of the Board of Trustees of the National Parks Conservation Association (2008-2011) and as a member of the Board of Directors for the Western Union Company (global money transfer, 2006-2011). |
Ned C. Lautenbach (68) |
| Year of Election or Appointment: 2000 Mr. Lautenbach is Chairman of the Independent Trustees of the Equity and High Income Funds (2006-present). Mr. Lautenbach currently serves as the Lead Director of the Eaton Corporation Board of Directors (diversified industrial, 1997-present). Mr. Lautenbach is Chairman of the Board of Directors of the Philharmonic Center for the Arts in Naples, Florida (2012-present) and a member of the Council on Foreign Relations (1994-present). Previously, Mr. Lautenbach was a Partner/Advisory Partner at Clayton, Dubilier & Rice, LLC (private equity investment, 1998-2010), as well as a Director of Sony Corporation (2006-2007). |
Joseph Mauriello (68) |
| Year of Election or Appointment: 2008 Prior to his retirement in January 2006, Mr. Mauriello served in numerous senior management positions including Deputy Chairman and Chief Operating Officer (2004-2005), and Vice Chairman of Financial Services (2002-2004) of KPMG LLP US (professional services, 1965-2005). Mr. Mauriello currently serves as a member of the Board of Directors of XL Group plc. (global insurance and re-insurance, 2006-present). Previously, Mr. Mauriello served as a Director of the Hamilton Funds of the Bank of New York (2006-2007) and of Arcadia Resources Inc. (health care services and products, 2007-2012). |
Robert W. Selander (62) |
| Year of Election or Appointment: 2011 Previously, Mr. Selander served as a Member of the Advisory Board of Fidelity's Equity and High Income Funds (2011), Executive Vice Chairman (2010), Chief Executive Officer (2009-2010), and President and Chief Executive Officer (1997-2009) of Mastercard, Inc. |
Cornelia M. Small (68) |
| Year of Election or Appointment: 2005 Ms. Small is a member of the Board of Directors (2009-present) and Chair of the Investment Committee (2010-present) of the Teagle Foundation. Ms. Small also serves on the Investment Committee of the Berkshire Taconic Community Foundation (2008-present). Previously, Ms. Small served as Chairperson (2002-2008) and a member of the Investment Committee and Chairperson (2008-2012) and a member of the Board of Trustees of Smith College. In addition, Ms. Small served as Chief Investment Officer, Director of Global Equity Investments, and a member of the Board of Directors of Scudder, Stevens & Clark and Scudder Kemper Investments. |
William S. Stavropoulos (73) |
| Year of Election or Appointment: 2001 Mr. Stavropoulos is Vice Chairman of the Independent Trustees of the Equity and High Income Funds (2006-present). Mr. Stavropoulos serves as President and Founder of the Michigan Baseball Foundation, the Great Lakes Loons (2007-present). Mr. Stavropoulos is Chairman Emeritus of the Board of Directors of The Dow Chemical Company, where he previously served in numerous senior management positions, including President, CEO (1995-2000; 2002-2004), Chairman of the Executive Committee (2000-2006), and as a member of the Board of Directors (1990-2006). Currently, Mr. Stavropoulos is a Director of Univar Inc. (global distributor of commodity and specialty chemicals, Chairman from 2010-May 2012 and Lead Director from May 2012-present), Teradata Corporation (data warehousing and technology solutions, 2008-present), Maersk Inc. (industrial conglomerate), and Tyco International, Ltd. (multinational manufacturing and services, 2007-present), and a member of the Advisory Board for Metalmark Capital LLC (private equity investment, 2005-present). Mr. Stavropoulos is an operating advisor to Clayton, Dubilier & Rice, LLC (private equity investment). In addition, Mr. Stavropoulos is a member of the University of Notre Dame Advisory Council for the College of Science, a Trustee of the Rollin L. Gerstacker Foundation, and a Director of the Naples Philharmonic Center for the Arts. Previously, Mr. Stavropoulos served as a Director of Chemical Financial Corporation (bank holding company, 1993-2012). |
David M. Thomas (63) |
| Year of Election or Appointment: 2008 Previously, Mr. Thomas served as Executive Chairman (2005-2006) and Chairman and Chief Executive Officer (2000-2005) of IMS Health, Inc. (pharmaceutical and healthcare information solutions), and a Director of Fortune Brands, Inc. (consumer products, 2000-2011). In addition, Mr. Thomas serves as Non-Executive Chairman of the Board of Directors of Fortune Brands Home and Security (home and security products, 2011-present), and as a member of the Board of Directors of Interpublic Group of Companies, Inc. (marketing communication, 2004-present). |
Michael E. Wiley (62) |
| Year of Election or Appointment: 2008 Mr. Wiley also serves as a Director of Asia Pacific Exploration Consolidated (international oil and gas exploration and production, 2008-present). Mr. Wiley serves as a Director of Tesoro Corporation (independent oil refiner and marketer, 2005-present), and a Director of Bill Barrett Corporation (exploration and production, 2005-present). In addition, Mr. Wiley also serves as a Director of Post Oak Bank (privately-held bank, 2004-present). Previously, Mr. Wiley served as a member of the Board of Trustees of the University of Tulsa (2000-2006; 2007-2010), as a Senior Energy Advisor of Katzenbach Partners, LLC (consulting, 2006-2007), as an Advisory Director of Riverstone Holdings (private investment), Chairman, President, and CEO of Baker Hughes, Inc. (oilfield services, 2000-2004), and as Director of Spinnaker Exploration Company (exploration and production, 2001-2005). |
+ The information above includes each Trustee's principal occupation during the last five years and other information relating to the experience, attributes, and skills relevant to each Trustee's qualifications to serve as a Trustee, which led to the conclusion that each Trustee should serve as a Trustee for the fund.
Advisory Board Members and Executive Officers:
Correspondence intended for David A. Rosow and Garnett A. Smith may be sent to Fidelity Investments, P.O. Box 55235, Boston, Massachusetts 02205-5235. Correspondence intended for each executive officer, Edward C. Johnson 3d, and Peter S. Lynch may be sent to Fidelity Investments, 82 Devonshire Street, Boston, Massachusetts 02109.
Name, Age; Principal Occupation |
Edward C. Johnson 3d (82) |
| Year of Election or Appointment: 2011 Member of the Advisory Board of Fidelity's Equity and High Income Funds. Mr. Johnson serves as Chief Executive Officer, Chairman, and a Director of FMR LLC, and also serves as Chairman and Director of FIL Limited. Previously, Mr. Johnson served as a Trustee and Chairman of the Board of certain Fidelity Trusts, Chairman and a Director of FMR, Chairman and a Director of FMR Co., Inc., and President of FMR LLC (2006-2007). |
Peter S. Lynch (68) |
| Year of Election or Appointment: 2003 Member of the Advisory Board of Fidelity's Equity and High Income Funds. Mr. Lynch is Vice Chairman and a Director of FMR and FMR Co., Inc. In addition, Mr. Lynch serves as a Trustee of Boston College and as the Chairman of the Inner-City Scholarship Fund. Previously, Mr. Lynch served on the Special Olympics International Board of Directors (1997-2006). |
David A. Rosow (70) |
| Year of Election or Appointment: 2012 Member of the Advisory Board of Fidelity's Equity and High Income Funds. Chairman and Chief Executive Officer of International Golf Group, Inc. (golf course development, 1989-present). Previously, Mr. Rosow served as Chairman and Chief Executive Officer of Rosow & Company, Inc. (private investment company, 1989-2011), a Lead Director of Hudson United Bancorp (2001-2006) and as a Director of TD Banknorth (1996-2006). In addition, Mr. Rosow is a member (2008-present) and President (2009-present) of the Town Council of Palm Beach, Florida. |
Garnett A. Smith (65) |
| Year of Election or Appointment: 2012 Member of the Advisory Board of Fidelity's Equity and High Income Funds. Prior to Mr. Smith's retirement, he served as Chairman and Chief Executive Officer of Inbrand Corp. (manufacturer of personal absorbent products, 1990-1997). He also served as President (1986-1990) of Inbrand Corp. Prior to his employment with Inbrand Corp., he was employed by a retail fabric chain and North Carolina National Bank. In addition, Mr. Smith is a board member of the Jackson Hole Land Trust (2009-present). |
Kenneth B. Robins (43) |
| Year of Election or Appointment: 2008 President and Treasurer of Fidelity's Equity and High Income Funds. Mr. Robins also serves as President and Treasurer (2010-present) and Assistant Treasurer (2009-present) of other Fidelity funds and is an employee of Fidelity Investments (2004-present). Previously, Mr. Robins served as Deputy Treasurer of the Fidelity funds (2005-2008) and Treasurer and Chief Financial Officer of The North Carolina Capital Management Trust: Cash and Term Portfolios (2006-2008). |
Bruce T. Herring (47) |
| Year of Election or Appointment: 2006 Vice President of certain Equity Funds. Mr. Herring also serves as President of Fidelity Research & Analysis Company (2010-present), Chief Investment Officer and Director of Fidelity Management & Research (U.K.) Inc. (2010-present) and Group Chief Investment Officer of FMR. Previously, Mr. Herring served as Vice President (2005-2006) and Senior Vice President (2006-2007) of Fidelity Management & Research Company, Vice President of FMR Co., Inc. (2001-2007) and as a portfolio manager for Fidelity U.S. Equity Funds. |
Brian B. Hogan (48) |
| Year of Election or Appointment: 2009 Vice President of Equity and High Income Funds. Mr. Hogan also serves as President of FMR's Equity Division (2009-present). Previously, Mr. Hogan served as Senior Vice President, Equity Research of FMR (2006-2009) and as a portfolio manager. |
Scott C. Goebel (44) |
| Year of Election or Appointment: 2008 Secretary and Chief Legal Officer (CLO) of the Fidelity funds. Mr. Goebel also serves as Secretary of Fidelity Investments Money Management, Inc. (FIMM) (2010-present) and Fidelity Research and Analysis Company (FRAC) (2010-present); Secretary and CLO of The North Carolina Capital Management Trust: Cash and Term Portfolios (2008-present); General Counsel, Secretary, and Senior Vice President of FMR (2008-present) and FMR Co., Inc. (2008-present); employed by FMR LLC or an affiliate (2001-present); Chief Legal Officer of Fidelity Management & Research (Hong Kong) Limited (2008-present) and Assistant Secretary of Fidelity Management & Research (Japan) Inc. (2008-present), and Fidelity Management & Research (U.K.) Inc. (2008-present). Previously, Mr. Goebel served as Assistant Secretary of FIMM (2008-2010), FRAC (2008-2010), and the Funds (2007-2008) and as Vice President and Secretary of Fidelity Distributors Corporation (FDC) (2005-2007). |
William C. Coffey (43) |
| Year of Election or Appointment: 2009 Assistant Secretary of Fidelity's Equity and High Income Funds. Mr. Coffey also serves as Senior Vice President and Deputy General Counsel of FMR LLC (2010-present), and is an employee of Fidelity Investments. Previously, Mr. Coffey served as Vice President and Associate General Counsel of FMR LLC (2005-2009). |
Elizabeth Paige Baumann (44) |
| Year of Election or Appointment: 2012 Anti-Money Laundering (AML) Officer of the Fidelity funds. Ms. Baumann also serves as AML Officer of The North Carolina Capital Management Trust: Cash and Term Portfolios (2012-present), Chief AML Officer of FMR LLC (2012-present), and is an employee of Fidelity Investments. Previously, Ms. Baumann served as Vice President and Deputy Anti-Money Laundering Officer (2007-2012). |
Christine Reynolds (54) |
| Year of Election or Appointment: 2008 Chief Financial Officer of the Fidelity funds. Ms. Reynolds became President of Fidelity Pricing and Cash Management Services (FPCMS) in August 2008. Ms. Reynolds served as Chief Operating Officer of FPCMS (2007-2008). Previously, Ms. Reynolds served as President, Treasurer, and Anti-Money Laundering officer of the Fidelity funds (2004-2007). |
Joseph A. Hanlon (44) |
| Year of Election or Appointment: 2012 Chief Compliance Officer of Fidelity's Equity and High Income Funds. Mr. Hanlon serves as Compliance Officer of FMR, FMR Co., Inc., Fidelity Investments Money Management, Inc. (FIMM), Fidelity Research and Analysis Company (FRAC), Fidelity Management & Research (Japan) Inc., Fidelity Management & Research (U.K.) Inc., Fidelity Management & Research (Hong Kong), and Strategic Advisers, Inc. (2009-present), as Senior Vice President of the Fidelity Asset Management Division (2009-present), and is an employee of Fidelity Investments. |
Joseph F. Zambello (55) |
| Year of Election or Appointment: 2011 Deputy Treasurer of the Fidelity funds. Mr. Zambello is an employee of Fidelity Investments. Previously, Mr. Zambello served as Vice President of FMR's Program Management Group (2009-2011) and Vice President of the Transfer Agent Oversight Group (2005-2009). |
Adrien E. Deberghes (45) |
| Year of Election or Appointment: 2008 Deputy Treasurer of Fidelity's Equity and High Income Funds. Mr. Deberghes also serves as Vice President (2011-present) and Assistant Treasurer (2010-present) of other Fidelity funds, and is an employee of Fidelity Investments (2008-present). Previously, Mr. Deberghes served as Senior Vice President of Mutual Fund Administration at State Street Corporation (2007-2008), Senior Director of Mutual Fund Administration at Investors Bank & Trust (2005-2007), and Director of Finance for Dunkin' Brands (2000-2005). |
Stephen Sadoski (41) |
<R> | Year of Election or Appointment: 2012</R> Deputy Treasurer of Fidelity's Equity and High Income Funds. Mr. Sadoski also serves as Assistant Treasurer of other Fidelity funds (2012-present) and is an employee of Fidelity Investments (2012-present). Previously, Mr. Sadoski served as an assistant chief accountant in the Division of Investment Management of the Securities and Exchange Commission (SEC) (2009-2012) and as a senior manager at Deloitte & Touche (1997-2009). |
Stephanie J. Dorsey (43) |
| Year of Election or Appointment: 2010 Assistant Treasurer of Fidelity's Equity and High Income Funds. Ms. Dorsey also serves as Deputy Treasurer of other Fidelity funds (2008-present) and is an employee of Fidelity Investments (2008-present). Previously, Ms. Dorsey served as Treasurer (2004-2008) of the JPMorgan Mutual Funds and Vice President (2004-2008) of JPMorgan Chase Bank. |
John R. Hebble (54) |
| Year of Election or Appointment: 2009 Assistant Treasurer of Fidelity's Equity and High Income Funds. Mr. Hebble also serves as President (2011-present), Treasurer, and Chief Financial Officer of The North Carolina Capital Management Trust: Cash and Term Portfolios (2008-present), President and Treasurer of other Fidelity funds (2008-present) and is an employee of Fidelity Investments. |
Gary W. Ryan (54) |
| Year of Election or Appointment: 2005 Assistant Treasurer of the Fidelity funds. Mr. Ryan is an employee of Fidelity Investments. Previously, Mr. Ryan served as Vice President of Fund Reporting in Fidelity Pricing and Cash Management Services (FPCMS) (1999-2005). |
Jonathan Davis (44) |
| Year of Election or Appointment: 2010 Assistant Treasurer of the Fidelity funds. Mr. Davis is also Assistant Treasurer of Fidelity Rutland Square Trust II and Fidelity Commonwealth Trust II. Mr. Davis is an employee of Fidelity Investments. Previously, Mr. Davis served as Vice President and Associate General Counsel of FMR LLC (2003-2010). |
Annual Report
Class A designates 91% and Class T designates 100% of the dividends distributed in during the fiscal year as amounts which may be taken into account as a dividend for purposes of the maximum rate under section 1(h)(11) of the Internal Revenue Code.
The amounts per share which represent income derived from sources within, and taxes paid to, foreign countries or possessions of the United States are as follows:
| Pay Date | Income | Taxes |
Class A | 12/05/2011 | $0.274 | $0.0863 |
| | | |
Class T | 12/05/2011 | $0.169 | $0.0863 |
| | | |
Class B | 12/05/2011 | $0.000 | $0.0000 |
| | | |
Class C | 12/05/2011 | $0.000 | $0.0000 |
The fund will notify shareholders in January 2013 of amounts for use in preparing 2012 income tax returns.
Annual Report
Board Approval of Investment Advisory Contracts and Management Fees
Fidelity China Region Fund
Each year, the Board of Trustees, including the Independent Trustees (together, the Board), votes on the renewal of the management contract and sub-advisory agreements (together, the Advisory Contracts) for the fund. The Board, assisted by the advice of fund counsel and Independent Trustees' counsel, requests and considers a broad range of information relevant to the renewal of the Advisory Contracts throughout the year.
The Board meets regularly and, at each of its meetings, considers factors that are relevant to its annual consideration of the renewal of the fund's Advisory Contracts, including the services and support provided to the fund and its shareholders. The Board has established various standing committees, each composed of and chaired by Independent Trustees with varying backgrounds, to which the Board has assigned specific subject matter responsibilities in order to enhance effective decision-making by the Board. The Board, acting directly and through its Committees, requests and receives information concerning the annual consideration of the renewal of the fund's Advisory Contracts. The Board also meets as needed to consider matters specifically related to the Board's annual consideration of the renewal of Advisory Contracts. Members of the Board may also meet with trustees of other Fidelity funds through ad hoc joint committees to discuss certain matters relevant to the Fidelity funds.
At its July 2012 meeting, the Board of Trustees, including the Independent Trustees, unanimously determined to renew the fund's Advisory Contracts. In reaching its determination, the Board considered all factors it believed relevant, including (i) the nature, extent, and quality of the services to be provided to the fund and its shareholders (including the investment performance of the fund); (ii) the competitiveness of the fund's management fee and total expense ratio relative to peer funds; (iii) the total costs of the services to be provided by and the profits to be realized by Fidelity from its relationship with the fund; (iv) the extent to which economies of scale exist and would be realized as the fund grows; and (v) whether fee levels reflect these economies of scale, if any, for the benefit of fund shareholders.
In considering whether to renew the Advisory Contracts for the fund, the Board reached a determination, with the assistance of fund counsel and Independent Trustees' counsel and through the exercise of its business judgment, that the renewal of the Advisory Contracts is in the best interests of the fund and its shareholders and that the compensation payable under the Advisory Contracts is fair and reasonable. The Board's decision to renew the Advisory Contracts was not based on any single factor, but rather was based on a comprehensive consideration of all the information provided to the Board at its meetings throughout the year. The Board, in reaching its determination to renew the Advisory Contracts, is aware that shareholders in the fund have a broad range of investment choices available to them, including a wide choice among mutual funds offered by Fidelity's competitors, and that the fund's shareholders, who have the opportunity to review and weigh the disclosure provided by the fund in its prospectus and other public disclosures, have chosen to invest in this fund, managed by Fidelity.
Nature, Extent, and Quality of Services Provided. The Board considered the staffing within the investment adviser, FMR, and the sub-advisers (together, the Investment Advisers), including the backgrounds of the fund's investment personnel, and also considered the fund's investment objective, strategies, and related investment philosophy. The Independent Trustees also had discussions with senior management of Fidelity's investment operations and investment groups. The Board considered the structure of the portfolio manager compensation program and whether this structure provides appropriate incentives to act in the best interests of the fund.
Resources Dedicated to Investment Management and Support Services. The Board and the Fund Oversight and Research Committees reviewed the general qualifications and capabilities of the Investment Advisers' investment staff, including its size, education, experience, and resources, as well as the Investment Advisers' approach to recruiting, training, managing, and compensating investment personnel. The Board also noted that FMR has continued to increase the resources devoted to non-U.S. offices, including expansion of Fidelity's global investment organization. The Board noted that Fidelity's analysts have extensive resources, tools and capabilities that allow them to conduct sophisticated quantitative and fundamental analysis, as well as credit analysis of issuers, counterparties and guarantors. The Board also believes that Fidelity's investment professionals have sufficient access to global information and data so as to provide competitive investment results over time, and that those professionals also have access to sophisticated tools that permit them to assess portfolio construction and risk and performance attribution characteristics continuously, as well as to transmit new information and research conclusions rapidly around the world. Additionally, in its deliberations, the Board considered the Investment Advisers' trading and risk management capabilities and resources, which are an integral part of the investment management process.
Shareholder and Administrative Services. The Board considered (i) the nature, extent, quality, and cost of advisory, administrative, and shareholder services performed by the Investment Advisers and their affiliates under the Advisory Contracts and under separate agreements covering transfer agency, pricing and bookkeeping, and securities lending services for the fund; (ii) the nature and extent of the supervision of third party service providers, principally custodians and subcustodians; and (iii) the resources devoted to, and the record of compliance with, the fund's compliance policies and procedures. The Board also reviewed the allocation of fund brokerage, including allocations to brokers affiliated with the Investment Advisers, the use of brokerage commissions to pay fund expenses, and the use of "soft" commission dollars to pay for research services.
The Board noted that the growth of fund assets over time across the complex allows Fidelity to reinvest in the development of services designed to enhance the value or convenience of the Fidelity funds as investment vehicles. These services include 24-hour access to account information and market information through telephone representatives and over the Internet, investor education materials and asset allocation tools, and the expanded availability of Fidelity Investor Centers.
Annual Report
Investment in a Large Fund Family. The Board considered the benefits to shareholders of investing in a Fidelity fund, including the benefits of investing in a fund that is part of a large family of funds offering a variety of investment disciplines and providing a large variety of mutual fund investor services. The Board noted that Fidelity had taken, or had made recommendations that resulted in the Fidelity funds taking, a number of actions over the previous year that benefited particular funds, including (i) continuing to dedicate additional resources to investment research and support of the senior management team that oversees asset management; (ii) persisting in efforts to enhance Fidelity's research capabilities, in particular, international research; (iii) launching new funds and making other enhancements to meet client needs for global and income-oriented solutions; (iv) continuing to launch dedicated lower cost underlying funds to meet investment management's portfolio construction needs related to expanding underlying fund options, specifically for the Freedom Fund product lines; (v) adopting a "Stock Selector" sector neutral investment approach and employing a team of portfolio managers who are sector specialists to manage certain funds; (vi) rationalizing product lines and gaining increased efficiencies through the mergers of several funds into other funds; (vii) strengthening the Spartan Index Fund product line by adding new funds and/or new low-cost institutional share classes, restructuring fund expenses to accommodate new classes, and reducing investment minimums for certain classes of shares; (viii) modifying the eligibility criteria for Institutional Class shares to increase their appeal to government entities and charitable investors; and (ix) reducing certain transfer agent fee rates.
Investment Performance. The Board considered whether the fund has operated in accordance with its investment objective, as well as its record of compliance with its investment restrictions. It also reviewed the fund's absolute investment performance for each class, as well as the fund's relative investment performance for each class measured over multiple periods against a broad-based securities market index. The Board noted that FMR believes that no meaningful peer group exists for the fund. The following charts considered by the Board show, over the one-, three-, and five-year periods ended December 31, 2011, as available, the cumulative total returns of the retail class and Class B of the fund and the cumulative total returns of a broad-based securities market index ("benchmark"). The returns of the retail class and Class B show the performance of the highest performing class (based on five-year performance) and the lowest performing class (based on three-year performance), respectively.
Fidelity China Region Fund

The Board noted that the investment performance of the retail class of the fund compared favorably to its benchmark for the three- and five-year periods, although the fund's one-year total return was lower than its benchmark. The Board considered that the variations in performance among the fund's classes reflect the variations in class expenses, which result in lower performance for higher expense classes. The Board noted that there was a portfolio management change for the fund in October 2011. The Board also reviewed the fund's performance since inception as well as performance in the current year.
Based on its review, the Board concluded that the nature, extent, and quality of services provided to the fund under the Advisory Contracts should benefit the fund's shareholders.
Competitiveness of Management Fee and Total Expense Ratio. The Board considered the fund's management fee and total expense ratio compared to "mapped groups" of competitive funds and classes. Fidelity creates "mapped groups" by combining similar Lipper investment objective categories that have comparable management fee characteristics. Combining Lipper investment objective categories aids the Board's management fee and total expense ratio comparisons by broadening the competitive group used for comparison and by reducing the number of universes to which various Fidelity funds are compared.
Annual Report
Board Approval of Investment Advisory Contracts and Management Fees - continued
Management Fee. The Board considered two proprietary management fee comparisons for the 12-month periods shown in the chart below. The group of Lipper funds used by the Board for management fee comparisons is referred to below as the "Total Mapped Group." The Total Mapped Group comparison focuses on a fund's standing relative to the total universe of comparable funds available to investors in terms of gross management fees before expense reimbursements or caps. "TMG %" represents the percentage of funds in the Total Mapped Group that had management fees that were lower than the fund's. For example, a TMG % of 7% means that 93% of the funds in the Total Mapped Group had higher management fees than the fund. The "Asset-Size Peer Group" (ASPG) comparison focuses on a fund's standing relative to non-Fidelity funds similar in size to the fund within the Total Mapped Group. The ASPG represents at least 15% of the funds in the Total Mapped Group with comparable asset size and management fee characteristics, subject to a minimum of 50 funds (or all funds in the Total Mapped Group if fewer than 50). Additional information, such as the ASPG quartile in which the fund's management fee ranked, is also included in the chart and considered by the Board.
Fidelity China Region Fund
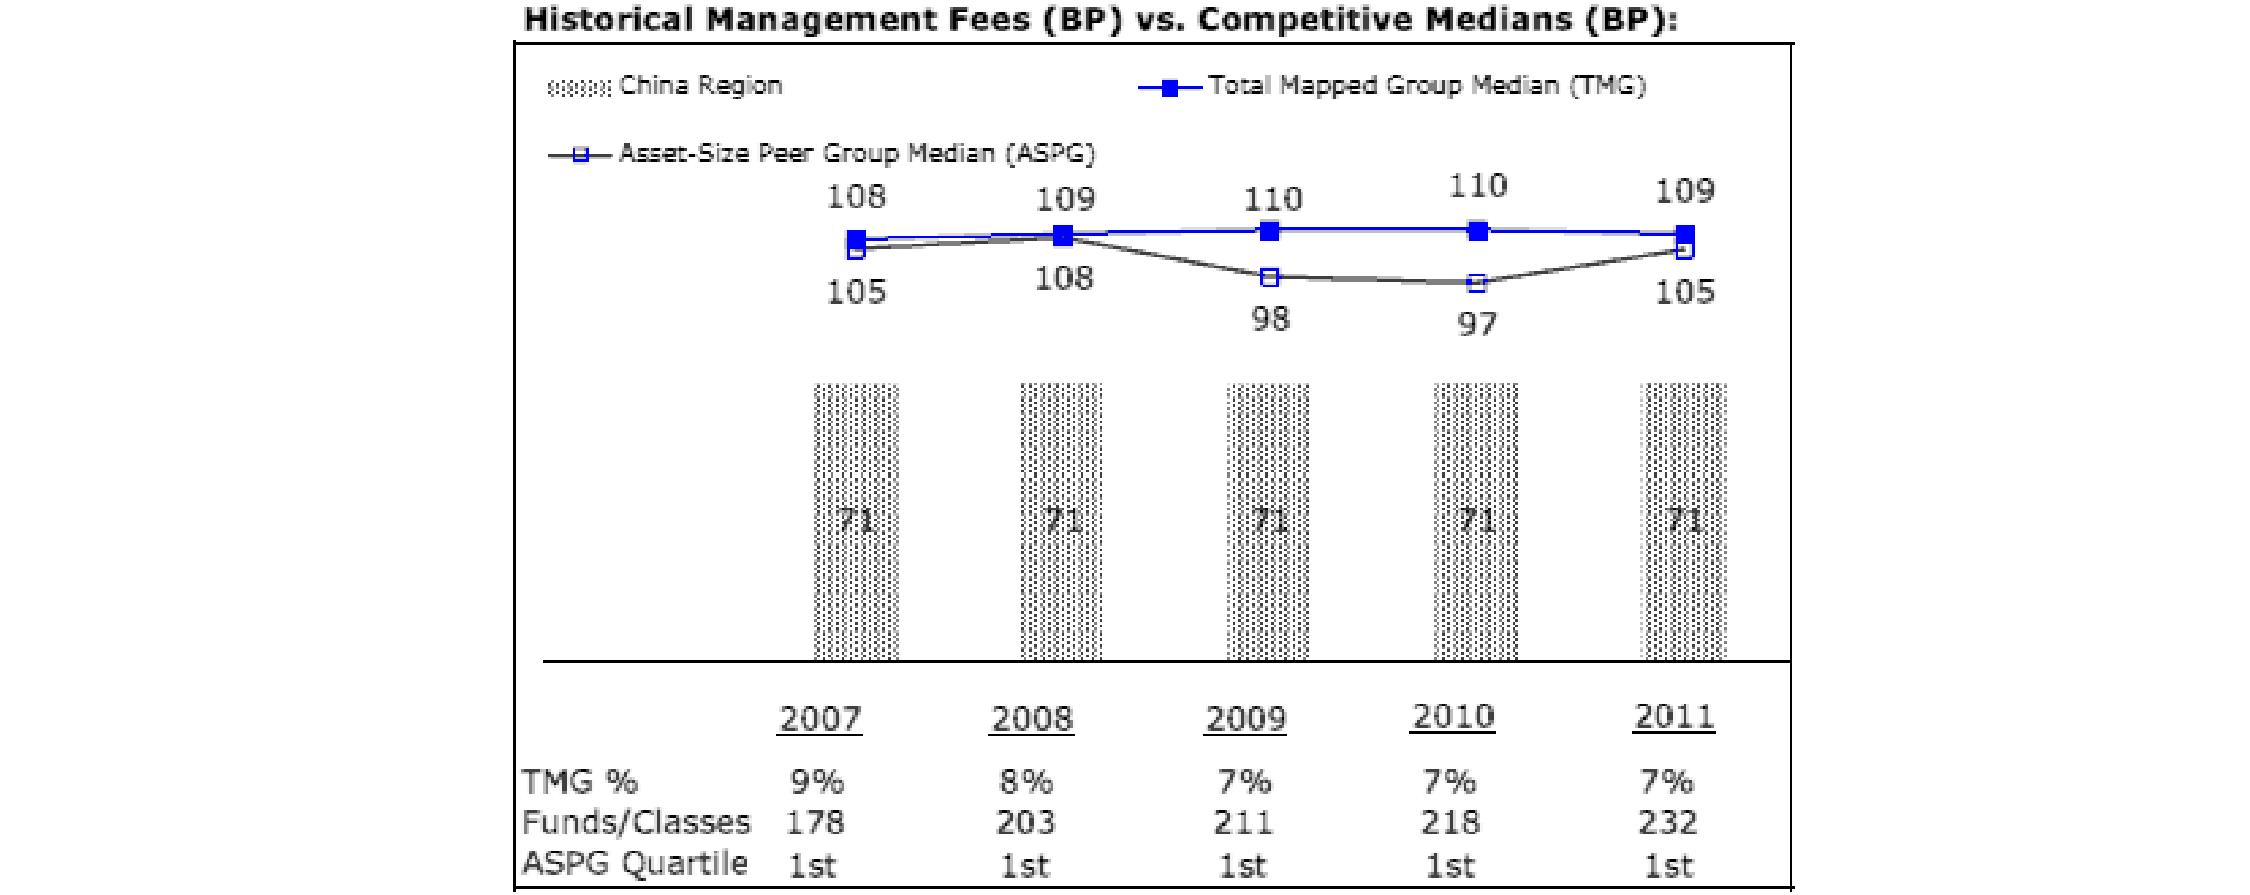
The Board noted that the fund's management fee ranked below the median of its Total Mapped Group and below the median of its ASPG for 2011.
Based on its review, the Board concluded that the fund's management fee is fair and reasonable in light of the services that the fund receives and the other factors considered.
Total Expense Ratio. In its review of each class's total expense ratio, the Board considered the fund's management fee as well as other fund or class expenses, as applicable, such as transfer agent fees, pricing and bookkeeping fees, fund-paid 12b-1 fees, and custodial, legal, and audit fees. The Board also noted the effects of any waivers and reimbursements on fees and expenses. As part of its review, the Board also considered the current and historical total expense ratios of each class of the fund compared to competitive fund median expenses. Each class of the fund is compared to those funds and classes in the Total Mapped Group (used by the Board for management fee comparisons) that have a similar sales load structure.
The Board noted that the total expense ratio of each class ranked below its competitive median for 2011.
Fees Charged to Other Fidelity Clients. The Board also considered Fidelity fee structures and other information with respect to clients of FMR and its affiliates, such as other mutual funds advised or subadvised by FMR or its affiliates, pension plan clients, and other institutional clients. The Board noted the findings of the 2010 ad hoc joint committee (created with the board of other Fidelity funds), which reviewed and compared Fidelity's institutional investment advisory business with its business of providing services to the Fidelity funds, including the differences in services provided, fees charged, and costs incurred, as well as competition in their respective marketplaces.
Based on its review of total expense ratios and fees charged to other Fidelity clients, the Board concluded that the total expense ratio of each class of the fund was reasonable in light of the services that the fund and its shareholders receive and the other factors considered.
Costs of the Services and Profitability. The Board considered the revenues earned and the expenses incurred by Fidelity in conducting the business of developing, marketing, distributing, managing, administering and servicing the fund and its shareholders. The Board also considered the level of Fidelity's profits in respect of all the Fidelity funds.
On an annual basis, FMR presents to the Board Fidelity's profitability for the fund. Fidelity calculates the profitability for each fund, as well as aggregate profitability for groups of Fidelity funds and all Fidelity funds, using a series of detailed revenue and cost allocation methodologies which originate with the books and records of Fidelity on which Fidelity's audited financial statements are based. The Audit Committee of the Board reviews any significant changes from the prior year's methodologies.
Annual Report
PricewaterhouseCoopers LLP (PwC), independent registered public accounting firm and auditor to Fidelity and certain Fidelity funds, has been engaged annually by the Board as part of the Board's assessment of Fidelity's profitability analysis. PwC's engagement includes the review and assessment of Fidelity's methodologies used in determining the revenues and expenses attributable to Fidelity's mutual fund business, and completion of agreed-upon procedures surrounding the mathematical accuracy of fund profitability and its conformity to allocation methodologies. After considering PwC's reports issued under the engagement and information provided by Fidelity, the Board concluded that while other allocation methods may also be reasonable, Fidelity's profitability methodologies are reasonable in all material respects.
The Board also reviewed Fidelity's non-fund businesses and fall-out benefits related to the mutual fund business as well as cases where Fidelity's affiliates may benefit from or be related to the fund's business.
The Board considered the costs of the services provided by and the profits realized by Fidelity in connection with the operation of the fund and was satisfied that the profitability was not excessive in the circumstances.
Economies of Scale. The Board considered whether there have been economies of scale in respect of the management of the Fidelity funds, whether the Fidelity funds (including the fund) have appropriately benefited from any such economies of scale, and whether there is potential for realization of any further economies of scale. The Board considered the extent to which the fund will benefit from economies of scale through increased services to the fund, through waivers or reimbursements, or through fee or expense reductions. The Board also noted that in 2009, it and the board of other Fidelity funds created an ad hoc committee (the Economies of Scale Committee) to analyze whether FMR attains economies of scale in respect of the management and servicing of the Fidelity funds, whether the Fidelity funds have appropriately benefited from such economies of scale, and whether there is potential for realization of any further economies of scale.
The Board recognized that the fund's management contract incorporates a "group fee" structure, which provides for lower group fee rates as total fund assets under FMR's management increase, and for higher group fee rates as total fund assets under FMR's management decrease. FMR calculates the group fee rates based on a tiered asset "breakpoint" schedule that varies based on asset class. The Board considered that the group fee is designed to deliver the benefits of economies of scale to fund shareholders when total Fidelity fund assets increase, even if assets of any particular fund are unchanged or have declined, because some portion of Fidelity's costs are attributable to services provided to all Fidelity funds, and all funds benefit if those costs can be allocated among more assets. The Board concluded that, given the group fee structure, fund shareholders will benefit from lower management fees as assets under FMR's management increase at the fund complex level, regardless of whether Fidelity achieves any such economies of scale.
The Board concluded, taking into account the analysis of the Economies of Scale Committee, that economies of scale, if any, are being appropriately shared between fund shareholders and Fidelity.
Additional Information Requested by the Board. In order to develop fully the factual basis for consideration of the Fidelity funds' Advisory Contracts, the Board requested and received additional information on certain topics, including (i) fund performance trends, actions to be taken by FMR to improve certain funds' overall performance, and Fidelity's long-term strategies for certain funds; (ii) the potential to further rationalize the Fidelity fund lineup with the possibility of achieving savings for the funds and Fidelity; (iii) Fidelity's compensation structure for portfolio managers and other key investment personnel; (iv) the amount of the investment that each portfolio manager has made in the Fidelity fund(s) that he or she manages; (v) the realization of fall-out benefits in certain Fidelity business units; (vi) Fidelity's group fee structures, the potential impact of regulatory changes on such structures, and the rationale for the individual fee rates of certain funds; (vii) fund profitability methodology, including Fidelity's cost allocation methodology, and the impact of certain factors on fund profitability results; (viii) trends regarding industry use of performance fee structures and the possibility of implementing performance fee structures for additional funds; and (ix) the impact of net redemptions from the Fidelity funds.
Based on its evaluation of all of the conclusions noted above, and after considering all factors it believed relevant, the Board ultimately concluded that the advisory fee structures are fair and reasonable, and that the fund's Advisory Contracts should be renewed.
Annual Report
Investment Adviser
Fidelity Management & Research Company
Boston, MA
Investment Sub-Advisers
FMR Co., Inc.
Fidelity Management & Research
(U.K.) Inc.
FIL Investments (Japan) Limited
FIL Investment Advisors
FIL Investment Advisors
(UK) Limited
Fidelity Management & Research
(Japan) Inc.
Fidelity Management & Research
(Hong Kong) Limited
General Distributor
Fidelity Distributors Corporation
Smithfield, RI
Transfer and Service Agents
Fidelity Investments Institutional
Operations Company, Inc.
Boston, MA
Fidelity Service Company, Inc.
Boston, MA
Custodian
Brown Brothers Harriman & Co.,
Boston, MA
(Fidelity Investment logo)(registered trademark)
Corporate Headquarters
82 Devonshire St., Boston, MA 02109
www.fidelity.com
AHKC-UANN-1212
1.861458.104
Fidelity Advisor®
China Region Fund -
Institutional Class
Annual Report
October 31, 2012
Institutional Class is a class of
Fidelity® China Region Fund
(Fidelity Cover Art)
Contents
Performance | (Click Here) | How the fund has done over time. |
Management's Discussion of Fund Performance | (Click Here) | The Portfolio Manager's review of fund performance and strategy. |
Shareholder Expense Example | (Click Here) | An example of shareholder expenses. |
Investment Changes | (Click Here) | A summary of major shifts in the fund's investments over the past six months. |
Investments | (Click Here) | A complete list of the fund's investments with their market values. |
Financial Statements | (Click Here) | Statements of assets and liabilities, operations, and changes in net assets, as well as financial highlights. |
Notes | (Click Here) | Notes to the financial statements. |
Report of Independent Registered Public Accounting Firm | (Click Here) | |
Trustees and Officers | (Click Here) | |
Distributions | (Click Here) | |
Board Approval of Investment Advisory Contracts and Management Fees | (Click Here) | |
To view a fund's proxy voting guidelines and proxy voting record for the 12-month period ended June 30, visit http://www.fidelity.com/proxyvotingresults or visit the Securities and Exchange Commission's (SEC) web site at http://www.sec.gov. You may also call 1-877-208-0098 to request a free copy of the proxy voting guidelines.
Standard & Poor's, S&P and S&P 500 are registered service marks of The McGraw-Hill Companies, Inc. and have been licensed for use by Fidelity Distributors Corporation.
Other third party marks appearing herein are the property of their respective owners.
All other marks appearing herein are registered or unregistered trademarks or service marks of FMR LLC or an affiliated company. © 2012 FMR LLC. All rights reserved.
This report and the financial statements contained herein are submitted for the general information of the shareholders of the fund. This report is not authorized for distribution to prospective investors in the fund unless preceded or accompanied by an effective prospectus.
A fund files its complete schedule of portfolio holdings with the SEC for the first and third quarters of each fiscal year on Form N-Q. Forms N-Q are available on the SEC's web site at http://www.sec.gov. A fund's Forms N-Q may be reviewed and copied at the SEC's Public Reference Room in Washington, DC. Information regarding the operation of the SEC's Public Reference Room may be obtained by calling 1-800-SEC-0330. For a complete list of a fund's portfolio holdings, view the most recent holdings listing, semiannual report, or annual report on Fidelity's web site at http://www.fidelity.com, http://www.advisor.fidelity.com, or http://www.401k.com, as applicable.
NOT FDIC INSURED • MAY LOSE VALUE • NO BANK GUARANTEE
Neither the fund nor Fidelity Distributors Corporation is a bank.
Annual Report
Performance: The Bottom Line
Average annual total return reflects the change in the value of an investment, assuming reinvestment of the class' distributions from dividend income and capital gains (the profits earned upon the sale of securities that have grown in value, if any) and assuming a constant rate of performance each year. The $10,000 table and the fund's returns do not reflect the deduction of taxes that a shareholder would pay on fund distributions or the redemption of fund shares. During periods of reimbursement by Fidelity, a fund's total return will be greater than it would be had the reimbursement not occurred. How a fund did yesterday is no guarantee of how it will do tomorrow.
Average Annual Total Returns
Periods ended October 31, 2012 | Past 1
year | Past 5
years | Past 10
years |
Institutional Class A | 7.02% | -3.38% | 13.01% |
A The initial offering of Institutional Class shares took place on May 9, 2008. Returns prior to May 9, 2008 are those of Fidelity® China Region Fund, the original class of the fund.
$10,000 Over 10 Years
Let's say hypothetically that $10,000 was invested in Fidelity Advisor® China Region Fund - Institutional Class on October 31, 2002. The chart shows how the value of your investment would have changed, and also shows how the MSCI® Golden Dragon Index performed over the same period. The initial offering of Institutional Class took place on May 9, 2008. See above for additional information regarding the performance of Institutional Class.
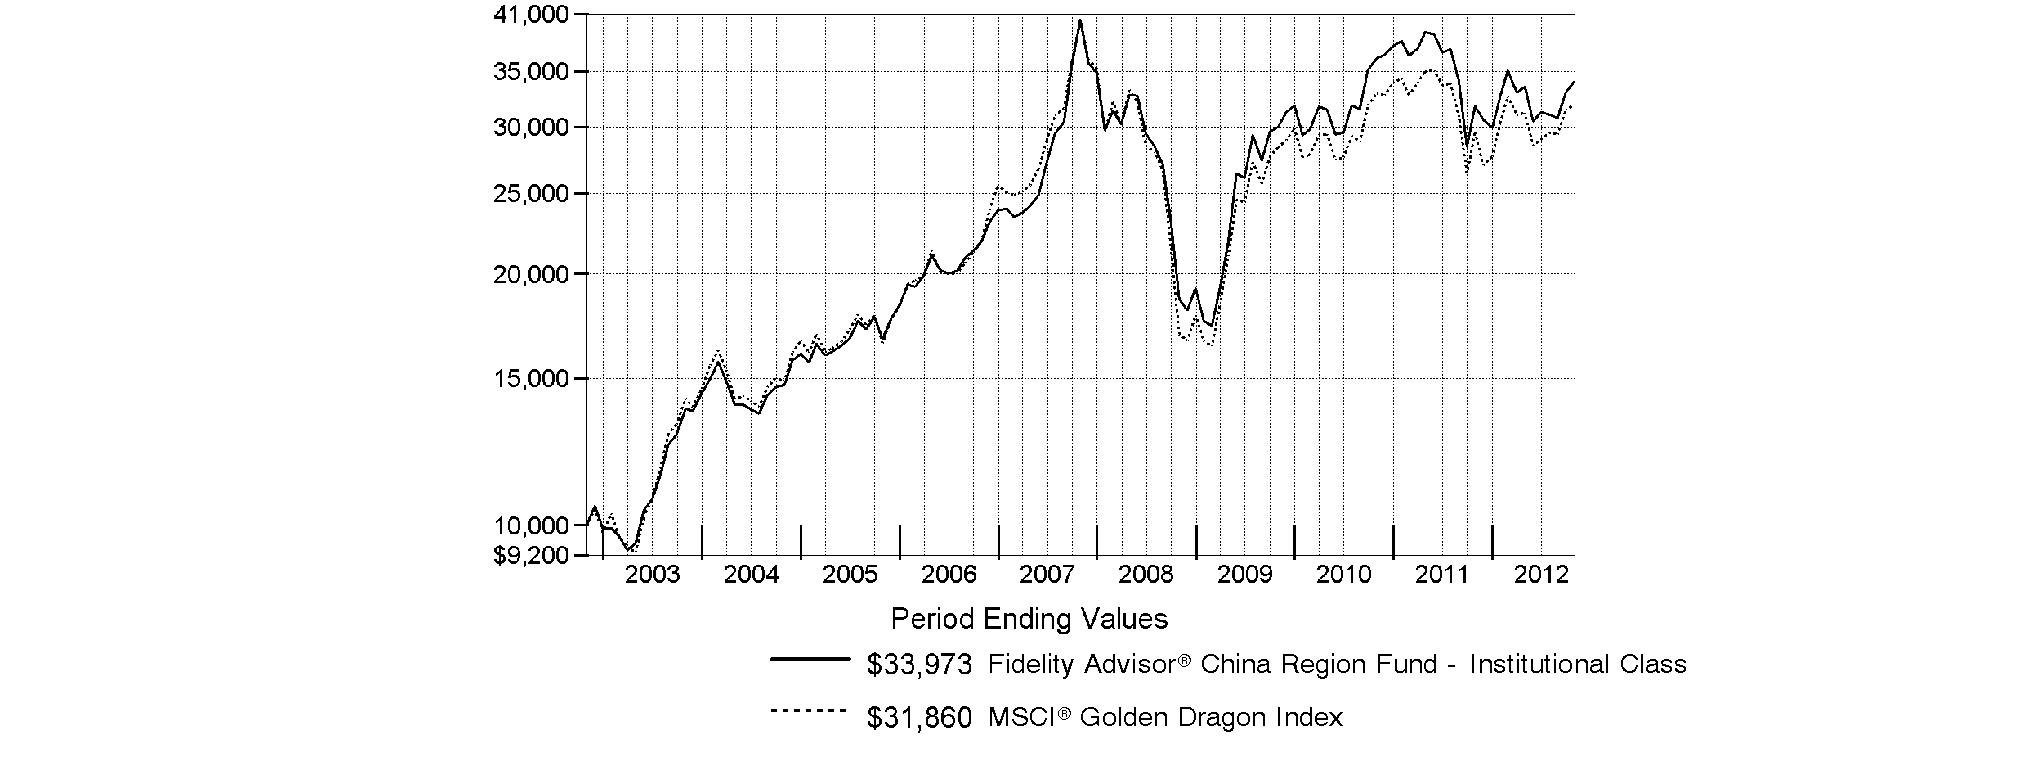
Annual Report
Market Recap: Returns for most domestic and international equities fluctuated during the 12 months ending October 31, 2012, as investor sentiment towards risk vacillated amid a changing global economic landscape. U.S. stocks overcame bouts of volatility to post strong gains for the past year, extending an uptrend that began in March 2009. The broad-based S&P 500® Index advanced 15.21%, while the blue-chip-laden Dow Jones Industrial AverageSM and technology-heavy Nasdaq Composite® Index rose 12.56% and 12.21%, respectively. Performance outside of the U.S. was relatively weak, as the MSCI® ACWI® (All Country World Index) ex USA Index rose 4.11%, hampered in part by a stronger U.S. dollar. International developed-markets generally struggled during the period as macroeconomic concerns ebbed and flowed, finishing with only a modest gain. The MSCI® EAFE® Index rose 4.76% for the year, largely buttressed in the summertime by pledges of accommodative monetary action from eurozone officials, as well as signs that the U.S. housing market was on the mend. Within the index, Asia-Pacific ex Japan showed the most impressive gain, advancing roughly 10%. A number of core European components, including Germany (+11%) and Switzerland (+10%), and the U.K. (+9%), benefited from optimism about the eurozone's ability to resolve its debt woes, which helped the region outpace the index overall. Elsewhere, Japan was among the few benchmark constituents to finish in the red, returning about -3%. Emerging-markets stocks gained 2.98% for the year, as measured by the MSCI Emerging Markets Index. A general uptrend in the final five months of the period lifted the index into positive territory for the full 12 months.
Comments from Robert Bao, Portfolio Manager of Fidelity Advisor® China Region Fund: During the past year, the fund's Institutional Class shares returned 7.02%, trailing the 8.02% gain of the MSCI® Golden Dragon Index. Versus the index, the biggest negative impact came from an overweighting and stock selection in China. Among sectors and industries, my picks in the retailing segment of consumer discretionary and the semiconductors/semiconductor equipment portion of information technology weighed on performance. Noteworthy individual detractors included Taiwan-based DRAM computer memory maker Inotera Memories. I thought the company might benefit from better industry supply discipline and firmer pricing following the bankruptcy of one of Inotera's major competitors, but a weak global economic environment prevented that from happening. China Shipping Container Lines, which I sold at what turned out to be an inopportune time, also hampered the fund's results, as did an out-of-index stake in jewelry retailer Luk Fook Holdings International, based in Hong Kong. Underweighting Taiwanese electronics contract manufacturer and benchmark component Hon Hai Precision Industry further worked against us, given the stock's robust performance. Conversely, a sizable underweighting in the weak-performing Taiwan market added value, along with my choices in the hardware/equipment area of information technology. Negligible exposure to Taiwan-headquartered HTC, a stock I sold early in the period, was the right decision, as the smartphone maker lost market share to rivals Apple and Samsung Electronics, which hampered its stock. China Overseas Land and Investment, one of the largest property developers in that nation, also contributed, as did BOC Hong Kong, one of my favorite banks, and Chinese power utility Huaneng Power International, whose stock rose as investors anticipated an earnings boost from lower coal prices.
Note to shareholders: Fidelity Advisor China Region Fund may invest up to 35% of its total assets in any industry that represents more than 20% of the Hong Kong, Taiwanese and Chinese market. As of October 31, 2012, the fund did not have more than 25% of its total assets invested in any one industry.
The views expressed above reflect those of the portfolio manager(s) only through the end of the period as stated on the cover of this report and do not necessarily represent the views of Fidelity or any other person in the Fidelity organization. Any such views are subject to change at any time based upon market or other conditions and Fidelity disclaims any responsibility to update such views. These views may not be relied on as investment advice and, because investment decisions for a Fidelity fund are based on numerous factors, may not be relied on as an indication of trading intent on behalf of any Fidelity fund.
Annual Report
Fidelity China Region Fund
As a shareholder of the Fund, you incur two types of costs: (1) transaction costs, including sales charges (loads) on purchase payments or redemption proceeds, redemption fees and (2) ongoing costs, including management fees, distribution and/or service (12b-1) fees and other Fund expenses. This Example is intended to help you understand your ongoing costs (in dollars) of investing in the Fund and to compare these costs with the ongoing costs of investing in other mutual funds.
The Example is based on an investment of $1,000 invested at the beginning of the period and held for the entire period (May 1, 2012 to October 31, 2012).
Actual Expenses
The first line of the accompanying table for each class of the Fund provides information about actual account values and actual expenses. You may use the information in this line, together with the amount you invested, to estimate the expenses that you paid over the period. Simply divide your account value by $1,000.00 (for example, an $8,600 account value divided by $1,000.00 = 8.6), then multiply the result by the number in the first line for a class of the Fund under the heading entitled "Expenses Paid During Period" to estimate the expenses you paid on your account during this period. A small balance maintenance fee of $12.00 that is charged once a year may apply for certain accounts with a value of less than $2,000. This fee is not included in the table below. If it was, the estimate of expenses you paid during the period would be higher, and your ending account value lower, by this amount. In addition, the Fund, as a shareholder in the underlying Fidelity Central Funds, will indirectly bear its pro-rata share of the fees and expenses incurred by the underlying Fidelity Central Funds. These fees and expenses are not included in the Fund's annualized expense ratio used to calculate the expense estimate in the table below.
Hypothetical Example for Comparison Purposes
The second line of the accompanying table for each class of the Fund provides information about hypothetical account values and hypothetical expenses based on a Class' actual expense ratio and an assumed rate of return of 5% per year before expenses, which is not the Class' actual return. The hypothetical account values and expenses may not be used to estimate the actual ending account balance or expenses you paid for the period. You may use this information to compare the ongoing costs of investing in the Fund and other funds. To do so, compare this 5% hypothetical example with the 5% hypothetical examples that appear in the shareholder reports of the other funds. A small balance maintenance fee of $12.00 that is charged once a year may apply for certain accounts with a value of less than $2,000. This fee is not included in the table below. If it was, the estimate of expenses you paid during the period would be higher, and your ending account value lower, by this amount. In addition, the Fund, as a shareholder in the underlying Fidelity Central Funds, will indirectly bear its pro-rata share of the fees and expenses incurred by the underlying Fidelity Central Funds. These fees and expenses are not included in the Fund's annualized expense ratio used to calculate the expense estimate in the table below.
Please note that the expenses shown in the table are meant to highlight your ongoing costs only and do not reflect any transaction costs. Therefore, the second line of the table is useful in comparing ongoing costs only, and will not help you determine the relative total costs of owning different funds. In addition, if these transactional costs were included, your costs would have been higher.
| Annualized
Expense Ratio | Beginning
Account Value
May 1, 2012 | Ending
Account Value
October 31, 2012 | Expenses Paid
During Period*
May 1, 2012
to October 31, 2012 |
Class A | 1.35% | | | |
Actual | | $ 1,000.00 | $ 1,013.10 | $ 6.83 |
HypotheticalA | | $ 1,000.00 | $ 1,018.35 | $ 6.85 |
Class T | 1.64% | | | |
Actual | | $ 1,000.00 | $ 1,011.80 | $ 8.29 |
HypotheticalA | | $ 1,000.00 | $ 1,016.89 | $ 8.31 |
Class B | 2.10% | | | |
Actual | | $ 1,000.00 | $ 1,009.70 | $ 10.61 |
HypotheticalA | | $ 1,000.00 | $ 1,014.58 | $ 10.63 |
Class C | 2.10% | | | |
Actual | | $ 1,000.00 | $ 1,009.30 | $ 10.61 |
HypotheticalA | | $ 1,000.00 | $ 1,014.58 | $ 10.63 |
China Region | 1.04% | | | |
Actual | | $ 1,000.00 | $ 1,014.80 | $ 5.27 |
HypotheticalA | | $ 1,000.00 | $ 1,019.91 | $ 5.28 |
Institutional Class | 1.05% | | | |
Actual | | $ 1,000.00 | $ 1,014.50 | $ 5.32 |
HypotheticalA | | $ 1,000.00 | $ 1,019.86 | $ 5.33 |
A 5% return per year before expenses
* Expenses are equal to each Class' annualized expense ratio, multiplied by the average account value over the period, multiplied by 184/366 (to reflect the one-half year period).
Annual Report
Fidelity China Region Fund
Investment Changes (Unaudited)
Geographic Diversification (% of fund's net assets) |
As of October 31, 2012 |
 | Hong Kong | 29.3% | |
 | China | 23.4% | |
 | Cayman Islands | 18.9% | |
 | Taiwan | 18.8% | |
 | Bermuda | 8.1% | |
 | Netherlands | 0.6% | |
 | Italy | 0.5% | |
 | United States of America | 0.2% | |
 | United Kingdom | 0.2% | |

Percentages are based on country or territory of incorporation and are adjusted for the effect of futures contracts, if applicable. |
As of April 30, 2012 |
| China | 28.3% | |
| Hong Kong | 27.1% | |
 | Taiwan | 21.6% | |
| Cayman Islands | 13.8% | |
| Bermuda | 5.7% | |
| United Kingdom | 0.9% | |
| United States of America | 0.6% | |
| Korea (South) | 0.5% | |
| Netherlands | 0.5% | |
| Other | 1.0% | |

Percentages are based on country or territory of incorporation and are adjusted for the effect of futures contracts, if applicable. |
Asset Allocation |
| % of fund's
net assets | % of fund's net assets
6 months ago |
Stocks | 99.8 | 99.4 |
Short-Term Investments and Net Other Assets (Liabilities) | 0.2 | 0.6 |
Top Ten Stocks as of October 31, 2012 |
| % of fund's
net assets | % of fund's net assets
6 months ago |
Taiwan Semiconductor Manufacturing Co. Ltd. (Semiconductors & Semiconductor Equipment) | 6.8 | 7.0 |
Tencent Holdings Ltd. (Internet Software & Services) | 4.7 | 2.8 |
Industrial & Commercial Bank of China Ltd. (H Shares) (Commercial Banks) | 4.1 | 4.9 |
China Overseas Land and Investment Ltd. (Real Estate Management & Development) | 2.8 | 1.6 |
Cheung Kong Holdings Ltd. (Real Estate Management & Development) | 2.7 | 2.1 |
AIA Group Ltd. (Insurance) | 2.7 | 4.2 |
China Construction Bank Corp. (H Shares) (Commercial Banks) | 2.6 | 2.6 |
BOC Hong Kong (Holdings) Ltd. (Commercial Banks) | 2.4 | 2.9 |
MediaTek, Inc. (Semiconductors & Semiconductor Equipment) | 2.4 | 0.7 |
Hon Hai Precision Industry Co. Ltd. (Foxconn) (Electronic Equipment & Components) | 2.3 | 3.0 |
| 33.5 | |
Market Sectors as of October 31, 2012 |
| % of fund's
net assets | % of fund's net assets
6 months ago |
Financials | 33.1 | 39.0 |
Information Technology | 24.0 | 18.6 |
Consumer Discretionary | 11.1 | 8.4 |
Materials | 10.6 | 7.1 |
Industrials | 8.1 | 10.7 |
Energy | 4.4 | 8.1 |
Telecommunication Services | 3.5 | 3.1 |
Utilities | 3.1 | 2.2 |
Consumer Staples | 1.5 | 1.9 |
Health Care | 0.4 | 0.3 |
Annual Report
Fidelity China Region Fund
Investments October 31, 2012
Showing Percentage of Net Assets
Common Stocks - 99.8% |
| Shares | | Value |
CONSUMER DISCRETIONARY - 11.1% |
Automobiles - 0.9% |
Brilliance China Automotive Holdings Ltd. (a) | 5,190,000 | | $ 6,482,436 |
Geely Automobile Holdings Ltd. | 11,915,000 | | 5,119,573 |
| | 11,602,009 |
Hotels, Restaurants & Leisure - 4.4% |
Galaxy Entertainment Group Ltd. (a) | 5,689,000 | | 19,562,693 |
Melco PBL Entertainment (Macau) Ltd. sponsored ADR (a) | 403,400 | | 5,853,334 |
Sands China Ltd. | 4,808,200 | | 18,084,920 |
SJM Holdings Ltd. | 2,601,000 | | 5,665,109 |
Wynn Macau Ltd. | 2,610,800 | | 7,394,412 |
| | 56,560,468 |
Household Durables - 1.7% |
Skyworth Digital Holdings Ltd. | 5,486,000 | | 2,965,960 |
Techtronic Industries Co. Ltd. | 9,863,500 | | 18,785,074 |
| | 21,751,034 |
Leisure Equipment & Products - 0.7% |
Merida Industry Co. Ltd. | 2,303,450 | | 8,832,126 |
Media - 0.9% |
Television Broadcasts Ltd. | 1,626,000 | | 12,116,244 |
Multiline Retail - 0.7% |
Lifestyle International Holdings Ltd. | 1,753,500 | | 3,746,809 |
Springland International Holdings Ltd. | 11,629,000 | | 5,716,930 |
| | 9,463,739 |
Specialty Retail - 0.8% |
Chow Tai Fook Jewellery Group Ltd. | 4,988,400 | | 6,153,393 |
Luk Fook Holdings International Ltd. | 1,834,000 | | 4,609,818 |
| | 10,763,211 |
Textiles, Apparel & Luxury Goods - 1.0% |
Prada SpA | 752,900 | | 6,139,738 |
Shenzhou International Group Holdings Ltd. | 3,459,000 | | 6,739,428 |
| | 12,879,166 |
TOTAL CONSUMER DISCRETIONARY | | 143,967,997 |
CONSUMER STAPLES - 1.5% |
Food & Staples Retailing - 0.2% |
President Chain Store Corp. | 601,000 | | 2,973,109 |
Food Products - 0.8% |
Want Want China Holdings Ltd. | 7,227,000 | | 9,884,607 |
Personal Products - 0.5% |
Hengan International Group Co. Ltd. | 676,500 | | 6,162,657 |
TOTAL CONSUMER STAPLES | | 19,020,373 |
ENERGY - 4.4% |
Energy Equipment & Services - 0.5% |
China Oilfield Services Ltd. (H Shares) | 3,520,000 | | 6,676,602 |
|
| Shares | | Value |
Oil, Gas & Consumable Fuels - 3.9% |
China Shenhua Energy Co. Ltd. (H Shares) | 4,588,500 | | $ 19,538,003 |
Kunlun Energy Co. Ltd. | 13,186,000 | | 24,500,281 |
Sinopec Kantons Holdings Ltd. | 8,596,000 | | 6,410,911 |
| | 50,449,195 |
TOTAL ENERGY | | 57,125,797 |
FINANCIALS - 33.1% |
Capital Markets - 2.8% |
CITIC Securities Co. Ltd. (H Shares) | 9,503,500 | | 17,829,677 |
Haitong Securities Co. Ltd. (H Shares) | 12,406,400 | | 15,912,106 |
Wuliangye Yibin Co. Ltd. (UBS Warrant Programme) warrants 4/22/13 (a) | 345,100 | | 1,859,050 |
| | 35,600,833 |
Commercial Banks - 12.5% |
BOC Hong Kong (Holdings) Ltd. | 10,152,000 | | 31,241,760 |
China Construction Bank Corp. (H Shares) | 43,679,000 | | 32,914,028 |
Chinatrust Financial Holding Co. Ltd. | 12,203,603 | | 6,726,395 |
Hang Seng Bank Ltd. | 1,319,700 | | 20,263,650 |
Industrial & Commercial Bank of China Ltd. (H Shares) | 80,562,000 | | 53,326,503 |
Wing Hang Bank Ltd. | 904,500 | | 9,593,474 |
Wuliangye Yibin Co. Ltd. (BNP Paribas Warrant Program) warrants 8/20/13 (a) | 1,351,900 | | 7,282,671 |
| | 161,348,481 |
Insurance - 3.2% |
AIA Group Ltd. | 8,697,000 | | 34,451,120 |
China Life Insurance Co. Ltd. (H Shares) | 2,372,000 | | 6,974,893 |
| | 41,426,013 |
Real Estate Management & Development - 14.6% |
Cheung Kong Holdings Ltd. | 2,337,000 | | 34,527,068 |
China Overseas Land and Investment Ltd. | 13,656,000 | | 35,769,679 |
Csi Properties Ltd. | 139,720,000 | | 5,678,905 |
Guangzhou R&F Properties Co. Ltd. (H Shares) | 10,685,600 | | 13,139,756 |
Henderson Land Development Co. Ltd. | 1,343,000 | | 9,305,630 |
Hopson Development Holdings Ltd. (a) | 16,090,000 | | 15,508,584 |
Hysan Development Co. Ltd. | 1,336,000 | | 5,904,220 |
KWG Property Holding Ltd. | 9,404,500 | | 5,606,259 |
Longfor Properties Co. Ltd. | 7,217,500 | | 12,739,969 |
New World Development Co. Ltd. | 6,432,000 | | 9,942,563 |
Shimao Property Holdings Ltd. | 3,908,500 | | 7,463,926 |
Sun Hung Kai Properties Ltd. | 1,656,000 | | 23,055,645 |
Wharf Holdings Ltd. | 1,448,000 | | 9,911,730 |
| | 188,553,934 |
TOTAL FINANCIALS | | 426,929,261 |
Common Stocks - continued |
| Shares | | Value |
HEALTH CARE - 0.4% |
Pharmaceuticals - 0.4% |
China Medical System Holdings Ltd. | 9,846,000 | | $ 5,678,882 |
INDUSTRIALS - 8.1% |
Construction & Engineering - 2.0% |
China Communications Construction Co. Ltd. (H Shares) | 4,803,000 | | 4,505,495 |
China Railway Group Ltd. (H Shares) | 8,253,000 | | 4,206,341 |
China State Construction International Holdings Ltd. | 13,696,000 | | 16,311,389 |
| | 25,023,225 |
Electrical Equipment - 0.4% |
Zhuzhou CSR Times Electric Co. Ltd. (H Shares) | 1,912,000 | | 5,624,944 |
Industrial Conglomerates - 1.8% |
Hutchison Whampoa Ltd. | 2,358,000 | | 23,199,528 |
Machinery - 0.3% |
HIWIN Technologies Corp. | 38,400 | | 247,148 |
Singamas Container Holdings Ltd. | 14,718,000 | | 3,722,206 |
| | 3,969,354 |
Marine - 2.7% |
China Shipping Development Co. Ltd. (H Shares) | 8,884,000 | | 4,665,503 |
Orient Overseas International Ltd. | 2,828,500 | | 17,883,304 |
Pacific Basin Shipping Ltd. | 22,304,000 | | 11,943,355 |
| | 34,492,162 |
Road & Rail - 0.7% |
MTR Corp. Ltd. | 2,265,000 | | 8,855,362 |
Transportation Infrastructure - 0.2% |
Jiangsu Expressway Co. Ltd. (H Shares) | 3,524,000 | | 3,037,441 |
TOTAL INDUSTRIALS | | 104,202,016 |
INFORMATION TECHNOLOGY - 24.0% |
Communications Equipment - 1.2% |
AAC Acoustic Technology Holdings, Inc. | 4,485,000 | | 16,030,155 |
Computers & Peripherals - 1.7% |
ASUSTeK Computer, Inc. | 616,000 | | 6,600,753 |
Lenovo Group Ltd. | 15,074,000 | | 12,117,473 |
Quanta Computer, Inc. | 1,391,000 | | 3,181,061 |
| | 21,899,287 |
Electronic Equipment & Components - 3.7% |
Chroma ATE, Inc. | 1,938,000 | | 3,688,901 |
Delta Electronics, Inc. | 1,475,000 | | 5,039,541 |
Hon Hai Precision Industry Co. Ltd. (Foxconn) | 9,711,047 | | 29,488,869 |
TPK Holding Co. Ltd. GDR (Reg. S) (a) | 727,542 | | 9,140,976 |
| | 47,358,287 |
Internet Software & Services - 4.7% |
Tencent Holdings Ltd. | 1,704,100 | | 60,247,792 |
|
| Shares | | Value |
Semiconductors & Semiconductor Equipment - 12.7% |
Advanced Semiconductor Engineering, Inc. sponsored ADR (d) | 1,694,111 | | $ 6,437,622 |
ASM Pacific Technology Ltd. | 283,900 | | 3,165,007 |
Inotera Memories, Inc. (a) | 42,209,000 | | 5,736,725 |
Kinsus Interconnect Technology Corp. | 2,131,000 | | 5,858,244 |
MediaTek, Inc. | 2,736,000 | | 30,394,796 |
Novatek Microelectronics Corp. | 2,979,000 | | 11,218,418 |
Spreadtrum Communications, Inc. ADR | 612,000 | | 14,106,600 |
Taiwan Semiconductor Manufacturing Co. Ltd. | 28,667,796 | | 87,359,967 |
| | 164,277,379 |
Software - 0.0% |
NetDragon WebSoft, Inc. | 464,000 | | 495,728 |
TOTAL INFORMATION TECHNOLOGY | | 310,308,628 |
MATERIALS - 10.6% |
Chemicals - 1.1% |
Formosa Chemicals & Fibre Corp. | 3,220,000 | | 7,628,346 |
Taiwan Fertilizer Co. Ltd. | 3,015,000 | | 7,183,978 |
| | 14,812,324 |
Construction Materials - 5.1% |
Anhui Conch Cement Co. Ltd. (H Shares) | 5,902,500 | | 20,411,094 |
BBMG Corp. (H Shares) | 16,845,000 | | 14,475,739 |
China National Building Materials Co. Ltd. (H Shares) | 12,214,000 | | 15,570,780 |
China Resources Cement Holdings Ltd. | 14,036,000 | | 9,544,418 |
Taiwan Cement Corp. | 4,629,000 | | 5,934,819 |
| | 65,936,850 |
Metals & Mining - 3.0% |
Aluminum Corp. of China Ltd. (H Shares) (a) | 15,936,000 | | 6,903,054 |
Jiangxi Copper Co. Ltd. (H Shares) | 9,581,000 | | 24,786,814 |
Maanshan Iron & Steel Ltd. (H Shares) (a) | 25,498,000 | | 6,580,087 |
| | 38,269,955 |
Paper & Forest Products - 1.4% |
Lee & Man Paper Manufacturing Ltd. | 15,012,000 | | 7,883,670 |
Nine Dragons Paper (Holdings) Ltd. | 13,664,000 | | 9,626,446 |
| | 17,510,116 |
TOTAL MATERIALS | | 136,529,245 |
TELECOMMUNICATION SERVICES - 3.5% |
Diversified Telecommunication Services - 0.9% |
China Unicom Ltd. | 6,946,000 | | 11,197,831 |
Wireless Telecommunication Services - 2.6% |
China Mobile Ltd. | 2,256,500 | | 25,028,527 |
Far EasTone Telecommunications Co. Ltd. | 3,710,000 | | 8,560,561 |
| | 33,589,088 |
TOTAL TELECOMMUNICATION SERVICES | | 44,786,919 |
Common Stocks - continued |
| Shares | | Value |
UTILITIES - 3.1% |
Electric Utilities - 0.8% |
Power Assets Holdings Ltd. | 1,173,500 | | $ 9,978,471 |
Independent Power Producers & Energy Traders - 2.3% |
China Resources Power Holdings Co. Ltd. | 2,084,000 | | 4,463,765 |
Huadian Power International Corp. Ltd. (H Shares) (a) | 9,798,000 | | 2,490,572 |
Huaneng Power International, Inc. (H Shares) | 29,620,000 | | 23,664,040 |
| | 30,618,377 |
TOTAL UTILITIES | | 40,596,848 |
TOTAL COMMON STOCKS (Cost $1,037,958,239) |
1,289,145,966
|
Money Market Funds - 1.3% |
| | | |
Fidelity Cash Central Fund, 0.19% (b) | 15,785,844 | | 15,785,844 |
Fidelity Securities Lending Cash Central Fund, 0.19% (b)(c) | 77,891 | | 77,891 |
TOTAL MONEY MARKET FUNDS (Cost $15,863,735) |
15,863,735
|
TOTAL INVESTMENT PORTFOLIO - 101.1% (Cost $1,053,821,974) | | 1,305,009,701 |
NET OTHER ASSETS (LIABILITIES) - (1.1)% | | (13,627,324) |
NET ASSETS - 100% | $ 1,291,382,377 |
Legend |
(a) Non-income producing |
(b) Affiliated fund that is available only to investment companies and other accounts managed by Fidelity Investments. The rate quoted is the annualized seven-day yield of the fund at period end. A complete unaudited listing of the fund's holdings as of its most recent quarter end is available upon request. In addition, each Fidelity Central Fund's financial statements, which are not covered by the Fund's Report of Independent Registered Public Accounting Firm, are available on the SEC's website or upon request. |
(c) Includes investment made with cash collateral received from securities on loan. |
(d) Security or a portion of the security is on loan at period end. |
Affiliated Central Funds |
Information regarding fiscal year to date income earned by the Fund from investments in Fidelity Central Funds is as follows: |
Fund | Income earned |
Fidelity Cash Central Fund | $ 26,173 |
Fidelity Securities Lending Cash Central Fund | 111,499 |
Total | $ 137,672 |
Other Information |
The following is a summary of the inputs used, as of October 31, 2012, involving the Fund's assets and liabilities carried at fair value. The inputs or methodology used for valuing securities may not be an indication of the risk associated with investing in those securities. For more information on valuation inputs, and their aggregation into the levels used in the tables below, please refer to the Security Valuation section in the accompanying Notes to Financial Statements. |
Valuation Inputs at Reporting Date: |
Description | Total | Level 1 | Level 2 | Level 3 |
Investments in Securities: | | | | |
Equities: | | | | |
Consumer Discretionary | $ 143,967,997 | $ 143,967,997 | $ - | $ - |
Consumer Staples | 19,020,373 | 19,020,373 | - | - |
Energy | 57,125,797 | 57,125,797 | - | - |
Financials | 426,929,261 | 410,812,647 | 16,116,614 | - |
Health Care | 5,678,882 | 5,678,882 | - | - |
Industrials | 104,202,016 | 104,202,016 | - | - |
Information Technology | 310,308,628 | 222,948,661 | 87,359,967 | - |
Materials | 136,529,245 | 129,626,191 | 6,903,054 | - |
Telecommunication Services | 44,786,919 | 8,560,561 | 36,226,358 | - |
Utilities | 40,596,848 | 16,932,808 | 23,664,040 | - |
Money Market Funds | 15,863,735 | 15,863,735 | - | - |
Total Investments in Securities: | $ 1,305,009,701 | $ 1,134,739,668 | $ 170,270,033 | $ - |
The following is a summary of transfers between Level 1 and Level 2 for the period ended October 31, 2012. Transfers are assumed to have occurred at the beginning of the period, and are primarily attributable to the valuation techniques used for foreign equity securities, as discussed in the accompanying Notes to Financial Statements: |
Transfers | Total |
Level 1 to Level 2 | $ 0 |
Level 2 to Level 1 | $ 741,933,610 |
See accompanying notes which are an integral part of the financial statements.
Annual Report
Fidelity China Region Fund
Statement of Assets and Liabilities
| October 31, 2012 |
| | |
Assets | | |
Investment in securities, at value (including securities loaned of $78,930) - See accompanying schedule: Unaffiliated issuers (cost $1,037,958,239) | $ 1,289,145,966 | |
Fidelity Central Funds (cost $15,863,735) | 15,863,735 | |
Total Investments (cost $1,053,821,974) | | $ 1,305,009,701 |
Receivable for investments sold | | 29,683,136 |
Receivable for fund shares sold | | 1,372,007 |
Dividends receivable | | 187,311 |
Distributions receivable from Fidelity Central Funds | | 772 |
Other receivables | | 280,271 |
Total assets | | 1,336,533,198 |
| | |
Liabilities | | |
Payable for investments purchased | $ 30,215,400 | |
Payable for fund shares redeemed | 13,622,794 | |
Accrued management fee | 754,511 | |
Distribution and service plan fees payable | 9,590 | |
Other affiliated payables | 299,717 | |
Other payables and accrued expenses | 170,918 | |
Collateral on securities loaned, at value | 77,891 | |
Total liabilities | | 45,150,821 |
| | |
Net Assets | | $ 1,291,382,377 |
Net Assets consist of: | | |
Paid in capital | | $ 1,051,109,763 |
Undistributed net investment income | | 19,540,796 |
Accumulated undistributed net realized gain (loss) on investments and foreign currency transactions | | (30,455,911) |
Net unrealized appreciation (depreciation) on investments and assets and liabilities in foreign currencies | | 251,187,729 |
Net Assets | | $ 1,291,382,377 |
Statement of Assets and Liabilities - continued
| October 31, 2012 |
| | |
Calculation of Maximum Offering Price Class A:
Net Asset Value and redemption price per share ($13,539,457 ÷ 474,618 shares) | | $ 28.53 |
| | |
Maximum offering price per share (100/94.25 of $28.53) | | $ 30.27 |
Class T:
Net Asset Value and redemption price per share ($4,348,975 ÷ 153,118 shares) | | $ 28.40 |
| | |
Maximum offering price per share (100/96.50 of $28.40) | | $ 29.43 |
Class B:
Net Asset Value and offering price per share ($1,532,663 ÷ 54,432 shares)A | | $ 28.16 |
| | |
Class C:
Net Asset Value and offering price per share ($4,515,324 ÷ 160,840 shares)A | | $ 28.07 |
| | |
China Region:
Net Asset Value, offering price and redemption price per share ($1,265,488,434 ÷ 44,044,355 shares) | | $ 28.73 |
| | |
Institutional Class:
Net Asset Value, offering price and redemption price per share ($1,957,524 ÷ 68,243 shares) | | $ 28.68 |
A Redemption price per share is equal to net asset value less any applicable contingent deferred sales charge.
See accompanying notes which are an integral part of the financial statements.
Annual Report
Fidelity China Region Fund
Financial Statements - continued
Statement of Operations
| Year ended October 31, 2012 |
| | |
Investment Income | | |
Dividends | | $ 39,489,882 |
Interest | | 86 |
Income from Fidelity Central Funds | | 137,672 |
Income before foreign taxes withheld | | 39,627,640 |
Less foreign taxes withheld | | (3,165,755) |
Total income | | 36,461,885 |
| | |
Expenses | | |
Management fee | $ 9,807,145 | |
Transfer agent fees | 3,322,107 | |
Distribution and service plan fees | 123,475 | |
Accounting and security lending fees | 628,178 | |
Custodian fees and expenses | 506,447 | |
Independent trustees' compensation | 9,256 | |
Registration fees | 88,369 | |
Audit | 76,960 | |
Legal | 7,477 | |
Interest | 2,622 | |
Miscellaneous | 17,419 | |
Total expenses before reductions | 14,589,455 | |
Expense reductions | (909,736) | 13,679,719 |
Net investment income (loss) | | 22,782,166 |
Realized and Unrealized Gain (Loss) Net realized gain (loss) on: | | |
Investment securities: | | |
Unaffiliated issuers | (16,254,587) | |
Foreign currency transactions | (261,369) | |
Total net realized gain (loss) | | (16,515,956) |
Change in net unrealized appreciation (depreciation) on: Investment securities | 76,673,788 | |
Assets and liabilities in foreign currencies | (86) | |
Total change in net unrealized appreciation (depreciation) | | 76,673,702 |
Net gain (loss) | | 60,157,746 |
Net increase (decrease) in net assets resulting from operations | | $ 82,939,912 |
Statement of Changes in Net Assets
| Year ended
October 31,
2012 | Year ended
October 31,
2011 |
Increase (Decrease) in Net Assets | | |
Operations | | |
Net investment income (loss) | $ 22,782,166 | $ 27,851,224 |
Net realized gain (loss) | (16,515,956) | 124,444,208 |
Change in net unrealized appreciation (depreciation) | 76,673,702 | (389,938,389) |
Net increase (decrease) in net assets resulting from operations | 82,939,912 | (237,642,957) |
Distributions to shareholders from net investment income | (15,687,379) | (25,544,611) |
Distributions to shareholders from net realized gain | (18,721,345) | (1,707,007) |
Total distributions | (34,408,724) | (27,251,618) |
Share transactions - net increase (decrease) | (301,570,428) | (353,944,406) |
Redemption fees | 184,146 | 551,160 |
Total increase (decrease) in net assets | (252,855,094) | (618,287,821) |
| | |
Net Assets | | |
Beginning of period | 1,544,237,471 | 2,162,525,292 |
End of period (including undistributed net investment income of $19,540,796 and undistributed net investment income of $15,589,239, respectively) | $ 1,291,382,377 | $ 1,544,237,471 |
See accompanying notes which are an integral part of the financial statements.
Annual Report
Financial Highlights - Class A
Years ended October 31, | 2012 | 2011 | 2010 | 2009 | 2008 H |
Selected Per-Share Data | | | | | |
Net asset value, beginning of period | $ 27.28 | $ 31.61 | $ 26.47 | $ 16.67 | $ 29.28 |
Income from Investment Operations | | | | | |
Net investment income (loss) E | .36 | .33 | .25 | .30 | .28 |
Net realized and unrealized gain (loss) | 1.42 | (4.33) | 5.15 | 9.63 | (12.91) |
Total from investment operations | 1.78 | (4.00) | 5.40 | 9.93 | (12.63) |
Distributions from net investment income | (.19) | (.31) | (.20) | (.16) | - |
Distributions from net realized gain | (.34) | (.03) | (.07) | - | - |
Total distributions | (.53) | (.34) | (.27) | (.16) | - |
Redemption fees added to paid in capital E | - J | .01 | .01 | .03 | .02 |
Net asset value, end of period | $ 28.53 | $ 27.28 | $ 31.61 | $ 26.47 | $ 16.67 |
Total Return B, C, D | 6.70% | (12.79)% | 20.54% | 60.41% | (43.07)% |
Ratios to Average Net Assets F, I | | | | | |
Expenses before reductions | 1.36% | 1.37% | 1.38% | 1.39% | 1.44% A |
Expenses net of fee waivers, if any | 1.36% | 1.37% | 1.38% | 1.39% | 1.44% A |
Expenses net of all reductions | 1.29% | 1.31% | 1.31% | 1.31% | 1.30% A |
Net investment income (loss) | 1.35% | 1.07% | .91% | 1.27% | 2.63% A |
Supplemental Data | | | | | |
Net assets, end of period (000 omitted) | $ 13,539 | $ 14,808 | $ 16,047 | $ 11,842 | $ 340 |
Portfolio turnover rate G | 107% | 87% | 57% | 88% | 133% |
A Annualized B Total returns for periods of less than one year are not annualized. C Total returns would have been lower if certain expenses had not been reduced during the applicable periods shown. D Total returns do not include the effect of the sales charges. E Calculated based on average shares outstanding during the period. F Fees and expenses of any underlying Fidelity Central Funds are not included in the Fund's expense ratio. The Fund indirectly bears its proportionate share of the expenses of any underlying Fidelity Central Funds. G Amount does not include the portfolio activity of any underlying Fidelity Central Funds. H For the period May 9, 2008 (commencement of sale of shares) to October 31, 2008. I Expense ratios reflect operating expenses of the class. Expenses before reductions do not reflect amounts reimbursed by the investment adviser or reductions from brokerage service arrangements or reductions from other expense offset arrangements and do not represent the amount paid by the class during periods when reimbursements or reductions occur. Expense ratios before reductions for start-up periods may not be representative of longer-term operating periods. Expenses net of fee waivers reflect expenses after reimbursement by the investment adviser but prior to reductions from brokerage service arrangements or other expense offset arrangements. Expenses net of all reductions represent the net expenses paid by the class. J Amount represents less than $.01 per share. |
Financial Highlights - Class T
Years ended October 31, | 2012 | 2011 | 2010 | 2009 | 2008 H |
Selected Per-Share Data | | | | | |
Net asset value, beginning of period | $ 27.13 | $ 31.48 | $ 26.40 | $ 16.65 | $ 29.28 |
Income from Investment Operations | | | | | |
Net investment income (loss) E | .29 | .25 | .18 | .23 | .26 |
Net realized and unrealized gain (loss) | 1.40 | (4.32) | 5.13 | 9.64 | (12.91) |
Total from investment operations | 1.69 | (4.07) | 5.31 | 9.87 | (12.65) |
Distributions from net investment income | (.08) | (.27) | (.18) | (.14) | - |
Distributions from net realized gain | (.34) | (.03) | (.07) | - | - |
Total distributions | (.42) | (.29) K | (.24) L | (.14) | - |
Redemption fees added to paid in capital E | - J | .01 | .01 | .02 | .02 |
Net asset value, end of period | $ 28.40 | $ 27.13 | $ 31.48 | $ 26.40 | $ 16.65 |
Total Return B, C, D | 6.38% | (13.04)% | 20.27% | 59.92% | (43.14)% |
Ratios to Average Net Assets F, I | | | | | |
Expenses before reductions | 1.64% | 1.63% | 1.64% | 1.66% | 1.68% A |
Expenses net of fee waivers, if any | 1.64% | 1.63% | 1.64% | 1.66% | 1.68% A |
Expenses net of all reductions | 1.57% | 1.57% | 1.58% | 1.58% | 1.53% A |
Net investment income (loss) | 1.06% | .81% | .64% | 1.00% | 2.40% A |
Supplemental Data | | | | | |
Net assets, end of period (000 omitted) | $ 4,349 | $ 5,281 | $ 6,070 | $ 3,139 | $ 107 |
Portfolio turnover rate G | 107% | 87% | 57% | 88% | 133% |
A Annualized B Total returns for periods of less than one year are not annualized. C Total returns would have been lower if certain expenses had not been reduced during the applicable periods shown. D Total returns do not include the effect of the sales charges. E Calculated based on average shares outstanding during the period. F Fees and expenses of any underlying Fidelity Central Funds are not included in the Fund's expense ratio. The Fund indirectly bears its proportionate share of the expenses of any underlying Fidelity Central Funds. G Amount does not include the portfolio activity of any underlying Fidelity Central Funds. H For the period May 9, 2008 (commencement of sale of shares) to October 31, 2008. I Expense ratios reflect operating expenses of the class. Expenses before reductions do not reflect amounts reimbursed by the investment adviser or reductions from brokerage service arrangements or reductions from other expense offset arrangements and do not represent the amount paid by the class during periods when reimbursements or reductions occur. Expense ratios before reductions for start-up periods may not be representative of longer-term operating periods. Expenses net of fee waivers reflect expenses after reimbursement by the investment adviser but prior to reductions from brokerage service arrangements or other expense offset arrangements. Expenses net of all reductions represent the net expenses paid by the class. J Amount represents less than $.01 per share. K Total distributions of $.29 per share is comprised of distributions from net investment income of $.268 and distributions from net realized gain of $.025 per share. L Total distributions of $.24 per share is comprised of distributions from net investment income of $.177 and distributions from net realized gain of $.065 per share. |
See accompanying notes which are an integral part of the financial statements.
Annual Report
Financial Highlights - Class B
Years ended October 31, | 2012 | 2011 | 2010 | 2009 | 2008 H |
Selected Per-Share Data | | | | | |
Net asset value, beginning of period | $ 26.94 | $ 31.23 | $ 26.28 | $ 16.61 | $ 29.28 |
Income from Investment Operations | | | | | |
Net investment income (loss) E | .16 | .10 | .04 | .12 | .20 |
Net realized and unrealized gain (loss) | 1.40 | (4.29) | 5.09 | 9.63 | (12.89) |
Total from investment operations | 1.56 | (4.19) | 5.13 | 9.75 | (12.69) |
Distributions from net investment income | - | (.08) | (.12) | (.10) | - |
Distributions from net realized gain | (.34) | (.03) | (.07) | - | - |
Total distributions | (.34) | (.11) | (.19) | (.10) | - |
Redemption fees added to paid in capital E | - J | .01 | .01 | .02 | .02 |
Net asset value, end of period | $ 28.16 | $ 26.94 | $ 31.23 | $ 26.28 | $ 16.61 |
Total Return B, C, D | 5.90% | (13.45)% | 19.63% | 59.16% | (43.27)% |
Ratios to Average Net Assets F, I | | | | | |
Expenses before reductions | 2.11% | 2.12% | 2.14% | 2.15% | 2.17% A |
Expenses net of fee waivers, if any | 2.11% | 2.12% | 2.14% | 2.15% | 2.17% A |
Expenses net of all reductions | 2.04% | 2.06% | 2.08% | 2.06% | 2.02% A |
Net investment income (loss) | .59% | .32% | .14% | .51% | 1.91% A |
Supplemental Data | | | | | |
Net assets, end of period (000 omitted) | $ 1,533 | $ 1,801 | $ 2,496 | $ 1,915 | $ 155 |
Portfolio turnover rate G | 107% | 87% | 57% | 88% | 133% |
A Annualized B Total returns for periods of less than one year are not annualized. C Total returns would have been lower if certain expenses had not been reduced during the applicable periods shown. D Total returns do not include the effect of the contingent deferred sales charge. E Calculated based on average shares outstanding during the period. F Fees and expenses of any underlying Fidelity Central Funds are not included in the Fund's expense ratio. The Fund indirectly bears its proportionate share of the expenses of any underlying Fidelity Central Funds. G Amount does not include the portfolio activity of any underlying Fidelity Central Funds. H For the period May 9, 2008 (commencement of sale of shares) to October 31, 2008. I Expense ratios reflect operating expenses of the class. Expenses before reductions do not reflect amounts reimbursed by the investment adviser or reductions from brokerage service arrangements or reductions from other expense offset arrangements and do not represent the amount paid by the class during periods when reimbursements or reductions occur. Expense ratios before reductions for start-up periods may not be representative of longer-term operating periods. Expenses net of fee waivers reflect expenses after reimbursement by the investment adviser but prior to reductions from brokerage service arrangements or other expense offset arrangements. Expenses net of all reductions represent the net expenses paid by the class. J Amount represents less than $.01 per share. |
Financial Highlights - Class C
Years ended October 31, | 2012 | 2011 | 2010 | 2009 | 2008 H |
Selected Per-Share Data | | | | | |
Net asset value, beginning of period | $ 26.86 | $ 31.19 | $ 26.25 | $ 16.61 | $ 29.28 |
Income from Investment Operations | | | | | |
Net investment income (loss) E | .16 | .10 | .04 | .12 | .20 |
Net realized and unrealized gain (loss) | 1.39 | (4.28) | 5.09 | 9.62 | (12.89) |
Total from investment operations | 1.55 | (4.18) | 5.13 | 9.74 | (12.69) |
Distributions from net investment income | - | (.13) | (.13) | (.12) | - |
Distributions from net realized gain | (.34) | (.03) | (.07) | - | - |
Total distributions | (.34) | (.16) | (.20) | (.12) | - |
Redemption fees added to paid in capital E | - J | .01 | .01 | .02 | .02 |
Net asset value, end of period | $ 28.07 | $ 26.86 | $ 31.19 | $ 26.25 | $ 16.61 |
Total Return B, C, D | 5.88% | (13.46)% | 19.66% | 59.18% | (43.27)% |
Ratios to Average Net Assets F, I | | | | | |
Expenses before reductions | 2.11% | 2.12% | 2.14% | 2.15% | 2.13% A |
Expenses net of fee waivers, if any | 2.11% | 2.12% | 2.14% | 2.15% | 2.13% A |
Expenses net of all reductions | 2.04% | 2.06% | 2.07% | 2.07% | 1.98% A |
Net investment income (loss) | .59% | .32% | .15% | .51% | 1.95% A |
Supplemental Data | | | | | |
Net assets, end of period (000 omitted) | $ 4,515 | $ 5,230 | $ 5,938 | $ 3,806 | $ 233 |
Portfolio turnover rate G | 107% | 87% | 57% | 88% | 133% |
A Annualized B Total returns for periods of less than one year are not annualized. C Total returns would have been lower if certain expenses had not been reduced during the applicable periods shown. D Total returns do not include the effect of the contingent deferred sales charge. E Calculated based on average shares outstanding during the period. F Fees and expenses of any underlying Fidelity Central Funds are not included in the Fund's expense ratio. The Fund indirectly bears its proportionate share of the expenses of any underlying Fidelity Central Funds. G Amount does not include the portfolio activity of any underlying Fidelity Central Funds. H For the period May 9, 2008 (commencement of sale of shares) to October 31, 2008. I Expense ratios reflect operating expenses of the class. Expenses before reductions do not reflect amounts reimbursed by the investment adviser or reductions from brokerage service arrangements or reductions from other expense offset arrangements and do not represent the amount paid by the class during periods when reimbursements or reductions occur. Expense ratios before reductions for start-up periods may not be representative of longer-term operating periods. Expenses net of fee waivers reflect expenses after reimbursement by the investment adviser but prior to reductions from brokerage service arrangements or other expense offset arrangements. Expenses net of all reductions represent the net expenses paid by the class. J Amount represents less than $.01 per share. |
See accompanying notes which are an integral part of the financial statements.
Annual Report
Financial Highlights - China Region
Years ended October 31, | 2012 | 2011 | 2010 | 2009 | 2008 |
Selected Per-Share Data | | | | | |
Net asset value, beginning of period | $ 27.49 | $ 31.81 | $ 26.55 | $ 16.69 | $ 41.52 |
Income from Investment Operations | | | | | |
Net investment income (loss) B | .45 | .44 | .34 | .33 | .39 |
Net realized and unrealized gain (loss) | 1.42 | (4.37) | 5.18 | 9.68 | (20.42) |
Total from investment operations | 1.87 | (3.93) | 5.52 | 10.01 | (20.03) |
Distributions from net investment income | (.29) | (.38) | (.21) | (.17) | (.32) |
Distributions from net realized gain | (.34) | (.03) | (.07) | - | (4.53) |
Total distributions | (.63) | (.40) G | (.27) H | (.17) | (4.85) |
Redemption fees added to paid in capital B | - F | .01 | .01 | .02 | .05 |
Net asset value, end of period | $ 28.73 | $ 27.49 | $ 31.81 | $ 26.55 | $ 16.69 |
Total Return A | 7.01% | (12.52)% | 20.97% | 60.77% | (53.75)% |
Ratios to Average Net Assets C, E | | | | | |
Expenses before reductions | 1.04% | 1.04% | 1.06% | 1.12% | 1.11% |
Expenses net of fee waivers, if any | 1.04% | 1.04% | 1.06% | 1.12% | 1.11% |
Expenses net of all reductions | .98% | .98% | 1.00% | 1.03% | .96% |
Net investment income (loss) | 1.66% | 1.40% | 1.22% | 1.54% | 1.45% |
Supplemental Data | | | | | |
Net assets, end of period (000 omitted) | $ 1,265,488 | $ 1,515,084 | $ 2,130,070 | $ 2,138,141 | $ 740,289 |
Portfolio turnover rate D | 107% | 87% | 57% | 88% | 133% |
A Total returns would have been lower if certain expenses had not been reduced during the applicable periods shown. B Calculated based on average shares outstanding during the period. C Fees and expenses of any underlying Fidelity Central Funds are not included in the Fund's expense ratio. The Fund indirectly bears its proportionate share of the expenses of any underlying Fidelity Central Funds. D Amount does not include the portfolio activity of any underlying Fidelity Central Funds. E Expense ratios reflect operating expenses of the class. Expenses before reductions do not reflect amounts reimbursed by the investment adviser or reductions from brokerage service arrangements or reductions from other expense offset arrangements and do not represent the amount paid by the class during periods when reimbursements or reductions occur. Expenses net of fee waivers reflect expenses after reimbursement by the investment adviser but prior to reductions from brokerage service arrangements or other expense offset arrangements. Expenses net of all reductions represent the net expenses paid by the class. F Amount represents less than $.01 per share. G Total distributions of $.40 per share is comprised of distributions from net investment income of $.376 and distributions from net realized gain of $.025 per share. H Total distributions of $.27 per share is comprised of distributions from net investment income of $.209 and distributions from net realized gain of $.065 per share. |
Financial Highlights - Institutional Class
Years ended October 31, | 2012 | 2011 | 2010 | 2009 | 2008 G |
Selected Per-Share Data | | | | | |
Net asset value, beginning of period | $ 27.46 | $ 31.79 | $ 26.55 | $ 16.70 | $ 29.28 |
Income from Investment Operations | | | | | |
Net investment income (loss) D | .45 | .43 | .33 | .37 | .34 |
Net realized and unrealized gain (loss) | 1.42 | (4.37) | 5.18 | 9.64 | (12.94) |
Total from investment operations | 1.87 | (3.94) | 5.51 | 10.01 | (12.60) |
Distributions from net investment income | (.31) | (.37) | (.22) | (.18) | - |
Distributions from net realized gain | (.34) | (.03) | (.07) | - | - |
Total distributions | (.65) | (.40) | (.28) J | (.18) | - |
Redemption fees added to paid in capital D | - I | .01 | .01 | .02 | .02 |
Net asset value, end of period | $ 28.68 | $ 27.46 | $ 31.79 | $ 26.55 | $ 16.70 |
Total Return B, C | 7.02% | (12.56)% | 20.92% | 60.78% | (42.96)% |
Ratios to Average Net Assets E, H | | | | | |
Expenses before reductions | 1.04% | 1.06% | 1.11% | 1.08% | 1.05% A |
Expenses net of fee waivers, if any | 1.04% | 1.06% | 1.11% | 1.08% | 1.05% A |
Expenses net of all reductions | .98% | 1.01% | 1.04% | 1.00% | .91% A |
Net investment income (loss) | 1.66% | 1.38% | 1.18% | 1.58% | 3.02% A |
Supplemental Data | | | | | |
Net assets, end of period (000 omitted) | $ 1,958 | $ 2,034 | $ 1,904 | $ 1,684 | $ 60 |
Portfolio turnover rate F | 107% | 87% | 57% | 88% | 133% |
A Annualized B Total returns for periods of less than one year are not annualized. C Total returns would have been lower if certain expenses had not been reduced during the applicable periods shown. D Calculated based on average shares outstanding during the period. E Fees and expenses of any underlying Fidelity Central Funds are not included in the Fund's expense ratio. The Fund indirectly bears its proportionate share of the expenses of any underlying Fidelity Central Funds. F Amount does not include the portfolio activity of any underlying Fidelity Central Funds. G For the period May 9, 2008 (commencement of sale of shares) to October 31, 2008. H Expense ratios reflect operating expenses of the class. Expenses before reductions do not reflect amounts reimbursed by the investment adviser or reductions from brokerage service arrangements or reductions from other expense offset arrangements and do not represent the amount paid by the class during periods when reimbursements or reductions occur. Expense ratios before reductions for start-up periods may not be representative of longer-term operating periods. Expenses net of fee waivers reflect expenses after reimbursement by the investment adviser but prior to reductions from brokerage service arrangements or other expense offset arrangements. Expenses net of all reductions represent the net expenses paid by the class. I Amount represents less than $.01 per share. J Total distributions of $.28 per share is comprised of distributions from net investment income of $.216 and distributions from net realized gain of $.065 per share. |
See accompanying notes which are an integral part of the financial statements.
Annual Report
Notes to Financial Statements
For the period ended October 31, 2012
1. Organization.
Fidelity China Region Fund (the Fund) is a fund of Fidelity Investment Trust (the Trust) and is authorized to issue an unlimited number of shares. The Trust is registered under the Investment Company Act of 1940, as amended (the 1940 Act), as an open-end management investment company organized as a Massachusetts business trust. The Fund offers Class A, Class T, Class C, China Region and Institutional Class shares, each of which, along with Class B shares, has equal rights as to assets and voting privileges. Effective after the close of business on September 1, 2010, Class B shares were closed to new accounts and additional purchases, except for exchanges and reinvestments. Each class has exclusive voting rights with respect to matters that affect that class. Class B shares will automatically convert to Class A shares after a holding period of seven years from the initial date of purchase. Investment income, realized and unrealized capital gains and losses, the common expenses of the Fund, and certain fund-level expense reductions, if any, are allocated on a pro-rata basis to each class based on the relative net assets of each class to the total net assets of the Fund. Each class differs with respect to transfer agent and distribution and service plan fees incurred. Certain expense reductions may also differ by class. The Fund's investments in emerging markets can be subject to social, economic, regulatory, and political uncertainties and can be extremely volatile.
2. Investments in Fidelity Central Funds.
The Fund invests in Fidelity Central Funds, which are open-end investment companies available only to other investment companies and accounts managed by Fidelity Management & Research Company (FMR) and its affiliates. The Fund's Schedule of Investments lists each of the Fidelity Central Funds held as of period end, if any, as an investment of the Fund, but does not include the underlying holdings of each Fidelity Central Fund. As an Investing Fund, the Fund indirectly bears its proportionate share of the expenses of the underlying Fidelity Central Funds.
The Money Market Central Funds seek preservation of capital and current income and are managed by Fidelity Investments Money Management, Inc. (FIMM), an affiliate of FMR.
A complete unaudited list of holdings for each Fidelity Central Fund is available upon request or at the Securities and Exchange Commission (the SEC) web site at www.sec.gov. In addition, the financial statements of the Fidelity Central Funds, which are not covered by the Fund's Report of Independent Registered Public Accounting Firm, are available on the SEC web site or upon request.
3. Significant Accounting Policies.
The financial statements have been prepared in conformity with accounting principles generally accepted in the United States of America (GAAP), which require management to make certain estimates and assumptions at the date of the financial statements. Actual results could differ from those estimates. Subsequent events, if any, through the date that the financial statements were issued have been evaluated in the preparation of the financial statements. The following summarizes the significant accounting policies of the Fund:
Security Valuation. Investments are valued as of 4:00 p.m. Eastern time on the last calendar day of the period. In accordance with valuation policies and procedures approved by the Board of Trustees (the Board), the Fund attempts to obtain prices from one or more third party pricing vendors or brokers to value its investments. When current market prices, quotations or rates are not readily available or reliable, securities will be fair valued in good faith by the FMR Fair Value Committee (the Committee), in accordance with procedures adopted by the Fund's Board. Factors used in determining fair value vary by security type and may include market or security specific events. The frequency with which these procedures are used cannot be predicted and they may be utilized to a significant extent. The Committee oversees the Fund's valuation policies and procedures and is responsible for approving and reporting to the Board all fair value determinations.
The Fund categorizes the inputs to valuation techniques used to value its investments into a disclosure hierarchy consisting of three levels as shown below:
Level 1 - quoted prices in active markets for identical investments
Level 2 - other significant observable inputs (including quoted prices for similar investments, interest rates, prepayment speeds, etc.)
Level 3 - unobservable inputs (including the Fund's own assumptions based on the best information available)
Valuation techniques used to value the Fund's investments by major category are as follows:
Equity securities, including restricted securities, for which market quotations are readily available, are valued at the last reported sale price or official closing price as reported by a third party pricing vendor on the primary market or exchange on which they are traded and are categorized as Level 1 in the hierarchy. In the event there were no sales during the day or closing prices are not available, securities are valued at the last quoted bid price or may be valued using the last available price and are generally categorized as Level 2 in the hierarchy. For foreign equity securities, when significant market or security specific events arise, comparisons to the valuation of American Depositary Receipts (ADRs), futures contracts, Exchange-Traded Funds (ETFs) and certain indexes as well as quoted prices for similar securities are used and are categorized as Level 2 in the hierarchy. Utilizing these techniques may result in transfers between Level 1 and Level 2.
Annual Report
Notes to Financial Statements - continued
3. Significant Accounting Policies - continued
Security Valuation - continued
Investments in open-end mutual funds, including the Fidelity Central Funds, are valued at their closing net asset value (NAV) each business day and are categorized as Level 1 in the hierarchy.
Changes in valuation techniques may result in transfers in or out of an assigned level within the disclosure hierarchy. The aggregate value of investments by input level, as of October 31, 2012, including information on transfers between Levels 1 and 2 securities, is included at the end of the Fund's Schedule of Investments.
Foreign Currency Translation. The Fund may use foreign currency contracts to facilitate transactions in foreign-denominated securities. Gains and losses from these transactions may arise from changes in the value of the foreign currency or if the counterparties do not perform under the contracts' terms.
Foreign-denominated assets, including investment securities, and liabilities are translated into U.S. dollars at the exchange rates at period end. Purchases and sales of investment securities, income and dividends received and expenses denominated in foreign currencies are translated into U.S. dollars at the exchange rate in effect on the transaction date.
The effects of exchange rate fluctuations on investments are included with the net realized and unrealized gain (loss) on investment securities. Other foreign currency transactions resulting in realized and unrealized gain (loss) are disclosed separately.
Investment Transactions and Income. For financial reporting purposes, the Fund's investment holdings and NAV include trades executed through the end of the last business day of the period. The NAV per share for processing shareholder transactions is calculated as of the close of business of the New York Stock Exchange (NYSE), normally 4:00 p.m. Eastern time and includes trades executed through the end of the prior business day. Gains and losses on securities sold are determined on the basis of identified cost. Dividend income is recorded on the ex-dividend date, except for certain dividends from foreign securities where the ex-dividend date may have passed, which are recorded as soon as the Fund is informed of the ex-dividend date. Non-cash dividends included in dividend income, if any, are recorded at the fair market value of the securities received. Interest income and distributions from the Fidelity Central Funds are accrued as earned. Interest income includes coupon interest and amortization of premium and accretion of discount on debt securities. Investment income is recorded net of foreign taxes withheld where recovery of such taxes is uncertain.
Expenses. Expenses directly attributable to a fund are charged to that fund. Expenses attributable to more than one fund are allocated among the respective funds on the basis of relative net assets or other appropriate methods. Expense estimates are accrued in the period to which they relate and adjustments are made when actual amounts are known.
Income Tax Information and Distributions to Shareholders. Each year, the Fund intends to qualify as a regulated investment company under Subchapter M of the Internal Revenue Code, including distributing substantially all of its taxable income and realized gains. As a result, no provision for income taxes is required. As of October 31, 2012, the Fund did not have any unrecognized tax benefits in the financial statements; nor is the Fund aware of any tax positions for which it is reasonably possible that the total amounts of unrecognized tax benefits will significantly change in the next twelve months. The Fund files a U.S. federal tax return, in addition to state and local tax returns as required. A fund's federal income tax returns are subject to examination by the Internal Revenue Service (IRS) for a period of three fiscal years after they are filed. State and local tax returns may be subject to examination for an additional fiscal year depending on the jurisdiction. Foreign taxes are provided for based on the Fund's understanding of the tax rules and rates that exist in the foreign markets in which it invests.
Distributions are declared and recorded on the ex-dividend date. Income dividends and capital gain distributions are declared separately for each class. Income and capital gain distributions are determined in accordance with income tax regulations, which may differ from GAAP. In addition, the Fund claimed a portion of the payment made to redeeming shareholders as a distribution for income tax purposes.
Capital accounts within the financial statements are adjusted for permanent book-tax differences. These adjustments have no impact on net assets or the results of operations. Temporary book-tax differences will reverse in a subsequent period.
Book-tax differences are primarily due to foreign currency transactions, deferred trustees compensation, capital loss carryforwards and losses deferred due to wash sales.
The federal tax cost of investment securities and unrealized appreciation (depreciation) as of period end were as follows:
Gross unrealized appreciation | $ 267,134,828 |
Gross unrealized depreciation | (22,561,736) |
Net unrealized appreciation (depreciation) on securities and other investments | $ 244,573,092 |
| |
Tax Cost | $ 1,060,436,609 |
Annual Report
3. Significant Accounting Policies - continued
Income Tax Information and Distributions to Shareholders - continued
The tax-based components of distributable earnings as of period end were as follows:
Undistributed ordinary income | $ 19,540,801 |
Capital loss carryforward | $ (23,841,276) |
Net unrealized appreciation (depreciation) | $ 244,573,094 |
Capital loss carryforwards are only available to offset future capital gains of the Fund to the extent provided by regulations and may be limited. Under the Regulated Investment Company Modernization Act of 2010 (the Act), the Fund is permitted to carry forward capital losses incurred in taxable years beginning after December 22, 2010 for an unlimited period and such capital losses are required to be used prior to any losses that expire. Capital loss carryforwards were as follows:
No expiration | |
Short-term | $ (23,841,276) |
The tax character of distributions paid was as follows:
| October 31, 2012 | October 31, 2011 |
Ordinary Income | $ 15,687,379 | $ 27,251,618 |
Long-term Capital Gains | 18,721,345 | - |
Total | $ 34,408,724 | $ 27,251,618 |
Short-Term Trading (Redemption) Fees. Shares held by investors in the Fund less than 90 days are subject to a redemption fee equal to 1.50% of the net asset value of shares redeemed. All redemption fees, which reduce the proceeds of the shareholder redemption, are retained by the Fund and accounted for as an addition to paid in capital.
New Accounting Pronouncement. In December 2011, the Financial Accounting Standards Board issued Accounting Standard Update No. 2011-11, Disclosures about Offsetting Assets and Liabilities. The update creates new disclosure requirements requiring entities to disclose both gross and net information for derivatives and other financial instruments that are either offset in the Statement of Assets and Liabilities or subject to an enforceable master netting arrangement or similar agreement. The disclosure requirements are effective for annual reporting periods beginning on or after January 1, 2013, and interim periods within those annual periods. Management is currently evaluating the impact of the update's adoption on the Fund's financial statement disclosures.
4. Purchases and Sales of Investments.
Purchases and sales of securities, other than short-term securities, aggregated $1,465,665,476 and $1,764,182,469, respectively.
5. Fees and Other Transactions with Affiliates.
Management Fee. FMR and its affiliates provide the Fund with investment management related services for which the Fund pays a monthly management fee. The management fee is the sum of an individual fund fee rate that is based on an annual rate of .45% of the Fund's average net assets and an annualized group fee rate that averaged .26% during the period. The group fee rate is based upon the average net assets of all the mutual funds advised by FMR. The group fee rate decreases as assets under management increase and increases as assets under management decrease. For the period, the total annual management fee rate was .71% of the Fund's average net assets.
Distribution and Service Plan Fees. In accordance with Rule 12b-1 of the 1940 Act, the Fund has adopted separate Distribution and Service Plans for each class of shares. Certain classes pay Fidelity Distributors Corporation (FDC), an affiliate of FMR, separate Distribution and Service Fees, each of which is based on an annual percentage of each class' average net assets. In addition, FDC may pay financial intermediaries for selling shares of the Fund and providing shareholder support services. For the period, the Distribution and Service Fee rates, total fees and amounts retained by FDC were as follows:
| Distribution
Fee | Service
Fee | Total Fees | Retained
by FDC |
Class A | -% | .25% | $ 35,281 | $ 524 |
Class T | .25% | .25% | 22,950 | - |
Class B | .75% | .25% | 16,491 | 12,400 |
Class C | .75% | .25% | 48,753 | 8,299 |
| | | $ 123,475 | $ 21,223 |
Annual Report
Notes to Financial Statements - continued
5. Fees and Other Transactions with Affiliates - continued
Sales Load. FDC may receive a front-end sales charge of up to 5.75% for selling Class A shares and 3.50% for selling Class T shares, some of which is paid to financial intermediaries for selling shares of the Fund. Depending on the holding period, FDC may receive contingent deferred sales charges levied on Class A, Class T, Class B, and Class C redemptions. The deferred sales charges range from 5.00% to 1.00% for Class B shares, 1.00% for Class C shares, 1.00% for certain purchases of Class A shares and .25% for certain purchases of Class T shares.
For the period, sales charge amounts retained by FDC were as follows:
| Retained
by FDC |
Class A | $ 10,963 |
Class T | 2,292 |
Class B* | 5,294 |
Class C* | 614 |
| $ 19,163 |
* When Class B and Class C shares are initially sold, FDC pays commissions from its own resources to financial intermediaries through which the sales are made.
Transfer Agent Fees. Fidelity Investments Institutional Operations Company, Inc. (FIIOC), an affiliate of FMR, is the transfer, dividend disbursing and shareholder servicing agent for each class of the Fund. FIIOC receives account fees and asset-based fees that vary according to the account size and type of account of the shareholders of the respective classes of the Fund. FIIOC pays for typesetting, printing and mailing of shareholder reports, except proxy statements. For the period, transfer agent fees for each class were as follows:
| Amount | % of
Average
Net Assets |
Class A | $ 42,267 | .30 |
Class T | 15,146 | .33 |
Class B | 4,929 | .30 |
Class C | 14,604 | .30 |
China Region | 3,240,864 | .24 |
Institutional Class | 4,297 | .24 |
| $ 3,322,107 | |
Accounting and Security Lending Fees. Fidelity Service Company, Inc. (FSC), an affiliate of FMR, maintains the Fund's accounting records. The accounting fee is based on the level of average net assets for each month. Under a separate contract, FSC administers the security lending program. The security lending fee is based on the number and duration of lending transactions.
Brokerage Commissions. The Fund placed a portion of its portfolio transactions with brokerage firms which are affiliates of the investment adviser. The commissions paid to these affiliated firms were $1,024 for the period.
Interfund Lending Program. Pursuant to an Exemptive Order issued by the SEC, the Fund, along with other registered investment companies having management contracts with FMR, may participate in an interfund lending program. This program provides an alternative credit facility allowing the funds to borrow from, or lend money to, other participating affiliated funds. At period end, there were no interfund loans outstanding. The Fund's activity in this program during the period for which loans were outstanding was as follows:
Borrower or Lender | Average Loan
Balance | Weighted Average Interest Rate | Interest
Expense |
Borrower | $ 5,482,818 | .39% | $ 2,622 |
6. Committed Line of Credit.
The Fund participates with other funds managed by FMR or an affiliate in a $4.25 billion credit facility (the "line of credit") to be utilized for temporary or emergency purposes to fund shareholder redemptions or for other short-term liquidity purposes. The Fund has agreed to pay commitment fees on its pro-rata portion of the line of credit, which amounted to $3,885 and is reflected in Miscellaneous expenses on the Statement of Operations. During the period, there were no borrowings on this line of credit.
Annual Report
7. Security Lending.
The Fund lends portfolio securities through a lending agent from time to time in order to earn additional income. For equity securities, a lending agent is used and may loan securities to certain qualified borrowers, including Fidelity Capital Markets (FCM), a broker-dealer affiliated with the Fund. On the settlement date of the loan, the Fund receives collateral (in the form of U.S. Treasury obligations, letters of credit and/or cash) against the loaned securities and maintains collateral in an amount not less than 100% of the market value of the loaned securities during the period of the loan. The market value of the loaned securities is determined at the close of business of the Fund and any additional required collateral is delivered to the Fund on the next business day. If the borrower defaults on its obligation to return the securities loaned because of insolvency or other reasons, a fund could experience delays and costs in recovering the securities loaned or in gaining access to the collateral. Any cash collateral received is invested in the Fidelity Securities Lending Cash Central Fund. The value of loaned securities and cash collateral at period end are disclosed on the Fund's Statement of Assets and Liabilities. Security lending income represents the income earned on investing cash collateral, less rebates paid to borrowers and any lending agent fees associated with the loan, plus any premium payments received for lending certain types of securities. Security lending income is presented in the Statement of Operations as a component of income from Fidelity Central Funds. Total security lending income during the period amounted to $111,499. During the period, there were no securities loaned to FCM.
8. Expense Reductions.
Many of the brokers with whom FMR places trades on behalf of the Fund provided services to the Fund in addition to trade execution. These services included payments of certain expenses on behalf of the Fund totaling $909,245 for the period. In addition, through arrangements with the Fund's custodian, credits realized as a result of uninvested cash balances were used to reduce the Fund's expenses. During the period, these credits reduced the Fund's custody expenses by $491.
9. Distributions to Shareholders.
Distributions to shareholders of each class were as follows:
Years ended October 31, | 2012 | 2011 |
From net investment income | | |
Class A | $ 100,983 | $ 172,777 |
Class T | 14,853 | 55,512 |
Class B | - | 6,583 |
Class C | - | 25,937 |
China Region | 15,549,167 | 25,262,487 |
Institutional Class | 22,376 | 21,315 |
Total | $ 15,687,379 | $ 25,544,611 |
From net realized gain | | |
Class A | $ 182,091 | $ 13,756 |
Class T | 60,664 | 5,178 |
Class B | 21,876 | 2,007 |
Class C | 65,490 | 4,950 |
China Region | 18,366,435 | 1,679,687 |
Institutional Class | 24,789 | 1,429 |
Total | $ 18,721,345 | $ 1,707,007 |
10. Share Transactions.
Transactions for each class of shares were as follows:
| Shares | Dollars |
Years ended October 31, | 2012 | 2011 | 2012 | 2011 |
Class A | | | | |
Shares sold | 128,967 | 281,861 | $ 3,497,936 | $ 8,932,867 |
Reinvestment of distributions | 10,227 | 5,327 | 266,217 | 172,528 |
Shares redeemed | (207,420) | (251,952) | (5,547,035) | (7,835,006) |
Net increase (decrease) | (68,226) | 35,236 | $ (1,782,882) | $ 1,270,389 |
Class T | | | | |
Shares sold | 40,215 | 75,956 | $ 1,078,486 | $ 2,390,903 |
Reinvestment of distributions | 2,834 | 1,832 | 73,623 | 59,161 |
Shares redeemed | (84,588) | (75,948) | (2,252,505) | (2,353,550) |
Net increase (decrease) | (41,539) | 1,840 | $ (1,100,396) | $ 96,514 |
Annual Report
Notes to Financial Statements - continued
10. Share Transactions - continued
| Shares | Dollars |
Years ended October 31, | 2012 | 2011 | 2012 | 2011 |
Class B | | | | |
Shares sold | 4,773 | 8,058 | $ 131,481 | $ 255,784 |
Reinvestment of distributions | 760 | 239 | 19,651 | 7,684 |
Shares redeemed | (17,966) | (21,353) | (477,343) | (653,889) |
Net increase (decrease) | (12,433) | (13,056) | $ (326,211) | $ (390,421) |
Class C | | | | |
Shares sold | 39,150 | 88,544 | $ 1,051,097 | $ 2,766,692 |
Reinvestment of distributions | 2,380 | 892 | 61,380 | 28,631 |
Shares redeemed | (75,401) | (85,136) | (1,981,464) | (2,585,147) |
Net increase (decrease) | (33,871) | 4,300 | $ (868,987) | $ 210,176 |
China Region | | | | |
Shares sold | 5,981,804 | 12,355,142 | $ 163,640,090 | $ 393,844,409 |
Reinvestment of distributions | 1,245,751 | 794,988 | 32,563,934 | 25,868,885 |
Shares redeemed | (18,300,659) | (24,993,159) | (493,563,874) | (775,253,396) |
Net increase (decrease) | (11,073,104) | (11,843,029) | $ (297,359,850) | $ (355,540,102) |
Institutional Class | | | | |
Shares sold | 33,539 | 53,728 | $ 913,352 | $ 1,636,945 |
Reinvestment of distributions | 1,708 | 607 | 44,574 | 19,735 |
Shares redeemed | (41,079) | (40,146) | (1,090,028) | (1,247,642) |
Net increase (decrease) | (5,832) | 14,189 | $ (132,102) | $ 409,038 |
11. Other.
The Fund's organizational documents provide former and current trustees and officers with a limited indemnification against liabilities arising in connection with the performance of their duties to the Fund. In the normal course of business, the Fund may also enter into contracts that provide general indemnifications. The Fund's maximum exposure under these arrangements is unknown as this would be dependent on future claims that may be made against the Fund. The risk of material loss from such claims is considered remote.
Annual Report
Report of Independent Registered Public Accounting Firm
To the Trustees of Fidelity Investment Trust and the Shareholders of Fidelity China Region Fund:
In our opinion, the accompanying statement of assets and liabilities, including the schedule of investments, and the related statements of operations and of changes in net assets and the financial highlights present fairly, in all material respects, the financial position of Fidelity China Region Fund (a fund of Fidelity Investment Trust) at October 31, 2012, the results of its operations for the year then ended, the changes in its net assets for each of the two years in the period then ended and the financial highlights for each of the five years in the period then ended, in conformity with accounting principles generally accepted in the United States of America. These financial statements and financial highlights (hereafter referred to as "financial statements") are the responsibility of the Fidelity China Region Fund's management. Our responsibility is to express an opinion on these financial statements based on our audits. We conducted our audits of these financial statements in accordance with the standards of the Public Company Accounting Oversight Board (United States). Those standards require that we plan and perform the audit to obtain reasonable assurance about whether the financial statements are free of material misstatement. An audit includes examining, on a test basis, evidence supporting the amounts and disclosures in the financial statements, assessing the accounting principles used and significant estimates made by management, and evaluating the overall financial statement presentation. We believe that our audits, which included confirmation of securities at October 31, 2012 by correspondence with the custodian and brokers, provide a reasonable basis for our opinion.
PricewaterhouseCoopers LLP
Boston, Massachusetts
December 18, 2012
Annual Report
The Trustees, Members of the Advisory Board, and executive officers of the trust and fund, as applicable, are listed below. The Board of Trustees governs the fund and is responsible for protecting the interests of shareholders. The Trustees are experienced executives who meet periodically throughout the year to oversee the fund's activities, review contractual arrangements with companies that provide services to the fund, oversee management of the risks associated with such activities and contractual arrangements, and review the fund's performance. Except for James C. Curvey, each of the Trustees oversees 236 funds advised by FMR or an affiliate. Mr. Curvey oversees 443 funds advised by FMR or an affiliate.
The Trustees hold office without limit in time except that (a) any Trustee may resign; (b) any Trustee may be removed by written instrument, signed by at least two-thirds of the number of Trustees prior to such removal; (c) any Trustee who requests to be retired or who has become incapacitated by illness or injury may be retired by written instrument signed by a majority of the other Trustees; and (d) any Trustee may be removed at any special meeting of shareholders by a two-thirds vote of the outstanding voting securities of the trust. Each Trustee who is not an interested person (as defined in the 1940 Act) (Independent Trustee), shall retire not later than the last day of the calendar year in which his or her 75th birthday occurs. The Independent Trustees may waive this mandatory retirement age policy with respect to individual Trustees. The executive officers and Advisory Board Members hold office without limit in time, except that any officer and Advisory Board Member may resign or may be removed by a vote of a majority of the Trustees at any regular meeting or any special meeting of the Trustees. Except as indicated, each individual has held the office shown or other offices in the same company for the past five years.
Experience, Skills, Attributes, and Qualifications of the Fund's Trustees. The Governance and Nominating Committee has adopted a statement of policy that describes the experience, qualifications, attributes, and skills that are necessary and desirable for potential Independent Trustee candidates (Statement of Policy). The Board believes that each Trustee satisfied at the time he or she was initially elected or appointed a Trustee, and continues to satisfy, the standards contemplated by the Statement of Policy. The Governance and Nominating Committee also engages professional search firms to help identify potential Independent Trustee candidates who have the experience, qualifications, attributes, and skills consistent with the Statement of Policy. From time to time, additional criteria based on the composition and skills of the current Independent Trustees, as well as experience or skills that may be appropriate in light of future changes to board composition, business conditions, and regulatory or other developments, have also been considered by the professional search firms and the Governance and Nominating Committee. In addition, the Board takes into account the Trustees' commitment and participation in Board and committee meetings, as well as their leadership of standing and ad hoc committees throughout their tenure.
In determining that a particular Trustee was and continues to be qualified to serve as a Trustee, the Board has considered a variety of criteria, none of which, in isolation, was controlling. The Board believes that, collectively, the Trustees have balanced and diverse experience, qualifications, attributes, and skills, which allow the Board to operate effectively in governing the fund and protecting the interests of shareholders. Information about the specific experience, skills, attributes, and qualifications of each Trustee, which in each case led to the Board's conclusion that the Trustee should serve (or continue to serve) as a trustee of the fund, is provided below.
Board Structure and Oversight Function. James C. Curvey is an interested person (as defined in the 1940 Act) and currently serves as Chairman. The Trustees have determined that an interested Chairman is appropriate and benefits shareholders because an interested Chairman has a personal and professional stake in the quality and continuity of services provided to the fund. Independent Trustees exercise their informed business judgment to appoint an individual of their choosing to serve as Chairman, regardless of whether the Trustee happens to be independent or a member of management. The Independent Trustees have determined that they can act independently and effectively without having an Independent Trustee serve as Chairman and that a key structural component for assuring that they are in a position to do so is for the Independent Trustees to constitute a substantial majority for the Board. The Independent Trustees also regularly meet in executive session. Ned C. Lautenbach serves as Chairman of the Independent Trustees and as such (i) acts as a liaison between the Independent Trustees and management with respect to matters important to the Independent Trustees and (ii) with management prepares agendas for Board meetings.
Fidelity funds are overseen by different Boards of Trustees. The fund's Board oversees Fidelity's equity and high income funds and another Board oversees Fidelity's investment-grade bond, money market, and asset allocation funds. The asset allocation funds may invest in Fidelity funds overseen by the fund's Board. The use of separate Boards, each with its own committee structure, allows the Trustees of each group of Fidelity funds to focus on the unique issues of the funds they oversee, including common research, investment, and operational issues. On occasion, the separate Boards establish joint committees to address issues of overlapping consequences for the Fidelity funds overseen by each Board.
The Trustees operate using a system of committees to facilitate the timely and efficient consideration of all matters of importance to the Trustees, the fund, and fund shareholders and to facilitate compliance with legal and regulatory requirements and oversight of the fund's activities and associated risks. The Board, acting through its committees, has charged FMR and its affiliates with (i) identifying events or circumstances the occurrence of which could have demonstrably adverse effects on the fund's business and/or reputation; (ii) implementing processes and controls to lessen the possibility that such events or circumstances occur or to mitigate the effects of such events or circumstances if they do occur; and (iii) creating and maintaining a system designed to evaluate continuously business and market conditions in order to facilitate the identification and implementation processes described in (i) and (ii) above. Because the day-to-day operations and activities of the fund are carried out by or through FMR, its affiliates and other service providers, the fund's exposure to risks is mitigated but not eliminated by the processes overseen by the Trustees. While each of the Board's committees has responsibility for overseeing different aspects of the fund's activities, oversight is exercised primarily through the Operations, Audit, and Compliance Committees. In addition, the Independent Trustees have worked with FMR to enhance the Board's oversight of investment and financial risks, legal and regulatory risks, technology risks, and operational risks, including the development of additional risk reporting to the Board. For example, a working group comprised of Independent Trustees and FMR has worked and continues to work to review the Fidelity funds' valuation-related activities, reporting and risk management. Appropriate personnel, including but not limited to the fund's Chief Compliance Officer (CCO), FMR's internal auditor, the independent accountants, the fund's Treasurer and portfolio management personnel, make periodic reports to the Board's committees, as appropriate, including an annual review of FMR's risk management program for the Fidelity funds. The responsibilities of each standing committee, including their oversight responsibilities, are described further under "Standing Committees of the Fund's Trustees."
Annual Report
Trustees and Officers - continued
The fund's Statement of Additional Information (SAI) includes more information about the Trustees. To request a free copy, call Fidelity at 1-877-208-0098.
Interested Trustees*:
Correspondence intended for each Trustee who is an interested person may be sent to Fidelity Investments, 82 Devonshire Street, Boston, Massachusetts 02109.
Name, Age; Principal Occupations and Other Relevant Experience+ |
James C. Curvey (77) |
| Year of Election or Appointment: 2007 Mr. Curvey is Trustee and Chairman of the Board of Trustees of certain Trusts. Mr. Curvey also serves as Trustee (2007-present) of other investment companies advised by FMR. Mr. Curvey is a Director of Fidelity Investments Money Management, Inc. (2009-present), Director of Fidelity Research & Analysis Co. (2009-present) and Director of FMR and FMR Co., Inc. (2007-present). Mr. Curvey is also Vice Chairman (2007-present) and Director of FMR LLC. In addition, Mr. Curvey serves as an Overseer for the Boston Symphony Orchestra and a member of the Trustees of Villanova University. Previously, Mr. Curvey was the Vice Chairman (2006-2007) and Director (2000-2007) of FMR Corp. |
Ronald P. O'Hanley (55) |
| Year of Election or Appointment: 2011 Mr. O'Hanley is Director of FMR Co., Inc. (2010-present), Director of Fidelity Investments Money Management, Inc. (2010-present), Director of Fidelity Research & Analysis Company (2010-present), President of Fidelity Asset Management and Corporate Services and a member of Fidelity's Executive Committee (2010-present). Previously, Mr. O'Hanley served as President and Chief Executive Officer of BNY Mellon Asset Management (2007-2010). Mr. O'Hanley also served as Vice Chairman of Bank New York Mellon Corp. and a member of that firm's Executive Committee. Prior to the 2007 merger of The Bank of New York and Mellon Financial Corporation, he was Vice Chairman of Mellon Financial Corporation and President and Chief Executive Officer of Mellon Asset Management. He joined Mellon in February 1997. Mr. O'Hanley currently serves as Chairman of the Boston Public Library Foundation Board of Directors and sits on the Board of Directors of Beth Israel Deaconess Medical Center, the Board of Trustees of the Marine Biological Laboratory and the Advisory Board of the Maxwell School of Citizenship and Public Administration at Syracuse University. Mr. O'Hanley also chairs the Council on Asset Management for the Financial Services Roundtable and is a member of the Board of Directors of Institutional Investor's U.S. Institute. |
* Trustees have been determined to be "Interested Trustees" by virtue of, among other things, their affiliation with the trust or various entities under common control with FMR.
+ The information above includes each Trustee's principal occupation during the last five years and other information relating to the experience, attributes, and skills relevant to each Trustee's qualifications to serve as a Trustee, which led to the conclusion that each Trustee should serve as a Trustee for the fund.
Independent Trustees:
Correspondence intended for each Independent Trustee (that is, the Trustees other than the Interested Trustees) may be sent to Fidelity Investments, P.O. Box 55235, Boston, Massachusetts 02205-5235.
Name, Age; Principal Occupations and Other Relevant Experience+ |
Dennis J. Dirks (64) |
| Year of Election or Appointment: 2005 Prior to his retirement in May 2003, Mr. Dirks was Chief Operating Officer and a member of the Board of The Depository Trust & Clearing Corporation (DTCC). He also served as President, Chief Operating Officer, and Board member of The Depository Trust Company (DTC) and President and Board member of the National Securities Clearing Corporation (NSCC). In addition, Mr. Dirks served as Chief Executive Officer and Board member of the Government Securities Clearing Corporation, Chief Executive Officer and Board member of the Mortgage-Backed Securities Clearing Corporation, as a Trustee and a member of the Finance Committee of Manhattan College (2005-2008), and as a Trustee and a member of the Finance Committee of AHRC of Nassau County (2006-2008). Mr. Dirks is a member of the Independent Directors Council (IDC) Governing Council (2010-present) and Board of Directors for The Brookville Center for Children's Services, Inc. (2009-present). |
Alan J. Lacy (59) |
| Year of Election or Appointment: 2008 Mr. Lacy serves as Senior Adviser (2007-present) of Oak Hill Capital Partners, L.P. (private equity). Mr. Lacy also served as Chief Executive Officer (2000-2005) and Vice Chairman (2005-2006) of Sears Holdings Corporation and Sears, Roebuck and Co. (retail). In addition, Mr. Lacy serves as a member of the Board of Directors of Dave & Buster's Entertainment, Inc. (restaurant and entertainment complexes, 2010-present), Earth Fare, Inc. (retail grocery, 2012-present), The Hillman Companies, Inc. (hardware wholesalers, 2010-present), and Bristol-Myers Squibb Company (global pharmaceuticals, 2008-present). Mr. Lacy is a member of the Board of Trustees of The National Parks Conservation Association (2006-present). Previously, Mr. Lacy served as Chairman of the Board of Trustees of the National Parks Conservation Association (2008-2011) and as a member of the Board of Directors for the Western Union Company (global money transfer, 2006-2011). |
Ned C. Lautenbach (68) |
| Year of Election or Appointment: 2000 Mr. Lautenbach is Chairman of the Independent Trustees of the Equity and High Income Funds (2006-present). Mr. Lautenbach currently serves as the Lead Director of the Eaton Corporation Board of Directors (diversified industrial, 1997-present). Mr. Lautenbach is Chairman of the Board of Directors of the Philharmonic Center for the Arts in Naples, Florida (2012-present) and a member of the Council on Foreign Relations (1994-present). Previously, Mr. Lautenbach was a Partner/Advisory Partner at Clayton, Dubilier & Rice, LLC (private equity investment, 1998-2010), as well as a Director of Sony Corporation (2006-2007). |
Joseph Mauriello (68) |
| Year of Election or Appointment: 2008 Prior to his retirement in January 2006, Mr. Mauriello served in numerous senior management positions including Deputy Chairman and Chief Operating Officer (2004-2005), and Vice Chairman of Financial Services (2002-2004) of KPMG LLP US (professional services, 1965-2005). Mr. Mauriello currently serves as a member of the Board of Directors of XL Group plc. (global insurance and re-insurance, 2006-present). Previously, Mr. Mauriello served as a Director of the Hamilton Funds of the Bank of New York (2006-2007) and of Arcadia Resources Inc. (health care services and products, 2007-2012). |
Robert W. Selander (62) |
| Year of Election or Appointment: 2011 Previously, Mr. Selander served as a Member of the Advisory Board of Fidelity's Equity and High Income Funds (2011), Executive Vice Chairman (2010), Chief Executive Officer (2009-2010), and President and Chief Executive Officer (1997-2009) of Mastercard, Inc. |
Cornelia M. Small (68) |
| Year of Election or Appointment: 2005 Ms. Small is a member of the Board of Directors (2009-present) and Chair of the Investment Committee (2010-present) of the Teagle Foundation. Ms. Small also serves on the Investment Committee of the Berkshire Taconic Community Foundation (2008-present). Previously, Ms. Small served as Chairperson (2002-2008) and a member of the Investment Committee and Chairperson (2008-2012) and a member of the Board of Trustees of Smith College. In addition, Ms. Small served as Chief Investment Officer, Director of Global Equity Investments, and a member of the Board of Directors of Scudder, Stevens & Clark and Scudder Kemper Investments. |
William S. Stavropoulos (73) |
| Year of Election or Appointment: 2001 Mr. Stavropoulos is Vice Chairman of the Independent Trustees of the Equity and High Income Funds (2006-present). Mr. Stavropoulos serves as President and Founder of the Michigan Baseball Foundation, the Great Lakes Loons (2007-present). Mr. Stavropoulos is Chairman Emeritus of the Board of Directors of The Dow Chemical Company, where he previously served in numerous senior management positions, including President, CEO (1995-2000; 2002-2004), Chairman of the Executive Committee (2000-2006), and as a member of the Board of Directors (1990-2006). Currently, Mr. Stavropoulos is a Director of Univar Inc. (global distributor of commodity and specialty chemicals, Chairman from 2010-May 2012 and Lead Director from May 2012-present), Teradata Corporation (data warehousing and technology solutions, 2008-present), Maersk Inc. (industrial conglomerate), and Tyco International, Ltd. (multinational manufacturing and services, 2007-present), and a member of the Advisory Board for Metalmark Capital LLC (private equity investment, 2005-present). Mr. Stavropoulos is an operating advisor to Clayton, Dubilier & Rice, LLC (private equity investment). In addition, Mr. Stavropoulos is a member of the University of Notre Dame Advisory Council for the College of Science, a Trustee of the Rollin L. Gerstacker Foundation, and a Director of the Naples Philharmonic Center for the Arts. Previously, Mr. Stavropoulos served as a Director of Chemical Financial Corporation (bank holding company, 1993-2012). |
David M. Thomas (63) |
| Year of Election or Appointment: 2008 Previously, Mr. Thomas served as Executive Chairman (2005-2006) and Chairman and Chief Executive Officer (2000-2005) of IMS Health, Inc. (pharmaceutical and healthcare information solutions), and a Director of Fortune Brands, Inc. (consumer products, 2000-2011). In addition, Mr. Thomas serves as Non-Executive Chairman of the Board of Directors of Fortune Brands Home and Security (home and security products, 2011-present), and as a member of the Board of Directors of Interpublic Group of Companies, Inc. (marketing communication, 2004-present). |
Michael E. Wiley (62) |
| Year of Election or Appointment: 2008 Mr. Wiley also serves as a Director of Asia Pacific Exploration Consolidated (international oil and gas exploration and production, 2008-present). Mr. Wiley serves as a Director of Tesoro Corporation (independent oil refiner and marketer, 2005-present), and a Director of Bill Barrett Corporation (exploration and production, 2005-present). In addition, Mr. Wiley also serves as a Director of Post Oak Bank (privately-held bank, 2004-present). Previously, Mr. Wiley served as a member of the Board of Trustees of the University of Tulsa (2000-2006; 2007-2010), as a Senior Energy Advisor of Katzenbach Partners, LLC (consulting, 2006-2007), as an Advisory Director of Riverstone Holdings (private investment), Chairman, President, and CEO of Baker Hughes, Inc. (oilfield services, 2000-2004), and as Director of Spinnaker Exploration Company (exploration and production, 2001-2005). |
+ The information above includes each Trustee's principal occupation during the last five years and other information relating to the experience, attributes, and skills relevant to each Trustee's qualifications to serve as a Trustee, which led to the conclusion that each Trustee should serve as a Trustee for the fund.
Advisory Board Members and Executive Officers:
Correspondence intended for David A. Rosow and Garnett A. Smith may be sent to Fidelity Investments, P.O. Box 55235, Boston, Massachusetts 02205-5235. Correspondence intended for each executive officer, Edward C. Johnson 3d, and Peter S. Lynch may be sent to Fidelity Investments, 82 Devonshire Street, Boston, Massachusetts 02109.
Name, Age; Principal Occupation |
Edward C. Johnson 3d (82) |
| Year of Election or Appointment: 2011 Member of the Advisory Board of Fidelity's Equity and High Income Funds. Mr. Johnson serves as Chief Executive Officer, Chairman, and a Director of FMR LLC, and also serves as Chairman and Director of FIL Limited. Previously, Mr. Johnson served as a Trustee and Chairman of the Board of certain Fidelity Trusts, Chairman and a Director of FMR, Chairman and a Director of FMR Co., Inc., and President of FMR LLC (2006-2007). |
Peter S. Lynch (68) |
| Year of Election or Appointment: 2003 Member of the Advisory Board of Fidelity's Equity and High Income Funds. Mr. Lynch is Vice Chairman and a Director of FMR and FMR Co., Inc. In addition, Mr. Lynch serves as a Trustee of Boston College and as the Chairman of the Inner-City Scholarship Fund. Previously, Mr. Lynch served on the Special Olympics International Board of Directors (1997-2006). |
David A. Rosow (70) |
| Year of Election or Appointment: 2012 Member of the Advisory Board of Fidelity's Equity and High Income Funds. Chairman and Chief Executive Officer of International Golf Group, Inc. (golf course development, 1989-present). Previously, Mr. Rosow served as Chairman and Chief Executive Officer of Rosow & Company, Inc. (private investment company, 1989-2011), a Lead Director of Hudson United Bancorp (2001-2006) and as a Director of TD Banknorth (1996-2006). In addition, Mr. Rosow is a member (2008-present) and President (2009-present) of the Town Council of Palm Beach, Florida. |
Garnett A. Smith (65) |
| Year of Election or Appointment: 2012 Member of the Advisory Board of Fidelity's Equity and High Income Funds. Prior to Mr. Smith's retirement, he served as Chairman and Chief Executive Officer of Inbrand Corp. (manufacturer of personal absorbent products, 1990-1997). He also served as President (1986-1990) of Inbrand Corp. Prior to his employment with Inbrand Corp., he was employed by a retail fabric chain and North Carolina National Bank. In addition, Mr. Smith is a board member of the Jackson Hole Land Trust (2009-present). |
Kenneth B. Robins (43) |
| Year of Election or Appointment: 2008 President and Treasurer of Fidelity's Equity and High Income Funds. Mr. Robins also serves as President and Treasurer (2010-present) and Assistant Treasurer (2009-present) of other Fidelity funds and is an employee of Fidelity Investments (2004-present). Previously, Mr. Robins served as Deputy Treasurer of the Fidelity funds (2005-2008) and Treasurer and Chief Financial Officer of The North Carolina Capital Management Trust: Cash and Term Portfolios (2006-2008). |
Bruce T. Herring (47) |
| Year of Election or Appointment: 2006 Vice President of certain Equity Funds. Mr. Herring also serves as President of Fidelity Research & Analysis Company (2010-present), Chief Investment Officer and Director of Fidelity Management & Research (U.K.) Inc. (2010-present) and Group Chief Investment Officer of FMR. Previously, Mr. Herring served as Vice President (2005-2006) and Senior Vice President (2006-2007) of Fidelity Management & Research Company, Vice President of FMR Co., Inc. (2001-2007) and as a portfolio manager for Fidelity U.S. Equity Funds. |
Brian B. Hogan (48) |
| Year of Election or Appointment: 2009 Vice President of Equity and High Income Funds. Mr. Hogan also serves as President of FMR's Equity Division (2009-present). Previously, Mr. Hogan served as Senior Vice President, Equity Research of FMR (2006-2009) and as a portfolio manager. |
Scott C. Goebel (44) |
| Year of Election or Appointment: 2008 Secretary and Chief Legal Officer (CLO) of the Fidelity funds. Mr. Goebel also serves as Secretary of Fidelity Investments Money Management, Inc. (FIMM) (2010-present) and Fidelity Research and Analysis Company (FRAC) (2010-present); Secretary and CLO of The North Carolina Capital Management Trust: Cash and Term Portfolios (2008-present); General Counsel, Secretary, and Senior Vice President of FMR (2008-present) and FMR Co., Inc. (2008-present); employed by FMR LLC or an affiliate (2001-present); Chief Legal Officer of Fidelity Management & Research (Hong Kong) Limited (2008-present) and Assistant Secretary of Fidelity Management & Research (Japan) Inc. (2008-present), and Fidelity Management & Research (U.K.) Inc. (2008-present). Previously, Mr. Goebel served as Assistant Secretary of FIMM (2008-2010), FRAC (2008-2010), and the Funds (2007-2008) and as Vice President and Secretary of Fidelity Distributors Corporation (FDC) (2005-2007). |
William C. Coffey (43) |
| Year of Election or Appointment: 2009 Assistant Secretary of Fidelity's Equity and High Income Funds. Mr. Coffey also serves as Senior Vice President and Deputy General Counsel of FMR LLC (2010-present), and is an employee of Fidelity Investments. Previously, Mr. Coffey served as Vice President and Associate General Counsel of FMR LLC (2005-2009). |
Elizabeth Paige Baumann (44) |
| Year of Election or Appointment: 2012 Anti-Money Laundering (AML) Officer of the Fidelity funds. Ms. Baumann also serves as AML Officer of The North Carolina Capital Management Trust: Cash and Term Portfolios (2012-present), Chief AML Officer of FMR LLC (2012-present), and is an employee of Fidelity Investments. Previously, Ms. Baumann served as Vice President and Deputy Anti-Money Laundering Officer (2007-2012). |
Christine Reynolds (54) |
| Year of Election or Appointment: 2008 Chief Financial Officer of the Fidelity funds. Ms. Reynolds became President of Fidelity Pricing and Cash Management Services (FPCMS) in August 2008. Ms. Reynolds served as Chief Operating Officer of FPCMS (2007-2008). Previously, Ms. Reynolds served as President, Treasurer, and Anti-Money Laundering officer of the Fidelity funds (2004-2007). |
Joseph A. Hanlon (44) |
| Year of Election or Appointment: 2012 Chief Compliance Officer of Fidelity's Equity and High Income Funds. Mr. Hanlon serves as Compliance Officer of FMR, FMR Co., Inc., Fidelity Investments Money Management, Inc. (FIMM), Fidelity Research and Analysis Company (FRAC), Fidelity Management & Research (Japan) Inc., Fidelity Management & Research (U.K.) Inc., Fidelity Management & Research (Hong Kong), and Strategic Advisers, Inc. (2009-present), as Senior Vice President of the Fidelity Asset Management Division (2009-present), and is an employee of Fidelity Investments. |
Joseph F. Zambello (55) |
| Year of Election or Appointment: 2011 Deputy Treasurer of the Fidelity funds. Mr. Zambello is an employee of Fidelity Investments. Previously, Mr. Zambello served as Vice President of FMR's Program Management Group (2009-2011) and Vice President of the Transfer Agent Oversight Group (2005-2009). |
Adrien E. Deberghes (45) |
| Year of Election or Appointment: 2008 Deputy Treasurer of Fidelity's Equity and High Income Funds. Mr. Deberghes also serves as Vice President (2011-present) and Assistant Treasurer (2010-present) of other Fidelity funds, and is an employee of Fidelity Investments (2008-present). Previously, Mr. Deberghes served as Senior Vice President of Mutual Fund Administration at State Street Corporation (2007-2008), Senior Director of Mutual Fund Administration at Investors Bank & Trust (2005-2007), and Director of Finance for Dunkin' Brands (2000-2005). |
Stephen Sadoski (41) |
<R> | Year of Election or Appointment: 2012</R> Deputy Treasurer of Fidelity's Equity and High Income Funds. Mr. Sadoski also serves as Assistant Treasurer of other Fidelity funds (2012-present) and is an employee of Fidelity Investments (2012-present). Previously, Mr. Sadoski served as an assistant chief accountant in the Division of Investment Management of the Securities and Exchange Commission (SEC) (2009-2012) and as a senior manager at Deloitte & Touche (1997-2009). |
Stephanie J. Dorsey (43) |
| Year of Election or Appointment: 2010 Assistant Treasurer of Fidelity's Equity and High Income Funds. Ms. Dorsey also serves as Deputy Treasurer of other Fidelity funds (2008-present) and is an employee of Fidelity Investments (2008-present). Previously, Ms. Dorsey served as Treasurer (2004-2008) of the JPMorgan Mutual Funds and Vice President (2004-2008) of JPMorgan Chase Bank. |
John R. Hebble (54) |
| Year of Election or Appointment: 2009 Assistant Treasurer of Fidelity's Equity and High Income Funds. Mr. Hebble also serves as President (2011-present), Treasurer, and Chief Financial Officer of The North Carolina Capital Management Trust: Cash and Term Portfolios (2008-present), President and Treasurer of other Fidelity funds (2008-present) and is an employee of Fidelity Investments. |
Gary W. Ryan (54) |
| Year of Election or Appointment: 2005 Assistant Treasurer of the Fidelity funds. Mr. Ryan is an employee of Fidelity Investments. Previously, Mr. Ryan served as Vice President of Fund Reporting in Fidelity Pricing and Cash Management Services (FPCMS) (1999-2005). |
Jonathan Davis (44) |
| Year of Election or Appointment: 2010 Assistant Treasurer of the Fidelity funds. Mr. Davis is also Assistant Treasurer of Fidelity Rutland Square Trust II and Fidelity Commonwealth Trust II. Mr. Davis is an employee of Fidelity Investments. Previously, Mr. Davis served as Vice President and Associate General Counsel of FMR LLC (2003-2010). |
Annual Report
Institutional Class designates 64% of the dividends distributed during the fiscal year as amounts which may be taken into account as a dividend for the purposes of the maximum rate under section 1(h)(11) of the Internal Revenue Code.
The amounts per share which represent income derived from sources within, and taxes paid to, foreign countries or possessions of the United States are as follows:
| Pay Date | Income | Taxes |
Institutional Class | 12/05/2011 | $0.392 | $0.0863 |
The fund will notify shareholders in January 2013 of amounts for use in preparing 2012 income tax returns.
Annual Report
Board Approval of Investment Advisory Contracts and Management Fees
Fidelity China Region Fund
Each year, the Board of Trustees, including the Independent Trustees (together, the Board), votes on the renewal of the management contract and sub-advisory agreements (together, the Advisory Contracts) for the fund. The Board, assisted by the advice of fund counsel and Independent Trustees' counsel, requests and considers a broad range of information relevant to the renewal of the Advisory Contracts throughout the year.
The Board meets regularly and, at each of its meetings, considers factors that are relevant to its annual consideration of the renewal of the fund's Advisory Contracts, including the services and support provided to the fund and its shareholders. The Board has established various standing committees, each composed of and chaired by Independent Trustees with varying backgrounds, to which the Board has assigned specific subject matter responsibilities in order to enhance effective decision-making by the Board. The Board, acting directly and through its Committees, requests and receives information concerning the annual consideration of the renewal of the fund's Advisory Contracts. The Board also meets as needed to consider matters specifically related to the Board's annual consideration of the renewal of Advisory Contracts. Members of the Board may also meet with trustees of other Fidelity funds through ad hoc joint committees to discuss certain matters relevant to the Fidelity funds.
At its July 2012 meeting, the Board of Trustees, including the Independent Trustees, unanimously determined to renew the fund's Advisory Contracts. In reaching its determination, the Board considered all factors it believed relevant, including (i) the nature, extent, and quality of the services to be provided to the fund and its shareholders (including the investment performance of the fund); (ii) the competitiveness of the fund's management fee and total expense ratio relative to peer funds; (iii) the total costs of the services to be provided by and the profits to be realized by Fidelity from its relationship with the fund; (iv) the extent to which economies of scale exist and would be realized as the fund grows; and (v) whether fee levels reflect these economies of scale, if any, for the benefit of fund shareholders.
In considering whether to renew the Advisory Contracts for the fund, the Board reached a determination, with the assistance of fund counsel and Independent Trustees' counsel and through the exercise of its business judgment, that the renewal of the Advisory Contracts is in the best interests of the fund and its shareholders and that the compensation payable under the Advisory Contracts is fair and reasonable. The Board's decision to renew the Advisory Contracts was not based on any single factor, but rather was based on a comprehensive consideration of all the information provided to the Board at its meetings throughout the year. The Board, in reaching its determination to renew the Advisory Contracts, is aware that shareholders in the fund have a broad range of investment choices available to them, including a wide choice among mutual funds offered by Fidelity's competitors, and that the fund's shareholders, who have the opportunity to review and weigh the disclosure provided by the fund in its prospectus and other public disclosures, have chosen to invest in this fund, managed by Fidelity.
Nature, Extent, and Quality of Services Provided. The Board considered the staffing within the investment adviser, FMR, and the sub-advisers (together, the Investment Advisers), including the backgrounds of the fund's investment personnel, and also considered the fund's investment objective, strategies, and related investment philosophy. The Independent Trustees also had discussions with senior management of Fidelity's investment operations and investment groups. The Board considered the structure of the portfolio manager compensation program and whether this structure provides appropriate incentives to act in the best interests of the fund.
Resources Dedicated to Investment Management and Support Services. The Board and the Fund Oversight and Research Committees reviewed the general qualifications and capabilities of the Investment Advisers' investment staff, including its size, education, experience, and resources, as well as the Investment Advisers' approach to recruiting, training, managing, and compensating investment personnel. The Board also noted that FMR has continued to increase the resources devoted to non-U.S. offices, including expansion of Fidelity's global investment organization. The Board noted that Fidelity's analysts have extensive resources, tools and capabilities that allow them to conduct sophisticated quantitative and fundamental analysis, as well as credit analysis of issuers, counterparties and guarantors. The Board also believes that Fidelity's investment professionals have sufficient access to global information and data so as to provide competitive investment results over time, and that those professionals also have access to sophisticated tools that permit them to assess portfolio construction and risk and performance attribution characteristics continuously, as well as to transmit new information and research conclusions rapidly around the world. Additionally, in its deliberations, the Board considered the Investment Advisers' trading and risk management capabilities and resources, which are an integral part of the investment management process.
Shareholder and Administrative Services. The Board considered (i) the nature, extent, quality, and cost of advisory, administrative, and shareholder services performed by the Investment Advisers and their affiliates under the Advisory Contracts and under separate agreements covering transfer agency, pricing and bookkeeping, and securities lending services for the fund; (ii) the nature and extent of the supervision of third party service providers, principally custodians and subcustodians; and (iii) the resources devoted to, and the record of compliance with, the fund's compliance policies and procedures. The Board also reviewed the allocation of fund brokerage, including allocations to brokers affiliated with the Investment Advisers, the use of brokerage commissions to pay fund expenses, and the use of "soft" commission dollars to pay for research services.
The Board noted that the growth of fund assets over time across the complex allows Fidelity to reinvest in the development of services designed to enhance the value or convenience of the Fidelity funds as investment vehicles. These services include 24-hour access to account information and market information through telephone representatives and over the Internet, investor education materials and asset allocation tools, and the expanded availability of Fidelity Investor Centers.
Annual Report
Investment in a Large Fund Family. The Board considered the benefits to shareholders of investing in a Fidelity fund, including the benefits of investing in a fund that is part of a large family of funds offering a variety of investment disciplines and providing a large variety of mutual fund investor services. The Board noted that Fidelity had taken, or had made recommendations that resulted in the Fidelity funds taking, a number of actions over the previous year that benefited particular funds, including (i) continuing to dedicate additional resources to investment research and support of the senior management team that oversees asset management; (ii) persisting in efforts to enhance Fidelity's research capabilities, in particular, international research; (iii) launching new funds and making other enhancements to meet client needs for global and income-oriented solutions; (iv) continuing to launch dedicated lower cost underlying funds to meet investment management's portfolio construction needs related to expanding underlying fund options, specifically for the Freedom Fund product lines; (v) adopting a "Stock Selector" sector neutral investment approach and employing a team of portfolio managers who are sector specialists to manage certain funds; (vi) rationalizing product lines and gaining increased efficiencies through the mergers of several funds into other funds; (vii) strengthening the Spartan Index Fund product line by adding new funds and/or new low-cost institutional share classes, restructuring fund expenses to accommodate new classes, and reducing investment minimums for certain classes of shares; (viii) modifying the eligibility criteria for Institutional Class shares to increase their appeal to government entities and charitable investors; and (ix) reducing certain transfer agent fee rates.
Investment Performance. The Board considered whether the fund has operated in accordance with its investment objective, as well as its record of compliance with its investment restrictions. It also reviewed the fund's absolute investment performance for each class, as well as the fund's relative investment performance for each class measured over multiple periods against a broad-based securities market index. The Board noted that FMR believes that no meaningful peer group exists for the fund. The following charts considered by the Board show, over the one-, three-, and five-year periods ended December 31, 2011, as available, the cumulative total returns of the retail class and Class B of the fund and the cumulative total returns of a broad-based securities market index ("benchmark"). The returns of the retail class and Class B show the performance of the highest performing class (based on five-year performance) and the lowest performing class (based on three-year performance), respectively.
Fidelity China Region Fund

The Board noted that the investment performance of the retail class of the fund compared favorably to its benchmark for the three- and five-year periods, although the fund's one-year total return was lower than its benchmark. The Board considered that the variations in performance among the fund's classes reflect the variations in class expenses, which result in lower performance for higher expense classes. The Board noted that there was a portfolio management change for the fund in October 2011. The Board also reviewed the fund's performance since inception as well as performance in the current year.
Based on its review, the Board concluded that the nature, extent, and quality of services provided to the fund under the Advisory Contracts should benefit the fund's shareholders.
Competitiveness of Management Fee and Total Expense Ratio. The Board considered the fund's management fee and total expense ratio compared to "mapped groups" of competitive funds and classes. Fidelity creates "mapped groups" by combining similar Lipper investment objective categories that have comparable management fee characteristics. Combining Lipper investment objective categories aids the Board's management fee and total expense ratio comparisons by broadening the competitive group used for comparison and by reducing the number of universes to which various Fidelity funds are compared.
Annual Report
Board Approval of Investment Advisory Contracts and Management Fees - continued
Management Fee. The Board considered two proprietary management fee comparisons for the 12-month periods shown in the chart below. The group of Lipper funds used by the Board for management fee comparisons is referred to below as the "Total Mapped Group." The Total Mapped Group comparison focuses on a fund's standing relative to the total universe of comparable funds available to investors in terms of gross management fees before expense reimbursements or caps. "TMG %" represents the percentage of funds in the Total Mapped Group that had management fees that were lower than the fund's. For example, a TMG % of 7% means that 93% of the funds in the Total Mapped Group had higher management fees than the fund. The "Asset-Size Peer Group" (ASPG) comparison focuses on a fund's standing relative to non-Fidelity funds similar in size to the fund within the Total Mapped Group. The ASPG represents at least 15% of the funds in the Total Mapped Group with comparable asset size and management fee characteristics, subject to a minimum of 50 funds (or all funds in the Total Mapped Group if fewer than 50). Additional information, such as the ASPG quartile in which the fund's management fee ranked, is also included in the chart and considered by the Board.
Fidelity China Region Fund

The Board noted that the fund's management fee ranked below the median of its Total Mapped Group and below the median of its ASPG for 2011.
Based on its review, the Board concluded that the fund's management fee is fair and reasonable in light of the services that the fund receives and the other factors considered.
Total Expense Ratio. In its review of each class's total expense ratio, the Board considered the fund's management fee as well as other fund or class expenses, as applicable, such as transfer agent fees, pricing and bookkeeping fees, fund-paid 12b-1 fees, and custodial, legal, and audit fees. The Board also noted the effects of any waivers and reimbursements on fees and expenses. As part of its review, the Board also considered the current and historical total expense ratios of each class of the fund compared to competitive fund median expenses. Each class of the fund is compared to those funds and classes in the Total Mapped Group (used by the Board for management fee comparisons) that have a similar sales load structure.
The Board noted that the total expense ratio of each class ranked below its competitive median for 2011.
Fees Charged to Other Fidelity Clients. The Board also considered Fidelity fee structures and other information with respect to clients of FMR and its affiliates, such as other mutual funds advised or subadvised by FMR or its affiliates, pension plan clients, and other institutional clients. The Board noted the findings of the 2010 ad hoc joint committee (created with the board of other Fidelity funds), which reviewed and compared Fidelity's institutional investment advisory business with its business of providing services to the Fidelity funds, including the differences in services provided, fees charged, and costs incurred, as well as competition in their respective marketplaces.
Based on its review of total expense ratios and fees charged to other Fidelity clients, the Board concluded that the total expense ratio of each class of the fund was reasonable in light of the services that the fund and its shareholders receive and the other factors considered.
Costs of the Services and Profitability. The Board considered the revenues earned and the expenses incurred by Fidelity in conducting the business of developing, marketing, distributing, managing, administering and servicing the fund and its shareholders. The Board also considered the level of Fidelity's profits in respect of all the Fidelity funds.
On an annual basis, FMR presents to the Board Fidelity's profitability for the fund. Fidelity calculates the profitability for each fund, as well as aggregate profitability for groups of Fidelity funds and all Fidelity funds, using a series of detailed revenue and cost allocation methodologies which originate with the books and records of Fidelity on which Fidelity's audited financial statements are based. The Audit Committee of the Board reviews any significant changes from the prior year's methodologies.
Annual Report
PricewaterhouseCoopers LLP (PwC), independent registered public accounting firm and auditor to Fidelity and certain Fidelity funds, has been engaged annually by the Board as part of the Board's assessment of Fidelity's profitability analysis. PwC's engagement includes the review and assessment of Fidelity's methodologies used in determining the revenues and expenses attributable to Fidelity's mutual fund business, and completion of agreed-upon procedures surrounding the mathematical accuracy of fund profitability and its conformity to allocation methodologies. After considering PwC's reports issued under the engagement and information provided by Fidelity, the Board concluded that while other allocation methods may also be reasonable, Fidelity's profitability methodologies are reasonable in all material respects.
The Board also reviewed Fidelity's non-fund businesses and fall-out benefits related to the mutual fund business as well as cases where Fidelity's affiliates may benefit from or be related to the fund's business.
The Board considered the costs of the services provided by and the profits realized by Fidelity in connection with the operation of the fund and was satisfied that the profitability was not excessive in the circumstances.
Economies of Scale. The Board considered whether there have been economies of scale in respect of the management of the Fidelity funds, whether the Fidelity funds (including the fund) have appropriately benefited from any such economies of scale, and whether there is potential for realization of any further economies of scale. The Board considered the extent to which the fund will benefit from economies of scale through increased services to the fund, through waivers or reimbursements, or through fee or expense reductions. The Board also noted that in 2009, it and the board of other Fidelity funds created an ad hoc committee (the Economies of Scale Committee) to analyze whether FMR attains economies of scale in respect of the management and servicing of the Fidelity funds, whether the Fidelity funds have appropriately benefited from such economies of scale, and whether there is potential for realization of any further economies of scale.
The Board recognized that the fund's management contract incorporates a "group fee" structure, which provides for lower group fee rates as total fund assets under FMR's management increase, and for higher group fee rates as total fund assets under FMR's management decrease. FMR calculates the group fee rates based on a tiered asset "breakpoint" schedule that varies based on asset class. The Board considered that the group fee is designed to deliver the benefits of economies of scale to fund shareholders when total Fidelity fund assets increase, even if assets of any particular fund are unchanged or have declined, because some portion of Fidelity's costs are attributable to services provided to all Fidelity funds, and all funds benefit if those costs can be allocated among more assets. The Board concluded that, given the group fee structure, fund shareholders will benefit from lower management fees as assets under FMR's management increase at the fund complex level, regardless of whether Fidelity achieves any such economies of scale.
The Board concluded, taking into account the analysis of the Economies of Scale Committee, that economies of scale, if any, are being appropriately shared between fund shareholders and Fidelity.
Additional Information Requested by the Board. In order to develop fully the factual basis for consideration of the Fidelity funds' Advisory Contracts, the Board requested and received additional information on certain topics, including (i) fund performance trends, actions to be taken by FMR to improve certain funds' overall performance, and Fidelity's long-term strategies for certain funds; (ii) the potential to further rationalize the Fidelity fund lineup with the possibility of achieving savings for the funds and Fidelity; (iii) Fidelity's compensation structure for portfolio managers and other key investment personnel; (iv) the amount of the investment that each portfolio manager has made in the Fidelity fund(s) that he or she manages; (v) the realization of fall-out benefits in certain Fidelity business units; (vi) Fidelity's group fee structures, the potential impact of regulatory changes on such structures, and the rationale for the individual fee rates of certain funds; (vii) fund profitability methodology, including Fidelity's cost allocation methodology, and the impact of certain factors on fund profitability results; (viii) trends regarding industry use of performance fee structures and the possibility of implementing performance fee structures for additional funds; and (ix) the impact of net redemptions from the Fidelity funds.
Based on its evaluation of all of the conclusions noted above, and after considering all factors it believed relevant, the Board ultimately concluded that the advisory fee structures are fair and reasonable, and that the fund's Advisory Contracts should be renewed.
Annual Report
Investment Adviser
Fidelity Management & Research Company
Boston, MA
Investment Sub-Advisers
FMR Co., Inc.
Fidelity Management & Research
(U.K.) Inc.
FIL Investments (Japan) Limited
FIL Investment Advisors
FIL Investment Advisors
(UK) Limited
Fidelity Management & Research
(Hong Kong) Limited
Fidelity Management & Research
(Japan) Inc.
General Distributor
Fidelity Distributors Corporation
Smithfield, RI
Transfer and Service Agents
Fidelity Investments Institutional
Operations Company, Inc.
Boston, MA
Fidelity Service Company, Inc.
Boston, MA
Custodian
Brown Brothers Harriman & Co.,
Boston, MA
(Fidelity Investment logo)(registered trademark)
Corporate Headquarters
82 Devonshire St., Boston, MA 02109
www.fidelity.com
AHKCI-UANN-1212
1.861450.104
Fidelity®
Emerging Markets
Fund -
Class K
Annual Report
October 31, 2012
(Fidelity Cover Art)
Contents
Performance | (Click Here) | How the fund has done over time. |
Management's Discussion of Fund Performance | (Click Here) | The Portfolio Manager's review of fund performance and strategy. |
Shareholder Expense Example | (Click Here) | An example of shareholder expenses. |
Investment Changes | (Click Here) | A summary of major shifts in the fund's investments over the past six months. |
Investments | (Click Here) | A complete list of the fund's investments with their market values. |
Financial Statements | (Click Here) | Statements of assets and liabilities, operations, and changes in net assets, as well as financial highlights. |
Notes | (Click Here) | Notes to the financial statements. |
Report of Independent Registered Public Accounting Firm | (Click Here) | |
Trustees and Officers | (Click Here) | |
Distributions | (Click Here) | |
Board Approval of Investment Advisory Contracts and Management Fees | (Click Here) | |
To view a fund's proxy voting guidelines and proxy voting record for the 12-month period ended June 30, visit http://www.fidelity.com/proxyvotingresults or visit the Securities and Exchange Commission's (SEC) web site at http://www.sec.gov. You may also call 1-800-835-5092 to request a free copy of the proxy voting guidelines.
Standard & Poor's, S&P and S&P 500 are registered service marks of The McGraw-Hill Companies, Inc. and have been licensed for use by Fidelity Distributors Corporation.
Other third party marks appearing herein are the property of their respective owners.
All other marks appearing herein are registered or unregistered trademarks or service marks of FMR LLC or an affiliated company. © 2012 FMR LLC. All rights reserved.
This report and the financial statements contained herein are submitted for the general information of the shareholders of the fund. This report is not authorized for distribution to prospective investors in the fund unless preceded or accompanied by an effective prospectus.
A fund files its complete schedule of portfolio holdings with the SEC for the first and third quarters of each fiscal year on Form N-Q. Forms N-Q are available on the SEC's web site at http://www.sec.gov. A fund's Forms N-Q may be reviewed and copied at the SEC's Public Reference Room in Washington, DC. Information regarding the operation of the SEC's Public Reference Room may be obtained by calling 1-800-SEC-0330. For a complete list of a fund's portfolio holdings, view the most recent holdings listing, semiannual report, or annual report on Fidelity's web site at http://www.fidelity.com, http://www.advisor.fidelity.com, or http://www.401k.com, as applicable.
NOT FDIC INSURED • MAY LOSE VALUE • NO BANK GUARANTEE
Neither the fund nor Fidelity Distributors Corporation is a bank.
Annual Report
Average annual total return reflects the change in the value of an investment, assuming reinvestment of the class' distributions from dividend income and capital gains (the profits earned upon the sale of securities that have grown in value, if any) and assuming a constant rate of performance each year. The $10,000 table and the fund's returns do not reflect the deduction of taxes that a shareholder would pay on fund distributions or the redemption of fund shares. During periods of reimbursement by Fidelity, a fund's total return will be greater than it would be had the reimbursement not occurred. How a fund did yesterday is no guarantee of how it will do tomorrow.
Average Annual Total Returns
Periods ended October 31, 2012 | Past 1
year | Past 5
years | Past 10
years |
Class K A | 1.25% | -7.95% | 13.98% |
A The initial offering of Class K shares took place on May 9, 2008. Returns prior to May 9, 2008, are those of Fidelity® Emerging Markets Fund, the original class of the fund.
$10,000 Over 10 Years
Let's say hypothetically that $10,000 was invested in Fidelity® Emerging Markets Fund - Class K on October 31, 2002. The chart shows how the value of your investment would have changed, and also shows how the MSCI® Emerging Markets Index performed over the same period. The initial offering of Class K took place on May 9, 2008. See above for additional information regarding the performance of Class K.
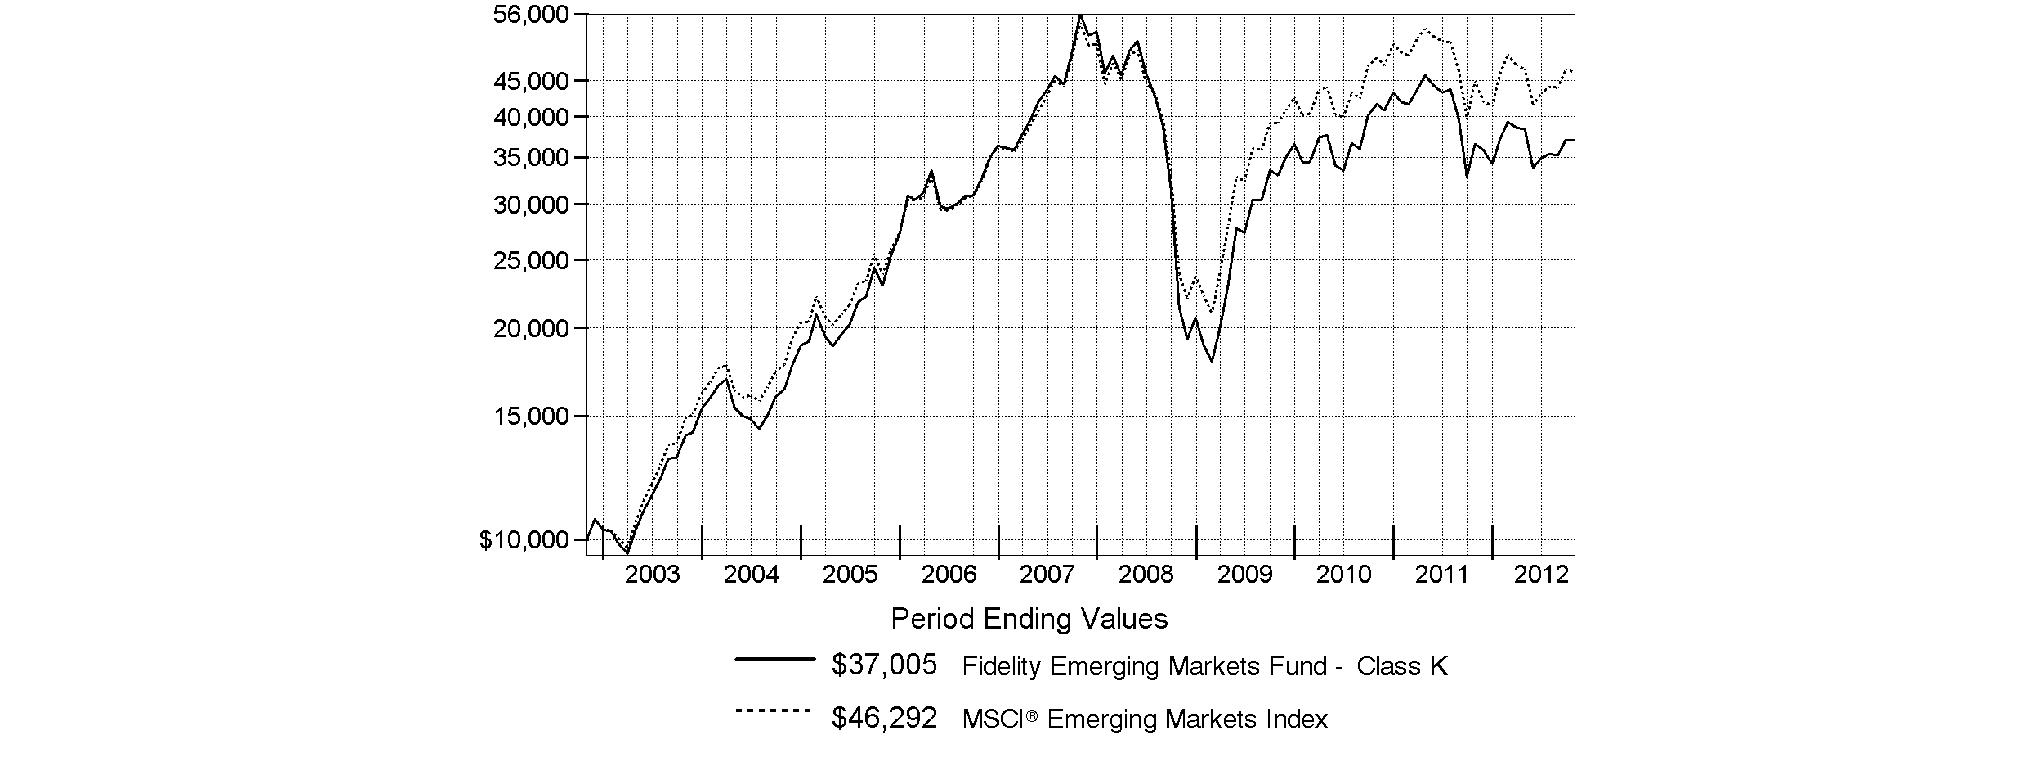
Annual Report
Market Recap: Emerging-markets stocks gained 2.98% for the year ending October 31, 2012, as measured by the MSCI® Emerging Markets Index. After some early choppiness, the index rallied strongly in the first two months of 2012 but retreated from March through May amid renewed concerns about Europe's sovereign debt crisis and continued economic sluggishness in key countries such as China and Brazil. A general uptrend in the final five months of the period lifted the index into positive territory for the full year, despite the head wind of a generally stronger U.S. dollar. Major benchmark component Brazil was a drag on performance, falling roughly 13%. The nation's inflation rate crept higher while economic growth ebbed, creating an unfavorable backdrop for stocks here. India's market retreated about 5%, while Russia gave up 4%. Conversely, Hong Kong advanced approximately 17%, aided by rebounding shares of property developers, while South Africa added 7%, China rose roughly 5% and South Korea and Taiwan gained about 4% and 1%, respectively. Sentiment about Chinese stocks improved following the government's September approval of massive outlays for infrastructure projects, in hopes of halting that nation's economic slowdown. However, China's ongoing transition to new Communist Party leadership created uncertainty that kept some investors on the sidelines.
Comments from Robert von Rekowsky, Portfolio Manager of Fidelity® Emerging Markets Fund for most of the period: For the year, the fund's Class K shares returned 1.25%, lagging the MSCI index. Relative performance was hurt the most by out-of-benchmark exposure to emerging-markets stocks listed in the United States, the United Kingdom and Canada, along with my picks in Taiwan and Hong Kong. Important individual detractors included OGX Petroleo e Gas Participacoes, a Brazilian producer of crude oil and natural gas. Given the company's significant downward revisions in its production and earnings targets, I sold the stock. Similar comments apply to an out-of-index position in Canadian gold-mining stock Eldorado Gold, which I also sold. Further weighing on our results was a non-index stake in China-based Yantai Changyu Pioneer Wine and underweighting the strong-performing shares of Taiwan Semiconductor Manufacturing. Conversely, stock selection in Indonesia helped. An out-of-benchmark stake in Indonesian cellular tower operator Tower Bersama Infrastructure paid off, as did underweighting Brazilian iron ore and nickel producer Vale and a sizable overweighting in Chinese automaker Great Wall Motor, which outperformed.
Note to shareholders: On October 1, 2012, Sammy Simnegar became Portfolio Manager of the fund.
The views expressed above reflect those of the portfolio manager(s) only through the end of the period as stated on the cover of this report and do not necessarily represent the views of Fidelity or any other person in the Fidelity organization. Any such views are subject to change at any time based upon market or other conditions and Fidelity disclaims any responsibility to update such views. These views may not be relied on as investment advice and, because investment decisions for a Fidelity fund are based on numerous factors, may not be relied on as an indication of trading intent on behalf of any Fidelity fund.
Annual Report
Fidelity Emerging Markets Fund
As a shareholder of the Fund, you incur two types of costs: (1) transaction costs, including redemption fees and (2) ongoing costs, including management fees and other Fund expenses. This Example is intended to help you understand your ongoing costs (in dollars) of investing in the Fund and to compare these costs with the ongoing costs of investing in other mutual funds.
The Example is based on an investment of $1,000 invested at the beginning of the period and held for the entire period (May 1, 2012 to October 31, 2012).
Actual Expenses
The first line of the accompanying table for each class of the Fund provides information about actual account values and actual expenses. You may use the information in this line, together with the amount you invested, to estimate the expenses that you paid over the period. Simply divide your account value by $1,000.00 (for example, an $8,600 account value divided by $1,000.00 = 8.6), then multiply the result by the number in the first line for a class of the Fund under the heading entitled "Expenses Paid During Period" to estimate the expenses you paid on your account during this period. A small balance maintenance fee of $12.00 that is charged once a year may apply for certain accounts with a value of less than $2,000. This fee is not included in the table below. If it was, the estimate of expenses you paid during the period would be higher, and your ending account value lower, by this amount. In addition, the Fund, as a shareholder in the underlying Fidelity Central Funds, will indirectly bear its pro-rata share of the fees and expenses incurred by the underlying Fidelity Central Funds. These fees and expenses are not included in the Fund's annualized expense ratio used to calculate the expense estimate in the table below.
Hypothetical Example for Comparison Purposes
The second line of the accompanying table for each class of the Fund provides information about hypothetical account values and hypothetical expenses based on a Class' actual expense ratio and an assumed rate of return of 5% per year before expenses, which is not the Class' actual return. The hypothetical account values and expenses may not be used to estimate the actual ending account balance or expenses you paid for the period. You may use this information to compare the ongoing costs of investing in the Fund and other funds. To do so, compare this 5% hypothetical example with the 5% hypothetical examples that appear in the shareholder reports of the other funds. A small balance maintenance fee of $12.00 that is charged once a year may apply for certain accounts with a value of less than $2,000. This fee is not included in the table below. If it was, the estimate of expenses you paid during the period would be higher, and your ending account value lower, by this amount. In addition, the Fund, as a shareholder in the underlying Fidelity Central Funds, will indirectly bear its pro-rata share of the fees and expenses incurred by the underlying Fidelity Central Funds. These fees and expenses are not included in the Fund's annualized expense ratio used to calculate the expense estimate in the table below.
Please note that the expenses shown in the table are meant to highlight your ongoing costs only and do not reflect any transaction costs. Therefore, the second line of the table is useful in comparing ongoing costs only, and will not help you determine the relative total costs of owning different funds. In addition, if these transactional costs were included, your costs would have been higher.
| Annualized
Expense Ratio | Beginning
Account Value
May 1, 2012 | Ending
Account Value
October 31, 2012 | Expenses Paid
During Period*
May 1, 2012
to October 31, 2012 |
Emerging Markets | 1.08% | | | |
Actual | | $ 1,000.00 | $ 965.10 | $ 5.33 |
HypotheticalA | | $ 1,000.00 | $ 1,019.71 | $ 5.48 |
Class K | .87% | | | |
Actual | | $ 1,000.00 | $ 966.00 | $ 4.30 |
HypotheticalA | | $ 1,000.00 | $ 1,020.76 | $ 4.42 |
A 5% return per year before expenses
* Expenses are equal to each Class' annualized expense ratio, multiplied by the average account value over the period, multiplied by 184/366 (to reflect the one-half year period).
Annual Report
Fidelity Emerging Markets Fund
Investment Changes (Unaudited)
Geographic Diversification (% of fund's net assets) |
As of October 31, 2012 |
 | Korea (South) | 13.3% | |
 | Brazil | 12.2% | |
 | India | 7.8% | |
 | Indonesia | 7.2% | |
 | United States of America | 5.9% | |
 | Cayman Islands | 5.8% | |
 | South Africa | 5.6% | |
 | Thailand | 4.0% | |
 | Russia | 3.9% | |
 | Other | 34.3% | |

Percentages are based on country or territory of incorporation and are adjusted for the effect of futures contracts, if applicable. |
As of April 30, 2012 |
| Korea (South) | 20.3% | |
| Brazil | 10.8% | |
| Indonesia | 7.1% | |
| Taiwan | 6.7% | |
| China | 6.4% | |
| South Africa | 6.2% | |
| Cayman Islands | 5.9% | |
| Russia | 5.3% | |
| Hong Kong | 4.9% | |
| Other | 26.4% | |

Percentages are based on country or territory of incorporation and are adjusted for the effect of futures contracts, if applicable. |
Asset Allocation |
| % of fund's
net assets | % of fund's net assets
6 months ago |
Stocks and Investment Companies | 98.4 | 99.3 |
Bonds | 0.0 | 0.1 |
Short-Term Investments and Net Other Assets (Liabilities) | 1.6 | 0.6 |
Top Ten Stocks as of October 31, 2012 |
| % of fund's
net assets | % of fund's net assets
6 months ago |
Samsung Electronics Co. Ltd. (Korea (South), Semiconductors & Semiconductor Equipment) | 4.4 | 5.1 |
iShares MSCI Emerging Markets Index ETF (United States of America, Investment Companies) | 2.0 | 0.0 |
Vale SA (PN-A) (Brazil, Metals & Mining) | 1.7 | 0.7 |
Hyundai Motor Co. (Korea (South), Automobiles) | 1.6 | 2.0 |
Sberbank (Savings Bank of the Russian Federation) (Russia, Commercial Banks) | 1.6 | 1.4 |
Tencent Holdings Ltd. (Cayman Islands, Internet Software & Services) | 1.6 | 0.0 |
Itau Unibanco Holdings SA sponsored ADR (Brazil, Commercial Banks) | 1.5 | 0.0 |
CNOOC Ltd. (Hong Kong, Oil, Gas & Consumable Fuels) | 1.5 | 1.4 |
Companhia de Bebidas das Americas (AmBev) (PN) sponsored ADR (Brazil, Beverages) | 1.4 | 1.0 |
Taiwan Semiconductor Manufacturing Co. Ltd. (Taiwan, Semiconductors & Semiconductor Equipment) | 1.2 | 1.6 |
| 18.5 | |
Market Sectors as of October 31, 2012 |
| % of fund's
net assets | % of fund's net assets
6 months ago |
Financials | 22.3 | 20.5 |
Consumer Discretionary | 17.8 | 12.7 |
Information Technology | 13.5 | 14.6 |
Consumer Staples | 11.0 | 9.7 |
Materials | 10.4 | 9.5 |
Industrials | 9.5 | 8.7 |
Energy | 6.4 | 13.8 |
Telecommunication Services | 2.9 | 4.6 |
Health Care | 1.4 | 1.4 |
Utilities | 1.2 | 3.9 |
Annual Report
Fidelity Emerging Markets Fund
Investments October 31, 2012
Showing Percentage of Net Assets
Common Stocks - 96.1% |
| Shares | | Value |
Australia - 0.3% |
Iluka Resources Ltd. | 834,598 | | $ 8,594,236 |
Bailiwick of Jersey - 0.2% |
Randgold Resources Ltd. sponsored ADR | 51,100 | | 6,111,049 |
Bermuda - 1.8% |
Brilliance China Automotive Holdings Ltd. (a) | 7,674,000 | | 9,585,012 |
Credicorp Ltd. (NY Shares) | 234,732 | | 30,360,237 |
Digital China Holdings Ltd. (H Shares) | 3,854,000 | | 6,484,624 |
Great Eagle Holdings Ltd. | 1,232,000 | | 3,656,234 |
Jardine Matheson Holdings Ltd. | 8,000 | | 492,800 |
TOTAL BERMUDA | | 50,578,907 |
Brazil - 12.2% |
BR Malls Participacoes SA | 1,346,200 | | 17,697,024 |
Brasil Foods SA | 561,934 | | 10,223,018 |
CCR SA | 1,867,700 | | 16,423,585 |
Cetip SA - Mercados Organizado | 787,433 | | 9,072,121 |
Cielo SA | 786,100 | | 19,448,820 |
Companhia Brasileira de Distribuicao Grupo Pao de Acucar sponsored ADR (d) | 323,819 | | 15,135,300 |
Companhia de Bebidas das Americas (AmBev) (PN) sponsored ADR | 974,334 | | 39,743,084 |
Companhia de Saneamento Basico do Estado de Sao Paulo (SABESP) | 227,355 | | 9,624,570 |
Companhia de Saneamento de Minas Gerais | 475,717 | | 11,228,612 |
Gerdau SA sponsored ADR | 1,561,874 | | 13,728,872 |
Itau Unibanco Holdings SA sponsored ADR | 2,893,600 | | 42,188,688 |
Localiza Rent A Car SA | 32,300 | | 566,151 |
Mills Estruturas e Servicos de Engenharia SA | 519,700 | | 7,968,025 |
Multiplan Empreendimentos Imobiliarios SA | 624,367 | | 18,290,951 |
Multiplus SA | 801,910 | | 18,631,808 |
Qualicorp SA (a) | 1,137,600 | | 11,672,575 |
Souza Cruz SA | 26,767 | | 349,241 |
Totvs SA | 228,374 | | 4,643,828 |
Ultrapar Participacoes SA | 957,700 | | 20,087,157 |
Usinas Siderurgicas de Minas Gerais SA - Usiminas (PN-A) (non-vtg.) | 1,623,461 | | 7,841,339 |
Vale SA (PN-A) | 2,636,723 | | 47,189,819 |
TOTAL BRAZIL | | 341,754,588 |
British Virgin Islands - 1.1% |
Arcos Dorados Holdings, Inc. Class A | 1,067,435 | | 13,780,586 |
Gem Diamonds Ltd. (a) | 759,283 | | 2,067,682 |
Mail.ru Group Ltd. GDR (e) | 442,500 | | 14,757,375 |
TOTAL BRITISH VIRGIN ISLANDS | | 30,605,643 |
Canada - 0.4% |
Africa Oil Corp. (a) | 29,951 | | 297,486 |
|
| Shares | | Value |
First Quantum Minerals Ltd. | 430,268 | | $ 9,671,606 |
Ivanplats Ltd. Class A (f) | 549,975 | | 2,299,570 |
TOTAL CANADA | | 12,268,662 |
Cayman Islands - 5.8% |
Anta Sports Products Ltd. | 4,438,000 | | 3,779,434 |
Baidu.com, Inc. sponsored ADR (a) | 128,900 | | 13,743,318 |
Belle International Holdings Ltd. | 4,010,000 | | 7,471,487 |
Chailease Holding Co. Ltd. | 2,784,000 | | 4,956,111 |
Changyou.com Ltd. (A Shares) ADR | 223,219 | | 5,546,992 |
Country Garden Holdings Co. Ltd. | 1,446,106 | | 580,305 |
ENN Energy Holdings Ltd. | 244,000 | | 1,015,348 |
Eurasia Drilling Co. Ltd. GDR (Reg. S) | 470,291 | | 16,272,069 |
Golden Eagle Retail Group Ltd. (H Shares) | 2,923,000 | | 6,411,701 |
Hengan International Group Co. Ltd. | 1,846,000 | | 16,816,356 |
Hengdeli Holdings Ltd. | 44,860,000 | | 14,123,573 |
Intime Department Store Group Co. Ltd. | 2,884,000 | | 3,416,122 |
KWG Property Holding Ltd. | 3,842,500 | | 2,290,611 |
MStar Semiconductor, Inc. | 216,000 | | 1,830,195 |
NetEase.com, Inc. sponsored ADR (a) | 153,152 | | 8,270,208 |
Sands China Ltd. | 856,000 | | 3,219,644 |
SINA Corp. (a) | 106,400 | | 5,812,632 |
Tencent Holdings Ltd. | 1,258,300 | | 44,486,707 |
Vinda International Holdings Ltd. | 3,041,000 | | 4,245,601 |
TOTAL CAYMAN ISLANDS | | 164,288,414 |
Chile - 0.7% |
CAP SA | 217,106 | | 7,484,438 |
Sociedad Quimica y Minera de Chile SA (PN-B) sponsored ADR (d) | 194,647 | | 11,260,329 |
TOTAL CHILE | | 18,744,767 |
China - 3.2% |
Air China Ltd. (H Shares) | 6,326,000 | | 4,489,390 |
China Communications Construction Co. Ltd. (H Shares) | 9,315,000 | | 8,738,015 |
China Communications Services Corp. Ltd. (H Shares) | 19,970,000 | | 11,260,431 |
China Minsheng Banking Corp. Ltd. (H Shares) | 15,847,000 | | 14,415,565 |
China Railway Construction Corp. Ltd. (H Shares) | 4,693,500 | | 4,663,189 |
China Shenhua Energy Co. Ltd. (H Shares) | 835,500 | | 3,557,590 |
Dongfeng Motor Group Co. Ltd. (H Shares) | 4,462,000 | | 5,527,087 |
Great Wall Motor Co. Ltd. (H Shares) | 8,433,500 | | 23,178,373 |
Huadian Power International Corp. Ltd. (H Shares) (a) | 12,364,000 | | 3,142,829 |
Tsingtao Brewery Co. Ltd. (H Shares) | 82,000 | | 443,326 |
Yantai Changyu Pioneer Wine Co. (B Shares) | 1,873,860 | | 9,499,805 |
TOTAL CHINA | | 88,915,600 |
Common Stocks - continued |
| Shares | | Value |
Colombia - 1.5% |
Almacenes Exito SA | 741,818 | | $ 14,141,719 |
BanColombia SA sponsored ADR | 174,049 | | 11,142,617 |
Ecopetrol SA ADR (d) | 296,500 | | 17,555,765 |
TOTAL COLOMBIA | | 42,840,101 |
Czech Republic - 0.3% |
Philip Morris CR A/S | 14,266 | | 7,643,421 |
Finland - 0.6% |
Kone Oyj (B Shares) (d) | 20,800 | | 1,489,536 |
Nokian Tyres PLC | 360,700 | | 14,960,682 |
TOTAL FINLAND | | 16,450,218 |
France - 0.5% |
LVMH Moet Hennessy - Louis Vuitton SA | 91,254 | | 14,832,171 |
Hong Kong - 2.6% |
AIA Group Ltd. | 125,400 | | 496,743 |
China Mobile Ltd. | 481,600 | | 5,341,785 |
CNOOC Ltd. | 20,334,000 | | 41,846,900 |
Dah Chong Hong Holdings Ltd. | 8,279,000 | | 7,808,916 |
Galaxy Entertainment Group Ltd. (a) | 1,617,000 | | 5,560,358 |
Guangdong Investment Ltd. | 9,818,000 | | 8,031,706 |
Shenzhen Investment Ltd. | 6,594,000 | | 1,752,716 |
Singamas Container Holdings Ltd. | 13,906,000 | | 3,516,850 |
TOTAL HONG KONG | | 74,355,974 |
India - 7.8% |
Axis Bank Ltd. | 534,804 | | 11,754,655 |
Bajaj Auto Ltd. | 325,108 | | 10,975,605 |
Bharat Heavy Electricals Ltd. | 1,834,291 | | 7,663,760 |
GlaxoSmithKline Pharmaceuticals Ltd. | 53,036 | | 1,976,344 |
HDFC Bank Ltd. | 1,040,389 | | 12,216,228 |
Hindustan Unilever Ltd. | 2,149,272 | | 21,834,254 |
Housing Development Finance Corp. Ltd. | 1,078,774 | | 15,284,887 |
ICICI Bank Ltd. | 1,222,397 | | 23,784,961 |
ITC Ltd. | 890,169 | | 4,674,607 |
Jaypee Infratech Ltd. | 2,914,167 | | 2,586,218 |
Larsen & Toubro Ltd. | 436,558 | | 13,199,784 |
Mahindra & Mahindra Financial Services Ltd. | 813,982 | | 13,111,002 |
Tata Consultancy Services Ltd. | 854,377 | | 20,889,005 |
Tata Motors Ltd. | 4,253,223 | | 20,225,370 |
Tata Steel Ltd. | 1,656,008 | | 12,071,115 |
Tech Mahindra Ltd. (a) | 245,142 | | 4,321,251 |
Titan Industries Ltd. | 1,632,955 | | 7,869,626 |
Ultratech Cemco Ltd. | 430,479 | | 15,971,047 |
TOTAL INDIA | | 220,409,719 |
Indonesia - 7.2% |
PT AKR Corporindo Tbk | 980,500 | | 454,264 |
PT Astra International Tbk | 35,143,500 | | 29,453,824 |
PT Bank Central Asia Tbk | 579,500 | | 494,730 |
PT Bank Mandiri (Persero) Tbk | 27,768,000 | | 23,850,602 |
|
| Shares | | Value |
PT Bank Rakyat Indonesia Tbk | 37,260,000 | | $ 28,706,177 |
PT Bank Tabungan Negara Tbk | 177,500 | | 28,089 |
PT Bumi Serpong Damai Tbk | 62,585,400 | | 8,079,705 |
PT Ciputra Development Tbk | 3,464,500 | | 245,273 |
PT Gadjah Tunggal Tbk | 6,986,500 | | 1,582,048 |
PT Global Mediacom Tbk | 56,864,000 | | 13,468,511 |
PT Indocement Tunggal Prakarsa Tbk | 8,437,500 | | 18,798,723 |
PT Indofood Sukses Makmur Tbk | 6,511,000 | | 4,846,794 |
PT Jasa Marga Tbk | 9,787,500 | | 5,910,178 |
PT Media Nusantara Citra Tbk | 3,430,000 | | 1,008,819 |
PT Mitra Adiperkasa Tbk | 19,720,000 | | 13,447,731 |
PT Pembangunan Perumahan Persero Tbk | 16,021,500 | | 1,284,383 |
PT Resource Alam Indonesia Tbk | 8,074,000 | | 2,395,711 |
PT Semen Gresik (Persero) Tbk | 9,173,000 | | 14,229,789 |
PT Summarecon Agung Tbk | 1,465,500 | | 267,008 |
PT Telkomunikasi Indonesia Tbk Series B | 5,655,500 | | 5,744,037 |
PT Tower Bersama Infrastructure Tbk (a) | 37,424,865 | | 19,481,888 |
PT United Tractors Tbk | 4,048,000 | | 8,892,497 |
PT Wijaya Karya Persero Tbk | 7,813,500 | | 1,114,466 |
TOTAL INDONESIA | | 203,785,247 |
Ireland - 0.3% |
Dragon Oil PLC | 870,100 | | 7,792,888 |
Israel - 1.0% |
Check Point Software Technologies Ltd. (a) | 338,460 | | 15,071,624 |
Israel Chemicals Ltd. | 1,067,200 | | 13,354,942 |
TOTAL ISRAEL | | 28,426,566 |
Italy - 0.4% |
Prada SpA | 1,450,500 | | 11,828,517 |
Japan - 0.0% |
Fanuc Corp. | 3,500 | | 557,247 |
Korea (South) - 13.3% |
Cheil Worldwide, Inc. | 25,820 | | 497,304 |
CJ Corp. | 24,943 | | 2,436,376 |
Cosmax, Inc. | 6,480 | | 289,137 |
DGB Financial Group Co. Ltd. | 393,540 | | 4,980,971 |
Dongbu Insurance Co. Ltd. | 267,210 | | 12,118,952 |
Grand Korea Leisure Co. Ltd. | 42,920 | | 1,208,493 |
Hana Financial Group, Inc. | 160,710 | | 4,679,858 |
Honam Petrochemical Corp. | 12,930 | | 2,644,536 |
Hotel Shilla Co. | 314,713 | | 13,277,569 |
Hyundai Glovis Co. Ltd. | 8,608 | | 1,792,149 |
Hyundai Heavy Industries Co. Ltd. | 88,694 | | 18,628,410 |
Hyundai Hysco Co. Ltd. | 388,360 | | 15,529,842 |
Hyundai Mobis | 44,867 | | 11,439,785 |
Hyundai Motor Co. | 220,399 | | 45,380,786 |
Hyundai Wia Corp. | 25,092 | | 4,061,870 |
Industrial Bank of Korea | 643,160 | | 7,078,583 |
Interflex Co. Ltd. | 4,601 | | 262,475 |
Kia Motors Corp. | 521,053 | | 28,960,135 |
Korea Zinc Co. Ltd. | 4,236 | | 1,740,524 |
Common Stocks - continued |
| Shares | | Value |
Korea (South) - continued |
KT Corp. | 12,310 | | $ 417,989 |
KT&G Corp. | 241,611 | | 18,414,663 |
LG Chemical Ltd. | 83,338 | | 23,388,941 |
LG Corp. | 75,855 | | 4,633,450 |
Lotte Samkang Co. Ltd. | 15,336 | | 10,281,951 |
NHN Corp. | 2,225 | | 515,273 |
Samsung C&T Corp. | 82,372 | | 4,480,024 |
Samsung Electronics Co. Ltd. | 102,273 | | 122,879,192 |
Samsung Heavy Industries Ltd. | 74,960 | | 2,292,828 |
Silicon Works Co. Ltd. | 87,326 | | 2,238,574 |
SK Energy Co. Ltd. | 2,948 | | 433,959 |
Sung Kwang Bend Co. Ltd. | 235,711 | | 5,707,289 |
TK Corp. (a) | 91,531 | | 2,321,183 |
TOTAL KOREA (SOUTH) | | 375,013,071 |
Luxembourg - 0.5% |
L'Occitane Ltd. | 4,051,000 | | 12,623,357 |
Malaysia - 0.3% |
Bumiputra-Commerce Holdings Bhd | 190,200 | | 476,437 |
Malayan Banking Bhd | 2,652,100 | | 7,862,266 |
TOTAL MALAYSIA | | 8,338,703 |
Mexico - 3.1% |
CEMEX SA de CV sponsored ADR | 1,749,940 | | 15,819,458 |
Coca-Cola FEMSA SAB de CV Series L | 322,685 | | 4,135,957 |
Fomento Economico Mexicano SAB de CV unit | 1,498,100 | | 13,491,366 |
Grupo Financiero Banorte SAB de CV Series O | 3,860,500 | | 21,448,860 |
Grupo Mexico SA de CV Series B | 2,869,031 | | 9,193,871 |
Grupo Televisa SA de CV | 5,127,457 | | 23,307,335 |
TOTAL MEXICO | | 87,396,847 |
Netherlands - 0.6% |
ASML Holding NV (Netherlands) | 77,500 | | 4,260,351 |
Yandex NV (a) | 529,500 | | 12,326,760 |
TOTAL NETHERLANDS | | 16,587,111 |
Nigeria - 0.6% |
Guaranty Trust Bank PLC GDR (Reg. S) | 2,876,489 | | 17,834,232 |
Panama - 0.9% |
Banco Latinoamericano de Exporaciones SA (BLADEX) Series E | 334,992 | | 7,537,320 |
Copa Holdings SA Class A | 177,200 | | 16,447,704 |
TOTAL PANAMA | | 23,985,024 |
Philippines - 2.6% |
Alliance Global Group, Inc. | 17,480,300 | | 6,328,634 |
Ayala Corp. | 471,140 | | 5,078,224 |
International Container Terminal Services, Inc. | 8,189,630 | | 14,147,536 |
Manila Water Co., Inc. | 2,015,100 | | 1,421,847 |
Metropolitan Bank & Trust Co. | 2,733,240 | | 6,317,708 |
|
| Shares | | Value |
Philippine National Bank (a) | 2,173,910 | | $ 3,808,309 |
PUREGOLD Price Club, Inc. | 6,059,500 | | 4,415,621 |
Security Bank Corp. | 4,334,780 | | 17,075,447 |
SM Investments Corp. | 338,620 | | 6,615,860 |
SM Prime Holdings, Inc. | 23,060,100 | | 8,135,558 |
TOTAL PHILIPPINES | | 73,344,744 |
Poland - 0.5% |
Bank Polska Kasa Opieki SA | 315,900 | | 15,168,424 |
Russia - 3.6% |
Magnit OJSC GDR (Reg. S) | 16,600 | | 589,300 |
Mechel Steel Group OAO sponsored ADR | 137,815 | | 875,125 |
Mobile TeleSystems OJSC sponsored ADR | 422,061 | | 7,234,126 |
NOVATEK OAO GDR (Reg. S) | 193,758 | | 22,088,412 |
Sberbank (Savings Bank of the Russian Federation) | 15,341,500 | | 44,911,019 |
Tatneft OAO sponsored ADR | 168,500 | | 6,527,690 |
TNK-BP Holding | 172,236 | | 351,605 |
Uralkali OJSC GDR (Reg. S) | 456,400 | | 17,881,752 |
TOTAL RUSSIA | | 100,459,029 |
Singapore - 0.4% |
Keppel Corp. Ltd. | 1,258,000 | | 10,993,835 |
South Africa - 5.6% |
African Bank Investments Ltd. | 4,768,962 | | 16,126,353 |
AVI Ltd. | 1,754,243 | | 11,568,638 |
Bidvest Group Ltd. | 380,600 | | 9,084,114 |
FirstRand Ltd. | 4,424,260 | | 14,685,197 |
Foschini Ltd. | 302,764 | | 4,395,860 |
Imperial Holdings Ltd. | 906,370 | | 20,590,932 |
Life Healthcare Group Holdings Ltd. | 4,987,200 | | 18,860,211 |
Mr Price Group Ltd. | 1,095,801 | | 16,928,667 |
Nampak Ltd. | 964,381 | | 3,214,362 |
Naspers Ltd. Class N | 426,880 | | 27,713,611 |
Shoprite Holdings Ltd. | 455,500 | | 9,366,731 |
Tongaat Hulett Ltd. | 306,300 | | 4,804,346 |
TOTAL SOUTH AFRICA | | 157,339,022 |
Switzerland - 1.0% |
Compagnie Financiere Richemont SA Series A | 115,158 | | 7,468,639 |
Dufry AG (a) | 90,900 | | 11,536,970 |
Swatch Group AG (Bearer) | 19,710 | | 8,156,592 |
TOTAL SWITZERLAND | | 27,162,201 |
Taiwan - 3.6% |
ASUSTeK Computer, Inc. | 923,000 | | 9,890,414 |
Chipbond Technology Corp. | 2,998,000 | | 5,080,486 |
Far EasTone Telecommunications Co. Ltd. | 3,567,000 | | 8,230,599 |
MediaTek, Inc. | 821,188 | | 9,122,749 |
Novatek Microelectronics Corp. | 2,370,000 | | 8,925,026 |
Radiant Opto-Electronics Corp. | 1,097,620 | | 4,565,588 |
Common Stocks - continued |
| Shares | | Value |
Taiwan - continued |
Taiwan Semiconductor Manufacturing Co. Ltd. | 11,416,000 | | $ 34,788,211 |
Unified-President Enterprises Corp. | 10,937,710 | | 19,321,665 |
TOTAL TAIWAN | | 99,924,738 |
Thailand - 4.0% |
Advanced Info Service PCL (For. Reg.) | 3,405,000 | | 21,926,557 |
Asian Property Development PCL (For. Reg.) | 22,831,800 | | 6,476,578 |
Bangkok Bank Public Co. Ltd. (For. Reg.) | 1,944,600 | | 11,476,120 |
Bangkok Expressway PCL (For.Reg.) | 7,473,700 | | 6,762,151 |
Bumrungrad Hospital PCL (For. Reg.) | 1,280,700 | | 3,163,124 |
C.P. ALL PCL (For. Reg.) | 8,367,800 | | 10,845,127 |
Hemaraj Land & Development PCL | 12,652,700 | | 1,295,386 |
Home Product Center PCL (For. Reg.) | 20,589,700 | | 7,653,165 |
Kasikornbank PCL (For. Reg.) | 82,500 | | 484,187 |
PTT PCL (For. Reg.) | 1,169,600 | | 12,126,925 |
Siam Commercial Bank PCL (For. Reg.) | 5,491,000 | | 28,824,617 |
TOTAL THAILAND | | 111,033,937 |
Turkey - 3.3% |
Coca-Cola Icecek A/S | 719,327 | | 13,965,177 |
Enka Insaat ve Sanayi A/S | 2,440,000 | | 6,479,442 |
TAV Havalimanlari Holding A/S | 729,000 | | 3,619,582 |
Turk Hava Yollari AO (a) | 3,616,000 | | 8,371,771 |
Turkiye Garanti Bankasi A/S | 5,569,395 | | 26,596,386 |
Turkiye Halk Bankasi A/S | 2,103,000 | | 18,536,904 |
Turkiye Is Bankasi A/S Series C | 4,367,000 | | 14,861,199 |
Turkiye Petrol Rafinerile A/S | 32,000 | | 781,925 |
TOTAL TURKEY | | 93,212,386 |
United Arab Emirates - 0.1% |
NMC Health PLC | 1,233,181 | | 3,601,983 |
United Kingdom - 1.9% |
Afren PLC (a) | 1,231,300 | | 2,736,113 |
Aggreko PLC | 313,500 | | 10,877,078 |
Antofagasta PLC | 143,400 | | 2,908,846 |
British American Tobacco PLC (United Kingdom) | 61,600 | | 3,055,336 |
Ophir Energy PLC (a) | 976,996 | | 8,742,398 |
Prudential PLC | 42,420 | | 582,579 |
Standard Chartered PLC (United Kingdom) | 549,760 | | 12,983,809 |
Tullow Oil PLC | 476,500 | | 10,796,084 |
TOTAL UNITED KINGDOM | | 52,682,243 |
United States of America - 2.3% |
Colgate-Palmolive Co. | 130,650 | | 13,713,024 |
Cummins, Inc. | 100,540 | | 9,408,533 |
Freeport-McMoRan Copper & Gold, Inc. | 14,000 | | 544,320 |
Mead Johnson Nutrition Co. Class A | 198,160 | | 12,218,546 |
Philip Morris International, Inc. | 96,640 | | 8,558,438 |
|
| Shares | | Value |
Rockwood Holdings, Inc. | 95,248 | | $ 4,371,883 |
Yum! Brands, Inc. | 206,420 | | 14,472,106 |
TOTAL UNITED STATES OF AMERICA | | 63,286,850 |
TOTAL COMMON STOCKS (Cost $2,408,789,180) |
2,700,771,672
|
Nonconvertible Preferred Stocks - 0.3% |
| | | |
Russia - 0.3% |
Surgutneftegaz JSC
(Cost $11,137,681) | 15,516,000 | |
9,610,219
|
Investment Companies - 2.0% |
| | | |
United States of America - 2.0% |
iShares MSCI Emerging Markets Index ETF
(Cost $56,917,403) | 1,364,100 | |
56,078,151
|
Money Market Funds - 2.4% |
| | | |
Fidelity Cash Central Fund, 0.19% (b) | 29,919,473 | | 29,919,473 |
Fidelity Securities Lending Cash Central Fund, 0.19% (b)(c) | 38,537,213 | | 38,537,213 |
TOTAL MONEY MARKET FUNDS (Cost $68,456,686) |
68,456,686
|
TOTAL INVESTMENT PORTFOLIO - 100.8% (Cost $2,545,300,950) | | 2,834,916,728 |
NET OTHER ASSETS (LIABILITIES) - (0.8)% | | (23,242,128) |
NET ASSETS - 100% | $ 2,811,674,600 |
Security Type Abbreviations |
ETF | - | Exchange-Traded Fund |
Legend |
(a) Non-income producing |
(b) Affiliated fund that is available only to investment companies and other accounts managed by Fidelity Investments. The rate quoted is the annualized seven-day yield of the fund at period end. A complete unaudited listing of the fund's holdings as of its most recent quarter end is available upon request. In addition, each Fidelity Central Fund's financial statements, which are not covered by the Fund's Report of Independent Registered Public Accounting Firm, are available on the SEC's website or upon request. |
(c) Investment made with cash collateral received from securities on loan. |
(d) Security or a portion of the security is on loan at period end. |
(e) Security exempt from registration under Rule 144A of the Securities Act of 1933. These securities may be resold in transactions exempt from registration, normally to qualified institutional buyers. At the end of the period, the value of these securities amounted to $14,757,375 or 0.5% of net assets. |
(f) Restricted securities - Investment in securities not registered under the Securities Act of 1933 (excluding 144A issues). At the end of the period, the value of restricted securities (excluding 144A issues) amounted to $2,299,570 or 0.1% of net assets. |
Additional information on each restricted holding is as follows: |
Security | Acquisition Date | Acquisition Cost |
Ivanplats Ltd. Class A | 10/23/12 | $ 2,663,584 |
Affiliated Central Funds |
Information regarding fiscal year to date income earned by the Fund from investments in Fidelity Central Funds is as follows: |
Fund | Income earned |
Fidelity Cash Central Fund | $ 45,641 |
Fidelity Securities Lending Cash Central Fund | 257,878 |
Total | $ 303,519 |
Other Information |
Categorizations in the Schedule of Investments are based on country or territory of incorporation. |
The following is a summary of the inputs used, as of October 31, 2012, involving the Fund's assets and liabilities carried at fair value. The inputs or methodology used for valuing securities may not be an indication of the risk associated with investing in those securities. For more information on valuation inputs, and their aggregation into the levels used in the tables below, please refer to the Security Valuation section in the accompanying Notes to Financial Statements. |
Valuation Inputs at Reporting Date: |
Description | Total | Level 1 | Level 2 | Level 3 |
Investments in Securities: | | | | |
Equities: | | | | |
Consumer Discretionary | $ 503,188,373 | $ 482,963,003 | $ 20,225,370 | $ - |
Consumer Staples | 308,631,549 | 305,576,213 | 3,055,336 | - |
Energy | 184,000,896 | 142,153,996 | 41,846,900 | - |
Financials | 632,164,723 | 595,580,955 | 36,583,768 | - |
Health Care | 39,274,237 | 39,274,237 | - | - |
Industrials | 260,070,095 | 260,070,095 | - | - |
Information Technology | 380,161,678 | 341,113,116 | 39,048,562 | - |
Materials | 288,788,016 | 286,488,446 | 2,299,570 | - |
Telecommunication Services | 79,637,412 | 68,133,601 | 11,503,811 | - |
Utilities | 34,464,912 | 34,464,912 | - | - |
Investment Companies | 56,078,151 | 56,078,151 | - | - |
Money Market Funds | 68,456,686 | 68,456,686 | - | - |
Total Investments in Securities: | $ 2,834,916,728 | $ 2,680,353,411 | $ 154,563,317 | $ - |
The following is a summary of transfers between Level 1 and Level 2 for the period ended October 31, 2012. Transfers are assumed to have occurred at the beginning of the period, and are primarily attributable to the valuation techniques used for foreign equity securities, as discussed in the accompanying Notes to Financial Statements: |
Transfers | Total |
Level 1 to Level 2 | $ 0 |
Level 2 to Level 1 | $ 928,909,440 |
See accompanying notes which are an integral part of the financial statements.
Annual Report
Fidelity Emerging Markets Fund
Statement of Assets and Liabilities
| October 31, 2012 |
| | |
Assets | | |
Investment in securities, at value (including securities loaned of $36,461,919) - See accompanying schedule: Unaffiliated issuers (cost $2,476,844,264) | $ 2,766,460,042 | |
Fidelity Central Funds (cost $68,456,686) | 68,456,686 | |
Total Investments (cost $2,545,300,950) | | $ 2,834,916,728 |
Cash | | 3,018,397 |
Foreign currency held at value (cost $12,706,460) | | 12,719,558 |
Receivable for investments sold | | 86,822,118 |
Receivable for fund shares sold | | 2,169,307 |
Dividends receivable | | 5,305,231 |
Distributions receivable from Fidelity Central Funds | | 26,243 |
Other receivables | | 2,320,404 |
Total assets | | 2,947,297,986 |
| | |
Liabilities | | |
Payable for investments purchased | $ 88,056,191 | |
Payable for fund shares redeemed | 6,240,218 | |
Accrued management fee | 1,669,645 | |
Other affiliated payables | 627,056 | |
Other payables and accrued expenses | 493,063 | |
Collateral on securities loaned, at value | 38,537,213 | |
Total liabilities | | 135,623,386 |
| | |
Net Assets | | $ 2,811,674,600 |
Net Assets consist of: | | |
Paid in capital | | $ 2,814,999,392 |
Undistributed net investment income | | 34,119,316 |
Accumulated undistributed net realized gain (loss) on investments and foreign currency transactions | | (326,713,001) |
Net unrealized appreciation (depreciation) on investments and assets and liabilities in foreign currencies | | 289,268,893 |
Net Assets | | $ 2,811,674,600 |
Statement of Assets and Liabilities - continued
| October 31, 2012 |
| | |
Emerging Markets:
Net Asset Value, offering price and redemption price per share ($2,203,756,037 ÷ 99,491,943 shares) | | $ 22.15 |
| | |
Class K:
Net Asset Value, offering price and redemption price per share ($607,918,563 ÷ 27,441,326 shares) | | $ 22.15 |
See accompanying notes which are an integral part of the financial statements.
Annual Report
Fidelity Emerging Markets Fund
Financial Statements - continued
Statement of Operations
| Year ended October 31, 2012 |
| | |
Investment Income | | |
Dividends | | $ 86,522,575 |
Interest | | 105,837 |
Income from Fidelity Central Funds | | 303,519 |
Income before foreign taxes withheld | | 86,931,931 |
Less foreign taxes withheld | | (8,754,391) |
Total income | | 78,177,540 |
| | |
Expenses | | |
Management fee | $ 21,897,795 | |
Transfer agent fees | 7,021,581 | |
Accounting and security lending fees | 1,347,028 | |
Custodian fees and expenses | 1,845,693 | |
Independent trustees' compensation | 20,683 | |
Registration fees | 86,128 | |
Audit | 118,130 | |
Legal | 16,723 | |
Interest | 4,699 | |
Miscellaneous | 40,045 | |
Total expenses before reductions | 32,398,505 | |
Expense reductions | (1,950,839) | 30,447,666 |
Net investment income (loss) | | 47,729,874 |
Realized and Unrealized Gain (Loss) Net realized gain (loss) on: | | |
Investment securities: | | |
Unaffiliated issuers | 26,412,836 | |
Foreign currency transactions | (4,436,506) | |
Total net realized gain (loss) | | 21,976,330 |
Change in net unrealized appreciation (depreciation) on: Investment securities | (38,607,945) | |
Assets and liabilities in foreign currencies | 21,905 | |
Total change in net unrealized appreciation (depreciation) | | (38,586,040) |
Net gain (loss) | | (16,609,710) |
Net increase (decrease) in net assets resulting from operations | | $ 31,120,164 |
Statement of Changes in Net Assets
| Year ended
October 31,
2012 | Year ended
October 31,
2011 |
Increase (Decrease) in Net Assets | | |
Operations | | |
Net investment income (loss) | $ 47,729,874 | $ 63,930,762 |
Net realized gain (loss) | 21,976,330 | 283,847,843 |
Change in net unrealized appreciation (depreciation) | (38,586,040) | (874,036,776) |
Net increase (decrease) in net assets resulting from operations | 31,120,164 | (526,258,171) |
Distributions to shareholders from net investment income | (46,903,179) | (49,437,799) |
Distributions to shareholders from net realized gain | - | (24,690,435) |
Total distributions | (46,903,179) | (74,128,234) |
Share transactions - net increase (decrease) | (578,640,528) | (859,245,695) |
Redemption fees | 392,465 | 1,366,825 |
Total increase (decrease) in net assets | (594,031,078) | (1,458,265,275) |
| | |
Net Assets | | |
Beginning of period | 3,405,705,678 | 4,863,970,953 |
End of period (including undistributed net investment income of $34,119,316 and undistributed net investment income of $36,916,001, respectively) | $ 2,811,674,600 | $ 3,405,705,678 |
See accompanying notes which are an integral part of the financial statements.
Annual Report
Financial Highlights - Emerging Markets
Years ended October 31, | 2012 | 2011 | 2010 | 2009 | 2008 |
Selected Per-Share Data | | | | | |
Net asset value, beginning of period | $ 22.23 | $ 25.72 | $ 20.68 | $ 13.71 | $ 37.55 |
Income from Investment Operations | | | | | |
Net investment income (loss) B | .33 | .35 | .23 | .17 | .42 E |
Net realized and unrealized gain (loss) | (.11) | (3.48) | 5.05 | 7.03 | (22.73) |
Total from investment operations | .22 | (3.13) | 5.28 | 7.20 | (22.31) |
Distributions from net investment income | (.30) | (.24) | (.12) | (.24) | (.19) |
Distributions from net realized gain | - | (.13) | (.14) | - | (1.37) |
Total distributions | (.30) | (.37) | (.25) H | (.24) | (1.56) |
Redemption fees added to paid in capital B | - G | .01 | .01 | .01 | .03 |
Net asset value, end of period | $ 22.15 | $ 22.23 | $ 25.72 | $ 20.68 | $ 13.71 |
Total Return A | 1.03% | (12.33)% | 25.76% | 53.95% | (61.84)% |
Ratios to Average Net Assets C, F | | | | | |
Expenses before reductions | 1.09% | 1.07% | 1.14% | 1.16% | 1.07% |
Expenses net of fee waivers, if any | 1.09% | 1.07% | 1.14% | 1.16% | 1.07% |
Expenses net of all reductions | 1.03% | 1.01% | 1.09% | 1.10% | 1.02% |
Net investment income (loss) | 1.50% | 1.38% | 1.00% | 1.09% | 1.47% E |
Supplemental Data | | | | | |
Net assets, end of period (000 omitted) | $ 2,203,756 | $ 2,907,884 | $ 3,975,342 | $ 3,649,582 | $ 2,086,196 |
Portfolio turnover rate D | 176% | 122% | 85% | 88% | 63% |
A Total returns would have been lower if certain expenses had not been reduced during the applicable periods shown. B Calculated based on average shares outstanding during the period. C Fees and expenses of any underlying Fidelity Central Funds are not included in the Fund's expense ratio. The Fund indirectly bears its proportionate share of the expenses of any underlying Fidelity Central Funds. D Amount does not include the portfolio activity of any underlying Fidelity Central Funds. E Investment income per share reflects a large, non-recurring dividend which amounted to $.09 per share. Excluding this non-recurring dividend, the ratio of net investment income (loss) to average net assets would have been 1.17%. F Expense ratios reflect operating expenses of the class. Expenses before reductions do not reflect amounts reimbursed by the investment adviser or reductions from brokerage service arrangements or reductions from other expense offset arrangements and do not represent the amount paid by the class during periods when reimbursements or reductions occur. Expenses net of fee waivers reflect expenses after reimbursement by the investment adviser but prior to reductions from brokerage service arrangements or other expense offset arrangements. Expenses net of all reductions represent the net expenses paid by the class. G Amount represents less than $.01 per share. H Total distributions of $.25 per share is comprised of distributions from net investment income of $.116 and distributions from net realized gain of $.135 per share. |
Financial Highlights - Class K
Years ended October 31, | 2012 | 2011 | 2010 | 2009 | 2008 H |
Selected Per-Share Data | | | | | |
Net asset value, beginning of period | $ 22.23 | $ 25.75 | $ 20.69 | $ 13.72 | $ 31.99 |
Income from Investment Operations | | | | | |
Net investment income (loss) D | .37 | .40 | .28 | .22 | .15 G |
Net realized and unrealized gain (loss) | (.10) | (3.48) | 5.05 | 7.02 | (18.43) |
Total from investment operations | .27 | (3.08) | 5.33 | 7.24 | (18.28) |
Distributions from net investment income | (.35) | (.32) | (.15) | (.28) | - |
Distributions from net realized gain | - | (.13) | (.14) | - | - |
Total distributions | (.35) | (.45) | (.28) K | (.28) | - |
Redemption fees added to paid in capital D | - J | .01 | .01 | .01 | .01 |
Net asset value, end of period | $ 22.15 | $ 22.23 | $ 25.75 | $ 20.69 | $ 13.72 |
Total Return B, C | 1.25% | (12.17)% | 26.03% | 54.44% | (57.11)% |
Ratios to Average Net Assets E, I | | | | | |
Expenses before reductions | .87% | .87% | .90% | .91% | .92% A |
Expenses net of fee waivers, if any | .87% | .87% | .90% | .91% | .92% A |
Expenses net of all reductions | .81% | .80% | .84% | .84% | .87% A |
Net investment income (loss) | 1.72% | 1.58% | 1.24% | 1.35% | 2.02% A, G |
Supplemental Data | | | | | |
Net assets, end of period (000 omitted) | $ 607,919 | $ 497,821 | $ 888,629 | $ 270,075 | $ 87,427 |
Portfolio turnover rate F | 176% | 122% | 85% | 88% | 63% |
A Annualized B Total returns for periods of less than one year are not annualized. C Total returns would have been lower if certain expenses had not been reduced during the applicable periods shown. D Calculated based on average shares outstanding during the period. E Fees and expenses of any underlying Fidelity Central Funds are not included in the Fund's expense ratio. The Fund indirectly bears its proportionate share of the expenses of any underlying Fidelity Central Funds. F Amount does not include the portfolio activity of any underlying Fidelity Central Funds. G Investment income per share reflects a large, non-recurring dividend which amounted to $.02 per share. Excluding this non-recurring dividend, the ratio of net investment income (loss) to average net assets would have been 1.71%. H For the period May 9, 2008 (commencement of sale of shares) to October 31, 2008. I Expense ratios reflect operating expenses of the class. Expenses before reductions do not reflect amounts reimbursed by the investment adviser or reductions from brokerage service arrangements or reductions from other expense offset arrangements and do not represent the amount paid by the class during periods when reimbursements or reductions occur. Expense ratios before reductions for start-up periods may not be representative of longer-term operating periods. Expenses net of fee waivers reflect expenses after reimbursement by the investment adviser but prior to reductions from brokerage service arrangements or other expense offset arrangements. Expenses net of all reductions represent the net expenses paid by the class. J Amount represents less than $.01 per share. K Total distributions of $.28 per share is comprised of distributions from net investment income of $.148 and distributions from net realized gain of $.135 per share. |
See accompanying notes which are an integral part of the financial statements.
Annual Report
Notes to Financial Statements
For the period ended October 31, 2012
1. Organization.
Fidelity Emerging Markets Fund (the Fund) is a fund of Fidelity Investment Trust (the Trust) and is authorized to issue an unlimited number of shares. The Trust is registered under the Investment Company Act of 1940, as amended (the 1940 Act), as an open-end management investment company organized as a Massachusetts business trust. The Fund offers Emerging Markets and Class K shares, each of which has equal rights as to assets and voting privileges. Each class has exclusive voting rights with respect to matters that affect that class. Investment income, realized and unrealized capital gains and losses, the common expenses of the Fund, and certain fund-level expense reductions, if any, are allocated on a pro-rata basis to each class based on the relative net assets of each class to the total net assets of the Fund. Each class differs with respect to transfer agent fees incurred. Certain expense reductions may also differ by class. The Fund's investments in emerging markets can be subject to social, economic, regulatory, and political uncertainties and can be extremely volatile.
2. Investments in Fidelity Central Funds.
The Fund invests in Fidelity Central Funds, which are open-end investment companies available only to other investment companies and accounts managed by Fidelity Management & Research Company (FMR) and its affiliates. The Fund's Schedule of Investments lists each of the Fidelity Central Funds held as of period end, if any, as an investment of the Fund, but does not include the underlying holdings of each Fidelity Central Fund. As an Investing Fund, the Fund indirectly bears its proportionate share of the expenses of the underlying Fidelity Central Funds.
The Money Market Central Funds seek preservation of capital and current income and are managed by Fidelity Investments Money Management, Inc. (FIMM), an affiliate of FMR.
A complete unaudited list of holdings for each Fidelity Central Fund is available upon request or at the Securities and Exchange Commission (the SEC) web site at www.sec.gov. In addition, the financial statements of the Fidelity Central Funds, which are not covered by the Fund's Report of Independent Registered Public Accounting Firm, are available on the SEC web site or upon request.
3. Significant Accounting Policies.
The financial statements have been prepared in conformity with accounting principles generally accepted in the United States of America (GAAP), which require management to make certain estimates and assumptions at the date of the financial statements. Actual results could differ from those estimates. Subsequent events, if any, through the date that the financial statements were issued have been evaluated in the preparation of the financial statements. The following summarizes the significant accounting policies of the Fund:
Security Valuation. Investments are valued as of 4:00 p.m. Eastern time on the last calendar day of the period. In accordance with valuation policies and procedures approved by the Board of Trustees (the Board), the Fund attempts to obtain prices from one or more third party pricing vendors or brokers to value its investments. When current market prices, quotations or rates are not readily available or reliable, securities will be fair valued in good faith by the FMR Fair Value Committee (the Committee), in accordance with procedures adopted by the Fund's Board. Factors used in determining fair value vary by security type and may include market or security specific events. The frequency with which these procedures are used cannot be predicted and they may be utilized to a significant extent. The Committee oversees the Fund's valuation policies and procedures and is responsible for approving and reporting to the Board all fair value determinations.
The Fund categorizes the inputs to valuation techniques used to value its investments into a disclosure hierarchy consisting of three levels as shown below:
Level 1 - quoted prices in active markets for identical investments
Level 2 - other significant observable inputs (including quoted prices for similar investments, interest rates, prepayment speeds, etc.)
Level 3 - unobservable inputs (including the Fund's own assumptions based on the best information available)
Valuation techniques used to value the Fund's investments by major category are as follows:
Equity securities, including restricted securities, for which market quotations are readily available, are valued at the last reported sale price or official closing price as reported by a third party pricing vendor on the primary market or exchange on which they are traded and are categorized as Level 1 in the hierarchy. In the event there were no sales during the day or closing prices are not available, securities are valued at the last quoted bid price or may be valued using the last available price and are generally categorized as Level 2 in the hierarchy. For foreign equity securities, when significant market or security specific events arise, comparisons to the valuation of American Depositary Receipts (ADRs), futures contracts, Exchange-Traded Funds (ETFs) and certain indexes as well as quoted prices for similar securities are used and are categorized as Level 2 in the hierarchy. Utilizing these techniques may result in transfers between Level 1 and Level 2. For restricted equity securities and private placements where observable inputs are limited, assumptions about market activity and risk are used and these securities are categorized as Level 3 in the hierarchy.
Annual Report
3. Significant Accounting Policies - continued
Security Valuation - continued
Investments in open-end mutual funds, including the Fidelity Central Funds, are valued at their closing net asset value (NAV) each business day and are categorized as Level 1 in the hierarchy.
Changes in valuation techniques may result in transfers in or out of an assigned level within the disclosure hierarchy. The aggregate value of investments by input level, as of October 31, 2012, including information on transfers between Levels 1 and 2, is included at the end of the Fund's Schedule of Investments.
Foreign Currency Translation. The Fund may use foreign currency contracts to facilitate transactions in foreign-denominated securities. Gains and losses from these transactions may arise from changes in the value of the foreign currency or if the counterparties do not perform under the contracts' terms.
Foreign-denominated assets, including investment securities, and liabilities are translated into U.S. dollars at the exchange rates at period end. Purchases and sales of investment securities, income and dividends received and expenses denominated in foreign currencies are translated into U.S. dollars at the exchange rate in effect on the transaction date.
The effects of exchange rate fluctuations on investments are included with the net realized and unrealized gain (loss) on investment securities. Other foreign currency transactions resulting in realized and unrealized gain (loss) are disclosed separately.
Investment Transactions and Income. For financial reporting purposes, the Fund's investment holdings and NAV include trades executed through the end of the last business day of the period. The NAV per share for processing shareholder transactions is calculated as of the close of business of the New York Stock Exchange (NYSE), normally 4:00 p.m. Eastern time and includes trades executed through the end of the prior business day. Gains and losses on securities sold are determined on the basis of identified cost and may include proceeds received from litigation. Dividend income is recorded on the ex-dividend date, except for certain dividends from foreign securities where the ex-dividend date may have passed, which are recorded as soon as the Fund is informed of the ex-dividend date. Non-cash dividends included in dividend income, if any, are recorded at the fair market value of the securities received. Interest income and distributions from the Fidelity Central Funds are accrued as earned. Interest income includes coupon interest and amortization of premium and accretion of discount on debt securities. Investment income is recorded net of foreign taxes withheld where recovery of such taxes is uncertain.
Expenses. Expenses directly attributable to a fund are charged to that fund. Expenses attributable to more than one fund are allocated among the respective funds on the basis of relative net assets or other appropriate methods. Expense estimates are accrued in the period to which they relate and adjustments are made when actual amounts are known.
Income Tax Information and Distributions to Shareholders. Each year, the Fund intends to qualify as a regulated investment company under Subchapter M of the Internal Revenue Code, including distributing substantially all of its taxable income and realized gains. As a result, no provision for income taxes is required. As of October 31, 2012, the Fund did not have any unrecognized tax benefits in the financial statements; nor is the Fund aware of any tax positions for which it is reasonably possible that the total amounts of unrecognized tax benefits will significantly change in the next twelve months. The Fund files a U.S. federal tax return, in addition to state and local tax returns as required. A fund's federal income tax returns are subject to examination by the Internal Revenue Service (IRS) for a period of three fiscal years after they are filed. State and local tax returns may be subject to examination for an additional fiscal year depending on the jurisdiction. Foreign taxes are provided for based on the Fund's understanding of the tax rules and rates that exist in the foreign markets in which it invests.
Distributions are declared and recorded on the ex-dividend date. Income dividends and capital gain distributions are declared separately for each class. Income and capital gain distributions are determined in accordance with income tax regulations, which may differ from GAAP.
Capital accounts within the financial statements are adjusted for permanent book-tax differences. These adjustments have no impact on net assets or the results of operations. Temporary book-tax differences will reverse in a subsequent period.
Book-tax differences are primarily due to foreign currency transactions, passive foreign investment companies (PFIC), deferred trustees compensation, capital loss carryforwards and losses deferred due to wash sales.
The federal tax cost of investment securities and unrealized appreciation (depreciation) as of period end were as follows:
Gross unrealized appreciation | $ 356,494,948 |
Gross unrealized depreciation | (80,646,374) |
Net unrealized appreciation (depreciation) on securities and other investments | $ 275,848,574 |
| |
Tax Cost | $ 2,559,068,154 |
Annual Report
Notes to Financial Statements - continued
3. Significant Accounting Policies - continued
Income Tax Information and Distributions to Shareholders - continued
The tax-based components of distributable earnings as of period end were as follows:
Undistributed ordinary income | $ 34,119,771 |
Capital loss carryforward | $ (312,945,798) |
Net unrealized appreciation (depreciation) | $ 275,501,689 |
Capital loss carryforwards are only available to offset future capital gains of the Fund to the extent provided by regulations and may be limited. Under the Regulated Investment Company Modernization Act of 2010 (the Act), the Fund is permitted to carry forward capital losses incurred in taxable years beginning after December 22, 2010 for an unlimited period and such capital losses are required to be used prior to any losses that expire. Capital loss carryforwards were as follows:
Fiscal year of expiration | |
2017 | $ (300,796,983) |
No expiration | |
Short-term | (12,148,815) |
Total capital loss carryforward | $ (312,945,798) |
The tax character of distributions paid was as follows:
| October 31, 2012 | October 31, 2011 |
Ordinary Income | $ 46,903,179 | $ 74,128,234 |
Short-Term Trading (Redemption) Fees. Shares held by investors in the Fund less than 90 days are subject to a redemption fee equal to 1.50% of the net asset value of shares redeemed. All redemption fees, which reduce the proceeds of the shareholder redemption, are retained by the Fund and accounted for as an addition to paid in capital.
Restricted Securities. The Fund may invest in securities that are subject to legal or contractual restrictions on resale. These securities generally may be resold in transactions exempt from registration or to the public if the securities are registered. Disposal of these securities may involve time-consuming negotiations and expense, and prompt sale at an acceptable price may be difficult. Information regarding restricted securities is included at the end of the Fund's Schedule of Investments.
New Accounting Pronouncement. In December 2011, the Financial Accounting Standards Board issued Accounting Standard Update No. 2011-11, Disclosures about Offsetting Assets and Liabilities. The update creates new disclosure requirements requiring entities to disclose both gross and net information for derivatives and other financial instruments that are either offset in the Statement of Assets and Liabilities or subject to an enforceable master netting arrangement or similar agreement. The disclosure requirements are effective for annual reporting periods beginning on or after January 1, 2013, and interim periods within those annual periods. Management is currently evaluating the impact of the update's adoption on the Fund's financial statement disclosures.
4. Purchases and Sales of Investments.
Purchases and sales of securities, other than short-term securities, aggregated $5,371,118,757 and $5,935,273,389, respectively.
5. Fees and Other Transactions with Affiliates.
Management Fee. FMR and its affiliates provide the Fund with investment management related services for which the Fund pays a monthly management fee. The management fee is the sum of an individual fund fee rate that is based on an annual rate of .45% of the Fund's average net assets and an annualized group fee rate that averaged .26% during the period. The group fee rate is based upon the average net assets of all the mutual funds advised by FMR. The group fee rate decreases as assets under management increase and increases as assets under management decrease. For the period, the total annual management fee rate was .71% of the Fund's average net assets.
Annual Report
5. Fees and Other Transactions with Affiliates - continued
Transfer Agent Fees. Fidelity Investments Institutional Operations Company, Inc. (FIIOC), an affiliate of FMR, is the transfer, dividend disbursing and shareholder servicing agent for each class of the Fund. FIIOC receives account fees and asset-based fees that vary according to the account size and type of account of the shareholders of Emerging Markets. FIIOC receives an asset-based fee of Class K's average net assets. FIIOC pays for typesetting, printing and mailing of shareholder reports, except proxy statements. For the period, transfer agent fees for each class were as follows:
| Amount | % of
Average
Net Assets |
Emerging Markets | $ 6,721,313 | .27 |
Class K | 300,268 | .05 |
| $ 7,021,581 | |
Accounting and Security Lending Fees. Fidelity Service Company, Inc. (FSC), an affiliate of FMR, maintains the Fund's accounting records. The accounting fee is based on the level of average net assets for each month. Under a separate contract, FSC administers the security lending program. The security lending fee is based on the number and duration of lending transactions.
Brokerage Commissions. The Fund placed a portion of its portfolio transactions with brokerage firms which are affiliates of the investment adviser. The commissions paid to these affiliated firms were $2,222 for the period.
Interfund Lending Program. Pursuant to an Exemptive Order issued by the SEC, the Fund, along with other registered investment companies having management contracts with FMR, may participate in an interfund lending program. This program provides an alternative credit facility allowing the funds to borrow from, or lend money to, other participating affiliated funds. At period end, there were no interfund loans outstanding. The Fund's activity in this program during the period for which loans were outstanding was as follows:
Borrower or Lender | Average Loan
Balance | Weighted Average Interest Rate | Interest
Expense |
Borrower | $ 15,311,759 | .38% | $ 4,699 |
6. Committed Line of Credit.
The Fund participates with other funds managed by FMR or an affiliate in a $4.25 billion credit facility (the "line of credit") to be utilized for temporary or emergency purposes to fund shareholder redemptions or for other short-term liquidity purposes. The Fund has agreed to pay commitment fees on its pro-rata portion of the line of credit, which amounted to $8,701 and is reflected in Miscellaneous expenses on the Statement of Operations. During the period, there were no borrowings on this line of credit.
7. Security Lending.
The Fund lends portfolio securities through a lending agent from time to time in order to earn additional income. For equity securities, a lending agent is used and may loan securities to certain qualified borrowers, including Fidelity Capital Markets (FCM), a broker-dealer affiliated with the Fund. On the settlement date of the loan, the Fund receives collateral (in the form of U.S. Treasury obligations, letters of credit and/or cash) against the loaned securities and maintains collateral in an amount not less than 100% of the market value of the loaned securities during the period of the loan. The market value of the loaned securities is determined at the close of business of the Fund and any additional required collateral is delivered to the Fund on the next business day. If the borrower defaults on its obligation to return the securities loaned because of insolvency or other reasons, a fund could experience delays and costs in recovering the securities loaned or in gaining access to the collateral. Any cash collateral received is invested in the Fidelity Securities Lending Cash Central Fund. The value of loaned securities and cash collateral at period end are disclosed on the Fund's Statement of Assets and Liabilities. Security lending income represents the income earned on investing cash collateral, less rebates paid to borrowers and any lending agent fees associated with the loan, plus any premium payments received for lending certain types of securities. Security lending income is presented in the Statement of Operations as a component of income from Fidelity Central Funds. Total security lending income during the period amounted to $257,878. During the period, there were no securities loaned to FCM.
8. Expense Reductions.
Many of the brokers with whom FMR places trades on behalf of the Fund provided services to the Fund in addition to trade execution. These services included payments of certain expenses on behalf of the Fund totaling $1,950,355 for the period. In addition, through arrangements with the Fund's custodian, credits realized as a result of uninvested cash balances were used to reduce the Fund's expenses. During the period, these credits reduced the Fund's custody expenses by $484.
Annual Report
Notes to Financial Statements - continued
9. Distributions to Shareholders.
Distributions to shareholders of each class were as follows:
Years ended October 31, | 2012 | 2011 |
From net investment income | | |
Emerging Markets | $ 38,359,433 | $ 38,140,950 |
Class K | 8,543,746 | 11,296,849 |
Total | $ 46,903,179 | $ 49,437,799 |
From net realized gain | | |
Emerging Markets | $ - | $ 20,164,680 |
Class K | - | 4,525,755 |
Total | $ - | $ 24,690,435 |
10. Share Transactions.
Transactions for each class of shares were as follows:
| Shares | Dollars |
Years ended October 31, | 2012 | 2011 | 2012 | 2011 |
Emerging Markets | | | | |
Shares sold | 17,560,683 | 35,985,818 | $ 382,055,836 | $ 924,231,122 |
Reinvestment of distributions | 1,697,255 | 2,151,168 | 36,745,572 | 55,865,828 |
Shares redeemed | (50,595,892) | (61,852,310) | (1,110,238,720) | (1,567,144,468) |
Net increase (decrease) | (31,337,954) | (23,715,324) | $ (691,437,312) | $ (587,047,518) |
Class K | | | | |
Shares sold | 14,677,576 | 11,514,792 | $ 321,820,048 | $ 289,925,357 |
Reinvestment of distributions | 395,361 | 610,205 | 8,543,746 | 15,822,605 |
Shares redeemed | (10,025,395) | (24,238,483) | (217,567,010) | (577,946,139) |
Net increase (decrease) | 5,047,542 | (12,113,486) | $ 112,796,784 | $ (272,198,177) |
11. Other.
The Fund's organizational documents provide former and current trustees and officers with a limited indemnification against liabilities arising in connection with the performance of their duties to the Fund. In the normal course of business, the Fund may also enter into contracts that provide general indemnifications. The Fund's maximum exposure under these arrangements is unknown as this would be dependent on future claims that may be made against the Fund. The risk of material loss from such claims is considered remote.
Annual Report
Report of Independent Registered Public Accounting Firm
To the Trustees of Fidelity Investment Trust and the Shareholders of Fidelity Emerging Markets Fund:
In our opinion, the accompanying statement of assets and liabilities, including the schedule of investments, and the related statements of operations and of changes in net assets and the financial highlights present fairly, in all material respects, the financial position of Fidelity Emerging Markets Fund (a fund of Fidelity Investment Trust) at October 31, 2012, the results of its operations for the year then ended, the changes in its net assets for each of the two years in the period then ended and the financial highlights for each of the five years in the period then ended, in conformity with accounting principles generally accepted in the United States of America. These financial statements and financial highlights (hereafter referred to as "financial statements") are the responsibility of the Fidelity Emerging Markets Fund's management. Our responsibility is to express an opinion on these financial statements based on our audits. We conducted our audits of these financial statements in accordance with the standards of the Public Company Accounting Oversight Board (United States). Those standards require that we plan and perform the audit to obtain reasonable assurance about whether the financial statements are free of material misstatement. An audit includes examining, on a test basis, evidence supporting the amounts and disclosures in the financial statements, assessing the accounting principles used and significant estimates made by management, and evaluating the overall financial statement presentation. We believe that our audits, which included confirmation of securities at October 31, 2012 by correspondence with the custodian and brokers, provide a reasonable basis for our opinion.
PricewaterhouseCoopers LLP
Boston, Massachusetts
December 18, 2012
Annual Report
The Trustees, Members of the Advisory Board, and executive officers of the trust and fund, as applicable, are listed below. The Board of Trustees governs the fund and is responsible for protecting the interests of shareholders. The Trustees are experienced executives who meet periodically throughout the year to oversee the fund's activities, review contractual arrangements with companies that provide services to the fund, oversee management of the risks associated with such activities and contractual arrangements, and review the fund's performance. Except for James C. Curvey, each of the Trustees oversees 236 funds advised by FMR or an affiliate. Mr. Curvey oversees 443 funds advised by FMR or an affiliate.
The Trustees hold office without limit in time except that (a) any Trustee may resign; (b) any Trustee may be removed by written instrument, signed by at least two-thirds of the number of Trustees prior to such removal; (c) any Trustee who requests to be retired or who has become incapacitated by illness or injury may be retired by written instrument signed by a majority of the other Trustees; and (d) any Trustee may be removed at any special meeting of shareholders by a two-thirds vote of the outstanding voting securities of the trust. Each Trustee who is not an interested person (as defined in the 1940 Act) (Independent Trustee), shall retire not later than the last day of the calendar year in which his or her 75th birthday occurs. The Independent Trustees may waive this mandatory retirement age policy with respect to individual Trustees. The executive officers and Advisory Board Members hold office without limit in time, except that any officer and Advisory Board Member may resign or may be removed by a vote of a majority of the Trustees at any regular meeting or any special meeting of the Trustees. Except as indicated, each individual has held the office shown or other offices in the same company for the past five years.
Experience, Skills, Attributes, and Qualifications of the Fund's Trustees. The Governance and Nominating Committee has adopted a statement of policy that describes the experience, qualifications, attributes, and skills that are necessary and desirable for potential Independent Trustee candidates (Statement of Policy). The Board believes that each Trustee satisfied at the time he or she was initially elected or appointed a Trustee, and continues to satisfy, the standards contemplated by the Statement of Policy. The Governance and Nominating Committee also engages professional search firms to help identify potential Independent Trustee candidates who have the experience, qualifications, attributes, and skills consistent with the Statement of Policy. From time to time, additional criteria based on the composition and skills of the current Independent Trustees, as well as experience or skills that may be appropriate in light of future changes to board composition, business conditions, and regulatory or other developments, have also been considered by the professional search firms and the Governance and Nominating Committee. In addition, the Board takes into account the Trustees' commitment and participation in Board and committee meetings, as well as their leadership of standing and ad hoc committees throughout their tenure.
In determining that a particular Trustee was and continues to be qualified to serve as a Trustee, the Board has considered a variety of criteria, none of which, in isolation, was controlling. The Board believes that, collectively, the Trustees have balanced and diverse experience, qualifications, attributes, and skills, which allow the Board to operate effectively in governing the fund and protecting the interests of shareholders. Information about the specific experience, skills, attributes, and qualifications of each Trustee, which in each case led to the Board's conclusion that the Trustee should serve (or continue to serve) as a trustee of the fund, is provided below.
Board Structure and Oversight Function. James C. Curvey is an interested person (as defined in the 1940 Act) and currently serves as Chairman. The Trustees have determined that an interested Chairman is appropriate and benefits shareholders because an interested Chairman has a personal and professional stake in the quality and continuity of services provided to the fund. Independent Trustees exercise their informed business judgment to appoint an individual of their choosing to serve as Chairman, regardless of whether the Trustee happens to be independent or a member of management. The Independent Trustees have determined that they can act independently and effectively without having an Independent Trustee serve as Chairman and that a key structural component for assuring that they are in a position to do so is for the Independent Trustees to constitute a substantial majority for the Board. The Independent Trustees also regularly meet in executive session. Ned C. Lautenbach serves as Chairman of the Independent Trustees and as such (i) acts as a liaison between the Independent Trustees and management with respect to matters important to the Independent Trustees and (ii) with management prepares agendas for Board meetings.
Fidelity funds are overseen by different Boards of Trustees. The fund's Board oversees Fidelity's equity and high income funds and another Board oversees Fidelity's investment-grade bond, money market, and asset allocation funds. The asset allocation funds may invest in Fidelity funds overseen by the fund's Board. The use of separate Boards, each with its own committee structure, allows the Trustees of each group of Fidelity funds to focus on the unique issues of the funds they oversee, including common research, investment, and operational issues. On occasion, the separate Boards establish joint committees to address issues of overlapping consequences for the Fidelity funds overseen by each Board.
The Trustees operate using a system of committees to facilitate the timely and efficient consideration of all matters of importance to the Trustees, the fund, and fund shareholders and to facilitate compliance with legal and regulatory requirements and oversight of the fund's activities and associated risks. The Board, acting through its committees, has charged FMR and its affiliates with (i) identifying events or circumstances the occurrence of which could have demonstrably adverse effects on the fund's business and/or reputation; (ii) implementing processes and controls to lessen the possibility that such events or circumstances occur or to mitigate the effects of such events or circumstances if they do occur; and (iii) creating and maintaining a system designed to evaluate continuously business and market conditions in order to facilitate the identification and implementation processes described in (i) and (ii) above. Because the day-to-day operations and activities of the fund are carried out by or through FMR, its affiliates and other service providers, the fund's exposure to risks is mitigated but not eliminated by the processes overseen by the Trustees. While each of the Board's committees has responsibility for overseeing different aspects of the fund's activities, oversight is exercised primarily through the Operations, Audit, and Compliance Committees. In addition, the Independent Trustees have worked with FMR to enhance the Board's oversight of investment and financial risks, legal and regulatory risks, technology risks, and operational risks, including the development of additional risk reporting to the Board. For example, a working group comprised of Independent Trustees and FMR has worked and continues to work to review the Fidelity funds' valuation-related activities, reporting and risk management. Appropriate personnel, including but not limited to the fund's Chief Compliance Officer (CCO), FMR's internal auditor, the independent accountants, the fund's Treasurer and portfolio management personnel, make periodic reports to the Board's committees, as appropriate, including an annual review of FMR's risk management program for the Fidelity funds. The responsibilities of each standing committee, including their oversight responsibilities, are described further under "Standing Committees of the Fund's Trustees."
Annual Report
Trustees and Officers - continued
The fund's Statement of Additional Information (SAI) includes more information about the Trustees. To request a free copy, call Fidelity at 1-800-835-5092.
Interested Trustees*:
Correspondence intended for each Trustee who is an interested person may be sent to Fidelity Investments, 82 Devonshire Street, Boston, Massachusetts 02109.
Name, Age; Principal Occupations and Other Relevant Experience+ |
James C. Curvey (77) |
| Year of Election or Appointment: 2007 Mr. Curvey is Trustee and Chairman of the Board of Trustees of certain Trusts. Mr. Curvey also serves as Trustee (2007-present) of other investment companies advised by FMR. Mr. Curvey is a Director of Fidelity Investments Money Management, Inc. (2009-present), Director of Fidelity Research & Analysis Co. (2009-present) and Director of FMR and FMR Co., Inc. (2007-present). Mr. Curvey is also Vice Chairman (2007-present) and Director of FMR LLC. In addition, Mr. Curvey serves as an Overseer for the Boston Symphony Orchestra and a member of the Trustees of Villanova University. Previously, Mr. Curvey was the Vice Chairman (2006-2007) and Director (2000-2007) of FMR Corp. |
Ronald P. O'Hanley (55) |
| Year of Election or Appointment: 2011 Mr. O'Hanley is Director of FMR Co., Inc. (2010-present), Director of Fidelity Investments Money Management, Inc. (2010-present), Director of Fidelity Research & Analysis Company (2010-present), President of Fidelity Asset Management and Corporate Services and a member of Fidelity's Executive Committee (2010-present). Previously, Mr. O'Hanley served as President and Chief Executive Officer of BNY Mellon Asset Management (2007-2010). Mr. O'Hanley also served as Vice Chairman of Bank New York Mellon Corp. and a member of that firm's Executive Committee. Prior to the 2007 merger of The Bank of New York and Mellon Financial Corporation, he was Vice Chairman of Mellon Financial Corporation and President and Chief Executive Officer of Mellon Asset Management. He joined Mellon in February 1997. Mr. O'Hanley currently serves as Chairman of the Boston Public Library Foundation Board of Directors and sits on the Board of Directors of Beth Israel Deaconess Medical Center, the Board of Trustees of the Marine Biological Laboratory and the Advisory Board of the Maxwell School of Citizenship and Public Administration at Syracuse University. Mr. O'Hanley also chairs the Council on Asset Management for the Financial Services Roundtable and is a member of the Board of Directors of Institutional Investor's U.S. Institute. |
* Trustees have been determined to be "Interested Trustees" by virtue of, among other things, their affiliation with the trust or various entities under common control with FMR.
+ The information above includes each Trustee's principal occupation during the last five years and other information relating to the experience, attributes, and skills relevant to each Trustee's qualifications to serve as a Trustee, which led to the conclusion that each Trustee should serve as a Trustee for the fund.
Independent Trustees:
Correspondence intended for each Independent Trustee (that is, the Trustees other than the Interested Trustees) may be sent to Fidelity Investments, P.O. Box 55235, Boston, Massachusetts 02205-5235.
Name, Age; Principal Occupations and Other Relevant Experience+ |
Dennis J. Dirks (64) |
| Year of Election or Appointment: 2005 Prior to his retirement in May 2003, Mr. Dirks was Chief Operating Officer and a member of the Board of The Depository Trust & Clearing Corporation (DTCC). He also served as President, Chief Operating Officer, and Board member of The Depository Trust Company (DTC) and President and Board member of the National Securities Clearing Corporation (NSCC). In addition, Mr. Dirks served as Chief Executive Officer and Board member of the Government Securities Clearing Corporation, Chief Executive Officer and Board member of the Mortgage-Backed Securities Clearing Corporation, as a Trustee and a member of the Finance Committee of Manhattan College (2005-2008), and as a Trustee and a member of the Finance Committee of AHRC of Nassau County (2006-2008). Mr. Dirks is a member of the Independent Directors Council (IDC) Governing Council (2010-present) and Board of Directors for The Brookville Center for Children's Services, Inc. (2009-present). |
Alan J. Lacy (59) |
| Year of Election or Appointment: 2008 Mr. Lacy serves as Senior Adviser (2007-present) of Oak Hill Capital Partners, L.P. (private equity). Mr. Lacy also served as Chief Executive Officer (2000-2005) and Vice Chairman (2005-2006) of Sears Holdings Corporation and Sears, Roebuck and Co. (retail). In addition, Mr. Lacy serves as a member of the Board of Directors of Dave & Buster's Entertainment, Inc. (restaurant and entertainment complexes, 2010-present), Earth Fare, Inc. (retail grocery, 2012-present), The Hillman Companies, Inc. (hardware wholesalers, 2010-present), and Bristol-Myers Squibb Company (global pharmaceuticals, 2008-present). Mr. Lacy is a member of the Board of Trustees of The National Parks Conservation Association (2006-present). Previously, Mr. Lacy served as Chairman of the Board of Trustees of the National Parks Conservation Association (2008-2011) and as a member of the Board of Directors for the Western Union Company (global money transfer, 2006-2011). |
Ned C. Lautenbach (68) |
| Year of Election or Appointment: 2000 Mr. Lautenbach is Chairman of the Independent Trustees of the Equity and High Income Funds (2006-present). Mr. Lautenbach currently serves as the Lead Director of the Eaton Corporation Board of Directors (diversified industrial, 1997-present). Mr. Lautenbach is Chairman of the Board of Directors of the Philharmonic Center for the Arts in Naples, Florida (2012-present) and a member of the Council on Foreign Relations (1994-present). Previously, Mr. Lautenbach was a Partner/Advisory Partner at Clayton, Dubilier & Rice, LLC (private equity investment, 1998-2010), as well as a Director of Sony Corporation (2006-2007). |
Joseph Mauriello (68) |
| Year of Election or Appointment: 2008 Prior to his retirement in January 2006, Mr. Mauriello served in numerous senior management positions including Deputy Chairman and Chief Operating Officer (2004-2005), and Vice Chairman of Financial Services (2002-2004) of KPMG LLP US (professional services, 1965-2005). Mr. Mauriello currently serves as a member of the Board of Directors of XL Group plc. (global insurance and re-insurance, 2006-present). Previously, Mr. Mauriello served as a Director of the Hamilton Funds of the Bank of New York (2006-2007) and of Arcadia Resources Inc. (health care services and products, 2007-2012). |
Robert W. Selander (62) |
| Year of Election or Appointment: 2011 Previously, Mr. Selander served as a Member of the Advisory Board of Fidelity's Equity and High Income Funds (2011), Executive Vice Chairman (2010), Chief Executive Officer (2009-2010), and President and Chief Executive Officer (1997-2009) of Mastercard, Inc. |
Cornelia M. Small (68) |
| Year of Election or Appointment: 2005 Ms. Small is a member of the Board of Directors (2009-present) and Chair of the Investment Committee (2010-present) of the Teagle Foundation. Ms. Small also serves on the Investment Committee of the Berkshire Taconic Community Foundation (2008-present). Previously, Ms. Small served as Chairperson (2002-2008) and a member of the Investment Committee and Chairperson (2008-2012) and a member of the Board of Trustees of Smith College. In addition, Ms. Small served as Chief Investment Officer, Director of Global Equity Investments, and a member of the Board of Directors of Scudder, Stevens & Clark and Scudder Kemper Investments. |
William S. Stavropoulos (73) |
| Year of Election or Appointment: 2001 Mr. Stavropoulos is Vice Chairman of the Independent Trustees of the Equity and High Income Funds (2006-present). Mr. Stavropoulos serves as President and Founder of the Michigan Baseball Foundation, the Great Lakes Loons (2007-present). Mr. Stavropoulos is Chairman Emeritus of the Board of Directors of The Dow Chemical Company, where he previously served in numerous senior management positions, including President, CEO (1995-2000; 2002-2004), Chairman of the Executive Committee (2000-2006), and as a member of the Board of Directors (1990-2006). Currently, Mr. Stavropoulos is a Director of Univar Inc. (global distributor of commodity and specialty chemicals, Chairman from 2010-May 2012 and Lead Director from May 2012-present), Teradata Corporation (data warehousing and technology solutions, 2008-present), Maersk Inc. (industrial conglomerate), and Tyco International, Ltd. (multinational manufacturing and services, 2007-present), and a member of the Advisory Board for Metalmark Capital LLC (private equity investment, 2005-present). Mr. Stavropoulos is an operating advisor to Clayton, Dubilier & Rice, LLC (private equity investment). In addition, Mr. Stavropoulos is a member of the University of Notre Dame Advisory Council for the College of Science, a Trustee of the Rollin L. Gerstacker Foundation, and a Director of the Naples Philharmonic Center for the Arts. Previously, Mr. Stavropoulos served as a Director of Chemical Financial Corporation (bank holding company, 1993-2012). |
David M. Thomas (63) |
| Year of Election or Appointment: 2008 Previously, Mr. Thomas served as Executive Chairman (2005-2006) and Chairman and Chief Executive Officer (2000-2005) of IMS Health, Inc. (pharmaceutical and healthcare information solutions), and a Director of Fortune Brands, Inc. (consumer products, 2000-2011). In addition, Mr. Thomas serves as Non-Executive Chairman of the Board of Directors of Fortune Brands Home and Security (home and security products, 2011-present), and as a member of the Board of Directors of Interpublic Group of Companies, Inc. (marketing communication, 2004-present). |
Michael E. Wiley (62) |
| Year of Election or Appointment: 2008 Mr. Wiley also serves as a Director of Asia Pacific Exploration Consolidated (international oil and gas exploration and production, 2008-present). Mr. Wiley serves as a Director of Tesoro Corporation (independent oil refiner and marketer, 2005-present), and a Director of Bill Barrett Corporation (exploration and production, 2005-present). In addition, Mr. Wiley also serves as a Director of Post Oak Bank (privately-held bank, 2004-present). Previously, Mr. Wiley served as a member of the Board of Trustees of the University of Tulsa (2000-2006; 2007-2010), as a Senior Energy Advisor of Katzenbach Partners, LLC (consulting, 2006-2007), as an Advisory Director of Riverstone Holdings (private investment), Chairman, President, and CEO of Baker Hughes, Inc. (oilfield services, 2000-2004), and as Director of Spinnaker Exploration Company (exploration and production, 2001-2005). |
+ The information above includes each Trustee's principal occupation during the last five years and other information relating to the experience, attributes, and skills relevant to each Trustee's qualifications to serve as a Trustee, which led to the conclusion that each Trustee should serve as a Trustee for the fund.
Advisory Board Members and Executive Officers:
Correspondence intended for David A. Rosow and Garnett A. Smith may be sent to Fidelity Investments, P.O. Box 55235, Boston, Massachusetts 02205-5235. Correspondence intended for each executive officer, Edward C. Johnson 3d, and Peter S. Lynch may be sent to Fidelity Investments, 82 Devonshire Street, Boston, Massachusetts 02109.
Name, Age; Principal Occupation |
Edward C. Johnson 3d (82) |
| Year of Election or Appointment: 2011 Member of the Advisory Board of Fidelity's Equity and High Income Funds. Mr. Johnson serves as Chief Executive Officer, Chairman, and a Director of FMR LLC, and also serves as Chairman and Director of FIL Limited. Previously, Mr. Johnson served as a Trustee and Chairman of the Board of certain Fidelity Trusts, Chairman and a Director of FMR, Chairman and a Director of FMR Co., Inc., and President of FMR LLC (2006-2007). |
Peter S. Lynch (68) |
| Year of Election or Appointment: 2003 Member of the Advisory Board of Fidelity's Equity and High Income Funds. Mr. Lynch is Vice Chairman and a Director of FMR and FMR Co., Inc. In addition, Mr. Lynch serves as a Trustee of Boston College and as the Chairman of the Inner-City Scholarship Fund. Previously, Mr. Lynch served on the Special Olympics International Board of Directors (1997-2006). |
David A. Rosow (70) |
| Year of Election or Appointment: 2012 Member of the Advisory Board of Fidelity's Equity and High Income Funds. Chairman and Chief Executive Officer of International Golf Group, Inc. (golf course development, 1989-present). Previously, Mr. Rosow served as Chairman and Chief Executive Officer of Rosow & Company, Inc. (private investment company, 1989-2011), a Lead Director of Hudson United Bancorp (2001-2006) and as a Director of TD Banknorth (1996-2006). In addition, Mr. Rosow is a member (2008-present) and President (2009-present) of the Town Council of Palm Beach, Florida. |
Garnett A. Smith (65) |
| Year of Election or Appointment: 2012 Member of the Advisory Board of Fidelity's Equity and High Income Funds. Prior to Mr. Smith's retirement, he served as Chairman and Chief Executive Officer of Inbrand Corp. (manufacturer of personal absorbent products, 1990-1997). He also served as President (1986-1990) of Inbrand Corp. Prior to his employment with Inbrand Corp., he was employed by a retail fabric chain and North Carolina National Bank. In addition, Mr. Smith is a board member of the Jackson Hole Land Trust (2009-present). |
Kenneth B. Robins (43) |
| Year of Election or Appointment: 2008 President and Treasurer of Fidelity's Equity and High Income Funds. Mr. Robins also serves as President and Treasurer (2010-present) and Assistant Treasurer (2009-present) of other Fidelity funds and is an employee of Fidelity Investments (2004-present). Previously, Mr. Robins served as Deputy Treasurer of the Fidelity funds (2005-2008) and Treasurer and Chief Financial Officer of The North Carolina Capital Management Trust: Cash and Term Portfolios (2006-2008). |
Bruce T. Herring (47) |
| Year of Election or Appointment: 2006 Vice President of certain Equity Funds. Mr. Herring also serves as President of Fidelity Research & Analysis Company (2010-present), Chief Investment Officer and Director of Fidelity Management & Research (U.K.) Inc. (2010-present) and Group Chief Investment Officer of FMR. Previously, Mr. Herring served as Vice President (2005-2006) and Senior Vice President (2006-2007) of Fidelity Management & Research Company, Vice President of FMR Co., Inc. (2001-2007) and as a portfolio manager for Fidelity U.S. Equity Funds. |
Brian B. Hogan (48) |
| Year of Election or Appointment: 2009 Vice President of Equity and High Income Funds. Mr. Hogan also serves as President of FMR's Equity Division (2009-present). Previously, Mr. Hogan served as Senior Vice President, Equity Research of FMR (2006-2009) and as a portfolio manager. |
Scott C. Goebel (44) |
| Year of Election or Appointment: 2008 Secretary and Chief Legal Officer (CLO) of the Fidelity funds. Mr. Goebel also serves as Secretary of Fidelity Investments Money Management, Inc. (FIMM) (2010-present) and Fidelity Research and Analysis Company (FRAC) (2010-present); Secretary and CLO of The North Carolina Capital Management Trust: Cash and Term Portfolios (2008-present); General Counsel, Secretary, and Senior Vice President of FMR (2008-present) and FMR Co., Inc. (2008-present); employed by FMR LLC or an affiliate (2001-present); Chief Legal Officer of Fidelity Management & Research (Hong Kong) Limited (2008-present) and Assistant Secretary of Fidelity Management & Research (Japan) Inc. (2008-present), and Fidelity Management & Research (U.K.) Inc. (2008-present). Previously, Mr. Goebel served as Assistant Secretary of FIMM (2008-2010), FRAC (2008-2010), and the Funds (2007-2008) and as Vice President and Secretary of Fidelity Distributors Corporation (FDC) (2005-2007). |
William C. Coffey (43) |
| Year of Election or Appointment: 2009 Assistant Secretary of Fidelity's Equity and High Income Funds. Mr. Coffey also serves as Senior Vice President and Deputy General Counsel of FMR LLC (2010-present), and is an employee of Fidelity Investments. Previously, Mr. Coffey served as Vice President and Associate General Counsel of FMR LLC (2005-2009). |
Elizabeth Paige Baumann (44) |
| Year of Election or Appointment: 2012 Anti-Money Laundering (AML) Officer of the Fidelity funds. Ms. Baumann also serves as AML Officer of The North Carolina Capital Management Trust: Cash and Term Portfolios (2012-present), Chief AML Officer of FMR LLC (2012-present), and is an employee of Fidelity Investments. Previously, Ms. Baumann served as Vice President and Deputy Anti-Money Laundering Officer (2007-2012). |
Christine Reynolds (54) |
| Year of Election or Appointment: 2008 Chief Financial Officer of the Fidelity funds. Ms. Reynolds became President of Fidelity Pricing and Cash Management Services (FPCMS) in August 2008. Ms. Reynolds served as Chief Operating Officer of FPCMS (2007-2008). Previously, Ms. Reynolds served as President, Treasurer, and Anti-Money Laundering officer of the Fidelity funds (2004-2007). |
Joseph A. Hanlon (44) |
| Year of Election or Appointment: 2012 Chief Compliance Officer of Fidelity's Equity and High Income Funds. Mr. Hanlon serves as Compliance Officer of FMR, FMR Co., Inc., Fidelity Investments Money Management, Inc. (FIMM), Fidelity Research and Analysis Company (FRAC), Fidelity Management & Research (Japan) Inc., Fidelity Management & Research (U.K.) Inc., Fidelity Management & Research (Hong Kong), and Strategic Advisers, Inc. (2009-present), as Senior Vice President of the Fidelity Asset Management Division (2009-present), and is an employee of Fidelity Investments. |
Joseph F. Zambello (55) |
| Year of Election or Appointment: 2011 Deputy Treasurer of the Fidelity funds. Mr. Zambello is an employee of Fidelity Investments. Previously, Mr. Zambello served as Vice President of FMR's Program Management Group (2009-2011) and Vice President of the Transfer Agent Oversight Group (2005-2009). |
Adrien E. Deberghes (45) |
| Year of Election or Appointment: 2008 Deputy Treasurer of Fidelity's Equity and High Income Funds. Mr. Deberghes also serves as Vice President (2011-present) and Assistant Treasurer (2010-present) of other Fidelity funds, and is an employee of Fidelity Investments (2008-present). Previously, Mr. Deberghes served as Senior Vice President of Mutual Fund Administration at State Street Corporation (2007-2008), Senior Director of Mutual Fund Administration at Investors Bank & Trust (2005-2007), and Director of Finance for Dunkin' Brands (2000-2005). |
Stephen Sadoski (41) |
| Year of Election or Appointment: 2012 Deputy Treasurer of Fidelity's Equity and High Income Funds. Mr. Sadoski also serves as Assistant Treasurer of other Fidelity funds (2012-present) and is an employee of Fidelity Investments (2012-present). Previously, Mr. Sadoski served as an assistant chief accountant in the Division of Investment Management of the Securities and Exchange Commission (SEC) (2009-2012) and as a senior manager at Deloitte & Touche (1997-2009). |
Stephanie J. Dorsey (43) |
| Year of Election or Appointment: 2010 Assistant Treasurer of Fidelity's Equity and High Income Funds. Ms. Dorsey also serves as Deputy Treasurer of other Fidelity funds (2008-present) and is an employee of Fidelity Investments (2008-present). Previously, Ms. Dorsey served as Treasurer (2004-2008) of the JPMorgan Mutual Funds and Vice President (2004-2008) of JPMorgan Chase Bank. |
John R. Hebble (54) |
| Year of Election or Appointment: 2009 Assistant Treasurer of Fidelity's Equity and High Income Funds. Mr. Hebble also serves as President (2011-present), Treasurer, and Chief Financial Officer of The North Carolina Capital Management Trust: Cash and Term Portfolios (2008-present), President and Treasurer of other Fidelity funds (2008-present) and is an employee of Fidelity Investments. |
Gary W. Ryan (54) |
| Year of Election or Appointment: 2005 Assistant Treasurer of the Fidelity funds. Mr. Ryan is an employee of Fidelity Investments. Previously, Mr. Ryan served as Vice President of Fund Reporting in Fidelity Pricing and Cash Management Services (FPCMS) (1999-2005). |
Jonathan Davis (44) |
| Year of Election or Appointment: 2010 Assistant Treasurer of the Fidelity funds. Mr. Davis is also Assistant Treasurer of Fidelity Rutland Square Trust II and Fidelity Commonwealth Trust II. Mr. Davis is an employee of Fidelity Investments. Previously, Mr. Davis served as Vice President and Associate General Counsel of FMR LLC (2003-2010). |
Annual Report
Class K designates 1% of the dividends distributed during the fiscal year as qualifying for the dividends-received deduction for corporate shareholders.
Class K designates 88% of the dividends distributed during the fiscal year as amounts which may be taken into account as a dividend for the purposes of the maximum rate under section 1(h)(11) of the Internal Revenue Code.
The amounts per share which represent income derived from sources within, and taxes paid to, foreign countries or possessions of the United States are $0.412 and $0.0618 for the dividend paid December 5, 2011.
The fund will notify shareholders in January 2013 of amounts for use in preparing 2012 income tax returns.
Annual Report
Board Approval of Investment Advisory Contracts and Management Fees
Fidelity Emerging Markets Fund
Each year, the Board of Trustees, including the Independent Trustees (together, the Board), votes on the renewal of the management contract and sub-advisory agreements (together, the Advisory Contracts) for the fund. The Board, assisted by the advice of fund counsel and Independent Trustees' counsel, requests and considers a broad range of information relevant to the renewal of the Advisory Contracts throughout the year.
The Board meets regularly and, at each of its meetings, considers factors that are relevant to its annual consideration of the renewal of the fund's Advisory Contracts, including the services and support provided to the fund and its shareholders. The Board has established various standing committees, each composed of and chaired by Independent Trustees with varying backgrounds, to which the Board has assigned specific subject matter responsibilities in order to enhance effective decision-making by the Board. The Board, acting directly and through its Committees, requests and receives information concerning the annual consideration of the renewal of the fund's Advisory Contracts. The Board also meets as needed to consider matters specifically related to the Board's annual consideration of the renewal of Advisory Contracts. Members of the Board may also meet with trustees of other Fidelity funds through ad hoc joint committees to discuss certain matters relevant to the Fidelity funds.
At its July 2012 meeting, the Board of Trustees, including the Independent Trustees, unanimously determined to renew the fund's Advisory Contracts. In reaching its determination, the Board considered all factors it believed relevant, including (i) the nature, extent, and quality of the services to be provided to the fund and its shareholders (including the investment performance of the fund); (ii) the competitiveness of the fund's management fee and total expense ratio relative to peer funds; (iii) the total costs of the services to be provided by and the profits to be realized by Fidelity from its relationship with the fund; (iv) the extent to which economies of scale exist and would be realized as the fund grows; and (v) whether fee levels reflect these economies of scale, if any, for the benefit of fund shareholders.
In considering whether to renew the Advisory Contracts for the fund, the Board reached a determination, with the assistance of fund counsel and Independent Trustees' counsel and through the exercise of its business judgment, that the renewal of the Advisory Contracts is in the best interests of the fund and its shareholders and that the compensation payable under the Advisory Contracts is fair and reasonable. The Board's decision to renew the Advisory Contracts was not based on any single factor, but rather was based on a comprehensive consideration of all the information provided to the Board at its meetings throughout the year. The Board, in reaching its determination to renew the Advisory Contracts, is aware that shareholders in the fund have a broad range of investment choices available to them, including a wide choice among mutual funds offered by Fidelity's competitors, and that the fund's shareholders, who have the opportunity to review and weigh the disclosure provided by the fund in its prospectus and other public disclosures, have chosen to invest in this fund, managed by Fidelity.
Nature, Extent, and Quality of Services Provided. The Board considered the staffing within the investment adviser, FMR, and the sub-advisers (together, the Investment Advisers), including the backgrounds of the fund's investment personnel, and also considered the fund's investment objective, strategies, and related investment philosophy. The Independent Trustees also had discussions with senior management of Fidelity's investment operations and investment groups. The Board considered the structure of the portfolio manager compensation program and whether this structure provides appropriate incentives to act in the best interests of the fund.
Resources Dedicated to Investment Management and Support Services. The Board and the Fund Oversight and Research Committees reviewed the general qualifications and capabilities of the Investment Advisers' investment staff, including its size, education, experience, and resources, as well as the Investment Advisers' approach to recruiting, training, managing, and compensating investment personnel. The Board also noted that FMR has continued to increase the resources devoted to non-U.S. offices, including expansion of Fidelity's global investment organization. The Board noted that Fidelity's analysts have extensive resources, tools and capabilities that allow them to conduct sophisticated quantitative and fundamental analysis, as well as credit analysis of issuers, counterparties and guarantors. The Board also believes that Fidelity's investment professionals have sufficient access to global information and data so as to provide competitive investment results over time, and that those professionals also have access to sophisticated tools that permit them to assess portfolio construction and risk and performance attribution characteristics continuously, as well as to transmit new information and research conclusions rapidly around the world. Additionally, in its deliberations, the Board considered the Investment Advisers' trading and risk management capabilities and resources, which are an integral part of the investment management process.
Shareholder and Administrative Services. The Board considered (i) the nature, extent, quality, and cost of advisory, administrative, and shareholder services performed by the Investment Advisers and their affiliates under the Advisory Contracts and under separate agreements covering transfer agency, pricing and bookkeeping, and securities lending services for the fund; (ii) the nature and extent of the supervision of third party service providers, principally custodians and subcustodians; and (iii) the resources devoted to, and the record of compliance with, the fund's compliance policies and procedures. The Board also reviewed the allocation of fund brokerage, including allocations to brokers affiliated with the Investment Advisers, the use of brokerage commissions to pay fund expenses, and the use of "soft" commission dollars to pay for research services.
The Board noted that the growth of fund assets over time across the complex allows Fidelity to reinvest in the development of services designed to enhance the value or convenience of the Fidelity funds as investment vehicles. These services include 24-hour access to account information and market information through telephone representatives and over the Internet, investor education materials and asset allocation tools, and the expanded availability of Fidelity Investor Centers.
Annual Report
Investment in a Large Fund Family. The Board considered the benefits to shareholders of investing in a Fidelity fund, including the benefits of investing in a fund that is part of a large family of funds offering a variety of investment disciplines and providing a large variety of mutual fund investor services. The Board noted that Fidelity had taken, or had made recommendations that resulted in the Fidelity funds taking, a number of actions over the previous year that benefited particular funds, including (i) continuing to dedicate additional resources to investment research and support of the senior management team that oversees asset management; (ii) persisting in efforts to enhance Fidelity's research capabilities, in particular, international research; (iii) launching new funds and making other enhancements to meet client needs for global and income-oriented solutions; (iv) continuing to launch dedicated lower cost underlying funds to meet investment management's portfolio construction needs related to expanding underlying fund options, specifically for the Freedom Fund product lines; (v) adopting a "Stock Selector" sector neutral investment approach and employing a team of portfolio managers who are sector specialists to manage certain funds; (vi) rationalizing product lines and gaining increased efficiencies through the mergers of several funds into other funds; (vii) strengthening the Spartan Index Fund product line by adding new funds and/or new low-cost institutional share classes, restructuring fund expenses to accommodate new classes, and reducing investment minimums for certain classes of shares; (viii) modifying the eligibility criteria for Institutional Class shares to increase their appeal to government entities and charitable investors; and (ix) reducing certain transfer agent fee rates.
Investment Performance. The Board considered whether the fund has operated in accordance with its investment objective, as well as its record of compliance with its investment restrictions. It also reviewed the fund's absolute investment performance for each class, as well as the fund's relative investment performance for each class measured over multiple periods against (i) a broad-based securities market index, and (ii) a peer group of mutual funds deemed appropriate by Fidelity and reviewed by the Board. The following charts considered by the Board show, over the one-, three-, and five-year periods ended December 31, 2011, as available, the cumulative total returns of Class K and the retail class of the fund, the cumulative total returns of a broad-based securities market index ("benchmark"), and a range of cumulative total returns of a peer group of mutual funds identified by Morningstar, Inc. as having an investment style similar to that of the fund based on underlying portfolio holdings. The box within each chart shows the 25th percentile return (top of box) and the 75th percentile return (bottom of box) of the peer group. Returns shown above the box are in the first quartile and returns shown below the box are in the fourth quartile. The percentage beaten numbers noted below each chart correspond to the percentile box and represent the percentage of funds in the peer group whose performance was equal to or lower than that of the class indicated.
Fidelity Emerging Markets Fund

The Board reviewed the fund's relative investment performance against its peer group and noted that the performance of the retail class of the fund (the class with the longer performance record) was in the third quartile for the one-year period, the second quartile for the three-year period, and the fourth quartile for the five-year period. The Board also noted that the investment performance of the fund was lower than its benchmark for all the periods shown. The Board considered that the variations in performance between the fund's classes reflect the variations in class expenses, which result in lower performance for the higher expense class. The Board discussed with FMR the fact that the fund underperformed its benchmark for each period measured. The Board also reviewed the fund's performance since inception as well as performance in the current year. The Board will continue to closely monitor performance of the fund in the coming year and discuss with FMR if other actions to address performance are appropriate.
Based on its review, the Board concluded that the nature, extent, and quality of services provided to the fund under the Advisory Contracts should benefit the fund's shareholders.
Annual Report
Board Approval of Investment Advisory Contracts and Management Fees - continued
Competitiveness of Management Fee and Total Expense Ratio. The Board considered the fund's management fee and total expense ratio compared to "mapped groups" of competitive funds and classes. Fidelity creates "mapped groups" by combining similar Lipper investment objective categories that have comparable management fee characteristics. Combining Lipper investment objective categories aids the Board's management fee and total expense ratio comparisons by broadening the competitive group used for comparison and by reducing the number of universes to which various Fidelity funds are compared.
Management Fee. The Board considered two proprietary management fee comparisons for the 12-month periods shown in the chart below. The group of Lipper funds used by the Board for management fee comparisons is referred to below as the "Total Mapped Group." The Total Mapped Group comparison focuses on a fund's standing relative to the total universe of comparable funds available to investors in terms of gross management fees before expense reimbursements or caps. "TMG %" represents the percentage of funds in the Total Mapped Group that had management fees that were lower than the fund's. For example, a TMG % of 7% means that 93% of the funds in the Total Mapped Group had higher management fees than the fund. The "Asset-Size Peer Group" (ASPG) comparison focuses on a fund's standing relative to non-Fidelity funds similar in size to the fund within the Total Mapped Group. The ASPG represents at least 15% of the funds in the Total Mapped Group with comparable asset size and management fee characteristics, subject to a minimum of 50 funds (or all funds in the Total Mapped Group if fewer than 50). Additional information, such as the ASPG quartile in which the fund's management fee ranked, is also included in the chart and considered by the Board.
Fidelity Emerging Markets Fund
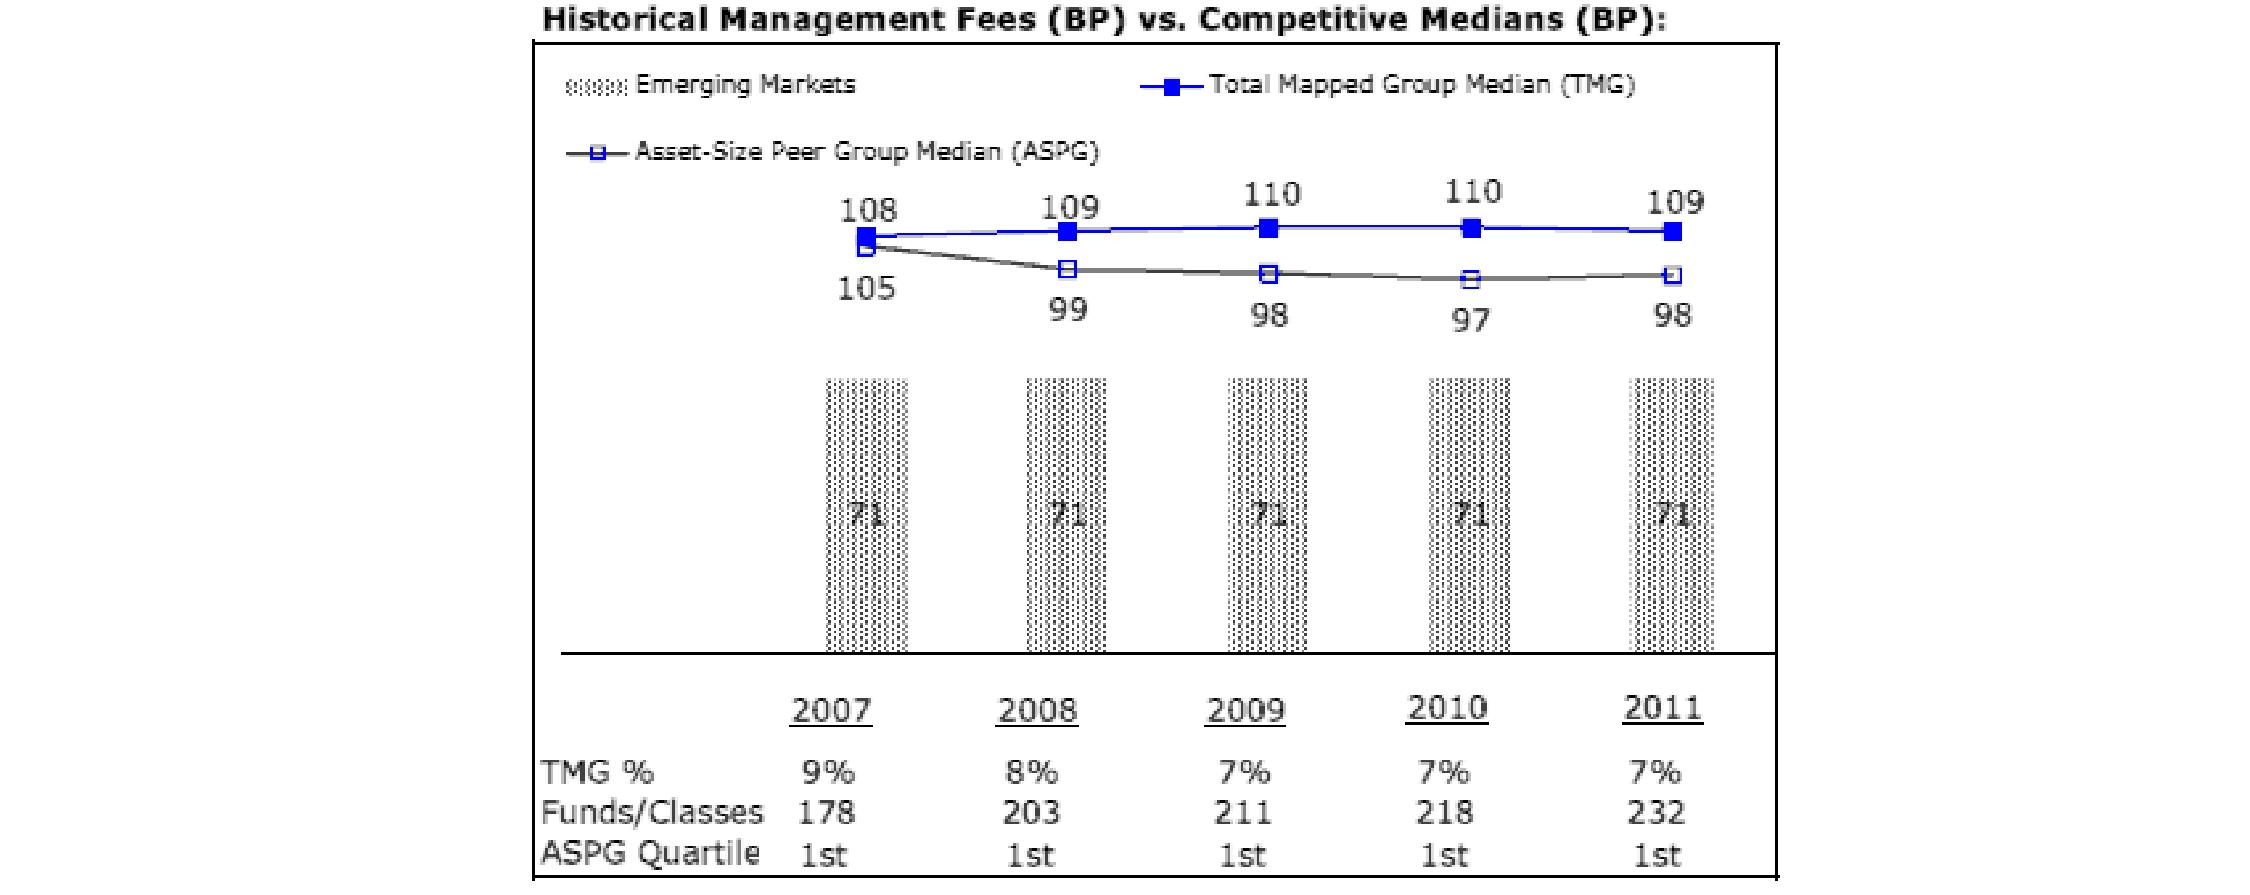
The Board noted that the fund's management fee ranked below the median of its Total Mapped Group and below the median of its ASPG for 2011.
Based on its review, the Board concluded that the fund's management fee is fair and reasonable in light of the services that the fund receives and the other factors considered.
Total Expense Ratio. In its review of each class's total expense ratio, the Board considered the fund's management fee as well as other fund or class expenses, as applicable, such as transfer agent fees, pricing and bookkeeping fees, and custodial, legal, and audit fees. The Board also noted the effects of any waivers and reimbursements on fees and expenses. As part of its review, the Board also considered the current and historical total expense ratios of each class of the fund compared to competitive fund median expenses. Each class of the fund is compared to those funds and classes in the Total Mapped Group (used by the Board for management fee comparisons) that have a similar sales load structure.
The Board noted that the total expense ratio of each class ranked below its competitive median for 2011.
Fees Charged to Other Fidelity Clients. The Board also considered Fidelity fee structures and other information with respect to clients of FMR and its affiliates, such as other mutual funds advised or subadvised by FMR or its affiliates, pension plan clients, and other institutional clients. The Board noted the findings of the 2010 ad hoc joint committee (created with the board of other Fidelity funds), which reviewed and compared Fidelity's institutional investment advisory business with its business of providing services to the Fidelity funds, including the differences in services provided, fees charged, and costs incurred, as well as competition in their respective marketplaces.
Based on its review of total expense ratios and fees charged to other Fidelity clients, the Board concluded that the total expense ratio of each class of the fund was reasonable in light of the services that the fund and its shareholders receive and the other factors considered.
Annual Report
Costs of the Services and Profitability. The Board considered the revenues earned and the expenses incurred by Fidelity in conducting the business of developing, marketing, distributing, managing, administering and servicing the fund and its shareholders. The Board also considered the level of Fidelity's profits in respect of all the Fidelity funds.
On an annual basis, FMR presents to the Board Fidelity's profitability for the fund. Fidelity calculates the profitability for each fund, as well as aggregate profitability for groups of Fidelity funds and all Fidelity funds, using a series of detailed revenue and cost allocation methodologies which originate with the books and records of Fidelity on which Fidelity's audited financial statements are based. The Audit Committee of the Board reviews any significant changes from the prior year's methodologies.
PricewaterhouseCoopers LLP (PwC), independent registered public accounting firm and auditor to Fidelity and certain Fidelity funds, has been engaged annually by the Board as part of the Board's assessment of Fidelity's profitability analysis. PwC's engagement includes the review and assessment of Fidelity's methodologies used in determining the revenues and expenses attributable to Fidelity's mutual fund business, and completion of agreed-upon procedures surrounding the mathematical accuracy of fund profitability and its conformity to allocation methodologies. After considering PwC's reports issued under the engagement and information provided by Fidelity, the Board concluded that while other allocation methods may also be reasonable, Fidelity's profitability methodologies are reasonable in all material respects.
The Board also reviewed Fidelity's non-fund businesses and fall-out benefits related to the mutual fund business as well as cases where Fidelity's affiliates may benefit from or be related to the fund's business.
The Board considered the costs of the services provided by and the profits realized by Fidelity in connection with the operation of the fund and was satisfied that the profitability was not excessive in the circumstances.
Economies of Scale. The Board considered whether there have been economies of scale in respect of the management of the Fidelity funds, whether the Fidelity funds (including the fund) have appropriately benefited from any such economies of scale, and whether there is potential for realization of any further economies of scale. The Board considered the extent to which the fund will benefit from economies of scale through increased services to the fund, through waivers or reimbursements, or through fee or expense reductions. The Board also noted that in 2009, it and the board of other Fidelity funds created an ad hoc committee (the Economies of Scale Committee) to analyze whether FMR attains economies of scale in respect of the management and servicing of the Fidelity funds, whether the Fidelity funds have appropriately benefited from such economies of scale, and whether there is potential for realization of any further economies of scale.
The Board recognized that the fund's management contract incorporates a "group fee" structure, which provides for lower group fee rates as total fund assets under FMR's management increase, and for higher group fee rates as total fund assets under FMR's management decrease. FMR calculates the group fee rates based on a tiered asset "breakpoint" schedule that varies based on asset class. The Board considered that the group fee is designed to deliver the benefits of economies of scale to fund shareholders when total Fidelity fund assets increase, even if assets of any particular fund are unchanged or have declined, because some portion of Fidelity's costs are attributable to services provided to all Fidelity funds, and all funds benefit if those costs can be allocated among more assets. The Board concluded that, given the group fee structure, fund shareholders will benefit from lower management fees as assets under FMR's management increase at the fund complex level, regardless of whether Fidelity achieves any such economies of scale.
The Board concluded, taking into account the analysis of the Economies of Scale Committee, that economies of scale, if any, are being appropriately shared between fund shareholders and Fidelity.
Additional Information Requested by the Board. In order to develop fully the factual basis for consideration of the Fidelity funds' Advisory Contracts, the Board requested and received additional information on certain topics, including (i) fund performance trends, actions to be taken by FMR to improve certain funds' overall performance, and Fidelity's long-term strategies for certain funds; (ii) the potential to further rationalize the Fidelity fund lineup with the possibility of achieving savings for the funds and Fidelity; (iii) Fidelity's compensation structure for portfolio managers and other key investment personnel; (iv) the amount of the investment that each portfolio manager has made in the Fidelity fund(s) that he or she manages; (v) the realization of fall-out benefits in certain Fidelity business units; (vi) Fidelity's group fee structures, the potential impact of regulatory changes on such structures, and the rationale for the individual fee rates of certain funds; (vii) fund profitability methodology, including Fidelity's cost allocation methodology, and the impact of certain factors on fund profitability results; (viii) trends regarding industry use of performance fee structures and the possibility of implementing performance fee structures for additional funds; and (ix) the impact of net redemptions from the Fidelity funds.
Based on its evaluation of all of the conclusions noted above, and after considering all factors it believed relevant, the Board ultimately concluded that the advisory fee structures are fair and reasonable, and that the fund's Advisory Contracts should be renewed.
Annual Report
Investment Adviser
Fidelity Management & Research Company
Boston, MA
Investment Sub-Advisers
FMR Co., Inc.
Fidelity Management & Research (U.K.) Inc.
FIL Investments (Japan) Limited
FIL Investment Advisors
FIL Investment Advisors
(UK) Limited
Fidelity Management & Research
(Hong Kong) Limited
Fidelity Management & Research
(Japan) Inc.
General Distributor
Fidelity Distributors Corporation
Smithfield, RI
Transfer and Service Agents
Fidelity Investments Institutional
Operations Company, Inc.
Boston, MA
Fidelity Service Company, Inc.
Boston, MA
Custodians
JPMorgan Chase Bank
New York, NY
Fidelity's International Equity Funds
Fidelity Canada Fund
Fidelity China Region Fund
Fidelity Diversified International Fund
Fidelity Emerging Asia Fund
Fidelity Emerging Europe, Middle East, Africa (EMEA) Fund
Fidelity Emerging Markets Fund
Fidelity Europe Capital Appreciation Fund
Fidelity Europe Fund
Fidelity Global Balanced Fund
Fidelity Global Commodity Stock Fund
Fidelity International Capital Appreciation Fund
Fidelity International Discovery Fund
Fidelity International Growth Fund
Fidelity International Small Cap Fund
Fidelity International Small Cap Opportunities Fund
Fidelity International Value Fund
Fidelity Japan Fund
Fidelity Japan Smaller Companies Fund
Fidelity Latin America Fund
Fidelity Nordic Fund
Fidelity Overseas Fund
Fidelity Pacific Basin Fund
Fidelity Total International Equity Fund
Fidelity Worldwide Fund
Corporate Headquarters
82 Devonshire Street
Boston, MA 02109
www.fidelity.com
(Fidelity Investment logo)(registered trademark)
Corporate Headquarters
82 Devonshire St., Boston, MA 02109
www.fidelity.com
EMF-K-UANN-1212
1.863014.104
Fidelity Advisor®
Japan
Fund - Class A, Class T, Class B, and Class C
Annual Report
October 31, 2012
(Fidelity Cover Art)
Class A, Class T, Class B, and Class C are
classes of Fidelity® Japan Fund
Contents
Performance | (Click Here) | How the fund has done over time. |
Management's Discussion of Fund Performance | (Click Here) | The Portfolio Manager's review of fund performance and strategy. |
Shareholder Expense Example | (Click Here) | An example of shareholder expenses. |
Investment Changes | (Click Here) | A summary of major shifts in the fund's investments over the past six months. |
Investments | (Click Here) | A complete list of the fund's investments with their market values. |
Financial Statements | (Click Here) | Statements of assets and liabilities, operations, and changes in net assets, as well as financial highlights. |
Notes | (Click Here) | Notes to the financial statements. |
Report of Independent Registered Public Accounting Firm | (Click Here) | |
Trustees and Officers | (Click Here) | |
Distributions | (Click Here) | |
Board Approval of Investment Advisory Contracts and Management Fees | (Click Here) | |
To view a fund's proxy voting guidelines and proxy voting record for the 12-month period ended June 30, visit http://www.fidelity.com/proxyvotingresults or visit the Securities and Exchange Commission's (SEC) web site at http://www.sec.gov. You may also call 1-877-208-0098 to request a free copy of the proxy voting guidelines.
Standard & Poor's, S&P and S&P 500 are registered service marks of The McGraw-Hill Companies, Inc. and have been licensed for use by Fidelity Distributors Corporation.
Other third party marks appearing herein are the property of their respective owners.
All other marks appearing herein are registered or unregistered trademarks or service marks of FMR LLC or an affiliated company. © 2012 FMR LLC. All rights reserved.
This report and the financial statements contained herein are submitted for the general information of the shareholders of the fund. This report is not authorized for distribution to prospective investors in the fund unless preceded or accompanied by an effective prospectus.
A fund files its complete schedule of portfolio holdings with the SEC for the first and third quarters of each fiscal year on Form N-Q. Forms N-Q are available on the SEC's web site at http://www.sec.gov. A fund's Forms N-Q may be reviewed and copied at the SEC's Public Reference Room in Washington, DC. Information regarding the operation of the SEC's Public Reference Room may be obtained by calling 1-800-SEC-0330. For a complete list of a fund's portfolio holdings, view the most recent holdings listing, semiannual report, or annual report on Fidelity's web site at http://www.fidelity.com, http://www.advisor.fidelity.com, or http://www.401k.com, as applicable.
NOT FDIC INSURED • MAY LOSE VALUE • NO BANK GUARANTEE
Neither the fund nor Fidelity Distributors Corporation is a bank.
Annual Report
Average annual total return reflects the change in the value of an investment, assuming reinvestment of the class' distributions from dividend income and capital gains (the profits earned upon the sale of securities that have grown in value, if any) and assuming a constant rate of performance each year. The $10,000 table and the fund's returns do not reflect the deduction of taxes that a shareholder would pay on fund distributions or the redemption of fund shares. During periods of reimbursement by Fidelity, a fund's total return will be greater than it would be had the reimbursement not occurred. How a fund did yesterday is no guarantee of how it will do tomorrow.
Average Annual Total Returns
Periods ended October 31, 2012 | Past 1
year | Past 5
years | Past 10
years |
Class A (incl. 5.75% sales charge) A | -6.36% | -9.22% | 3.18% |
Class T (incl. 3.50% sales charge) B | -4.23% | -8.87% | 3.38% |
Class B (incl. contingent deferred sales charge) C | -6.13% | -8.68% | 3.66% |
Class C (incl. contingent deferred sales charge) D | -2.25% | -8.37% | 3.67% |
A Class A shares bear a 0.25% 12b-1 fee. The initial offering of Class A shares took place on December 14, 2010. Returns prior to December 14, 2010, are those of Fidelity® Japan Fund, the original class of the fund, which has no 12b-1 fee. Had Class A's 12b-1 fee been reflected, returns prior to December 14, 2010, would have been lower.
B Class T shares bear a 0.50% 12b-1 fee. The initial offering of Class T shares took place on December 14, 2010. Returns prior to December 14, 2010, are those of Fidelity® Japan Fund, the original class of the fund, which has no 12b-1 fee. Had Class T's 12b-1 fee been reflected, returns prior to December 14, 2010, would have been lower.
C Class B shares bear a 1.00% 12b-1 fee. The initial offering of Class B shares took place on December 14, 2010. Returns prior to December 14, 2010, are those of Fidelity Japan Fund, the original class of the fund, which has no 12b-1 fee. Had Class B's 12b-1 fee been reflected, returns prior to December 14, 2010, would have been lower. Class B shares' contingent deferred sales charges included in the past one year, past five years, and past ten years total return figures are 5%, 2%, and 0%, respectively.
D Class C shares bear a 1.00% 12b-1 fee. The initial offering of Class C shares took place on December 14, 2010. Returns prior to December 14, 2010, are those of Fidelity Japan Fund, the original class of the fund, which has no 12b-1 fee. Had Class C's 12b-1 fee been reflected, returns prior to December 14, 2010, would have been lower. Class C shares' contingent deferred sales charges included in the past one year, past five years, and past ten years total return figures are 1%, 0%, and 0%, respectively.
$10,000 Over 10 Years
Let's say hypothetically that $10,000 was invested in Fidelity Advisor® Japan Fund - Class A on October 31, 2002, and the current 5.75% sales charge was paid. The chart shows how the value of your investment would have changed, and also shows how the Tokyo Stock Price Index (TOPIX) performed over the same period. The initial offering of Class A took place on December 14, 2010. See above for additional information regarding the performance of Class A.
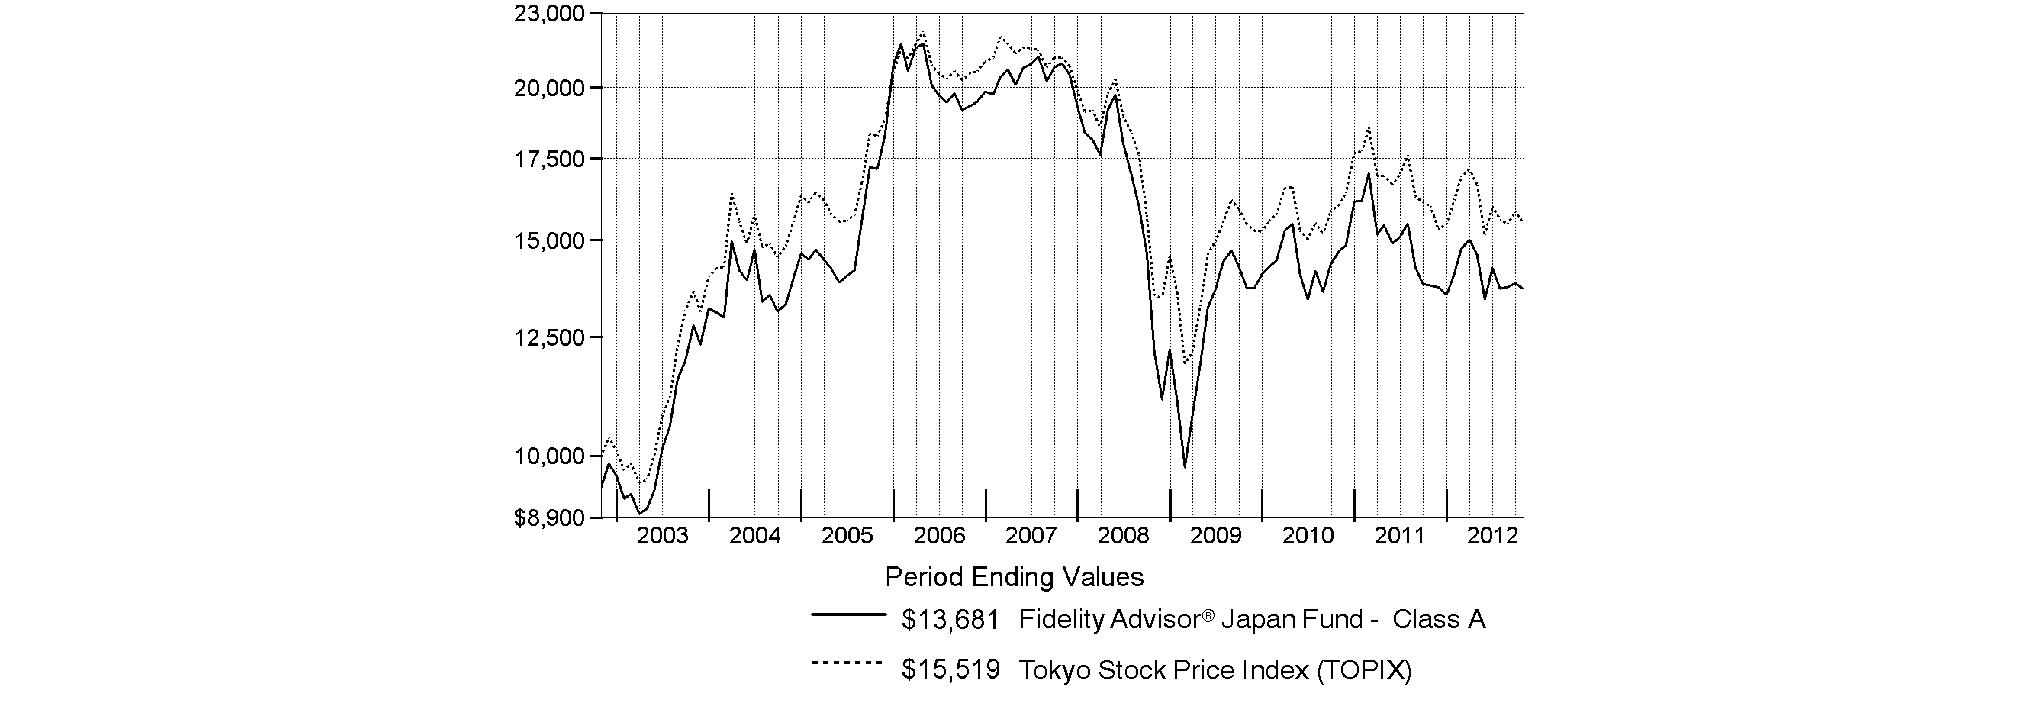
-
Annual Report
Market Recap: Returns for most domestic and international equities fluctuated during the 12 months ending October 31, 2012, as investor sentiment towards risk vacillated amid a changing global economic landscape. U.S. stocks overcame bouts of volatility to post strong gains for the past year, extending an uptrend that began in March 2009. The broad-based S&P 500® Index advanced 15.21%, while the blue-chip-laden Dow Jones Industrial AverageSM and technology-heavy Nasdaq Composite® Index rose 12.56% and 12.21%, respectively. Performance outside of the U.S. was relatively weak, as the MSCI® ACWI® (All Country World Index) ex USA Index rose 4.11%, hampered in part by a stronger U.S. dollar. International developed-markets generally struggled during the period as macroeconomic concerns ebbed and flowed, finishing with only a modest gain. The MSCI® EAFE® Index rose 4.76% for the year, largely buttressed in the summertime by pledges of accommodative monetary action from eurozone officials, as well as signs that the U.S. housing market was on the mend. Within the index, Asia-Pacific ex Japan showed the most impressive gain, advancing roughly 10%. A number of core European components, including Germany (+11%) and Switzerland (+10%), and the U.K. (+9%), benefited from optimism about the eurozone's ability to resolve its debt woes, which helped the region outpace the index overall. Elsewhere, Japan was among the few benchmark constituents to finish in the red, returning about -3%. Emerging-markets stocks gained 2.98% for the year, as measured by the MSCI Emerging Markets Index. A general uptrend in the final five months of the period lifted the index into positive territory for the full 12 months.
Comments from Rie Shigekawa, Portfolio Manager of Fidelity Advisor® Japan Fund: For the year, the fund's Class A, Class T, Class B and Class C shares returned -0.64%, -0.75%, -1.24% and -1.27%, respectively (excluding sales charges), well ahead of the TOPIX, which returned -2.93%. The fund got a sizable boost from stock selection in the consumer discretionary sector, especially the automobile/components and media groups. My choices in the pharmaceuticals, biotechnology and life science part of health care also lifted performance, and security selection in the software/services segment of information technology helped as well. In the latter two cases, though, the benefits were largely or entirely offset by unfavorable positioning elsewhere in the sector. The fund's biggest individual contributor was Astellas Pharma, one of the largest Japanese drug companies. Given the company's reinvigorated product pipeline and healthy dividend yield, the stock offered growth potential and relative safety, and investors rewarded it with roughly a 40% advance. Other strong performers were Otsuka, an IT services provider for small and medium-sized businesses, and So-net Entertainment, which provides Internet services to Sony customers and was partially owned by Sony. During the period, Sony acquired the remaining stake in So-net at a healthy premium to where the shares had been trading. Sony, a weak-performing benchmark component, contributed to performance because the fund didn't own it. Automaker Toyota, the fund's largest holding during the period, also contributed. Conversely, the biggest negative factors were stock selection and a large overweighting in technology hardware/equipment, a group that accounted for the four largest individual detractors from relative performance: Fujitsu, Canon, Shimadzu and Toshiba. All of these companies suffered from a weaker-than-expected global economic backdrop and a relatively expensive yen. In addition, Fujitsu and Toshiba were adversely affected by stiffer competition from South Korean and Taiwanese rivals.
The views expressed above reflect those of the portfolio manager(s) only through the end of the period as stated on the cover of this report and do not necessarily represent the views of Fidelity or any other person in the Fidelity organization. Any such views are subject to change at any time based upon market or other conditions and Fidelity disclaims any responsibility to update such views. These views may not be relied on as investment advice and, because investment decisions for a Fidelity fund are based on numerous factors, may not be relied on as an indication of trading intent on behalf of any Fidelity fund.
Annual Report
Fidelity Japan Fund
As a shareholder of the Fund, you incur two types of costs: (1) transaction costs, including sales charges (loads) on purchase payments or redemption proceeds, redemption fees and (2) ongoing costs, including management fees, distribution and/or service (12b-1) fees and other Fund expenses. This Example is intended to help you understand your ongoing costs (in dollars) of investing in the Fund and to compare these costs with the ongoing costs of investing in other mutual funds.
The Example is based on an investment of $1,000 invested at the beginning of the period and held for the entire period (May 1, 2012 to October 31, 2012).
Actual Expenses
The first line of the accompanying table for each class of the Fund provides information about actual account values and actual expenses. You may use the information in this line, together with the amount you invested, to estimate the expenses that you paid over the period. Simply divide your account value by $1,000.00 (for example, an $8,600 account value divided by $1,000.00 = 8.6), then multiply the result by the number in the first line for a class of the Fund under the heading entitled "Expenses Paid During Period" to estimate the expenses you paid on your account during this period. A small balance maintenance fee of $12.00 that is charged once a year may apply for certain accounts with a value of less than $2,000. This fee is not included in the table below. If it was, the estimate of expenses you paid during the period would be higher, and your ending account value lower, by this amount. In addition, the Fund, as a shareholder in the underlying Fidelity Central Funds, will indirectly bear its pro-rata share of the fees and expenses incurred by the underlying Fidelity Central Funds. These fees and expenses are not included in the Fund's annualized expense ratio used to calculate the expense estimate in the table below.
Hypothetical Example for Comparison Purposes
The second line of the accompanying table for each class of the Fund provides information about hypothetical account values and hypothetical expenses based on a Class' actual expense ratio and an assumed rate of return of 5% per year before expenses, which is not the Class' actual return. The hypothetical account values and expenses may not be used to estimate the actual ending account balance or expenses you paid for the period. You may use this information to compare the ongoing costs of investing in the Fund and other funds. To do so, compare this 5% hypothetical example with the 5% hypothetical examples that appear in the shareholder reports of the other funds. A small balance maintenance fee of $12.00 that is charged once a year may apply for certain accounts with a value of less than $2,000. This fee is not included in the table below. If it was, the estimate of expenses you paid during the period would be higher, and your ending account value lower, by this amount. In addition, the Fund, as a shareholder in the underlying Fidelity Central Funds, will indirectly bear its pro-rata share of the fees and expenses incurred by the underlying Fidelity Central Funds. These fees and expenses are not included in the Fund's annualized expense ratio used to calculate the expense estimate in the table below.
Please note that the expenses shown in the table are meant to highlight your ongoing costs only and do not reflect any transaction costs. Therefore, the second line of the table is useful in comparing ongoing costs only, and will not help you determine the relative total costs of owning different funds. In addition, if these transactional costs were included, your costs would have been higher.
| Annualized
Expense Ratio | Beginning
Account Value
May 1, 2012 | Ending
Account Value
October 31, 2012 | Expenses Paid
During Period*
May 1, 2012
to October 31, 2012 |
Class A | 1.27% | | | |
Actual | | $ 1,000.00 | $ 937.50 | $ 6.19 |
HypotheticalA | | $ 1,000.00 | $ 1,018.75 | $ 6.44 |
Class T | 1.56% | | | |
Actual | | $ 1,000.00 | $ 937.40 | $ 7.60 |
HypotheticalA | | $ 1,000.00 | $ 1,017.29 | $ 7.91 |
Class B | 2.02% | | | |
Actual | | $ 1,000.00 | $ 934.40 | $ 9.82 |
HypotheticalA | | $ 1,000.00 | $ 1,014.98 | $ 10.23 |
Class C | 2.01% | | | |
Actual | | $ 1,000.00 | $ 935.30 | $ 9.78 |
HypotheticalA | | $ 1,000.00 | $ 1,015.03 | $ 10.18 |
Japan | .95% | | | |
Actual | | $ 1,000.00 | $ 940.60 | $ 4.63 |
HypotheticalA | | $ 1,000.00 | $ 1,020.36 | $ 4.82 |
Institutional Class | .84% | | | |
Actual | | $ 1,000.00 | $ 939.60 | $ 4.10 |
HypotheticalA | | $ 1,000.00 | $ 1,020.91 | $ 4.27 |
A 5% return per year before expenses
* Expenses are equal to each Class' annualized expense ratio, multiplied by the average account value over the period, multiplied by 184/366 (to reflect the one-half year period).
Annual Report
Fidelity Japan Fund
Investment Changes (Unaudited)
Geographic Diversification (% of fund's net assets) |
As of October 31, 2012 |
 | Japan | 98.9% | |
 | United States of America | 1.1% | |

Percentages are based on country or territory of incorporation and are adjusted for the effect of futures contracts, if applicable. |
As of April 30, 2012 |
| Japan | 96.0% | |
| United States of America | 4.0% | |

Percentages are based on country or territory of incorporation and are adjusted for the effect of futures contracts, if applicable. |
Asset Allocation |
| % of fund's
net assets | % of fund's net assets
6 months ago |
Stocks | 98.9 | 96.0 |
Short-Term Investments and Net Other Assets (Liabilities) | 1.1 | 4.0 |
Top Ten Stocks as of October 31, 2012 |
| % of fund's
net assets | % of fund's net assets
6 months ago |
Toyota Motor Corp. (Automobiles) | 7.3 | 6.9 |
Honda Motor Co. Ltd. (Automobiles) | 4.5 | 4.7 |
Canon, Inc. (Office Electronics) | 4.4 | 4.1 |
Mitsubishi UFJ Financial Group, Inc. (Commercial Banks) | 4.1 | 3.5 |
Sumitomo Mitsui Financial Group, Inc. (Commercial Banks) | 3.4 | 3.3 |
Astellas Pharma, Inc. (Pharmaceuticals) | 3.0 | 2.7 |
Asahi Kasei Corp. (Chemicals) | 2.9 | 2.9 |
Nomura Real Estate Holdings, Inc. (Real Estate Management & Development) | 2.8 | 3.1 |
Toray Industries, Inc. (Chemicals) | 2.8 | 2.7 |
Shimadzu Corp. (Electronic Equipment & Components) | 2.6 | 2.5 |
| 37.8 | |
Market Sectors as of October 31, 2012 |
| % of fund's
net assets | % of fund's net assets
6 months ago |
Consumer Discretionary | 26.6 | 22.6 |
Financials | 20.5 | 18.3 |
Information Technology | 17.3 | 25.1 |
Health Care | 10.4 | 6.0 |
Materials | 10.1 | 9.9 |
Industrials | 8.5 | 7.6 |
Consumer Staples | 2.8 | 3.2 |
Telecommunication Services | 2.0 | 2.2 |
Utilities | 0.7 | 1.1 |
Annual Report
Fidelity Japan Fund
Investments October 31, 2012
Showing Percentage of Net Assets
Common Stocks - 98.9% |
| Shares | | Value |
CONSUMER DISCRETIONARY - 26.6% |
Auto Components - 4.7% |
Bridgestone Corp. | 280,900 | | $ 6,541,314 |
Denso Corp. | 282,500 | | 8,843,386 |
Keihin Corp. | 175,300 | | 2,112,472 |
| | 17,497,172 |
Automobiles - 15.1% |
Honda Motor Co. Ltd. | 567,900 | | 17,072,918 |
Nissan Motor Co. Ltd. | 727,500 | | 6,087,561 |
Suzuki Motor Corp. | 275,400 | | 6,237,294 |
Toyota Motor Corp. | 709,100 | | 27,340,884 |
| | 56,738,657 |
Household Durables - 1.6% |
Panasonic Corp. | 1,011,200 | | 6,133,496 |
Media - 2.0% |
Avex Group Holdings, Inc. | 193,400 | | 3,822,939 |
Jupiter Telecommunications Co. | 2,685 | | 3,649,286 |
| | 7,472,225 |
Multiline Retail - 1.7% |
Marui Group Co. Ltd. | 889,500 | | 6,395,753 |
Specialty Retail - 0.3% |
Arc Land Sakamoto Co. Ltd. | 86,200 | | 1,249,322 |
Textiles, Apparel & Luxury Goods - 1.2% |
Onward Holdings Co. Ltd. | 629,000 | | 4,656,633 |
TOTAL CONSUMER DISCRETIONARY | | 100,143,258 |
CONSUMER STAPLES - 2.8% |
Food & Staples Retailing - 1.0% |
Seven & i Holdings Co., Ltd. | 124,000 | | 3,824,226 |
Food Products - 0.6% |
Toyo Suisan Kaisha Ltd. | 91,000 | | 2,267,306 |
Personal Products - 1.2% |
Shiseido Co. Ltd. | 363,400 | | 4,597,695 |
TOTAL CONSUMER STAPLES | | 10,689,227 |
FINANCIALS - 20.5% |
Commercial Banks - 9.7% |
Mitsubishi UFJ Financial Group, Inc. | 3,437,800 | | 15,552,497 |
Mizuho Financial Group, Inc. | 5,340,800 | | 8,356,644 |
Sumitomo Mitsui Financial Group, Inc. | 411,100 | | 12,561,985 |
| | 36,471,126 |
Consumer Finance - 1.9% |
ACOM Co. Ltd. (a) | 85,750 | | 2,531,789 |
Aeon Credit Service Co. Ltd. | 226,400 | | 4,804,229 |
| | 7,336,018 |
Insurance - 1.5% |
MS&AD Insurance Group Holdings, Inc. | 322,900 | | 5,472,676 |
|
| Shares | | Value |
Real Estate Investment Trusts - 2.6% |
Frontier Real Estate Investment Corp. | 731 | | $ 6,455,656 |
Japan Logistics Fund, Inc. | 383 | | 3,497,520 |
| | 9,953,176 |
Real Estate Management & Development - 4.8% |
Mitsui Fudosan Co. Ltd. | 374,000 | | 7,556,833 |
Nomura Real Estate Holdings, Inc. | 583,600 | | 10,475,996 |
| | 18,032,829 |
TOTAL FINANCIALS | | 77,265,825 |
HEALTH CARE - 10.4% |
Health Care Equipment & Supplies - 2.0% |
ASAHI INTECC Co. Ltd. (d) | 88,000 | | 2,611,449 |
Terumo Corp. | 114,100 | | 4,916,748 |
| | 7,528,197 |
Health Care Providers & Services - 1.8% |
Message Co. Ltd. (d) | 2,198 | | 6,784,257 |
Pharmaceuticals - 6.6% |
Astellas Pharma, Inc. | 227,900 | | 11,319,347 |
Shionogi & Co. Ltd. | 251,600 | | 4,172,847 |
Takeda Pharmaceutical Co. Ltd. | 198,700 | | 9,234,335 |
| | 24,726,529 |
TOTAL HEALTH CARE | | 39,038,983 |
INDUSTRIALS - 8.5% |
Electrical Equipment - 0.8% |
Nidec Corp. (d) | 44,900 | | 3,194,689 |
Machinery - 3.7% |
Kubota Corp. | 679,000 | | 6,940,549 |
Makita Corp. | 73,000 | | 2,885,068 |
Mitsubishi Heavy Industries Ltd. | 956,000 | | 4,023,750 |
| | 13,849,367 |
Road & Rail - 2.2% |
East Japan Railway Co. | 101,500 | | 6,967,556 |
Hitachi Transport System Ltd. | 93,700 | | 1,404,972 |
| | 8,372,528 |
Trading Companies & Distributors - 1.8% |
Sumitomo Corp. | 486,400 | | 6,629,127 |
TOTAL INDUSTRIALS | | 32,045,711 |
INFORMATION TECHNOLOGY - 17.3% |
Computers & Peripherals - 4.0% |
Fujitsu Ltd. | 1,680,000 | | 6,460,729 |
Toshiba Corp. | 2,360,000 | | 8,750,595 |
| | 15,211,324 |
Electronic Equipment & Components - 5.1% |
Hamamatsu Photonics K.K. | 97,100 | | 3,363,165 |
Hitachi High-Technologies Corp. | 90,600 | | 1,982,691 |
Common Stocks - continued |
| Shares | | Value |
INFORMATION TECHNOLOGY - continued |
Electronic Equipment & Components - continued |
Horiba Ltd. | 153,400 | | $ 4,179,444 |
Shimadzu Corp. | 1,426,000 | | 9,592,409 |
| | 19,117,709 |
IT Services - 2.7% |
Otsuka Corp. | 88,500 | | 7,217,024 |
SCSK Corp. | 182,000 | | 3,096,029 |
| | 10,313,053 |
Office Electronics - 4.4% |
Canon, Inc. | 507,500 | | 16,493,586 |
Software - 1.1% |
Capcom Co. Ltd. | 209,500 | | 3,991,601 |
TOTAL INFORMATION TECHNOLOGY | | 65,127,273 |
MATERIALS - 10.1% |
Chemicals - 9.2% |
Asahi Kasei Corp. | 2,006,000 | | 11,031,367 |
Kaneka Corp. | 427,000 | | 2,080,709 |
Nippon Kayaku Co. Ltd. | 110,000 | | 1,223,600 |
Nippon Shokubai Co. Ltd. | 305,000 | | 2,991,545 |
Nitto Denko Corp. | 152,200 | | 6,901,716 |
Toray Industries, Inc. | 1,794,000 | | 10,472,304 |
| | 34,701,241 |
Metals & Mining - 0.9% |
Hitachi Metals Ltd. | 333,000 | | 3,116,009 |
TOTAL MATERIALS | | 37,817,250 |
TELECOMMUNICATION SERVICES - 2.0% |
Wireless Telecommunication Services - 2.0% |
NTT DoCoMo, Inc. | 5,200 | | 7,534,942 |
|
| Shares | | Value |
UTILITIES - 0.7% |
Electric Utilities - 0.7% |
Kansai Electric Power Co., Inc. | 330,300 | | $ 2,540,451 |
TOTAL COMMON STOCKS (Cost $445,663,766) |
372,202,920
|
Money Market Funds - 3.5% |
| | | |
Fidelity Cash Central Fund, 0.19% (b) | 9,391,664 | | 9,391,664 |
Fidelity Securities Lending Cash Central Fund, 0.19% (b)(c) | 3,921,508 | | 3,921,508 |
TOTAL MONEY MARKET FUNDS (Cost $13,313,172) |
13,313,172
|
TOTAL INVESTMENT PORTFOLIO - 102.4% (Cost $458,976,938) | | 385,516,092 |
NET OTHER ASSETS (LIABILITIES) - (2.4)% | | (9,021,583) |
NET ASSETS - 100% | $ 376,494,509 |
Legend |
(a) Non-income producing |
(b) Affiliated fund that is available only to investment companies and other accounts managed by Fidelity Investments. The rate quoted is the annualized seven-day yield of the fund at period end. A complete unaudited listing of the fund's holdings as of its most recent quarter end is available upon request. In addition, each Fidelity Central Fund's financial statements, which are not covered by the Fund's Report of Independent Registered Public Accounting Firm, are available on the SEC's website or upon request. |
(c) Investment made with cash collateral received from securities on loan. |
(d) Security or a portion of the security is on loan at period end. |
Affiliated Central Funds |
Information regarding fiscal year to date income earned by the Fund from investments in Fidelity Central Funds is as follows: |
Fund | Income earned |
Fidelity Cash Central Fund | $ 15,392 |
Fidelity Securities Lending Cash Central Fund | 57,669 |
Total | $ 73,061 |
Other Information |
The following is a summary of the inputs used, as of October 31, 2012, involving the Fund's assets and liabilities carried at fair value. The inputs or methodology used for valuing securities may not be an indication of the risk associated with investing in those securities. For more information on valuation inputs, and their aggregation into the levels used in the tables below, please refer to the Security Valuation section in the accompanying Notes to Financial Statements. |
Valuation Inputs at Reporting Date: |
Description | Total | Level 1 | Level 2 | Level 3 |
Investments in Securities: | | | | |
Equities: | | | | |
Consumer Discretionary | $ 100,143,258 | $ 49,595,960 | $ 50,547,298 | $ - |
Consumer Staples | 10,689,227 | 10,689,227 | - | - |
Financials | 77,265,825 | 40,794,699 | 36,471,126 | - |
Health Care | 39,038,983 | 39,038,983 | - | - |
Industrials | 32,045,711 | 32,045,711 | - | - |
Information Technology | 65,127,273 | 48,633,687 | 16,493,586 | - |
Materials | 37,817,250 | 37,817,250 | - | - |
Telecommunication Services | 7,534,942 | - | 7,534,942 | - |
Utilities | 2,540,451 | 2,540,451 | - | - |
Money Market Funds | 13,313,172 | 13,313,172 | - | - |
Total Investments in Securities: | $ 385,516,092 | $ 274,469,140 | $ 111,046,952 | $ - |
The following is a summary of transfers between Level 1 and Level 2 for the period ended October 31, 2012. Transfers are assumed to have occurred at the beginning of the period, and are primarily attributable to the valuation techniques used for foreign equity securities, as discussed in the accompanying Notes to Financial Statements: |
Transfers | Total |
Level 1 to Level 2 | $ 0 |
Level 2 to Level 1 | $ 221,614,606 |
See accompanying notes which are an integral part of the financial statements.
Annual Report
Fidelity Japan Fund
Statement of Assets and Liabilities
| October 31, 2012 |
| | |
Assets | | |
Investment in securities, at value (including securities loaned of $3,663,872) - See accompanying schedule: Unaffiliated issuers (cost $445,663,766) | $ 372,202,920 | |
Fidelity Central Funds (cost $13,313,172) | 13,313,172 | |
Total Investments (cost $458,976,938) | | $ 385,516,092 |
Receivable for investments sold | | 1,818,767 |
Receivable for fund shares sold | | 199,278 |
Dividends receivable | | 3,555,728 |
Distributions receivable from Fidelity Central Funds | | 5,293 |
Other receivables | | 32,231 |
Total assets | | 391,127,389 |
| | |
Liabilities | | |
Payable for investments purchased | $ 1,472,890 | |
Payable for fund shares redeemed | 8,839,933 | |
Accrued management fee | 226,105 | |
Distribution and service plan fees payable | 10,452 | |
Other affiliated payables | 92,408 | |
Other payables and accrued expenses | 69,584 | |
Collateral on securities loaned, at value | 3,921,508 | |
Total liabilities | | 14,632,880 |
| | |
Net Assets | | $ 376,494,509 |
Net Assets consist of: | | |
Paid in capital | | $ 662,035,138 |
Undistributed net investment income | | 5,171,198 |
Accumulated undistributed net realized gain (loss) on investments and foreign currency transactions | | (217,159,330) |
Net unrealized appreciation (depreciation) on investments and assets and liabilities in foreign currencies | | (73,552,497) |
Net Assets | | $ 376,494,509 |
Statement of Assets and Liabilities - continued
| October 31, 2012 |
| | |
Calculation of Maximum Offering Price Class A:
Net Asset Value and redemption price per share ($9,495,097 ÷ 1,020,459 shares) | | $ 9.30 |
| | |
Maximum offering price per share (100/94.25 of $9.30) | | $ 9.87 |
Class T:
Net Asset Value and redemption price per share ($3,933,511 ÷ 424,072 shares) | | $ 9.28 |
| | |
Maximum offering price per share (100/96.50 of $9.28) | | $ 9.62 |
Class B:
Net Asset Value and offering price per share ($1,012,233 ÷ 109,322 shares)A | | $ 9.26 |
| | |
Class C:
Net Asset Value and offering price per share ($7,015,255 ÷ 758,790 shares)A | | $ 9.25 |
| | |
Japan:
Net Asset Value, offering price and redemption price per share ($353,550,250 ÷ 37,872,939 shares) | | $ 9.34 |
| | |
Institutional Class:
Net Asset Value, offering price and redemption price per share ($1,488,163 ÷ 159,495 shares) | | $ 9.33 |
A Redemption price per share is equal to net asset value less any applicable contingent deferred sales charge.
See accompanying notes which are an integral part of the financial statements.
Annual Report
Fidelity Japan Fund
Financial Statements - continued
Statement of Operations
| Year ended October 31, 2012 |
| | |
Investment Income | | |
Dividends | | $ 10,808,030 |
Interest | | 66 |
Income from Fidelity Central Funds | | 73,061 |
Income before foreign taxes withheld | | 10,881,157 |
Less foreign taxes withheld | | (756,562) |
Total income | | 10,124,595 |
| | |
Expenses | | |
Management fee Basic fee | $ 3,118,883 | |
Performance adjustment | 256,814 | |
Transfer agent fees | 999,478 | |
Distribution and service plan fees | 143,002 | |
Accounting and security lending fees | 229,410 | |
Custodian fees and expenses | 50,443 | |
Independent trustees' compensation | 3,017 | |
Registration fees | 75,488 | |
Audit | 67,660 | |
Legal | 2,379 | |
Miscellaneous | 4,284 | |
Total expenses before reductions | 4,950,858 | |
Expense reductions | (194,406) | 4,756,452 |
Net investment income (loss) | | 5,368,143 |
Realized and Unrealized Gain (Loss) Net realized gain (loss) on: | | |
Investment securities: | | |
Unaffiliated issuers | (9,017,678) | |
Foreign currency transactions | 105,412 | |
Total net realized gain (loss) | | (8,912,266) |
Change in net unrealized appreciation (depreciation) on: Investment securities | 3,036,129 | |
Assets and liabilities in foreign currencies | (14,170) | |
Total change in net unrealized appreciation (depreciation) | | 3,021,959 |
Net gain (loss) | | (5,890,307) |
Net increase (decrease) in net assets resulting from operations | | $ (522,164) |
Statement of Changes in Net Assets
| Year ended
October 31,
2012 | Year ended
October 31,
2011 |
Increase (Decrease) in Net Assets | | |
Operations | | |
Net investment income (loss) | $ 5,368,143 | $ 7,504,955 |
Net realized gain (loss) | (8,912,266) | (68,712,920) |
Change in net unrealized appreciation (depreciation) | 3,021,959 | 31,829,795 |
Net increase (decrease) in net assets resulting from operations | (522,164) | (29,378,170) |
Distributions to shareholders from net investment income | (7,688,787) | (9,748,982) |
Distributions to shareholders from net realized gain | (2,570,905) | (10,506,757) |
Total distributions | (10,259,692) | (20,255,739) |
Share transactions - net increase (decrease) | (93,975,629) | (153,265,919) |
Redemption fees | 61,543 | 492,971 |
Total increase (decrease) in net assets | (104,695,942) | (202,406,857) |
| | |
Net Assets | | |
Beginning of period | 481,190,451 | 683,597,308 |
End of period (including undistributed net investment income of $5,171,198 and undistributed net investment income of $7,491,842, respectively) | $ 376,494,509 | $ 481,190,451 |
See accompanying notes which are an integral part of the financial statements.
Annual Report
Financial Highlights - Class A
Years ended October 31, | 2012 | 2011 H |
Selected Per-Share Data | | |
Net asset value, beginning of period | $ 9.54 | $ 10.83 |
Income from Investment Operations | | |
Net investment income (loss) E | .09 | .09 |
Net realized and unrealized gain (loss) | (.15) | (1.39) |
Total from investment operations | (.06) | (1.30) |
Distributions from net investment income | (.13) | - |
Distributions from net realized gain | (.05) | - |
Total distributions | (.18) | - |
Redemption fees added to paid in capital E | - K | .01 |
Net asset value, end of period | $ 9.30 | $ 9.54 |
Total Return B, C, D | (.64)% | (11.91)% |
Ratios to Average Net Assets F, I | | |
Expenses before reductions | 1.42% | 1.20% A |
Expenses net of fee waivers, if any | 1.38% | 1.20% A |
Expenses net of all reductions | 1.36% | 1.16% A |
Net investment income (loss) | .94% | 1.02% A |
Supplemental Data | | |
Net assets, end of period (000 omitted) | $ 9,495 | $ 13,208 |
Portfolio turnover rate G | 52% | 134% J |
A Annualized B Total returns for periods of less than one year are not annualized. C Total returns would have been lower if certain expenses had not been reduced during the applicable periods shown. D Total returns do not include the effect of the sales charges. E Calculated based on average shares outstanding during the period. F Fees and expenses of any underlying Fidelity Central Funds are not included in the Fund's expense ratio. The Fund indirectly bears its proportionate share of the expenses of any underlying Fidelity Central Funds. G Amount does not include the portfolio activity of any underlying Fidelity Central Funds. H For the period December 14, 2010 (commencement of sale of shares) to October 31, 2011. I Expense ratios reflect operating expenses of the class. Expenses before reductions do not reflect amounts reimbursed by the investment adviser or reductions from brokerage service arrangements or reductions from other expense offset arrangements and do not represent the amount paid by the class during periods when reimbursements or reductions occur. Expense ratios before reductions for start-up periods may not be representative of longer-term operating periods. Expenses net of fee waivers reflect expenses after reimbursement by the investment adviser but prior to reductions from brokerage service arrangements or other expense offset arrangements. Expenses net of all reductions represent the net expenses paid by the class. J The portfolio turnover rate does not include the assets acquired in the merger. K Amount represents less than $.01 per share. |
Financial Highlights - Class T
Years ended October 31, | 2012 | 2011 H |
Selected Per-Share Data | | |
Net asset value, beginning of period | $ 9.51 | $ 10.83 |
Income from Investment Operations | | |
Net investment income (loss) E | .06 | .07 |
Net realized and unrealized gain (loss) | (.13) | (1.40) |
Total from investment operations | (.07) | (1.33) |
Distributions from net investment income | (.11) | - |
Distributions from net realized gain | (.05) | - |
Total distributions | (.16) | - |
Redemption fees added to paid in capital E | - K | .01 |
Net asset value, end of period | $ 9.28 | $ 9.51 |
Total Return B, C, D | (.75)% | (12.19)% |
Ratios to Average Net Assets F, I | | |
Expenses before reductions | 1.70% | 1.48% A |
Expenses net of fee waivers, if any | 1.66% | 1.48% A |
Expenses net of all reductions | 1.64% | 1.44% A |
Net investment income (loss) | .66% | .74% A |
Supplemental Data | | |
Net assets, end of period (000 omitted) | $ 3,934 | $ 4,643 |
Portfolio turnover rate G | 52% | 134% J |
A Annualized B Total returns for periods of less than one year are not annualized. C Total returns would have been lower if certain expenses had not been reduced during the applicable periods shown. D Total returns do not include the effect of the sales charges. E Calculated based on average shares outstanding during the period. F Fees and expenses of any underlying Fidelity Central Funds are not included in the Fund's expense ratio. The Fund indirectly bears its proportionate share of the expenses of any underlying Fidelity Central Funds. G Amount does not include the portfolio activity of any underlying Fidelity Central Funds. H For the period December 14, 2010 (commencement of sale of shares) to October 31, 2011. I Expense ratios reflect operating expenses of the class. Expenses before reductions do not reflect amounts reimbursed by the investment adviser or reductions from brokerage service arrangements or reductions from other expense offset arrangements and do not represent the amount paid by the class during periods when reimbursements or reductions occur. Expense ratios before reductions for start-up periods may not be representative of longer-term operating periods. Expenses net of fee waivers reflect expenses after reimbursement by the investment adviser but prior to reductions from brokerage service arrangements or other expense offset arrangements. Expenses net of all reductions represent the net expenses paid by the class. J The portfolio turnover rate does not include the assets acquired in the merger. K Amount represents less than $.01 per share. |
See accompanying notes which are an integral part of the financial statements.
Annual Report
Financial Highlights - Class B
Years ended October 31, | 2012 | 2011 H |
Selected Per-Share Data | | |
Net asset value, beginning of period | $ 9.47 | $ 10.83 |
Income from Investment Operations | | |
Net investment income (loss) E | .02 | .02 |
Net realized and unrealized gain (loss) | (.14) | (1.39) |
Total from investment operations | (.12) | (1.37) |
Distributions from net investment income | (.04) | - |
Distributions from net realized gain | (.05) | - |
Total distributions | (.09) | - |
Redemption fees added to paid in capital E | - K | .01 |
Net asset value, end of period | $ 9.26 | $ 9.47 |
Total Return B, C, D | (1.24)% | (12.56)% |
Ratios to Average Net Assets F, I | | |
Expenses before reductions | 2.17% | 1.95% A |
Expenses net of fee waivers, if any | 2.13% | 1.95% A |
Expenses net of all reductions | 2.11% | 1.91% A |
Net investment income (loss) | .19% | .27% A |
Supplemental Data | | |
Net assets, end of period (000 omitted) | $ 1,012 | $ 1,458 |
Portfolio turnover rate G | 52% | 134% J |
A Annualized B Total returns for periods of less than one year are not annualized. C Total returns would have been lower if certain expenses had not been reduced during the applicable periods shown. D Total returns do not include the effect of the contingent deferred sales charge. E Calculated based on average shares outstanding during the period. F Fees and expenses of any underlying Fidelity Central Funds are not included in the Fund's expense ratio. The Fund indirectly bears its proportionate share of the expenses of any underlying Fidelity Central Funds. G Amount does not include the portfolio activity of any underlying Fidelity Central Funds. H For the period December 14, 2010 (commencement of sale of shares) to October 31, 2011. I Expense ratios reflect operating expenses of the class. Expenses before reductions do not reflect amounts reimbursed by the investment adviser or reductions from brokerage service arrangements or reductions from other expense offset arrangements and do not represent the amount paid by the class during periods when reimbursements or reductions occur. Expense ratios before reductions for start-up periods may not be representative of longer-term operating periods. Expenses net of fee waivers reflect expenses after reimbursement by the investment adviser but prior to reductions from brokerage service arrangements or other expense offset arrangements. Expenses net of all reductions represent the net expenses paid by the class. J The portfolio turnover rate does not include the assets acquired in the merger. K Amount represents less than $.01 per share. |
Financial Highlights - Class C
Years ended October 31, | 2012 | 2011 H |
Selected Per-Share Data | | |
Net asset value, beginning of period | $ 9.48 | $ 10.83 |
Income from Investment Operations | | |
Net investment income (loss) E | .02 | .03 |
Net realized and unrealized gain (loss) | (.14) | (1.39) |
Total from investment operations | (.12) | (1.36) |
Distributions from net investment income | (.06) | - |
Distributions from net realized gain | (.05) | - |
Total distributions | (.11) | - |
Redemption fees added to paid in capital E | - K | .01 |
Net asset value, end of period | $ 9.25 | $ 9.48 |
Total Return B, C, D | (1.27)% | (12.47)% |
Ratios to Average Net Assets F, I | | |
Expenses before reductions | 2.15% | 1.92% A |
Expenses net of fee waivers, if any | 2.11% | 1.92% A |
Expenses net of all reductions | 2.09% | 1.88% A |
Net investment income (loss) | .21% | .30% A |
Supplemental Data | | |
Net assets, end of period (000 omitted) | $ 7,015 | $ 8,750 |
Portfolio turnover rate G | 52% | 134% J |
A Annualized B Total returns for periods of less than one year are not annualized. C Total returns would have been lower if certain expenses had not been reduced during the applicable periods shown. D Total returns do not include the effect of the contingent deferred sales charge. E Calculated based on average shares outstanding during the period. F Fees and expenses of any underlying Fidelity Central Funds are not included in the Fund's expense ratio. The Fund indirectly bears its proportionate share of the expenses of any underlying Fidelity Central Funds. G Amount does not include the portfolio activity of any underlying Fidelity Central Funds. H For the period December 14, 2010 (commencement of sale of shares) to October 31, 2011. I Expense ratios reflect operating expenses of the class. Expenses before reductions do not reflect amounts reimbursed by the investment adviser or reductions from brokerage service arrangements or reductions from other expense offset arrangements and do not represent the amount paid by the class during periods when reimbursements or reductions occur. Expense ratios before reductions for start-up periods may not be representative of longer-term operating periods. Expenses net of fee waivers reflect expenses after reimbursement by the investment adviser but prior to reductions from brokerage service arrangements or other expense offset arrangements. Expenses net of all reductions represent the net expenses paid by the class. J The portfolio turnover rate does not include the assets acquired in the merger. K Amount represents less than $.01 per share. |
See accompanying notes which are an integral part of the financial statements.
Annual Report
Financial Highlights - Japan
Years ended October 31, | 2012 | 2011 | 2010 | 2009 | 2008 |
Selected Per-Share Data | | | | | |
Net asset value, beginning of period | $ 9.57 | $ 10.57 | $ 10.03 | $ 9.03 | $ 18.00 |
Income from Investment Operations | | | | | |
Net investment income (loss) B | .12 | .15 | .10 | .08 | .10 |
Net realized and unrealized gain (loss) | (.14) | (.75) | .61 | 1.04 | (6.64) |
Total from investment operations | (.02) | (.60) | .71 | 1.12 | (6.54) |
Distributions from net investment income | (.16) | (.20) | (.07) | (.11) | (.04) |
Distributions from net realized gain | (.05) | (.21) | (.10) | (.01) | (2.39) |
Total distributions | (.21) | (.41) | (.17) | (.12) | (2.43) |
Redemption fees added to paid in capital B | - G | .01 | - G | - G | - G |
Net asset value, end of period | $ 9.34 | $ 9.57 | $ 10.57 | $ 10.03 | $ 9.03 |
Total Return A | (.19)% | (6.00)% | 7.12% | 12.84% | (41.88)% |
Ratios to Average Net Assets C, E | | | | | |
Expenses before reductions | 1.09% | .86% | .93% | .90% | 1.12% |
Expenses net of fee waivers, if any | 1.06% | .84% | .93% | .90% | 1.12% |
Expenses net of all reductions | 1.04% | .80% | .93% | .89% | 1.10% |
Net investment income (loss) | 1.26% | 1.38% | .97% | .90% | .72% |
Supplemental Data | | | | | |
Net assets, end of period (000 omitted) | $ 353,550 | $ 450,417 | $ 649,316 | $ 944,902 | $ 1,025,334 |
Portfolio turnover rate D | 52% | 134% F | 43% | 73% | 78% |
A Total returns would have been lower if certain expenses had not been reduced during the applicable periods shown. B Calculated based on average shares outstanding during the period. C Fees and expenses of any underlying Fidelity Central Funds are not included in the Fund's expense ratio. The Fund indirectly bears its proportionate share of the expenses of any underlying Fidelity Central Funds. D Amount does not include the portfolio activity of any underlying Fidelity Central Funds. E Expense ratios reflect operating expenses of the class. Expenses before reductions do not reflect amounts reimbursed by the investment adviser or reductions from brokerage service arrangements or reductions from other expense offset arrangements and do not represent the amount paid by the class during periods when reimbursements or reductions occur. Expenses net of fee waivers reflect expenses after reimbursement by the investment adviser but prior to reductions from brokerage service arrangements or other expense offset arrangements. Expenses net of all reductions represent the net expenses paid by the class. F The portfolio turnover rate does not include the assets acquired in the merger. G Amount represents less than $.01 per share. |
Financial Highlights - Institutional Class
Years ended October 31, | 2012 | 2011 G |
Selected Per-Share Data | | |
Net asset value, beginning of period | $ 9.57 | $ 10.83 |
Income from Investment Operations | | |
Net investment income (loss) D | .12 | .13 |
Net realized and unrealized gain (loss) | (.14) | (1.40) |
Total from investment operations | (.02) | (1.27) |
Distributions from net investment income | (.17) | - |
Distributions from net realized gain | (.05) | - |
Total distributions | (.22) | - |
Redemption fees added to paid in capital D | - J | .01 |
Net asset value, end of period | $ 9.33 | $ 9.57 |
Total Return B, C | (.18)% | (11.63)% |
Ratios to Average Net Assets E, H | | |
Expenses before reductions | 1.03% | .79% A |
Expenses net of fee waivers, if any | 1.01% | .79% A |
Expenses net of all reductions | .99% | .75% A |
Net investment income (loss) | 1.31% | 1.43% A |
Supplemental Data | | |
Net assets, end of period (000 omitted) | $ 1,488 | $ 2,715 |
Portfolio turnover rate F | 52% | 134% I |
A Annualized B Total returns for periods of less than one year are not annualized. C Total returns would have been lower if certain expenses had not been reduced during the applicable periods shown. D Calculated based on average shares outstanding during the period. E Fees and expenses of any underlying Fidelity Central Funds are not included in the Fund's expense ratio. The Fund indirectly bears its proportionate share of the expenses of any underlying Fidelity Central Funds. F Amount does not include the portfolio activity of any underlying Fidelity Central Funds. G For the period December 14, 2010 (commencement of sale of shares) to October 31, 2011. H Expense ratios reflect operating expenses of the class. Expenses before reductions do not reflect amounts reimbursed by the investment adviser or reductions from brokerage service arrangements or reductions from other expense offset arrangements and do not represent the amount paid by the class during periods when reimbursements or reductions occur. Expense ratios before reductions for start-up periods may not be representative of longer-term operating periods. Expenses net of fee waivers reflect expenses after reimbursement by the investment adviser but prior to reductions from brokerage service arrangements or other expense offset arrangements. Expenses net of all reductions represent the net expenses paid by the class. I The portfolio turnover rate does not include the assets acquired in the merger. J Amount represents less than $.01 per share. |
See accompanying notes which are an integral part of the financial statements.
Annual Report
Notes to Financial Statements
For the period ended October 31, 2012
1. Organization.
Fidelity Japan Fund (the Fund) is a fund of Fidelity Investment Trust (the Trust) and is authorized to issue an unlimited number of shares. The Trust is registered under the Investment Company Act of 1940, as amended (the 1940 Act), as an open-end management investment company organized as a Massachusetts business trust. The Fund offers Class A, Class T, Class C, Japan and Institutional Class shares, each of which, along with Class B shares, has equal rights as to assets and voting privileges. Class B shares are closed to new accounts and additional purchases, except for exchanges and reinvestments. Each class has exclusive voting rights with respect to matters that affect that class. Class B shares automatically convert to Class A shares after a holding period of seven years from the initial date of purchase. Investment income, realized and unrealized capital gains and losses, the common expenses of the Fund, and certain fund-level expense reductions, if any, are allocated on a pro-rata basis to each class based on the relative net assets of each class to the total net assets of the Fund. Each class differs with respect to transfer agent and distribution and service plan fees incurred. Certain expense reductions may also differ by class. The Fund offered Class F shares during the period June 26, 2009 through December 15, 2010 and all outstanding shares were redeemed by December 15, 2010.
2. Investments in Fidelity Central Funds.
The Fund invests in Fidelity Central Funds, which are open-end investment companies available only to other investment companies and accounts managed by Fidelity Management & Research Company (FMR) and its affiliates. The Fund's Schedule of Investments lists each of the Fidelity Central Funds held as of period end, if any, as an investment of the Fund, but does not include the underlying holdings of each Fidelity Central Fund. As an Investing Fund, the Fund indirectly bears its proportionate share of the expenses of the underlying Fidelity Central Funds.
The Money Market Central Funds seek preservation of capital and current income and are managed by Fidelity Investments Money Management, Inc. (FIMM), an affiliate of FMR.
A complete unaudited list of holdings for each Fidelity Central Fund is available upon request or at the Securities and Exchange Commission (the SEC) web site at www.sec.gov. In addition, the financial statements of the Fidelity Central Funds, which are not covered by the Fund's Report of Independent Registered Public Accounting Firm, are available on the SEC web site or upon request.
3. Significant Accounting Policies.
The financial statements have been prepared in conformity with accounting principles generally accepted in the United States of America (GAAP), which require management to make certain estimates and assumptions at the date of the financial statements. Actual results could differ from those estimates. Subsequent events, if any, through the date that the financial statements were issued have been evaluated in the preparation of the financial statements. The following summarizes the significant accounting policies of the Fund:
Security Valuation. Investments are valued as of 4:00 p.m. Eastern time on the last calendar day of the period. In accordance with valuation policies and procedures approved by the Board of Trustees (the Board), the Fund attempts to obtain prices from one or more third party pricing vendors or brokers to value its investments. When current market prices, quotations or rates are not readily available or reliable, securities will be fair valued in good faith by the FMR Fair Value Committee (the Committee), in accordance with procedures adopted by the Fund's Board. Factors used in determining fair value vary by security type and may include market or security specific events. The frequency with which these procedures are used cannot be predicted and they may be utilized to a significant extent. The Committee oversees the Fund's valuation policies and procedures and is responsible for approving and reporting to the Board all fair value determinations.
The Fund categorizes the inputs to valuation techniques used to value its investments into a disclosure hierarchy consisting of three levels as shown below:
Level 1 - quoted prices in active markets for identical investments
Level 2 - other significant observable inputs (including quoted prices for similar investments, interest rates, prepayment speeds, etc.)
Level 3 - unobservable inputs (including the Fund's own assumptions based on the best information available)
Valuation techniques used to value the Fund's investments by major category are as follows:
Equity securities, including restricted securities, for which market quotations are readily available, are valued at the last reported sale price or official closing price as reported by a third party pricing vendor on the primary market or exchange on which they are traded and are categorized as Level 1 in the hierarchy. In the event there were no sales during the day or closing prices are not available, securities are valued at the last quoted bid price or may be valued using the last available price and are generally categorized as Level 2 in the hierarchy. For foreign equity securities, when significant market or security specific events arise, comparisons to the valuation of American Depositary Receipts (ADRs), futures contracts, Exchange-Traded Funds (ETFs) and certain indexes as well as quoted prices for similar securities are used and are categorized as Level 2 in the hierarchy. Utilizing these techniques may result in transfers between Level 1 and Level 2.
Annual Report
Notes to Financial Statements - continued
3. Significant Accounting Policies - continued
Security Valuation - continued
Investments in open-end mutual funds, including the Fidelity Central Funds, are valued at their closing net asset value (NAV) each business day and are categorized as Level 1 in the hierarchy.
Changes in valuation techniques may result in transfers in or out of an assigned level within the disclosure hierarchy. The aggregate value of investments by input level, as of October 31, 2012, including information on transfers between Levels 1 and 2, is included at the end of the Fund's Schedule of Investments.
Foreign Currency Translation. The Fund may use foreign currency contracts to facilitate transactions in foreign-denominated securities. Gains and losses from these transactions may arise from changes in the value of the foreign currency or if the counterparties do not perform under the contracts' terms.
Foreign-denominated assets, including investment securities, and liabilities are translated into U.S. dollars at the exchange rates at period end. Purchases and sales of investment securities, income and dividends received and expenses denominated in foreign currencies are translated into U.S. dollars at the exchange rate in effect on the transaction date.
The effects of exchange rate fluctuations on investments are included with the net realized and unrealized gain (loss) on investment securities. Other foreign currency transactions resulting in realized and unrealized gain (loss) are disclosed separately.
Investment Transactions and Income. For financial reporting purposes, the Fund's investment holdings and NAV include trades executed through the end of the last business day of the period. The NAV per share for processing shareholder transactions is calculated as of the close of business of the New York Stock Exchange (NYSE), normally 4:00 p.m. Eastern time and includes trades executed through the end of the prior business day. Gains and losses on securities sold are determined on the basis of identified cost. Dividend income is recorded on the ex-dividend date, except for certain dividends from foreign securities where the ex-dividend date may have passed, which are recorded as soon as the Fund is informed of the ex-dividend date. Non-cash dividends included in dividend income, if any, are recorded at the fair market value of the securities received. Interest income and distributions from the Fidelity Central Funds are accrued as earned. Interest income includes coupon interest and amortization of premium and accretion of discount on debt securities. Investment income is recorded net of foreign taxes withheld where recovery of such taxes is uncertain.
Expenses. Expenses directly attributable to a fund are charged to that fund. Expenses attributable to more than one fund are allocated among the respective funds on the basis of relative net assets or other appropriate methods. Expense estimates are accrued in the period to which they relate and adjustments are made when actual amounts are known.
Income Tax Information and Distributions to Shareholders. Each year, the Fund intends to qualify as a regulated investment company under Subchapter M of the Internal Revenue Code, including distributing substantially all of its taxable income and realized gains. As a result, no provision for income taxes is required. As of October 31, 2012, the Fund did not have any unrecognized tax benefits in the financial statements; nor is the Fund aware of any tax positions for which it is reasonably possible that the total amounts of unrecognized tax benefits will significantly change in the next twelve months. The Fund files a U.S. federal tax return, in addition to state and local tax returns as required. A fund's federal income tax returns are subject to examination by the Internal Revenue Service (IRS) for a period of three fiscal years after they are filed. State and local tax returns may be subject to examination for an additional fiscal year depending on the jurisdiction. Foreign taxes are provided for based on the Fund's understanding of the tax rules and rates that exist in the foreign markets in which it invests.
Distributions are declared and recorded on the ex-dividend date. Income dividends and capital gain distributions are declared separately for each class. Income and capital gain distributions are determined in accordance with income tax regulations, which may differ from GAAP.
Capital accounts within the financial statements are adjusted for permanent book-tax differences. These adjustments have no impact on net assets or the results of operations. Temporary book-tax differences will reverse in a subsequent period.
Book-tax differences are primarily due to the foreign currency transactions, passive foreign investment companies (PFIC), deferred trustees compensation, capital loss carryfowards and losses deferred due to wash sales.
The federal tax cost of investment securities and unrealized appreciation (depreciation) as of period end were as follows:
Gross unrealized appreciation | $ 13,646,950 |
Gross unrealized depreciation | (95,986,881) |
Net unrealized appreciation (depreciation) on securities and other investments | $ (82,339,931) |
| |
Tax Cost | $ 467,856,023 |
Annual Report
3. Significant Accounting Policies - continued
Income Tax Information and Distributions to Shareholders - continued
The tax-based components of distributable earnings as of period end were as follows:
Undistributed ordinary income | $ 8,180,595 |
Capital loss carryforward | $ (211,289,523) |
Net unrealized appreciation (depreciation) | $ (82,431,582) |
Capital loss carryforwards are only available to offset future capital gains of the Fund to the extent provided by regulations and may be limited. Under the Regulated Investment Company Modernization Act of 2010 (the Act), the Fund is permitted to carry forward capital losses incurred in taxable years beginning after December 22, 2010 for an unlimited period and such capital losses are required to be used prior to any losses that expire. Capital loss carryforwards were as follows:
Fiscal year of expiration | |
2016 | $ (7,195,987) |
2017 | (66,780,238) |
2018 | (26,887,863) |
2019 | (98,806,037) |
Total with expiration | (199,670,125) |
No expiration | |
Short-term | (2,193,630) |
Long-term | (9,425,768) |
Total no expiration | (11,619,398) |
Total capital loss carryforward | $ (211,289,523) |
At October 31, 2011, the Fund reported a total capital loss carryforward amount of $523,526,201. As a result of large redemptions in December 2010, the Fund had an "ownership change" under the Internal Revenue Code, which limits capital losses that would be available to offset future gains to $18,885,324 per year, including adjustments for certain gains and losses in the Fund existing at the time of the ownership change. The impact of this ownership change to the total capital loss carryforward amount reported at October 31, 2011 was not properly reflected in the Fund's financial statements. As a result, an adjustment of $323,400,279 was made between Accumulated Undistributed Net Realized Loss and Paid In Capital in the current period to reflect the amount of losses that will expire unused resulting from the ownership change. This adjustment was not considered material to the financial statements of the Fund.
In addition, the Fund acquired $25,965,572 of capital loss carryforwards from the Fidelity Advisor Japan Fund when it merged with that fund on December 17, 2010. Under the Internal Revenue Code, the losses acquired from the Fidelity Advisor Japan Fund that will be available to offset future capital gains of the Fund will be limited. As a result, at least $17,152,282 of the losses acquired from Fidelity Advisor Japan Fund will expire unused.
The total capital loss carryforward amounts reported in the table above reflect the deduction of amounts relating to the ownership change and merger that are expected to expire unused.
The tax character of distributions paid was as follows:
| October 31, 2012 | October 31, 2011 |
Ordinary Income | $ 10,259,692 | $ 20,255,739 |
Short-Term Trading (Redemption) Fees. Shares purchased by investors and held in the Fund less than 90 days are subject to a redemption fee equal to 1.50% of the net asset value of shares redeemed. All redemption fees, which reduce the proceeds of the shareholder redemption, are retained by the Fund and accounted for as an addition to paid in capital.
New Accounting Pronouncement. In December 2011, the Financial Accounting Standards Board issued Accounting Standard Update No. 2011-11, Disclosures about Offsetting Assets and Liabilities. The update creates new disclosure requirements requiring entities to disclose both gross and net information for derivatives and other financial instruments that are either offset in the Statement of Assets and Liabilities or subject to an enforceable master netting arrangement or similar agreement. The disclosure requirements are effective for annual reporting periods beginning on or after January 1, 2013, and interim periods within those annual periods. Management is currently evaluating the impact of the update's adoption on the Fund's financial statement disclosures.
4. Purchases and Sales of Investments.
Purchases and sales of securities, other than short sales and short-term securities, aggregated $221,392,251 and $306,262,922, respectively.
Annual Report
Notes to Financial Statements - continued
5. Fees and Other Transactions with Affiliates.
Management Fee. FMR and its affiliates provide the Fund with investment management related services for which the Fund pays a monthly management fee. The management fee is the sum of an individual fund fee rate that is based on an annual rate of .45% of the Fund's average net assets and an annualized group fee rate that averaged .26% during the period. The group fee rate is based upon the average net assets of all the mutual funds advised by FMR. The group fee rate decreases as assets under management increase and increases as assets under management decrease. In addition, the management fee is subject to a performance adjustment (up to a maximum of ± .20% of the Fund's average net assets over a 36 month performance period). The upward or downward adjustment to the management fee is based on the relative investment performance of Japan as compared to an appropriate benchmark index. For the period, the total annual management fee rate, including the performance adjustment, was .77% of the Fund's average net assets.
Distribution and Service Plan Fees. In accordance with Rule 12b-1 of the 1940 Act, the Fund has adopted separate Distribution and Service Plans for each class of shares. Certain classes pay Fidelity Distributors Corporation (FDC), an affiliate of FMR, separate Distribution and Service Fees, each of which is based on an annual percentage of each class' average net assets. In addition, FDC may pay financial intermediaries for selling shares of the Fund and providing shareholder support services. For the period, the Distribution and Service Fee rates, total fees and amounts retained by FDC were as follows:
| Distribution
Fee | Service
Fee | Total Fees | Retained
by FDC |
Class A | -% | .25% | $ 29,171 | $ 772 |
Class T | .25% | .25% | 21,850 | 83 |
Class B | .75% | .25% | 12,679 | 9,525 |
Class C | .75% | .25% | 79,302 | 21,124 |
| | | $ 143,002 | $ 31,504 |
Sales Load. FDC may receive a front-end sales charge of up to 5.75% for selling Class A shares and 3.50% for selling Class T shares, some of which is paid to financial intermediaries for selling shares of the Fund. Depending on the holding period, FDC may receive contingent deferred sales charges levied on Class A, Class T, Class B, and Class C redemptions. The deferred sales charges range from 5.00% to 1.00% for Class B shares, 1.00% for Class C shares, 1.00% for certain purchases of Class A shares and .25% for certain purchases of Class T shares.
For the period, sales charge amounts retained by FDC were as follows:
| Retained
by FDC |
Class A | $ 2,962 |
Class T | 1,060 |
Class B* | 1,711 |
Class C* | 2,026 |
| $ 7,759 |
* When Class B and Class C shares are initially sold, FDC pays commissions from its own resources to financial intermediaries through which the sales are made.
Transfer Agent Fees. Fidelity Investments Institutional Operations Company, Inc. (FIIOC), an affiliate of FMR, is the transfer, dividend disbursing and shareholder servicing agent for each class of the Fund. FIIOC receives account fees and asset-based fees that vary according to the account size and type of account. FIIOC pays for typesetting, printing and mailing of shareholder reports, except proxy statements. For the period, transfer agent fees for each class were as follows:
| Amount | % of
Average
Net Assets |
Class A | $ 35,249 | .30 |
Class T | 14,791 | .34 |
Class B | 3,843 | .30 |
Class C | 22,142 | .28 |
Japan | 920,315 | .22 |
Institutional Class | 3,138 | .16 |
| $ 999,478 | |
Accounting and Security Lending Fees. Fidelity Service Company, Inc. (FSC), an affiliate of FMR, maintains the Fund's accounting records. The accounting fee is based on the level of average net assets for each month. Under a separate contract, FSC administers the security lending program. The security lending fee is based on the number and duration of lending transactions.
Annual Report
6. Committed Line of Credit.
The Fund participates with other funds managed by FMR or an affiliate in a $4.25 billion credit facility (the "line of credit") to be utilized for temporary or emergency purposes to fund shareholder redemptions or for other short-term liquidity purposes. The Fund has agreed to pay commitment fees on its pro-rata portion of the line of credit, which amounted to $1,244 and is reflected in Miscellaneous expenses on the Statement of Operations. During the period, there were no borrowings on this line of credit.
7. Security Lending.
The Fund lends portfolio securities through a lending agent from time to time in order to earn additional income. For equity securities, a lending agent is used and may loan securities to certain qualified borrowers, including Fidelity Capital Markets (FCM), a broker-dealer affiliated with the Fund. On the settlement date of the loan, the Fund receives collateral (in the form of U.S. Treasury obligations, letters of credit and/or cash) against the loaned securities and maintains collateral in an amount not less than 100% of the market value of the loaned securities during the period of the loan. The market value of the loaned securities is determined at the close of business of the Fund and any additional required collateral is delivered to the Fund on the next business day. If the borrower defaults on its obligation to return the securities loaned because of insolvency or other reasons, a fund could experience delays and costs in recovering the securities loaned or in gaining access to the collateral. Any cash collateral received is invested in Fidelity Securities Lending Cash Central Fund. The value of loaned securities and cash collateral at period end are disclosed on the Fund's Statement of Assets and Liabilities. Security lending income represents the income earned on investing cash collateral, less rebates paid to borrowers and any lending agent fees associated with the loan, plus any premium payments received for lending certain types of securities. Security lending income is presented in the Statement of Operations as a component of income from Fidelity Central Funds. Total security lending income during the period amounted to $57,669. During the period, there were no securities loaned to FCM.
8. Expense Reductions.
FMR voluntarily agreed to reimburse each class to the extent annual operating expenses exceeded certain levels of average net assets as noted in the table below. Some expenses, for example interest expense, including commitment fees, are excluded from this reimbursement.
The following classes were in reimbursement during the period:
| Expense
Limitations | Reimbursement
from adviser |
Class A | 1.45% | $ 4,359 |
Class T | 1.70% | 1,853 |
Class B | 2.20% | 481 |
Class C | 2.20% | 2,553 |
Japan | 1.20% | 97,123 |
Institutional Class | 1.20% | 460 |
| | $ 106,829 |
Effective January 1, 2012 the expense limitations were discontinued.
Many of the brokers with whom FMR places trades on behalf of the Fund provided services in addition to trade execution. These services included payments of certain expenses on behalf of the Fund totaling $87,577 for the period.
9. Distributions to Shareholders.
Distributions to shareholders of each class were as follows:
Years ended October 31, | 2012 | 2011 A, B |
From net investment income | | |
Class A | $ 168,535 | $ - |
Class T | 50,833 | - |
Class B | 6,144 | - |
Class C | 52,214 | - |
Japan | 7,354,386 | 9,544,936 |
Class F | - | 204,046 |
Institutional Class | 56,675 | - |
Total | $ 7,688,787 | $ 9,748,982 |
Annual Report
Notes to Financial Statements - continued
9. Distributions to Shareholders - continued
Years ended October 31, | 2012 | 2011 A, B |
From net realized gain | | |
Class A | $ 69,007 | $ - |
Class T | 24,703 | - |
Class B | 7,792 | - |
Class C | 46,858 | - |
Japan | 2,405,209 | 10,328,111 |
Class F | - | 178,646 |
Institutional Class | 17,336 | - |
Total | $ 2,570,905 | $ 10,506,757 |
A Distributions for Class A, Class T, Class B, Class C and Institutional Class are for the period December 14, 2010 (commencement of sale of shares) to October 31, 2011.
B All Class F shares were redeemed on December 15, 2010.
10. Share Transactions.
Transactions for each class of shares were as follows:
| Shares | Dollars |
Years ended October 31, | 2012 | 2011 A, B | 2012 | 2011 A, B |
Class A | | | | |
Shares sold | 272,417 | 902,250 | $ 2,571,605 | $ 9,266,531 |
Issued in exchange for shares of Fidelity Advisor Japan Fund | - | 1,458,691 | - | 15,812,213 |
Reinvestment of distributions | 22,132 | - | 206,271 | - |
Shares redeemed | (659,149) | (975,882) | (6,253,228) | (10,202,627) |
Net increase (decrease) | (364,600) | 1,385,059 | $ (3,475,352) | $ 14,876,117 |
Class T | | | | |
Shares sold | 61,409 | 132,383 | $ 587,072 | $ 1,384,063 |
Issued in exchange for shares of Fidelity Advisor Japan Fund | - | 487,882 | - | 5,288,638 |
Reinvestment of distributions | 7,853 | - | 73,111 | - |
Shares redeemed | (133,261) | (132,194) | (1,264,265) | (1,415,637) |
Net increase (decrease) | (63,999) | 488,071 | $ (604,082) | $ 5,257,064 |
Class B | | | | |
Shares sold | 6,716 | 15,198 | $ 66,720 | $ 161,868 |
Issued in exchange for shares of Fidelity Advisor Japan Fund | - | 224,548 | - | 2,434,105 |
Reinvestment of distributions | 1,058 | - | 9,881 | - |
Shares redeemed | (52,372) | (85,826) | (495,118) | (926,239) |
Net increase (decrease) | (44,598) | 153,920 | $ (418,517) | $ 1,669,734 |
Class C | | | | |
Shares sold | 108,642 | 711,218 | $ 1,051,805 | $ 7,424,606 |
Issued in exchange for shares of Fidelity Advisor Japan Fund | - | 857,308 | - | 9,293,223 |
Reinvestment of distributions | 7,654 | - | 71,333 | - |
Shares redeemed | (280,979) | (645,053) | (2,637,126) | (6,643,542) |
Net increase (decrease) | (164,683) | 923,473 | $ (1,513,988) | $ 10,074,287 |
Japan | | | | |
Shares sold | 2,737,496 | 16,755,813 | $ 26,290,775 | $ 180,371,996 |
Reinvestment of distributions | 1,014,920 | 1,718,167 | 9,459,053 | 18,229,748 |
Shares redeemed | (12,951,522) | (32,842,865) | (122,521,103) | (351,598,189) |
Net increase (decrease) | (9,199,106) | (14,368,885) | $ (86,771,275) | $ (152,996,445) |
Class F | | | | |
Shares sold | - | 346,757 | $ - | $ 3,766,116 |
Reinvestment of distributions | - | 36,103 | - | 382,692 |
Shares redeemed | - | (3,617,960) | - | (39,396,699) |
Net increase (decrease) | - | (3,235,100) | $ - | $ (35,247,891) |
Annual Report
10. Share Transactions - continued
| Shares | Dollars |
Years ended October 31, | 2012 | 2011 A, B | 2012 | 2011 A, B |
Institutional Class | | | | |
Shares sold | 238,239 | 324,072 | $ 2,250,127 | $ 3,355,850 |
Issued in exchange for shares of Fidelity Advisor Japan Fund | - | 420,228 | - | 4,555,276 |
Reinvestment of distributions | 6,735 | - | 62,700 | - |
Shares redeemed | (369,198) | (460,581) | (3,505,242) | (4,809,911) |
Net increase (decrease) | (124,224) | 283,719 | $ (1,192,415) | $ 3,101,215 |
A Share transactions for Class A, Class T, Class B, Class C and Institutional Class are for the period December 14, 2010 (commencement of sale of shares) to October 31, 2011.
B All Class F shares were redeemed on December 15, 2010.
11. Other.
The Fund's organizational documents provide former and current trustees and officers with a limited indemnification against liabilities arising in connection with the performance of their duties to the Fund. In the normal course of business, the Fund may also enter into contracts that provide general indemnifications. The Fund's maximum exposure under these arrangements is unknown as this would be dependent on future claims that may be made against the Fund. The risk of material loss from such claims is considered remote.
At the end of the period, Strategic Advisors International Fund was the owner of record of approximately 40% of the total outstanding shares of the Fund. Mutual funds managed by Strategic Advisors, Inc., an affiliate of FMR, were the owners of record, in the aggregate, of approximately 46% of the total outstanding shares of the Fund.
12. Merger Information.
On December 17, 2010, the Fund acquired all of the assets and assumed all of the liabilities of the Fidelity Advisor Japan Fund ("Target Fund") pursuant to an agreement and plan of reorganization approved by the Board of Trustees ("The Board") on July 14, 2010. The reorganization provides shareholders of the Target Fund access to a larger portfolio with the same investment objective and lower expenses. The acquisition was accomplished by an exchange of 1,458,691 Class A shares, 487,882 Class T shares, 224,548 Class B shares, 857,308 Class C shares, and 420,228 Institutional Class shares of the Fund, respectively, for 1,347,662 Class A shares, 458,320 Class T shares, 220,839 Class B shares, 837,651 Class C shares, and 377,690 Institutional Class shares then outstanding (valued at $11.73, $11.54, $11.02, $11.09 and $12.06 per share for Class A, Class T, Class B, Class C, and Institutional Class, respectively) of the Target Fund. The reorganization qualified as a tax-free reorganization for federal income tax purposes with no gain or loss recognized to the funds or their shareholders. The Target Fund's net assets, including securities of $37,429,891 unrealized depreciation of $(2,434,247), cash of $6,456 and net other liabilities of $(52,892), were combined with the Fund's net assets of $515,046,445 for total net assets after the acquisition of $552,429,900.
Pro forma results of operations of the combined entity for the entire period ended October 31, 2011, as though the acquisition had occurred as of the beginning of the year (rather than on the actual acquisition date), are as follows:
Net investment income (loss) | $ 7,426,258 |
Total net realized gain (loss) | (68,640,546) |
Total change in net unrealized appreciation (depreciation) | 34,276,793 |
Net increase (decrease) in net assets resulting from operations | $ (26,937,495) |
Because the combined investment portfolios have been managed as a single portfolio since the acquisition was completed, it is not practicable to separate the amounts of revenue and earnings of the acquired fund that have been included in the Fund's accompanying Statement of Operations since December 17, 2010.
Annual Report
Report of Independent Registered Public Accounting Firm
To the Trustees of Fidelity Investment Trust and the Shareholders of Fidelity Japan Fund:
In our opinion, the accompanying statement of assets and liabilities, including the schedule of investments, and the related statements of operations and of changes in net assets and the financial highlights present fairly, in all material respects, the financial position of Fidelity Japan Fund (a fund of Fidelity Investment Trust) at October 31, 2012, the results of its operations for the year then ended, the changes in its net assets for each of the two years in the period then ended and the financial highlights for each of the periods indicated, in conformity with accounting principles generally accepted in the United States of America. These financial statements and financial highlights (hereafter referred to as "financial statements") are the responsibility of the Fidelity Japan Fund's management. Our responsibility is to express an opinion on these financial statements based on our audits. We conducted our audits of these financial statements in accordance with the standards of the Public Company Accounting Oversight Board (United States). Those standards require that we plan and perform the audit to obtain reasonable assurance about whether the financial statements are free of material misstatement. An audit includes examining, on a test basis, evidence supporting the amounts and disclosures in the financial statements, assessing the accounting principles used and significant estimates made by management, and evaluating the overall financial statement presentation. We believe that our audits, which included confirmation of securities at October 31, 2012 by correspondence with the custodian and brokers, provide a reasonable basis for our opinion.
PricewaterhouseCoopers LLP
Boston, Massachusetts
December 18, 2012
Annual Report
The Trustees, Members of the Advisory Board, and executive officers of the trust and fund, as applicable, are listed below. The Board of Trustees governs the fund and is responsible for protecting the interests of shareholders. The Trustees are experienced executives who meet periodically throughout the year to oversee the fund's activities, review contractual arrangements with companies that provide services to the fund, oversee management of the risks associated with such activities and contractual arrangements, and review the fund's performance. Except for James C. Curvey, each of the Trustees oversees 236 funds advised by FMR or an affiliate. Mr. Curvey oversees 443 funds advised by FMR or an affiliate.
The Trustees hold office without limit in time except that (a) any Trustee may resign; (b) any Trustee may be removed by written instrument, signed by at least two-thirds of the number of Trustees prior to such removal; (c) any Trustee who requests to be retired or who has become incapacitated by illness or injury may be retired by written instrument signed by a majority of the other Trustees; and (d) any Trustee may be removed at any special meeting of shareholders by a two-thirds vote of the outstanding voting securities of the trust. Each Trustee who is not an interested person (as defined in the 1940 Act) (Independent Trustee), shall retire not later than the last day of the calendar year in which his or her 75th birthday occurs. The Independent Trustees may waive this mandatory retirement age policy with respect to individual Trustees. The executive officers and Advisory Board Members hold office without limit in time, except that any officer and Advisory Board Member may resign or may be removed by a vote of a majority of the Trustees at any regular meeting or any special meeting of the Trustees. Except as indicated, each individual has held the office shown or other offices in the same company for the past five years.
Experience, Skills, Attributes, and Qualifications of the Fund's Trustees. The Governance and Nominating Committee has adopted a statement of policy that describes the experience, qualifications, attributes, and skills that are necessary and desirable for potential Independent Trustee candidates (Statement of Policy). The Board believes that each Trustee satisfied at the time he or she was initially elected or appointed a Trustee, and continues to satisfy, the standards contemplated by the Statement of Policy. The Governance and Nominating Committee also engages professional search firms to help identify potential Independent Trustee candidates who have the experience, qualifications, attributes, and skills consistent with the Statement of Policy. From time to time, additional criteria based on the composition and skills of the current Independent Trustees, as well as experience or skills that may be appropriate in light of future changes to board composition, business conditions, and regulatory or other developments, have also been considered by the professional search firms and the Governance and Nominating Committee. In addition, the Board takes into account the Trustees' commitment and participation in Board and committee meetings, as well as their leadership of standing and ad hoc committees throughout their tenure.
In determining that a particular Trustee was and continues to be qualified to serve as a Trustee, the Board has considered a variety of criteria, none of which, in isolation, was controlling. The Board believes that, collectively, the Trustees have balanced and diverse experience, qualifications, attributes, and skills, which allow the Board to operate effectively in governing the fund and protecting the interests of shareholders. Information about the specific experience, skills, attributes, and qualifications of each Trustee, which in each case led to the Board's conclusion that the Trustee should serve (or continue to serve) as a trustee of the fund, is provided below.
Board Structure and Oversight Function. James C. Curvey is an interested person (as defined in the 1940 Act) and currently serves as Chairman. The Trustees have determined that an interested Chairman is appropriate and benefits shareholders because an interested Chairman has a personal and professional stake in the quality and continuity of services provided to the fund. Independent Trustees exercise their informed business judgment to appoint an individual of their choosing to serve as Chairman, regardless of whether the Trustee happens to be independent or a member of management. The Independent Trustees have determined that they can act independently and effectively without having an Independent Trustee serve as Chairman and that a key structural component for assuring that they are in a position to do so is for the Independent Trustees to constitute a substantial majority for the Board. The Independent Trustees also regularly meet in executive session. Ned C. Lautenbach serves as Chairman of the Independent Trustees and as such (i) acts as a liaison between the Independent Trustees and management with respect to matters important to the Independent Trustees and (ii) with management prepares agendas for Board meetings.
Fidelity funds are overseen by different Boards of Trustees. The fund's Board oversees Fidelity's equity and high income funds and another Board oversees Fidelity's investment-grade bond, money market, and asset allocation funds. The asset allocation funds may invest in Fidelity funds overseen by the fund's Board. The use of separate Boards, each with its own committee structure, allows the Trustees of each group of Fidelity funds to focus on the unique issues of the funds they oversee, including common research, investment, and operational issues. On occasion, the separate Boards establish joint committees to address issues of overlapping consequences for the Fidelity funds overseen by each Board.
The Trustees operate using a system of committees to facilitate the timely and efficient consideration of all matters of importance to the Trustees, the fund, and fund shareholders and to facilitate compliance with legal and regulatory requirements and oversight of the fund's activities and associated risks. The Board, acting through its committees, has charged FMR and its affiliates with (i) identifying events or circumstances the occurrence of which could have demonstrably adverse effects on the fund's business and/or reputation; (ii) implementing processes and controls to lessen the possibility that such events or circumstances occur or to mitigate the effects of such events or circumstances if they do occur; and (iii) creating and maintaining a system designed to evaluate continuously business and market conditions in order to facilitate the identification and implementation processes described in (i) and (ii) above. Because the day-to-day operations and activities of the fund are carried out by or through FMR, its affiliates and other service providers, the fund's exposure to risks is mitigated but not eliminated by the processes overseen by the Trustees. While each of the Board's committees has responsibility for overseeing different aspects of the fund's activities, oversight is exercised primarily through the Operations, Audit, and Compliance Committees. In addition, the Independent Trustees have worked with FMR to enhance the Board's oversight of investment and financial risks, legal and regulatory risks, technology risks, and operational risks, including the development of additional risk reporting to the Board. For example, a working group comprised of Independent Trustees and FMR has worked and continues to work to review the Fidelity funds' valuation-related activities, reporting and risk management. Appropriate personnel, including but not limited to the fund's Chief Compliance Officer (CCO), FMR's internal auditor, the independent accountants, the fund's Treasurer and portfolio management personnel, make periodic reports to the Board's committees, as appropriate, including an annual review of FMR's risk management program for the Fidelity funds. The responsibilities of each standing committee, including their oversight responsibilities, are described further under "Standing Committees of the Fund's Trustees."
Annual Report
Trustees and Officers - continued
The fund's Statement of Additional Information (SAI) includes more information about the Trustees. To request a free copy, call Fidelity at 1-877-208-0098.
Interested Trustees*:
Correspondence intended for each Trustee who is an interested person may be sent to Fidelity Investments, 82 Devonshire Street, Boston, Massachusetts 02109.
Name, Age; Principal Occupations and Other Relevant Experience+ |
James C. Curvey (77) |
| Year of Election or Appointment: 2007 Mr. Curvey is Trustee and Chairman of the Board of Trustees of certain Trusts. Mr. Curvey also serves as Trustee (2007-present) of other investment companies advised by FMR. Mr. Curvey is a Director of Fidelity Investments Money Management, Inc. (2009-present), Director of Fidelity Research & Analysis Co. (2009-present) and Director of FMR and FMR Co., Inc. (2007-present). Mr. Curvey is also Vice Chairman (2007-present) and Director of FMR LLC. In addition, Mr. Curvey serves as an Overseer for the Boston Symphony Orchestra and a member of the Trustees of Villanova University. Previously, Mr. Curvey was the Vice Chairman (2006-2007) and Director (2000-2007) of FMR Corp. |
Ronald P. O'Hanley (55) |
| Year of Election or Appointment: 2011 Mr. O'Hanley is Director of FMR Co., Inc. (2010-present), Director of Fidelity Investments Money Management, Inc. (2010-present), Director of Fidelity Research & Analysis Company (2010-present), President of Fidelity Asset Management and Corporate Services and a member of Fidelity's Executive Committee (2010-present). Previously, Mr. O'Hanley served as President and Chief Executive Officer of BNY Mellon Asset Management (2007-2010). Mr. O'Hanley also served as Vice Chairman of Bank New York Mellon Corp. and a member of that firm's Executive Committee. Prior to the 2007 merger of The Bank of New York and Mellon Financial Corporation, he was Vice Chairman of Mellon Financial Corporation and President and Chief Executive Officer of Mellon Asset Management. He joined Mellon in February 1997. Mr. O'Hanley currently serves as Chairman of the Boston Public Library Foundation Board of Directors and sits on the Board of Directors of Beth Israel Deaconess Medical Center, the Board of Trustees of the Marine Biological Laboratory and the Advisory Board of the Maxwell School of Citizenship and Public Administration at Syracuse University. Mr. O'Hanley also chairs the Council on Asset Management for the Financial Services Roundtable and is a member of the Board of Directors of Institutional Investor's U.S. Institute. |
* Trustees have been determined to be "Interested Trustees" by virtue of, among other things, their affiliation with the trust or various entities under common control with FMR.
+ The information above includes each Trustee's principal occupation during the last five years and other information relating to the experience, attributes, and skills relevant to each Trustee's qualifications to serve as a Trustee, which led to the conclusion that each Trustee should serve as a Trustee for the fund.
Independent Trustees:
Correspondence intended for each Independent Trustee (that is, the Trustees other than the Interested Trustees) may be sent to Fidelity Investments, P.O. Box 55235, Boston, Massachusetts 02205-5235.
Name, Age; Principal Occupations and Other Relevant Experience+ |
Dennis J. Dirks (64) |
| Year of Election or Appointment: 2005 Prior to his retirement in May 2003, Mr. Dirks was Chief Operating Officer and a member of the Board of The Depository Trust & Clearing Corporation (DTCC). He also served as President, Chief Operating Officer, and Board member of The Depository Trust Company (DTC) and President and Board member of the National Securities Clearing Corporation (NSCC). In addition, Mr. Dirks served as Chief Executive Officer and Board member of the Government Securities Clearing Corporation, Chief Executive Officer and Board member of the Mortgage-Backed Securities Clearing Corporation, as a Trustee and a member of the Finance Committee of Manhattan College (2005-2008), and as a Trustee and a member of the Finance Committee of AHRC of Nassau County (2006-2008). Mr. Dirks is a member of the Independent Directors Council (IDC) Governing Council (2010-present) and Board of Directors for The Brookville Center for Children's Services, Inc. (2009-present). |
Alan J. Lacy (59) |
| Year of Election or Appointment: 2008 Mr. Lacy serves as Senior Adviser (2007-present) of Oak Hill Capital Partners, L.P. (private equity). Mr. Lacy also served as Chief Executive Officer (2000-2005) and Vice Chairman (2005-2006) of Sears Holdings Corporation and Sears, Roebuck and Co. (retail). In addition, Mr. Lacy serves as a member of the Board of Directors of Dave & Buster's Entertainment, Inc. (restaurant and entertainment complexes, 2010-present), Earth Fare, Inc. (retail grocery, 2012-present), The Hillman Companies, Inc. (hardware wholesalers, 2010-present), and Bristol-Myers Squibb Company (global pharmaceuticals, 2008-present). Mr. Lacy is a member of the Board of Trustees of The National Parks Conservation Association (2006-present). Previously, Mr. Lacy served as Chairman of the Board of Trustees of the National Parks Conservation Association (2008-2011) and as a member of the Board of Directors for the Western Union Company (global money transfer, 2006-2011). |
Ned C. Lautenbach (68) |
| Year of Election or Appointment: 2000 Mr. Lautenbach is Chairman of the Independent Trustees of the Equity and High Income Funds (2006-present). Mr. Lautenbach currently serves as the Lead Director of the Eaton Corporation Board of Directors (diversified industrial, 1997-present). Mr. Lautenbach is Chairman of the Board of Directors of the Philharmonic Center for the Arts in Naples, Florida (2012-present) and a member of the Council on Foreign Relations (1994-present). Previously, Mr. Lautenbach was a Partner/Advisory Partner at Clayton, Dubilier & Rice, LLC (private equity investment, 1998-2010), as well as a Director of Sony Corporation (2006-2007). |
Joseph Mauriello (68) |
| Year of Election or Appointment: 2008 Prior to his retirement in January 2006, Mr. Mauriello served in numerous senior management positions including Deputy Chairman and Chief Operating Officer (2004-2005), and Vice Chairman of Financial Services (2002-2004) of KPMG LLP US (professional services, 1965-2005). Mr. Mauriello currently serves as a member of the Board of Directors of XL Group plc. (global insurance and re-insurance, 2006-present). Previously, Mr. Mauriello served as a Director of the Hamilton Funds of the Bank of New York (2006-2007) and of Arcadia Resources Inc. (health care services and products, 2007-2012). |
Robert W. Selander (62) |
| Year of Election or Appointment: 2011 Previously, Mr. Selander served as a Member of the Advisory Board of Fidelity's Equity and High Income Funds (2011), Executive Vice Chairman (2010), Chief Executive Officer (2009-2010), and President and Chief Executive Officer (1997-2009) of Mastercard, Inc. |
Cornelia M. Small (68) |
| Year of Election or Appointment: 2005 Ms. Small is a member of the Board of Directors (2009-present) and Chair of the Investment Committee (2010-present) of the Teagle Foundation. Ms. Small also serves on the Investment Committee of the Berkshire Taconic Community Foundation (2008-present). Previously, Ms. Small served as Chairperson (2002-2008) and a member of the Investment Committee and Chairperson (2008-2012) and a member of the Board of Trustees of Smith College. In addition, Ms. Small served as Chief Investment Officer, Director of Global Equity Investments, and a member of the Board of Directors of Scudder, Stevens & Clark and Scudder Kemper Investments. |
William S. Stavropoulos (73) |
| Year of Election or Appointment: 2001 Mr. Stavropoulos is Vice Chairman of the Independent Trustees of the Equity and High Income Funds (2006-present). Mr. Stavropoulos serves as President and Founder of the Michigan Baseball Foundation, the Great Lakes Loons (2007-present). Mr. Stavropoulos is Chairman Emeritus of the Board of Directors of The Dow Chemical Company, where he previously served in numerous senior management positions, including President, CEO (1995-2000; 2002-2004), Chairman of the Executive Committee (2000-2006), and as a member of the Board of Directors (1990-2006). Currently, Mr. Stavropoulos is a Director of Univar Inc. (global distributor of commodity and specialty chemicals, Chairman from 2010-May 2012 and Lead Director from May 2012-present), Teradata Corporation (data warehousing and technology solutions, 2008-present), Maersk Inc. (industrial conglomerate), and Tyco International, Ltd. (multinational manufacturing and services, 2007-present), and a member of the Advisory Board for Metalmark Capital LLC (private equity investment, 2005-present). Mr. Stavropoulos is an operating advisor to Clayton, Dubilier & Rice, LLC (private equity investment). In addition, Mr. Stavropoulos is a member of the University of Notre Dame Advisory Council for the College of Science, a Trustee of the Rollin L. Gerstacker Foundation, and a Director of the Naples Philharmonic Center for the Arts. Previously, Mr. Stavropoulos served as a Director of Chemical Financial Corporation (bank holding company, 1993-2012). |
David M. Thomas (63) |
| Year of Election or Appointment: 2008 Previously, Mr. Thomas served as Executive Chairman (2005-2006) and Chairman and Chief Executive Officer (2000-2005) of IMS Health, Inc. (pharmaceutical and healthcare information solutions), and a Director of Fortune Brands, Inc. (consumer products, 2000-2011). In addition, Mr. Thomas serves as Non-Executive Chairman of the Board of Directors of Fortune Brands Home and Security (home and security products, 2011-present), and as a member of the Board of Directors of Interpublic Group of Companies, Inc. (marketing communication, 2004-present). |
Michael E. Wiley (62) |
| Year of Election or Appointment: 2008 Mr. Wiley also serves as a Director of Asia Pacific Exploration Consolidated (international oil and gas exploration and production, 2008-present). Mr. Wiley serves as a Director of Tesoro Corporation (independent oil refiner and marketer, 2005-present), and a Director of Bill Barrett Corporation (exploration and production, 2005-present). In addition, Mr. Wiley also serves as a Director of Post Oak Bank (privately-held bank, 2004-present). Previously, Mr. Wiley served as a member of the Board of Trustees of the University of Tulsa (2000-2006; 2007-2010), as a Senior Energy Advisor of Katzenbach Partners, LLC (consulting, 2006-2007), as an Advisory Director of Riverstone Holdings (private investment), Chairman, President, and CEO of Baker Hughes, Inc. (oilfield services, 2000-2004), and as Director of Spinnaker Exploration Company (exploration and production, 2001-2005). |
+ The information above includes each Trustee's principal occupation during the last five years and other information relating to the experience, attributes, and skills relevant to each Trustee's qualifications to serve as a Trustee, which led to the conclusion that each Trustee should serve as a Trustee for the fund.
Advisory Board Members and Executive Officers:
Correspondence intended for David A. Rosow and Garnett A. Smith may be sent to Fidelity Investments, P.O. Box 55235, Boston, Massachusetts 02205-5235. Correspondence intended for each executive officer, Edward C. Johnson 3d, and Peter S. Lynch may be sent to Fidelity Investments, 82 Devonshire Street, Boston, Massachusetts 02109.
Name, Age; Principal Occupation |
Edward C. Johnson 3d (82) |
| Year of Election or Appointment: 2011 Member of the Advisory Board of Fidelity's Equity and High Income Funds. Mr. Johnson serves as Chief Executive Officer, Chairman, and a Director of FMR LLC, and also serves as Chairman and Director of FIL Limited. Previously, Mr. Johnson served as a Trustee and Chairman of the Board of certain Fidelity Trusts, Chairman and a Director of FMR, Chairman and a Director of FMR Co., Inc., and President of FMR LLC (2006-2007). |
Peter S. Lynch (68) |
| Year of Election or Appointment: 2003 Member of the Advisory Board of Fidelity's Equity and High Income Funds. Mr. Lynch is Vice Chairman and a Director of FMR and FMR Co., Inc. In addition, Mr. Lynch serves as a Trustee of Boston College and as the Chairman of the Inner-City Scholarship Fund. Previously, Mr. Lynch served on the Special Olympics International Board of Directors (1997-2006). |
David A. Rosow (70) |
| Year of Election or Appointment: 2012 Member of the Advisory Board of Fidelity's Equity and High Income Funds. Chairman and Chief Executive Officer of International Golf Group, Inc. (golf course development, 1989-present). Previously, Mr. Rosow served as Chairman and Chief Executive Officer of Rosow & Company, Inc. (private investment company, 1989-2011), a Lead Director of Hudson United Bancorp (2001-2006) and as a Director of TD Banknorth (1996-2006). In addition, Mr. Rosow is a member (2008-present) and President (2009-present) of the Town Council of Palm Beach, Florida. |
Garnett A. Smith (65) |
| Year of Election or Appointment: 2012 Member of the Advisory Board of Fidelity's Equity and High Income Funds. Prior to Mr. Smith's retirement, he served as Chairman and Chief Executive Officer of Inbrand Corp. (manufacturer of personal absorbent products, 1990-1997). He also served as President (1986-1990) of Inbrand Corp. Prior to his employment with Inbrand Corp., he was employed by a retail fabric chain and North Carolina National Bank. In addition, Mr. Smith is a board member of the Jackson Hole Land Trust (2009-present). |
Kenneth B. Robins (43) |
| Year of Election or Appointment: 2008 President and Treasurer of Fidelity's Equity and High Income Funds. Mr. Robins also serves as President and Treasurer (2010-present) and Assistant Treasurer (2009-present) of other Fidelity funds and is an employee of Fidelity Investments (2004-present). Previously, Mr. Robins served as Deputy Treasurer of the Fidelity funds (2005-2008) and Treasurer and Chief Financial Officer of The North Carolina Capital Management Trust: Cash and Term Portfolios (2006-2008). |
Bruce T. Herring (47) |
| Year of Election or Appointment: 2006 Vice President of certain Equity Funds. Mr. Herring also serves as President of Fidelity Research & Analysis Company (2010-present), Chief Investment Officer and Director of Fidelity Management & Research (U.K.) Inc. (2010-present) and Group Chief Investment Officer of FMR. Previously, Mr. Herring served as Vice President (2005-2006) and Senior Vice President (2006-2007) of Fidelity Management & Research Company, Vice President of FMR Co., Inc. (2001-2007) and as a portfolio manager for Fidelity U.S. Equity Funds. |
Brian B. Hogan (48) |
| Year of Election or Appointment: 2009 Vice President of Equity and High Income Funds. Mr. Hogan also serves as President of FMR's Equity Division (2009-present). Previously, Mr. Hogan served as Senior Vice President, Equity Research of FMR (2006-2009) and as a portfolio manager. |
Scott C. Goebel (44) |
| Year of Election or Appointment: 2008 Secretary and Chief Legal Officer (CLO) of the Fidelity funds. Mr. Goebel also serves as Secretary of Fidelity Investments Money Management, Inc. (FIMM) (2010-present) and Fidelity Research and Analysis Company (FRAC) (2010-present); Secretary and CLO of The North Carolina Capital Management Trust: Cash and Term Portfolios (2008-present); General Counsel, Secretary, and Senior Vice President of FMR (2008-present) and FMR Co., Inc. (2008-present); employed by FMR LLC or an affiliate (2001-present); Chief Legal Officer of Fidelity Management & Research (Hong Kong) Limited (2008-present) and Assistant Secretary of Fidelity Management & Research (Japan) Inc. (2008-present), and Fidelity Management & Research (U.K.) Inc. (2008-present). Previously, Mr. Goebel served as Assistant Secretary of FIMM (2008-2010), FRAC (2008-2010), and the Funds (2007-2008) and as Vice President and Secretary of Fidelity Distributors Corporation (FDC) (2005-2007). |
William C. Coffey (43) |
| Year of Election or Appointment: 2009 Assistant Secretary of Fidelity's Equity and High Income Funds. Mr. Coffey also serves as Senior Vice President and Deputy General Counsel of FMR LLC (2010-present), and is an employee of Fidelity Investments. Previously, Mr. Coffey served as Vice President and Associate General Counsel of FMR LLC (2005-2009). |
Elizabeth Paige Baumann (44) |
| Year of Election or Appointment: 2012 Anti-Money Laundering (AML) Officer of the Fidelity funds. Ms. Baumann also serves as AML Officer of The North Carolina Capital Management Trust: Cash and Term Portfolios (2012-present), Chief AML Officer of FMR LLC (2012-present), and is an employee of Fidelity Investments. Previously, Ms. Baumann served as Vice President and Deputy Anti-Money Laundering Officer (2007-2012). |
Christine Reynolds (54) |
| Year of Election or Appointment: 2008 Chief Financial Officer of the Fidelity funds. Ms. Reynolds became President of Fidelity Pricing and Cash Management Services (FPCMS) in August 2008. Ms. Reynolds served as Chief Operating Officer of FPCMS (2007-2008). Previously, Ms. Reynolds served as President, Treasurer, and Anti-Money Laundering officer of the Fidelity funds (2004-2007). |
Joseph A. Hanlon (44) |
| Year of Election or Appointment: 2012 Chief Compliance Officer of Fidelity's Equity and High Income Funds. Mr. Hanlon serves as Compliance Officer of FMR, FMR Co., Inc., Fidelity Investments Money Management, Inc. (FIMM), Fidelity Research and Analysis Company (FRAC), Fidelity Management & Research (Japan) Inc., Fidelity Management & Research (U.K.) Inc., Fidelity Management & Research (Hong Kong), and Strategic Advisers, Inc. (2009-present), as Senior Vice President of the Fidelity Asset Management Division (2009-present), and is an employee of Fidelity Investments. |
Joseph F. Zambello (55) |
| Year of Election or Appointment: 2011 Deputy Treasurer of the Fidelity funds. Mr. Zambello is an employee of Fidelity Investments. Previously, Mr. Zambello served as Vice President of FMR's Program Management Group (2009-2011) and Vice President of the Transfer Agent Oversight Group (2005-2009). |
Adrien E. Deberghes (45) |
| Year of Election or Appointment: 2008 Deputy Treasurer of Fidelity's Equity and High Income Funds. Mr. Deberghes also serves as Vice President (2011-present) and Assistant Treasurer (2010-present) of other Fidelity funds, and is an employee of Fidelity Investments (2008-present). Previously, Mr. Deberghes served as Senior Vice President of Mutual Fund Administration at State Street Corporation (2007-2008), Senior Director of Mutual Fund Administration at Investors Bank & Trust (2005-2007), and Director of Finance for Dunkin' Brands (2000-2005). |
Stephen Sadoski (41) |
| Year of Election or Appointment: 2012 Deputy Treasurer of Fidelity's Equity and High Income Funds. Mr. Sadoski also serves as Assistant Treasurer of other Fidelity funds (2012-present) and is an employee of Fidelity Investments (2012-present). Previously, Mr. Sadoski served as an assistant chief accountant in the Division of Investment Management of the Securities and Exchange Commission (SEC) (2009-2012) and as a senior manager at Deloitte & Touche (1997-2009). |
Stephanie J. Dorsey (43) |
| Year of Election or Appointment: 2010 Assistant Treasurer of Fidelity's Equity and High Income Funds. Ms. Dorsey also serves as Deputy Treasurer of other Fidelity funds (2008-present) and is an employee of Fidelity Investments (2008-present). Previously, Ms. Dorsey served as Treasurer (2004-2008) of the JPMorgan Mutual Funds and Vice President (2004-2008) of JPMorgan Chase Bank. |
John R. Hebble (54) |
| Year of Election or Appointment: 2009 Assistant Treasurer of Fidelity's Equity and High Income Funds. Mr. Hebble also serves as President (2011-present), Treasurer, and Chief Financial Officer of The North Carolina Capital Management Trust: Cash and Term Portfolios (2008-present), President and Treasurer of other Fidelity funds (2008-present) and is an employee of Fidelity Investments. |
Gary W. Ryan (54) |
| Year of Election or Appointment: 2005 Assistant Treasurer of the Fidelity funds. Mr. Ryan is an employee of Fidelity Investments. Previously, Mr. Ryan served as Vice President of Fund Reporting in Fidelity Pricing and Cash Management Services (FPCMS) (1999-2005). |
Jonathan Davis (44) |
| Year of Election or Appointment: 2010 Assistant Treasurer of the Fidelity funds. Mr. Davis is also Assistant Treasurer of Fidelity Rutland Square Trust II and Fidelity Commonwealth Trust II. Mr. Davis is an employee of Fidelity Investments. Previously, Mr. Davis served as Vice President and Associate General Counsel of FMR LLC (2003-2010). |
Annual Report
The Board of Trustees of Fidelity Japan Fund voted to pay to shareholders of record at the opening of business on record date, the following distributions per share derived from capital gains realized from sales of portfolio securities, and dividends derived from net investment income:
| Pay Date | Record Date | Dividends | Capital Gains |
Class A | 12/10/12 | 12/07/12 | $0.106 | $0.079 |
Class T | 12/10/12 | 12/07/12 | $0.078 | $0.079 |
Class B | 12/10/12 | 12/07/12 | $0.000 | $0.068 |
Class C | 12/10/12 | 12/07/12 | $0.012 | $0.079 |
Class A, Class T, Class B, and Class C designates 100% of the dividends distributed during the fiscal year as amounts which may be taken into account as a dividend for purposes of the maximum rate under section 1(h)(11) of the Internal Revenue Code.
The amounts per share which represent income derived from sources within, and taxes paid to, foreign countries or possessions of the United States are as follows:
| Pay Date | Income | Taxes |
Class A | 12/12/2011 | $0.098 | $0.0181 |
Class T | 12/12/2011 | $0.088 | $0.0181 |
Class B | 12/12/2011 | $0.055 | $0.0181 |
Class C | 12/12/2011 | $0.063 | $0.0181 |
The fund will notify shareholders in January 2013 of amounts for use in preparing 2012 income tax returns.
Annual Report
Board Approval of Investment Advisory Contracts and Management Fees
Fidelity Japan Fund
Each year, the Board of Trustees, including the Independent Trustees (together, the Board), votes on the renewal of the management contract and sub-advisory agreements (together, the Advisory Contracts) for the fund. The Board, assisted by the advice of fund counsel and Independent Trustees' counsel, requests and considers a broad range of information relevant to the renewal of the Advisory Contracts throughout the year.
The Board meets regularly and, at each of its meetings, considers factors that are relevant to its annual consideration of the renewal of the fund's Advisory Contracts, including the services and support provided to the fund and its shareholders. The Board has established various standing committees, each composed of and chaired by Independent Trustees with varying backgrounds, to which the Board has assigned specific subject matter responsibilities in order to enhance effective decision-making by the Board. The Board, acting directly and through its Committees, requests and receives information concerning the annual consideration of the renewal of the fund's Advisory Contracts. The Board also meets as needed to consider matters specifically related to the Board's annual consideration of the renewal of Advisory Contracts. Members of the Board may also meet with trustees of other Fidelity funds through ad hoc joint committees to discuss certain matters relevant to the Fidelity funds.
At its July 2012 meeting, the Board of Trustees, including the Independent Trustees, unanimously determined to renew the fund's Advisory Contracts. In reaching its determination, the Board considered all factors it believed relevant, including (i) the nature, extent, and quality of the services to be provided to the fund and its shareholders (including the investment performance of the fund); (ii) the competitiveness of the fund's management fee and total expense ratio relative to peer funds; (iii) the total costs of the services to be provided by and the profits to be realized by Fidelity from its relationship with the fund; (iv) the extent to which economies of scale exist and would be realized as the fund grows; and (v) whether fee levels reflect these economies of scale, if any, for the benefit of fund shareholders.
In considering whether to renew the Advisory Contracts for the fund, the Board reached a determination, with the assistance of fund counsel and Independent Trustees' counsel and through the exercise of its business judgment, that the renewal of the Advisory Contracts is in the best interests of the fund and its shareholders and that the compensation payable under the Advisory Contracts is fair and reasonable. The Board's decision to renew the Advisory Contracts was not based on any single factor, but rather was based on a comprehensive consideration of all the information provided to the Board at its meetings throughout the year. The Board, in reaching its determination to renew the Advisory Contracts, is aware that shareholders in the fund have a broad range of investment choices available to them, including a wide choice among mutual funds offered by Fidelity's competitors, and that the fund's shareholders, who have the opportunity to review and weigh the disclosure provided by the fund in its prospectus and other public disclosures, have chosen to invest in this fund, managed by Fidelity.
Nature, Extent, and Quality of Services Provided. The Board considered the staffing within the investment adviser, FMR, and the sub-advisers (together, the Investment Advisers), including the backgrounds of the fund's investment personnel, and also considered the fund's investment objective, strategies, and related investment philosophy. The Independent Trustees also had discussions with senior management of Fidelity's investment operations and investment groups. The Board considered the structure of the portfolio manager compensation program and whether this structure provides appropriate incentives to act in the best interests of the fund.
Resources Dedicated to Investment Management and Support Services. The Board and the Fund Oversight and Research Committees reviewed the general qualifications and capabilities of the Investment Advisers' investment staff, including its size, education, experience, and resources, as well as the Investment Advisers' approach to recruiting, training, managing, and compensating investment personnel. The Board also noted that FMR has continued to increase the resources devoted to non-U.S. offices, including expansion of Fidelity's global investment organization. The Board noted that Fidelity's analysts have extensive resources, tools and capabilities that allow them to conduct sophisticated quantitative and fundamental analysis, as well as credit analysis of issuers, counterparties and guarantors. The Board also believes that Fidelity's investment professionals have sufficient access to global information and data so as to provide competitive investment results over time, and that those professionals also have access to sophisticated tools that permit them to assess portfolio construction and risk and performance attribution characteristics continuously, as well as to transmit new information and research conclusions rapidly around the world. Additionally, in its deliberations, the Board considered the Investment Advisers' trading and risk management capabilities and resources, which are an integral part of the investment management process.
Shareholder and Administrative Services. The Board considered (i) the nature, extent, quality, and cost of advisory, administrative, and shareholder services performed by the Investment Advisers and their affiliates under the Advisory Contracts and under separate agreements covering transfer agency, pricing and bookkeeping, and securities lending services for the fund; (ii) the nature and extent of the supervision of third party service providers, principally custodians and subcustodians; and (iii) the resources devoted to, and the record of compliance with, the fund's compliance policies and procedures. The Board also reviewed the allocation of fund brokerage, including allocations to brokers affiliated with the Investment Advisers, the use of brokerage commissions to pay fund expenses, and the use of "soft" commission dollars to pay for research services.
The Board noted that the growth of fund assets over time across the complex allows Fidelity to reinvest in the development of services designed to enhance the value or convenience of the Fidelity funds as investment vehicles. These services include 24-hour access to account information and market information through telephone representatives and over the Internet, investor education materials and asset allocation tools, and the expanded availability of Fidelity Investor Centers.
Annual Report
Investment in a Large Fund Family. The Board considered the benefits to shareholders of investing in a Fidelity fund, including the benefits of investing in a fund that is part of a large family of funds offering a variety of investment disciplines and providing a large variety of mutual fund investor services. The Board noted that Fidelity had taken, or had made recommendations that resulted in the Fidelity funds taking, a number of actions over the previous year that benefited particular funds, including (i) continuing to dedicate additional resources to investment research and support of the senior management team that oversees asset management; (ii) persisting in efforts to enhance Fidelity's research capabilities, in particular, international research; (iii) launching new funds and making other enhancements to meet client needs for global and income-oriented solutions; (iv) continuing to launch dedicated lower cost underlying funds to meet investment management's portfolio construction needs related to expanding underlying fund options, specifically for the Freedom Fund product lines; (v) adopting a "Stock Selector" sector neutral investment approach and employing a team of portfolio managers who are sector specialists to manage certain funds; (vi) rationalizing product lines and gaining increased efficiencies through the mergers of several funds into other funds; (vii) strengthening the Spartan Index Fund product line by adding new funds and/or new low-cost institutional share classes, restructuring fund expenses to accommodate new classes, and reducing investment minimums for certain classes of shares; (viii) modifying the eligibility criteria for Institutional Class shares to increase their appeal to government entities and charitable investors; and (ix) reducing certain transfer agent fee rates.
Investment Performance. The Board considered whether the fund has operated in accordance with its investment objective, as well as its record of compliance with its investment restrictions. It also reviewed the fund's absolute investment performance for each class, as well as the fund's relative investment performance for each class measured over multiple periods against (i) a broad-based securities market index, and (ii) a peer group of mutual funds deemed appropriate by Fidelity and reviewed by the Board. The following charts considered by the Board show, over the one-, three-, and five-year periods ended December 31, 2011, as available, the cumulative total returns of the retail class and Class C of the fund, the cumulative total returns of a broad-based securities market index ("benchmark"), and a range of cumulative total returns of a peer group of mutual funds identified by Lipper, Inc. as having an investment objective similar to that of the fund. The returns of the retail class and Class C show the performance of the highest performing class (based on five-year performance) and the lowest performing class (based on one-year performance), respectively. The box within each chart shows the 25th percentile return (top of box) and the 75th percentile return (bottom of box) of the peer group. Returns shown above the box are in the first quartile and returns shown below the box are in the fourth quartile. The percentage beaten numbers noted below each chart correspond to the percentile box and represent the percentage of funds in the peer group whose performance was equal to or lower than that of the fund or class indicated.
Fidelity Japan Fund
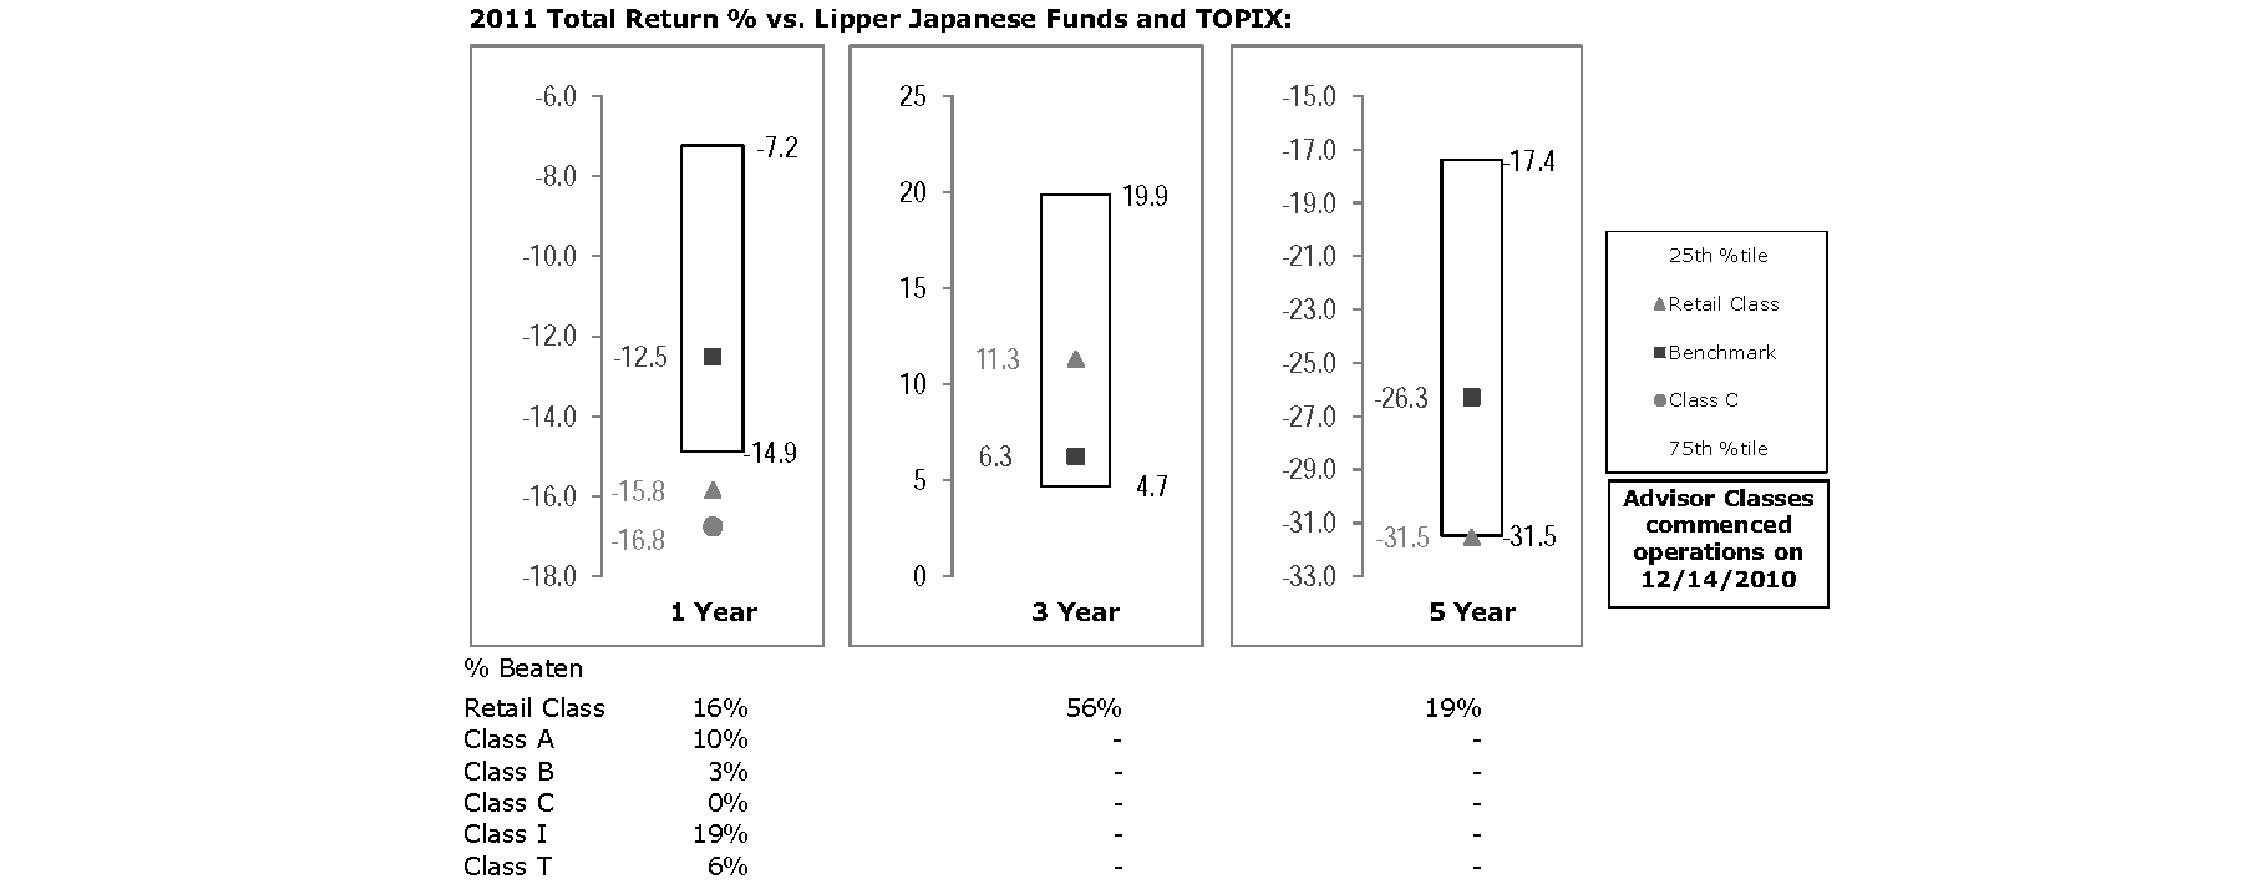
The Board reviewed the fund's relative investment performance against its peer group and noted that the performance of the retail class of the fund was in the fourth quartile for the one- and five-year periods and the second quartile for the three-year period. The Board also noted that the investment performance of the fund was lower than its benchmark for the one- and five-year periods, although the three-year cumulative total return of the retail class compared favorably to its benchmark. The Board considered that the variations in performance among the fund's classes reflect the variations in class expenses, which result in lower performance for higher expense classes. The Board also reviewed the fund's performance since inception as well as performance in the current year. The Board will closely monitor the performance of the fund in the coming year.
The Board also considered that the fund's management fee is subject to upward or downward adjustment depending upon whether, and to what extent, the fund's investment performance for the performance period exceeds, or is exceeded by, the record (over the same period) of a Board-approved performance adjustment index. The Board noted that the performance adjustment provides FMR with a strong economic incentive to seek to achieve superior performance for the fund's shareholders and helps to more closely align the interests of FMR and the fund's shareholders.
Annual Report
Board Approval of Investment Advisory Contracts and Management Fees - continued
Based on its review, the Board concluded that the nature, extent, and quality of services provided to the fund under the Advisory Contracts should benefit the fund's shareholders.
Competitiveness of Management Fee and Total Expense Ratio. The Board considered the fund's management fee and total expense ratio compared to "mapped groups" of competitive funds and classes. Fidelity creates "mapped groups" by combining similar Lipper investment objective categories that have comparable management fee characteristics. Combining Lipper investment objective categories aids the Board's management fee and total expense ratio comparisons by broadening the competitive group used for comparison and by reducing the number of universes to which various Fidelity funds are compared.
Management Fee. The Board considered two proprietary management fee comparisons for the 12-month periods shown in the chart below. The group of Lipper funds used by the Board for management fee comparisons is referred to below as the "Total Mapped Group." The Total Mapped Group is broader than the Lipper peer group used by the Board for performance comparisons because the Total Mapped Group combines several Lipper investment objective categories while the Lipper peer group does not. The Total Mapped Group comparison focuses on a fund's standing relative to the total universe of comparable funds available to investors in terms of gross management fees before expense reimbursements or caps, and without giving effect to the fund's performance adjustment. "TMG %" represents the percentage of funds in the Total Mapped Group that had management fees that were lower than the fund's. For example, a TMG % of 17% means that 83% of the funds in the Total Mapped Group had higher management fees than the fund. The "Asset-Size Peer Group" (ASPG) comparison focuses on a fund's standing relative to non-Fidelity funds similar in size to the fund within the Total Mapped Group. The ASPG represents at least 15% of the funds in the Total Mapped Group with comparable asset size and management fee characteristics, subject to a minimum of 50 funds (or all funds in the Total Mapped Group if fewer than 50). Additional information, such as the ASPG quartile in which the fund's management fee ranked and the impact of the fund's performance adjustment, is also included in the chart and considered by the Board.
Fidelity Japan Fund
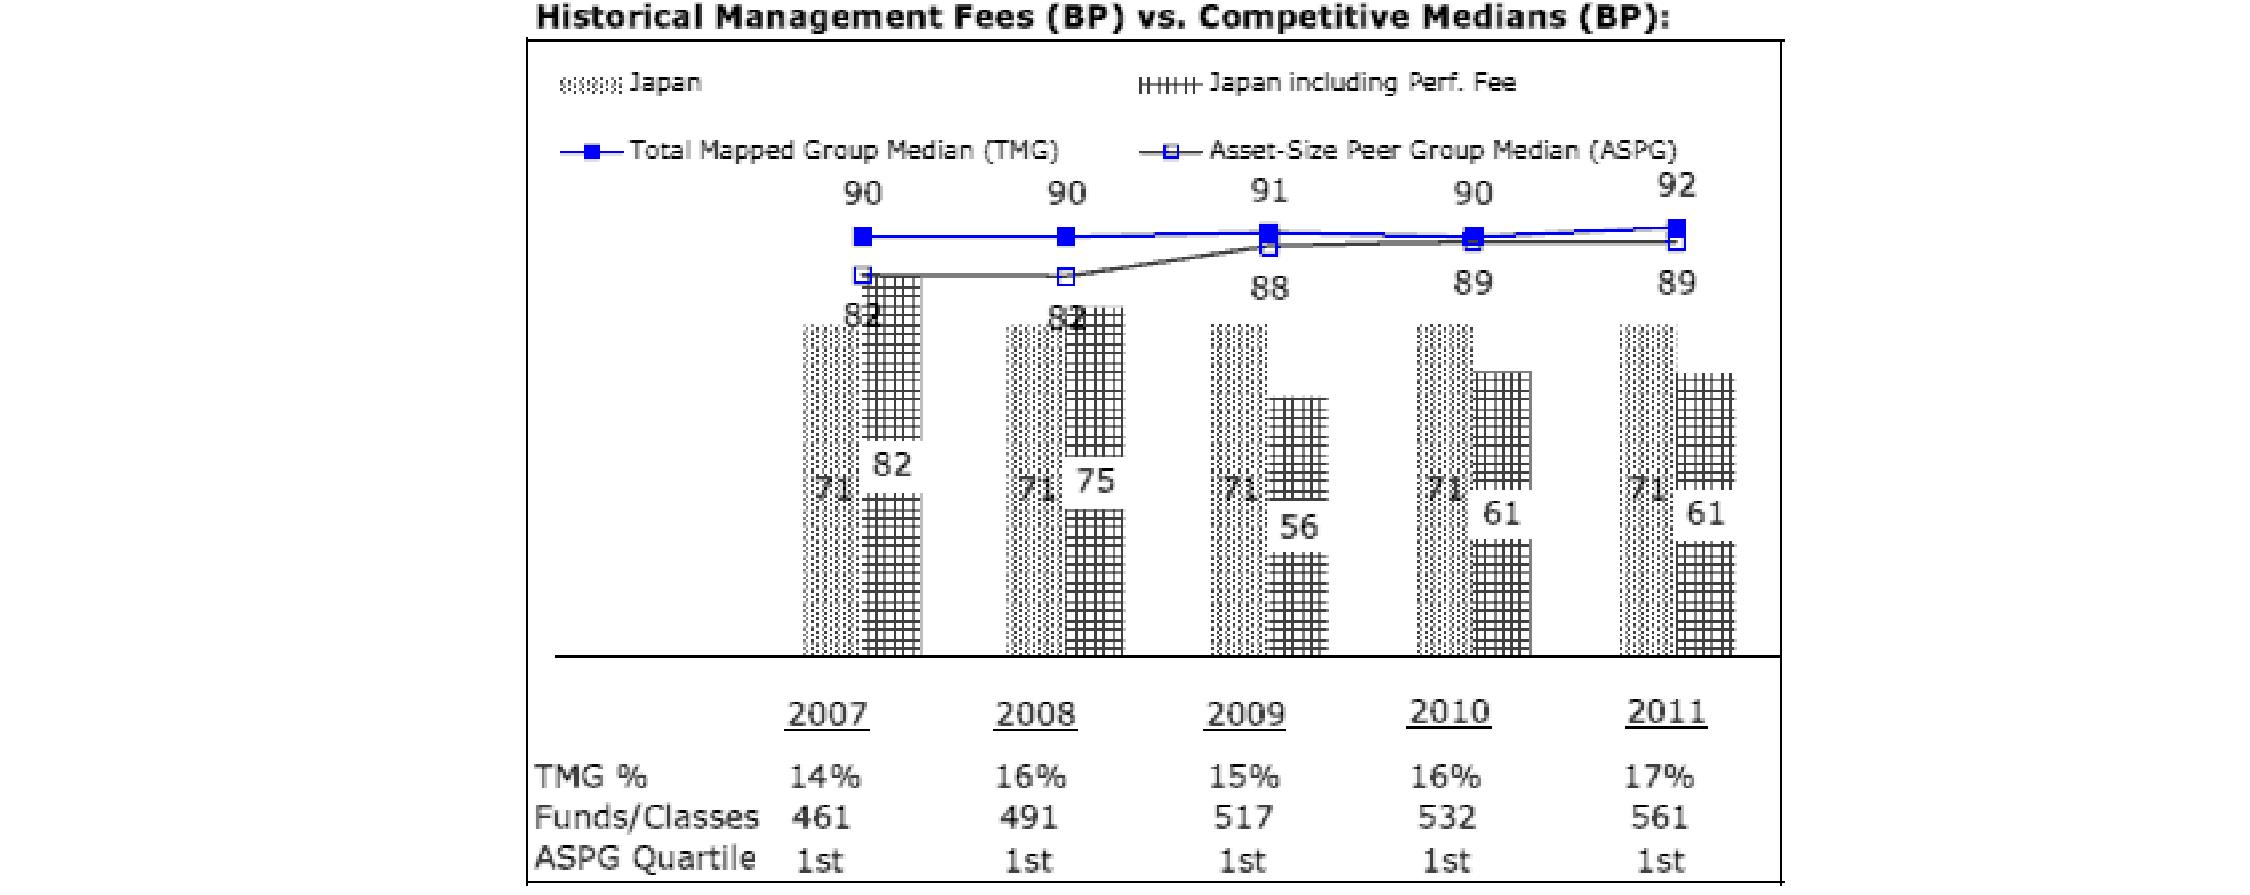
The Board noted that the fund's management fee ranked below the median of its Total Mapped Group and below the median of its ASPG for 2011. The Board also noted the effect of the fund's negative performance adjustment on the fund's management fee ranking. The Board noted that the performance adjustment for each year represents calculations for performance periods that differ from the periods shown in the performance charts above.
Based on its review, the Board concluded that the fund's management fee is fair and reasonable in light of the services that the fund receives and the other factors considered.
Total Expense Ratio. In its review of each class's total expense ratio, the Board considered the fund's management fee as well as other fund or class expenses, as applicable, such as transfer agent fees, pricing and bookkeeping fees, fund-paid 12b-1 fees, and custodial, legal, and audit fees. The Board also noted the effects of any waivers and reimbursements on fees and expenses, as well as the impact of the fund's performance adjustment. As part of its review, the Board also considered the current and historical total expense ratios of each class of the fund compared to competitive fund median expenses. Each class of the fund is compared to those funds and classes in the Total Mapped Group (used by the Board for management fee comparisons) that have a similar sales load structure.
Annual Report
The Board noted that the total expense ratio of each of Class A, Class B, Class C, Institutional Class, and the retail class ranked below its competitive median for 2011 and the total expense ratio of Class T ranked above its competitive median for 2011. The Board considered that various factors, including 12b-1 fees, positive or negative performance adjustments, and relatively higher other expenses in the case of small fund size, can affect total expense ratios. The Board noted that the total expense ratio of Class T was above the competitive median primarily because of higher 12b-1 fees on Class T. Class T has a higher 12b-1 fee, but a lower front-end sales charge, than traditionally priced front-end sales charge classes. The Board considered that Class T is primarily sold load-waived in the retirement plan market where its 0.50% 12b-1 fee is comparable to competing no-load, higher 12b-1 fee classes designed specifically for retirement plans. The Board noted that the fund offers multiple classes, each of which has a different sales load and 12b-1 fee structure, and that the multiple structures are intended to offer a range of pricing options for the intermediary market. The Board also noted that the total expense ratios of the classes vary primarily by the level of their 12b-1 fees, although differences in transfer agent fees may also cause expenses to vary from class to class.
Fees Charged to Other Fidelity Clients. The Board also considered Fidelity fee structures and other information with respect to clients of FMR and its affiliates, such as other mutual funds advised or subadvised by FMR or its affiliates, pension plan clients, and other institutional clients. The Board noted the findings of the 2010 ad hoc joint committee (created with the board of other Fidelity funds), which reviewed and compared Fidelity's institutional investment advisory business with its business of providing services to the Fidelity funds, including the differences in services provided, fees charged, and costs incurred, as well as competition in their respective marketplaces.
Based on its review of total expense ratios and fees charged to other Fidelity clients, the Board concluded that the total expense ratio of each class of the fund was reasonable, although Class T was above the median of the universe presented for comparison, in light of the services that the fund and its shareholders receive and the other factors considered.
Costs of the Services and Profitability. The Board considered the revenues earned and the expenses incurred by Fidelity in conducting the business of developing, marketing, distributing, managing, administering and servicing the fund and its shareholders. The Board also considered the level of Fidelity's profits in respect of all the Fidelity funds.
On an annual basis, FMR presents to the Board Fidelity's profitability for the fund. Fidelity calculates the profitability for each fund, as well as aggregate profitability for groups of Fidelity funds and all Fidelity funds, using a series of detailed revenue and cost allocation methodologies which originate with the books and records of Fidelity on which Fidelity's audited financial statements are based. The Audit Committee of the Board reviews any significant changes from the prior year's methodologies.
PricewaterhouseCoopers LLP (PwC), independent registered public accounting firm and auditor to Fidelity and certain Fidelity funds, has been engaged annually by the Board as part of the Board's assessment of Fidelity's profitability analysis. PwC's engagement includes the review and assessment of Fidelity's methodologies used in determining the revenues and expenses attributable to Fidelity's mutual fund business, and completion of agreed-upon procedures surrounding the mathematical accuracy of fund profitability and its conformity to allocation methodologies. After considering PwC's reports issued under the engagement and information provided by Fidelity, the Board concluded that while other allocation methods may also be reasonable, Fidelity's profitability methodologies are reasonable in all material respects.
The Board also reviewed Fidelity's non-fund businesses and fall-out benefits related to the mutual fund business as well as cases where Fidelity's affiliates may benefit from or be related to the fund's business.
The Board considered the costs of the services provided by and the profits realized by Fidelity in connection with the operation of the fund and was satisfied that the profitability was not excessive in the circumstances.
Economies of Scale. The Board considered whether there have been economies of scale in respect of the management of the Fidelity funds, whether the Fidelity funds (including the fund) have appropriately benefited from any such economies of scale, and whether there is potential for realization of any further economies of scale. The Board considered the extent to which the fund will benefit from economies of scale through increased services to the fund, through waivers or reimbursements, or through fee or expense reductions. The Board also noted that in 2009, it and the board of other Fidelity funds created an ad hoc committee (the Economies of Scale Committee) to analyze whether FMR attains economies of scale in respect of the management and servicing of the Fidelity funds, whether the Fidelity funds have appropriately benefited from such economies of scale, and whether there is potential for realization of any further economies of scale.
The Board recognized that the fund's management contract incorporates a "group fee" structure, which provides for lower group fee rates as total fund assets under FMR's management increase, and for higher group fee rates as total fund assets under FMR's management decrease. FMR calculates the group fee rates based on a tiered asset "breakpoint" schedule that varies based on asset class. The Board considered that the group fee is designed to deliver the benefits of economies of scale to fund shareholders when total Fidelity fund assets increase, even if assets of any particular fund are unchanged or have declined, because some portion of Fidelity's costs are attributable to services provided to all Fidelity funds, and all funds benefit if those costs can be allocated among more assets. The Board concluded that, given the group fee structure, fund shareholders will benefit from lower management fees as assets under FMR's management increase at the fund complex level, regardless of whether Fidelity achieves any such economies of scale.
Annual Report
Board Approval of Investment Advisory Contracts and Management Fees - continued
The Board concluded, taking into account the analysis of the Economies of Scale Committee, that economies of scale, if any, are being appropriately shared between fund shareholders and Fidelity.
Additional Information Requested by the Board. In order to develop fully the factual basis for consideration of the Fidelity funds' Advisory Contracts, the Board requested and received additional information on certain topics, including (i) fund performance trends, actions to be taken by FMR to improve certain funds' overall performance, and Fidelity's long-term strategies for certain funds; (ii) the potential to further rationalize the Fidelity fund lineup with the possibility of achieving savings for the funds and Fidelity; (iii) Fidelity's compensation structure for portfolio managers and other key investment personnel; (iv) the amount of the investment that each portfolio manager has made in the Fidelity fund(s) that he or she manages; (v) the realization of fall-out benefits in certain Fidelity business units; (vi) Fidelity's group fee structures, the potential impact of regulatory changes on such structures, and the rationale for the individual fee rates of certain funds; (vii) fund profitability methodology, including Fidelity's cost allocation methodology, and the impact of certain factors on fund profitability results; (viii) trends regarding industry use of performance fee structures and the possibility of implementing performance fee structures for additional funds; and (ix) the impact of net redemptions from the Fidelity funds.
Based on its evaluation of all of the conclusions noted above, and after considering all factors it believed relevant, the Board ultimately concluded that the advisory fee structures are fair and reasonable, and that the fund's Advisory Contracts should be renewed.
Annual Report
Investment Adviser
Fidelity Management & Research Company
Boston, MA
Investment Sub-Advisers
FMR Co., Inc.
Fidelity Management & Research
(U.K.) Inc.
Fidelity Management & Research
(Hong Kong) Limited
Fidelity Management & Research
(Japan) Inc.
FIL Investment Advisors
FIL Investments (Japan) Limited
FIL Investment Advisors (UK) Limited
General Distributor
Fidelity Distributors Corporation
Smithfield, RI
Transfer and Service Agents
Fidelity Investments Institutional Operations Company, Inc.
Boston, MA
Fidelity Service Company, Inc.
Boston, MA
Custodian
JPMorgan Chase Bank
New York, NY
(Fidelity Investment logo)(registered trademark)
Corporate Headquarters
82 Devonshire St., Boston, MA 02109
www.fidelity.com
AJPNA-UANN-1212
1.917388.101
Fidelity Advisor®
Japan
Fund - Institutional Class
Annual Report
October 31, 2012
(Fidelity Cover Art)
Institutional Class is a class of
Fidelity® Japan Fund
Contents
Performance | (Click Here) | How the fund has done over time. |
Management's Discussion of Fund Performance | (Click Here) | The Portfolio Manager's review of fund performance and strategy. |
Shareholder Expense Example | (Click Here) | An example of shareholder expenses. |
Investment Changes | (Click Here) | A summary of major shifts in the fund's investments over the past six months. |
Investments | (Click Here) | A complete list of the fund's investments with their market values. |
Financial Statements | (Click Here) | Statements of assets and liabilities, operations, and changes in net assets, as well as financial highlights. |
Notes | (Click Here) | Notes to the financial statements. |
Report of Independent Registered Public Accounting Firm | (Click Here) | |
Trustees and Officers | (Click Here) | |
Distributions | (Click Here) | |
Board Approval of Investment Advisory Contracts and Management Fees | (Click Here) | |
To view a fund's proxy voting guidelines and proxy voting record for the 12-month period ended June 30, visit http://www.fidelity.com/proxyvotingresults or visit the Securities and Exchange Commission's (SEC) web site at http://www.sec.gov. You may also call 1-877-208-0098 to request a free copy of the proxy voting guidelines.
Standard & Poor's, S&P and S&P 500 are registered service marks of The McGraw-Hill Companies, Inc. and have been licensed for use by Fidelity Distributors Corporation.
Other third party marks appearing herein are the property of their respective owners.
All other marks appearing herein are registered or unregistered trademarks or service marks of FMR LLC or an affiliated company. © 2012 FMR LLC. All rights reserved.
This report and the financial statements contained herein are submitted for the general information of the shareholders of the fund. This report is not authorized for distribution to prospective investors in the fund unless preceded or accompanied by an effective prospectus.
A fund files its complete schedule of portfolio holdings with the SEC for the first and third quarters of each fiscal year on Form N-Q. Forms N-Q are available on the SEC's web site at http://www.sec.gov. A fund's Forms N-Q may be reviewed and copied at the SEC's Public Reference Room in Washington, DC. Information regarding the operation of the SEC's Public Reference Room may be obtained by calling 1-800-SEC-0330. For a complete list of a fund's portfolio holdings, view the most recent holdings listing, semiannual report, or annual report on Fidelity's web site at http://www.fidelity.com, http://www.advisor.fidelity.com, or http://www.401k.com, as applicable.
NOT FDIC INSURED • MAY LOSE VALUE • NO BANK GUARANTEE
Neither the fund nor Fidelity Distributors Corporation is a bank.
Annual Report
Average annual total return reflects the change in the value of an investment, assuming reinvestment of the class' distributions from dividend income and capital gains (the profits earned upon the sale of securities that have grown in value, if any) and assuming a constant rate of performance each year. The $10,000 table and the fund's returns do not reflect the deduction of taxes that a shareholder would pay on fund distributions or the redemption of fund shares. During periods of reimbursement by Fidelity, a fund's total return will be greater than it would be had the reimbursement not occurred. How a fund did yesterday is no guarantee of how it will do tomorrow.
Average Annual Total Returns
Periods ended October 31, 2012 | Past 1
year | Past 5
years | Past 10
years |
Institutional Class A | -0.18% | -8.00% | 3.88% |
A The initial offering of Institutional Class shares took place on December 14, 2010. Returns prior to December 14, 2010, are those of Fidelity® Japan Fund, the original class of the fund.
$10,000 Over 10 Years
Let's say hypothetically that $10,000 was invested in Fidelity Advisor® Japan Fund - Institutional Class on October 31, 2002. The chart shows how the value of your investment would have changed, and also shows how the Tokyo Stock Price Index (TOPIX) performed over the same period. The initial offering of Institutional Class took place on December 14, 2010. See above for additional information regarding the performance of Institutional Class.
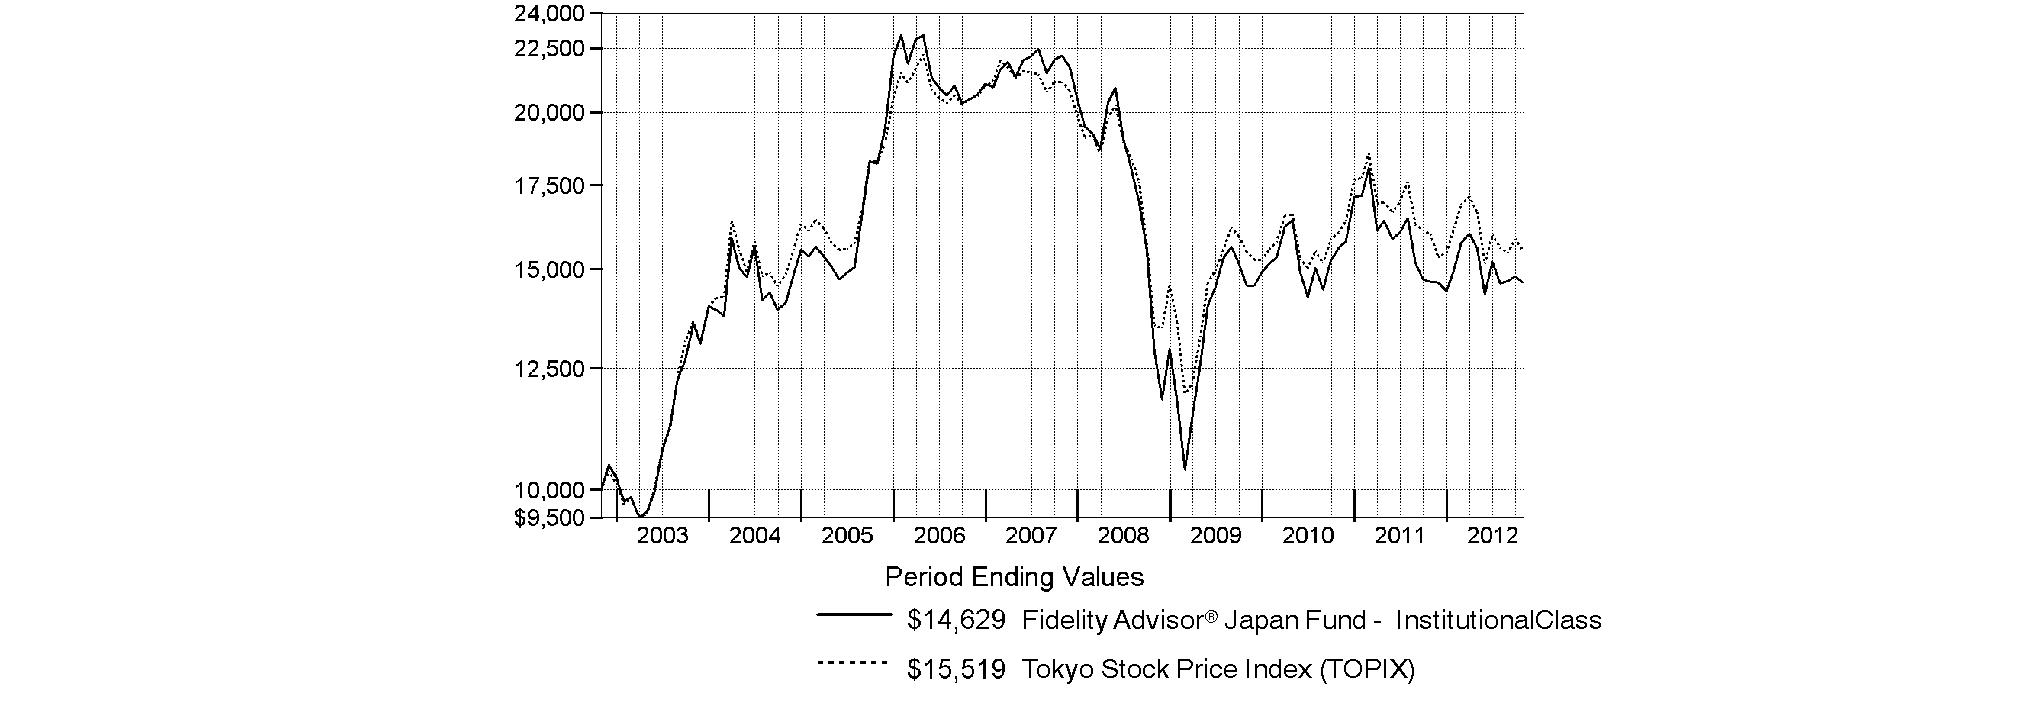
-
Annual Report
Market Recap: Returns for most domestic and international equities fluctuated during the 12 months ending October 31, 2012, as investor sentiment towards risk vacillated amid a changing global economic landscape. U.S. stocks overcame bouts of volatility to post strong gains for the past year, extending an uptrend that began in March 2009. The broad-based S&P 500® Index advanced 15.21%, while the blue-chip-laden Dow Jones Industrial AverageSM and technology-heavy Nasdaq Composite® Index rose 12.56% and 12.21%, respectively. Performance outside of the U.S. was relatively weak, as the MSCI® ACWI® (All Country World Index) ex USA Index rose 4.11%, hampered in part by a stronger U.S. dollar. International developed-markets generally struggled during the period as macroeconomic concerns ebbed and flowed, finishing with only a modest gain. The MSCI® EAFE® Index rose 4.76% for the year, largely buttressed in the summertime by pledges of accommodative monetary action from eurozone officials, as well as signs that the U.S. housing market was on the mend. Within the index, Asia-Pacific ex Japan showed the most impressive gain, advancing roughly 10%. A number of core European components, including Germany (+11%) and Switzerland (+10%), and the U.K. (+9%), benefited from optimism about the eurozone's ability to resolve its debt woes, which helped the region outpace the index overall. Elsewhere, Japan was among the few benchmark constituents to finish in the red, returning about -3%. Emerging-markets stocks gained 2.98% for the year, as measured by the MSCI Emerging Markets Index. A general uptrend in the final five months of the period lifted the index into positive territory for the full 12 months.
Comments from Rie Shigekawa, Portfolio Manager of Fidelity Advisor® Japan Fund: For the year, the fund's Institutional Class shares returned -0.18%, well ahead of the TOPIX, which returned -2.93%. The fund got a sizable boost from stock selection in the consumer discretionary sector, especially the automobile/components and media groups. My choices in the pharmaceuticals, biotechnology and life science part of health care also lifted performance, and security selection in the software/services segment of information technology helped as well. In the latter two cases, though, the benefits were largely or entirely offset by unfavorable positioning elsewhere in the sector. The fund's biggest individual contributor was Astellas Pharma, one of the largest Japanese drug companies. Given the company's reinvigorated product pipeline and healthy dividend yield, the stock offered growth potential and relative safety, and investors rewarded it with roughly a 40% advance. Other strong performers were Otsuka, an IT services provider for small and medium-sized businesses, and So-net Entertainment, which provides Internet services to Sony customers and was partially owned by Sony. During the period, Sony acquired the remaining stake in So-net at a healthy premium to where the shares had been trading. Sony, a weak-performing benchmark component, contributed to performance because the fund didn't own it. Automaker Toyota, the fund's largest holding during the period, also contributed. Conversely, the biggest negative factors were stock selection and a large overweighting in technology hardware/equipment, a group that accounted for the four largest individual detractors from relative performance: Fujitsu, Canon, Shimadzu and Toshiba. All of these companies suffered from a weaker-than-expected global economic backdrop and a relatively expensive yen. In addition, Fujitsu and Toshiba were adversely affected by stiffer competition from South Korean and Taiwanese rivals.
The views expressed above reflect those of the portfolio manager(s) only through the end of the period as stated on the cover of this report and do not necessarily represent the views of Fidelity or any other person in the Fidelity organization. Any such views are subject to change at any time based upon market or other conditions and Fidelity disclaims any responsibility to update such views. These views may not be relied on as investment advice and, because investment decisions for a Fidelity fund are based on numerous factors, may not be relied on as an indication of trading intent on behalf of any Fidelity fund.
Annual Report
Fidelity Japan Fund
As a shareholder of the Fund, you incur two types of costs: (1) transaction costs, including sales charges (loads) on purchase payments or redemption proceeds, redemption fees and (2) ongoing costs, including management fees, distribution and/or service (12b-1) fees and other Fund expenses. This Example is intended to help you understand your ongoing costs (in dollars) of investing in the Fund and to compare these costs with the ongoing costs of investing in other mutual funds.
The Example is based on an investment of $1,000 invested at the beginning of the period and held for the entire period (May 1, 2012 to October 31, 2012).
Actual Expenses
The first line of the accompanying table for each class of the Fund provides information about actual account values and actual expenses. You may use the information in this line, together with the amount you invested, to estimate the expenses that you paid over the period. Simply divide your account value by $1,000.00 (for example, an $8,600 account value divided by $1,000.00 = 8.6), then multiply the result by the number in the first line for a class of the Fund under the heading entitled "Expenses Paid During Period" to estimate the expenses you paid on your account during this period. A small balance maintenance fee of $12.00 that is charged once a year may apply for certain accounts with a value of less than $2,000. This fee is not included in the table below. If it was, the estimate of expenses you paid during the period would be higher, and your ending account value lower, by this amount. In addition, the Fund, as a shareholder in the underlying Fidelity Central Funds, will indirectly bear its pro-rata share of the fees and expenses incurred by the underlying Fidelity Central Funds. These fees and expenses are not included in the Fund's annualized expense ratio used to calculate the expense estimate in the table below.
Hypothetical Example for Comparison Purposes
The second line of the accompanying table for each class of the Fund provides information about hypothetical account values and hypothetical expenses based on a Class' actual expense ratio and an assumed rate of return of 5% per year before expenses, which is not the Class' actual return. The hypothetical account values and expenses may not be used to estimate the actual ending account balance or expenses you paid for the period. You may use this information to compare the ongoing costs of investing in the Fund and other funds. To do so, compare this 5% hypothetical example with the 5% hypothetical examples that appear in the shareholder reports of the other funds. A small balance maintenance fee of $12.00 that is charged once a year may apply for certain accounts with a value of less than $2,000. This fee is not included in the table below. If it was, the estimate of expenses you paid during the period would be higher, and your ending account value lower, by this amount. In addition, the Fund, as a shareholder in the underlying Fidelity Central Funds, will indirectly bear its pro-rata share of the fees and expenses incurred by the underlying Fidelity Central Funds. These fees and expenses are not included in the Fund's annualized expense ratio used to calculate the expense estimate in the table below.
Please note that the expenses shown in the table are meant to highlight your ongoing costs only and do not reflect any transaction costs. Therefore, the second line of the table is useful in comparing ongoing costs only, and will not help you determine the relative total costs of owning different funds. In addition, if these transactional costs were included, your costs would have been higher.
| Annualized
Expense Ratio | Beginning
Account Value
May 1, 2012 | Ending
Account Value
October 31, 2012 | Expenses Paid
During Period*
May 1, 2012
to October 31, 2012 |
Class A | 1.27% | | | |
Actual | | $ 1,000.00 | $ 937.50 | $ 6.19 |
HypotheticalA | | $ 1,000.00 | $ 1,018.75 | $ 6.44 |
Class T | 1.56% | | | |
Actual | | $ 1,000.00 | $ 937.40 | $ 7.60 |
HypotheticalA | | $ 1,000.00 | $ 1,017.29 | $ 7.91 |
Class B | 2.02% | | | |
Actual | | $ 1,000.00 | $ 934.40 | $ 9.82 |
HypotheticalA | | $ 1,000.00 | $ 1,014.98 | $ 10.23 |
Class C | 2.01% | | | |
Actual | | $ 1,000.00 | $ 935.30 | $ 9.78 |
HypotheticalA | | $ 1,000.00 | $ 1,015.03 | $ 10.18 |
Japan | .95% | | | |
Actual | | $ 1,000.00 | $ 940.60 | $ 4.63 |
HypotheticalA | | $ 1,000.00 | $ 1,020.36 | $ 4.82 |
Institutional Class | .84% | | | |
Actual | | $ 1,000.00 | $ 939.60 | $ 4.10 |
HypotheticalA | | $ 1,000.00 | $ 1,020.91 | $ 4.27 |
A 5% return per year before expenses
* Expenses are equal to each Class' annualized expense ratio, multiplied by the average account value over the period, multiplied by 184/366 (to reflect the one-half year period).
Annual Report
Fidelity Japan Fund
Investment Changes (Unaudited)
Geographic Diversification (% of fund's net assets) |
As of October 31, 2012 |
 | Japan | 98.9% | |
 | United States of America | 1.1% | |

Percentages are based on country or territory of incorporation and are adjusted for the effect of futures contracts, if applicable. |
As of April 30, 2012 |
| Japan | 96.0% | |
| United States of America | 4.0% | |

Percentages are based on country or territory of incorporation and are adjusted for the effect of futures contracts, if applicable. |
Asset Allocation |
| % of fund's
net assets | % of fund's net assets
6 months ago |
Stocks | 98.9 | 96.0 |
Short-Term Investments and Net Other Assets (Liabilities) | 1.1 | 4.0 |
Top Ten Stocks as of October 31, 2012 |
| % of fund's
net assets | % of fund's net assets
6 months ago |
Toyota Motor Corp. (Automobiles) | 7.3 | 6.9 |
Honda Motor Co. Ltd. (Automobiles) | 4.5 | 4.7 |
Canon, Inc. (Office Electronics) | 4.4 | 4.1 |
Mitsubishi UFJ Financial Group, Inc. (Commercial Banks) | 4.1 | 3.5 |
Sumitomo Mitsui Financial Group, Inc. (Commercial Banks) | 3.4 | 3.3 |
Astellas Pharma, Inc. (Pharmaceuticals) | 3.0 | 2.7 |
Asahi Kasei Corp. (Chemicals) | 2.9 | 2.9 |
Nomura Real Estate Holdings, Inc. (Real Estate Management & Development) | 2.8 | 3.1 |
Toray Industries, Inc. (Chemicals) | 2.8 | 2.7 |
Shimadzu Corp. (Electronic Equipment & Components) | 2.6 | 2.5 |
| 37.8 | |
Market Sectors as of October 31, 2012 |
| % of fund's
net assets | % of fund's net assets
6 months ago |
Consumer Discretionary | 26.6 | 22.6 |
Financials | 20.5 | 18.3 |
Information Technology | 17.3 | 25.1 |
Health Care | 10.4 | 6.0 |
Materials | 10.1 | 9.9 |
Industrials | 8.5 | 7.6 |
Consumer Staples | 2.8 | 3.2 |
Telecommunication Services | 2.0 | 2.2 |
Utilities | 0.7 | 1.1 |
Annual Report
Fidelity Japan Fund
Investments October 31, 2012
Showing Percentage of Net Assets
Common Stocks - 98.9% |
| Shares | | Value |
CONSUMER DISCRETIONARY - 26.6% |
Auto Components - 4.7% |
Bridgestone Corp. | 280,900 | | $ 6,541,314 |
Denso Corp. | 282,500 | | 8,843,386 |
Keihin Corp. | 175,300 | | 2,112,472 |
| | 17,497,172 |
Automobiles - 15.1% |
Honda Motor Co. Ltd. | 567,900 | | 17,072,918 |
Nissan Motor Co. Ltd. | 727,500 | | 6,087,561 |
Suzuki Motor Corp. | 275,400 | | 6,237,294 |
Toyota Motor Corp. | 709,100 | | 27,340,884 |
| | 56,738,657 |
Household Durables - 1.6% |
Panasonic Corp. | 1,011,200 | | 6,133,496 |
Media - 2.0% |
Avex Group Holdings, Inc. | 193,400 | | 3,822,939 |
Jupiter Telecommunications Co. | 2,685 | | 3,649,286 |
| | 7,472,225 |
Multiline Retail - 1.7% |
Marui Group Co. Ltd. | 889,500 | | 6,395,753 |
Specialty Retail - 0.3% |
Arc Land Sakamoto Co. Ltd. | 86,200 | | 1,249,322 |
Textiles, Apparel & Luxury Goods - 1.2% |
Onward Holdings Co. Ltd. | 629,000 | | 4,656,633 |
TOTAL CONSUMER DISCRETIONARY | | 100,143,258 |
CONSUMER STAPLES - 2.8% |
Food & Staples Retailing - 1.0% |
Seven & i Holdings Co., Ltd. | 124,000 | | 3,824,226 |
Food Products - 0.6% |
Toyo Suisan Kaisha Ltd. | 91,000 | | 2,267,306 |
Personal Products - 1.2% |
Shiseido Co. Ltd. | 363,400 | | 4,597,695 |
TOTAL CONSUMER STAPLES | | 10,689,227 |
FINANCIALS - 20.5% |
Commercial Banks - 9.7% |
Mitsubishi UFJ Financial Group, Inc. | 3,437,800 | | 15,552,497 |
Mizuho Financial Group, Inc. | 5,340,800 | | 8,356,644 |
Sumitomo Mitsui Financial Group, Inc. | 411,100 | | 12,561,985 |
| | 36,471,126 |
Consumer Finance - 1.9% |
ACOM Co. Ltd. (a) | 85,750 | | 2,531,789 |
Aeon Credit Service Co. Ltd. | 226,400 | | 4,804,229 |
| | 7,336,018 |
Insurance - 1.5% |
MS&AD Insurance Group Holdings, Inc. | 322,900 | | 5,472,676 |
|
| Shares | | Value |
Real Estate Investment Trusts - 2.6% |
Frontier Real Estate Investment Corp. | 731 | | $ 6,455,656 |
Japan Logistics Fund, Inc. | 383 | | 3,497,520 |
| | 9,953,176 |
Real Estate Management & Development - 4.8% |
Mitsui Fudosan Co. Ltd. | 374,000 | | 7,556,833 |
Nomura Real Estate Holdings, Inc. | 583,600 | | 10,475,996 |
| | 18,032,829 |
TOTAL FINANCIALS | | 77,265,825 |
HEALTH CARE - 10.4% |
Health Care Equipment & Supplies - 2.0% |
ASAHI INTECC Co. Ltd. (d) | 88,000 | | 2,611,449 |
Terumo Corp. | 114,100 | | 4,916,748 |
| | 7,528,197 |
Health Care Providers & Services - 1.8% |
Message Co. Ltd. (d) | 2,198 | | 6,784,257 |
Pharmaceuticals - 6.6% |
Astellas Pharma, Inc. | 227,900 | | 11,319,347 |
Shionogi & Co. Ltd. | 251,600 | | 4,172,847 |
Takeda Pharmaceutical Co. Ltd. | 198,700 | | 9,234,335 |
| | 24,726,529 |
TOTAL HEALTH CARE | | 39,038,983 |
INDUSTRIALS - 8.5% |
Electrical Equipment - 0.8% |
Nidec Corp. (d) | 44,900 | | 3,194,689 |
Machinery - 3.7% |
Kubota Corp. | 679,000 | | 6,940,549 |
Makita Corp. | 73,000 | | 2,885,068 |
Mitsubishi Heavy Industries Ltd. | 956,000 | | 4,023,750 |
| | 13,849,367 |
Road & Rail - 2.2% |
East Japan Railway Co. | 101,500 | | 6,967,556 |
Hitachi Transport System Ltd. | 93,700 | | 1,404,972 |
| | 8,372,528 |
Trading Companies & Distributors - 1.8% |
Sumitomo Corp. | 486,400 | | 6,629,127 |
TOTAL INDUSTRIALS | | 32,045,711 |
INFORMATION TECHNOLOGY - 17.3% |
Computers & Peripherals - 4.0% |
Fujitsu Ltd. | 1,680,000 | | 6,460,729 |
Toshiba Corp. | 2,360,000 | | 8,750,595 |
| | 15,211,324 |
Electronic Equipment & Components - 5.1% |
Hamamatsu Photonics K.K. | 97,100 | | 3,363,165 |
Hitachi High-Technologies Corp. | 90,600 | | 1,982,691 |
Common Stocks - continued |
| Shares | | Value |
INFORMATION TECHNOLOGY - continued |
Electronic Equipment & Components - continued |
Horiba Ltd. | 153,400 | | $ 4,179,444 |
Shimadzu Corp. | 1,426,000 | | 9,592,409 |
| | 19,117,709 |
IT Services - 2.7% |
Otsuka Corp. | 88,500 | | 7,217,024 |
SCSK Corp. | 182,000 | | 3,096,029 |
| | 10,313,053 |
Office Electronics - 4.4% |
Canon, Inc. | 507,500 | | 16,493,586 |
Software - 1.1% |
Capcom Co. Ltd. | 209,500 | | 3,991,601 |
TOTAL INFORMATION TECHNOLOGY | | 65,127,273 |
MATERIALS - 10.1% |
Chemicals - 9.2% |
Asahi Kasei Corp. | 2,006,000 | | 11,031,367 |
Kaneka Corp. | 427,000 | | 2,080,709 |
Nippon Kayaku Co. Ltd. | 110,000 | | 1,223,600 |
Nippon Shokubai Co. Ltd. | 305,000 | | 2,991,545 |
Nitto Denko Corp. | 152,200 | | 6,901,716 |
Toray Industries, Inc. | 1,794,000 | | 10,472,304 |
| | 34,701,241 |
Metals & Mining - 0.9% |
Hitachi Metals Ltd. | 333,000 | | 3,116,009 |
TOTAL MATERIALS | | 37,817,250 |
TELECOMMUNICATION SERVICES - 2.0% |
Wireless Telecommunication Services - 2.0% |
NTT DoCoMo, Inc. | 5,200 | | 7,534,942 |
|
| Shares | | Value |
UTILITIES - 0.7% |
Electric Utilities - 0.7% |
Kansai Electric Power Co., Inc. | 330,300 | | $ 2,540,451 |
TOTAL COMMON STOCKS (Cost $445,663,766) |
372,202,920
|
Money Market Funds - 3.5% |
| | | |
Fidelity Cash Central Fund, 0.19% (b) | 9,391,664 | | 9,391,664 |
Fidelity Securities Lending Cash Central Fund, 0.19% (b)(c) | 3,921,508 | | 3,921,508 |
TOTAL MONEY MARKET FUNDS (Cost $13,313,172) |
13,313,172
|
TOTAL INVESTMENT PORTFOLIO - 102.4% (Cost $458,976,938) | | 385,516,092 |
NET OTHER ASSETS (LIABILITIES) - (2.4)% | | (9,021,583) |
NET ASSETS - 100% | $ 376,494,509 |
Legend |
(a) Non-income producing |
(b) Affiliated fund that is available only to investment companies and other accounts managed by Fidelity Investments. The rate quoted is the annualized seven-day yield of the fund at period end. A complete unaudited listing of the fund's holdings as of its most recent quarter end is available upon request. In addition, each Fidelity Central Fund's financial statements, which are not covered by the Fund's Report of Independent Registered Public Accounting Firm, are available on the SEC's website or upon request. |
(c) Investment made with cash collateral received from securities on loan. |
(d) Security or a portion of the security is on loan at period end. |
Affiliated Central Funds |
Information regarding fiscal year to date income earned by the Fund from investments in Fidelity Central Funds is as follows: |
Fund | Income earned |
Fidelity Cash Central Fund | $ 15,392 |
Fidelity Securities Lending Cash Central Fund | 57,669 |
Total | $ 73,061 |
Other Information |
The following is a summary of the inputs used, as of October 31, 2012, involving the Fund's assets and liabilities carried at fair value. The inputs or methodology used for valuing securities may not be an indication of the risk associated with investing in those securities. For more information on valuation inputs, and their aggregation into the levels used in the tables below, please refer to the Security Valuation section in the accompanying Notes to Financial Statements. |
Valuation Inputs at Reporting Date: |
Description | Total | Level 1 | Level 2 | Level 3 |
Investments in Securities: | | | | |
Equities: | | | | |
Consumer Discretionary | $ 100,143,258 | $ 49,595,960 | $ 50,547,298 | $ - |
Consumer Staples | 10,689,227 | 10,689,227 | - | - |
Financials | 77,265,825 | 40,794,699 | 36,471,126 | - |
Health Care | 39,038,983 | 39,038,983 | - | - |
Industrials | 32,045,711 | 32,045,711 | - | - |
Information Technology | 65,127,273 | 48,633,687 | 16,493,586 | - |
Materials | 37,817,250 | 37,817,250 | - | - |
Telecommunication Services | 7,534,942 | - | 7,534,942 | - |
Utilities | 2,540,451 | 2,540,451 | - | - |
Money Market Funds | 13,313,172 | 13,313,172 | - | - |
Total Investments in Securities: | $ 385,516,092 | $ 274,469,140 | $ 111,046,952 | $ - |
The following is a summary of transfers between Level 1 and Level 2 for the period ended October 31, 2012. Transfers are assumed to have occurred at the beginning of the period, and are primarily attributable to the valuation techniques used for foreign equity securities, as discussed in the accompanying Notes to Financial Statements: |
Transfers | Total |
Level 1 to Level 2 | $ 0 |
Level 2 to Level 1 | $ 221,614,606 |
See accompanying notes which are an integral part of the financial statements.
Annual Report
Fidelity Japan Fund
Statement of Assets and Liabilities
| October 31, 2012 |
| | |
Assets | | |
Investment in securities, at value (including securities loaned of $3,663,872) - See accompanying schedule: Unaffiliated issuers (cost $445,663,766) | $ 372,202,920 | |
Fidelity Central Funds (cost $13,313,172) | 13,313,172 | |
Total Investments (cost $458,976,938) | | $ 385,516,092 |
Receivable for investments sold | | 1,818,767 |
Receivable for fund shares sold | | 199,278 |
Dividends receivable | | 3,555,728 |
Distributions receivable from Fidelity Central Funds | | 5,293 |
Other receivables | | 32,231 |
Total assets | | 391,127,389 |
| | |
Liabilities | | |
Payable for investments purchased | $ 1,472,890 | |
Payable for fund shares redeemed | 8,839,933 | |
Accrued management fee | 226,105 | |
Distribution and service plan fees payable | 10,452 | |
Other affiliated payables | 92,408 | |
Other payables and accrued expenses | 69,584 | |
Collateral on securities loaned, at value | 3,921,508 | |
Total liabilities | | 14,632,880 |
| | |
Net Assets | | $ 376,494,509 |
Net Assets consist of: | | |
Paid in capital | | $ 662,035,138 |
Undistributed net investment income | | 5,171,198 |
Accumulated undistributed net realized gain (loss) on investments and foreign currency transactions | | (217,159,330) |
Net unrealized appreciation (depreciation) on investments and assets and liabilities in foreign currencies | | (73,552,497) |
Net Assets | | $ 376,494,509 |
Statement of Assets and Liabilities - continued
| October 31, 2012 |
| | |
Calculation of Maximum Offering Price Class A:
Net Asset Value and redemption price per share ($9,495,097 ÷ 1,020,459 shares) | | $ 9.30 |
| | |
Maximum offering price per share (100/94.25 of $9.30) | | $ 9.87 |
Class T:
Net Asset Value and redemption price per share ($3,933,511 ÷ 424,072 shares) | | $ 9.28 |
| | |
Maximum offering price per share (100/96.50 of $9.28) | | $ 9.62 |
Class B:
Net Asset Value and offering price per share ($1,012,233 ÷ 109,322 shares)A | | $ 9.26 |
| | |
Class C:
Net Asset Value and offering price per share ($7,015,255 ÷ 758,790 shares)A | | $ 9.25 |
| | |
Japan:
Net Asset Value, offering price and redemption price per share ($353,550,250 ÷ 37,872,939 shares) | | $ 9.34 |
| | |
Institutional Class:
Net Asset Value, offering price and redemption price per share ($1,488,163 ÷ 159,495 shares) | | $ 9.33 |
A Redemption price per share is equal to net asset value less any applicable contingent deferred sales charge.
See accompanying notes which are an integral part of the financial statements.
Annual Report
Fidelity Japan Fund
Financial Statements - continued
Statement of Operations
| Year ended October 31, 2012 |
| | |
Investment Income | | |
Dividends | | $ 10,808,030 |
Interest | | 66 |
Income from Fidelity Central Funds | | 73,061 |
Income before foreign taxes withheld | | 10,881,157 |
Less foreign taxes withheld | | (756,562) |
Total income | | 10,124,595 |
| | |
Expenses | | |
Management fee Basic fee | $ 3,118,883 | |
Performance adjustment | 256,814 | |
Transfer agent fees | 999,478 | |
Distribution and service plan fees | 143,002 | |
Accounting and security lending fees | 229,410 | |
Custodian fees and expenses | 50,443 | |
Independent trustees' compensation | 3,017 | |
Registration fees | 75,488 | |
Audit | 67,660 | |
Legal | 2,379 | |
Miscellaneous | 4,284 | |
Total expenses before reductions | 4,950,858 | |
Expense reductions | (194,406) | 4,756,452 |
Net investment income (loss) | | 5,368,143 |
Realized and Unrealized Gain (Loss) Net realized gain (loss) on: | | |
Investment securities: | | |
Unaffiliated issuers | (9,017,678) | |
Foreign currency transactions | 105,412 | |
Total net realized gain (loss) | | (8,912,266) |
Change in net unrealized appreciation (depreciation) on: Investment securities | 3,036,129 | |
Assets and liabilities in foreign currencies | (14,170) | |
Total change in net unrealized appreciation (depreciation) | | 3,021,959 |
Net gain (loss) | | (5,890,307) |
Net increase (decrease) in net assets resulting from operations | | $ (522,164) |
Statement of Changes in Net Assets
| Year ended
October 31,
2012 | Year ended
October 31,
2011 |
Increase (Decrease) in Net Assets | | |
Operations | | |
Net investment income (loss) | $ 5,368,143 | $ 7,504,955 |
Net realized gain (loss) | (8,912,266) | (68,712,920) |
Change in net unrealized appreciation (depreciation) | 3,021,959 | 31,829,795 |
Net increase (decrease) in net assets resulting from operations | (522,164) | (29,378,170) |
Distributions to shareholders from net investment income | (7,688,787) | (9,748,982) |
Distributions to shareholders from net realized gain | (2,570,905) | (10,506,757) |
Total distributions | (10,259,692) | (20,255,739) |
Share transactions - net increase (decrease) | (93,975,629) | (153,265,919) |
Redemption fees | 61,543 | 492,971 |
Total increase (decrease) in net assets | (104,695,942) | (202,406,857) |
| | |
Net Assets | | |
Beginning of period | 481,190,451 | 683,597,308 |
End of period (including undistributed net investment income of $5,171,198 and undistributed net investment income of $7,491,842, respectively) | $ 376,494,509 | $ 481,190,451 |
See accompanying notes which are an integral part of the financial statements.
Annual Report
Financial Highlights - Class A
Years ended October 31, | 2012 | 2011 H |
Selected Per-Share Data | | |
Net asset value, beginning of period | $ 9.54 | $ 10.83 |
Income from Investment Operations | | |
Net investment income (loss) E | .09 | .09 |
Net realized and unrealized gain (loss) | (.15) | (1.39) |
Total from investment operations | (.06) | (1.30) |
Distributions from net investment income | (.13) | - |
Distributions from net realized gain | (.05) | - |
Total distributions | (.18) | - |
Redemption fees added to paid in capital E | - K | .01 |
Net asset value, end of period | $ 9.30 | $ 9.54 |
Total Return B, C, D | (.64)% | (11.91)% |
Ratios to Average Net Assets F, I | | |
Expenses before reductions | 1.42% | 1.20% A |
Expenses net of fee waivers, if any | 1.38% | 1.20% A |
Expenses net of all reductions | 1.36% | 1.16% A |
Net investment income (loss) | .94% | 1.02% A |
Supplemental Data | | |
Net assets, end of period (000 omitted) | $ 9,495 | $ 13,208 |
Portfolio turnover rate G | 52% | 134% J |
A Annualized B Total returns for periods of less than one year are not annualized. C Total returns would have been lower if certain expenses had not been reduced during the applicable periods shown. D Total returns do not include the effect of the sales charges. E Calculated based on average shares outstanding during the period. F Fees and expenses of any underlying Fidelity Central Funds are not included in the Fund's expense ratio. The Fund indirectly bears its proportionate share of the expenses of any underlying Fidelity Central Funds. G Amount does not include the portfolio activity of any underlying Fidelity Central Funds. H For the period December 14, 2010 (commencement of sale of shares) to October 31, 2011. I Expense ratios reflect operating expenses of the class. Expenses before reductions do not reflect amounts reimbursed by the investment adviser or reductions from brokerage service arrangements or reductions from other expense offset arrangements and do not represent the amount paid by the class during periods when reimbursements or reductions occur. Expense ratios before reductions for start-up periods may not be representative of longer-term operating periods. Expenses net of fee waivers reflect expenses after reimbursement by the investment adviser but prior to reductions from brokerage service arrangements or other expense offset arrangements. Expenses net of all reductions represent the net expenses paid by the class. J The portfolio turnover rate does not include the assets acquired in the merger. K Amount represents less than $.01 per share. |
Financial Highlights - Class T
Years ended October 31, | 2012 | 2011 H |
Selected Per-Share Data | | |
Net asset value, beginning of period | $ 9.51 | $ 10.83 |
Income from Investment Operations | | |
Net investment income (loss) E | .06 | .07 |
Net realized and unrealized gain (loss) | (.13) | (1.40) |
Total from investment operations | (.07) | (1.33) |
Distributions from net investment income | (.11) | - |
Distributions from net realized gain | (.05) | - |
Total distributions | (.16) | - |
Redemption fees added to paid in capital E | - K | .01 |
Net asset value, end of period | $ 9.28 | $ 9.51 |
Total Return B, C, D | (.75)% | (12.19)% |
Ratios to Average Net Assets F, I | | |
Expenses before reductions | 1.70% | 1.48% A |
Expenses net of fee waivers, if any | 1.66% | 1.48% A |
Expenses net of all reductions | 1.64% | 1.44% A |
Net investment income (loss) | .66% | .74% A |
Supplemental Data | | |
Net assets, end of period (000 omitted) | $ 3,934 | $ 4,643 |
Portfolio turnover rate G | 52% | 134% J |
A Annualized B Total returns for periods of less than one year are not annualized. C Total returns would have been lower if certain expenses had not been reduced during the applicable periods shown. D Total returns do not include the effect of the sales charges. E Calculated based on average shares outstanding during the period. F Fees and expenses of any underlying Fidelity Central Funds are not included in the Fund's expense ratio. The Fund indirectly bears its proportionate share of the expenses of any underlying Fidelity Central Funds. G Amount does not include the portfolio activity of any underlying Fidelity Central Funds. H For the period December 14, 2010 (commencement of sale of shares) to October 31, 2011. I Expense ratios reflect operating expenses of the class. Expenses before reductions do not reflect amounts reimbursed by the investment adviser or reductions from brokerage service arrangements or reductions from other expense offset arrangements and do not represent the amount paid by the class during periods when reimbursements or reductions occur. Expense ratios before reductions for start-up periods may not be representative of longer-term operating periods. Expenses net of fee waivers reflect expenses after reimbursement by the investment adviser but prior to reductions from brokerage service arrangements or other expense offset arrangements. Expenses net of all reductions represent the net expenses paid by the class. J The portfolio turnover rate does not include the assets acquired in the merger. K Amount represents less than $.01 per share. |
See accompanying notes which are an integral part of the financial statements.
Annual Report
Financial Highlights - Class B
Years ended October 31, | 2012 | 2011 H |
Selected Per-Share Data | | |
Net asset value, beginning of period | $ 9.47 | $ 10.83 |
Income from Investment Operations | | |
Net investment income (loss) E | .02 | .02 |
Net realized and unrealized gain (loss) | (.14) | (1.39) |
Total from investment operations | (.12) | (1.37) |
Distributions from net investment income | (.04) | - |
Distributions from net realized gain | (.05) | - |
Total distributions | (.09) | - |
Redemption fees added to paid in capital E | - K | .01 |
Net asset value, end of period | $ 9.26 | $ 9.47 |
Total Return B, C, D | (1.24)% | (12.56)% |
Ratios to Average Net Assets F, I | | |
Expenses before reductions | 2.17% | 1.95% A |
Expenses net of fee waivers, if any | 2.13% | 1.95% A |
Expenses net of all reductions | 2.11% | 1.91% A |
Net investment income (loss) | .19% | .27% A |
Supplemental Data | | |
Net assets, end of period (000 omitted) | $ 1,012 | $ 1,458 |
Portfolio turnover rate G | 52% | 134% J |
A Annualized B Total returns for periods of less than one year are not annualized. C Total returns would have been lower if certain expenses had not been reduced during the applicable periods shown. D Total returns do not include the effect of the contingent deferred sales charge. E Calculated based on average shares outstanding during the period. F Fees and expenses of any underlying Fidelity Central Funds are not included in the Fund's expense ratio. The Fund indirectly bears its proportionate share of the expenses of any underlying Fidelity Central Funds. G Amount does not include the portfolio activity of any underlying Fidelity Central Funds. H For the period December 14, 2010 (commencement of sale of shares) to October 31, 2011. I Expense ratios reflect operating expenses of the class. Expenses before reductions do not reflect amounts reimbursed by the investment adviser or reductions from brokerage service arrangements or reductions from other expense offset arrangements and do not represent the amount paid by the class during periods when reimbursements or reductions occur. Expense ratios before reductions for start-up periods may not be representative of longer-term operating periods. Expenses net of fee waivers reflect expenses after reimbursement by the investment adviser but prior to reductions from brokerage service arrangements or other expense offset arrangements. Expenses net of all reductions represent the net expenses paid by the class. J The portfolio turnover rate does not include the assets acquired in the merger. K Amount represents less than $.01 per share. |
Financial Highlights - Class C
Years ended October 31, | 2012 | 2011 H |
Selected Per-Share Data | | |
Net asset value, beginning of period | $ 9.48 | $ 10.83 |
Income from Investment Operations | | |
Net investment income (loss) E | .02 | .03 |
Net realized and unrealized gain (loss) | (.14) | (1.39) |
Total from investment operations | (.12) | (1.36) |
Distributions from net investment income | (.06) | - |
Distributions from net realized gain | (.05) | - |
Total distributions | (.11) | - |
Redemption fees added to paid in capital E | - K | .01 |
Net asset value, end of period | $ 9.25 | $ 9.48 |
Total Return B, C, D | (1.27)% | (12.47)% |
Ratios to Average Net Assets F, I | | |
Expenses before reductions | 2.15% | 1.92% A |
Expenses net of fee waivers, if any | 2.11% | 1.92% A |
Expenses net of all reductions | 2.09% | 1.88% A |
Net investment income (loss) | .21% | .30% A |
Supplemental Data | | |
Net assets, end of period (000 omitted) | $ 7,015 | $ 8,750 |
Portfolio turnover rate G | 52% | 134% J |
A Annualized B Total returns for periods of less than one year are not annualized. C Total returns would have been lower if certain expenses had not been reduced during the applicable periods shown. D Total returns do not include the effect of the contingent deferred sales charge. E Calculated based on average shares outstanding during the period. F Fees and expenses of any underlying Fidelity Central Funds are not included in the Fund's expense ratio. The Fund indirectly bears its proportionate share of the expenses of any underlying Fidelity Central Funds. G Amount does not include the portfolio activity of any underlying Fidelity Central Funds. H For the period December 14, 2010 (commencement of sale of shares) to October 31, 2011. I Expense ratios reflect operating expenses of the class. Expenses before reductions do not reflect amounts reimbursed by the investment adviser or reductions from brokerage service arrangements or reductions from other expense offset arrangements and do not represent the amount paid by the class during periods when reimbursements or reductions occur. Expense ratios before reductions for start-up periods may not be representative of longer-term operating periods. Expenses net of fee waivers reflect expenses after reimbursement by the investment adviser but prior to reductions from brokerage service arrangements or other expense offset arrangements. Expenses net of all reductions represent the net expenses paid by the class. J The portfolio turnover rate does not include the assets acquired in the merger. K Amount represents less than $.01 per share. |
See accompanying notes which are an integral part of the financial statements.
Annual Report
Financial Highlights - Japan
Years ended October 31, | 2012 | 2011 | 2010 | 2009 | 2008 |
Selected Per-Share Data | | | | | |
Net asset value, beginning of period | $ 9.57 | $ 10.57 | $ 10.03 | $ 9.03 | $ 18.00 |
Income from Investment Operations | | | | | |
Net investment income (loss) B | .12 | .15 | .10 | .08 | .10 |
Net realized and unrealized gain (loss) | (.14) | (.75) | .61 | 1.04 | (6.64) |
Total from investment operations | (.02) | (.60) | .71 | 1.12 | (6.54) |
Distributions from net investment income | (.16) | (.20) | (.07) | (.11) | (.04) |
Distributions from net realized gain | (.05) | (.21) | (.10) | (.01) | (2.39) |
Total distributions | (.21) | (.41) | (.17) | (.12) | (2.43) |
Redemption fees added to paid in capital B | - G | .01 | - G | - G | - G |
Net asset value, end of period | $ 9.34 | $ 9.57 | $ 10.57 | $ 10.03 | $ 9.03 |
Total Return A | (.19)% | (6.00)% | 7.12% | 12.84% | (41.88)% |
Ratios to Average Net Assets C, E | | | | | |
Expenses before reductions | 1.09% | .86% | .93% | .90% | 1.12% |
Expenses net of fee waivers, if any | 1.06% | .84% | .93% | .90% | 1.12% |
Expenses net of all reductions | 1.04% | .80% | .93% | .89% | 1.10% |
Net investment income (loss) | 1.26% | 1.38% | .97% | .90% | .72% |
Supplemental Data | | | | | |
Net assets, end of period (000 omitted) | $ 353,550 | $ 450,417 | $ 649,316 | $ 944,902 | $ 1,025,334 |
Portfolio turnover rate D | 52% | 134% F | 43% | 73% | 78% |
A Total returns would have been lower if certain expenses had not been reduced during the applicable periods shown. B Calculated based on average shares outstanding during the period. C Fees and expenses of any underlying Fidelity Central Funds are not included in the Fund's expense ratio. The Fund indirectly bears its proportionate share of the expenses of any underlying Fidelity Central Funds. D Amount does not include the portfolio activity of any underlying Fidelity Central Funds. E Expense ratios reflect operating expenses of the class. Expenses before reductions do not reflect amounts reimbursed by the investment adviser or reductions from brokerage service arrangements or reductions from other expense offset arrangements and do not represent the amount paid by the class during periods when reimbursements or reductions occur. Expenses net of fee waivers reflect expenses after reimbursement by the investment adviser but prior to reductions from brokerage service arrangements or other expense offset arrangements. Expenses net of all reductions represent the net expenses paid by the class. F The portfolio turnover rate does not include the assets acquired in the merger. G Amount represents less than $.01 per share. |
Financial Highlights - Institutional Class
Years ended October 31, | 2012 | 2011 G |
Selected Per-Share Data | | |
Net asset value, beginning of period | $ 9.57 | $ 10.83 |
Income from Investment Operations | | |
Net investment income (loss) D | .12 | .13 |
Net realized and unrealized gain (loss) | (.14) | (1.40) |
Total from investment operations | (.02) | (1.27) |
Distributions from net investment income | (.17) | - |
Distributions from net realized gain | (.05) | - |
Total distributions | (.22) | - |
Redemption fees added to paid in capital D | - J | .01 |
Net asset value, end of period | $ 9.33 | $ 9.57 |
Total Return B, C | (.18)% | (11.63)% |
Ratios to Average Net Assets E, H | | |
Expenses before reductions | 1.03% | .79% A |
Expenses net of fee waivers, if any | 1.01% | .79% A |
Expenses net of all reductions | .99% | .75% A |
Net investment income (loss) | 1.31% | 1.43% A |
Supplemental Data | | |
Net assets, end of period (000 omitted) | $ 1,488 | $ 2,715 |
Portfolio turnover rate F | 52% | 134% I |
A Annualized B Total returns for periods of less than one year are not annualized. C Total returns would have been lower if certain expenses had not been reduced during the applicable periods shown. D Calculated based on average shares outstanding during the period. E Fees and expenses of any underlying Fidelity Central Funds are not included in the Fund's expense ratio. The Fund indirectly bears its proportionate share of the expenses of any underlying Fidelity Central Funds. F Amount does not include the portfolio activity of any underlying Fidelity Central Funds. G For the period December 14, 2010 (commencement of sale of shares) to October 31, 2011. H Expense ratios reflect operating expenses of the class. Expenses before reductions do not reflect amounts reimbursed by the investment adviser or reductions from brokerage service arrangements or reductions from other expense offset arrangements and do not represent the amount paid by the class during periods when reimbursements or reductions occur. Expense ratios before reductions for start-up periods may not be representative of longer-term operating periods. Expenses net of fee waivers reflect expenses after reimbursement by the investment adviser but prior to reductions from brokerage service arrangements or other expense offset arrangements. Expenses net of all reductions represent the net expenses paid by the class. I The portfolio turnover rate does not include the assets acquired in the merger. J Amount represents less than $.01 per share. |
See accompanying notes which are an integral part of the financial statements.
Annual Report
Notes to Financial Statements
For the period ended October 31, 2012
1. Organization.
Fidelity Japan Fund (the Fund) is a fund of Fidelity Investment Trust (the Trust) and is authorized to issue an unlimited number of shares. The Trust is registered under the Investment Company Act of 1940, as amended (the 1940 Act), as an open-end management investment company organized as a Massachusetts business trust. The Fund offers Class A, Class T, Class C, Japan and Institutional Class shares, each of which, along with Class B shares, has equal rights as to assets and voting privileges. Class B shares are closed to new accounts and additional purchases, except for exchanges and reinvestments. Each class has exclusive voting rights with respect to matters that affect that class. Class B shares automatically convert to Class A shares after a holding period of seven years from the initial date of purchase. Investment income, realized and unrealized capital gains and losses, the common expenses of the Fund, and certain fund-level expense reductions, if any, are allocated on a pro-rata basis to each class based on the relative net assets of each class to the total net assets of the Fund. Each class differs with respect to transfer agent and distribution and service plan fees incurred. Certain expense reductions may also differ by class. The Fund offered Class F shares during the period June 26, 2009 through December 15, 2010 and all outstanding shares were redeemed by December 15, 2010.
2. Investments in Fidelity Central Funds.
The Fund invests in Fidelity Central Funds, which are open-end investment companies available only to other investment companies and accounts managed by Fidelity Management & Research Company (FMR) and its affiliates. The Fund's Schedule of Investments lists each of the Fidelity Central Funds held as of period end, if any, as an investment of the Fund, but does not include the underlying holdings of each Fidelity Central Fund. As an Investing Fund, the Fund indirectly bears its proportionate share of the expenses of the underlying Fidelity Central Funds.
The Money Market Central Funds seek preservation of capital and current income and are managed by Fidelity Investments Money Management, Inc. (FIMM), an affiliate of FMR.
A complete unaudited list of holdings for each Fidelity Central Fund is available upon request or at the Securities and Exchange Commission (the SEC) web site at www.sec.gov. In addition, the financial statements of the Fidelity Central Funds, which are not covered by the Fund's Report of Independent Registered Public Accounting Firm, are available on the SEC web site or upon request.
3. Significant Accounting Policies.
The financial statements have been prepared in conformity with accounting principles generally accepted in the United States of America (GAAP), which require management to make certain estimates and assumptions at the date of the financial statements. Actual results could differ from those estimates. Subsequent events, if any, through the date that the financial statements were issued have been evaluated in the preparation of the financial statements. The following summarizes the significant accounting policies of the Fund:
Security Valuation. Investments are valued as of 4:00 p.m. Eastern time on the last calendar day of the period. In accordance with valuation policies and procedures approved by the Board of Trustees (the Board), the Fund attempts to obtain prices from one or more third party pricing vendors or brokers to value its investments. When current market prices, quotations or rates are not readily available or reliable, securities will be fair valued in good faith by the FMR Fair Value Committee (the Committee), in accordance with procedures adopted by the Fund's Board. Factors used in determining fair value vary by security type and may include market or security specific events. The frequency with which these procedures are used cannot be predicted and they may be utilized to a significant extent. The Committee oversees the Fund's valuation policies and procedures and is responsible for approving and reporting to the Board all fair value determinations.
The Fund categorizes the inputs to valuation techniques used to value its investments into a disclosure hierarchy consisting of three levels as shown below:
Level 1 - quoted prices in active markets for identical investments
Level 2 - other significant observable inputs (including quoted prices for similar investments, interest rates, prepayment speeds, etc.)
Level 3 - unobservable inputs (including the Fund's own assumptions based on the best information available)
Valuation techniques used to value the Fund's investments by major category are as follows:
Equity securities, including restricted securities, for which market quotations are readily available, are valued at the last reported sale price or official closing price as reported by a third party pricing vendor on the primary market or exchange on which they are traded and are categorized as Level 1 in the hierarchy. In the event there were no sales during the day or closing prices are not available, securities are valued at the last quoted bid price or may be valued using the last available price and are generally categorized as Level 2 in the hierarchy. For foreign equity securities, when significant market or security specific events arise, comparisons to the valuation of American Depositary Receipts (ADRs), futures contracts, Exchange-Traded Funds (ETFs) and certain indexes as well as quoted prices for similar securities are used and are categorized as Level 2 in the hierarchy. Utilizing these techniques may result in transfers between Level 1 and Level 2.
Annual Report
Notes to Financial Statements - continued
3. Significant Accounting Policies - continued
Security Valuation - continued
Investments in open-end mutual funds, including the Fidelity Central Funds, are valued at their closing net asset value (NAV) each business day and are categorized as Level 1 in the hierarchy.
Changes in valuation techniques may result in transfers in or out of an assigned level within the disclosure hierarchy. The aggregate value of investments by input level, as of October 31, 2012, including information on transfers between Levels 1 and 2, is included at the end of the Fund's Schedule of Investments.
Foreign Currency Translation. The Fund may use foreign currency contracts to facilitate transactions in foreign-denominated securities. Gains and losses from these transactions may arise from changes in the value of the foreign currency or if the counterparties do not perform under the contracts' terms.
Foreign-denominated assets, including investment securities, and liabilities are translated into U.S. dollars at the exchange rates at period end. Purchases and sales of investment securities, income and dividends received and expenses denominated in foreign currencies are translated into U.S. dollars at the exchange rate in effect on the transaction date.
The effects of exchange rate fluctuations on investments are included with the net realized and unrealized gain (loss) on investment securities. Other foreign currency transactions resulting in realized and unrealized gain (loss) are disclosed separately.
Investment Transactions and Income. For financial reporting purposes, the Fund's investment holdings and NAV include trades executed through the end of the last business day of the period. The NAV per share for processing shareholder transactions is calculated as of the close of business of the New York Stock Exchange (NYSE), normally 4:00 p.m. Eastern time and includes trades executed through the end of the prior business day. Gains and losses on securities sold are determined on the basis of identified cost. Dividend income is recorded on the ex-dividend date, except for certain dividends from foreign securities where the ex-dividend date may have passed, which are recorded as soon as the Fund is informed of the ex-dividend date. Non-cash dividends included in dividend income, if any, are recorded at the fair market value of the securities received. Interest income and distributions from the Fidelity Central Funds are accrued as earned. Interest income includes coupon interest and amortization of premium and accretion of discount on debt securities. Investment income is recorded net of foreign taxes withheld where recovery of such taxes is uncertain.
Expenses. Expenses directly attributable to a fund are charged to that fund. Expenses attributable to more than one fund are allocated among the respective funds on the basis of relative net assets or other appropriate methods. Expense estimates are accrued in the period to which they relate and adjustments are made when actual amounts are known.
Income Tax Information and Distributions to Shareholders. Each year, the Fund intends to qualify as a regulated investment company under Subchapter M of the Internal Revenue Code, including distributing substantially all of its taxable income and realized gains. As a result, no provision for income taxes is required. As of October 31, 2012, the Fund did not have any unrecognized tax benefits in the financial statements; nor is the Fund aware of any tax positions for which it is reasonably possible that the total amounts of unrecognized tax benefits will significantly change in the next twelve months. The Fund files a U.S. federal tax return, in addition to state and local tax returns as required. A fund's federal income tax returns are subject to examination by the Internal Revenue Service (IRS) for a period of three fiscal years after they are filed. State and local tax returns may be subject to examination for an additional fiscal year depending on the jurisdiction. Foreign taxes are provided for based on the Fund's understanding of the tax rules and rates that exist in the foreign markets in which it invests.
Distributions are declared and recorded on the ex-dividend date. Income dividends and capital gain distributions are declared separately for each class. Income and capital gain distributions are determined in accordance with income tax regulations, which may differ from GAAP.
Capital accounts within the financial statements are adjusted for permanent book-tax differences. These adjustments have no impact on net assets or the results of operations. Temporary book-tax differences will reverse in a subsequent period.
Book-tax differences are primarily due to the foreign currency transactions, passive foreign investment companies (PFIC), deferred trustees compensation, capital loss carryfowards and losses deferred due to wash sales.
The federal tax cost of investment securities and unrealized appreciation (depreciation) as of period end were as follows:
Gross unrealized appreciation | $ 13,646,950 |
Gross unrealized depreciation | (95,986,881) |
Net unrealized appreciation (depreciation) on securities and other investments | $ (82,339,931) |
| |
Tax Cost | $ 467,856,023 |
Annual Report
3. Significant Accounting Policies - continued
Income Tax Information and Distributions to Shareholders - continued
The tax-based components of distributable earnings as of period end were as follows:
Undistributed ordinary income | $ 8,180,595 |
Capital loss carryforward | $ (211,289,523) |
Net unrealized appreciation (depreciation) | $ (82,431,582) |
Capital loss carryforwards are only available to offset future capital gains of the Fund to the extent provided by regulations and may be limited. Under the Regulated Investment Company Modernization Act of 2010 (the Act), the Fund is permitted to carry forward capital losses incurred in taxable years beginning after December 22, 2010 for an unlimited period and such capital losses are required to be used prior to any losses that expire. Capital loss carryforwards were as follows:
Fiscal year of expiration | |
2016 | $ (7,195,987) |
2017 | (66,780,238) |
2018 | (26,887,863) |
2019 | (98,806,037) |
Total with expiration | (199,670,125) |
No expiration | |
Short-term | (2,193,630) |
Long-term | (9,425,768) |
Total no expiration | (11,619,398) |
Total capital loss carryforward | $ (211,289,523) |
At October 31, 2011, the Fund reported a total capital loss carryforward amount of $523,526,201. As a result of large redemptions in December 2010, the Fund had an "ownership change" under the Internal Revenue Code, which limits capital losses that would be available to offset future gains to $18,885,324 per year, including adjustments for certain gains and losses in the Fund existing at the time of the ownership change. The impact of this ownership change to the total capital loss carryforward amount reported at October 31, 2011 was not properly reflected in the Fund's financial statements. As a result, an adjustment of $323,400,279 was made between Accumulated Undistributed Net Realized Loss and Paid In Capital in the current period to reflect the amount of losses that will expire unused resulting from the ownership change. This adjustment was not considered material to the financial statements of the Fund.
In addition, the Fund acquired $25,965,572 of capital loss carryforwards from the Fidelity Advisor Japan Fund when it merged with that fund on December 17, 2010. Under the Internal Revenue Code, the losses acquired from the Fidelity Advisor Japan Fund that will be available to offset future capital gains of the Fund will be limited. As a result, at least $17,152,282 of the losses acquired from Fidelity Advisor Japan Fund will expire unused.
The total capital loss carryforward amounts reported in the table above reflect the deduction of amounts relating to the ownership change and merger that are expected to expire unused.
The tax character of distributions paid was as follows:
| October 31, 2012 | October 31, 2011 |
Ordinary Income | $ 10,259,692 | $ 20,255,739 |
Short-Term Trading (Redemption) Fees. Shares purchased by investors and held in the Fund less than 90 days are subject to a redemption fee equal to 1.50% of the net asset value of shares redeemed. All redemption fees, which reduce the proceeds of the shareholder redemption, are retained by the Fund and accounted for as an addition to paid in capital.
New Accounting Pronouncement. In December 2011, the Financial Accounting Standards Board issued Accounting Standard Update No. 2011-11, Disclosures about Offsetting Assets and Liabilities. The update creates new disclosure requirements requiring entities to disclose both gross and net information for derivatives and other financial instruments that are either offset in the Statement of Assets and Liabilities or subject to an enforceable master netting arrangement or similar agreement. The disclosure requirements are effective for annual reporting periods beginning on or after January 1, 2013, and interim periods within those annual periods. Management is currently evaluating the impact of the update's adoption on the Fund's financial statement disclosures.
4. Purchases and Sales of Investments.
Purchases and sales of securities, other than short sales and short-term securities, aggregated $221,392,251 and $306,262,922, respectively.
Annual Report
Notes to Financial Statements - continued
5. Fees and Other Transactions with Affiliates.
Management Fee. FMR and its affiliates provide the Fund with investment management related services for which the Fund pays a monthly management fee. The management fee is the sum of an individual fund fee rate that is based on an annual rate of .45% of the Fund's average net assets and an annualized group fee rate that averaged .26% during the period. The group fee rate is based upon the average net assets of all the mutual funds advised by FMR. The group fee rate decreases as assets under management increase and increases as assets under management decrease. In addition, the management fee is subject to a performance adjustment (up to a maximum of ± .20% of the Fund's average net assets over a 36 month performance period). The upward or downward adjustment to the management fee is based on the relative investment performance of Japan as compared to an appropriate benchmark index. For the period, the total annual management fee rate, including the performance adjustment, was .77% of the Fund's average net assets.
Distribution and Service Plan Fees. In accordance with Rule 12b-1 of the 1940 Act, the Fund has adopted separate Distribution and Service Plans for each class of shares. Certain classes pay Fidelity Distributors Corporation (FDC), an affiliate of FMR, separate Distribution and Service Fees, each of which is based on an annual percentage of each class' average net assets. In addition, FDC may pay financial intermediaries for selling shares of the Fund and providing shareholder support services. For the period, the Distribution and Service Fee rates, total fees and amounts retained by FDC were as follows:
| Distribution
Fee | Service
Fee | Total Fees | Retained
by FDC |
Class A | -% | .25% | $ 29,171 | $ 772 |
Class T | .25% | .25% | 21,850 | 83 |
Class B | .75% | .25% | 12,679 | 9,525 |
Class C | .75% | .25% | 79,302 | 21,124 |
| | | $ 143,002 | $ 31,504 |
Sales Load. FDC may receive a front-end sales charge of up to 5.75% for selling Class A shares and 3.50% for selling Class T shares, some of which is paid to financial intermediaries for selling shares of the Fund. Depending on the holding period, FDC may receive contingent deferred sales charges levied on Class A, Class T, Class B, and Class C redemptions. The deferred sales charges range from 5.00% to 1.00% for Class B shares, 1.00% for Class C shares, 1.00% for certain purchases of Class A shares and .25% for certain purchases of Class T shares.
For the period, sales charge amounts retained by FDC were as follows:
| Retained
by FDC |
Class A | $ 2,962 |
Class T | 1,060 |
Class B* | 1,711 |
Class C* | 2,026 |
| $ 7,759 |
* When Class B and Class C shares are initially sold, FDC pays commissions from its own resources to financial intermediaries through which the sales are made.
Transfer Agent Fees. Fidelity Investments Institutional Operations Company, Inc. (FIIOC), an affiliate of FMR, is the transfer, dividend disbursing and shareholder servicing agent for each class of the Fund. FIIOC receives account fees and asset-based fees that vary according to the account size and type of account. FIIOC pays for typesetting, printing and mailing of shareholder reports, except proxy statements. For the period, transfer agent fees for each class were as follows:
| Amount | % of
Average
Net Assets |
Class A | $ 35,249 | .30 |
Class T | 14,791 | .34 |
Class B | 3,843 | .30 |
Class C | 22,142 | .28 |
Japan | 920,315 | .22 |
Institutional Class | 3,138 | .16 |
| $ 999,478 | |
Accounting and Security Lending Fees. Fidelity Service Company, Inc. (FSC), an affiliate of FMR, maintains the Fund's accounting records. The accounting fee is based on the level of average net assets for each month. Under a separate contract, FSC administers the security lending program. The security lending fee is based on the number and duration of lending transactions.
Annual Report
6. Committed Line of Credit.
The Fund participates with other funds managed by FMR or an affiliate in a $4.25 billion credit facility (the "line of credit") to be utilized for temporary or emergency purposes to fund shareholder redemptions or for other short-term liquidity purposes. The Fund has agreed to pay commitment fees on its pro-rata portion of the line of credit, which amounted to $1,244 and is reflected in Miscellaneous expenses on the Statement of Operations. During the period, there were no borrowings on this line of credit.
7. Security Lending.
The Fund lends portfolio securities through a lending agent from time to time in order to earn additional income. For equity securities, a lending agent is used and may loan securities to certain qualified borrowers, including Fidelity Capital Markets (FCM), a broker-dealer affiliated with the Fund. On the settlement date of the loan, the Fund receives collateral (in the form of U.S. Treasury obligations, letters of credit and/or cash) against the loaned securities and maintains collateral in an amount not less than 100% of the market value of the loaned securities during the period of the loan. The market value of the loaned securities is determined at the close of business of the Fund and any additional required collateral is delivered to the Fund on the next business day. If the borrower defaults on its obligation to return the securities loaned because of insolvency or other reasons, a fund could experience delays and costs in recovering the securities loaned or in gaining access to the collateral. Any cash collateral received is invested in Fidelity Securities Lending Cash Central Fund. The value of loaned securities and cash collateral at period end are disclosed on the Fund's Statement of Assets and Liabilities. Security lending income represents the income earned on investing cash collateral, less rebates paid to borrowers and any lending agent fees associated with the loan, plus any premium payments received for lending certain types of securities. Security lending income is presented in the Statement of Operations as a component of income from Fidelity Central Funds. Total security lending income during the period amounted to $57,669. During the period, there were no securities loaned to FCM.
8. Expense Reductions.
FMR voluntarily agreed to reimburse each class to the extent annual operating expenses exceeded certain levels of average net assets as noted in the table below. Some expenses, for example interest expense, including commitment fees, are excluded from this reimbursement.
The following classes were in reimbursement during the period:
| Expense
Limitations | Reimbursement
from adviser |
Class A | 1.45% | $ 4,359 |
Class T | 1.70% | 1,853 |
Class B | 2.20% | 481 |
Class C | 2.20% | 2,553 |
Japan | 1.20% | 97,123 |
Institutional Class | 1.20% | 460 |
| | $ 106,829 |
Effective January 1, 2012 the expense limitations were discontinued.
Many of the brokers with whom FMR places trades on behalf of the Fund provided services in addition to trade execution. These services included payments of certain expenses on behalf of the Fund totaling $87,577 for the period.
9. Distributions to Shareholders.
Distributions to shareholders of each class were as follows:
Years ended October 31, | 2012 | 2011 A, B |
From net investment income | | |
Class A | $ 168,535 | $ - |
Class T | 50,833 | - |
Class B | 6,144 | - |
Class C | 52,214 | - |
Japan | 7,354,386 | 9,544,936 |
Class F | - | 204,046 |
Institutional Class | 56,675 | - |
Total | $ 7,688,787 | $ 9,748,982 |
Annual Report
Notes to Financial Statements - continued
9. Distributions to Shareholders - continued
Years ended October 31, | 2012 | 2011 A, B |
From net realized gain | | |
Class A | $ 69,007 | $ - |
Class T | 24,703 | - |
Class B | 7,792 | - |
Class C | 46,858 | - |
Japan | 2,405,209 | 10,328,111 |
Class F | - | 178,646 |
Institutional Class | 17,336 | - |
Total | $ 2,570,905 | $ 10,506,757 |
A Distributions for Class A, Class T, Class B, Class C and Institutional Class are for the period December 14, 2010 (commencement of sale of shares) to October 31, 2011.
B All Class F shares were redeemed on December 15, 2010.
10. Share Transactions.
Transactions for each class of shares were as follows:
| Shares | Dollars |
Years ended October 31, | 2012 | 2011 A, B | 2012 | 2011 A, B |
Class A | | | | |
Shares sold | 272,417 | 902,250 | $ 2,571,605 | $ 9,266,531 |
Issued in exchange for shares of Fidelity Advisor Japan Fund | - | 1,458,691 | - | 15,812,213 |
Reinvestment of distributions | 22,132 | - | 206,271 | - |
Shares redeemed | (659,149) | (975,882) | (6,253,228) | (10,202,627) |
Net increase (decrease) | (364,600) | 1,385,059 | $ (3,475,352) | $ 14,876,117 |
Class T | | | | |
Shares sold | 61,409 | 132,383 | $ 587,072 | $ 1,384,063 |
Issued in exchange for shares of Fidelity Advisor Japan Fund | - | 487,882 | - | 5,288,638 |
Reinvestment of distributions | 7,853 | - | 73,111 | - |
Shares redeemed | (133,261) | (132,194) | (1,264,265) | (1,415,637) |
Net increase (decrease) | (63,999) | 488,071 | $ (604,082) | $ 5,257,064 |
Class B | | | | |
Shares sold | 6,716 | 15,198 | $ 66,720 | $ 161,868 |
Issued in exchange for shares of Fidelity Advisor Japan Fund | - | 224,548 | - | 2,434,105 |
Reinvestment of distributions | 1,058 | - | 9,881 | - |
Shares redeemed | (52,372) | (85,826) | (495,118) | (926,239) |
Net increase (decrease) | (44,598) | 153,920 | $ (418,517) | $ 1,669,734 |
Class C | | | | |
Shares sold | 108,642 | 711,218 | $ 1,051,805 | $ 7,424,606 |
Issued in exchange for shares of Fidelity Advisor Japan Fund | - | 857,308 | - | 9,293,223 |
Reinvestment of distributions | 7,654 | - | 71,333 | - |
Shares redeemed | (280,979) | (645,053) | (2,637,126) | (6,643,542) |
Net increase (decrease) | (164,683) | 923,473 | $ (1,513,988) | $ 10,074,287 |
Japan | | | | |
Shares sold | 2,737,496 | 16,755,813 | $ 26,290,775 | $ 180,371,996 |
Reinvestment of distributions | 1,014,920 | 1,718,167 | 9,459,053 | 18,229,748 |
Shares redeemed | (12,951,522) | (32,842,865) | (122,521,103) | (351,598,189) |
Net increase (decrease) | (9,199,106) | (14,368,885) | $ (86,771,275) | $ (152,996,445) |
Class F | | | | |
Shares sold | - | 346,757 | $ - | $ 3,766,116 |
Reinvestment of distributions | - | 36,103 | - | 382,692 |
Shares redeemed | - | (3,617,960) | - | (39,396,699) |
Net increase (decrease) | - | (3,235,100) | $ - | $ (35,247,891) |
Annual Report
10. Share Transactions - continued
| Shares | Dollars |
Years ended October 31, | 2012 | 2011 A, B | 2012 | 2011 A, B |
Institutional Class | | | | |
Shares sold | 238,239 | 324,072 | $ 2,250,127 | $ 3,355,850 |
Issued in exchange for shares of Fidelity Advisor Japan Fund | - | 420,228 | - | 4,555,276 |
Reinvestment of distributions | 6,735 | - | 62,700 | - |
Shares redeemed | (369,198) | (460,581) | (3,505,242) | (4,809,911) |
Net increase (decrease) | (124,224) | 283,719 | $ (1,192,415) | $ 3,101,215 |
A Share transactions for Class A, Class T, Class B, Class C and Institutional Class are for the period December 14, 2010 (commencement of sale of shares) to October 31, 2011.
B All Class F shares were redeemed on December 15, 2010.
11. Other.
The Fund's organizational documents provide former and current trustees and officers with a limited indemnification against liabilities arising in connection with the performance of their duties to the Fund. In the normal course of business, the Fund may also enter into contracts that provide general indemnifications. The Fund's maximum exposure under these arrangements is unknown as this would be dependent on future claims that may be made against the Fund. The risk of material loss from such claims is considered remote.
At the end of the period, Strategic Advisors International Fund was the owner of record of approximately 40% of the total outstanding shares of the Fund. Mutual funds managed by Strategic Advisors, Inc., an affiliate of FMR, were the owners of record, in the aggregate, of approximately 46% of the total outstanding shares of the Fund.
12. Merger Information.
On December 17, 2010, the Fund acquired all of the assets and assumed all of the liabilities of the Fidelity Advisor Japan Fund ("Target Fund") pursuant to an agreement and plan of reorganization approved by the Board of Trustees ("The Board") on July 14, 2010. The reorganization provides shareholders of the Target Fund access to a larger portfolio with the same investment objective and lower expenses. The acquisition was accomplished by an exchange of 1,458,691 Class A shares, 487,882 Class T shares, 224,548 Class B shares, 857,308 Class C shares, and 420,228 Institutional Class shares of the Fund, respectively, for 1,347,662 Class A shares, 458,320 Class T shares, 220,839 Class B shares, 837,651 Class C shares, and 377,690 Institutional Class shares then outstanding (valued at $11.73, $11.54, $11.02, $11.09 and $12.06 per share for Class A, Class T, Class B, Class C, and Institutional Class, respectively) of the Target Fund. The reorganization qualified as a tax-free reorganization for federal income tax purposes with no gain or loss recognized to the funds or their shareholders. The Target Fund's net assets, including securities of $37,429,891 unrealized depreciation of $(2,434,247), cash of $6,456 and net other liabilities of $(52,892), were combined with the Fund's net assets of $515,046,445 for total net assets after the acquisition of $552,429,900.
Pro forma results of operations of the combined entity for the entire period ended October 31, 2011, as though the acquisition had occurred as of the beginning of the year (rather than on the actual acquisition date), are as follows:
Net investment income (loss) | $ 7,426,258 |
Total net realized gain (loss) | (68,640,546) |
Total change in net unrealized appreciation (depreciation) | 34,276,793 |
Net increase (decrease) in net assets resulting from operations | $ (26,937,495) |
Because the combined investment portfolios have been managed as a single portfolio since the acquisition was completed, it is not practicable to separate the amounts of revenue and earnings of the acquired fund that have been included in the Fund's accompanying Statement of Operations since December 17, 2010.
Annual Report
Report of Independent Registered Public Accounting Firm
To the Trustees of Fidelity Investment Trust and the Shareholders of Fidelity Japan Fund:
In our opinion, the accompanying statement of assets and liabilities, including the schedule of investments, and the related statements of operations and of changes in net assets and the financial highlights present fairly, in all material respects, the financial position of Fidelity Japan Fund (a fund of Fidelity Investment Trust) at October 31, 2012, the results of its operations for the year then ended, the changes in its net assets for each of the two years in the period then ended and the financial highlights for each of the periods indicated, in conformity with accounting principles generally accepted in the United States of America. These financial statements and financial highlights (hereafter referred to as "financial statements") are the responsibility of the Fidelity Japan Fund's management. Our responsibility is to express an opinion on these financial statements based on our audits. We conducted our audits of these financial statements in accordance with the standards of the Public Company Accounting Oversight Board (United States). Those standards require that we plan and perform the audit to obtain reasonable assurance about whether the financial statements are free of material misstatement. An audit includes examining, on a test basis, evidence supporting the amounts and disclosures in the financial statements, assessing the accounting principles used and significant estimates made by management, and evaluating the overall financial statement presentation. We believe that our audits, which included confirmation of securities at October 31, 2012 by correspondence with the custodian and brokers, provide a reasonable basis for our opinion.
PricewaterhouseCoopers LLP
Boston, Massachusetts
December 18, 2012
Annual Report
The Trustees, Members of the Advisory Board, and executive officers of the trust and fund, as applicable, are listed below. The Board of Trustees governs the fund and is responsible for protecting the interests of shareholders. The Trustees are experienced executives who meet periodically throughout the year to oversee the fund's activities, review contractual arrangements with companies that provide services to the fund, oversee management of the risks associated with such activities and contractual arrangements, and review the fund's performance. Except for James C. Curvey, each of the Trustees oversees 236 funds advised by FMR or an affiliate. Mr. Curvey oversees 443 funds advised by FMR or an affiliate.
The Trustees hold office without limit in time except that (a) any Trustee may resign; (b) any Trustee may be removed by written instrument, signed by at least two-thirds of the number of Trustees prior to such removal; (c) any Trustee who requests to be retired or who has become incapacitated by illness or injury may be retired by written instrument signed by a majority of the other Trustees; and (d) any Trustee may be removed at any special meeting of shareholders by a two-thirds vote of the outstanding voting securities of the trust. Each Trustee who is not an interested person (as defined in the 1940 Act) (Independent Trustee), shall retire not later than the last day of the calendar year in which his or her 75th birthday occurs. The Independent Trustees may waive this mandatory retirement age policy with respect to individual Trustees. The executive officers and Advisory Board Members hold office without limit in time, except that any officer and Advisory Board Member may resign or may be removed by a vote of a majority of the Trustees at any regular meeting or any special meeting of the Trustees. Except as indicated, each individual has held the office shown or other offices in the same company for the past five years.
Experience, Skills, Attributes, and Qualifications of the Fund's Trustees. The Governance and Nominating Committee has adopted a statement of policy that describes the experience, qualifications, attributes, and skills that are necessary and desirable for potential Independent Trustee candidates (Statement of Policy). The Board believes that each Trustee satisfied at the time he or she was initially elected or appointed a Trustee, and continues to satisfy, the standards contemplated by the Statement of Policy. The Governance and Nominating Committee also engages professional search firms to help identify potential Independent Trustee candidates who have the experience, qualifications, attributes, and skills consistent with the Statement of Policy. From time to time, additional criteria based on the composition and skills of the current Independent Trustees, as well as experience or skills that may be appropriate in light of future changes to board composition, business conditions, and regulatory or other developments, have also been considered by the professional search firms and the Governance and Nominating Committee. In addition, the Board takes into account the Trustees' commitment and participation in Board and committee meetings, as well as their leadership of standing and ad hoc committees throughout their tenure.
In determining that a particular Trustee was and continues to be qualified to serve as a Trustee, the Board has considered a variety of criteria, none of which, in isolation, was controlling. The Board believes that, collectively, the Trustees have balanced and diverse experience, qualifications, attributes, and skills, which allow the Board to operate effectively in governing the fund and protecting the interests of shareholders. Information about the specific experience, skills, attributes, and qualifications of each Trustee, which in each case led to the Board's conclusion that the Trustee should serve (or continue to serve) as a trustee of the fund, is provided below.
Board Structure and Oversight Function. James C. Curvey is an interested person (as defined in the 1940 Act) and currently serves as Chairman. The Trustees have determined that an interested Chairman is appropriate and benefits shareholders because an interested Chairman has a personal and professional stake in the quality and continuity of services provided to the fund. Independent Trustees exercise their informed business judgment to appoint an individual of their choosing to serve as Chairman, regardless of whether the Trustee happens to be independent or a member of management. The Independent Trustees have determined that they can act independently and effectively without having an Independent Trustee serve as Chairman and that a key structural component for assuring that they are in a position to do so is for the Independent Trustees to constitute a substantial majority for the Board. The Independent Trustees also regularly meet in executive session. Ned C. Lautenbach serves as Chairman of the Independent Trustees and as such (i) acts as a liaison between the Independent Trustees and management with respect to matters important to the Independent Trustees and (ii) with management prepares agendas for Board meetings.
Fidelity funds are overseen by different Boards of Trustees. The fund's Board oversees Fidelity's equity and high income funds and another Board oversees Fidelity's investment-grade bond, money market, and asset allocation funds. The asset allocation funds may invest in Fidelity funds overseen by the fund's Board. The use of separate Boards, each with its own committee structure, allows the Trustees of each group of Fidelity funds to focus on the unique issues of the funds they oversee, including common research, investment, and operational issues. On occasion, the separate Boards establish joint committees to address issues of overlapping consequences for the Fidelity funds overseen by each Board.
The Trustees operate using a system of committees to facilitate the timely and efficient consideration of all matters of importance to the Trustees, the fund, and fund shareholders and to facilitate compliance with legal and regulatory requirements and oversight of the fund's activities and associated risks. The Board, acting through its committees, has charged FMR and its affiliates with (i) identifying events or circumstances the occurrence of which could have demonstrably adverse effects on the fund's business and/or reputation; (ii) implementing processes and controls to lessen the possibility that such events or circumstances occur or to mitigate the effects of such events or circumstances if they do occur; and (iii) creating and maintaining a system designed to evaluate continuously business and market conditions in order to facilitate the identification and implementation processes described in (i) and (ii) above. Because the day-to-day operations and activities of the fund are carried out by or through FMR, its affiliates and other service providers, the fund's exposure to risks is mitigated but not eliminated by the processes overseen by the Trustees. While each of the Board's committees has responsibility for overseeing different aspects of the fund's activities, oversight is exercised primarily through the Operations, Audit, and Compliance Committees. In addition, the Independent Trustees have worked with FMR to enhance the Board's oversight of investment and financial risks, legal and regulatory risks, technology risks, and operational risks, including the development of additional risk reporting to the Board. For example, a working group comprised of Independent Trustees and FMR has worked and continues to work to review the Fidelity funds' valuation-related activities, reporting and risk management. Appropriate personnel, including but not limited to the fund's Chief Compliance Officer (CCO), FMR's internal auditor, the independent accountants, the fund's Treasurer and portfolio management personnel, make periodic reports to the Board's committees, as appropriate, including an annual review of FMR's risk management program for the Fidelity funds. The responsibilities of each standing committee, including their oversight responsibilities, are described further under "Standing Committees of the Fund's Trustees."
Annual Report
Trustees and Officers - continued
The fund's Statement of Additional Information (SAI) includes more information about the Trustees. To request a free copy, call Fidelity at 1-877-208-0098.
Interested Trustees*:
Correspondence intended for each Trustee who is an interested person may be sent to Fidelity Investments, 82 Devonshire Street, Boston, Massachusetts 02109.
Name, Age; Principal Occupations and Other Relevant Experience+ |
James C. Curvey (77) |
| Year of Election or Appointment: 2007 Mr. Curvey is Trustee and Chairman of the Board of Trustees of certain Trusts. Mr. Curvey also serves as Trustee (2007-present) of other investment companies advised by FMR. Mr. Curvey is a Director of Fidelity Investments Money Management, Inc. (2009-present), Director of Fidelity Research & Analysis Co. (2009-present) and Director of FMR and FMR Co., Inc. (2007-present). Mr. Curvey is also Vice Chairman (2007-present) and Director of FMR LLC. In addition, Mr. Curvey serves as an Overseer for the Boston Symphony Orchestra and a member of the Trustees of Villanova University. Previously, Mr. Curvey was the Vice Chairman (2006-2007) and Director (2000-2007) of FMR Corp. |
Ronald P. O'Hanley (55) |
| Year of Election or Appointment: 2011 Mr. O'Hanley is Director of FMR Co., Inc. (2010-present), Director of Fidelity Investments Money Management, Inc. (2010-present), Director of Fidelity Research & Analysis Company (2010-present), President of Fidelity Asset Management and Corporate Services and a member of Fidelity's Executive Committee (2010-present). Previously, Mr. O'Hanley served as President and Chief Executive Officer of BNY Mellon Asset Management (2007-2010). Mr. O'Hanley also served as Vice Chairman of Bank New York Mellon Corp. and a member of that firm's Executive Committee. Prior to the 2007 merger of The Bank of New York and Mellon Financial Corporation, he was Vice Chairman of Mellon Financial Corporation and President and Chief Executive Officer of Mellon Asset Management. He joined Mellon in February 1997. Mr. O'Hanley currently serves as Chairman of the Boston Public Library Foundation Board of Directors and sits on the Board of Directors of Beth Israel Deaconess Medical Center, the Board of Trustees of the Marine Biological Laboratory and the Advisory Board of the Maxwell School of Citizenship and Public Administration at Syracuse University. Mr. O'Hanley also chairs the Council on Asset Management for the Financial Services Roundtable and is a member of the Board of Directors of Institutional Investor's U.S. Institute. |
* Trustees have been determined to be "Interested Trustees" by virtue of, among other things, their affiliation with the trust or various entities under common control with FMR.
+ The information above includes each Trustee's principal occupation during the last five years and other information relating to the experience, attributes, and skills relevant to each Trustee's qualifications to serve as a Trustee, which led to the conclusion that each Trustee should serve as a Trustee for the fund.
Independent Trustees:
Correspondence intended for each Independent Trustee (that is, the Trustees other than the Interested Trustees) may be sent to Fidelity Investments, P.O. Box 55235, Boston, Massachusetts 02205-5235.
Name, Age; Principal Occupations and Other Relevant Experience+ |
Dennis J. Dirks (64) |
| Year of Election or Appointment: 2005 Prior to his retirement in May 2003, Mr. Dirks was Chief Operating Officer and a member of the Board of The Depository Trust & Clearing Corporation (DTCC). He also served as President, Chief Operating Officer, and Board member of The Depository Trust Company (DTC) and President and Board member of the National Securities Clearing Corporation (NSCC). In addition, Mr. Dirks served as Chief Executive Officer and Board member of the Government Securities Clearing Corporation, Chief Executive Officer and Board member of the Mortgage-Backed Securities Clearing Corporation, as a Trustee and a member of the Finance Committee of Manhattan College (2005-2008), and as a Trustee and a member of the Finance Committee of AHRC of Nassau County (2006-2008). Mr. Dirks is a member of the Independent Directors Council (IDC) Governing Council (2010-present) and Board of Directors for The Brookville Center for Children's Services, Inc. (2009-present). |
Alan J. Lacy (59) |
| Year of Election or Appointment: 2008 Mr. Lacy serves as Senior Adviser (2007-present) of Oak Hill Capital Partners, L.P. (private equity). Mr. Lacy also served as Chief Executive Officer (2000-2005) and Vice Chairman (2005-2006) of Sears Holdings Corporation and Sears, Roebuck and Co. (retail). In addition, Mr. Lacy serves as a member of the Board of Directors of Dave & Buster's Entertainment, Inc. (restaurant and entertainment complexes, 2010-present), Earth Fare, Inc. (retail grocery, 2012-present), The Hillman Companies, Inc. (hardware wholesalers, 2010-present), and Bristol-Myers Squibb Company (global pharmaceuticals, 2008-present). Mr. Lacy is a member of the Board of Trustees of The National Parks Conservation Association (2006-present). Previously, Mr. Lacy served as Chairman of the Board of Trustees of the National Parks Conservation Association (2008-2011) and as a member of the Board of Directors for the Western Union Company (global money transfer, 2006-2011). |
Ned C. Lautenbach (68) |
| Year of Election or Appointment: 2000 Mr. Lautenbach is Chairman of the Independent Trustees of the Equity and High Income Funds (2006-present). Mr. Lautenbach currently serves as the Lead Director of the Eaton Corporation Board of Directors (diversified industrial, 1997-present). Mr. Lautenbach is Chairman of the Board of Directors of the Philharmonic Center for the Arts in Naples, Florida (2012-present) and a member of the Council on Foreign Relations (1994-present). Previously, Mr. Lautenbach was a Partner/Advisory Partner at Clayton, Dubilier & Rice, LLC (private equity investment, 1998-2010), as well as a Director of Sony Corporation (2006-2007). |
Joseph Mauriello (68) |
| Year of Election or Appointment: 2008 Prior to his retirement in January 2006, Mr. Mauriello served in numerous senior management positions including Deputy Chairman and Chief Operating Officer (2004-2005), and Vice Chairman of Financial Services (2002-2004) of KPMG LLP US (professional services, 1965-2005). Mr. Mauriello currently serves as a member of the Board of Directors of XL Group plc. (global insurance and re-insurance, 2006-present). Previously, Mr. Mauriello served as a Director of the Hamilton Funds of the Bank of New York (2006-2007) and of Arcadia Resources Inc. (health care services and products, 2007-2012). |
Robert W. Selander (62) |
| Year of Election or Appointment: 2011 Previously, Mr. Selander served as a Member of the Advisory Board of Fidelity's Equity and High Income Funds (2011), Executive Vice Chairman (2010), Chief Executive Officer (2009-2010), and President and Chief Executive Officer (1997-2009) of Mastercard, Inc. |
Cornelia M. Small (68) |
| Year of Election or Appointment: 2005 Ms. Small is a member of the Board of Directors (2009-present) and Chair of the Investment Committee (2010-present) of the Teagle Foundation. Ms. Small also serves on the Investment Committee of the Berkshire Taconic Community Foundation (2008-present). Previously, Ms. Small served as Chairperson (2002-2008) and a member of the Investment Committee and Chairperson (2008-2012) and a member of the Board of Trustees of Smith College. In addition, Ms. Small served as Chief Investment Officer, Director of Global Equity Investments, and a member of the Board of Directors of Scudder, Stevens & Clark and Scudder Kemper Investments. |
William S. Stavropoulos (73) |
| Year of Election or Appointment: 2001 Mr. Stavropoulos is Vice Chairman of the Independent Trustees of the Equity and High Income Funds (2006-present). Mr. Stavropoulos serves as President and Founder of the Michigan Baseball Foundation, the Great Lakes Loons (2007-present). Mr. Stavropoulos is Chairman Emeritus of the Board of Directors of The Dow Chemical Company, where he previously served in numerous senior management positions, including President, CEO (1995-2000; 2002-2004), Chairman of the Executive Committee (2000-2006), and as a member of the Board of Directors (1990-2006). Currently, Mr. Stavropoulos is a Director of Univar Inc. (global distributor of commodity and specialty chemicals, Chairman from 2010-May 2012 and Lead Director from May 2012-present), Teradata Corporation (data warehousing and technology solutions, 2008-present), Maersk Inc. (industrial conglomerate), and Tyco International, Ltd. (multinational manufacturing and services, 2007-present), and a member of the Advisory Board for Metalmark Capital LLC (private equity investment, 2005-present). Mr. Stavropoulos is an operating advisor to Clayton, Dubilier & Rice, LLC (private equity investment). In addition, Mr. Stavropoulos is a member of the University of Notre Dame Advisory Council for the College of Science, a Trustee of the Rollin L. Gerstacker Foundation, and a Director of the Naples Philharmonic Center for the Arts. Previously, Mr. Stavropoulos served as a Director of Chemical Financial Corporation (bank holding company, 1993-2012). |
David M. Thomas (63) |
| Year of Election or Appointment: 2008 Previously, Mr. Thomas served as Executive Chairman (2005-2006) and Chairman and Chief Executive Officer (2000-2005) of IMS Health, Inc. (pharmaceutical and healthcare information solutions), and a Director of Fortune Brands, Inc. (consumer products, 2000-2011). In addition, Mr. Thomas serves as Non-Executive Chairman of the Board of Directors of Fortune Brands Home and Security (home and security products, 2011-present), and as a member of the Board of Directors of Interpublic Group of Companies, Inc. (marketing communication, 2004-present). |
Michael E. Wiley (62) |
| Year of Election or Appointment: 2008 Mr. Wiley also serves as a Director of Asia Pacific Exploration Consolidated (international oil and gas exploration and production, 2008-present). Mr. Wiley serves as a Director of Tesoro Corporation (independent oil refiner and marketer, 2005-present), and a Director of Bill Barrett Corporation (exploration and production, 2005-present). In addition, Mr. Wiley also serves as a Director of Post Oak Bank (privately-held bank, 2004-present). Previously, Mr. Wiley served as a member of the Board of Trustees of the University of Tulsa (2000-2006; 2007-2010), as a Senior Energy Advisor of Katzenbach Partners, LLC (consulting, 2006-2007), as an Advisory Director of Riverstone Holdings (private investment), Chairman, President, and CEO of Baker Hughes, Inc. (oilfield services, 2000-2004), and as Director of Spinnaker Exploration Company (exploration and production, 2001-2005). |
+ The information above includes each Trustee's principal occupation during the last five years and other information relating to the experience, attributes, and skills relevant to each Trustee's qualifications to serve as a Trustee, which led to the conclusion that each Trustee should serve as a Trustee for the fund.
Advisory Board Members and Executive Officers:
Correspondence intended for David A. Rosow and Garnett A. Smith may be sent to Fidelity Investments, P.O. Box 55235, Boston, Massachusetts 02205-5235. Correspondence intended for each executive officer, Edward C. Johnson 3d, and Peter S. Lynch may be sent to Fidelity Investments, 82 Devonshire Street, Boston, Massachusetts 02109.
Name, Age; Principal Occupation |
Edward C. Johnson 3d (82) |
| Year of Election or Appointment: 2011 Member of the Advisory Board of Fidelity's Equity and High Income Funds. Mr. Johnson serves as Chief Executive Officer, Chairman, and a Director of FMR LLC, and also serves as Chairman and Director of FIL Limited. Previously, Mr. Johnson served as a Trustee and Chairman of the Board of certain Fidelity Trusts, Chairman and a Director of FMR, Chairman and a Director of FMR Co., Inc., and President of FMR LLC (2006-2007). |
Peter S. Lynch (68) |
| Year of Election or Appointment: 2003 Member of the Advisory Board of Fidelity's Equity and High Income Funds. Mr. Lynch is Vice Chairman and a Director of FMR and FMR Co., Inc. In addition, Mr. Lynch serves as a Trustee of Boston College and as the Chairman of the Inner-City Scholarship Fund. Previously, Mr. Lynch served on the Special Olympics International Board of Directors (1997-2006). |
David A. Rosow (70) |
| Year of Election or Appointment: 2012 Member of the Advisory Board of Fidelity's Equity and High Income Funds. Chairman and Chief Executive Officer of International Golf Group, Inc. (golf course development, 1989-present). Previously, Mr. Rosow served as Chairman and Chief Executive Officer of Rosow & Company, Inc. (private investment company, 1989-2011), a Lead Director of Hudson United Bancorp (2001-2006) and as a Director of TD Banknorth (1996-2006). In addition, Mr. Rosow is a member (2008-present) and President (2009-present) of the Town Council of Palm Beach, Florida. |
Garnett A. Smith (65) |
| Year of Election or Appointment: 2012 Member of the Advisory Board of Fidelity's Equity and High Income Funds. Prior to Mr. Smith's retirement, he served as Chairman and Chief Executive Officer of Inbrand Corp. (manufacturer of personal absorbent products, 1990-1997). He also served as President (1986-1990) of Inbrand Corp. Prior to his employment with Inbrand Corp., he was employed by a retail fabric chain and North Carolina National Bank. In addition, Mr. Smith is a board member of the Jackson Hole Land Trust (2009-present). |
Kenneth B. Robins (43) |
| Year of Election or Appointment: 2008 President and Treasurer of Fidelity's Equity and High Income Funds. Mr. Robins also serves as President and Treasurer (2010-present) and Assistant Treasurer (2009-present) of other Fidelity funds and is an employee of Fidelity Investments (2004-present). Previously, Mr. Robins served as Deputy Treasurer of the Fidelity funds (2005-2008) and Treasurer and Chief Financial Officer of The North Carolina Capital Management Trust: Cash and Term Portfolios (2006-2008). |
Bruce T. Herring (47) |
| Year of Election or Appointment: 2006 Vice President of certain Equity Funds. Mr. Herring also serves as President of Fidelity Research & Analysis Company (2010-present), Chief Investment Officer and Director of Fidelity Management & Research (U.K.) Inc. (2010-present) and Group Chief Investment Officer of FMR. Previously, Mr. Herring served as Vice President (2005-2006) and Senior Vice President (2006-2007) of Fidelity Management & Research Company, Vice President of FMR Co., Inc. (2001-2007) and as a portfolio manager for Fidelity U.S. Equity Funds. |
Brian B. Hogan (48) |
| Year of Election or Appointment: 2009 Vice President of Equity and High Income Funds. Mr. Hogan also serves as President of FMR's Equity Division (2009-present). Previously, Mr. Hogan served as Senior Vice President, Equity Research of FMR (2006-2009) and as a portfolio manager. |
Scott C. Goebel (44) |
| Year of Election or Appointment: 2008 Secretary and Chief Legal Officer (CLO) of the Fidelity funds. Mr. Goebel also serves as Secretary of Fidelity Investments Money Management, Inc. (FIMM) (2010-present) and Fidelity Research and Analysis Company (FRAC) (2010-present); Secretary and CLO of The North Carolina Capital Management Trust: Cash and Term Portfolios (2008-present); General Counsel, Secretary, and Senior Vice President of FMR (2008-present) and FMR Co., Inc. (2008-present); employed by FMR LLC or an affiliate (2001-present); Chief Legal Officer of Fidelity Management & Research (Hong Kong) Limited (2008-present) and Assistant Secretary of Fidelity Management & Research (Japan) Inc. (2008-present), and Fidelity Management & Research (U.K.) Inc. (2008-present). Previously, Mr. Goebel served as Assistant Secretary of FIMM (2008-2010), FRAC (2008-2010), and the Funds (2007-2008) and as Vice President and Secretary of Fidelity Distributors Corporation (FDC) (2005-2007). |
William C. Coffey (43) |
| Year of Election or Appointment: 2009 Assistant Secretary of Fidelity's Equity and High Income Funds. Mr. Coffey also serves as Senior Vice President and Deputy General Counsel of FMR LLC (2010-present), and is an employee of Fidelity Investments. Previously, Mr. Coffey served as Vice President and Associate General Counsel of FMR LLC (2005-2009). |
Elizabeth Paige Baumann (44) |
| Year of Election or Appointment: 2012 Anti-Money Laundering (AML) Officer of the Fidelity funds. Ms. Baumann also serves as AML Officer of The North Carolina Capital Management Trust: Cash and Term Portfolios (2012-present), Chief AML Officer of FMR LLC (2012-present), and is an employee of Fidelity Investments. Previously, Ms. Baumann served as Vice President and Deputy Anti-Money Laundering Officer (2007-2012). |
Christine Reynolds (54) |
| Year of Election or Appointment: 2008 Chief Financial Officer of the Fidelity funds. Ms. Reynolds became President of Fidelity Pricing and Cash Management Services (FPCMS) in August 2008. Ms. Reynolds served as Chief Operating Officer of FPCMS (2007-2008). Previously, Ms. Reynolds served as President, Treasurer, and Anti-Money Laundering officer of the Fidelity funds (2004-2007). |
Joseph A. Hanlon (44) |
| Year of Election or Appointment: 2012 Chief Compliance Officer of Fidelity's Equity and High Income Funds. Mr. Hanlon serves as Compliance Officer of FMR, FMR Co., Inc., Fidelity Investments Money Management, Inc. (FIMM), Fidelity Research and Analysis Company (FRAC), Fidelity Management & Research (Japan) Inc., Fidelity Management & Research (U.K.) Inc., Fidelity Management & Research (Hong Kong), and Strategic Advisers, Inc. (2009-present), as Senior Vice President of the Fidelity Asset Management Division (2009-present), and is an employee of Fidelity Investments. |
Joseph F. Zambello (55) |
| Year of Election or Appointment: 2011 Deputy Treasurer of the Fidelity funds. Mr. Zambello is an employee of Fidelity Investments. Previously, Mr. Zambello served as Vice President of FMR's Program Management Group (2009-2011) and Vice President of the Transfer Agent Oversight Group (2005-2009). |
Adrien E. Deberghes (45) |
| Year of Election or Appointment: 2008 Deputy Treasurer of Fidelity's Equity and High Income Funds. Mr. Deberghes also serves as Vice President (2011-present) and Assistant Treasurer (2010-present) of other Fidelity funds, and is an employee of Fidelity Investments (2008-present). Previously, Mr. Deberghes served as Senior Vice President of Mutual Fund Administration at State Street Corporation (2007-2008), Senior Director of Mutual Fund Administration at Investors Bank & Trust (2005-2007), and Director of Finance for Dunkin' Brands (2000-2005). |
Stephen Sadoski (41) |
| Year of Election or Appointment: 2012 Deputy Treasurer of Fidelity's Equity and High Income Funds. Mr. Sadoski also serves as Assistant Treasurer of other Fidelity funds (2012-present) and is an employee of Fidelity Investments (2012-present). Previously, Mr. Sadoski served as an assistant chief accountant in the Division of Investment Management of the Securities and Exchange Commission (SEC) (2009-2012) and as a senior manager at Deloitte & Touche (1997-2009). |
Stephanie J. Dorsey (43) |
| Year of Election or Appointment: 2010 Assistant Treasurer of Fidelity's Equity and High Income Funds. Ms. Dorsey also serves as Deputy Treasurer of other Fidelity funds (2008-present) and is an employee of Fidelity Investments (2008-present). Previously, Ms. Dorsey served as Treasurer (2004-2008) of the JPMorgan Mutual Funds and Vice President (2004-2008) of JPMorgan Chase Bank. |
John R. Hebble (54) |
| Year of Election or Appointment: 2009 Assistant Treasurer of Fidelity's Equity and High Income Funds. Mr. Hebble also serves as President (2011-present), Treasurer, and Chief Financial Officer of The North Carolina Capital Management Trust: Cash and Term Portfolios (2008-present), President and Treasurer of other Fidelity funds (2008-present) and is an employee of Fidelity Investments. |
Gary W. Ryan (54) |
| Year of Election or Appointment: 2005 Assistant Treasurer of the Fidelity funds. Mr. Ryan is an employee of Fidelity Investments. Previously, Mr. Ryan served as Vice President of Fund Reporting in Fidelity Pricing and Cash Management Services (FPCMS) (1999-2005). |
Jonathan Davis (44) |
| Year of Election or Appointment: 2010 Assistant Treasurer of the Fidelity funds. Mr. Davis is also Assistant Treasurer of Fidelity Rutland Square Trust II and Fidelity Commonwealth Trust II. Mr. Davis is an employee of Fidelity Investments. Previously, Mr. Davis served as Vice President and Associate General Counsel of FMR LLC (2003-2010). |
Annual Report
The Board of Trustees of Fidelity Japan Fund voted to pay to shareholders of record at the opening of business on record date, the following distributions per share derived from capital gains realized from sales of portfolio securities, and dividends derived from net investment income:
| Pay Date | Record Date | Dividends | Capital Gains |
Institutional Class | 12/10/12 | 12/07/12 | $0.154 | $0.079 |
Institutional Class designates 100% of the dividends distributed on December 9, 2011 as amounts which may be taken into account as a dividend for the purposes of the maximum rate under section 1(h)(11) of the Internal Revenue Code.
The amounts per share which represent income derived from sources within, and taxes paid to, foreign countries or possessions of the United States are as follows:
| Pay Date | Income | Taxes |
Institutional Class | 12/12/2011 | $0.119 | $0.0181 |
The fund will notify shareholders in January 2013 of amounts for use in preparing 2012 income tax returns.
Annual Report
Board Approval of Investment Advisory Contracts and Management Fees
Fidelity Japan Fund
Each year, the Board of Trustees, including the Independent Trustees (together, the Board), votes on the renewal of the management contract and sub-advisory agreements (together, the Advisory Contracts) for the fund. The Board, assisted by the advice of fund counsel and Independent Trustees' counsel, requests and considers a broad range of information relevant to the renewal of the Advisory Contracts throughout the year.
The Board meets regularly and, at each of its meetings, considers factors that are relevant to its annual consideration of the renewal of the fund's Advisory Contracts, including the services and support provided to the fund and its shareholders. The Board has established various standing committees, each composed of and chaired by Independent Trustees with varying backgrounds, to which the Board has assigned specific subject matter responsibilities in order to enhance effective decision-making by the Board. The Board, acting directly and through its Committees, requests and receives information concerning the annual consideration of the renewal of the fund's Advisory Contracts. The Board also meets as needed to consider matters specifically related to the Board's annual consideration of the renewal of Advisory Contracts. Members of the Board may also meet with trustees of other Fidelity funds through ad hoc joint committees to discuss certain matters relevant to the Fidelity funds.
At its July 2012 meeting, the Board of Trustees, including the Independent Trustees, unanimously determined to renew the fund's Advisory Contracts. In reaching its determination, the Board considered all factors it believed relevant, including (i) the nature, extent, and quality of the services to be provided to the fund and its shareholders (including the investment performance of the fund); (ii) the competitiveness of the fund's management fee and total expense ratio relative to peer funds; (iii) the total costs of the services to be provided by and the profits to be realized by Fidelity from its relationship with the fund; (iv) the extent to which economies of scale exist and would be realized as the fund grows; and (v) whether fee levels reflect these economies of scale, if any, for the benefit of fund shareholders.
In considering whether to renew the Advisory Contracts for the fund, the Board reached a determination, with the assistance of fund counsel and Independent Trustees' counsel and through the exercise of its business judgment, that the renewal of the Advisory Contracts is in the best interests of the fund and its shareholders and that the compensation payable under the Advisory Contracts is fair and reasonable. The Board's decision to renew the Advisory Contracts was not based on any single factor, but rather was based on a comprehensive consideration of all the information provided to the Board at its meetings throughout the year. The Board, in reaching its determination to renew the Advisory Contracts, is aware that shareholders in the fund have a broad range of investment choices available to them, including a wide choice among mutual funds offered by Fidelity's competitors, and that the fund's shareholders, who have the opportunity to review and weigh the disclosure provided by the fund in its prospectus and other public disclosures, have chosen to invest in this fund, managed by Fidelity.
Nature, Extent, and Quality of Services Provided. The Board considered the staffing within the investment adviser, FMR, and the sub-advisers (together, the Investment Advisers), including the backgrounds of the fund's investment personnel, and also considered the fund's investment objective, strategies, and related investment philosophy. The Independent Trustees also had discussions with senior management of Fidelity's investment operations and investment groups. The Board considered the structure of the portfolio manager compensation program and whether this structure provides appropriate incentives to act in the best interests of the fund.
Resources Dedicated to Investment Management and Support Services. The Board and the Fund Oversight and Research Committees reviewed the general qualifications and capabilities of the Investment Advisers' investment staff, including its size, education, experience, and resources, as well as the Investment Advisers' approach to recruiting, training, managing, and compensating investment personnel. The Board also noted that FMR has continued to increase the resources devoted to non-U.S. offices, including expansion of Fidelity's global investment organization. The Board noted that Fidelity's analysts have extensive resources, tools and capabilities that allow them to conduct sophisticated quantitative and fundamental analysis, as well as credit analysis of issuers, counterparties and guarantors. The Board also believes that Fidelity's investment professionals have sufficient access to global information and data so as to provide competitive investment results over time, and that those professionals also have access to sophisticated tools that permit them to assess portfolio construction and risk and performance attribution characteristics continuously, as well as to transmit new information and research conclusions rapidly around the world. Additionally, in its deliberations, the Board considered the Investment Advisers' trading and risk management capabilities and resources, which are an integral part of the investment management process.
Shareholder and Administrative Services. The Board considered (i) the nature, extent, quality, and cost of advisory, administrative, and shareholder services performed by the Investment Advisers and their affiliates under the Advisory Contracts and under separate agreements covering transfer agency, pricing and bookkeeping, and securities lending services for the fund; (ii) the nature and extent of the supervision of third party service providers, principally custodians and subcustodians; and (iii) the resources devoted to, and the record of compliance with, the fund's compliance policies and procedures. The Board also reviewed the allocation of fund brokerage, including allocations to brokers affiliated with the Investment Advisers, the use of brokerage commissions to pay fund expenses, and the use of "soft" commission dollars to pay for research services.
The Board noted that the growth of fund assets over time across the complex allows Fidelity to reinvest in the development of services designed to enhance the value or convenience of the Fidelity funds as investment vehicles. These services include 24-hour access to account information and market information through telephone representatives and over the Internet, investor education materials and asset allocation tools, and the expanded availability of Fidelity Investor Centers.
Annual Report
Investment in a Large Fund Family. The Board considered the benefits to shareholders of investing in a Fidelity fund, including the benefits of investing in a fund that is part of a large family of funds offering a variety of investment disciplines and providing a large variety of mutual fund investor services. The Board noted that Fidelity had taken, or had made recommendations that resulted in the Fidelity funds taking, a number of actions over the previous year that benefited particular funds, including (i) continuing to dedicate additional resources to investment research and support of the senior management team that oversees asset management; (ii) persisting in efforts to enhance Fidelity's research capabilities, in particular, international research; (iii) launching new funds and making other enhancements to meet client needs for global and income-oriented solutions; (iv) continuing to launch dedicated lower cost underlying funds to meet investment management's portfolio construction needs related to expanding underlying fund options, specifically for the Freedom Fund product lines; (v) adopting a "Stock Selector" sector neutral investment approach and employing a team of portfolio managers who are sector specialists to manage certain funds; (vi) rationalizing product lines and gaining increased efficiencies through the mergers of several funds into other funds; (vii) strengthening the Spartan Index Fund product line by adding new funds and/or new low-cost institutional share classes, restructuring fund expenses to accommodate new classes, and reducing investment minimums for certain classes of shares; (viii) modifying the eligibility criteria for Institutional Class shares to increase their appeal to government entities and charitable investors; and (ix) reducing certain transfer agent fee rates.
Investment Performance. The Board considered whether the fund has operated in accordance with its investment objective, as well as its record of compliance with its investment restrictions. It also reviewed the fund's absolute investment performance for each class, as well as the fund's relative investment performance for each class measured over multiple periods against (i) a broad-based securities market index, and (ii) a peer group of mutual funds deemed appropriate by Fidelity and reviewed by the Board. The following charts considered by the Board show, over the one-, three-, and five-year periods ended December 31, 2011, as available, the cumulative total returns of the retail class and Class C of the fund, the cumulative total returns of a broad-based securities market index ("benchmark"), and a range of cumulative total returns of a peer group of mutual funds identified by Lipper, Inc. as having an investment objective similar to that of the fund. The returns of the retail class and Class C show the performance of the highest performing class (based on five-year performance) and the lowest performing class (based on one-year performance), respectively. The box within each chart shows the 25th percentile return (top of box) and the 75th percentile return (bottom of box) of the peer group. Returns shown above the box are in the first quartile and returns shown below the box are in the fourth quartile. The percentage beaten numbers noted below each chart correspond to the percentile box and represent the percentage of funds in the peer group whose performance was equal to or lower than that of the fund or class indicated.
Fidelity Japan Fund

The Board reviewed the fund's relative investment performance against its peer group and noted that the performance of the retail class of the fund was in the fourth quartile for the one- and five-year periods and the second quartile for the three-year period. The Board also noted that the investment performance of the fund was lower than its benchmark for the one- and five-year periods, although the three-year cumulative total return of the retail class compared favorably to its benchmark. The Board considered that the variations in performance among the fund's classes reflect the variations in class expenses, which result in lower performance for higher expense classes. The Board also reviewed the fund's performance since inception as well as performance in the current year. The Board will closely monitor the performance of the fund in the coming year.
The Board also considered that the fund's management fee is subject to upward or downward adjustment depending upon whether, and to what extent, the fund's investment performance for the performance period exceeds, or is exceeded by, the record (over the same period) of a Board-approved performance adjustment index. The Board noted that the performance adjustment provides FMR with a strong economic incentive to seek to achieve superior performance for the fund's shareholders and helps to more closely align the interests of FMR and the fund's shareholders.
Annual Report
Board Approval of Investment Advisory Contracts and Management Fees - continued
Based on its review, the Board concluded that the nature, extent, and quality of services provided to the fund under the Advisory Contracts should benefit the fund's shareholders.
Competitiveness of Management Fee and Total Expense Ratio. The Board considered the fund's management fee and total expense ratio compared to "mapped groups" of competitive funds and classes. Fidelity creates "mapped groups" by combining similar Lipper investment objective categories that have comparable management fee characteristics. Combining Lipper investment objective categories aids the Board's management fee and total expense ratio comparisons by broadening the competitive group used for comparison and by reducing the number of universes to which various Fidelity funds are compared.
Management Fee. The Board considered two proprietary management fee comparisons for the 12-month periods shown in the chart below. The group of Lipper funds used by the Board for management fee comparisons is referred to below as the "Total Mapped Group." The Total Mapped Group is broader than the Lipper peer group used by the Board for performance comparisons because the Total Mapped Group combines several Lipper investment objective categories while the Lipper peer group does not. The Total Mapped Group comparison focuses on a fund's standing relative to the total universe of comparable funds available to investors in terms of gross management fees before expense reimbursements or caps, and without giving effect to the fund's performance adjustment. "TMG %" represents the percentage of funds in the Total Mapped Group that had management fees that were lower than the fund's. For example, a TMG % of 17% means that 83% of the funds in the Total Mapped Group had higher management fees than the fund. The "Asset-Size Peer Group" (ASPG) comparison focuses on a fund's standing relative to non-Fidelity funds similar in size to the fund within the Total Mapped Group. The ASPG represents at least 15% of the funds in the Total Mapped Group with comparable asset size and management fee characteristics, subject to a minimum of 50 funds (or all funds in the Total Mapped Group if fewer than 50). Additional information, such as the ASPG quartile in which the fund's management fee ranked and the impact of the fund's performance adjustment, is also included in the chart and considered by the Board.
Fidelity Japan Fund

The Board noted that the fund's management fee ranked below the median of its Total Mapped Group and below the median of its ASPG for 2011. The Board also noted the effect of the fund's negative performance adjustment on the fund's management fee ranking. The Board noted that the performance adjustment for each year represents calculations for performance periods that differ from the periods shown in the performance charts above.
Based on its review, the Board concluded that the fund's management fee is fair and reasonable in light of the services that the fund receives and the other factors considered.
Total Expense Ratio. In its review of each class's total expense ratio, the Board considered the fund's management fee as well as other fund or class expenses, as applicable, such as transfer agent fees, pricing and bookkeeping fees, fund-paid 12b-1 fees, and custodial, legal, and audit fees. The Board also noted the effects of any waivers and reimbursements on fees and expenses, as well as the impact of the fund's performance adjustment. As part of its review, the Board also considered the current and historical total expense ratios of each class of the fund compared to competitive fund median expenses. Each class of the fund is compared to those funds and classes in the Total Mapped Group (used by the Board for management fee comparisons) that have a similar sales load structure.
Annual Report
The Board noted that the total expense ratio of each of Class A, Class B, Class C, Institutional Class, and the retail class ranked below its competitive median for 2011 and the total expense ratio of Class T ranked above its competitive median for 2011. The Board considered that various factors, including 12b-1 fees, positive or negative performance adjustments, and relatively higher other expenses in the case of small fund size, can affect total expense ratios. The Board noted that the total expense ratio of Class T was above the competitive median primarily because of higher 12b-1 fees on Class T. Class T has a higher 12b-1 fee, but a lower front-end sales charge, than traditionally priced front-end sales charge classes. The Board considered that Class T is primarily sold load-waived in the retirement plan market where its 0.50% 12b-1 fee is comparable to competing no-load, higher 12b-1 fee classes designed specifically for retirement plans. The Board noted that the fund offers multiple classes, each of which has a different sales load and 12b-1 fee structure, and that the multiple structures are intended to offer a range of pricing options for the intermediary market. The Board also noted that the total expense ratios of the classes vary primarily by the level of their 12b-1 fees, although differences in transfer agent fees may also cause expenses to vary from class to class.
Fees Charged to Other Fidelity Clients. The Board also considered Fidelity fee structures and other information with respect to clients of FMR and its affiliates, such as other mutual funds advised or subadvised by FMR or its affiliates, pension plan clients, and other institutional clients. The Board noted the findings of the 2010 ad hoc joint committee (created with the board of other Fidelity funds), which reviewed and compared Fidelity's institutional investment advisory business with its business of providing services to the Fidelity funds, including the differences in services provided, fees charged, and costs incurred, as well as competition in their respective marketplaces.
Based on its review of total expense ratios and fees charged to other Fidelity clients, the Board concluded that the total expense ratio of each class of the fund was reasonable, although Class T was above the median of the universe presented for comparison, in light of the services that the fund and its shareholders receive and the other factors considered.
Costs of the Services and Profitability. The Board considered the revenues earned and the expenses incurred by Fidelity in conducting the business of developing, marketing, distributing, managing, administering and servicing the fund and its shareholders. The Board also considered the level of Fidelity's profits in respect of all the Fidelity funds.
On an annual basis, FMR presents to the Board Fidelity's profitability for the fund. Fidelity calculates the profitability for each fund, as well as aggregate profitability for groups of Fidelity funds and all Fidelity funds, using a series of detailed revenue and cost allocation methodologies which originate with the books and records of Fidelity on which Fidelity's audited financial statements are based. The Audit Committee of the Board reviews any significant changes from the prior year's methodologies.
PricewaterhouseCoopers LLP (PwC), independent registered public accounting firm and auditor to Fidelity and certain Fidelity funds, has been engaged annually by the Board as part of the Board's assessment of Fidelity's profitability analysis. PwC's engagement includes the review and assessment of Fidelity's methodologies used in determining the revenues and expenses attributable to Fidelity's mutual fund business, and completion of agreed-upon procedures surrounding the mathematical accuracy of fund profitability and its conformity to allocation methodologies. After considering PwC's reports issued under the engagement and information provided by Fidelity, the Board concluded that while other allocation methods may also be reasonable, Fidelity's profitability methodologies are reasonable in all material respects.
The Board also reviewed Fidelity's non-fund businesses and fall-out benefits related to the mutual fund business as well as cases where Fidelity's affiliates may benefit from or be related to the fund's business.
The Board considered the costs of the services provided by and the profits realized by Fidelity in connection with the operation of the fund and was satisfied that the profitability was not excessive in the circumstances.
Economies of Scale. The Board considered whether there have been economies of scale in respect of the management of the Fidelity funds, whether the Fidelity funds (including the fund) have appropriately benefited from any such economies of scale, and whether there is potential for realization of any further economies of scale. The Board considered the extent to which the fund will benefit from economies of scale through increased services to the fund, through waivers or reimbursements, or through fee or expense reductions. The Board also noted that in 2009, it and the board of other Fidelity funds created an ad hoc committee (the Economies of Scale Committee) to analyze whether FMR attains economies of scale in respect of the management and servicing of the Fidelity funds, whether the Fidelity funds have appropriately benefited from such economies of scale, and whether there is potential for realization of any further economies of scale.
The Board recognized that the fund's management contract incorporates a "group fee" structure, which provides for lower group fee rates as total fund assets under FMR's management increase, and for higher group fee rates as total fund assets under FMR's management decrease. FMR calculates the group fee rates based on a tiered asset "breakpoint" schedule that varies based on asset class. The Board considered that the group fee is designed to deliver the benefits of economies of scale to fund shareholders when total Fidelity fund assets increase, even if assets of any particular fund are unchanged or have declined, because some portion of Fidelity's costs are attributable to services provided to all Fidelity funds, and all funds benefit if those costs can be allocated among more assets. The Board concluded that, given the group fee structure, fund shareholders will benefit from lower management fees as assets under FMR's management increase at the fund complex level, regardless of whether Fidelity achieves any such economies of scale.
Annual Report
Board Approval of Investment Advisory Contracts and Management Fees - continued
The Board concluded, taking into account the analysis of the Economies of Scale Committee, that economies of scale, if any, are being appropriately shared between fund shareholders and Fidelity.
Additional Information Requested by the Board. In order to develop fully the factual basis for consideration of the Fidelity funds' Advisory Contracts, the Board requested and received additional information on certain topics, including (i) fund performance trends, actions to be taken by FMR to improve certain funds' overall performance, and Fidelity's long-term strategies for certain funds; (ii) the potential to further rationalize the Fidelity fund lineup with the possibility of achieving savings for the funds and Fidelity; (iii) Fidelity's compensation structure for portfolio managers and other key investment personnel; (iv) the amount of the investment that each portfolio manager has made in the Fidelity fund(s) that he or she manages; (v) the realization of fall-out benefits in certain Fidelity business units; (vi) Fidelity's group fee structures, the potential impact of regulatory changes on such structures, and the rationale for the individual fee rates of certain funds; (vii) fund profitability methodology, including Fidelity's cost allocation methodology, and the impact of certain factors on fund profitability results; (viii) trends regarding industry use of performance fee structures and the possibility of implementing performance fee structures for additional funds; and (ix) the impact of net redemptions from the Fidelity funds.
Based on its evaluation of all of the conclusions noted above, and after considering all factors it believed relevant, the Board ultimately concluded that the advisory fee structures are fair and reasonable, and that the fund's Advisory Contracts should be renewed.
Annual Report
Investment Adviser
Fidelity Management & Research Company
Boston, MA
Investment Sub-Advisers
FMR Co., Inc.
Fidelity Management & Research
(U.K.) Inc.
Fidelity Management & Research
(Hong Kong) Limited
Fidelity Management & Research
(Japan) Inc.
FIL Investment Advisors
FIL Investments (Japan) Limited
FIL Investment Advisors (UK) Limited
General Distributor
Fidelity Distributors Corporation
Smithfield, RI
Transfer and Service Agents
Fidelity Investments Institutional Operations Company, Inc.
Boston, MA
Fidelity Service Company, Inc.
Boston, MA
Custodian
JPMorgan Chase Bank
New York, NY
(Fidelity Investment logo)(registered trademark)
Corporate Headquarters
82 Devonshire St., Boston, MA 02109
www.fidelity.com
AJPNI-UANN-1212
1.917380.101
Fidelity Advisor®
Latin America Fund -
Class A, Class T, Class B, and Class C
Annual Report
October 31, 2012
(Fidelity Cover Art)
Class A, Class T, Class B, and Class C are
classes of Fidelity® Latin America Fund
Contents
Performance | 3 | How the fund has done over time. |
Management's Discussion of Fund Performance | 4 | The Portfolio Manager's review of fund performance and strategy. |
Shareholder Expense Example | 5 | An example of shareholder expenses. |
Investment Changes | 6 | A summary of major shifts in the fund's investments over the past six months. |
Investments | 7 | A complete list of the fund's investments with their market values. |
Financial Statements | 9 | Statements of assets and liabilities, operations, and changes in net assets, as well as financial highlights. |
Notes | 14 | Notes to the financial statements. |
Report of Independent Registered Public Accounting Firm | 20 | |
Trustees and Officers | 21 | |
Distributions | 27 | |
Board Approval of Investment Advisory Contracts and Management Fees | 28 | |
To view a fund's proxy voting guidelines and proxy voting record for the 12-month period ended June 30, visit http://www.fidelity.com/proxyvotingresults or visit the Securities and Exchange Commission's (SEC) web site at http://www.sec.gov. You may also call 1-877-208-0098 to request a free copy of the proxy voting guidelines.
Standard & Poor's, S&P and S&P 500 are registered service marks of The McGraw-Hill Companies, Inc. and have been licensed for use by Fidelity Distributors Corporation.
Other third party marks appearing herein are the property of their respective owners.
All other marks appearing herein are registered or unregistered trademarks or service marks of FMR LLC or an affiliated company. © 2012 FMR LLC. All rights reserved.
This report and the financial statements contained herein are submitted for the general information of the shareholders of the fund. This report is not authorized for distribution to prospective investors in the fund unless preceded or accompanied by an effective prospectus.
A fund files its complete schedule of portfolio holdings with the SEC for the first and third quarters of each fiscal year on Form N-Q. Forms N-Q are available on the SEC's web site at http://www.sec.gov. A fund's Forms N-Q may be reviewed and copied at the SEC's Public Reference Room in Washington, DC. Information regarding the operation of the SEC's Public Reference Room may be obtained by calling 1-800-SEC-0330. For a complete list of a fund's portfolio holdings, view the most recent holdings listing, semiannual report, or annual report on Fidelity's web site at http://www.fidelity.com, http://www.advisor.fidelity.com, or http://www.401k.com, as applicable.
NOT FDIC INSURED • MAY LOSE VALUE • NO BANK GUARANTEE
Neither the fund nor Fidelity Distributors Corporation is a bank.
Annual Report
Performance: The Bottom Line
Average annual total return reflects the change in the value of an investment, assuming reinvestment of the class' distributions from dividend income and capital gains (the profits earned upon the sale of securities that have grown in value, if any) and assuming a constant rate of performance each year. The $10,000 table and the fund's returns do not reflect the deduction of taxes that a shareholder would pay on fund distributions or the redemption of fund shares. During periods of reimbursement by Fidelity, a fund's total return will be greater than it would be had the reimbursement not occurred. How a fund did yesterday is no guarantee of how it will do tomorrow.
Average Annual Total Returns
Periods ended October 31, 2012 | Past 1
year | Past 5
years | Past 10
years |
Class A (incl. 5.75% sales charge ) A | -10.68% | -5.38% | 20.45% |
Class T (incl. 3.50% sales charge) B | -8.79% | -5.04% | 20.67% |
Class B (incl. contingent deferred sales charge) C | -10.63% | -4.90% | 20.97% |
Class C (incl. contingent deferred sales charge) D | -6.87% | -4.55% | 20.98% |
A Class A shares bear a 0.25% 12b-1 fee. The initial offering of Class A shares took place on September 28, 2010. Returns prior to September 28, 2010 are those of Fidelity® Latin America Fund, the original class of the fund, which has no 12b-1 fee. Had Class A's 12b-1 fee been reflected, returns prior to September 28, 2010, would have been lower.
B Class T shares bear a 0.50% 12b-1 fee. The initial offering of Class T shares took place on September 28, 2010. Returns prior to September 28, 2010 are those of Fidelity® Latin America Fund, the original class of the fund, which has no 12b-1 fee. Had Class T's 12b-1 fee been reflected, returns prior to September 28, 2010, would have been lower.
C Class B shares bear a 1.00% 12b-1 fee. The initial offering of Class B shares took place on September 28, 2010. Returns prior to September 28, 2010 are those of Fidelity Latin America Fund, the original class of the fund, which has no 12b-1 fee. Had Class B's 12b-1 fee been reflected, returns prior to September 28, 2010, would have been lower. Class B shares' contingent deferred sales charges included in the past one year, past five years, and past ten years total return figures are 5%, 2%, and 0%, respectively.
D Class C shares bear a 1.00% 12b-1 fee. The initial offering of Class C shares took place on September 28, 2010. Returns prior to September 28, 2010 are those of Fidelity Latin America Fund, the original class of the fund, which has no 12b-1 fee. Had Class C's 12b-1 fee been reflected, returns prior to September 28, 2010, would have been lower. Class C shares' contingent deferred sales charges included in the past one year, past five years, and past ten years total return figures are 1%, 0%, and 0%, respectively.
$10,000 Over 10 Years
Let's say hypothetically that $10,000 was invested in Fidelity Advisor® Latin America Fund - Class A on October 31, 2002, and the current 5.75% sales charge was paid. The chart shows how the value of your investment would have changed, and also shows how the MSCI® EM (Emerging Markets) Latin America Index performed over the same period. The initial offering of Class A took place on September 28, 2010. See above for additional information regarding the performance of Class A.

Annual Report
Management's Discussion of Fund Performance
Market Recap: Returns for most domestic and international equities fluctuated during the 12 months ending October 31, 2012, as investor sentiment towards risk vacillated amid a changing global economic landscape. U.S. stocks overcame bouts of volatility to post strong gains for the past year, extending an uptrend that began in March 2009. The broad-based S&P 500® Index advanced 15.21%, while the blue-chip-laden Dow Jones Industrial AverageSM and technology-heavy Nasdaq Composite® Index rose 12.56% and 12.21%, respectively. Performance outside of the U.S. was relatively weak, as the MSCI® ACWI® (All Country World Index) ex USA Index rose 4.11%, hampered in part by a stronger U.S. dollar. International developed-markets generally struggled during the period as macroeconomic concerns ebbed and flowed, finishing with only a modest gain. The MSCI® EAFE® Index rose 4.76% for the year, largely buttressed in the summertime by pledges of accommodative monetary action from eurozone officials, as well as signs that the U.S. housing market was on the mend. Within the index, Asia-Pacific ex Japan showed the most impressive gain, advancing roughly 10%. A number of core European components, including Germany (+11%) and Switzerland (+10%), and the U.K. (+9%), benefited from optimism about the eurozone's ability to resolve its debt woes, which helped the region outpace the index overall. Elsewhere, Japan was among the few benchmark constituents to finish in the red, returning about -3%. Emerging-markets stocks gained 2.98% for the year, as measured by the MSCI Emerging Markets Index. A general uptrend in the final five months of the period lifted the index into positive territory for the full 12 months.
Comments from Adam Kutas, Portfolio Manager of Fidelity Advisor® Latin America Fund: For the year, the fund's Class A, Class T, Class B and Class C shares returned -5.23%, -5.49%, -5.95% and -5.94%, respectively (excluding sales charges), underperforming the -3.76% return of the MSCI® EM (Emerging Markets) Latin America Index. The fund was hurt relative to the index by stock selection in materials, banks and utilities, and, geographically, the fund suffered from security selection in Brazil and Mexico, and from an underweighting in Chile. Individual detractors included not owning Mexican cement company and index component CEMEX, investments in Brazilian bank Itau Unibanco Holding and steel manufacturer Usinas Siderurgicas de Minas Gerais, largely avoiding Mexican bank Grupo Financiero Banorte and an out-of-benchmark position in Colombian energy company Petrominerales. Conversely, positioning in consumer staples helped - particularly in food/beverage/tobacco - as did security selection in industrials and, geographically, stock selection in Chile. Among the top contributors were underweightings in energy firm OGX Petroleo E Gas and iron ore supplier Vale - both located in Brazil - an overweighting in Wal-Mart de Mexico and investments in Multiplus, the company that runs the frequent-flier loyalty program for Brazilian airline TAM, and timely ownership of TAM itself. Some stocks mentioned were sold from the fund before period end.
Note to shareholders: Fidelity Advisor® Latin America Fund may invest up to 35% of its total assets in any industry that represents more than 20% of the Latin American market. As of October 31, 2012, the fund did not have more than 25% of its total assets invested in any one industry.
The views expressed above reflect those of the portfolio manager(s) only through the end of the period as stated on the cover of this report and do not necessarily represent the views of Fidelity or any other person in the Fidelity organization. Any such views are subject to change at any time based upon market or other conditions and Fidelity disclaims any responsibility to update such views. These views may not be relied on as investment advice and, because investment decisions for a Fidelity fund are based on numerous factors, may not be relied on as an indication of trading intent on behalf of any Fidelity fund.
Annual Report
Fidelity Latin America Fund
Shareholder Expense Example
As a shareholder of the Fund, you incur two types of costs: (1) transaction costs, including sales charges (loads) on purchase payments or redemption proceeds, redemption fees and (2) ongoing costs, including management fees, distribution and/or service (12b-1) fees and other Fund expenses. This Example is intended to help you understand your ongoing costs (in dollars) of investing in the Fund and to compare these costs with the ongoing costs of investing in other mutual funds.
The Example is based on an investment of $1,000 invested at the beginning of the period and held for the entire period (May 1, 2012 to October 31, 2012).
Actual Expenses
The first line of the accompanying table for each class of the Fund provides information about actual account values and actual expenses. You may use the information in this line, together with the amount you invested, to estimate the expenses that you paid over the period. Simply divide your account value by $1,000.00 (for example, an $8,600 account value divided by $1,000.00 = 8.6), then multiply the result by the number in the first line for a class of the Fund under the heading entitled "Expenses Paid During Period" to estimate the expenses you paid on your account during this period. A small balance maintenance fee of $12.00 that is charged once a year may apply for certain accounts with a value of less than $2,000. This fee is not included in the table below. If it was, the estimate of expenses you paid during the period would be higher, and your ending account value lower, by this amount. In addition, the Fund, as a shareholder in the underlying Fidelity Central Funds, will indirectly bear its pro-rata share of the fees and expenses incurred by the underlying Fidelity Central Funds. These fees and expenses are not included in the Fund's annualized expense ratio used to calculate the expense estimate in the table below.
Hypothetical Example for Comparison Purposes
The second line of the accompanying table for each class of the Fund provides information about hypothetical account values and hypothetical expenses based on a Class' actual expense ratio and an assumed rate of return of 5% per year before expenses, which is not the Class' actual return. The hypothetical account values and expenses may not be used to estimate the actual ending account balance or expenses you paid for the period. You may use this information to compare the ongoing costs of investing in the Fund and other funds. To do so, compare this 5% hypothetical example with the 5% hypothetical examples that appear in the shareholder reports of the other funds. A small balance maintenance fee of $12.00 that is charged once a year may apply for certain accounts with a value of less than $2,000. This fee is not included in the table below. If it was, the estimate of expenses you paid during the period would be higher, and your ending account value lower, by this amount. In addition, the Fund, as a shareholder in the underlying Fidelity Central Funds, will indirectly bear its pro-rata share of the fees and expenses incurred by the underlying Fidelity Central Funds. These fees and expenses are not included in the Fund's annualized expense ratio used to calculate the expense estimate in the table below.
Please note that the expenses shown in the table are meant to highlight your ongoing costs only and do not reflect any transaction costs. Therefore, the second line of the table is useful in comparing ongoing costs only, and will not help you determine the relative total costs of owning different funds. In addition, if these transactional costs were included, your costs would have been higher.
| Annualized
Expense Ratio | Beginning
Account Value
May 1, 2012 | Ending
Account Value
October 31, 2012 | Expenses Paid
During Period*
May 1, 2012
to October 31, 2012 |
Class A | 1.35% | | | |
Actual | | $ 1,000.00 | $ 925.20 | $ 6.53 |
Hypothetical A | | $ 1,000.00 | $ 1,018.35 | $ 6.85 |
Class T | 1.61% | | | |
Actual | | $ 1,000.00 | $ 924.00 | $ 7.79 |
Hypothetical A | | $ 1,000.00 | $ 1,017.04 | $ 8.16 |
Class B | 2.10% | | | |
Actual | | $ 1,000.00 | $ 921.70 | $ 10.14 |
Hypothetical A | | $ 1,000.00 | $ 1,014.58 | $ 10.63 |
Class C | 2.10% | | | |
Actual | | $ 1,000.00 | $ 921.70 | $ 10.14 |
Hypothetical A | | $ 1,000.00 | $ 1,014.58 | $ 10.63 |
Latin America | 1.02% | | | |
Actual | | $ 1,000.00 | $ 926.80 | $ 4.94 |
Hypothetical A | | $ 1,000.00 | $ 1,020.01 | $ 5.18 |
Institutional Class | 1.04% | | | |
Actual | | $ 1,000.00 | $ 926.50 | $ 5.04 |
Hypothetical A | | $ 1,000.00 | $ 1,019.91 | $ 5.28 |
A 5% return per year before expenses
* Expenses are equal to each Class' annualized expense ratio, multiplied by the average account value over the period, multiplied by 184/366 (to reflect the one-half year period).
Annual Report
Fidelity Latin America Fund
Investment Changes (Unaudited)
Geographic Diversification (% of fund's net assets) |
As of October 31, 2012 |
 | Brazil | 46.5% | |
 | Mexico | 23.6% | |
 | Chile | 14.8% | |
 | Colombia | 6.8% | |
 | United States of America | 4.6% | |
 | Peru | 3.2% | |
 | Canada | 0.5% | |

Percentages are based on country or territory of incorporation and are adjusted for the effect of futures contracts, if applicable. |
As of April 30, 2012 |
| Brazil | 53.2% | |
| Mexico | 21.4% | |
| Chile | 13.1% | |
| Colombia | 5.7% | |
| United States of America | 2.9% | |
 | Peru | 2.7% | |
| Canada | 0.7% | |
| Luxembourg | 0.3% | |

Percentages are based on country or territory of incorporation and are adjusted for the effect of futures contracts, if applicable. |
Asset Allocation |
| % of fund's
net assets | % of fund's net assets
6 months ago |
Stocks | 99.1 | 98.9 |
Short-Term Investments and Net Other Assets (Liabilities) | 0.9 | 1.1 |
Top Ten Stocks as of October 31, 2012 |
| % of fund's
net assets | % of fund's net assets
6 months ago |
America Movil SAB de CV Series L (Mexico, Wireless Telecommunication Services) | 9.9 | 9.8 |
Petroleo Brasileiro SA - Petrobras (PN) (non-vtg.) (Brazil, Oil, Gas & Consumable Fuels) | 6.6 | 6.0 |
Itau Unibanco Holding SA (Brazil, Commercial Banks) | 6.2 | 7.0 |
Wal-Mart de Mexico SA de CV Series V (Mexico, Food & Staples Retailing) | 5.2 | 4.5 |
Petroleo Brasileiro SA - Petrobras (Brazil, Oil, Gas & Consumable Fuels) | 5.1 | 4.5 |
Companhia de Bebidas das Americas (AmBev) (PN) sponsored ADR (Brazil, Beverages) | 5.0 | 5.0 |
Vale SA (PN-A) (Brazil, Metals & Mining) | 3.4 | 4.3 |
Fomento Economico Mexicano SAB de CV sponsored ADR (Mexico, Beverages) | 2.9 | 1.6 |
Telefonica Brasil SA (Brazil, Diversified Telecommunication Services) | 2.7 | 2.7 |
Banco Santander Chile sponsored ADR (Chile, Commercial Banks) | 2.7 | 2.5 |
| 49.7 | |
Market Sectors as of October 31, 2012 |
| % of fund's
net assets | % of fund's net assets
6 months ago |
Consumer Staples | 22.6 | 19.3 |
Telecommunication Services | 16.4 | 16.1 |
Financials | 15.8 | 17.0 |
Energy | 15.2 | 14.4 |
Materials | 14.3 | 16.5 |
Utilities | 7.0 | 7.6 |
Industrials | 5.2 | 5.1 |
Consumer Discretionary | 2.6 | 2.9 |
Annual Report
Fidelity Latin America Fund
Investments October 31, 2012
Showing Percentage of Net Assets
Common Stocks - 99.0% |
| Shares | | Value |
Brazil - 46.5% |
AES Tiete SA (PN) (non-vtg.) | 4,090,245 | | $ 46,459,689 |
Banco Bradesco SA (PN) | 1,108,016 | | 17,457,232 |
CCR SA | 6,112,300 | | 53,748,395 |
Companhia de Bebidas das Americas (AmBev): | | | |
(PN) sponsored ADR | 2,981,030 | | 121,596,214 |
sponsored ADR | 345,425 | | 11,765,176 |
Companhia Energetica de Sao Paulo Series A | 921,200 | | 8,277,443 |
CPFL Energia SA sponsored ADR (d) | 992,149 | | 23,107,150 |
Eletropaulo Metropolitana SA (PN-B) | 1,784,420 | | 14,171,337 |
Itau Unibanco Holding SA | 3,511,400 | | 51,347,126 |
Itau Unibanco Holding SA sponsored ADR | 6,746,858 | | 98,369,190 |
Itausa-Investimentos Itau SA (PN) | 5,372,620 | | 23,542,659 |
Light SA | 2,222,800 | | 23,912,843 |
Lupatech SA (a) | 1,356,700 | | 1,723,387 |
Lupatech SA (Subscription Receipts) (a) | 4,975,704 | | 6,320,530 |
M. Dias Branco SA | 576,700 | | 19,364,831 |
Multiplus SA | 1,486,300 | | 34,533,122 |
Petroleo Brasileiro SA - Petrobras: | | | |
(ON) | 919,228 | | 9,730,633 |
(PN) (non-vtg.) | 8,998,371 | | 92,152,392 |
(PN) sponsored ADR (non-vtg.) | 3,282,376 | | 67,387,179 |
sponsored ADR | 5,276,220 | | 111,908,626 |
Souza Cruz SA | 3,533,000 | | 46,096,600 |
Telefonica Brasil SA | 1,239,613 | | 27,464,900 |
Telefonica Brasil SA sponsored ADR (d) | 1,706,883 | | 37,585,564 |
TIM Participacoes SA | 6,632,495 | | 23,511,959 |
TIM Participacoes SA sponsored ADR | 792,304 | | 13,770,244 |
Tractebel Energia SA | 1,024,800 | | 17,659,831 |
Usinas Siderurgicas de Minas Gerais SA - Usiminas | 1,385,750 | | 7,245,841 |
Vale SA: | | | |
(PN-A) | 1,797,500 | | 32,170,121 |
(PN-A) sponsored ADR | 2,746,620 | | 48,862,370 |
sponsored ADR | 1,614,493 | | 29,577,512 |
TOTAL BRAZIL | | 1,120,820,096 |
Canada - 0.5% |
Petrominerales Ltd. (d) | 858,100 | | 6,881,984 |
Silver Standard Resources, Inc. (a) | 330,800 | | 5,038,083 |
TOTAL CANADA | | 11,920,067 |
Chile - 14.8% |
Banco de Chile | 29,536,944 | | 4,407,061 |
Banco de Chile sponsored ADR (d) | 113,767 | | 10,059,278 |
Banco Santander Chile sponsored ADR (d) | 2,381,499 | | 64,752,958 |
CAP SA | 1,651,960 | | 56,949,104 |
Compania Cervecerias Unidas SA | 3,379,403 | | 49,165,170 |
|
| Shares | | Value |
Compania Cervecerias Unidas SA sponsored ADR | 8,028 | | $ 569,426 |
Compania Sudamericana de Vapores (a) | 36,530,345 | | 3,490,939 |
Embotelladora Andina SA: | | | |
Class A | 1,336,236 | | 6,720,755 |
Class B | 2,819,596 | | 17,814,761 |
Empresa Nacional de Electricidad SA | 5,398,806 | | 8,690,378 |
Empresa Nacional de Telecomunicaciones SA (ENTEL) | 1,984,478 | | 40,419,588 |
Empresas La Polar SA (a) | 5,500,872 | | 2,652,400 |
Enersis SA | 35,324,499 | | 12,091,749 |
Enersis SA sponsored ADR | 849,447 | | 14,389,632 |
Inversiones La Construccion SA | 362,646 | | 6,406,508 |
SACI Falabella | 5,150,235 | | 52,824,297 |
Sociedad Matriz SAAM SA | 48,961,581 | | 5,723,972 |
TOTAL CHILE | | 357,127,976 |
Colombia - 6.7% |
BanColombia SA sponsored ADR | 419,321 | | 26,844,930 |
Bolsa de Valores de Colombia | 592,791,382 | | 10,420,495 |
Ecopetrol SA | 12,622,088 | | 37,554,182 |
Ecopetrol SA ADR | 150,000 | | 8,881,500 |
Empresa de Telecomunicaciones de Bogota (a) | 40,480,188 | | 10,055,056 |
Grupo de Inversiones Suramerica | 1,624,314 | | 31,710,135 |
Inversiones Argos SA | 3,136,005 | | 35,849,576 |
TOTAL COLOMBIA | | 161,315,874 |
Mexico - 23.6% |
America Movil SAB de CV: | | | |
Series L | 5,073,400 | | 6,443,458 |
Series L sponsored ADR | 9,200,234 | | 232,673,915 |
Bolsa Mexicana de Valores SA de CV | 4,499,683 | | 9,962,258 |
Consorcio ARA SA de CV (a)(d) | 20,968,721 | | 6,581,751 |
Corporacion Inmobiliaria Vesta SAB de CV | 4,313,500 | | 6,492,980 |
Embotelladoras Arca SAB de CC | 1,379,708 | | 10,011,155 |
Fibra Uno Administracion SA de CV | 2,829,900 | | 7,456,205 |
Fomento Economico Mexicano SAB de CV sponsored ADR | 757,860 | | 68,669,695 |
Grupo Modelo SAB de CV Series C | 1,316,300 | | 11,600,811 |
Industrias Penoles SA de CV | 730,155 | | 36,376,708 |
Kimberly-Clark de Mexico SA de CV Series A | 19,110,900 | | 45,887,177 |
Wal-Mart de Mexico SA de CV Series V | 42,363,570 | | 125,110,681 |
TOTAL MEXICO | | 567,266,794 |
Peru - 3.2% |
Alicorp SA Class C | 4,479,951 | | 12,706,016 |
Compania de Minas Buenaventura SA sponsored ADR | 1,783,600 | | 63,781,536 |
TOTAL PERU | | 76,487,552 |
United States of America - 3.7% |
BPZ Energy, Inc. (a)(d) | 3,583,700 | | 10,321,056 |
Common Stocks - continued |
| Shares | | Value |
United States of America - continued |
First Cash Financial Services, Inc. (a) | 222,745 | | $ 9,947,792 |
Gran Tierra Energy, Inc. (Canada) (a) | 1,649,500 | | 8,307,369 |
LATAM Airlines Group SA sponsored ADR (d) | 1,296,540 | | 32,141,227 |
Southern Copper Corp. | 743,351 | | 28,321,673 |
TOTAL UNITED STATES OF AMERICA | | 89,039,117 |
TOTAL COMMON STOCKS (Cost $1,502,331,972) |
2,383,977,476
|
Nonconvertible Preferred Stocks - 0.1% |
| | | |
Colombia - 0.1% |
Grupo de Inversiones Suramerica
(Cost $2,763,035) | 161,141 | |
3,316,485
|
Money Market Funds - 2.9% |
| Shares | | Value |
Fidelity Cash Central Fund, 0.19% (b) | 13,182,131 | | $ 13,182,131 |
Fidelity Securities Lending Cash Central Fund, 0.19% (b)(c) | 55,587,141 | | 55,587,141 |
TOTAL MONEY MARKET FUNDS (Cost $68,769,272) |
68,769,272
|
TOTAL INVESTMENT PORTFOLIO - 102.0% (Cost $1,573,864,279) | | 2,456,063,233 |
NET OTHER ASSETS (LIABILITIES) - (2.0)% | | (47,648,097) |
NET ASSETS - 100% | $ 2,408,415,136 |
Legend |
(a) Non-income producing |
(b) Affiliated fund that is available only to investment companies and other accounts managed by Fidelity Investments. The rate quoted is the annualized seven-day yield of the fund at period end. A complete unaudited listing of the fund's holdings as of its most recent quarter end is available upon request. In addition, each Fidelity Central Fund's financial statements, which are not covered by the Fund's Report of Independent Registered Public Accounting Firm, are available on the SEC's website or upon request. |
(c) Includes cash collateral received from securities on loan. |
(d) Security or a portion of the security is on loan at period end. |
Affiliated Central Funds |
Information regarding fiscal year to date income earned by the Fund from investments in Fidelity Central Funds is as follows: |
Fund | Income earned |
Fidelity Cash Central Fund | $ 23,517 |
Fidelity Securities Lending Cash Central Fund | 729,136 |
Total | $ 752,653 |
Other Information |
Categorizations in the Schedule of Investments are based on country or territory of incorporation. |
The following is a summary of the inputs used, as of October 31, 2012, involving the Fund's assets and liabilities carried at fair value. The inputs or methodology used for valuing securities may not be an indication of the risk associated with investing in those securities. For more information on valuation inputs, and their aggregation into the levels used in the table below, please refer to the Security Valuation section in the accompanying Notes to Financial Statements. |
Valuation Inputs at Reporting Date: |
Description | Total | Level 1 | Level 2 | Level 3 |
Investments in Securities: | | | | |
Equities: | | | | |
Consumer Discretionary | $ 62,058,448 | $ 62,058,448 | $ - | $ - |
Consumer Staples | 547,078,468 | 547,078,468 | - | - |
Energy | 361,168,838 | 361,168,838 | - | - |
Financials | 382,493,292 | 382,493,292 | - | - |
Industrials | 129,637,655 | 129,637,655 | - | - |
Materials | 344,172,524 | 344,172,524 | - | - |
Telecommunication Services | 391,924,684 | 391,924,684 | - | - |
Utilities | 168,760,052 | 168,760,052 | - | - |
Money Market Funds | 68,769,272 | 68,769,272 | - | - |
Total Investments in Securities: | $ 2,456,063,233 | $ 2,456,063,233 | $ - | $ - |
See accompanying notes which are an integral part of the financial statements.
Annual Report
Fidelity Latin America Fund
Financial Statements
Statement of Assets and Liabilities
| October 31, 2012 |
| | |
Assets | | |
Investment in securities, at value (including securities loaned of $54,129,152) - See accompanying schedule: Unaffiliated issuers (cost $1,505,095,007) | $ 2,387,293,961 | |
Fidelity Central Funds (cost $68,769,272) | 68,769,272 | |
Total Investments (cost $1,573,864,279) | | $ 2,456,063,233 |
Foreign currency held at value (cost $2,696,024) | | 2,696,024 |
Receivable for investments sold | | 3,500,639 |
Receivable for fund shares sold | | 1,291,956 |
Dividends receivable | | 7,735,466 |
Distributions receivable from Fidelity Central Funds | | 77,876 |
Other receivables | | 139,075 |
Total assets | | 2,471,504,269 |
| | |
Liabilities | | |
Payable for fund shares redeemed | $ 5,116,221 | |
Accrued management fee | 1,447,471 | |
Distribution and service plan fees payable | 54,506 | |
Other affiliated payables | 557,201 | |
Other payables and accrued expenses | 326,593 | |
Collateral on securities loaned, at value | 55,587,141 | |
Total liabilities | | 63,089,133 |
| | |
Net Assets | | $ 2,408,415,136 |
Net Assets consist of: | | |
Paid in capital | | $ 1,333,456,047 |
Undistributed net investment income | | 34,109,670 |
Accumulated undistributed net realized gain (loss) on investments and foreign currency transactions | | 158,698,415 |
Net unrealized appreciation (depreciation) on investments and assets and liabilities in foreign currencies | | 882,151,004 |
Net Assets | | $ 2,408,415,136 |
Statement of Assets and Liabilities - continued
| October 31, 2012 |
| | |
Calculation of Maximum Offering Price Class A:
Net Asset Value and redemption price per share ($69,654,164 ÷ 1,422,951 shares) | | $ 48.95 |
| | |
Maximum offering price per share (100/94.25 of $48.95) | | $ 51.94 |
Class T:
Net Asset Value and redemption price per share ($19,334,062 ÷ 395,559 shares) | | $ 48.88 |
| | |
Maximum offering price per share (100/96.50 of $48.88) | | $ 50.65 |
Class B:
Net Asset Value and offering price per share ($9,492,370 ÷ 194,835 shares)A | | $ 48.72 |
| | |
Class C:
Net Asset Value and offering price per share ($27,404,926 ÷ 562,422 shares)A | | $ 48.73 |
| | |
Latin America:
Net Asset Value, offering price and redemption price per share ($2,274,601,476 ÷ 46,335,920 shares) | | $ 49.09 |
| | |
Institutional Class:
Net Asset Value, offering price and redemption price per share ($7,928,138 ÷ 161,568 shares) | | $ 49.07 |
A Redemption price per share is equal to net asset value less any applicable contingent deferred sales charge.
See accompanying notes which are an integral part of the financial statements.
Annual Report
Statement of Operations
| Year ended October 31, 2012 |
| | |
Investment Income | | |
Dividends | | $ 94,540,068 |
Interest | | 2,557 |
Income from Fidelity Central Funds | | 752,653 |
Income before foreign taxes withheld | | 95,295,278 |
Less foreign taxes withheld | | (7,079,604) |
Total income | | 88,215,674 |
| | |
Expenses | | |
Management fee | $ 19,821,507 | |
Transfer agent fees | 6,191,998 | |
Distribution and service plan fees | 761,401 | |
Accounting and security lending fees | 1,233,628 | |
Custodian fees and expenses | 1,099,392 | |
Independent trustees' compensation | 18,758 | |
Registration fees | 107,722 | |
Audit | 72,875 | |
Legal | 15,046 | |
Interest | 409 | |
Miscellaneous | 32,900 | |
Total expenses before reductions | 29,355,636 | |
Expense reductions | (32,251) | 29,323,385 |
Net investment income (loss) | | 58,892,289 |
Realized and Unrealized Gain (Loss) Net realized gain (loss) on: | | |
Investment securities: | | |
Unaffiliated issuers | 297,029,381 | |
Foreign currency transactions | (2,004,709) | |
Total net realized gain (loss) | | 295,024,672 |
Change in net unrealized appreciation (depreciation) on: Investment securities | (507,618,368) | |
Assets and liabilities in foreign currencies | (146,577) | |
Total change in net unrealized appreciation (depreciation) | | (507,764,945) |
Net gain (loss) | | (212,740,273) |
Net increase (decrease) in net assets resulting from operations | | $ (153,847,984) |
Statement of Changes in Net Assets
| Year ended
October 31,
2012 | Year ended
October 31,
2011 |
Increase (Decrease) in Net Assets | | |
Operations | | |
Net investment income (loss) | $ 58,892,289 | $ 90,374,208 |
Net realized gain (loss) | 295,024,672 | 338,023,359 |
Change in net unrealized appreciation (depreciation) | (507,764,945) | (733,138,438) |
Net increase (decrease) in net assets resulting from operations | (153,847,984) | (304,740,871) |
Distributions to shareholders from net investment income | (46,233,461) | (22,292,136) |
Distributions to shareholders from net realized gain | - | (15,707,585) |
Total distributions | (46,233,461) | (37,999,721) |
Share transactions - net increase (decrease) | (452,506,012) | (1,114,870,853) |
Redemption fees | 354,338 | 763,732 |
Total increase (decrease) in net assets | (652,233,119) | (1,456,847,713) |
| | |
Net Assets | | |
Beginning of period | 3,060,648,255 | 4,517,495,968 |
End of period (including undistributed net investment income of $34,109,670 and undistributed net investment income of $34,016,290, respectively) | $ 2,408,415,136 | $ 3,060,648,255 |
See accompanying notes which are an integral part of the financial statements.
Annual Report
Financial Highlights - Class A
Years ended October 31, | 2012 | 2011 | 2010 H |
Selected Per-Share Data | | | |
Net asset value, beginning of period | $ 52.38 | $ 57.48 | $ 55.47 |
Income from Investment Operations | | | |
Net investment income (loss) E | .92 | 1.15 | .02 |
Net realized and unrealized gain (loss) | (3.66) | (5.87) | 2.79 |
Total from investment operations | (2.74) | (4.72) | 2.81 |
Distributions from net investment income | (.70) | (.19) | (.80) |
Distributions from net realized gain | - | (.20) | - |
Total distributions | (.70) | (.39) | (.80) |
Redemption fees added to paid in capital E | .01 | .01 | - K |
Net asset value, end of period | $ 48.95 | $ 52.38 | $ 57.48 |
Total Return B, C, D | (5.23)% | (8.26)% | 5.14% |
Ratios to Average Net Assets F, I | | | |
Expenses before reductions | 1.35% | 1.34% | 1.37% A |
Expenses net of fee waivers, if any | 1.35% | 1.34% | 1.37% A |
Expenses net of all reductions | 1.35% | 1.34% | 1.34% A |
Net investment income (loss) | 1.80% | 2.05% | .39% A |
Supplemental Data | | | |
Net assets, end of period (000 omitted) | $ 69,654 | $ 91,407 | $ 115,626 |
Portfolio turnover rate G | 23% | 11% | 56% J |
A Annualized B Total returns for periods of less than one year are not annualized. C Total returns would have been lower if certain expenses had not been reduced during the applicable periods shown. D Total returns do not include the effect of the sales charges. E Calculated based on average shares outstanding during the period. F Fees and expenses of any underlying Fidelity Central Funds are not included in the Fund's expense ratio. The Fund indirectly bears its proportionate share of the expenses of any underlying Fidelity Central Funds. G Amount does not include the portfolio activity of any underlying Fidelity Central Funds. H For the period September 28, 2010 (commencement of sale of shares) to October 31, 2010. I Expense ratios reflect operating expenses of the class. Expenses before reductions do not reflect amounts reimbursed by the investment adviser or reductions from brokerage service arrangements or reductions from other expense offset arrangements and do not represent the amount paid by the class during periods when reimbursements or reductions occur. Expense ratios before reductions for start-up periods may not be representative of longer-term operating periods. Expenses net of fee waivers reflect expenses after reimbursement by the investment adviser but prior to reductions from brokerage service arrangements or other expense offset arrangements. Expenses net of all reductions represent the net expenses paid by the class. J The portfolio turnover rate does not include the assets acquired in the merger. K Amount represents less than $.01 per share. |
Financial Highlights - Class T
Years ended October 31, | 2012 | 2011 | 2010 H |
Selected Per-Share Data | | | |
Net asset value, beginning of period | $ 52.27 | $ 57.47 | $ 55.47 |
Income from Investment Operations | | | |
Net investment income (loss) E | .78 | .99 | .01 |
Net realized and unrealized gain (loss) | (3.65) | (5.85) | 2.79 |
Total from investment operations | (2.87) | (4.86) | 2.80 |
Distributions from net investment income | (.53) | (.15) | (.80) |
Distributions from net realized gain | - | (.20) | - |
Total distributions | (.53) | (.35) | (.80) |
Redemption fees added to paid in capital E | .01 | .01 | - K |
Net asset value, end of period | $ 48.88 | $ 52.27 | $ 57.47 |
Total Return B, C, D | (5.49)% | (8.50)% | 5.12% |
Ratios to Average Net Assets F, I | | | |
Expenses before reductions | 1.61% | 1.61% | 1.63% A |
Expenses net of fee waivers, if any | 1.61% | 1.61% | 1.63% A |
Expenses net of all reductions | 1.61% | 1.61% | 1.60% A |
Net investment income (loss) | 1.54% | 1.78% | .13% A |
Supplemental Data | | | |
Net assets, end of period (000 omitted) | $ 19,334 | $ 26,020 | $ 36,820 |
Portfolio turnover rate G | 23% | 11% | 56% J |
A Annualized B Total returns for periods of less than one year are not annualized. C Total returns would have been lower if certain expenses had not been reduced during the applicable periods shown. D Total returns do not include the effect of the sales charges. E Calculated based on average shares outstanding during the period. F Fees and expenses of any underlying Fidelity Central Funds are not included in the Fund's expense ratio. The Fund indirectly bears its proportionate share of the expenses of any underlying Fidelity Central Funds. G Amount does not include the portfolio activity of any underlying Fidelity Central Funds. H For the period September 28, 2010 (commencement of sale of shares) to October 31, 2010. I Expense ratios reflect operating expenses of the class. Expenses before reductions do not reflect amounts reimbursed by the investment adviser or reductions from brokerage service arrangements or reductions from other expense offset arrangements and do not represent the amount paid by the class during periods when reimbursements or reductions occur. Expense ratios before reductions for start-up periods may not be representative of longer-term operating periods. Expenses net of fee waivers reflect expenses after reimbursement by the investment adviser but prior to reductions from brokerage service arrangements or other expense offset arrangements. Expenses net of all reductions represent the net expenses paid by the class. J The portfolio turnover rate does not include the assets acquired in the merger. K Amount represents less than $.01 per share. |
See accompanying notes which are an integral part of the financial statements.
Annual Report
Financial Highlights - Class B
Years ended October 31, | 2012 | 2011 | 2010 H |
Selected Per-Share Data | | | |
Net asset value, beginning of period | $ 52.06 | $ 57.44 | $ 55.47 |
Income from Investment Operations | | | |
Net investment income (loss) E | .53 | .72 | (.02) |
Net realized and unrealized gain (loss) | (3.63) | (5.84) | 2.79 |
Total from investment operations | (3.10) | (5.12) | 2.77 |
Distributions from net investment income | (.25) | (.07) | (.80) |
Distributions from net realized gain | - | (.20) | - |
Total distributions | (.25) | (.27) | (.80) |
Redemption fees added to paid in capital E | .01 | .01 | - K |
Net asset value, end of period | $ 48.72 | $ 52.06 | $ 57.44 |
Total Return B, C, D | (5.95)% | (8.94)% | 5.06% |
Ratios to Average Net Assets F, I | | | |
Expenses before reductions | 2.10% | 2.10% | 2.12% A |
Expenses net of fee waivers, if any | 2.10% | 2.10% | 2.12% A |
Expenses net of all reductions | 2.10% | 2.10% | 2.10% A |
Net investment income (loss) | 1.05% | 1.29% | (.36)% A |
Supplemental Data | | | |
Net assets, end of period (000 omitted) | $ 9,492 | $ 14,114 | $ 20,392 |
Portfolio turnover rate G | 23% | 11% | 56% J |
A Annualized B Total returns for periods of less than one year are not annualized. C Total returns would have been lower if certain expenses had not been reduced during the applicable periods shown. D Total returns do not include the effect of the contingent deferred sales charge. E Calculated based on average shares outstanding during the period. F Fees and expenses of any underlying Fidelity Central Funds are not included in the Fund's expense ratio. The Fund indirectly bears its proportionate share of the expenses of any underlying Fidelity Central Funds. G Amount does not include the portfolio activity of any underlying Fidelity Central Funds. H For the period September 28, 2010 (commencement of sale of shares) to October 31, 2010. I Expense ratios reflect operating expenses of the class. Expenses before reductions do not reflect amounts reimbursed by the investment adviser or reductions from brokerage service arrangements or reductions from other expense offset arrangements and do not represent the amount paid by the class during periods when reimbursements or reductions occur. Expense ratios before reductions for start-up periods may not be representative of longer-term operating periods. Expenses net of fee waivers reflect expenses after reimbursement by the investment adviser but prior to reductions from brokerage service arrangements or other expense offset arrangements. Expenses net of all reductions represent the net expenses paid by the class. J The portfolio turnover rate does not include the assets acquired in the merger. K Amount represents less than $.01 per share. |
Financial Highlights - Class C
Years ended October 31, | 2012 | 2011 | 2010 H |
Selected Per-Share Data | | | |
Net asset value, beginning of period | $ 52.05 | $ 57.44 | $ 55.47 |
Income from Investment Operations | | | |
Net investment income (loss) E | .54 | .73 | (.02) |
Net realized and unrealized gain (loss) | (3.64) | (5.84) | 2.79 |
Total from investment operations | (3.10) | (5.11) | 2.77 |
Distributions from net investment income | (.23) | (.09) | (.80) |
Distributions from net realized gain | - | (.20) | - |
Total distributions | (.23) | (.29) | (.80) |
Redemption fees added to paid in capital E | .01 | .01 | - K |
Net asset value, end of period | $ 48.73 | $ 52.05 | $ 57.44 |
Total Return B, C, D | (5.94)% | (8.93)% | 5.06% |
Ratios to Average Net Assets F, I | | | |
Expenses before reductions | 2.10% | 2.08% | 2.09% A |
Expenses net of fee waivers, if any | 2.10% | 2.08% | 2.09% A |
Expenses net of all reductions | 2.10% | 2.08% | 2.07% A |
Net investment income (loss) | 1.06% | 1.31% | (.34)% A |
Supplemental Data | | | |
Net assets, end of period (000 omitted) | $ 27,405 | $ 35,203 | $ 48,329 |
Portfolio turnover rate G | 23% | 11% | 56% J |
A Annualized B Total returns for periods of less than one year are not annualized. C Total returns would have been lower if certain expenses had not been reduced during the applicable periods shown. D Total returns do not include the effect of the contingent deferred sales charge. E Calculated based on average shares outstanding during the period. F Fees and expenses of any underlying Fidelity Central Funds are not included in the Fund's expense ratio. The Fund indirectly bears its proportionate share of the expenses of any underlying Fidelity Central Funds. G Amount does not include the portfolio activity of any underlying Fidelity Central Funds. H For the period September 28, 2010 (commencement of sale of shares) to October 31, 2010. I Expense ratios reflect operating expenses of the class. Expenses before reductions do not reflect amounts reimbursed by the investment adviser or reductions from brokerage service arrangements or reductions from other expense offset arrangements and do not represent the amount paid by the class during periods when reimbursements or reductions occur. Expense ratios before reductions for start-up periods may not be representative of longer-term operating periods. Expenses net of fee waivers reflect expenses after reimbursement by the investment adviser but prior to reductions from brokerage service arrangements or other expense offset arrangements. Expenses net of all reductions represent the net expenses paid by the class. J The portfolio turnover rate does not include the assets acquired in the merger. K Amount represents less than $.01 per share. |
See accompanying notes which are an integral part of the financial statements.
Annual Report
Financial Highlights - Latin America
Years ended October 31, | 2012 | 2011 | 2010 | 2009 | 2008 |
Selected Per-Share Data | | | | | |
Net asset value, beginning of period | $ 52.48 | $ 57.50 | $ 47.29 | $ 28.69 | $ 67.90 |
Income from Investment Operations | | | | | |
Net investment income (loss) B | 1.09 | 1.34 | 1.07 | .72 | .83 |
Net realized and unrealized gain (loss) | (3.67) | (5.88) | 11.00 | 18.32 | (37.74) |
Total from investment operations | (2.58) | (4.54) | 12.07 | 19.04 | (36.91) |
Distributions from net investment income | (.82) | (.29) | (1.49) | (.46) | (.65) |
Distributions from net realized gain | - | (.20) | (.39) | - | (1.72) |
Total distributions | (.82) | (.49) | (1.88) | (.46) | (2.37) |
Redemption fees added to paid in capital B | .01 | .01 | .02 | .02 | .07 |
Net asset value, end of period | $ 49.09 | $ 52.48 | $ 57.50 | $ 47.29 | $ 28.69 |
Total Return A | (4.91)% | (7.96)% | 25.91% | 67.88% | (56.20)% |
Ratios to Average Net Assets C, E | | | | | |
Expenses before reductions | 1.02% | 1.00% | 1.03% | 1.07% | 1.02% |
Expenses net of fee waivers, if any | 1.02% | 1.00% | 1.03% | 1.07% | 1.02% |
Expenses net of all reductions | 1.02% | 1.00% | 1.01% | 1.05% | 1.00% |
Net investment income (loss) | 2.14% | 2.39% | 2.10% | 2.04% | 1.41% |
Supplemental Data | | | | | |
Net assets, end of period (000 omitted) | $ 2,274,601 | $ 2,884,301 | $ 4,283,462 | $ 4,043,748 | $ 2,225,606 |
Portfolio turnover rate D | 23% | 11% | 56% F | 52% | 51% |
A Total returns would have been lower if certain expenses had not been reduced during the applicable periods shown. B Calculated based on average shares outstanding during the period. C Fees and expenses of any underlying Fidelity Central Funds are not included in the Fund's expense ratio. The Fund indirectly bears its proportionate share of the expenses of any underlying Fidelity Central Funds. D Amount does not include the portfolio activity of any underlying Fidelity Central Funds. E Expense ratios reflect operating expenses of the class. Expenses before reductions do not reflect amounts reimbursed by the investment adviser or reductions from brokerage service arrangements or reductions from other expense offset arrangements and do not represent the amount paid by the class during periods when reimbursements or reductions occur. Expenses net of fee waivers reflect expenses after reimbursement by the investment adviser but prior to reductions from brokerage service arrangements or other expense offset arrangements. Expenses net of all reductions represent the net expenses paid by the class. F The portfolio turnover rate does not include the assets acquired in the merger. |
Financial Highlights - Institutional Class
Years ended October 31, | 2012 | 2011 | 2010 G |
Selected Per-Share Data | | | |
Net asset value, beginning of period | $ 52.51 | $ 57.49 | $ 55.47 |
Income from Investment Operations | | | |
Net investment income (loss) D | 1.08 | 1.32 | .03 |
Net realized and unrealized gain (loss) | (3.67) | (5.88) | 2.79 |
Total from investment operations | (2.59) | (4.56) | 2.82 |
Distributions from net investment income | (.86) | (.23) | (.80) |
Distributions from net realized gain | - | (.20) | - |
Total distributions | (.86) | (.43) | (.80) |
Redemption fees added to paid in capital D | .01 | .01 | - J |
Net asset value, end of period | $ 49.07 | $ 52.51 | $ 57.49 |
Total Return B, C | (4.93)% | (7.98)% | 5.15% |
Ratios to Average Net Assets E, H | | | |
Expenses before reductions | 1.04% | 1.04% | 1.08% A |
Expenses net of fee waivers, if any | 1.04% | 1.04% | 1.08% A |
Expenses net of all reductions | 1.04% | 1.04% | 1.06% A |
Net investment income (loss) | 2.12% | 2.35% | .68% A |
Supplemental Data | | | |
Net assets, end of period (000 omitted) | $ 7,928 | $ 9,603 | $ 12,868 |
Portfolio turnover rate F | 23% | 11% | 56% I |
A Annualized B Total returns for periods of less than one year are not annualized. C Total returns would have been lower if certain expenses had not been reduced during the applicable periods shown. D Calculated based on average shares outstanding during the period. E Fees and expenses of any underlying Fidelity Central Funds are not included in the Fund's expense ratio. The Fund indirectly bears its proportionate share of the expenses of any underlying Fidelity Central Funds. F Amount does not include the portfolio activity of any underlying Fidelity Central Funds. G For the period September 28, 2010 (commencement of sale of shares) to October 31, 2010. H Expense ratios reflect operating expenses of the class. Expenses before reductions do not reflect amounts reimbursed by the investment adviser or reductions from brokerage service arrangements or reductions from other expense offset arrangements and do not represent the amount paid by the class during periods when reimbursements or reductions occur. Expense ratios before reductions for start-up periods may not be representative of longer-term operating periods. Expenses net of fee waivers reflect expenses after reimbursement by the investment adviser but prior to reductions from brokerage service arrangements or other expense offset arrangements. Expenses net of all reductions represent the net expenses paid by the class. I The portfolio turnover rate does not include the assets acquired in the merger. J Amount represents less than $.01 per share. |
See accompanying notes which are an integral part of the financial statements.
Annual Report
Notes to Financial Statements
For the period ended October 31, 2012
1. Organization.
Fidelity Latin America Fund (the Fund) is a non-diversified fund of Fidelity Investment Trust (the Trust) and is authorized to issue an unlimited number of shares. The Trust is registered under the Investment Company Act of 1940, as amended (the 1940 Act), as an open-end management investment company organized as a Massachusetts business trust. The Fund offers Class A, Class T, Class C, Latin America and Institutional Class shares, each of which, along with Class B shares, has equal rights as to assets and voting privileges. Class B shares are closed to new accounts and additional purchases, except for exchanges and reinvestments. Each class has exclusive voting rights with respect to matters that affect that class. Investment income, realized and unrealized capital gains and losses, the common expenses of the Fund, and certain fund-level expense reductions, if any, are allocated on a pro-rata basis to each class based on the relative net assets of each class to the total net assets of the Fund. Each class differs with respect to transfer agent and distribution and service plan fees incurred. Certain expense reductions may also differ by class. The Fund's investments in emerging markets can be subject to social, economic, regulatory, and political uncertainties and can be extremely volatile.
2. Investments in Fidelity Central Funds.
The Fund invests in Fidelity Central Funds, which are open-end investment companies available only to other investment companies and accounts managed by Fidelity Management & Research Company (FMR) and its affiliates. The Fund's Schedule of Investments lists each of the Fidelity Central Funds held as of period end, as an investment of the Fund, but does not include the underlying holdings of each Fidelity Central Fund. As an Investing Fund, the Fund indirectly bears its proportionate share of the expenses of the underlying Fidelity Central Funds.
The Money Market Central Funds seek preservation of capital and current income and are managed by Fidelity Investments Money Management, Inc. (FIMM), an affiliate of FMR.
A complete unaudited list of holdings for each Fidelity Central Fund is available upon request or at the Securities and Exchange Commission (the SEC) web site at www.sec.gov. In addition, the financial statements of the Fidelity Central Funds, which are not covered by the Fund's Report of Independent Registered Public Accounting Firm, are available on the SEC web site or upon request.
3. Significant Accounting Policies.
The financial statements have been prepared in conformity with accounting principles generally accepted in the United States of America (GAAP), which require management to make certain estimates and assumptions at the date of the financial statements. Actual results could differ from those estimates. Subsequent events, if any, through the date that the financial statements were issued have been evaluated in the preparation of the financial statements. The following summarizes the significant accounting policies of the Fund:
Security Valuation. Investments are valued as of 4:00 p.m. Eastern time on the last calendar day of the period. In accordance with valuation policies and procedures approved by the Board of Trustees (the Board), the Fund attempts to obtain prices from one or more third party pricing vendors or brokers to value its investments. When current market prices, quotations or rates are not readily available or reliable, securities will be fair valued in good faith by the FMR Fair Value Committee (the Committee), in accordance with procedures adopted by the Fund's Board. Factors used in determining fair value vary by security type and may include market or security specific events. The frequency with which these procedures are used cannot be predicted and they may be utilized to a significant extent. The Committee oversees the Fund's valuation policies and procedures and is responsible for approving and reporting to the Board all fair value determinations.
The Fund categorizes the inputs to valuation techniques used to value its investments into a disclosure hierarchy consisting of three levels as shown below:
Level 1 - quoted prices in active markets for identical investments
Level 2 - other significant observable inputs (including quoted prices for similar investments, interest rates, prepayment speeds, etc.)
Level 3 - unobservable inputs (including the Fund's own assumptions based on the best information available)
Valuation techniques used to value the Fund's investments by major category are as follows:
Equity securities, including restricted securities, for which market quotations are readily available, are valued at the last reported sale price or official closing price as reported by a third party pricing vendor on the primary market or exchange on which they are traded and are categorized as Level 1 in the hierarchy. In the event there were no sales during the day or closing prices are not available, securities are valued at the last quoted bid price or may be valued using the last available price and are generally categorized as Level 2 in the hierarchy. For foreign equity securities, when significant market or security specific events arise, comparisons to the valuation of American Depositary Receipts (ADRs), futures contracts, Exchange-Traded Funds (ETFs) and certain indexes as well as quoted prices for similar securities are used and are categorized as Level 2 in the hierarchy. Utilizing these techniques may result in transfers between Level 1 and Level 2.
Annual Report
3. Significant Accounting Policies - continued
Security Valuation - continued
Investments in open-end mutual funds, including the Fidelity Central Funds, are valued at their closing net asset value (NAV) each business day and are categorized as Level 1 in the hierarchy.
Changes in valuation techniques may result in transfers in or out of an assigned level within the disclosure hierarchy. The aggregate value of investments by input level, as of October 31, 2012, is included at the end of the Fund's Schedule of Investments.
Foreign Currency Translation. The Fund may use foreign currency contracts to facilitate transactions in foreign-denominated securities. Gains and losses from these transactions may arise from changes in the value of the foreign currency or if the counterparties do not perform under the contracts' terms.
Foreign-denominated assets, including investment securities, and liabilities are translated into U.S. dollars at the exchange rates at period end. Purchases and sales of investment securities, income and dividends received and expenses denominated in foreign currencies are translated into U.S. dollars at the exchange rate in effect on the transaction date.
The effects of exchange rate fluctuations on investments are included with the net realized and unrealized gain (loss) on investment securities. Other foreign currency transactions resulting in realized and unrealized gain (loss) are disclosed separately.
Investment Transactions and Income. For financial reporting purposes, the Fund's investment holdings and NAV include trades executed through the end of the last business day of the period. The NAV per share for processing shareholder transactions is calculated as of the close of business of the New York Stock Exchange (NYSE), normally 4:00 p.m. Eastern time and includes trades executed through the end of the prior business day. Gains and losses on securities sold are determined on the basis of identified cost. Dividend income is recorded on the ex-dividend date, except for certain dividends from foreign securities where the ex-dividend date may have passed, which are recorded as soon as the Fund is informed of the ex-dividend date. Non-cash dividends included in dividend income, if any, are recorded at the fair market value of the securities received. Distributions received on securities that represent a return of capital or capital gain are recorded as a reduction of cost of investments and/or as a realized gain. The Fund estimates the components of distributions received that may be considered return of capital distributions or capital gain distributions. Interest income and distributions from the Fidelity Central Funds are accrued as earned. Interest income includes coupon interest and amortization of premium and accretion of discount on debt securities. Investment income is recorded net of foreign taxes withheld where recovery of such taxes is uncertain.
Expenses. Expenses directly attributable to a fund are charged to that fund. Expenses attributable to more than one fund are allocated among the respective funds on the basis of relative net assets or other appropriate methods. Expense estimates are accrued in the period to which they relate and adjustments are made when actual amounts are known.
Income Tax Information and Distributions to Shareholders. Each year, the Fund intends to qualify as a regulated investment company under Subchapter M of the Internal Revenue Code, including distributing substantially all of its taxable income and realized gains. As a result, no provision for income taxes is required. As of October 31, 2012, the Fund did not have any unrecognized tax benefits in the financial statements; nor is the Fund aware of any tax positions for which it is reasonably possible that the total amounts of unrecognized tax benefits will significantly change in the next twelve months. The Fund files a U.S. federal tax return, in addition to state and local tax returns as required. A fund's federal income tax returns are subject to examination by the Internal Revenue Service (IRS) for a period of three fiscal years after they are filed. State and local tax returns may be subject to examination for an additional fiscal year depending on the jurisdiction. Foreign taxes are provided for based on the Fund's understanding of the tax rules and rates that exist in the foreign markets in which it invests.
Distributions are declared and recorded on the ex-dividend date. Income dividends and capital gain distributions are declared separately for each class. Income and capital gain distributions are determined in accordance with income tax regulations, which may differ from GAAP. In addition, the Fund claimed a portion of the payment made to redeeming shareholders as a distribution for income tax purposes.
Capital accounts within the financial statements are adjusted for permanent book-tax differences. These adjustments have no impact on net assets or the results of operations. Temporary book-tax differences will reverse in a subsequent period.
Book-tax differences are primarily due to foreign currency transactions, passive foreign investment companies (PFIC), deferred trustees compensation, capital loss carryforwards and losses deferred due to wash sales.
The federal tax cost of investment securities and unrealized appreciation (depreciation) as of period end were as follows:
Gross unrealized appreciation | $ 1,012,238,931 |
Gross unrealized depreciation | (135,807,314) |
Net unrealized appreciation (depreciation) on securities and other investments | $ 876,431,617 |
| |
Tax Cost | $ 1,579,631,616 |
Annual Report
Notes to Financial Statements - continued
3. Significant Accounting Policies - continued
Income Tax Information and Distributions to Shareholders - continued
The tax-based components of distributable earnings as of period end were as follows:
Undistributed ordinary income | $ 34,110,342 |
Undistributed long-term capital gain | $ 164,465,752 |
Net unrealized appreciation (depreciation) | $ 876,383,667 |
The tax character of distributions paid was as follows:
| October 31, 2012 | October 31, 2011 |
Ordinary Income | $ 46,233,461 | $ 37,999,721 |
Short-Term Trading (Redemption) Fees. Shares held by investors in the Fund less than 90 days are subject to a redemption fee equal to 1.50% of the net asset value of shares redeemed. All redemption fees, which reduce the proceeds of the shareholder redemption, are retained by the Fund and accounted for as an addition to paid in capital.
New Accounting Pronouncement. In December 2011, the Financial Accounting Standards Board issued Accounting Standard Update No. 2011-11, Disclosures about Offsetting Assets and Liabilities. The update creates new disclosure requirements requiring entities to disclose both gross and net information for derivatives and other financial instruments that are either offset in the Statement of Assets and Liabilities or subject to an enforceable master netting arrangement or similar agreement. The disclosure requirements are effective for annual reporting periods beginning on or after January 1, 2013, and interim periods within those annual periods. Management is currently evaluating the impact of the update's adoption on the Fund's financial statement disclosures.
4. Purchases and Sales of Investments.
Purchases and sales of securities, other than short-term securities, aggregated $631,783,120 and $1,035,360,910, respectively.
5. Fees and Other Transactions with Affiliates.
Management Fee. FMR and its affiliates provide the Fund with investment management related services for which the Fund pays a monthly management fee. The management fee is the sum of an individual fund fee rate that is based on an annual rate of .45% of the Fund's average net assets and an annualized group fee rate that averaged .26% during the period. The group fee rate is based upon the average net assets of all the mutual funds advised by FMR. The group fee rate decreases as assets under management increase and increases as assets under management decrease. For the period, the total annual management fee rate was .71% of the Fund's average net assets.
Distribution and Service Plan Fees. In accordance with Rule 12b-1 of the 1940 Act, the Fund has adopted separate Distribution and Service Plans for each class of shares. Certain classes pay Fidelity Distributors Corporation (FDC), an affiliate of FMR, separate Distribution and Service Fees, each of which is based on an annual percentage of each class' average net assets. In addition, FDC may pay financial intermediaries for selling shares of the Fund and providing shareholder support services. For the period, the Distribution and Service Fee rates, total fees and amounts retained by FDC were as follows:
| Distribution
Fee | Service
Fee | Total Fees | Retained
by FDC |
Class A | -% | .25% | $ 205,957 | $ 4,047 |
Class T | .25% | .25% | 115,866 | 2,034 |
Class B | .75% | .25% | 119,367 | 89,525 |
Class C | .75% | .25% | 320,211 | 31,231 |
| | | $ 761,401 | $ 126,837 |
Sales Load. FDC may receive a front-end sales charge of up to 5.75% for selling Class A shares and 3.50% for selling Class T shares, some of which is paid to financial intermediaries for selling shares of the Fund. Depending on the holding period, FDC may receive contingent deferred sales charges levied on Class A, Class T, Class B, and Class C redemptions. The deferred sales charges range from 5.00% to 1.00% for Class B shares, 1.00% for Class C shares, 1.00% for certain purchases of Class A shares and .25% for certain purchases of Class T shares.
Annual Report
5. Fees and Other Transactions with Affiliates - continued
Sales Load - continued
For the period, sales charge amounts retained by FDC were as follows:
| Retained
by FDC |
Class A | $ 30,084 |
Class T | 4,827 |
Class B* | 6,323 |
Class C* | 3,913 |
| $ 45,147 |
* When Class B and Class C shares are initially sold, FDC pays commissions from its own resources to financial intermediaries through which the sales are made.
Transfer Agent Fees. Fidelity Investments Institutional Operations Company, Inc. (FIIOC), an affiliate of FMR, is the transfer, dividend disbursing and shareholder servicing agent for each class of the Fund. FIIOC receives account fees and asset-based fees that vary according to the account size and type of account of the shareholders of the respective classes of the Fund. FIIOC pays for typesetting, printing and mailing of shareholder reports, except proxy statements. For the period, transfer agent fees for each class were as follows:
| Amount | % of
Average
Net Assets |
Class A | $ 246,709 | .30 |
Class T | 72,147 | .31 |
Class B | 35,775 | .30 |
Class C | 94,503 | .30 |
Latin America | 5,720,698 | .22 |
Institutional Class | 22,166 | .24 |
| $ 6,191,998 | |
Accounting and Security Lending Fees. Fidelity Service Company, Inc. (FSC), an affiliate of FMR, maintains the Fund's accounting records. The accounting fee is based on the level of average net assets for each month. Under a separate contract, FSC administers the security lending program. The security lending fee is based on the number and duration of lending transactions.
Brokerage Commissions. The Fund placed a portion of its portfolio transactions with brokerage firms which are affiliates of the investment adviser. The commissions paid to these affiliated firms were $4,272 for the period.
Interfund Lending Program. Pursuant to an Exemptive Order issued by the SEC, the Fund, along with other registered investment companies having management contracts with FMR, may participate in an interfund lending program. This program provides an alternative credit facility allowing the funds to borrow from, or lend money to, other participating affiliated funds. At period end, there were no interfund loans outstanding. The Fund's activity in this program during the period for which loans were outstanding was as follows:
Borrower or Lender | Average Loan
Balance | Weighted Average Interest Rate | Interest
Expense |
Borrower | $ 3,888,444 | .42% | $ 409 |
6. Committed Line of Credit.
The Fund participates with other funds managed by FMR or an affiliate in a $4.25 billion credit facility (the "line of credit") to be utilized for temporary or emergency purposes to fund shareholder redemptions or for other short-term liquidity purposes. The Fund has agreed to pay commitment fees on its pro-rata portion of the line of credit, which amounted to $7,849 and is reflected in Miscellaneous expenses on the Statement of Operations. During the period, there were no borrowings on this line of credit.
7. Security Lending.
The Fund lends portfolio securities through a lending agent from time to time in order to earn additional income. For equity securities, a lending agent is used and may loan securities to certain qualified borrowers, including Fidelity Capital Markets (FCM), a broker-dealer affiliated with the Fund. On the settlement date of the loan, the Fund receives collateral (in the form of U.S. Treasury obligations, letters of credit and/or cash) against the loaned securities and maintains collateral in an amount not less than 100% of the market value of the loaned securities during the period of the loan. The
Annual Report
Notes to Financial Statements - continued
7. Security Lending - continued
market value of the loaned securities is determined at the close of business of the Fund and any additional required collateral is delivered to the Fund on the next business day. If the borrower defaults on its obligation to return the securities loaned because of insolvency or other reasons, a fund could experience delays and costs in recovering the securities loaned or in gaining access to the collateral. Any cash collateral received is invested in the Fidelity Securities Lending Cash Central Fund. The value of loaned securities and cash collateral at period end are disclosed on the Fund's Statement of Assets and Liabilities. Security lending income represents the income earned on investing cash collateral, less rebates paid to borrowers and any lending agent fees associated with the loan, plus any premium payments received for lending certain types of securities. Security lending income is presented in the Statement of Operations as a component of income from Fidelity Central Funds. Total security lending income during the period amounted to $729,136. During the period, there were no securities loaned to FCM.
8. Expense Reductions.
Many of the brokers with whom FMR places trades on behalf of the Fund provided services to the Fund in addition to trade execution. These services included payments of certain expenses on behalf of the Fund totaling $32,182 for the period. In addition, through arrangements with the Fund's custodian, credits realized as a result of uninvested cash balances were used to reduce the Fund's expenses. During the period, these credits reduced the Fund's custody expenses by $69.
9. Distributions to Shareholders.
Distributions to shareholders of each class were as follows:
Years ended October 31, | 2012 | 2011 |
From net investment income | | |
Class A | $ 1,209,540 | $ 387,219 |
Class T | 259,191 | 94,474 |
Class B | 65,750 | 23,836 |
Class C | 156,473 | 78,469 |
Latin America | 44,398,764 | 21,655,692 |
Institutional Class | 143,743 | 52,446 |
Total | $ 46,233,461 | $ 22,292,136 |
From net realized gain | | |
Class A | $ - | $ 407,401 |
Class T | - | 127,447 |
Class B | - | 68,279 |
Class C | - | 170,156 |
Latin America | - | 14,889,803 |
Institutional Class | - | 44,499 |
Total | $ - | $ 15,707,585 |
10. Share Transactions.
Transactions for each class of shares were as follows:
| Shares | Dollars |
Years ended October 31, | 2012 | 2011 | 2012 | 2011 |
Class A | �� | | | |
Shares sold | 250,504 | 412,254 | $ 12,951,683 | $ 23,066,057 |
Reinvestment of distributions | 21,636 | 12,195 | 1,072,283 | 706,536 |
Shares redeemed | (594,208) | (691,058) | (30,101,636) | (38,328,762) |
Net increase (decrease) | (322,068) | (266,609) | $ (16,077,670) | $ (14,556,169) |
Class T | | | | |
Shares sold | 45,016 | 87,514 | $ 2,321,071 | $ 4,903,931 |
Reinvestment of distributions | 5,062 | 3,721 | 251,031 | 215,680 |
Shares redeemed | (152,369) | (234,128) | (7,641,343) | (12,893,248) |
Net increase (decrease) | (102,291) | (142,893) | $ (5,069,241) | $ (7,773,637) |
Annual Report
10. Share Transactions - continued
| Shares | Dollars |
Years ended October 31, | 2012 | 2011 | 2012 | 2011 |
Class B | | | | |
Shares sold | 3,378 | 11,256 | $ 173,307 | $ 626,261 |
Reinvestment of distributions | 1,105 | 1,326 | 54,795 | 76,906 |
Shares redeemed | (80,783) | (96,470) | (4,111,766) | (5,351,844) |
Net increase (decrease) | (76,300) | (83,888) | $ (3,883,664) | $ (4,648,677) |
Class C | | | | |
Shares sold | 55,877 | 137,950 | $ 2,923,684 | $ 7,785,005 |
Reinvestment of distributions | 2,881 | 3,829 | 142,933 | 222,012 |
Shares redeemed | (172,705) | (306,800) | (8,681,626) | (16,851,535) |
Net increase (decrease) | (113,947) | (165,021) | $ (5,615,009) | $ (8,844,518) |
Latin America | | | | |
Shares sold | 6,405,350 | 8,382,994 | $ 336,749,510 | $ 474,305,310 |
Reinvestment of distributions | 860,999 | 609,933 | 42,666,908 | 35,291,350 |
Shares redeemed | (15,886,221) | (28,534,583) | (800,304,511) | (1,586,342,682) |
Net increase (decrease) | (8,619,872) | (19,541,656) | $ (420,888,093) | $ (1,076,746,022) |
Institutional Class | | | | |
Shares sold | 84,374 | 72,884 | $ 4,329,443 | $ 4,108,817 |
Reinvestment of distributions | 2,228 | 1,178 | 110,408 | 68,214 |
Shares redeemed | (107,894) | (115,010) | (5,412,186) | (6,478,861) |
Net increase (decrease) | (21,292) | (40,948) | $ (972,335) | $ (2,301,830) |
11. Other.
The Fund's organizational documents provide former and current trustees and officers with a limited indemnification against liabilities arising in connection with the performance of their duties to the Fund. In the normal course of business, the Fund may also enter into contracts that provide general indemnifications. The Fund's maximum exposure under these arrangements is unknown as this would be dependent on future claims that may be made against the Fund. The risk of material loss from such claims is considered remote.
Annual Report
Report of Independent Registered Public Accounting Firm
To the Trustees of Fidelity Investment Trust and the Shareholders of Fidelity Latin America Fund:
In our opinion, the accompanying statement of assets and liabilities, including the schedule of investments, and the related statements of operations and of changes in net assets and the financial highlights present fairly, in all material respects, the financial position of Fidelity Latin America Fund (a fund of Fidelity Investment Trust) at October 31, 2012, the results of its operations for the year then ended, the changes in its net assets for each of the two years in the period then ended and the financial highlights for each of the periods indicated, in conformity with accounting principles generally accepted in the United States of America. These financial statements and financial highlights (hereafter referred to as "financial statements") are the responsibility of the Fidelity Latin America Fund's management. Our responsibility is to express an opinion on these financial statements based on our audits. We conducted our audits of these financial statements in accordance with the standards of the Public Company Accounting Oversight Board (United States). Those standards require that we plan and perform the audit to obtain reasonable assurance about whether the financial statements are free of material misstatement. An audit includes examining, on a test basis, evidence supporting the amounts and disclosures in the financial statements, assessing the accounting principles used and significant estimates made by management, and evaluating the overall financial statement presentation. We believe that our audits, which included confirmation of securities at October 31, 2012 by correspondence with the custodian and brokers, provide a reasonable basis for our opinion.
PricewaterhouseCoopers LLP
Boston, Massachusetts
December 18, 2012
Annual Report
Trustees and Officers
The Trustees, Members of the Advisory Board, and executive officers of the trust and fund, as applicable, are listed below. The Board of Trustees governs the fund and is responsible for protecting the interests of shareholders. The Trustees are experienced executives who meet periodically throughout the year to oversee the fund's activities, review contractual arrangements with companies that provide services to the fund, oversee management of the risks associated with such activities and contractual arrangements, and review the fund's performance. Except for James C. Curvey, each of the Trustees oversees 236 funds advised by FMR or an affiliate. Mr. Curvey oversees 443 funds advised by FMR or an affiliate.
The Trustees hold office without limit in time except that (a) any Trustee may resign; (b) any Trustee may be removed by written instrument, signed by at least two-thirds of the number of Trustees prior to such removal; (c) any Trustee who requests to be retired or who has become incapacitated by illness or injury may be retired by written instrument signed by a majority of the other Trustees; and (d) any Trustee may be removed at any special meeting of shareholders by a two-thirds vote of the outstanding voting securities of the trust. Each Trustee who is not an interested person (as defined in the 1940 Act) (Independent Trustee), shall retire not later than the last day of the calendar year in which his or her 75th birthday occurs. The Independent Trustees may waive this mandatory retirement age policy with respect to individual Trustees. The executive officers and Advisory Board Members hold office without limit in time, except that any officer and Advisory Board Member may resign or may be removed by a vote of a majority of the Trustees at any regular meeting or any special meeting of the Trustees. Except as indicated, each individual has held the office shown or other offices in the same company for the past five years.
Experience, Skills, Attributes, and Qualifications of the Fund's Trustees. The Governance and Nominating Committee has adopted a statement of policy that describes the experience, qualifications, attributes, and skills that are necessary and desirable for potential Independent Trustee candidates (Statement of Policy). The Board believes that each Trustee satisfied at the time he or she was initially elected or appointed a Trustee, and continues to satisfy, the standards contemplated by the Statement of Policy. The Governance and Nominating Committee also engages professional search firms to help identify potential Independent Trustee candidates who have the experience, qualifications, attributes, and skills consistent with the Statement of Policy. From time to time, additional criteria based on the composition and skills of the current Independent Trustees, as well as experience or skills that may be appropriate in light of future changes to board composition, business conditions, and regulatory or other developments, have also been considered by the professional search firms and the Governance and Nominating Committee. In addition, the Board takes into account the Trustees' commitment and participation in Board and committee meetings, as well as their leadership of standing and ad hoc committees throughout their tenure.
In determining that a particular Trustee was and continues to be qualified to serve as a Trustee, the Board has considered a variety of criteria, none of which, in isolation, was controlling. The Board believes that, collectively, the Trustees have balanced and diverse experience, qualifications, attributes, and skills, which allow the Board to operate effectively in governing the fund and protecting the interests of shareholders. Information about the specific experience, skills, attributes, and qualifications of each Trustee, which in each case led to the Board's conclusion that the Trustee should serve (or continue to serve) as a trustee of the fund, is provided below.
Board Structure and Oversight Function. James C. Curvey is an interested person (as defined in the 1940 Act) and currently serves as Chairman. The Trustees have determined that an interested Chairman is appropriate and benefits shareholders because an interested Chairman has a personal and professional stake in the quality and continuity of services provided to the fund. Independent Trustees exercise their informed business judgment to appoint an individual of their choosing to serve as Chairman, regardless of whether the Trustee happens to be independent or a member of management. The Independent Trustees have determined that they can act independently and effectively without having an Independent Trustee serve as Chairman and that a key structural component for assuring that they are in a position to do so is for the Independent Trustees to constitute a substantial majority for the Board. The Independent Trustees also regularly meet in executive session. Ned C. Lautenbach serves as Chairman of the Independent Trustees and as such (i) acts as a liaison between the Independent Trustees and management with respect to matters important to the Independent Trustees and (ii) with management prepares agendas for Board meetings.
Fidelity funds are overseen by different Boards of Trustees. The fund's Board oversees Fidelity's equity and high income funds and another Board oversees Fidelity's investment-grade bond, money market, and asset allocation funds. The asset allocation funds may invest in Fidelity funds overseen by the fund's Board. The use of separate Boards, each with its own committee structure, allows the Trustees of each group of Fidelity funds to focus on the unique issues of the funds they oversee, including common research, investment, and operational issues. On occasion, the separate Boards establish joint committees to address issues of overlapping consequences for the Fidelity funds overseen by each Board.
The Trustees operate using a system of committees to facilitate the timely and efficient consideration of all matters of importance to the Trustees, the fund, and fund shareholders and to facilitate compliance with legal and regulatory requirements and oversight of the fund's activities and associated risks. The Board, acting through its committees, has charged FMR and its affiliates with (i) identifying events or circumstances the occurrence of which could have demonstrably adverse effects on the fund's business and/or reputation; (ii) implementing processes and controls to lessen the possibility that such events or circumstances occur or to mitigate the effects of such events or circumstances if they do occur; and (iii) creating and maintaining a system designed to evaluate continuously business and market conditions in order to facilitate the identification and implementation processes described in (i) and (ii) above. Because the day-to-day operations and activities of the fund are carried out by or through FMR, its affiliates and other service providers, the fund's exposure to risks is mitigated but not eliminated by the processes overseen by the Trustees. While each of the Board's committees has responsibility for overseeing different aspects of the fund's activities, oversight is exercised primarily through the Operations, Audit, and Compliance Committees. In addition, the Independent Trustees have worked with FMR to enhance the Board's oversight of investment and financial risks, legal and regulatory risks, technology risks, and operational risks, including the development of additional risk reporting to the Board. For example, a working group comprised of Independent Trustees and FMR has worked and continues to work to review the Fidelity funds' valuation-related activities, reporting and risk management. Appropriate personnel, including but not limited to the fund's Chief Compliance Officer (CCO), FMR's internal auditor, the independent accountants, the fund's Treasurer and portfolio management personnel, make periodic reports to the Board's committees, as appropriate, including an annual review of FMR's risk management program for the Fidelity funds. The responsibilities of each standing committee, including their oversight responsibilities, are described further under "Standing Committees of the Fund's Trustees."
Annual Report
Trustees and Officers - continued
The fund's Statement of Additional Information (SAI) includes more information about the Trustees. To request a free copy, call Fidelity at 1-877-208-0098.
Interested Trustees*:
Correspondence intended for each Trustee who is an interested person may be sent to Fidelity Investments, 82 Devonshire Street, Boston, Massachusetts 02109.
Name, Age; Principal Occupations and Other Relevant Experience+ |
James C. Curvey (77) |
| Year of Election or Appointment: 2007 Mr. Curvey is Trustee and Chairman of the Board of Trustees of certain Trusts. Mr. Curvey also serves as Trustee (2007-present) of other investment companies advised by FMR. Mr. Curvey is a Director of Fidelity Investments Money Management, Inc. (2009-present), Director of Fidelity Research & Analysis Co. (2009-present) and Director of FMR and FMR Co., Inc. (2007-present). Mr. Curvey is also Vice Chairman (2007-present) and Director of FMR LLC. In addition, Mr. Curvey serves as an Overseer for the Boston Symphony Orchestra and a member of the Trustees of Villanova University. Previously, Mr. Curvey was the Vice Chairman (2006-2007) and Director (2000-2007) of FMR Corp. |
Ronald P. O'Hanley (55) |
| Year of Election or Appointment: 2011 Mr. O'Hanley is Director of FMR Co., Inc. (2010-present), Director of Fidelity Investments Money Management, Inc. (2010-present), Director of Fidelity Research & Analysis Company (2010-present), President of Fidelity Asset Management and Corporate Services and a member of Fidelity's Executive Committee (2010-present). Previously, Mr. O'Hanley served as President and Chief Executive Officer of BNY Mellon Asset Management (2007-2010). Mr. O'Hanley also served as Vice Chairman of Bank New York Mellon Corp. and a member of that firm's Executive Committee. Prior to the 2007 merger of The Bank of New York and Mellon Financial Corporation, he was Vice Chairman of Mellon Financial Corporation and President and Chief Executive Officer of Mellon Asset Management. He joined Mellon in February 1997. Mr. O'Hanley currently serves as Chairman of the Boston Public Library Foundation Board of Directors and sits on the Board of Directors of Beth Israel Deaconess Medical Center, the Board of Trustees of the Marine Biological Laboratory and the Advisory Board of the Maxwell School of Citizenship and Public Administration at Syracuse University. Mr. O'Hanley also chairs the Council on Asset Management for the Financial Services Roundtable and is a member of the Board of Directors of Institutional Investor's U.S. Institute. |
* Trustees have been determined to be "Interested Trustees" by virtue of, among other things, their affiliation with the trust or various entities under common control with FMR.
+ The information above includes each Trustee's principal occupation during the last five years and other information relating to the experience, attributes, and skills relevant to each Trustee's qualifications to serve as a Trustee, which led to the conclusion that each Trustee should serve as a Trustee for the fund.
Independent Trustees:
Correspondence intended for each Independent Trustee (that is, the Trustees other than the Interested Trustees) may be sent to Fidelity Investments, P.O. Box 55235, Boston, Massachusetts 02205-5235.
Name, Age; Principal Occupations and Other Relevant Experience+ |
Dennis J. Dirks (64) |
| Year of Election or Appointment: 2005 Prior to his retirement in May 2003, Mr. Dirks was Chief Operating Officer and a member of the Board of The Depository Trust & Clearing Corporation (DTCC). He also served as President, Chief Operating Officer, and Board member of The Depository Trust Company (DTC) and President and Board member of the National Securities Clearing Corporation (NSCC). In addition, Mr. Dirks served as Chief Executive Officer and Board member of the Government Securities Clearing Corporation, Chief Executive Officer and Board member of the Mortgage-Backed Securities Clearing Corporation, as a Trustee and a member of the Finance Committee of Manhattan College (2005-2008), and as a Trustee and a member of the Finance Committee of AHRC of Nassau County (2006-2008). Mr. Dirks is a member of the Independent Directors Council (IDC) Governing Council (2010-present) and Board of Directors for The Brookville Center for Children's Services, Inc. (2009-present). |
Alan J. Lacy (59) |
| Year of Election or Appointment: 2008 Mr. Lacy serves as Senior Adviser (2007-present) of Oak Hill Capital Partners, L.P. (private equity). Mr. Lacy also served as Chief Executive Officer (2000-2005) and Vice Chairman (2005-2006) of Sears Holdings Corporation and Sears, Roebuck and Co. (retail). In addition, Mr. Lacy serves as a member of the Board of Directors of Dave & Buster's Entertainment, Inc. (restaurant and entertainment complexes, 2010-present), Earth Fare, Inc. (retail grocery, 2012-present), The Hillman Companies, Inc. (hardware wholesalers, 2010-present), and Bristol-Myers Squibb Company (global pharmaceuticals, 2008-present). Mr. Lacy is a member of the Board of Trustees of The National Parks Conservation Association (2006-present). Previously, Mr. Lacy served as Chairman of the Board of Trustees of the National Parks Conservation Association (2008-2011) and as a member of the Board of Directors for the Western Union Company (global money transfer, 2006-2011). |
Ned C. Lautenbach (68) |
| Year of Election or Appointment: 2000 Mr. Lautenbach is Chairman of the Independent Trustees of the Equity and High Income Funds (2006-present). Mr. Lautenbach currently serves as the Lead Director of the Eaton Corporation Board of Directors (diversified industrial, 1997-present). Mr. Lautenbach is Chairman of the Board of Directors of the Philharmonic Center for the Arts in Naples, Florida (2012-present) and a member of the Council on Foreign Relations (1994-present). Previously, Mr. Lautenbach was a Partner/Advisory Partner at Clayton, Dubilier & Rice, LLC (private equity investment, 1998-2010), as well as a Director of Sony Corporation (2006-2007). |
Joseph Mauriello (68) |
| Year of Election or Appointment: 2008 Prior to his retirement in January 2006, Mr. Mauriello served in numerous senior management positions including Deputy Chairman and Chief Operating Officer (2004-2005), and Vice Chairman of Financial Services (2002-2004) of KPMG LLP US (professional services, 1965-2005). Mr. Mauriello currently serves as a member of the Board of Directors of XL Group plc. (global insurance and re-insurance, 2006-present). Previously, Mr. Mauriello served as a Director of the Hamilton Funds of the Bank of New York (2006-2007) and of Arcadia Resources Inc. (health care services and products, 2007-2012). |
Robert W. Selander (62) |
| Year of Election or Appointment: 2011 Previously, Mr. Selander served as a Member of the Advisory Board of Fidelity's Equity and High Income Funds (2011), Executive Vice Chairman (2010), Chief Executive Officer (2009-2010), and President and Chief Executive Officer (1997-2009) of Mastercard, Inc. |
Cornelia M. Small (68) |
| Year of Election or Appointment: 2005 Ms. Small is a member of the Board of Directors (2009-present) and Chair of the Investment Committee (2010-present) of the Teagle Foundation. Ms. Small also serves on the Investment Committee of the Berkshire Taconic Community Foundation (2008-present). Previously, Ms. Small served as Chairperson (2002-2008) and a member of the Investment Committee and Chairperson (2008-2012) and a member of the Board of Trustees of Smith College. In addition, Ms. Small served as Chief Investment Officer, Director of Global Equity Investments, and a member of the Board of Directors of Scudder, Stevens & Clark and Scudder Kemper Investments. |
William S. Stavropoulos (73) |
| Year of Election or Appointment: 2001 Mr. Stavropoulos is Vice Chairman of the Independent Trustees of the Equity and High Income Funds (2006-present). Mr. Stavropoulos serves as President and Founder of the Michigan Baseball Foundation, the Great Lakes Loons (2007-present). Mr. Stavropoulos is Chairman Emeritus of the Board of Directors of The Dow Chemical Company, where he previously served in numerous senior management positions, including President, CEO (1995-2000; 2002-2004), Chairman of the Executive Committee (2000-2006), and as a member of the Board of Directors (1990-2006). Currently, Mr. Stavropoulos is a Director of Univar Inc. (global distributor of commodity and specialty chemicals, Chairman from 2010-May 2012 and Lead Director from May 2012-present), Teradata Corporation (data warehousing and technology solutions, 2008-present), Maersk Inc. (industrial conglomerate), and Tyco International, Ltd. (multinational manufacturing and services, 2007-present), and a member of the Advisory Board for Metalmark Capital LLC (private equity investment, 2005-present). Mr. Stavropoulos is an operating advisor to Clayton, Dubilier & Rice, LLC (private equity investment). In addition, Mr. Stavropoulos is a member of the University of Notre Dame Advisory Council for the College of Science, a Trustee of the Rollin L. Gerstacker Foundation, and a Director of the Naples Philharmonic Center for the Arts. Previously, Mr. Stavropoulos served as a Director of Chemical Financial Corporation (bank holding company, 1993-2012). |
David M. Thomas (63) |
| Year of Election or Appointment: 2008 Previously, Mr. Thomas served as Executive Chairman (2005-2006) and Chairman and Chief Executive Officer (2000-2005) of IMS Health, Inc. (pharmaceutical and healthcare information solutions), and a Director of Fortune Brands, Inc. (consumer products, 2000-2011). In addition, Mr. Thomas serves as Non-Executive Chairman of the Board of Directors of Fortune Brands Home and Security (home and security products, 2011-present), and as a member of the Board of Directors of Interpublic Group of Companies, Inc. (marketing communication, 2004-present). |
Michael E. Wiley (62) |
| Year of Election or Appointment: 2008 Mr. Wiley also serves as a Director of Asia Pacific Exploration Consolidated (international oil and gas exploration and production, 2008-present). Mr. Wiley serves as a Director of Tesoro Corporation (independent oil refiner and marketer, 2005-present), and a Director of Bill Barrett Corporation (exploration and production, 2005-present). In addition, Mr. Wiley also serves as a Director of Post Oak Bank (privately-held bank, 2004-present). Previously, Mr. Wiley served as a member of the Board of Trustees of the University of Tulsa (2000-2006; 2007-2010), as a Senior Energy Advisor of Katzenbach Partners, LLC (consulting, 2006-2007), as an Advisory Director of Riverstone Holdings (private investment), Chairman, President, and CEO of Baker Hughes, Inc. (oilfield services, 2000-2004), and as Director of Spinnaker Exploration Company (exploration and production, 2001-2005). |
+ The information above includes each Trustee's principal occupation during the last five years and other information relating to the experience, attributes, and skills relevant to each Trustee's qualifications to serve as a Trustee, which led to the conclusion that each Trustee should serve as a Trustee for the fund.
Advisory Board Members and Executive Officers:
Correspondence intended for David A. Rosow and Garnett A. Smith may be sent to Fidelity Investments, P.O. Box 55235, Boston, Massachusetts 02205-5235. Correspondence intended for each executive officer, Edward C. Johnson 3d, and Peter S. Lynch may be sent to Fidelity Investments, 82 Devonshire Street, Boston, Massachusetts 02109.
Name, Age; Principal Occupation |
Edward C. Johnson 3d (82) |
| Year of Election or Appointment: 2011 Member of the Advisory Board of Fidelity's Equity and High Income Funds. Mr. Johnson serves as Chief Executive Officer, Chairman, and a Director of FMR LLC, and also serves as Chairman and Director of FIL Limited. Previously, Mr. Johnson served as a Trustee and Chairman of the Board of certain Fidelity Trusts, Chairman and a Director of FMR, Chairman and a Director of FMR Co., Inc., and President of FMR LLC (2006-2007). |
Peter S. Lynch (68) |
| Year of Election or Appointment: 2003 Member of the Advisory Board of Fidelity's Equity and High Income Funds. Mr. Lynch is Vice Chairman and a Director of FMR and FMR Co., Inc. In addition, Mr. Lynch serves as a Trustee of Boston College and as the Chairman of the Inner-City Scholarship Fund. Previously, Mr. Lynch served on the Special Olympics International Board of Directors (1997-2006). |
David A. Rosow (70) |
| Year of Election or Appointment: 2012 Member of the Advisory Board of Fidelity's Equity and High Income Funds. Chairman and Chief Executive Officer of International Golf Group, Inc. (golf course development, 1989-present). Previously, Mr. Rosow served as Chairman and Chief Executive Officer of Rosow & Company, Inc. (private investment company, 1989-2011), a Lead Director of Hudson United Bancorp (2001-2006) and as a Director of TD Banknorth (1996-2006). In addition, Mr. Rosow is a member (2008-present) and President (2009-present) of the Town Council of Palm Beach, Florida. |
Garnett A. Smith (65) |
| Year of Election or Appointment: 2012 Member of the Advisory Board of Fidelity's Equity and High Income Funds. Prior to Mr. Smith's retirement, he served as Chairman and Chief Executive Officer of Inbrand Corp. (manufacturer of personal absorbent products, 1990-1997). He also served as President (1986-1990) of Inbrand Corp. Prior to his employment with Inbrand Corp., he was employed by a retail fabric chain and North Carolina National Bank. In addition, Mr. Smith is a board member of the Jackson Hole Land Trust (2009-present). |
Kenneth B. Robins (43) |
| Year of Election or Appointment: 2008 President and Treasurer of Fidelity's Equity and High Income Funds. Mr. Robins also serves as President and Treasurer (2010-present) and Assistant Treasurer (2009-present) of other Fidelity funds and is an employee of Fidelity Investments (2004-present). Previously, Mr. Robins served as Deputy Treasurer of the Fidelity funds (2005-2008) and Treasurer and Chief Financial Officer of The North Carolina Capital Management Trust: Cash and Term Portfolios (2006-2008). |
Bruce T. Herring (47) |
| Year of Election or Appointment: 2006 Vice President of certain Equity Funds. Mr. Herring also serves as President of Fidelity Research & Analysis Company (2010-present), Chief Investment Officer and Director of Fidelity Management & Research (U.K.) Inc. (2010-present) and Group Chief Investment Officer of FMR. Previously, Mr. Herring served as Vice President (2005-2006) and Senior Vice President (2006-2007) of Fidelity Management & Research Company, Vice President of FMR Co., Inc. (2001-2007) and as a portfolio manager for Fidelity U.S. Equity Funds. |
Brian B. Hogan (48) |
| Year of Election or Appointment: 2009 Vice President of Equity and High Income Funds. Mr. Hogan also serves as President of FMR's Equity Division (2009-present). Previously, Mr. Hogan served as Senior Vice President, Equity Research of FMR (2006-2009) and as a portfolio manager. |
Scott C. Goebel (44) |
| Year of Election or Appointment: 2008 Secretary and Chief Legal Officer (CLO) of the Fidelity funds. Mr. Goebel also serves as Secretary of Fidelity Investments Money Management, Inc. (FIMM) (2010-present) and Fidelity Research and Analysis Company (FRAC) (2010-present); Secretary and CLO of The North Carolina Capital Management Trust: Cash and Term Portfolios (2008-present); General Counsel, Secretary, and Senior Vice President of FMR (2008-present) and FMR Co., Inc. (2008-present); employed by FMR LLC or an affiliate (2001-present); Chief Legal Officer of Fidelity Management & Research (Hong Kong) Limited (2008-present) and Assistant Secretary of Fidelity Management & Research (Japan) Inc. (2008-present), and Fidelity Management & Research (U.K.) Inc. (2008-present). Previously, Mr. Goebel served as Assistant Secretary of FIMM (2008-2010), FRAC (2008-2010), and the Funds (2007-2008) and as Vice President and Secretary of Fidelity Distributors Corporation (FDC) (2005-2007). |
William C. Coffey (43) |
| Year of Election or Appointment: 2009 Assistant Secretary of Fidelity's Equity and High Income Funds. Mr. Coffey also serves as Senior Vice President and Deputy General Counsel of FMR LLC (2010-present), and is an employee of Fidelity Investments. Previously, Mr. Coffey served as Vice President and Associate General Counsel of FMR LLC (2005-2009). |
Elizabeth Paige Baumann (44) |
| Year of Election or Appointment: 2012 Anti-Money Laundering (AML) Officer of the Fidelity funds. Ms. Baumann also serves as AML Officer of The North Carolina Capital Management Trust: Cash and Term Portfolios (2012-present), Chief AML Officer of FMR LLC (2012-present), and is an employee of Fidelity Investments. Previously, Ms. Baumann served as Vice President and Deputy Anti-Money Laundering Officer (2007-2012). |
Christine Reynolds (54) |
| Year of Election or Appointment: 2008 Chief Financial Officer of the Fidelity funds. Ms. Reynolds became President of Fidelity Pricing and Cash Management Services (FPCMS) in August 2008. Ms. Reynolds served as Chief Operating Officer of FPCMS (2007-2008). Previously, Ms. Reynolds served as President, Treasurer, and Anti-Money Laundering officer of the Fidelity funds (2004-2007). |
Joseph A. Hanlon (44) |
| Year of Election or Appointment: 2012 Chief Compliance Officer of Fidelity's Equity and High Income Funds. Mr. Hanlon serves as Compliance Officer of FMR, FMR Co., Inc., Fidelity Investments Money Management, Inc. (FIMM), Fidelity Research and Analysis Company (FRAC), Fidelity Management & Research (Japan) Inc., Fidelity Management & Research (U.K.) Inc., Fidelity Management & Research (Hong Kong), and Strategic Advisers, Inc. (2009-present), as Senior Vice President of the Fidelity Asset Management Division (2009-present), and is an employee of Fidelity Investments. |
Joseph F. Zambello (55) |
| Year of Election or Appointment: 2011 Deputy Treasurer of the Fidelity funds. Mr. Zambello is an employee of Fidelity Investments. Previously, Mr. Zambello served as Vice President of FMR's Program Management Group (2009-2011) and Vice President of the Transfer Agent Oversight Group (2005-2009). |
Adrien E. Deberghes (45) |
| Year of Election or Appointment: 2008 Deputy Treasurer of Fidelity's Equity and High Income Funds. Mr. Deberghes also serves as Vice President (2011-present) and Assistant Treasurer (2010-present) of other Fidelity funds, and is an employee of Fidelity Investments (2008-present). Previously, Mr. Deberghes served as Senior Vice President of Mutual Fund Administration at State Street Corporation (2007-2008), Senior Director of Mutual Fund Administration at Investors Bank & Trust (2005-2007), and Director of Finance for Dunkin' Brands (2000-2005). |
Stephen Sadoski (41) |
| Year of Election or Appointment: 2012 Deputy Treasurer of Fidelity's Equity and High Income Funds. Mr. Sadoski also serves as Assistant Treasurer of other Fidelity funds (2012-present) and is an employee of Fidelity Investments (2012-present). Previously, Mr. Sadoski served as an assistant chief accountant in the Division of Investment Management of the Securities and Exchange Commission (SEC) (2009-2012) and as a senior manager at Deloitte & Touche (1997-2009). |
Stephanie J. Dorsey (43) |
| Year of Election or Appointment: 2010 Assistant Treasurer of Fidelity's Equity and High Income Funds. Ms. Dorsey also serves as Deputy Treasurer of other Fidelity funds (2008-present) and is an employee of Fidelity Investments (2008-present). Previously, Ms. Dorsey served as Treasurer (2004-2008) of the JPMorgan Mutual Funds and Vice President (2004-2008) of JPMorgan Chase Bank. |
John R. Hebble (54) |
| Year of Election or Appointment: 2009 Assistant Treasurer of Fidelity's Equity and High Income Funds. Mr. Hebble also serves as President (2011-present), Treasurer, and Chief Financial Officer of The North Carolina Capital Management Trust: Cash and Term Portfolios (2008-present), President and Treasurer of other Fidelity funds (2008-present) and is an employee of Fidelity Investments. |
Gary W. Ryan (54) |
| Year of Election or Appointment: 2005 Assistant Treasurer of the Fidelity funds. Mr. Ryan is an employee of Fidelity Investments. Previously, Mr. Ryan served as Vice President of Fund Reporting in Fidelity Pricing and Cash Management Services (FPCMS) (1999-2005). |
Jonathan Davis (44) |
| Year of Election or Appointment: 2010 Assistant Treasurer of the Fidelity funds. Mr. Davis is also Assistant Treasurer of Fidelity Rutland Square Trust II and Fidelity Commonwealth Trust II. Mr. Davis is an employee of Fidelity Investments. Previously, Mr. Davis served as Vice President and Associate General Counsel of FMR LLC (2003-2010). |
Annual Report
Distributions (Unaudited)
The Board of Trustees of Fidelity Latin America Fund voted to pay to shareholders of record at the opening of business on record date, the following distributions per share derived from capital gains realized from sales of portfolio securities and dividends derived from net investment income:
| Pay Date | Record Date | Dividends | Capital Gains |
Class A | 12/10/2012 | 12/07/2012 | $0.785 | $3.450 |
| | | | |
Class T | 12/10/2012 | 12/07/2012 | $0.632 | $3.450 |
| | | | |
Class B | 12/10/2012 | 12/07/2012 | $0.310 | $3.450 |
| | | | |
Class C | 12/10/2012 | 12/07/2012 | $0.355 | $3.450 |
The fund hereby designates as a capital gain dividend with respect to the taxable year ended October 31, 2012, $198,275,480, or, if subsequently determined to be different, the net capital gain of such year.
A percentage of the dividends distributed during the fiscal year qualify for the dividends-received deduction for corporate shareholders.
| December 2, 2011 | December 28, 2011 |
Class A | 1% | 4% |
Class T | 1% | 4% |
Class B | 2% | 4% |
Class C | 2% | 4% |
A percentage of the dividends distributed during the fiscal year may be taken into account as a dividend for the purposes of the maximum rate under section 1(h)(11) of the Internal Revenue Code.
| December 2, 2011 | December 28, 2011 |
Class A | 100% | 65% |
Class T | 100% | 65% |
Class B | 100% | 65% |
Class C | 100% | 65% |
The amounts per share which represent income derived from sources within, and taxes paid to, foreign countries or possessions of the United States are as follows:
| Pay Date | Income | Taxes |
Class A | 12/05/11 | $0.864 | $0.1806 |
Class A | 12/29/11 | $0.015 | $0.0000 |
Class T | 12/05/11 | $0.696 | $0.1806 |
Class T | 12/29/11 | $0.015 | $0.0000 |
Class B | 12/05/11 | $0.412 | $0.1806 |
Class B | 12/29/11 | $0.015 | $0.0000 |
Class C | 12/05/11 | $0.400 | $0.1806 |
Class C | 12/29/11 | $0.015 | $0.0000 |
The fund will notify shareholders in January 2013 of amounts for use in preparing 2012 income tax returns.
Annual Report
Board Approval of Investment Advisory Contracts and Management Fees
Fidelity Latin America Fund
Each year, the Board of Trustees, including the Independent Trustees (together, the Board), votes on the renewal of the management contract and sub-advisory agreements (together, the Advisory Contracts) for the fund. The Board, assisted by the advice of fund counsel and Independent Trustees' counsel, requests and considers a broad range of information relevant to the renewal of the Advisory Contracts throughout the year.
The Board meets regularly and, at each of its meetings, considers factors that are relevant to its annual consideration of the renewal of the fund's Advisory Contracts, including the services and support provided to the fund and its shareholders. The Board has established various standing committees, each composed of and chaired by Independent Trustees with varying backgrounds, to which the Board has assigned specific subject matter responsibilities in order to enhance effective decision-making by the Board. The Board, acting directly and through its Committees, requests and receives information concerning the annual consideration of the renewal of the fund's Advisory Contracts. The Board also meets as needed to consider matters specifically related to the Board's annual consideration of the renewal of Advisory Contracts. Members of the Board may also meet with trustees of other Fidelity funds through ad hoc joint committees to discuss certain matters relevant to the Fidelity funds.
At its July 2012 meeting, the Board of Trustees, including the Independent Trustees, unanimously determined to renew the fund's Advisory Contracts. In reaching its determination, the Board considered all factors it believed relevant, including (i) the nature, extent, and quality of the services to be provided to the fund and its shareholders (including the investment performance of the fund); (ii) the competitiveness of the fund's management fee and total expense ratio relative to peer funds; (iii) the total costs of the services to be provided by and the profits to be realized by Fidelity from its relationship with the fund; (iv) the extent to which economies of scale exist and would be realized as the fund grows; and (v) whether fee levels reflect these economies of scale, if any, for the benefit of fund shareholders.
In considering whether to renew the Advisory Contracts for the fund, the Board reached a determination, with the assistance of fund counsel and Independent Trustees' counsel and through the exercise of its business judgment, that the renewal of the Advisory Contracts is in the best interests of the fund and its shareholders and that the compensation payable under the Advisory Contracts is fair and reasonable. The Board's decision to renew the Advisory Contracts was not based on any single factor, but rather was based on a comprehensive consideration of all the information provided to the Board at its meetings throughout the year. The Board, in reaching its determination to renew the Advisory Contracts, is aware that shareholders in the fund have a broad range of investment choices available to them, including a wide choice among mutual funds offered by Fidelity's competitors, and that the fund's shareholders, who have the opportunity to review and weigh the disclosure provided by the fund in its prospectus and other public disclosures, have chosen to invest in this fund, managed by Fidelity.
Nature, Extent, and Quality of Services Provided. The Board considered the staffing within the investment adviser, FMR, and the sub-advisers (together, the Investment Advisers), including the backgrounds of the fund's investment personnel, and also considered the fund's investment objective, strategies, and related investment philosophy. The Independent Trustees also had discussions with senior management of Fidelity's investment operations and investment groups. The Board considered the structure of the portfolio manager compensation program and whether this structure provides appropriate incentives to act in the best interests of the fund.
Resources Dedicated to Investment Management and Support Services. The Board and the Fund Oversight and Research Committees reviewed the general qualifications and capabilities of the Investment Advisers' investment staff, including its size, education, experience, and resources, as well as the Investment Advisers' approach to recruiting, training, managing, and compensating investment personnel. The Board also noted that FMR has continued to increase the resources devoted to non-U.S. offices, including expansion of Fidelity's global investment organization. The Board noted that Fidelity's analysts have extensive resources, tools and capabilities that allow them to conduct sophisticated quantitative and fundamental analysis, as well as credit analysis of issuers, counterparties and guarantors. The Board also believes that Fidelity's investment professionals have sufficient access to global information and data so as to provide competitive investment results over time, and that those professionals also have access to sophisticated tools that permit them to assess portfolio construction and risk and performance attribution characteristics continuously, as well as to transmit new information and research conclusions rapidly around the world. Additionally, in its deliberations, the Board considered the Investment Advisers' trading and risk management capabilities and resources, which are an integral part of the investment management process.
Shareholder and Administrative Services. The Board considered (i) the nature, extent, quality, and cost of advisory, administrative, and shareholder services performed by the Investment Advisers and their affiliates under the Advisory Contracts and under separate agreements covering transfer agency, pricing and bookkeeping, and securities lending services for the fund; (ii) the nature and extent of the supervision of third party service providers, principally custodians and subcustodians; and (iii) the resources devoted to, and the record of compliance with, the fund's compliance policies and procedures. The Board also reviewed the allocation of fund brokerage, including allocations to brokers affiliated with the Investment Advisers, the use of brokerage commissions to pay fund expenses, and the use of "soft" commission dollars to pay for research services.
The Board noted that the growth of fund assets over time across the complex allows Fidelity to reinvest in the development of services designed to enhance the value or convenience of the Fidelity funds as investment vehicles. These services include 24-hour access to account information and market information through telephone representatives and over the Internet, investor education materials and asset allocation tools, and the expanded availability of Fidelity Investor Centers.
Annual Report
Investment in a Large Fund Family. The Board considered the benefits to shareholders of investing in a Fidelity fund, including the benefits of investing in a fund that is part of a large family of funds offering a variety of investment disciplines and providing a large variety of mutual fund investor services. The Board noted that Fidelity had taken, or had made recommendations that resulted in the Fidelity funds taking, a number of actions over the previous year that benefited particular funds, including (i) continuing to dedicate additional resources to investment research and support of the senior management team that oversees asset management; (ii) persisting in efforts to enhance Fidelity's research capabilities, in particular, international research; (iii) launching new funds and making other enhancements to meet client needs for global and income-oriented solutions; (iv) continuing to launch dedicated lower cost underlying funds to meet investment management's portfolio construction needs related to expanding underlying fund options, specifically for the Freedom Fund product lines; (v) adopting a "Stock Selector" sector neutral investment approach and employing a team of portfolio managers who are sector specialists to manage certain funds; (vi) rationalizing product lines and gaining increased efficiencies through the mergers of several funds into other funds; (vii) strengthening the Spartan Index Fund product line by adding new funds and/or new low-cost institutional share classes, restructuring fund expenses to accommodate new classes, and reducing investment minimums for certain classes of shares; (viii) modifying the eligibility criteria for Institutional Class shares to increase their appeal to government entities and charitable investors; and (ix) reducing certain transfer agent fee rates.
Investment Performance. The Board considered whether the fund has operated in accordance with its investment objective, as well as its record of compliance with its investment restrictions. It also reviewed the fund's absolute investment performance for the each class, as well as the fund's relative investment performance for the each class measured over multiple periods against a broad-based securities market index. The Board noted that FMR believes that no meaningful peer group exists for the fund. The following charts considered by the Board show, over the one-, three-, and five-year periods ended December 31, 2011, the cumulative total returns of the retail class and Class B of the fund and the cumulative total returns of a broad-based securities market index ("benchmark"). The returns of the retail class and Class B show the performance of the highest performing class (based on five-year performance) and the lowest performing class (based on one-year performance), respectively.
Fidelity Latin America Fund
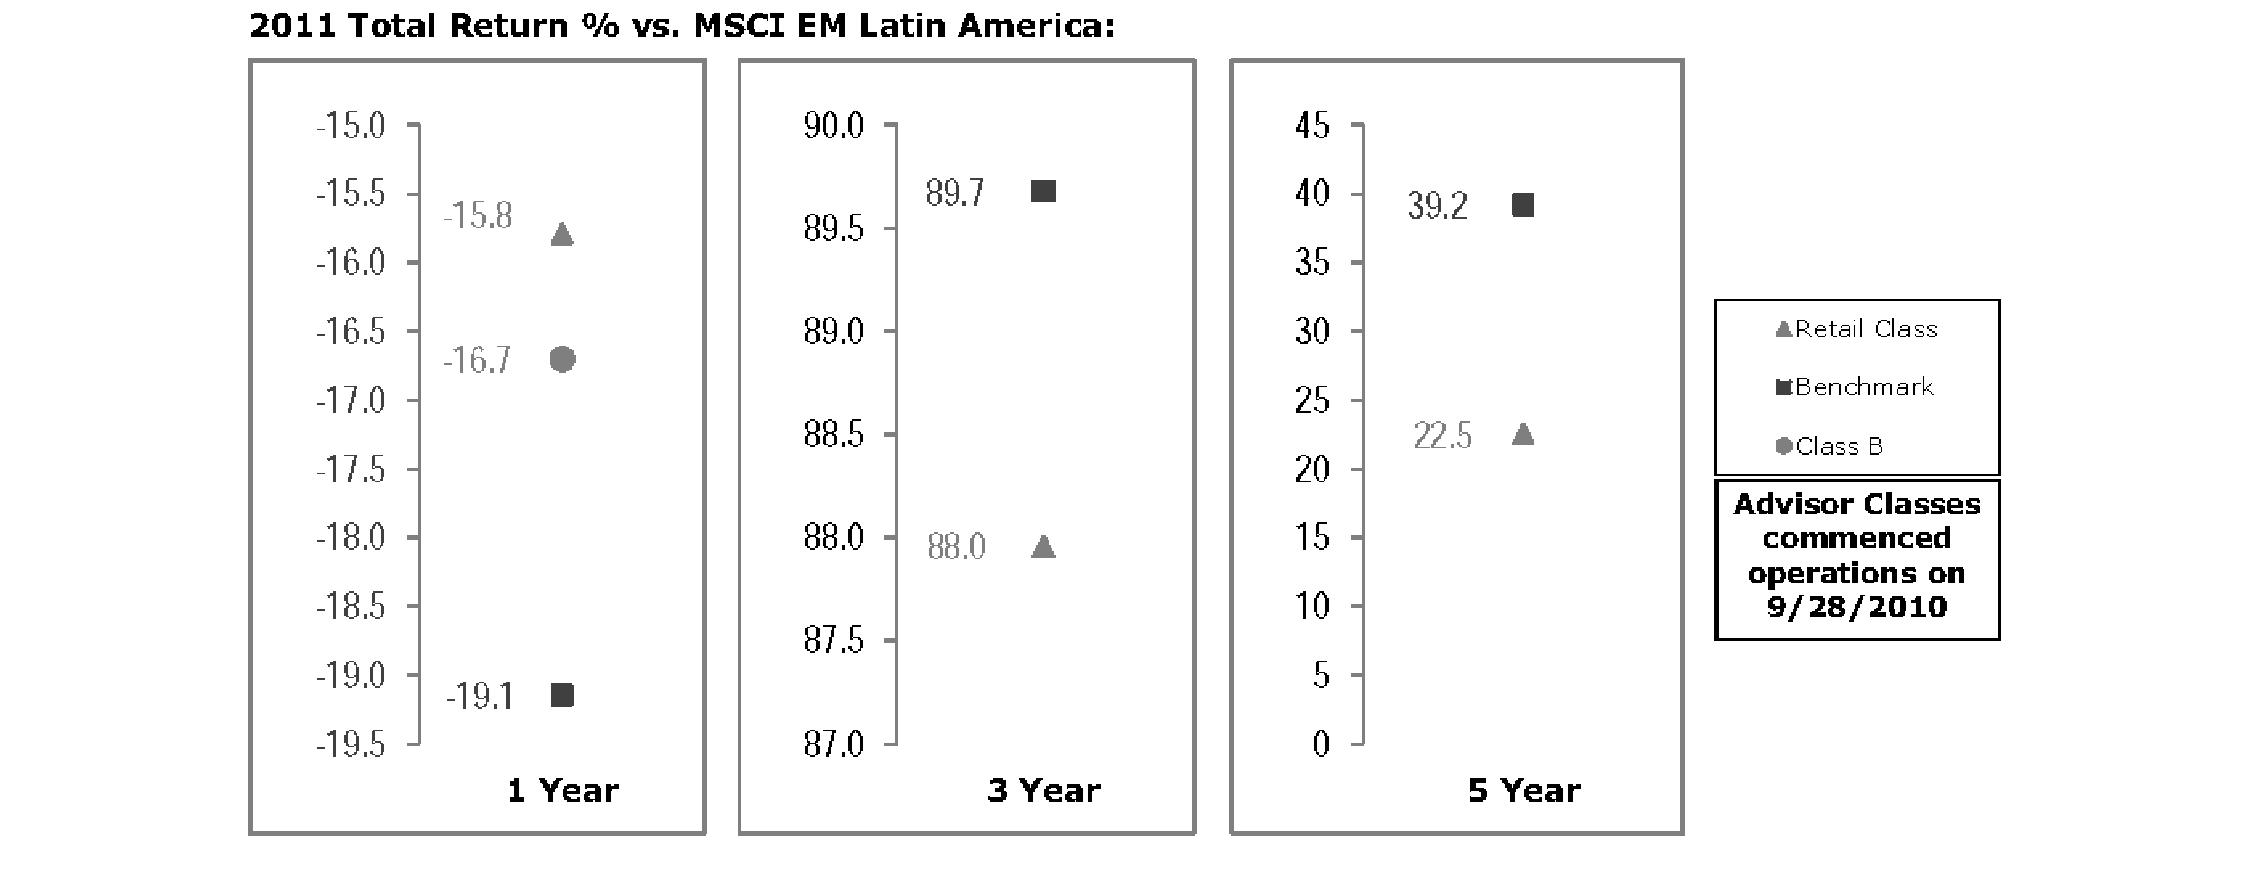
The Board noted that the investment performance of the fund was lower than its benchmark for the three- and five-year periods, although the one-year total return of the retail class compared favorably to its benchmark. The Board considered that the variations in performance among the fund's classes reflect the variations in class expenses, which result in lower performance for higher expense classes. The Board also reviewed the fund's performance since inception as well as performance in the current year.
Based on its review, the Board concluded that the nature, extent, and quality of services provided to the fund under the Advisory Contracts should benefit the fund's shareholders.
Competitiveness of Management Fee and Total Expense Ratio. The Board considered the fund's management fee and total expense ratio compared to "mapped groups" of competitive funds and classes. Fidelity creates "mapped groups" by combining similar Lipper investment objective categories that have comparable management fee characteristics. Combining Lipper investment objective categories aids the Board's management fee and total expense ratio comparisons by broadening the competitive group used for comparison and by reducing the number of universes to which various Fidelity funds are compared.
Annual Report
Board Approval of Investment Advisory Contracts and Management Fees - continued
Management Fee. The Board considered two proprietary management fee comparisons for the 12-month periods shown in the chart below. The group of Lipper funds used by the Board for management fee comparisons is referred to below as the "Total Mapped Group." The Total Mapped Group comparison focuses on a fund's standing relative to the total universe of comparable funds available to investors in terms of gross management fees before expense reimbursements or caps, and without giving effect to the fund's performance adjustment. "TMG %" represents the percentage of funds in the Total Mapped Group that had management fees that were lower than the fund's. For example, a TMG % of 7% means that 93% of the funds in the Total Mapped Group had higher management fees than the fund. The "Asset-Size Peer Group" (ASPG) comparison focuses on a fund's standing relative to non-Fidelity funds similar in size to the fund within the Total Mapped Group. The ASPG represents at least 15% of the funds in the Total Mapped Group with comparable asset size and management fee characteristics, subject to a minimum of 50 funds (or all funds in the Total Mapped Group if fewer than 50). Additional information, such as the ASPG quartile in which the fund's management fee ranked and the impact of the fund's performance adjustment, is also included in the chart and considered by the Board.
Fidelity Latin America Fund
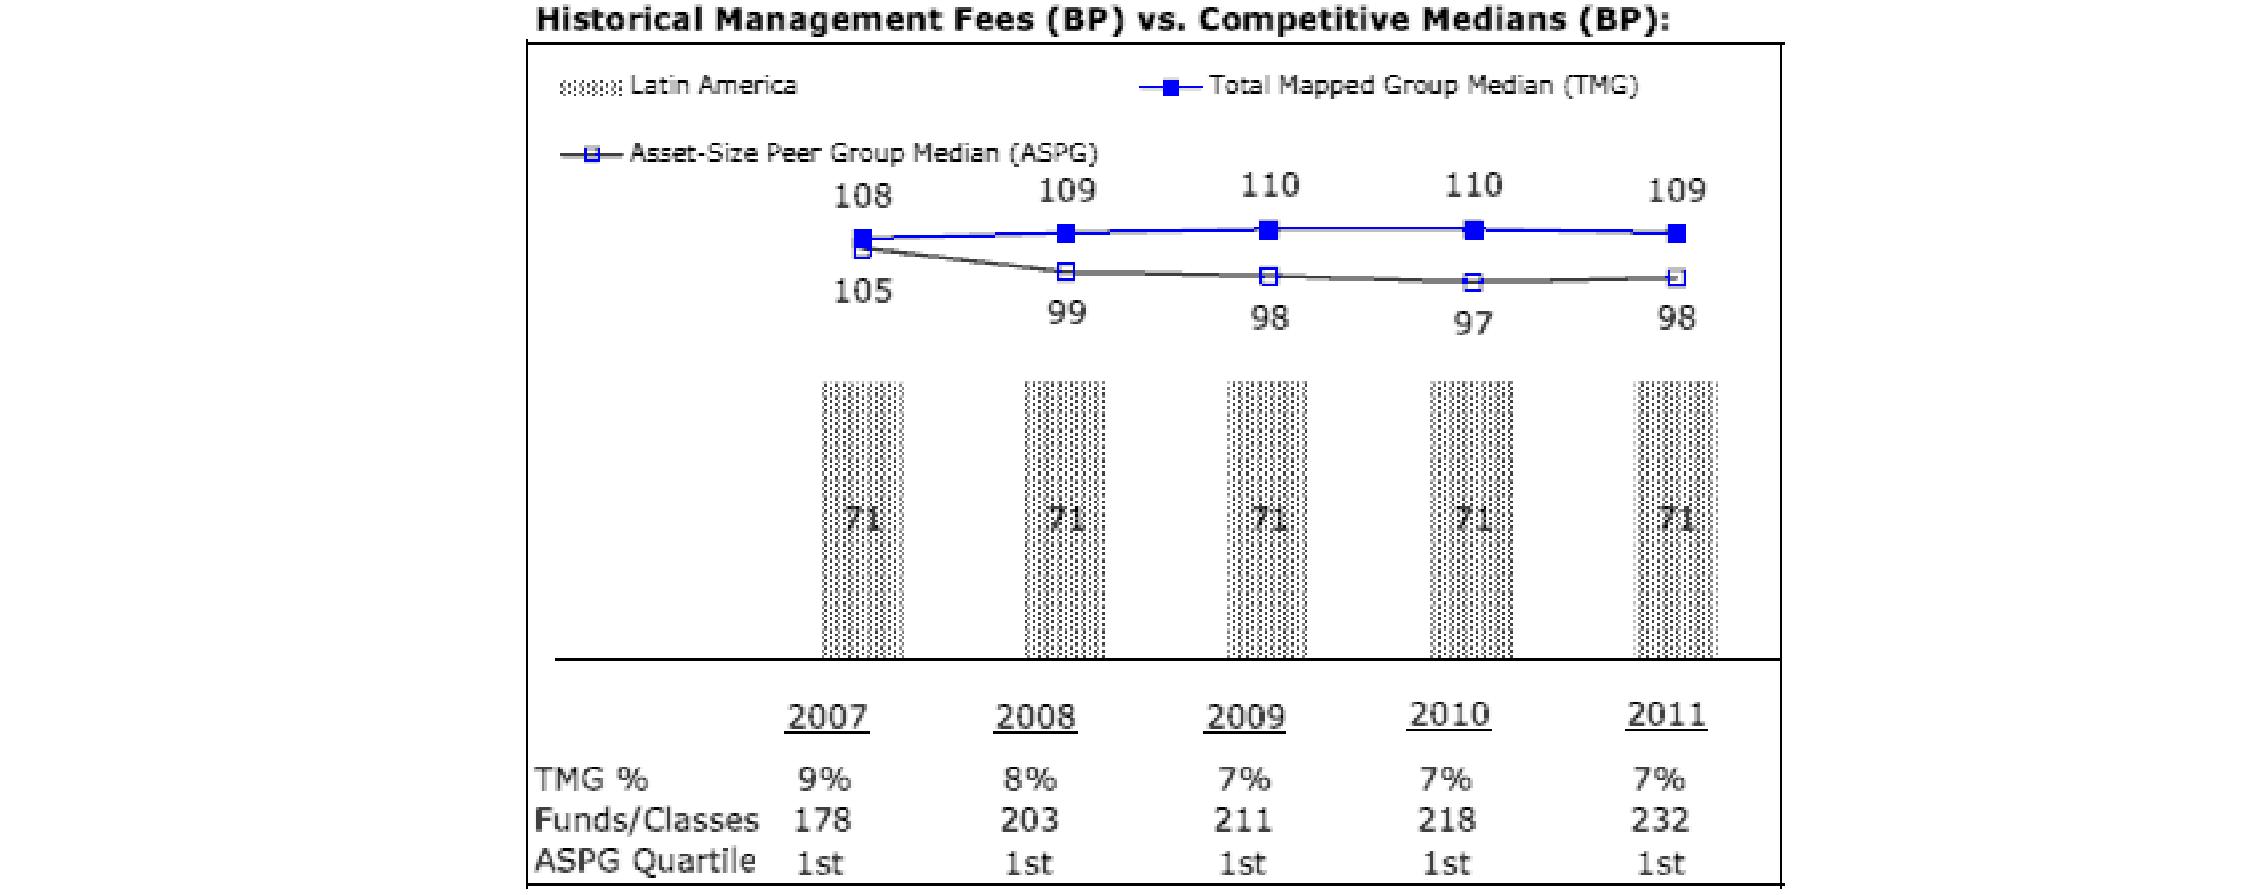
The Board noted that the fund's management fee ranked below the median of its Total Mapped Group and below the median of its ASPG for 2011.
Based on its review, the Board concluded that the fund's management fee is fair and reasonable in light of the services that the fund receives and the other factors considered.
Total Expense Ratio. In its review of each class's total expense ratio, the Board considered the fund's management fee as well as other fund or class expenses, as applicable, such as transfer agent fees, pricing and bookkeeping fees, fund-paid 12b-1 fees, and custodial, legal, and audit fees. The Board also noted the effects of any waivers and reimbursements on fees and expenses, as well as the impact of the fund's performance adjustment. As part of its review, the Board also considered the current and historical total expense ratios of each class of the fund compared to competitive fund median expenses. Each class of the fund is compared to those funds and classes in the Total Mapped Group (used by the Board for management fee comparisons) that have a similar sales load structure.
The Board noted that the total expense ratio of each class ranked below its competitive median for the period.
Fees Charged to Other Fidelity Clients. The Board also considered Fidelity fee structures and other information with respect to clients of FMR and its affiliates, such as other mutual funds advised or subadvised by FMR or its affiliates, pension plan clients, and other institutional clients. The Board noted the findings of the 2010 ad hoc joint committee (created with the board of other Fidelity funds), which reviewed and compared Fidelity's institutional investment advisory business with its business of providing services to the Fidelity funds, including the differences in services provided, fees charged, and costs incurred, as well as competition in their respective marketplaces.
Based on its review of total expense ratios and fees charged to other Fidelity clients, the Board concluded that the total expense ratio of each class of the fund was reasonable in light of the services that the fund and its shareholders receive and the other factors considered.
Costs of the Services and Profitability. The Board considered the revenues earned and the expenses incurred by Fidelity in conducting the business of developing, marketing, distributing, managing, administering and servicing the fund and its shareholders. The Board also considered the level of Fidelity's profits in respect of all the Fidelity funds.
Annual Report
On an annual basis, FMR presents to the Board Fidelity's profitability for the fund. Fidelity calculates the profitability for each fund, as well as aggregate profitability for groups of Fidelity funds and all Fidelity funds, using a series of detailed revenue and cost allocation methodologies which originate with the books and records of Fidelity on which Fidelity's audited financial statements are based. The Audit Committee of the Board reviews any significant changes from the prior year's methodologies.
PricewaterhouseCoopers LLP (PwC), independent registered public accounting firm and auditor to Fidelity and certain Fidelity funds, has been engaged annually by the Board as part of the Board's assessment of Fidelity's profitability analysis. PwC's engagement includes the review and assessment of Fidelity's methodologies used in determining the revenues and expenses attributable to Fidelity's mutual fund business, and completion of agreed-upon procedures surrounding the mathematical accuracy of fund profitability and its conformity to allocation methodologies. After considering PwC's reports issued under the engagement and information provided by Fidelity, the Board concluded that while other allocation methods may also be reasonable, Fidelity's profitability methodologies are reasonable in all material respects.
The Board also reviewed Fidelity's non-fund businesses and fall-out benefits related to the mutual fund business as well as cases where Fidelity's affiliates may benefit from or be related to the fund's business.
The Board considered the costs of the services provided by and the profits realized by Fidelity in connection with the operation of the fund and was satisfied that the profitability was not excessive in the circumstances.
Economies of Scale. The Board considered whether there have been economies of scale in respect of the management of the Fidelity funds, whether the Fidelity funds (including the fund) have appropriately benefited from any such economies of scale, and whether there is potential for realization of any further economies of scale. The Board considered the extent to which the fund will benefit from economies of scale through increased services to the fund, through waivers or reimbursements, or through fee or expense reductions. The Board also noted that in 2009, it and the board of other Fidelity funds created an ad hoc committee (the Economies of Scale Committee) to analyze whether FMR attains economies of scale in respect of the management and servicing of the Fidelity funds, whether the Fidelity funds have appropriately benefited from such economies of scale, and whether there is potential for realization of any further economies of scale.
The Board recognized that the fund's management contract incorporates a "group fee" structure, which provides for lower group fee rates as total fund assets under FMR's management increase, and for higher group fee rates as total fund assets under FMR's management decrease. FMR calculates the group fee rates based on a tiered asset "breakpoint" schedule that varies based on asset class. The Board considered that the group fee is designed to deliver the benefits of economies of scale to fund shareholders when total Fidelity fund assets increase, even if assets of any particular fund are unchanged or have declined, because some portion of Fidelity's costs are attributable to services provided to all Fidelity funds, and all funds benefit if those costs can be allocated among more assets. The Board concluded that, given the group fee structure, fund shareholders will benefit from lower management fees as assets under FMR's management increase at the fund complex level, regardless of whether Fidelity achieves any such economies of scale.
The Board concluded, taking into account the analysis of the Economies of Scale Committee, that economies of scale, if any, are being appropriately shared between fund shareholders and Fidelity.
Additional Information Requested by the Board. In order to develop fully the factual basis for consideration of the Fidelity funds' Advisory Contracts, the Board requested and received additional information on certain topics, including (i) fund performance trends, actions to be taken by FMR to improve certain funds' overall performance, and Fidelity's long-term strategies for certain funds; (ii) the potential to further rationalize the Fidelity fund lineup with the possibility of achieving savings for the funds and Fidelity; (iii) Fidelity's compensation structure for portfolio managers and other key investment personnel; (iv) the amount of the investment that each portfolio manager has made in the Fidelity fund(s) that he or she manages; (v) the realization of fall-out benefits in certain Fidelity business units; (vi) Fidelity's group fee structures, the potential impact of regulatory changes on such structures, and the rationale for the individual fee rates of certain funds; (vii) fund profitability methodology, including Fidelity's cost allocation methodology, and the impact of certain factors on fund profitability results; (viii) trends regarding industry use of performance fee structures and the possibility of implementing performance fee structures for additional funds; and (ix) the impact of net redemptions from the Fidelity funds.
Based on its evaluation of all of the conclusions noted above, and after considering all factors it believed relevant, the Board ultimately concluded that the advisory fee structures are fair and reasonable, and that the fund's Advisory Contracts should be renewed.
Annual Report
Investment Adviser
Fidelity Management & Research Company
Boston, MA
Investment Sub-Adviser(s)
FMR Co., Inc.
Fidelity Management & Research
(U.K.) Inc.
FIL Investment Advisors
FIL Investment Advisors
(UK) Limited
Fidelity Management & Research
(Hong Kong) Limited
Fidelity Management & Research
(Japan) Inc.
General Distributor
Fidelity Distributors Corporation
Smithfield, RI
Transfer and Service Agents
Fidelity Investments Institutional Operations Company, Inc.
Boston, MA
Fidelity Service Company, Inc.
Boston, MA
Custodian
Brown Brothers Harriman & Co.
Boston, MA
(Fidelity Investment logo)(registered trademark)
Corporate Headquarters
82 Devonshire St., Boston, MA 02109
www.fidelity.com
FALAA-UANN-1212
1.917416.102
Fidelity Advisor®
Latin America Fund -
Institutional Class
(Fidelity Cover Art)
Annual Report
October 31, 2012
Institutional Class is a class of
Fidelity® Latin America Fund
Contents
Performance | 3 | How the fund has done over time. |
Management's Discussion of Fund Performance | 4 | The Portfolio Manager's review of fund performance and strategy. |
Shareholder Expense Example | 5 | An example of shareholder expenses. |
Investment Changes | 6 | A summary of major shifts in the fund's investments over the past six months. |
Investments | 7 | A complete list of the fund's investments with their market values. |
Financial Statements | 9 | Statements of assets and liabilities, operations, and changes in net assets, as well as financial highlights. |
Notes | 14 | Notes to the financial statements. |
Report of Independent Registered Public Accounting Firm | 20 | |
Trustees and Officers | 21 | |
Distributions | 27 | |
Board Approval of Investment Advisory Contracts and Management Fees | 28 | |
To view a fund's proxy voting guidelines and proxy voting record for the 12-month period ended June 30, visit http://www.fidelity.com/proxyvotingresults or visit the Securities and Exchange Commission's (SEC) web site at http://www.sec.gov. You may also call 1-877-208-0098 to request a free copy of the proxy voting guidelines.
Standard & Poor's, S&P and S&P 500 are registered service marks of The McGraw-Hill Companies, Inc. and have been licensed for use by Fidelity Distributors Corporation.
Other third party marks appearing herein are the property of their respective owners.
All other marks appearing herein are registered or unregistered trademarks or service marks of FMR LLC or an affiliated company. © 2012 FMR LLC. All rights reserved.
This report and the financial statements contained herein are submitted for the general information of the shareholders of the fund. This report is not authorized for distribution to prospective investors in the fund unless preceded or accompanied by an effective prospectus.
A fund files its complete schedule of portfolio holdings with the SEC for the first and third quarters of each fiscal year on Form N-Q. Forms N-Q are available on the SEC's web site at http://www.sec.gov. A fund's Forms N-Q may be reviewed and copied at the SEC's Public Reference Room in Washington, DC. Information regarding the operation of the SEC's Public Reference Room may be obtained by calling 1-800-SEC-0330. For a complete list of a fund's portfolio holdings, view the most recent holdings listing, semiannual report, or annual report on Fidelity's web site at http://www.fidelity.com, http://www.advisor.fidelity.com, or http://www.401k.com, as applicable.
NOT FDIC INSURED • MAY LOSE VALUE • NO BANK GUARANTEE
Neither the fund nor Fidelity Distributors Corporation is a bank.
Annual Report
Performance: The Bottom Line
Average annual total return reflects the change in the value of an investment, assuming reinvestment of the class' distributions from dividend income and capital gains (the profits earned upon the sale of securities that have grown in value, if any) and assuming a constant rate of performance each year. The $10,000 table and the fund's returns do not reflect the deduction of taxes that a shareholder would pay on fund distributions or the redemption of fund shares. During periods of reimbursement by Fidelity, a fund's total return will be greater than it would be had the reimbursement not occurred. How a fund did yesterday is no guarantee of how it will do tomorrow.
Average Annual Total Returns
Periods ended October 31, 2012 | Past 1
year | Past 5
years | Past 10
years |
Institutional Class A | -4.93% | -4.13% | 21.24% |
A The initial offering of Institutional Class shares took place on September 28, 2010. Returns prior to September 28, 2010 are those of Fidelity® Latin America Fund, the original class of the fund.
$10,000 Over 10 Years
Let's say hypothetically that $10,000 was invested in Fidelity Advisor® Latin America Fund - Institutional Class on October 31, 2002. The chart shows how the value of your investment would have changed, and also shows how the MSCI® EM (Emerging Markets) Latin America Index performed over the same period. The initial offering of Institutional Class took place on September 28, 2010. See above for additional information regarding the performance of Institutional Class.
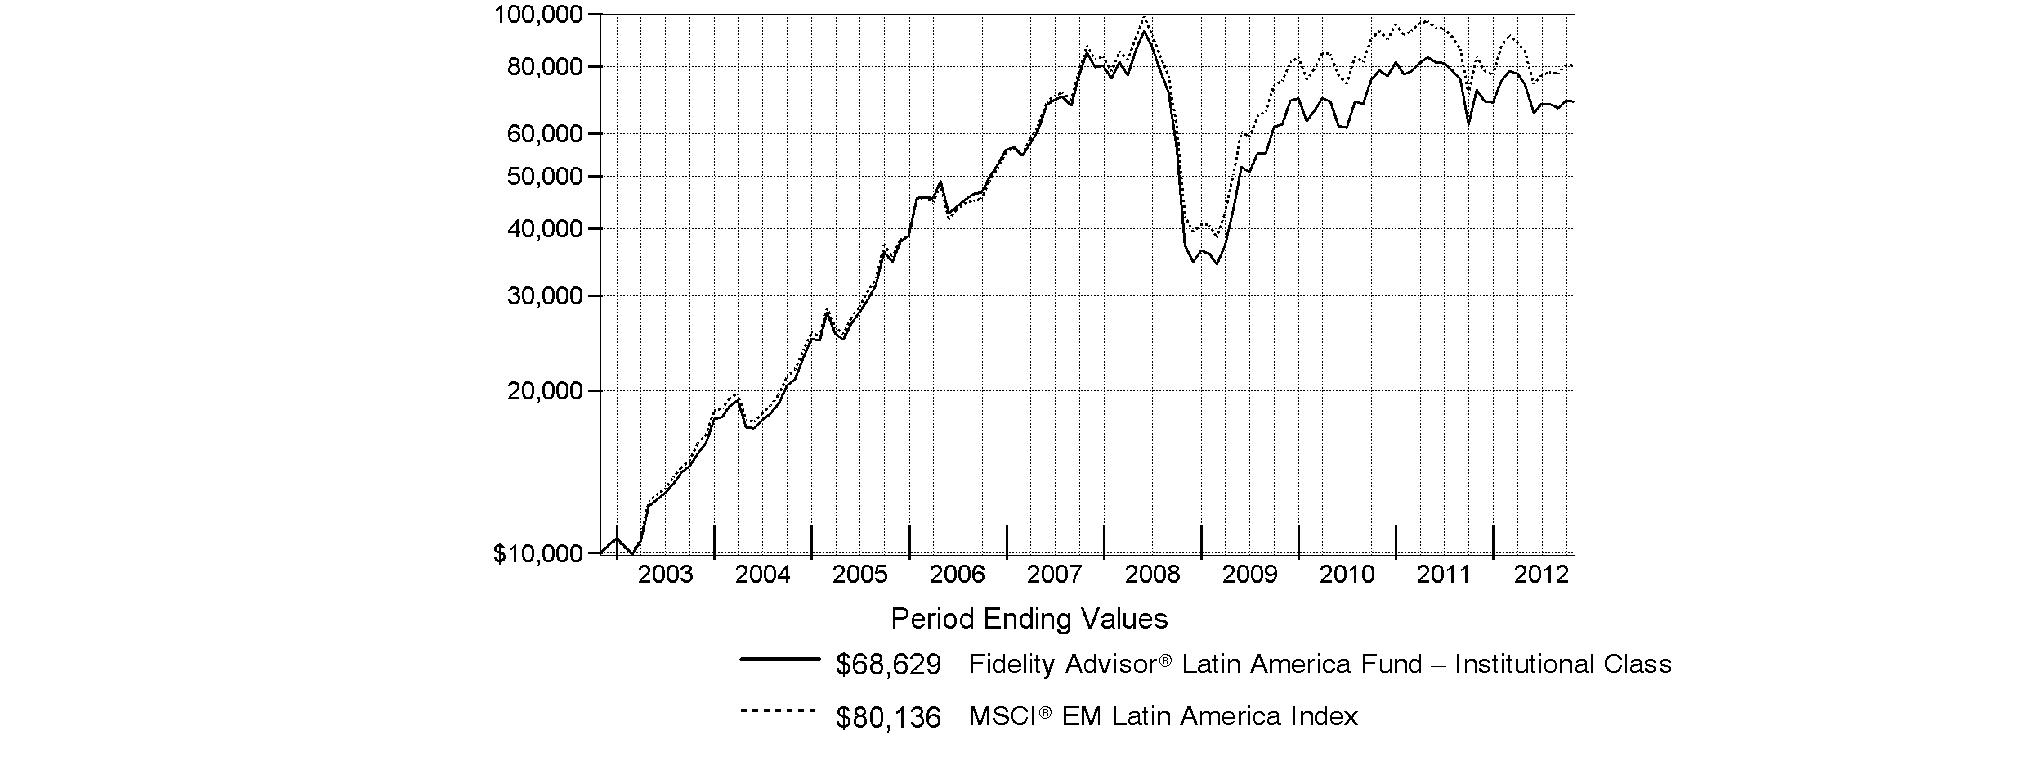
Annual Report
Management's Discussion of Fund Performance
Market Recap: Returns for most domestic and international equities fluctuated during the 12 months ending October 31, 2012, as investor sentiment towards risk vacillated amid a changing global economic landscape. U.S. stocks overcame bouts of volatility to post strong gains for the past year, extending an uptrend that began in March 2009. The broad-based S&P 500® Index advanced 15.21%, while the blue-chip-laden Dow Jones Industrial AverageSM and technology-heavy Nasdaq Composite® Index rose 12.56% and 12.21%, respectively. Performance outside of the U.S. was relatively weak, as the MSCI® ACWI® (All Country World Index) ex USA Index rose 4.11%, hampered in part by a stronger U.S. dollar. International developed-markets generally struggled during the period as macroeconomic concerns ebbed and flowed, finishing with only a modest gain. The MSCI® EAFE® Index rose 4.76% for the year, largely buttressed in the summertime by pledges of accommodative monetary action from eurozone officials, as well as signs that the U.S. housing market was on the mend. Within the index, Asia-Pacific ex Japan showed the most impressive gain, advancing roughly 10%. A number of core European components, including Germany (+11%) and Switzerland (+10%), and the U.K. (+9%), benefited from optimism about the eurozone's ability to resolve its debt woes, which helped the region outpace the index overall. Elsewhere, Japan was among the few benchmark constituents to finish in the red, returning about -3%. Emerging-markets stocks gained 2.98% for the year, as measured by the MSCI Emerging Markets Index. A general uptrend in the final five months of the period lifted the index into positive territory for the full 12 months.
Comments from Adam Kutas, Portfolio Manager of Fidelity Advisor® Latin America Fund: For the year, the fund's Institutional Class shares returned -4.93%, underperforming the -3.76% return of the MSCI® EM (Emerging Markets) Latin America Index. The fund was hurt relative to the index by stock selection in materials, banks and utilities, and, geographically, the fund suffered from security selection in Brazil and Mexico, and from an underweighting in Chile. Individual detractors included not owning Mexican cement company and index component CEMEX, investments in Brazilian bank Itau Unibanco Holding and steel manufacturer Usinas Siderurgicas de Minas Gerais, largely avoiding Mexican bank Grupo Financiero Banorte and an out-of-benchmark position in Colombian energy company Petrominerales. Conversely, positioning in consumer staples helped - particularly in food/beverage/tobacco - as did security selection in industrials and, geographically, stock selection in Chile. Among the top contributors were underweightings in energy firm OGX Petroleo E Gas and iron ore supplier Vale - both located in Brazil - an overweighting in Wal-Mart de Mexico and investments in Multiplus, the company that runs the frequent-flier loyalty program for Brazilian airline TAM, and timely ownership of TAM itself. Some stocks mentioned were sold from the fund before period end.
Note to shareholders: Fidelity Advisor® Latin America Fund may invest up to 35% of its total assets in any industry that represents more than 20% of the Latin American market. As of October 31, 2012, the fund did not have more than 25% of its total assets invested in any one industry.
The views expressed above reflect those of the portfolio manager(s) only through the end of the period as stated on the cover of this report and do not necessarily represent the views of Fidelity or any other person in the Fidelity organization. Any such views are subject to change at any time based upon market or other conditions and Fidelity disclaims any responsibility to update such views. These views may not be relied on as investment advice and, because investment decisions for a Fidelity fund are based on numerous factors, may not be relied on as an indication of trading intent on behalf of any Fidelity fund.
Annual Report
Fidelity Latin America Fund
Shareholder Expense Example
As a shareholder of the Fund, you incur two types of costs: (1) transaction costs, including sales charges (loads) on purchase payments or redemption proceeds, redemption fees and (2) ongoing costs, including management fees, distribution and/or service (12b-1) fees and other Fund expenses. This Example is intended to help you understand your ongoing costs (in dollars) of investing in the Fund and to compare these costs with the ongoing costs of investing in other mutual funds.
The Example is based on an investment of $1,000 invested at the beginning of the period and held for the entire period (May 1, 2012 to October 31, 2012).
Actual Expenses
The first line of the accompanying table for each class of the Fund provides information about actual account values and actual expenses. You may use the information in this line, together with the amount you invested, to estimate the expenses that you paid over the period. Simply divide your account value by $1,000.00 (for example, an $8,600 account value divided by $1,000.00 = 8.6), then multiply the result by the number in the first line for a class of the Fund under the heading entitled "Expenses Paid During Period" to estimate the expenses you paid on your account during this period. A small balance maintenance fee of $12.00 that is charged once a year may apply for certain accounts with a value of less than $2,000. This fee is not included in the table below. If it was, the estimate of expenses you paid during the period would be higher, and your ending account value lower, by this amount. In addition, the Fund, as a shareholder in the underlying Fidelity Central Funds, will indirectly bear its pro-rata share of the fees and expenses incurred by the underlying Fidelity Central Funds. These fees and expenses are not included in the Fund's annualized expense ratio used to calculate the expense estimate in the table below.
Hypothetical Example for Comparison Purposes
The second line of the accompanying table for each class of the Fund provides information about hypothetical account values and hypothetical expenses based on a Class' actual expense ratio and an assumed rate of return of 5% per year before expenses, which is not the Class' actual return. The hypothetical account values and expenses may not be used to estimate the actual ending account balance or expenses you paid for the period. You may use this information to compare the ongoing costs of investing in the Fund and other funds. To do so, compare this 5% hypothetical example with the 5% hypothetical examples that appear in the shareholder reports of the other funds. A small balance maintenance fee of $12.00 that is charged once a year may apply for certain accounts with a value of less than $2,000. This fee is not included in the table below. If it was, the estimate of expenses you paid during the period would be higher, and your ending account value lower, by this amount. In addition, the Fund, as a shareholder in the underlying Fidelity Central Funds, will indirectly bear its pro-rata share of the fees and expenses incurred by the underlying Fidelity Central Funds. These fees and expenses are not included in the Fund's annualized expense ratio used to calculate the expense estimate in the table below.
Please note that the expenses shown in the table are meant to highlight your ongoing costs only and do not reflect any transaction costs. Therefore, the second line of the table is useful in comparing ongoing costs only, and will not help you determine the relative total costs of owning different funds. In addition, if these transactional costs were included, your costs would have been higher.
| Annualized
Expense Ratio | Beginning
Account Value
May 1, 2012 | Ending
Account Value
October 31, 2012 | Expenses Paid
During Period*
May 1, 2012
to October 31, 2012 |
Class A | 1.35% | | | |
Actual | | $ 1,000.00 | $ 925.20 | $ 6.53 |
Hypothetical A | | $ 1,000.00 | $ 1,018.35 | $ 6.85 |
Class T | 1.61% | | | |
Actual | | $ 1,000.00 | $ 924.00 | $ 7.79 |
Hypothetical A | | $ 1,000.00 | $ 1,017.04 | $ 8.16 |
Class B | 2.10% | | | |
Actual | | $ 1,000.00 | $ 921.70 | $ 10.14 |
Hypothetical A | | $ 1,000.00 | $ 1,014.58 | $ 10.63 |
Class C | 2.10% | | | |
Actual | | $ 1,000.00 | $ 921.70 | $ 10.14 |
Hypothetical A | | $ 1,000.00 | $ 1,014.58 | $ 10.63 |
Latin America | 1.02% | | | |
Actual | | $ 1,000.00 | $ 926.80 | $ 4.94 |
Hypothetical A | | $ 1,000.00 | $ 1,020.01 | $ 5.18 |
Institutional Class | 1.04% | | | |
Actual | | $ 1,000.00 | $ 926.50 | $ 5.04 |
Hypothetical A | | $ 1,000.00 | $ 1,019.91 | $ 5.28 |
A 5% return per year before expenses
* Expenses are equal to each Class' annualized expense ratio, multiplied by the average account value over the period, multiplied by 184/366 (to reflect the one-half year period).
Annual Report
Fidelity Latin America Fund
Investment Changes (Unaudited)
Geographic Diversification (% of fund's net assets) |
As of October 31, 2012 |
 | Brazil | 46.5% | |
 | Mexico | 23.6% | |
 | Chile | 14.8% | |
 | Colombia | 6.8% | |
 | United States of America | 4.6% | |
 | Peru | 3.2% | |
 | Canada | 0.5% | |

Percentages are based on country or territory of incorporation and are adjusted for the effect of futures contracts, if applicable. |
As of April 30, 2012 |
| Brazil | 53.2% | |
| Mexico | 21.4% | |
| Chile | 13.1% | |
| Colombia | 5.7% | |
| United States of America | 2.9% | |
 | Peru | 2.7% | |
| Canada | 0.7% | |
| Luxembourg | 0.3% | |

Percentages are based on country or territory of incorporation and are adjusted for the effect of futures contracts, if applicable. |
Asset Allocation |
| % of fund's
net assets | % of fund's net assets
6 months ago |
Stocks | 99.1 | 98.9 |
Short-Term Investments and Net Other Assets (Liabilities) | 0.9 | 1.1 |
Top Ten Stocks as of October 31, 2012 |
| % of fund's
net assets | % of fund's net assets
6 months ago |
America Movil SAB de CV Series L (Mexico, Wireless Telecommunication Services) | 9.9 | 9.8 |
Petroleo Brasileiro SA - Petrobras (PN) (non-vtg.) (Brazil, Oil, Gas & Consumable Fuels) | 6.6 | 6.0 |
Itau Unibanco Holding SA (Brazil, Commercial Banks) | 6.2 | 7.0 |
Wal-Mart de Mexico SA de CV Series V (Mexico, Food & Staples Retailing) | 5.2 | 4.5 |
Petroleo Brasileiro SA - Petrobras (Brazil, Oil, Gas & Consumable Fuels) | 5.1 | 4.5 |
Companhia de Bebidas das Americas (AmBev) (PN) sponsored ADR (Brazil, Beverages) | 5.0 | 5.0 |
Vale SA (PN-A) (Brazil, Metals & Mining) | 3.4 | 4.3 |
Fomento Economico Mexicano SAB de CV sponsored ADR (Mexico, Beverages) | 2.9 | 1.6 |
Telefonica Brasil SA (Brazil, Diversified Telecommunication Services) | 2.7 | 2.7 |
Banco Santander Chile sponsored ADR (Chile, Commercial Banks) | 2.7 | 2.5 |
| 49.7 | |
Market Sectors as of October 31, 2012 |
| % of fund's
net assets | % of fund's net assets
6 months ago |
Consumer Staples | 22.6 | 19.3 |
Telecommunication Services | 16.4 | 16.1 |
Financials | 15.8 | 17.0 |
Energy | 15.2 | 14.4 |
Materials | 14.3 | 16.5 |
Utilities | 7.0 | 7.6 |
Industrials | 5.2 | 5.1 |
Consumer Discretionary | 2.6 | 2.9 |
Annual Report
Fidelity Latin America Fund
Investments October 31, 2012
Showing Percentage of Net Assets
Common Stocks - 99.0% |
| Shares | | Value |
Brazil - 46.5% |
AES Tiete SA (PN) (non-vtg.) | 4,090,245 | | $ 46,459,689 |
Banco Bradesco SA (PN) | 1,108,016 | | 17,457,232 |
CCR SA | 6,112,300 | | 53,748,395 |
Companhia de Bebidas das Americas (AmBev): | | | |
(PN) sponsored ADR | 2,981,030 | | 121,596,214 |
sponsored ADR | 345,425 | | 11,765,176 |
Companhia Energetica de Sao Paulo Series A | 921,200 | | 8,277,443 |
CPFL Energia SA sponsored ADR (d) | 992,149 | | 23,107,150 |
Eletropaulo Metropolitana SA (PN-B) | 1,784,420 | | 14,171,337 |
Itau Unibanco Holding SA | 3,511,400 | | 51,347,126 |
Itau Unibanco Holding SA sponsored ADR | 6,746,858 | | 98,369,190 |
Itausa-Investimentos Itau SA (PN) | 5,372,620 | | 23,542,659 |
Light SA | 2,222,800 | | 23,912,843 |
Lupatech SA (a) | 1,356,700 | | 1,723,387 |
Lupatech SA (Subscription Receipts) (a) | 4,975,704 | | 6,320,530 |
M. Dias Branco SA | 576,700 | | 19,364,831 |
Multiplus SA | 1,486,300 | | 34,533,122 |
Petroleo Brasileiro SA - Petrobras: | | | |
(ON) | 919,228 | | 9,730,633 |
(PN) (non-vtg.) | 8,998,371 | | 92,152,392 |
(PN) sponsored ADR (non-vtg.) | 3,282,376 | | 67,387,179 |
sponsored ADR | 5,276,220 | | 111,908,626 |
Souza Cruz SA | 3,533,000 | | 46,096,600 |
Telefonica Brasil SA | 1,239,613 | | 27,464,900 |
Telefonica Brasil SA sponsored ADR (d) | 1,706,883 | | 37,585,564 |
TIM Participacoes SA | 6,632,495 | | 23,511,959 |
TIM Participacoes SA sponsored ADR | 792,304 | | 13,770,244 |
Tractebel Energia SA | 1,024,800 | | 17,659,831 |
Usinas Siderurgicas de Minas Gerais SA - Usiminas | 1,385,750 | | 7,245,841 |
Vale SA: | | | |
(PN-A) | 1,797,500 | | 32,170,121 |
(PN-A) sponsored ADR | 2,746,620 | | 48,862,370 |
sponsored ADR | 1,614,493 | | 29,577,512 |
TOTAL BRAZIL | | 1,120,820,096 |
Canada - 0.5% |
Petrominerales Ltd. (d) | 858,100 | | 6,881,984 |
Silver Standard Resources, Inc. (a) | 330,800 | | 5,038,083 |
TOTAL CANADA | | 11,920,067 |
Chile - 14.8% |
Banco de Chile | 29,536,944 | | 4,407,061 |
Banco de Chile sponsored ADR (d) | 113,767 | | 10,059,278 |
Banco Santander Chile sponsored ADR (d) | 2,381,499 | | 64,752,958 |
CAP SA | 1,651,960 | | 56,949,104 |
Compania Cervecerias Unidas SA | 3,379,403 | | 49,165,170 |
|
| Shares | | Value |
Compania Cervecerias Unidas SA sponsored ADR | 8,028 | | $ 569,426 |
Compania Sudamericana de Vapores (a) | 36,530,345 | | 3,490,939 |
Embotelladora Andina SA: | | | |
Class A | 1,336,236 | | 6,720,755 |
Class B | 2,819,596 | | 17,814,761 |
Empresa Nacional de Electricidad SA | 5,398,806 | | 8,690,378 |
Empresa Nacional de Telecomunicaciones SA (ENTEL) | 1,984,478 | | 40,419,588 |
Empresas La Polar SA (a) | 5,500,872 | | 2,652,400 |
Enersis SA | 35,324,499 | | 12,091,749 |
Enersis SA sponsored ADR | 849,447 | | 14,389,632 |
Inversiones La Construccion SA | 362,646 | | 6,406,508 |
SACI Falabella | 5,150,235 | | 52,824,297 |
Sociedad Matriz SAAM SA | 48,961,581 | | 5,723,972 |
TOTAL CHILE | | 357,127,976 |
Colombia - 6.7% |
BanColombia SA sponsored ADR | 419,321 | | 26,844,930 |
Bolsa de Valores de Colombia | 592,791,382 | | 10,420,495 |
Ecopetrol SA | 12,622,088 | | 37,554,182 |
Ecopetrol SA ADR | 150,000 | | 8,881,500 |
Empresa de Telecomunicaciones de Bogota (a) | 40,480,188 | | 10,055,056 |
Grupo de Inversiones Suramerica | 1,624,314 | | 31,710,135 |
Inversiones Argos SA | 3,136,005 | | 35,849,576 |
TOTAL COLOMBIA | | 161,315,874 |
Mexico - 23.6% |
America Movil SAB de CV: | | | |
Series L | 5,073,400 | | 6,443,458 |
Series L sponsored ADR | 9,200,234 | | 232,673,915 |
Bolsa Mexicana de Valores SA de CV | 4,499,683 | | 9,962,258 |
Consorcio ARA SA de CV (a)(d) | 20,968,721 | | 6,581,751 |
Corporacion Inmobiliaria Vesta SAB de CV | 4,313,500 | | 6,492,980 |
Embotelladoras Arca SAB de CC | 1,379,708 | | 10,011,155 |
Fibra Uno Administracion SA de CV | 2,829,900 | | 7,456,205 |
Fomento Economico Mexicano SAB de CV sponsored ADR | 757,860 | | 68,669,695 |
Grupo Modelo SAB de CV Series C | 1,316,300 | | 11,600,811 |
Industrias Penoles SA de CV | 730,155 | | 36,376,708 |
Kimberly-Clark de Mexico SA de CV Series A | 19,110,900 | | 45,887,177 |
Wal-Mart de Mexico SA de CV Series V | 42,363,570 | | 125,110,681 |
TOTAL MEXICO | | 567,266,794 |
Peru - 3.2% |
Alicorp SA Class C | 4,479,951 | | 12,706,016 |
Compania de Minas Buenaventura SA sponsored ADR | 1,783,600 | | 63,781,536 |
TOTAL PERU | | 76,487,552 |
United States of America - 3.7% |
BPZ Energy, Inc. (a)(d) | 3,583,700 | | 10,321,056 |
Common Stocks - continued |
| Shares | | Value |
United States of America - continued |
First Cash Financial Services, Inc. (a) | 222,745 | | $ 9,947,792 |
Gran Tierra Energy, Inc. (Canada) (a) | 1,649,500 | | 8,307,369 |
LATAM Airlines Group SA sponsored ADR (d) | 1,296,540 | | 32,141,227 |
Southern Copper Corp. | 743,351 | | 28,321,673 |
TOTAL UNITED STATES OF AMERICA | | 89,039,117 |
TOTAL COMMON STOCKS (Cost $1,502,331,972) |
2,383,977,476
|
Nonconvertible Preferred Stocks - 0.1% |
| | | |
Colombia - 0.1% |
Grupo de Inversiones Suramerica
(Cost $2,763,035) | 161,141 | |
3,316,485
|
Money Market Funds - 2.9% |
| Shares | | Value |
Fidelity Cash Central Fund, 0.19% (b) | 13,182,131 | | $ 13,182,131 |
Fidelity Securities Lending Cash Central Fund, 0.19% (b)(c) | 55,587,141 | | 55,587,141 |
TOTAL MONEY MARKET FUNDS (Cost $68,769,272) |
68,769,272
|
TOTAL INVESTMENT PORTFOLIO - 102.0% (Cost $1,573,864,279) | | 2,456,063,233 |
NET OTHER ASSETS (LIABILITIES) - (2.0)% | | (47,648,097) |
NET ASSETS - 100% | $ 2,408,415,136 |
Legend |
(a) Non-income producing |
(b) Affiliated fund that is available only to investment companies and other accounts managed by Fidelity Investments. The rate quoted is the annualized seven-day yield of the fund at period end. A complete unaudited listing of the fund's holdings as of its most recent quarter end is available upon request. In addition, each Fidelity Central Fund's financial statements, which are not covered by the Fund's Report of Independent Registered Public Accounting Firm, are available on the SEC's website or upon request. |
(c) Includes cash collateral received from securities on loan. |
(d) Security or a portion of the security is on loan at period end. |
Affiliated Central Funds |
Information regarding fiscal year to date income earned by the Fund from investments in Fidelity Central Funds is as follows: |
Fund | Income earned |
Fidelity Cash Central Fund | $ 23,517 |
Fidelity Securities Lending Cash Central Fund | 729,136 |
Total | $ 752,653 |
Other Information |
Categorizations in the Schedule of Investments are based on country or territory of incorporation. |
The following is a summary of the inputs used, as of October 31, 2012, involving the Fund's assets and liabilities carried at fair value. The inputs or methodology used for valuing securities may not be an indication of the risk associated with investing in those securities. For more information on valuation inputs, and their aggregation into the levels used in the table below, please refer to the Security Valuation section in the accompanying Notes to Financial Statements. |
Valuation Inputs at Reporting Date: |
Description | Total | Level 1 | Level 2 | Level 3 |
Investments in Securities: | | | | |
Equities: | | | | |
Consumer Discretionary | $ 62,058,448 | $ 62,058,448 | $ - | $ - |
Consumer Staples | 547,078,468 | 547,078,468 | - | - |
Energy | 361,168,838 | 361,168,838 | - | - |
Financials | 382,493,292 | 382,493,292 | - | - |
Industrials | 129,637,655 | 129,637,655 | - | - |
Materials | 344,172,524 | 344,172,524 | - | - |
Telecommunication Services | 391,924,684 | 391,924,684 | - | - |
Utilities | 168,760,052 | 168,760,052 | - | - |
Money Market Funds | 68,769,272 | 68,769,272 | - | - |
Total Investments in Securities: | $ 2,456,063,233 | $ 2,456,063,233 | $ - | $ - |
See accompanying notes which are an integral part of the financial statements.
Annual Report
Fidelity Latin America Fund
Financial Statements
Statement of Assets and Liabilities
| October 31, 2012 |
| | |
Assets | | |
Investment in securities, at value (including securities loaned of $54,129,152) - See accompanying schedule: Unaffiliated issuers (cost $1,505,095,007) | $ 2,387,293,961 | |
Fidelity Central Funds (cost $68,769,272) | 68,769,272 | |
Total Investments (cost $1,573,864,279) | | $ 2,456,063,233 |
Foreign currency held at value (cost $2,696,024) | | 2,696,024 |
Receivable for investments sold | | 3,500,639 |
Receivable for fund shares sold | | 1,291,956 |
Dividends receivable | | 7,735,466 |
Distributions receivable from Fidelity Central Funds | | 77,876 |
Other receivables | | 139,075 |
Total assets | | 2,471,504,269 |
| | |
Liabilities | | |
Payable for fund shares redeemed | $ 5,116,221 | |
Accrued management fee | 1,447,471 | |
Distribution and service plan fees payable | 54,506 | |
Other affiliated payables | 557,201 | |
Other payables and accrued expenses | 326,593 | |
Collateral on securities loaned, at value | 55,587,141 | |
Total liabilities | | 63,089,133 |
| | |
Net Assets | | $ 2,408,415,136 |
Net Assets consist of: | | |
Paid in capital | | $ 1,333,456,047 |
Undistributed net investment income | | 34,109,670 |
Accumulated undistributed net realized gain (loss) on investments and foreign currency transactions | | 158,698,415 |
Net unrealized appreciation (depreciation) on investments and assets and liabilities in foreign currencies | | 882,151,004 |
Net Assets | | $ 2,408,415,136 |
Statement of Assets and Liabilities - continued
| October 31, 2012 |
| | |
Calculation of Maximum Offering Price Class A:
Net Asset Value and redemption price per share ($69,654,164 ÷ 1,422,951 shares) | | $ 48.95 |
| | |
Maximum offering price per share (100/94.25 of $48.95) | | $ 51.94 |
Class T:
Net Asset Value and redemption price per share ($19,334,062 ÷ 395,559 shares) | | $ 48.88 |
| | |
Maximum offering price per share (100/96.50 of $48.88) | | $ 50.65 |
Class B:
Net Asset Value and offering price per share ($9,492,370 ÷ 194,835 shares)A | | $ 48.72 |
| | |
Class C:
Net Asset Value and offering price per share ($27,404,926 ÷ 562,422 shares)A | | $ 48.73 |
| | |
Latin America:
Net Asset Value, offering price and redemption price per share ($2,274,601,476 ÷ 46,335,920 shares) | | $ 49.09 |
| | |
Institutional Class:
Net Asset Value, offering price and redemption price per share ($7,928,138 ÷ 161,568 shares) | | $ 49.07 |
A Redemption price per share is equal to net asset value less any applicable contingent deferred sales charge.
See accompanying notes which are an integral part of the financial statements.
Annual Report
Fidelity Latin America Fund
Financial Statements - continued
Statement of Operations
| Year ended October 31, 2012 |
| | |
Investment Income | | |
Dividends | | $ 94,540,068 |
Interest | | 2,557 |
Income from Fidelity Central Funds | | 752,653 |
Income before foreign taxes withheld | | 95,295,278 |
Less foreign taxes withheld | | (7,079,604) |
Total income | | 88,215,674 |
| | |
Expenses | | |
Management fee | $ 19,821,507 | |
Transfer agent fees | 6,191,998 | |
Distribution and service plan fees | 761,401 | |
Accounting and security lending fees | 1,233,628 | |
Custodian fees and expenses | 1,099,392 | |
Independent trustees' compensation | 18,758 | |
Registration fees | 107,722 | |
Audit | 72,875 | |
Legal | 15,046 | |
Interest | 409 | |
Miscellaneous | 32,900 | |
Total expenses before reductions | 29,355,636 | |
Expense reductions | (32,251) | 29,323,385 |
Net investment income (loss) | | 58,892,289 |
Realized and Unrealized Gain (Loss) Net realized gain (loss) on: | | |
Investment securities: | | |
Unaffiliated issuers | 297,029,381 | |
Foreign currency transactions | (2,004,709) | |
Total net realized gain (loss) | | 295,024,672 |
Change in net unrealized appreciation (depreciation) on: Investment securities | (507,618,368) | |
Assets and liabilities in foreign currencies | (146,577) | |
Total change in net unrealized appreciation (depreciation) | | (507,764,945) |
Net gain (loss) | | (212,740,273) |
Net increase (decrease) in net assets resulting from operations | | $ (153,847,984) |
Statement of Changes in Net Assets
| Year ended
October 31,
2012 | Year ended
October 31,
2011 |
Increase (Decrease) in Net Assets | | |
Operations | | |
Net investment income (loss) | $ 58,892,289 | $ 90,374,208 |
Net realized gain (loss) | 295,024,672 | 338,023,359 |
Change in net unrealized appreciation (depreciation) | (507,764,945) | (733,138,438) |
Net increase (decrease) in net assets resulting from operations | (153,847,984) | (304,740,871) |
Distributions to shareholders from net investment income | (46,233,461) | (22,292,136) |
Distributions to shareholders from net realized gain | - | (15,707,585) |
Total distributions | (46,233,461) | (37,999,721) |
Share transactions - net increase (decrease) | (452,506,012) | (1,114,870,853) |
Redemption fees | 354,338 | 763,732 |
Total increase (decrease) in net assets | (652,233,119) | (1,456,847,713) |
| | |
Net Assets | | |
Beginning of period | 3,060,648,255 | 4,517,495,968 |
End of period (including undistributed net investment income of $34,109,670 and undistributed net investment income of $34,016,290, respectively) | $ 2,408,415,136 | $ 3,060,648,255 |
See accompanying notes which are an integral part of the financial statements.
Annual Report
Financial Highlights - Class A
Years ended October 31, | 2012 | 2011 | 2010 H |
Selected Per-Share Data | | | |
Net asset value, beginning of period | $ 52.38 | $ 57.48 | $ 55.47 |
Income from Investment Operations | | | |
Net investment income (loss) E | .92 | 1.15 | .02 |
Net realized and unrealized gain (loss) | (3.66) | (5.87) | 2.79 |
Total from investment operations | (2.74) | (4.72) | 2.81 |
Distributions from net investment income | (.70) | (.19) | (.80) |
Distributions from net realized gain | - | (.20) | - |
Total distributions | (.70) | (.39) | (.80) |
Redemption fees added to paid in capital E | .01 | .01 | - K |
Net asset value, end of period | $ 48.95 | $ 52.38 | $ 57.48 |
Total Return B, C, D | (5.23)% | (8.26)% | 5.14% |
Ratios to Average Net Assets F, I | | | |
Expenses before reductions | 1.35% | 1.34% | 1.37% A |
Expenses net of fee waivers, if any | 1.35% | 1.34% | 1.37% A |
Expenses net of all reductions | 1.35% | 1.34% | 1.34% A |
Net investment income (loss) | 1.80% | 2.05% | .39% A |
Supplemental Data | | | |
Net assets, end of period (000 omitted) | $ 69,654 | $ 91,407 | $ 115,626 |
Portfolio turnover rate G | 23% | 11% | 56% J |
A Annualized B Total returns for periods of less than one year are not annualized. C Total returns would have been lower if certain expenses had not been reduced during the applicable periods shown. D Total returns do not include the effect of the sales charges. E Calculated based on average shares outstanding during the period. F Fees and expenses of any underlying Fidelity Central Funds are not included in the Fund's expense ratio. The Fund indirectly bears its proportionate share of the expenses of any underlying Fidelity Central Funds. G Amount does not include the portfolio activity of any underlying Fidelity Central Funds. H For the period September 28, 2010 (commencement of sale of shares) to October 31, 2010. I Expense ratios reflect operating expenses of the class. Expenses before reductions do not reflect amounts reimbursed by the investment adviser or reductions from brokerage service arrangements or reductions from other expense offset arrangements and do not represent the amount paid by the class during periods when reimbursements or reductions occur. Expense ratios before reductions for start-up periods may not be representative of longer-term operating periods. Expenses net of fee waivers reflect expenses after reimbursement by the investment adviser but prior to reductions from brokerage service arrangements or other expense offset arrangements. Expenses net of all reductions represent the net expenses paid by the class. J The portfolio turnover rate does not include the assets acquired in the merger. K Amount represents less than $.01 per share. |
Financial Highlights - Class T
Years ended October 31, | 2012 | 2011 | 2010 H |
Selected Per-Share Data | | | |
Net asset value, beginning of period | $ 52.27 | $ 57.47 | $ 55.47 |
Income from Investment Operations | | | |
Net investment income (loss) E | .78 | .99 | .01 |
Net realized and unrealized gain (loss) | (3.65) | (5.85) | 2.79 |
Total from investment operations | (2.87) | (4.86) | 2.80 |
Distributions from net investment income | (.53) | (.15) | (.80) |
Distributions from net realized gain | - | (.20) | - |
Total distributions | (.53) | (.35) | (.80) |
Redemption fees added to paid in capital E | .01 | .01 | - K |
Net asset value, end of period | $ 48.88 | $ 52.27 | $ 57.47 |
Total Return B, C, D | (5.49)% | (8.50)% | 5.12% |
Ratios to Average Net Assets F, I | | | |
Expenses before reductions | 1.61% | 1.61% | 1.63% A |
Expenses net of fee waivers, if any | 1.61% | 1.61% | 1.63% A |
Expenses net of all reductions | 1.61% | 1.61% | 1.60% A |
Net investment income (loss) | 1.54% | 1.78% | .13% A |
Supplemental Data | | | |
Net assets, end of period (000 omitted) | $ 19,334 | $ 26,020 | $ 36,820 |
Portfolio turnover rate G | 23% | 11% | 56% J |
A Annualized B Total returns for periods of less than one year are not annualized. C Total returns would have been lower if certain expenses had not been reduced during the applicable periods shown. D Total returns do not include the effect of the sales charges. E Calculated based on average shares outstanding during the period. F Fees and expenses of any underlying Fidelity Central Funds are not included in the Fund's expense ratio. The Fund indirectly bears its proportionate share of the expenses of any underlying Fidelity Central Funds. G Amount does not include the portfolio activity of any underlying Fidelity Central Funds. H For the period September 28, 2010 (commencement of sale of shares) to October 31, 2010. I Expense ratios reflect operating expenses of the class. Expenses before reductions do not reflect amounts reimbursed by the investment adviser or reductions from brokerage service arrangements or reductions from other expense offset arrangements and do not represent the amount paid by the class during periods when reimbursements or reductions occur. Expense ratios before reductions for start-up periods may not be representative of longer-term operating periods. Expenses net of fee waivers reflect expenses after reimbursement by the investment adviser but prior to reductions from brokerage service arrangements or other expense offset arrangements. Expenses net of all reductions represent the net expenses paid by the class. J The portfolio turnover rate does not include the assets acquired in the merger. K Amount represents less than $.01 per share. |
See accompanying notes which are an integral part of the financial statements.
Annual Report
Financial Highlights - Class B
Years ended October 31, | 2012 | 2011 | 2010 H |
Selected Per-Share Data | | | |
Net asset value, beginning of period | $ 52.06 | $ 57.44 | $ 55.47 |
Income from Investment Operations | | | |
Net investment income (loss) E | .53 | .72 | (.02) |
Net realized and unrealized gain (loss) | (3.63) | (5.84) | 2.79 |
Total from investment operations | (3.10) | (5.12) | 2.77 |
Distributions from net investment income | (.25) | (.07) | (.80) |
Distributions from net realized gain | - | (.20) | - |
Total distributions | (.25) | (.27) | (.80) |
Redemption fees added to paid in capital E | .01 | .01 | - K |
Net asset value, end of period | $ 48.72 | $ 52.06 | $ 57.44 |
Total Return B, C, D | (5.95)% | (8.94)% | 5.06% |
Ratios to Average Net Assets F, I | | | |
Expenses before reductions | 2.10% | 2.10% | 2.12% A |
Expenses net of fee waivers, if any | 2.10% | 2.10% | 2.12% A |
Expenses net of all reductions | 2.10% | 2.10% | 2.10% A |
Net investment income (loss) | 1.05% | 1.29% | (.36)% A |
Supplemental Data | | | |
Net assets, end of period (000 omitted) | $ 9,492 | $ 14,114 | $ 20,392 |
Portfolio turnover rate G | 23% | 11% | 56% J |
A Annualized B Total returns for periods of less than one year are not annualized. C Total returns would have been lower if certain expenses had not been reduced during the applicable periods shown. D Total returns do not include the effect of the contingent deferred sales charge. E Calculated based on average shares outstanding during the period. F Fees and expenses of any underlying Fidelity Central Funds are not included in the Fund's expense ratio. The Fund indirectly bears its proportionate share of the expenses of any underlying Fidelity Central Funds. G Amount does not include the portfolio activity of any underlying Fidelity Central Funds. H For the period September 28, 2010 (commencement of sale of shares) to October 31, 2010. I Expense ratios reflect operating expenses of the class. Expenses before reductions do not reflect amounts reimbursed by the investment adviser or reductions from brokerage service arrangements or reductions from other expense offset arrangements and do not represent the amount paid by the class during periods when reimbursements or reductions occur. Expense ratios before reductions for start-up periods may not be representative of longer-term operating periods. Expenses net of fee waivers reflect expenses after reimbursement by the investment adviser but prior to reductions from brokerage service arrangements or other expense offset arrangements. Expenses net of all reductions represent the net expenses paid by the class. J The portfolio turnover rate does not include the assets acquired in the merger. K Amount represents less than $.01 per share. |
Financial Highlights - Class C
Years ended October 31, | 2012 | 2011 | 2010 H |
Selected Per-Share Data | | | |
Net asset value, beginning of period | $ 52.05 | $ 57.44 | $ 55.47 |
Income from Investment Operations | | | |
Net investment income (loss) E | .54 | .73 | (.02) |
Net realized and unrealized gain (loss) | (3.64) | (5.84) | 2.79 |
Total from investment operations | (3.10) | (5.11) | 2.77 |
Distributions from net investment income | (.23) | (.09) | (.80) |
Distributions from net realized gain | - | (.20) | - |
Total distributions | (.23) | (.29) | (.80) |
Redemption fees added to paid in capital E | .01 | .01 | - K |
Net asset value, end of period | $ 48.73 | $ 52.05 | $ 57.44 |
Total Return B, C, D | (5.94)% | (8.93)% | 5.06% |
Ratios to Average Net Assets F, I | | | |
Expenses before reductions | 2.10% | 2.08% | 2.09% A |
Expenses net of fee waivers, if any | 2.10% | 2.08% | 2.09% A |
Expenses net of all reductions | 2.10% | 2.08% | 2.07% A |
Net investment income (loss) | 1.06% | 1.31% | (.34)% A |
Supplemental Data | | | |
Net assets, end of period (000 omitted) | $ 27,405 | $ 35,203 | $ 48,329 |
Portfolio turnover rate G | 23% | 11% | 56% J |
A Annualized B Total returns for periods of less than one year are not annualized. C Total returns would have been lower if certain expenses had not been reduced during the applicable periods shown. D Total returns do not include the effect of the contingent deferred sales charge. E Calculated based on average shares outstanding during the period. F Fees and expenses of any underlying Fidelity Central Funds are not included in the Fund's expense ratio. The Fund indirectly bears its proportionate share of the expenses of any underlying Fidelity Central Funds. G Amount does not include the portfolio activity of any underlying Fidelity Central Funds. H For the period September 28, 2010 (commencement of sale of shares) to October 31, 2010. I Expense ratios reflect operating expenses of the class. Expenses before reductions do not reflect amounts reimbursed by the investment adviser or reductions from brokerage service arrangements or reductions from other expense offset arrangements and do not represent the amount paid by the class during periods when reimbursements or reductions occur. Expense ratios before reductions for start-up periods may not be representative of longer-term operating periods. Expenses net of fee waivers reflect expenses after reimbursement by the investment adviser but prior to reductions from brokerage service arrangements or other expense offset arrangements. Expenses net of all reductions represent the net expenses paid by the class. J The portfolio turnover rate does not include the assets acquired in the merger. K Amount represents less than $.01 per share. |
See accompanying notes which are an integral part of the financial statements.
Annual Report
Financial Highlights - Latin America
Years ended October 31, | 2012 | 2011 | 2010 | 2009 | 2008 |
Selected Per-Share Data | | | | | |
Net asset value, beginning of period | $ 52.48 | $ 57.50 | $ 47.29 | $ 28.69 | $ 67.90 |
Income from Investment Operations | | | | | |
Net investment income (loss) B | 1.09 | 1.34 | 1.07 | .72 | .83 |
Net realized and unrealized gain (loss) | (3.67) | (5.88) | 11.00 | 18.32 | (37.74) |
Total from investment operations | (2.58) | (4.54) | 12.07 | 19.04 | (36.91) |
Distributions from net investment income | (.82) | (.29) | (1.49) | (.46) | (.65) |
Distributions from net realized gain | - | (.20) | (.39) | - | (1.72) |
Total distributions | (.82) | (.49) | (1.88) | (.46) | (2.37) |
Redemption fees added to paid in capital B | .01 | .01 | .02 | .02 | .07 |
Net asset value, end of period | $ 49.09 | $ 52.48 | $ 57.50 | $ 47.29 | $ 28.69 |
Total Return A | (4.91)% | (7.96)% | 25.91% | 67.88% | (56.20)% |
Ratios to Average Net Assets C, E | | | | | |
Expenses before reductions | 1.02% | 1.00% | 1.03% | 1.07% | 1.02% |
Expenses net of fee waivers, if any | 1.02% | 1.00% | 1.03% | 1.07% | 1.02% |
Expenses net of all reductions | 1.02% | 1.00% | 1.01% | 1.05% | 1.00% |
Net investment income (loss) | 2.14% | 2.39% | 2.10% | 2.04% | 1.41% |
Supplemental Data | | | | | |
Net assets, end of period (000 omitted) | $ 2,274,601 | $ 2,884,301 | $ 4,283,462 | $ 4,043,748 | $ 2,225,606 |
Portfolio turnover rate D | 23% | 11% | 56% F | 52% | 51% |
A Total returns would have been lower if certain expenses had not been reduced during the applicable periods shown. B Calculated based on average shares outstanding during the period. C Fees and expenses of any underlying Fidelity Central Funds are not included in the Fund's expense ratio. The Fund indirectly bears its proportionate share of the expenses of any underlying Fidelity Central Funds. D Amount does not include the portfolio activity of any underlying Fidelity Central Funds. E Expense ratios reflect operating expenses of the class. Expenses before reductions do not reflect amounts reimbursed by the investment adviser or reductions from brokerage service arrangements or reductions from other expense offset arrangements and do not represent the amount paid by the class during periods when reimbursements or reductions occur. Expenses net of fee waivers reflect expenses after reimbursement by the investment adviser but prior to reductions from brokerage service arrangements or other expense offset arrangements. Expenses net of all reductions represent the net expenses paid by the class. F The portfolio turnover rate does not include the assets acquired in the merger. |
Financial Highlights - Institutional Class
Years ended October 31, | 2012 | 2011 | 2010 G |
Selected Per-Share Data | | | |
Net asset value, beginning of period | $ 52.51 | $ 57.49 | $ 55.47 |
Income from Investment Operations | | | |
Net investment income (loss) D | 1.08 | 1.32 | .03 |
Net realized and unrealized gain (loss) | (3.67) | (5.88) | 2.79 |
Total from investment operations | (2.59) | (4.56) | 2.82 |
Distributions from net investment income | (.86) | (.23) | (.80) |
Distributions from net realized gain | - | (.20) | - |
Total distributions | (.86) | (.43) | (.80) |
Redemption fees added to paid in capital D | .01 | .01 | - J |
Net asset value, end of period | $ 49.07 | $ 52.51 | $ 57.49 |
Total Return B, C | (4.93)% | (7.98)% | 5.15% |
Ratios to Average Net Assets E, H | | | |
Expenses before reductions | 1.04% | 1.04% | 1.08% A |
Expenses net of fee waivers, if any | 1.04% | 1.04% | 1.08% A |
Expenses net of all reductions | 1.04% | 1.04% | 1.06% A |
Net investment income (loss) | 2.12% | 2.35% | .68% A |
Supplemental Data | | | |
Net assets, end of period (000 omitted) | $ 7,928 | $ 9,603 | $ 12,868 |
Portfolio turnover rate F | 23% | 11% | 56% I |
A Annualized B Total returns for periods of less than one year are not annualized. C Total returns would have been lower if certain expenses had not been reduced during the applicable periods shown. D Calculated based on average shares outstanding during the period. E Fees and expenses of any underlying Fidelity Central Funds are not included in the Fund's expense ratio. The Fund indirectly bears its proportionate share of the expenses of any underlying Fidelity Central Funds. F Amount does not include the portfolio activity of any underlying Fidelity Central Funds. G For the period September 28, 2010 (commencement of sale of shares) to October 31, 2010. H Expense ratios reflect operating expenses of the class. Expenses before reductions do not reflect amounts reimbursed by the investment adviser or reductions from brokerage service arrangements or reductions from other expense offset arrangements and do not represent the amount paid by the class during periods when reimbursements or reductions occur. Expense ratios before reductions for start-up periods may not be representative of longer-term operating periods. Expenses net of fee waivers reflect expenses after reimbursement by the investment adviser but prior to reductions from brokerage service arrangements or other expense offset arrangements. Expenses net of all reductions represent the net expenses paid by the class. I The portfolio turnover rate does not include the assets acquired in the merger. J Amount represents less than $.01 per share. |
See accompanying notes which are an integral part of the financial statements.
Annual Report
Notes to Financial Statements
For the period ended October 31, 2012
1. Organization.
Fidelity Latin America Fund (the Fund) is a non-diversified fund of Fidelity Investment Trust (the Trust) and is authorized to issue an unlimited number of shares. The Trust is registered under the Investment Company Act of 1940, as amended (the 1940 Act), as an open-end management investment company organized as a Massachusetts business trust. The Fund offers Class A, Class T, Class C, Latin America and Institutional Class shares, each of which, along with Class B shares, has equal rights as to assets and voting privileges. Class B shares are closed to new accounts and additional purchases, except for exchanges and reinvestments. Each class has exclusive voting rights with respect to matters that affect that class. Investment income, realized and unrealized capital gains and losses, the common expenses of the Fund, and certain fund-level expense reductions, if any, are allocated on a pro-rata basis to each class based on the relative net assets of each class to the total net assets of the Fund. Each class differs with respect to transfer agent and distribution and service plan fees incurred. Certain expense reductions may also differ by class. The Fund's investments in emerging markets can be subject to social, economic, regulatory, and political uncertainties and can be extremely volatile.
2. Investments in Fidelity Central Funds.
The Fund invests in Fidelity Central Funds, which are open-end investment companies available only to other investment companies and accounts managed by Fidelity Management & Research Company (FMR) and its affiliates. The Fund's Schedule of Investments lists each of the Fidelity Central Funds held as of period end, as an investment of the Fund, but does not include the underlying holdings of each Fidelity Central Fund. As an Investing Fund, the Fund indirectly bears its proportionate share of the expenses of the underlying Fidelity Central Funds.
The Money Market Central Funds seek preservation of capital and current income and are managed by Fidelity Investments Money Management, Inc. (FIMM), an affiliate of FMR.
A complete unaudited list of holdings for each Fidelity Central Fund is available upon request or at the Securities and Exchange Commission (the SEC) web site at www.sec.gov. In addition, the financial statements of the Fidelity Central Funds, which are not covered by the Fund's Report of Independent Registered Public Accounting Firm, are available on the SEC web site or upon request.
3. Significant Accounting Policies.
The financial statements have been prepared in conformity with accounting principles generally accepted in the United States of America (GAAP), which require management to make certain estimates and assumptions at the date of the financial statements. Actual results could differ from those estimates. Subsequent events, if any, through the date that the financial statements were issued have been evaluated in the preparation of the financial statements. The following summarizes the significant accounting policies of the Fund:
Security Valuation. Investments are valued as of 4:00 p.m. Eastern time on the last calendar day of the period. In accordance with valuation policies and procedures approved by the Board of Trustees (the Board), the Fund attempts to obtain prices from one or more third party pricing vendors or brokers to value its investments. When current market prices, quotations or rates are not readily available or reliable, securities will be fair valued in good faith by the FMR Fair Value Committee (the Committee), in accordance with procedures adopted by the Fund's Board. Factors used in determining fair value vary by security type and may include market or security specific events. The frequency with which these procedures are used cannot be predicted and they may be utilized to a significant extent. The Committee oversees the Fund's valuation policies and procedures and is responsible for approving and reporting to the Board all fair value determinations.
The Fund categorizes the inputs to valuation techniques used to value its investments into a disclosure hierarchy consisting of three levels as shown below:
Level 1 - quoted prices in active markets for identical investments
Level 2 - other significant observable inputs (including quoted prices for similar investments, interest rates, prepayment speeds, etc.)
Level 3 - unobservable inputs (including the Fund's own assumptions based on the best information available)
Valuation techniques used to value the Fund's investments by major category are as follows:
Equity securities, including restricted securities, for which market quotations are readily available, are valued at the last reported sale price or official closing price as reported by a third party pricing vendor on the primary market or exchange on which they are traded and are categorized as Level 1 in the hierarchy. In the event there were no sales during the day or closing prices are not available, securities are valued at the last quoted bid price or may be valued using the last available price and are generally categorized as Level 2 in the hierarchy. For foreign equity securities, when significant market or security specific events arise, comparisons to the valuation of American Depositary Receipts (ADRs), futures contracts, Exchange-Traded Funds (ETFs) and certain indexes as well as quoted prices for similar securities are used and are categorized as Level 2 in the hierarchy. Utilizing these techniques may result in transfers between Level 1 and Level 2.
Annual Report
Notes to Financial Statements - continued
3. Significant Accounting Policies - continued
Security Valuation - continued
Investments in open-end mutual funds, including the Fidelity Central Funds, are valued at their closing net asset value (NAV) each business day and are categorized as Level 1 in the hierarchy.
Changes in valuation techniques may result in transfers in or out of an assigned level within the disclosure hierarchy. The aggregate value of investments by input level, as of October 31, 2012, is included at the end of the Fund's Schedule of Investments.
Foreign Currency Translation. The Fund may use foreign currency contracts to facilitate transactions in foreign-denominated securities. Gains and losses from these transactions may arise from changes in the value of the foreign currency or if the counterparties do not perform under the contracts' terms.
Foreign-denominated assets, including investment securities, and liabilities are translated into U.S. dollars at the exchange rates at period end. Purchases and sales of investment securities, income and dividends received and expenses denominated in foreign currencies are translated into U.S. dollars at the exchange rate in effect on the transaction date.
The effects of exchange rate fluctuations on investments are included with the net realized and unrealized gain (loss) on investment securities. Other foreign currency transactions resulting in realized and unrealized gain (loss) are disclosed separately.
Investment Transactions and Income. For financial reporting purposes, the Fund's investment holdings and NAV include trades executed through the end of the last business day of the period. The NAV per share for processing shareholder transactions is calculated as of the close of business of the New York Stock Exchange (NYSE), normally 4:00 p.m. Eastern time and includes trades executed through the end of the prior business day. Gains and losses on securities sold are determined on the basis of identified cost. Dividend income is recorded on the ex-dividend date, except for certain dividends from foreign securities where the ex-dividend date may have passed, which are recorded as soon as the Fund is informed of the ex-dividend date. Non-cash dividends included in dividend income, if any, are recorded at the fair market value of the securities received. Distributions received on securities that represent a return of capital or capital gain are recorded as a reduction of cost of investments and/or as a realized gain. The Fund estimates the components of distributions received that may be considered return of capital distributions or capital gain distributions. Interest income and distributions from the Fidelity Central Funds are accrued as earned. Interest income includes coupon interest and amortization of premium and accretion of discount on debt securities. Investment income is recorded net of foreign taxes withheld where recovery of such taxes is uncertain.
Expenses. Expenses directly attributable to a fund are charged to that fund. Expenses attributable to more than one fund are allocated among the respective funds on the basis of relative net assets or other appropriate methods. Expense estimates are accrued in the period to which they relate and adjustments are made when actual amounts are known.
Income Tax Information and Distributions to Shareholders. Each year, the Fund intends to qualify as a regulated investment company under Subchapter M of the Internal Revenue Code, including distributing substantially all of its taxable income and realized gains. As a result, no provision for income taxes is required. As of October 31, 2012, the Fund did not have any unrecognized tax benefits in the financial statements; nor is the Fund aware of any tax positions for which it is reasonably possible that the total amounts of unrecognized tax benefits will significantly change in the next twelve months. The Fund files a U.S. federal tax return, in addition to state and local tax returns as required. A fund's federal income tax returns are subject to examination by the Internal Revenue Service (IRS) for a period of three fiscal years after they are filed. State and local tax returns may be subject to examination for an additional fiscal year depending on the jurisdiction. Foreign taxes are provided for based on the Fund's understanding of the tax rules and rates that exist in the foreign markets in which it invests.
Distributions are declared and recorded on the ex-dividend date. Income dividends and capital gain distributions are declared separately for each class. Income and capital gain distributions are determined in accordance with income tax regulations, which may differ from GAAP. In addition, the Fund claimed a portion of the payment made to redeeming shareholders as a distribution for income tax purposes.
Capital accounts within the financial statements are adjusted for permanent book-tax differences. These adjustments have no impact on net assets or the results of operations. Temporary book-tax differences will reverse in a subsequent period.
Book-tax differences are primarily due to foreign currency transactions, passive foreign investment companies (PFIC), deferred trustees compensation, capital loss carryforwards and losses deferred due to wash sales.
The federal tax cost of investment securities and unrealized appreciation (depreciation) as of period end were as follows:
Gross unrealized appreciation | $ 1,012,238,931 |
Gross unrealized depreciation | (135,807,314) |
Net unrealized appreciation (depreciation) on securities and other investments | $ 876,431,617 |
| |
Tax Cost | $ 1,579,631,616 |
Annual Report
3. Significant Accounting Policies - continued
Income Tax Information and Distributions to Shareholders - continued
The tax-based components of distributable earnings as of period end were as follows:
Undistributed ordinary income | $ 34,110,342 |
Undistributed long-term capital gain | $ 164,465,752 |
Net unrealized appreciation (depreciation) | $ 876,383,667 |
The tax character of distributions paid was as follows:
| October 31, 2012 | October 31, 2011 |
Ordinary Income | $ 46,233,461 | $ 37,999,721 |
Short-Term Trading (Redemption) Fees. Shares held by investors in the Fund less than 90 days are subject to a redemption fee equal to 1.50% of the net asset value of shares redeemed. All redemption fees, which reduce the proceeds of the shareholder redemption, are retained by the Fund and accounted for as an addition to paid in capital.
New Accounting Pronouncement. In December 2011, the Financial Accounting Standards Board issued Accounting Standard Update No. 2011-11, Disclosures about Offsetting Assets and Liabilities. The update creates new disclosure requirements requiring entities to disclose both gross and net information for derivatives and other financial instruments that are either offset in the Statement of Assets and Liabilities or subject to an enforceable master netting arrangement or similar agreement. The disclosure requirements are effective for annual reporting periods beginning on or after January 1, 2013, and interim periods within those annual periods. Management is currently evaluating the impact of the update's adoption on the Fund's financial statement disclosures.
4. Purchases and Sales of Investments.
Purchases and sales of securities, other than short-term securities, aggregated $631,783,120 and $1,035,360,910, respectively.
5. Fees and Other Transactions with Affiliates.
Management Fee. FMR and its affiliates provide the Fund with investment management related services for which the Fund pays a monthly management fee. The management fee is the sum of an individual fund fee rate that is based on an annual rate of .45% of the Fund's average net assets and an annualized group fee rate that averaged .26% during the period. The group fee rate is based upon the average net assets of all the mutual funds advised by FMR. The group fee rate decreases as assets under management increase and increases as assets under management decrease. For the period, the total annual management fee rate was .71% of the Fund's average net assets.
Distribution and Service Plan Fees. In accordance with Rule 12b-1 of the 1940 Act, the Fund has adopted separate Distribution and Service Plans for each class of shares. Certain classes pay Fidelity Distributors Corporation (FDC), an affiliate of FMR, separate Distribution and Service Fees, each of which is based on an annual percentage of each class' average net assets. In addition, FDC may pay financial intermediaries for selling shares of the Fund and providing shareholder support services. For the period, the Distribution and Service Fee rates, total fees and amounts retained by FDC were as follows:
| Distribution
Fee | Service
Fee | Total Fees | Retained
by FDC |
Class A | -% | .25% | $ 205,957 | $ 4,047 |
Class T | .25% | .25% | 115,866 | 2,034 |
Class B | .75% | .25% | 119,367 | 89,525 |
Class C | .75% | .25% | 320,211 | 31,231 |
| | | $ 761,401 | $ 126,837 |
Sales Load. FDC may receive a front-end sales charge of up to 5.75% for selling Class A shares and 3.50% for selling Class T shares, some of which is paid to financial intermediaries for selling shares of the Fund. Depending on the holding period, FDC may receive contingent deferred sales charges levied on Class A, Class T, Class B, and Class C redemptions. The deferred sales charges range from 5.00% to 1.00% for Class B shares, 1.00% for Class C shares, 1.00% for certain purchases of Class A shares and .25% for certain purchases of Class T shares.
Annual Report
Notes to Financial Statements - continued
5. Fees and Other Transactions with Affiliates - continued
Sales Load - continued
For the period, sales charge amounts retained by FDC were as follows:
| Retained
by FDC |
Class A | $ 30,084 |
Class T | 4,827 |
Class B* | 6,323 |
Class C* | 3,913 |
| $ 45,147 |
* When Class B and Class C shares are initially sold, FDC pays commissions from its own resources to financial intermediaries through which the sales are made.
Transfer Agent Fees. Fidelity Investments Institutional Operations Company, Inc. (FIIOC), an affiliate of FMR, is the transfer, dividend disbursing and shareholder servicing agent for each class of the Fund. FIIOC receives account fees and asset-based fees that vary according to the account size and type of account of the shareholders of the respective classes of the Fund. FIIOC pays for typesetting, printing and mailing of shareholder reports, except proxy statements. For the period, transfer agent fees for each class were as follows:
| Amount | % of
Average
Net Assets |
Class A | $ 246,709 | .30 |
Class T | 72,147 | .31 |
Class B | 35,775 | .30 |
Class C | 94,503 | .30 |
Latin America | 5,720,698 | .22 |
Institutional Class | 22,166 | .24 |
| $ 6,191,998 | |
Accounting and Security Lending Fees. Fidelity Service Company, Inc. (FSC), an affiliate of FMR, maintains the Fund's accounting records. The accounting fee is based on the level of average net assets for each month. Under a separate contract, FSC administers the security lending program. The security lending fee is based on the number and duration of lending transactions.
Brokerage Commissions. The Fund placed a portion of its portfolio transactions with brokerage firms which are affiliates of the investment adviser. The commissions paid to these affiliated firms were $4,272 for the period.
Interfund Lending Program. Pursuant to an Exemptive Order issued by the SEC, the Fund, along with other registered investment companies having management contracts with FMR, may participate in an interfund lending program. This program provides an alternative credit facility allowing the funds to borrow from, or lend money to, other participating affiliated funds. At period end, there were no interfund loans outstanding. The Fund's activity in this program during the period for which loans were outstanding was as follows:
Borrower or Lender | Average Loan
Balance | Weighted Average Interest Rate | Interest
Expense |
Borrower | $ 3,888,444 | .42% | $ 409 |
6. Committed Line of Credit.
The Fund participates with other funds managed by FMR or an affiliate in a $4.25 billion credit facility (the "line of credit") to be utilized for temporary or emergency purposes to fund shareholder redemptions or for other short-term liquidity purposes. The Fund has agreed to pay commitment fees on its pro-rata portion of the line of credit, which amounted to $7,849 and is reflected in Miscellaneous expenses on the Statement of Operations. During the period, there were no borrowings on this line of credit.
7. Security Lending.
The Fund lends portfolio securities through a lending agent from time to time in order to earn additional income. For equity securities, a lending agent is used and may loan securities to certain qualified borrowers, including Fidelity Capital Markets (FCM), a broker-dealer affiliated with the Fund. On the settlement date of the loan, the Fund receives collateral (in the form of U.S. Treasury obligations, letters of credit and/or cash) against the loaned securities and maintains collateral in an amount not less than 100% of the market value of the loaned securities during the period of the loan. The
Annual Report
7. Security Lending - continued
market value of the loaned securities is determined at the close of business of the Fund and any additional required collateral is delivered to the Fund on the next business day. If the borrower defaults on its obligation to return the securities loaned because of insolvency or other reasons, a fund could experience delays and costs in recovering the securities loaned or in gaining access to the collateral. Any cash collateral received is invested in the Fidelity Securities Lending Cash Central Fund. The value of loaned securities and cash collateral at period end are disclosed on the Fund's Statement of Assets and Liabilities. Security lending income represents the income earned on investing cash collateral, less rebates paid to borrowers and any lending agent fees associated with the loan, plus any premium payments received for lending certain types of securities. Security lending income is presented in the Statement of Operations as a component of income from Fidelity Central Funds. Total security lending income during the period amounted to $729,136. During the period, there were no securities loaned to FCM.
8. Expense Reductions.
Many of the brokers with whom FMR places trades on behalf of the Fund provided services to the Fund in addition to trade execution. These services included payments of certain expenses on behalf of the Fund totaling $32,182 for the period. In addition, through arrangements with the Fund's custodian, credits realized as a result of uninvested cash balances were used to reduce the Fund's expenses. During the period, these credits reduced the Fund's custody expenses by $69.
9. Distributions to Shareholders.
Distributions to shareholders of each class were as follows:
Years ended October 31, | 2012 | 2011 |
From net investment income | | |
Class A | $ 1,209,540 | $ 387,219 |
Class T | 259,191 | 94,474 |
Class B | 65,750 | 23,836 |
Class C | 156,473 | 78,469 |
Latin America | 44,398,764 | 21,655,692 |
Institutional Class | 143,743 | 52,446 |
Total | $ 46,233,461 | $ 22,292,136 |
From net realized gain | | |
Class A | $ - | $ 407,401 |
Class T | - | 127,447 |
Class B | - | 68,279 |
Class C | - | 170,156 |
Latin America | - | 14,889,803 |
Institutional Class | - | 44,499 |
Total | $ - | $ 15,707,585 |
10. Share Transactions.
Transactions for each class of shares were as follows:
| Shares | Dollars |
Years ended October 31, | 2012 | 2011 | 2012 | 2011 |
Class A | | | | |
Shares sold | 250,504 | 412,254 | $ 12,951,683 | $ 23,066,057 |
Reinvestment of distributions | 21,636 | 12,195 | 1,072,283 | 706,536 |
Shares redeemed | (594,208) | (691,058) | (30,101,636) | (38,328,762) |
Net increase (decrease) | (322,068) | (266,609) | $ (16,077,670) | $ (14,556,169) |
Class T | | | | |
Shares sold | 45,016 | 87,514 | $ 2,321,071 | $ 4,903,931 |
Reinvestment of distributions | 5,062 | 3,721 | 251,031 | 215,680 |
Shares redeemed | (152,369) | (234,128) | (7,641,343) | (12,893,248) |
Net increase (decrease) | (102,291) | (142,893) | $ (5,069,241) | $ (7,773,637) |
Annual Report
Notes to Financial Statements - continued
10. Share Transactions - continued
| Shares | Dollars |
Years ended October 31, | 2012 | 2011 | 2012 | 2011 |
Class B | | | | |
Shares sold | 3,378 | 11,256 | $ 173,307 | $ 626,261 |
Reinvestment of distributions | 1,105 | 1,326 | 54,795 | 76,906 |
Shares redeemed | (80,783) | (96,470) | (4,111,766) | (5,351,844) |
Net increase (decrease) | (76,300) | (83,888) | $ (3,883,664) | $ (4,648,677) |
Class C | | | | |
Shares sold | 55,877 | 137,950 | $ 2,923,684 | $ 7,785,005 |
Reinvestment of distributions | 2,881 | 3,829 | 142,933 | 222,012 |
Shares redeemed | (172,705) | (306,800) | (8,681,626) | (16,851,535) |
Net increase (decrease) | (113,947) | (165,021) | $ (5,615,009) | $ (8,844,518) |
Latin America | | | | |
Shares sold | 6,405,350 | 8,382,994 | $ 336,749,510 | $ 474,305,310 |
Reinvestment of distributions | 860,999 | 609,933 | 42,666,908 | 35,291,350 |
Shares redeemed | (15,886,221) | (28,534,583) | (800,304,511) | (1,586,342,682) |
Net increase (decrease) | (8,619,872) | (19,541,656) | $ (420,888,093) | $ (1,076,746,022) |
Institutional Class | | | | |
Shares sold | 84,374 | 72,884 | $ 4,329,443 | $ 4,108,817 |
Reinvestment of distributions | 2,228 | 1,178 | 110,408 | 68,214 |
Shares redeemed | (107,894) | (115,010) | (5,412,186) | (6,478,861) |
Net increase (decrease) | (21,292) | (40,948) | $ (972,335) | $ (2,301,830) |
11. Other.
The Fund's organizational documents provide former and current trustees and officers with a limited indemnification against liabilities arising in connection with the performance of their duties to the Fund. In the normal course of business, the Fund may also enter into contracts that provide general indemnifications. The Fund's maximum exposure under these arrangements is unknown as this would be dependent on future claims that may be made against the Fund. The risk of material loss from such claims is considered remote.
Annual Report
Report of Independent Registered Public Accounting Firm
To the Trustees of Fidelity Investment Trust and the Shareholders of Fidelity Latin America Fund:
In our opinion, the accompanying statement of assets and liabilities, including the schedule of investments, and the related statements of operations and of changes in net assets and the financial highlights present fairly, in all material respects, the financial position of Fidelity Latin America Fund (a fund of Fidelity Investment Trust) at October 31, 2012, the results of its operations for the year then ended, the changes in its net assets for each of the two years in the period then ended and the financial highlights for each of the periods indicated, in conformity with accounting principles generally accepted in the United States of America. These financial statements and financial highlights (hereafter referred to as "financial statements") are the responsibility of the Fidelity Latin America Fund's management. Our responsibility is to express an opinion on these financial statements based on our audits. We conducted our audits of these financial statements in accordance with the standards of the Public Company Accounting Oversight Board (United States). Those standards require that we plan and perform the audit to obtain reasonable assurance about whether the financial statements are free of material misstatement. An audit includes examining, on a test basis, evidence supporting the amounts and disclosures in the financial statements, assessing the accounting principles used and significant estimates made by management, and evaluating the overall financial statement presentation. We believe that our audits, which included confirmation of securities at October 31, 2012 by correspondence with the custodian and brokers, provide a reasonable basis for our opinion.
PricewaterhouseCoopers LLP
Boston, Massachusetts
December 18, 2012
Annual Report
Trustees and Officers
The Trustees, Members of the Advisory Board, and executive officers of the trust and fund, as applicable, are listed below. The Board of Trustees governs the fund and is responsible for protecting the interests of shareholders. The Trustees are experienced executives who meet periodically throughout the year to oversee the fund's activities, review contractual arrangements with companies that provide services to the fund, oversee management of the risks associated with such activities and contractual arrangements, and review the fund's performance. Except for James C. Curvey, each of the Trustees oversees 236 funds advised by FMR or an affiliate. Mr. Curvey oversees 443 funds advised by FMR or an affiliate.
The Trustees hold office without limit in time except that (a) any Trustee may resign; (b) any Trustee may be removed by written instrument, signed by at least two-thirds of the number of Trustees prior to such removal; (c) any Trustee who requests to be retired or who has become incapacitated by illness or injury may be retired by written instrument signed by a majority of the other Trustees; and (d) any Trustee may be removed at any special meeting of shareholders by a two-thirds vote of the outstanding voting securities of the trust. Each Trustee who is not an interested person (as defined in the 1940 Act) (Independent Trustee), shall retire not later than the last day of the calendar year in which his or her 75th birthday occurs. The Independent Trustees may waive this mandatory retirement age policy with respect to individual Trustees. The executive officers and Advisory Board Members hold office without limit in time, except that any officer and Advisory Board Member may resign or may be removed by a vote of a majority of the Trustees at any regular meeting or any special meeting of the Trustees. Except as indicated, each individual has held the office shown or other offices in the same company for the past five years.
Experience, Skills, Attributes, and Qualifications of the Fund's Trustees. The Governance and Nominating Committee has adopted a statement of policy that describes the experience, qualifications, attributes, and skills that are necessary and desirable for potential Independent Trustee candidates (Statement of Policy). The Board believes that each Trustee satisfied at the time he or she was initially elected or appointed a Trustee, and continues to satisfy, the standards contemplated by the Statement of Policy. The Governance and Nominating Committee also engages professional search firms to help identify potential Independent Trustee candidates who have the experience, qualifications, attributes, and skills consistent with the Statement of Policy. From time to time, additional criteria based on the composition and skills of the current Independent Trustees, as well as experience or skills that may be appropriate in light of future changes to board composition, business conditions, and regulatory or other developments, have also been considered by the professional search firms and the Governance and Nominating Committee. In addition, the Board takes into account the Trustees' commitment and participation in Board and committee meetings, as well as their leadership of standing and ad hoc committees throughout their tenure.
In determining that a particular Trustee was and continues to be qualified to serve as a Trustee, the Board has considered a variety of criteria, none of which, in isolation, was controlling. The Board believes that, collectively, the Trustees have balanced and diverse experience, qualifications, attributes, and skills, which allow the Board to operate effectively in governing the fund and protecting the interests of shareholders. Information about the specific experience, skills, attributes, and qualifications of each Trustee, which in each case led to the Board's conclusion that the Trustee should serve (or continue to serve) as a trustee of the fund, is provided below.
Board Structure and Oversight Function. James C. Curvey is an interested person (as defined in the 1940 Act) and currently serves as Chairman. The Trustees have determined that an interested Chairman is appropriate and benefits shareholders because an interested Chairman has a personal and professional stake in the quality and continuity of services provided to the fund. Independent Trustees exercise their informed business judgment to appoint an individual of their choosing to serve as Chairman, regardless of whether the Trustee happens to be independent or a member of management. The Independent Trustees have determined that they can act independently and effectively without having an Independent Trustee serve as Chairman and that a key structural component for assuring that they are in a position to do so is for the Independent Trustees to constitute a substantial majority for the Board. The Independent Trustees also regularly meet in executive session. Ned C. Lautenbach serves as Chairman of the Independent Trustees and as such (i) acts as a liaison between the Independent Trustees and management with respect to matters important to the Independent Trustees and (ii) with management prepares agendas for Board meetings.
Fidelity funds are overseen by different Boards of Trustees. The fund's Board oversees Fidelity's equity and high income funds and another Board oversees Fidelity's investment-grade bond, money market, and asset allocation funds. The asset allocation funds may invest in Fidelity funds overseen by the fund's Board. The use of separate Boards, each with its own committee structure, allows the Trustees of each group of Fidelity funds to focus on the unique issues of the funds they oversee, including common research, investment, and operational issues. On occasion, the separate Boards establish joint committees to address issues of overlapping consequences for the Fidelity funds overseen by each Board.
The Trustees operate using a system of committees to facilitate the timely and efficient consideration of all matters of importance to the Trustees, the fund, and fund shareholders and to facilitate compliance with legal and regulatory requirements and oversight of the fund's activities and associated risks. The Board, acting through its committees, has charged FMR and its affiliates with (i) identifying events or circumstances the occurrence of which could have demonstrably adverse effects on the fund's business and/or reputation; (ii) implementing processes and controls to lessen the possibility that such events or circumstances occur or to mitigate the effects of such events or circumstances if they do occur; and (iii) creating and maintaining a system designed to evaluate continuously business and market conditions in order to facilitate the identification and implementation processes described in (i) and (ii) above. Because the day-to-day operations and activities of the fund are carried out by or through FMR, its affiliates and other service providers, the fund's exposure to risks is mitigated but not eliminated by the processes overseen by the Trustees. While each of the Board's committees has responsibility for overseeing different aspects of the fund's activities, oversight is exercised primarily through the Operations, Audit, and Compliance Committees. In addition, the Independent Trustees have worked with FMR to enhance the Board's oversight of investment and financial risks, legal and regulatory risks, technology risks, and operational risks, including the development of additional risk reporting to the Board. For example, a working group comprised of Independent Trustees and FMR has worked and continues to work to review the Fidelity funds' valuation-related activities, reporting and risk management. Appropriate personnel, including but not limited to the fund's Chief Compliance Officer (CCO), FMR's internal auditor, the independent accountants, the fund's Treasurer and portfolio management personnel, make periodic reports to the Board's committees, as appropriate, including an annual review of FMR's risk management program for the Fidelity funds. The responsibilities of each standing committee, including their oversight responsibilities, are described further under "Standing Committees of the Fund's Trustees."
Annual Report
The fund's Statement of Additional Information (SAI) includes more information about the Trustees. To request a free copy, call Fidelity at 1-877-208-0098.
Interested Trustees*:
Correspondence intended for each Trustee who is an interested person may be sent to Fidelity Investments, 82 Devonshire Street, Boston, Massachusetts 02109.
Name, Age; Principal Occupations and Other Relevant Experience+ |
James C. Curvey (77) |
| Year of Election or Appointment: 2007 Mr. Curvey is Trustee and Chairman of the Board of Trustees of certain Trusts. Mr. Curvey also serves as Trustee (2007-present) of other investment companies advised by FMR. Mr. Curvey is a Director of Fidelity Investments Money Management, Inc. (2009-present), Director of Fidelity Research & Analysis Co. (2009-present) and Director of FMR and FMR Co., Inc. (2007-present). Mr. Curvey is also Vice Chairman (2007-present) and Director of FMR LLC. In addition, Mr. Curvey serves as an Overseer for the Boston Symphony Orchestra and a member of the Trustees of Villanova University. Previously, Mr. Curvey was the Vice Chairman (2006-2007) and Director (2000-2007) of FMR Corp. |
Ronald P. O'Hanley (55) |
| Year of Election or Appointment: 2011 Mr. O'Hanley is Director of FMR Co., Inc. (2010-present), Director of Fidelity Investments Money Management, Inc. (2010-present), Director of Fidelity Research & Analysis Company (2010-present), President of Fidelity Asset Management and Corporate Services and a member of Fidelity's Executive Committee (2010-present). Previously, Mr. O'Hanley served as President and Chief Executive Officer of BNY Mellon Asset Management (2007-2010). Mr. O'Hanley also served as Vice Chairman of Bank New York Mellon Corp. and a member of that firm's Executive Committee. Prior to the 2007 merger of The Bank of New York and Mellon Financial Corporation, he was Vice Chairman of Mellon Financial Corporation and President and Chief Executive Officer of Mellon Asset Management. He joined Mellon in February 1997. Mr. O'Hanley currently serves as Chairman of the Boston Public Library Foundation Board of Directors and sits on the Board of Directors of Beth Israel Deaconess Medical Center, the Board of Trustees of the Marine Biological Laboratory and the Advisory Board of the Maxwell School of Citizenship and Public Administration at Syracuse University. Mr. O'Hanley also chairs the Council on Asset Management for the Financial Services Roundtable and is a member of the Board of Directors of Institutional Investor's U.S. Institute. |
* Trustees have been determined to be "Interested Trustees" by virtue of, among other things, their affiliation with the trust or various entities under common control with FMR.
+ The information above includes each Trustee's principal occupation during the last five years and other information relating to the experience, attributes, and skills relevant to each Trustee's qualifications to serve as a Trustee, which led to the conclusion that each Trustee should serve as a Trustee for the fund.
Independent Trustees:
Correspondence intended for each Independent Trustee (that is, the Trustees other than the Interested Trustees) may be sent to Fidelity Investments, P.O. Box 55235, Boston, Massachusetts 02205-5235.
Name, Age; Principal Occupations and Other Relevant Experience+ |
Dennis J. Dirks (64) |
| Year of Election or Appointment: 2005 Prior to his retirement in May 2003, Mr. Dirks was Chief Operating Officer and a member of the Board of The Depository Trust & Clearing Corporation (DTCC). He also served as President, Chief Operating Officer, and Board member of The Depository Trust Company (DTC) and President and Board member of the National Securities Clearing Corporation (NSCC). In addition, Mr. Dirks served as Chief Executive Officer and Board member of the Government Securities Clearing Corporation, Chief Executive Officer and Board member of the Mortgage-Backed Securities Clearing Corporation, as a Trustee and a member of the Finance Committee of Manhattan College (2005-2008), and as a Trustee and a member of the Finance Committee of AHRC of Nassau County (2006-2008). Mr. Dirks is a member of the Independent Directors Council (IDC) Governing Council (2010-present) and Board of Directors for The Brookville Center for Children's Services, Inc. (2009-present). |
Alan J. Lacy (59) |
| Year of Election or Appointment: 2008 Mr. Lacy serves as Senior Adviser (2007-present) of Oak Hill Capital Partners, L.P. (private equity). Mr. Lacy also served as Chief Executive Officer (2000-2005) and Vice Chairman (2005-2006) of Sears Holdings Corporation and Sears, Roebuck and Co. (retail). In addition, Mr. Lacy serves as a member of the Board of Directors of Dave & Buster's Entertainment, Inc. (restaurant and entertainment complexes, 2010-present), Earth Fare, Inc. (retail grocery, 2012-present), The Hillman Companies, Inc. (hardware wholesalers, 2010-present), and Bristol-Myers Squibb Company (global pharmaceuticals, 2008-present). Mr. Lacy is a member of the Board of Trustees of The National Parks Conservation Association (2006-present). Previously, Mr. Lacy served as Chairman of the Board of Trustees of the National Parks Conservation Association (2008-2011) and as a member of the Board of Directors for the Western Union Company (global money transfer, 2006-2011). |
Ned C. Lautenbach (68) |
| Year of Election or Appointment: 2000 Mr. Lautenbach is Chairman of the Independent Trustees of the Equity and High Income Funds (2006-present). Mr. Lautenbach currently serves as the Lead Director of the Eaton Corporation Board of Directors (diversified industrial, 1997-present). Mr. Lautenbach is Chairman of the Board of Directors of the Philharmonic Center for the Arts in Naples, Florida (2012-present) and a member of the Council on Foreign Relations (1994-present). Previously, Mr. Lautenbach was a Partner/Advisory Partner at Clayton, Dubilier & Rice, LLC (private equity investment, 1998-2010), as well as a Director of Sony Corporation (2006-2007). |
Joseph Mauriello (68) |
| Year of Election or Appointment: 2008 Prior to his retirement in January 2006, Mr. Mauriello served in numerous senior management positions including Deputy Chairman and Chief Operating Officer (2004-2005), and Vice Chairman of Financial Services (2002-2004) of KPMG LLP US (professional services, 1965-2005). Mr. Mauriello currently serves as a member of the Board of Directors of XL Group plc. (global insurance and re-insurance, 2006-present). Previously, Mr. Mauriello served as a Director of the Hamilton Funds of the Bank of New York (2006-2007) and of Arcadia Resources Inc. (health care services and products, 2007-2012). |
Robert W. Selander (62) |
| Year of Election or Appointment: 2011 Previously, Mr. Selander served as a Member of the Advisory Board of Fidelity's Equity and High Income Funds (2011), Executive Vice Chairman (2010), Chief Executive Officer (2009-2010), and President and Chief Executive Officer (1997-2009) of Mastercard, Inc. |
Cornelia M. Small (68) |
| Year of Election or Appointment: 2005 Ms. Small is a member of the Board of Directors (2009-present) and Chair of the Investment Committee (2010-present) of the Teagle Foundation. Ms. Small also serves on the Investment Committee of the Berkshire Taconic Community Foundation (2008-present). Previously, Ms. Small served as Chairperson (2002-2008) and a member of the Investment Committee and Chairperson (2008-2012) and a member of the Board of Trustees of Smith College. In addition, Ms. Small served as Chief Investment Officer, Director of Global Equity Investments, and a member of the Board of Directors of Scudder, Stevens & Clark and Scudder Kemper Investments. |
William S. Stavropoulos (73) |
| Year of Election or Appointment: 2001 Mr. Stavropoulos is Vice Chairman of the Independent Trustees of the Equity and High Income Funds (2006-present). Mr. Stavropoulos serves as President and Founder of the Michigan Baseball Foundation, the Great Lakes Loons (2007-present). Mr. Stavropoulos is Chairman Emeritus of the Board of Directors of The Dow Chemical Company, where he previously served in numerous senior management positions, including President, CEO (1995-2000; 2002-2004), Chairman of the Executive Committee (2000-2006), and as a member of the Board of Directors (1990-2006). Currently, Mr. Stavropoulos is a Director of Univar Inc. (global distributor of commodity and specialty chemicals, Chairman from 2010-May 2012 and Lead Director from May 2012-present), Teradata Corporation (data warehousing and technology solutions, 2008-present), Maersk Inc. (industrial conglomerate), and Tyco International, Ltd. (multinational manufacturing and services, 2007-present), and a member of the Advisory Board for Metalmark Capital LLC (private equity investment, 2005-present). Mr. Stavropoulos is an operating advisor to Clayton, Dubilier & Rice, LLC (private equity investment). In addition, Mr. Stavropoulos is a member of the University of Notre Dame Advisory Council for the College of Science, a Trustee of the Rollin L. Gerstacker Foundation, and a Director of the Naples Philharmonic Center for the Arts. Previously, Mr. Stavropoulos served as a Director of Chemical Financial Corporation (bank holding company, 1993-2012). |
David M. Thomas (63) |
| Year of Election or Appointment: 2008 Previously, Mr. Thomas served as Executive Chairman (2005-2006) and Chairman and Chief Executive Officer (2000-2005) of IMS Health, Inc. (pharmaceutical and healthcare information solutions), and a Director of Fortune Brands, Inc. (consumer products, 2000-2011). In addition, Mr. Thomas serves as Non-Executive Chairman of the Board of Directors of Fortune Brands Home and Security (home and security products, 2011-present), and as a member of the Board of Directors of Interpublic Group of Companies, Inc. (marketing communication, 2004-present). |
Michael E. Wiley (62) |
| Year of Election or Appointment: 2008 Mr. Wiley also serves as a Director of Asia Pacific Exploration Consolidated (international oil and gas exploration and production, 2008-present). Mr. Wiley serves as a Director of Tesoro Corporation (independent oil refiner and marketer, 2005-present), and a Director of Bill Barrett Corporation (exploration and production, 2005-present). In addition, Mr. Wiley also serves as a Director of Post Oak Bank (privately-held bank, 2004-present). Previously, Mr. Wiley served as a member of the Board of Trustees of the University of Tulsa (2000-2006; 2007-2010), as a Senior Energy Advisor of Katzenbach Partners, LLC (consulting, 2006-2007), as an Advisory Director of Riverstone Holdings (private investment), Chairman, President, and CEO of Baker Hughes, Inc. (oilfield services, 2000-2004), and as Director of Spinnaker Exploration Company (exploration and production, 2001-2005). |
+ The information above includes each Trustee's principal occupation during the last five years and other information relating to the experience, attributes, and skills relevant to each Trustee's qualifications to serve as a Trustee, which led to the conclusion that each Trustee should serve as a Trustee for the fund.
Advisory Board Members and Executive Officers:
Correspondence intended for David A. Rosow and Garnett A. Smith may be sent to Fidelity Investments, P.O. Box 55235, Boston, Massachusetts 02205-5235. Correspondence intended for each executive officer, Edward C. Johnson 3d, and Peter S. Lynch may be sent to Fidelity Investments, 82 Devonshire Street, Boston, Massachusetts 02109.
Name, Age; Principal Occupation |
Edward C. Johnson 3d (82) |
| Year of Election or Appointment: 2011 Member of the Advisory Board of Fidelity's Equity and High Income Funds. Mr. Johnson serves as Chief Executive Officer, Chairman, and a Director of FMR LLC, and also serves as Chairman and Director of FIL Limited. Previously, Mr. Johnson served as a Trustee and Chairman of the Board of certain Fidelity Trusts, Chairman and a Director of FMR, Chairman and a Director of FMR Co., Inc., and President of FMR LLC (2006-2007). |
Peter S. Lynch (68) |
| Year of Election or Appointment: 2003 Member of the Advisory Board of Fidelity's Equity and High Income Funds. Mr. Lynch is Vice Chairman and a Director of FMR and FMR Co., Inc. In addition, Mr. Lynch serves as a Trustee of Boston College and as the Chairman of the Inner-City Scholarship Fund. Previously, Mr. Lynch served on the Special Olympics International Board of Directors (1997-2006). |
David A. Rosow (70) |
| Year of Election or Appointment: 2012 Member of the Advisory Board of Fidelity's Equity and High Income Funds. Chairman and Chief Executive Officer of International Golf Group, Inc. (golf course development, 1989-present). Previously, Mr. Rosow served as Chairman and Chief Executive Officer of Rosow & Company, Inc. (private investment company, 1989-2011), a Lead Director of Hudson United Bancorp (2001-2006) and as a Director of TD Banknorth (1996-2006). In addition, Mr. Rosow is a member (2008-present) and President (2009-present) of the Town Council of Palm Beach, Florida. |
Garnett A. Smith (65) |
| Year of Election or Appointment: 2012 Member of the Advisory Board of Fidelity's Equity and High Income Funds. Prior to Mr. Smith's retirement, he served as Chairman and Chief Executive Officer of Inbrand Corp. (manufacturer of personal absorbent products, 1990-1997). He also served as President (1986-1990) of Inbrand Corp. Prior to his employment with Inbrand Corp., he was employed by a retail fabric chain and North Carolina National Bank. In addition, Mr. Smith is a board member of the Jackson Hole Land Trust (2009-present). |
Kenneth B. Robins (43) |
| Year of Election or Appointment: 2008 President and Treasurer of Fidelity's Equity and High Income Funds. Mr. Robins also serves as President and Treasurer (2010-present) and Assistant Treasurer (2009-present) of other Fidelity funds and is an employee of Fidelity Investments (2004-present). Previously, Mr. Robins served as Deputy Treasurer of the Fidelity funds (2005-2008) and Treasurer and Chief Financial Officer of The North Carolina Capital Management Trust: Cash and Term Portfolios (2006-2008). |
Bruce T. Herring (47) |
| Year of Election or Appointment: 2006 Vice President of certain Equity Funds. Mr. Herring also serves as President of Fidelity Research & Analysis Company (2010-present), Chief Investment Officer and Director of Fidelity Management & Research (U.K.) Inc. (2010-present) and Group Chief Investment Officer of FMR. Previously, Mr. Herring served as Vice President (2005-2006) and Senior Vice President (2006-2007) of Fidelity Management & Research Company, Vice President of FMR Co., Inc. (2001-2007) and as a portfolio manager for Fidelity U.S. Equity Funds. |
Brian B. Hogan (48) |
| Year of Election or Appointment: 2009 Vice President of Equity and High Income Funds. Mr. Hogan also serves as President of FMR's Equity Division (2009-present). Previously, Mr. Hogan served as Senior Vice President, Equity Research of FMR (2006-2009) and as a portfolio manager. |
Scott C. Goebel (44) |
| Year of Election or Appointment: 2008 Secretary and Chief Legal Officer (CLO) of the Fidelity funds. Mr. Goebel also serves as Secretary of Fidelity Investments Money Management, Inc. (FIMM) (2010-present) and Fidelity Research and Analysis Company (FRAC) (2010-present); Secretary and CLO of The North Carolina Capital Management Trust: Cash and Term Portfolios (2008-present); General Counsel, Secretary, and Senior Vice President of FMR (2008-present) and FMR Co., Inc. (2008-present); employed by FMR LLC or an affiliate (2001-present); Chief Legal Officer of Fidelity Management & Research (Hong Kong) Limited (2008-present) and Assistant Secretary of Fidelity Management & Research (Japan) Inc. (2008-present), and Fidelity Management & Research (U.K.) Inc. (2008-present). Previously, Mr. Goebel served as Assistant Secretary of FIMM (2008-2010), FRAC (2008-2010), and the Funds (2007-2008) and as Vice President and Secretary of Fidelity Distributors Corporation (FDC) (2005-2007). |
William C. Coffey (43) |
| Year of Election or Appointment: 2009 Assistant Secretary of Fidelity's Equity and High Income Funds. Mr. Coffey also serves as Senior Vice President and Deputy General Counsel of FMR LLC (2010-present), and is an employee of Fidelity Investments. Previously, Mr. Coffey served as Vice President and Associate General Counsel of FMR LLC (2005-2009). |
Elizabeth Paige Baumann (44) |
| Year of Election or Appointment: 2012 Anti-Money Laundering (AML) Officer of the Fidelity funds. Ms. Baumann also serves as AML Officer of The North Carolina Capital Management Trust: Cash and Term Portfolios (2012-present), Chief AML Officer of FMR LLC (2012-present), and is an employee of Fidelity Investments. Previously, Ms. Baumann served as Vice President and Deputy Anti-Money Laundering Officer (2007-2012). |
Christine Reynolds (54) |
| Year of Election or Appointment: 2008 Chief Financial Officer of the Fidelity funds. Ms. Reynolds became President of Fidelity Pricing and Cash Management Services (FPCMS) in August 2008. Ms. Reynolds served as Chief Operating Officer of FPCMS (2007-2008). Previously, Ms. Reynolds served as President, Treasurer, and Anti-Money Laundering officer of the Fidelity funds (2004-2007). |
Joseph A. Hanlon (44) |
| Year of Election or Appointment: 2012 Chief Compliance Officer of Fidelity's Equity and High Income Funds. Mr. Hanlon serves as Compliance Officer of FMR, FMR Co., Inc., Fidelity Investments Money Management, Inc. (FIMM), Fidelity Research and Analysis Company (FRAC), Fidelity Management & Research (Japan) Inc., Fidelity Management & Research (U.K.) Inc., Fidelity Management & Research (Hong Kong), and Strategic Advisers, Inc. (2009-present), as Senior Vice President of the Fidelity Asset Management Division (2009-present), and is an employee of Fidelity Investments. |
Joseph F. Zambello (55) |
| Year of Election or Appointment: 2011 Deputy Treasurer of the Fidelity funds. Mr. Zambello is an employee of Fidelity Investments. Previously, Mr. Zambello served as Vice President of FMR's Program Management Group (2009-2011) and Vice President of the Transfer Agent Oversight Group (2005-2009). |
Adrien E. Deberghes (45) |
| Year of Election or Appointment: 2008 Deputy Treasurer of Fidelity's Equity and High Income Funds. Mr. Deberghes also serves as Vice President (2011-present) and Assistant Treasurer (2010-present) of other Fidelity funds, and is an employee of Fidelity Investments (2008-present). Previously, Mr. Deberghes served as Senior Vice President of Mutual Fund Administration at State Street Corporation (2007-2008), Senior Director of Mutual Fund Administration at Investors Bank & Trust (2005-2007), and Director of Finance for Dunkin' Brands (2000-2005). |
Stephen Sadoski (41) |
| Year of Election or Appointment: 2012 Deputy Treasurer of Fidelity's Equity and High Income Funds. Mr. Sadoski also serves as Assistant Treasurer of other Fidelity funds (2012-present) and is an employee of Fidelity Investments (2012-present). Previously, Mr. Sadoski served as an assistant chief accountant in the Division of Investment Management of the Securities and Exchange Commission (SEC) (2009-2012) and as a senior manager at Deloitte & Touche (1997-2009). |
Stephanie J. Dorsey (43) |
| Year of Election or Appointment: 2010 Assistant Treasurer of Fidelity's Equity and High Income Funds. Ms. Dorsey also serves as Deputy Treasurer of other Fidelity funds (2008-present) and is an employee of Fidelity Investments (2008-present). Previously, Ms. Dorsey served as Treasurer (2004-2008) of the JPMorgan Mutual Funds and Vice President (2004-2008) of JPMorgan Chase Bank. |
John R. Hebble (54) |
| Year of Election or Appointment: 2009 Assistant Treasurer of Fidelity's Equity and High Income Funds. Mr. Hebble also serves as President (2011-present), Treasurer, and Chief Financial Officer of The North Carolina Capital Management Trust: Cash and Term Portfolios (2008-present), President and Treasurer of other Fidelity funds (2008-present) and is an employee of Fidelity Investments. |
Gary W. Ryan (54) |
| Year of Election or Appointment: 2005 Assistant Treasurer of the Fidelity funds. Mr. Ryan is an employee of Fidelity Investments. Previously, Mr. Ryan served as Vice President of Fund Reporting in Fidelity Pricing and Cash Management Services (FPCMS) (1999-2005). |
Jonathan Davis (44) |
| Year of Election or Appointment: 2010 Assistant Treasurer of the Fidelity funds. Mr. Davis is also Assistant Treasurer of Fidelity Rutland Square Trust II and Fidelity Commonwealth Trust II. Mr. Davis is an employee of Fidelity Investments. Previously, Mr. Davis served as Vice President and Associate General Counsel of FMR LLC (2003-2010). |
Annual Report
Distributions (Unaudited)
The Board of Trustees of Fidelity Latin America Fund voted to pay to shareholders of record at the opening of business on record date, the following distributions per share derived from capital gains realized from sales of portfolio securities and dividends derived from net investment income:
| Pay Date | Record Date | Dividends | Capital Gains |
Institutional Class | 12/10/2012 | 12/07/2012 | $0.966 | $3.450 |
The fund hereby designates as a capital gain dividend with respect to the taxable year ended October 31, 2012, $198,275,480, or, if subsequently determined to be different, the net capital gain of such year.
A percentage of the dividends distributed during the fiscal year qualify for the dividends-received deduction for corporate shareholders.
| December 2, 2011 | December 28, 2011 |
Institutional Class | 1% | 4% |
A percentage of the dividends distributed during the fiscal year may be taken into account as a dividend for the purposes of the maximum rate under section 1(h)(11) of the Internal Revenue Code.
| December 2, 2011 | December 28, 2011 |
Institutional Class | 88% | 65% |
The amounts per share which represent income derived from sources within, and taxes paid to, foreign countries or possessions of the United States are as follows:
| Pay Date | Income | Taxes |
Institutional Class | 12/05/11 | $1.026 | $0.1806 |
Institutional Class | 12/29/11 | $0.015 | $0.0000 |
The fund will notify shareholders in January 2013 of amounts for use in preparing 2012 income tax returns.
Annual Report
Board Approval of Investment Advisory Contracts and Management Fees
Fidelity Latin America Fund
Each year, the Board of Trustees, including the Independent Trustees (together, the Board), votes on the renewal of the management contract and sub-advisory agreements (together, the Advisory Contracts) for the fund. The Board, assisted by the advice of fund counsel and Independent Trustees' counsel, requests and considers a broad range of information relevant to the renewal of the Advisory Contracts throughout the year.
The Board meets regularly and, at each of its meetings, considers factors that are relevant to its annual consideration of the renewal of the fund's Advisory Contracts, including the services and support provided to the fund and its shareholders. The Board has established various standing committees, each composed of and chaired by Independent Trustees with varying backgrounds, to which the Board has assigned specific subject matter responsibilities in order to enhance effective decision-making by the Board. The Board, acting directly and through its Committees, requests and receives information concerning the annual consideration of the renewal of the fund's Advisory Contracts. The Board also meets as needed to consider matters specifically related to the Board's annual consideration of the renewal of Advisory Contracts. Members of the Board may also meet with trustees of other Fidelity funds through ad hoc joint committees to discuss certain matters relevant to the Fidelity funds.
At its July 2012 meeting, the Board of Trustees, including the Independent Trustees, unanimously determined to renew the fund's Advisory Contracts. In reaching its determination, the Board considered all factors it believed relevant, including (i) the nature, extent, and quality of the services to be provided to the fund and its shareholders (including the investment performance of the fund); (ii) the competitiveness of the fund's management fee and total expense ratio relative to peer funds; (iii) the total costs of the services to be provided by and the profits to be realized by Fidelity from its relationship with the fund; (iv) the extent to which economies of scale exist and would be realized as the fund grows; and (v) whether fee levels reflect these economies of scale, if any, for the benefit of fund shareholders.
In considering whether to renew the Advisory Contracts for the fund, the Board reached a determination, with the assistance of fund counsel and Independent Trustees' counsel and through the exercise of its business judgment, that the renewal of the Advisory Contracts is in the best interests of the fund and its shareholders and that the compensation payable under the Advisory Contracts is fair and reasonable. The Board's decision to renew the Advisory Contracts was not based on any single factor, but rather was based on a comprehensive consideration of all the information provided to the Board at its meetings throughout the year. The Board, in reaching its determination to renew the Advisory Contracts, is aware that shareholders in the fund have a broad range of investment choices available to them, including a wide choice among mutual funds offered by Fidelity's competitors, and that the fund's shareholders, who have the opportunity to review and weigh the disclosure provided by the fund in its prospectus and other public disclosures, have chosen to invest in this fund, managed by Fidelity.
Nature, Extent, and Quality of Services Provided. The Board considered the staffing within the investment adviser, FMR, and the sub-advisers (together, the Investment Advisers), including the backgrounds of the fund's investment personnel, and also considered the fund's investment objective, strategies, and related investment philosophy. The Independent Trustees also had discussions with senior management of Fidelity's investment operations and investment groups. The Board considered the structure of the portfolio manager compensation program and whether this structure provides appropriate incentives to act in the best interests of the fund.
Resources Dedicated to Investment Management and Support Services. The Board and the Fund Oversight and Research Committees reviewed the general qualifications and capabilities of the Investment Advisers' investment staff, including its size, education, experience, and resources, as well as the Investment Advisers' approach to recruiting, training, managing, and compensating investment personnel. The Board also noted that FMR has continued to increase the resources devoted to non-U.S. offices, including expansion of Fidelity's global investment organization. The Board noted that Fidelity's analysts have extensive resources, tools and capabilities that allow them to conduct sophisticated quantitative and fundamental analysis, as well as credit analysis of issuers, counterparties and guarantors. The Board also believes that Fidelity's investment professionals have sufficient access to global information and data so as to provide competitive investment results over time, and that those professionals also have access to sophisticated tools that permit them to assess portfolio construction and risk and performance attribution characteristics continuously, as well as to transmit new information and research conclusions rapidly around the world. Additionally, in its deliberations, the Board considered the Investment Advisers' trading and risk management capabilities and resources, which are an integral part of the investment management process.
Shareholder and Administrative Services. The Board considered (i) the nature, extent, quality, and cost of advisory, administrative, and shareholder services performed by the Investment Advisers and their affiliates under the Advisory Contracts and under separate agreements covering transfer agency, pricing and bookkeeping, and securities lending services for the fund; (ii) the nature and extent of the supervision of third party service providers, principally custodians and subcustodians; and (iii) the resources devoted to, and the record of compliance with, the fund's compliance policies and procedures. The Board also reviewed the allocation of fund brokerage, including allocations to brokers affiliated with the Investment Advisers, the use of brokerage commissions to pay fund expenses, and the use of "soft" commission dollars to pay for research services.
The Board noted that the growth of fund assets over time across the complex allows Fidelity to reinvest in the development of services designed to enhance the value or convenience of the Fidelity funds as investment vehicles. These services include 24-hour access to account information and market information through telephone representatives and over the Internet, investor education materials and asset allocation tools, and the expanded availability of Fidelity Investor Centers.
Annual Report
Board Approval of Investment Advisory Contracts and Management Fees - continued
Investment in a Large Fund Family. The Board considered the benefits to shareholders of investing in a Fidelity fund, including the benefits of investing in a fund that is part of a large family of funds offering a variety of investment disciplines and providing a large variety of mutual fund investor services. The Board noted that Fidelity had taken, or had made recommendations that resulted in the Fidelity funds taking, a number of actions over the previous year that benefited particular funds, including (i) continuing to dedicate additional resources to investment research and support of the senior management team that oversees asset management; (ii) persisting in efforts to enhance Fidelity's research capabilities, in particular, international research; (iii) launching new funds and making other enhancements to meet client needs for global and income-oriented solutions; (iv) continuing to launch dedicated lower cost underlying funds to meet investment management's portfolio construction needs related to expanding underlying fund options, specifically for the Freedom Fund product lines; (v) adopting a "Stock Selector" sector neutral investment approach and employing a team of portfolio managers who are sector specialists to manage certain funds; (vi) rationalizing product lines and gaining increased efficiencies through the mergers of several funds into other funds; (vii) strengthening the Spartan Index Fund product line by adding new funds and/or new low-cost institutional share classes, restructuring fund expenses to accommodate new classes, and reducing investment minimums for certain classes of shares; (viii) modifying the eligibility criteria for Institutional Class shares to increase their appeal to government entities and charitable investors; and (ix) reducing certain transfer agent fee rates.
Investment Performance. The Board considered whether the fund has operated in accordance with its investment objective, as well as its record of compliance with its investment restrictions. It also reviewed the fund's absolute investment performance for the each class, as well as the fund's relative investment performance for the each class measured over multiple periods against a broad-based securities market index. The Board noted that FMR believes that no meaningful peer group exists for the fund. The following charts considered by the Board show, over the one-, three-, and five-year periods ended December 31, 2011, the cumulative total returns of the retail class and Class B of the fund and the cumulative total returns of a broad-based securities market index ("benchmark"). The returns of the retail class and Class B show the performance of the highest performing class (based on five-year performance) and the lowest performing class (based on one-year performance), respectively.
Fidelity Latin America Fund

The Board noted that the investment performance of the fund was lower than its benchmark for the three- and five-year periods, although the one-year total return of the retail class compared favorably to its benchmark. The Board considered that the variations in performance among the fund's classes reflect the variations in class expenses, which result in lower performance for higher expense classes. The Board also reviewed the fund's performance since inception as well as performance in the current year.
Based on its review, the Board concluded that the nature, extent, and quality of services provided to the fund under the Advisory Contracts should benefit the fund's shareholders.
Competitiveness of Management Fee and Total Expense Ratio. The Board considered the fund's management fee and total expense ratio compared to "mapped groups" of competitive funds and classes. Fidelity creates "mapped groups" by combining similar Lipper investment objective categories that have comparable management fee characteristics. Combining Lipper investment objective categories aids the Board's management fee and total expense ratio comparisons by broadening the competitive group used for comparison and by reducing the number of universes to which various Fidelity funds are compared.
Annual Report
Management Fee. The Board considered two proprietary management fee comparisons for the 12-month periods shown in the chart below. The group of Lipper funds used by the Board for management fee comparisons is referred to below as the "Total Mapped Group." The Total Mapped Group comparison focuses on a fund's standing relative to the total universe of comparable funds available to investors in terms of gross management fees before expense reimbursements or caps, and without giving effect to the fund's performance adjustment. "TMG %" represents the percentage of funds in the Total Mapped Group that had management fees that were lower than the fund's. For example, a TMG % of 7% means that 93% of the funds in the Total Mapped Group had higher management fees than the fund. The "Asset-Size Peer Group" (ASPG) comparison focuses on a fund's standing relative to non-Fidelity funds similar in size to the fund within the Total Mapped Group. The ASPG represents at least 15% of the funds in the Total Mapped Group with comparable asset size and management fee characteristics, subject to a minimum of 50 funds (or all funds in the Total Mapped Group if fewer than 50). Additional information, such as the ASPG quartile in which the fund's management fee ranked and the impact of the fund's performance adjustment, is also included in the chart and considered by the Board.
Fidelity Latin America Fund

The Board noted that the fund's management fee ranked below the median of its Total Mapped Group and below the median of its ASPG for 2011.
Based on its review, the Board concluded that the fund's management fee is fair and reasonable in light of the services that the fund receives and the other factors considered.
Total Expense Ratio. In its review of each class's total expense ratio, the Board considered the fund's management fee as well as other fund or class expenses, as applicable, such as transfer agent fees, pricing and bookkeeping fees, fund-paid 12b-1 fees, and custodial, legal, and audit fees. The Board also noted the effects of any waivers and reimbursements on fees and expenses, as well as the impact of the fund's performance adjustment. As part of its review, the Board also considered the current and historical total expense ratios of each class of the fund compared to competitive fund median expenses. Each class of the fund is compared to those funds and classes in the Total Mapped Group (used by the Board for management fee comparisons) that have a similar sales load structure.
The Board noted that the total expense ratio of each class ranked below its competitive median for the period.
Fees Charged to Other Fidelity Clients. The Board also considered Fidelity fee structures and other information with respect to clients of FMR and its affiliates, such as other mutual funds advised or subadvised by FMR or its affiliates, pension plan clients, and other institutional clients. The Board noted the findings of the 2010 ad hoc joint committee (created with the board of other Fidelity funds), which reviewed and compared Fidelity's institutional investment advisory business with its business of providing services to the Fidelity funds, including the differences in services provided, fees charged, and costs incurred, as well as competition in their respective marketplaces.
Based on its review of total expense ratios and fees charged to other Fidelity clients, the Board concluded that the total expense ratio of each class of the fund was reasonable in light of the services that the fund and its shareholders receive and the other factors considered.
Costs of the Services and Profitability. The Board considered the revenues earned and the expenses incurred by Fidelity in conducting the business of developing, marketing, distributing, managing, administering and servicing the fund and its shareholders. The Board also considered the level of Fidelity's profits in respect of all the Fidelity funds.
Annual Report
Board Approval of Investment Advisory Contracts and Management Fees - continued
On an annual basis, FMR presents to the Board Fidelity's profitability for the fund. Fidelity calculates the profitability for each fund, as well as aggregate profitability for groups of Fidelity funds and all Fidelity funds, using a series of detailed revenue and cost allocation methodologies which originate with the books and records of Fidelity on which Fidelity's audited financial statements are based. The Audit Committee of the Board reviews any significant changes from the prior year's methodologies.
PricewaterhouseCoopers LLP (PwC), independent registered public accounting firm and auditor to Fidelity and certain Fidelity funds, has been engaged annually by the Board as part of the Board's assessment of Fidelity's profitability analysis. PwC's engagement includes the review and assessment of Fidelity's methodologies used in determining the revenues and expenses attributable to Fidelity's mutual fund business, and completion of agreed-upon procedures surrounding the mathematical accuracy of fund profitability and its conformity to allocation methodologies. After considering PwC's reports issued under the engagement and information provided by Fidelity, the Board concluded that while other allocation methods may also be reasonable, Fidelity's profitability methodologies are reasonable in all material respects.
The Board also reviewed Fidelity's non-fund businesses and fall-out benefits related to the mutual fund business as well as cases where Fidelity's affiliates may benefit from or be related to the fund's business.
The Board considered the costs of the services provided by and the profits realized by Fidelity in connection with the operation of the fund and was satisfied that the profitability was not excessive in the circumstances.
Economies of Scale. The Board considered whether there have been economies of scale in respect of the management of the Fidelity funds, whether the Fidelity funds (including the fund) have appropriately benefited from any such economies of scale, and whether there is potential for realization of any further economies of scale. The Board considered the extent to which the fund will benefit from economies of scale through increased services to the fund, through waivers or reimbursements, or through fee or expense reductions. The Board also noted that in 2009, it and the board of other Fidelity funds created an ad hoc committee (the Economies of Scale Committee) to analyze whether FMR attains economies of scale in respect of the management and servicing of the Fidelity funds, whether the Fidelity funds have appropriately benefited from such economies of scale, and whether there is potential for realization of any further economies of scale.
The Board recognized that the fund's management contract incorporates a "group fee" structure, which provides for lower group fee rates as total fund assets under FMR's management increase, and for higher group fee rates as total fund assets under FMR's management decrease. FMR calculates the group fee rates based on a tiered asset "breakpoint" schedule that varies based on asset class. The Board considered that the group fee is designed to deliver the benefits of economies of scale to fund shareholders when total Fidelity fund assets increase, even if assets of any particular fund are unchanged or have declined, because some portion of Fidelity's costs are attributable to services provided to all Fidelity funds, and all funds benefit if those costs can be allocated among more assets. The Board concluded that, given the group fee structure, fund shareholders will benefit from lower management fees as assets under FMR's management increase at the fund complex level, regardless of whether Fidelity achieves any such economies of scale.
The Board concluded, taking into account the analysis of the Economies of Scale Committee, that economies of scale, if any, are being appropriately shared between fund shareholders and Fidelity.
Additional Information Requested by the Board. In order to develop fully the factual basis for consideration of the Fidelity funds' Advisory Contracts, the Board requested and received additional information on certain topics, including (i) fund performance trends, actions to be taken by FMR to improve certain funds' overall performance, and Fidelity's long-term strategies for certain funds; (ii) the potential to further rationalize the Fidelity fund lineup with the possibility of achieving savings for the funds and Fidelity; (iii) Fidelity's compensation structure for portfolio managers and other key investment personnel; (iv) the amount of the investment that each portfolio manager has made in the Fidelity fund(s) that he or she manages; (v) the realization of fall-out benefits in certain Fidelity business units; (vi) Fidelity's group fee structures, the potential impact of regulatory changes on such structures, and the rationale for the individual fee rates of certain funds; (vii) fund profitability methodology, including Fidelity's cost allocation methodology, and the impact of certain factors on fund profitability results; (viii) trends regarding industry use of performance fee structures and the possibility of implementing performance fee structures for additional funds; and (ix) the impact of net redemptions from the Fidelity funds.
Based on its evaluation of all of the conclusions noted above, and after considering all factors it believed relevant, the Board ultimately concluded that the advisory fee structures are fair and reasonable, and that the fund's Advisory Contracts should be renewed.
Annual Report
Investment Adviser
Fidelity Management & Research Company
Boston, MA
Investment Sub-Adviser(s)
FMR Co., Inc.
Fidelity Management & Research
(U.K.) Inc.
FIL Investment Advisors
FIL Investment Advisors
(UK) Limited
Fidelity Management & Research
(Hong Kong) Limited
Fidelity Management & Research
(Japan) Inc.
General Distributor
Fidelity Distributors Corporation
Smithfield, RI
Transfer and Service Agents
Fidelity Investments Institutional Operations Company, Inc.
Boston, MA
Fidelity Service Company, Inc.
Boston, MA
Custodian
Brown Brothers Harriman & Co.
Boston, MA
(Fidelity Investment logo)(registered trademark)
Corporate Headquarters
82 Devonshire St., Boston, MA 02109
www.fidelity.com
FALAI-UANN-1212
1.917407.102
Item 2. Code of Ethics
As of the end of the period, October 31, 2012, Fidelity Investment Trust (the trust) has adopted a code of ethics, as defined in Item 2 of Form N-CSR, that applies to its President and Treasurer and its Chief Financial Officer. A copy of the code of ethics is filed as an exhibit to this Form N-CSR.
Item 3. Audit Committee Financial Expert
The Board of Trustees of the trust has determined that Joseph Mauriello is an audit committee financial expert, as defined in Item 3 of Form N-CSR. Mr. Mauriello is independent for purposes of Item 3 of Form N-CSR.
Item 4. Principal Accountant Fees and Services
Fees and Services
The following table presents fees billed by Deloitte & Touche LLP, the member firms of Deloitte Touche Tohmatsu, and their respective affiliates (collectively, "Deloitte Entities") in each of the last two fiscal years for services rendered to Fidelity Europe Capital Appreciation Fund (the "Fund"):
Services Billed by Deloitte Entities
October 31, 2012 FeesA
| Audit Fees | Audit-Related Fees | Tax Fees | All Other Fees |
Fidelity Europe Capital Appreciation Fund | $43,000 | $- | $5,700 | $400 |
October 31, 2011 FeesA
| Audit Fees | Audit-Related Fees | Tax Fees | All Other Fees |
Fidelity Europe Capital Appreciation Fund | $43,000 | $- | $5,700 | $300 |
A Amounts may reflect rounding.
The following table presents fees billed by PricewaterhouseCoopers LLP ("PwC") in each of the last two fiscal years for services rendered to Fidelity Canada Fund, Fidelity China Region Fund, Fidelity Emerging Asia Fund, Fidelity Emerging Markets Fund, Fidelity Europe Fund, Fidelity Japan Fund, Fidelity Japan Smaller Companies Fund, Fidelity Latin America Fund, Fidelity Nordic Fund and Fidelity Pacific Basin (the "Funds"):
Services Billed by PwC
October 31, 2012 FeesA
| Audit Fees | Audit-Related Fees | Tax Fees | All Other Fees |
Fidelity Canada Fund | $64,000 | $- | $5,100 | $3,100 |
Fidelity China Region Fund | $59,000 | $- | $5,100 | $2,100 |
Fidelity Emerging Asia Fund | $61,000 | $- | $5,100 | $2,100 |
Fidelity Emerging Markets Fund | $77,000 | $- | $5,300 | $2,800 |
Fidelity Europe Fund | $62,000 | $- | $8,200 | $1,800 |
Fidelity Japan Fund | $60,000 | $- | $5,100 | $1,700 |
Fidelity Japan Smaller Companies Fund | $50,000 | $- | $5,100 | $1,600 |
Fidelity Latin America Fund | $62,000 | $- | $5,100 | $2,700 |
Fidelity Nordic Fund | $50,000 | $- | $5,100 | $1,600 |
Fidelity Pacific Basin Fund | $61,000 | $- | $5,300 | $1,800 |
October 31, 2011 FeesA
| Audit Fees | Audit-Related Fees | Tax Fees | All Other Fees |
Fidelity Canada Fund | $66,000 | $- | $5,100 | $3,900 |
Fidelity China Region Fund | $59,000 | $- | $5,100 | $2,600 |
Fidelity Emerging Asia Fund | $61,000 | $- | $5,100 | $2,500 |
Fidelity Emerging Markets Fund | $80,000 | $- | $5,300 | $3,800 |
Fidelity Europe Fund | $62,000 | 4- | $8,300 | $2,100 |
Fidelity Japan Fund | $60,000 | $- | $5,100 | $2,000 |
Fidelity Japan Smaller Companies Fund | $49,000 | $- | $5,100 | $1,800 |
Fidelity Latin America Fund | $65,000 | $- | $5,100 | $3,500 |
Fidelity Nordic Fund | $50,000 | $- | $5,100 | $1,900 |
Fidelity Pacific Basin Fund | $62,000 | $- | $5,300 | $2,100 |
A Amounts may reflect rounding.
The following table presents fees billed by PwC and Deloitte Entities that were required to be approved by the Audit Committee for services that relate directly to the operations and financial reporting of the Funds and that are rendered on behalf of Fidelity Management & Research Company ("FMR") and entities controlling, controlled by, or under common control with FMR (not including any sub-adviser whose role is primarily portfolio management and is subcontracted with or overseen by another investment adviser) that provide ongoing services to the Funds ("Fund Service Providers"):
Services Billed by Deloitte Entities
| October 31, 2012A | October 31, 2011A |
Audit-Related Fees | $720,000 | $440,000 |
Tax Fees | $- | $- |
All Other Fees | $1,305,000 | $430,000 |
A Amounts may reflect rounding.
Services Billed by PwC
| October 31, 2012A | October 31, 2011A |
Audit-Related Fees | $3,640,000 | $3,835,000 |
Tax Fees | $- | $- |
All Other Fees | $- | $- |
A Amounts may reflect rounding.
"Audit-Related Fees" represent fees billed for assurance and related services that are reasonably related to the performance of the fund audit or the review of the fund's financial statements and that are not reported under Audit Fees.
"Tax Fees" represent fees billed for tax compliance, tax advice or tax planning that relate directly to the operations and financial reporting of the fund.
"All Other Fees" represent fees billed for services provided to the fund or Fund Service Provider, a significant portion of which are assurance related, that relate directly to the operations and financial reporting of the fund, excluding those services that are reported under Audit Fees, Audit-Related Fees or Tax Fees.
Assurance services must be performed by an independent public accountant.
* * *
The aggregate non-audit fees billed by PwC and Deloitte Entities for services rendered to the Funds, FMR (not including any sub-adviser whose role is primarily portfolio management and is subcontracted with or overseen by another investment adviser), and any Fund Service Provider for each of the last two fiscal years of the Funds are as follows:
Billed By | October 31, 2012 A | October 31, 2011 A |
PwC | $4,245,000 | $5,915,000 |
Deloitte Entities | $2,070,000 | $965,000 |
A Amounts may reflect rounding.
The trust's Audit Committee has considered non-audit services that were not pre-approved that were provided by PwC and Deloitte Entities to Fund Service Providers to be compatible with maintaining the independence of PwC and Deloitte Entities in their audits of the Funds, taking into account representations from PwC and Deloitte Entities, in accordance with Public Company Accounting Oversight Board rules, regarding their independence from the Funds and their related entities and FMR's review of the appropriateness and permissibility under applicable law of such non-audit services prior to their provision to the Fund Service Providers.
Audit Committee Pre-Approval Policies and Procedures
The trust's Audit Committee must pre-approve all audit and non-audit services provided by a fund's independent registered public accounting firm relating to the operations or financial reporting of the fund. Prior to the commencement of any audit or non-audit services to a fund, the Audit Committee reviews the services to determine whether they are appropriate and permissible under applicable law.
The Audit Committee has adopted policies and procedures to, among other purposes, provide a framework for the Committee's consideration of non-audit services by the audit firms that audit the Fidelity funds. The policies and procedures require that any non-audit service provided by a fund audit firm to a Fidelity fund and any non-audit service provided by a fund auditor to a Fund Service Provider that relates directly to the operations and financial reporting of a Fidelity fund ("Covered Service") are subject to approval by the Audit Committee before such service is provided.
All Covered Services must be approved in advance of provision of the service either: (i) by formal resolution of the Audit Committee, or (ii) by oral or written approval of the service by the Chair of the Audit Committee (or if the Chair is unavailable, such other member of the Audit Committee as may be designated by the Chair to act in the Chair's absence). The approval contemplated by (ii) above is permitted where the Treasurer determines that action on such an engagement is necessary before the next meeting of the Audit Committee.
Non-audit services provided by a fund audit firm to a Fund Service Provider that do not relate directly to the operations and financial reporting of a Fidelity fund are reported to the Audit Committee on a periodic basis.
Non-Audit Services Approved Pursuant to Rule 2-01(c)(7)(i)(C) and (ii) of Regulation S-X ("De Minimis Exception")
There were no non-audit services approved or required to be approved by the Audit Committee pursuant to the De Minimis Exception during the Funds' last two fiscal years relating to services provided to (i) the Funds or (ii) any Fund Service Provider that relate directly to the operations and financial reporting of the Funds.
Item 5. Audit Committee of Listed Registrants
Not applicable.
Item 6. Investments
(a) Not applicable.
(b) Not applicable
Item 7. Disclosure of Proxy Voting Policies and Procedures for Closed-End Management Investment Companies
Not applicable.
Item 8. Portfolio Managers of Closed-End Management Investment Companies
Not applicable.
Item 9. Purchase of Equity Securities by Closed-End Management Investment Company and Affiliated Purchasers
Not applicable.
Item 10. Submission of Matters to a Vote of Security Holders
There were no material changes to the procedures by which shareholders may recommend nominees to the trust's Board of Trustees.
Item 11. Controls and Procedures
(a)(i) The President and Treasurer and the Chief Financial Officer have concluded that the trust's disclosure controls and procedures (as defined in Rule 30a-3(c) under the Investment Company Act) provide reasonable assurances that material information relating to the trust is made known to them by the appropriate persons, based on their evaluation of these controls and procedures as of a date within 90 days of the filing date of this report.
(a)(ii) There was no change in the trust's internal control over financial reporting (as defined in Rule 30a-3(d) under the Investment Company Act) that occurred during the second fiscal quarter of the period covered by this report that has materially affected, or is reasonably likely to materially affect, the trust's internal control over financial reporting.
Item 12. Exhibits
(a) | (1) | Code of Ethics pursuant to Item 2 of Form N-CSR is filed and attached hereto as EX-99.CODE ETH. |
(a) | (2) | Certification pursuant to Rule 30a-2(a) under the Investment Company Act of 1940 (17 CFR 270.30a-2(a)) is filed and attached hereto as Exhibit 99.CERT. |
(a) | (3) | Not applicable. |
(b) | | Certification pursuant to Rule 30a-2(b) under the Investment Company Act of 1940 (17 CFR 270.30a-2(b)) is furnished and attached hereto as Exhibit 99.906CERT. |
SIGNATURES
Pursuant to the requirements of the Securities Exchange Act of 1934 and the Investment Company Act of 1940, the registrant has duly caused this report to be signed on its behalf by the undersigned, thereunto duly authorized.
Fidelity Investment Trust
By: | /s/Kenneth B. Robins |
| Kenneth B. Robins |
| President and Treasurer |
| |
Date: | December 26, 2012 |
Pursuant to the requirements of the Securities Exchange Act of 1934 and the Investment Company Act of 1940, this report has been signed below by the following persons on behalf of the registrant and in the capacities and on the dates indicated.
By: | /s/Kenneth B. Robins |
| Kenneth B. Robins |
| President and Treasurer |
| |
Date: | December 26, 2012 |
By: | /s/Christine Reynolds |
| Christine Reynolds |
| Chief Financial Officer |
| |
Date: | December 26, 2012 |