UNITED STATES
SECURITIES AND EXCHANGE COMMISSION
Washington, D.C. 20549
FORM N-CSR
CERTIFIED SHAREHOLDER REPORT OF REGISTERED
MANAGEMENT INVESTMENT COMPANIES
Investment Company Act file number 811-04008
Fidelity Investment Trust
(Exact name of registrant as specified in charter)
245 Summer St., Boston, MA 02210
(Address of principal executive offices) (Zip code)
Margaret Carey, Secretary
245 Summer St.
Boston, Massachusetts 02210
(Name and address of agent for service)
Registrant's telephone number, including area code:
617-563-7000
| |
Date of fiscal year end: | October 31 |
|
|
Date of reporting period: | April 30, 2023 |
Item 1.
Reports to Stockholders
Fidelity® Series Emerging Markets Fund
Fidelity® Series Emerging Markets Opportunities Fund
Fidelity® Series International Growth Fund
Fidelity® Series International Small Cap Fund
Fidelity® Series International Value Fund
Semi-Annual Report
April 30, 2023
Contents
To view a fund's proxy voting guidelines and proxy voting record for the 12-month period ended June 30, visit http://www.fidelity.com/proxyvotingresults or visit the Securities and Exchange Commission's (SEC) web site at http://www.sec.gov.
You may also call 1-800-544-8544 to request a free copy of the proxy voting guidelines.
Standard & Poor's, S&P and S&P 500 are registered service marks of The McGraw-Hill Companies, Inc. and have been licensed for use by Fidelity Distributors Corporation.
Other third-party marks appearing herein are the property of their respective owners.
All other marks appearing herein are registered or unregistered trademarks or service marks of FMR LLC or an affiliated company. © 2023 FMR LLC. All rights reserved.
This report and the financial statements contained herein are submitted for the general information of the shareholders of the Funds. This report is not authorized for distribution to prospective investors in the Funds unless preceded or accompanied by an effective prospectus.
A fund files its complete schedule of portfolio holdings with the SEC for the first and third quarters of each fiscal year on Form N-PORT. Forms N-PORT are available on the SEC's web site at http://www.sec.gov. A fund's Forms N-PORT may be reviewed and copied at the SEC's Public Reference Room in Washington, DC. Information regarding the operation of the SEC's Public Reference Room may be obtained by calling 1-800-SEC-0330.
For a complete list of a fund's portfolio holdings, view the most recent holdings listing, semiannual report, or annual report on Fidelity's web site at http://www.fidelity.com, http://www.institutional.fidelity.com, or http://www.401k.com, as applicable.
NOT FDIC INSURED •MAY LOSE VALUE •NO BANK GUARANTEE
Neither the Funds nor Fidelity Distributors Corporation is a bank.
Top Holdings (% of Fund's net assets) |
| |
| Taiwan Semiconductor Manufacturing Co. Ltd. (Taiwan, Semiconductors & Semiconductor Equipment) | 7.8 | |
| Samsung Electronics Co. Ltd. (Korea (South), Technology Hardware, Storage & Peripherals) | 5.2 | |
| Tencent Holdings Ltd. (China, Interactive Media & Services) | 5.0 | |
| Alibaba Group Holding Ltd. (China, Broadline Retail) | 3.1 | |
| Reliance Industries Ltd. (India, Oil, Gas & Consumable Fuels) | 2.5 | |
| Meituan Class B (China, Hotels, Restaurants & Leisure) | 2.0 | |
| HDFC Bank Ltd. (India, Banks) | 1.8 | |
| LG Chemical Ltd. (Korea (South), Chemicals) | 1.8 | |
| ICICI Bank Ltd. (India, Banks) | 1.7 | |
| NetEase, Inc. ADR (China, Entertainment) | 1.5 | |
| | 32.4 | |
| |
| Market Sectors (% of Fund's net assets) |
| |
| Financials | 21.0 | |
| Information Technology | 17.3 | |
| Consumer Discretionary | 15.1 | |
| Communication Services | 11.4 | |
| Consumer Staples | 7.8 | |
| Materials | 6.1 | |
| Industrials | 5.4 | |
| Energy | 4.8 | |
| Health Care | 4.3 | |
| Utilities | 1.8 | |
| |
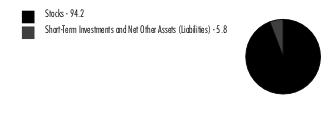
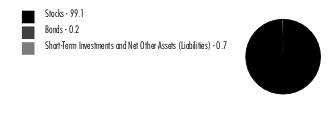
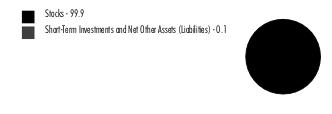
Asset Allocation (% of Fund's net assets) |
|
Futures - 1.5% |
|
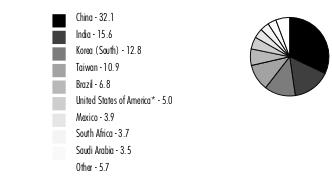
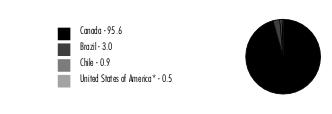
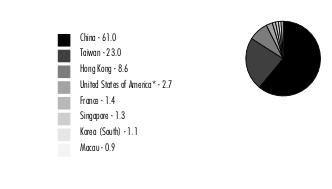
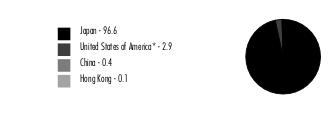
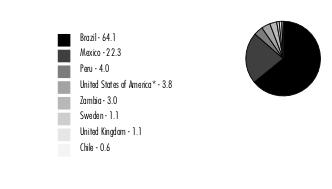
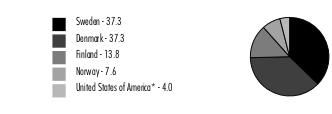
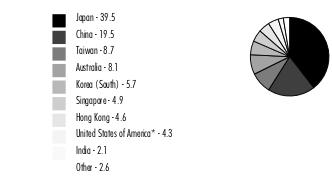
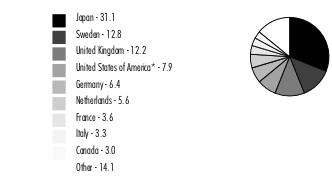
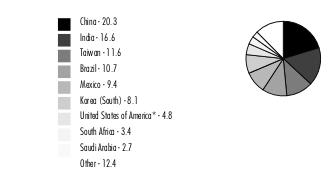
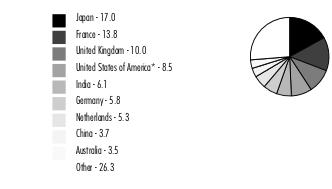
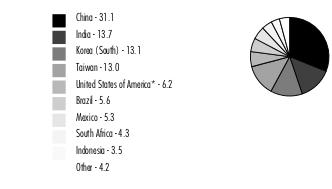
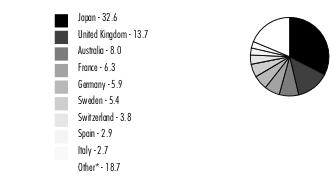
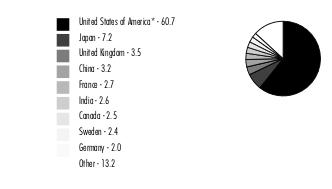
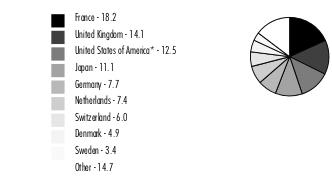
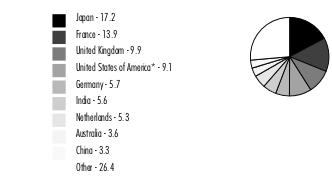
Geographic Diversification (% of Fund's net assets) |
|
* Includes Short-Term investments and Net Other Assets (Liabilities). Percentages are adjusted for the effect of derivatives, if applicable. |
| |
Fidelity® Series Emerging Markets Fund
| Common Stocks - 92.5% |
| | | Shares | Value ($) |
| Australia - 0.1% | | | |
| AngloGold Ashanti Ltd. | | 130,800 | 3,495,834 |
| Brazil - 4.3% | | | |
| Azul SA sponsored ADR (a)(b) | | 1,505,000 | 9,797,550 |
| Hapvida Participacoes e Investimentos SA (a)(c) | | 40,997,194 | 22,685,804 |
| Localiza Rent a Car SA | | 1,468,133 | 17,074,942 |
| Localiza Rent a Car SA rights 5/11/23 (a) | | 1,939 | 6,671 |
| Lojas Renner SA | | 4,890,905 | 15,532,286 |
| Natura & Co. Holding SA | | 2,479,867 | 5,498,883 |
| Pet Center Comercio e Participacoes SA | | 12,853,384 | 15,899,872 |
| Raia Drogasil SA | | 4,947,987 | 26,070,231 |
| Vale SA | | 1,044,152 | 15,156,302 |
| Vamos Locacao de Caminhoes Maquinas e Equipamentos SA | | 7,190,674 | 17,616,993 |
TOTAL BRAZIL | | | 145,339,534 |
| China - 32.1% | | | |
| Airtac International Group | | 1,002,993 | 36,377,677 |
| Alibaba Group Holding Ltd. (a) | | 9,860,699 | 104,263,351 |
| Alibaba Group Holding Ltd. sponsored ADR (a) | | 157,400 | 13,330,206 |
| Baidu, Inc. sponsored ADR (a) | | 90,099 | 10,866,840 |
| BeiGene Ltd. ADR (a) | | 34,866 | 8,889,435 |
| Bilibili, Inc. ADR (a)(b) | | 573,610 | 11,678,700 |
| BYD Co. Ltd. (H Shares) | | 631,237 | 19,143,052 |
| China Construction Bank Corp. (H Shares) | | 69,357,686 | 46,367,445 |
| China Life Insurance Co. Ltd. (H Shares) | | 16,890,492 | 32,449,262 |
| China Petroleum & Chemical Corp. (H Shares) | | 33,945,833 | 22,248,631 |
| China Resources Beer Holdings Co. Ltd. | | 941,787 | 7,275,100 |
| Contemporary Amperex Technology Co. Ltd. | | 253,960 | 8,517,953 |
| ENN Energy Holdings Ltd. | | 2,048,195 | 28,084,046 |
| Flat Glass Group Co. Ltd. | | 76,000 | 213,659 |
| Guangzhou Automobile Group Co. Ltd. (H Shares) | | 32,741,340 | 20,434,430 |
| Haier Smart Home Co. Ltd. | | 6,908,077 | 22,517,452 |
| Hansoh Pharmaceutical Group Co. Ltd. (c) | | 1,567,220 | 2,859,084 |
| Industrial & Commercial Bank of China Ltd. (H Shares) | | 36,214,791 | 19,483,712 |
| JD.com, Inc. sponsored ADR | | 454,455 | 16,233,133 |
| Kunlun Energy Co. Ltd. | | 12,098,244 | 11,215,167 |
| Kweichow Moutai Co. Ltd. (A Shares) | | 117,946 | 30,094,455 |
| Li Auto, Inc. ADR (a) | | 609,404 | 14,320,994 |
| Li Ning Co. Ltd. | | 3,083,438 | 22,051,571 |
| Meituan Class B (a)(c) | | 3,925,440 | 67,087,564 |
| NetEase, Inc. ADR | | 586,292 | 52,256,206 |
| New Horizon Health Ltd. (a)(c) | | 3,283,953 | 11,784,599 |
| PDD Holdings, Inc. ADR (a) | | 384,452 | 26,200,404 |
| Ping An Insurance Group Co. of China Ltd. (H Shares) | | 6,483,292 | 47,298,991 |
| Shenzhen Mindray Bio-Medical Electronics Co. Ltd. (A Shares) | | 723,861 | 32,725,553 |
| Shenzhou International Group Holdings Ltd. | | 1,491,447 | 14,325,596 |
| Silergy Corp. | | 655,085 | 10,332,851 |
| Sinopharm Group Co. Ltd. (H Shares) | | 543,000 | 1,923,457 |
| Sinotruk Hong Kong Ltd. | | 13,571,598 | 20,740,682 |
| Sunny Optical Technology Group Co. Ltd. | | 835,139 | 8,825,172 |
| Tencent Holdings Ltd. | | 3,856,973 | 171,311,760 |
| Trip.com Group Ltd. ADR (a) | | 1,329,474 | 47,209,622 |
| Wuliangye Yibin Co. Ltd. (A Shares) | | 782,068 | 19,151,922 |
| Wuxi Biologics (Cayman), Inc. (a)(c) | | 3,175,673 | 18,936,028 |
| Zai Lab Ltd. ADR (a) | | 293,732 | 10,274,745 |
| Zijin Mining Group Co. Ltd. (H Shares) | | 15,918,889 | 26,951,565 |
TOTAL CHINA | | | 1,096,252,072 |
| Hungary - 0.4% | | | |
| OTP Bank PLC | | 178,830 | 5,440,674 |
| Richter Gedeon PLC | | 364,506 | 8,796,336 |
TOTAL HUNGARY | | | 14,237,010 |
| India - 15.6% | | | |
| Axis Bank Ltd. | | 1,305,668 | 13,797,056 |
| Bharti Airtel Ltd. | | 3,085,187 | 30,233,830 |
| HDFC Bank Ltd. | | 2,985,869 | 61,798,608 |
| HDFC Standard Life Insurance Co. Ltd. (c) | | 3,156,812 | 20,515,705 |
| Hindustan Aeronautics Ltd. | | 226,072 | 8,104,458 |
| Hindustan Unilever Ltd. | | 1,001,547 | 30,178,065 |
| Housing Development Finance Corp. Ltd. | | 959,376 | 32,722,210 |
| ICICI Bank Ltd. | | 5,253,582 | 59,328,645 |
| Infosys Ltd. | | 2,133,841 | 32,958,131 |
| ITC Ltd. | | 7,094,836 | 37,036,915 |
| Larsen & Toubro Ltd. | | 1,553,594 | 45,090,075 |
| NTPC Ltd. | | 10,939,148 | 23,096,876 |
| Reliance Industries Ltd. | | 2,864,800 | 85,166,184 |
| SRF Ltd. | | 172,300 | 5,374,940 |
| Tata Consultancy Services Ltd. | | 229,329 | 9,076,474 |
| Tata Steel Ltd. | | 10,532,663 | 13,978,613 |
| Ultratech Cement Ltd. | | 252,376 | 23,388,140 |
TOTAL INDIA | | | 531,844,925 |
| Indonesia - 3.4% | | | |
| PT Bank Central Asia Tbk | | 51,910,247 | 32,124,735 |
| PT Bank Mandiri (Persero) Tbk | | 72,557,542 | 25,649,097 |
| PT Bank Rakyat Indonesia (Persero) Tbk | | 79,977,601 | 27,870,534 |
| PT Telkom Indonesia Persero Tbk | | 25,973,197 | 7,523,106 |
| PT United Tractors Tbk | | 11,454,327 | 22,611,715 |
TOTAL INDONESIA | | | 115,779,187 |
| Korea (South) - 12.8% | | | |
| Db Insurance Co. Ltd. | | 349,584 | 21,984,110 |
| Hansol Chemical Co. Ltd. | | 69,022 | 11,509,272 |
| Hyundai Fire & Marine Insurance Co. Ltd. | | 246,310 | 6,922,557 |
| Hyundai Motor Co. Ltd. | | 245,080 | 36,317,913 |
| JYP Entertainment Corp. | | 102,086 | 6,908,641 |
| KB Financial Group, Inc. | | 521,854 | 19,376,921 |
| Kia Corp. | | 511,191 | 32,388,251 |
| Korea Aerospace Industries Ltd. | | 160,310 | 6,587,483 |
| LG Chemical Ltd. | | 107,566 | 59,774,810 |
| LG H & H Co. Ltd. | | 9,730 | 4,545,188 |
| LG Innotek Co. Ltd. | | 22,275 | 4,435,169 |
| NAVER Corp. | | 105,399 | 15,275,771 |
| POSCO | | 38,260 | 10,832,049 |
| Samsung Electronics Co. Ltd. | | 3,604,535 | 177,428,144 |
| SK Hynix, Inc. | | 343,612 | 23,128,574 |
TOTAL KOREA (SOUTH) | | | 437,414,853 |
| Mexico - 3.9% | | | |
| America Movil S.A.B. de CV Series L | | 9,360,981 | 10,095,354 |
| CEMEX S.A.B. de CV sponsored ADR (a) | | 1,269,623 | 7,617,738 |
| Fomento Economico Mexicano S.A.B. de CV sponsored ADR | | 166,969 | 16,199,332 |
| Gruma S.A.B. de CV Series B | | 1,081,725 | 16,932,054 |
| Grupo Aeroportuario del Sureste S.A.B. de CV Series B | | 138,696 | 3,980,871 |
| Grupo Financiero Banorte S.A.B. de CV Series O | | 5,974,079 | 51,661,604 |
| Wal-Mart de Mexico SA de CV Series V | | 6,956,934 | 28,049,064 |
TOTAL MEXICO | | | 134,536,017 |
| Peru - 0.2% | | | |
| Credicorp Ltd. (United States) | | 54,594 | 7,396,395 |
| Russia - 0.1% | | | |
| LUKOIL PJSC (d) | | 568,462 | 204,715 |
| Sberbank of Russia (d) | | 5,098,115 | 36,469 |
| Yandex NV Series A (a)(d) | | 273,678 | 2,079,953 |
TOTAL RUSSIA | | | 2,321,137 |
| Saudi Arabia - 3.5% | | | |
| Al Rajhi Bank | | 1,216,852 | 24,916,478 |
| Alinma Bank | | 3,335,931 | 28,150,003 |
| Dr Sulaiman Al Habib Medical Services Group Co. | | 408,369 | 31,248,008 |
| Saudi Telecom Co. | | 1,342,134 | 16,102,602 |
| The Saudi National Bank | | 1,379,954 | 17,991,242 |
TOTAL SAUDI ARABIA | | | 118,408,333 |
| Singapore - 0.6% | | | |
| Sea Ltd. ADR (a) | | 282,200 | 21,495,174 |
| South Africa - 3.7% | | | |
| Absa Group Ltd. | | 3,164,829 | 30,733,920 |
| Bid Corp. Ltd. | | 1,016,916 | 23,142,935 |
| Gold Fields Ltd. sponsored ADR | | 566,100 | 8,808,516 |
| Impala Platinum Holdings Ltd. | | 1,502,130 | 14,624,440 |
| MTN Group Ltd. (b) | | 3,843,674 | 26,962,977 |
| Naspers Ltd. Class N | | 118,722 | 21,165,843 |
TOTAL SOUTH AFRICA | | | 125,438,631 |
| Taiwan - 10.9% | | | |
| Chailease Holding Co. Ltd. | | 3,675,336 | 26,749,238 |
| eMemory Technology, Inc. | | 304,416 | 18,188,855 |
| HIWIN Technologies Corp. | | 1,906,396 | 14,633,167 |
| Hon Hai Precision Industry Co. Ltd. (Foxconn) | | 3,055,425 | 10,404,237 |
| International Games Systems Co. Ltd. | | 571,689 | 9,977,251 |
| MediaTek, Inc. | | 1,250,763 | 27,177,392 |
| Taiwan Semiconductor Manufacturing Co. Ltd. | | 16,248,342 | 265,890,288 |
TOTAL TAIWAN | | | 373,020,428 |
| Thailand - 0.9% | | | |
| Bangkok Bank PCL (For. Reg.) | | 2,921,081 | 13,472,239 |
| CP ALL PCL (For. Reg.) | | 5,070,933 | 9,637,842 |
| Thai Beverage PCL | | 13,122,901 | 6,306,334 |
TOTAL THAILAND | | | 29,416,415 |
| TOTAL COMMON STOCKS (Cost $2,966,429,091) | | | 3,156,395,945 |
| | | | |
| Nonconvertible Preferred Stocks - 2.5% |
| | | Shares | Value ($) |
| Brazil - 2.5% | | | |
| Banco Bradesco SA (PN) | | 2,424,400 | 6,732,014 |
| Gerdau SA | | 2,280,926 | 11,514,840 |
| Itau Unibanco Holding SA | | 6,260,861 | 32,535,691 |
| Petroleo Brasileiro SA - Petrobras sponsored ADR (b) | | 3,279,083 | 34,823,861 |
| | | | |
| TOTAL NONCONVERTIBLE PREFERRED STOCKS (Cost $82,415,859) | | | 85,606,406 |
| | | | |
| Government Obligations - 0.2% |
| | | Principal Amount (e) | Value ($) |
| United States of America - 0.2% | | | |
U.S. Treasury Bills, yield at date of purchase 4.45% to 4.58% 6/1/23 (f) (Cost $4,960,651) | | 4,980,000 | 4,961,657 |
| | | | |
| Money Market Funds - 9.5% |
| | | Shares | Value ($) |
| Fidelity Cash Central Fund 4.88% (g) | | 288,813,824 | 288,871,587 |
| Fidelity Securities Lending Cash Central Fund 4.88% (g)(h) | | 35,035,809 | 35,039,313 |
| TOTAL MONEY MARKET FUNDS (Cost $323,910,899) | | | 323,910,900 |
| | | | |
| TOTAL INVESTMENT IN SECURITIES - 104.7% (Cost $3,377,716,500) | 3,570,874,908 |
NET OTHER ASSETS (LIABILITIES) - (4.7)% | (160,055,401) |
| NET ASSETS - 100.0% | 3,410,819,507 |
| | |
| Futures Contracts |
| | Number of contracts | Expiration Date | Notional Amount ($) | Value ($) | Unrealized Appreciation/ (Depreciation) ($) |
| Purchased | | | | | |
| | | | | | |
| Equity Index Contracts | | | | | |
| ICE E-mini MSCI Emerging Markets Index Contracts (United States) | 1,027 | Jun 2023 | 50,538,670 | 1,465,660 | 1,465,660 |
| | | | | | |
| The notional amount of futures purchased as a percentage of Net Assets is 1.5% |
Legend
| (b) | Security or a portion of the security is on loan at period end. |
| (c) | Security exempt from registration under Rule 144A of the Securities Act of 1933. These securities may be resold in transactions exempt from registration, normally to qualified institutional buyers. At the end of the period, the value of these securities amounted to $143,868,784 or 4.2% of net assets. |
| (e) | Amount is stated in United States dollars unless otherwise noted. |
| (f) | Security or a portion of the security was pledged to cover margin requirements for futures contracts. At period end, the value of securities pledged amounted to $4,391,764. |
| (g) | Affiliated fund that is generally available only to investment companies and other accounts managed by Fidelity Investments. The rate quoted is the annualized seven-day yield of the fund at period end. A complete unaudited listing of the fund's holdings as of its most recent quarter end is available upon request. In addition, each Fidelity Central Fund's financial statements are available on the SEC's website or upon request. |
| (h) | Investment made with cash collateral received from securities on loan. |
Affiliated Central Funds
Fiscal year to date information regarding the Fund's investments in Fidelity Central Funds, including the ownership percentage, is presented below.
| Affiliate | Value, beginning of period ($) | Purchases ($) | Sales Proceeds ($) | Dividend Income ($) | Realized Gain (loss) ($) | Change in Unrealized appreciation (depreciation) ($) | Value, end of period ($) | % ownership, end of period |
| Fidelity Cash Central Fund 4.88% | 175,911,032 | 1,276,051,844 | 1,163,091,290 | 3,766,096 | - | 1 | 288,871,587 | 0.7% |
| Fidelity Securities Lending Cash Central Fund 4.88% | 9,725,325 | 178,675,706 | 153,361,718 | 178,673 | - | - | 35,039,313 | 0.1% |
| Total | 185,636,357 | 1,454,727,550 | 1,316,453,008 | 3,944,769 | - | 1 | 323,910,900 | |
| | | | | | | | | |
Amounts in the dividend income column in the above table include any capital gain distributions from underlying funds, which are presented in the corresponding line item in the Statement of Operations, if applicable.
Amounts in the dividend income column for Fidelity Securities Lending Cash Central Fund represents the income earned on investing cash collateral, less rebates paid to borrowers and any lending agent fees associated with the loan, plus any premium payments received for lending certain types of securities.
Amounts included in the purchases and sales proceeds columns may include in-kind transactions, if applicable.
Investment Valuation
The following is a summary of the inputs used, as of April 30, 2023, involving the Fund's assets and liabilities carried at fair value. The inputs or methodology used for valuing securities may not be an indication of the risk associated with investing in those securities. For more information on valuation inputs, and their aggregation into the levels used below, please refer to the Investment Valuation section in the accompanying Notes to Financial Statements.
| Valuation Inputs at Reporting Date: |
| Description | Total ($) | Level 1 ($) | Level 2 ($) | Level 3 ($) |
Investments in Securities: | | | | |
|
| Equities: | | | | |
Communication Services | 392,768,165 | 149,457,853 | 241,230,359 | 2,079,953 |
Consumer Discretionary | 508,421,540 | 169,892,360 | 338,529,180 | - |
Consumer Staples | 260,118,320 | 115,892,499 | 144,225,821 | - |
Energy | 165,055,106 | 34,823,861 | 130,026,530 | 204,715 |
Financials | 713,505,555 | 205,558,021 | 507,911,065 | 36,469 |
Health Care | 150,123,049 | 81,894,328 | 68,228,721 | - |
Industrials | 188,528,522 | 48,477,027 | 140,051,495 | - |
Information Technology | 588,058,946 | - | 588,058,946 | - |
Materials | 213,027,059 | 43,097,396 | 169,929,663 | - |
Utilities | 62,396,089 | - | 62,396,089 | - |
|
| Government Obligations | 4,961,657 | - | 4,961,657 | - |
|
| Money Market Funds | 323,910,900 | 323,910,900 | - | - |
| Total Investments in Securities: | 3,570,874,908 | 1,173,004,245 | 2,395,549,526 | 2,321,137 |
Derivative Instruments: | | | | |
|
| Assets | | | | |
Futures Contracts | 1,465,660 | 1,465,660 | - | - |
| Total Assets | 1,465,660 | 1,465,660 | - | - |
| Total Derivative Instruments: | 1,465,660 | 1,465,660 | - | - |
Value of Derivative Instruments
The following table is a summary of the Fund's value of derivative instruments by primary risk exposure as of April 30, 2023. For additional information on derivative instruments, please refer to the Derivative Instruments section in the accompanying Notes to Financial Statements.
Primary Risk Exposure / Derivative Type | Value |
| Asset ($) | Liability ($) |
| Equity Risk | | |
Futures Contracts (a) | 1,465,660 | 0 |
| Total Equity Risk | 1,465,660 | 0 |
| Total Value of Derivatives | 1,465,660 | 0 |
(a)Reflects gross cumulative appreciation (depreciation) on futures contracts as presented in the Schedule of Investments. In the Statement of Assets and Liabilities, the period end daily variation margin is included in receivable or payable for daily variation margin on futures contracts, and the net cumulative appreciation (depreciation) is included in Total accumulated earnings (loss).
Fidelity® Series Emerging Markets Fund
| Statement of Assets and Liabilities |
| | | | April 30, 2023 (Unaudited) |
| | | | | |
| Assets | | | | |
| Investment in securities, at value (including securities loaned of $33,633,679) - See accompanying schedule: | | | | |
Unaffiliated issuers (cost $3,053,805,601) | $ | 3,246,964,008 | | |
Fidelity Central Funds (cost $323,910,899) | | 323,910,900 | | |
| | | | | |
| | | | | |
| Total Investment in Securities (cost $3,377,716,500) | | | $ | 3,570,874,908 |
| Foreign currency held at value (cost $1,914,645) | | | | 1,910,999 |
| Receivable for investments sold | | | | 1,499,989 |
| Receivable for fund shares sold | | | | 14,033,310 |
| Dividends receivable | | | | 10,463,395 |
| Distributions receivable from Fidelity Central Funds | | | | 1,039,334 |
| Receivable for daily variation margin on futures contracts | | | | 694,667 |
| Receivable from investment adviser for expense reductions | | | | 43,414 |
| Other receivables | | | | 1,011,878 |
Total assets | | | | 3,601,571,894 |
| Liabilities | | | | |
| Payable for investments purchased | $ | 148,104,680 | | |
| Payable for fund shares redeemed | | 58,749 | | |
| Other payables and accrued expenses | | 7,549,645 | | |
| Collateral on securities loaned | | 35,039,313 | | |
| Total Liabilities | | | | 190,752,387 |
| Net Assets | | | $ | 3,410,819,507 |
| Net Assets consist of: | | | | |
| Paid in capital | | | $ | 3,673,583,849 |
| Total accumulated earnings (loss) | | | | (262,764,342) |
| Net Assets | | | $ | 3,410,819,507 |
Net Asset Value , offering price and redemption price per share ($3,410,819,507 ÷ 423,467,919 shares) | | | $ | 8.05 |
| Statement of Operations |
| | | | Six months ended April 30, 2023 (Unaudited) |
| Investment Income | | | | |
| Dividends | | | $ | 36,016,676 |
| Non-Cash dividends | | | | 7,004,906 |
| Interest | | | | 90,725 |
| Income from Fidelity Central Funds (including $178,673 from security lending) | | | | 3,944,769 |
| Income before foreign taxes withheld | | | $ | 47,057,076 |
| Less foreign taxes withheld | | | | (4,084,538) |
| Total Income | | | | 42,972,538 |
| Expenses | | | | |
| Custodian fees and expenses | $ | 403,507 | | |
| Independent trustees' fees and expenses | | 8,682 | | |
| Total expenses before reductions | | 412,189 | | |
| Expense reductions | | (217,473) | | |
| Total expenses after reductions | | | | 194,716 |
| Net Investment income (loss) | | | | 42,777,822 |
| Realized and Unrealized Gain (Loss) | | | | |
| Net realized gain (loss) on: | | | | |
| Investment Securities: | | | | |
| Unaffiliated issuers (net of foreign taxes of $1,749,748) | | (125,841,314) | | |
| Foreign currency transactions | | (2,037,253) | | |
| Futures contracts | | 192,539 | | |
| Total net realized gain (loss) | | | | (127,686,028) |
| Change in net unrealized appreciation (depreciation) on: | | | | |
| Investment Securities: | | | | |
| Unaffiliated issuers(net of increase in deferred foreign taxes of $396,378) | | 547,935,451 | | |
| Fidelity Central Funds | | 1 | | |
| Assets and liabilities in foreign currencies | | 17,983 | | |
| Futures contracts | | 13,270,698 | | |
| Total change in net unrealized appreciation (depreciation) | | | | 561,224,133 |
| Net gain (loss) | | | | 433,538,105 |
| Net increase (decrease) in net assets resulting from operations | | | $ | 476,315,927 |
| Statement of Changes in Net Assets |
| |
| | Six months ended April 30, 2023 (Unaudited) | | Year ended October 31, 2022 |
| Increase (Decrease) in Net Assets | | | | |
| Operations | | | | |
| Net investment income (loss) | $ | 42,777,822 | $ | 74,510,346 |
| Net realized gain (loss) | | (127,686,028) | | (324,627,707) |
| Change in net unrealized appreciation (depreciation) | | 561,224,133 | | (1,027,426,269) |
| Net increase (decrease) in net assets resulting from operations | | 476,315,927 | | (1,277,543,630) |
| Distributions to shareholders | | (65,273,730) | | (105,313,301) |
| Share transactions | | | | |
| Proceeds from sales of shares | | 954,240,489 | | 739,859,925 |
| Reinvestment of distributions | | 65,273,730 | | 105,313,301 |
| Cost of shares redeemed | | (456,480,619) | | (265,266,031) |
Net increase (decrease) in net assets resulting from share transactions | | 563,033,600 | | 579,907,195 |
| Total increase (decrease) in net assets | | 974,075,797 | | (802,949,736) |
| | | | | |
| Net Assets | | | | |
| Beginning of period | | 2,436,743,710 | | 3,239,693,446 |
| End of period | $ | 3,410,819,507 | $ | 2,436,743,710 |
| | | | | |
| Other Information | | | | |
| Shares | | | | |
| Sold | | 119,786,177 | | 84,221,344 |
| Issued in reinvestment of distributions | | 8,304,546 | | 9,925,853 |
| Redeemed | | (55,910,644) | | (29,402,412) |
| Net increase (decrease) | | 72,180,079 | | 64,744,785 |
| | | | | |
Financial Highlights
| Fidelity® Series Emerging Markets Fund |
| |
| | Six months ended (Unaudited) April 30, 2023 | | Years ended October 31, 2022 | | 2021 | | 2020 | | 2019 | | 2018 A |
Selected Per-Share Data | | | | | | | | | | | | |
| Net asset value, beginning of period | $ | 6.94 | $ | 11.31 | $ | 9.65 | $ | 9.48 | $ | 8.87 | $ | 10.00 |
| Income from Investment Operations | | | | | | | | | | | | |
Net investment income (loss) B,C | | .12 | | .23 | | .20 | | .17 | | .30 D | | .01 |
| Net realized and unrealized gain (loss) | | 1.19 | | (4.24) | | 1.62 | | .22 | | .35 | | (1.14) |
| Total from investment operations | | 1.31 | | (4.01) | | 1.82 | | .39 | | .65 | | (1.13) |
| Distributions from net investment income | | (.20) | | (.30) | | (.16) | | (.22) | | (.04) | | - |
| Distributions from net realized gain | | - | | (.07) | | - | | - | | - | | - |
| Total distributions | | (.20) | | (.36) E | | (.16) | | (.22) | | (.04) | | - |
| Net asset value, end of period | $ | 8.05 | $ | 6.94 | $ | 11.31 | $ | 9.65 | $ | 9.48 | $ | 8.87 |
Total Return F,G | | 18.92% | | (36.53)% | | 18.88% | | 4.16% | | 7.33% | | (11.30)% |
Ratios to Average Net Assets C,H,I | | | | | | | | | | | | |
| Expenses before reductions | | .03% J | | .04% | | .04% | | .05% | | .04% | | .04% J |
| Expenses net of fee waivers, if any | | .01% J | | .01% | | .01% | | .01% | | .01% | | .01% J |
| Expenses net of all reductions | | .01% J | | .01% | | .01% | | .01% | | .01% | | .01% J |
| Net investment income (loss) | | 2.97% J | | 2.61% | | 1.70% | | 1.86% | | 3.24% D | | .65% J |
| Supplemental Data | | | | | | | | | | | | |
| Net assets, end of period (000 omitted) | $ | 3,410,820 | $ | 2,436,744 | $ | 3,239,693 | $ | 2,995,875 | $ | 2,065,165 | $ | 1,431,017 |
Portfolio turnover rate K | | 102% J | | 65% | | 78% | | 117% L | | 47% | | 15% L,M |
A For the period August 29, 2018 (commencement of operations) through October 31, 2018.
B Calculated based on average shares outstanding during the period.
C Net investment income (loss) is affected by the timing of the declaration of dividends by any underlying mutual funds or exchange-traded funds (ETFs). Net investment income (loss) of any mutual funds or ETFs is not included in the Fund's net investment income (loss) ratio.
D Net investment income per share reflects one or more large, non-recurring dividend(s) which amounted to $.07 per share. Excluding such non-recurring dividend(s), the ratio of net investment income (loss) to average net assets would have been 2.50%.
E Total distributions per share do not sum due to rounding.
F Total returns for periods of less than one year are not annualized.
G Total returns would have been lower if certain expenses had not been reduced during the applicable periods shown.
H Fees and expenses of any underlying mutual funds or exchange-traded funds (ETFs) are not included in the Fund's expense ratio. The Fund indirectly bears its proportionate share of these expenses. For additional expense information related to investments in Fidelity Central Funds, please refer to the "Investments in Fidelity Central Funds" note found in the Notes to Financial Statements section of the most recent Annual or Semi-Annual report.
I Expense ratios reflect operating expenses of the class. Expenses before reductions do not reflect amounts reimbursed, waived, or reduced through arrangements with the investment adviser, brokerage services, or other offset arrangements, if applicable, and do not represent the amount paid by the class during periods when reimbursements, waivers or reductions occur.
J Annualized.
K Amount does not include the portfolio activity of any underlying mutual funds or exchange-traded funds (ETFs).
L Portfolio turnover rate excludes securities received or delivered in-kind.
M Amount not annualized.
Top Holdings (% of Fund's net assets) |
| |
| Taiwan Semiconductor Manufacturing Co. Ltd. (Taiwan, Semiconductors & Semiconductor Equipment) | 7.6 | |
| Samsung Electronics Co. Ltd. (Korea (South), Technology Hardware, Storage & Peripherals) | 4.8 | |
| Tencent Holdings Ltd. (China, Interactive Media & Services) | 4.6 | |
| HDFC Bank Ltd. (India, Banks) | 2.8 | |
| Alibaba Group Holding Ltd. (China, Broadline Retail) | 2.6 | |
| Meituan Class B (China, Hotels, Restaurants & Leisure) | 1.9 | |
| Reliance Industries Ltd. (India, Oil, Gas & Consumable Fuels) | 1.8 | |
| Ping An Insurance Group Co. of China Ltd. (H Shares) (China, Insurance) | 1.6 | |
| Sea Ltd. ADR (Singapore, Entertainment) | 1.5 | |
| China Construction Bank Corp. (H Shares) (China, Banks) | 1.4 | |
| | 30.6 | |
| |
| Market Sectors (% of Fund's net assets) |
| |
| Financials | 23.7 | |
| Information Technology | 18.1 | |
| Consumer Discretionary | 14.0 | |
| Communication Services | 9.8 | |
| Materials | 9.0 | |
| Consumer Staples | 6.7 | |
| Industrials | 5.3 | |
| Energy | 4.6 | |
| Health Care | 3.6 | |
| Utilities | 2.9 | |
| Real Estate | 1.5 | |
| |
Asset Allocation (% of Fund's net assets) |
|
|
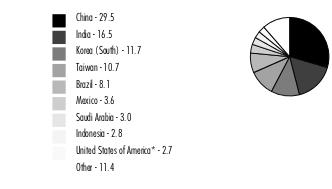
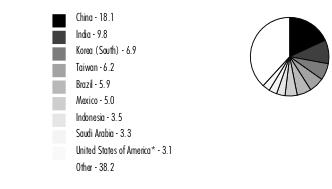
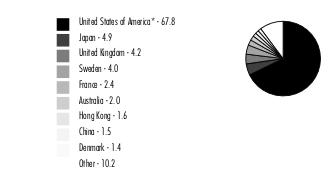
Geographic Diversification (% of Fund's net assets) |
|
* Includes Short-Term investments and Net Other Assets (Liabilities). Percentages are adjusted for the effect of derivatives, if applicable. |
| |
Fidelity® Series Emerging Markets Opportunities Fund
| Common Stocks - 96.2% |
| | | Shares | Value ($) |
| Brazil - 6.3% | | | |
| Arezzo Industria e Comercio SA | | 2,394,563 | 31,867,976 |
| Atacadao SA | | 24,646,000 | 53,118,509 |
| Dexco SA | | 29,895,811 | 35,303,406 |
| ENGIE Brasil Energia SA | | 5,663,100 | 46,812,144 |
| Equatorial Energia SA | | 10,638,200 | 58,311,959 |
| Localiza Rent a Car SA | | 8,461,721 | 98,413,015 |
| Localiza Rent a Car SA rights 5/11/23 (a) | | 39,088 | 134,478 |
| LOG Commercial Properties e Participacoes SA | | 4,552,451 | 14,959,435 |
| Lojas Renner SA | | 14,021,226 | 44,527,892 |
| MercadoLibre, Inc. (a) | | 86,367 | 110,332,979 |
| Multiplan Empreendimentos Imobiliarios SA | | 1,937,700 | 10,061,837 |
| PagSeguro Digital Ltd. (a)(b) | | 13,698,749 | 134,795,690 |
| Raia Drogasil SA | | 25,233,500 | 132,951,678 |
| Rede D'Oregon Sao Luiz SA (c) | | 6,502,900 | 29,817,018 |
| Rumo SA | | 23,197,600 | 91,622,102 |
| StoneCo Ltd. Class A (a) | | 8,262,530 | 101,794,370 |
| Suzano Papel e Celulose SA | | 2,860,700 | 22,826,870 |
| Transmissora Alianca de Energia Eletrica SA | | 5,446,400 | 39,823,210 |
| Vale SA sponsored ADR | | 15,622,770 | 225,124,116 |
| XP, Inc. Class A (a)(b) | | 10,230,065 | 146,187,629 |
TOTAL BRAZIL | | | 1,428,786,313 |
| Canada - 0.9% | | | |
| Barrick Gold Corp. | | 10,673,200 | 203,217,728 |
| Chile - 1.1% | | | |
| Antofagasta PLC | | 6,693,044 | 122,849,710 |
| Banco de Chile | | 1,190,736,100 | 126,780,759 |
TOTAL CHILE | | | 249,630,469 |
| China - 29.1% | | | |
| Akeso, Inc. (a)(b)(c) | | 5,034,545 | 27,650,687 |
| Alibaba Group Holding Ltd. (a) | | 55,674,739 | 588,683,910 |
| Alibaba Group Holding Ltd. sponsored ADR (a) | | 617,515 | 52,297,345 |
| Angelalign Technology, Inc. (c) | | 886,600 | 11,121,216 |
| Ant International Co. Ltd. Class C (a)(d)(e) | | 9,361,123 | 14,416,129 |
| Antengene Corp. (a)(c) | | 6,459,686 | 2,231,017 |
| Baidu, Inc.: | | | |
| Class A (a) | | 2,279,473 | 34,310,426 |
| sponsored ADR (a) | | 450,950 | 54,389,080 |
| BeiGene Ltd. ADR (a) | | 207,600 | 52,929,696 |
| Beijing Enlight Media Co. Ltd. (A Shares) | | 17,155,976 | 25,408,751 |
| Bilibili, Inc. ADR (a)(b) | | 4,195,088 | 85,411,992 |
| BYD Co. Ltd. (H Shares) | | 5,057,594 | 153,377,869 |
| C&S Paper Co. Ltd. (A Shares) | | 22,252,600 | 37,977,954 |
| China Communications Services Corp. Ltd. (H Shares) | | 75,360,000 | 41,294,620 |
| China Construction Bank Corp. (H Shares) | | 481,252,000 | 321,729,676 |
| China Gas Holdings Ltd. | | 35,524,400 | 45,701,081 |
| China Life Insurance Co. Ltd. (H Shares) | | 101,446,690 | 194,894,868 |
| China Merchants Holdings International Co. Ltd. | | 27,236,494 | 40,414,122 |
| China Merchants Shekou Industrial Zone Holdings Co. Ltd. (A Shares) | | 4,509,628 | 8,916,674 |
| China Overseas Land and Investment Ltd. | | 12,386,400 | 31,413,697 |
| China Petroleum & Chemical Corp. (H Shares) | | 221,316,000 | 145,053,975 |
| China Resources Beer Holdings Co. Ltd. | | 15,194,666 | 117,375,487 |
| China Resources Land Ltd. | | 13,515,720 | 62,939,413 |
| China Tower Corp. Ltd. (H Shares) (c) | | 135,868,721 | 17,340,023 |
| China Vanke Co. Ltd. (H Shares) | | 13,349,400 | 20,869,041 |
| Daqin Railway Co. Ltd. (A Shares) | | 80,892,300 | 90,194,429 |
| Daqo New Energy Corp. ADR (a) | | 193,772 | 8,898,010 |
| ENN Energy Holdings Ltd. | | 5,153,900 | 70,668,255 |
| ESR Group Ltd. (c) | | 5,393,000 | 8,430,043 |
| Greentown China Holdings Ltd. | | 8,214,000 | 9,871,950 |
| Guangdong Investment Ltd. | | 49,930,000 | 47,731,915 |
| Haier Smart Home Co. Ltd. | | 23,547,216 | 76,754,111 |
| Haier Smart Home Co. Ltd. (A Shares) | | 1,171,203 | 4,027,055 |
| Haitian International Holdings Ltd. | | 17,099,306 | 44,428,816 |
| Hansoh Pharmaceutical Group Co. Ltd. (c) | | 20,567,724 | 37,521,763 |
| Innovent Biologics, Inc. (a)(c) | | 8,269,362 | 39,759,693 |
| JD Health International, Inc. (a)(c) | | 2,426,058 | 17,506,735 |
| JD.com, Inc.: | | | |
| Class A | | 6,340,397 | 113,162,423 |
| sponsored ADR | | 432,593 | 15,452,222 |
| Jiumaojiu International Holdings Ltd. (c) | | 15,743,199 | 35,373,609 |
| KE Holdings, Inc. | | 11,300 | 59,201 |
| KE Holdings, Inc. ADR (a) | | 2,521,200 | 39,557,628 |
| Kuaishou Technology Class B (a)(c) | | 2,865,134 | 18,967,592 |
| Kunlun Energy Co. Ltd. | | 60,942,000 | 56,493,712 |
| Kweichow Moutai Co. Ltd. (A Shares) | | 428,110 | 109,234,201 |
| Lenovo Group Ltd. | | 7,218,000 | 7,384,564 |
| Li Auto, Inc.: | | | |
| ADR (a)(b) | | 6,575,609 | 154,526,812 |
| Class A (a) | | 520,690 | 6,166,979 |
| Li Ning Co. Ltd. | | 12,806,364 | 91,586,226 |
| Longfor Properties Co. Ltd. (c) | | 5,616,935 | 15,370,736 |
| LONGi Green Energy Technology Co. Ltd. | | 1,444,200 | 7,312,247 |
| Medlive Technology Co. Ltd. (c) | | 10,435,280 | 11,556,223 |
| Meituan Class B (a)(c) | | 24,898,636 | 425,529,073 |
| NetEase, Inc. ADR | | 855,952 | 76,291,002 |
| New Oriental Education & Technology Group, Inc. sponsored ADR (a) | | 1,404,130 | 64,014,287 |
| OPT Machine Vision Tech Co. Ltd. | | 242,766 | 5,263,044 |
| PDD Holdings, Inc. ADR (a) | | 2,816,984 | 191,977,460 |
| Ping An Insurance Group Co. of China Ltd. (H Shares) | | 48,607,000 | 354,613,371 |
| Proya Cosmetics Co. Ltd. (A Shares) | | 4,919,730 | 119,694,390 |
| Shangri-La Asia Ltd. (a) | | 17,378,000 | 16,031,465 |
| Shenzhen Mindray Bio-Medical Electronics Co. Ltd. (A Shares) | | 1,765,939 | 79,837,608 |
| Shenzhou International Group Holdings Ltd. | | 2,633,349 | 25,293,754 |
| Silergy Corp. | | 3,654,196 | 57,638,723 |
| Sinopec Engineering Group Co. Ltd. (H Shares) | | 49,856,187 | 25,853,523 |
| Sinopharm Group Co. Ltd. (H Shares) | | 10,756,000 | 38,100,745 |
| Sinotruk Hong Kong Ltd. | | 16,387,161 | 25,043,542 |
| Sunny Optical Technology Group Co. Ltd. | | 6,395,057 | 67,578,547 |
| Tencent Holdings Ltd. | | 23,318,764 | 1,035,728,923 |
| Tongdao Liepin Group (a) | | 7,274,950 | 9,321,000 |
| TravelSky Technology Ltd. (H Shares) | | 22,713,000 | 45,338,055 |
| Trip.com Group Ltd. ADR (a) | | 5,656,392 | 200,858,480 |
| Tsingtao Brewery Co. Ltd. (H Shares) | | 11,583,384 | 124,007,442 |
| Uni-President China Holdings Ltd. | | 41,390,000 | 41,326,593 |
| Venus MedTech Hangzhou, Inc. (H Shares) (a)(c) | | 6,020,987 | 8,429,276 |
| WuXi AppTec Co. Ltd. (H Shares) (c) | | 2,939,604 | 25,853,615 |
| Wuxi Biologics (Cayman), Inc. (a)(c) | | 17,685,087 | 105,453,333 |
| Xinyi Solar Holdings Ltd. | | 14,298,000 | 15,371,745 |
| Zai Lab Ltd. (a)(f) | | 11,808,902 | 41,344,155 |
| Zhuzhou CRRC Times Electric Co. Ltd. (H Shares) | | 14,363,300 | 57,970,260 |
TOTAL CHINA | | | 6,609,909,310 |
| Greece - 0.7% | | | |
| Alpha Bank SA (a) | | 86,748,700 | 108,492,825 |
| Piraeus Financial Holdings SA (a) | | 21,381,847 | 50,419,806 |
TOTAL GREECE | | | 158,912,631 |
| Hong Kong - 0.9% | | | |
| Huanxi Media Group Ltd. (a) | | 130,621,425 | 16,500,704 |
| Kerry Properties Ltd. | | 6,340,500 | 16,359,161 |
| Prudential PLC | | 11,655,048 | 178,334,360 |
TOTAL HONG KONG | | | 211,194,225 |
| Hungary - 0.2% | | | |
| Richter Gedeon PLC | | 1,691,900 | 40,829,289 |
| India - 16.3% | | | |
| Apollo Hospitals Enterprise Ltd. | | 1,185,900 | 65,714,921 |
| Bajaj Auto Ltd. | | 833,400 | 45,281,336 |
| Bajaj Finance Ltd. | | 2,046,177 | 157,994,710 |
| Bandhan Bank Ltd. (a)(c) | | 29,989,032 | 84,539,154 |
| Bharat Electronics Ltd. | | 60,507,400 | 76,711,577 |
| Bharti Airtel Ltd. | | 8,643,091 | 84,699,484 |
| Campus Activewear Ltd. | | 3,094,577 | 13,528,512 |
| Divi's Laboratories Ltd. | | 754,000 | 30,238,425 |
| Embassy Office Parks (REIT) | | 3,840,355 | 15,498,530 |
| HDFC Bank Ltd. | | 30,718,288 | 635,777,197 |
| HDFC Standard Life Insurance Co. Ltd. (c) | | 20,348,741 | 132,243,782 |
| Hindustan Aeronautics Ltd. | | 1,288,300 | 46,184,281 |
| Housing Development Finance Corp. Ltd. | | 1,511,400 | 51,550,537 |
| Indraprastha Gas Ltd. | | 10,918,594 | 66,385,473 |
| Infosys Ltd. | | 2,503,128 | 38,661,934 |
| Infosys Ltd. sponsored ADR | | 15,425,766 | 239,716,404 |
| ITC Ltd. | | 33,800,954 | 176,449,895 |
| JK Cement Ltd. (f) | | 3,988,031 | 146,559,825 |
| Larsen & Toubro Ltd. | | 5,290,644 | 153,550,758 |
| Mahanagar Gas Ltd. | | 3,487,034 | 43,123,398 |
| Manappuram General Finance & Leasing Ltd. | | 30,961,687 | 49,346,415 |
| Mankind Pharma Ltd. (g) | | 124,117 | 1,557,725 |
| Mankind Pharma Ltd. (g) | | 124,118 | 1,557,738 |
| Maruti Suzuki India Ltd. | | 691,192 | 72,873,888 |
| NTPC Ltd. | | 37,236,845 | 78,621,735 |
| Oberoi Realty Ltd. | | 962,972 | 10,819,901 |
| Oil & Natural Gas Corp. Ltd. | | 36,520,100 | 71,298,522 |
| One97 Communications Ltd. (a) | | 6,085,200 | 48,846,136 |
| Petronet LNG Ltd. | | 11,584,880 | 33,683,370 |
| Pine Labs Private Ltd. (a)(d)(e) | | 9,606 | 5,288,583 |
| Power Grid Corp. of India Ltd. | | 31,955,654 | 93,018,941 |
| Reliance Industries Ltd. | | 13,780,792 | 409,682,167 |
| Shree Cement Ltd. | | 315,268 | 94,100,609 |
| Sona Blw Precision Forgings Ltd. (c) | | 4,741,243 | 27,948,962 |
| SRF Ltd. | | 2,529,877 | 78,920,119 |
| Sun Pharmaceutical Industries Ltd. | | 1,592,400 | 19,282,227 |
| Tata Motors Ltd. (a) | | 2,058,173 | 12,292,945 |
| Tata Steel Ltd. | | 102,870,800 | 136,526,827 |
| Torrent Pharmaceuticals Ltd. | | 1,505,272 | 30,506,220 |
| Vijaya Diagnostic Centre Pvt Ltd. | | 1,766,900 | 8,177,301 |
| Zomato Ltd. (a) | | 121,356,497 | 97,145,387 |
TOTAL INDIA | | | 3,685,905,851 |
| Indonesia - 2.8% | | | |
| First Resources Ltd. | | 57,800,646 | 66,637,412 |
| PT Bank Central Asia Tbk | | 375,840,360 | 232,589,379 |
| PT Bank Rakyat Indonesia (Persero) Tbk | | 673,246,539 | 234,612,446 |
| PT Dayamitra Telekomunikasi Tbk | | 54,585,700 | 2,606,519 |
| PT Sumber Alfaria Trijaya Tbk | | 332,470,200 | 65,740,084 |
| PT United Tractors Tbk | | 14,247,500 | 28,125,652 |
TOTAL INDONESIA | | | 630,311,492 |
| Japan - 0.2% | | | |
| Z Holdings Corp. | | 14,880,005 | 40,759,926 |
| Korea (South) - 11.2% | | | |
| Coway Co. Ltd. | | 1,069,970 | 39,301,059 |
| Delivery Hero AG (a)(c) | | 909,670 | 36,215,461 |
| Hyundai Fire & Marine Insurance Co. Ltd. | | 2,806,240 | 78,869,538 |
| Hyundai Motor Co. Ltd. | | 121,830 | 18,053,743 |
| Jeisys Medical, Inc. (a) | | 2,135,054 | 13,830,441 |
| Kakao Corp. | | 1,985,749 | 86,989,502 |
| Kakao Pay Corp. (a)(b) | | 525,237 | 21,592,820 |
| KB Financial Group, Inc. | | 4,613,228 | 171,293,416 |
| Kia Corp. | | 2,539,592 | 160,904,522 |
| L&F Co. Ltd. (b) | | 52,600 | 10,503,760 |
| LG Chemical Ltd. | | 106,766 | 59,330,247 |
| LG Corp. | | 1,026,038 | 67,182,402 |
| NAVER Corp. | | 330,883 | 47,955,795 |
| NCSOFT Corp. | | 48,710 | 13,789,041 |
| POSCO | | 599,666 | 169,775,524 |
| S-Oil Corp. | | 802,400 | 44,958,503 |
| Samsung Biologics Co. Ltd. (a)(c) | | 152,488 | 89,219,203 |
| Samsung Electronics Co. Ltd. | | 22,302,876 | 1,097,827,570 |
| Samsung SDI Co. Ltd. | | 264,797 | 137,476,704 |
| SK Hynix, Inc. | | 2,626,204 | 176,770,173 |
TOTAL KOREA (SOUTH) | | | 2,541,839,424 |
| Mauritius - 0.0% | | | |
| Jumo World Ltd. (a)(e) | | 2,021 | 1,918,293 |
| Mexico - 3.6% | | | |
| CEMEX S.A.B. de CV sponsored ADR (a) | | 32,622,700 | 195,736,200 |
| Corporacion Inmobiliaria Vesta S.A.B. de CV | | 13,579,784 | 42,893,069 |
| Grupo Aeroportuario del Pacifico S.A.B. de CV Series B | | 4,535,800 | 80,700,635 |
| Grupo Aeroportuario del Sureste S.A.B. de CV Series B sponsored ADR | | 267,933 | 76,714,577 |
| Grupo Aeroportuario Norte S.A.B. de CV | | 4,411,100 | 48,489,102 |
| Grupo Financiero Banorte S.A.B. de CV Series O | | 28,335,778 | 245,037,224 |
| Wal-Mart de Mexico SA de CV Series V | | 30,145,300 | 121,540,243 |
TOTAL MEXICO | | | 811,111,050 |
| Netherlands - 0.0% | | | |
| CTP BV (c) | | 878,177 | 11,515,193 |
| CTP BV rights (a)(g) | | 878,177 | 222,563 |
TOTAL NETHERLANDS | | | 11,737,756 |
| Panama - 0.2% | | | |
| Copa Holdings SA Class A (b) | | 483,822 | 43,698,803 |
| Peru - 0.5% | | | |
| Credicorp Ltd. (United States) | | 807,722 | 109,430,177 |
| Philippines - 0.3% | | | |
| Ayala Land, Inc. | | 54,350,524 | 26,222,696 |
| SM Investments Corp. | | 2,355,000 | 38,096,058 |
TOTAL PHILIPPINES | | | 64,318,754 |
| Poland - 0.6% | | | |
| CD Projekt RED SA | | 1,307,369 | 35,588,983 |
| Dino Polska SA (a)(c) | | 947,200 | 96,356,282 |
TOTAL POLAND | | | 131,945,265 |
| Russia - 0.7% | | | |
| Fix Price Group Ltd. GDR (Reg. S) (a)(e) | | 5,084,349 | 1,877,803 |
| Gazprom OAO sponsored ADR (Reg. S) (a)(e) | | 10,986,900 | 2,509,847 |
| LSR Group OJSC (a)(e) | | 98,230 | 114,965 |
| LUKOIL PJSC sponsored ADR (a)(e) | | 2,479,000 | 701,284 |
| Novatek PJSC GDR (Reg. S) (a)(e) | | 648,900 | 28,551,600 |
| Sberbank of Russia (e) | | 12,899,053 | 92,273 |
| Sberbank of Russia sponsored ADR (a)(e) | | 19,633,994 | 349,485 |
| Severstal PAO GDR (Reg. S) (a)(e) | | 6,035,400 | 142,496 |
| TCS Group Holding PLC GDR (a)(e) | | 4,004,379 | 35,879,236 |
| X5 Retail Group NV GDR (Reg. S) (a)(e) | | 6,393,700 | 48,592,120 |
| Yandex NV Series A (a)(b)(e) | | 6,629,608 | 50,385,021 |
TOTAL RUSSIA | | | 169,196,130 |
| Saudi Arabia - 3.0% | | | |
| Al Rajhi Bank | | 9,858,815 | 201,870,849 |
| Alinma Bank | | 14,710,200 | 124,130,917 |
| Bupa Arabia for Cooperative Insurance Co. | | 2,544,832 | 119,686,556 |
| The Saudi National Bank | | 17,272,200 | 225,187,453 |
TOTAL SAUDI ARABIA | | | 670,875,775 |
| Singapore - 1.5% | | | |
| Sea Ltd. ADR (a) | | 4,611,455 | 351,254,527 |
| South Africa - 2.6% | | | |
| Capitec Bank Holdings Ltd. | | 1,365,561 | 118,909,999 |
| Discovery Ltd. (a) | | 15,141,500 | 119,004,699 |
| Impala Platinum Holdings Ltd. | | 20,218,902 | 196,847,225 |
| Naspers Ltd. Class N | | 552,818 | 98,556,789 |
| Pick 'n Pay Stores Ltd. | | 22,801,884 | 54,123,701 |
TOTAL SOUTH AFRICA | | | 587,442,413 |
| Switzerland - 0.1% | | | |
| OPT Machine Vision Tech Co. Ltd. ELS (UBS AG London Branch Bank Warrant Programme) Class A warrants 2/21/25 (a)(c) | | 831,200 | 18,050,589 |
| Taiwan - 10.7% | | | |
| BizLink Holding, Inc. | | 4,745,000 | 40,724,609 |
| BizLink Holding, Inc. rights 5/8/23 (a) | | 121,229 | 130,040 |
| Chailease Holding Co. Ltd. | | 26,635,341 | 193,853,048 |
| eMemory Technology, Inc. | | 893,513 | 53,387,400 |
| Formosa Plastics Corp. | | 6,722,000 | 20,549,020 |
| MediaTek, Inc. | | 6,840,189 | 148,628,074 |
| Novatek Microelectronics Corp. | | 1,227,000 | 16,762,739 |
| Realtek Semiconductor Corp. | | 1,320,000 | 15,468,785 |
| Taiwan Semiconductor Manufacturing Co. Ltd. | | 105,803,886 | 1,731,390,572 |
| Uni-President Enterprises Corp. | | 39,464,000 | 94,543,238 |
| United Microelectronics Corp. | | 2,904,000 | 4,667,405 |
| Wistron Corp. | | 17,616,000 | 26,682,266 |
| Wiwynn Corp. | | 1,670,473 | 63,528,155 |
| Yageo Corp. | | 1,093,000 | 17,706,187 |
TOTAL TAIWAN | | | 2,428,021,538 |
| Tanzania - 0.1% | | | |
| Helios Towers PLC (a) | | 14,359,600 | 18,822,424 |
| Thailand - 0.7% | | | |
| Carabao Group PCL (For. Reg.) | | 25,941,900 | 54,540,709 |
| Land & House PCL (For. Reg.) | | 52,674,000 | 15,144,562 |
| PTT Global Chemical PCL (For. Reg.) | | 63,289,400 | 77,237,713 |
| Supalai PCL (For. Reg.) | | 13,722,800 | 8,530,245 |
TOTAL THAILAND | | | 155,453,229 |
| United States of America - 1.8% | | | |
| FirstCash Holdings, Inc. | | 1,735,954 | 178,855,341 |
| Globant SA (a)(b) | | 290,367 | 45,549,871 |
| Legend Biotech Corp. ADR (a) | | 407,900 | 28,026,809 |
| Parade Technologies Ltd. | | 238,000 | 7,284,259 |
| Tenaris SA sponsored ADR (b) | | 1,838,400 | 52,780,464 |
| Titan Cement International Trading SA (f) | | 5,818,852 | 93,868,650 |
TOTAL UNITED STATES OF AMERICA | | | 406,365,394 |
| Uruguay - 0.1% | | | |
| Dlocal Ltd. (a) | | 1,456,566 | 20,391,924 |
| TOTAL COMMON STOCKS (Cost $19,856,986,469) | | | 21,801,330,699 |
| | | | |
| Preferred Stocks - 3.0% |
| | | Shares | Value ($) |
| Convertible Preferred Stocks - 0.6% | | | |
| Brazil - 0.1% | | | |
| Creditas Financial Solutions Ltd. Series F (a)(d)(e) | | 70,500 | 20,123,520 |
| China - 0.4% | | | |
| ByteDance Ltd. Series E1 (a)(d)(e) | | 399,541 | 79,508,659 |
| dMed Biopharmaceutical Co. Ltd. Series C (a)(d)(e) | | 769,712 | 6,827,345 |
| | | | 86,336,004 |
| India - 0.1% | | | |
| Meesho Series F (a)(d)(e) | | 431,274 | 29,852,786 |
TOTAL CONVERTIBLE PREFERRED STOCKS | | | 136,312,310 |
| Nonconvertible Preferred Stocks - 2.4% | | | |
| Brazil - 1.7% | | | |
| Companhia de Transmissao de Energia Eletrica Paulista (PN) | | 6,849,800 | 31,654,816 |
| Metalurgica Gerdau SA (PN) | | 52,885,922 | 123,631,631 |
| Petroleo Brasileiro SA - Petrobras: | | | |
| (PN) sponsored ADR (non-vtg.) | | 12,291,800 | 116,649,182 |
| sponsored ADR | | 10,449,335 | 110,971,938 |
| | | | 382,907,567 |
| India - 0.1% | | | |
| Pine Labs Private Ltd.: | | | |
| Series 1 (a)(d)(e) | | 22,959 | 12,640,077 |
| Series A (a)(d)(e) | | 5,737 | 3,158,505 |
| Series B (a)(d)(e) | | 6,242 | 3,436,533 |
| Series B2 (a)(d)(e) | | 5,049 | 2,779,727 |
| Series C (a)(d)(e) | | 9,391 | 5,170,215 |
| Series C1 (a)(d)(e) | | 1,978 | 1,088,988 |
| Series D (a)(d)(e) | | 2,116 | 1,164,964 |
| | | | 29,439,009 |
| Korea (South) - 0.5% | | | |
| Hyundai Motor Co. Ltd. Series 2 | | 901,059 | 74,774,293 |
| Samsung Electronics Co. Ltd. | | 1,072,790 | 44,865,629 |
| | | | 119,639,922 |
| United States of America - 0.1% | | | |
| Gupshup, Inc. (a)(d)(e) | | 566,129 | 8,848,596 |
TOTAL NONCONVERTIBLE PREFERRED STOCKS | | | 540,835,094 |
| TOTAL PREFERRED STOCKS (Cost $548,655,437) | | | 677,147,404 |
| | | | |
| Government Obligations - 0.1% |
| | | Principal Amount (h) | Value ($) |
| United States of America - 0.1% | | | |
U.S. Treasury Bills, yield at date of purchase 4.43% to 4.78% 5/25/23 to 6/1/23 (Cost $15,351,049) | | 15,410,000 | 15,353,708 |
| | | | |
| Money Market Funds - 2.2% |
| | | Shares | Value ($) |
| Fidelity Cash Central Fund 4.88% (i) | | 186,856,281 | 186,893,653 |
| Fidelity Securities Lending Cash Central Fund 4.88% (i)(j) | | 325,945,812 | 325,978,407 |
| TOTAL MONEY MARKET FUNDS (Cost $512,867,710) | | | 512,872,060 |
| | | | |
| TOTAL INVESTMENT IN SECURITIES - 101.5% (Cost $20,933,860,665) | 23,006,703,871 |
NET OTHER ASSETS (LIABILITIES) - (1.5)% | (338,084,821) |
| NET ASSETS - 100.0% | 22,668,619,050 |
| | |
Security Type Abbreviations
| ELS | - | EQUITY-LINKED SECURITY |
Legend
| (b) | Security or a portion of the security is on loan at period end. |
| (c) | Security exempt from registration under Rule 144A of the Securities Act of 1933. These securities may be resold in transactions exempt from registration, normally to qualified institutional buyers. At the end of the period, the value of these securities amounted to $1,334,000,278 or 5.9% of net assets. |
| (d) | Restricted securities (including private placements) - Investment in securities not registered under the Securities Act of 1933 (excluding 144A issues). At the end of the period, the value of restricted securities (excluding 144A issues) amounted to $194,304,627 or 0.9% of net assets. |
| (g) | Security or a portion of the security purchased on a delayed delivery or when-issued basis. |
| (h) | Amount is stated in United States dollars unless otherwise noted. |
| (i) | Affiliated fund that is generally available only to investment companies and other accounts managed by Fidelity Investments. The rate quoted is the annualized seven-day yield of the fund at period end. A complete unaudited listing of the fund's holdings as of its most recent quarter end is available upon request. In addition, each Fidelity Central Fund's financial statements are available on the SEC's website or upon request. |
| (j) | Investment made with cash collateral received from securities on loan. |
| Additional information on each restricted holding is as follows: |
| Security | Acquisition Date | Acquisition Cost ($) |
| Ant International Co. Ltd. Class C | 5/16/18 | 35,678,747 |
| | | |
| ByteDance Ltd. Series E1 | 11/18/20 | 43,779,377 |
| | | |
| Creditas Financial Solutions Ltd. Series F | 1/28/22 | 22,206,259 |
| | | |
| dMed Biopharmaceutical Co. Ltd. Series C | 12/01/20 | 10,932,333 |
| | | |
| Gupshup, Inc. | 6/08/21 | 12,944,653 |
| | | |
| Meesho Series F | 9/21/21 | 33,066,770 |
| | | |
| Pine Labs Private Ltd. | 6/30/21 | 3,581,693 |
| | | |
| Pine Labs Private Ltd. Series 1 | 6/30/21 | 8,560,493 |
| | | |
| Pine Labs Private Ltd. Series A | 6/30/21 | 2,139,098 |
| | | |
| Pine Labs Private Ltd. Series B | 6/30/21 | 2,327,392 |
| | | |
| Pine Labs Private Ltd. Series B2 | 6/30/21 | 1,882,570 |
| | | |
| Pine Labs Private Ltd. Series C | 6/30/21 | 3,501,528 |
| | | |
| Pine Labs Private Ltd. Series C1 | 6/30/21 | 737,517 |
| | | |
| Pine Labs Private Ltd. Series D | 6/30/21 | 788,972 |
| | | |
Affiliated Central Funds
Fiscal year to date information regarding the Fund's investments in Fidelity Central Funds, including the ownership percentage, is presented below.
| Affiliate | Value, beginning of period ($) | Purchases ($) | Sales Proceeds ($) | Dividend Income ($) | Realized Gain (loss) ($) | Change in Unrealized appreciation (depreciation) ($) | Value, end of period ($) | % ownership, end of period |
| Fidelity Cash Central Fund 4.88% | 723,008,581 | 7,463,935,389 | 8,000,050,317 | 10,117,791 | 14,130 | (14,130) | 186,893,653 | 0.5% |
| Fidelity Securities Lending Cash Central Fund 4.88% | 429,041,537 | 2,621,276,756 | 2,724,339,886 | 2,878,171 | - | - | 325,978,407 | 1.0% |
| Total | 1,152,050,118 | 10,085,212,145 | 10,724,390,203 | 12,995,962 | 14,130 | (14,130) | 512,872,060 | |
| | | | | | | | | |
Amounts in the dividend income column in the above table include any capital gain distributions from underlying funds, which are presented in the corresponding line item in the Statement of Operations, if applicable.
Amounts in the dividend income column for Fidelity Securities Lending Cash Central Fund represents the income earned on investing cash collateral, less rebates paid to borrowers and any lending agent fees associated with the loan, plus any premium payments received for lending certain types of securities.
Amounts included in the purchases and sales proceeds columns may include in-kind transactions, if applicable.
Other Affiliated Issuers
An affiliated company is a company in which the Fund has ownership of at least 5% of the voting securities. Fiscal year to date transactions with companies which are or were affiliates are presented in the table below. Certain corporate actions, such as mergers, are excluded from the amounts in this table if applicable. A dash in the Value end of period ($) column means either the issuer is no longer held at period end, or the issuer is held at period end but is no longer an affiliate.
| Affiliate | Value, beginning of period ($) | Purchases ($) | Sales Proceeds ($) | Dividend Income ($) | Realized Gain (loss) ($) | Change in Unrealized appreciation (depreciation) ($) | Value, end of period ($) |
| JK Cement Ltd. | 153,502,664 | - | 24,315,150 | - | (955,592) | 18,327,903 | 146,559,825 |
| LOG Commercial Properties e Participacoes SA | 24,979,870 | 1,289,315 | 5,346,790 | 728,098 | (3,206,447) | (2,756,513) | - |
| Pick 'n Pay Stores Ltd. | 119,922,945 | 287,922 | 35,437,696 | 825,160 | (29,290,770) | (1,358,700) | - |
| Titan Cement International Trading SA | 65,636,709 | - | 1,270,953 | - | (984,987) | 30,487,881 | 93,868,650 |
| Zai Lab Ltd. | 25,948,841 | 3,264,890 | 3,244,798 | - | (6,809,334) | 22,184,556 | 41,344,155 |
| Zai Lab Ltd. ADR | 1,098,404 | - | 1,681,573 | - | (196,203) | 779,372 | - |
| Total | 391,089,433 | 4,842,127 | 71,296,960 | 1,553,258 | (41,443,333) | 67,664,499 | 281,772,630 |
Amounts included in the purchases and sales proceeds columns may include in-kind transactions, if applicable.
Investment Valuation
The following is a summary of the inputs used, as of April 30, 2023, involving the Fund's assets and liabilities carried at fair value. The inputs or methodology used for valuing securities may not be an indication of the risk associated with investing in those securities. For more information on valuation inputs, and their aggregation into the levels used below, please refer to the Investment Valuation section in the accompanying Notes to Financial Statements.
| Valuation Inputs at Reporting Date: |
| Description | Total ($) | Level 1 ($) | Level 2 ($) | Level 3 ($) |
Investments in Securities: | | | | |
|
| Equities: | | | | |
Communication Services | 2,186,029,374 | 621,758,008 | 1,434,377,686 | 129,893,680 |
Consumer Discretionary | 3,173,909,665 | 1,000,627,703 | 2,143,429,176 | 29,852,786 |
Consumer Staples | 1,533,594,476 | 458,090,413 | 1,025,034,140 | 50,469,923 |
Energy | 1,044,966,504 | 280,401,584 | 732,802,189 | 31,762,731 |
Financials | 5,346,436,007 | 2,130,976,218 | 3,142,680,853 | 72,778,936 |
Health Care | 847,373,689 | 151,602,812 | 688,943,532 | 6,827,345 |
Industrials | 1,187,551,749 | 439,772,712 | 747,779,037 | - |
Information Technology | 4,107,951,544 | 294,164,285 | 3,770,211,071 | 43,576,188 |
Materials | 2,002,547,916 | 1,022,558,311 | 979,847,109 | 142,496 |
Real Estate | 369,770,540 | 118,987,162 | 250,668,413 | 114,965 |
Utilities | 678,346,639 | 176,602,129 | 501,744,510 | - |
|
| Government Obligations | 15,353,708 | - | 15,353,708 | - |
|
| Money Market Funds | 512,872,060 | 512,872,060 | - | - |
| Total Investments in Securities: | 23,006,703,871 | 7,208,413,397 | 15,432,871,424 | 365,419,050 |
The following is a reconciliation of Investments in Securities for which Level 3 inputs were used in determining value:
| |
| Investments in Securities: | |
| Beginning Balance | $ | 221,119,750 | |
| Net Realized Gain (Loss) on Investment Securities | | (1,574,410) | |
| Net Unrealized Gain (Loss) on Investment Securities | | 146,281,710 | |
| Cost of Purchases | | - | |
| Proceeds of Sales | | (408,000) | |
| Amortization/Accretion | | - | |
| Transfers into Level 3 | | - | |
| Transfers out of Level 3 | | - | |
| Ending Balance | $ | 365,419,050 | |
| The change in unrealized gain (loss) for the period attributable to Level 3 securities held at April 30, 2023 | $ | 146,281,710 | |
| The information used in the above reconciliation represents fiscal year to date activity for any Investments in Securities identified as using Level 3 inputs at either the beginning or the end of the current fiscal period. Cost of purchases and proceeds of sales may include securities received and/or delivered through in-kind transactions, corporate actions or exchanges. Transfers into Level 3 were attributable to a lack of observable market data resulting from decreases in market activity, decreases in liquidity, security restructurings or corporate actions. Transfers out of Level 3 were attributable to observable market data becoming available for those securities. Transfers in or out of Level 3 represent the beginning value of any Security or Instrument where a change in the pricing level occurred from the beginning to the end of the period. Realized and unrealized gains (losses) disclosed in the reconciliation are included in Net Gain (Loss) on the Fund's Statement of Operations. | |
Fidelity® Series Emerging Markets Opportunities Fund
| Statement of Assets and Liabilities |
| | | | April 30, 2023 (Unaudited) |
| | | | | |
| Assets | | | | |
| Investment in securities, at value (including securities loaned of $309,896,740) - See accompanying schedule: | | | | |
Unaffiliated issuers (cost $20,230,284,999) | $ | 22,212,059,181 | | |
Fidelity Central Funds (cost $512,867,710) | | 512,872,060 | | |
Other affiliated issuers (cost $190,707,956) | | 281,772,630 | | |
| | | | | |
| | | | | |
| Total Investment in Securities (cost $20,933,860,665) | | | $ | 23,006,703,871 |
| Foreign currency held at value (cost $80,488,636) | | | | 75,689,952 |
| Receivable for investments sold | | | | 53,401,846 |
| Receivable for fund shares sold | | | | 49,835 |
| Dividends receivable | | | | 54,662,361 |
| Distributions receivable from Fidelity Central Funds | | | | 1,522,580 |
| Receivable for daily variation margin on futures contracts | | | | 24,807 |
| Receivable from investment adviser for expense reductions | | | | 278,437 |
| Other receivables | | | | 3,053,349 |
Total assets | | | | 23,195,387,038 |
| Liabilities | | | | |
| Payable to custodian bank | $ | 2,707,550 | | |
| Payable for investments purchased | | | | |
Regular delivery | | 57,189,002 | | |
Delayed delivery | | 20,025,629 | | |
| Payable for fund shares redeemed | | 34,705,616 | | |
| Deferred taxes | | 84,019,941 | | |
| Other payables and accrued expenses | | 2,146,939 | | |
| Collateral on securities loaned | | 325,973,311 | | |
| Total Liabilities | | | | 526,767,988 |
| Net Assets | | | $ | 22,668,619,050 |
| Net Assets consist of: | | | | |
| Paid in capital | | | $ | 22,626,492,647 |
| Total accumulated earnings (loss) | | | | 42,126,403 |
| Net Assets | | | $ | 22,668,619,050 |
Net Asset Value , offering price and redemption price per share ($22,668,619,050 ÷ 1,375,885,800 shares) | | | $ | 16.48 |
| Statement of Operations |
| | | | Six months ended April 30, 2023 (Unaudited) |
| Investment Income | | | | |
| Dividends (including $1,553,258 earned from affiliated issuers) | | | $ | 268,240,654 |
| Non-Cash dividends | | | | 59,985,114 |
| Interest | | | | 427,075 |
| Income from Fidelity Central Funds (including $2,878,171 from security lending) | | | | 12,995,962 |
| Income before foreign taxes withheld | | | $ | 341,648,805 |
| Less foreign taxes withheld | | | | (31,875,815) |
| Total Income | | | | 309,772,990 |
| Expenses | | | | |
| Custodian fees and expenses | $ | 3,340,429 | | |
| Independent trustees' fees and expenses | | 77,459 | | |
| Interest | | 51,384 | | |
| Total expenses before reductions | | 3,469,272 | | |
| Expense reductions | | (1,791,339) | | |
| Total expenses after reductions | | | | 1,677,933 |
| Net Investment income (loss) | | | | 308,095,057 |
| Realized and Unrealized Gain (Loss) | | | | |
| Net realized gain (loss) on: | | | | |
| Investment Securities: | | | | |
| Unaffiliated issuers (net of foreign taxes of $11,909,230) | | (694,745,816) | | |
| Fidelity Central Funds | | 14,130 | | |
| Other affiliated issuers | | (41,443,333) | | |
| Foreign currency transactions | | 920,822 | | |
| Futures contracts | | 19,646,729 | | |
| Total net realized gain (loss) | | | | (715,607,468) |
| Change in net unrealized appreciation (depreciation) on: | | | | |
| Investment Securities: | | | | |
| Unaffiliated issuers(net of increase in deferred foreign taxes of $10,852,581) | | 4,524,248,310 | | |
| Fidelity Central Funds | | (14,130) | | |
| Other affiliated issuers | | 67,664,499 | | |
| Assets and liabilities in foreign currencies | | (1,165,604) | | |
| Futures contracts | | 4,775,049 | | |
| Total change in net unrealized appreciation (depreciation) | | | | 4,595,508,124 |
| Net gain (loss) | | | | 3,879,900,656 |
| Net increase (decrease) in net assets resulting from operations | | | $ | 4,187,995,713 |
| Statement of Changes in Net Assets |
| |
| | Six months ended April 30, 2023 (Unaudited) | | Year ended October 31, 2022 |
| Increase (Decrease) in Net Assets | | | | |
| Operations | | | | |
| Net investment income (loss) | $ | 308,095,057 | $ | 687,585,060 |
| Net realized gain (loss) | | (715,607,468) | | (1,069,863,359) |
| Change in net unrealized appreciation (depreciation) | | 4,595,508,124 | | (10,801,411,227) |
| Net increase (decrease) in net assets resulting from operations | | 4,187,995,713 | | (11,183,689,526) |
| Distributions to shareholders | | (559,062,771) | | (3,331,305,613) |
| Share transactions | | | | |
| Proceeds from sales of shares | | 1,162,520,016 | | 7,263,042,676 |
| Reinvestment of distributions | | 559,062,771 | | 3,331,305,613 |
| Cost of shares redeemed | | (5,012,173,230) | | (2,937,614,184) |
Net increase (decrease) in net assets resulting from share transactions | | (3,290,590,443) | | 7,656,734,105 |
| Total increase (decrease) in net assets | | 338,342,499 | | (6,858,261,034) |
| | | | | |
| Net Assets | | | | |
| Beginning of period | | 22,330,276,551 | | 29,188,537,585 |
| End of period | $ | 22,668,619,050 | $ | 22,330,276,551 |
| | | | | |
| Other Information | | | | |
| Shares | | | | |
| Sold | | 71,536,716 | | 398,835,244 |
| Issued in reinvestment of distributions | | 35,117,008 | | 156,693,585 |
| Redeemed | | (307,111,888) | | (161,208,420) |
| Net increase (decrease) | | (200,458,164) | | 394,320,409 |
| | | | | |
Financial Highlights
| Fidelity® Series Emerging Markets Opportunities Fund |
| |
| | Six months ended (Unaudited) April 30, 2023 | | Years ended October 31, 2022 | | 2021 | | 2020 | | 2019 | | 2018 |
Selected Per-Share Data | | | | | | | | | | | | |
| Net asset value, beginning of period | $ | 14.17 | $ | 24.69 | $ | 21.49 | $ | 19.39 | $ | 17.66 | $ | 21.35 |
| Income from Investment Operations | | | | | | | | | | | | |
Net investment income (loss) A,B | | .21 | | .48 | | .47 | | .35 | | .57 C | | .45 |
| Net realized and unrealized gain (loss) | | 2.47 | | (8.30) | | 3.48 | | 2.26 | | 2.71 | | (3.52) |
| Total from investment operations | | 2.68 | | (7.82) | | 3.95 | | 2.61 | | 3.28 | | (3.07) |
| Distributions from net investment income | | (.37) | | (.68) | | (.33) | | (.50) | | (.41) | | (.39) |
| Distributions from net realized gain | | - | | (2.01) | | (.41) | | (.02) | | (1.14) | | (.23) |
| Total distributions | | (.37) | | (2.70) D | | (.75) D | | (.51) D | | (1.55) | | (.62) |
| Net asset value, end of period | $ | 16.48 | $ | 14.17 | $ | 24.69 | $ | 21.49 | $ | 19.39 | $ | 17.66 |
Total Return E,F | | 19.03% | | (35.33)% | | 18.44% | | 13.66% | | 20.13% | | (14.82)% |
Ratios to Average Net Assets B,G,H | | | | | | | | | | | | |
| Expenses before reductions | | .03% I | | .03% | | .03% | | .04% | | .04% | | .05% |
| Expenses net of fee waivers, if any | | .01% I | | .01% | | .01% | | .01% | | .01% | | .01% |
| Expenses net of all reductions | | .01% I | | .01% | | .01% | | .01% | | .01% | | .01% |
| Net investment income (loss) | | 2.58% I | | 2.64% | | 1.82% | | 1.78% | | 3.12% C | | 2.16% |
| Supplemental Data | | | | | | | | | | | | |
| Net assets, end of period (000 omitted) | $ | 22,668,619 | $ | 22,330,277 | $ | 29,188,538 | $ | 26,829,783 | $ | 18,675,048 | $ | 13,597,809 |
Portfolio turnover rate J | | 41% I | | 37% | | 69% | | 42% K | | 54% | | 64% |
A Calculated based on average shares outstanding during the period.
B Net investment income (loss) is affected by the timing of the declaration of dividends by any underlying mutual funds or exchange-traded funds (ETFs). Net investment income (loss) of any mutual funds or ETFs is not included in the Fund's net investment income (loss) ratio.
C Net investment income per share reflects one or more large, non-recurring dividend(s) which amounted to $.15 per share. Excluding such non-recurring dividend(s), the ratio of net investment income (loss) to average net assets would have been 2.29%.
D Total distributions per share do not sum due to rounding.
E Total returns for periods of less than one year are not annualized.
F Total returns would have been lower if certain expenses had not been reduced during the applicable periods shown.
G Fees and expenses of any underlying mutual funds or exchange-traded funds (ETFs) are not included in the Fund's expense ratio. The Fund indirectly bears its proportionate share of these expenses. For additional expense information related to investments in Fidelity Central Funds, please refer to the "Investments in Fidelity Central Funds" note found in the Notes to Financial Statements section of the most recent Annual or Semi-Annual report.
H Expense ratios reflect operating expenses of the class. Expenses before reductions do not reflect amounts reimbursed, waived, or reduced through arrangements with the investment adviser, brokerage services, or other offset arrangements, if applicable, and do not represent the amount paid by the class during periods when reimbursements, waivers or reductions occur.
I Annualized.
J Amount does not include the portfolio activity of any underlying mutual funds or exchange-traded funds (ETFs).
K Portfolio turnover rate excludes securities received or delivered in-kind.
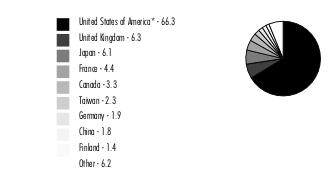
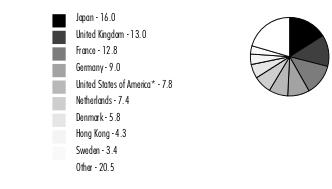
Top Holdings (% of Fund's net assets) |
| |
| LVMH Moet Hennessy Louis Vuitton SE (France, Textiles, Apparel & Luxury Goods) | 6.1 | |
| ASML Holding NV (Netherlands) (Netherlands, Semiconductors & Semiconductor Equipment) | 5.6 | |
| Nestle SA (Reg. S) (United States of America, Food Products) | 4.9 | |
| Linde PLC (United States of America, Chemicals) | 3.7 | |
| Keyence Corp. (Japan, Electronic Equipment, Instruments & Components) | 3.1 | |
| Novo Nordisk A/S Series B (Denmark, Pharmaceuticals) | 3.1 | |
| Safran SA (France, Aerospace & Defense) | 2.9 | |
| Atlas Copco AB (A Shares) (Sweden, Machinery) | 2.8 | |
| Marsh & McLennan Companies, Inc. (United States of America, Insurance) | 2.8 | |
| AIA Group Ltd. (Hong Kong, Insurance) | 2.6 | |
| | 37.6 | |
| |
| Market Sectors (% of Fund's net assets) |
| |
| Industrials | 26.6 | |
| Financials | 17.5 | |
| Information Technology | 15.5 | |
| Consumer Discretionary | 13.6 | |
| Health Care | 8.8 | |
| Materials | 7.5 | |
| Consumer Staples | 5.4 | |
| Communication Services | 1.5 | |
| Energy | 0.8 | |
| Real Estate | 0.2 | |
| |
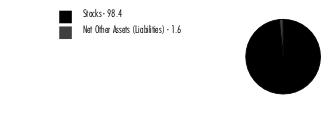
Asset Allocation (% of Fund's net assets) |
|
|
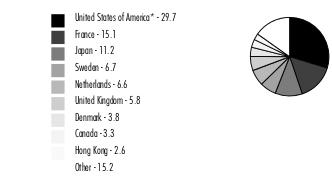
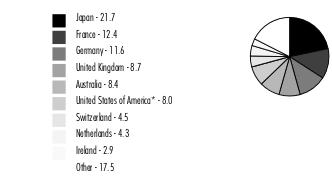
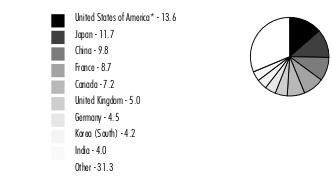
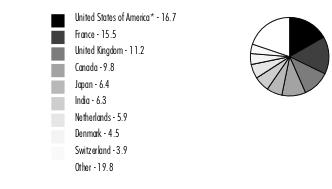
Geographic Diversification (% of Fund's net assets) |
|
* Includes Short-Term investments and Net Other Assets (Liabilities). Percentages are adjusted for the effect of derivatives, if applicable. |
| |
Fidelity® Series International Growth Fund
| Common Stocks - 97.1% |
| | | Shares | Value ($) |
| Belgium - 0.4% | | | |
| Azelis Group NV | | 2,117,369 | 50,162,271 |
| Canada - 3.3% | | | |
| CAE, Inc. (a) | | 3,768,300 | 84,803,090 |
| Canadian Pacific Kansas City Ltd. | | 3,176,840 | 250,423,672 |
| Franco-Nevada Corp. | | 778,228 | 118,085,480 |
TOTAL CANADA | | | 453,312,242 |
| Denmark - 3.8% | | | |
| Novo Nordisk A/S Series B | | 2,553,200 | 424,736,308 |
| Vestas Wind Systems A/S | | 3,815,300 | 105,571,621 |
TOTAL DENMARK | | | 530,307,929 |
| Finland - 0.6% | | | |
| Kone OYJ (B Shares) | | 1,478,100 | 84,204,741 |
| France - 15.1% | | | |
| Adevinta ASA Class B (a) | | 4,185,302 | 32,203,543 |
| Airbus Group NV (b) | | 2,463,100 | 344,919,283 |
| Edenred SA | | 3,114,536 | 202,207,973 |
| Lectra | | 1,054,888 | 34,290,242 |
| Legrand SA | | 2,378,344 | 224,593,754 |
| LVMH Moet Hennessy Louis Vuitton SE (b) | | 879,196 | 845,682,220 |
| Safran SA | | 2,582,100 | 401,567,591 |
TOTAL FRANCE | | | 2,085,464,606 |
| Germany - 1.7% | | | |
| Deutsche Borse AG | | 1,114,045 | 212,458,015 |
| Vonovia SE (b) | | 1,327,462 | 28,790,680 |
TOTAL GERMANY | | | 241,248,695 |
| Hong Kong - 2.6% | | | |
| AIA Group Ltd. | | 32,939,501 | 358,614,842 |
| India - 1.8% | | | |
| Housing Development Finance Corp. Ltd. | | 3,632,200 | 123,886,370 |
| Kotak Mahindra Bank Ltd. | | 2,608,100 | 62,138,440 |
| Reliance Industries Ltd. | | 1,075,000 | 31,958,129 |
| Reliance Industries Ltd. GDR (c) | | 505,800 | 30,145,680 |
TOTAL INDIA | | | 248,128,619 |
| Ireland - 1.8% | | | |
| CRH PLC sponsored ADR | | 5,058,440 | 245,334,340 |
| Israel - 1.3% | | | |
| NICE Ltd. sponsored ADR (a)(b) | | 859,554 | 175,357,612 |
| Italy - 1.6% | | | |
| Interpump Group SpA | | 1,713,520 | 95,312,686 |
| Prada SpA | | 16,335,900 | 120,275,997 |
TOTAL ITALY | | | 215,588,683 |
| Japan - 11.2% | | | |
| Azbil Corp. | | 4,869,705 | 136,189,894 |
| FANUC Corp. | | 2,809,575 | 94,882,758 |
| Hoya Corp. | | 1,932,100 | 202,590,426 |
| Keyence Corp. | | 946,287 | 426,734,083 |
| Lasertec Corp. | | 777,200 | 105,734,975 |
| Misumi Group, Inc. | | 6,777,406 | 170,975,026 |
| OSG Corp. | | 2,187,246 | 30,725,792 |
| Recruit Holdings Co. Ltd. | | 7,681,405 | 215,491,119 |
| SHO-BOND Holdings Co. Ltd. | | 2,070,100 | 88,467,693 |
| USS Co. Ltd. | | 3,848,100 | 64,663,443 |
TOTAL JAPAN | | | 1,536,455,209 |
| Kenya - 0.2% | | | |
| Safaricom Ltd. | | 269,131,800 | 32,652,020 |
| Netherlands - 6.6% | | | |
| Aalberts Industries NV | | 682,400 | 31,415,909 |
| ASML Holding NV (Netherlands) | | 1,222,646 | 772,638,484 |
| IMCD NV | | 695,554 | 104,387,896 |
TOTAL NETHERLANDS | | | 908,442,289 |
| Norway - 0.3% | | | |
| Schibsted ASA (B Shares) | | 2,487,454 | 40,286,436 |
| South Africa - 0.2% | | | |
| Clicks Group Ltd. | | 1,833,522 | 26,796,434 |
| Spain - 2.3% | | | |
| Amadeus IT Holding SA Class A (a) | | 4,452,164 | 312,920,476 |
| Sweden - 6.7% | | | |
| ASSA ABLOY AB (B Shares) (b) | | 8,478,401 | 201,645,239 |
| Atlas Copco AB (A Shares) (b) | | 27,121,944 | 391,686,038 |
| Autoliv, Inc. | | 1,237,534 | 106,192,793 |
| Epiroc AB (A Shares) | | 10,438,736 | 209,119,971 |
| Lagercrantz Group AB (B Shares) | | 1,525,400 | 19,604,753 |
TOTAL SWEDEN | | | 928,248,794 |
| Switzerland - 1.0% | | | |
| Schindler Holding AG: | | | |
| (participation certificate) | | 205,741 | 45,735,567 |
| (Reg.) | | 152,992 | 32,503,419 |
| UBS Group AG | | 2,667,780 | 53,916,704 |
TOTAL SWITZERLAND | | | 132,155,690 |
| Taiwan - 1.7% | | | |
| Taiwan Semiconductor Manufacturing Co. Ltd. | | 14,356,885 | 234,938,207 |
| United Kingdom - 5.8% | | | |
| BAE Systems PLC | | 10,644,900 | 135,615,855 |
| Compass Group PLC | | 10,896,000 | 287,446,944 |
| Dechra Pharmaceuticals PLC | | 707,900 | 33,184,069 |
| InterContinental Hotel Group PLC ADR | | 1,872,230 | 129,708,094 |
| Rightmove PLC | | 8,998,992 | 64,939,053 |
| Spectris PLC | | 3,076,386 | 145,332,267 |
TOTAL UNITED KINGDOM | | | 796,226,282 |
| United States of America - 27.1% | | | |
| Experian PLC | | 5,982,189 | 211,798,701 |
| Lam Research Corp. | | 143,713 | 75,317,109 |
| Linde PLC | | 1,396,701 | 516,011,184 |
| Marsh & McLennan Companies, Inc. | | 2,114,531 | 381,017,341 |
| MasterCard, Inc. Class A | | 628,731 | 238,936,642 |
| Moody's Corp. | | 618,359 | 193,620,570 |
| MSCI, Inc. | | 471,227 | 227,343,466 |
| Nestle SA (Reg. S) | | 5,215,220 | 669,058,353 |
| NOV, Inc. | | 3,128,100 | 52,395,675 |
| Otis Worldwide Corp. | | 971,400 | 82,860,420 |
| PriceSmart, Inc. | | 571,127 | 42,080,637 |
| ResMed, Inc. | | 1,238,818 | 298,505,585 |
| Roche Holding AG (participation certificate) | | 793,944 | 248,615,789 |
| S&P Global, Inc. | | 507,880 | 184,147,130 |
| Sherwin-Williams Co. | | 625,341 | 148,543,501 |
| Visa, Inc. Class A | | 697,970 | 162,438,558 |
TOTAL UNITED STATES OF AMERICA | | | 3,732,690,661 |
| TOTAL COMMON STOCKS (Cost $8,290,016,536) | | | 13,369,537,078 |
| | | | |
| Convertible Preferred Stocks - 0.3% |
| | | Shares | Value ($) |
| China - 0.3% | | | |
ByteDance Ltd. Series E1 (a)(d)(e) (Cost $18,859,141) | | 172,113 | 34,250,487 |
| | | | |
| Money Market Funds - 7.9% |
| | | Shares | Value ($) |
| Fidelity Cash Central Fund 4.88% (f) | | 198,601,976 | 198,641,697 |
| Fidelity Securities Lending Cash Central Fund 4.88% (f)(g) | | 892,574,721 | 892,663,978 |
| TOTAL MONEY MARKET FUNDS (Cost $1,091,305,675) | | | 1,091,305,675 |
| | | | |
| TOTAL INVESTMENT IN SECURITIES - 105.3% (Cost $9,400,181,352) | 14,495,093,240 |
NET OTHER ASSETS (LIABILITIES) - (5.3)% | (730,005,855) |
| NET ASSETS - 100.0% | 13,765,087,385 |
| | |
Legend
| (b) | Security or a portion of the security is on loan at period end. |
| (c) | Security exempt from registration under Rule 144A of the Securities Act of 1933. These securities may be resold in transactions exempt from registration, normally to qualified institutional buyers. At the end of the period, the value of these securities amounted to $30,145,680 or 0.2% of net assets. |
| (d) | Restricted securities (including private placements) - Investment in securities not registered under the Securities Act of 1933 (excluding 144A issues). At the end of the period, the value of restricted securities (excluding 144A issues) amounted to $34,250,487 or 0.2% of net assets. |
| (f) | Affiliated fund that is generally available only to investment companies and other accounts managed by Fidelity Investments. The rate quoted is the annualized seven-day yield of the fund at period end. A complete unaudited listing of the fund's holdings as of its most recent quarter end is available upon request. In addition, each Fidelity Central Fund's financial statements are available on the SEC's website or upon request. |
| (g) | Investment made with cash collateral received from securities on loan. |
| Additional information on each restricted holding is as follows: |
| Security | Acquisition Date | Acquisition Cost ($) |
| ByteDance Ltd. Series E1 | 11/18/20 | 18,859,141 |
| | | |
Affiliated Central Funds
Fiscal year to date information regarding the Fund's investments in Fidelity Central Funds, including the ownership percentage, is presented below.
| Affiliate | Value, beginning of period ($) | Purchases ($) | Sales Proceeds ($) | Dividend Income ($) | Realized Gain (loss) ($) | Change in Unrealized appreciation (depreciation) ($) | Value, end of period ($) | % ownership, end of period |
| Fidelity Cash Central Fund 4.88% | 350,149,852 | 1,234,969,138 | 1,386,477,293 | 4,333,692 | - | - | 198,641,697 | 0.5% |
| Fidelity Securities Lending Cash Central Fund 4.88% | 459,204,500 | 2,283,178,367 | 1,849,718,889 | 634,750 | - | - | 892,663,978 | 2.7% |
| Total | 809,354,352 | 3,518,147,505 | 3,236,196,182 | 4,968,442 | - | - | 1,091,305,675 | |
| | | | | | | | | |
Amounts in the dividend income column in the above table include any capital gain distributions from underlying funds, which are presented in the corresponding line item in the Statement of Operations, if applicable.
Amounts in the dividend income column for Fidelity Securities Lending Cash Central Fund represents the income earned on investing cash collateral, less rebates paid to borrowers and any lending agent fees associated with the loan, plus any premium payments received for lending certain types of securities.
Amounts included in the purchases and sales proceeds columns may include in-kind transactions, if applicable.
Investment Valuation
The following is a summary of the inputs used, as of April 30, 2023, involving the Fund's assets and liabilities carried at fair value. The inputs or methodology used for valuing securities may not be an indication of the risk associated with investing in those securities. For more information on valuation inputs, and their aggregation into the levels used below, please refer to the Investment Valuation section in the accompanying Notes to Financial Statements.
| Valuation Inputs at Reporting Date: |
| Description | Total ($) | Level 1 ($) | Level 2 ($) | Level 3 ($) |
Investments in Securities: | | | | |
|
| Equities: | | | | |
Communication Services | 204,331,539 | 170,081,052 | - | 34,250,487 |
Consumer Discretionary | 1,866,889,967 | 235,900,887 | 1,630,989,080 | - |
Consumer Staples | 737,935,424 | 68,877,071 | 669,058,353 | - |
Energy | 114,499,484 | 82,541,355 | 31,958,129 | - |
Financials | 2,400,726,051 | 1,643,628,384 | 757,097,667 | - |
Health Care | 1,207,632,177 | 331,689,654 | 875,942,523 | - |
Industrials | 3,688,870,112 | 1,679,734,702 | 2,009,135,410 | - |
Information Technology | 2,126,137,626 | 1,222,540,467 | 903,597,159 | - |
Materials | 1,027,974,505 | 1,027,974,505 | - | - |
Real Estate | 28,790,680 | - | 28,790,680 | - |
|
| Money Market Funds | 1,091,305,675 | 1,091,305,675 | - | - |
| Total Investments in Securities: | 14,495,093,240 | 7,554,273,752 | 6,906,569,001 | 34,250,487 |
Fidelity® Series International Growth Fund
| Statement of Assets and Liabilities |
| | | | April 30, 2023 (Unaudited) |
| | | | | |
| Assets | | | | |
| Investment in securities, at value (including securities loaned of $853,173,765) - See accompanying schedule: | | | | |
Unaffiliated issuers (cost $8,308,875,677) | $ | 13,403,787,565 | | |
Fidelity Central Funds (cost $1,091,305,675) | | 1,091,305,675 | | |
| | | | | |
| | | | | |
| Total Investment in Securities (cost $9,400,181,352) | | | $ | 14,495,093,240 |
| Foreign currency held at value (cost $12,231,771) | | | | 12,174,576 |
| Receivable for investments sold | | | | 24,547,554 |
| Receivable for fund shares sold | | | | 71,200,509 |
| Dividends receivable | | | | 31,829,545 |
| Reclaims receivable | | | | 31,220,055 |
| Interest receivable | | | | 10,973 |
| Distributions receivable from Fidelity Central Funds | | | | 567,725 |
| Other receivables | | | | 28,191 |
Total assets | | | | 14,666,672,368 |
| Liabilities | | | | |
| Payable for fund shares redeemed | $ | 4,985,790 | | |
| Other payables and accrued expenses | | 3,935,215 | | |
| Collateral on securities loaned | | 892,663,978 | | |
| Total Liabilities | | | | 901,584,983 |
| Net Assets | | | $ | 13,765,087,385 |
| Net Assets consist of: | | | | |
| Paid in capital | | | $ | 8,715,595,221 |
| Total accumulated earnings (loss) | | | | 5,049,492,164 |
| Net Assets | | | $ | 13,765,087,385 |
Net Asset Value , offering price and redemption price per share ($13,765,087,385 ÷ 856,993,498 shares) | | | $ | 16.06 |
| Statement of Operations |
| | | | Six months ended April 30, 2023 (Unaudited) |
| Investment Income | | | | |
| Dividends | | | $ | 112,122,311 |
| Foreign Tax Reclaims | | | | 6,509,287 |
| Interest | | | | 11,508 |
| Income from Fidelity Central Funds (including $634,750 from security lending) | | | | 4,968,442 |
| Income before foreign taxes withheld | | | $ | 123,611,548 |
| Less foreign taxes withheld | | | | (18,217,728) |
| Total Income | | | | 105,393,820 |
| Expenses | | | | |
| Custodian fees and expenses | $ | 571,954 | | |
| Independent trustees' fees and expenses | | 42,005 | | |
| Interest | | 20,320 | | |
| Total expenses before reductions | | 634,279 | | |
| Expense reductions | | (445) | | |
| Total expenses after reductions | | | | 633,834 |
| Net Investment income (loss) | | | | 104,759,986 |
| Realized and Unrealized Gain (Loss) | | | | |
| Net realized gain (loss) on: | | | | |
| Investment Securities: | | | | |
| Unaffiliated issuers | | (171,498,828) | | |
| Redemptions in-kind | | 105,980,569 | | |
| Foreign currency transactions | | 238,374 | | |
| Total net realized gain (loss) | | | | (65,279,885) |
| Change in net unrealized appreciation (depreciation) on: | | | | |
| Investment Securities: | | | | |
| Unaffiliated issuers(net of increase in deferred foreign taxes of $894,469) | | 2,457,644,965 | | |
| Assets and liabilities in foreign currencies | | 2,729,349 | | |
| Total change in net unrealized appreciation (depreciation) | | | | 2,460,374,314 |
| Net gain (loss) | | | | 2,395,094,429 |
| Net increase (decrease) in net assets resulting from operations | | | $ | 2,499,854,415 |
| Statement of Changes in Net Assets |
| |
| | Six months ended April 30, 2023 (Unaudited) | | Year ended October 31, 2022 |
| Increase (Decrease) in Net Assets | | | | |
| Operations | | | | |
| Net investment income (loss) | $ | 104,759,986 | $ | 182,935,807 |
| Net realized gain (loss) | | (65,279,885) | | 316,466,877 |
| Change in net unrealized appreciation (depreciation) | | 2,460,374,314 | | (4,983,117,038) |
| Net increase (decrease) in net assets resulting from operations | | 2,499,854,415 | | (4,483,714,354) |
| Distributions to shareholders | | (434,836,481) | | (1,228,456,975) |
| Share transactions | | | | |
| Proceeds from sales of shares | | 969,017,193 | | 3,357,019,808 |
| Reinvestment of distributions | | 434,836,481 | | 1,228,456,975 |
| Cost of shares redeemed | | (2,095,954,757) | | (1,948,259,376) |
Net increase (decrease) in net assets resulting from share transactions | | (692,101,083) | | 2,637,217,407 |
| Total increase (decrease) in net assets | | 1,372,916,851 | | (3,074,953,922) |
| | | | | |
| Net Assets | | | | |
| Beginning of period | | 12,392,170,534 | | 15,467,124,456 |
| End of period | $ | 13,765,087,385 | $ | 12,392,170,534 |
| | | | | |
| Other Information | | | | |
| Shares | | | | |
| Sold | | 63,555,986 | | 205,948,049 |
| Issued in reinvestment of distributions | | 29,420,601 | | 65,032,132 |
| Redeemed | | (136,969,889) | | (124,061,175) |
| Net increase (decrease) | | (43,993,302) | | 146,919,006 |
| | | | | |
Financial Highlights
| Fidelity® Series International Growth Fund |
| |
| | Six months ended (Unaudited) April 30, 2023 | | Years ended October 31, 2022 | | 2021 | | 2020 | | 2019 | | 2018 |
Selected Per-Share Data | | | | | | | | | | | | |
| Net asset value, beginning of period | $ | 13.75 | $ | 20.51 | $ | 18.01 | $ | 17.07 | $ | 14.96 | $ | 16.22 |
| Income from Investment Operations | | | | | | | | | | | | |
Net investment income (loss) A,B | | .12 | | .21 | | .20 | | .20 | | .37 C | | .30 |
| Net realized and unrealized gain (loss) | | 2.69 | | (5.38) | | 5.19 | | 1.38 | | 2.74 | | (1.05) |
| Total from investment operations | | 2.81 | | (5.17) | | 5.39 | | 1.58 | | 3.11 | | (.75) |
| Distributions from net investment income | | (.20) | | (.28) | | (.24) | | (.37) | | (.28) | | (.24) |
| Distributions from net realized gain | | (.30) | | (1.31) | | (2.65) | | (.27) | | (.72) | | (.27) |
| Total distributions | | (.50) | | (1.59) | | (2.89) | | (.64) | | (1.00) | | (.51) |
| Net asset value, end of period | $ | 16.06 | $ | 13.75 | $ | 20.51 | $ | 18.01 | $ | 17.07 | $ | 14.96 |
Total Return D,E | | 20.78% | | (27.31)% | | 33.10% | | 9.39% | | 22.58% | | (4.82)% |
Ratios to Average Net Assets B,F,G | | | | | | | | | | | | |
| Expenses before reductions | | .01% H | | .01% | | .01% | | .01% | | .01% | | .01% |
| Expenses net of fee waivers, if any | | .01% H | | .01% | | .01% | | .01% | | .01% | | .01% |
| Expenses net of all reductions | | .01% H | | .01% | | .01% | | .01% | | .01% | | -% I |
| Net investment income (loss) | | 1.58% H | | 1.32% | | 1.06% | | 1.18% | | 2.38% C | | 1.84% |
| Supplemental Data | | | | | | | | | | | | |
| Net assets, end of period (000 omitted) | $ | 13,765,087 | $ | 12,392,171 | $ | 15,467,124 | $ | 11,557,995 | $ | 16,501,791 | $ | 14,113,600 |
Portfolio turnover rate J | | 11% H,K | | 22% K | | 24% | | 16% K | | 24% | | 33% |
A Calculated based on average shares outstanding during the period.
B Net investment income (loss) is affected by the timing of the declaration of dividends by any underlying mutual funds or exchange-traded funds (ETFs). Net investment income (loss) of any mutual funds or ETFs is not included in the Fund's net investment income (loss) ratio.
C Net investment income per share reflects one or more large, non-recurring dividend(s) which amounted to $.07 per share. Excluding such non-recurring dividend(s), the ratio of net investment income (loss) to average net assets would have been 1.92%.
D Total returns for periods of less than one year are not annualized.
E Total returns would have been lower if certain expenses had not been reduced during the applicable periods shown.
F Fees and expenses of any underlying mutual funds or exchange-traded funds (ETFs) are not included in the Fund's expense ratio. The Fund indirectly bears its proportionate share of these expenses. For additional expense information related to investments in Fidelity Central Funds, please refer to the "Investments in Fidelity Central Funds" note found in the Notes to Financial Statements section of the most recent Annual or Semi-Annual report.
G Expense ratios reflect operating expenses of the class. Expenses before reductions do not reflect amounts reimbursed, waived, or reduced through arrangements with the investment adviser, brokerage services, or other offset arrangements, if applicable, and do not represent the amount paid by the class during periods when reimbursements, waivers or reductions occur.
H Annualized.
I Amount represents less than .005%.
J Amount does not include the portfolio activity of any underlying mutual funds or exchange-traded funds (ETFs).
K Portfolio turnover rate excludes securities received or delivered in-kind.
Top Holdings (% of Fund's net assets) |
| |
| Lagercrantz Group AB (B Shares) (Sweden, Electronic Equipment, Instruments & Components) | 3.4 | |
| Spectris PLC (United Kingdom, Electronic Equipment, Instruments & Components) | 3.4 | |
| AddTech AB (B Shares) (Sweden, Trading Companies & Distributors) | 3.3 | |
| Aalberts Industries NV (Netherlands, Machinery) | 2.7 | |
| Azbil Corp. (Japan, Electronic Equipment, Instruments & Components) | 2.5 | |
| Interpump Group SpA (Italy, Machinery) | 2.4 | |
| CTS Eventim AG (Germany, Entertainment) | 2.2 | |
| SHO-BOND Holdings Co. Ltd. (Japan, Construction & Engineering) | 1.5 | |
| Kongsberg Gruppen ASA (Norway, Aerospace & Defense) | 1.5 | |
| OBIC Co. Ltd. (Japan, IT Services) | 1.4 | |
| | 24.3 | |
| |
| Market Sectors (% of Fund's net assets) |
| |
| Industrials | 31.1 | |
| Information Technology | 17.9 | |
| Consumer Discretionary | 10.6 | |
| Health Care | 8.3 | |
| Communication Services | 6.8 | |
| Financials | 6.0 | |
| Consumer Staples | 5.5 | |
| Materials | 4.3 | |
| Real Estate | 2.9 | |
| Energy | 2.0 | |
| Utilities | 0.2 | |
| |
Asset Allocation (% of Fund's net assets) |
|
|
Geographic Diversification (% of Fund's net assets) |
|
* Includes Short-Term investments and Net Other Assets (Liabilities). Percentages are adjusted for the effect of derivatives, if applicable. |
| |
Fidelity® Series International Small Cap Fund
| Common Stocks - 95.6% |
| | | Shares | Value ($) |
| Australia - 1.1% | | | |
| EBOS Group Ltd. | | 100,000 | 2,744,301 |
| Imdex Ltd. | | 10,644,033 | 14,708,318 |
| Steadfast Group Ltd. | | 6,116,015 | 24,111,829 |
TOTAL AUSTRALIA | | | 41,564,448 |
| Austria - 0.2% | | | |
| Mayr-Melnhof Karton AG | | 24,700 | 3,935,568 |
| Wienerberger AG | | 110,000 | 3,309,006 |
TOTAL AUSTRIA | | | 7,244,574 |
| Belgium - 1.7% | | | |
| Azelis Group NV | | 823,072 | 19,499,275 |
| Fagron NV | | 522,500 | 9,707,023 |
| Galapagos NV (a) | | 85,000 | 3,297,941 |
| KBC Ancora | | 677,579 | 32,597,617 |
TOTAL BELGIUM | | | 65,101,856 |
| Brazil - 0.2% | | | |
| LOG Commercial Properties e Participacoes SA | | 1,200,000 | 3,943,221 |
| Orizon Valorizacao de Residuos SA (a) | | 325,000 | 2,215,406 |
| Pet Center Comercio e Participacoes SA | | 1,400,000 | 1,731,826 |
TOTAL BRAZIL | | | 7,890,453 |
| Canada - 3.2% | | | |
| CAE, Inc. (a) | | 1,100,500 | 24,766,022 |
| Cameco Corp. | | 135,000 | 3,711,150 |
| Cogeco Communications, Inc. (b) | | 70,000 | 3,392,405 |
| ECN Capital Corp. | | 982,650 | 2,291,895 |
| Lumine Group, Inc. | | 364,900 | 4,915,249 |
| McCoy Global, Inc. (a) | | 1,106,750 | 1,257,995 |
| MTY Food Group, Inc. | | 93,600 | 4,063,588 |
| North West Co., Inc. | | 130,000 | 3,813,116 |
| Onex Corp. (sub. vtg.) | | 90,000 | 4,144,444 |
| Osisko Gold Royalties Ltd. | | 874,700 | 14,216,256 |
| Parkland Corp. | | 182,500 | 4,303,705 |
| Pason Systems, Inc. | | 1,235,700 | 10,762,269 |
| Real Matters, Inc. (a)(b) | | 950,000 | 3,562,018 |
| Richelieu Hardware Ltd. | | 1,238,420 | 37,238,979 |
| Total Energy Services, Inc. | | 323,400 | 1,911,971 |
TOTAL CANADA | | | 124,351,062 |
| China - 0.5% | | | |
| Chlitina Holding Ltd. | | 2,142,000 | 15,277,988 |
| Kindstar Globalgene Technology, Inc. (a)(c) | | 2,888,000 | 652,796 |
| SITC International Holdings Co. Ltd. | | 850,000 | 1,572,230 |
TOTAL CHINA | | | 17,503,014 |
| Denmark - 0.5% | | | |
| Spar Nord Bank A/S | | 1,292,340 | 20,957,898 |
| Egypt - 0.3% | | | |
| Energean PLC | | 275,000 | 4,278,605 |
| Integrated Diagnostics Holdings PLC (c) | | 16,028,734 | 7,228,959 |
TOTAL EGYPT | | | 11,507,564 |
| Finland - 0.7% | | | |
| Huhtamaki Oyj | | 115,489 | 4,153,679 |
| Musti Group OYJ | | 908,878 | 18,818,047 |
| Nanoform Finland PLC (a) | | 450,000 | 1,110,715 |
| Olvi Oyj (A Shares) | | 74,900 | 2,442,956 |
TOTAL FINLAND | | | 26,525,397 |
| France - 3.9% | | | |
| Altarea SCA | | 21,100 | 2,762,111 |
| ARGAN SA | | 87,404 | 6,818,781 |
| Elis SA | | 340,000 | 6,743,628 |
| Exail Technologies SA (a) | | 114,000 | 2,379,178 |
| Exclusive Networks SA | | 450,000 | 9,718,758 |
| Laurent-Perrier Group SA | | 117,531 | 15,929,411 |
| Lectra | | 1,059,745 | 34,448,124 |
| LISI | | 861,095 | 24,385,203 |
| Maisons du Monde SA (c) | | 270,700 | 2,848,615 |
| Stef SA | | 65,000 | 7,534,792 |
| Teleperformance | | 14,000 | 2,789,129 |
| Thermador Groupe SA | | 33,900 | 3,511,315 |
| Vallourec SA (a) | | 250,000 | 2,847,034 |
| Vetoquinol SA | | 295,648 | 28,961,356 |
TOTAL FRANCE | | | 151,677,435 |
| Germany - 5.8% | | | |
| CTS Eventim AG | | 1,306,770 | 85,819,820 |
| DIC Asset AG (b) | | 163,800 | 1,243,585 |
| DIC Asset AG rights (a) | | 163,800 | 135,368 |
| Gerresheimer AG | | 61,000 | 6,634,209 |
| Instone Real Estate Group BV (c) | | 400,000 | 3,195,510 |
| Nexus AG | | 618,016 | 35,411,575 |
| NORMA Group AG | | 98,900 | 2,345,205 |
| Rheinmetall AG | | 138,100 | 40,401,769 |
| Scout24 AG (c) | | 330,500 | 20,576,054 |
| Stabilus Se | | 398,800 | 26,014,713 |
| Talanx AG | | 75,200 | 3,775,233 |
TOTAL GERMANY | | | 225,553,041 |
| Greece - 0.1% | | | |
| Mytilineos SA | | 187,700 | 5,439,540 |
| Hong Kong - 0.2% | | | |
| Cadeler A/S (a) | | 950,000 | 4,139,795 |
| HKBN Ltd. | | 4,000,000 | 2,822,611 |
TOTAL HONG KONG | | | 6,962,406 |
| Hungary - 0.2% | | | |
| Richter Gedeon PLC | | 352,100 | 8,496,952 |
| India - 0.8% | | | |
| Embassy Office Parks (REIT) | | 3,892,602 | 15,709,383 |
| Indian Energy Exchange Ltd. (a)(c) | | 7,267,508 | 13,975,218 |
| One97 Communications Ltd. (a) | | 350,000 | 2,809,464 |
TOTAL INDIA | | | 32,494,065 |
| Indonesia - 0.2% | | | |
| PT Selamat Sempurna Tbk | | 54,385,260 | 5,767,030 |
| Ireland - 1.6% | | | |
| AerCap Holdings NV (a) | | 416,000 | 23,445,760 |
| Cairn Homes PLC | | 11,532,634 | 13,131,236 |
| Cairn Homes PLC | | 5,500,000 | 6,205,901 |
| Greencore Group PLC (a) | | 2,750,000 | 2,963,574 |
| Irish Residential Properties REIT PLC | | 10,632,916 | 12,091,335 |
| Mincon Group PLC | | 4,037,729 | 4,315,698 |
TOTAL IRELAND | | | 62,153,504 |
| Israel - 1.0% | | | |
| Ituran Location & Control Ltd. | | 968,735 | 20,149,688 |
| Maytronics Ltd. | | 1,003,771 | 10,484,786 |
| Tel Aviv Stock Exchange Ltd. | | 1,742,857 | 8,024,341 |
TOTAL ISRAEL | | | 38,658,815 |
| Italy - 2.9% | | | |
| Banca Generali SpA | | 140,000 | 4,641,864 |
| BFF Bank SpA (c) | | 525,000 | 5,044,498 |
| Coca-Cola HBC AG | | 125,000 | 3,807,953 |
| Intercos SpA | | 269,000 | 4,872,998 |
| Interpump Group SpA | | 1,633,037 | 90,835,906 |
| MARR SpA | | 131,400 | 2,056,013 |
TOTAL ITALY | | | 111,259,232 |
| Japan - 29.6% | | | |
| ABC-MART, Inc. | | 68,300 | 3,881,404 |
| Ai Holdings Corp. | | 416,292 | 7,287,996 |
| Aoki Super Co. Ltd. | | 309,187 | 5,483,309 |
| Arcland Sakamoto Co. Ltd. | | 193,700 | 2,193,851 |
| Artnature, Inc. | | 1,214,900 | 6,987,995 |
| As One Corp. | | 62,000 | 2,626,601 |
| ASKUL Corp. | | 470,000 | 6,263,604 |
| Aucnet, Inc. | | 757,060 | 8,855,371 |
| Azbil Corp. | | 3,466,390 | 96,943,714 |
| Bank of Kyoto Ltd. | | 61,153 | 3,008,877 |
| BayCurrent Consulting, Inc. | | 119,000 | 4,136,441 |
| Broadleaf Co. Ltd. (d) | | 6,232,673 | 19,661,922 |
| Central Automotive Products Ltd. | | 183,879 | 3,909,442 |
| CKD Corp. | | 267,000 | 4,067,103 |
| Curves Holdings Co. Ltd. (d) | | 5,387,359 | 31,409,088 |
| Daiichikosho Co. Ltd. | | 2,031,428 | 36,419,882 |
| Daikokutenbussan Co. Ltd. | | 179,300 | 7,178,389 |
| Dexerials Corp. | | 90,000 | 1,712,752 |
| Digital Hearts Holdings Co. Ltd. (d) | | 1,330,250 | 14,412,187 |
| Dip Corp. | | 163,500 | 4,033,886 |
| Dowa Holdings Co. Ltd. | | 90,000 | 2,940,343 |
| Elan Corp. | | 173,200 | 1,297,015 |
| Fujitec Co. Ltd. | | 475,300 | 12,661,628 |
| Funai Soken Holdings, Inc. | | 1,121,757 | 21,503,610 |
| Goldcrest Co. Ltd. | | 1,711,100 | 22,936,813 |
| i-mobile Co. Ltd. | | 220,000 | 2,112,187 |
| Inaba Denki Sangyo Co. Ltd. | | 396,300 | 8,851,746 |
| Invincible Investment Corp. | | 7,000 | 3,022,302 |
| Iwatani Corp. | | 85,000 | 4,024,138 |
| Iwatsuka Confectionary Co. Ltd. | | 105,800 | 3,751,949 |
| JINS Holdings, Inc. | | 123,200 | 2,653,074 |
| JTOWER, Inc. (a) | | 225,000 | 9,703,457 |
| Justsystems Corp. | | 100,000 | 2,642,500 |
| Kamigumi Co. Ltd. | | 445,800 | 9,770,091 |
| Kansai Electric Power Co., Inc. | | 660,000 | 7,124,512 |
| Katitas Co. Ltd. | | 118,700 | 2,318,080 |
| Kobayashi Pharmaceutical Co. Ltd. | | 416,800 | 26,009,164 |
| Kobe Bussan Co. Ltd. | | 82,300 | 2,301,800 |
| Koshidaka Holdings Co. Ltd. (d) | | 4,497,659 | 38,076,995 |
| Kusuri No Aoki Holdings Co. Ltd. | | 255,658 | 12,267,488 |
| Kyoritsu Maintenance Co. Ltd. | | 107,700 | 4,347,432 |
| Lasertec Corp. | | 194,360 | 26,441,907 |
| M&A Capital Partners Co. Ltd. (a) | | 120,000 | 3,390,005 |
| Maeda Kosen Co. Ltd. | | 167,300 | 4,003,167 |
| Maruwa Ceramic Co. Ltd. | | 59,600 | 7,600,488 |
| MCJ Co. Ltd. | | 680,000 | 4,703,170 |
| Medikit Co. Ltd. | | 695,300 | 12,067,137 |
| Meitec Corp. | | 201,000 | 3,396,491 |
| Miroku Jyoho Service Co., Ltd. (b) | | 643,891 | 8,042,835 |
| Misumi Group, Inc. | | 1,548,865 | 39,073,538 |
| Mitsuboshi Belting Ltd. | | 292,952 | 8,392,989 |
| Miura Co. Ltd. | | 147,900 | 3,939,652 |
| Nagaileben Co. Ltd. | | 1,513,000 | 23,535,723 |
| Net One Systems Co. Ltd. | | 409,400 | 9,652,986 |
| Nihon Parkerizing Co. Ltd. | | 5,700,468 | 44,618,519 |
| Nippon Concept Corp. | | 135,000 | 1,609,675 |
| Nitto Kohki Co. Ltd. | | 270,000 | 3,992,207 |
| NOF Corp. | | 232,800 | 10,636,972 |
| NS Tool Co. Ltd. (d) | | 1,434,000 | 11,954,995 |
| NSD Co. Ltd. | | 1,373,780 | 25,272,585 |
| OBIC Co. Ltd. | | 359,600 | 55,405,447 |
| OSG Corp. | | 2,120,875 | 29,793,431 |
| PALTAC Corp. | | 135,000 | 5,179,532 |
| Paramount Bed Holdings Co. Ltd. | | 616,612 | 10,934,255 |
| Pilot Corp. | | 115,900 | 3,862,624 |
| ProNexus, Inc. | | 1,319,577 | 9,693,400 |
| Qol Holdings Co. Ltd. | | 240,000 | 2,200,217 |
| Raccoon Holdings, Inc. (b) | | 220,000 | 1,181,967 |
| Relo Group, Inc. | | 273,600 | 4,253,492 |
| Renesas Electronics Corp. (a) | | 281,200 | 3,664,725 |
| Roland Corp. | | 100,000 | 2,997,588 |
| San-Ai Obbli Co. Ltd. | | 1,576,710 | 16,612,271 |
| Sekisui Jushi Corp. | | 175,000 | 2,811,001 |
| SHO-BOND Holdings Co. Ltd. | | 1,372,000 | 58,633,725 |
| Shoei Co. Ltd. | | 1,705,000 | 31,629,615 |
| SK Kaken Co. Ltd. | | 97,904 | 31,131,093 |
| Software Service, Inc. | | 181,500 | 11,631,307 |
| Sumco Corp. | | 471,400 | 6,491,959 |
| SWCC Showa Holdings Co. Ltd. | | 293,500 | 3,812,125 |
| Techno Medica Co. Ltd. | | 283,000 | 3,732,780 |
| The Monogatari Corp. | | 735,288 | 15,455,546 |
| TIS, Inc. | | 952,836 | 26,164,614 |
| Tocalo Co. Ltd. | | 1,515,849 | 14,235,652 |
| Toyo Suisan Kaisha Ltd. | | 105,000 | 4,687,930 |
| Tsuruha Holdings, Inc. | | 133,635 | 8,752,523 |
| USS Co. Ltd. | | 1,868,300 | 31,394,899 |
| Vector, Inc. | | 200,000 | 1,891,340 |
| YAKUODO Holdings Co. Ltd. | | 740,300 | 13,532,113 |
| Yamato Holdings Co. Ltd. | | 215,000 | 3,693,181 |
| Zuken, Inc. | | 98,600 | 2,503,392 |
TOTAL JAPAN | | | 1,141,078,923 |
| Kenya - 0.0% | | | |
| Safaricom Ltd. | | 10,459,846 | 1,269,025 |
| Korea (South) - 0.6% | | | |
| BGF Retail Co. Ltd. | | 110,318 | 15,396,945 |
| Hansol Chemical Co. Ltd. | | 18,660 | 3,111,515 |
| Soulbrain Co. Ltd. | | 20,000 | 3,292,229 |
TOTAL KOREA (SOUTH) | | | 21,800,689 |
| Luxembourg - 0.1% | | | |
| Novem Group SA | | 255,000 | 2,764,887 |
| Mexico - 0.1% | | | |
| Bolsa Mexicana de Valores S.A.B. de CV | | 1,173,400 | 2,594,213 |
| Netherlands - 4.9% | | | |
| Aalberts Industries NV | | 2,235,235 | 102,904,367 |
| BE Semiconductor Industries NV (b) | | 284,000 | 25,454,507 |
| IMCD NV | | 310,129 | 46,543,782 |
| TKH Group NV (bearer) (depositary receipt) | | 87,800 | 4,239,446 |
| Van Lanschot Kempen NV (Bearer) | | 305,761 | 9,282,092 |
TOTAL NETHERLANDS | | | 188,424,194 |
| Norway - 2.6% | | | |
| Europris ASA (c) | | 1,314,800 | 9,407,247 |
| Kongsberg Gruppen ASA | | 1,266,008 | 56,760,419 |
| Medistim ASA | | 433,545 | 10,699,240 |
| Selvaag Bolig ASA | | 840,200 | 2,869,770 |
| Sparebanken Midt-Norge | | 721,800 | 9,333,168 |
| TGS ASA | | 310,000 | 4,851,999 |
| Volue A/S (a) | | 3,597,000 | 6,075,415 |
TOTAL NORWAY | | | 99,997,258 |
| Philippines - 0.0% | | | |
| Robinsons Land Corp. | | 5,000,000 | 1,302,282 |
| Singapore - 0.1% | | | |
| Boustead Singapore Ltd. | | 9,000,000 | 5,433,905 |
| South Africa - 0.4% | | | |
| Clicks Group Ltd. | | 926,731 | 13,543,926 |
| Spain - 0.9% | | | |
| Cie Automotive SA | | 248,200 | 7,471,790 |
| Compania de Distribucion Integral Logista Holdings SA | | 457,000 | 12,417,994 |
| Fluidra SA | | 759,020 | 12,988,735 |
| Grupo Catalana Occidente SA | | 40,000 | 1,291,427 |
TOTAL SPAIN | | | 34,169,946 |
| Sweden - 11.3% | | | |
| AAK AB | | 246,700 | 4,965,249 |
| Addlife AB | | 1,775,624 | 20,985,332 |
| AddTech AB (B Shares) | | 6,461,065 | 129,157,666 |
| Alligo AB (B Shares) | | 650,000 | 7,251,062 |
| Arjo AB | | 370,000 | 1,636,579 |
| Autoliv, Inc. (b) | | 433,900 | 37,232,959 |
| Bergman & Beving AB (B Shares) | | 725,105 | 10,181,825 |
| Betsson AB (B Shares) | | 590,000 | 6,368,862 |
| BHG Group AB (a)(b) | | 1,203,200 | 1,365,693 |
| Dometic Group AB (b)(c) | | 391,200 | 2,795,417 |
| Hemnet Group AB (b) | | 2,020,100 | 33,093,627 |
| HEXPOL AB (B Shares) | | 375,500 | 4,419,564 |
| INVISIO AB | | 1,223,434 | 25,112,784 |
| JM AB (B Shares) | | 125,000 | 2,002,672 |
| John Mattson Fastighetsforetag (a) | | 1,057,353 | 7,299,876 |
| Lagercrantz Group AB (B Shares) | | 10,360,623 | 133,156,844 |
| MIPS AB | | 36,600 | 1,972,215 |
| Teqnion AB | | 431,829 | 7,520,652 |
TOTAL SWEDEN | | | 436,518,878 |
| Switzerland - 1.5% | | | |
| Kardex AG | | 14,990 | 3,395,956 |
| Tecan Group AG | | 111,285 | 48,281,393 |
| VZ Holding AG | | 81,662 | 7,582,867 |
TOTAL SWITZERLAND | | | 59,260,216 |
| Taiwan - 0.5% | | | |
| Addcn Technology Co. Ltd. | | 2,058,764 | 13,610,459 |
| International Games Systems Co. Ltd. | | 248,000 | 4,328,155 |
TOTAL TAIWAN | | | 17,938,614 |
| United Kingdom - 14.7% | | | |
| Allfunds Group PLC | | 350,000 | 2,312,062 |
| Alliance Pharma PLC | | 2,244,435 | 1,796,782 |
| B&M European Value Retail SA | | 1,921,031 | 11,581,185 |
| Baltic Classifieds Group PLC | | 3,487,200 | 7,117,243 |
| Beazley PLC | | 850,000 | 6,361,354 |
| Bodycote PLC | | 5,348,808 | 46,416,200 |
| Clarkson PLC | | 778,734 | 30,338,893 |
| Close Brothers Group PLC | | 1,429 | 16,307 |
| DCC PLC (United Kingdom) | | 94,000 | 5,840,570 |
| Dechra Pharmaceuticals PLC | | 780,413 | 36,583,245 |
| Deliveroo PLC Class A (a)(c) | | 2,000,000 | 2,749,769 |
| Direct Line Insurance Group PLC | | 2,250,000 | 4,853,726 |
| Domino's Pizza UK & IRL PLC | | 1,209,100 | 4,470,476 |
| Dowlais Group PLC | | 2,500,000 | 4,166,126 |
| DP Poland PLC (a) | | 32,210,430 | 3,825,403 |
| Dr. Martens Ltd. | | 1,150,000 | 2,400,581 |
| Endava PLC ADR (a) | | 53,000 | 3,051,210 |
| Games Workshop Group PLC | | 26,000 | 3,241,410 |
| Genuit Group PLC | | 900,000 | 3,398,880 |
| Grainger Trust PLC | | 2,156,700 | 7,009,179 |
| H&T Group PLC | | 580,000 | 3,331,142 |
| Harbour Energy PLC | | 875,800 | 2,721,936 |
| Hill & Smith Holdings PLC | | 385,514 | 6,666,647 |
| Howden Joinery Group PLC | | 3,987,682 | 34,308,862 |
| InterContinental Hotel Group PLC ADR | | 205,000 | 14,202,400 |
| J.D. Wetherspoon PLC (a) | | 633,500 | 5,676,558 |
| Jet2 PLC | | 130,000 | 2,003,008 |
| John Wood Group PLC (a) | | 1,550,000 | 4,390,707 |
| Lancashire Holdings Ltd. | | 1,561,924 | 12,023,056 |
| Londonmetric Properity PLC | | 1,000,000 | 2,420,501 |
| LSL Property Services PLC | | 694,900 | 2,366,685 |
| Mears Group PLC | | 1,234,708 | 3,437,058 |
| Mitie Group PLC | | 2,200,000 | 2,543,662 |
| On The Beach Group PLC (a)(c) | | 2,387,000 | 3,959,818 |
| Petershill Partners PLC (c) | | 1,600,000 | 3,354,014 |
| Pets At Home Group PLC | | 2,101,500 | 10,183,928 |
| Rightmove PLC | | 5,469,570 | 39,469,831 |
| S4 Capital PLC (a) | | 2,136,800 | 3,926,089 |
| Sabre Insurance Group PLC (c) | | 5,661,270 | 8,993,109 |
| Softcat PLC | | 280,945 | 4,720,648 |
| Spectris PLC | | 2,802,228 | 132,380,705 |
| Spirax-Sarco Engineering PLC | | 387,897 | 54,062,592 |
| Synthomer PLC | | 5,181,700 | 7,788,473 |
| Tate & Lyle PLC | | 929,800 | 9,523,488 |
| Ten Entertainment Group PLC | | 887,600 | 3,000,672 |
| Vistry Group PLC | | 300,000 | 2,950,221 |
TOTAL UNITED KINGDOM | | | 567,936,411 |
| United States of America - 3.2% | | | |
| Morningstar, Inc. | | 231,100 | 41,207,441 |
| NOV, Inc. | | 1,056,900 | 17,703,075 |
| PriceSmart, Inc. | | 310,551 | 22,881,398 |
| Ramaco Resources, Inc. (b) | | 220,000 | 1,788,600 |
| ResMed, Inc. | | 166,300 | 40,071,648 |
TOTAL UNITED STATES OF AMERICA | | | 123,652,162 |
| TOTAL COMMON STOCKS (Cost $2,808,419,559) | | | 3,688,793,815 |
| | | | |
| Money Market Funds - 4.4% |
| | | Shares | Value ($) |
| Fidelity Cash Central Fund 4.88% (e) | | 149,509,468 | 149,539,370 |
| Fidelity Securities Lending Cash Central Fund 4.88% (e)(f) | | 21,759,748 | 21,761,924 |
| TOTAL MONEY MARKET FUNDS (Cost $171,300,334) | | | 171,301,294 |
| | | | |
| TOTAL INVESTMENT IN SECURITIES - 100.0% (Cost $2,979,719,893) | 3,860,095,109 |
NET OTHER ASSETS (LIABILITIES) - 0.0% | 754,489 |
| NET ASSETS - 100.0% | 3,860,849,598 |
| | |
Legend
| (b) | Security or a portion of the security is on loan at period end. |
| (c) | Security exempt from registration under Rule 144A of the Securities Act of 1933. These securities may be resold in transactions exempt from registration, normally to qualified institutional buyers. At the end of the period, the value of these securities amounted to $84,781,024 or 2.2% of net assets. |
| (e) | Affiliated fund that is generally available only to investment companies and other accounts managed by Fidelity Investments. The rate quoted is the annualized seven-day yield of the fund at period end. A complete unaudited listing of the fund's holdings as of its most recent quarter end is available upon request. In addition, each Fidelity Central Fund's financial statements are available on the SEC's website or upon request. |
| (f) | Investment made with cash collateral received from securities on loan. |
Affiliated Central Funds
Fiscal year to date information regarding the Fund's investments in Fidelity Central Funds, including the ownership percentage, is presented below.
| Affiliate | Value, beginning of period ($) | Purchases ($) | Sales Proceeds ($) | Dividend Income ($) | Realized Gain (loss) ($) | Change in Unrealized appreciation (depreciation) ($) | Value, end of period ($) | % ownership, end of period |
| Fidelity Cash Central Fund 4.88% | 121,291,715 | 533,255,039 | 505,007,384 | 2,764,022 | - | - | 149,539,370 | 0.4% |
| Fidelity Securities Lending Cash Central Fund 4.88% | 18,451,075 | 105,756,678 | 102,445,829 | 53,777 | - | - | 21,761,924 | 0.1% |
| Total | 139,742,790 | 639,011,717 | 607,453,213 | 2,817,799 | - | - | 171,301,294 | |
| | | | | | | | | |
Amounts in the dividend income column in the above table include any capital gain distributions from underlying funds, which are presented in the corresponding line item in the Statement of Operations, if applicable.
Amounts in the dividend income column for Fidelity Securities Lending Cash Central Fund represents the income earned on investing cash collateral, less rebates paid to borrowers and any lending agent fees associated with the loan, plus any premium payments received for lending certain types of securities.
Amounts included in the purchases and sales proceeds columns may include in-kind transactions, if applicable.
Other Affiliated Issuers
An affiliated company is a company in which the Fund has ownership of at least 5% of the voting securities. Fiscal year to date transactions with companies which are or were affiliates are presented in the table below. Certain corporate actions, such as mergers, are excluded from the amounts in this table if applicable. A dash in the Value end of period ($) column means either the issuer is no longer held at period end, or the issuer is held at period end but is no longer an affiliate.
| Affiliate | Value, beginning of period ($) | Purchases ($) | Sales Proceeds ($) | Dividend Income ($) | Realized Gain (loss) ($) | Change in Unrealized appreciation (depreciation) ($) | Value, end of period ($) |
| Broadleaf Co. Ltd. | 21,927,817 | 815,563 | - | 40,486 | - | (3,081,458) | 19,661,922 |
| Curves Holdings Co. Ltd. | 29,217,035 | 2,258,897 | - | 169,668 | - | (66,844) | 31,409,088 |
| Digital Hearts Holdings Co. Ltd. | 18,366,423 | - | 69,148 | 94,778 | (17,568) | (3,867,520) | 14,412,187 |
| Goldcrest Co. Ltd. | 20,638,219 | 1,026,768 | 1,611,736 | 497,326 | (1,404,296) | 4,287,858 | - |
| Koshidaka Holdings Co. Ltd. | 26,779,211 | 9,714,010 | 2,853,047 | 133,716 | 95,100 | 4,341,721 | 38,076,995 |
| NS Tool Co. Ltd. | 10,526,821 | 630,552 | - | 121,631 | - | 797,622 | 11,954,995 |
| Total | 127,455,526 | 14,445,790 | 4,533,931 | 1,057,605 | (1,326,764) | 2,411,379 | 115,515,187 |
Amounts included in the purchases and sales proceeds columns may include in-kind transactions, if applicable.
Investment Valuation
The following is a summary of the inputs used, as of April 30, 2023, involving the Fund's assets and liabilities carried at fair value. The inputs or methodology used for valuing securities may not be an indication of the risk associated with investing in those securities. For more information on valuation inputs, and their aggregation into the levels used below, please refer to the Investment Valuation section in the accompanying Notes to Financial Statements.
| Valuation Inputs at Reporting Date: |
| Description | Total ($) | Level 1 ($) | Level 2 ($) | Level 3 ($) |
Investments in Securities: | | | | |
|
| Equities: | | | | |
Communication Services | 265,552,185 | 194,664,094 | 70,888,091 | - |
Consumer Discretionary | 396,270,726 | 201,074,288 | 195,196,438 | - |
Consumer Staples | 210,627,892 | 86,800,082 | 123,827,810 | - |
Energy | 79,376,855 | 58,740,446 | 20,636,409 | - |
Financials | 241,309,161 | 194,013,768 | 47,295,393 | - |
Health Care | 330,124,864 | 257,605,008 | 72,519,856 | - |
Industrials | 1,199,751,052 | 928,825,726 | 270,925,326 | - |
Information Technology | 692,676,327 | 374,071,148 | 318,605,179 | - |
Materials | 160,719,949 | 46,277,793 | 114,442,156 | - |
Real Estate | 105,260,292 | 55,582,572 | 49,677,720 | - |
Utilities | 7,124,512 | - | 7,124,512 | - |
|
| Money Market Funds | 171,301,294 | 171,301,294 | - | - |
| Total Investments in Securities: | 3,860,095,109 | 2,568,956,219 | 1,291,138,890 | - |
Fidelity® Series International Small Cap Fund
| Statement of Assets and Liabilities |
| | | | April 30, 2023 (Unaudited) |
| | | | | |
| Assets | | | | |
| Investment in securities, at value (including securities loaned of $20,568,857) - See accompanying schedule: | | | | |
Unaffiliated issuers (cost $2,695,569,756) | $ | 3,573,278,628 | | |
Fidelity Central Funds (cost $171,300,334) | | 171,301,294 | | |
Other affiliated issuers (cost $112,849,803) | | 115,515,187 | | |
| | | | | |
| | | | | |
| Total Investment in Securities (cost $2,979,719,893) | | | $ | 3,860,095,109 |
| Cash | | | | 359,579 |
| Foreign currency held at value (cost $341,013) | | | | 339,995 |
| Receivable for investments sold | | | | 8,407,584 |
| Receivable for fund shares sold | | | | 9,346,598 |
| Dividends receivable | | | | 15,408,188 |
| Reclaims receivable | | | | 4,302,417 |
| Distributions receivable from Fidelity Central Funds | | | | 621,243 |
| Other receivables | | | | 8,815 |
Total assets | | | | 3,898,889,528 |
| Liabilities | | | | |
| Payable for investments purchased | | | | |
Regular delivery | $ | 7,425,436 | | |
Delayed delivery | | 135,368 | | |
| Payable for fund shares redeemed | | 7,580,155 | | |
| Other payables and accrued expenses | | 1,137,047 | | |
| Collateral on securities loaned | | 21,761,924 | | |
| Total Liabilities | | | | 38,039,930 |
| Net Assets | | | $ | 3,860,849,598 |
| Net Assets consist of: | | | | |
| Paid in capital | | | $ | 2,952,485,307 |
| Total accumulated earnings (loss) | | | | 908,364,291 |
| Net Assets | | | $ | 3,860,849,598 |
Net Asset Value , offering price and redemption price per share ($3,860,849,598 ÷ 237,308,429 shares) | | | $ | 16.27 |
| Statement of Operations |
| | | | Six months ended April 30, 2023 (Unaudited) |
| Investment Income | | | | |
| Dividends (including $1,057,605 earned from affiliated issuers) | | | $ | 31,092,354 |
| Income from Fidelity Central Funds (including $53,777 from security lending) | | | | 2,817,799 |
| Income before foreign taxes withheld | | | $ | 33,910,153 |
| Less foreign taxes withheld | | | | (5,441,102) |
| Total Income | | | | 28,469,051 |
| Expenses | | | | |
| Custodian fees and expenses | $ | 150,095 | | |
| Independent trustees' fees and expenses | | 11,515 | | |
| Total Expenses | | | | 161,610 |
| Net Investment income (loss) | | | | 28,307,441 |
| Realized and Unrealized Gain (Loss) | | | | |
| Net realized gain (loss) on: | | | | |
| Investment Securities: | | | | |
| Unaffiliated issuers | | 24,369,342 | | |
| Affiliated issuers | | (1,326,764) | | |
| Foreign currency transactions | | 401,762 | | |
| Total net realized gain (loss) | | | | 23,444,340 |
| Change in net unrealized appreciation (depreciation) on: | | | | |
| Investment Securities: | | | | |
| Unaffiliated issuers (net of decrease in deferred foreign taxes of $375,061) | | 571,503,787 | | |
| Affiliated issuers | | 2,411,379 | | |
| Assets and liabilities in foreign currencies | | 525,072 | | |
| Total change in net unrealized appreciation (depreciation) | | | | 574,440,238 |
| Net gain (loss) | | | | 597,884,578 |
| Net increase (decrease) in net assets resulting from operations | | | $ | 626,192,019 |
| Statement of Changes in Net Assets |
| |
| | Six months ended April 30, 2023 (Unaudited) | | Year ended October 31, 2022 |
| Increase (Decrease) in Net Assets | | | | |
| Operations | | | | |
| Net investment income (loss) | $ | 28,307,441 | $ | 78,778,239 |
| Net realized gain (loss) | | 23,444,340 | | 170,598,372 |
| Change in net unrealized appreciation (depreciation) | | 574,440,238 | | (1,772,210,175) |
| Net increase (decrease) in net assets resulting from operations | | 626,192,019 | | (1,522,833,564) |
| Distributions to shareholders | | (211,666,578) | | (562,935,286) |
| Share transactions | | | | |
| Proceeds from sales of shares | | 234,574,964 | | 318,375,461 |
| Reinvestment of distributions | | 211,666,578 | | 562,935,286 |
| Cost of shares redeemed | | (246,175,710) | | (397,219,829) |
Net increase (decrease) in net assets resulting from share transactions | | 200,065,832 | | 484,090,918 |
| Total increase (decrease) in net assets | | 614,591,273 | | (1,601,677,932) |
| | | | | |
| Net Assets | | | | |
| Beginning of period | | 3,246,258,325 | | 4,847,936,257 |
| End of period | $ | 3,860,849,598 | $ | 3,246,258,325 |
| | | | | |
| Other Information | | | | |
| Shares | | | | |
| Sold | | 14,923,236 | | 18,537,989 |
| Issued in reinvestment of distributions | | 14,026,944 | | 27,025,218 |
| Redeemed | | (15,787,882) | | (22,410,759) |
| Net increase (decrease) | | 13,162,298 | | 23,152,448 |
| | | | | |
Financial Highlights
| Fidelity® Series International Small Cap Fund |
| |
| | Six months ended (Unaudited) April 30, 2023 | | Years ended October 31, 2022 | | 2021 | | 2020 | | 2019 | | 2018 |
Selected Per-Share Data | | | | | | | | | | | | |
| Net asset value, beginning of period | $ | 14.48 | $ | 24.12 | $ | 17.55 | $ | 16.71 | $ | 16.43 | $ | 18.17 |
| Income from Investment Operations | | | | | | | | | | | | |
Net investment income (loss) A,B | | .12 | | .35 | | .29 | | .22 | | .36 | | .38 |
| Net realized and unrealized gain (loss) | | 2.62 | | (7.16) | | 6.45 | | 1.36 | | 1.47 | | (.99) |
| Total from investment operations | | 2.74 | | (6.81) | | 6.74 | | 1.58 | | 1.83 | | (.61) |
| Distributions from net investment income | | (.21) | | (.47) | | (.17) | | (.36) | | (.37) | | (.29) |
| Distributions from net realized gain | | (.73) | | (2.35) | | - | | (.38) | | (1.18) | | (.85) |
| Total distributions | | (.95) C | | (2.83) C | | (.17) | | (.74) | | (1.55) | | (1.13) C |
| Net asset value, end of period | $ | 16.27 | $ | 14.48 | $ | 24.12 | $ | 17.55 | $ | 16.71 | $ | 16.43 |
Total Return D,E | | 19.41% | | (31.82)% | | 38.60% | | 9.60% | | 12.77% | | (3.72)% |
Ratios to Average Net Assets B,F,G | | | | | | | | | | | | |
| Expenses before reductions | | .01% H | | .01% | | .01% | | .01% | | .01% | | .01% |
| Expenses net of fee waivers, if any | | .01% H | | .01% | | .01% | | .01% | | .01% | | .01% |
| Expenses net of all reductions | | .01% H | | .01% | | .01% | | .01% | | .01% | | .01% |
| Net investment income (loss) | | 1.55% H | | 2.03% | | 1.34% | | 1.36% | | 2.28% | | 2.08% |
| Supplemental Data | | | | | | | | | | | | |
| Net assets, end of period (000 omitted) | $ | 3,860,850 | $ | 3,246,258 | $ | 4,847,936 | $ | 3,653,041 | $ | 3,498,064 | $ | 3,225,502 |
Portfolio turnover rate I | | 28% H | | 25% | | 32% | | 24% J | | 23% | | 14% |
A Calculated based on average shares outstanding during the period.
B Net investment income (loss) is affected by the timing of the declaration of dividends by any underlying mutual funds or exchange-traded funds (ETFs). Net investment income (loss) of any mutual funds or ETFs is not included in the Fund's net investment income (loss) ratio.
C Total distributions per share do not sum due to rounding.
D Total returns for periods of less than one year are not annualized.
E Total returns would have been lower if certain expenses had not been reduced during the applicable periods shown.
F Fees and expenses of any underlying mutual funds or exchange-traded funds (ETFs) are not included in the Fund's expense ratio. The Fund indirectly bears its proportionate share of these expenses. For additional expense information related to investments in Fidelity Central Funds, please refer to the "Investments in Fidelity Central Funds" note found in the Notes to Financial Statements section of the most recent Annual or Semi-Annual report.
G Expense ratios reflect operating expenses of the class. Expenses before reductions do not reflect amounts reimbursed, waived, or reduced through arrangements with the investment adviser, brokerage services, or other offset arrangements, if applicable, and do not represent the amount paid by the class during periods when reimbursements, waivers or reductions occur.
H Annualized.
I Amount does not include the portfolio activity of any underlying mutual funds or exchange-traded funds (ETFs).
J Portfolio turnover rate excludes securities received or delivered in-kind.
Top Holdings (% of Fund's net assets) |
| |
| Shell PLC ADR (Netherlands, Oil, Gas & Consumable Fuels) | 4.0 | |
| BHP Group Ltd. (Australia, Metals & Mining) | 3.6 | |
| TotalEnergies SE (France, Oil, Gas & Consumable Fuels) | 3.6 | |
| Toyota Motor Corp. (Japan, Automobiles) | 2.5 | |
| Siemens AG (Germany, Industrial Conglomerates) | 2.4 | |
| Sanofi SA (United States of America, Pharmaceuticals) | 2.1 | |
| Hitachi Ltd. (Japan, Industrial Conglomerates) | 2.1 | |
| BAE Systems PLC (United Kingdom, Aerospace & Defense) | 2.0 | |
| UBS Group AG (Switzerland, Capital Markets) | 2.0 | |
| AXA SA (France, Insurance) | 2.0 | |
| | 26.3 | |
| |
| Market Sectors (% of Fund's net assets) |
| |
| Financials | 32.6 | |
| Industrials | 15.7 | |
| Materials | 13.7 | |
| Energy | 11.9 | |
| Consumer Discretionary | 8.0 | |
| Health Care | 5.2 | |
| Information Technology | 5.1 | |
| Communication Services | 1.9 | |
| Utilities | 1.5 | |
| Real Estate | 0.9 | |
| Consumer Staples | 0.6 | |
| |
Asset Allocation (% of Fund's net assets) |
|
|
Geographic Diversification (% of Fund's net assets) |
|
* Includes Short-Term investments and Net Other Assets (Liabilities). Percentages are adjusted for the effect of derivatives, if applicable. |
| |
Fidelity® Series International Value Fund
| Common Stocks - 96.3% |
| | | Shares | Value ($) |
| Australia - 8.5% | | | |
| BHP Group Ltd. | | 16,782,287 | 498,056,315 |
| Flutter Entertainment PLC (a) | | 211,500 | 42,302,488 |
| Glencore PLC | | 43,478,127 | 256,635,441 |
| Macquarie Group Ltd. | | 1,451,038 | 177,014,777 |
| National Australia Bank Ltd. | | 3,598,957 | 69,284,097 |
| Woodside Energy Group Ltd. | | 5,529,722 | 125,471,226 |
TOTAL AUSTRALIA | | | 1,168,764,344 |
| Belgium - 1.5% | | | |
| KBC Group NV | | 1,928,487 | 137,657,488 |
| UCB SA | | 654,100 | 60,845,950 |
TOTAL BELGIUM | | | 198,503,438 |
| Canada - 0.5% | | | |
| Nutrien Ltd. | | 1,041,700 | 72,265,847 |
| Denmark - 0.7% | | | |
| DSV A/S | | 480,300 | 90,209,350 |
| Finland - 1.2% | | | |
| Sampo Oyj (A Shares) | | 3,183,787 | 161,237,556 |
| France - 12.6% | | | |
| Air Liquide SA | | 990,099 | 178,109,139 |
| Airbus Group NV (b) | | 540,387 | 75,672,890 |
| ALTEN | | 461,608 | 78,331,462 |
| AXA SA | | 8,205,179 | 267,818,445 |
| BNP Paribas SA | | 3,633,770 | 234,790,196 |
| Capgemini SA | | 562,248 | 102,162,323 |
| Euroapi SASU | | 146,370 | 1,757,201 |
| Teleperformance | | 258,331 | 51,465,611 |
| TotalEnergies SE (b) | | 7,715,792 | 493,038,670 |
| VINCI SA (b) | | 1,092,829 | 135,109,924 |
| Vivendi SA (b) | | 9,101,855 | 99,831,991 |
TOTAL FRANCE | | | 1,718,087,852 |
| Germany - 11.0% | | | |
| Bayer AG | | 2,493,482 | 164,560,511 |
| Covestro AG (b)(c) | | 1,701,300 | 74,636,785 |
| Deutsche Post AG | | 3,061,607 | 147,262,064 |
| Hannover Reuck SE | | 800,863 | 170,846,374 |
| Muenchener Rueckversicherungs-Gesellschaft AG in Muenchen | | 450,117 | 168,882,525 |
| Rheinmetall AG | | 714,641 | 209,071,404 |
| RWE AG | | 3,845,300 | 180,290,140 |
| Siemens AG | | 2,027,407 | 334,182,036 |
| Vonovia SE (b) | | 2,449,641 | 53,129,077 |
TOTAL GERMANY | | | 1,502,860,916 |
| Hong Kong - 2.1% | | | |
| AIA Group Ltd. | | 10,428,247 | 113,533,115 |
| Prudential PLC | | 11,254,800 | 172,210,149 |
TOTAL HONG KONG | | | 285,743,264 |
| India - 0.6% | | | |
| Reliance Industries Ltd. GDR (c) | | 1,486,500 | 88,595,400 |
| Indonesia - 0.6% | | | |
| PT Bank Rakyat Indonesia (Persero) Tbk | | 232,294,937 | 80,949,964 |
| Ireland - 2.9% | | | |
| Bank of Ireland Group PLC | | 11,508,200 | 118,819,898 |
| CRH PLC | | 3,755,008 | 181,194,064 |
| Ryanair Holdings PLC sponsored ADR (a) | | 1,035,700 | 99,002,563 |
TOTAL IRELAND | | | 399,016,525 |
| Italy - 2.4% | | | |
| Enel SpA | | 3,707,650 | 25,331,092 |
| Eni SpA | | 12,248,200 | 185,038,599 |
| Mediobanca SpA | | 10,576,055 | 113,391,036 |
TOTAL ITALY | | | 323,760,727 |
| Japan - 22.0% | | | |
| Daiichi Sankyo Kabushiki Kaisha | | 390,200 | 13,389,563 |
| DENSO Corp. | | 2,750,596 | 166,035,903 |
| Fast Retailing Co. Ltd. | | 474,900 | 112,457,097 |
| FUJIFILM Holdings Corp. | | 1,862,549 | 97,076,003 |
| Fujitsu Ltd. | | 713,300 | 95,066,707 |
| Hitachi Ltd. | | 5,218,600 | 288,664,960 |
| Hoya Corp. | | 575,509 | 60,345,020 |
| Ibiden Co. Ltd. | | 1,275,444 | 50,183,919 |
| INPEX Corp. | | 5,952,200 | 65,135,241 |
| Itochu Corp. | | 5,344,553 | 177,304,797 |
| Minebea Mitsumi, Inc. | | 4,650,051 | 86,112,617 |
| Mitsubishi Estate Co. Ltd. | | 5,263,433 | 64,868,146 |
| Mitsubishi UFJ Financial Group, Inc. | | 35,092,224 | 219,660,997 |
| NOF Corp. | | 318,100 | 14,534,453 |
| ORIX Corp. | | 8,438,433 | 143,559,038 |
| Renesas Electronics Corp. (a) | | 9,089,000 | 118,451,929 |
| Shin-Etsu Chemical Co. Ltd. | | 6,451,690 | 184,104,276 |
| SoftBank Group Corp. | | 2,004,537 | 75,174,990 |
| Sony Group Corp. | | 1,139,145 | 103,062,717 |
| Sumitomo Mitsui Financial Group, Inc. | | 4,787,563 | 195,685,117 |
| Suzuki Motor Corp. | | 3,467,182 | 120,895,356 |
| TIS, Inc. | | 1,932,556 | 53,067,455 |
| Tokio Marine Holdings, Inc. | | 8,185,145 | 164,578,987 |
| Toyota Motor Corp. | | 24,569,520 | 337,340,396 |
TOTAL JAPAN | | | 3,006,755,684 |
| Korea (South) - 0.7% | | | |
| Samsung Electronics Co. Ltd. | | 2,022,715 | 99,565,289 |
| Luxembourg - 0.7% | | | |
| ArcelorMittal SA (Netherlands) | | 3,328,845 | 94,305,676 |
| Netherlands - 4.3% | | | |
| Shell PLC ADR | | 8,883,648 | 550,608,507 |
| Universal Music Group NV | | 1,890,387 | 41,264,575 |
TOTAL NETHERLANDS | | | 591,873,082 |
| Singapore - 1.3% | | | |
| United Overseas Bank Ltd. (b) | | 8,052,389 | 171,016,311 |
| South Africa - 1.1% | | | |
| Anglo American PLC (United Kingdom) | | 4,718,076 | 145,383,643 |
| Thungela Resources Ltd. (b) | | 748,374 | 6,950,436 |
TOTAL SOUTH AFRICA | | | 152,334,079 |
| Spain - 2.3% | | | |
| Banco Santander SA (Spain) (b) | | 67,611,844 | 237,399,000 |
| Cellnex Telecom SA (c) | | 1,315,638 | 55,393,607 |
| Unicaja Banco SA (b)(c) | | 27,183,131 | 27,541,868 |
TOTAL SPAIN | | | 320,334,475 |
| Sweden - 2.1% | | | |
| Alleima AB | | 595,300 | 3,052,240 |
| Investor AB (B Shares) | | 9,443,760 | 202,411,343 |
| Sandvik AB (b) | | 3,803,700 | 77,334,723 |
TOTAL SWEDEN | | | 282,798,306 |
| Switzerland - 4.5% | | | |
| Swiss Life Holding AG (b) | | 162,130 | 106,436,073 |
| UBS Group AG (b) | | 13,450,991 | 272,382,568 |
| Zurich Insurance Group Ltd. | | 491,640 | 237,500,869 |
TOTAL SWITZERLAND | | | 616,319,510 |
| United Kingdom - 8.7% | | | |
| AstraZeneca PLC (United Kingdom) | | 837,499 | 123,248,853 |
| BAE Systems PLC | | 21,729,391 | 276,832,092 |
| Barratt Developments PLC | | 15,580,300 | 97,902,710 |
| Beazley PLC | | 9,303,117 | 69,624,028 |
| BP PLC | | 17,450,198 | 117,073,296 |
| Imperial Brands PLC | | 3,240,767 | 80,222,268 |
| Lloyds Banking Group PLC | | 227,255,116 | 138,062,440 |
| NatWest Group PLC | | 25,046,000 | 82,504,009 |
| Rolls-Royce Holdings PLC (a) | | 10,909,700 | 20,899,379 |
| Standard Chartered PLC (United Kingdom) | | 24,026,922 | 189,750,623 |
TOTAL UNITED KINGDOM | | | 1,196,119,698 |
| United States of America - 4.0% | | | |
| Ferguson PLC | | 565,455 | 79,555,652 |
| Linde PLC | | 481,874 | 178,028,349 |
| Sanofi SA | | 2,706,506 | 291,675,429 |
TOTAL UNITED STATES OF AMERICA | | | 549,259,430 |
| TOTAL COMMON STOCKS (Cost $10,322,191,622) | | | 13,170,676,723 |
| | | | |
| Nonconvertible Preferred Stocks - 0.8% |
| | | Shares | Value ($) |
| Germany - 0.8% | | | |
Porsche Automobil Holding SE (Germany) (Cost $126,732,977) | | 1,951,077 | 108,669,573 |
| | | | |
| Money Market Funds - 8.2% |
| | | Shares | Value ($) |
| Fidelity Cash Central Fund 4.88% (d) | | 240,315,815 | 240,363,878 |
| Fidelity Securities Lending Cash Central Fund 4.88% (d)(e) | | 875,920,140 | 876,007,732 |
| TOTAL MONEY MARKET FUNDS (Cost $1,116,371,610) | | | 1,116,371,610 |
| | | | |
| TOTAL INVESTMENT IN SECURITIES - 105.3% (Cost $11,565,296,209) | 14,395,717,906 |
NET OTHER ASSETS (LIABILITIES) - (5.3)% | (726,875,328) |
| NET ASSETS - 100.0% | 13,668,842,578 |
| | |
Legend
| (b) | Security or a portion of the security is on loan at period end. |
| (c) | Security exempt from registration under Rule 144A of the Securities Act of 1933. These securities may be resold in transactions exempt from registration, normally to qualified institutional buyers. At the end of the period, the value of these securities amounted to $246,167,660 or 1.8% of net assets. |
| (d) | Affiliated fund that is generally available only to investment companies and other accounts managed by Fidelity Investments. The rate quoted is the annualized seven-day yield of the fund at period end. A complete unaudited listing of the fund's holdings as of its most recent quarter end is available upon request. In addition, each Fidelity Central Fund's financial statements are available on the SEC's website or upon request. |
| (e) | Investment made with cash collateral received from securities on loan. |
Affiliated Central Funds
Fiscal year to date information regarding the Fund's investments in Fidelity Central Funds, including the ownership percentage, is presented below.
| Affiliate | Value, beginning of period ($) | Purchases ($) | Sales Proceeds ($) | Dividend Income ($) | Realized Gain (loss) ($) | Change in Unrealized appreciation (depreciation) ($) | Value, end of period ($) | % ownership, end of period |
| Fidelity Cash Central Fund 4.88% | 391,984,399 | 1,838,209,444 | 1,989,829,965 | 6,448,452 | - | - | 240,363,878 | 0.6% |
| Fidelity Securities Lending Cash Central Fund 4.88% | 513,502,912 | 2,484,295,849 | 2,121,791,029 | 2,479,280 | - | - | 876,007,732 | 2.7% |
| Total | 905,487,311 | 4,322,505,293 | 4,111,620,994 | 8,927,732 | - | - | 1,116,371,610 | |
| | | | | | | | | |
Amounts in the dividend income column in the above table include any capital gain distributions from underlying funds, which are presented in the corresponding line item in the Statement of Operations, if applicable.
Amounts in the dividend income column for Fidelity Securities Lending Cash Central Fund represents the income earned on investing cash collateral, less rebates paid to borrowers and any lending agent fees associated with the loan, plus any premium payments received for lending certain types of securities.
Amounts included in the purchases and sales proceeds columns may include in-kind transactions, if applicable.
Investment Valuation
The following is a summary of the inputs used, as of April 30, 2023, involving the Fund's assets and liabilities carried at fair value. The inputs or methodology used for valuing securities may not be an indication of the risk associated with investing in those securities. For more information on valuation inputs, and their aggregation into the levels used below, please refer to the Investment Valuation section in the accompanying Notes to Financial Statements.
| Valuation Inputs at Reporting Date: |
| Description | Total ($) | Level 1 ($) | Level 2 ($) | Level 3 ($) |
Investments in Securities: | | | | |
|
| Equities: | | | | |
Communication Services | 271,665,163 | 141,096,566 | 130,568,597 | - |
Consumer Discretionary | 1,088,666,240 | 140,205,198 | 948,461,042 | - |
Consumer Staples | 80,222,268 | - | 80,222,268 | - |
Energy | 1,631,911,375 | 646,154,343 | 985,757,032 | - |
Financials | 4,444,548,891 | 2,213,881,249 | 2,230,667,642 | - |
Health Care | 715,822,527 | 62,603,151 | 653,219,376 | - |
Industrials | 2,148,680,062 | 741,749,227 | 1,406,930,835 | - |
Information Technology | 693,905,087 | 180,493,785 | 513,411,302 | - |
Materials | 1,880,306,228 | 347,652,112 | 1,532,654,116 | - |
Real Estate | 117,997,223 | - | 117,997,223 | - |
Utilities | 205,621,232 | 180,290,140 | 25,331,092 | - |
|
| Money Market Funds | 1,116,371,610 | 1,116,371,610 | - | - |
| Total Investments in Securities: | 14,395,717,906 | 5,770,497,381 | 8,625,220,525 | - |
Fidelity® Series International Value Fund
| Statement of Assets and Liabilities |
| | | | April 30, 2023 (Unaudited) |
| | | | | |
| Assets | | | | |
| Investment in securities, at value (including securities loaned of $816,198,366) - See accompanying schedule: | | | | |
Unaffiliated issuers (cost $10,448,924,599) | $ | 13,279,346,296 | | |
Fidelity Central Funds (cost $1,116,371,610) | | 1,116,371,610 | | |
| | | | | |
| | | | | |
| Total Investment in Securities (cost $11,565,296,209) | | | $ | 14,395,717,906 |
| Foreign currency held at value (cost $1,904,406) | | | | 1,905,007 |
| Receivable for investments sold | | | | 103,769,594 |
| Receivable for fund shares sold | | | | 3,908,489 |
| Dividends receivable | | | | 75,733,338 |
| Reclaims receivable | | | | 37,329,724 |
| Interest receivable | | | | 134 |
| Distributions receivable from Fidelity Central Funds | | | | 2,340,522 |
Total assets | | | | 14,620,704,714 |
| Liabilities | | | | |
| Payable for investments purchased | $ | 25,661,099 | | |
| Payable for fund shares redeemed | | 50,011,096 | | |
| Other payables and accrued expenses | | 182,209 | | |
| Collateral on securities loaned | | 876,007,732 | | |
| Total Liabilities | | | | 951,862,136 |
| Net Assets | | | $ | 13,668,842,578 |
| Net Assets consist of: | | | | |
| Paid in capital | | | $ | 11,829,645,534 |
| Total accumulated earnings (loss) | | | | 1,839,197,044 |
| Net Assets | | | $ | 13,668,842,578 |
Net Asset Value , offering price and redemption price per share ($13,668,842,578 ÷ 1,259,440,258 shares) | | | $ | 10.85 |
| Statement of Operations |
| | | | Six months ended April 30, 2023 (Unaudited) |
| Investment Income | | | | |
| Dividends | | | $ | 216,245,007 |
| Interest | | | | 10,820 |
| Income from Fidelity Central Funds (including $2,479,280 from security lending) | | | | 8,927,732 |
| Income before foreign taxes withheld | | | $ | 225,183,559 |
| Less foreign taxes withheld | | | | (19,353,852) |
| Total Income | | | | 205,829,707 |
| Expenses | | | | |
| Custodian fees and expenses | $ | 379,569 | | |
| Independent trustees' fees and expenses | | 42,005 | | |
| Interest | | 42,483 | | |
| Total expenses before reductions | | 464,057 | | |
| Expense reductions | | (10) | | |
| Total expenses after reductions | | | | 464,047 |
| Net Investment income (loss) | | | | 205,365,660 |
| Realized and Unrealized Gain (Loss) | | | | |
| Net realized gain (loss) on: | | | | |
| Investment Securities: | | | | |
| Unaffiliated issuers | | 19,899,214 | | |
| Redemptions in-kind | | 65,332,292 | | |
| Foreign currency transactions | | 1,293,562 | | |
| Total net realized gain (loss) | | | | 86,525,068 |
| Change in net unrealized appreciation (depreciation) on: | | | | |
| Investment Securities: | | | | |
| Unaffiliated issuers | | 2,251,769,975 | | |
| Assets and liabilities in foreign currencies | | 4,222,780 | | |
| Total change in net unrealized appreciation (depreciation) | | | | 2,255,992,755 |
| Net gain (loss) | | | | 2,342,517,823 |
| Net increase (decrease) in net assets resulting from operations | | | $ | 2,547,883,483 |
| Statement of Changes in Net Assets |
| |
| | Six months ended April 30, 2023 (Unaudited) | | Year ended October 31, 2022 |
| Increase (Decrease) in Net Assets | | | | |
| Operations | | | | |
| Net investment income (loss) | $ | 205,365,660 | $ | 571,708,614 |
| Net realized gain (loss) | | 86,525,068 | | (148,251,550) |
| Change in net unrealized appreciation (depreciation) | | 2,255,992,755 | | (2,774,795,334) |
| Net increase (decrease) in net assets resulting from operations | | 2,547,883,483 | | (2,351,338,270) |
| Distributions to shareholders | | (425,784,758) | | (770,910,384) |
| Share transactions | | | | |
| Proceeds from sales of shares | | 1,023,228,674 | | 2,577,499,861 |
| Reinvestment of distributions | | 425,784,758 | | 770,910,384 |
| Cost of shares redeemed | | (2,270,247,837) | | (3,188,665,043) |
Net increase (decrease) in net assets resulting from share transactions | | (821,234,405) | | 159,745,202 |
| Total increase (decrease) in net assets | | 1,300,864,320 | | (2,962,503,452) |
| | | | | |
| Net Assets | | | | |
| Beginning of period | | 12,367,978,258 | | 15,330,481,710 |
| End of period | $ | 13,668,842,578 | $ | 12,367,978,258 |
| | | | | |
| Other Information | | | | |
| Shares | | | | |
| Sold | | 98,026,247 | | 248,540,462 |
| Issued in reinvestment of distributions | | 42,493,489 | | 70,596,189 |
| Redeemed | | (220,287,615) | | (298,779,921) |
| Net increase (decrease) | | (79,767,879) | | 20,356,730 |
| | | | | |
Financial Highlights
| Fidelity® Series International Value Fund |
| |
| | Six months ended (Unaudited) April 30, 2023 | | Years ended October 31, 2022 | | 2021 | | 2020 | | 2019 | | 2018 |
Selected Per-Share Data | | | | | | | | | | | | |
| Net asset value, beginning of period | $ | 9.24 | $ | 11.62 | $ | 8.25 | $ | 9.82 | $ | 9.68 | $ | 10.87 |
| Income from Investment Operations | | | | | | | | | | | | |
Net investment income (loss) A,B | | .16 | | .42 | | .43 C | | .26 | | .39 | | .38 |
| Net realized and unrealized gain (loss) | | 1.78 | | (2.24) | | 3.23 | | (1.43) | | .10 | | (1.23) |
| Total from investment operations | | 1.94 | | (1.82) | | 3.66 | | (1.17) | | .49 | | (.85) |
| Distributions from net investment income | | (.33) | | (.56) | | (.29) | | (.36) | | (.35) | | (.31) |
| Distributions from net realized gain | | - | | - | | - | | (.04) | | - | | (.03) |
| Total distributions | | (.33) | | (.56) | | (.29) | | (.40) | | (.35) | | (.34) |
| Net asset value, end of period | $ | 10.85 | $ | 9.24 | $ | 11.62 | $ | 8.25 | $ | 9.82 | $ | 9.68 |
Total Return D,E | | 21.34% | | (16.40)% | | 44.95% | | (12.55)% | | 5.48% | | (8.11)% |
Ratios to Average Net Assets B,F,G | | | | | | | | | | | | |
| Expenses before reductions | | .01% H | | .01% | | .01% | | .01% | | .01% | | .01% |
| Expenses net of fee waivers, if any | | .01% H | | .01% | | .01% | | .01% | | .01% | | .01% |
| Expenses net of all reductions | | .01% H | | .01% | | .01% | | .01% | | .01% | | -% I |
| Net investment income (loss) | | 3.11% H | | 4.09% | | 3.97% C | | 2.92% | | 4.23% | | 3.60% |
| Supplemental Data | | | | | | | | | | | | |
| Net assets, end of period (000 omitted) | $ | 13,668,843 | $ | 12,367,978 | $ | 15,330,482 | $ | 11,605,710 | $ | 15,992,396 | $ | 14,030,676 |
Portfolio turnover rate J | | 35% H,K | | 31% K | | 34% | | 36% K | | 41% | | 43% |
A Calculated based on average shares outstanding during the period.
B Net investment income (loss) is affected by the timing of the declaration of dividends by any underlying mutual funds or exchange-traded funds (ETFs). Net investment income (loss) of any mutual funds or ETFs is not included in the Fund's net investment income (loss) ratio.
C Net investment income per share reflects one or more large, non-recurring dividend(s) which amounted to $.11 per share. Excluding such non-recurring dividend(s), the ratio of net investment income (loss) to average net assets would have been 3.00%.
D Total returns for periods of less than one year are not annualized.
E Total returns would have been lower if certain expenses had not been reduced during the applicable periods shown.
F Fees and expenses of any underlying mutual funds or exchange-traded funds (ETFs) are not included in the Fund's expense ratio. The Fund indirectly bears its proportionate share of these expenses. For additional expense information related to investments in Fidelity Central Funds, please refer to the "Investments in Fidelity Central Funds" note found in the Notes to Financial Statements section of the most recent Annual or Semi-Annual report.
G Expense ratios reflect operating expenses of the class. Expenses before reductions do not reflect amounts reimbursed, waived, or reduced through arrangements with the investment adviser, brokerage services, or other offset arrangements, if applicable, and do not represent the amount paid by the class during periods when reimbursements, waivers or reductions occur.
H Annualized.
I Amount represents less than .005%.
J Amount does not include the portfolio activity of any underlying mutual funds or exchange-traded funds (ETFs).
K Portfolio turnover rate excludes securities received or delivered in-kind.
For the period ended April 30, 2023
1. Organization.
Fidelity Series Emerging Markets Fund, Fidelity Series Emerging Markets Opportunities Fund, Fidelity Series International Growth Fund, Fidelity Series International Small Cap Fund and Fidelity Series International Value Fund (the Funds) are funds of Fidelity Investment Trust (the Trust). The Trust is registered under the Investment Company Act of 1940, as amended (the 1940 Act), as an open-end management investment company organized as a Massachusetts business trust. Each Fund is authorized to issue an unlimited number of shares. Shares are offered only to certain other Fidelity funds, Fidelity managed 529 plans, and Fidelity managed collective investment trusts. Investments in emerging markets, if applicable, can be subject to social, economic, regulatory, and political uncertainties and can be extremely volatile.
2. Investments in Fidelity Central Funds.
Funds may invest in Fidelity Central Funds, which are open-end investment companies generally available only to other investment companies and accounts managed by the investment adviser and its affiliates. The Schedule of Investments lists any Fidelity Central Funds held as an investment as of period end, but does not include the underlying holdings of each Fidelity Central Fund. An investing fund indirectly bears its proportionate share of the expenses of the underlying Fidelity Central Funds.
Based on its investment objective, each Fidelity Central Fund may invest or participate in various investment vehicles or strategies that are similar to those of the investing fund. These strategies are consistent with the investment objectives of the investing fund and may involve certain economic risks which may cause a decline in value of each of the Fidelity Central Funds and thus a decline in the value of the investing fund.
| Fidelity Central Fund | Investment Manager | Investment Objective | Investment Practices | Expense Ratio A |
| Fidelity Money Market Central Funds | Fidelity Management & Research Company LLC (FMR) | Each fund seeks to obtain a high level of current income consistent with the preservation of capital and liquidity. | Short-term Investments | Less than .005% |
A Expenses expressed as a percentage of average net assets and are as of each underlying Central Fund's most recent annual or semi-annual shareholder report.
A complete unaudited list of holdings for each Fidelity Central Fund is available upon request or at the Securities and Exchange Commission website at www.sec.gov. In addition, the financial statements of the Fidelity Central Funds which contain the significant accounting policies (including investment valuation policies) of those funds, and are not covered by the Report of Independent Registered Public Accounting Firm, are available on the Securities and Exchange Commission website or upon request.
3. Significant Accounting Policies.
Each Fund is an investment company and applies the accounting and reporting guidance of the Financial Accounting Standards Board (FASB) Accounting Standards Codification Topic 946 Financial Services - Investment Companies . The financial statements have been prepared in conformity with accounting principles generally accepted in the United States of America (GAAP), which require management to make certain estimates and assumptions at the date of the financial statements. Actual results could differ from those estimates. Subsequent events, if any, through the date that the financial statements were issued have been evaluated in the preparation of the financial statements. Each Fund's Schedule of Investments lists any underlying mutual funds or exchange-traded funds (ETFs) but does not include the underlying holdings of these funds. The following summarizes the significant accounting policies of each Fund:
Investment Valuation. Investments are valued as of 4:00 p.m. Eastern time on the last calendar day of the period. The Board of Trustees (the Board) has designated each Fund's investment adviser as the valuation designee responsible for the fair valuation function and performing fair value determinations as needed. The investment adviser has established a Fair Value Committee (the Committee) to carry out the day-to-day fair valuation responsibilities and has adopted policies and procedures to govern the fair valuation process and the activities of the Committee. In accordance with these fair valuation policies and procedures, which have been approved by the Board, each Fund attempts to obtain prices from one or more third party pricing services or brokers to value its investments. When current market prices, quotations or currency exchange rates are not readily available or reliable, investments will be fair valued in good faith by the Committee, in accordance with the policies and procedures. Factors used in determining fair value vary by investment type and may include market or investment specific events, transaction data, estimated cash flows, and market observations of comparable investments. The frequency that the fair valuation procedures are used cannot be predicted and they may be utilized to a significant extent. The Committee manages each Fund's fair valuation practices and maintains the fair valuation policies and procedures. Each Fund's investment adviser reports to the Board information regarding the fair valuation process and related material matters.
Each Fund categorizes the inputs to valuation techniques used to value its investments into a disclosure hierarchy consisting of three levels as shown below:
Level 1 - unadjusted quoted prices in active markets for identical investments
Level 2 - other significant observable inputs (including quoted prices for similar investments, interest rates, prepayment speeds, etc.)
Level 3 - unobservable inputs (including the Fund's own assumptions based on the best information available)
Valuation techniques used to value each Fund's investments by major category are as follows:
Equity securities, including restricted securities, for which market quotations are readily available, are valued at the last reported sale price or official closing price as reported by a third party pricing service on the primary market or exchange on which they are traded and are categorized as Level 1 in the hierarchy. In the event there were no sales during the day or closing prices are not available, securities are valued at the last quoted bid price or may be valued using the last available price and are generally categorized as Level 2 in the hierarchy. For foreign equity securities, when market or security specific events arise, comparisons to the valuation of American Depositary Receipts (ADRs), futures contracts, ETFs and certain indexes as well as quoted prices for similar securities may be used and would be categorized as Level 2 in the hierarchy. For equity securities, including restricted securities, where observable inputs are limited, assumptions about market activity and risk are used and these securities may be categorized as Level 3 in the hierarchy.
Debt securities, including restricted securities, are valued based on evaluated prices received from third party pricing services or from brokers who make markets in such securities. U.S. government and government agency obligations are valued by pricing services who utilize matrix pricing which considers yield or price of bonds of comparable quality, coupon, maturity and type or by broker-supplied prices. When independent prices are unavailable or unreliable, debt securities may be valued utilizing pricing methodologies which consider similar factors that would be used by third party pricing services. Debt securities are generally categorized as Level 2 in the hierarchy but may be Level 3 depending on the circumstances.
Futures contracts are valued at the settlement price established each day by the board of trade or exchange on which they are traded and are categorized as Level 1 in the hierarchy. Investments in open-end mutual funds, including the Fidelity Central Funds, are valued at their closing net asset value (NAV) each business day and are categorized as Level 1 in the hierarchy.
The following provides information on Level 3 securities held by the Fund that were valued at period end based on unobservable inputs. These amounts exclude valuations provided by a broker.
| Asset Type | Fair Value | Valuation Technique(s) | Unobservable Input | Amount or Range/Weighted Average | Impact to Valuation from an Increase in Input A |
| Equities | $365,419,050 | Market comparable | Enterprise value/Revenue multiple (EV/R) | 2.1 - 20.0/7.7 | Increase |
| | | Market approach | Transaction price | $9.50 $55.00/$19.69 | Increase |
| | | | Discount rate | 20.0% - 50.0%/21.3% | Decrease |
| | | Book value | Book value multiple | 1.4 | Increase |
| | | Indicative market price | Discount rate | 20.0% | Decrease |
| | | | Bid price | $11.20 | Increase |
| | | Black scholes | Discount rate | 4.2% | Increase |
| | | | Volatility | 95.0% | Increase |
| | | | Term | 2.0 | Increase |
A Represents the directional change in the fair value of the Level 3 investments that could have resulted from an increase in the corresponding input as of period end. A decrease to the unobservable input would have had the opposite effect. Significant changes in these inputs may have resulted in a significantly higher or lower fair value measurement at period end.
Changes in valuation techniques may result in transfers in or out of an assigned level within the disclosure hierarchy. The aggregate value of investments by input level as of April 30, 2023, as well as a roll forward of Level 3 investments, is included at the end of each Fund's Schedule of Investments.
Foreign Currency. Certain Funds may use foreign currency contracts to facilitate transactions in foreign-denominated securities. Gains and losses from these transactions may arise from changes in the value of the foreign currency or if the counterparties do not perform under the contracts' terms.
Foreign-denominated assets, including investment securities, and liabilities are translated into U.S. dollars at the exchange rates at period end. Purchases and sales of investment securities, income and dividends received, and expenses denominated in foreign currencies are translated into U.S. dollars at the exchange rate in effect on the transaction date.
The effects of exchange rate fluctuations on investments are included with the net realized and unrealized gain (loss) on investment securities. Other foreign currency transactions resulting in realized and unrealized gain (loss) are disclosed separately.
Investment Transactions and Income. For financial reporting purposes, the Funds' investment holdings and NAV include trades executed through the end of the last business day of the period. The NAV per share for processing shareholder transactions is calculated as of the close of business of the New York Stock Exchange (NYSE), normally 4:00 p.m. Eastern time and includes trades executed through the end of the prior business day. Gains and losses on securities sold are determined on the basis of identified cost and for certain Funds include proceeds received from litigation. Commissions paid to certain brokers with whom the investment adviser, or its affiliates, places trades on behalf of a fund include an amount in addition to trade execution, which may be rebated back to a fund. Any such rebates are included in net realized gain (loss) on investments in the Statement of Operations. Dividend income is recorded on the ex-dividend date, except for certain dividends from foreign securities where the ex-dividend date may have passed, which are recorded as soon as the Funds are informed of the ex-dividend date. Non-cash dividends included in dividend income, if any, are recorded at the fair market value of the securities received. Income and capital gain distributions from Fidelity Central Funds, if any, are recorded on the ex-dividend date. Certain distributions received by the Funds represent a return of capital or capital gain. The Funds determine the components of these distributions subsequent to the ex-dividend date, based upon receipt of tax filings or other correspondence relating to the underlying investment. These distributions are recorded as a reduction of cost of investments and/or as a realized gain. Interest income is accrued as earned and includes coupon interest and amortization of premium and accretion of discount on debt securities as applicable. Investment income is recorded net of foreign taxes withheld where recovery of such taxes is uncertain. Funds may file withholding tax reclaims in certain jurisdictions to recover a portion of amounts previously withheld. Any withholding tax reclaims income is included in the Statement of Operations in foreign tax reclaims or foreign taxes withheld, as applicable. Any receivables for withholding tax reclaims are included in the Statement of Assets and Liabilities in dividends receivable or reclaims receivable, as applicable. Fidelity Series Emerging Markets Fund did not recognize dividend income during the period on certain Russian securities due to restrictions imposed by the Russian government on these dividend payments. There is uncertainty regarding the timeline for these restrictions to be lifted and the collectability of these and future dividend payments on Russian securities.
Expenses. Expenses directly attributable to a fund are charged to that fund. Expenses attributable to more than one fund are allocated among the respective funds on the basis of relative net assets or other appropriate methods. Expenses included in the accompanying financial statements reflect the expenses of that fund and do not include any expenses associated with any underlying mutual funds or exchange-traded funds. Although not included in a fund's expenses, a fund indirectly bears its proportionate share of these expenses through the net asset value of each underlying mutual fund or exchange-traded fund. Expense estimates are accrued in the period to which they relate and adjustments are made when actual amounts are known.
Income Tax Information and Distributions to Shareholders. Each year, each Fund intends to qualify as a regulated investment company under Subchapter M of the Internal Revenue Code, including distributing substantially all of its taxable income and realized gains. As a result, no provision for U.S. Federal income taxes is required. Each Fund files a U.S. federal tax return, in addition to state and local tax returns as required. Each Fund's federal income tax returns are subject to examination by the Internal Revenue Service (IRS) for a period of three fiscal years after they are filed. State and local tax returns may be subject to examination for an additional fiscal year depending on the jurisdiction. Foreign taxes are provided for based on each Fund's understanding of the tax rules and rates that exist in the foreign markets in which it invests. Fidelity Series Emerging Markets Fund, Fidelity Series Emerging Markets Opportunities Fund, Fidelity Series International Growth Fund and Fidelity Series International Small Cap Fund are subject to a tax imposed on capital gains by certain countries in which they invest. An estimated deferred tax liability for net unrealized appreciation on the applicable securities is included in Deferred taxes or Other payables and accrued expenses on each applicable Fund's Statement of Assets & Liabilities.
Distributions are declared and recorded on the ex-dividend date. Income and capital gain distributions are determined in accordance with income tax regulations, which may differ from GAAP.
Capital accounts within the financial statements are adjusted for permanent book-tax differences. These adjustments have no impact on net assets or the results of operations. Capital accounts are not adjusted for temporary book-tax differences which will reverse in a subsequent period.
Book-tax differences are primarily due to futures contracts, foreign currency transactions, certain foreign taxes, passive foreign investment companies (PFIC), redemptions in-kind, capital loss carryforwards and losses deferred due to wash sales.
As of period end, the cost and unrealized appreciation (depreciation) in securities, and derivatives if applicable, for federal income tax purposes were as follows for each Fund:
| | Tax cost | Gross unrealized appreciation | Gross unrealized depreciation | Net unrealized appreciation (depreciation) |
Fidelity Series Emerging Markets Fund | $3,426,744,496 | $420,347,892 | $(274,751,820) | $145,596,072 |
Fidelity Series Emerging Markets Opportunities Fund | 21,407,947,165 | 5,288,943,927 | (3,690,187,221) | 1,598,756,706 |
Fidelity Series International Growth Fund | 9,443,327,748 | 5,389,048,965 | (337,283,473) | 5,051,765,492 |
Fidelity Series International Small Cap Fund | 2,994,311,987 | 1,161,165,605 | (295,382,483) | 865,783,122 |
| Fidelity Series International Value Fund | 11,759,837,055 | 2,993,686,699 | (357,805,848) | 2,635,880,851 |
Capital loss carryforwards are only available to offset future capital gains of the Funds to the extent provided by regulations and may be limited. The capital loss carryforward information presented below, including any applicable limitation, is estimated as of prior fiscal period end and is subject to adjustment.
| | Short-term | Long-term | Total capital loss carryforward |
Fidelity Series Emerging Markets Fund | $ (259,568,802) | $(37,857,752) | $ (297,426,554) |
Fidelity Series Emerging Markets Opportunities Fund | (834,830,045) | - | (834,830,045) |
| | | | |
| | | | |
| Fidelity Series International Value Fund | (1,007,762,687) | - | (1,007,762,687) |
| | | | |
| | | | |
Delayed Delivery Transactions and When-Issued Securities. During the period, certain Funds transacted in securities on a delayed delivery or when-issued basis. Payment and delivery may take place after the customary settlement period for that security. The price of the underlying securities and the date when the securities will be delivered and paid for are fixed at the time the transaction is negotiated. Securities purchased on a delayed delivery or when-issued basis are identified as such in the Schedule of Investments. Compensation for interest forgone in the purchase of a delayed delivery or when-issued debt security may be received. With respect to purchase commitments, each applicable Fund identifies securities as segregated in its records with a value at least equal to the amount of the commitment. Payables and receivables associated with the purchases and sales of delayed delivery securities having the same coupon, settlement date and broker are offset. Delayed delivery or when-issued securities that have been purchased from and sold to different brokers are reflected as both payables and receivables in the Statement of Assets and Liabilities under the caption "Delayed delivery", as applicable. Losses may arise due to changes in the value of the underlying securities or if the counterparty does not perform under the contract's terms, or if the issuer does not issue the securities due to political, economic, or other factors.
Restricted Securities (including Private Placements). Funds may invest in securities that are subject to legal or contractual restrictions on resale. These securities generally may be resold in transactions exempt from registration or to the public if the securities are registered. Disposal of these securities may involve time-consuming negotiations and expense, and prompt sale at an acceptable price may be difficult. Information regarding restricted securities held at period end is included at the end of the Schedule of Investments, if applicable.
New Accounting Pronouncement. In June 2022, the Financial Accounting Standards Board (FASB) issued Accounting Standards Update (ASU) 2022-03 Fair Value Measurement (Topic 820): Fair Value Measurement of Equity Securities Subject to Contractual Sale Restrictions. The amendments in this ASU clarify that a contractual restriction on the sale of an equity security is not considered part of the unit of account of the equity security and, therefore, is not considered in measuring fair value. They also clarify that an entity cannot, as a separate unit of account, recognize and measure a contractual sale restriction. They also require additional disclosures for equity securities subject to contractual sale restrictions. ASU 2022-03 will be effective for fiscal years, including interim periods within those fiscal years, beginning after December 15, 2023, and allows for early adoption. ASU 2022-03 will only be applicable to an equity security in which the contractual arrangement that restricts its sale is executed or modified on or after the adoption date. Management is currently evaluating the potential impact of ASU 2022-03 to the financial statements.
4. Derivative Instruments.
Risk Exposures and the Use of Derivative Instruments. Each Fund's investment objectives allow for various types of derivative instruments, including futures contracts. Derivatives are investments whose value is primarily derived from underlying assets, indices or reference rates and may be transacted on an exchange or over-the-counter (OTC). Derivatives may involve a future commitment to buy or sell a specified asset based on specified terms, to exchange future cash flows at periodic intervals based on a notional principal amount, or for one party to make one or more payments upon the occurrence of specified events in exchange for periodic payments from the other party.
Derivatives were used to increase returns and to manage exposure to certain risks as defined below. The success of any strategy involving derivatives depends on analysis of numerous economic factors, and if the strategies for investment do not work as intended, the objectives may not be achieved.
Derivatives were used to increase or decrease exposure to the following risk(s):
| | |
| Equity Risk | Equity risk relates to the fluctuations in the value of financial instruments as a result of changes in market prices (other than those arising from interest rate risk or foreign exchange risk), whether caused by factors specific to an individual investment, its issuer, or all factors affecting all instruments traded in a market or market segment. |
Funds are also exposed to additional risks from investing in derivatives, such as liquidity risk and counterparty credit risk. Liquidity risk is the risk that a fund will be unable to close out the derivative in the open market in a timely manner. Counterparty credit risk is the risk that the counterparty will not be able to fulfill its obligation to a fund. Counterparty credit risk related to exchange-traded contracts may be mitigated by the protection provided by the exchange on which they trade.
Investing in derivatives may involve greater risks than investing in the underlying assets directly and, to varying degrees, may involve risk of loss in excess of any initial investment and collateral received and amounts recognized in the Statement of Assets and Liabilities. In addition, there may be the risk that the change in value of the derivative contract does not correspond to the change in value of the underlying instrument.
Futures Contracts. A futures contract is an agreement between two parties to buy or sell a specified underlying instrument for a fixed price at a specified future date. Futures contracts were used to manage exposure to the stock market.
Upon entering into a futures contract, a fund is required to deposit either cash or securities (initial margin) with a clearing broker in an amount equal to a certain percentage of the face value of the contract. Futures contracts are marked-to-market daily and subsequent daily payments are made or received by a fund depending on the daily fluctuations in the value of the futures contracts and are recorded as unrealized appreciation or (depreciation). This receivable and/or payable, if any, is included in daily variation margin on futures contracts in the Statement of Assets and Liabilities. Realized gain or (loss) is recorded upon the expiration or closing of a futures contract. The net realized gain (loss) and change in net unrealized appreciation (depreciation) on futures contracts during the period is presented in the Statement of Operations.
Any open futures contracts at period end are presented in the Schedule of Investments under the caption "Futures Contracts". The notional amount at value reflects each contract's exposure to the underlying instrument or index at period end, and is representative of volume of activity during the period unless an average notional amount is presented. Any securities deposited to meet initial margin requirements are identified in the Schedule of Investments. Any cash deposited to meet initial margin requirements is presented as segregated cash with brokers for derivative instruments in the Statement of Assets and Liabilities.
5. Purchases and Sales of Investments.
Purchases and sales of securities, other than short-term securities, U.S. government securities and in-kind transactions, as applicable, are noted in the table below.
| | Purchases ($) | Sales ($) |
| Fidelity Series Emerging Markets Fund | 1,940,052,033 | 1,392,476,870 |
| Fidelity Series Emerging Markets Opportunities Fund | 4,711,780,877 | 7,226,091,491 |
| Fidelity Series International Growth Fund | 733,651,282 | 1,491,122,007 |
| Fidelity Series International Small Cap Fund | 495,925,545 | 493,430,244 |
| Fidelity Series International Value Fund | 2,250,478,692 | 3,028,041,113 |
Unaffiliated Redemptions In-Kind. Shares that were redeemed in-kind for investments, including accrued interest and cash, if any, are shown in the table below. The net realized gain or loss on investments delivered through in-kind redemptions is included in the "Net realized gain (loss) on: Redemptions in-kind" line in the accompanying Statement of Operations. The amount of the in-kind redemptions is included in share transactions in the accompanying Statement of Changes in Net Assets. There was no gain or loss for federal income tax purposes.
| | Shares | Total net realized gain or loss ($) | Total Proceeds ($) |
| Fidelity Series International Growth Fund | 14,310,643 | 105,980,569 | 214,546,284 |
| Fidelity Series International Value Fund | 20,829,707 | 65,332,292 | 212,630,931 |
6. Fees and Other Transactions with Affiliates.
Management Fee. Fidelity Management & Research Company LLC (the investment adviser) and its affiliates provide the Funds with investment management related services for which the Funds do not pay a management fee. Under the management contract, the investment adviser or an affiliate pays all ordinary operating expenses of the Funds, except custody fees, fees and expenses of the independent Trustees, and certain miscellaneous expenses such as proxy and shareholder meeting expenses.
Brokerage Commissions. A portion of portfolio transactions were placed with brokerage firms which are affiliates of the investment adviser. Brokerage commissions are included in net realized gain (loss) and change in net unrealized appreciation (depreciation) in the Statement of Operations. The commissions paid to these affiliated firms were as follows:
| | Amount |
| Fidelity Series Emerging Markets Fund | $742 |
| Fidelity Series Emerging Markets Opportunities Fund | 36,393 |
| Fidelity Series International Growth Fund | 1,952 |
| Fidelity Series International Small Cap Fund | 572 |
| Fidelity Series International Value Fund | 3,184 |
Interfund Lending Program. Pursuant to an Exemptive Order issued by the Securities and Exchange Commission (the SEC), each Fund, along with other registered investment companies having management contracts with Fidelity Management & Research Company LLC (FMR), or other affiliated entities of FMR, may participate in an interfund lending program. This program provides an alternative credit facility allowing each Fund to borrow from, or lend money to, other participating affiliated funds. At period end, there were no interfund loans outstanding. Activity in this program during the period for which loans were outstanding was as follows:
| | Borrower or Lender | Average Loan Balance | Weighted Average Interest Rate | Interest Expense |
Fidelity Series Emerging Markets Opportunities Fund | Borrower | $ 405,211,000 | 4.57% | $51,384 |
Fidelity Series International Growth Fund | Borrower | $86,931,000 | 4.21% | $20,320 |
| Fidelity Series International Value Fund | Borrower | $ 60,929,833 | 4.18% | $42,483 |
Interfund Trades. Funds may purchase from or sell securities to other Fidelity Funds under procedures adopted by the Board. The procedures have been designed to ensure these interfund trades are executed in accordance with Rule 17a-7 of the 1940 Act. Any interfund trades are included within the respective purchases and sales amounts shown in the Purchases and Sales of Investments note. Interfund trades during the period are noted in the table below.
| | Purchases ($) | Sales ($) | Realized Gain (Loss) ($) |
| Fidelity Series Emerging Markets Fund | 13,771,431 | 18,425,558 | (4,622,653) |
| Fidelity Series Emerging Markets Opportunities Fund | 34,891,551 | 140,922,684 | 11,938,259 |
| Fidelity Series International Growth Fund | 19,076,727 | 47,661,249 | (19,547,106) |
| Fidelity Series International Small Cap Fund | 18,676,170 | 15,288,139 | 748,566 |
| Fidelity Series International Value Fund | 74,470,645 | 65,739,885 | 8,812,417 |
Prior Fiscal Year Affiliated Redemptions In-Kind. Shares that were redeemed in-kind for investments, including accrued interest and cash, if any, are shown in the table below; along with realized gain or loss on investments delivered through in-kind redemptions. The amount of the in-kind redemptions is included in share transactions in the accompanying Statement of Changes in Net Assets. There was no gain or loss for federal income tax purposes.
| | Shares | Total net realized gain or loss ($) | Total Proceeds ($) |
| Fidelity Series International Growth Fund | 3,489,700 | 20,221,102 | 47,323,914 |
| Fidelity Series International Value Fund | 5,171,078 | 9,807,643 | 46,949,274 |
7. Committed Line of Credit.
Certain Funds participate with other funds managed by the investment adviser or an affiliate in a $4.25 billion credit facility (the "line of credit") to be utilized for temporary or emergency purposes to fund shareholder redemptions or for other short-term liquidity purposes. The commitment fees on the pro-rata portion of the line of credit are borne by the investment adviser. During the period, there were no borrowings on this line of credit.
8. Security Lending.
Funds lend portfolio securities from time to time in order to earn additional income. Lending agents are used, including National Financial Services (NFS), an affiliate of the investment adviser. Pursuant to a securities lending agreement, NFS will receive a fee, which is capped at 9.9% of a fund's daily lending revenue, for its services as lending agent. A fund may lend securities to certain qualified borrowers, including NFS. On the settlement date of the loan, a fund receives collateral (in the form of U.S. Treasury obligations, letters of credit and/or cash) against the loaned securities and maintains collateral in an amount not less than 100% of the market value of the loaned securities during the period of the loan. The market value of the loaned securities is determined at the close of business of a fund and any additional required collateral is delivered to a fund on the next business day. A fund or borrower may terminate the loan at any time, and if the borrower defaults on its obligation to return the securities loaned because of insolvency or other reasons, a fund may apply collateral received from the borrower against the obligation. A fund may experience delays and costs in recovering the securities loaned. Any cash collateral received is invested in the Fidelity Securities Lending Cash Central Fund. Any loaned securities are identified as such in the Schedule of Investments, and the value of loaned securities and cash collateral at period end, as applicable, are presented in the Statement of Assets and Liabilities. Security lending income represents the income earned on investing cash collateral, less rebates paid to borrowers and any lending agent fees associated with the loan, plus any premium payments received for lending certain types of securities. Security lending income is presented in the Statement of Operations as a component of income from Fidelity Central Funds. Affiliated security lending activity, if any, was as follows:
| | Total Security Lending Fees Paid to NFS | Security Lending Income From Securities Loaned to NFS | Value of Securities Loaned to NFS at Period End |
| Fidelity Series Emerging Markets Fund | $19,488 | $- | $- |
| Fidelity Series Emerging Markets Opportunities Fund | $311,671 | $- | $- |
| Fidelity Series International Growth Fund | $70,635 | $- | $- |
| Fidelity Series International Small Cap Fund | $5,550 | $1 | $- |
| Fidelity Series International Value Fund | $274,463 | $2,429 | $- |
9. Expense Reductions.
The investment adviser contractually agreed to reimburse each Fund to the extent annual operating expenses exceeded certain levels of average net assets as noted in the table below. This reimbursement will remain in place through February 28, 2026. Some expenses, for example the compensation of the independent Trustees, and certain other expenses such as interest expense, are excluded from this reimbursement.
The following Funds were in reimbursement during the period:
| | Expense Limitations | Reimbursement |
| Fidelity Series Emerging Markets Fund | .013% | $ 216,645 |
| Fidelity Series Emerging Markets Opportunities Fund | .013% | $ 1,789,394 |
Through arrangements with each applicable Fund's custodian, credits realized as a result of certain uninvested cash balances were used to reduce each applicable Fund's expenses. All of the applicable expense reductions are noted in the table below.
| | Custodian credits |
Fidelity Series Emerging Markets Fund | $ 828 |
Fidelity Series Emerging Markets Opportunities Fund | 1,945 |
Fidelity Series International Growth Fund | 445 |
Fidelity Series International Value Fund | 10 |
10. Other.
A fund's organizational documents provide former and current trustees and officers with a limited indemnification against liabilities arising in connection with the performance of their duties to the fund. In the normal course of business, a fund may also enter into contracts that provide general indemnifications. A fund's maximum exposure under these arrangements is unknown as this would be dependent on future claims that may be made against a fund. The risk of material loss from such claims is considered remote.
At the end of the period, mutual funds and accounts managed by the investment adviser or its affiliates were the owners of record of all of the outstanding shares of the Fund.
11. Risk and Uncertainties.
Many factors affect a fund's performance. Developments that disrupt global economies and financial markets, such as pandemics, epidemics, outbreaks of infectious diseases, war, terrorism, and environmental disasters, may significantly affect a fund's investment performance. The effects of these developments to a fund will be impacted by the types of securities in which a fund invests, the financial condition, industry, economic sector, and geographic location of an issuer, and a fund's level of investment in the securities of that issuer. Significant concentrations in security types, issuers, industries, sectors, and geographic locations may magnify the factors that affect a fund's performance.
As a shareholder, you incur two types of costs: (1) transaction costs, which may include sales charges (loads) on purchase payments or redemption proceeds, as applicable and (2) ongoing costs, which generally include management fees, distribution and/or service (12b-1) fees and other Fund expenses. This Example is intended to help you understand your ongoing costs (in dollars) of investing in a fund and to compare these costs with the ongoing costs of investing in other mutual funds.
| The Example is based on an investment of $1,000 invested at the beginning of the period and held for the entire period (November 1, 2022 to April 30, 2023). |
Actual Expenses
The first line of the accompanying table provides information about actual account values and actual expenses. You may use the information in this line, together with the amount you invested, to estimate the expenses that you paid over the period. Simply divide your account value by $1,000.00 (for example, an $8,600 account value divided by $1,000.00 = 8.6), then multiply the result by the number in the first line for a class/Fund under the heading entitled "Expenses Paid During Period" to estimate the expenses you paid on your account during this period. If any fund is a shareholder of any underlying mutual funds or exchange-traded funds (ETFs) (the Underlying Funds), such fund indirectly bears its proportional share of the expenses of the Underlying Funds in addition to the direct expenses incurred presented in the table. These fees and expenses are not included in the annualized expense ratio used to calculate the expense estimate in the table below.
Hypothetical Example for Comparison Purposes
The second line of the accompanying table provides information about hypothetical account values and hypothetical expenses based on the actual expense ratio and an assumed rate of return of 5% per year before expenses, which is not the actual return. The hypothetical account values and expenses may not be used to estimate the actual ending account balance or expenses you paid for the period. You may use this information to compare the ongoing costs of investing in the Fund and other funds. To do so, compare this 5% hypothetical example with the 5% hypothetical examples that appear in the shareholder reports of the other funds. If any fund is a shareholder of any Underlying Funds, such fund indirectly bears its proportional share of the expenses of the Underlying Funds in addition to the direct expenses as presented in the table. These fees and expenses are not included in the annualized expense ratio used to calculate the expense estimate in the table below.
Please note that the expenses shown in the table are meant to highlight your ongoing costs only and do not reflect any transaction costs. Therefore, the second line of the table is useful in comparing ongoing costs only, and will not help you determine the relative total costs of owning different funds. In addition, if these transactional costs were included, your costs would have been higher.
| | | | | Annualized Expense Ratio- A | | Beginning Account Value November 1, 2022 | | Ending Account Value April 30, 2023 | | Expenses Paid During Period- C November 1, 2022 to April 30, 2023 |
| | | | | | | | | | |
| Fidelity® Series Emerging Markets Fund | | | | .01% | | | | | | |
| Actual | | | | | | $ 1,000 | | $ 1,189.20 | | $ .05 |
Hypothetical- B | | | | | | $ 1,000 | | $ 1,024.74 | | $ .05 |
| | | | | | | | | | |
| Fidelity® Series Emerging Markets Opportunities Fund | | | | .01% | | | | | | |
| Actual | | | | | | $ 1,000 | | $ 1,190.30 | | $ .05 |
Hypothetical- B | | | | | | $ 1,000 | | $ 1,024.74 | | $ .05 |
| | | | | | | | | | |
| Fidelity® Series International Growth Fund | | | | .01% | | | | | | |
| Actual | | | | | | $ 1,000 | | $ 1,207.80 | | $ .05 |
Hypothetical- B | | | | | | $ 1,000 | | $ 1,024.74 | | $ .05 |
| | | | | | | | | | |
| Fidelity® Series International Small Cap Fund | | | | .01% | | | | | | |
| Actual | | | | | | $ 1,000 | | $ 1,194.10 | | $ .05 |
Hypothetical- B | | | | | | $ 1,000 | | $ 1,024.74 | | $ .05 |
| | | | | | | | | | |
| Fidelity® Series International Value Fund | | | | .01% | | | | | | |
| Actual | | | | | | $ 1,000 | | $ 1,213.40 | | $ .05 |
Hypothetical- B | | | | | | $ 1,000 | | $ 1,024.74 | | $ .05 |
| |
A Annualized expense ratio reflects expenses net of applicable fee waivers.
B 5% return per year before expenses
C Expenses are equal to the annualized expense ratio, multiplied by the average account value over the period, multiplied by 181/ 365 (to reflect the one-half year period). The fees and expenses of any Underlying Funds are not included in each annualized expense ratio.
The Securities and Exchange Commission adopted Rule 22e-4 under the Investment Company Act of 1940 (the Liquidity Rule) to promote effective liquidity risk management throughout the open-end investment company industry, thereby reducing the risk that funds will be unable to meet their redemption obligations and mitigating dilution of the interests of fund shareholders.
The Funds have adopted and implemented a liquidity risk management program (the Program) reasonably designed to assess and manage each Fund's liquidity risk and to comply with the requirements of the Liquidity Rule. Each Fund's Board of Trustees (the Board) has designated each Fund's investment adviser as administrator of the Program. The Fidelity advisers have established a Liquidity Risk Management Committee (the LRM Committee) to manage the Program for each of the Fidelity Funds. The LRM Committee monitors the adequacy and effectiveness of implementation of the Program and on a periodic basis assesses each Fund's liquidity risk based on a variety of factors including (1) the Fund's investment strategy, (2) portfolio liquidity and cash flow projections during normal and reasonably foreseeable stressed conditions, (3) shareholder redemptions, (4) borrowings and other funding sources and (5) certain factor specific to ETFs including the effect of the Fund's prices and spreads, market participants, and basket compositions on the overall liquidity of the Fund's portfolio, as applicable.
In accordance with the Program, each of the Fund's portfolio investments is classified into one of four defined liquidity categories based on a determination of a reasonable expectation for how long it would take to convert the investment to cash (or sell or dispose of the investment) without significantly changing its market value.
- Highly liquid investments - cash or convertible to cash within three business days or less
- Moderately liquid investments - convertible to cash in three to seven calendar days
- Less liquid investments - can be sold or disposed of, but not settled, within seven calendar days
- Illiquid investments - cannot be sold or disposed of within seven calendar days
Liquidity classification determinations take into account a variety of factors including various market, trading and investment-specific considerations, as well as market depth, and generally utilize analysis from a third-party liquidity metrics service.
The Liquidity Rule places a 15% limit on a fund's illiquid investments and requires funds that do not primarily hold assets that are highly liquid investments to determine and maintain a minimum percentage of the fund's net assets to be invested in highly liquid investments (highly liquid investment minimum or HLIM). The Program includes provisions reasonably designed to comply with the 15% limit on illiquid investments and for determining, periodically reviewing and complying with the HLIM requirement as applicable.
At a recent meeting of the Fund's Board of Trustees, the LRM Committee provided a written report to the Board pertaining to the operation, adequacy, and effectiveness of the Program for the period December 1, 2021 through November 30, 2022. The report concluded that the Program is operating effectively and is reasonably designed to assess and manage the Fund's liquidity risk.
1.907946.113
GSV-S-SANN-0623
Fidelity® Sustainable International Equity Fund
Semi-Annual Report
April 30, 2023
Includes Fidelity and Fidelity Advisor share classes
Contents
To view a fund's proxy voting guidelines and proxy voting record for the 12-month period ended June 30, visit http://www.fidelity.com/proxyvotingresults or visit the Securities and Exchange Commission's (SEC) web site at http://www.sec.gov.
You may also call 1-800-544-8544 if you're an individual investing directly with Fidelity, call 1-800-835-5092 if you're a plan sponsor or participant with Fidelity as your recordkeeper or call 1-877-208-0098 on institutional accounts or if you're an advisor or invest through one to request a free copy of the proxy voting guidelines.
Standard & Poor's, S&P and S&P 500 are registered service marks of The McGraw-Hill Companies, Inc. and have been licensed for use by Fidelity Distributors Corporation.
Other third-party marks appearing herein are the property of their respective owners.
All other marks appearing herein are registered or unregistered trademarks or service marks of FMR LLC or an affiliated company. © 2023 FMR LLC. All rights reserved.
This report and the financial statements contained herein are submitted for the general information of the shareholders of the Fund. This report is not authorized for distribution to prospective investors in the Fund unless preceded or accompanied by an effective prospectus.
A fund files its complete schedule of portfolio holdings with the SEC for the first and third quarters of each fiscal year on Form N-PORT. Forms N-PORT are available on the SEC's web site at http://www.sec.gov. A fund's Forms N-PORT may be reviewed and copied at the SEC's Public Reference Room in Washington, DC. Information regarding the operation of the SEC's Public Reference Room may be obtained by calling 1-800-SEC-0330.
For a complete list of a fund's portfolio holdings, view the most recent holdings listing, semiannual report, or annual report on Fidelity's web site at http://www.fidelity.com, http://www.institutional.fidelity.com, or http://www.401k.com, as applicable.
NOT FDIC INSURED •MAY LOSE VALUE •NO BANK GUARANTEE
Neither the Fund nor Fidelity Distributors Corporation is a bank.
Top Holdings (% of Fund's net assets) |
| |
| Novo Nordisk A/S Series B (Denmark, Pharmaceuticals) | 4.4 | |
| AstraZeneca PLC (United Kingdom) (United Kingdom, Pharmaceuticals) | 3.9 | |
| Sony Group Corp. (Japan, Household Durables) | 3.7 | |
| Nestle SA (Reg. S) (United States of America, Food Products) | 3.1 | |
| ASML Holding NV (Netherlands) (Netherlands, Semiconductors & Semiconductor Equipment) | 2.9 | |
| LVMH Moet Hennessy Louis Vuitton SE (France, Textiles, Apparel & Luxury Goods) | 2.8 | |
| AIA Group Ltd. (Hong Kong, Insurance) | 2.5 | |
| Itochu Corp. (Japan, Trading Companies & Distributors) | 2.5 | |
| ORIX Corp. (Japan, Financial Services) | 2.4 | |
| Koninklijke KPN NV (Netherlands, Diversified Telecommunication Services) | 2.1 | |
| | 30.3 | |
| |
| Market Sectors (% of Fund's net assets) |
| |
| Financials | 23.0 | |
| Health Care | 14.4 | |
| Industrials | 12.0 | |
| Consumer Discretionary | 11.3 | |
| Information Technology | 10.6 | |
| Consumer Staples | 10.4 | |
| Materials | 6.2 | |
| Utilities | 4.7 | |
| Communication Services | 2.4 | |
| Energy | 1.4 | |
| Real Estate | 0.6 | |
| |
Asset Allocation (% of Fund's net assets) |
|
|
Geographic Diversification (% of Fund's net assets) |
|
* Includes Short-Term investments and Net Other Assets (Liabilities). Percentages are adjusted for the effect of derivatives, if applicable. |
| |
Showing Percentage of Net Assets
| Common Stocks - 97.0% |
| | | Shares | Value ($) |
| Australia - 1.7% | | | |
| Bapcor Ltd. | | 13,451 | 58,695 |
| EBOS Group Ltd. | | 2,369 | 65,012 |
TOTAL AUSTRALIA | | | 123,707 |
| Austria - 2.0% | | | |
| Verbund AG | | 1,003 | 89,411 |
| Wienerberger AG | | 1,975 | 59,412 |
TOTAL AUSTRIA | | | 148,823 |
| Belgium - 2.2% | | | |
| KBC Group NV | | 921 | 65,742 |
| UCB SA | | 1,006 | 93,581 |
TOTAL BELGIUM | | | 159,323 |
| China - 0.9% | | | |
| Chervon Holdings Ltd. | | 12,564 | 63,937 |
| Denmark - 5.8% | | | |
| Novo Nordisk A/S Series B | | 1,924 | 320,068 |
| ORSTED A/S (a) | | 758 | 67,973 |
| Vestas Wind Systems A/S | | 1,327 | 36,719 |
TOTAL DENMARK | | | 424,760 |
| Finland - 1.4% | | | |
| Neste OYJ | | 2,158 | 104,485 |
| France - 12.8% | | | |
| Air Liquide SA | | 418 | 75,194 |
| AXA SA | | 3,976 | 129,777 |
| BNP Paribas SA | | 2,076 | 134,137 |
| Capgemini SA | | 261 | 47,425 |
| Edenred SA | | 658 | 42,720 |
| L'Oreal SA | | 267 | 127,318 |
| LVMH Moet Hennessy Louis Vuitton SE | | 211 | 202,957 |
| Pernod Ricard SA | | 649 | 149,749 |
| Worldline SA (a)(b) | | 587 | 25,472 |
TOTAL FRANCE | | | 934,749 |
| Germany - 8.9% | | | |
| Deutsche Borse AG | | 561 | 106,988 |
| Deutsche Post AG | | 1,637 | 78,739 |
| Gerresheimer AG | | 226 | 24,579 |
| Merck KGaA | | 752 | 134,694 |
| Muenchener Rueckversicherungs-Gesellschaft AG in Muenchen | | 289 | 108,432 |
| SAP SE | | 390 | 52,773 |
| Siemens AG | | 900 | 148,349 |
TOTAL GERMANY | | | 654,554 |
| Hong Kong - 4.3% | | | |
| AIA Group Ltd. | | 16,795 | 182,848 |
| Hang Seng Bank Ltd. | | 5,273 | 78,161 |
| Prudential PLC | | 3,778 | 57,807 |
TOTAL HONG KONG | | | 318,816 |
| India - 1.4% | | | |
| HDFC Bank Ltd. sponsored ADR | | 1,430 | 99,814 |
| Ireland - 2.6% | | | |
| CRH PLC | | 2,374 | 115,213 |
| Dalata Hotel Group PLC (b) | | 15,213 | 76,356 |
TOTAL IRELAND | | | 191,569 |
| Italy - 0.5% | | | |
| Carel Industries SpA (a) | | 1,384 | 36,296 |
| Japan - 16.3% | | | |
| FUJIFILM Holdings Corp. | | 2,396 | 124,879 |
| Fujitsu Ltd. | | 561 | 74,769 |
| Hitachi Ltd. | | 2,805 | 155,158 |
| Hoya Corp. | | 1,231 | 129,077 |
| Itochu Corp. | | 5,397 | 179,045 |
| ORIX Corp. | | 10,326 | 175,671 |
| Persol Holdings Co. Ltd. | | 2,615 | 53,920 |
| Sony Group Corp. | | 2,981 | 269,702 |
| TIS, Inc. | | 1,134 | 31,139 |
TOTAL JAPAN | | | 1,193,360 |
| Kenya - 0.2% | | | |
| Safaricom Ltd. | | 143,462 | 17,405 |
| Korea (South) - 0.5% | | | |
| SK Hynix, Inc. | | 526 | 35,405 |
| Netherlands - 7.4% | | | |
| ASML Holding NV (Netherlands) | | 340 | 214,859 |
| BE Semiconductor Industries NV | | 205 | 18,374 |
| Heineken NV (Bearer) | | 552 | 63,288 |
| ING Groep NV (Certificaten Van Aandelen) | | 7,151 | 88,252 |
| Koninklijke KPN NV | | 42,831 | 156,200 |
TOTAL NETHERLANDS | | | 540,973 |
| New Zealand - 0.8% | | | |
| Contact Energy Ltd. | | 12,034 | 58,365 |
| Norway - 2.1% | | | |
| DNB Bank ASA | | 8,313 | 146,025 |
| Schibsted ASA (A Shares) | | 329 | 5,829 |
TOTAL NORWAY | | | 151,854 |
| Singapore - 0.9% | | | |
| United Overseas Bank Ltd. | | 2,955 | 62,758 |
| Spain - 1.4% | | | |
| CaixaBank SA | | 5,758 | 21,314 |
| EDP Renovaveis SA | | 683 | 15,172 |
| Iberdrola SA | | 5,192 | 67,278 |
TOTAL SPAIN | | | 103,764 |
| Sweden - 3.4% | | | |
| Boliden AB | | 3,404 | 121,554 |
| Instalco AB | | 1,724 | 9,044 |
| Investor AB (B Shares) | | 1,541 | 33,029 |
| Lagercrantz Group AB (B Shares) | | 1,680 | 21,592 |
| Nibe Industrier AB (B Shares) | | 5,634 | 62,905 |
TOTAL SWEDEN | | | 248,124 |
| Taiwan - 1.9% | | | |
| Taiwan Semiconductor Manufacturing Co. Ltd. | | 8,450 | 138,277 |
| United Kingdom - 12.9% | | | |
| AstraZeneca PLC (United Kingdom) | | 1,945 | 286,232 |
| Barratt Developments PLC | | 5,555 | 34,906 |
| Beazley PLC | | 3,197 | 23,926 |
| Big Yellow Group PLC | | 769 | 11,829 |
| Bunzl PLC | | 594 | 23,620 |
| Compass Group PLC | | 4,397 | 115,997 |
| Diageo PLC | | 2,896 | 132,104 |
| Endava PLC ADR (b) | | 263 | 15,141 |
| Grainger Trust PLC | | 10,865 | 35,311 |
| Impax Asset Management Group PLC | | 843 | 8,306 |
| National Grid PLC | | 3,455 | 49,538 |
| NatWest Group PLC | | 25,996 | 85,633 |
| Reckitt Benckiser Group PLC | | 813 | 65,698 |
| Renewi PLC (b) | | 1,152 | 8,687 |
| Smart Metering Systems PLC | | 5,149 | 51,315 |
TOTAL UNITED KINGDOM | | | 948,243 |
| United States of America - 4.7% | | | |
| Ferguson PLC | | 244 | 34,329 |
| Linde PLC | | 231 | 85,343 |
| Nestle SA (Reg. S) | | 1,783 | 228,740 |
TOTAL UNITED STATES OF AMERICA | | | 348,412 |
| TOTAL COMMON STOCKS (Cost $6,569,194) | | | 7,107,773 |
| | | | |
| Money Market Funds - 3.0% |
| | | Shares | Value ($) |
Fidelity Cash Central Fund 4.88% (c) (Cost $219,993) | | 219,949 | 219,993 |
| | | | |
| TOTAL INVESTMENT IN SECURITIES - 100.0% (Cost $6,789,187) | 7,327,766 |
NET OTHER ASSETS (LIABILITIES) - 0.0% | (3,162) |
| NET ASSETS - 100.0% | 7,324,604 |
| | |
Legend
| (a) | Security exempt from registration under Rule 144A of the Securities Act of 1933. These securities may be resold in transactions exempt from registration, normally to qualified institutional buyers. At the end of the period, the value of these securities amounted to $129,741 or 1.8% of net assets. |
| (c) | Affiliated fund that is generally available only to investment companies and other accounts managed by Fidelity Investments. The rate quoted is the annualized seven-day yield of the fund at period end. A complete unaudited listing of the fund's holdings as of its most recent quarter end is available upon request. In addition, each Fidelity Central Fund's financial statements are available on the SEC's website or upon request. |
Affiliated Central Funds
Fiscal year to date information regarding the Fund's investments in Fidelity Central Funds, including the ownership percentage, is presented below.
| Affiliate | Value, beginning of period ($) | Purchases ($) | Sales Proceeds ($) | Dividend Income ($) | Realized Gain (loss) ($) | Change in Unrealized appreciation (depreciation) ($) | Value, end of period ($) | % ownership, end of period |
| Fidelity Cash Central Fund 4.88% | 225,629 | 1,803,674 | 1,809,310 | 4,969 | - | - | 219,993 | 0.0% |
| Total | 225,629 | 1,803,674 | 1,809,310 | 4,969 | - | - | 219,993 | |
| | | | | | | | | |
Amounts in the dividend income column in the above table include any capital gain distributions from underlying funds, which are presented in the corresponding line item in the Statement of Operations, if applicable.
Amounts included in the purchases and sales proceeds columns may include in-kind transactions, if applicable.
Investment Valuation
The following is a summary of the inputs used, as of April 30, 2023, involving the Fund's assets and liabilities carried at fair value. The inputs or methodology used for valuing securities may not be an indication of the risk associated with investing in those securities. For more information on valuation inputs, and their aggregation into the levels used below, please refer to the Investment Valuation section in the accompanying Notes to Financial Statements.
| Valuation Inputs at Reporting Date: |
| Description | Total ($) | Level 1 ($) | Level 2 ($) | Level 3 ($) |
Investments in Securities: | | | | |
|
| Equities: | | | | |
Communication Services | 179,434 | 23,234 | 156,200 | - |
Consumer Discretionary | 822,550 | 111,262 | 711,288 | - |
Consumer Staples | 766,897 | 340,355 | 426,542 | - |
Energy | 104,485 | 104,485 | - | - |
Financials | 1,676,812 | 641,718 | 1,035,094 | - |
Health Care | 1,053,243 | 252,854 | 800,389 | - |
Industrials | 878,126 | 226,196 | 651,930 | - |
Information Technology | 774,633 | 317,391 | 457,242 | - |
Materials | 456,716 | 266,309 | 190,407 | - |
Real Estate | 47,140 | 47,140 | - | - |
Utilities | 347,737 | 172,556 | 175,181 | - |
|
| Money Market Funds | 219,993 | 219,993 | - | - |
| Total Investments in Securities: | 7,327,766 | 2,723,493 | 4,604,273 | - |
| Statement of Assets and Liabilities |
| | | | April 30, 2023 (Unaudited) |
| | | | | |
| Assets | | | | |
| Investment in securities, at value - See accompanying schedule: | | | | |
Unaffiliated issuers (cost $6,569,194) | $ | 7,107,773 | | |
Fidelity Central Funds (cost $219,993) | | 219,993 | | |
| | | | | |
| | | | | |
| Total Investment in Securities (cost $6,789,187) | | | $ | 7,327,766 |
| Cash | | | | 9,044 |
| Foreign currency held at value (cost $2,296) | | | | 2,298 |
| Receivable for fund shares sold | | | | 4,131 |
| Dividends receivable | | | | 35,938 |
| Reclaims receivable | | | | 5,378 |
| Distributions receivable from Fidelity Central Funds | | | | 1,028 |
| Prepaid expenses | | | | 1 |
| Receivable from investment adviser for expense reductions | | | | 12,854 |
Total assets | | | | 7,398,438 |
| Liabilities | | | | |
| Payable for investments purchased | $ | 33,140 | | |
| Payable for fund shares redeemed | | 89 | | |
| Accrued management fee | | 3,794 | | |
| Distribution and service plan fees payable | | 349 | | |
| Other affiliated payables | | 1,371 | | |
| Audit fee payable | | 28,524 | | |
| Custody fee payable | | 6,563 | | |
| Other payables and accrued expenses | | 4 | | |
| Total Liabilities | | | | 73,834 |
| Net Assets | | | $ | 7,324,604 |
| Net Assets consist of: | | | | |
| Paid in capital | | | $ | 7,133,776 |
| Total accumulated earnings (loss) | | | | 190,828 |
| Net Assets | | | $ | 7,324,604 |
| | | | | |
| Net Asset Value and Maximum Offering Price | | | | |
| Class A : | | | | |
Net Asset Value and redemption price per share ($388,616 ÷ 44,631 shares) (a) | | | $ | 8.71 |
| Maximum offering price per share (100/94.25 of $8.71) | | | $ | 9.24 |
| Class M : | | | | |
Net Asset Value and redemption price per share ($217,827 ÷ 25,045 shares) (a) | | | $ | 8.70 |
| Maximum offering price per share (100/96.50 of $8.70) | | | $ | 9.02 |
| Class C : | | | | |
Net Asset Value and offering price per share ($216,455 ÷ 25,000 shares) (a) | | | $ | 8.66 |
| Fidelity Sustainable International Equity Fund : | | | | |
Net Asset Value , offering price and redemption price per share ($6,062,213 ÷ 695,188 shares) | | | $ | 8.72 |
| Class I : | | | | |
Net Asset Value , offering price and redemption price per share ($219,975 ÷ 25,227 shares) | | | $ | 8.72 |
| Class Z : | | | | |
Net Asset Value , offering price and redemption price per share ($219,518 ÷ 25,132 shares) | | | $ | 8.73 |
(a)Redemption price per share is equal to net asset value less any applicable contingent deferred sales charge. |
| Statement of Operations |
| | | | Six months ended April 30, 2023 (Unaudited) |
| Investment Income | | | | |
| Dividends | | | $ | 90,004 |
| Income from Fidelity Central Funds | | | | 4,969 |
| Income before foreign taxes withheld | | | $ | 94,973 |
| Less foreign taxes withheld | | | | (11,303) |
| Total Income | | | | 83,670 |
| Expenses | | | | |
| Management fee | | | | |
| Basic fee | $ | 21,568 | | |
| Performance adjustment | | (728) | | |
| Transfer agent fees | | 6,607 | | |
| Distribution and service plan fees | | 1,949 | | |
| Accounting fees and expenses | | 1,588 | | |
| Custodian fees and expenses | | 9,778 | | |
| Independent trustees' fees and expenses | | 15 | | |
| Registration fees | | 104,636 | | |
| Audit | | 31,898 | | |
| Legal | | 4 | | |
| Miscellaneous | | 10 | | |
| Total expenses before reductions | | 177,325 | | |
| Expense reductions | | (142,448) | | |
| Total expenses after reductions | | | | 34,877 |
| Net Investment income (loss) | | | | 48,793 |
| Realized and Unrealized Gain (Loss) | | | | |
| Net realized gain (loss) on: | | | | |
| Investment Securities: | | | | |
| Unaffiliated issuers | | (103,726) | | |
| Foreign currency transactions | | 1,843 | | |
| Total net realized gain (loss) | | | | (101,883) |
| Change in net unrealized appreciation (depreciation) on: | | | | |
| Investment Securities: | | | | |
| Unaffiliated issuers | | 1,199,531 | | |
| Assets and liabilities in foreign currencies | | 181 | | |
| Total change in net unrealized appreciation (depreciation) | | | | 1,199,712 |
| Net gain (loss) | | | | 1,097,829 |
| Net increase (decrease) in net assets resulting from operations | | | $ | 1,146,622 |
| Statement of Changes in Net Assets |
| |
| | Six months ended April 30, 2023 (Unaudited) | | For the period February 10, 2022 (commencement of operations) through October 31, 2022 |
| Increase (Decrease) in Net Assets | | | | |
| Operations | | | | |
| Net investment income (loss) | $ | 48,793 | $ | 29,662 |
| Net realized gain (loss) | | (101,883) | | (295,162) |
| Change in net unrealized appreciation (depreciation) | | 1,199,712 | | (661,097) |
| Net increase (decrease) in net assets resulting from operations | | 1,146,622 | | (926,597) |
| Distributions to shareholders | | (29,290) | | - |
| Share transactions - net increase (decrease) | | 1,395,341 | | 5,738,528 |
| Total increase (decrease) in net assets | | 2,512,673 | | 4,811,931 |
| | | | | |
| Net Assets | | | | |
| Beginning of period | | 4,811,931 | | - |
| End of period | $ | 7,324,604 | $ | 4,811,931 |
| | | | | |
| | | | | |
Financial Highlights
| Fidelity Advisor® Sustainable International Equity Fund Class A |
| |
| | Six months ended (Unaudited) April 30, 2023 | | Years ended October 31, 2022 A |
Selected Per-Share Data | | | | |
| Net asset value, beginning of period | $ | 7.20 | $ | 10.00 |
| Income from Investment Operations | | | | |
Net investment income (loss) B,C | | .06 | | .07 |
| Net realized and unrealized gain (loss) | | 1.48 | | (2.87) |
| Total from investment operations | | 1.54 | | (2.80) |
| Distributions from net investment income | | (.03) | | - |
| Total distributions | | (.03) | | - |
| Net asset value, end of period | $ | 8.71 | $ | 7.20 |
Total Return D,E,F | | 21.42% | | (28.00)% |
Ratios to Average Net Assets C,G,H | | | | |
| Expenses before reductions | | 5.74% I | | 7.77% I,J |
| Expenses net of fee waivers, if any | | 1.29% I | | 1.30% I |
| Expenses net of all reductions | | 1.29% I | | 1.28% I |
| Net investment income (loss) | | 1.34% I | | 1.18% I |
| Supplemental Data | | | | |
| Net assets, end of period (000 omitted) | $ | 389 | $ | 185 |
Portfolio turnover rate K | | 49% I | | 43% I |
A For the period February 10, 2022 (commencement of operations) through October 31, 2022
B Calculated based on average shares outstanding during the period.
C Net investment income (loss) is affected by the timing of the declaration of dividends by any underlying mutual funds or exchange-traded funds (ETFs). Net investment income (loss) of any mutual funds or ETFs is not included in the Fund's net investment income (loss) ratio.
D Total returns for periods of less than one year are not annualized.
E Total returns would have been lower if certain expenses had not been reduced during the applicable periods shown.
F Total returns do not include the effect of the sales charges.
G Fees and expenses of any underlying mutual funds or exchange-traded funds (ETFs) are not included in the Fund's expense ratio. The Fund indirectly bears its proportionate share of these expenses. For additional expense information related to investments in Fidelity Central Funds, please refer to the "Investments in Fidelity Central Funds" note found in the Notes to Financial Statements section of the most recent Annual or Semi-Annual report.
H Expense ratios reflect operating expenses of the class. Expenses before reductions do not reflect amounts reimbursed, waived, or reduced through arrangements with the investment adviser, brokerage services, or other offset arrangements, if applicable, and do not represent the amount paid by the class during periods when reimbursements, waivers or reductions occur.
I Annualized.
J Audit fees are not annualized.
K Amount does not include the portfolio activity of any underlying mutual funds or exchange-traded funds (ETFs).
| Fidelity Advisor® Sustainable International Equity Fund Class M |
| |
| | Six months ended (Unaudited) April 30, 2023 | | Years ended October 31, 2022 A |
Selected Per-Share Data | | | | |
| Net asset value, beginning of period | $ | 7.19 | $ | 10.00 |
| Income from Investment Operations | | | | |
Net investment income (loss) B,C | | .04 | | .05 |
| Net realized and unrealized gain (loss) | | 1.48 | | (2.86) |
| Total from investment operations | | 1.52 | | (2.81) |
| Distributions from net investment income | | (.01) | | - |
| Total distributions | | (.01) | | - |
| Net asset value, end of period | $ | 8.70 | $ | 7.19 |
Total Return D,E,F | | 21.20% | | (28.10)% |
Ratios to Average Net Assets C,G,H | | | | |
| Expenses before reductions | | 5.97% I | | 8.02% I,J |
| Expenses net of fee waivers, if any | | 1.55% I | | 1.55% I |
| Expenses net of all reductions | | 1.54% I | | 1.55% I |
| Net investment income (loss) | | 1.09% I | | .91% I |
| Supplemental Data | | | | |
| Net assets, end of period (000 omitted) | $ | 218 | $ | 180 |
Portfolio turnover rate K | | 49% I | | 43% I |
A For the period February 10, 2022 (commencement of operations) through October 31, 2022
B Calculated based on average shares outstanding during the period.
C Net investment income (loss) is affected by the timing of the declaration of dividends by any underlying mutual funds or exchange-traded funds (ETFs). Net investment income (loss) of any mutual funds or ETFs is not included in the Fund's net investment income (loss) ratio.
D Total returns would have been lower if certain expenses had not been reduced during the applicable periods shown.
E Total returns do not include the effect of the sales charges.
F Total returns for periods of less than one year are not annualized.
G Fees and expenses of any underlying mutual funds or exchange-traded funds (ETFs) are not included in the Fund's expense ratio. The Fund indirectly bears its proportionate share of these expenses. For additional expense information related to investments in Fidelity Central Funds, please refer to the "Investments in Fidelity Central Funds" note found in the Notes to Financial Statements section of the most recent Annual or Semi-Annual report.
H Expense ratios reflect operating expenses of the class. Expenses before reductions do not reflect amounts reimbursed, waived, or reduced through arrangements with the investment adviser, brokerage services, or other offset arrangements, if applicable, and do not represent the amount paid by the class during periods when reimbursements, waivers or reductions occur.
I Annualized.
J Audit fees are not annualized.
K Amount does not include the portfolio activity of any underlying mutual funds or exchange-traded funds (ETFs).
| Fidelity Advisor® Sustainable International Equity Fund Class C |
| |
| | Six months ended (Unaudited) April 30, 2023 | | Years ended October 31, 2022 A |
Selected Per-Share Data | | | | |
| Net asset value, beginning of period | $ | 7.16 | $ | 10.00 |
| Income from Investment Operations | | | | |
Net investment income (loss) B,C | | .02 | | .02 |
| Net realized and unrealized gain (loss) | | 1.48 | | (2.86) |
| Total from investment operations | | 1.50 | | (2.84) |
| Net asset value, end of period | $ | 8.66 | $ | 7.16 |
Total Return D,E,F | | 20.95% | | (28.40)% |
Ratios to Average Net Assets C,G,H | | | | |
| Expenses before reductions | | 6.45% I | | 8.51% I,J |
| Expenses net of fee waivers, if any | | 2.05% I | | 2.05% I |
| Expenses net of all reductions | | 2.04% I | | 2.05% I |
| Net investment income (loss) | | .59% I | | .41% I |
| Supplemental Data | | | | |
| Net assets, end of period (000 omitted) | $ | 216 | $ | 179 |
Portfolio turnover rate K | | 49% I | | 43% I |
A For the period February 10, 2022 (commencement of operations) through October 31, 2022
B Calculated based on average shares outstanding during the period.
C Net investment income (loss) is affected by the timing of the declaration of dividends by any underlying mutual funds or exchange-traded funds (ETFs). Net investment income (loss) of any mutual funds or ETFs is not included in the Fund's net investment income (loss) ratio.
D Total returns for periods of less than one year are not annualized.
E Total returns would have been lower if certain expenses had not been reduced during the applicable periods shown.
F Total returns do not include the effect of the contingent deferred sales charge.
G Fees and expenses of any underlying mutual funds or exchange-traded funds (ETFs) are not included in the Fund's expense ratio. The Fund indirectly bears its proportionate share of these expenses. For additional expense information related to investments in Fidelity Central Funds, please refer to the "Investments in Fidelity Central Funds" note found in the Notes to Financial Statements section of the most recent Annual or Semi-Annual report.
H Expense ratios reflect operating expenses of the class. Expenses before reductions do not reflect amounts reimbursed, waived, or reduced through arrangements with the investment adviser, brokerage services, or other offset arrangements, if applicable, and do not represent the amount paid by the class during periods when reimbursements, waivers or reductions occur.
I Annualized.
J Audit fees are not annualized.
K Amount does not include the portfolio activity of any underlying mutual funds or exchange-traded funds (ETFs).
| Fidelity® Sustainable International Equity Fund |
| |
| | Six months ended (Unaudited) April 30, 2023 | | Years ended October 31, 2022 A |
Selected Per-Share Data | | | | |
| Net asset value, beginning of period | $ | 7.21 | $ | 10.00 |
| Income from Investment Operations | | | | |
Net investment income (loss) B,C | | .07 | | .08 |
| Net realized and unrealized gain (loss) | | 1.48 | | (2.87) |
| Total from investment operations | | 1.55 | | (2.79) |
| Distributions from net investment income | | (.04) | | - |
| Total distributions | | (.04) | | - |
| Net asset value, end of period | $ | 8.72 | $ | 7.21 |
Total Return D,E | | 21.58% | | (27.90)% |
Ratios to Average Net Assets C,F,G | | | | |
| Expenses before reductions | | 5.53% H | | 7.64% H,I |
| Expenses net of fee waivers, if any | | 1.04% H | | 1.05% H |
| Expenses net of all reductions | | 1.04% H | | 1.01% H |
| Net investment income (loss) | | 1.59% H | | 1.45% H |
| Supplemental Data | | | | |
| Net assets, end of period (000 omitted) | $ | 6,062 | $ | 3,908 |
Portfolio turnover rate J | | 49% H | | 43% H |
A For the period February 10, 2022 (commencement of operations) through October 31, 2022
B Calculated based on average shares outstanding during the period.
C Net investment income (loss) is affected by the timing of the declaration of dividends by any underlying mutual funds or exchange-traded funds (ETFs). Net investment income (loss) of any mutual funds or ETFs is not included in the Fund's net investment income (loss) ratio.
D Total returns for periods of less than one year are not annualized.
E Total returns would have been lower if certain expenses had not been reduced during the applicable periods shown.
F Fees and expenses of any underlying mutual funds or exchange-traded funds (ETFs) are not included in the Fund's expense ratio. The Fund indirectly bears its proportionate share of these expenses. For additional expense information related to investments in Fidelity Central Funds, please refer to the "Investments in Fidelity Central Funds" note found in the Notes to Financial Statements section of the most recent Annual or Semi-Annual report.
G Expense ratios reflect operating expenses of the class. Expenses before reductions do not reflect amounts reimbursed, waived, or reduced through arrangements with the investment adviser, brokerage services, or other offset arrangements, if applicable, and do not represent the amount paid by the class during periods when reimbursements, waivers or reductions occur.
H Annualized.
I Audit fees are not annualized.
J Amount does not include the portfolio activity of any underlying mutual funds or exchange-traded funds (ETFs).
| Fidelity Advisor® Sustainable International Equity Fund Class I |
| |
| | Six months ended (Unaudited) April 30, 2023 | | Years ended October 31, 2022 A |
Selected Per-Share Data | | | | |
| Net asset value, beginning of period | $ | 7.21 | $ | 10.00 |
| Income from Investment Operations | | | | |
Net investment income (loss) B,C | | .07 | | .08 |
| Net realized and unrealized gain (loss) | | 1.48 | | (2.87) |
| Total from investment operations | | 1.55 | | (2.79) |
| Distributions from net investment income | | (.04) | | - |
| Total distributions | | (.04) | | - |
| Net asset value, end of period | $ | 8.72 | $ | 7.21 |
Total Return D,E | | 21.58% | | (27.90)% |
Ratios to Average Net Assets C,F,G | | | | |
| Expenses before reductions | | 5.48% H | | 7.52% H,I |
| Expenses net of fee waivers, if any | | 1.04% H | | 1.05% H |
| Expenses net of all reductions | | 1.04% H | | 1.03% H |
| Net investment income (loss) | | 1.59% H | | 1.43% H |
| Supplemental Data | | | | |
| Net assets, end of period (000 omitted) | $ | 220 | $ | 180 |
Portfolio turnover rate J | | 49% H | | 43% H |
A For the period February 10, 2022 (commencement of operations) through October 31, 2022
B Calculated based on average shares outstanding during the period.
C Net investment income (loss) is affected by the timing of the declaration of dividends by any underlying mutual funds or exchange-traded funds (ETFs). Net investment income (loss) of any mutual funds or ETFs is not included in the Fund's net investment income (loss) ratio.
D Total returns for periods of less than one year are not annualized.
E Total returns would have been lower if certain expenses had not been reduced during the applicable periods shown.
F Fees and expenses of any underlying mutual funds or exchange-traded funds (ETFs) are not included in the Fund's expense ratio. The Fund indirectly bears its proportionate share of these expenses. For additional expense information related to investments in Fidelity Central Funds, please refer to the "Investments in Fidelity Central Funds" note found in the Notes to Financial Statements section of the most recent Annual or Semi-Annual report.
G Expense ratios reflect operating expenses of the class. Expenses before reductions do not reflect amounts reimbursed, waived, or reduced through arrangements with the investment adviser, brokerage services, or other offset arrangements, if applicable, and do not represent the amount paid by the class during periods when reimbursements, waivers or reductions occur.
H Annualized.
I Audit fees are not annualized.
J Amount does not include the portfolio activity of any underlying mutual funds or exchange-traded funds (ETFs).
| Fidelity Advisor® Sustainable International Equity Fund Class Z |
| |
| | Six months ended (Unaudited) April 30, 2023 | | Years ended October 31, 2022 A |
Selected Per-Share Data | | | | |
| Net asset value, beginning of period | $ | 7.22 | $ | 10.00 |
| Income from Investment Operations | | | | |
Net investment income (loss) B,C | | .07 | | .09 |
| Net realized and unrealized gain (loss) | | 1.48 | | (2.87) |
| Total from investment operations | | 1.55 | | (2.78) |
| Distributions from net investment income | | (.04) | | - |
| Total distributions | | (.04) | | - |
| Net asset value, end of period | $ | 8.73 | $ | 7.22 |
Total Return D,E | | 21.55% | | (27.80)% |
Ratios to Average Net Assets C,F,G | | | | |
| Expenses before reductions | | 5.40% H | | 7.46% H,I |
| Expenses net of fee waivers, if any | | .90% H | | .90% H |
| Expenses net of all reductions | | .89% H | | .90% H |
| Net investment income (loss) | | 1.74% H | | 1.56% H |
| Supplemental Data | | | | |
| Net assets, end of period (000 omitted) | $ | 220 | $ | 181 |
Portfolio turnover rate J | | 49% H | | 43% H |
A For the period February 10, 2022 (commencement of operations) through October 31, 2022
B Calculated based on average shares outstanding during the period.
C Net investment income (loss) is affected by the timing of the declaration of dividends by any underlying mutual funds or exchange-traded funds (ETFs). Net investment income (loss) of any mutual funds or ETFs is not included in the Fund's net investment income (loss) ratio.
D Total returns for periods of less than one year are not annualized.
E Total returns would have been lower if certain expenses had not been reduced during the applicable periods shown.
F Fees and expenses of any underlying mutual funds or exchange-traded funds (ETFs) are not included in the Fund's expense ratio. The Fund indirectly bears its proportionate share of these expenses. For additional expense information related to investments in Fidelity Central Funds, please refer to the "Investments in Fidelity Central Funds" note found in the Notes to Financial Statements section of the most recent Annual or Semi-Annual report.
G Expense ratios reflect operating expenses of the class. Expenses before reductions do not reflect amounts reimbursed, waived, or reduced through arrangements with the investment adviser, brokerage services, or other offset arrangements, if applicable, and do not represent the amount paid by the class during periods when reimbursements, waivers or reductions occur.
H Annualized.
I Audit fees are not annualized.
J Amount does not include the portfolio activity of any underlying mutual funds or exchange-traded funds (ETFs).
For the period ended April 30, 2023
1. Organization.
Fidelity Sustainable International Equity Fund (the Fund) is a fund of Fidelity Investment Trust (the Trust) and is authorized to issue an unlimited number of shares. The Trust is registered under the Investment Company Act of 1940, as amended (the 1940 Act), as an open-end management investment company organized as a Massachusetts business trust. The Fund offers Class A, Class M, Class C, Fidelity Sustainable International Equity Fund, Class I and Class Z shares, each of which has equal rights as to assets and voting privileges. Class A, Class M, Class C, Class I and Class Z are Fidelity Advisor classes. Each class has exclusive voting rights with respect to matters that affect that class. Class C shares will automatically convert to Class A shares after a holding period of eight years from the initial date of purchase, with certain exceptions.
2. Investments in Fidelity Central Funds.
Funds may invest in Fidelity Central Funds, which are open-end investment companies generally available only to other investment companies and accounts managed by the investment adviser and its affiliates. The Schedule of Investments lists any Fidelity Central Funds held as an investment as of period end, but does not include the underlying holdings of each Fidelity Central Fund. An investing fund indirectly bears its proportionate share of the expenses of the underlying Fidelity Central Funds.
Based on its investment objective, each Fidelity Central Fund may invest or participate in various investment vehicles or strategies that are similar to those of the investing fund. These strategies are consistent with the investment objectives of the investing fund and may involve certain economic risks which may cause a decline in value of each of the Fidelity Central Funds and thus a decline in the value of the investing fund.
| Fidelity Central Fund | Investment Manager | Investment Objective | Investment Practices | Expense Ratio A |
| Fidelity Money Market Central Funds | Fidelity Management & Research Company LLC (FMR) | Each fund seeks to obtain a high level of current income consistent with the preservation of capital and liquidity. | Short-term Investments | Less than .005% |
A Expenses expressed as a percentage of average net assets and are as of each underlying Central Fund's most recent annual or semi-annual shareholder report.
A complete unaudited list of holdings for each Fidelity Central Fund is available upon request or at the Securities and Exchange Commission website at www.sec.gov. In addition, the financial statements of the Fidelity Central Funds which contain the significant accounting policies (including investment valuation policies) of those funds, and are not covered by the Report of Independent Registered Public Accounting Firm, are available on the Securities and Exchange Commission website or upon request.
3. Significant Accounting Policies.
The Fund is an investment company and applies the accounting and reporting guidance of the Financial Accounting Standards Board (FASB) Accounting Standards Codification Topic 946 Financial Services - Investment Companies . The financial statements have been prepared in conformity with accounting principles generally accepted in the United States of America (GAAP), which require management to make certain estimates and assumptions at the date of the financial statements. Actual results could differ from those estimates. Subsequent events, if any, through the date that the financial statements were issued have been evaluated in the preparation of the financial statements. The Fund's Schedule of Investments lists any underlying mutual funds or exchange-traded funds (ETFs) but does not include the underlying holdings of these funds. The following summarizes the significant accounting policies of the Fund:
Investment Valuation. Investments are valued as of 4:00 p.m. Eastern time on the last calendar day of the period. The Board of Trustees (the Board) has designated the Fund's investment adviser as the valuation designee responsible for the fair valuation function and performing fair value determinations as needed. The investment adviser has established a Fair Value Committee (the Committee) to carry out the day-to-day fair valuation responsibilities and has adopted policies and procedures to govern the fair valuation process and the activities of the Committee. In accordance with these fair valuation policies and procedures, which have been approved by the Board, the Fund attempts to obtain prices from one or more third party pricing services or brokers to value its investments. When current market prices, quotations or currency exchange rates are not readily available or reliable, investments will be fair valued in good faith by the Committee, in accordance with the policies and procedures. Factors used in determining fair value vary by investment type and may include market or investment specific events, transaction data, estimated cash flows, and market observations of comparable investments. The frequency that the fair valuation procedures are used cannot be predicted and they may be utilized to a significant extent. The Committee manages the Fund's fair valuation practices and maintains the fair valuation policies and procedures. The Fund's investment adviser reports to the Board information regarding the fair valuation process and related material matters.
The Fund categorizes the inputs to valuation techniques used to value its investments into a disclosure hierarchy consisting of three levels as shown below:
Level 1 - unadjusted quoted prices in active markets for identical investments
Level 2 - other significant observable inputs (including quoted prices for similar investments, interest rates, prepayment speeds, etc.)
Level 3 - unobservable inputs (including the Fund's own assumptions based on the best information available)
Valuation techniques used to value the Fund's investments by major category are as follows:
Equity securities, including restricted securities, for which market quotations are readily available, are valued at the last reported sale price or official closing price as reported by a third party pricing service on the primary market or exchange on which they are traded and are categorized as Level 1 in the hierarchy. In the event there were no sales during the day or closing prices are not available, securities are valued at the last quoted bid price or may be valued using the last available price and are generally categorized as Level 2 in the hierarchy. For foreign equity securities, when market or security specific events arise, comparisons to the valuation of American Depositary Receipts (ADRs), futures contracts, ETFs and certain indexes as well as quoted prices for similar securities may be used and would be categorized as Level 2 in the hierarchy. For equity securities, including restricted securities, where observable inputs are limited, assumptions about market activity and risk are used and these securities may be categorized as Level 3 in the hierarchy.
Investments in open-end mutual funds, including the Fidelity Central Funds, are valued at their closing net asset value (NAV) each business day and are categorized as Level 1 in the hierarchy.
Changes in valuation techniques may result in transfers in or out of an assigned level within the disclosure hierarchy. The aggregate value of investments by input level as of April 30, 2023 is included at the end of the Fund's Schedule of Investments.
Foreign Currency. Certain Funds may use foreign currency contracts to facilitate transactions in foreign-denominated securities. Gains and losses from these transactions may arise from changes in the value of the foreign currency or if the counterparties do not perform under the contracts' terms.
Foreign-denominated assets, including investment securities, and liabilities are translated into U.S. dollars at the exchange rates at period end. Purchases and sales of investment securities, income and dividends received, and expenses denominated in foreign currencies are translated into U.S. dollars at the exchange rate in effect on the transaction date.
The effects of exchange rate fluctuations on investments are included with the net realized and unrealized gain (loss) on investment securities. Other foreign currency transactions resulting in realized and unrealized gain (loss) are disclosed separately.
Investment Transactions and Income. For financial reporting purposes, the Fund's investment holdings and NAV include trades executed through the end of the last business day of the period. The NAV per share for processing shareholder transactions is calculated as of the close of business of the New York Stock Exchange (NYSE), normally 4:00 p.m. Eastern time and includes trades executed through the end of the prior business day. Gains and losses on securities sold are determined on the basis of identified cost. Commissions paid to certain brokers with whom the investment adviser, or its affiliates, places trades on behalf of a fund include an amount in addition to trade execution, which may be rebated back to a fund. Any such rebates are included in net realized gain (loss) on investments in the Statement of Operations. Dividend income is recorded on the ex-dividend date, except for certain dividends from foreign securities where the ex-dividend date may have passed, which are recorded as soon as the Fund is informed of the ex-dividend date. Non-cash dividends included in dividend income, if any, are recorded at the fair market value of the securities received. Income and capital gain distributions from Fidelity Central Funds, if any, are recorded on the ex-dividend date. Investment income is recorded net of foreign taxes withheld where recovery of such taxes is uncertain. Funds may file withholding tax reclaims in certain jurisdictions to recover a portion of amounts previously withheld. Any withholding tax reclaims income is included in the Statement of Operations in foreign taxes withheld. Any receivables for withholding tax reclaims are included in the Statement of Assets and Liabilities in reclaims receivable.
Class Allocations and Expenses. Investment income, realized and unrealized capital gains and losses, common expenses of a fund, and certain fund-level expense reductions, if any, are allocated daily on a pro-rata basis to each class based on the relative net assets of each class to the total net assets of a fund. Each class differs with respect to transfer agent and distribution and service plan fees incurred, as applicable. Certain expense reductions may also differ by class, if applicable. For the reporting period, the allocated portion of income and expenses to each class as a percent of its average net assets may vary due to the timing of recording these transactions in relation to fluctuating net assets of the classes. Expenses directly attributable to a fund are charged to that fund. Expenses attributable to more than one fund are allocated among the respective funds on the basis of relative net assets or other appropriate methods. Expenses included in the accompanying financial statements reflect the expenses of that fund and do not include any expenses associated with any underlying mutual funds or exchange-traded funds. Although not included in a fund's expenses, a fund indirectly bears its proportionate share of these expenses through the net asset value of each underlying mutual fund or exchange-traded fund. Expense estimates are accrued in the period to which they relate and adjustments are made when actual amounts are known.
Income Tax Information and Distributions to Shareholders. Each year, the Fund intends to qualify as a regulated investment company under Subchapter M of the Internal Revenue Code, including distributing substantially all of its taxable income and realized gains. As a result, no provision for U.S. Federal income taxes is required. The Fund files a U.S. federal tax return, in addition to state and local tax returns as required. The Fund's federal income tax returns are subject to examination by the Internal Revenue Service (IRS) for a period of three fiscal years after they are filed. State and local tax returns may be subject to examination for an additional fiscal year depending on the jurisdiction. Foreign taxes are provided for based on the Fund's understanding of the tax rules and rates that exist in the foreign markets in which it invests.
Distributions are declared and recorded on the ex-dividend date. Income and capital gain distributions are declared separately for each class. Income and capital gain distributions are determined in accordance with income tax regulations, which may differ from GAAP.
Capital accounts within the financial statements are adjusted for permanent book-tax differences. These adjustments have no impact on net assets or the results of operations. Capital accounts are not adjusted for temporary book-tax differences which will reverse in a subsequent period.
Book-tax differences are primarily due to foreign currency transactions, passive foreign investment companies (PFIC), capital loss carryforwards and losses deferred due to wash sales.
As of period end, the cost and unrealized appreciation (depreciation) in securities, and derivatives if applicable, for federal income tax purposes were as follows:
| Gross unrealized appreciation | $743,317 |
| Gross unrealized depreciation | (248,737) |
| Net unrealized appreciation (depreciation) | $494,580 |
| Tax cost | $6,833,186 |
Capital loss carryforwards are only available to offset future capital gains of the Fund to the extent provided by regulations and may be limited. The capital loss carryforward information presented below, including any applicable limitation, is estimated as of prior fiscal period end and is subject to adjustment.
Restricted Securities (including Private Placements). Funds may invest in securities that are subject to legal or contractual restrictions on resale. These securities generally may be resold in transactions exempt from registration or to the public if the securities are registered. Disposal of these securities may involve time-consuming negotiations and expense, and prompt sale at an acceptable price may be difficult. Information regarding restricted securities held at period end is included at the end of the Schedule of Investments, if applicable.
4. Purchases and Sales of Investments.
Purchases and sales of securities, other than short-term securities and in-kind transactions, as applicable, are noted in the table below.
| | Purchases ($) | Sales ($) |
| Fidelity Sustainable International Equity Fund | 2,858,256 | 1,486,876 |
5. Fees and Other Transactions with Affiliates.
Management Fee. Fidelity Management & Research Company LLC (the investment adviser) and its affiliates provide the Fund with investment management related services for which the Fund pays a monthly management fee. The management fee is the sum of an individual fund fee rate that is based on an annual rate of .45% of the Fund's average net assets and an annualized group fee rate that averaged .23% during the period. The group fee rate is based upon the monthly average net assets of a group of registered investment companies with which the investment adviser has management contracts. The group fee rate decreases as assets under management increase and increases as assets under management decrease. In addition, the management fee is subject to a performance adjustment (up to a maximum of +/- .10% of the Fund's average net assets over a 36 month performance period). The upward or downward adjustment to the management fee is based on the relative investment performance of Fidelity Sustainable International Equity Fund as compared to its benchmark index, the MSCI EAFE Index, over the same 36 month performance period. The Fund's performance adjustment took effect in October, 2022. Subsequent months will be added until the performance period includes 36 months. For the reporting period, the total annualized management fee rate, including the performance adjustment, was .66% of the Fund's average net assets. The performance adjustment included in the management fee rate may be higher or lower than the maximum performance adjustment rate due to the difference between the average net assets for the reporting and performance periods.
Distribution and Service Plan Fees. In accordance with Rule 12b-1 of the 1940 Act, the Fund has adopted separate Distribution and Service Plans for each class of shares. Certain classes pay Fidelity Distributors Company LLC (FDC), an affiliate of the investment adviser, separate Distribution and Service Fees, each of which is based on an annual percentage of each class' average net assets. In addition, FDC may pay financial intermediaries for selling shares of the Fund and providing shareholder support services. For the period, the Distribution and Service Fee rates, total fees and amounts retained by FDC were as follows:
| | Distribution Fee | Service Fee | Total Fees | Retained by FDC |
| Class A | - % | .25% | $406 | $261 |
| Class M | .25% | .25% | 516 | 516 |
| Class C | .75% | .25% | 1,027 | 1,027 |
| | | | $1,949 | $1804 |
Sales Load. FDC may receive a front-end sales charge of up to 5.75% for selling Class A shares and 3.50% for selling Class M shares, some of which is paid to financial intermediaries for selling shares of the Fund. Depending on the holding period, FDC may receive contingent deferred sales charges levied on Class A, Class M and Class C redemptions. The deferred sales charges are 1.00% for Class C shares, 1.00% for certain purchases of Class A shares and .25% for certain purchases of Class M shares. For the period, there were no sales charge amounts retained by FDC.
Transfer Agent Fees. Fidelity Investments Institutional Operations Company LLC (FIIOC), an affiliate of the investment adviser, is the transfer, dividend disbursing and shareholder servicing agent for each class of the Fund. FIIOC receives account fees and asset-based fees that vary according to the account size and type of account of the shareholders of the respective classes of the Fund, except for Class Z. FIIOC receives an asset-based fee of Class Z's average net assets. FIIOC pays for typesetting, printing and mailing of shareholder reports, except proxy statements.
For the period, transfer agent fees for each class were as follows:
| | Amount | % of Class-Level Average Net Assets A |
| Class A | $281 | .17 |
| Class M | 112 | .11 |
| Class C | 98 | .10 |
| Fidelity Sustainable International Equity Fund | 5,937 | .23 |
| Class I | 135 | .13 |
| Class Z | 44 | .04 |
| | $6,607 | |
A Annualized
Accounting Fees. Fidelity Service Company, Inc. (FSC), an affiliate of the investment adviser, maintains the Fund's accounting records. The accounting fee is based on the level of average net assets for each month. For the period, the fees were equivalent to the following annualized rates:
| | % of Average Net Assets |
| Fidelity Sustainable International Equity Fund | .05 |
Interfund Trades. Funds may purchase from or sell securities to other Fidelity Funds under procedures adopted by the Board. The procedures have been designed to ensure these interfund trades are executed in accordance with Rule 17a-7 of the 1940 Act. Any interfund trades are included within the respective purchases and sales amounts shown in the Purchases and Sales of Investments note. Interfund trades during the period are noted in the table below.
| | Purchases ($) | Sales ($) | Realized Gain (Loss) ($) |
| Fidelity Sustainable International Equity Fund | 54,865 | 101,738 | (3,196) |
6. Committed Line of Credit.
Certain Funds participate with other funds managed by the investment adviser or an affiliate in a $4.25 billion credit facility (the "line of credit") to be utilized for temporary or emergency purposes to fund shareholder redemptions or for other short-term liquidity purposes. The participating funds have agreed to pay commitment fees on their pro-rata portion of the line of credit, which are reflected in Miscellaneous expenses on the Statement of Operations, and are listed below. During the period, there were no borrowings on this line of credit.
| | Amount |
| Fidelity Sustainable International Equity Fund | $6 |
7. Expense Reductions.
The investment adviser contractually agreed to reimburse expenses of each class to the extent annual operating expenses exceeded certain levels of class-level average net assets as noted in the table below. This reimbursement will remain in place through February 29, 2024. Some expenses, for example the compensation of the independent Trustees, and certain miscellaneous expenses such as proxy and shareholder meeting expenses, are excluded from this reimbursement.
The following classes were in reimbursement during the period:
| | Expense Limitations | Reimbursement |
| Class A | 1.30% | $7,178 |
| Class M | 1.55% | 4,548 |
| Class C | 2.05% | 4,515 |
| Fidelity Sustainable International Equity Fund | 1.05% | 116,671 |
| Class I | 1.05% | 4,595 |
| Class Z | .90% | 4,660 |
| | | $142,167 |
Through arrangements with the Fund's custodian, credits realized as a result of certain uninvested cash balances were used to reduce the Fund's expenses. During the period, custodian credits reduced the Fund's expenses by $134.
In addition, during the period the investment adviser or an affiliate reimbursed and/or waived a portion of fund-level operating expenses in the amount of $147.
8. Distributions to Shareholders.
Distributions to shareholders of each class were as follows:
| | Six months ended April 30, 2023 | Year ended October 31, 2022 A |
| Fidelity Sustainable International Equity Fund | | |
| Distributions to shareholders | | |
| Class A | $863 | $- |
| Class M | 325 | - |
| Fidelity Sustainable International Equity Fund | 25,952 | - |
| Class I | 1,075 | - |
| Class Z | 1,075 | - |
Total | $29,290 | $- |
A For the period February 10,2022(commencement of operations) through October 31, 2022.
9. Share Transactions.
Share transactions for each class were as follows and may contain in-kind transactions, automatic conversions between classes or exchanges between affiliated funds:
| | Shares | Shares | Dollars | Dollars |
| | Six months ended April 30, 2023 | Year ended October 31, 2022 A | Six months ended April 30, 2023 | Year ended October 31, 2022 A |
| Fidelity Sustainable International Equity Fund | | | | |
| Class A | | | | |
| Shares sold | 19,524 | 25,690 | $155,387 | $255,541 |
| Reinvestment of distributions | 107 | - | 863 | - |
| Shares redeemed | (633) | (57) | (5,145) | (435) |
| Net increase (decrease) | 18,998 | 25,633 | $151,105 | $255,106 |
| Class M | | | | |
| Shares sold | 5 | 25,000 | $39 | $250,003 |
| Reinvestment of distributions | 40 | - | 325 | - |
| Net increase (decrease) | 45 | 25,000 | $364 | $250,003 |
| Class C | | | | |
| Shares sold | - | 25,000 | $- | $250,000 |
| Net increase (decrease) | - | 25,000 | $- | $250,000 |
| Fidelity Sustainable International Equity Fund | | | | |
| Shares sold | 222,366 | 564,957 | $1,814,242 | $4,670,389 |
| Reinvestment of distributions | 2,932 | - | 23,779 | - |
| Shares redeemed | (71,802) | (23,265) | (597,099) | (187,070) |
| Net increase (decrease) | 153,496 | 541,692 | $1,240,922 | $4,483,319 |
| Class I | | | | |
| Shares sold | 94 | 25,054 | $800 | $250,509 |
| Reinvestment of distributions | 133 | - | 1,075 | - |
| Shares redeemed | - | (54) | - | (409) |
| Net increase (decrease) | 227 | 25,000 | $1,875 | $250,100 |
| Class Z | | | | |
| Shares sold | - | 25,000 | $- | $250,000 |
| Reinvestment of distributions | 132 | - | 1,075 | - |
| Net increase (decrease) | 132 | 25,000 | $1,075 | $250,000 |
A For the period February 10,2022 (commencement of operations) through October 31, 2022.
10. Other.
A fund's organizational documents provide former and current trustees and officers with a limited indemnification against liabilities arising in connection with the performance of their duties to the fund. In the normal course of business, a fund may also enter into contracts that provide general indemnifications. A fund's maximum exposure under these arrangements is unknown as this would be dependent on future claims that may be made against a fund. The risk of material loss from such claims is considered remote.
At the end of the period, the investment adviser or its affiliates were owners of record of more than 10% and certain otherwise unaffiliated shareholders were owners of record of more than 10% of the outstanding shares as follows:
| Fund | Affiliated % |
Fidelity Sustainable International Equity Fund | 24% |
In addition, At the end of the period, the following mutual funds managed by the investment adviser or its affiliates were the owners of record of 10% or more of the total outstanding shares.
| | Fidelity Sustainable Multi-Asset Fund |
| Fidelity Sustainable International Equity Fund | 27% |
11. Risk and Uncertainties.
Many factors affect a fund's performance. Developments that disrupt global economies and financial markets, such as pandemics, epidemics, outbreaks of infectious diseases, war, terrorism, and environmental disasters, may significantly affect a fund's investment performance. The effects of these developments to a fund will be impacted by the types of securities in which a fund invests, the financial condition, industry, economic sector, and geographic location of an issuer, and a fund's level of investment in the securities of that issuer. Significant concentrations in security types, issuers, industries, sectors, and geographic locations may magnify the factors that affect a fund's performance.
As a shareholder, you incur two types of costs: (1) transaction costs, which may include sales charges (loads) on purchase payments or redemption proceeds, as applicable and (2) ongoing costs, which generally include management fees, distribution and/or service (12b-1) fees and other Fund expenses. This Example is intended to help you understand your ongoing costs (in dollars) of investing in a fund and to compare these costs with the ongoing costs of investing in other mutual funds.
| The Example is based on an investment of $1,000 invested at the beginning of the period and held for the entire period (November 1, 2022 to April 30, 2023). |
Actual Expenses
The first line of the accompanying table provides information about actual account values and actual expenses. You may use the information in this line, together with the amount you invested, to estimate the expenses that you paid over the period. Simply divide your account value by $1,000.00 (for example, an $8,600 account value divided by $1,000.00 = 8.6), then multiply the result by the number in the first line for a class/Fund under the heading entitled "Expenses Paid During Period" to estimate the expenses you paid on your account during this period. If any fund is a shareholder of any underlying mutual funds or exchange-traded funds (ETFs) (the Underlying Funds), such fund indirectly bears its proportional share of the expenses of the Underlying Funds in addition to the direct expenses incurred presented in the table. These fees and expenses are not included in the annualized expense ratio used to calculate the expense estimate in the table below.
Hypothetical Example for Comparison Purposes
The second line of the accompanying table provides information about hypothetical account values and hypothetical expenses based on the actual expense ratio and an assumed rate of return of 5% per year before expenses, which is not the actual return. The hypothetical account values and expenses may not be used to estimate the actual ending account balance or expenses you paid for the period. You may use this information to compare the ongoing costs of investing in the Fund and other funds. To do so, compare this 5% hypothetical example with the 5% hypothetical examples that appear in the shareholder reports of the other funds. If any fund is a shareholder of any Underlying Funds, such fund indirectly bears its proportional share of the expenses of the Underlying Funds in addition to the direct expenses as presented in the table. These fees and expenses are not included in the annualized expense ratio used to calculate the expense estimate in the table below.
Please note that the expenses shown in the table are meant to highlight your ongoing costs only and do not reflect any transaction costs. Therefore, the second line of the table is useful in comparing ongoing costs only, and will not help you determine the relative total costs of owning different funds. In addition, if these transactional costs were included, your costs would have been higher.
| | | | | Annualized Expense Ratio- A | | Beginning Account Value November 1, 2022 | | Ending Account Value April 30, 2023 | | Expenses Paid During Period- C November 1, 2022 to April 30, 2023 |
| Fidelity® Sustainable International Equity Fund | | | | | | | | | | |
| Class A | | | | 1.29% | | | | | | |
| Actual | | | | | | $ 1,000 | | $ 1,214.20 | | $ 7.08 |
Hypothetical- B | | | | | | $ 1,000 | | $ 1,018.40 | | $ 6.46 |
| Class M | | | | 1.55% | | | | | | |
| Actual | | | | | | $ 1,000 | | $ 1,212.00 | | $ 8.50 |
Hypothetical- B | | | | | | $ 1,000 | | $ 1,017.11 | | $ 7.75 |
| Class C | | | | 2.04% | | | | | | |
| Actual | | | | | | $ 1,000 | | $ 1,209.50 | | $ 11.18 |
Hypothetical- B | | | | | | $ 1,000 | | $ 1,014.68 | | $ 10.19 |
| Fidelity® Sustainable International Equity Fund | | | | 1.04% | | | | | | |
| Actual | | | | | | $ 1,000 | | $ 1,215.80 | | $ 5.71 |
Hypothetical- B | | | | | | $ 1,000 | | $ 1,019.64 | | $ 5.21 |
| Class I | | | | 1.04% | | | | | | |
| Actual | | | | | | $ 1,000 | | $ 1,215.80 | | $ 5.71 |
Hypothetical- B | | | | | | $ 1,000 | | $ 1,019.64 | | $ 5.21 |
| Class Z | | | | .90% | | | | | | |
| Actual | | | | | | $ 1,000 | | $ 1,215.50 | | $ 4.94 |
Hypothetical- B | | | | | | $ 1,000 | | $ 1,020.33 | | $ 4.51 |
| |
A Annualized expense ratio reflects expenses net of applicable fee waivers.
B 5% return per year before expenses
C Expenses are equal to the annualized expense ratio, multiplied by the average account value over the period, multiplied by 181/ 365 (to reflect the one-half year period). The fees and expenses of any Underlying Funds are not included in each annualized expense ratio.
The Securities and Exchange Commission adopted Rule 22e-4 under the Investment Company Act of 1940 (the Liquidity Rule) to promote effective liquidity risk management throughout the open-end investment company industry, thereby reducing the risk that funds will be unable to meet their redemption obligations and mitigating dilution of the interests of fund shareholders.
The Fund has adopted and implemented a liquidity risk management program (the Program) reasonably designed to assess and manage the Fund's liquidity risk and to comply with the requirements of the Liquidity Rule. The Fund's Board of Trustees (the Board) has designated the Fund's investment adviser as administrator of the Program. The Fidelity advisers have established a Liquidity Risk Management Committee (the LRM Committee) to manage the Program for each of the Fidelity Funds. The LRM Committee monitors the adequacy and effectiveness of implementation of the Program and on a periodic basis assesses each Fund's liquidity risk based on a variety of factors including (1) the Fund's investment strategy, (2) portfolio liquidity and cash flow projections during normal and reasonably foreseeable stressed conditions, (3) shareholder redemptions, (4) borrowings and other funding sources and (5) certain factors specific to ETFs including the effect of the Fund's prices and spreads, market participants, and basket compositions on the overall liquidity of the Fund's portfolio, as applicable.
In accordance with the Program, each of the Fund's portfolio investments is classified into one of four defined liquidity categories based on a determination of a reasonable expectation for how long it would take to convert the investment to cash (or sell or dispose of the investment) without significantly changing its market value.
- Highly liquid investments - cash or convertible to cash within three business days or less
- Moderately liquid investments - convertible to cash in three to seven calendar days
- Less liquid investments - can be sold or disposed of, but not settled, within seven calendar days
- Illiquid investments - cannot be sold or disposed of within seven calendar days
Liquidity classification determinations take into account a variety of factors including various market, trading and investment-specific considerations, as well as market depth, and generally utilize analysis from a third-party liquidity metrics service.
The Liquidity Rule places a 15% limit on a fund's illiquid investments and requires funds that do not primarily hold assets that are highly liquid investments to determine and maintain a minimum percentage of the fund's net assets to be invested in highly liquid investments (highly liquid investment minimum or HLIM). The Program includes provisions reasonably designed to comply with the 15% limit on illiquid investments and for determining, periodically reviewing and complying with the HLIM requirement as applicable.
At a recent meeting of the Fund's Board of Trustees, the LRM Committee provided a written report to the Board pertaining to the operation, adequacy, and effectiveness of the Program for the period December 1, 2021 through November 30, 2022. The report concluded that the Program is operating effectively and is reasonably designed to assess and manage the Fund's liquidity risk.
1.9904430.101
SIC-SANN-0623
Fidelity's Targeted International Equity Funds®
Fidelity® Canada Fund
Fidelity® China Region Fund
Fidelity® Emerging Asia Fund
Fidelity® Emerging Markets Fund
Fidelity® Europe Fund
Fidelity® Japan Fund
Fidelity® Japan Smaller Companies Fund
Fidelity® Latin America Fund
Fidelity® Nordic Fund
Fidelity® Pacific Basin Fund
Semi-Annual Report
April 30, 2023
Includes Fidelity and Fidelity Advisor share classes
Contents
To view a fund's proxy voting guidelines and proxy voting record for the 12-month period ended June 30, visit http://www.fidelity.com/proxyvotingresults or visit the Securities and Exchange Commission's (SEC) web site at http://www.sec.gov.
You may also call 1-800-544-8544 if you're an individual investing directly with Fidelity, call 1-800-835-5092 if you're a plan sponsor or participant with Fidelity as your recordkeeper or call 1-877-208-0098 on institutional accounts or if you're an advisor or invest through one to request a free copy of the proxy voting guidelines.
Standard & Poor's, S&P and S&P 500 are registered service marks of The McGraw-Hill Companies, Inc. and have been licensed for use by Fidelity Distributors Corporation.
Other third-party marks appearing herein are the property of their respective owners.
All other marks appearing herein are registered or unregistered trademarks or service marks of FMR LLC or an affiliated company. © 2023 FMR LLC. All rights reserved.
This report and the financial statements contained herein are submitted for the general information of the shareholders of the Funds. This report is not authorized for distribution to prospective investors in the Funds unless preceded or accompanied by an effective prospectus.
A fund files its complete schedule of portfolio holdings with the SEC for the first and third quarters of each fiscal year on Form N-PORT. Forms N-PORT are available on the SEC's web site at http://www.sec.gov. A fund's Forms N-PORT may be reviewed and copied at the SEC's Public Reference Room in Washington, DC. Information regarding the operation of the SEC's Public Reference Room may be obtained by calling 1-800-SEC-0330.
For a complete list of a fund's portfolio holdings, view the most recent holdings listing, semiannual report, or annual report on Fidelity's web site at http://www.fidelity.com, http://www.institutional.fidelity.com, or http://www.401k.com, as applicable.
NOT FDIC INSURED •MAY LOSE VALUE •NO BANK GUARANTEE
Neither the Funds nor Fidelity Distributors Corporation is a bank.
Top Holdings (% of Fund's net assets) |
| |
| Royal Bank of Canada (Banks) | 8.3 | |
| The Toronto-Dominion Bank (Banks) | 7.1 | |
| Canadian Pacific Kansas City Ltd. (Ground Transportation) | 6.8 | |
| Alimentation Couche-Tard, Inc. Class A (multi-vtg.) (Consumer Staples Distribution & Retail) | 5.6 | |
| Canadian Natural Resources Ltd. (Oil, Gas & Consumable Fuels) | 5.3 | |
| Franco-Nevada Corp. (Metals & Mining) | 4.4 | |
| Constellation Software, Inc. (Software) | 4.2 | |
| Suncor Energy, Inc. (Oil, Gas & Consumable Fuels) | 4.2 | |
| Nutrien Ltd. (Chemicals) | 3.0 | |
| Wheaton Precious Metals Corp. (Metals & Mining) | 3.0 | |
| | 51.9 | |
| |
| Market Sectors (% of Fund's net assets) |
| |
| Financials | 26.6 | |
| Energy | 17.0 | |
| Industrials | 15.0 | |
| Materials | 13.4 | |
| Consumer Staples | 9.1 | |
| Information Technology | 7.6 | |
| Consumer Discretionary | 6.0 | |
| Communication Services | 4.0 | |
| Health Care | 0.8 | |
| |
Market Sectors may include more than one industry category.
The Fund may invest up to 35% of its total assets in any industry that represents more than 20% of the Canadian market. As of April 30, 2023, the Fund did not have more than 25% of its total assets invested in any one industry.
Asset Allocation (% of Fund's net assets) |
|
|
Geographic Diversification (% of Fund's net assets) |
|
* Includes Short-Term investments and Net Other Assets (Liabilities). Percentages are adjusted for the effect of derivatives, if applicable. |
| |
Fidelity® Canada Fund
Showing Percentage of Net Assets
| Common Stocks - 99.1% |
| | | Shares | Value ($) |
| COMMUNICATION SERVICES - 3.7% | | | |
| Diversified Telecommunication Services - 0.9% | | | |
| TELUS Corp. | | 373,800 | 7,923,782 |
| Interactive Media & Services - 0.0% | | | |
| VerticalScope Holdings, Inc. (a) | | 52,900 | 135,486 |
| Media - 1.2% | | | |
| Quebecor, Inc.: | | | |
| Class A | | 352,400 | 9,080,182 |
| Class B (sub. vtg.) | | 65,500 | 1,690,619 |
| | | | 10,770,801 |
| Wireless Telecommunication Services - 1.6% | | | |
| Rogers Communications, Inc. Class B (non-vtg.) | | 310,200 | 15,326,263 |
TOTAL COMMUNICATION SERVICES | | | 34,156,332 |
| CONSUMER DISCRETIONARY - 6.0% | | | |
| Automobile Components - 0.7% | | | |
| Magna International, Inc. Class A (sub. vtg.) | | 128,500 | 6,699,812 |
| Broadline Retail - 2.7% | | | |
| Dollarama, Inc. | | 404,900 | 25,079,683 |
| Hotels, Restaurants & Leisure - 2.3% | | | |
| Restaurant Brands International, Inc. (b) | | 297,100 | 20,827,810 |
| Specialty Retail - 0.1% | | | |
| Diversified Royalty Corp. (b) | | 588,500 | 1,294,409 |
| Textiles, Apparel & Luxury Goods - 0.2% | | | |
| Canada Goose Holdings, Inc. (a) | | 97,900 | 1,919,197 |
TOTAL CONSUMER DISCRETIONARY | | | 55,820,911 |
| CONSUMER STAPLES - 9.1% | | | |
| Beverages - 0.1% | | | |
| GURU Organic Energy Corp. (a)(b) | | 322,600 | 654,796 |
| Consumer Staples Distribution & Retail - 8.8% | | | |
| Alimentation Couche-Tard, Inc. Class A (multi-vtg.) (b) | | 1,033,200 | 51,566,582 |
| Metro, Inc. | | 341,595 | 19,469,289 |
| Neighbourly Pharmacy, Inc. (b) | | 160,178 | 2,512,295 |
| North West Co., Inc. (b) | | 260,400 | 7,637,964 |
| | | | 81,186,130 |
| Personal Care Products - 0.2% | | | |
| Jamieson Wellness, Inc. (c) | | 99,200 | 2,449,889 |
TOTAL CONSUMER STAPLES | | | 84,290,815 |
| ENERGY - 17.0% | | | |
| Energy Equipment & Services - 0.8% | | | |
| Computer Modelling Group Ltd. | | 531,800 | 2,782,937 |
| Pason Systems, Inc. | | 559,918 | 4,876,579 |
| | | | 7,659,516 |
| Oil, Gas & Consumable Fuels - 16.2% | | | |
| Cameco Corp. | | 243,700 | 6,700,244 |
| Canadian Natural Resources Ltd. | | 802,798 | 48,919,809 |
| Enbridge, Inc. | | 519,500 | 20,655,766 |
| Parkland Corp. | | 521,900 | 12,307,418 |
| PrairieSky Royalty Ltd. (b) | | 1,479,018 | 23,339,414 |
| Suncor Energy, Inc. | | 1,222,800 | 38,285,549 |
| | | | 150,208,200 |
TOTAL ENERGY | | | 157,867,716 |
| FINANCIALS - 26.6% | | | |
| Banks - 15.4% | | | |
| Royal Bank of Canada (b) | | 770,800 | 76,525,305 |
| The Toronto-Dominion Bank (b) | | 1,086,700 | 65,826,821 |
| | | | 142,352,126 |
| Capital Markets - 4.7% | | | |
| Brookfield Asset Management Ltd. Class A | | 466,201 | 15,628,925 |
| Brookfield Corp. (Canada) Class A | | 499,906 | 16,220,148 |
| TMX Group Ltd. | | 121,100 | 12,265,079 |
| | | | 44,114,152 |
| Insurance - 6.5% | | | |
| Definity Financial Corp. | | 388,713 | 10,543,752 |
| Intact Financial Corp. | | 146,625 | 22,179,081 |
| Sun Life Financial, Inc. | | 555,600 | 27,254,069 |
| | | | 59,976,902 |
TOTAL FINANCIALS | | | 246,443,180 |
| HEALTH CARE - 0.8% | | | |
| Health Care Providers & Services - 0.8% | | | |
| Andlauer Healthcare Group, Inc. | | 137,800 | 5,239,014 |
| dentalcorp Holdings Ltd. (a) | | 287,800 | 1,884,183 |
| | | | 7,123,197 |
| INDUSTRIALS - 15.0% | | | |
| Commercial Services & Supplies - 2.8% | | | |
| GFL Environmental, Inc. (b) | | 702,700 | 25,523,022 |
| Ground Transportation - 9.5% | | | |
| Canadian National Railway Co. | | 206,950 | 24,668,727 |
| Canadian Pacific Kansas City Ltd. | | 806,062 | 63,540,186 |
| | | | 88,208,913 |
| Professional Services - 2.7% | | | |
| Thomson Reuters Corp. | | 190,000 | 24,984,611 |
TOTAL INDUSTRIALS | | | 138,716,546 |
| INFORMATION TECHNOLOGY - 7.5% | | | |
| IT Services - 2.4% | | | |
| Shopify, Inc. Class A (a) | | 451,600 | 21,879,193 |
| Software - 5.1% | | | |
| ApplyBoard, Inc. (a)(d)(e) | | 1,677 | 97,182 |
| ApplyBoard, Inc. (non-vtg.) (a)(d)(e) | | 414 | 23,991 |
| Constellation Software, Inc. | | 20,000 | 39,145,588 |
| Dye & Durham Ltd. | | 486,700 | 5,180,067 |
| Enghouse Systems Ltd. | | 55,100 | 1,516,536 |
| Lumine Group, Inc. | | 86,107 | 1,159,872 |
| | | | 47,123,236 |
TOTAL INFORMATION TECHNOLOGY | | | 69,002,429 |
| MATERIALS - 13.4% | | | |
| Chemicals - 3.0% | | | |
| Nutrien Ltd. | | 405,581 | 28,136,368 |
| Containers & Packaging - 1.3% | | | |
| CCL Industries, Inc.: | | | |
| Class A | | 25,900 | 1,213,898 |
| Class B (b) | | 226,000 | 10,627,346 |
| | | | 11,841,244 |
| Metals & Mining - 8.6% | | | |
| Franco-Nevada Corp. | | 268,900 | 40,801,906 |
| Lundin Mining Corp. | | 1,040,200 | 7,946,319 |
| Triple Flag Precious Metals Corp. | | 180,900 | 2,925,430 |
| Wheaton Precious Metals Corp. | | 565,100 | 27,882,743 |
| | | | 79,556,398 |
| Paper & Forest Products - 0.5% | | | |
| Stella-Jones, Inc. | | 95,923 | 3,753,801 |
| Western Forest Products, Inc. | | 1,447,683 | 1,111,260 |
| | | | 4,865,061 |
TOTAL MATERIALS | | | 124,399,071 |
| TOTAL COMMON STOCKS (Cost $519,671,115) | | | 917,820,197 |
| | | | |
| Nonconvertible Preferred Stocks - 0.1% |
| | | Shares | Value ($) |
| INFORMATION TECHNOLOGY - 0.1% | | | |
| Software - 0.1% | | | |
| ApplyBoard, Inc.: | | | |
| Series A1 (a)(d)(e) | | 2,063 | 119,551 |
| Series A2 (a)(d)(e) | | 1,615 | 93,589 |
| Series A3 (a)(d)(e) | | 92 | 5,331 |
| Series D (a)(d)(e) | | 4,504 | 261,007 |
| Series Seed (a)(d)(e) | | 617 | 35,755 |
| (Cost $770,130) | | | 515,233 |
| | | | |
| Convertible Bonds - 0.3% |
| | | Principal Amount (f) | Value ($) |
| COMMUNICATION SERVICES - 0.3% | | | |
| Entertainment - 0.3% | | | |
Cineplex, Inc. 5.75% 9/30/25 (c) (Cost $2,341,803) | CAD | 3,203,000 | 2,387,504 |
| | | | |
| Money Market Funds - 8.0% |
| | | Shares | Value ($) |
| Fidelity Cash Central Fund 4.88% (g) | | 261,505 | 261,557 |
| Fidelity Securities Lending Cash Central Fund 4.88% (g)(h) | | 74,137,444 | 74,144,858 |
| TOTAL MONEY MARKET FUNDS (Cost $74,406,415) | | | 74,406,415 |
| | | | |
| TOTAL INVESTMENT IN SECURITIES - 107.5% (Cost $597,189,463) | 995,129,349 |
NET OTHER ASSETS (LIABILITIES) - (7.5)% | (69,420,812) |
| NET ASSETS - 100.0% | 925,708,537 |
| | |
Currency Abbreviations
Legend
| (b) | Security or a portion of the security is on loan at period end. |
| (c) | Security exempt from registration under Rule 144A of the Securities Act of 1933. These securities may be resold in transactions exempt from registration, normally to qualified institutional buyers. At the end of the period, the value of these securities amounted to $4,837,393 or 0.5% of net assets. |
| (d) | Restricted securities (including private placements) - Investment in securities not registered under the Securities Act of 1933 (excluding 144A issues). At the end of the period, the value of restricted securities (excluding 144A issues) amounted to $636,406 or 0.1% of net assets. |
| (f) | Amount is stated in United States dollars unless otherwise noted. |
| (g) | Affiliated fund that is generally available only to investment companies and other accounts managed by Fidelity Investments. The rate quoted is the annualized seven-day yield of the fund at period end. A complete unaudited listing of the fund's holdings as of its most recent quarter end is available upon request. In addition, each Fidelity Central Fund's financial statements are available on the SEC's website or upon request. |
| (h) | Investment made with cash collateral received from securities on loan. |
| Additional information on each restricted holding is as follows: |
| Security | Acquisition Date | Acquisition Cost ($) |
| ApplyBoard, Inc. | 6/04/21 - 6/30/21 | 85,688 |
| | | |
| ApplyBoard, Inc. (non-vtg.) | 6/30/21 | 44,290 |
| | | |
| ApplyBoard, Inc. Series A1 | 6/04/21 | 133,582 |
| | | |
| ApplyBoard, Inc. Series A2 | 6/04/21 | 104,573 |
| | | |
| ApplyBoard, Inc. Series A3 | 6/04/21 | 5,957 |
| | | |
| ApplyBoard, Inc. Series D | 6/04/21 | 486,066 |
| | | |
| ApplyBoard, Inc. Series Seed | 6/04/21 | 39,952 |
| | | |
Affiliated Central Funds
Fiscal year to date information regarding the Fund's investments in Fidelity Central Funds, including the ownership percentage, is presented below.
| Affiliate | Value, beginning of period ($) | Purchases ($) | Sales Proceeds ($) | Dividend Income ($) | Realized Gain (loss) ($) | Change in Unrealized appreciation (depreciation) ($) | Value, end of period ($) | % ownership, end of period |
| Fidelity Cash Central Fund 4.88% | 505,538 | 17,660,616 | 17,904,597 | 9,705 | - | - | 261,557 | 0.0% |
| Fidelity Securities Lending Cash Central Fund 4.88% | 29,353,183 | 391,163,561 | 346,371,886 | 71,222 | - | - | 74,144,858 | 0.2% |
| Total | 29,858,721 | 408,824,177 | 364,276,483 | 80,927 | - | - | 74,406,415 | |
| | | | | | | | | |
Amounts in the dividend income column in the above table include any capital gain distributions from underlying funds, which are presented in the corresponding line item in the Statement of Operations, if applicable.
Amounts in the dividend income column for Fidelity Securities Lending Cash Central Fund represents the income earned on investing cash collateral, less rebates paid to borrowers and any lending agent fees associated with the loan, plus any premium payments received for lending certain types of securities.
Amounts included in the purchases and sales proceeds columns may include in-kind transactions, if applicable.
Investment Valuation
The following is a summary of the inputs used, as of April 30, 2023, involving the Fund's assets and liabilities carried at fair value. The inputs or methodology used for valuing securities may not be an indication of the risk associated with investing in those securities. For more information on valuation inputs, and their aggregation into the levels used below, please refer to the Investment Valuation section in the accompanying Notes to Financial Statements.
| Valuation Inputs at Reporting Date: |
| Description | Total ($) | Level 1 ($) | Level 2 ($) | Level 3 ($) |
Investments in Securities: | | | | |
|
| Equities: | | | | |
Communication Services | 34,156,332 | 34,156,332 | - | - |
Consumer Discretionary | 55,820,911 | 55,820,911 | - | - |
Consumer Staples | 84,290,815 | 84,290,815 | - | - |
Energy | 157,867,716 | 157,867,716 | - | - |
Financials | 246,443,180 | 246,443,180 | - | - |
Health Care | 7,123,197 | 7,123,197 | - | - |
Industrials | 138,716,546 | 138,716,546 | - | - |
Information Technology | 69,517,662 | 68,881,256 | - | 636,406 |
Materials | 124,399,071 | 124,399,071 | - | - |
|
| Corporate Bonds | 2,387,504 | - | 2,387,504 | - |
|
| Money Market Funds | 74,406,415 | 74,406,415 | - | - |
| Total Investments in Securities: | 995,129,349 | 992,105,439 | 2,387,504 | 636,406 |
Fidelity® Canada Fund
| Statement of Assets and Liabilities |
| | | | April 30, 2023 (Unaudited) |
| | | | | |
| Assets | | | | |
| Investment in securities, at value (including securities loaned of $70,766,456) - See accompanying schedule: | | | | |
Unaffiliated issuers (cost $522,783,048) | $ | 920,722,934 | | |
Fidelity Central Funds (cost $74,406,415) | | 74,406,415 | | |
| | | | | |
| | | | | |
| Total Investment in Securities (cost $597,189,463) | | | $ | 995,129,349 |
| Cash | | | | 3,183 |
| Foreign currency held at value (cost $4,437,140) | | | | 4,461,023 |
| Receivable for fund shares sold | | | | 113,738 |
| Dividends receivable | | | | 1,448,880 |
| Interest receivable | | | | 11,545 |
| Distributions receivable from Fidelity Central Funds | | | | 23,125 |
| Prepaid expenses | | | | 347 |
Total assets | | | | 1,001,191,190 |
| Liabilities | | | | |
| Payable for investments purchased | $ | 43,050 | | |
| Payable for fund shares redeemed | | 457,832 | | |
| Accrued management fee | | 628,883 | | |
| Distribution and service plan fees payable | | 10,544 | | |
| Other affiliated payables | | 164,461 | | |
| Other payables and accrued expenses | | 36,600 | | |
| Collateral on securities loaned | | 74,141,283 | | |
| Total Liabilities | | | | 75,482,653 |
| Net Assets | | | $ | 925,708,537 |
| Net Assets consist of: | | | | |
| Paid in capital | | | $ | 516,912,835 |
| Total accumulated earnings (loss) | | | | 408,795,702 |
| Net Assets | | | $ | 925,708,537 |
| | | | | |
| Net Asset Value and Maximum Offering Price | | | | |
| Class A : | | | | |
Net Asset Value and redemption price per share ($32,641,068 ÷ 525,604 shares) (a) | | | $ | 62.10 |
| Maximum offering price per share (100/94.25 of $62.10) | | | $ | 65.89 |
| Class M : | | | | |
Net Asset Value and redemption price per share ($6,867,741 ÷ 111,049 shares) (a) | | | $ | 61.84 |
| Maximum offering price per share (100/96.50 of $61.84) | | | $ | 64.08 |
| Class C : | | | | |
Net Asset Value and offering price per share ($1,031,092 ÷ 16,797 shares) (a) | | | $ | 61.39 |
| Canada : | | | | |
Net Asset Value , offering price and redemption price per share ($866,932,431 ÷ 13,899,093 shares) | | | $ | 62.37 |
| Class I : | | | | |
Net Asset Value , offering price and redemption price per share ($14,195,529 ÷ 227,412 shares) | | | $ | 62.42 |
| Class Z : | | | | |
Net Asset Value , offering price and redemption price per share ($4,040,676 ÷ 64,974 shares) | | | $ | 62.19 |
(a)Redemption price per share is equal to net asset value less any applicable contingent deferred sales charge. |
| Statement of Operations |
| | | | Six months ended April 30, 2023 (Unaudited) |
| Investment Income | | | | |
| Dividends | | | $ | 11,714,155 |
| Non-Cash dividends | | | | 628,878 |
| Interest | | | | 104,284 |
| Income from Fidelity Central Funds (including $71,222 from security lending) | | | | 80,927 |
| Income before foreign taxes withheld | | | $ | 12,528,244 |
| Less foreign taxes withheld | | | | (1,863,564) |
| Total Income | | | | 10,664,680 |
| Expenses | | | | |
| Management fee | | | | |
| Basic fee | $ | 3,077,184 | | |
| Performance adjustment | | 415,963 | | |
| Transfer agent fees | | 790,225 | | |
| Distribution and service plan fees | | 62,849 | | |
| Accounting fees | | 205,456 | | |
| Custodian fees and expenses | | 11,584 | | |
| Independent trustees' fees and expenses | | 2,848 | | |
| Registration fees | | 59,121 | | |
| Audit | | 31,471 | | |
| Legal | | 1,473 | | |
| Miscellaneous | | 1,933 | | |
| Total expenses before reductions | | 4,660,107 | | |
| Expense reductions | | (21,295) | | |
| Total expenses after reductions | | | | 4,638,812 |
| Net Investment income (loss) | | | | 6,025,868 |
| Realized and Unrealized Gain (Loss) | | | | |
| Net realized gain (loss) on: | | | | |
| Investment Securities: | | | | |
| Unaffiliated issuers | | 10,031,345 | | |
| Foreign currency transactions | | (8,667) | | |
| Total net realized gain (loss) | | | | 10,022,678 |
| Change in net unrealized appreciation (depreciation) on: | | | | |
| Investment Securities: | | | | |
| �� Unaffiliated issuers | | 58,433,435 | | |
| Assets and liabilities in foreign currencies | | 26,893 | | |
| Total change in net unrealized appreciation (depreciation) | | | | 58,460,328 |
| Net gain (loss) | | | | 68,483,006 |
| Net increase (decrease) in net assets resulting from operations | | | $ | 74,508,874 |
| Statement of Changes in Net Assets |
| |
| | Six months ended April 30, 2023 (Unaudited) | | Year ended October 31, 2022 |
| Increase (Decrease) in Net Assets | | | | |
| Operations | | | | |
| Net investment income (loss) | $ | 6,025,868 | $ | 11,825,119 |
| Net realized gain (loss) | | 10,022,678 | | 24,520,329 |
| Change in net unrealized appreciation (depreciation) | | 58,460,328 | | (104,988,178) |
| Net increase (decrease) in net assets resulting from operations | | 74,508,874 | | (68,642,730) |
| Distributions to shareholders | | (34,966,270) | | (44,124,388) |
| Share transactions - net increase (decrease) | | (786,890) | | 99,770,958 |
| Total increase (decrease) in net assets | | 38,755,714 | | (12,996,160) |
| | | | | |
| Net Assets | | | | |
| Beginning of period | | 886,952,823 | | 899,948,983 |
| End of period | $ | 925,708,537 | $ | 886,952,823 |
| | | | | |
| | | | | |
Financial Highlights
| Fidelity Advisor® Canada Fund Class A |
| |
| | Six months ended (Unaudited) April 30, 2023 | | Years ended October 31, 2022 | | 2021 | | 2020 | | 2019 | | 2018 |
Selected Per-Share Data | | | | | | | | | | | | |
| Net asset value, beginning of period | $ | 59.44 | $ | 67.23 | $ | 46.01 | $ | 51.95 | $ | 49.75 | $ | 54.11 |
| Income from Investment Operations | | | | | | | | | | | | |
Net investment income (loss) A,B | | .31 | | .63 | | .55 | | .61 | | .66 | | .60 |
| Net realized and unrealized gain (loss) | | 4.55 | | (5.30) | | 21.89 | | (4.38) | | 4.56 | | (3.88) |
| Total from investment operations | | 4.86 | | (4.67) | | 22.44 | | (3.77) | | 5.22 | | (3.28) |
| Distributions from net investment income | | (.68) | | (.61) | | (.63) | | (.77) | | (.39) | | (.59) |
| Distributions from net realized gain | | (1.52) | | (2.51) | | (.59) | | (1.40) | | (2.63) | | (.49) |
| Total distributions | | (2.20) | | (3.12) | | (1.22) | | (2.17) | | (3.02) | | (1.08) |
Redemption fees added to paid in capital A | | - | | - | | - | | - | | - | | - C |
| Net asset value, end of period | $ | 62.10 | $ | 59.44 | $ | 67.23 | $ | 46.01 | $ | 51.95 | $ | 49.75 |
Total Return D,E,F | | 8.38% | | (7.06)% | | 49.45% | | (7.70)% | | 11.34% | | (6.19)% |
Ratios to Average Net Assets B,G,H | | | | | | | | | | | | |
| Expenses before reductions | | 1.32% I | | 1.20% | | 1.12% | | 1.20% | | 1.20% | | 1.21% |
| Expenses net of fee waivers, if any | | 1.32% I | | 1.20% | | 1.12% | | 1.20% | | 1.20% | | 1.21% |
| Expenses net of all reductions | | 1.32% I | | 1.20% | | 1.12% | | 1.19% | | 1.19% | | 1.20% |
| Net investment income (loss) | | 1.03% I | | 1.00% | | .92% | | 1.27% | | 1.32% | | 1.13% |
| Supplemental Data | | | | | | | | | | | | |
| Net assets, end of period (000 omitted) | $ | 32,641 | $ | 31,707 | $ | 33,087 | $ | 23,395 | $ | 30,598 | $ | 29,420 |
Portfolio turnover rate J | | 9% I | | 13% | | 7% | | 11% | | 8% K | | 29% |
A Calculated based on average shares outstanding during the period.
B Net investment income (loss) is affected by the timing of the declaration of dividends by any underlying mutual funds or exchange-traded funds (ETFs). Net investment income (loss) of any mutual funds or ETFs is not included in the Fund's net investment income (loss) ratio.
C Amount represents less than $.005 per share.
D Total returns for periods of less than one year are not annualized.
E Total returns would have been lower if certain expenses had not been reduced during the applicable periods shown.
F Total returns do not include the effect of the sales charges.
G Fees and expenses of any underlying mutual funds or exchange-traded funds (ETFs) are not included in the Fund's expense ratio. The Fund indirectly bears its proportionate share of these expenses. For additional expense information related to investments in Fidelity Central Funds, please refer to the "Investments in Fidelity Central Funds" note found in the Notes to Financial Statements section of the most recent Annual or Semi-Annual report.
H Expense ratios reflect operating expenses of the class. Expenses before reductions do not reflect amounts reimbursed, waived, or reduced through arrangements with the investment adviser, brokerage services, or other offset arrangements, if applicable, and do not represent the amount paid by the class during periods when reimbursements, waivers or reductions occur.
I Annualized.
J Amount does not include the portfolio activity of any underlying mutual funds or exchange-traded funds (ETFs).
K Portfolio turnover rate excludes securities received or delivered in-kind.
| Fidelity Advisor® Canada Fund Class M |
| |
| | Six months ended (Unaudited) April 30, 2023 | | Years ended October 31, 2022 | | 2021 | | 2020 | | 2019 | | 2018 |
Selected Per-Share Data | | | | | | | | | | | | |
| Net asset value, beginning of period | $ | 59.09 | $ | 66.84 | $ | 45.74 | $ | 51.67 | $ | 49.46 | $ | 53.77 |
| Income from Investment Operations | | | | | | | | | | | | |
Net investment income (loss) A,B | | .23 | | .45 | | .38 | | .47 | | .51 | | .44 |
| Net realized and unrealized gain (loss) | | 4.53 | | (5.26) | | 21.78 | | (4.36) | | 4.55 | | (3.86) |
| Total from investment operations | | 4.76 | | (4.81) | | 22.16 | | (3.89) | | 5.06 | | (3.42) |
| Distributions from net investment income | | (.49) | | (.42) | | (.47) | | (.64) | | (.22) | | (.40) |
| Distributions from net realized gain | | (1.52) | | (2.51) | | (.59) | | (1.40) | | (2.63) | | (.49) |
| Total distributions | | (2.01) | | (2.94) C | | (1.06) | | (2.04) | | (2.85) | | (.89) |
Redemption fees added to paid in capital A | | - | | - | | - | | - | | - | | - D |
| Net asset value, end of period | $ | 61.84 | $ | 59.09 | $ | 66.84 | $ | 45.74 | $ | 51.67 | $ | 49.46 |
Total Return E,F,G | | 8.24% | | (7.32)% | | 49.04% | | (7.95)% | | 11.02% | | (6.47)% |
Ratios to Average Net Assets B,H,I | | | | | | | | | | | | |
| Expenses before reductions | | 1.60% J | | 1.48% | | 1.40% | | 1.47% | | 1.49% | | 1.51% |
| Expenses net of fee waivers, if any | | 1.59% J | | 1.48% | | 1.39% | | 1.47% | | 1.48% | | 1.51% |
| Expenses net of all reductions | | 1.57% J | | 1.48% | | 1.39% | | 1.47% | | 1.48% | | 1.51% |
| Net investment income (loss) | | .77% J | | .72% | | .64% | | .99% | | 1.03% | | .83% |
| Supplemental Data | | | | | | | | | | | | |
| Net assets, end of period (000 omitted) | $ | 6,868 | $ | 6,641 | $ | 7,829 | $ | 5,911 | $ | 8,589 | $ | 7,844 |
Portfolio turnover rate K | | 9% J | | 13% | | 7% | | 11% | | 8% L | | 29% |
A Calculated based on average shares outstanding during the period.
B Net investment income (loss) is affected by the timing of the declaration of dividends by any underlying mutual funds or exchange-traded funds (ETFs). Net investment income (loss) of any mutual funds or ETFs is not included in the Fund's net investment income (loss) ratio.
C Total distributions per share do not sum due to rounding.
D Amount represents less than $.005 per share.
E Total returns for periods of less than one year are not annualized.
F Total returns would have been lower if certain expenses had not been reduced during the applicable periods shown.
G Total returns do not include the effect of the sales charges.
H Fees and expenses of any underlying mutual funds or exchange-traded funds (ETFs) are not included in the Fund's expense ratio. The Fund indirectly bears its proportionate share of these expenses. For additional expense information related to investments in Fidelity Central Funds, please refer to the "Investments in Fidelity Central Funds" note found in the Notes to Financial Statements section of the most recent Annual or Semi-Annual report.
I Expense ratios reflect operating expenses of the class. Expenses before reductions do not reflect amounts reimbursed, waived, or reduced through arrangements with the investment adviser, brokerage services, or other offset arrangements, if applicable, and do not represent the amount paid by the class during periods when reimbursements, waivers or reductions occur.
J Annualized.
K Amount does not include the portfolio activity of any underlying mutual funds or exchange-traded funds (ETFs).
L Portfolio turnover rate excludes securities received or delivered in-kind.
| Fidelity Advisor® Canada Fund Class C |
| |
| | Six months ended (Unaudited) April 30, 2023 | | Years ended October 31, 2022 | | 2021 | | 2020 | | 2019 | | 2018 |
Selected Per-Share Data | | | | | | | | | | | | |
| Net asset value, beginning of period | $ | 58.39 | $ | 65.76 | $ | 44.96 | $ | 50.61 | $ | 48.48 | $ | 52.72 |
| Income from Investment Operations | | | | | | | | | | | | |
Net investment income (loss) A,B | | .08 | | .14 | | .08 | | .24 | | .29 | | .21 |
| Net realized and unrealized gain (loss) | | 4.50 | | (5.19) | | 21.46 | | (4.31) | | 4.47 | | (3.78) |
| Total from investment operations | | 4.58 | | (5.05) | | 21.54 | | (4.07) | | 4.76 | | (3.57) |
| Distributions from net investment income | | (.05) | | - | | (.15) | | (.18) | | - | | (.18) |
| Distributions from net realized gain | | (1.52) | | (2.32) | | (.59) | | (1.40) | | (2.63) | | (.49) |
| Total distributions | | (1.58) C | | (2.32) | | (.74) | | (1.58) | | (2.63) | | (.67) |
Redemption fees added to paid in capital A | | - | | - | | - | | - | | - | | - D |
| Net asset value, end of period | $ | 61.39 | $ | 58.39 | $ | 65.76 | $ | 44.96 | $ | 50.61 | $ | 48.48 |
Total Return E,F,G | | 7.98% | | (7.79)% | | 48.31% | | (8.39)% | | 10.53% | | (6.85)% |
Ratios to Average Net Assets B,H,I | | | | | | | | | | | | |
| Expenses before reductions | | 2.10% J | | 1.99% | | 1.90% | | 1.95% | | 1.92% | | 1.94% |
| Expenses net of fee waivers, if any | | 2.09% J | | 1.98% | | 1.90% | | 1.95% | | 1.92% | | 1.93% |
| Expenses net of all reductions | | 2.09% J | | 1.98% | | 1.90% | | 1.95% | | 1.91% | | 1.93% |
| Net investment income (loss) | | .26% J | | .22% | | .14% | | .51% | | .60% | | .40% |
| Supplemental Data | | | | | | | | | | | | |
| Net assets, end of period (000 omitted) | $ | 1,031 | $ | 1,109 | $ | 1,683 | $ | 3,151 | $ | 6,226 | $ | 11,196 |
Portfolio turnover rate K | | 9% J | | 13% | | 7% | | 11% | | 8% L | | 29% |
A Calculated based on average shares outstanding during the period.
B Net investment income (loss) is affected by the timing of the declaration of dividends by any underlying mutual funds or exchange-traded funds (ETFs). Net investment income (loss) of any mutual funds or ETFs is not included in the Fund's net investment income (loss) ratio.
C Total distributions per share do not sum due to rounding.
D Amount represents less than $.005 per share.
E Total returns for periods of less than one year are not annualized.
F Total returns would have been lower if certain expenses had not been reduced during the applicable periods shown.
G Total returns do not include the effect of the contingent deferred sales charge.
H Fees and expenses of any underlying mutual funds or exchange-traded funds (ETFs) are not included in the Fund's expense ratio. The Fund indirectly bears its proportionate share of these expenses. For additional expense information related to investments in Fidelity Central Funds, please refer to the "Investments in Fidelity Central Funds" note found in the Notes to Financial Statements section of the most recent Annual or Semi-Annual report.
I Expense ratios reflect operating expenses of the class. Expenses before reductions do not reflect amounts reimbursed, waived, or reduced through arrangements with the investment adviser, brokerage services, or other offset arrangements, if applicable, and do not represent the amount paid by the class during periods when reimbursements, waivers or reductions occur.
J Annualized.
K Amount does not include the portfolio activity of any underlying mutual funds or exchange-traded funds (ETFs).
L Portfolio turnover rate excludes securities received or delivered in-kind.
| | Six months ended (Unaudited) April 30, 2023 | | Years ended October 31, 2022 | | 2021 | | 2020 | | 2019 | | 2018 |
Selected Per-Share Data | | | | | | | | | | | | |
| Net asset value, beginning of period | $ | 59.79 | $ | 67.62 | $ | 46.26 | $ | 52.21 | $ | 50.02 | $ | 54.41 |
| Income from Investment Operations | | | | | | | | | | | | |
Net investment income (loss) A,B | | .41 | | .83 | | .74 | | .76 | | .82 | | .77 |
| Net realized and unrealized gain (loss) | | 4.56 | | (5.33) | | 21.99 | | (4.38) | | 4.58 | | (3.90) |
| Total from investment operations | | 4.97 | | (4.50) | | 22.73 | | (3.62) | | 5.40 | | (3.13) |
| Distributions from net investment income | | (.87) | | (.82) | | (.78) | | (.92) | | (.58) | | (.77) |
| Distributions from net realized gain | | (1.52) | | (2.51) | | (.59) | | (1.40) | | (2.63) | | (.49) |
| Total distributions | | (2.39) | | (3.33) | | (1.37) | | (2.33) C | | (3.21) | | (1.26) |
Redemption fees added to paid in capital A | | - | | - | | - | | - | | - | | - D |
| Net asset value, end of period | $ | 62.37 | $ | 59.79 | $ | 67.62 | $ | 46.26 | $ | 52.21 | $ | 50.02 |
Total Return E,F | | 8.55% | | (6.77)% | | 49.91% | | (7.40)% | | 11.70% | | (5.89)% |
Ratios to Average Net Assets B,G,H | | | | | | | | | | | | |
| Expenses before reductions | | 1.01% I | | .89% | | .80% | | .88% | | .88% | | .89% |
| Expenses net of fee waivers, if any | | 1.01% I | | .88% | | .80% | | .88% | | .88% | | .89% |
| Expenses net of all reductions | | 1.01% I | | .88% | | .80% | | .88% | | .87% | | .88% |
| Net investment income (loss) | | 1.34% I | | 1.32% | | 1.24% | | 1.58% | | 1.64% | | 1.45% |
| Supplemental Data | | | | | | | | | | | | |
| Net assets, end of period (000 omitted) | $ | 866,932 | $ | 825,488 | $ | 821,617 | $ | 612,716 | $ | 803,629 | $ | 903,662 |
Portfolio turnover rate J | | 9% I | | 13% | | 7% | | 11% | | 8% K | | 29% |
A Calculated based on average shares outstanding during the period.
B Net investment income (loss) is affected by the timing of the declaration of dividends by any underlying mutual funds or exchange-traded funds (ETFs). Net investment income (loss) of any mutual funds or ETFs is not included in the Fund's net investment income (loss) ratio.
C Total distributions per share do not sum due to rounding.
D Amount represents less than $.005 per share.
E Total returns for periods of less than one year are not annualized.
F Total returns would have been lower if certain expenses had not been reduced during the applicable periods shown.
G Fees and expenses of any underlying mutual funds or exchange-traded funds (ETFs) are not included in the Fund's expense ratio. The Fund indirectly bears its proportionate share of these expenses. For additional expense information related to investments in Fidelity Central Funds, please refer to the "Investments in Fidelity Central Funds" note found in the Notes to Financial Statements section of the most recent Annual or Semi-Annual report.
H Expense ratios reflect operating expenses of the class. Expenses before reductions do not reflect amounts reimbursed, waived, or reduced through arrangements with the investment adviser, brokerage services, or other offset arrangements, if applicable, and do not represent the amount paid by the class during periods when reimbursements, waivers or reductions occur.
I Annualized.
J Amount does not include the portfolio activity of any underlying mutual funds or exchange-traded funds (ETFs).
K Portfolio turnover rate excludes securities received or delivered in-kind.
| Fidelity Advisor® Canada Fund Class I |
| |
| | Six months ended (Unaudited) April 30, 2023 | | Years ended October 31, 2022 | | 2021 | | 2020 | | 2019 | | 2018 |
Selected Per-Share Data | | | | | | | | | | | | |
| Net asset value, beginning of period | $ | 59.84 | $ | 67.70 | $ | 46.24 | $ | 52.11 | $ | 49.93 | $ | 54.29 |
| Income from Investment Operations | | | | | | | | | | | | |
Net investment income (loss) A,B | | .41 | | .85 | | .78 | | .79 | | .85 | | .79 |
| Net realized and unrealized gain (loss) | | 4.57 | | (5.34) | | 22.00 | | (4.39) | | 4.55 | | (3.90) |
| Total from investment operations | | 4.98 | | (4.49) | | 22.78 | | (3.60) | | 5.40 | | (3.11) |
| Distributions from net investment income | | (.88) | | (.86) | | (.73) | | (.87) | | (.59) | | (.77) |
| Distributions from net realized gain | | (1.52) | | (2.51) | | (.59) | | (1.40) | | (2.63) | | (.49) |
| Total distributions | | (2.40) | | (3.37) | | (1.32) | | (2.27) | | (3.22) | | (1.25) C |
Redemption fees added to paid in capital A | | - | | - | | - | | - | | - | | - D |
| Net asset value, end of period | $ | 62.42 | $ | 59.84 | $ | 67.70 | $ | 46.24 | $ | 52.11 | $ | 49.93 |
Total Return E,F | | 8.55% | | (6.74)% | | 50.02% | | (7.35)% | | 11.74% | | (5.86)% |
Ratios to Average Net Assets B,G,H | | | | | | | | | | | | |
| Expenses before reductions | | .99% I | | .86% | | .74% | | .81% | | .84% | | .86% |
| Expenses net of fee waivers, if any | | .99% I | | .86% | | .74% | | .81% | | .84% | | .85% |
| Expenses net of all reductions | | .99% I | | .86% | | .74% | | .81% | | .83% | | .85% |
| Net investment income (loss) | | 1.36% I | | 1.34% | | 1.29% | | 1.65% | | 1.68% | | 1.49% |
| Supplemental Data | | | | | | | | | | | | |
| Net assets, end of period (000 omitted) | $ | 14,196 | $ | 16,165 | $ | 13,724 | $ | 8,392 | $ | 14,507 | $ | 26,923 |
Portfolio turnover rate J | | 9% I | | 13% | | 7% | | 11% | | 8% K | | 29% |
A Calculated based on average shares outstanding during the period.
B Net investment income (loss) is affected by the timing of the declaration of dividends by any underlying mutual funds or exchange-traded funds (ETFs). Net investment income (loss) of any mutual funds or ETFs is not included in the Fund's net investment income (loss) ratio.
C Total distributions per share do not sum due to rounding.
D Amount represents less than $.005 per share.
E Total returns for periods of less than one year are not annualized.
F Total returns would have been lower if certain expenses had not been reduced during the applicable periods shown.
G Fees and expenses of any underlying mutual funds or exchange-traded funds (ETFs) are not included in the Fund's expense ratio. The Fund indirectly bears its proportionate share of these expenses. For additional expense information related to investments in Fidelity Central Funds, please refer to the "Investments in Fidelity Central Funds" note found in the Notes to Financial Statements section of the most recent Annual or Semi-Annual report.
H Expense ratios reflect operating expenses of the class. Expenses before reductions do not reflect amounts reimbursed, waived, or reduced through arrangements with the investment adviser, brokerage services, or other offset arrangements, if applicable, and do not represent the amount paid by the class during periods when reimbursements, waivers or reductions occur.
I Annualized.
J Amount does not include the portfolio activity of any underlying mutual funds or exchange-traded funds (ETFs).
K Portfolio turnover rate excludes securities received or delivered in-kind.
| Fidelity Advisor® Canada Fund Class Z |
| |
| | Six months ended (Unaudited) April 30, 2023 | | Years ended October 31, 2022 | | 2021 | | 2020 | | 2019 | | 2018 A |
Selected Per-Share Data | | | | | | | | | | | | |
| Net asset value, beginning of period | $ | 59.55 | $ | 67.38 | $ | 46.11 | $ | 52.07 | $ | 49.94 | $ | 53.92 |
| Income from Investment Operations | | | | | | | | | | | | |
Net investment income (loss) B,C | | .45 | | .92 | | .82 | | .84 | | .92 | | .06 |
| Net realized and unrealized gain (loss) | | 4.55 | | (5.33) | | 21.91 | | (4.37) | | 4.53 | | (4.04) |
| Total from investment operations | | 5.00 | | (4.41) | | 22.73 | | (3.53) | | 5.45 | | (3.98) |
| Distributions from net investment income | | (.84) | | (.91) | | (.87) | | (1.03) | | (.69) | | - |
| Distributions from net realized gain | | (1.52) | | (2.51) | | (.59) | | (1.40) | | (2.63) | | - |
| Total distributions | | (2.36) | | (3.42) | | (1.46) | | (2.43) | | (3.32) | | - |
| Net asset value, end of period | $ | 62.19 | $ | 59.55 | $ | 67.38 | $ | 46.11 | $ | 52.07 | $ | 49.94 |
Total Return D,E | | 8.63% | | (6.66)% | | 50.13% | | (7.24)% | | 11.87% | | (7.38)% |
Ratios to Average Net Assets C,F,G | | | | | | | | | | | | |
| Expenses before reductions | | .88% H | | .75% | | .66% | | .72% | | .72% | | .80% H |
| Expenses net of fee waivers, if any | | .87% H | | .75% | | .66% | | .72% | | .72% | | .80% H |
| Expenses net of all reductions | | .87% H | | .75% | | .66% | | .72% | | .71% | | .79% H |
| Net investment income (loss) | | 1.47% H | | 1.45% | | 1.38% | | 1.74% | | 1.80% | | 1.48% H |
| Supplemental Data | | | | | | | | | | | | |
| Net assets, end of period (000 omitted) | $ | 4,041 | $ | 5,843 | $ | 22,010 | $ | 15,221 | $ | 20,496 | $ | 128 |
Portfolio turnover rate I | | 9% H | | 13% | | 7% | | 11% | | 8% J | | 29% |
A For the period October 2, 2018 (commencement of sale of shares) through October 31, 2018.
B Calculated based on average shares outstanding during the period.
C Net investment income (loss) is affected by the timing of the declaration of dividends by any underlying mutual funds or exchange-traded funds (ETFs). Net investment income (loss) of any mutual funds or ETFs is not included in the Fund's net investment income (loss) ratio.
D Total returns for periods of less than one year are not annualized.
E Total returns would have been lower if certain expenses had not been reduced during the applicable periods shown.
F Fees and expenses of any underlying mutual funds or exchange-traded funds (ETFs) are not included in the Fund's expense ratio. The Fund indirectly bears its proportionate share of these expenses. For additional expense information related to investments in Fidelity Central Funds, please refer to the "Investments in Fidelity Central Funds" note found in the Notes to Financial Statements section of the most recent Annual or Semi-Annual report.
G Expense ratios reflect operating expenses of the class. Expenses before reductions do not reflect amounts reimbursed, waived, or reduced through arrangements with the investment adviser, brokerage services, or other offset arrangements, if applicable, and do not represent the amount paid by the class during periods when reimbursements, waivers or reductions occur.
H Annualized.
I Amount does not include the portfolio activity of any underlying mutual funds or exchange-traded funds (ETFs).
J Portfolio turnover rate excludes securities received or delivered in-kind.
For the period ended April 30, 2023
1. Organization.
Fidelity Canada Fund (the Fund) is a fund of Fidelity Investment Trust (the Trust) and is authorized to issue an unlimited number of shares. The Trust is registered under the Investment Company Act of 1940, as amended (the 1940 Act), as an open-end management investment company organized as a Massachusetts business trust. The Fund offers Class A, Class M, Class C, Canada, Class I and Class Z shares, each of which has equal rights as to assets and voting privileges. Class A, Class M, Class C, Class I and Class Z are Fidelity Advisor classes. Each class has exclusive voting rights with respect to matters that affect that class. Class C shares will automatically convert to Class A shares after a holding period of eight years from the initial date of purchase, with certain exceptions.
2. Investments in Fidelity Central Funds.
Funds may invest in Fidelity Central Funds, which are open-end investment companies generally available only to other investment companies and accounts managed by the investment adviser and its affiliates. The Schedule of Investments lists any Fidelity Central Funds held as an investment as of period end, but does not include the underlying holdings of each Fidelity Central Fund. An investing fund indirectly bears its proportionate share of the expenses of the underlying Fidelity Central Funds.
Based on its investment objective, each Fidelity Central Fund may invest or participate in various investment vehicles or strategies that are similar to those of the investing fund. These strategies are consistent with the investment objectives of the investing fund and may involve certain economic risks which may cause a decline in value of each of the Fidelity Central Funds and thus a decline in the value of the investing fund.
| Fidelity Central Fund | Investment Manager | Investment Objective | Investment Practices | Expense Ratio A |
| Fidelity Money Market Central Funds | Fidelity Management & Research Company LLC (FMR) | Each fund seeks to obtain a high level of current income consistent with the preservation of capital and liquidity. | Short-term Investments | Less than .005% |
A Expenses expressed as a percentage of average net assets and are as of each underlying Central Fund's most recent annual or semi-annual shareholder report.
A complete unaudited list of holdings for each Fidelity Central Fund is available upon request or at the Securities and Exchange Commission website at www.sec.gov. In addition, the financial statements of the Fidelity Central Funds which contain the significant accounting policies (including investment valuation policies) of those funds, and are not covered by the Report of Independent Registered Public Accounting Firm, are available on the Securities and Exchange Commission website or upon request.
3. Significant Accounting Policies.
The Fund is an investment company and applies the accounting and reporting guidance of the Financial Accounting Standards Board (FASB) Accounting Standards Codification Topic 946 Financial Services - Investment Companies . The financial statements have been prepared in conformity with accounting principles generally accepted in the United States of America (GAAP), which require management to make certain estimates and assumptions at the date of the financial statements. Actual results could differ from those estimates. Subsequent events, if any, through the date that the financial statements were issued have been evaluated in the preparation of the financial statements. The Fund's Schedule of Investments lists any underlying mutual funds or exchange-traded funds (ETFs) but does not include the underlying holdings of these funds. The following summarizes the significant accounting policies of the Fund:
Investment Valuation. Investments are valued as of 4:00 p.m. Eastern time on the last calendar day of the period. The Board of Trustees (the Board) has designated the Fund's investment adviser as the valuation designee responsible for the fair valuation function and performing fair value determinations as needed. The investment adviser has established a Fair Value Committee (the Committee) to carry out the day-to-day fair valuation responsibilities and has adopted policies and procedures to govern the fair valuation process and the activities of the Committee. In accordance with these fair valuation policies and procedures, which have been approved by the Board, the Fund attempts to obtain prices from one or more third party pricing services or brokers to value its investments. When current market prices, quotations or currency exchange rates are not readily available or reliable, investments will be fair valued in good faith by the Committee, in accordance with the policies and procedures. Factors used in determining fair value vary by investment type and may include market or investment specific events, transaction data, estimated cash flows, and market observations of comparable investments. The frequency that the fair valuation procedures are used cannot be predicted and they may be utilized to a significant extent. The Committee manages the Fund's fair valuation practices and maintains the fair valuation policies and procedures. The Fund's investment adviser reports to the Board information regarding the fair valuation process and related material matters.
The Fund categorizes the inputs to valuation techniques used to value its investments into a disclosure hierarchy consisting of three levels as shown below:
Level 1 - unadjusted quoted prices in active markets for identical investments
Level 2 - other significant observable inputs (including quoted prices for similar investments, interest rates, prepayment speeds, etc.)
Level 3 - unobservable inputs (including the Fund's own assumptions based on the best information available)
Valuation techniques used to value the Fund's investments by major category are as follows:
Equity securities, including restricted securities, for which market quotations are readily available, are valued at the last reported sale price or official closing price as reported by a third party pricing service on the primary market or exchange on which they are traded and are categorized as Level 1 in the hierarchy. In the event there were no sales during the day or closing prices are not available, securities are valued at the last quoted bid price or may be valued using the last available price and are generally categorized as Level 2 in the hierarchy. For foreign equity securities, when market or security specific events arise, comparisons to the valuation of American Depositary Receipts (ADRs), futures contracts, ETFs and certain indexes as well as quoted prices for similar securities may be used and would be categorized as Level 2 in the hierarchy. For equity securities, including restricted securities, where observable inputs are limited, assumptions about market activity and risk are used and these securities may be categorized as Level 3 in the hierarchy.
Debt securities, including restricted securities, are valued based on evaluated prices received from third party pricing services or from brokers who make markets in such securities. Corporate bonds are valued by pricing services who utilize matrix pricing which considers yield or price of bonds of comparable quality, coupon, maturity and type or by broker-supplied prices. When independent prices are unavailable or unreliable, debt securities may be valued utilizing pricing methodologies which consider similar factors that would be used by third party pricing services. Debt securities are generally categorized as Level 2 in the hierarchy but may be Level 3 depending on the circumstances.
Investments in open-end mutual funds, including the Fidelity Central Funds, are valued at their closing net asset value (NAV) each business day and are categorized as Level 1 in the hierarchy.
Changes in valuation techniques may result in transfers in or out of an assigned level within the disclosure hierarchy. The aggregate value of investments by input level as of April 30, 2023 is included at the end of the Fund's Schedule of Investments.
Foreign Currency. Certain Funds may use foreign currency contracts to facilitate transactions in foreign-denominated securities. Gains and losses from these transactions may arise from changes in the value of the foreign currency or if the counterparties do not perform under the contracts' terms.
Foreign-denominated assets, including investment securities, and liabilities are translated into U.S. dollars at the exchange rates at period end. Purchases and sales of investment securities, income and dividends received, and expenses denominated in foreign currencies are translated into U.S. dollars at the exchange rate in effect on the transaction date.
The effects of exchange rate fluctuations on investments are included with the net realized and unrealized gain (loss) on investment securities. Other foreign currency transactions resulting in realized and unrealized gain (loss) are disclosed separately.
Investment Transactions and Income. For financial reporting purposes, the Fund's investment holdings and NAV include trades executed through the end of the last business day of the period. The NAV per share for processing shareholder transactions is calculated as of the close of business of the New York Stock Exchange (NYSE), normally 4:00 p.m. Eastern time and includes trades executed through the end of the prior business day. Gains and losses on securities sold are determined on the basis of identified cost. Commissions paid to certain brokers with whom the investment adviser, or its affiliates, places trades on behalf of a fund include an amount in addition to trade execution, which may be rebated back to a fund. Any such rebates are included in net realized gain (loss) on investments in the Statement of Operations. Dividend income is recorded on the ex-dividend date, except for certain dividends from foreign securities where the ex-dividend date may have passed, which are recorded as soon as the Fund is informed of the ex-dividend date. Non-cash dividends included in dividend income, if any, are recorded at the fair market value of the securities received. Income and capital gain distributions from Fidelity Central Funds, if any, are recorded on the ex-dividend date. Certain distributions received by the Fund represent a return of capital or capital gain. The Fund determines the components of these distributions subsequent to the ex-dividend date, based upon receipt of tax filings or other correspondence relating to the underlying investment. These distributions are recorded as a reduction of cost of investments and/or as a realized gain. Interest income is accrued as earned and includes coupon interest and amortization of premium and accretion of discount on debt securities as applicable. Investment income is recorded net of foreign taxes withheld where recovery of such taxes is uncertain.
Class Allocations and Expenses. Investment income, realized and unrealized capital gains and losses, common expenses of a fund, and certain fund-level expense reductions, if any, are allocated daily on a pro-rata basis to each class based on the relative net assets of each class to the total net assets of a fund. Each class differs with respect to transfer agent and distribution and service plan fees incurred, as applicable. Certain expense reductions may also differ by class, if applicable. For the reporting period, the allocated portion of income and expenses to each class as a percent of its average net assets may vary due to the timing of recording these transactions in relation to fluctuating net assets of the classes. Expenses directly attributable to a fund are charged to that fund. Expenses attributable to more than one fund are allocated among the respective funds on the basis of relative net assets or other appropriate methods. Expenses included in the accompanying financial statements reflect the expenses of that fund and do not include any expenses associated with any underlying mutual funds or exchange-traded funds. Although not included in a fund's expenses, a fund indirectly bears its proportionate share of these expenses through the net asset value of each underlying mutual fund or exchange-traded fund. Expense estimates are accrued in the period to which they relate and adjustments are made when actual amounts are known.
Income Tax Information and Distributions to Shareholders. Each year, the Fund intends to qualify as a regulated investment company under Subchapter M of the Internal Revenue Code, including distributing substantially all of its taxable income and realized gains. As a result, no provision for U.S. Federal income taxes is required. The Fund files a U.S. federal tax return, in addition to state and local tax returns as required. The Fund's federal income tax returns are subject to examination by the Internal Revenue Service (IRS) for a period of three fiscal years after they are filed. State and local tax returns may be subject to examination for an additional fiscal year depending on the jurisdiction. Foreign taxes are provided for based on the Fund's understanding of the tax rules and rates that exist in the foreign markets in which it invests.
Distributions are declared and recorded on the ex-dividend date. Income and capital gain distributions are declared separately for each class. Income and capital gain distributions are determined in accordance with income tax regulations, which may differ from GAAP.
Capital accounts within the financial statements are adjusted for permanent book-tax differences. These adjustments have no impact on net assets or the results of operations. Capital accounts are not adjusted for temporary book-tax differences which will reverse in a subsequent period.
Book-tax differences are primarily due to foreign currency transactions, passive foreign investment companies (PFIC) and losses deferred due to wash sales.
As of period end, the cost and unrealized appreciation (depreciation) in securities, and derivatives if applicable, for federal income tax purposes were as follows:
| Gross unrealized appreciation | $424,043,900 |
| Gross unrealized depreciation | (27,319,132) |
| Net unrealized appreciation (depreciation) | $396,724,768 |
| Tax cost | $598,404,581 |
Restricted Securities (including Private Placements). Funds may invest in securities that are subject to legal or contractual restrictions on resale. These securities generally may be resold in transactions exempt from registration or to the public if the securities are registered. Disposal of these securities may involve time-consuming negotiations and expense, and prompt sale at an acceptable price may be difficult. Information regarding restricted securities held at period end is included at the end of the Schedule of Investments, if applicable.
4. Purchases and Sales of Investments.
Purchases and sales of securities, other than short-term securities and in-kind transactions, as applicable, are noted in the table below.
| | Purchases ($) | Sales ($) |
| Fidelity Canada Fund | 40,858,768 | 69,985,829 |
5. Fees and Other Transactions with Affiliates.
Management Fee. Fidelity Management & Research Company LLC (the investment adviser) and its affiliates provide the Fund with investment management related services for which the Fund pays a monthly management fee. The management fee is the sum of an individual fund fee rate that is based on an annual rate of .45% of the Fund's average net assets and an annualized group fee rate that averaged .23% during the period. The group fee rate is based upon the monthly average net assets of a group of registered investment companies with which the investment adviser has management contracts. The group fee rate decreases as assets under management increase and increases as assets under management decrease. In addition, the management fee is subject to a performance adjustment (up to a maximum of +/- .20% of the Fund's average net assets over a 36 month performance period). The upward or downward adjustment to the management fee is based on the relative investment performance of Canada as compared to its benchmark index, the S&P/TSX Composite Index, over the same 36 month performance period. For the reporting period, the total annualized management fee rate, including the performance adjustment, was .77% of the Fund's average net assets. The performance adjustment included in the management fee rate may be higher or lower than the maximum performance adjustment rate due to the difference between the average net assets for the reporting and performance periods.
Distribution and Service Plan Fees. In accordance with Rule 12b-1 of the 1940 Act, the Fund has adopted separate Distribution and Service Plans for each class of shares. Certain classes pay Fidelity Distributors Company LLC (FDC), an affiliate of the investment adviser, separate Distribution and Service Fees, each of which is based on an annual percentage of each class' average net assets. In addition, FDC may pay financial intermediaries for selling shares of the Fund and providing shareholder support services. For the period, the Distribution and Service Fee rates, total fees and amounts retained by FDC were as follows:
| | Distribution Fee | Service Fee | Total Fees | Retained by FDC |
| Class A | - % | .25% | $40,334 | $567 |
| Class M | .25% | .25% | 17,136 | 220 |
| Class C | .75% | .25% | 5,379 | 517 |
| | | | $62,849 | $1,304 |
Sales Load. FDC may receive a front-end sales charge of up to 5.75% for selling Class A shares and 3.50% for selling Class M shares, some of which is paid to financial intermediaries for selling shares of the Fund. Depending on the holding period, FDC may receive contingent deferred sales charges levied on Class A, Class M and Class C redemptions. The deferred sales charges are 1.00% for Class C shares, 1.00% for certain purchases of Class A shares and .25% for certain purchases of Class M shares.
For the period, sales charge amounts retained by FDC were as follows:
| | Retained by FDC |
| Class A | $4,039 |
| Class M | 229 |
Class C A | 176 |
| | $4,444 |
A When Class C shares are initially sold, FDC pays commissions from its own resources to financial intermediaries through which the sales are made.
Transfer Agent Fees. Fidelity Investments Institutional Operations Company LLC (FIIOC), an affiliate of the investment adviser, is the transfer, dividend disbursing and shareholder servicing agent for each class of the Fund. FIIOC receives account fees and asset-based fees that vary according to the account size and type of account of the shareholders of the respective classes of the Fund, except for Class Z. FIIOC receives an asset-based fee of Class Z's average net assets. FIIOC pays for typesetting, printing and mailing of shareholder reports, except proxy statements.
For the period, transfer agent fees for each class were as follows:
| | Amount | % of Class-Level Average Net Assets A |
| Class A | $37,473 | .23 |
| Class M | 8,798 | .26 |
| Class C | 1,383 | .26 |
| Canada | 729,736 | .17 |
| Class I | 12,001 | .16 |
| Class Z | 834 | .04 |
| | $790,225 | |
A Annualized
Accounting Fees. Fidelity Service Company, Inc. (FSC), an affiliate of the investment adviser, maintains the Fund's accounting records. The accounting fee is based on the level of average net assets for each month. For the period, the fees were equivalent to the following annualized rates:
| | % of Average Net Assets |
| Fidelity Canada Fund | .05 |
Interfund Trades. Funds may purchase from or sell securities to other Fidelity Funds under procedures adopted by the Board. The procedures have been designed to ensure these interfund trades are executed in accordance with Rule 17a-7 of the 1940 Act. Any interfund trades are included within the respective purchases and sales amounts shown in the Purchases and Sales of Investments note. Interfund trades during the period are noted in the table below.
| | Purchases ($) | Sales ($) | Realized Gain (Loss) ($) |
| Fidelity Canada Fund | 353,566 | 1,375,811 | 219,355 |
6. Committed Line of Credit.
Certain Funds participate with other funds managed by the investment adviser or an affiliate in a $4.25 billion credit facility (the "line of credit") to be utilized for temporary or emergency purposes to fund shareholder redemptions or for other short-term liquidity purposes. The participating funds have agreed to pay commitment fees on their pro-rata portion of the line of credit, which are reflected in Miscellaneous expenses on the Statement of Operations, and are listed below. During the period, there were no borrowings on this line of credit.
| | Amount |
| Fidelity Canada Fund | $891 |
7. Security Lending.
Funds lend portfolio securities from time to time in order to earn additional income. Lending agents are used, including National Financial Services (NFS), an affiliate of the investment adviser. Pursuant to a securities lending agreement, NFS will receive a fee, which is capped at 9.9% of a fund's daily lending revenue, for its services as lending agent. A fund may lend securities to certain qualified borrowers, including NFS. On the settlement date of the loan, a fund receives collateral (in the form of U.S. Treasury obligations, letters of credit and/or cash) against the loaned securities and maintains collateral in an amount not less than 100% of the market value of the loaned securities during the period of the loan. The market value of the loaned securities is determined at the close of business of a fund and any additional required collateral is delivered to a fund on the next business day. A fund or borrower may terminate the loan at any time, and if the borrower defaults on its obligation to return the securities loaned because of insolvency or other reasons, a fund may apply collateral received from the borrower against the obligation. A fund may experience delays and costs in recovering the securities loaned. Any cash collateral received is invested in the Fidelity Securities Lending Cash Central Fund. Any loaned securities are identified as such in the Schedule of Investments, and the value of loaned securities and cash collateral at period end, as applicable, are presented in the Statement of Assets and Liabilities. Security lending income represents the income earned on investing cash collateral, less rebates paid to borrowers and any lending agent fees associated with the loan, plus any premium payments received for lending certain types of securities. Security lending income is presented in the Statement of Operations as a component of income from Fidelity Central Funds. Affiliated security lending activity, if any, was as follows:
| | Total Security Lending Fees Paid to NFS | Security Lending Income From Securities Loaned to NFS | Value of Securities Loaned to NFS at Period End |
| Fidelity Canada Fund | $7,769 | $- | $- |
8. Expense Reductions.
Through arrangements with each class' transfer agent, credits realized as a result of certain uninvested cash balances were used to reduce the Fund's expenses. During the period, transfer agent credits reduced each class' expenses as noted in the table below.
| | Expense reduction |
| Class A | $77 |
| Class M | 575 |
| Class C | 10 |
| | $662 |
In addition, during the period the investment adviser or an affiliate reimbursed and/or waived a portion of fund-level operating expenses in the amount of $20,633.
9. Distributions to Shareholders.
Distributions to shareholders of each class were as follows:
| | Six months ended April 30, 2023 | Year ended October 31, 2022 |
| Fidelity Canada Fund | | |
| Distributions to shareholders | | |
| Class A | $ 1,149,850 | $1,521,087 |
| Class M | 223,562 | 339,044 |
| Class C | 28,556 | 58,947 |
| Canada | 32,768,937 | 40,254,541 |
| Class I | 643,345 | 818,871 |
| Class Z | 152,020 | 1,131,898 |
Total | $34,966,270 | $44,124,388 |
10. Share Transactions.
Share transactions for each class were as follows and may contain in-kind transactions, automatic conversions between classes or exchanges between affiliated funds:
| | Shares | Shares | Dollars | Dollars |
| | Six months ended April 30, 2023 | Year ended October 31, 2022 | Six months ended April 30, 2023 | Year ended October 31, 2022 |
| Fidelity Canada Fund | | | | |
| Class A | | | | |
| Shares sold | 12,996 | 91,502 | $784,046 | $5,737,202 |
| Reinvestment of distributions | 18,742 | 23,772 | 1,102,198 | 1,449,851 |
| Shares redeemed | (39,549) | (73,975) | (2,406,148) | (4,692,234) |
| Net increase (decrease) | (7,811) | 41,299 | $(519,904) | $2,494,819 |
| Class M | | | | |
| Shares sold | 1,919 | 6,970 | $114,820 | $443,908 |
| Reinvestment of distributions | 3,795 | 5,557 | 222,444 | 337,743 |
| Shares redeemed | (7,042) | (17,269) | (420,348) | (1,094,130) |
| Net increase (decrease) | (1,328) | (4,742) | $(83,084) | $(312,479) |
| Class C | | | | |
| Shares sold | 1,156 | 3,877 | $69,167 | $245,296 |
| Reinvestment of distributions | 490 | 977 | 28,556 | 58,947 |
| Shares redeemed | (3,835) | (11,456) | (230,908) | (711,381) |
| Net increase (decrease) | (2,189) | (6,602) | $(133,185) | $(407,138) |
| Canada | | | | |
| Shares sold | 410,216 | 2,660,313 | $24,967,370 | $168,972,527 |
| Reinvestment of distributions | 524,933 | 619,960 | 30,971,047 | 37,922,967 |
| Shares redeemed | (842,442) | (1,624,197) | (51,321,372) | (101,772,732) |
| Net increase (decrease) | 92,707 | 1,656,076 | $4,617,045 | $105,122,762 |
| Class I | | | | |
| Shares sold | 35,576 | 238,697 | $2,148,035 | $15,537,489 |
| Reinvestment of distributions | 10,141 | 12,737 | 598,723 | 779,507 |
| Shares redeemed | (88,462) | (183,998) | (5,338,495) | (11,689,703) |
| Net increase (decrease) | (42,745) | 67,436 | $(2,591,737) | $4,627,293 |
| Class Z | | | | |
| Shares sold | 21,520 | 156,264 | $1,278,433 | $10,087,519 |
| Reinvestment of distributions | 2,264 | 18,285 | 133,088 | 1,112,618 |
| Shares redeemed | (56,929) | (403,081) | (3,487,546) | (22,954,436) |
| Net increase (decrease) | (33,145) | (228,532) | $(2,076,025) | $(11,754,299) |
11. Other.
A fund's organizational documents provide former and current trustees and officers with a limited indemnification against liabilities arising in connection with the performance of their duties to the fund. In the normal course of business, a fund may also enter into contracts that provide general indemnifications. A fund's maximum exposure under these arrangements is unknown as this would be dependent on future claims that may be made against a fund. The risk of material loss from such claims is considered remote.
12. Risk and Uncertainties.
Many factors affect a fund's performance. Developments that disrupt global economies and financial markets, such as pandemics, epidemics, outbreaks of infectious diseases, war, terrorism, and environmental disasters, may significantly affect a fund's investment performance. The effects of these developments to a fund will be impacted by the types of securities in which a fund invests, the financial condition, industry, economic sector, and geographic location of an issuer, and a fund's level of investment in the securities of that issuer. Significant concentrations in security types, issuers, industries, sectors, and geographic locations may magnify the factors that affect a fund's performance.
Top Holdings (% of Fund's net assets) |
| |
| Taiwan Semiconductor Manufacturing Co. Ltd. (Semiconductors & Semiconductor Equipment) | 17.8 | |
| Tencent Holdings Ltd. (Interactive Media & Services) | 9.9 | |
| Alibaba Group Holding Ltd. (Broadline Retail) | 5.6 | |
| AIA Group Ltd. (Insurance) | 5.0 | |
| Meituan Class B (Hotels, Restaurants & Leisure) | 4.0 | |
| China Construction Bank Corp. (H Shares) (Banks) | 2.4 | |
| Industrial & Commercial Bank of China Ltd. (H Shares) (Banks) | 2.2 | |
| Hong Kong Exchanges and Clearing Ltd. (Capital Markets) | 2.1 | |
| Zijin Mining Group Co. Ltd. (H Shares) (Metals & Mining) | 2.1 | |
| Kweichow Moutai Co. Ltd. (A Shares) (Beverages) | 2.0 | |
| | 53.1 | |
| |
| Market Sectors (% of Fund's net assets) |
| |
| Information Technology | 25.2 | |
| Consumer Discretionary | 22.5 | |
| Financials | 16.1 | |
| Communication Services | 14.0 | |
| Health Care | 5.7 | |
| Consumer Staples | 4.6 | |
| Industrials | 3.8 | |
| Materials | 3.1 | |
| Real Estate | 2.5 | |
| Energy | 1.3 | |
| |
Market Sectors may include more than one industry category.
The Fund may invest up to 35% of its total assets in any industry that represents more than 20% of the Hong Kong, Taiwanese and Chinese markets. As of April 30, 2023, the Fund did not have more than 25% of its total assets invested in any one industry.
Asset Allocation (% of Fund's net assets) |
|
|
Geographic Diversification (% of Fund's net assets) |
|
* Includes Short-Term investments and Net Other Assets (Liabilities). Percentages are adjusted for the effect of derivatives, if applicable. |
| |
Fidelity® China Region Fund
Showing Percentage of Net Assets
| Common Stocks - 96.7% |
| | | Shares | Value ($) |
| COMMUNICATION SERVICES - 13.3% | | | |
| Entertainment - 3.4% | | | |
| Bilibili, Inc. ADR (a) | | 92,200 | 1,877,192 |
| NetEase, Inc. | | 1,190,900 | 21,200,880 |
| Sea Ltd. ADR (a) | | 182,800 | 13,923,876 |
| | | | 37,001,948 |
| Interactive Media & Services - 9.9% | | | |
| Tencent Holdings Ltd. | | 2,387,700 | 106,052,360 |
TOTAL COMMUNICATION SERVICES | | | 143,054,308 |
| CONSUMER DISCRETIONARY - 22.5% | | | |
| Automobiles - 3.0% | | | |
| Brilliance China Automotive Holdings Ltd. | | 1,668,000 | 701,165 |
| BYD Co. Ltd. (H Shares) | | 290,000 | 8,794,613 |
| Great Wall Motor Co. Ltd. (H Shares) (b) | | 4,248,500 | 5,155,880 |
| Guangzhou Automobile Group Co. Ltd. (H Shares) | | 9,646,000 | 6,020,233 |
| Li Auto, Inc.: | | | |
| ADR (a) | | 387,000 | 9,094,500 |
| Class A (a) | | 249,800 | 2,958,596 |
| | | | 32,724,987 |
| Broadline Retail - 7.9% | | | |
| Alibaba Group Holding Ltd. (a) | | 5,675,200 | 60,007,447 |
| JD.com, Inc.: | | | |
| Class A | | 309,300 | 5,520,338 |
| sponsored ADR | | 61,700 | 2,203,924 |
| PDD Holdings, Inc. ADR (a) | | 249,805 | 17,024,211 |
| | | | 84,755,920 |
| Hotels, Restaurants & Leisure - 7.1% | | | |
| Galaxy Entertainment Group Ltd. | | 1,411,000 | 10,042,504 |
| Meituan Class B (a)(c) | | 2,547,758 | 43,542,349 |
| TravelSky Technology Ltd. (H Shares) | | 3,063,000 | 6,114,140 |
| Trip.com Group Ltd. (a) | | 144,000 | 5,119,911 |
| Trip.com Group Ltd. ADR (a) | | 330,400 | 11,732,504 |
| | | | 76,551,408 |
| Household Durables - 1.0% | | | |
| Haier Smart Home Co. Ltd. (A Shares) | | 3,282,727 | 11,287,301 |
| Specialty Retail - 0.6% | | | |
| China Tourism Group Duty Free Corp. Ltd. (A Shares) | | 262,200 | 6,131,597 |
| Textiles, Apparel & Luxury Goods - 2.9% | | | |
| Li Ning Co. Ltd. | | 1,458,000 | 10,427,059 |
| LVMH Moet Hennessy Louis Vuitton SE | | 15,900 | 15,293,913 |
| Shenzhou International Group Holdings Ltd. | | 555,300 | 5,333,749 |
| | | | 31,054,721 |
TOTAL CONSUMER DISCRETIONARY | | | 242,505,934 |
| CONSUMER STAPLES - 4.6% | | | |
| Beverages - 2.8% | | | |
| Kweichow Moutai Co. Ltd. (A Shares) | | 84,845 | 21,648,585 |
| Wuliangye Yibin Co. Ltd. (A Shares) | | 337,760 | 8,271,344 |
| | | | 29,919,929 |
| Food Products - 0.8% | | | |
| Uni-President Enterprises Corp. | | 3,562,000 | 8,533,423 |
| Household Products - 0.4% | | | |
| C&S Paper Co. Ltd. (A Shares) | | 2,955,102 | 5,043,398 |
| Personal Care Products - 0.6% | | | |
| Proya Cosmetics Co. Ltd. (A Shares) | | 267,260 | 6,502,292 |
TOTAL CONSUMER STAPLES | | | 49,999,042 |
| ENERGY - 1.3% | | | |
| Energy Equipment & Services - 1.3% | | | |
| China Oilfield Services Ltd. (H Shares) | | 12,112,000 | 14,246,424 |
| FINANCIALS - 16.1% | | | |
| Banks - 5.8% | | | |
| China Construction Bank Corp. (H Shares) | | 39,046,610 | 26,103,690 |
| E.SUN Financial Holdings Co. Ltd. | | 10,799,144 | 8,776,283 |
| Hang Seng Bank Ltd. | | 248,800 | 3,687,926 |
| Industrial & Commercial Bank of China Ltd. (H Shares) | | 43,988,000 | 23,665,732 |
| | | | 62,233,631 |
| Capital Markets - 2.1% | | | |
| Hong Kong Exchanges and Clearing Ltd. | | 560,200 | 23,257,767 |
| Financial Services - 1.1% | | | |
| Far East Horizon Ltd. | | 13,122,500 | 11,805,292 |
| Far East Horizon Ltd. rights (a) | | 110,273 | 0 |
| | | | 11,805,292 |
| Insurance - 7.1% | | | |
| AIA Group Ltd. | | 4,969,200 | 54,100,057 |
| China Pacific Insurance (Group) Co. Ltd. (H Shares) | | 3,278,800 | 9,793,884 |
| Ping An Insurance Group Co. of China Ltd. (H Shares) | | 955,500 | 6,970,870 |
| Prudential PLC | | 359,500 | 5,500,724 |
| | | | 76,365,535 |
TOTAL FINANCIALS | | | 173,662,225 |
| HEALTH CARE - 5.5% | | | |
| Biotechnology - 1.4% | | | |
| Innovent Biologics, Inc. (a)(c) | | 1,021,000 | 4,909,042 |
| Zai Lab Ltd. (a) | | 986,000 | 3,452,085 |
| Zai Lab Ltd. ADR (a) | | 182,900 | 6,397,842 |
| | | | 14,758,969 |
| Health Care Equipment & Supplies - 1.1% | | | |
| MicroTech Medical (Hangzhou) Co. Ltd. (H Shares) (a)(c) | | 2,176,600 | 1,913,229 |
| Shenzhen Mindray Bio-Medical Electronics Co. Ltd. (A Shares) | | 211,015 | 9,539,929 |
| | | | 11,453,158 |
| Life Sciences Tools & Services - 1.7% | | | |
| Hangzhou Tigermed Consulting Co. Ltd. (H Shares) (c) | | 391,600 | 3,262,107 |
| Pharmaron Beijing Co. Ltd. (H Shares) (c) | | 614,900 | 2,665,848 |
| WuXi AppTec Co. Ltd. (H Shares) (c) | | 346,500 | 3,047,444 |
| Wuxi Biologics (Cayman), Inc. (a)(c) | | 1,622,500 | 9,674,707 |
| | | | 18,650,106 |
| Pharmaceuticals - 1.3% | | | |
| Asymchem Laboratories Tianjin Co. Ltd. (H Shares) (b)(c) | | 453,940 | 5,705,085 |
| Hansoh Pharmaceutical Group Co. Ltd. (c) | | 3,340,000 | 6,093,172 |
| Zhejiang Starry Pharmaceutical Co. Ltd. | | 907,233 | 2,274,710 |
| | | | 14,072,967 |
TOTAL HEALTH CARE | | | 58,935,200 |
| INDUSTRIALS - 3.8% | | | |
| Aerospace & Defense - 0.1% | | | |
| Space Exploration Technologies Corp. Class A (a)(d)(e) | | 10,000 | 770,000 |
| Air Freight & Logistics - 0.4% | | | |
| Milkyway Chemical Supply Chain Service Co. Ltd. (A Shares) | | 308,329 | 4,128,577 |
| Construction & Engineering - 0.6% | | | |
| China State Construction International Holdings Ltd. | | 5,064,000 | 6,296,079 |
| Electrical Equipment - 0.3% | | | |
| Sungrow Power Supply Co. Ltd. (A Shares) | | 191,634 | 3,137,379 |
| Machinery - 2.2% | | | |
| Shenzhen Inovance Technology Co. Ltd. (A Shares) | | 1,038,213 | 9,299,180 |
| Sinotruk Hong Kong Ltd. | | 1,842,500 | 2,815,785 |
| Techtronic Industries Co. Ltd. | | 454,500 | 4,917,003 |
| Weichai Power Co. Ltd. (H Shares) | | 3,298,000 | 4,874,910 |
| Zhejiang Sanhua Intelligent Controls Co. Ltd. (A Shares) | | 693,784 | 2,347,518 |
| | | | 24,254,396 |
| Professional Services - 0.2% | | | |
| Centre Testing International Group Co. Ltd. (A Shares) | | 923,700 | 2,577,204 |
TOTAL INDUSTRIALS | | | 41,163,635 |
| INFORMATION TECHNOLOGY - 24.1% | | | |
| Communications Equipment - 0.2% | | | |
| ZTE Corp. (H Shares) | | 772,800 | 2,489,024 |
| Electronic Equipment, Instruments & Components - 1.1% | | | |
| Hon Hai Precision Industry Co. Ltd. (Foxconn) | | 2,213,000 | 7,535,638 |
| Yageo Corp. | | 287,000 | 4,649,292 |
| | | | 12,184,930 |
| IT Services - 0.2% | | | |
| Vnet Group, Inc. ADR (a) | | 913,783 | 2,686,522 |
| Semiconductors & Semiconductor Equipment - 22.3% | | | |
| eMemory Technology, Inc. | | 190,481 | 11,381,239 |
| MediaTek, Inc. | | 714,000 | 15,514,256 |
| Micron Technology, Inc. | | 102,100 | 6,571,156 |
| Parade Technologies Ltd. | | 293,608 | 8,986,205 |
| Silergy Corp. | | 380,000 | 5,993,853 |
| Taiwan Semiconductor Manufacturing Co. Ltd. | | 11,717,000 | 191,738,734 |
| | | | 240,185,443 |
| Software - 0.3% | | | |
| LongShine Technology Group Co. Ltd. (A Shares) | | 781,600 | 2,715,550 |
TOTAL INFORMATION TECHNOLOGY | | | 260,261,469 |
| MATERIALS - 3.1% | | | |
| Chemicals - 0.1% | | | |
| Weihai Guangwei Composites Co. Ltd. (A Shares) | | 106,058 | 800,540 |
| Construction Materials - 0.3% | | | |
| West China Cement Ltd. | | 24,942,000 | 3,090,531 |
| Containers & Packaging - 0.6% | | | |
| Shenzhen YUTO Packaging Technology Co. Ltd. (A Shares) | | 1,974,671 | 7,247,761 |
| Metals & Mining - 2.1% | | | |
| Zijin Mining Group Co. Ltd. (H Shares) | | 13,316,000 | 22,544,729 |
TOTAL MATERIALS | | | 33,683,561 |
| REAL ESTATE - 2.4% | | | |
| Real Estate Management & Development - 2.4% | | | |
| China Resources Mixc Lifestyle Services Ltd. (c) | | 1,142,000 | 6,054,434 |
| Hysan Development Co. Ltd. | | 925,000 | 2,614,092 |
| KE Holdings, Inc. ADR (a) | | 580,131 | 9,102,255 |
| Longfor Properties Co. Ltd. (c) | | 2,394,000 | 6,551,178 |
| Seazen Group Ltd. (a) | | 7,250,000 | 1,558,469 |
| | | | 25,880,428 |
| TOTAL COMMON STOCKS (Cost $935,104,632) | | | 1,043,392,226 |
| | | | |
| Preferred Stocks - 2.1% |
| | | Shares | Value ($) |
| Convertible Preferred Stocks - 0.9% | | | |
| COMMUNICATION SERVICES - 0.7% | | | |
| Interactive Media & Services - 0.7% | | | |
| ByteDance Ltd. Series E1 (a)(d)(e) | | 38,752 | 7,711,648 |
| | | | |
| HEALTH CARE - 0.2% | | | |
| Health Care Providers & Services - 0.2% | | | |
| dMed Biopharmaceutical Co. Ltd. Series C (a)(d)(e) | | 275,211 | 2,441,122 |
| | | | |
| TOTAL CONVERTIBLE PREFERRED STOCKS | | | 10,152,770 |
| Nonconvertible Preferred Stocks - 1.2% | | | |
| INFORMATION TECHNOLOGY - 1.1% | | | |
| Technology Hardware, Storage & Peripherals - 1.1% | | | |
| Samsung Electronics Co. Ltd. | | 273,930 | 11,456,149 |
| | | | |
| REAL ESTATE - 0.1% | | | |
| Real Estate Management & Development - 0.1% | | | |
| ZKH Group Ltd. Series F (e) | | 3,131,343 | 1,158,597 |
| | | | |
| TOTAL NONCONVERTIBLE PREFERRED STOCKS | | | 12,614,746 |
| TOTAL PREFERRED STOCKS (Cost $21,962,567) | | | 22,767,516 |
| | | | |
| Money Market Funds - 1.6% |
| | | Shares | Value ($) |
| Fidelity Cash Central Fund 4.88% (f) | | 12,336,943 | 12,339,410 |
| Fidelity Securities Lending Cash Central Fund 4.88% (f)(g) | | 4,281,030 | 4,281,458 |
| TOTAL MONEY MARKET FUNDS (Cost $16,620,868) | | | 16,620,868 |
| | | | |
| TOTAL INVESTMENT IN SECURITIES - 100.4% (Cost $973,688,067) | 1,082,780,610 |
NET OTHER ASSETS (LIABILITIES) - (0.4)% | (4,110,648) |
| NET ASSETS - 100.0% | 1,078,669,962 |
| | |
Legend
| (b) | Security or a portion of the security is on loan at period end. |
| (c) | Security exempt from registration under Rule 144A of the Securities Act of 1933. These securities may be resold in transactions exempt from registration, normally to qualified institutional buyers. At the end of the period, the value of these securities amounted to $93,418,595 or 8.7% of net assets. |
| (d) | Restricted securities (including private placements) - Investment in securities not registered under the Securities Act of 1933 (excluding 144A issues). At the end of the period, the value of restricted securities (excluding 144A issues) amounted to $10,922,770 or 1.0% of net assets. |
| (f) | Affiliated fund that is generally available only to investment companies and other accounts managed by Fidelity Investments. The rate quoted is the annualized seven-day yield of the fund at period end. A complete unaudited listing of the fund's holdings as of its most recent quarter end is available upon request. In addition, each Fidelity Central Fund's financial statements are available on the SEC's website or upon request. |
| (g) | Investment made with cash collateral received from securities on loan. |
| Additional information on each restricted holding is as follows: |
| Security | Acquisition Date | Acquisition Cost ($) |
| ByteDance Ltd. Series E1 | 11/18/20 | 4,246,219 |
| | | |
| dMed Biopharmaceutical Co. Ltd. Series C | 12/01/20 | 3,908,863 |
| | | |
| Space Exploration Technologies Corp. Class A | 2/16/21 | 419,990 |
| | | |
Affiliated Central Funds
Fiscal year to date information regarding the Fund's investments in Fidelity Central Funds, including the ownership percentage, is presented below.
| Affiliate | Value, beginning of period ($) | Purchases ($) | Sales Proceeds ($) | Dividend Income ($) | Realized Gain (loss) ($) | Change in Unrealized appreciation (depreciation) ($) | Value, end of period ($) | % ownership, end of period |
| Fidelity Cash Central Fund 4.88% | 31,370,924 | 122,572,058 | 141,603,572 | 362,889 | - | - | 12,339,410 | 0.0% |
| Fidelity Securities Lending Cash Central Fund 4.88% | 4,494,305 | 72,942,082 | 73,154,929 | 51,700 | - | - | 4,281,458 | 0.0% |
| Total | 35,865,229 | 195,514,140 | 214,758,501 | 414,589 | - | - | 16,620,868 | |
| | | | | | | | | |
Amounts in the dividend income column in the above table include any capital gain distributions from underlying funds, which are presented in the corresponding line item in the Statement of Operations, if applicable.
Amounts in the dividend income column for Fidelity Securities Lending Cash Central Fund represents the income earned on investing cash collateral, less rebates paid to borrowers and any lending agent fees associated with the loan, plus any premium payments received for lending certain types of securities.
Amounts included in the purchases and sales proceeds columns may include in-kind transactions, if applicable.
Investment Valuation
The following is a summary of the inputs used, as of April 30, 2023, involving the Fund's assets and liabilities carried at fair value. The inputs or methodology used for valuing securities may not be an indication of the risk associated with investing in those securities. For more information on valuation inputs, and their aggregation into the levels used below, please refer to the Investment Valuation section in the accompanying Notes to Financial Statements.
| Valuation Inputs at Reporting Date: |
| Description | Total ($) | Level 1 ($) | Level 2 ($) | Level 3 ($) |
Investments in Securities: | | | | |
|
| Equities: | | | | |
Communication Services | 150,765,956 | 15,801,068 | 127,253,240 | 7,711,648 |
Consumer Discretionary | 242,505,934 | 40,055,139 | 202,450,795 | - |
Consumer Staples | 49,999,042 | - | 49,999,042 | - |
Energy | 14,246,424 | - | 14,246,424 | - |
Financials | 173,662,225 | - | 173,662,225 | - |
Health Care | 61,376,322 | 6,397,842 | 52,537,358 | 2,441,122 |
Industrials | 41,163,635 | - | 40,393,635 | 770,000 |
Information Technology | 271,717,618 | 9,257,678 | 262,459,940 | - |
Materials | 33,683,561 | - | 33,683,561 | - |
Real Estate | 27,039,025 | 9,102,255 | 16,778,173 | 1,158,597 |
|
| Money Market Funds | 16,620,868 | 16,620,868 | - | - |
| Total Investments in Securities: | 1,082,780,610 | 97,234,850 | 973,464,393 | 12,081,367 |
The following is a reconciliation of Investments in Securities for which Level 3 inputs were used in determining value:
| |
| Investments in Securities: | |
| Beginning Balance | $ | 11,025,509 | |
| Net Realized Gain (Loss) on Investment Securities | | - | |
| Net Unrealized Gain (Loss) on Investment Securities | | 1,055,858 | |
| Cost of Purchases | | - | |
| Proceeds of Sales | | - | |
| Amortization/Accretion | | - | |
| Transfers into Level 3 | | - | |
| Transfers out of Level 3 | | - | |
| Ending Balance | $ | 12,081,367 | |
| The change in unrealized gain (loss) for the period attributable to Level 3 securities held at April 30, 2023 | $ | 1,055,858 | |
| The information used in the above reconciliation represents fiscal year to date activity for any Investments in Securities identified as using Level 3 inputs at either the beginning or the end of the current fiscal period. Cost of purchases and proceeds of sales may include securities received and/or delivered through in-kind transactions, corporate actions or exchanges. Transfers into Level 3 were attributable to a lack of observable market data resulting from decreases in market activity, decreases in liquidity, security restructurings or corporate actions. Transfers out of Level 3 were attributable to observable market data becoming available for those securities. Transfers in or out of Level 3 represent the beginning value of any Security or Instrument where a change in the pricing level occurred from the beginning to the end of the period. Realized and unrealized gains (losses) disclosed in the reconciliation are included in Net Gain (Loss) on the Fund's Statement of Operations. | |
Fidelity® China Region Fund
| Statement of Assets and Liabilities |
| | | | April 30, 2023 (Unaudited) |
| | | | | |
| Assets | | | | |
| Investment in securities, at value (including securities loaned of $3,505,799) - See accompanying schedule: | | | | |
Unaffiliated issuers (cost $957,067,199) | $ | 1,066,159,742 | | |
Fidelity Central Funds (cost $16,620,868) | | 16,620,868 | | |
| | | | | |
| | | | | |
| Total Investment in Securities (cost $973,688,067) | | | $ | 1,082,780,610 |
| Foreign currency held at value (cost $54) | | | | 54 |
| Receivable for investments sold | | | | 8,692,914 |
| Receivable for fund shares sold | | | | 643,392 |
| Dividends receivable | | | | 377,657 |
| Distributions receivable from Fidelity Central Funds | | | | 68,899 |
| Prepaid expenses | | | | 472 |
| Other receivables | | | | 17,238 |
Total assets | | | | 1,092,581,236 |
| Liabilities | | | | |
| Payable for investments purchased | $ | 8,035,257 | | |
| Payable for fund shares redeemed | | 632,239 | | |
| Accrued management fee | | 627,159 | | |
| Distribution and service plan fees payable | | 16,544 | | |
| Other affiliated payables | | 211,715 | | |
| Other payables and accrued expenses | | 108,360 | | |
| Collateral on securities loaned | | 4,280,000 | | |
| Total Liabilities | | | | 13,911,274 |
| Net Assets | | | $ | 1,078,669,962 |
| Net Assets consist of: | | | | |
| Paid in capital | | | $ | 1,116,097,173 |
| Total accumulated earnings (loss) | | | | (37,427,211) |
| Net Assets | | | $ | 1,078,669,962 |
| | | | | |
| Net Asset Value and Maximum Offering Price | | | | |
| Class A : | | | | |
Net Asset Value and redemption price per share ($26,649,775 ÷ 807,657 shares) (a) | | | $ | 33.00 |
| Maximum offering price per share (100/94.25 of $33.00) | | | $ | 35.01 |
| Class M : | | | | |
Net Asset Value and redemption price per share ($8,639,886 ÷ 263,946 shares) (a) | | | $ | 32.73 |
| Maximum offering price per share (100/96.50 of $32.73) | | | $ | 33.92 |
| Class C : | | | | |
Net Asset Value and offering price per share ($7,719,748 ÷ 245,914 shares) (a) | | | $ | 31.39 |
| China Region : | | | | |
Net Asset Value , offering price and redemption price per share ($977,872,613 ÷ 29,220,912 shares) | | | $ | 33.46 |
| Class I : | | | | |
Net Asset Value , offering price and redemption price per share ($45,195,772 ÷ 1,361,256 shares) | | | $ | 33.20 |
| Class Z : | | | | |
Net Asset Value , offering price and redemption price per share ($12,592,168 ÷ 379,136 shares) | | | $ | 33.21 |
(a)Redemption price per share is equal to net asset value less any applicable contingent deferred sales charge. |
| Statement of Operations |
| | | | Six months ended April 30, 2023 (Unaudited) |
| Investment Income | | | | |
| Dividends | | | $ | 8,285,840 |
| Income from Fidelity Central Funds (including $51,700 from security lending) | | | | 414,589 |
| Income before foreign taxes withheld | | | $ | 8,700,429 |
| Less foreign taxes withheld | | | | (498,744) |
| Total Income | | | | 8,201,685 |
| Expenses | | | | |
| Management fee | $ | 3,704,234 | | |
| Transfer agent fees | | 1,001,247 | | |
| Distribution and service plan fees | | 96,131 | | |
| Accounting fees | | 242,095 | | |
| Custodian fees and expenses | | 116,423 | | |
| Independent trustees' fees and expenses | | 3,589 | | |
| Registration fees | | 57,555 | | |
| Audit | | 47,481 | | |
| Legal | | 1,303 | | |
| Miscellaneous | | 2,471 | | |
| Total expenses before reductions | | 5,272,529 | | |
| Expense reductions | | (27,271) | | |
| Total expenses after reductions | | | | 5,245,258 |
| Net Investment income (loss) | | | | 2,956,427 |
| Realized and Unrealized Gain (Loss) | | | | |
| Net realized gain (loss) on: | | | | |
| Investment Securities: | | | | |
| Unaffiliated issuers | | 2,796,089 | | |
| Foreign currency transactions | | 206,377 | | |
| Total net realized gain (loss) | | | | 3,002,466 |
| Change in net unrealized appreciation (depreciation) on: | | | | |
| Investment Securities: | | | | |
| Unaffiliated issuers | | 254,557,372 | | |
| Assets and liabilities in foreign currencies | | 314,425 | | |
| Total change in net unrealized appreciation (depreciation) | | | | 254,871,797 |
| Net gain (loss) | | | | 257,874,263 |
| Net increase (decrease) in net assets resulting from operations | | | $ | 260,830,690 |
| Statement of Changes in Net Assets |
| |
| | Six months ended April 30, 2023 (Unaudited) | | Year ended October 31, 2022 |
| Increase (Decrease) in Net Assets | | | | |
| Operations | | | | |
| Net investment income (loss) | $ | 2,956,427 | $ | 8,621,218 |
| Net realized gain (loss) | | 3,002,466 | | (142,874,829) |
| Change in net unrealized appreciation (depreciation) | | 254,871,797 | | (593,880,795) |
| Net increase (decrease) in net assets resulting from operations | | 260,830,690 | | (728,134,406) |
| Distributions to shareholders | | (10,463,693) | | (163,021,571) |
| Share transactions - net increase (decrease) | | 36,719,369 | | (137,715,540) |
| Total increase (decrease) in net assets | | 287,086,366 | | (1,028,871,517) |
| | | | | |
| Net Assets | | | | |
| Beginning of period | | 791,583,596 | | 1,820,455,113 |
| End of period | $ | 1,078,669,962 | $ | 791,583,596 |
| | | | | |
| | | | | |
Financial Highlights
| Fidelity Advisor® China Region Fund Class A |
| |
| | Six months ended (Unaudited) April 30, 2023 | | Years ended October 31, 2022 | | 2021 | | 2020 | | 2019 | | 2018 |
Selected Per-Share Data | | | | | | | | | | | | |
| Net asset value, beginning of period | $ | 24.85 | $ | 50.32 | $ | 50.90 | $ | 35.86 | $ | 28.73 | $ | 34.22 |
| Income from Investment Operations | | | | | | | | | | | | |
Net investment income (loss) A,B | | .04 | | .14 | | .06 | | .08 | | .15 | | .15 |
| Net realized and unrealized gain (loss) | | 8.30 C | | (20.99) | | 1.95 | | 15.11 | | 7.10 | | (5.56) |
| Total from investment operations | | 8.34 | | (20.85) | | 2.01 | | 15.19 | | 7.25 | | (5.41) |
| Distributions from net investment income | | (.19) | | - | | (.44) | | (.15) | | (.12) | | (.08) |
| Distributions from net realized gain | | - | | (4.62) | | (2.16) | | - | | - | | - |
| Total distributions | | (.19) | | (4.62) | | (2.59) D | | (.15) | | (.12) | | (.08) |
Redemption fees added to paid in capital A | | - | | - | | - | | - | | - | | - E |
| Net asset value, end of period | $ | 33.00 | $ | 24.85 | $ | 50.32 | $ | 50.90 | $ | 35.86 | $ | 28.73 |
Total Return F,G,H | | 33.58% C | | (45.20)% | | 3.65% | | 42.52% | | 25.30% | | (15.86)% |
Ratios to Average Net Assets B,I,J | | | | | | | | | | | | |
| Expenses before reductions | | 1.25% K | | 1.23% | | 1.21% | | 1.24% | | 1.27% | | 1.27% |
| Expenses net of fee waivers, if any | | 1.24% K | | 1.22% | | 1.21% | | 1.24% | | 1.26% | | 1.27% |
| Expenses net of all reductions | | 1.24% K | | 1.22% | | 1.21% | | 1.22% | | 1.26% | | 1.24% |
| Net investment income (loss) | | .26% K | | .38% | | .11% | | .18% | | .44% | | .43% |
| Supplemental Data | | | | | | | | | | | | |
| Net assets, end of period (000 omitted) | $ | 26,650 | $ | 19,362 | $ | 45,301 | $ | 39,303 | $ | 29,963 | $ | 23,424 |
Portfolio turnover rate L | | 26% K | | 20% | | 60% | | 60% | | 80% | | 60% |
A Calculated based on average shares outstanding during the period.
B Net investment income (loss) is affected by the timing of the declaration of dividends by any underlying mutual funds or exchange-traded funds (ETFs). Net investment income (loss) of any mutual funds or ETFs is not included in the Fund's net investment income (loss) ratio.
C Amount includes a reimbursement from the investment adviser for an operational error which amounted to less than $.01 per share. Excluding this reimbursement, the total return would have been 33.56%.
D Total distributions per share do not sum due to rounding.
E Amount represents less than $.005 per share.
F Total returns for periods of less than one year are not annualized.
G Total returns would have been lower if certain expenses had not been reduced during the applicable periods shown.
H Total returns do not include the effect of the sales charges.
I Fees and expenses of any underlying mutual funds or exchange-traded funds (ETFs) are not included in the Fund's expense ratio. The Fund indirectly bears its proportionate share of these expenses. For additional expense information related to investments in Fidelity Central Funds, please refer to the "Investments in Fidelity Central Funds" note found in the Notes to Financial Statements section of the most recent Annual or Semi-Annual report.
J Expense ratios reflect operating expenses of the class. Expenses before reductions do not reflect amounts reimbursed, waived, or reduced through arrangements with the investment adviser, brokerage services, or other offset arrangements, if applicable, and do not represent the amount paid by the class during periods when reimbursements, waivers or reductions occur.
K Annualized.
L Amount does not include the portfolio activity of any underlying mutual funds or exchange-traded funds (ETFs).
| Fidelity Advisor® China Region Fund Class M |
| |
| | Six months ended (Unaudited) April 30, 2023 | | Years ended October 31, 2022 | | 2021 | | 2020 | | 2019 | | 2018 |
Selected Per-Share Data | | | | | | | | | | | | |
| Net asset value, beginning of period | $ | 24.61 | $ | 50.02 | $ | 50.64 | $ | 35.66 | $ | 28.55 | $ | 34.05 |
| Income from Investment Operations | | | | | | | | | | | | |
Net investment income (loss) A,B | | - C | | .03 | | (.10) | | (.05) | | .04 | | .03 |
| Net realized and unrealized gain (loss) | | 8.21 D | | (20.82) | | 1.96 | | 15.04 | | 7.07 | | (5.53) |
| Total from investment operations | | 8.21 | | (20.79) | | 1.86 | | 14.99 | | 7.11 | | (5.50) |
| Distributions from net investment income | | (.09) | | - | | (.32) | | (.01) | | - | | - |
| Distributions from net realized gain | | - | | (4.62) | | (2.16) | | - | | - | | - |
| Total distributions | | (.09) | | (4.62) | | (2.48) | | (.01) | | - | | - |
Redemption fees added to paid in capital A | | - | | - | | - | | - | | - | | - C |
| Net asset value, end of period | $ | 32.73 | $ | 24.61 | $ | 50.02 | $ | 50.64 | $ | 35.66 | $ | 28.55 |
Total Return E,F,G | | 33.38% D | | (45.37)% | | 3.36% | | 42.04% | | 24.90% | | (16.15)% |
Ratios to Average Net Assets B,H,I | | | | | | | | | | | | |
| Expenses before reductions | | 1.52% J | | 1.53% | | 1.50% | | 1.56% | | 1.59% | | 1.62% |
| Expenses net of fee waivers, if any | | 1.52% J | | 1.53% | | 1.50% | | 1.56% | | 1.59% | | 1.62% |
| Expenses net of all reductions | | 1.50% J | | 1.53% | | 1.50% | | 1.53% | | 1.58% | | 1.58% |
| Net investment income (loss) | | -% J,K | | .08% | | (.18)% | | (.13)% | | .12% | | .08% |
| Supplemental Data | | | | | | | | | | | | |
| Net assets, end of period (000 omitted) | $ | 8,640 | $ | 5,803 | $ | 12,623 | $ | 12,028 | $ | 9,251 | $ | 8,132 |
Portfolio turnover rate L | | 26% J | | 20% | | 60% | | 60% | | 80% | | 60% |
A Calculated based on average shares outstanding during the period.
B Net investment income (loss) is affected by the timing of the declaration of dividends by any underlying mutual funds or exchange-traded funds (ETFs). Net investment income (loss) of any mutual funds or ETFs is not included in the Fund's net investment income (loss) ratio.
C Amount represents less than $.005 per share.
D Amount includes a reimbursement from the investment adviser for an operational error which amounted to less than $.01 per share. Excluding this reimbursement, the total return would have been 33.36%.
E Total returns for periods of less than one year are not annualized.
F Total returns would have been lower if certain expenses had not been reduced during the applicable periods shown.
G Total returns do not include the effect of the sales charges.
H Fees and expenses of any underlying mutual funds or exchange-traded funds (ETFs) are not included in the Fund's expense ratio. The Fund indirectly bears its proportionate share of these expenses. For additional expense information related to investments in Fidelity Central Funds, please refer to the "Investments in Fidelity Central Funds" note found in the Notes to Financial Statements section of the most recent Annual or Semi-Annual report.
I Expense ratios reflect operating expenses of the class. Expenses before reductions do not reflect amounts reimbursed, waived, or reduced through arrangements with the investment adviser, brokerage services, or other offset arrangements, if applicable, and do not represent the amount paid by the class during periods when reimbursements, waivers or reductions occur.
J Annualized.
K Amount represents less than .005%.
L Amount does not include the portfolio activity of any underlying mutual funds or exchange-traded funds (ETFs).
| Fidelity Advisor® China Region Fund Class C |
| |
| | Six months ended (Unaudited) April 30, 2023 | | Years ended October 31, 2022 | | 2021 | | 2020 | | 2019 | | 2018 |
Selected Per-Share Data | | | | | | | | | | | | |
| Net asset value, beginning of period | $ | 23.59 | $ | 48.34 | $ | 49.10 | $ | 34.71 | $ | 27.90 | $ | 33.41 |
| Income from Investment Operations | | | | | | | | | | | | |
Net investment income (loss) A,B | | (.07) | | (.13) | | (.35) | | (.22) | | (.09) | | (.11) |
| Net realized and unrealized gain (loss) | | 7.87 C | | (20.00) | | 1.92 | | 14.61 | | 6.90 | | (5.40) |
| Total from investment operations | | 7.80 | | (20.13) | | 1.57 | | 14.39 | | 6.81 | | (5.51) |
| Distributions from net investment income | | - | | - | | (.17) | | - | | - | | - |
| Distributions from net realized gain | | - | | (4.62) | | (2.16) | | - | | - | | - |
| Total distributions | | - | | (4.62) | | (2.33) | | - | | - | | - |
Redemption fees added to paid in capital A | | - | | - | | - | | - | | - | | - D |
| Net asset value, end of period | $ | 31.39 | $ | 23.59 | $ | 48.34 | $ | 49.10 | $ | 34.71 | $ | 27.90 |
Total Return E,F,G | | 33.06% C | | (45.60)% | | 2.89% | | 41.46% | | 24.41% | | (16.49)% |
Ratios to Average Net Assets B,H,I | | | | | | | | | | | | |
| Expenses before reductions | | 1.96% J | | 1.96% | | 1.96% | | 1.98% | | 2.00% | | 2.01% |
| Expenses net of fee waivers, if any | | 1.96% J | | 1.96% | | 1.96% | | 1.98% | | 2.00% | | 2.01% |
| Expenses net of all reductions | | 1.95% J | | 1.96% | | 1.96% | | 1.96% | | 1.99% | | 1.98% |
| Net investment income (loss) | | (.45)% J | | (.36)% | | (.65)% | | (.55)% | | (.29)% | | (.31)% |
| Supplemental Data | | | | | | | | | | | | |
| Net assets, end of period (000 omitted) | $ | 7,720 | $ | 5,784 | $ | 13,168 | $ | 11,308 | $ | 9,437 | $ | 10,138 |
Portfolio turnover rate K | | 26% J | | 20% | | 60% | | 60% | | 80% | | 60% |
A Calculated based on average shares outstanding during the period.
B Net investment income (loss) is affected by the timing of the declaration of dividends by any underlying mutual funds or exchange-traded funds (ETFs). Net investment income (loss) of any mutual funds or ETFs is not included in the Fund's net investment income (loss) ratio.
C Amount includes a reimbursement from the investment adviser for an operational error which amounted to less than $.01 per share. Excluding this reimbursement, the total return would have been 33.04%.
D Amount represents less than $.005 per share.
E Total returns for periods of less than one year are not annualized.
F Total returns would have been lower if certain expenses had not been reduced during the applicable periods shown.
G Total returns do not include the effect of the contingent deferred sales charge.
H Fees and expenses of any underlying mutual funds or exchange-traded funds (ETFs) are not included in the Fund's expense ratio. The Fund indirectly bears its proportionate share of these expenses. For additional expense information related to investments in Fidelity Central Funds, please refer to the "Investments in Fidelity Central Funds" note found in the Notes to Financial Statements section of the most recent Annual or Semi-Annual report.
I Expense ratios reflect operating expenses of the class. Expenses before reductions do not reflect amounts reimbursed, waived, or reduced through arrangements with the investment adviser, brokerage services, or other offset arrangements, if applicable, and do not represent the amount paid by the class during periods when reimbursements, waivers or reductions occur.
J Annualized.
K Amount does not include the portfolio activity of any underlying mutual funds or exchange-traded funds (ETFs).
| Fidelity® China Region Fund |
| |
| | Six months ended (Unaudited) April 30, 2023 | | Years ended October 31, 2022 | | 2021 | | 2020 | | 2019 | | 2018 |
Selected Per-Share Data | | | | | | | | | | | | |
| Net asset value, beginning of period | $ | 25.28 | $ | 51.03 | $ | 51.53 | $ | 36.30 | $ | 29.11 | $ | 34.64 |
| Income from Investment Operations | | | | | | | | | | | | |
Net investment income (loss) A,B | | .09 | | .25 | | .23 | | .21 | | .25 | | .26 |
| Net realized and unrealized gain (loss) | | 8.43 C | | (21.32) | | 1.97 | | 15.28 | | 7.19 | | (5.65) |
| Total from investment operations | | 8.52 | | (21.07) | | 2.20 | | 15.49 | | 7.44 | | (5.39) |
| Distributions from net investment income | | (.34) | | (.06) | | (.54) | | (.26) | | (.25) | | (.14) |
| Distributions from net realized gain | | - | | (4.62) | | (2.16) | | - | | - | | - |
| Total distributions | | (.34) | | (4.68) | | (2.70) | | (.26) | | (.25) | | (.14) |
Redemption fees added to paid in capital A | | - | | - | | - | | - | | - | | - D |
| Net asset value, end of period | $ | 33.46 | $ | 25.28 | $ | 51.03 | $ | 51.53 | $ | 36.30 | $ | 29.11 |
Total Return E,F | | 33.73% C | | (45.04)% | | 3.97% | | 42.95% | | 25.72% | | (15.62)% |
Ratios to Average Net Assets B,G,H | | | | | | | | | | | | |
| Expenses before reductions | | .95% I | | .94% | | .91% | | .93% | | .95% | | .96% |
| Expenses net of fee waivers, if any | | .94% I | | .93% | | .91% | | .93% | | .95% | | .96% |
| Expenses net of all reductions | | .94% I | | .93% | | .91% | | .91% | | .95% | | .93% |
| Net investment income (loss) | | .56% I | | .67% | | .41% | | .49% | | .76% | | .74% |
| Supplemental Data | | | | | | | | | | | | |
| Net assets, end of period (000 omitted) | $ | 977,873 | $ | 736,185 | $ | 1,609,326 | $ | 1,518,404 | $ | 1,093,827 | $ | 969,679 |
Portfolio turnover rate J | | 26% I | | 20% | | 60% | | 60% | | 80% | | 60% |
A Calculated based on average shares outstanding during the period.
B Net investment income (loss) is affected by the timing of the declaration of dividends by any underlying mutual funds or exchange-traded funds (ETFs). Net investment income (loss) of any mutual funds or ETFs is not included in the Fund's net investment income (loss) ratio.
C Amount includes a reimbursement from the investment adviser for an operational error which amounted to less than $.01 per share. Excluding this reimbursement, the total return would have been 33.71%.
D Amount represents less than $.005 per share.
E Total returns for periods of less than one year are not annualized.
F Total returns would have been lower if certain expenses had not been reduced during the applicable periods shown.
G Fees and expenses of any underlying mutual funds or exchange-traded funds (ETFs) are not included in the Fund's expense ratio. The Fund indirectly bears its proportionate share of these expenses. For additional expense information related to investments in Fidelity Central Funds, please refer to the "Investments in Fidelity Central Funds" note found in the Notes to Financial Statements section of the most recent Annual or Semi-Annual report.
H Expense ratios reflect operating expenses of the class. Expenses before reductions do not reflect amounts reimbursed, waived, or reduced through arrangements with the investment adviser, brokerage services, or other offset arrangements, if applicable, and do not represent the amount paid by the class during periods when reimbursements, waivers or reductions occur.
I Annualized.
J Amount does not include the portfolio activity of any underlying mutual funds or exchange-traded funds (ETFs).
| Fidelity Advisor® China Region Fund Class I |
| |
| | Six months ended (Unaudited) April 30, 2023 | | Years ended October 31, 2022 | | 2021 | | 2020 | | 2019 | | 2018 |
Selected Per-Share Data | | | | | | | | | | | | |
| Net asset value, beginning of period | $ | 25.07 | $ | 50.63 | $ | 51.16 | $ | 36.05 | $ | 28.90 | $ | 34.41 |
| Income from Investment Operations | | | | | | | | | | | | |
Net investment income (loss) A,B | | .10 | | .25 | | .22 | | .20 | | .25 | | .26 |
| Net realized and unrealized gain (loss) | | 8.37 C | | (21.15) | | 1.96 | | 15.17 | | 7.13 | | (5.61) |
| Total from investment operations | | 8.47 | | (20.90) | | 2.18 | | 15.37 | | 7.38 | | (5.35) |
| Distributions from net investment income | | (.34) | | (.04) | | (.55) | | (.26) | | (.23) | | (.16) |
| Distributions from net realized gain | | - | | (4.62) | | (2.16) | | - | | - | | - |
| Total distributions | | (.34) | | (4.66) | | (2.71) | | (.26) | | (.23) | | (.16) |
Redemption fees added to paid in capital A | | - | | - | | - | | - | | - | | - D |
| Net asset value, end of period | $ | 33.20 | $ | 25.07 | $ | 50.63 | $ | 51.16 | $ | 36.05 | $ | 28.90 |
Total Return E,F | | 33.79% C | | (45.05)% | | 3.96% | | 42.91% | | 25.71% | | (15.63)% |
Ratios to Average Net Assets B,G,H | | | | | | | | | | | | |
| Expenses before reductions | | .93% I | | .93% | | .93% | | .95% | | .97% | | .98% |
| Expenses net of fee waivers, if any | | .93% I | | .93% | | .93% | | .95% | | .96% | | .98% |
| Expenses net of all reductions | | .93% I | | .93% | | .93% | | .93% | | .96% | | .95% |
| Net investment income (loss) | | .57% I | | .68% | | .39% | | .48% | | .74% | | .72% |
| Supplemental Data | | | | | | | | | | | | |
| Net assets, end of period (000 omitted) | $ | 45,196 | $ | 20,509 | $ | 68,464 | $ | 47,688 | $ | 27,410 | $ | 20,854 |
Portfolio turnover rate J | | 26% I | | 20% | | 60% | | 60% | | 80% | | 60% |
A Calculated based on average shares outstanding during the period.
B Net investment income (loss) is affected by the timing of the declaration of dividends by any underlying mutual funds or exchange-traded funds (ETFs). Net investment income (loss) of any mutual funds or ETFs is not included in the Fund's net investment income (loss) ratio.
C Amount includes a reimbursement from the investment adviser for an operational error which amounted to less than $.01 per share. Excluding this reimbursement, the total return would have been 33.77%.
D Amount represents less than $.005 per share.
E Total returns for periods of less than one year are not annualized.
F Total returns would have been lower if certain expenses had not been reduced during the applicable periods shown.
G Fees and expenses of any underlying mutual funds or exchange-traded funds (ETFs) are not included in the Fund's expense ratio. The Fund indirectly bears its proportionate share of these expenses. For additional expense information related to investments in Fidelity Central Funds, please refer to the "Investments in Fidelity Central Funds" note found in the Notes to Financial Statements section of the most recent Annual or Semi-Annual report.
H Expense ratios reflect operating expenses of the class. Expenses before reductions do not reflect amounts reimbursed, waived, or reduced through arrangements with the investment adviser, brokerage services, or other offset arrangements, if applicable, and do not represent the amount paid by the class during periods when reimbursements, waivers or reductions occur.
I Annualized.
J Amount does not include the portfolio activity of any underlying mutual funds or exchange-traded funds (ETFs).
| Fidelity Advisor® China Region Fund Class Z |
| |
| | Six months ended (Unaudited) April 30, 2023 | | Years ended October 31, 2022 | | 2021 | | 2020 | | 2019 | | 2018 A |
Selected Per-Share Data | | | | | | | | | | | | |
| Net asset value, beginning of period | $ | 25.02 | $ | 50.57 | $ | 51.07 | $ | 36.00 | $ | 28.91 | $ | 32.63 |
| Income from Investment Operations | | | | | | | | | | | | |
Net investment income (loss) B,C | | .12 | | .30 | | .29 | | .26 | | .30 | | .01 |
| Net realized and unrealized gain (loss) | | 8.35 D | | (21.10) | | 1.95 | | 15.14 | | 7.11 | | (3.73) |
| Total from investment operations | | 8.47 | | (20.80) | | 2.24 | | 15.40 | | 7.41 | | (3.72) |
| Distributions from net investment income | | (.28) | | (.12) | | (.59) | | (.33) | | (.32) | | - |
| Distributions from net realized gain | | - | | (4.62) | | (2.16) | | - | | - | | - |
| Total distributions | | (.28) | | (4.75) E | | (2.74) E | | (.33) | | (.32) | | - |
| Net asset value, end of period | $ | 33.21 | $ | 25.02 | $ | 50.57 | $ | 51.07 | $ | 36.00 | $ | 28.91 |
Total Return F,G | | 33.86% D | | (44.97)% | | 4.09% | | 43.13% | | 25.86% | | (11.40)% |
Ratios to Average Net Assets C,H,I | | | | | | | | | | | | |
| Expenses before reductions | | .80% J | | .80% | | .80% | | .81% | | .82% | | .91% J |
| Expenses net of fee waivers, if any | | .80% J | | .80% | | .80% | | .81% | | .82% | | .90% J |
| Expenses net of all reductions | | .80% J | | .80% | | .80% | | .79% | | .81% | | .87% J |
| Net investment income (loss) | | .70% J | | .81% | | .52% | | .61% | | .89% | | .57% J |
| Supplemental Data | | | | | | | | | | | | |
| Net assets, end of period (000 omitted) | $ | 12,592 | $ | 3,940 | $ | 71,573 | $ | 71,121 | $ | 46,861 | $ | 323 |
Portfolio turnover rate K | | 26% J | | 20% | | 60% | | 60% | | 80% | | 60% J |
A For the period October 2, 2018 (commencement of sale of shares) through October 31, 2018.
B Calculated based on average shares outstanding during the period.
C Net investment income (loss) is affected by the timing of the declaration of dividends by any underlying mutual funds or exchange-traded funds (ETFs). Net investment income (loss) of any mutual funds or ETFs is not included in the Fund's net investment income (loss) ratio.
D Amount includes a reimbursement from the investment adviser for an operational error which amounted to less than $.01 per share. Excluding this reimbursement, the total return would have been 33.84%.
E Total distributions per share do not sum due to rounding.
F Total returns for periods of less than one year are not annualized.
G Total returns would have been lower if certain expenses had not been reduced during the applicable periods shown.
H Fees and expenses of any underlying mutual funds or exchange-traded funds (ETFs) are not included in the Fund's expense ratio. The Fund indirectly bears its proportionate share of these expenses. For additional expense information related to investments in Fidelity Central Funds, please refer to the "Investments in Fidelity Central Funds" note found in the Notes to Financial Statements section of the most recent Annual or Semi-Annual report.
I Expense ratios reflect operating expenses of the class. Expenses before reductions do not reflect amounts reimbursed, waived, or reduced through arrangements with the investment adviser, brokerage services, or other offset arrangements, if applicable, and do not represent the amount paid by the class during periods when reimbursements, waivers or reductions occur.
J Annualized.
K Amount does not include the portfolio activity of any underlying mutual funds or exchange-traded funds (ETFs).
For the period ended April 30, 2023
1. Organization.
Fidelity China Region Fund (the Fund) is a fund of Fidelity Investment Trust (the Trust) and is authorized to issue an unlimited number of shares. The Trust is registered under the Investment Company Act of 1940, as amended (the 1940 Act), as an open-end management investment company organized as a Massachusetts business trust. The Fund offers Class A, Class M, Class C, China Region, Class I and Class Z shares, each of which has equal rights as to assets and voting privileges. Class A, Class M, Class C, Class I and Class Z are Fidelity Advisor classes. Each class has exclusive voting rights with respect to matters that affect that class. Class C shares will automatically convert to Class A shares after a holding period of eight years from the initial date of purchase, with certain exceptions. The Fund's investments in emerging markets can be subject to social, economic, regulatory, and political uncertainties and can be extremely volatile.
2. Investments in Fidelity Central Funds.
Funds may invest in Fidelity Central Funds, which are open-end investment companies generally available only to other investment companies and accounts managed by the investment adviser and its affiliates. The Schedule of Investments lists any Fidelity Central Funds held as an investment as of period end, but does not include the underlying holdings of each Fidelity Central Fund. An investing fund indirectly bears its proportionate share of the expenses of the underlying Fidelity Central Funds.
Based on its investment objective, each Fidelity Central Fund may invest or participate in various investment vehicles or strategies that are similar to those of the investing fund. These strategies are consistent with the investment objectives of the investing fund and may involve certain economic risks which may cause a decline in value of each of the Fidelity Central Funds and thus a decline in the value of the investing fund.
| Fidelity Central Fund | Investment Manager | Investment Objective | Investment Practices | Expense Ratio A |
| Fidelity Money Market Central Funds | Fidelity Management & Research Company LLC (FMR) | Each fund seeks to obtain a high level of current income consistent with the preservation of capital and liquidity. | Short-term Investments | Less than .005% |
A Expenses expressed as a percentage of average net assets and are as of each underlying Central Fund's most recent annual or semi-annual shareholder report.
A complete unaudited list of holdings for each Fidelity Central Fund is available upon request or at the Securities and Exchange Commission website at www.sec.gov. In addition, the financial statements of the Fidelity Central Funds which contain the significant accounting policies (including investment valuation policies) of those funds, and are not covered by the Report of Independent Registered Public Accounting Firm, are available on the Securities and Exchange Commission website or upon request.
3. Significant Accounting Policies.
The Fund is an investment company and applies the accounting and reporting guidance of the Financial Accounting Standards Board (FASB) Accounting Standards Codification Topic 946 Financial Services - Investment Companies . The financial statements have been prepared in conformity with accounting principles generally accepted in the United States of America (GAAP), which require management to make certain estimates and assumptions at the date of the financial statements. Actual results could differ from those estimates. Subsequent events, if any, through the date that the financial statements were issued have been evaluated in the preparation of the financial statements. The Fund's Schedule of Investments lists any underlying mutual funds or exchange-traded funds (ETFs) but does not include the underlying holdings of these funds. The following summarizes the significant accounting policies of the Fund:
Investment Valuation. Investments are valued as of 4:00 p.m. Eastern time on the last calendar day of the period. The Board of Trustees (the Board) has designated the Fund's investment adviser as the valuation designee responsible for the fair valuation function and performing fair value determinations as needed. The investment adviser has established a Fair Value Committee (the Committee) to carry out the day-to-day fair valuation responsibilities and has adopted policies and procedures to govern the fair valuation process and the activities of the Committee. In accordance with these fair valuation policies and procedures, which have been approved by the Board, the Fund attempts to obtain prices from one or more third party pricing services or brokers to value its investments. When current market prices, quotations or currency exchange rates are not readily available or reliable, investments will be fair valued in good faith by the Committee, in accordance with the policies and procedures. Factors used in determining fair value vary by investment type and may include market or investment specific events, transaction data, estimated cash flows, and market observations of comparable investments. The frequency that the fair valuation procedures are used cannot be predicted and they may be utilized to a significant extent. The Committee manages the Fund's fair valuation practices and maintains the fair valuation policies and procedures. The Fund's investment adviser reports to the Board information regarding the fair valuation process and related material matters.
The Fund categorizes the inputs to valuation techniques used to value its investments into a disclosure hierarchy consisting of three levels as shown below:
Level 1 - unadjusted quoted prices in active markets for identical investments
Level 2 - other significant observable inputs (including quoted prices for similar investments, interest rates, prepayment speeds, etc.)
Level 3 - unobservable inputs (including the Fund's own assumptions based on the best information available)
Valuation techniques used to value the Fund's investments by major category are as follows:
Equity securities, including restricted securities, for which market quotations are readily available, are valued at the last reported sale price or official closing price as reported by a third party pricing service on the primary market or exchange on which they are traded and are categorized as Level 1 in the hierarchy. In the event there were no sales during the day or closing prices are not available, securities are valued at the last quoted bid price or may be valued using the last available price and are generally categorized as Level 2 in the hierarchy. For foreign equity securities, when market or security specific events arise, comparisons to the valuation of American Depositary Receipts (ADRs), futures contracts, ETFs and certain indexes as well as quoted prices for similar securities may be used and would be categorized as Level 2 in the hierarchy. For equity securities, including restricted securities, where observable inputs are limited, assumptions about market activity and risk are used and these securities may be categorized as Level 3 in the hierarchy. Securities, including private placements or other restricted securities, for which observable inputs are not available are valued using alternate valuation approaches, including the market approach, the income approach and cost approach, and are categorized as Level 3 in the hierarchy. The market approach considers factors including the price of recent investments in the same or a similar security or financial metrics of comparable securities. The income approach considers factors including expected future cash flows, security specific risks and corresponding discount rates. The cost approach considers factors including the value of the security's underlying assets and liabilities.
Investments in open-end mutual funds, including the Fidelity Central Funds, are valued at their closing net asset value (NAV) each business day and are categorized as Level 1 in the hierarchy.
The following provides information on Level 3 securities held by the Fund that were valued at period end based on unobservable inputs. These amounts exclude valuations provided by a broker.
| Asset Type | Fair Value | Valuation Technique(s) | Unobservable Input | Amount or Range/Weighted Average | Impact to Valuation from an Increase in Input A |
| Equities | $12,081,367 | Market comparable | Enterprise value/Revenue multiple (EV/R) | 1.4 - 8.5 / 4.7 | Increase |
A Represents the directional change in the fair value of the Level 3 investments that could have resulted from an increase in the corresponding input as of period end. A decrease to the unobservable input would have had the opposite effect. Significant changes in these inputs may have resulted in a significantly higher or lower fair value measurement at period end.
Changes in valuation techniques may result in transfers in or out of an assigned level within the disclosure hierarchy. The aggregate value of investments by input level as of April 30, 2023, as well as a roll forward of Level 3 investments, is included at the end of the Fund's Schedule of Investments.
Foreign Currency. Certain Funds may use foreign currency contracts to facilitate transactions in foreign-denominated securities. Gains and losses from these transactions may arise from changes in the value of the foreign currency or if the counterparties do not perform under the contracts' terms.
Foreign-denominated assets, including investment securities, and liabilities are translated into U.S. dollars at the exchange rates at period end. Purchases and sales of investment securities, income and dividends received, and expenses denominated in foreign currencies are translated into U.S. dollars at the exchange rate in effect on the transaction date.
The effects of exchange rate fluctuations on investments are included with the net realized and unrealized gain (loss) on investment securities. Other foreign currency transactions resulting in realized and unrealized gain (loss) are disclosed separately.
Investment Transactions and Income. For financial reporting purposes, the Fund's investment holdings and NAV include trades executed through the end of the last business day of the period. The NAV per share for processing shareholder transactions is calculated as of the close of business of the New York Stock Exchange (NYSE), normally 4:00 p.m. Eastern time and includes trades executed through the end of the prior business day. Gains and losses on securities sold are determined on the basis of identified cost. Commissions paid to certain brokers with whom the investment adviser, or its affiliates, places trades on behalf of a fund include an amount in addition to trade execution, which may be rebated back to a fund. Any such rebates are included in net realized gain (loss) on investments in the Statement of Operations. Dividend income is recorded on the ex-dividend date, except for certain dividends from foreign securities where the ex-dividend date may have passed, which are recorded as soon as the Fund is informed of the ex-dividend date. Non-cash dividends included in dividend income, if any, are recorded at the fair market value of the securities received. Income and capital gain distributions from Fidelity Central Funds, if any, are recorded on the ex-dividend date. Investment income is recorded net of foreign taxes withheld where recovery of such taxes is uncertain. Funds may file withholding tax reclaims in certain jurisdictions to recover a portion of amounts previously withheld. Any withholding tax reclaims income is included in the Statement of Operations in foreign taxes withheld. Any receivables for withholding tax reclaims are included in the Statement of Assets and Liabilities in dividends receivable.
Class Allocations and Expenses. Investment income, realized and unrealized capital gains and losses, common expenses of a fund, and certain fund-level expense reductions, if any, are allocated daily on a pro-rata basis to each class based on the relative net assets of each class to the total net assets of a fund. Each class differs with respect to transfer agent and distribution and service plan fees incurred, as applicable. Certain expense reductions may also differ by class, if applicable. For the reporting period, the allocated portion of income and expenses to each class as a percent of its average net assets may vary due to the timing of recording these transactions in relation to fluctuating net assets of the classes. Expenses directly attributable to a fund are charged to that fund. Expenses attributable to more than one fund are allocated among the respective funds on the basis of relative net assets or other appropriate methods. Expenses included in the accompanying financial statements reflect the expenses of that fund and do not include any expenses associated with any underlying mutual funds or exchange-traded funds. Although not included in a fund's expenses, a fund indirectly bears its proportionate share of these expenses through the net asset value of each underlying mutual fund or exchange-traded fund. Expense estimates are accrued in the period to which they relate and adjustments are made when actual amounts are known.
Income Tax Information and Distributions to Shareholders. Each year, the Fund intends to qualify as a regulated investment company under Subchapter M of the Internal Revenue Code, including distributing substantially all of its taxable income and realized gains. As a result, no provision for U.S. Federal income taxes is required. The Fund files a U.S. federal tax return, in addition to state and local tax returns as required. The Fund's federal income tax returns are subject to examination by the Internal Revenue Service (IRS) for a period of three fiscal years after they are filed. State and local tax returns may be subject to examination for an additional fiscal year depending on the jurisdiction. Foreign taxes are provided for based on the Fund's understanding of the tax rules and rates that exist in the foreign markets in which it invests.
Distributions are declared and recorded on the ex-dividend date. Income and capital gain distributions are declared separately for each class. Income and capital gain distributions are determined in accordance with income tax regulations, which may differ from GAAP.
Capital accounts within the financial statements are adjusted for permanent book-tax differences. These adjustments have no impact on net assets or the results of operations. Capital accounts are not adjusted for temporary book-tax differences which will reverse in a subsequent period.
Book-tax differences are primarily due to foreign currency transactions, passive foreign investment companies (PFIC), capital loss carryforwards, certain corporate actions and losses deferred due to wash sales.
As of period end, the cost and unrealized appreciation (depreciation) in securities, and derivatives if applicable, for federal income tax purposes were as follows:
| Gross unrealized appreciation | $270,250,352 |
| Gross unrealized depreciation | (176,532,572) |
| Net unrealized appreciation (depreciation) | $93,717,780 |
| Tax cost | $989,062,830 |
Capital loss carryforwards are only available to offset future capital gains of the Fund to the extent provided by regulations and may be limited. The capital loss carryforward information presented below, including any applicable limitation, is estimated as of prior fiscal period end and is subject to adjustment.
Short-term | $(99,049,173) |
Long-term | (34,928,533) |
| Total capital loss carryforward | $(133,977,706) |
Restricted Securities (including Private Placements). Funds may invest in securities that are subject to legal or contractual restrictions on resale. These securities generally may be resold in transactions exempt from registration or to the public if the securities are registered. Disposal of these securities may involve time-consuming negotiations and expense, and prompt sale at an acceptable price may be difficult. Information regarding restricted securities held at period end is included at the end of the Schedule of Investments, if applicable.
New Accounting Pronouncement. In June 2022, the Financial Accounting Standards Board (FASB) issued Accounting Standards Update (ASU) 2022-03 Fair Value Measurement (Topic 820): Fair Value Measurement of Equity Securities Subject to Contractual Sale Restrictions. The amendments in this ASU clarify that a contractual restriction on the sale of an equity security is not considered part of the unit of account of the equity security and, therefore, is not considered in measuring fair value. They also clarify that an entity cannot, as a separate unit of account, recognize and measure a contractual sale restriction. They also require additional disclosures for equity securities subject to contractual sale restrictions. ASU 2022-03 will be effective for fiscal years, including interim periods within those fiscal years, beginning after December 15, 2023, and allows for early adoption. ASU 2022-03 will only be applicable to an equity security in which the contractual arrangement that restricts its sale is executed or modified on or after the adoption date. Management is currently evaluating the potential impact of ASU 2022-03 to the financial statements.
4. Purchases and Sales of Investments.
Purchases and sales of securities, other than short-term securities and in-kind transactions, as applicable, are noted in the table below.
| | Purchases ($) | Sales ($) |
| Fidelity China Region Fund | 185,085,233 | 132,961,986 |
5. Fees and Other Transactions with Affiliates.
Management Fee. Fidelity Management & Research Company LLC (the investment adviser) and its affiliates provide the Fund with investment management related services for which the Fund pays a monthly management fee. The management fee is the sum of an individual fund fee rate that is based on an annual rate of .45% of the Fund's average net assets and an annualized group fee rate that averaged .23% during the period. The group fee rate is based upon the monthly average net assets of a group of registered investment companies with which the investment adviser has management contracts. The group fee rate decreases as assets under management increase and increases as assets under management decrease. For the reporting period, the total annualized management fee rate was .68% of the Fund's average net assets.
Distribution and Service Plan Fees. In accordance with Rule 12b-1 of the 1940 Act, the Fund has adopted separate Distribution and Service Plans for each class of shares. Certain classes pay Fidelity Distributors Company LLC (FDC), an affiliate of the investment adviser, separate Distribution and Service Fees, each of which is based on an annual percentage of each class' average net assets. In addition, FDC may pay financial intermediaries for selling shares of the Fund and providing shareholder support services. For the period, the Distribution and Service Fee rates, total fees and amounts retained by FDC were as follows:
| | Distribution Fee | Service Fee | Total Fees | Retained by FDC |
| Class A | - % | .25% | $33,906 | $779 |
| Class M | .25% | .25% | 21,020 | 263 |
| Class C | .75% | .25% | 41,205 | 7,949 |
| | | | $96,131 | $8,991 |
Sales Load. FDC may receive a front-end sales charge of up to 5.75% for selling Class A shares and 3.50% for selling Class M shares, some of which is paid to financial intermediaries for selling shares of the Fund. Depending on the holding period, FDC may receive contingent deferred sales charges levied on Class A, Class M and Class C redemptions. The deferred sales charges are 1.00% for Class C shares, 1.00% for certain purchases of Class A shares and .25% for certain purchases of Class M shares.
For the period, sales charge amounts retained by FDC were as follows:
| | Retained by FDC |
| Class A | $4,004 |
| Class M | 1,564 |
Class C A | 325 |
| | $5,893 |
A When Class C shares are initially sold, FDC pays commissions from its own resources to financial intermediaries through which the sales are made.
Transfer Agent Fees. Fidelity Investments Institutional Operations Company LLC (FIIOC), an affiliate of the investment adviser, is the transfer, dividend disbursing and shareholder servicing agent for each class of the Fund. FIIOC receives account fees and asset-based fees that vary according to the account size and type of account of the shareholders of the respective classes of the Fund, except for Class Z. FIIOC receives an asset-based fee of Class Z's average net assets. FIIOC pays for typesetting, printing and mailing of shareholder reports, except proxy statements.
For the period, transfer agent fees for each class were as follows:
| | Amount | % of Class-Level Average Net Assets A |
| Class A | $31,380 | .23 |
| Class M | 10,756 | .26 |
| Class C | 7,984 | .19 |
| China Region | 917,016 | .18 |
| Class I | 32,351 | .17 |
| Class Z | 1,760 | .04 |
| | $1,001,247 | |
A Annualized
Accounting Fees. Fidelity Service Company, Inc. (FSC), an affiliate of the investment adviser, maintains the Fund's accounting records. The accounting fee is based on the level of average net assets for each month. For the period, the fees were equivalent to the following annualized rates:
| | % of Average Net Assets |
| Fidelity China Region Fund | .04 |
Brokerage Commissions. A portion of portfolio transactions were placed with brokerage firms which are affiliates of the investment adviser. Brokerage commissions are included in net realized gain (loss) and change in net unrealized appreciation (depreciation) in the Statement of Operations. The commissions paid to these affiliated firms were as follows:
| | Amount |
| Fidelity China Region Fund | $1,286 |
Interfund Trades. Funds may purchase from or sell securities to other Fidelity Funds under procedures adopted by the Board. The procedures have been designed to ensure these interfund trades are executed in accordance with Rule 17a-7 of the 1940 Act. Any interfund trades are included within the respective purchases and sales amounts shown in the Purchases and Sales of Investments note. Interfund trades during the period are noted in the table below.
| | Purchases ($) | Sales ($) | Realized Gain (Loss) ($) |
| Fidelity China Region Fund | 8,857,783 | 2,809,204 | 777,175 |
Other. During the period, FMR reimbursed the Fund $254,190 for an operational error which is included in Net Realized Gain (Loss) in the accompanying Statement of Operations.
6. Committed Line of Credit.
Certain Funds participate with other funds managed by the investment adviser or an affiliate in a $4.25 billion credit facility (the "line of credit") to be utilized for temporary or emergency purposes to fund shareholder redemptions or for other short-term liquidity purposes. The participating funds have agreed to pay commitment fees on their pro-rata portion of the line of credit, which are reflected in Miscellaneous expenses on the Statement of Operations, and are listed below. During the period, there were no borrowings on this line of credit.
| | Amount |
| Fidelity China Region Fund | $1,054 |
7. Security Lending.
Funds lend portfolio securities from time to time in order to earn additional income. Lending agents are used, including National Financial Services (NFS), an affiliate of the investment adviser. Pursuant to a securities lending agreement, NFS will receive a fee, which is capped at 9.9% of a fund's daily lending revenue, for its services as lending agent. A fund may lend securities to certain qualified borrowers, including NFS. On the settlement date of the loan, a fund receives collateral (in the form of U.S. Treasury obligations, letters of credit and/or cash) against the loaned securities and maintains collateral in an amount not less than 100% of the market value of the loaned securities during the period of the loan. The market value of the loaned securities is determined at the close of business of a fund and any additional required collateral is delivered to a fund on the next business day. A fund or borrower may terminate the loan at any time, and if the borrower defaults on its obligation to return the securities loaned because of insolvency or other reasons, a fund may apply collateral received from the borrower against the obligation. A fund may experience delays and costs in recovering the securities loaned. Any cash collateral received is invested in the Fidelity Securities Lending Cash Central Fund. Any loaned securities are identified as such in the Schedule of Investments, and the value of loaned securities and cash collateral at period end, as applicable, are presented in the Statement of Assets and Liabilities. Security lending income represents the income earned on investing cash collateral, less rebates paid to borrowers and any lending agent fees associated with the loan, plus any premium payments received for lending certain types of securities. Security lending income is presented in the Statement of Operations as a component of income from Fidelity Central Funds. Affiliated security lending activity, if any, was as follows:
| | Total Security Lending Fees Paid to NFS | Security Lending Income From Securities Loaned to NFS | Value of Securities Loaned to NFS at Period End |
| Fidelity China Region Fund | $5,523 | $- | $- |
8. Expense Reductions.
Through arrangements with the Fund's custodian and each class' transfer agent, credits realized as a result of certain uninvested cash balances were used to reduce the Fund's expenses. During the period, custodian credits reduced the Fund's expenses by $1,178. During the period, transfer agent credits reduced each class' expenses as noted in the table below.
| | Expense reduction |
| Class A | $402 |
| Class M | 483 |
| Class C | 49 |
| | $934 |
In addition, during the period the investment adviser or an affiliate reimbursed and/or waived a portion of fund-level operating expenses in the amount of $25,159.
9. Distributions to Shareholders.
Distributions to shareholders of each class were as follows:
| | Six months ended April 30, 2023 | Year ended October 31, 2022 |
| Fidelity China Region Fund | | |
| Distributions to shareholders | | |
| Class A | $147,676 | $4,134,709 |
| Class M | 22,086 | 1,142,842 |
| Class C | - | 1,227,041 |
| China Region | 9,963,708 | 144,410,750 |
| Class I | 287,558 | 5,718,145 |
| Class Z | 42,665 | 6,388,084 |
Total | $10,463,693 | $163,021,571 |
10. Share Transactions.
Share transactions for each class were as follows and may contain in-kind transactions, automatic conversions between classes or exchanges between affiliated funds:
| | Shares | Shares | Dollars | Dollars |
| | Six months ended April 30, 2023 | Year ended October 31, 2022 | Six months ended April 30, 2023 | Year ended October 31, 2022 |
| Fidelity China Region Fund | | | | |
| Class A | | | | |
| Shares sold | 142,348 | 167,076 | $5,016,973 | $6,290,832 |
| Reinvestment of distributions | 4,346 | 93,787 | 141,383 | 3,954,050 |
| Shares redeemed | (118,254) | (381,933) | (3,929,816) | (12,663,126) |
| Net increase (decrease) | 28,440 | (121,070) | $1,228,540 | $(2,418,244) |
| Class M | | | | |
| Shares sold | 48,481 | 14,193 | $1,769,939 | $518,243 |
| Reinvestment of distributions | 682 | 27,154 | 22,023 | 1,136,944 |
| Shares redeemed | (21,000) | (57,927) | (705,307) | (2,269,682) |
| Net increase (decrease) | 28,163 | (16,580) | $1,086,655 | $(614,495) |
| Class C | | | | |
| Shares sold | 63,082 | 52,147 | $2,109,329 | $1,830,320 |
| Reinvestment of distributions | - | 28,637 | - | 1,153,507 |
| Shares redeemed | (62,403) | (107,986) | (1,959,869) | (4,068,826) |
| Net increase (decrease) | 679 | (27,202) | $149,460 | $(1,084,999) |
| China Region | | | | |
| Shares sold | 3,583,185 | 4,318,983 | $124,632,995 | $163,821,858 |
| Reinvestment of distributions | 285,364 | 3,187,084 | 9,405,600 | 136,311,566 |
| Shares redeemed | (3,771,823) | (9,920,317) | (127,181,627) | (380,571,112) |
| Net increase (decrease) | 96,726 | (2,414,250) | $6,856,968 | $(80,437,688) |
| Class I | | | | |
| Shares sold | 808,487 | 518,992 | $28,385,168 | $19,260,467 |
| Reinvestment of distributions | 7,396 | 117,730 | 241,861 | 4,994,105 |
| Shares redeemed | (272,576) | (1,171,014) | (9,329,274) | (44,285,642) |
| Net increase (decrease) | 543,307 | (534,292) | $19,297,755 | $(20,031,070) |
| Class Z | | | | |
| Shares sold | 274,553 | 625,286 | $9,861,164 | $23,658,178 |
| Reinvestment of distributions | 1,256 | 148,353 | 41,047 | 6,272,360 |
| Shares redeemed | (54,131) | (2,031,604) | (1,802,220) | (63,059,582) |
| Net increase (decrease) | 221,678 | (1,257,965) | $8,099,991 | $(33,129,044) |
11. Other.
A fund's organizational documents provide former and current trustees and officers with a limited indemnification against liabilities arising in connection with the performance of their duties to the fund. In the normal course of business, a fund may also enter into contracts that provide general indemnifications. A fund's maximum exposure under these arrangements is unknown as this would be dependent on future claims that may be made against a fund. The risk of material loss from such claims is considered remote.
12. Risk and Uncertainties.
Many factors affect a fund's performance. Developments that disrupt global economies and financial markets, such as pandemics, epidemics, outbreaks of infectious diseases, war, terrorism, and environmental disasters, may significantly affect a fund's investment performance. The effects of these developments to a fund will be impacted by the types of securities in which a fund invests, the financial condition, industry, economic sector, and geographic location of an issuer, and a fund's level of investment in the securities of that issuer. Significant concentrations in security types, issuers, industries, sectors, and geographic locations may magnify the factors that affect a fund's performance.
Top Holdings (% of Fund's net assets) |
| |
| Taiwan Semiconductor Manufacturing Co. Ltd. (Taiwan, Semiconductors & Semiconductor Equipment) | 10.3 | |
| Alibaba Group Holding Ltd. sponsored ADR (China, Broadline Retail) | 7.3 | |
| Samsung Electronics Co. Ltd. (Korea (South), Technology Hardware, Storage & Peripherals) | 6.1 | |
| Zomato Ltd. (India, Hotels, Restaurants & Leisure) | 2.9 | |
| Reliance Industries Ltd. (India, Oil, Gas & Consumable Fuels) | 2.9 | |
| PDD Holdings, Inc. ADR (China, Broadline Retail) | 2.8 | |
| Sea Ltd. ADR (Singapore, Entertainment) | 2.0 | |
| Taiwan Semiconductor Manufacturing Co. Ltd. sponsored ADR (Taiwan, Semiconductors & Semiconductor Equipment) | 1.9 | |
| Meituan Class B (China, Hotels, Restaurants & Leisure) | 1.8 | |
| Micron Technology, Inc.(United States of America, Semiconductors & Semiconductor Equipment) | 1.8 | |
| | 39.8 | |
| |
| Market Sectors (% of Fund's net assets) |
| |
| Information Technology | 30.6 | |
| Consumer Discretionary | 26.2 | |
| Financials | 12.1 | |
| Health Care | 8.7 | |
| Communication Services | 7.0 | |
| Industrials | 6.5 | |
| Energy | 2.9 | |
| Real Estate | 1.7 | |
| Consumer Staples | 1.7 | |
| Materials | 1.6 | |
| |
Asset Allocation (% of Fund's net assets) |
|
|
Geographic Diversification (% of Fund's net assets) |
|
* Includes Short-Term investments and Net Other Assets (Liabilities). Percentages are adjusted for the effect of derivatives, if applicable. |
| |
Fidelity® Emerging Asia Fund
Showing Percentage of Net Assets
| Common Stocks - 97.2% |
| | | Shares | Value ($) |
| China - 39.3% | | | |
| Agora, Inc. ADR (a) | | 470,000 | 1,574,500 |
| Akeso, Inc. (a)(b)(c) | | 646,732 | 3,551,976 |
| Alibaba Group Holding Ltd. (a) | | 3,006,364 | 31,788,171 |
| Alibaba Group Holding Ltd. sponsored ADR (a) | | 448,405 | 37,975,419 |
| Anhui Korrun Co. Ltd. (A Shares) | | 1,325,261 | 3,156,080 |
| Antengene Corp. (a)(c) | | 3,408,163 | 1,177,096 |
| Baidu, Inc.: | | | |
| Class A (a) | | 103,600 | 1,559,378 |
| sponsored ADR (a) | | 28,701 | 3,461,628 |
| Bairong, Inc. (a)(c) | | 1,914,735 | 2,649,296 |
| BC Technology Group Ltd. (a) | | 3,282,217 | 1,180,889 |
| Beijing Sinohytec Co. Ltd. (A Shares) | | 439,880 | 5,128,280 |
| Bilibili, Inc. ADR (a)(b) | | 501,772 | 10,216,078 |
| BYD Co. Ltd.: | | | |
| (A Shares) | | 100,000 | 3,714,194 |
| (H Shares) | | 347,264 | 10,531,216 |
| DPC Dash Ltd. | | 326,300 | 2,109,725 |
| Empyrean Technology Co. Ltd. (A Shares) | | 233,600 | 3,936,109 |
| Estun Automation Co. Ltd.: | | | |
| (A Shares) | | 3,303,300 | 10,913,886 |
| (A Shares) | | 855,528 | 2,826,608 |
| Glodon Co. Ltd. (A Shares) | | 877,100 | 7,370,692 |
| GRG Metrology & Test Co. Ltd. (A Shares) | | 1,041,390 | 3,415,935 |
| Guangzhou Kingmed Diagnostics Group Co. Ltd. (A Shares) | | 551,732 | 6,541,774 |
| Hangzhou Tigermed Consulting Co. Ltd. (A Shares) | | 465,297 | 6,137,577 |
| Hundsun Technologies, Inc. (A Shares) | | 1,145,886 | 8,213,696 |
| Innovent Biologics, Inc. (a)(c) | | 705,745 | 3,393,273 |
| Jiangxi Copper Co. Ltd. (A Shares) | | 2,167,100 | 6,423,001 |
| Joinn Laboratories China Co. Ltd. (A Shares) | | 611,686 | 4,391,439 |
| Kangji Medical Holdings Ltd. (b) | | 1,511,945 | 1,905,184 |
| KE Holdings, Inc. ADR (a) | | 772,765 | 12,124,683 |
| Kindstar Globalgene Technology, Inc. (a)(c) | | 6,775,265 | 1,531,462 |
| Li Auto, Inc.: | | | |
| ADR (a) | | 462,710 | 10,873,685 |
| Class A (a) | | 326,484 | 3,866,830 |
| Meituan Class B (a)(c) | | 1,029,469 | 17,594,096 |
| Microport Cardioflow Medtech Corp. (a)(b)(c) | | 12,173,311 | 3,598,162 |
| MicroTech Medical (Hangzhou) Co. Ltd. (H Shares) (a)(c) | | 1,296,269 | 1,139,419 |
| Ming Yuan Cloud Group Holdings Ltd. | | 8,275,459 | 4,302,934 |
| New Horizon Health Ltd. (a)(c) | | 1,922,040 | 6,897,319 |
| NXP Semiconductors NV | | 38,762 | 6,346,890 |
| PDD Holdings, Inc. ADR (a) | | 390,699 | 26,626,137 |
| RLX Technology, Inc. ADR (a) | | 746,592 | 1,836,616 |
| Shenzhen Inovance Technology Co. Ltd. (A Shares) | | 1,110,632 | 9,947,830 |
| Shenzhen Mindray Bio-Medical Electronics Co. Ltd. (A Shares) | | 195,089 | 8,819,919 |
| Smoore International Holdings Ltd. (b)(c) | | 2,133,176 | 2,493,716 |
| Sunac China Holdings Ltd. (a)(b) | | 4,892,796 | 1,028,368 |
| Sungrow Power Supply Co. Ltd. (A Shares) | | 716,542 | 11,731,026 |
| Tencent Holdings Ltd. | | 208,856 | 9,276,572 |
| Trip.com Group Ltd. (a) | | 248,157 | 8,823,206 |
| Trip.com Group Ltd. ADR (a) | | 190,206 | 6,754,215 |
| Venus MedTech Hangzhou, Inc. (H Shares) (a)(c) | | 2,490,882 | 3,487,191 |
| Weihai Guangwei Composites Co. Ltd. (A Shares) | | 672,960 | 5,079,591 |
| WuXi AppTec Co. Ltd. (H Shares) (c) | | 854,720 | 7,517,204 |
| Wuxi Biologics (Cayman), Inc. (a)(c) | | 1,338,999 | 7,984,236 |
| Yonyou Network Technology Co. Ltd. (A Shares) | | 1,636,100 | 5,127,677 |
| Zai Lab Ltd. (a) | | 493,310 | 1,727,128 |
| Zai Lab Ltd. ADR (a) | | 94,279 | 3,297,879 |
TOTAL CHINA | | | 375,077,091 |
| Hong Kong - 2.5% | | | |
| AIA Group Ltd. | | 1,432,672 | 15,597,609 |
| Hong Kong Exchanges and Clearing Ltd. | | 142,944 | 5,934,592 |
| Huanxi Media Group Ltd. (a) | | 19,829,015 | 2,504,893 |
TOTAL HONG KONG | | | 24,037,094 |
| India - 18.4% | | | |
| Amber Enterprises India Ltd. (a) | | 79,174 | 1,814,813 |
| Asian Paints Ltd. | | 107,389 | 3,825,834 |
| Aster DM Healthcare Ltd. (a)(c) | | 663,051 | 2,008,221 |
| Bajaj Finance Ltd. | | 41,901 | 3,235,368 |
| Campus Activewear Ltd. | | 1,630,000 | 7,125,845 |
| Computer Age Management Services Private Ltd. | | 326,313 | 8,257,251 |
| Delhivery Private Ltd. | | 450,164 | 2,067,825 |
| Devyani International Ltd. (a) | | 1,695,512 | 3,362,871 |
| Dixon Technologies India Ltd. | | 134,879 | 4,831,592 |
| HDFC Asset Management Co. Ltd. (c) | | 355,961 | 7,702,489 |
| HDFC Bank Ltd. | | 499,403 | 10,336,157 |
| HDFC Standard Life Insurance Co. Ltd. (c) | | 430,500 | 2,797,763 |
| Hindustan Aeronautics Ltd. | | 170,895 | 6,126,417 |
| Housing Development Finance Corp. Ltd. | | 293,158 | 9,998,976 |
| Indian Energy Exchange Ltd. (a)(c) | | 1,110,458 | 2,135,380 |
| Kotak Mahindra Bank Ltd. | | 207,066 | 4,933,384 |
| MakeMyTrip Ltd. (a) | | 329,745 | 7,729,223 |
| One97 Communications Ltd. (a) | | 1,417,007 | 11,374,370 |
| Page Industries Ltd. | | 5,450 | 2,695,239 |
| Reliance Industries Ltd. | | 915,221 | 27,208,140 |
| Sapphire Foods India Ltd. (a) | | 236,579 | 3,477,031 |
| Tata Consultancy Services Ltd. | | 171,952 | 6,805,584 |
| Tata Motors Ltd. (a) | | 1,143,147 | 6,827,727 |
| Vijaya Diagnostic Centre Pvt Ltd. | | 196,617 | 909,953 |
| Zomato Ltd. (a) | | 34,497,779 | 27,615,333 |
TOTAL INDIA | | | 175,202,786 |
| Indonesia - 0.9% | | | |
| PT Bank Central Asia Tbk | | 13,717,603 | 8,489,160 |
| Japan - 3.5% | | | |
| Money Forward, Inc. (a) | | 401,557 | 16,722,577 |
| Renesas Electronics Corp. (a) | | 769,328 | 10,026,228 |
| Z Holdings Corp. | | 2,373,630 | 6,501,946 |
TOTAL JAPAN | | | 33,250,751 |
| Korea (South) - 9.8% | | | |
| Coupang, Inc. Class A (a) | | 564,758 | 9,465,344 |
| Delivery Hero AG (a)(c) | | 300,717 | 11,972,039 |
| Gabia, Inc. | | 128,155 | 1,121,125 |
| Kakao Pay Corp. (a) | | 188,330 | 7,742,364 |
| LG Energy Solution (a) | | 3,400 | 1,482,428 |
| Samsung Electronics Co. Ltd. | | 1,182,479 | 58,205,859 |
| SK Hynix, Inc. | | 46,680 | 3,142,038 |
TOTAL KOREA (SOUTH) | | | 93,131,197 |
| Netherlands - 1.1% | | | |
| ASML Holding NV (Netherlands) | | 7,702 | 4,867,199 |
| Shop Apotheke Europe NV (a)(b)(c) | | 52,018 | 5,186,190 |
TOTAL NETHERLANDS | | | 10,053,389 |
| Russia - 0.1% | | | |
| Yandex NV Series A (a)(b)(d) | | 153,309 | 1,165,148 |
| Singapore - 4.3% | | | |
| DBS Group Holdings Ltd. | | 284,779 | 7,036,879 |
| Oversea-Chinese Banking Corp. Ltd. | | 1,182,736 | 11,189,737 |
| Sea Ltd. ADR (a) | | 248,990 | 18,965,568 |
| United Overseas Bank Ltd. | | 201,231 | 4,273,736 |
TOTAL SINGAPORE | | | 41,465,920 |
| Switzerland - 0.7% | | | |
| Yunnan Botanee Bio-Technology Group Co. Ltd. ELS (UBS AG London Branch Bank Warrant Programme) Class A warrants 3/10/25 (a)(c) | | 179,025 | 2,971,124 |
| ZWSOFT Co. Ltd. (Guangzhou) ELS (UBS AG London Branch Bank Warrant Programme) Class A warrants 10/12/23 (a)(c) | | 144,349 | 4,104,914 |
TOTAL SWITZERLAND | | | 7,076,038 |
| Taiwan - 11.1% | | | |
| GlobalWafers Co. Ltd. | | 255,000 | 4,004,839 |
| MediaTek, Inc. | | 158,000 | 3,433,127 |
| Taiwan Semiconductor Manufacturing Co. Ltd. | | 4,907,892 | 80,313,476 |
| Taiwan Semiconductor Manufacturing Co. Ltd. sponsored ADR | | 212,253 | 17,892,928 |
TOTAL TAIWAN | | | 105,644,370 |
| United States of America - 5.2% | | | |
| Frontage Holdings Corp. (a)(c) | | 17,621,768 | 5,482,822 |
| GlobalFoundries, Inc. (a) | | 76,792 | 4,515,370 |
| Micron Technology, Inc. | | 260,875 | 16,789,915 |
| NVIDIA Corp. | | 28,240 | 7,836,318 |
| onsemi (a) | | 97,043 | 6,983,214 |
| Snap, Inc. Class A (a) | | 773,523 | 6,737,385 |
| Space Exploration Technologies Corp. Class A (a)(d)(e) | | 11,000 | 847,000 |
TOTAL UNITED STATES OF AMERICA | | | 49,192,024 |
| Vietnam - 0.3% | | | |
| Vietnam Dairy Products Corp. | | 1,043,400 | 3,119,146 |
| TOTAL COMMON STOCKS (Cost $965,733,033) | | | 926,904,114 |
| | | | |
| Preferred Stocks - 1.8% |
| | | Shares | Value ($) |
| Convertible Preferred Stocks - 0.6% | | | |
| China - 0.6% | | | |
| ByteDance Ltd. Series E1 (a)(d)(e) | | 23,366 | 4,649,834 |
| dMed Biopharmaceutical Co. Ltd. Series C (a)(d)(e) | | 128,423 | 1,139,112 |
| | | | 5,788,946 |
| Nonconvertible Preferred Stocks - 1.2% | | | |
| China - 0.3% | | | |
| ZKH Group Ltd. Series F (d) | | 8,603,093 | 3,183,144 |
| Korea (South) - 0.9% | | | |
| Samsung Electronics Co. Ltd. | | 200,292 | 8,376,501 |
TOTAL NONCONVERTIBLE PREFERRED STOCKS | | | 11,559,645 |
| TOTAL PREFERRED STOCKS (Cost $16,082,759) | | | 17,348,591 |
| | | | |
| Money Market Funds - 2.4% |
| | | Shares | Value ($) |
| Fidelity Cash Central Fund 4.88% (f) | | 4,403,084 | 4,403,965 |
| Fidelity Securities Lending Cash Central Fund 4.88% (f)(g) | | 18,907,290 | 18,909,181 |
| TOTAL MONEY MARKET FUNDS (Cost $23,313,146) | | | 23,313,146 |
| | | | |
| TOTAL INVESTMENT IN SECURITIES - 101.4% (Cost $1,005,128,938) | 967,565,851 |
NET OTHER ASSETS (LIABILITIES) - (1.4)% | (13,656,508) |
| NET ASSETS - 100.0% | 953,909,343 |
| | |
Security Type Abbreviations
| ELS | - | EQUITY-LINKED SECURITY |
Legend
| (b) | Security or a portion of the security is on loan at period end. |
| (c) | Security exempt from registration under Rule 144A of the Securities Act of 1933. These securities may be resold in transactions exempt from registration, normally to qualified institutional buyers. At the end of the period, the value of these securities amounted to $107,375,388 or 11.3% of net assets. |
| (e) | Restricted securities (including private placements) - Investment in securities not registered under the Securities Act of 1933 (excluding 144A issues). At the end of the period, the value of restricted securities (excluding 144A issues) amounted to $6,635,946 or 0.7% of net assets. |
| (f) | Affiliated fund that is generally available only to investment companies and other accounts managed by Fidelity Investments. The rate quoted is the annualized seven-day yield of the fund at period end. A complete unaudited listing of the fund's holdings as of its most recent quarter end is available upon request. In addition, each Fidelity Central Fund's financial statements are available on the SEC's website or upon request. |
| (g) | Investment made with cash collateral received from securities on loan. |
| Additional information on each restricted holding is as follows: |
| Security | Acquisition Date | Acquisition Cost ($) |
| ByteDance Ltd. Series E1 | 11/18/20 | 2,560,310 |
| | | |
| dMed Biopharmaceutical Co. Ltd. Series C | 12/01/20 | 1,824,011 |
| | | |
| Space Exploration Technologies Corp. Class A | 2/16/21 | 461,989 |
| | | |
Affiliated Central Funds
Fiscal year to date information regarding the Fund's investments in Fidelity Central Funds, including the ownership percentage, is presented below.
| Affiliate | Value, beginning of period ($) | Purchases ($) | Sales Proceeds ($) | Dividend Income ($) | Realized Gain (loss) ($) | Change in Unrealized appreciation (depreciation) ($) | Value, end of period ($) | % ownership, end of period |
| Fidelity Cash Central Fund 4.88% | 180,369 | 121,171,588 | 116,947,992 | 230,828 | - | - | 4,403,965 | 0.0% |
| Fidelity Securities Lending Cash Central Fund 4.88% | 32,545,160 | 150,143,758 | 163,779,737 | 510,747 | - | - | 18,909,181 | 0.1% |
| Total | 32,725,529 | 271,315,346 | 280,727,729 | 741,575 | - | - | 23,313,146 | |
| | | | | | | | | |
Amounts in the dividend income column in the above table include any capital gain distributions from underlying funds, which are presented in the corresponding line item in the Statement of Operations, if applicable.
Amounts in the dividend income column for Fidelity Securities Lending Cash Central Fund represents the income earned on investing cash collateral, less rebates paid to borrowers and any lending agent fees associated with the loan, plus any premium payments received for lending certain types of securities.
Amounts included in the purchases and sales proceeds columns may include in-kind transactions, if applicable.
Investment Valuation
The following is a summary of the inputs used, as of April 30, 2023, involving the Fund's assets and liabilities carried at fair value. The inputs or methodology used for valuing securities may not be an indication of the risk associated with investing in those securities. For more information on valuation inputs, and their aggregation into the levels used below, please refer to the Investment Valuation section in the accompanying Notes to Financial Statements.
| Valuation Inputs at Reporting Date: |
| Description | Total ($) | Level 1 ($) | Level 2 ($) | Level 3 ($) |
Investments in Securities: | | | | |
|
| Equities: | | | | |
Communication Services | 65,038,430 | 39,380,659 | 19,842,789 | 5,814,982 |
Consumer Discretionary | 250,730,031 | 111,396,062 | 139,333,969 | - |
Consumer Staples | 15,606,792 | 7,022,806 | 8,583,986 | - |
Energy | 27,208,140 | - | 27,208,140 | - |
Financials | 116,608,149 | - | 116,608,149 | - |
Health Care | 82,638,346 | 3,297,879 | 78,201,355 | 1,139,112 |
Industrials | 62,744,486 | - | 61,897,486 | 847,000 |
Information Technology | 292,013,710 | 66,806,334 | 225,207,376 | - |
Materials | 15,328,426 | - | 15,328,426 | - |
Real Estate | 16,336,195 | 12,124,683 | 1,028,368 | 3,183,144 |
|
| Money Market Funds | 23,313,146 | 23,313,146 | - | - |
| Total Investments in Securities: | 967,565,851 | 263,341,569 | 693,240,044 | 10,984,238 |
The following is a reconciliation of Investments in Securities for which Level 3 inputs were used in determining value:
| |
| Investments in Securities: | |
| Beginning Balance | $ | 12,231,826 | |
| Net Realized Gain (Loss) on Investment Securities | | - | |
| Net Unrealized Gain (Loss) on Investment Securities | | (960) | |
| Cost of Purchases | | - | |
| Proceeds of Sales | | - | |
| Amortization/Accretion | | - | |
| Transfers into Level 3 | | - | |
| Transfers out of Level 3 | | (1,246,628) | |
| Ending Balance | $ | 10,984,238 | |
| The change in unrealized gain (loss) for the period attributable to Level 3 securities held at April 30, 2023 | $ | (960) | |
| The information used in the above reconciliation represents fiscal year to date activity for any Investments in Securities identified as using Level 3 inputs at either the beginning or the end of the current fiscal period. Cost of purchases and proceeds of sales may include securities received and/or delivered through in-kind transactions, corporate actions or exchanges. Transfers into Level 3 were attributable to a lack of observable market data resulting from decreases in market activity, decreases in liquidity, security restructurings or corporate actions. Transfers out of Level 3 were attributable to observable market data becoming available for those securities. Transfers in or out of Level 3 represent the beginning value of any Security or Instrument where a change in the pricing level occurred from the beginning to the end of the period. Realized and unrealized gains (losses) disclosed in the reconciliation are included in Net Gain (Loss) on the Fund's Statement of Operations. | |
Fidelity® Emerging Asia Fund
| Statement of Assets and Liabilities |
| | | | April 30, 2023 (Unaudited) |
| | | | | |
| Assets | | | | |
| Investment in securities, at value (including securities loaned of $17,473,122) - See accompanying schedule: | | | | |
Unaffiliated issuers (cost $981,815,792) | $ | 944,252,705 | | |
Fidelity Central Funds (cost $23,313,146) | | 23,313,146 | | |
| | | | | |
| | | | | |
| Total Investment in Securities (cost $1,005,128,938) | | | $ | 967,565,851 |
| Foreign currency held at value (cost $4,846,594) | | | | 4,847,712 |
| Receivable for investments sold | | | | 6,028,688 |
| Receivable for fund shares sold | | | | 197,741 |
| Dividends receivable | | | | 633,766 |
| Distributions receivable from Fidelity Central Funds | | | | 76,962 |
| Prepaid expenses | | | | 424 |
| Other receivables | | | | 503,976 |
Total assets | | | | 979,855,120 |
| Liabilities | | | | |
| Payable for investments purchased | $ | 3,578,664 | | |
| Payable for fund shares redeemed | | 658,626 | | |
| Accrued management fee | | 475,286 | | |
| Other affiliated payables | | 197,833 | | |
| Deferred taxes | | 2,009,615 | | |
| Other payables and accrued expenses | | 115,342 | | |
| Collateral on securities loaned | | 18,910,411 | | |
| Total Liabilities | | | | 25,945,777 |
| Net Assets | | | $ | 953,909,343 |
| Net Assets consist of: | | | | |
| Paid in capital | | | $ | 1,246,579,636 |
| Total accumulated earnings (loss) | | | | (292,670,293) |
| Net Assets | | | $ | 953,909,343 |
Net Asset Value , offering price and redemption price per share ($953,909,343 ÷ 26,211,079 shares) | | | $ | 36.39 |
| Statement of Operations |
| | | | Six months ended April 30, 2023 (Unaudited) |
| Investment Income | | | | |
| Dividends | | | $ | 3,235,420 |
| Non-Cash dividends | | | | 256,116 |
| Income from Fidelity Central Funds (including $510,747 from security lending) | | | | 741,575 |
| Income before foreign taxes withheld | | | $ | 4,233,111 |
| Less foreign taxes withheld | | | | (509,576) |
| Total Income | | | | 3,723,535 |
| Expenses | | | | |
| Management fee | | | | |
| Basic fee | $ | 3,346,985 | | |
| Performance adjustment | | 727,469 | | |
| Transfer agent fees | | 964,873 | | |
| Accounting fees | | 221,220 | | |
| Custodian fees and expenses | | 101,709 | | |
| Independent trustees' fees and expenses | | 3,307 | | |
| Registration fees | | 19,651 | | |
| Audit | | 56,891 | | |
| Legal | | 1,244 | | |
| Interest | | 4,608 | | |
| Miscellaneous | | 2,237 | | |
| Total expenses before reductions | | 5,450,194 | | |
| Expense reductions | | (22,698) | | |
| Total expenses after reductions | | | | 5,427,496 |
| Net Investment income (loss) | | | | (1,703,961) |
| Realized and Unrealized Gain (Loss) | | | | |
| Net realized gain (loss) on: | | | | |
| Investment Securities: | | | | |
| Unaffiliated issuers (net of foreign taxes of $569,524) | | (107,795,861) | | |
| Foreign currency transactions | | (105,524) | | |
| Total net realized gain (loss) | | | | (107,901,385) |
| Change in net unrealized appreciation (depreciation) on: | | | | |
| Investment Securities: | | | | |
| Unaffiliated issuers (net of decrease in deferred foreign taxes of $1,436,508) | | 275,078,646 | | |
| Assets and liabilities in foreign currencies | | 379,736 | | |
| Total change in net unrealized appreciation (depreciation) | | | | 275,458,382 |
| Net gain (loss) | | | | 167,556,997 |
| Net increase (decrease) in net assets resulting from operations | | | $ | 165,853,036 |
| Statement of Changes in Net Assets |
| |
| | Six months ended April 30, 2023 (Unaudited) | | Year ended October 31, 2022 |
| Increase (Decrease) in Net Assets | | | | |
| Operations | | | | |
| Net investment income (loss) | $ | (1,703,961) | $ | (6,406,902) |
| Net realized gain (loss) | | (107,901,385) | | (135,551,761) |
| Change in net unrealized appreciation (depreciation) | | 275,458,382 | | (672,888,572) |
| Net increase (decrease) in net assets resulting from operations | | 165,853,036 | | (814,847,235) |
| Distributions to shareholders | | - | | (218,312,620) |
| Share transactions | | | | |
| Proceeds from sales of shares | | 68,096,921 | | 116,575,535 |
| Reinvestment of distributions | | - | | 202,673,713 |
| Cost of shares redeemed | | (103,567,472) | | (462,682,896) |
Net increase (decrease) in net assets resulting from share transactions | | (35,470,551) | | (143,433,648) |
| Total increase (decrease) in net assets | | 130,382,485 | | (1,176,593,503) |
| | | | | |
| Net Assets | | | | |
| Beginning of period | | 823,526,858 | | 2,000,120,361 |
| End of period | $ | 953,909,343 | $ | 823,526,858 |
| | | | | |
| Other Information | | | | |
| Shares | | | | |
| Sold | | 1,803,232 | | 2,698,029 |
| Issued in reinvestment of distributions | | - | | 3,879,665 |
| Redeemed | | (2,833,084) | | (10,270,869) |
| Net increase (decrease) | | (1,029,852) | | (3,693,175) |
| | | | | |
Financial Highlights
| Fidelity® Emerging Asia Fund |
| |
| | Six months ended (Unaudited) April 30, 2023 | | Years ended October 31, 2022 | | 2021 | | 2020 | | 2019 | | 2018 |
Selected Per-Share Data | | | | | | | | | | | | |
| Net asset value, beginning of period | $ | 30.23 | $ | 64.66 | $ | 63.60 | $ | 45.03 | $ | 36.69 | $ | 43.94 |
| Income from Investment Operations | | | | | | | | | | | | |
Net investment income (loss) A,B | | (.06) | | (.22) | | (.31) C | | (.12) | | .34 | | .41 |
| Net realized and unrealized gain (loss) | | 6.22 | | (26.97) | | 11.00 | | 21.49 | | 9.27 | | (7.27) |
| Total from investment operations | | 6.16 | | (27.19) | | 10.69 | | 21.37 | | 9.61 | | (6.86) |
| Distributions from net investment income | | - | | (.09) | | - | | (.29) D | | (.39) | | (.37) |
| Distributions from net realized gain | | - | | (7.15) | | (9.63) | | (2.51) D | | (.88) | | (.02) |
| Total distributions | | - | | (7.24) | | (9.63) | | (2.80) | | (1.27) | | (.39) |
Redemption fees added to paid in capital A | | - | | - | | - | | - | | - | | - E |
| Net asset value, end of period | $ | 36.39 | $ | 30.23 | $ | 64.66 | $ | 63.60 | $ | 45.03 | $ | 36.69 |
Total Return F,G | | 20.38% | | (46.77)% | | 17.02% | | 50.46% | | 26.95% | | (15.75)% |
Ratios to Average Net Assets B,H,I | | | | | | | | | | | | |
| Expenses before reductions | | 1.10% J | | 1.18% | | 1.02% | | 1.13% | | 1.11% | | 1.02% |
| Expenses net of fee waivers, if any | | 1.10% J | | 1.17% | | 1.02% | | 1.13% | | 1.11% | | 1.02% |
| Expenses net of all reductions | | 1.10% J | | 1.17% | | 1.02% | | 1.10% | | 1.11% | | 1.00% |
| Net investment income (loss) | | (.34)% J | | (.51)% | | (.45)% C | | (.24)% | | .82% | | .93% |
| Supplemental Data | | | | | | | | | | | | |
| Net assets, end of period (000 omitted) | $ | 953,909 | $ | 823,527 | $ | 2,000,120 | $ | 1,578,782 | $ | 993,620 | $ | 913,940 |
Portfolio turnover rate K | | 34% J | | 44% | | 85% | | 114% | | 61% L | | 36% |
A Calculated based on average shares outstanding during the period.
B Net investment income (loss) is affected by the timing of the declaration of dividends by any underlying mutual funds or exchange-traded funds (ETFs). Net investment income (loss) of any mutual funds or ETFs is not included in the Fund's net investment income (loss) ratio.
C Net investment income per share reflects one or more large, non-recurring dividend(s) which amounted to $.06 per share. Excluding such non-recurring dividend(s), the ratio of net investment income (loss) to average net assets would have been (.54)%.
D The amount shown reflects reclassifications related to book to tax differences that were made in the year shown.
E Amount represents less than $.005 per share.
F Total returns for periods of less than one year are not annualized.
G Total returns would have been lower if certain expenses had not been reduced during the applicable periods shown.
H Fees and expenses of any underlying mutual funds or exchange-traded funds (ETFs) are not included in the Fund's expense ratio. The Fund indirectly bears its proportionate share of these expenses. For additional expense information related to investments in Fidelity Central Funds, please refer to the "Investments in Fidelity Central Funds" note found in the Notes to Financial Statements section of the most recent Annual or Semi-Annual report.
I Expense ratios reflect operating expenses of the class. Expenses before reductions do not reflect amounts reimbursed, waived, or reduced through arrangements with the investment adviser, brokerage services, or other offset arrangements, if applicable, and do not represent the amount paid by the class during periods when reimbursements, waivers or reductions occur.
J Annualized.
K Amount does not include the portfolio activity of any underlying mutual funds or exchange-traded funds (ETFs).
L Portfolio turnover rate excludes securities received or delivered in-kind.
For the period ended April 30, 2023
1. Organization.
Fidelity Emerging Asia Fund (the Fund) is a fund of Fidelity Investment Trust (the Trust) and is authorized to issue an unlimited number of shares. Share transactions on the Statement of Changes in Net Assets may contain exchanges between affiliated funds. The Trust is registered under the Investment Company Act of 1940, as amended (the 1940 Act), as an open-end management investment company organized as a Massachusetts business trust. The Fund's investments in emerging markets can be subject to social, economic, regulatory, and political uncertainties and can be extremely volatile.
2. Investments in Fidelity Central Funds.
Funds may invest in Fidelity Central Funds, which are open-end investment companies generally available only to other investment companies and accounts managed by the investment adviser and its affiliates. The Schedule of Investments lists any Fidelity Central Funds held as an investment as of period end, but does not include the underlying holdings of each Fidelity Central Fund. An investing fund indirectly bears its proportionate share of the expenses of the underlying Fidelity Central Funds.
Based on its investment objective, each Fidelity Central Fund may invest or participate in various investment vehicles or strategies that are similar to those of the investing fund. These strategies are consistent with the investment objectives of the investing fund and may involve certain economic risks which may cause a decline in value of each of the Fidelity Central Funds and thus a decline in the value of the investing fund.
| Fidelity Central Fund | Investment Manager | Investment Objective | Investment Practices | Expense Ratio A |
| Fidelity Money Market Central Funds | Fidelity Management & Research Company LLC (FMR) | Each fund seeks to obtain a high level of current income consistent with the preservation of capital and liquidity. | Short-term Investments | Less than .005% |
A Expenses expressed as a percentage of average net assets and are as of each underlying Central Fund's most recent annual or semi-annual shareholder report.
A complete unaudited list of holdings for each Fidelity Central Fund is available upon request or at the Securities and Exchange Commission website at www.sec.gov. In addition, the financial statements of the Fidelity Central Funds which contain the significant accounting policies (including investment valuation policies) of those funds, and are not covered by the Report of Independent Registered Public Accounting Firm, are available on the Securities and Exchange Commission website or upon request.
3. Significant Accounting Policies.
The Fund is an investment company and applies the accounting and reporting guidance of the Financial Accounting Standards Board (FASB) Accounting Standards Codification Topic 946 Financial Services - Investment Companies . The financial statements have been prepared in conformity with accounting principles generally accepted in the United States of America (GAAP), which require management to make certain estimates and assumptions at the date of the financial statements. Actual results could differ from those estimates. Subsequent events, if any, through the date that the financial statements were issued have been evaluated in the preparation of the financial statements. The Fund's Schedule of Investments lists any underlying mutual funds or exchange-traded funds (ETFs) but does not include the underlying holdings of these funds. The following summarizes the significant accounting policies of the Fund:
Investment Valuation. Investments are valued as of 4:00 p.m. Eastern time on the last calendar day of the period. The Board of Trustees (the Board) has designated the Fund's investment adviser as the valuation designee responsible for the fair valuation function and performing fair value determinations as needed. The investment adviser has established a Fair Value Committee (the Committee) to carry out the day-to-day fair valuation responsibilities and has adopted policies and procedures to govern the fair valuation process and the activities of the Committee. In accordance with these fair valuation policies and procedures, which have been approved by the Board, the Fund attempts to obtain prices from one or more third party pricing services or brokers to value its investments. When current market prices, quotations or currency exchange rates are not readily available or reliable, investments will be fair valued in good faith by the Committee, in accordance with the policies and procedures. Factors used in determining fair value vary by investment type and may include market or investment specific events, transaction data, estimated cash flows, and market observations of comparable investments. The frequency that the fair valuation procedures are used cannot be predicted and they may be utilized to a significant extent. The Committee manages the Fund's fair valuation practices and maintains the fair valuation policies and procedures. The Fund's investment adviser reports to the Board information regarding the fair valuation process and related material matters.
The Fund categorizes the inputs to valuation techniques used to value its investments into a disclosure hierarchy consisting of three levels as shown below:
Level 1 - unadjusted quoted prices in active markets for identical investments
Level 2 - other significant observable inputs (including quoted prices for similar investments, interest rates, prepayment speeds, etc.)
Level 3 - unobservable inputs (including the Fund's own assumptions based on the best information available)
Valuation techniques used to value the Fund's investments by major category are as follows:
Equity securities, including restricted securities, for which market quotations are readily available, are valued at the last reported sale price or official closing price as reported by a third party pricing service on the primary market or exchange on which they are traded and are categorized as Level 1 in the hierarchy. In the event there were no sales during the day or closing prices are not available, securities are valued at the last quoted bid price or may be valued using the last available price and are generally categorized as Level 2 in the hierarchy. For foreign equity securities, when market or security specific events arise, comparisons to the valuation of American Depositary Receipts (ADRs), futures contracts, ETFs and certain indexes as well as quoted prices for similar securities may be used and would be categorized as Level 2 in the hierarchy. For equity securities, including restricted securities, where observable inputs are limited, assumptions about market activity and risk are used and these securities may be categorized as Level 3 in the hierarchy. Securities, including private placements or other restricted securities, for which observable inputs are not available are valued using alternate valuation approaches, including the market approach, the income approach and cost approach, and are categorized as Level 3 in the hierarchy. The market approach considers factors including the price of recent investments in the same or a similar security or financial metrics of comparable securities. The income approach considers factors including expected future cash flows, security specific risks and corresponding discount rates. The cost approach considers factors including the value of the security's underlying assets and liabilities.
Investments in open-end mutual funds, including the Fidelity Central Funds, are valued at their closing net asset value (NAV) each business day and are categorized as Level 1 in the hierarchy.
The following provides information on Level 3 securities held by the Fund that were valued at period end based on unobservable inputs. These amounts exclude valuations provided by a broker.
| Asset Type | Fair Value | Valuation Technique(s) | Unobservable Input | Amount or Range/Weighted Average | Impact to Valuation from an Increase in Input A |
| Equities | $10,984,238 | Market comparable | Enterprise value/Revenue multiple (EV/R) | 1.4 - 8.5 / 3.9 | Increase |
| | | Market approach | Transaction price | $9.50 | Increase |
| | | | Discount rate | 20.0% | Decrease |
A Represents the directional change in the fair value of the Level 3 investments that could have resulted from an increase in the corresponding input as of period end. A decrease to the unobservable input would have had the opposite effect. Significant changes in these inputs may have resulted in a significantly higher or lower fair value measurement at period end.
Changes in valuation techniques may result in transfers in or out of an assigned level within the disclosure hierarchy. The aggregate value of investments by input level as of April 30, 2023, as well as a roll forward of Level 3 investments, is included at the end of the Fund's Schedule of Investments.
Foreign Currency. Certain Funds may use foreign currency contracts to facilitate transactions in foreign-denominated securities. Gains and losses from these transactions may arise from changes in the value of the foreign currency or if the counterparties do not perform under the contracts' terms.
Foreign-denominated assets, including investment securities, and liabilities are translated into U.S. dollars at the exchange rates at period end. Purchases and sales of investment securities, income and dividends received, and expenses denominated in foreign currencies are translated into U.S. dollars at the exchange rate in effect on the transaction date.
The effects of exchange rate fluctuations on investments are included with the net realized and unrealized gain (loss) on investment securities. Other foreign currency transactions resulting in realized and unrealized gain (loss) are disclosed separately.
Investment Transactions and Income. For financial reporting purposes, the Fund's investment holdings and NAV include trades executed through the end of the last business day of the period. The NAV per share for processing shareholder transactions is calculated as of the close of business of the New York Stock Exchange (NYSE), normally 4:00 p.m. Eastern time and includes trades executed through the end of the prior business day. Gains and losses on securities sold are determined on the basis of identified cost and include proceeds received from litigation. Commissions paid to certain brokers with whom the investment adviser, or its affiliates, places trades on behalf of a fund include an amount in addition to trade execution, which may be rebated back to a fund. Any such rebates are included in net realized gain (loss) on investments in the Statement of Operations. Dividend income is recorded on the ex-dividend date, except for certain dividends from foreign securities where the ex-dividend date may have passed, which are recorded as soon as the Fund is informed of the ex-dividend date. Non-cash dividends included in dividend income, if any, are recorded at the fair market value of the securities received. Income and capital gain distributions from Fidelity Central Funds, if any, are recorded on the ex-dividend date. Investment income is recorded net of foreign taxes withheld where recovery of such taxes is uncertain. Funds may file withholding tax reclaims in certain jurisdictions to recover a portion of amounts previously withheld. Any withholding tax reclaims income is included in the Statement of Operations in foreign taxes withheld. Any receivables for withholding tax reclaims are included in the Statement of Assets and Liabilities in dividends receivable.
Expenses. Expenses directly attributable to a fund are charged to that fund. Expenses attributable to more than one fund are allocated among the respective funds on the basis of relative net assets or other appropriate methods. Expenses included in the accompanying financial statements reflect the expenses of that fund and do not include any expenses associated with any underlying mutual funds or exchange-traded funds. Although not included in a fund's expenses, a fund indirectly bears its proportionate share of these expenses through the net asset value of each underlying mutual fund or exchange-traded fund. Expense estimates are accrued in the period to which they relate and adjustments are made when actual amounts are known.
Income Tax Information and Distributions to Shareholders. Each year, the Fund intends to qualify as a regulated investment company under Subchapter M of the Internal Revenue Code, including distributing substantially all of its taxable income and realized gains. As a result, no provision for U.S. Federal income taxes is required. The Fund files a U.S. federal tax return, in addition to state and local tax returns as required. The Fund's federal income tax returns are subject to examination by the Internal Revenue Service (IRS) for a period of three fiscal years after they are filed. State and local tax returns may be subject to examination for an additional fiscal year depending on the jurisdiction. Foreign taxes are provided for based on the Fund's understanding of the tax rules and rates that exist in the foreign markets in which it invests. The Fund is subject to a tax imposed on capital gains by certain countries in which it invests. An estimated deferred tax liability for net unrealized appreciation on the applicable securities is included in Deferred taxes on the Statement of Assets & Liabilities.
Distributions are declared and recorded on the ex-dividend date. Income and capital gain distributions are determined in accordance with income tax regulations, which may differ from GAAP.
Capital accounts within the financial statements are adjusted for permanent book-tax differences. These adjustments have no impact on net assets or the results of operations. Capital accounts are not adjusted for temporary book-tax differences which will reverse in a subsequent period.
Book-tax differences are primarily due to foreign currency transactions, certain foreign taxes, passive foreign investment companies (PFIC), net operating losses, capital loss carryforwards and losses deferred due to wash sales and excise tax regulations.
As of period end, the cost and unrealized appreciation (depreciation) in securities, and derivatives if applicable, for federal income tax purposes were as follows:
| Gross unrealized appreciation | $219,176,600 |
| Gross unrealized depreciation | (282,366,394) |
| Net unrealized appreciation (depreciation) | $(63,189,794) |
| Tax cost | $1,030,755,645 |
Capital loss carryforwards are only available to offset future capital gains of the Fund to the extent provided by regulations and may be limited. The capital loss carryforward information presented below, including any applicable limitation, is estimated as of prior fiscal period end and is subject to adjustment.
Short-term | $(111,911,461) |
Long-term | (4,880,227) |
| Total capital loss carryforward | $(116,791,688) |
The Fund elected to defer to its next fiscal year $6,944,021 of ordinary losses recognized during the period January 1, 2022 to October 31, 2022.
Restricted Securities (including Private Placements). Funds may invest in securities that are subject to legal or contractual restrictions on resale. These securities generally may be resold in transactions exempt from registration or to the public if the securities are registered. Disposal of these securities may involve time-consuming negotiations and expense, and prompt sale at an acceptable price may be difficult. Information regarding restricted securities held at period end is included at the end of the Schedule of Investments, if applicable.
New Accounting Pronouncement. In June 2022, the Financial Accounting Standards Board (FASB) issued Accounting Standards Update (ASU) 2022-03 Fair Value Measurement (Topic 820): Fair Value Measurement of Equity Securities Subject to Contractual Sale Restrictions. The amendments in this ASU clarify that a contractual restriction on the sale of an equity security is not considered part of the unit of account of the equity security and, therefore, is not considered in measuring fair value. They also clarify that an entity cannot, as a separate unit of account, recognize and measure a contractual sale restriction. They also require additional disclosures for equity securities subject to contractual sale restrictions. ASU 2022-03 will be effective for fiscal years, including interim periods within those fiscal years, beginning after December 15, 2023, and allows for early adoption. ASU 2022-03 will only be applicable to an equity security in which the contractual arrangement that restricts its sale is executed or modified on or after the adoption date. Management is currently evaluating the potential impact of ASU 2022-03 to the financial statements.
4. Purchases and Sales of Investments.
Purchases and sales of securities, other than short-term securities and in-kind transactions, as applicable, are noted in the table below.
| | Purchases ($) | Sales ($) |
| Fidelity Emerging Asia Fund | 164,683,881 | 215,727,216 |
5. Fees and Other Transactions with Affiliates.
Management Fee. Fidelity Management & Research Company LLC (the investment adviser) and its affiliates provide the Fund with investment management related services for which the Fund pays a monthly management fee. The management fee is the sum of an individual fund fee rate that is based on an annual rate of .45% of the Fund's average net assets and an annualized group fee rate that averaged .23% during the period. The group fee rate is based upon the monthly average net assets of a group of registered investment companies with which the investment adviser has management contracts. The group fee rate decreases as assets under management increase and increases as assets under management decrease. In addition, the management fee is subject to a performance adjustment (up to a maximum of +/- .20% of the Fund's average net assets over a 36 month performance period). The upward or downward adjustment to the management fee is based on the Fund's relative investment performance as compared to its benchmark index, the MSCI All Country Asia ex Japan Index, over the same 36 month performance period. For the reporting period, the total annualized management fee rate, including the performance adjustment, was .82% of the Fund's average net assets. The performance adjustment included in the management fee rate may be higher or lower than the maximum performance adjustment rate due to the difference between the average net assets for the reporting and performance periods.
Transfer Agent Fees. Fidelity Investments Institutional Operations Company LLC (FIIOC), an affiliate of the investment adviser, is the Fund's transfer, dividend disbursing and shareholder servicing agent. FIIOC receives account fees and asset-based fees that vary according to account size and type of account. FIIOC pays for typesetting, printing and mailing of shareholder reports, except proxy statements. For the period, the transfer agent fees were equivalent to an annualized rate of .20% of average net assets.
Accounting Fees. Fidelity Service Company, Inc. (FSC), an affiliate of the investment adviser, maintains the Fund's accounting records. The accounting fee is based on the level of average net assets for each month. For the period, the fees were equivalent to the following annualized rates:
| | % of Average Net Assets |
| Fidelity Emerging Asia Fund | .04 |
Brokerage Commissions. A portion of portfolio transactions were placed with brokerage firms which are affiliates of the investment adviser. Brokerage commissions are included in net realized gain (loss) and change in net unrealized appreciation (depreciation) in the Statement of Operations. The commissions paid to these affiliated firms were as follows:
| | Amount |
| Fidelity Emerging Asia Fund | $2,898 |
Interfund Lending Program. Pursuant to an Exemptive Order issued by the Securities and Exchange Commission (the SEC), the Fund, along with other registered investment companies having management contracts with Fidelity Management & Research Company LLC (FMR), or other affiliated entities of FMR, may participate in an interfund lending program. This program provides an alternative credit facility allowing the Fund to borrow from, or lend money to, other participating affiliated funds. At period end, there were no interfund loans outstanding. Activity in this program during the period for which loans were outstanding was as follows:
| | Borrower or Lender | Average Loan Balance | Weighted Average Interest Rate | Interest Expense |
| Fidelity Emerging Asia Fund | Borrower | $4,093,875 | 5.07% | $4,608 |
Interfund Trades. Funds may purchase from or sell securities to other Fidelity Funds under procedures adopted by the Board. The procedures have been designed to ensure these interfund trades are executed in accordance with Rule 17a-7 of the 1940 Act. Any interfund trades are included within the respective purchases and sales amounts shown in the Purchases and Sales of Investments note. Interfund trades during the period are noted in the table below.
| | Purchases ($) | Sales ($) | Realized Gain (Loss) ($) |
| Fidelity Emerging Asia Fund | 3,177,098 | 8,804,915 | (6,897,412) |
6. Committed Line of Credit.
Certain Funds participate with other funds managed by the investment adviser or an affiliate in a $4.25 billion credit facility (the "line of credit") to be utilized for temporary or emergency purposes to fund shareholder redemptions or for other short-term liquidity purposes. The participating funds have agreed to pay commitment fees on their pro-rata portion of the line of credit, which are reflected in Miscellaneous expenses on the Statement of Operations, and are listed below. During the period, there were no borrowings on this line of credit.
| | Amount |
| Fidelity Emerging Asia Fund | $962 |
7. Security Lending.
Funds lend portfolio securities from time to time in order to earn additional income. Lending agents are used, including National Financial Services (NFS), an affiliate of the investment adviser. Pursuant to a securities lending agreement, NFS will receive a fee, which is capped at 9.9% of a fund's daily lending revenue, for its services as lending agent. A fund may lend securities to certain qualified borrowers, including NFS. On the settlement date of the loan, a fund receives collateral (in the form of U.S. Treasury obligations, letters of credit and/or cash) against the loaned securities and maintains collateral in an amount not less than 100% of the market value of the loaned securities during the period of the loan. The market value of the loaned securities is determined at the close of business of a fund and any additional required collateral is delivered to a fund on the next business day. A fund or borrower may terminate the loan at any time, and if the borrower defaults on its obligation to return the securities loaned because of insolvency or other reasons, a fund may apply collateral received from the borrower against the obligation. A fund may experience delays and costs in recovering the securities loaned. Any cash collateral received is invested in the Fidelity Securities Lending Cash Central Fund. Any loaned securities are identified as such in the Schedule of Investments, and the value of loaned securities and cash collateral at period end, as applicable, are presented in the Statement of Assets and Liabilities. Security lending income represents the income earned on investing cash collateral, less rebates paid to borrowers and any lending agent fees associated with the loan, plus any premium payments received for lending certain types of securities. Security lending income is presented in the Statement of Operations as a component of income from Fidelity Central Funds. Affiliated security lending activity, if any, was as follows:
| | Total Security Lending Fees Paid to NFS | Security Lending Income From Securities Loaned to NFS | Value of Securities Loaned to NFS at Period End |
| Fidelity Emerging Asia Fund | $54,755 | $- | $- |
8. Expense Reductions.
During the period the investment adviser or an affiliate reimbursed and/or waived a portion of operating expenses in the amount of $22,698.
9. Other.
A fund's organizational documents provide former and current trustees and officers with a limited indemnification against liabilities arising in connection with the performance of their duties to the fund. In the normal course of business, a fund may also enter into contracts that provide general indemnifications. A fund's maximum exposure under these arrangements is unknown as this would be dependent on future claims that may be made against a fund. The risk of material loss from such claims is considered remote.
10. Risk and Uncertainties.
Many factors affect a fund's performance. Developments that disrupt global economies and financial markets, such as pandemics, epidemics, outbreaks of infectious diseases, war, terrorism, and environmental disasters, may significantly affect a fund's investment performance. The effects of these developments to a fund will be impacted by the types of securities in which a fund invests, the financial condition, industry, economic sector, and geographic location of an issuer, and a fund's level of investment in the securities of that issuer. Significant concentrations in security types, issuers, industries, sectors, and geographic locations may magnify the factors that affect a fund's performance.
Top Holdings (% of Fund's net assets) |
| |
| Taiwan Semiconductor Manufacturing Co. Ltd. (Taiwan, Semiconductors & Semiconductor Equipment) | 8.3 | |
| Tencent Holdings Ltd. (China, Interactive Media & Services) | 6.1 | |
| Samsung Electronics Co. Ltd. (Korea (South), Technology Hardware, Storage & Peripherals) | 4.6 | |
| NVIDIA Corp. (United States of America, Semiconductors & Semiconductor Equipment) | 3.4 | |
| Reliance Industries Ltd. (India, Oil, Gas & Consumable Fuels) | 2.9 | |
| PT Bank Central Asia Tbk (Indonesia, Banks) | 2.7 | |
| Alibaba Group Holding Ltd. (China, Broadline Retail) | 2.6 | |
| Kweichow Moutai Co. Ltd. (A Shares) (China, Beverages) | 2.5 | |
| Housing Development Finance Corp. Ltd. (India, Financial Services) | 2.3 | |
| PDD Holdings, Inc. ADR (China, Broadline Retail) | 2.1 | |
| | 37.5 | |
| |
| Market Sectors (% of Fund's net assets) |
| |
| Information Technology | 26.4 | |
| Financials | 18.7 | |
| Consumer Discretionary | 11.4 | |
| Communication Services | 9.3 | |
| Health Care | 7.6 | |
| Industrials | 6.5 | |
| Consumer Staples | 6.5 | |
| Energy | 5.6 | |
| Materials | 4.4 | |
| Utilities | 1.8 | |
| Real Estate | 0.2 | |
| |
Asset Allocation (% of Fund's net assets) |
|
|
Geographic Diversification (% of Fund's net assets) |
|
* Includes Short-Term investments and Net Other Assets (Liabilities). Percentages are adjusted for the effect of derivatives, if applicable. |
| |
Fidelity® Emerging Markets Fund
Showing Percentage of Net Assets
| Common Stocks - 97.7% |
| | | Shares | Value ($) |
| Australia - 0.4% | | | |
| Lynas Rare Earths Ltd. (a) | | 5,885,228 | 25,276,500 |
| Brazil - 2.5% | | | |
| Localiza Rent a Car SA | | 7,017,537 | 81,616,609 |
| Localiza Rent a Car SA rights 5/11/23 (a) | | 27,237 | 93,706 |
| PagSeguro Digital Ltd. (a) | | 1,068,399 | 10,513,046 |
| Vamos Locacao de Caminhoes Maquinas e Equipamentos SA | | 17,010,284 | 41,674,821 |
| XP, Inc. Class A (a)(b) | | 2,927,700 | 41,836,833 |
TOTAL BRAZIL | | | 175,735,015 |
| China - 25.8% | | | |
| Alibaba Group Holding Ltd. (a) | | 17,145,032 | 181,285,169 |
| Bank of Chengdu Co. Ltd. (A Shares) | | 17,931,644 | 35,728,045 |
| Bilibili, Inc. ADR (a)(b) | | 1,830,000 | 37,258,800 |
| Chervon Holdings Ltd. | | 9,903,337 | 50,396,823 |
| Hansoh Pharmaceutical Group Co. Ltd. (c) | | 31,570,000 | 57,593,250 |
| Huali Industrial Group Co. Ltd. (A Shares) | | 3,864,963 | 24,716,738 |
| Kweichow Moutai Co. Ltd. (A Shares) | | 694,180 | 177,123,164 |
| Meituan Class B (a)(c) | | 7,791,310 | 133,157,050 |
| NetEase, Inc. ADR | | 465,100 | 41,454,363 |
| PDD Holdings, Inc. ADR (a) | | 2,185,700 | 148,955,455 |
| Shandong Sinocera Functional Material Co. Ltd. (A Shares) | | 8,804,849 | 37,574,646 |
| Shenzhen Mindray Bio-Medical Electronics Co. Ltd. (A Shares) | | 2,450,554 | 110,788,861 |
| Silergy Corp. | | 2,949,000 | 46,515,456 |
| Sinopharm Group Co. Ltd. (H Shares) | | 21,595,699 | 76,497,974 |
| Sunresin New Materials Co. Ltd. (A Shares) | | 3,210,889 | 41,832,654 |
| Tencent Holdings Ltd. | | 9,641,800 | 428,251,306 |
| Wuliangye Yibin Co. Ltd. (A Shares) | | 3,772,134 | 92,375,107 |
| Wuxi Biologics (Cayman), Inc. (a)(c) | | 11,281,000 | 67,266,791 |
| Zai Lab Ltd. ADR (a) | | 1,006,900 | 35,221,362 |
TOTAL CHINA | | | 1,823,993,014 |
| France - 3.2% | | | |
| Gaztransport et Technigaz SA | | 387,948 | 41,444,176 |
| Hermes International SCA | | 41,119 | 89,113,792 |
| LVMH Moet Hennessy Louis Vuitton SE | | 66,999 | 64,445,087 |
| Sartorius Stedim Biotech | | 128,400 | 34,309,860 |
TOTAL FRANCE | | | 229,312,915 |
| Hong Kong - 3.1% | | | |
| AIA Group Ltd. | | 10,430,600 | 113,558,732 |
| Hong Kong Exchanges and Clearing Ltd. | | 1,493,574 | 62,008,562 |
| Techtronic Industries Co. Ltd. | | 4,269,000 | 46,184,131 |
TOTAL HONG KONG | | | 221,751,425 |
| Hungary - 0.8% | | | |
| Richter Gedeon PLC | | 2,267,800 | 54,727,029 |
| India - 16.1% | | | |
| 360 ONE WAM Ltd. | | 5,663,156 | 29,166,212 |
| HDFC Bank Ltd. | | 5,319,694 | 110,101,844 |
| HDFC Standard Life Insurance Co. Ltd. (c) | | 8,040,600 | 52,254,798 |
| Housing Development Finance Corp. Ltd. | | 4,846,446 | 165,301,636 |
| Kotak Mahindra Bank Ltd. | | 4,620,048 | 110,073,453 |
| Larsen & Toubro Ltd. | | 3,393,300 | 98,484,001 |
| Mankind Pharma Ltd. (d) | | 38,701 | 485,715 |
| Mankind Pharma Ltd. (d) | | 38,701 | 485,715 |
| Petronet LNG Ltd. | | 19,126,300 | 55,610,265 |
| Power Grid Corp. of India Ltd. | | 44,879,500 | 130,638,652 |
| Reliance Industries Ltd. | | 7,001,618 | 208,147,546 |
| Restaurant Brands Asia Ltd. (a)(e) | | 25,702,456 | 32,249,937 |
| Tata Consultancy Services Ltd. | | 1,778,500 | 70,390,179 |
| Ultratech Cement Ltd. | | 808,600 | 74,934,423 |
TOTAL INDIA | | | 1,138,324,376 |
| Indonesia - 2.7% | | | |
| PT Bank Central Asia Tbk | | 307,131,870 | 190,069,026 |
| Italy - 1.2% | | | |
| Ferrari NV (b) | | 293,700 | 81,836,568 |
| Japan - 0.4% | | | |
| Hoya Corp. | | 290,400 | 30,449,904 |
| Kazakhstan - 1.0% | | | |
| Kaspi.KZ JSC GDR (Reg. S) | | 865,300 | 71,387,250 |
| Kenya - 0.4% | | | |
| Safaricom Ltd. | | 233,129,100 | 28,284,045 |
| Korea (South) - 5.5% | | | |
| Kakao Corp. | | 1,441,260 | 63,137,129 |
| Samsung Electronics Co. Ltd. | | 6,683,737 | 328,997,514 |
TOTAL KOREA (SOUTH) | | | 392,134,643 |
| Mexico - 3.4% | | | |
| Banco del Bajio SA (c) | | 17,066,022 | 56,144,787 |
| Becle S.A.B. de CV | | 24,074,694 | 55,568,831 |
| GCC S.A.B. de CV | | 4,165,500 | 33,114,097 |
| Grupo Aeroportuario Norte S.A.B. de CV | | 8,538,587 | 93,860,582 |
TOTAL MEXICO | | | 238,688,297 |
| Netherlands - 3.0% | | | |
| ASML Holding NV (Netherlands) | | 190,600 | 120,447,697 |
| BE Semiconductor Industries NV (b) | | 1,037,800 | 93,016,505 |
TOTAL NETHERLANDS | | | 213,464,202 |
| Philippines - 0.5% | | | |
| TaskUs, Inc. (a)(b) | | 2,727,456 | 36,711,558 |
| Poland - 1.2% | | | |
| Dino Polska SA (a)(c) | | 823,481 | 83,770,658 |
| Russia - 0.1% | | | |
| LUKOIL PJSC sponsored ADR (a)(f) | | 802,595 | 227,046 |
| Sberbank of Russia (f) | | 25,741,060 | 184,138 |
| Yandex NV Series A (a)(f) | | 1,084,187 | 8,239,821 |
TOTAL RUSSIA | | | 8,651,005 |
| Saudi Arabia - 5.4% | | | |
| Al Rajhi Bank | | 7,197,220 | 147,371,556 |
| Arabian Internet and Communications Services Co. Ltd. | | 726,600 | 54,048,951 |
| Dr Sulaiman Al Habib Medical Services Group Co. | | 903,000 | 69,096,702 |
| Sabic Agriculture-Nutrients Co. | | 1,448,500 | 51,595,595 |
| Saudi Arabian Oil Co. (c) | | 5,939,100 | 57,004,719 |
TOTAL SAUDI ARABIA | | | 379,117,523 |
| Singapore - 0.5% | | | |
| Sea Ltd. ADR (a) | | 440,400 | 33,545,268 |
| South Africa - 0.7% | | | |
| Clicks Group Ltd. | | 3,364,183 | 49,166,636 |
| Sweden - 0.2% | | | |
| VEF AB (a)(e) | | 86,555,885 | 17,707,788 |
| Taiwan - 12.7% | | | |
| ASPEED Tech, Inc. | | 1,041,000 | 89,079,416 |
| Chailease Holding Co. Ltd. | | 7,617,812 | 55,442,732 |
| eMemory Technology, Inc. | | 1,743,000 | 104,144,247 |
| Taiwan Semiconductor Manufacturing Co. Ltd. | | 35,754,000 | 585,083,787 |
| Voltronic Power Technology Corp. | | 1,114,868 | 64,060,183 |
TOTAL TAIWAN | | | 897,810,365 |
| United Arab Emirates - 0.5% | | | |
| Adnoc Gas PLC | | 37,475,969 | 32,758,179 |
| United States of America - 5.3% | | | |
| Adobe, Inc. (a) | | 101,778 | 38,427,302 |
| Globant SA (a)(b) | | 330,100 | 51,782,787 |
| Lattice Semiconductor Corp. (a) | | 582,300 | 46,409,310 |
| NVIDIA Corp. | | 855,808 | 237,478,162 |
TOTAL UNITED STATES OF AMERICA | | | 374,097,561 |
| Uruguay - 0.5% | | | |
| Dlocal Ltd. (a)(b) | | 2,642,072 | 36,989,008 |
| Zambia - 0.6% | | | |
| First Quantum Minerals Ltd. | | 1,829,600 | 44,455,425 |
| TOTAL COMMON STOCKS (Cost $5,942,642,725) | | | 6,910,215,183 |
| | | | |
| Preferred Stocks - 0.7% |
| | | Shares | Value ($) |
| Convertible Preferred Stocks - 0.5% | | | |
| Brazil - 0.3% | | | |
| Creditas Financial Solutions Ltd. Series F (a)(f)(g) | | 64,604 | 18,440,566 |
| China - 0.2% | | | |
| ByteDance Ltd. Series E1 (a)(f)(g) | | 85,253 | 16,965,347 |
TOTAL CONVERTIBLE PREFERRED STOCKS | | | 35,405,913 |
| Nonconvertible Preferred Stocks - 0.2% | | | |
| China - 0.2% | | | |
| ZKH Group Ltd. Series F (f) | | 37,926,244 | 14,032,710 |
| TOTAL PREFERRED STOCKS (Cost $51,152,521) | | | 49,438,623 |
| | | | |
| Money Market Funds - 3.8% |
| | | Shares | Value ($) |
| Fidelity Cash Central Fund 4.88% (h) | | 115,162,701 | 115,185,734 |
| Fidelity Securities Lending Cash Central Fund 4.88% (h)(i) | | 149,752,195 | 149,767,170 |
| TOTAL MONEY MARKET FUNDS (Cost $264,952,904) | | | 264,952,904 |
| | | | |
| TOTAL INVESTMENT IN SECURITIES - 102.2% (Cost $6,258,748,150) | 7,224,606,710 |
NET OTHER ASSETS (LIABILITIES) - (2.2)% | (154,939,239) |
| NET ASSETS - 100.0% | 7,069,667,471 |
| | |
Legend
| (b) | Security or a portion of the security is on loan at period end. |
| (c) | Security exempt from registration under Rule 144A of the Securities Act of 1933. These securities may be resold in transactions exempt from registration, normally to qualified institutional buyers. At the end of the period, the value of these securities amounted to $507,192,053 or 7.2% of net assets. |
| (d) | Security or a portion of the security purchased on a delayed delivery or when-issued basis. |
| (g) | Restricted securities (including private placements) - Investment in securities not registered under the Securities Act of 1933 (excluding 144A issues). At the end of the period, the value of restricted securities (excluding 144A issues) amounted to $35,405,913 or 0.5% of net assets. |
| (h) | Affiliated fund that is generally available only to investment companies and other accounts managed by Fidelity Investments. The rate quoted is the annualized seven-day yield of the fund at period end. A complete unaudited listing of the fund's holdings as of its most recent quarter end is available upon request. In addition, each Fidelity Central Fund's financial statements are available on the SEC's website or upon request. |
| (i) | Investment made with cash collateral received from securities on loan. |
| Additional information on each restricted holding is as follows: |
| Security | Acquisition Date | Acquisition Cost ($) |
| ByteDance Ltd. Series E1 | 11/18/20 | 9,341,528 |
| | | |
| Creditas Financial Solutions Ltd. Series F | 1/28/22 | 20,349,123 |
| | | |
Affiliated Central Funds
Fiscal year to date information regarding the Fund's investments in Fidelity Central Funds, including the ownership percentage, is presented below.
| Affiliate | Value, beginning of period ($) | Purchases ($) | Sales Proceeds ($) | Dividend Income ($) | Realized Gain (loss) ($) | Change in Unrealized appreciation (depreciation) ($) | Value, end of period ($) | % ownership, end of period |
| Fidelity Cash Central Fund 4.88% | 67,633,060 | 900,474,823 | 852,922,149 | 2,696,841 | - | - | 115,185,734 | 0.3% |
| Fidelity Securities Lending Cash Central Fund 4.88% | 93,754,025 | 508,011,886 | 451,998,741 | 250,936 | - | - | 149,767,170 | 0.5% |
| Total | 161,387,085 | 1,408,486,709 | 1,304,920,890 | 2,947,777 | - | - | 264,952,904 | |
| | | | | | | | | |
Amounts in the dividend income column in the above table include any capital gain distributions from underlying funds, which are presented in the corresponding line item in the Statement of Operations, if applicable.
Amounts in the dividend income column for Fidelity Securities Lending Cash Central Fund represents the income earned on investing cash collateral, less rebates paid to borrowers and any lending agent fees associated with the loan, plus any premium payments received for lending certain types of securities.
Amounts included in the purchases and sales proceeds columns may include in-kind transactions, if applicable.
Other Affiliated Issuers
An affiliated company is a company in which the Fund has ownership of at least 5% of the voting securities. Fiscal year to date transactions with companies which are or were affiliates are presented in the table below. Certain corporate actions, such as mergers, are excluded from the amounts in this table if applicable. A dash in the Value end of period ($) column means either the issuer is no longer held at period end, or the issuer is held at period end but is no longer an affiliate.
| Affiliate | Value, beginning of period ($) | Purchases ($) | Sales Proceeds ($) | Dividend Income ($) | Realized Gain (loss) ($) | Change in Unrealized appreciation (depreciation) ($) | Value, end of period ($) |
| Restaurant Brands Asia Ltd. | 38,433,791 | - | 645,684 | - | (345,077) | (5,193,093) | 32,249,937 |
| VEF AB | 18,957,451 | 1,207,377 | - | - | - | (2,457,040) | 17,707,788 |
| Total | 57,391,242 | 1,207,377 | 645,684 | - | (345,077) | (7,650,133) | 49,957,725 |
Amounts included in the purchases and sales proceeds columns may include in-kind transactions, if applicable.
Investment Valuation
The following is a summary of the inputs used, as of April 30, 2023, involving the Fund's assets and liabilities carried at fair value. The inputs or methodology used for valuing securities may not be an indication of the risk associated with investing in those securities. For more information on valuation inputs, and their aggregation into the levels used below, please refer to the Investment Valuation section in the accompanying Notes to Financial Statements.
| Valuation Inputs at Reporting Date: |
| Description | Total ($) | Level 1 ($) | Level 2 ($) | Level 3 ($) |
Investments in Securities: | | | | |
|
| Equities: | | | | |
Communication Services | 657,136,079 | 140,542,476 | 491,388,435 | 25,205,168 |
Consumer Discretionary | 806,156,619 | 319,905,815 | 486,250,804 | - |
Consumer Staples | 458,004,396 | 188,506,125 | 269,498,271 | - |
Energy | 395,191,931 | 131,207,074 | 263,757,811 | 227,046 |
Financials | 1,324,280,012 | 381,950,268 | 923,705,040 | 18,624,704 |
Health Care | 536,923,163 | 193,354,953 | 343,568,210 | - |
Industrials | 462,685,591 | 253,957,276 | 208,728,315 | - |
Information Technology | 1,865,821,313 | 641,610,714 | 1,224,210,599 | - |
Materials | 308,783,340 | 129,165,117 | 179,618,223 | - |
Real Estate | 14,032,710 | - | - | 14,032,710 |
Utilities | 130,638,652 | - | 130,638,652 | - |
|
| Money Market Funds | 264,952,904 | 264,952,904 | - | - |
| Total Investments in Securities: | 7,224,606,710 | 2,645,152,722 | 4,521,364,360 | 58,089,628 |
Fidelity® Emerging Markets Fund
| Statement of Assets and Liabilities |
| | | | April 30, 2023 (Unaudited) |
| | | | | |
| Assets | | | | |
| Investment in securities, at value (including securities loaned of $145,547,463) - See accompanying schedule: | | | | |
Unaffiliated issuers (cost $5,915,443,094) | $ | 6,909,696,081 | | |
Fidelity Central Funds (cost $264,952,904) | | 264,952,904 | | |
Other affiliated issuers (cost $78,352,152) | | 49,957,725 | | |
| | | | | |
| | | | | |
| Total Investment in Securities (cost $6,258,748,150) | | | $ | 7,224,606,710 |
| Foreign currency held at value (cost $37,635,727) | | | | 37,485,583 |
| Receivable for fund shares sold | | | | 8,190,442 |
| Dividends receivable | | | | 7,375,955 |
| Distributions receivable from Fidelity Central Funds | | | | 873,175 |
| Prepaid expenses | | | | 2,546 |
| Other receivables | | | | 1,393,824 |
Total assets | | | | 7,279,928,235 |
| Liabilities | | | | |
| Payable for investments purchased | | | | |
Regular delivery | $ | 14,860,219 | | |
Delayed delivery | | 1,022,559 | | |
| Payable for fund shares redeemed | | 8,048,465 | | |
| Accrued management fee | | 3,964,728 | | |
| Distribution and service plan fees payable | | 5,446 | | |
| Other affiliated payables | | 845,569 | | |
| Deferred taxes | | 31,183,531 | | |
| Other payables and accrued expenses | | 563,077 | | |
| Collateral on securities loaned | | 149,767,170 | | |
| Total Liabilities | | | | 210,260,764 |
| Net Assets | | | $ | 7,069,667,471 |
| Net Assets consist of: | | | | |
| Paid in capital | | | $ | 6,562,653,309 |
| Total accumulated earnings (loss) | | | | 507,014,162 |
| Net Assets | | | $ | 7,069,667,471 |
| | | | | |
| Net Asset Value and Maximum Offering Price | | | | |
| Class A : | | | | |
Net Asset Value and redemption price per share ($14,902,852 ÷ 445,575 shares) (a) | | | $ | 33.45 |
| Maximum offering price per share (100/94.25 of $33.45) | | | $ | 35.49 |
| Class M : | | | | |
Net Asset Value and redemption price per share ($2,273,083 ÷ 67,867 shares) (a) | | | $ | 33.49 |
| Maximum offering price per share (100/96.50 of $33.49) | | | $ | 34.70 |
| Class C : | | | | |
Net Asset Value and offering price per share ($1,751,862 ÷ 52,607 shares) (a) | | | $ | 33.30 |
| Emerging Markets : | | | | |
Net Asset Value , offering price and redemption price per share ($4,243,387,998 ÷ 126,393,912 shares) | | | $ | 33.57 |
| Class K : | | | | |
Net Asset Value , offering price and redemption price per share ($1,118,078,065 ÷ 33,290,508 shares) | | | $ | 33.59 |
| Class I : | | | | |
Net Asset Value , offering price and redemption price per share ($109,369,862 ÷ 3,265,546 shares) | | | $ | 33.49 |
| Class Z : | | | | |
Net Asset Value , offering price and redemption price per share ($1,579,903,749 ÷ 47,098,105 shares) | | | $ | 33.54 |
(a)Redemption price per share is equal to net asset value less any applicable contingent deferred sales charge. |
| Statement of Operations |
| | | | Six months ended April 30, 2023 (Unaudited) |
| Investment Income | | | | |
| Dividends | | | $ | 50,310,263 |
| Non-Cash dividends | | | | 23,096,816 |
| Income from Fidelity Central Funds (including $250,936 from security lending) | | | | 2,947,777 |
| Income before foreign taxes withheld | | | $ | 76,354,856 |
| Less foreign taxes withheld | | | | (6,859,403) |
| Total Income | | | | 69,495,453 |
| Expenses | | | | |
| Management fee | $ | 22,427,440 | | |
| Transfer agent fees | | 4,076,391 | | |
| Distribution and service plan fees | | 30,808 | | |
| Accounting fees | | 781,207 | | |
| Custodian fees and expenses | | 781,627 | | |
| Independent trustees' fees and expenses | | 20,845 | | |
| Registration fees | | 168,313 | | |
| Audit | | 83,185 | | |
| Legal | | 5,109 | | |
| Miscellaneous | | 13,994 | | |
| Total expenses before reductions | | 28,388,919 | | |
| Expense reductions | | (154,271) | | |
| Total expenses after reductions | | | | 28,234,648 |
| Net Investment income (loss) | | | | 41,260,805 |
| Realized and Unrealized Gain (Loss) | | | | |
| Net realized gain (loss) on: | | | | |
| Investment Securities: | | | | |
| Unaffiliated issuers (net of foreign taxes of $4,191,208) | | (133,870,618) | | |
| Affiliated issuers | | (345,077) | | |
| Foreign currency transactions | | (1,371,804) | | |
| Total net realized gain (loss) | | | | (135,587,499) |
| Change in net unrealized appreciation (depreciation) on: | | | | |
| Investment Securities: | | | | |
| Unaffiliated issuers(net of increase in deferred foreign taxes of $1,846,486) | | 1,276,873,577 | | |
| Affiliated issuers | | (7,650,133) | | |
| Assets and liabilities in foreign currencies | | (54,223) | | |
| Total change in net unrealized appreciation (depreciation) | | | | 1,269,169,221 |
| Net gain (loss) | | | | 1,133,581,722 |
| Net increase (decrease) in net assets resulting from operations | | | $ | 1,174,842,527 |
| Statement of Changes in Net Assets |
| |
| | Six months ended April 30, 2023 (Unaudited) | | Year ended October 31, 2022 |
| Increase (Decrease) in Net Assets | | | | |
| Operations | | | | |
| Net investment income (loss) | $ | 41,260,805 | $ | 57,338,565 |
| Net realized gain (loss) | | (135,587,499) | | (249,065,256) |
| Change in net unrealized appreciation (depreciation) | | 1,269,169,221 | | (3,129,085,535) |
| Net increase (decrease) in net assets resulting from operations | | 1,174,842,527 | | (3,320,812,226) |
| Distributions to shareholders | | (50,450,464) | | (481,791,574) |
| Share transactions - net increase (decrease) | | 420,735,068 | | 787,871,888 |
| Total increase (decrease) in net assets | | 1,545,127,131 | | (3,014,731,912) |
| | | | | |
| Net Assets | | | | |
| Beginning of period | | 5,524,540,340 | | 8,539,272,252 |
| End of period | $ | 7,069,667,471 | $ | 5,524,540,340 |
| | | | | |
| | | | | |
Financial Highlights
| Fidelity Advisor® Emerging Markets Fund Class A |
| |
| | Six months ended (Unaudited) April 30, 2023 | | Years ended October 31, 2022 | | 2021 A |
Selected Per-Share Data | | | | | | |
| Net asset value, beginning of period | $ | 27.73 | $ | 47.48 | $ | 46.83 |
| Income from Investment Operations | | | | | | |
Net investment income (loss) B,C | | .15 D | | .16 E | | (.04) |
| Net realized and unrealized gain (loss) | | 5.71 | | (17.27) | | .69 |
| Total from investment operations | | 5.86 | | (17.11) | | .65 |
| Distributions from net investment income | | (.14) | | (.48) | | - |
| Distributions from net realized gain | | - | | (2.16) | | - |
| Total distributions | | (.14) | | (2.64) | | - |
| Net asset value, end of period | $ | 33.45 | $ | 27.73 | $ | 47.48 |
Total Return F,G,H | | 21.16% | | (38.00)% | | 1.39% |
Ratios to Average Net Assets C,I,J | | | | | | |
| Expenses before reductions | | 1.21% K | | 1.21% | | 1.25% K |
| Expenses net of fee waivers, if any | | 1.20% K | | 1.21% | | 1.25% K |
| Expenses net of all reductions | | 1.20% K | | 1.21% | | 1.25% K |
| Net investment income (loss) | | .55% D,K | | .45% E | | (.17)% K |
| Supplemental Data | | | | | | |
| Net assets, end of period (000 omitted) | $ | 14,903 | $ | 10,046 | $ | 6,248 |
Portfolio turnover rate L | | 19% K | | 34% | | 38% K,M |
A For the period May 11, 2021 (commencement of sale of shares) through October 31, 2021.
B Calculated based on average shares outstanding during the period.
C Net investment income (loss) is affected by the timing of the declaration of dividends by any underlying mutual funds or exchange-traded funds (ETFs). Net investment income (loss) of any mutual funds or ETFs is not included in the Fund's net investment income (loss) ratio.
D Net investment income per share reflects one or more large, non-recurring dividend(s) which amounted to $.11 per share. Such dividends are not annualized in the ratio of net investment income (loss) to average net assets. Excluding such non-recurring dividend(s) the ratio of net investment income (loss) to average net assets would have been .20%.
E Net investment income per share reflects one or more large, non-recurring dividend(s) which amounted to $.08 per share. Excluding such non-recurring dividend(s), the ratio of net investment income (loss) to average net assets would have been .22%.
F Total returns for periods of less than one year are not annualized.
G Total returns would have been lower if certain expenses had not been reduced during the applicable periods shown.
H Total returns do not include the effect of the sales charges.
I Fees and expenses of any underlying mutual funds or exchange-traded funds (ETFs) are not included in the Fund's expense ratio. The Fund indirectly bears its proportionate share of these expenses. For additional expense information related to investments in Fidelity Central Funds, please refer to the "Investments in Fidelity Central Funds" note found in the Notes to Financial Statements section of the most recent Annual or Semi-Annual report.
J Expense ratios reflect operating expenses of the class. Expenses before reductions do not reflect amounts reimbursed, waived, or reduced through arrangements with the investment adviser, brokerage services, or other offset arrangements, if applicable, and do not represent the amount paid by the class during periods when reimbursements, waivers or reductions occur.
K Annualized.
L Amount does not include the portfolio activity of any underlying mutual funds or exchange-traded funds (ETFs).
M The portfolio turnover rate does not include the assets acquired in the merger.
| Fidelity Advisor® Emerging Markets Fund Class M |
| |
| | Six months ended (Unaudited) April 30, 2023 | | Years ended October 31, 2022 | | 2021 A |
Selected Per-Share Data | | | | | | |
| Net asset value, beginning of period | $ | 27.71 | $ | 47.42 | $ | 46.83 |
| Income from Investment Operations | | | | | | |
Net investment income (loss) B,C | | .10 D | | .05 E | | (.09) |
| Net realized and unrealized gain (loss) | | 5.72 | | (17.29) | | .68 |
| Total from investment operations | | 5.82 | | (17.24) | | .59 |
| Distributions from net investment income | | (.04) | | (.32) | | - |
| Distributions from net realized gain | | - | | (2.16) | | - |
| Total distributions | | (.04) | | (2.47) F | | - |
| Net asset value, end of period | $ | 33.49 | $ | 27.71 | $ | 47.42 |
Total Return G,H,I | | 21.00% | | (38.20)% | | 1.26% |
Ratios to Average Net Assets C,J,K | | | | | | |
| Expenses before reductions | | 1.49% L | | 1.51% | | 1.52% L |
| Expenses net of fee waivers, if any | | 1.48% L | | 1.50% | | 1.51% L |
| Expenses net of all reductions | | 1.47% L | | 1.50% | | 1.51% L |
| Net investment income (loss) | | .28% D,L | | .15% E | | (.39)% L |
| Supplemental Data | | | | | | |
| Net assets, end of period (000 omitted) | $ | 2,273 | $ | 1,392 | $ | 2,234 |
Portfolio turnover rate M | | 19% L | | 34% | | 38% L,N |
A For the period May 11, 2021 (commencement of sale of shares) through October 31, 2021.
B Calculated based on average shares outstanding during the period.
C Net investment income (loss) is affected by the timing of the declaration of dividends by any underlying mutual funds or exchange-traded funds (ETFs). Net investment income (loss) of any mutual funds or ETFs is not included in the Fund's net investment income (loss) ratio.
D Net investment income per share reflects one or more large, non-recurring dividend(s) which amounted to $.11 per share. Such dividends are not annualized in the ratio of net investment income (loss) to average net assets. Excluding such non-recurring dividend(s) the ratio of net investment income (loss) to average net assets would have been (.07)%.
E Net investment income per share reflects one or more large, non-recurring dividend(s) which amounted to $.08 per share. Excluding such non-recurring dividend(s), the ratio of net investment income (loss) to average net assets would have been (.08)%.
F Total distributions per share do not sum due to rounding.
G Total returns for periods of less than one year are not annualized.
H Total returns would have been lower if certain expenses had not been reduced during the applicable periods shown.
I Total returns do not include the effect of the sales charges.
J Fees and expenses of any underlying mutual funds or exchange-traded funds (ETFs) are not included in the Fund's expense ratio. The Fund indirectly bears its proportionate share of these expenses. For additional expense information related to investments in Fidelity Central Funds, please refer to the "Investments in Fidelity Central Funds" note found in the Notes to Financial Statements section of the most recent Annual or Semi-Annual report.
K Expense ratios reflect operating expenses of the class. Expenses before reductions do not reflect amounts reimbursed, waived, or reduced through arrangements with the investment adviser, brokerage services, or other offset arrangements, if applicable, and do not represent the amount paid by the class during periods when reimbursements, waivers or reductions occur.
L Annualized.
M Amount does not include the portfolio activity of any underlying mutual funds or exchange-traded funds (ETFs).
N The portfolio turnover rate does not include the assets acquired in the merger.
| Fidelity Advisor® Emerging Markets Fund Class C |
| |
| | Six months ended (Unaudited) April 30, 2023 | | Years ended October 31, 2022 | | 2021 A |
Selected Per-Share Data | | | | | | |
| Net asset value, beginning of period | $ | 27.59 | $ | 47.31 | $ | 46.83 |
| Income from Investment Operations | | | | | | |
Net investment income (loss) B,C | | .02 D | | (.12) E | | (.19) |
| Net realized and unrealized gain (loss) | | 5.69 | | (17.26) | | .67 |
| Total from investment operations | | 5.71 | | (17.38) | | .48 |
| Distributions from net investment income | | - | | (.18) | | - |
| Distributions from net realized gain | | - | | (2.16) | | - |
| Total distributions | | - | | (2.34) | | - |
| Net asset value, end of period | $ | 33.30 | $ | 27.59 | $ | 47.31 |
Total Return F,G,H | | 20.70% | | (38.50)% | | 1.02% |
Ratios to Average Net Assets B,I,J | | | | | | |
| Expenses before reductions | | 1.99% K | | 2.00% | | 2.01% K |
| Expenses net of fee waivers, if any | | 1.98% K | | 2.00% | | 2.01% K |
| Expenses net of all reductions | | 1.98% K | | 2.00% | | 2.01% K |
| Net investment income (loss) | | (.23)% D,K | | (.34)% E | | (.86)% K |
| Supplemental Data | | | | | | |
| Net assets, end of period (000 omitted) | $ | 1,752 | $ | 1,377 | $ | 1,587 |
Portfolio turnover rate L | | 19% K | | 34% | | 38% K,M |
A For the period May 11, 2021 (commencement of sale of shares) through October 31, 2021.
B Net investment income (loss) is affected by the timing of the declaration of dividends by any underlying mutual funds or exchange-traded funds (ETFs). Net investment income (loss) of any mutual funds or ETFs is not included in the Fund's net investment income (loss) ratio.
C Calculated based on average shares outstanding during the period.
D Net investment income per share reflects one or more large, non-recurring dividend(s) which amounted to $.11 per share. Such dividends are not annualized in the ratio of net investment income (loss) to average net assets. Excluding such non-recurring dividend(s) the ratio of net investment income (loss) to average net assets would have been (.58)%.
E Net investment income per share reflects one or more large, non-recurring dividend(s) which amounted to $.08 per share. Excluding such non-recurring dividend(s), the ratio of net investment income (loss) to average net assets would have been (.57)%.
F Total returns for periods of less than one year are not annualized.
G Total returns would have been lower if certain expenses had not been reduced during the applicable periods shown.
H Total returns do not include the effect of the contingent deferred sales charge.
I Fees and expenses of any underlying mutual funds or exchange-traded funds (ETFs) are not included in the Fund's expense ratio. The Fund indirectly bears its proportionate share of these expenses. For additional expense information related to investments in Fidelity Central Funds, please refer to the "Investments in Fidelity Central Funds" note found in the Notes to Financial Statements section of the most recent Annual or Semi-Annual report.
J Expense ratios reflect operating expenses of the class. Expenses before reductions do not reflect amounts reimbursed, waived, or reduced through arrangements with the investment adviser, brokerage services, or other offset arrangements, if applicable, and do not represent the amount paid by the class during periods when reimbursements, waivers or reductions occur.
K Annualized.
L Amount does not include the portfolio activity of any underlying mutual funds or exchange-traded funds (ETFs).
M The portfolio turnover rate does not include the assets acquired in the merger.
| Fidelity® Emerging Markets Fund |
| |
| | Six months ended (Unaudited) April 30, 2023 | | Years ended October 31, 2022 | | 2021 | | 2020 | | 2019 | | 2018 |
Selected Per-Share Data | | | | | | | | | | | | |
| Net asset value, beginning of period | $ | 27.87 | $ | 47.56 | $ | 40.26 | $ | 33.03 | $ | 26.66 | $ | 31.37 |
| Income from Investment Operations | | | | | | | | | | | | |
Net investment income (loss) A,B | | .20 C | | .28 D | | .12 | | .15 | | .61 E | | .24 |
| Net realized and unrealized gain (loss) | | 5.74 | | (17.35) | | 7.81 | | 7.68 | | 5.98 | | (4.76) |
| Total from investment operations | | 5.94 | | (17.07) | | 7.93 | | 7.83 | | 6.59 | | (4.52) |
| Distributions from net investment income | | (.24) | | (.46) | | (.09) | | (.60) | | (.22) | | (.16) |
| Distributions from net realized gain | | - | | (2.16) | | (.54) | | - | | - F | | (.03) |
| Total distributions | | (.24) | | (2.62) | | (.63) | | (.60) | | (.22) | | (.19) |
Redemption fees added to paid in capital A | | - | | - | | - | | - | | - | | - F |
| Net asset value, end of period | $ | 33.57 | $ | 27.87 | $ | 47.56 | $ | 40.26 | $ | 33.03 | $ | 26.66 |
Total Return G,H | | 21.35% | | (37.83)% | | 19.83% | | 24.09% | | 24.91% | | (14.51)% |
Ratios to Average Net Assets B,I,J | | | | | | | | | | | | |
| Expenses before reductions | | .91% K | | .90% | | .88% | | .92% | | .94% | | .96% |
| Expenses net of fee waivers, if any | | .90% K | | .90% | | .88% | | .92% | | .94% | | .96% |
| Expenses net of all reductions | | .90% K | | .90% | | .88% | | .91% | | .92% | | .92% |
| Net investment income (loss) | | .85% C,K | | .76% D | | .26% | | .43% | | 2.02% E | | .75% |
| Supplemental Data | | | | | | | | | | | | |
| Net assets, end of period (000 omitted) | $ | 4,243,388 | $ | 3,330,900 | $ | 5,016,159 | $ | 4,526,531 | $ | 3,104,887 | $ | 3,493,583 |
Portfolio turnover rate L | | 19% K | | 34% | | 38% M | | 34% | | 85% N | | 86% |
A Calculated based on average shares outstanding during the period.
B Net investment income (loss) is affected by the timing of the declaration of dividends by any underlying mutual funds or exchange-traded funds (ETFs). Net investment income (loss) of any mutual funds or ETFs is not included in the Fund's net investment income (loss) ratio.
C Net investment income per share reflects one or more large, non-recurring dividend(s) which amounted to $.11 per share. Such dividends are not annualized in the ratio of net investment income (loss) to average net assets. Excluding such non-recurring dividend(s) the ratio of net investment income (loss) to average net assets would have been .50%.
D Net investment income per share reflects one or more large, non-recurring dividend(s) which amounted to $.08 per share. Excluding such non-recurring dividend(s), the ratio of net investment income (loss) to average net assets would have been .53%.
E Net investment income per share reflects one or more large, non-recurring dividend(s) which amounted to $.34 per share. Excluding such non-recurring dividend(s), the ratio of net investment income (loss) to average net assets would have been .88%.
F Amount represents less than $.005 per share.
G Total returns for periods of less than one year are not annualized.
H Total returns would have been lower if certain expenses had not been reduced during the applicable periods shown.
I Fees and expenses of any underlying mutual funds or exchange-traded funds (ETFs) are not included in the Fund's expense ratio. The Fund indirectly bears its proportionate share of these expenses. For additional expense information related to investments in Fidelity Central Funds, please refer to the "Investments in Fidelity Central Funds" note found in the Notes to Financial Statements section of the most recent Annual or Semi-Annual report.
J Expense ratios reflect operating expenses of the class. Expenses before reductions do not reflect amounts reimbursed, waived, or reduced through arrangements with the investment adviser, brokerage services, or other offset arrangements, if applicable, and do not represent the amount paid by the class during periods when reimbursements, waivers or reductions occur.
K Annualized.
L Amount does not include the portfolio activity of any underlying mutual funds or exchange-traded funds (ETFs).
M The portfolio turnover rate does not include the assets acquired in the merger.
N Portfolio turnover rate excludes securities received or delivered in-kind.
| Fidelity® Emerging Markets Fund Class K |
| |
| | Six months ended (Unaudited) April 30, 2023 | | Years ended October 31, 2022 | | 2021 | | 2020 | | 2019 | | 2018 |
Selected Per-Share Data | | | | | | | | | | | | |
| Net asset value, beginning of period | $ | 27.90 | $ | 47.62 | $ | 40.30 | $ | 33.07 | $ | 26.70 | $ | 31.41 |
| Income from Investment Operations | | | | | | | | | | | | |
Net investment income (loss) A,B | | .22 C | | .33 D | | .16 | | .19 | | .65 E | | .28 |
| Net realized and unrealized gain (loss) | | 5.75 | | (17.35) | | 7.83 | | 7.69 | | 5.99 | | (4.76) |
| Total from investment operations | | 5.97 | | (17.02) | | 7.99 | | 7.88 | | 6.64 | | (4.48) |
| Distributions from net investment income | | (.28) | | (.54) | | (.12) | | (.65) | | (.26) | | (.20) |
| Distributions from net realized gain | | - | | (2.16) | | (.54) | | - | | - F | | (.03) |
| Total distributions | | (.28) | | (2.70) | | (.67) G | | (.65) | | (.27) G | | (.23) |
Redemption fees added to paid in capital A | | - | | - | | - | | - | | - | | - F |
| Net asset value, end of period | $ | 33.59 | $ | 27.90 | $ | 47.62 | $ | 40.30 | $ | 33.07 | $ | 26.70 |
Total Return H,I | | 21.43% | | (37.73)% | | 19.94% | | 24.24% | | 25.08% | | (14.39)% |
Ratios to Average Net Assets B,J,K | | | | | | | | | | | | |
| Expenses before reductions | | .78% L | | .77% | | .77% | | .80% | | .80% | | .82% |
| Expenses net of fee waivers, if any | | .77% L | | .77% | | .77% | | .80% | | .80% | | .82% |
| Expenses net of all reductions | | .77% L | | .77% | | .77% | | .79% | | .79% | | .78% |
| Net investment income (loss) | | .98% C,L | | .88% D | | .34% | | .55% | | 2.15% E | | .89% |
| Supplemental Data | | | | | | | | | | | | |
| Net assets, end of period (000 omitted) | $ | 1,118,078 | $ | 826,468 | $ | 1,689,454 | $ | 1,227,097 | $ | 1,018,765 | $ | 870,859 |
Portfolio turnover rate M | | 19% L | | 34% | | 38% N | | 34% | | 85% O | | 86% |
A Calculated based on average shares outstanding during the period.
B Net investment income (loss) is affected by the timing of the declaration of dividends by any underlying mutual funds or exchange-traded funds (ETFs). Net investment income (loss) of any mutual funds or ETFs is not included in the Fund's net investment income (loss) ratio.
C Net investment income per share reflects one or more large, non-recurring dividend(s) which amounted to $.11 per share. Such dividends are not annualized in the ratio of net investment income (loss) to average net assets. Excluding such non-recurring dividend(s) the ratio of net investment income (loss) to average net assets would have been .63%.
D Net investment income per share reflects one or more large, non-recurring dividend(s) which amounted to $.08 per share. Excluding such non-recurring dividend(s), the ratio of net investment income (loss) to average net assets would have been .66%.
E Net investment income per share reflects one or more large, non-recurring dividend(s) which amounted to $.34 per share. Excluding such non-recurring dividend(s), the ratio of net investment income (loss) to average net assets would have been 1.02%.
F Amount represents less than $.005 per share.
G Total distributions per share do not sum due to rounding.
H Total returns for periods of less than one year are not annualized.
I Total returns would have been lower if certain expenses had not been reduced during the applicable periods shown.
J Fees and expenses of any underlying mutual funds or exchange-traded funds (ETFs) are not included in the Fund's expense ratio. The Fund indirectly bears its proportionate share of these expenses. For additional expense information related to investments in Fidelity Central Funds, please refer to the "Investments in Fidelity Central Funds" note found in the Notes to Financial Statements section of the most recent Annual or Semi-Annual report.
K Expense ratios reflect operating expenses of the class. Expenses before reductions do not reflect amounts reimbursed, waived, or reduced through arrangements with the investment adviser, brokerage services, or other offset arrangements, if applicable, and do not represent the amount paid by the class during periods when reimbursements, waivers or reductions occur.
L Annualized.
M Amount does not include the portfolio activity of any underlying mutual funds or exchange-traded funds (ETFs).
N The portfolio turnover rate does not include the assets acquired in the merger.
O Portfolio turnover rate excludes securities received or delivered in-kind.
| Fidelity Advisor® Emerging Markets Fund Class I |
| |
| | Six months ended (Unaudited) April 30, 2023 | | Years ended October 31, 2022 | | 2021 A |
Selected Per-Share Data | | | | | | |
| Net asset value, beginning of period | $ | 27.83 | $ | 47.55 | $ | 46.83 |
| Income from Investment Operations | | | | | | |
Net investment income (loss) B,C | | .20 D | | .26 E | | .04 |
| Net realized and unrealized gain (loss) | | 5.73 | | (17.29) | | .68 |
| Total from investment operations | | 5.93 | | (17.03) | | .72 |
| Distributions from net investment income | | (.27) | | (.53) | | - |
| Distributions from net realized gain | | - | | (2.16) | | - |
| Total distributions | | (.27) | | (2.69) | | - |
| Net asset value, end of period | $ | 33.49 | $ | 27.83 | $ | 47.55 |
Total Return F,G | | 21.33% | | (37.81)% | | 1.54% |
Ratios to Average Net Assets C,H,I | | | | | | |
| Expenses before reductions | | .90% J | | .89% | | .94% J |
| Expenses net of fee waivers, if any | | .89% J | | .89% | | .93% J |
| Expenses net of all reductions | | .89% J | | .89% | | .93% J |
| Net investment income (loss) | | .86% D,J | | .76% E | | .17% J |
| Supplemental Data | | | | | | |
| Net assets, end of period (000 omitted) | $ | 109,370 | $ | 47,819 | $ | 25,824 |
Portfolio turnover rate K | | 19% J | | 34% | | 38% J,L |
A For the period May 11, 2021 (commencement of sale of shares) through October 31, 2021.
B Calculated based on average shares outstanding during the period.
C Net investment income (loss) is affected by the timing of the declaration of dividends by any underlying mutual funds or exchange-traded funds (ETFs). Net investment income (loss) of any mutual funds or ETFs is not included in the Fund's net investment income (loss) ratio.
D Net investment income per share reflects one or more large, non-recurring dividend(s) which amounted to $.11 per share. Such dividends are not annualized in the ratio of net investment income (loss) to average net assets. Excluding such non-recurring dividend(s) the ratio of net investment income (loss) to average net assets would have been .51%.
E Net investment income per share reflects one or more large, non-recurring dividend(s) which amounted to $.08 per share. Excluding such non-recurring dividend(s), the ratio of net investment income (loss) to average net assets would have been .53%.
F Total returns for periods of less than one year are not annualized.
G Total returns would have been lower if certain expenses had not been reduced during the applicable periods shown.
H Fees and expenses of any underlying mutual funds or exchange-traded funds (ETFs) are not included in the Fund's expense ratio. The Fund indirectly bears its proportionate share of these expenses. For additional expense information related to investments in Fidelity Central Funds, please refer to the "Investments in Fidelity Central Funds" note found in the Notes to Financial Statements section of the most recent Annual or Semi-Annual report.
I Expense ratios reflect operating expenses of the class. Expenses before reductions do not reflect amounts reimbursed, waived, or reduced through arrangements with the investment adviser, brokerage services, or other offset arrangements, if applicable, and do not represent the amount paid by the class during periods when reimbursements, waivers or reductions occur.
J Annualized.
K Amount does not include the portfolio activity of any underlying mutual funds or exchange-traded funds (ETFs).
L The portfolio turnover rate does not include the assets acquired in the merger.
| Fidelity Advisor® Emerging Markets Fund Class Z |
| |
| | Six months ended (Unaudited) April 30, 2023 | | Years ended October 31, 2022 | | 2021 A |
Selected Per-Share Data | | | | | | |
| Net asset value, beginning of period | $ | 27.87 | $ | 47.59 | $ | 46.83 |
| Income from Investment Operations | | | | | | |
Net investment income (loss) B,C | | .22 D | | .32 E | | (.03) |
| Net realized and unrealized gain (loss) | | 5.73 | | (17.33) | | .79 |
| Total from investment operations | | 5.95 | | (17.01) | | .76 |
| Distributions from net investment income | | (.28) | | (.55) | | - |
| Distributions from net realized gain | | - | | (2.16) | | - |
| Total distributions | | (.28) | | (2.71) | | - |
| Net asset value, end of period | $ | 33.54 | $ | 27.87 | $ | 47.59 |
Total Return F,G | | 21.39% | | (37.74)% | | 1.62% |
Ratios to Average Net Assets C,H,I | | | | | | |
| Expenses before reductions | | .78% J | | .77% | | .78% J |
| Expenses net of fee waivers, if any | | .77% J | | .77% | | .78% J |
| Expenses net of all reductions | | .77% J | | .77% | | .78% J |
| Net investment income (loss) | | .98% D,J | | .88% E | | (.13)% J |
| Supplemental Data | | | | | | |
| Net assets, end of period (000 omitted) | $ | 1,579,904 | $ | 1,306,539 | $ | 1,797,766 |
Portfolio turnover rate K | | 19% J | | 34% | | 38% J,L |
A For the period May 11, 2021 (commencement of sale of shares) through October 31, 2021.
B Calculated based on average shares outstanding during the period.
C Net investment income (loss) is affected by the timing of the declaration of dividends by any underlying mutual funds or exchange-traded funds (ETFs). Net investment income (loss) of any mutual funds or ETFs is not included in the Fund's net investment income (loss) ratio.
D Net investment income per share reflects one or more large, non-recurring dividend(s) which amounted to $.11 per share. Such dividends are not annualized in the ratio of net investment income (loss) to average net assets. Excluding such non-recurring dividend(s) the ratio of net investment income (loss) to average net assets would have been .63%.
E Net investment income per share reflects one or more large, non-recurring dividend(s) which amounted to $.08 per share. Excluding such non-recurring dividend(s), the ratio of net investment income (loss) to average net assets would have been .66%.
F Total returns for periods of less than one year are not annualized.
G Total returns would have been lower if certain expenses had not been reduced during the applicable periods shown.
H Fees and expenses of any underlying mutual funds or exchange-traded funds (ETFs) are not included in the Fund's expense ratio. The Fund indirectly bears its proportionate share of these expenses. For additional expense information related to investments in Fidelity Central Funds, please refer to the "Investments in Fidelity Central Funds" note found in the Notes to Financial Statements section of the most recent Annual or Semi-Annual report.
I Expense ratios reflect operating expenses of the class. Expenses before reductions do not reflect amounts reimbursed, waived, or reduced through arrangements with the investment adviser, brokerage services, or other offset arrangements, if applicable, and do not represent the amount paid by the class during periods when reimbursements, waivers or reductions occur.
J Annualized.
K Amount does not include the portfolio activity of any underlying mutual funds or exchange-traded funds (ETFs).
L The portfolio turnover rate does not include the assets acquired in the merger.
For the period ended April 30, 2023
1. Organization.
Fidelity Emerging Markets Fund (the Fund) is a fund of Fidelity Investment Trust (the Trust) and is authorized to issue an unlimited number of shares. The Trust is registered under the Investment Company Act of 1940, as amended (the 1940 Act), as an open-end management investment company organized as a Massachusetts business trust. The Fund offers Class A, Class M, Class C, Emerging Markets, Class K, Class I and Class Z shares, each of which has equal rights as to assets and voting privileges. Class A, Class M, Class C, Class I and Class Z are Fidelity Advisor classes. Each class has exclusive voting rights with respect to matters that affect that class. Class C shares will automatically convert to Class A shares after a holding period of eight years from the initial date of purchase, with certain exceptions. The Fund's investments in emerging markets can be subject to social, economic, regulatory, and political uncertainties and can be extremely volatile.
2. Investments in Fidelity Central Funds.
Funds may invest in Fidelity Central Funds, which are open-end investment companies generally available only to other investment companies and accounts managed by the investment adviser and its affiliates. The Schedule of Investments lists any Fidelity Central Funds held as an investment as of period end, but does not include the underlying holdings of each Fidelity Central Fund. An investing fund indirectly bears its proportionate share of the expenses of the underlying Fidelity Central Funds.
Based on its investment objective, each Fidelity Central Fund may invest or participate in various investment vehicles or strategies that are similar to those of the investing fund. These strategies are consistent with the investment objectives of the investing fund and may involve certain economic risks which may cause a decline in value of each of the Fidelity Central Funds and thus a decline in the value of the investing fund.
| Fidelity Central Fund | Investment Manager | Investment Objective | Investment Practices | Expense Ratio A |
| Fidelity Money Market Central Funds | Fidelity Management & Research Company LLC (FMR) | Each fund seeks to obtain a high level of current income consistent with the preservation of capital and liquidity. | Short-term Investments | Less than .005% |
A Expenses expressed as a percentage of average net assets and are as of each underlying Central Fund's most recent annual or semi-annual shareholder report.
A complete unaudited list of holdings for each Fidelity Central Fund is available upon request or at the Securities and Exchange Commission website at www.sec.gov. In addition, the financial statements of the Fidelity Central Funds which contain the significant accounting policies (including investment valuation policies) of those funds, and are not covered by the Report of Independent Registered Public Accounting Firm, are available on the Securities and Exchange Commission website or upon request.
3. Significant Accounting Policies.
The Fund is an investment company and applies the accounting and reporting guidance of the Financial Accounting Standards Board (FASB) Accounting Standards Codification Topic 946 Financial Services - Investment Companies . The financial statements have been prepared in conformity with accounting principles generally accepted in the United States of America (GAAP), which require management to make certain estimates and assumptions at the date of the financial statements. Actual results could differ from those estimates. Subsequent events, if any, through the date that the financial statements were issued have been evaluated in the preparation of the financial statements. The Fund's Schedule of Investments lists any underlying mutual funds or exchange-traded funds (ETFs) but does not include the underlying holdings of these funds. The following summarizes the significant accounting policies of the Fund:
Investment Valuation. Investments are valued as of 4:00 p.m. Eastern time on the last calendar day of the period. The Board of Trustees (the Board) has designated the Fund's investment adviser as the valuation designee responsible for the fair valuation function and performing fair value determinations as needed. The investment adviser has established a Fair Value Committee (the Committee) to carry out the day-to-day fair valuation responsibilities and has adopted policies and procedures to govern the fair valuation process and the activities of the Committee. In accordance with these fair valuation policies and procedures, which have been approved by the Board, the Fund attempts to obtain prices from one or more third party pricing services or brokers to value its investments. When current market prices, quotations or currency exchange rates are not readily available or reliable, investments will be fair valued in good faith by the Committee, in accordance with the policies and procedures. Factors used in determining fair value vary by investment type and may include market or investment specific events, transaction data, estimated cash flows, and market observations of comparable investments. The frequency that the fair valuation procedures are used cannot be predicted and they may be utilized to a significant extent. The Committee manages the Fund's fair valuation practices and maintains the fair valuation policies and procedures. The Fund's investment adviser reports to the Board information regarding the fair valuation process and related material matters.
The Fund categorizes the inputs to valuation techniques used to value its investments into a disclosure hierarchy consisting of three levels as shown below:
Level 1 - unadjusted quoted prices in active markets for identical investments
Level 2 - other significant observable inputs (including quoted prices for similar investments, interest rates, prepayment speeds, etc.)
Level 3 - unobservable inputs (including the Fund's own assumptions based on the best information available)
Valuation techniques used to value the Fund's investments by major category are as follows:
Equity securities, including restricted securities, for which market quotations are readily available, are valued at the last reported sale price or official closing price as reported by a third party pricing service on the primary market or exchange on which they are traded and are categorized as Level 1 in the hierarchy. In the event there were no sales during the day or closing prices are not available, securities are valued at the last quoted bid price or may be valued using the last available price and are generally categorized as Level 2 in the hierarchy. For foreign equity securities, when market or security specific events arise, comparisons to the valuation of American Depositary Receipts (ADRs), futures contracts, ETFs and certain indexes as well as quoted prices for similar securities may be used and would be categorized as Level 2 in the hierarchy. For equity securities, including restricted securities, where observable inputs are limited, assumptions about market activity and risk are used and these securities may be categorized as Level 3 in the hierarchy.
Investments in open-end mutual funds, including the Fidelity Central Funds, are valued at their closing net asset value (NAV) each business day and are categorized as Level 1 in the hierarchy.
Changes in valuation techniques may result in transfers in or out of an assigned level within the disclosure hierarchy. The aggregate value of investments by input level as of April 30, 2023 is included at the end of the Fund's Schedule of Investments.
Foreign Currency. Certain Funds may use foreign currency contracts to facilitate transactions in foreign-denominated securities. Gains and losses from these transactions may arise from changes in the value of the foreign currency or if the counterparties do not perform under the contracts' terms.
Foreign-denominated assets, including investment securities, and liabilities are translated into U.S. dollars at the exchange rates at period end. Purchases and sales of investment securities, income and dividends received, and expenses denominated in foreign currencies are translated into U.S. dollars at the exchange rate in effect on the transaction date.
The effects of exchange rate fluctuations on investments are included with the net realized and unrealized gain (loss) on investment securities. Other foreign currency transactions resulting in realized and unrealized gain (loss) are disclosed separately.
Investment Transactions and Income. For financial reporting purposes, the Fund's investment holdings and NAV include trades executed through the end of the last business day of the period. The NAV per share for processing shareholder transactions is calculated as of the close of business of the New York Stock Exchange (NYSE), normally 4:00 p.m. Eastern time and includes trades executed through the end of the prior business day. Gains and losses on securities sold are determined on the basis of identified cost and include proceeds received from litigation. Commissions paid to certain brokers with whom the investment adviser, or its affiliates, places trades on behalf of a fund include an amount in addition to trade execution, which may be rebated back to a fund. Any such rebates are included in net realized gain (loss) on investments in the Statement of Operations. Dividend income is recorded on the ex-dividend date, except for certain dividends from foreign securities where the ex-dividend date may have passed, which are recorded as soon as the Fund is informed of the ex-dividend date. Non-cash dividends included in dividend income, if any, are recorded at the fair market value of the securities received. Income and capital gain distributions from Fidelity Central Funds, if any, are recorded on the ex-dividend date. Large, non-recurring dividends recognized by the Fund are presented separately on the Statement of Operations as "Non-cash dividends" and the impact of these dividends is presented in the Financial Highlights. Interest income is accrued as earned and includes coupon interest and amortization of premium and accretion of discount on debt securities as applicable. Investment income is recorded net of foreign taxes withheld where recovery of such taxes is uncertain. Funds may file withholding tax reclaims in certain jurisdictions to recover a portion of amounts previously withheld. Any withholding tax reclaims income is included in the Statement of Operations in foreign taxes withheld. Any receivables for withholding tax reclaims are included in the Statement of Assets and Liabilities in dividends receivable.
Class Allocations and Expenses. Investment income, realized and unrealized capital gains and losses, common expenses of a fund, and certain fund-level expense reductions, if any, are allocated daily on a pro-rata basis to each class based on the relative net assets of each class to the total net assets of a fund. Each class differs with respect to transfer agent and distribution and service plan fees incurred, as applicable. Certain expense reductions may also differ by class, if applicable. For the reporting period, the allocated portion of income and expenses to each class as a percent of its average net assets may vary due to the timing of recording these transactions in relation to fluctuating net assets of the classes. Expenses directly attributable to a fund are charged to that fund. Expenses attributable to more than one fund are allocated among the respective funds on the basis of relative net assets or other appropriate methods. Expenses included in the accompanying financial statements reflect the expenses of that fund and do not include any expenses associated with any underlying mutual funds or exchange-traded funds. Although not included in a fund's expenses, a fund indirectly bears its proportionate share of these expenses through the net asset value of each underlying mutual fund or exchange-traded fund. Expense estimates are accrued in the period to which they relate and adjustments are made when actual amounts are known.
Income Tax Information and Distributions to Shareholders. Each year, the Fund intends to qualify as a regulated investment company under Subchapter M of the Internal Revenue Code, including distributing substantially all of its taxable income and realized gains. As a result, no provision for U.S. Federal income taxes is required. The Fund files a U.S. federal tax return, in addition to state and local tax returns as required. The Fund's federal income tax returns are subject to examination by the Internal Revenue Service (IRS) for a period of three fiscal years after they are filed. State and local tax returns may be subject to examination for an additional fiscal year depending on the jurisdiction. Foreign taxes are provided for based on the Fund's understanding of the tax rules and rates that exist in the foreign markets in which it invests. The Fund is subject to a tax imposed on capital gains by certain countries in which it invests. An estimated deferred tax liability for net unrealized appreciation on the applicable securities is included in Deferred taxes on the Statement of Assets & Liabilities.
Distributions are declared and recorded on the ex-dividend date. Income and capital gain distributions are declared separately for each class. Income and capital gain distributions are determined in accordance with income tax regulations, which may differ from GAAP.
Capital accounts within the financial statements are adjusted for permanent book-tax differences. These adjustments have no impact on net assets or the results of operations. Capital accounts are not adjusted for temporary book-tax differences which will reverse in a subsequent period.
Book-tax differences are primarily due to foreign currency transactions, certain foreign taxes, passive foreign investment companies (PFIC), capital loss carryforwards and losses deferred due to wash sales.
As of period end, the cost and unrealized appreciation (depreciation) in securities, and derivatives if applicable, for federal income tax purposes were as follows:
| Gross unrealized appreciation | $1,950,977,383 |
| Gross unrealized depreciation | (1,047,413,060) |
| Net unrealized appreciation (depreciation) | $903,564,323 |
| Tax cost | $6,321,042,387 |
Capital loss carryforwards are only available to offset future capital gains of the Fund to the extent provided by regulations and may be limited. The capital loss carryforward information presented below, including any applicable limitation, is estimated as of prior fiscal period end and is subject to adjustment.
Short-term | $(249,361,263) |
| Total capital loss carryforward | $(249,361,263) |
Delayed Delivery Transactions and When-Issued Securities. During the period, certain Funds transacted in securities on a delayed delivery or when-issued basis. Payment and delivery may take place after the customary settlement period for that security. The price of the underlying securities and the date when the securities will be delivered and paid for are fixed at the time the transaction is negotiated. Securities purchased on a delayed delivery or when-issued basis are identified as such in the Schedule of Investments. Compensation for interest forgone in the purchase of a delayed delivery or when-issued debt security may be received. With respect to purchase commitments, each applicable Fund identifies securities as segregated in its records with a value at least equal to the amount of the commitment. Payables and receivables associated with the purchases and sales of delayed delivery securities having the same coupon, settlement date and broker are offset. Delayed delivery or when-issued securities that have been purchased from and sold to different brokers are reflected as both payables and receivables in the Statement of Assets and Liabilities under the caption "Delayed delivery", as applicable. Losses may arise due to changes in the value of the underlying securities or if the counterparty does not perform under the contract's terms, or if the issuer does not issue the securities due to political, economic, or other factors.
Restricted Securities (including Private Placements). Funds may invest in securities that are subject to legal or contractual restrictions on resale. These securities generally may be resold in transactions exempt from registration or to the public if the securities are registered. Disposal of these securities may involve time-consuming negotiations and expense, and prompt sale at an acceptable price may be difficult. Information regarding restricted securities held at period end is included at the end of the Schedule of Investments, if applicable.
4. Purchases and Sales of Investments.
Purchases and sales of securities, other than short-term securities and in-kind transactions, as applicable, are noted in the table below.
| | Purchases ($) | Sales ($) |
| Fidelity Emerging Markets Fund | 972,441,461 | 624,580,645 |
5. Fees and Other Transactions with Affiliates.
Management Fee. Fidelity Management & Research Company LLC (the investment adviser) and its affiliates provide the Fund with investment management related services for which the Fund pays a monthly management fee. The management fee is the sum of an individual fund fee rate that is based on an annual rate of .45% of the Fund's average net assets and an annualized group fee rate that averaged .23% during the period. The group fee rate is based upon the monthly average net assets of a group of registered investment companies with which the investment adviser has management contracts. The group fee rate decreases as assets under management increase and increases as assets under management decrease. For the reporting period, the total annualized management fee rate was .68% of the Fund's average net assets.
Distribution and Service Plan Fees. In accordance with Rule 12b-1 of the 1940 Act, the Fund has adopted separate Distribution and Service Plans for each class of shares. Certain classes pay Fidelity Distributors Company LLC (FDC), an affiliate of the investment adviser, separate Distribution and Service Fees, each of which is based on an annual percentage of each class' average net assets. In addition, FDC may pay financial intermediaries for selling shares of the Fund and providing shareholder support services. For the period, the Distribution and Service Fee rates, total fees and amounts retained by FDC were as follows:
| | Distribution Fee | Service Fee | Total Fees | Retained by FDC |
| Class A | - % | .25% | $17,957 | $2,700 |
| Class M | .25% | .25% | 4,626 | 60 |
| Class C | .75% | .25% | 8,225 | 4,394 |
| | | | $30,808 | $7,154 |
Sales Load. FDC may receive a front-end sales charge of up to 5.75% for selling Class A shares and 3.50% for selling Class M shares, some of which is paid to financial intermediaries for selling shares of the Fund. Depending on the holding period, FDC may receive contingent deferred sales charges levied on Class A, Class M and Class C redemptions. The deferred sales charges are 1.00% for Class C shares, 1.00% for certain purchases of Class A shares and .25% for certain purchases of Class M shares.
For the period, sales charge amounts retained by FDC were as follows:
| | Retained by FDC |
| Class A | $53,891 |
| Class M | 380 |
Class C A | 746 |
| | $55,017 |
A When Class C shares are initially sold, FDC pays commissions from its own resources to financial intermediaries through which the sales are made.
Transfer Agent Fees. Fidelity Investments Institutional Operations Company LLC (FIIOC), an affiliate of the investment adviser, is the transfer, dividend disbursing and shareholder servicing agent for each class of the Fund. FIIOC receives account fees and asset-based fees that vary according to the account size and type of account of the shareholders of the respective classes of the Fund, except for Class K and Class Z. FIIOC receives an asset-based fee of Class K's and Class Z's average net assets. FIIOC pays for typesetting, printing and mailing of shareholder reports, except proxy statements.
For the period, transfer agent fees for each class were as follows:
| | Amount | % of Class-Level Average Net Assets A |
| Class A | $16,002 | .22 |
| Class M | 2,345 | .25 |
| Class C | 2,103 | .26 |
| Emerging Markets | 3,458,388 | .17 |
| Class K | 202,526 | .04 |
| Class I | 72,311 | .16 |
| Class Z | 322,716 | .04 |
| | $4,076,391 | |
A Annualized
Accounting Fees. Fidelity Service Company, Inc. (FSC), an affiliate of the investment adviser, maintains the Fund's accounting records. The accounting fee is based on the level of average net assets for each month. For the period, the fees were equivalent to the following annualized rates:
| | % of Average Net Assets |
| Fidelity Emerging Markets Fund | .02 |
Brokerage Commissions. A portion of portfolio transactions were placed with brokerage firms which are affiliates of the investment adviser. Brokerage commissions are included in net realized gain (loss) and change in net unrealized appreciation (depreciation) in the Statement of Operations. The commissions paid to these affiliated firms were as follows:
| | Amount |
| Fidelity Emerging Markets Fund | $3,351 |
Interfund Trades. Funds may purchase from or sell securities to other Fidelity Funds under procedures adopted by the Board. The procedures have been designed to ensure these interfund trades are executed in accordance with Rule 17a-7 of the 1940 Act. Any interfund trades are included within the respective purchases and sales amounts shown in the Purchases and Sales of Investments note. Interfund trades during the period are noted in the table below.
| | Purchases ($) | Sales ($) | Realized Gain (Loss) ($) |
| Fidelity Emerging Markets Fund | 20,566,423 | 18,482,277 | (5,061,934) |
6. Committed Line of Credit.
Certain Funds participate with other funds managed by the investment adviser or an affiliate in a $4.25 billion credit facility (the "line of credit") to be utilized for temporary or emergency purposes to fund shareholder redemptions or for other short-term liquidity purposes. The participating funds have agreed to pay commitment fees on their pro-rata portion of the line of credit, which are reflected in Miscellaneous expenses on the Statement of Operations, and are listed below. During the period, there were no borrowings on this line of credit.
| | Amount |
| Fidelity Emerging Markets Fund | $6,342 |
7. Security Lending.
Funds lend portfolio securities from time to time in order to earn additional income. Lending agents are used, including National Financial Services (NFS), an affiliate of the investment adviser. Pursuant to a securities lending agreement, NFS will receive a fee, which is capped at 9.9% of a fund's daily lending revenue, for its services as lending agent. A fund may lend securities to certain qualified borrowers, including NFS. On the settlement date of the loan, a fund receives collateral (in the form of U.S. Treasury obligations, letters of credit and/or cash) against the loaned securities and maintains collateral in an amount not less than 100% of the market value of the loaned securities during the period of the loan. The market value of the loaned securities is determined at the close of business of a fund and any additional required collateral is delivered to a fund on the next business day. A fund or borrower may terminate the loan at any time, and if the borrower defaults on its obligation to return the securities loaned because of insolvency or other reasons, a fund may apply collateral received from the borrower against the obligation. A fund may experience delays and costs in recovering the securities loaned. Any cash collateral received is invested in the Fidelity Securities Lending Cash Central Fund. Any loaned securities are identified as such in the Schedule of Investments, and the value of loaned securities and cash collateral at period end, as applicable, are presented in the Statement of Assets and Liabilities. Security lending income represents the income earned on investing cash collateral, less rebates paid to borrowers and any lending agent fees associated with the loan, plus any premium payments received for lending certain types of securities. Security lending income is presented in the Statement of Operations as a component of income from Fidelity Central Funds. Affiliated security lending activity, if any, was as follows:
| | Total Security Lending Fees Paid to NFS | Security Lending Income From Securities Loaned to NFS | Value of Securities Loaned to NFS at Period End |
| Fidelity Emerging Markets Fund | $28,044 | $8,778 | $9,080,400 |
8. Expense Reductions.
Through arrangements with the Fund's custodian and each class' transfer agent, credits realized as a result of certain uninvested cash balances were used to reduce the Fund's expenses. During the period, custodian credits reduced the Fund's expenses by $1,932. During the period, transfer agent credits reduced each class' expenses as noted in the table below.
| | Expense reduction |
| Class A | $57 |
| Class M | 123 |
| Class C | 26 |
| | $206 |
In addition, during the period the investment adviser or an affiliate reimbursed and/or waived a portion of fund-level operating expenses in the amount of $152,133.
9. Distributions to Shareholders.
Distributions to shareholders of each class were as follows:
| | Six months ended April 30, 2023 | Year ended October 31, 2022 |
| Fidelity Emerging Markets Fund | | |
| Distributions to shareholders | | |
| Class A | $53,539 | $625,889 |
| Class M | 1,926 | 114,309 |
| Class C | - | 82,608 |
| Emerging Markets | 28,390,916 | 277,953,427 |
| Class K | 8,364,511 | 95,062,813 |
| Class I | 674,976 | 1,596,371 |
| Class Z | 12,964,596 | 106,356,157 |
Total | $50,450,464 | $481,791,574 |
10. Share Transactions.
Share transactions for each class were as follows and may contain in-kind transactions, automatic conversions between classes or exchanges between affiliated funds:
| | Shares | Shares | Dollars | Dollars |
| | Six months ended April 30, 2023 | Year ended October 31, 2022 | Six months ended April 30, 2023 | Year ended October 31, 2022 |
| Fidelity Emerging Markets Fund | | | | |
| Class A | | | | |
| Shares sold | 200,715 | 405,334 | $6,564,379 | $16,326,133 |
| Reinvestment of distributions | 1,632 | 14,217 | 52,760 | 609,645 |
| Shares redeemed | (119,099) | (188,821) | (3,861,772) | (6,470,572) |
| Net increase (decrease) | 83,248 | 230,730 | $2,755,367 | $10,465,206 |
| Class M | | | | |
| Shares sold | 22,384 | 9,094 | $759,065 | $331,845 |
| Reinvestment of distributions | 60 | 2,657 | 1,926 | 114,195 |
| Shares redeemed | (4,824) | (8,614) | (155,094) | (305,492) |
| Net increase (decrease) | 17,620 | 3,137 | $605,897 | $140,548 |
| Class C | | | | |
| Shares sold | 15,042 | 27,888 | $482,233 | $1,033,697 |
| Reinvestment of distributions | - | 1,916 | - | 82,366 |
| Shares redeemed | (12,345) | (13,429) | (390,151) | (473,302) |
| Net increase (decrease) | 2,697 | 16,375 | $92,082 | $642,761 |
| Emerging Markets | | | | |
| Shares sold | 21,518,883 | 90,211,588 | $704,154,869 | $3,178,493,756 |
| Reinvestment of distributions | 705,770 | 4,752,444 | 22,902,138 | 204,307,548 |
| Shares redeemed | (15,333,270) | (80,932,071) | (494,075,590) | (2,841,698,156) |
| Net increase (decrease) | 6,891,383 | 14,031,961 | $232,981,417 | $541,103,148 |
| Class K | | | | |
| Shares sold | 9,757,457 | 8,137,924 | $326,149,178 | $295,826,108 |
| Reinvestment of distributions | 257,656 | 2,211,734 | 8,363,213 | 95,060,337 |
| Shares redeemed | (6,348,363) | (16,201,876) | (208,893,775) | (567,669,911) |
| Net increase (decrease) | 3,666,750 | (5,852,218) | $125,618,616 | $(176,783,466) |
| Class I | | | | |
| Shares sold | 2,279,783 | 2,413,035 | $74,403,824 | $83,439,062 |
| Reinvestment of distributions | 19,449 | 35,220 | 629,629 | 1,511,652 |
| Shares redeemed | (752,043) | (1,272,970) | (24,097,545) | (42,317,885) |
| Net increase (decrease) | 1,547,189 | 1,175,285 | $50,935,908 | $42,632,829 |
| Class Z | | | | |
| Shares sold | 1,793,958 | 8,050,253 | $59,528,666 | $312,633,669 |
| Reinvestment of distributions | 395,803 | 2,468,777 | 12,830,167 | 105,984,590 |
| Shares redeemed | (1,976,337) | (1,412,722) | (64,613,052) | (48,947,397) |
| Net increase (decrease) | 213,424 | 9,106,308 | $7,745,781 | $369,670,862 |
11. Other.
A fund's organizational documents provide former and current trustees and officers with a limited indemnification against liabilities arising in connection with the performance of their duties to the fund. In the normal course of business, a fund may also enter into contracts that provide general indemnifications. A fund's maximum exposure under these arrangements is unknown as this would be dependent on future claims that may be made against a fund. The risk of material loss from such claims is considered remote.
At the end of the period, the following mutual funds managed by the investment adviser or its affiliates were the owners of record of 10% or more of the total outstanding shares.
| | Strategic Advisers Fidelity Emerging Markets Fund |
| Fidelity Emerging Markets Fund | 13% |
Mutual funds managed by the investment adviser or its affiliates, in aggregate, were the owners of record of more than 20% of the total outstanding shares.
| Fund | % of shares held |
| Fidelity Emerging Markets Fund | 33% |
12. Risk and Uncertainties.
Many factors affect a fund's performance. Developments that disrupt global economies and financial markets, such as pandemics, epidemics, outbreaks of infectious diseases, war, terrorism, and environmental disasters, may significantly affect a fund's investment performance. The effects of these developments to a fund will be impacted by the types of securities in which a fund invests, the financial condition, industry, economic sector, and geographic location of an issuer, and a fund's level of investment in the securities of that issuer. Significant concentrations in security types, issuers, industries, sectors, and geographic locations may magnify the factors that affect a fund's performance.
Top Holdings (% of Fund's net assets) |
| |
| LVMH Moet Hennessy Louis Vuitton SE (France, Textiles, Apparel & Luxury Goods) | 5.4 | |
| Nestle SA (Reg. S) (United States of America, Food Products) | 4.6 | |
| Novo Nordisk A/S Series B (Denmark, Pharmaceuticals) | 4.4 | |
| AstraZeneca PLC (United Kingdom) (United Kingdom, Pharmaceuticals) | 4.0 | |
| ASML Holding NV (Netherlands) (Netherlands, Semiconductors & Semiconductor Equipment) | 3.6 | |
| TotalEnergies SE (France, Oil, Gas & Consumable Fuels) | 3.4 | |
| Compagnie Financiere Richemont SA Series A (Switzerland, Textiles, Apparel & Luxury Goods) | 2.8 | |
| L'Oreal SA (France, Personal Care Products) | 2.5 | |
| Air Liquide SA (France, Chemicals) | 2.3 | |
| Sanofi SA (United States of America, Pharmaceuticals) | 2.2 | |
| | 35.2 | |
| |
| Market Sectors (% of Fund's net assets) |
| |
| Consumer Discretionary | 17.9 | |
| Financials | 17.5 | |
| Health Care | 15.5 | |
| Industrials | 15.3 | |
| Consumer Staples | 12.2 | |
| Information Technology | 5.9 | |
| Energy | 5.1 | |
| Materials | 4.9 | |
| Communication Services | 1.6 | |
| Utilities | 1.2 | |
| Real Estate | 1.1 | |
| |
Asset Allocation (% of Fund's net assets) |
|
|
Geographic Diversification (% of Fund's net assets) |
|
* Includes Short-Term investments and Net Other Assets (Liabilities). Percentages are adjusted for the effect of derivatives, if applicable. |
| |
Fidelity® Europe Fund
Showing Percentage of Net Assets
| Common Stocks - 98.1% |
| | | Shares | Value ($) |
| Australia - 2.6% | | | |
| Flutter Entertainment PLC (Ireland) (a) | | 43,100 | 8,600,781 |
| Glencore PLC | | 1,384,300 | 8,171,015 |
TOTAL AUSTRALIA | | | 16,771,796 |
| Belgium - 2.1% | | | |
| Azelis Group NV | | 165,500 | 3,920,836 |
| KBC Group NV | | 58,700 | 4,190,070 |
| UCB SA | | 58,400 | 5,432,508 |
TOTAL BELGIUM | | | 13,543,414 |
| China - 1.0% | | | |
| Prosus NV | | 85,912 | 6,429,098 |
| Denmark - 6.8% | | | |
| DSV A/S | | 41,600 | 7,813,260 |
| Novo Nordisk A/S Series B | | 174,100 | 28,962,318 |
| Tryg A/S | | 156,900 | 3,699,542 |
| Vestas Wind Systems A/S | | 154,000 | 4,261,272 |
TOTAL DENMARK | | | 44,736,392 |
| Finland - 3.7% | | | |
| Elisa Corp. (A Shares) | | 127,200 | 7,893,906 |
| Nordea Bank ABP | | 852,900 | 9,466,271 |
| Sampo Oyj (A Shares) | | 133,700 | 6,771,012 |
TOTAL FINLAND | | | 24,131,189 |
| France - 24.4% | | | |
| Air Liquide SA | | 82,880 | 14,909,302 |
| Airbus Group NV | | 62,700 | 8,780,171 |
| AXA SA | | 274,500 | 8,959,727 |
| BNP Paribas SA | | 129,200 | 8,348,050 |
| Capgemini SA | | 44,100 | 8,013,116 |
| Dassault Aviation SA | | 38,100 | 7,443,478 |
| Dassault Systemes SA | | 105,500 | 4,262,904 |
| Edenred SA | | 86,100 | 5,589,952 |
| L'Oreal SA | | 35,000 | 16,689,653 |
| LVMH Moet Hennessy Louis Vuitton SE | | 36,800 | 35,397,233 |
| Pernod Ricard SA | | 41,200 | 9,506,400 |
| Sartorius Stedim Biotech | | 22,800 | 6,092,405 |
| Teleperformance | | 18,600 | 3,705,557 |
| TotalEnergies SE | | 349,007 | 22,301,527 |
TOTAL FRANCE | | | 159,999,475 |
| Germany - 5.8% | | | |
| Deutsche Borse AG | | 58,500 | 11,156,456 |
| Deutsche Post AG | | 104,300 | 5,016,788 |
| Merck KGaA | | 32,300 | 5,785,377 |
| RWE AG | | 164,400 | 7,708,033 |
| Scout24 AG (b) | | 47,500 | 2,957,224 |
| Siemens Healthineers AG (b) | | 86,800 | 5,396,286 |
TOTAL GERMANY | | | 38,020,164 |
| Hong Kong - 1.8% | | | |
| Prudential PLC | | 765,438 | 11,711,998 |
| Ireland - 1.5% | | | |
| Bank of Ireland Group PLC | | 648,800 | 6,698,732 |
| Smurfit Kappa Group PLC | | 81,100 | 2,997,272 |
TOTAL IRELAND | | | 9,696,004 |
| Israel - 0.4% | | | |
| NICE Ltd. (a) | | 13,200 | 2,710,304 |
| Italy - 4.0% | | | |
| Coca-Cola HBC AG | | 97,600 | 2,973,249 |
| Ferrari NV (Italy) | | 22,100 | 6,144,007 |
| FinecoBank SpA | | 291,635 | 4,412,171 |
| Industrie de Nora SpA | | 120,000 | 2,385,393 |
| Prada SpA | | 686,200 | 5,052,271 |
| Recordati SpA | | 120,300 | 5,531,669 |
TOTAL ITALY | | | 26,498,760 |
| Netherlands - 4.6% | | | |
| ASML Holding NV (Netherlands) | | 37,100 | 23,444,961 |
| Heineken NV (Bearer) | | 60,300 | 6,913,558 |
TOTAL NETHERLANDS | | | 30,358,519 |
| Norway - 2.2% | | | |
| Equinor ASA | | 223,500 | 6,434,796 |
| Kongsberg Gruppen ASA | | 72,700 | 3,259,444 |
| TGS ASA | | 289,483 | 4,530,875 |
TOTAL NORWAY | | | 14,225,115 |
| Spain - 1.5% | | | |
| Amadeus IT Holding SA Class A (a) | | 74,700 | 5,250,292 |
| CaixaBank SA | | 1,222,700 | 4,525,955 |
TOTAL SPAIN | | | 9,776,247 |
| Sweden - 5.7% | | | |
| ASSA ABLOY AB (B Shares) | | 188,700 | 4,487,928 |
| Haypp Group (a) | | 491,497 | 1,744,554 |
| HEXPOL AB (B Shares) | | 385,600 | 4,538,439 |
| Indutrade AB | | 271,700 | 6,509,641 |
| Investor AB (B Shares) | | 378,000 | 8,101,804 |
| Kry International AB (a)(c)(d) | | 406 | 31,737 |
| Nordnet AB | | 233,200 | 3,656,595 |
| Sandvik AB (e) | | 395,600 | 8,043,120 |
TOTAL SWEDEN | | | 37,113,818 |
| Switzerland - 2.8% | | | |
| Compagnie Financiere Richemont SA Series A | | 111,600 | 18,447,577 |
| United Kingdom - 17.8% | | | |
| AstraZeneca PLC (United Kingdom) | | 178,600 | 26,283,309 |
| B&M European Value Retail SA | | 1,347,200 | 8,121,770 |
| Barratt Developments PLC | | 296,500 | 1,863,132 |
| Beazley PLC | | 570,300 | 4,268,095 |
| Berkeley Group Holdings PLC | | 33,600 | 1,877,826 |
| Bunzl PLC | | 155,954 | 6,201,288 |
| Compass Group PLC | | 380,855 | 10,047,321 |
| Deliveroo PLC Class A (a)(b) | | 2,126,500 | 2,923,692 |
| Diageo PLC | | 317,028 | 14,461,584 |
| Direct Line Insurance Group PLC | | 991,089 | 2,137,988 |
| Grainger Trust PLC | | 866,690 | 2,816,704 |
| Hiscox Ltd. | | 301,414 | 4,477,440 |
| JD Sports Fashion PLC | | 2,804,300 | 5,675,892 |
| Judges Scientific PLC | | 3,879 | 484,568 |
| Londonmetric Properity PLC | | 905,210 | 2,191,061 |
| NatWest Group PLC | | 1,309,700 | 4,314,282 |
| RELX PLC (London Stock Exchange) | | 376,976 | 12,535,811 |
| RS GROUP PLC | | 320,158 | 3,707,332 |
| Safestore Holdings PLC | | 209,545 | 2,608,439 |
TOTAL UNITED KINGDOM | | | 116,997,534 |
| United States of America - 9.4% | | | |
| Experian PLC | | 209,516 | 7,417,889 |
| Ferguson PLC | | 32,000 | 4,502,181 |
| Nestle SA (Reg. S) | | 234,020 | 30,022,326 |
| ResMed, Inc. | | 18,300 | 4,409,568 |
| RHI Magnesita NV | | 26,726 | 759,087 |
| Sanofi SA | | 135,600 | 14,613,375 |
TOTAL UNITED STATES OF AMERICA | | | 61,724,426 |
| TOTAL COMMON STOCKS (Cost $539,978,768) | | | 642,891,830 |
| | | | |
| Preferred Stocks - 0.1% |
| | | Shares | Value ($) |
| Convertible Preferred Stocks - 0.1% | | | |
| Estonia - 0.1% | | | |
| Bolt Technology OU Series E (a)(c)(d) | | 3,852 | 502,042 |
| Nonconvertible Preferred Stocks - 0.0% | | | |
| Sweden - 0.0% | | | |
| Kry International AB Series E (a)(c)(d) | | 2,345 | 183,306 |
| TOTAL PREFERRED STOCKS (Cost $2,072,807) | | | 685,348 |
| | | | |
| Money Market Funds - 2.3% |
| | | Shares | Value ($) |
| Fidelity Cash Central Fund 4.88% (f) | | 6,936,524 | 6,937,911 |
| Fidelity Securities Lending Cash Central Fund 4.88% (f)(g) | | 8,091,126 | 8,091,935 |
| TOTAL MONEY MARKET FUNDS (Cost $15,029,846) | | | 15,029,846 |
| | | | |
| TOTAL INVESTMENT IN SECURITIES - 100.5% (Cost $557,081,421) | 658,607,024 |
NET OTHER ASSETS (LIABILITIES) - (0.5)% | (3,529,293) |
| NET ASSETS - 100.0% | 655,077,731 |
| | |
Legend
| (b) | Security exempt from registration under Rule 144A of the Securities Act of 1933. These securities may be resold in transactions exempt from registration, normally to qualified institutional buyers. At the end of the period, the value of these securities amounted to $11,277,202 or 1.7% of net assets. |
| (c) | Restricted securities (including private placements) - Investment in securities not registered under the Securities Act of 1933 (excluding 144A issues). At the end of the period, the value of restricted securities (excluding 144A issues) amounted to $717,085 or 0.1% of net assets. |
| (e) | Security or a portion of the security is on loan at period end. |
| (f) | Affiliated fund that is generally available only to investment companies and other accounts managed by Fidelity Investments. The rate quoted is the annualized seven-day yield of the fund at period end. A complete unaudited listing of the fund's holdings as of its most recent quarter end is available upon request. In addition, each Fidelity Central Fund's financial statements are available on the SEC's website or upon request. |
| (g) | Investment made with cash collateral received from securities on loan. |
| Additional information on each restricted holding is as follows: |
| Security | Acquisition Date | Acquisition Cost ($) |
| Bolt Technology OU Series E | 1/03/22 | 1,000,736 |
| | | |
| Kry International AB | 5/14/21 | 176,328 |
| | | |
| Kry International AB Series E | 5/14/21 | 1,072,071 |
| | | |
Affiliated Central Funds
Fiscal year to date information regarding the Fund's investments in Fidelity Central Funds, including the ownership percentage, is presented below.
| Affiliate | Value, beginning of period ($) | Purchases ($) | Sales Proceeds ($) | Dividend Income ($) | Realized Gain (loss) ($) | Change in Unrealized appreciation (depreciation) ($) | Value, end of period ($) | % ownership, end of period |
| Fidelity Cash Central Fund 4.88% | - | 67,998,020 | 61,060,109 | 127,606 | - | - | 6,937,911 | 0.0% |
| Fidelity Securities Lending Cash Central Fund 4.88% | 3,435,000 | 54,086,388 | 49,429,453 | 49,464 | - | - | 8,091,935 | 0.0% |
| Total | 3,435,000 | 122,084,408 | 110,489,562 | 177,070 | - | - | 15,029,846 | |
| | | | | | | | | |
Amounts in the dividend income column in the above table include any capital gain distributions from underlying funds, which are presented in the corresponding line item in the Statement of Operations, if applicable.
Amounts in the dividend income column for Fidelity Securities Lending Cash Central Fund represents the income earned on investing cash collateral, less rebates paid to borrowers and any lending agent fees associated with the loan, plus any premium payments received for lending certain types of securities.
Amounts included in the purchases and sales proceeds columns may include in-kind transactions, if applicable.
Investment Valuation
The following is a summary of the inputs used, as of April 30, 2023, involving the Fund's assets and liabilities carried at fair value. The inputs or methodology used for valuing securities may not be an indication of the risk associated with investing in those securities. For more information on valuation inputs, and their aggregation into the levels used below, please refer to the Investment Valuation section in the accompanying Notes to Financial Statements.
| Valuation Inputs at Reporting Date: |
| Description | Total ($) | Level 1 ($) | Level 2 ($) | Level 3 ($) |
Investments in Securities: | | | | |
|
| Equities: | | | | |
Communication Services | 10,851,130 | 10,851,130 | - | - |
Consumer Discretionary | 117,575,446 | 36,951,654 | 80,623,792 | - |
Consumer Staples | 80,566,770 | 36,082,860 | 44,483,910 | - |
Energy | 33,267,198 | 4,530,875 | 28,736,323 | - |
Financials | 112,486,140 | 63,469,672 | 49,016,468 | - |
Health Care | 102,506,815 | 32,647,813 | 69,859,002 | - |
Industrials | 100,475,957 | 74,999,837 | 25,476,120 | - |
Information Technology | 39,148,370 | 38,431,285 | - | 717,085 |
Materials | 31,375,115 | 8,294,798 | 23,080,317 | - |
Real Estate | 7,616,204 | 7,616,204 | - | - |
Utilities | 7,708,033 | 7,708,033 | - | - |
|
| Money Market Funds | 15,029,846 | 15,029,846 | - | - |
| Total Investments in Securities: | 658,607,024 | 336,614,007 | 321,275,932 | 717,085 |
Fidelity® Europe Fund
| Statement of Assets and Liabilities |
| | | | April 30, 2023 (Unaudited) |
| | | | | |
| Assets | | | | |
| Investment in securities, at value (including securities loaned of $7,562,550) - See accompanying schedule: | | | | |
Unaffiliated issuers (cost $542,051,575) | $ | 643,577,178 | | |
Fidelity Central Funds (cost $15,029,846) | | 15,029,846 | | |
| | | | | |
| | | | | |
| Total Investment in Securities (cost $557,081,421) | | | $ | 658,607,024 |
| Cash | | | | 41,622 |
| Foreign currency held at value (cost $412,426) | | | | 412,311 |
| Receivable for investments sold | | | | 22,562 |
| Receivable for fund shares sold | | | | 163,278 |
| Dividends receivable | | | | 882,024 |
| Reclaims receivable | | | | 3,856,062 |
| Distributions receivable from Fidelity Central Funds | | | | 40,676 |
| Prepaid expenses | | | | 242 |
Total assets | | | | 664,025,801 |
| Liabilities | | | | |
| Payable for investments purchased | $ | 273,783 | | |
| Payable for fund shares redeemed | | 181,519 | | |
| Accrued management fee | | 227,088 | | |
| Distribution and service plan fees payable | | 7,897 | | |
| Other affiliated payables | | 113,970 | | |
| Other payables and accrued expenses | | 51,878 | | |
| Collateral on securities loaned | | 8,091,935 | | |
| Total Liabilities | | | | 8,948,070 |
| Net Assets | | | $ | 655,077,731 |
| Net Assets consist of: | | | | |
| Paid in capital | | | $ | 648,787,252 |
| Total accumulated earnings (loss) | | | | 6,290,479 |
| Net Assets | | | $ | 655,077,731 |
| | | | | |
| Net Asset Value and Maximum Offering Price | | | | |
| Class A : | | | | |
Net Asset Value and redemption price per share ($17,722,109 ÷ 515,906 shares) (a) | | | $ | 34.35 |
| Maximum offering price per share (100/94.25 of $34.35) | | | $ | 36.45 |
| Class M : | | | | |
Net Asset Value and redemption price per share ($4,918,865 ÷ 143,023 shares) (a) | | | $ | 34.39 |
| Maximum offering price per share (100/96.50 of $34.39) | | | $ | 35.64 |
| Class C : | | | | |
Net Asset Value and offering price per share ($2,626,419 ÷ 77,373 shares) (a) | | | $ | 33.94 |
| Europe : | | | | |
Net Asset Value , offering price and redemption price per share ($621,705,374 ÷ 18,081,037 shares) | | | $ | 34.38 |
| Class I : | | | | |
Net Asset Value , offering price and redemption price per share ($6,156,942 ÷ 179,059 shares) | | | $ | 34.38 |
| Class Z : | | | | |
Net Asset Value , offering price and redemption price per share ($1,948,022 ÷ 56,786 shares) | | | $ | 34.30 |
(a)Redemption price per share is equal to net asset value less any applicable contingent deferred sales charge. |
| Statement of Operations |
| | | | Six months ended April 30, 2023 (Unaudited) |
| Investment Income | | | | |
| Dividends | | | $ | 7,892,381 |
| Foreign Tax Reclaims | | | | 693,155 |
| Income from Fidelity Central Funds (including $49,464 from security lending) | | | | 177,070 |
| Income before foreign taxes withheld | | | $ | 8,762,606 |
| Less foreign taxes withheld | | | | (1,812,088) |
| Total Income | | | | 6,950,518 |
| Expenses | | | | |
| Management fee | | | | |
| Basic fee | $ | 2,104,299 | | |
| Performance adjustment | | (615,629) | | |
| Transfer agent fees | | 529,864 | | |
| Distribution and service plan fees | | 47,158 | | |
| Accounting fees | | 148,645 | | |
| Custodian fees and expenses | | 27,708 | | |
| Independent trustees' fees and expenses | | 2,022 | | |
| Registration fees | | 67,301 | | |
| Audit | | 55,419 | | |
| Legal | | 473 | | |
| Miscellaneous | | 1,326 | | |
| Total expenses before reductions | | 2,368,586 | | |
| Expense reductions | | (14,513) | | |
| Total expenses after reductions | | | | 2,354,073 |
| Net Investment income (loss) | | | | 4,596,445 |
| Realized and Unrealized Gain (Loss) | | | | |
| Net realized gain (loss) on: | | | | |
| Investment Securities: | | | | |
| Unaffiliated issuers | | 619,920 | | |
| Foreign currency transactions | | 357,580 | | |
| Total net realized gain (loss) | | | | 977,500 |
| Change in net unrealized appreciation (depreciation) on: | | | | |
| Investment Securities: | | | | |
| Unaffiliated issuers | | 127,402,693 | | |
| Assets and liabilities in foreign currencies | | 371,842 | | |
| Total change in net unrealized appreciation (depreciation) | | | | 127,774,535 |
| Net gain (loss) | | | | 128,752,035 |
| Net increase (decrease) in net assets resulting from operations | | | $ | 133,348,480 |
| Statement of Changes in Net Assets |
| |
| | Six months ended April 30, 2023 (Unaudited) | | Year ended October 31, 2022 |
| Increase (Decrease) in Net Assets | | | | |
| Operations | | | | |
| Net investment income (loss) | $ | 4,596,445 | $ | 12,412,102 |
| Net realized gain (loss) | | 977,500 | | (97,543,049) |
| Change in net unrealized appreciation (depreciation) | | 127,774,535 | | (184,315,984) |
| Net increase (decrease) in net assets resulting from operations | | 133,348,480 | | (269,446,931) |
| Distributions to shareholders | | - | | (133,487,366) |
| Share transactions - net increase (decrease) | | (30,755,462) | | (44,868,451) |
| Total increase (decrease) in net assets | | 102,593,018 | | (447,802,748) |
| | | | | |
| Net Assets | | | | |
| Beginning of period | | 552,484,713 | | 1,000,287,461 |
| End of period | $ | 655,077,731 | $ | 552,484,713 |
| | | | | |
| | | | | |
Financial Highlights
| Fidelity Advisor® Europe Fund Class A |
| |
| | Six months ended (Unaudited) April 30, 2023 | | Years ended October 31, 2022 | | 2021 | | 2020 | | 2019 | | 2018 |
Selected Per-Share Data | | | | | | | | | | | | |
| Net asset value, beginning of period | $ | 27.58 | $ | 46.12 | $ | 35.37 | $ | 36.30 | $ | 37.61 | $ | 42.47 |
| Income from Investment Operations | | | | | | | | | | | | |
Net investment income (loss) A,B | | .19 | | .47 | | .41 | | .19 | | 1.41 C | | .34 |
| Net realized and unrealized gain (loss) | | 6.58 | | (12.91) | | 10.72 | | 1.46 | | .82 | | (4.21) D |
| Total from investment operations | | 6.77 | | (12.44) | | 11.13 | | 1.65 | | 2.23 | | (3.87) |
| Distributions from net investment income | | - | | (.99) | | (.38) | | (1.50) | | (.11) | | (.33) |
| Distributions from net realized gain | | - | | (5.12) | | - | | (1.08) | | (3.43) | | (.66) |
| Total distributions | | - | | (6.10) E | | (.38) | | (2.58) | | (3.54) | | (.99) |
| Net asset value, end of period | $ | 34.35 | $ | 27.58 | $ | 46.12 | $ | 35.37 | $ | 36.30 | $ | 37.61 |
Total Return F,G,H | | 24.55% | | (30.29)% | | 31.60% | | 4.62% | | 7.21% | | (9.31)% D |
Ratios to Average Net Assets B,I,J | | | | | | | | | | | | |
| Expenses before reductions | | 1.06% K | | 1.18% | | 1.36% | | 1.34% | | 1.09% | | 1.28% |
| Expenses net of fee waivers, if any | | 1.06% K | | 1.18% | | 1.36% | | 1.34% | | 1.09% | | 1.28% |
| Expenses net of all reductions | | 1.06% K | | 1.18% | | 1.36% | | 1.33% | | 1.07% | | 1.28% |
| Net investment income (loss) | | 1.18% K | | 1.42% | | .92% | | .56% | | 4.02% C | | .82% |
| Supplemental Data | | | | | | | | | | | | |
| Net assets, end of period (000 omitted) | $ | 17,722 | $ | 16,495 | $ | 32,148 | $ | 23,189 | $ | 20,819 | $ | 19,531 |
Portfolio turnover rate L | | 40% K | | 55% | | 52% | | 39% | | 45% | | 57% |
A Calculated based on average shares outstanding during the period.
B Net investment income (loss) is affected by the timing of the declaration of dividends by any underlying mutual funds or exchange-traded funds (ETFs). Net investment income (loss) of any mutual funds or ETFs is not included in the Fund's net investment income (loss) ratio.
C Net investment income per share reflects one or more large, non-recurring dividend(s) which amounted to $.20 per share. Excluding such non-recurring dividend(s), the ratio of net investment income (loss) to average net assets would have been 3.44%.
D Net realized and unrealized gain (loss) per share reflects proceeds received from litigation which amounted to $.18 per share. Excluding these litigation proceeds, the total return would have been (9.74)%.
E Total distributions per share do not sum due to rounding.
F Total returns for periods of less than one year are not annualized.
G Total returns would have been lower if certain expenses had not been reduced during the applicable periods shown.
H Total returns do not include the effect of the sales charges.
I Fees and expenses of any underlying mutual funds or exchange-traded funds (ETFs) are not included in the Fund's expense ratio. The Fund indirectly bears its proportionate share of these expenses. For additional expense information related to investments in Fidelity Central Funds, please refer to the "Investments in Fidelity Central Funds" note found in the Notes to Financial Statements section of the most recent Annual or Semi-Annual report.
J Expense ratios reflect operating expenses of the class. Expenses before reductions do not reflect amounts reimbursed, waived, or reduced through arrangements with the investment adviser, brokerage services, or other offset arrangements, if applicable, and do not represent the amount paid by the class during periods when reimbursements, waivers or reductions occur.
K Annualized.
L Amount does not include the portfolio activity of any underlying mutual funds or exchange-traded funds (ETFs).
| Fidelity Advisor® Europe Fund Class M |
| |
| | Six months ended (Unaudited) April 30, 2023 | | Years ended October 31, 2022 | | 2021 | | 2020 | | 2019 | | 2018 |
Selected Per-Share Data | | | | | | | | | | | | |
| Net asset value, beginning of period | $ | 27.65 | $ | 46.18 | $ | 35.42 | $ | 36.32 | $ | 37.57 | $ | 42.47 |
| Income from Investment Operations | | | | | | | | | | | | |
Net investment income (loss) A,B | | .15 | | .37 | | .27 | | .09 | | 1.30 C | | .21 |
| Net realized and unrealized gain (loss) | | 6.59 | | (12.95) | | 10.75 | | 1.45 | | .83 | | (4.23) D |
| Total from investment operations | | 6.74 | | (12.58) | | 11.02 | | 1.54 | | 2.13 | | (4.02) |
| Distributions from net investment income | | - | | (.83) | | (.26) | | (1.36) | | - | | (.23) |
| Distributions from net realized gain | | - | | (5.12) | | - | | (1.08) | | (3.38) | | (.66) |
| Total distributions | | - | | (5.95) | | (.26) | | (2.44) | | (3.38) | | (.88) E |
| Net asset value, end of period | $ | 34.39 | $ | 27.65 | $ | 46.18 | $ | 35.42 | $ | 36.32 | $ | 37.57 |
Total Return F,G,H | | 24.38% | | (30.51)% | | 31.20% | | 4.30% | | 6.88% | | (9.63)% D |
Ratios to Average Net Assets B,I,J | | | | | | | | | | | | |
| Expenses before reductions | | 1.33% K | | 1.49% | | 1.68% | | 1.65% | | 1.41% | | 1.61% |
| Expenses net of fee waivers, if any | | 1.33% K | | 1.48% | | 1.68% | | 1.65% | | 1.40% | | 1.61% |
| Expenses net of all reductions | | 1.32% K | | 1.48% | | 1.68% | | 1.64% | | 1.38% | | 1.61% |
| Net investment income (loss) | | .91% K | | 1.12% | | .59% | | .25% | | 3.70% C | | .50% |
| Supplemental Data | | | | | | | | | | | | |
| Net assets, end of period (000 omitted) | $ | 4,919 | $ | 4,066 | $ | 6,937 | $ | 5,204 | $ | 5,782 | $ | 7,257 |
Portfolio turnover rate L | | 40% K | | 55% | | 52% | | 39% | | 45% | | 57% |
A Calculated based on average shares outstanding during the period.
B Net investment income (loss) is affected by the timing of the declaration of dividends by any underlying mutual funds or exchange-traded funds (ETFs). Net investment income (loss) of any mutual funds or ETFs is not included in the Fund's net investment income (loss) ratio.
C Net investment income per share reflects one or more large, non-recurring dividend(s) which amounted to $.20 per share. Excluding such non-recurring dividend(s), the ratio of net investment income (loss) to average net assets would have been 3.12%.
D Net realized and unrealized gain (loss) per share reflects proceeds received from litigation which amounted to $.18 per share. Excluding these litigation proceeds, the total return would have been (10.06)%.
E Total distributions per share do not sum due to rounding.
F Total returns for periods of less than one year are not annualized.
G Total returns would have been lower if certain expenses had not been reduced during the applicable periods shown.
H Total returns do not include the effect of the sales charges.
I Fees and expenses of any underlying mutual funds or exchange-traded funds (ETFs) are not included in the Fund's expense ratio. The Fund indirectly bears its proportionate share of these expenses. For additional expense information related to investments in Fidelity Central Funds, please refer to the "Investments in Fidelity Central Funds" note found in the Notes to Financial Statements section of the most recent Annual or Semi-Annual report.
J Expense ratios reflect operating expenses of the class. Expenses before reductions do not reflect amounts reimbursed, waived, or reduced through arrangements with the investment adviser, brokerage services, or other offset arrangements, if applicable, and do not represent the amount paid by the class during periods when reimbursements, waivers or reductions occur.
K Annualized.
L Amount does not include the portfolio activity of any underlying mutual funds or exchange-traded funds (ETFs).
| Fidelity Advisor® Europe Fund Class C |
| |
| | Six months ended (Unaudited) April 30, 2023 | | Years ended October 31, 2022 | | 2021 | | 2020 | | 2019 | | 2018 |
Selected Per-Share Data | | | | | | | | | | | | |
| Net asset value, beginning of period | $ | 27.36 | $ | 45.63 | $ | 35.01 | $ | 35.87 | $ | 37.23 | $ | 42.15 |
| Income from Investment Operations | | | | | | | | | | | | |
Net investment income (loss) A,B | | .06 | | .21 | | .04 | | (.09) | | 1.12 C | | .02 |
| Net realized and unrealized gain (loss) | | 6.52 | | (12.84) | | 10.64 | | 1.45 | | .82 | | (4.18) D |
| Total from investment operations | | 6.58 | | (12.63) | | 10.68 | | 1.36 | | 1.94 | | (4.16) |
| Distributions from net investment income | | - | | (.52) | | (.06) | | (1.14) | | - | | (.10) |
| Distributions from net realized gain | | - | | (5.12) | | - | | (1.08) | | (3.30) | | (.66) |
| Total distributions | | - | | (5.64) | | (.06) | | (2.22) | | (3.30) | | (.76) |
| Net asset value, end of period | $ | 33.94 | $ | 27.36 | $ | 45.63 | $ | 35.01 | $ | 35.87 | $ | 37.23 |
Total Return E,F,G | | 24.05% | | (30.85)% | | 30.53% | | 3.81% | | 6.35% | | (10.04)% D |
Ratios to Average Net Assets B,H,I | | | | | | | | | | | | |
| Expenses before reductions | | 1.84% J | | 1.99% | | 2.19% | | 2.15% | | 1.90% | | 2.06% |
| Expenses net of fee waivers, if any | | 1.83% J | | 1.98% | | 2.18% | | 2.15% | | 1.90% | | 2.06% |
| Expenses net of all reductions | | 1.83% J | | 1.98% | | 2.18% | | 2.14% | | 1.87% | | 2.06% |
| Net investment income (loss) | | .40% J | | .62% | | .09% | | (.25)% | | 3.21% C | | .04% |
| Supplemental Data | | | | | | | | | | | | |
| Net assets, end of period (000 omitted) | $ | 2,626 | $ | 2,496 | $ | 5,255 | $ | 5,242 | $ | 6,145 | $ | 10,060 |
Portfolio turnover rate K | | 40% J | | 55% | | 52% | | 39% | | 45% | | 57% |
A Calculated based on average shares outstanding during the period.
B Net investment income (loss) is affected by the timing of the declaration of dividends by any underlying mutual funds or exchange-traded funds (ETFs). Net investment income (loss) of any mutual funds or ETFs is not included in the Fund's net investment income (loss) ratio.
C Net investment income per share reflects one or more large, non-recurring dividend(s) which amounted to $.20 per share. Excluding such non-recurring dividend(s), the ratio of net investment income (loss) to average net assets would have been 2.63%.
D Net realized and unrealized gain (loss) per share reflects proceeds received from litigation which amounted to $.18 per share. Excluding these litigation proceeds, the total return would have been (10.47)%.
E Total returns for periods of less than one year are not annualized.
F Total returns would have been lower if certain expenses had not been reduced during the applicable periods shown.
G Total returns do not include the effect of the contingent deferred sales charge.
H Fees and expenses of any underlying mutual funds or exchange-traded funds (ETFs) are not included in the Fund's expense ratio. The Fund indirectly bears its proportionate share of these expenses. For additional expense information related to investments in Fidelity Central Funds, please refer to the "Investments in Fidelity Central Funds" note found in the Notes to Financial Statements section of the most recent Annual or Semi-Annual report.
I Expense ratios reflect operating expenses of the class. Expenses before reductions do not reflect amounts reimbursed, waived, or reduced through arrangements with the investment adviser, brokerage services, or other offset arrangements, if applicable, and do not represent the amount paid by the class during periods when reimbursements, waivers or reductions occur.
J Annualized.
K Amount does not include the portfolio activity of any underlying mutual funds or exchange-traded funds (ETFs).
| | Six months ended (Unaudited) April 30, 2023 | | Years ended October 31, 2022 | | 2021 | | 2020 | | 2019 | | 2018 |
Selected Per-Share Data | | | | | | | | | | | | |
| Net asset value, beginning of period | $ | 27.57 | $ | 46.11 | $ | 35.35 | $ | 36.28 | $ | 37.70 | $ | 42.53 |
| Income from Investment Operations | | | | | | | | | | | | |
Net investment income (loss) A,B | | .24 | | .57 | | .54 | | .30 | | 1.52 C | | .48 |
| Net realized and unrealized gain (loss) | | 6.57 | | (12.88) | | 10.71 | | 1.46 | | .81 | | (4.24) D |
| Total from investment operations | | 6.81 | | (12.31) | | 11.25 | | 1.76 | | 2.33 | | (3.76) |
| Distributions from net investment income | | - | | (1.11) | | (.49) | | (1.61) | | (.32) | | (.41) |
| Distributions from net realized gain | | - | | (5.12) | | - | | (1.08) | | (3.43) | | (.66) |
| Total distributions | | - | | (6.23) | | (.49) | | (2.69) | | (3.75) | | (1.07) |
| Net asset value, end of period | $ | 34.38 | $ | 27.57 | $ | 46.11 | $ | 35.35 | $ | 36.28 | $ | 37.70 |
Total Return E,F | | 24.70% | | (30.07)% | | 31.99% | | 4.95% | | 7.56% | | (9.05)% D |
Ratios to Average Net Assets B,G,H | | | | | | | | | | | | |
| Expenses before reductions | | .74% I | | .88% | | 1.06% | | 1.03% | | .78% | | .96% |
| Expenses net of fee waivers, if any | | .74% I | | .88% | | 1.06% | | 1.03% | | .77% | | .96% |
| Expenses net of all reductions | | .74% I | | .88% | | 1.06% | | 1.02% | | .75% | | .96% |
| Net investment income (loss) | | 1.50% I | | 1.73% | | 1.21% | | .86% | | 4.33% C | | 1.14% |
| Supplemental Data | | | | | | | | | | | | |
| Net assets, end of period (000 omitted) | $ | 621,705 | $ | 523,685 | $ | 913,296 | $ | 755,125 | $ | 836,373 | $ | 941,670 |
Portfolio turnover rate J | | 40% I | | 55% | | 52% | | 39% | | 45% | | 57% |
A Calculated based on average shares outstanding during the period.
B Net investment income (loss) is affected by the timing of the declaration of dividends by any underlying mutual funds or exchange-traded funds (ETFs). Net investment income (loss) of any mutual funds or ETFs is not included in the Fund's net investment income (loss) ratio.
C Net investment income per share reflects one or more large, non-recurring dividend(s) which amounted to $.20 per share. Excluding such non-recurring dividend(s), the ratio of net investment income (loss) to average net assets would have been 3.75%.
D Net realized and unrealized gain (loss) per share reflects proceeds received from litigation which amounted to $.18 per share. Excluding these litigation proceeds, the total return would have been (9.48)%.
E Total returns for periods of less than one year are not annualized.
F Total returns would have been lower if certain expenses had not been reduced during the applicable periods shown.
G Fees and expenses of any underlying mutual funds or exchange-traded funds (ETFs) are not included in the Fund's expense ratio. The Fund indirectly bears its proportionate share of these expenses. For additional expense information related to investments in Fidelity Central Funds, please refer to the "Investments in Fidelity Central Funds" note found in the Notes to Financial Statements section of the most recent Annual or Semi-Annual report.
H Expense ratios reflect operating expenses of the class. Expenses before reductions do not reflect amounts reimbursed, waived, or reduced through arrangements with the investment adviser, brokerage services, or other offset arrangements, if applicable, and do not represent the amount paid by the class during periods when reimbursements, waivers or reductions occur.
I Annualized.
J Amount does not include the portfolio activity of any underlying mutual funds or exchange-traded funds (ETFs).
| Fidelity Advisor® Europe Fund Class I |
| |
| | Six months ended (Unaudited) April 30, 2023 | | Years ended October 31, 2022 | | 2021 | | 2020 | | 2019 | | 2018 |
Selected Per-Share Data | | | | | | | | | | | | |
| Net asset value, beginning of period | $ | 27.56 | $ | 46.07 | $ | 35.34 | $ | 36.27 | $ | 37.69 | $ | 42.53 |
| Income from Investment Operations | | | | | | | | | | | | |
Net investment income (loss) A,B | | .24 | | .60 | | .54 | | .31 | | 1.53 C | | .48 |
| Net realized and unrealized gain (loss) | | 6.58 | | (12.91) | | 10.70 | | 1.46 | | .80 | | (4.23) D |
| Total from investment operations | | 6.82 | | (12.31) | | 11.24 | | 1.77 | | 2.33 | | (3.75) |
| Distributions from net investment income | | - | | (1.08) | | (.51) | | (1.62) | | (.32) | | (.43) |
| Distributions from net realized gain | | - | | (5.12) | | - | | (1.08) | | (3.43) | | (.66) |
| Total distributions | | - | | (6.20) | | (.51) | | (2.70) | | (3.75) | | (1.09) |
| Net asset value, end of period | $ | 34.38 | $ | 27.56 | $ | 46.07 | $ | 35.34 | $ | 36.27 | $ | 37.69 |
Total Return E,F | | 24.75% | | (30.08)% | | 31.99% | | 4.99% | | 7.58% | | (9.02)% D |
Ratios to Average Net Assets B,G,H | | | | | | | | | | | | |
| Expenses before reductions | | .72% I | | .86% | | 1.06% | | 1.00% | | .75% | | .95% |
| Expenses net of fee waivers, if any | | .72% I | | .86% | | 1.06% | | 1.00% | | .74% | | .95% |
| Expenses net of all reductions | | .72% I | | .86% | | 1.06% | | .99% | | .72% | | .95% |
| Net investment income (loss) | | 1.52% I | | 1.74% | | 1.22% | | .90% | | 4.36% C | | 1.16% |
| Supplemental Data | | | | | | | | | | | | |
| Net assets, end of period (000 omitted) | $ | 6,157 | $ | 4,283 | $ | 14,401 | $ | 14,733 | $ | 6,686 | $ | 7,318 |
Portfolio turnover rate J | | 40% I | | 55% | | 52% | | 39% | | 45% | | 57% |
A Calculated based on average shares outstanding during the period.
B Net investment income (loss) is affected by the timing of the declaration of dividends by any underlying mutual funds or exchange-traded funds (ETFs). Net investment income (loss) of any mutual funds or ETFs is not included in the Fund's net investment income (loss) ratio.
C Net investment income per share reflects one or more large, non-recurring dividend(s) which amounted to $.20 per share. Excluding such non-recurring dividend(s), the ratio of net investment income (loss) to average net assets would have been 3.78%.
D Net realized and unrealized gain (loss) per share reflects proceeds received from litigation which amounted to $.18 per share. Excluding these litigation proceeds, the total return would have been (9.45)%.
E Total returns for periods of less than one year are not annualized.
F Total returns would have been lower if certain expenses had not been reduced during the applicable periods shown.
G Fees and expenses of any underlying mutual funds or exchange-traded funds (ETFs) are not included in the Fund's expense ratio. The Fund indirectly bears its proportionate share of these expenses. For additional expense information related to investments in Fidelity Central Funds, please refer to the "Investments in Fidelity Central Funds" note found in the Notes to Financial Statements section of the most recent Annual or Semi-Annual report.
H Expense ratios reflect operating expenses of the class. Expenses before reductions do not reflect amounts reimbursed, waived, or reduced through arrangements with the investment adviser, brokerage services, or other offset arrangements, if applicable, and do not represent the amount paid by the class during periods when reimbursements, waivers or reductions occur.
I Annualized.
J Amount does not include the portfolio activity of any underlying mutual funds or exchange-traded funds (ETFs).
| Fidelity Advisor® Europe Fund Class Z |
| |
| | Six months ended (Unaudited) April 30, 2023 | | Years ended October 31, 2022 | | 2021 | | 2020 | | 2019 | | 2018 A |
Selected Per-Share Data | | | | | | | | | | | | |
| Net asset value, beginning of period | $ | 27.48 | $ | 46.00 | $ | 35.27 | $ | 36.21 | $ | 37.69 | $ | 41.00 |
| Income from Investment Operations | | | | | | | | | | | | |
Net investment income (loss) B,C | | .26 | | .62 | | .59 | | .34 | | 1.53 D | | .06 |
| Net realized and unrealized gain (loss) | | 6.56 | | (12.86) | | 10.67 | | 1.47 | | .82 | | (3.37) E |
| Total from investment operations | | 6.82 | | (12.24) | | 11.26 | | 1.81 | | 2.35 | | (3.31) |
| Distributions from net investment income | | - | | (1.17) | | (.53) | | (1.67) | | (.41) | | - |
| Distributions from net realized gain | | - | | (5.12) | | - | | (1.08) | | (3.43) | | - |
| Total distributions | | - | | (6.28) F | | (.53) | | (2.75) | | (3.83) F | | - |
| Net asset value, end of period | $ | 34.30 | $ | 27.48 | $ | 46.00 | $ | 35.27 | $ | 36.21 | $ | 37.69 |
Total Return G,H | | 24.82% | | (30.00)% | | 32.13% | | 5.11% | | 7.71% | | (8.07)% E |
Ratios to Average Net Assets C,I,J | | | | | | | | | | | | |
| Expenses before reductions | | .62% K | | .76% | | .95% | | .91% | | .65% | | .91% K |
| Expenses net of fee waivers, if any | | .61% K | | .75% | | .95% | | .90% | | .64% | | .90% K |
| Expenses net of all reductions | | .61% K | | .75% | | .95% | | .90% | | .62% | | .90% K |
| Net investment income (loss) | | 1.62% K | | 1.85% | | 1.33% | | .99% | | 4.46% D | | 2.04% K |
| Supplemental Data | | | | | | | | | | | | |
| Net assets, end of period (000 omitted) | $ | 1,948 | $ | 1,461 | $ | 28,249 | $ | 19,479 | $ | 21,838 | $ | 104 |
Portfolio turnover rate L | | 40% K | | 55% | | 52% | | 39% | | 45% | | 57% |
A For the period October 2, 2018 (commencement of sale of shares) through October 31, 2018.
B Calculated based on average shares outstanding during the period.
C Net investment income (loss) is affected by the timing of the declaration of dividends by any underlying mutual funds or exchange-traded funds (ETFs). Net investment income (loss) of any mutual funds or ETFs is not included in the Fund's net investment income (loss) ratio.
D Net investment income per share reflects one or more large, non-recurring dividend(s) which amounted to $.20 per share. Excluding such non-recurring dividend(s), the ratio of net investment income (loss) to average net assets would have been 3.88%.
E Net realized and unrealized gain (loss) per share reflects proceeds received from litigation which amounted to $.16 per share. Excluding these litigation proceeds, the total return would have been (8.50)%.
F Total distributions per share do not sum due to rounding.
G Total returns for periods of less than one year are not annualized.
H Total returns would have been lower if certain expenses had not been reduced during the applicable periods shown.
I Fees and expenses of any underlying mutual funds or exchange-traded funds (ETFs) are not included in the Fund's expense ratio. The Fund indirectly bears its proportionate share of these expenses. For additional expense information related to investments in Fidelity Central Funds, please refer to the "Investments in Fidelity Central Funds" note found in the Notes to Financial Statements section of the most recent Annual or Semi-Annual report.
J Expense ratios reflect operating expenses of the class. Expenses before reductions do not reflect amounts reimbursed, waived, or reduced through arrangements with the investment adviser, brokerage services, or other offset arrangements, if applicable, and do not represent the amount paid by the class during periods when reimbursements, waivers or reductions occur.
K Annualized.
L Amount does not include the portfolio activity of any underlying mutual funds or exchange-traded funds (ETFs).
For the period ended April 30, 2023
1. Organization.
Fidelity Europe Fund (the Fund) is a fund of Fidelity Investment Trust (the Trust) and is authorized to issue an unlimited number of shares. The Trust is registered under the Investment Company Act of 1940, as amended (the 1940 Act), as an open-end management investment company organized as a Massachusetts business trust. The Fund offers Class A, Class M, Class C, Europe, Class I and Class Z shares, each of which has equal rights as to assets and voting privileges. Class A, Class M, Class C, Class I and Class Z are Fidelity Advisor classes. Each class has exclusive voting rights with respect to matters that affect that class. Class C shares will automatically convert to Class A shares after a holding period of eight years from the initial date of purchase, with certain exceptions.
2. Investments in Fidelity Central Funds.
Funds may invest in Fidelity Central Funds, which are open-end investment companies generally available only to other investment companies and accounts managed by the investment adviser and its affiliates. The Schedule of Investments lists any Fidelity Central Funds held as an investment as of period end, but does not include the underlying holdings of each Fidelity Central Fund. An investing fund indirectly bears its proportionate share of the expenses of the underlying Fidelity Central Funds.
Based on its investment objective, each Fidelity Central Fund may invest or participate in various investment vehicles or strategies that are similar to those of the investing fund. These strategies are consistent with the investment objectives of the investing fund and may involve certain economic risks which may cause a decline in value of each of the Fidelity Central Funds and thus a decline in the value of the investing fund.
| Fidelity Central Fund | Investment Manager | Investment Objective | Investment Practices | Expense Ratio A |
| Fidelity Money Market Central Funds | Fidelity Management & Research Company LLC (FMR) | Each fund seeks to obtain a high level of current income consistent with the preservation of capital and liquidity. | Short-term Investments | Less than .005% |
A Expenses expressed as a percentage of average net assets and are as of each underlying Central Fund's most recent annual or semi-annual shareholder report.
A complete unaudited list of holdings for each Fidelity Central Fund is available upon request or at the Securities and Exchange Commission website at www.sec.gov. In addition, the financial statements of the Fidelity Central Funds which contain the significant accounting policies (including investment valuation policies) of those funds, and are not covered by the Report of Independent Registered Public Accounting Firm, are available on the Securities and Exchange Commission website or upon request.
3. Significant Accounting Policies.
The Fund is an investment company and applies the accounting and reporting guidance of the Financial Accounting Standards Board (FASB) Accounting Standards Codification Topic 946 Financial Services - Investment Companies . The financial statements have been prepared in conformity with accounting principles generally accepted in the United States of America (GAAP), which require management to make certain estimates and assumptions at the date of the financial statements. Actual results could differ from those estimates. Subsequent events, if any, through the date that the financial statements were issued have been evaluated in the preparation of the financial statements. The Fund's Schedule of Investments lists any underlying mutual funds or exchange-traded funds (ETFs) but does not include the underlying holdings of these funds. The following summarizes the significant accounting policies of the Fund:
Investment Valuation. Investments are valued as of 4:00 p.m. Eastern time on the last calendar day of the period. The Board of Trustees (the Board) has designated the Fund's investment adviser as the valuation designee responsible for the fair valuation function and performing fair value determinations as needed. The investment adviser has established a Fair Value Committee (the Committee) to carry out the day-to-day fair valuation responsibilities and has adopted policies and procedures to govern the fair valuation process and the activities of the Committee. In accordance with these fair valuation policies and procedures, which have been approved by the Board, the Fund attempts to obtain prices from one or more third party pricing services or brokers to value its investments. When current market prices, quotations or currency exchange rates are not readily available or reliable, investments will be fair valued in good faith by the Committee, in accordance with the policies and procedures. Factors used in determining fair value vary by investment type and may include market or investment specific events, transaction data, estimated cash flows, and market observations of comparable investments. The frequency that the fair valuation procedures are used cannot be predicted and they may be utilized to a significant extent. The Committee manages the Fund's fair valuation practices and maintains the fair valuation policies and procedures. The Fund's investment adviser reports to the Board information regarding the fair valuation process and related material matters.
The Fund categorizes the inputs to valuation techniques used to value its investments into a disclosure hierarchy consisting of three levels as shown below:
Level 1 - unadjusted quoted prices in active markets for identical investments
Level 2 - other significant observable inputs (including quoted prices for similar investments, interest rates, prepayment speeds, etc.)
Level 3 - unobservable inputs (including the Fund's own assumptions based on the best information available)
Valuation techniques used to value the Fund's investments by major category are as follows:
Equity securities, including restricted securities, for which market quotations are readily available, are valued at the last reported sale price or official closing price as reported by a third party pricing service on the primary market or exchange on which they are traded and are categorized as Level 1 in the hierarchy. In the event there were no sales during the day or closing prices are not available, securities are valued at the last quoted bid price or may be valued using the last available price and are generally categorized as Level 2 in the hierarchy. For foreign equity securities, when market or security specific events arise, comparisons to the valuation of American Depositary Receipts (ADRs), futures contracts, ETFs and certain indexes as well as quoted prices for similar securities may be used and would be categorized as Level 2 in the hierarchy. For equity securities, including restricted securities, where observable inputs are limited, assumptions about market activity and risk are used and these securities may be categorized as Level 3 in the hierarchy.
Investments in open-end mutual funds, including the Fidelity Central Funds, are valued at their closing net asset value (NAV) each business day and are categorized as Level 1 in the hierarchy.
Changes in valuation techniques may result in transfers in or out of an assigned level within the disclosure hierarchy. The aggregate value of investments by input level as of April 30, 2023 is included at the end of the Fund's Schedule of Investments.
Foreign Currency. Certain Funds may use foreign currency contracts to facilitate transactions in foreign-denominated securities. Gains and losses from these transactions may arise from changes in the value of the foreign currency or if the counterparties do not perform under the contracts' terms.
Foreign-denominated assets, including investment securities, and liabilities are translated into U.S. dollars at the exchange rates at period end. Purchases and sales of investment securities, income and dividends received, and expenses denominated in foreign currencies are translated into U.S. dollars at the exchange rate in effect on the transaction date.
The effects of exchange rate fluctuations on investments are included with the net realized and unrealized gain (loss) on investment securities. Other foreign currency transactions resulting in realized and unrealized gain (loss) are disclosed separately.
Investment Transactions and Income. For financial reporting purposes, the Fund's investment holdings and NAV include trades executed through the end of the last business day of the period. The NAV per share for processing shareholder transactions is calculated as of the close of business of the New York Stock Exchange (NYSE), normally 4:00 p.m. Eastern time and includes trades executed through the end of the prior business day. Gains and losses on securities sold are determined on the basis of identified cost and include proceeds received from litigation. Commissions paid to certain brokers with whom the investment adviser, or its affiliates, places trades on behalf of a fund include an amount in addition to trade execution, which may be rebated back to a fund. Any such rebates are included in net realized gain (loss) on investments in the Statement of Operations. Dividend income is recorded on the ex-dividend date, except for certain dividends from foreign securities where the ex-dividend date may have passed, which are recorded as soon as the Fund is informed of the ex-dividend date. Non-cash dividends included in dividend income, if any, are recorded at the fair market value of the securities received. Income and capital gain distributions from Fidelity Central Funds, if any, are recorded on the ex-dividend date. Investment income is recorded net of foreign taxes withheld where recovery of such taxes is uncertain. Funds may file withholding tax reclaims in certain jurisdictions to recover a portion of amounts previously withheld. Any withholding tax reclaims income is included in the Statement of Operations in foreign tax reclaims. Any receivables for withholding tax reclaims are included in the Statement of Assets and Liabilities in reclaims receivable. The Fund has filed tax reclaims for previously withheld taxes on dividends earned in certain European Union (EU) countries. These additional filings are subject to various administrative proceedings by the local jurisdictions' tax authorities within the EU, as well as a number of related judicial proceedings. Income recognized for EU reclaims is included with other reclaims in the Statement of Operations in foreign tax reclaims. These reclaims are recorded when the amount is known and there are no significant uncertainties on collectability.
Class Allocations and Expenses. Investment income, realized and unrealized capital gains and losses, common expenses of a fund, and certain fund-level expense reductions, if any, are allocated daily on a pro-rata basis to each class based on the relative net assets of each class to the total net assets of a fund. Each class differs with respect to transfer agent and distribution and service plan fees incurred, as applicable. Certain expense reductions may also differ by class, if applicable. For the reporting period, the allocated portion of income and expenses to each class as a percent of its average net assets may vary due to the timing of recording these transactions in relation to fluctuating net assets of the classes. Expenses directly attributable to a fund are charged to that fund. Expenses attributable to more than one fund are allocated among the respective funds on the basis of relative net assets or other appropriate methods. Expenses included in the accompanying financial statements reflect the expenses of that fund and do not include any expenses associated with any underlying mutual funds or exchange-traded funds. Although not included in a fund's expenses, a fund indirectly bears its proportionate share of these expenses through the net asset value of each underlying mutual fund or exchange-traded fund. Expense estimates are accrued in the period to which they relate and adjustments are made when actual amounts are known.
Income Tax Information and Distributions to Shareholders. Each year, the Fund intends to qualify as a regulated investment company under Subchapter M of the Internal Revenue Code, including distributing substantially all of its taxable income and realized gains. As a result, no provision for U.S. Federal income taxes is required. The Fund files a U.S. federal tax return, in addition to state and local tax returns as required. The Fund's federal income tax returns are subject to examination by the Internal Revenue Service (IRS) for a period of three fiscal years after they are filed. State and local tax returns may be subject to examination for an additional fiscal year depending on the jurisdiction. Foreign taxes are provided for based on the Fund's understanding of the tax rules and rates that exist in the foreign markets in which it invests.
Distributions are declared and recorded on the ex-dividend date. Income and capital gain distributions are declared separately for each class. Income and capital gain distributions are determined in accordance with income tax regulations, which may differ from GAAP.
Capital accounts within the financial statements are adjusted for permanent book-tax differences. These adjustments have no impact on net assets or the results of operations. Capital accounts are not adjusted for temporary book-tax differences which will reverse in a subsequent period.
Book-tax differences are primarily due to foreign currency transactions, passive foreign investment companies (PFIC), capital loss carryforwards and losses deferred due to wash sales and excise tax regulations.
As of period end, the cost and unrealized appreciation (depreciation) in securities, and derivatives if applicable, for federal income tax purposes were as follows:
| Gross unrealized appreciation | $116,586,399 |
| Gross unrealized depreciation | (15,066,885) |
| Net unrealized appreciation (depreciation) | $101,519,514 |
| Tax cost | $557,087,510 |
Capital loss carryforwards are only available to offset future capital gains of the Fund to the extent provided by regulations and may be limited. The capital loss carryforward information presented below, including any applicable limitation, is estimated as of prior fiscal period end and is subject to adjustment.
Short-term | $(54,492,199) |
Long-term | (44,431,472) |
| Total capital loss carryforward | $(98,923,671) |
Restricted Securities (including Private Placements). Funds may invest in securities that are subject to legal or contractual restrictions on resale. These securities generally may be resold in transactions exempt from registration or to the public if the securities are registered. Disposal of these securities may involve time-consuming negotiations and expense, and prompt sale at an acceptable price may be difficult. Information regarding restricted securities held at period end is included at the end of the Schedule of Investments, if applicable.
4. Purchases and Sales of Investments.
Purchases and sales of securities, other than short-term securities and in-kind transactions, as applicable, are noted in the table below.
| | Purchases ($) | Sales ($) |
| Fidelity Europe Fund | 121,863,877 | 149,492,663 |
5. Fees and Other Transactions with Affiliates.
Management Fee. Fidelity Management & Research Company LLC (the investment adviser) and its affiliates provide the Fund with investment management related services for which the Fund pays a monthly management fee. The management fee is the sum of an individual fund fee rate that is based on an annual rate of .45% of the Fund's average net assets and an annualized group fee rate that averaged .23% during the period. The group fee rate is based upon the monthly average net assets of a group of registered investment companies with which the investment adviser has management contracts. The group fee rate decreases as assets under management increase and increases as assets under management decrease. In addition, the management fee is subject to a performance adjustment (up to a maximum of +/- .20% of the Fund's average net assets over a 36 month performance period). The upward or downward adjustment to the management fee is based on the relative investment performance of Europe as compared to its benchmark index, the MSCI Europe Index, over the same 36 month performance period. For the reporting period, the total annualized management fee rate, including the performance adjustment, was .48% of the Fund's average net assets. The performance adjustment included in the management fee rate may be higher or lower than the maximum performance adjustment rate due to the difference between the average net assets for the reporting and performance periods.
Distribution and Service Plan Fees. In accordance with Rule 12b-1 of the 1940 Act, the Fund has adopted separate Distribution and Service Plans for each class of shares. Certain classes pay Fidelity Distributors Company LLC (FDC), an affiliate of the investment adviser, separate Distribution and Service Fees, each of which is based on an annual percentage of each class' average net assets. In addition, FDC may pay financial intermediaries for selling shares of the Fund and providing shareholder support services. For the period, the Distribution and Service Fee rates, total fees and amounts retained by FDC were as follows:
| | Distribution Fee | Service Fee | Total Fees | Retained by FDC |
| Class A | - % | .25% | $22,233 | $309 |
| Class M | .25% | .25% | 11,590 | 217 |
| Class C | .75% | .25% | 13,335 | 823 |
| | | | $47,158 | $1,349 |
Sales Load. FDC may receive a front-end sales charge of up to 5.75% for selling Class A shares and 3.50% for selling Class M shares, some of which is paid to financial intermediaries for selling shares of the Fund. Depending on the holding period, FDC may receive contingent deferred sales charges levied on Class A, Class M and Class C redemptions. The deferred sales charges are 1.00% for Class C shares, 1.00% for certain purchases of Class A shares and .25% for certain purchases of Class M shares.
For the period, sales charge amounts retained by FDC were as follows:
| | Retained by FDC |
| Class A | $1,595 |
| Class M | 63 |
Class C A | 18 |
| | $1,676 |
A When Class C shares are initially sold, FDC pays commissions from its own resources to financial intermediaries through which the sales are made.
Transfer Agent Fees. Fidelity Investments Institutional Operations Company LLC (FIIOC), an affiliate of the investment adviser, is the transfer, dividend disbursing and shareholder servicing agent for each class of the Fund. FIIOC receives account fees and asset-based fees that vary according to the account size and type of account of the shareholders of the respective classes of the Fund, except for Class Z. FIIOC receives an asset-based fee of Class Z's average net assets. FIIOC pays for typesetting, printing and mailing of shareholder reports, except proxy statements.
For the period, transfer agent fees for each class were as follows:
| | Amount | % of Class-Level Average Net Assets A |
| Class A | $20,777 | .23 |
| Class M | 5,949 | .26 |
| Class C | 3,452 | .26 |
| Europe | 495,660 | .17 |
| Class I | 3,674 | .15 |
| Class Z | 352 | .04 |
| | $529,864 | |
A Annualized
Accounting Fees. Fidelity Service Company, Inc. (FSC), an affiliate of the investment adviser, maintains the Fund's accounting records. The accounting fee is based on the level of average net assets for each month. For the period, the fees were equivalent to the following annualized rates:
| | % of Average Net Assets |
| Fidelity Europe Fund | .05 |
Interfund Trades. Funds may purchase from or sell securities to other Fidelity Funds under procedures adopted by the Board. The procedures have been designed to ensure these interfund trades are executed in accordance with Rule 17a-7 of the 1940 Act. Any interfund trades are included within the respective purchases and sales amounts shown in the Purchases and Sales of Investments note. Interfund trades during the period are noted in the table below.
| | Purchases ($) | Sales ($) | Realized Gain (Loss) ($) |
| Fidelity Europe Fund | 1,777,727 | 5,941,171 | (2,958,040) |
6. Committed Line of Credit.
Certain Funds participate with other funds managed by the investment adviser or an affiliate in a $4.25 billion credit facility (the "line of credit") to be utilized for temporary or emergency purposes to fund shareholder redemptions or for other short-term liquidity purposes. The participating funds have agreed to pay commitment fees on their pro-rata portion of the line of credit, which are reflected in Miscellaneous expenses on the Statement of Operations, and are listed below. During the period, there were no borrowings on this line of credit.
| | Amount |
| Fidelity Europe Fund | $599 |
7. Security Lending.
Funds lend portfolio securities from time to time in order to earn additional income. Lending agents are used, including National Financial Services (NFS), an affiliate of the investment adviser. Pursuant to a securities lending agreement, NFS will receive a fee, which is capped at 9.9% of a fund's daily lending revenue, for its services as lending agent. A fund may lend securities to certain qualified borrowers, including NFS. On the settlement date of the loan, a fund receives collateral (in the form of U.S. Treasury obligations, letters of credit and/or cash) against the loaned securities and maintains collateral in an amount not less than 100% of the market value of the loaned securities during the period of the loan. The market value of the loaned securities is determined at the close of business of a fund and any additional required collateral is delivered to a fund on the next business day. A fund or borrower may terminate the loan at any time, and if the borrower defaults on its obligation to return the securities loaned because of insolvency or other reasons, a fund may apply collateral received from the borrower against the obligation. A fund may experience delays and costs in recovering the securities loaned. Any cash collateral received is invested in the Fidelity Securities Lending Cash Central Fund. Any loaned securities are identified as such in the Schedule of Investments, and the value of loaned securities and cash collateral at period end, as applicable, are presented in the Statement of Assets and Liabilities. Security lending income represents the income earned on investing cash collateral, less rebates paid to borrowers and any lending agent fees associated with the loan, plus any premium payments received for lending certain types of securities. Security lending income is presented in the Statement of Operations as a component of income from Fidelity Central Funds. Affiliated security lending activity, if any, was as follows:
| | Total Security Lending Fees Paid to NFS | Security Lending Income From Securities Loaned to NFS | Value of Securities Loaned to NFS at Period End |
| Fidelity Europe Fund | $5,838 | $- | $- |
8. Expense Reductions.
Through arrangements with each class' transfer agent, credits realized as a result of certain uninvested cash balances were used to reduce the Fund's expenses. During the period, transfer agent credits reduced each class' expenses as noted in the table below.
| | Expense reduction |
| Class A | $77 |
| Class M | 146 |
| | $223 |
In addition, during the period the investment adviser or an affiliate reimbursed and/or waived a portion of fund-level operating expenses in the amount of $14,290.
9. Distributions to Shareholders.
Distributions to shareholders of each class were as follows:
| | Six months ended April 30, 2023 | Year ended October 31, 2022 |
| Fidelity Europe Fund | | |
| Distributions to shareholders | | |
| Class A | $- | $4,275,681 |
| Class M | - | 898,902 |
| Class C | - | 639,208 |
| Europe | - | 122,299,625 |
| Class I | - | 1,583,837 |
| Class Z | - | 3,790,113 |
Total | $- | $133,487,366 |
10. Share Transactions.
Share transactions for each class were as follows and may contain in-kind transactions, automatic conversions between classes or exchanges between affiliated funds:
| | Shares | Shares | Dollars | Dollars |
| | Six months ended April 30, 2023 | Year ended October 31, 2022 | Six months ended April 30, 2023 | Year ended October 31, 2022 |
| Fidelity Europe Fund | | | | |
| Class A | | | | |
| Shares sold | 21,458 | 89,634 | $701,355 | $3,307,956 |
| Reinvestment of distributions | - | 114,063 | - | 4,203,218 |
| Shares redeemed | (103,547) | (302,699) | (3,330,782) | (9,893,172) |
| Net increase (decrease) | (82,089) | (99,002) | $(2,629,427) | $(2,381,998) |
| Class M | | | | |
| Shares sold | 1,892 | 8,884 | $60,729 | $301,526 |
| Reinvestment of distributions | - | 23,449 | - | 868,563 |
| Shares redeemed | (5,908) | (35,522) | (189,847) | (1,126,542) |
| Net increase (decrease) | (4,016) | (3,189) | $(129,118) | $43,547 |
| Class C | | | | |
| Shares sold | 4,429 | 5,167 | $141,583 | $168,904 |
| Reinvestment of distributions | - | 17,238 | - | 634,712 |
| Shares redeemed | (18,254) | (46,375) | (578,332) | (1,573,732) |
| Net increase (decrease) | (13,825) | (23,970) | $(436,749) | $(770,116) |
| Europe | | | | |
| Shares sold | 620,306 | 1,206,003 | $20,038,984 | $40,801,820 |
| Reinvestment of distributions | - | 3,093,089 | - | 113,578,213 |
| Shares redeemed | (1,536,714) | (5,107,735) | (48,593,953) | (176,296,705) |
| Net increase (decrease) | (916,408) | (808,643) | $(28,554,969) | $(21,916,672) |
| Class I | | | | |
| Shares sold | 69,591 | 42,946 | $2,309,062 | $1,701,289 |
| Reinvestment of distributions | - | 41,688 | - | 1,530,795 |
| Shares redeemed | (45,907) | (241,861) | (1,434,540) | (8,753,022) |
| Net increase (decrease) | 23,684 | (157,227) | $874,522 | $(5,520,938) |
| Class Z | | | | |
| Shares sold | 7,625 | 91,178 | $247,444 | $3,170,475 |
| Reinvestment of distributions | - | 99,611 | - | 3,642,775 |
| Shares redeemed | (3,979) | (751,739) | (127,165) | (21,135,524) |
| Net increase (decrease) | 3,646 | (560,950) | $120,279 | $(14,322,274) |
11. Other.
A fund's organizational documents provide former and current trustees and officers with a limited indemnification against liabilities arising in connection with the performance of their duties to the fund. In the normal course of business, a fund may also enter into contracts that provide general indemnifications. A fund's maximum exposure under these arrangements is unknown as this would be dependent on future claims that may be made against a fund. The risk of material loss from such claims is considered remote.
12. Risk and Uncertainties.
Many factors affect a fund's performance. Developments that disrupt global economies and financial markets, such as pandemics, epidemics, outbreaks of infectious diseases, war, terrorism, and environmental disasters, may significantly affect a fund's investment performance. The effects of these developments to a fund will be impacted by the types of securities in which a fund invests, the financial condition, industry, economic sector, and geographic location of an issuer, and a fund's level of investment in the securities of that issuer. Significant concentrations in security types, issuers, industries, sectors, and geographic locations may magnify the factors that affect a fund's performance.
Top Holdings (% of Fund's net assets) |
| |
| Sony Group Corp. (Household Durables) | 4.7 | |
| Sumitomo Mitsui Financial Group, Inc. (Banks) | 4.6 | |
| Hoya Corp. (Health Care Equipment & Supplies) | 3.9 | |
| Hitachi Ltd. (Industrial Conglomerates) | 3.7 | |
| DENSO Corp. (Automobile Components) | 3.3 | |
| ORIX Corp. (Financial Services) | 3.2 | |
| Renesas Electronics Corp. (Semiconductors & Semiconductor Equipment) | 3.2 | |
| Tokio Marine Holdings, Inc. (Insurance) | 2.9 | |
| Shin-Etsu Chemical Co. Ltd. (Chemicals) | 2.6 | |
| INPEX Corp. (Oil, Gas & Consumable Fuels) | 2.5 | |
| | 34.6 | |
| |
| Market Sectors (% of Fund's net assets) |
| |
| Information Technology | 17.4 | |
| Industrials | 17.4 | |
| Consumer Discretionary | 17.1 | |
| Financials | 11.8 | |
| Health Care | 9.4 | |
| Materials | 7.3 | |
| Communication Services | 5.8 | |
| Consumer Staples | 5.5 | |
| Energy | 2.9 | |
| Real Estate | 1.4 | |
| Utilities | 1.3 | |
| |
Asset Allocation (% of Fund's net assets) |
|
|
Geographic Diversification (% of Fund's net assets) |
|
* Includes Short-Term investments and Net Other Assets (Liabilities). Percentages are adjusted for the effect of derivatives, if applicable. |
| |
Fidelity® Japan Fund
Showing Percentage of Net Assets
| Common Stocks - 97.3% |
| | | Shares | Value ($) |
| COMMUNICATION SERVICES - 5.8% | | | |
| Diversified Telecommunication Services - 1.1% | | | |
| JTOWER, Inc. (a) | | 165,600 | 7,141,744 |
| Entertainment - 1.4% | | | |
| Capcom Co. Ltd. | | 61,500 | 2,311,023 |
| Daiichikosho Co. Ltd. | | 369,000 | 6,615,512 |
| | | | 8,926,535 |
| Interactive Media & Services - 1.8% | | | |
| Hypebeast Ltd. (a) | | 16,722,500 | 628,778 |
| Kakaku.com, Inc. | | 389,900 | 5,364,526 |
| Z Holdings Corp. | | 1,944,000 | 5,325,085 |
| | | | 11,318,389 |
| Media - 0.2% | | | |
| ValueCommerce Co. Ltd. | | 116,800 | 1,131,369 |
| Wireless Telecommunication Services - 1.3% | | | |
| SoftBank Group Corp. | | 231,700 | 8,689,311 |
TOTAL COMMUNICATION SERVICES | | | 37,207,348 |
| CONSUMER DISCRETIONARY - 17.1% | | | |
| Automobile Components - 4.1% | | | |
| DENSO Corp. | | 352,600 | 21,284,209 |
| Koito Manufacturing Co. Ltd. | | 256,800 | 4,967,400 |
| | | | 26,251,609 |
| Automobiles - 2.1% | | | |
| Isuzu Motors Ltd. | | 503,400 | 5,944,662 |
| Suzuki Motor Corp. | | 217,400 | 7,580,407 |
| | | | 13,525,069 |
| Broadline Retail - 0.8% | | | |
| Pan Pacific International Holdings Ltd. | | 293,200 | 5,479,008 |
| Hotels, Restaurants & Leisure - 0.9% | | | |
| Curves Holdings Co. Ltd. | | 576,700 | 3,362,245 |
| Kyoritsu Maintenance Co. Ltd. | | 62,500 | 2,522,883 |
| | | | 5,885,128 |
| Household Durables - 6.1% | | | |
| Chervon Holdings Ltd. | | 381,500 | 1,941,405 |
| Open House Group Co. Ltd. | | 172,000 | 6,875,313 |
| Sony Group Corp. | | 337,300 | 30,516,796 |
| | | | 39,333,514 |
| Leisure Products - 0.7% | | | |
| Roland Corp. | | 147,700 | 4,427,438 |
| Specialty Retail - 2.4% | | | |
| Fast Retailing Co. Ltd. | | 40,000 | 9,472,065 |
| ZOZO, Inc. | | 271,200 | 5,707,230 |
| | | | 15,179,295 |
TOTAL CONSUMER DISCRETIONARY | | | 110,081,061 |
| CONSUMER STAPLES - 5.5% | | | |
| Consumer Staples Distribution & Retail - 4.2% | | | |
| Nishimoto Co. Ltd. | | 137,900 | 3,928,331 |
| Seven & i Holdings Co. Ltd. | | 327,100 | 14,823,338 |
| Sugi Holdings Co. Ltd. | | 50,700 | 2,150,940 |
| Tsuruha Holdings, Inc. | | 49,900 | 3,268,237 |
| Welcia Holdings Co. Ltd. | | 142,300 | 2,979,344 |
| | | | 27,150,190 |
| Personal Care Products - 1.3% | | | |
| Shiseido Co. Ltd. | | 165,100 | 8,275,769 |
TOTAL CONSUMER STAPLES | | | 35,425,959 |
| ENERGY - 2.9% | | | |
| Oil, Gas & Consumable Fuels - 2.9% | | | |
| Idemitsu Kosan Co. Ltd. | | 125,500 | 2,672,277 |
| INPEX Corp. | | 1,489,700 | 16,301,866 |
| | | | 18,974,143 |
| FINANCIALS - 11.8% | | | |
| Banks - 4.6% | | | |
| Sumitomo Mitsui Financial Group, Inc. | | 727,800 | 29,747,834 |
| Capital Markets - 0.5% | | | |
| SBI Holdings, Inc. Japan | | 155,200 | 3,031,174 |
| Financial Services - 3.2% | | | |
| ORIX Corp. | | 1,221,800 | 20,785,901 |
| Insurance - 3.5% | | | |
| Lifenet Insurance Co. (a) | | 454,100 | 3,957,714 |
| Tokio Marine Holdings, Inc. | | 907,200 | 18,241,101 |
| | | | 22,198,815 |
TOTAL FINANCIALS | | | 75,763,724 |
| HEALTH CARE - 9.4% | | | |
| Biotechnology - 0.2% | | | |
| PeptiDream, Inc. (a) | | 110,100 | 1,487,558 |
| Health Care Equipment & Supplies - 5.1% | | | |
| Hoya Corp. | | 236,500 | 24,798,217 |
| Olympus Corp. | | 455,700 | 7,977,674 |
| | | | 32,775,891 |
| Health Care Technology - 0.1% | | | |
| Medlive Technology Co. Ltd. (b) | | 637,500 | 705,979 |
| Pharmaceuticals - 4.0% | | | |
| Astellas Pharma, Inc. | | 859,100 | 12,941,967 |
| Daiichi Sankyo Kabushiki Kaisha | | 367,300 | 12,603,758 |
| | | | 25,545,725 |
TOTAL HEALTH CARE | | | 60,515,153 |
| INDUSTRIALS - 17.4% | | | |
| Aerospace & Defense - 0.2% | | | |
| Space Exploration Technologies Corp. Class A (a)(c)(d) | | 18,055 | 1,390,235 |
| Building Products - 1.9% | | | |
| Daikin Industries Ltd. | | 50,400 | 9,154,206 |
| Toto Ltd. | | 97,800 | 3,344,931 |
| | | | 12,499,137 |
| Ground Transportation - 0.5% | | | |
| Seibu Holdings, Inc. | | 286,100 | 3,202,140 |
| Industrial Conglomerates - 3.7% | | | |
| Hitachi Ltd. | | 433,700 | 23,989,958 |
| Machinery - 3.8% | | | |
| Minebea Mitsumi, Inc. | | 372,100 | 6,890,786 |
| Misumi Group, Inc. | | 390,960 | 9,862,829 |
| Mitsubishi Heavy Industries Ltd. | | 74,000 | 2,806,098 |
| Nabtesco Corp. | | 189,900 | 4,577,259 |
| | | | 24,136,972 |
| Professional Services - 5.9% | | | |
| Dip Corp. | | 81,700 | 2,015,709 |
| Funai Soken Holdings, Inc. | | 272,000 | 5,214,126 |
| Outsourcing, Inc. | | 424,900 | 4,328,276 |
| Persol Holdings Co. Ltd. | | 735,400 | 15,163,518 |
| SMS Co., Ltd. | | 241,900 | 5,684,675 |
| TechnoPro Holdings, Inc. | | 193,400 | 5,276,666 |
| | | | 37,682,970 |
| Trading Companies & Distributors - 1.4% | | | |
| Itochu Corp. | | 280,000 | 9,288,961 |
TOTAL INDUSTRIALS | | | 112,190,373 |
| INFORMATION TECHNOLOGY - 17.4% | | | |
| Electronic Equipment, Instruments & Components - 1.9% | | | |
| Dexerials Corp. | | 163,900 | 3,119,112 |
| Iriso Electronics Co. Ltd. | | 106,200 | 3,635,186 |
| TDK Corp. | | 160,200 | 5,507,504 |
| | | | 12,261,802 |
| IT Services - 6.9% | | | |
| Digital Hearts Holdings Co. Ltd. | | 306,492 | 3,320,594 |
| DTS Corp. | | 156,600 | 3,720,749 |
| ExaWizards, Inc. (a) | | 627,500 | 1,540,479 |
| Fujitsu Ltd. | | 106,000 | 14,127,395 |
| Net One Systems Co. Ltd. | | 188,900 | 4,453,955 |
| Nomura Research Institute Ltd. | | 226,800 | 5,706,185 |
| NSD Co. Ltd. | | 300,100 | 5,520,755 |
| Techmatrix Corp. | | 346,600 | 4,135,652 |
| TIS, Inc. | | 86,000 | 2,361,536 |
| | | | 44,887,300 |
| Semiconductors & Semiconductor Equipment - 6.1% | | | |
| Advantest Corp. | | 56,900 | 4,434,326 |
| Furuya Metal Co. Ltd. | | 5,200 | 345,483 |
| Renesas Electronics Corp. (a) | | 1,582,200 | 20,619,941 |
| ROHM Co. Ltd. | | 85,000 | 6,399,496 |
| Sumco Corp. | | 529,600 | 7,293,469 |
| | | | 39,092,715 |
| Software - 0.9% | | | |
| Appier Group, Inc. (a) | | 76,600 | 869,847 |
| Money Forward, Inc. (a) | | 118,800 | 4,947,348 |
| | | | 5,817,195 |
| Technology Hardware, Storage & Peripherals - 1.6% | | | |
| FUJIFILM Holdings Corp. | | 195,600 | 10,194,667 |
TOTAL INFORMATION TECHNOLOGY | | | 112,253,679 |
| MATERIALS - 7.3% | | | |
| Chemicals - 7.3% | | | |
| JSR Corp. | | 382,200 | 8,868,358 |
| Kansai Paint Co. Ltd. | | 389,500 | 5,491,164 |
| Nippon Sanso Holdings Corp. | | 238,000 | 4,294,159 |
| Nissan Chemical Corp. | | 64,500 | 2,866,512 |
| NOF Corp. | | 90,400 | 4,130,508 |
| Shin-Etsu Chemical Co. Ltd. | | 577,500 | 16,479,437 |
| Tokyo Ohka Kogyo Co. Ltd. | | 87,300 | 4,557,342 |
| | | | 46,687,480 |
| REAL ESTATE - 1.4% | | | |
| Real Estate Management & Development - 1.4% | | | |
| Relo Group, Inc. | | 588,300 | 9,145,940 |
| UTILITIES - 1.3% | | | |
| Electric Utilities - 1.3% | | | |
| Kansai Electric Power Co., Inc. | | 760,800 | 8,212,620 |
| TOTAL COMMON STOCKS (Cost $519,241,356) | | | 626,457,480 |
| | | | |
| Money Market Funds - 0.2% |
| | | Shares | Value ($) |
Fidelity Cash Central Fund 4.88% (e) (Cost $1,569,567) | | 1,569,253 | 1,569,567 |
| | | | |
| TOTAL INVESTMENT IN SECURITIES - 97.5% (Cost $520,810,923) | 628,027,047 |
NET OTHER ASSETS (LIABILITIES) - 2.5% | 15,897,700 |
| NET ASSETS - 100.0% | 643,924,747 |
| | |
Legend
| (b) | Security exempt from registration under Rule 144A of the Securities Act of 1933. These securities may be resold in transactions exempt from registration, normally to qualified institutional buyers. At the end of the period, the value of these securities amounted to $705,979 or 0.1% of net assets. |
| (c) | Restricted securities (including private placements) - Investment in securities not registered under the Securities Act of 1933 (excluding 144A issues). At the end of the period, the value of restricted securities (excluding 144A issues) amounted to $1,390,235 or 0.2% of net assets. |
| (e) | Affiliated fund that is generally available only to investment companies and other accounts managed by Fidelity Investments. The rate quoted is the annualized seven-day yield of the fund at period end. A complete unaudited listing of the fund's holdings as of its most recent quarter end is available upon request. In addition, each Fidelity Central Fund's financial statements are available on the SEC's website or upon request. |
| Additional information on each restricted holding is as follows: |
| Security | Acquisition Date | Acquisition Cost ($) |
| Space Exploration Technologies Corp. Class A | 2/16/21 - 5/24/22 | 1,151,846 |
| | | |
Affiliated Central Funds
Fiscal year to date information regarding the Fund's investments in Fidelity Central Funds, including the ownership percentage, is presented below.
| Affiliate | Value, beginning of period ($) | Purchases ($) | Sales Proceeds ($) | Dividend Income ($) | Realized Gain (loss) ($) | Change in Unrealized appreciation (depreciation) ($) | Value, end of period ($) | % ownership, end of period |
| Fidelity Cash Central Fund 4.88% | 1,141,639 | 27,677,981 | 27,250,053 | 21,080 | - | - | 1,569,567 | 0.0% |
| Fidelity Securities Lending Cash Central Fund 4.88% | 2,829,335 | 42,981,118 | 45,810,453 | 10,838 | - | - | - | 0.0% |
| Total | 3,970,974 | 70,659,099 | 73,060,506 | 31,918 | - | - | 1,569,567 | |
| | | | | | | | | |
Amounts in the dividend income column in the above table include any capital gain distributions from underlying funds, which are presented in the corresponding line item in the Statement of Operations, if applicable.
Amounts in the dividend income column for Fidelity Securities Lending Cash Central Fund represents the income earned on investing cash collateral, less rebates paid to borrowers and any lending agent fees associated with the loan, plus any premium payments received for lending certain types of securities.
Amounts included in the purchases and sales proceeds columns may include in-kind transactions, if applicable.
Investment Valuation
The following is a summary of the inputs used, as of April 30, 2023, involving the Fund's assets and liabilities carried at fair value. The inputs or methodology used for valuing securities may not be an indication of the risk associated with investing in those securities. For more information on valuation inputs, and their aggregation into the levels used below, please refer to the Investment Valuation section in the accompanying Notes to Financial Statements.
| Valuation Inputs at Reporting Date: |
| Description | Total ($) | Level 1 ($) | Level 2 ($) | Level 3 ($) |
Investments in Securities: | | | | |
|
| Equities: | | | | |
Communication Services | 37,207,348 | - | 37,207,348 | - |
Consumer Discretionary | 110,081,061 | - | 110,081,061 | - |
Consumer Staples | 35,425,959 | - | 35,425,959 | - |
Energy | 18,974,143 | - | 18,974,143 | - |
Financials | 75,763,724 | - | 75,763,724 | - |
Health Care | 60,515,153 | - | 60,515,153 | - |
Industrials | 112,190,373 | - | 110,800,138 | 1,390,235 |
Information Technology | 112,253,679 | - | 112,253,679 | - |
Materials | 46,687,480 | - | 46,687,480 | - |
Real Estate | 9,145,940 | - | 9,145,940 | - |
Utilities | 8,212,620 | - | 8,212,620 | - |
|
| Money Market Funds | 1,569,567 | 1,569,567 | - | - |
| Total Investments in Securities: | 628,027,047 | 1,569,567 | 625,067,245 | 1,390,235 |
Fidelity® Japan Fund
| Statement of Assets and Liabilities |
| | | | April 30, 2023 (Unaudited) |
| | | | | |
| Assets | | | | |
| Investment in securities, at value - See accompanying schedule: | | | | |
Unaffiliated issuers (cost $519,241,356) | $ | 626,457,480 | | |
Fidelity Central Funds (cost $1,569,567) | | 1,569,567 | | |
| | | | | |
| | | | | |
| Total Investment in Securities (cost $520,810,923) | | | $ | 628,027,047 |
| Foreign currency held at value (cost $12,441,744) | | | | 12,242,243 |
| Receivable for fund shares sold | | | | 176,093 |
| Dividends receivable | | | | 5,066,287 |
| Interest receivable | | | | 364 |
| Distributions receivable from Fidelity Central Funds | | | | 6,415 |
| Prepaid expenses | | | | 238 |
Total assets | | | | 645,518,687 |
| Liabilities | | | | |
| Payable for investments purchased | $ | 1,014,052 | | |
| Payable for fund shares redeemed | | 49,903 | | |
| Accrued management fee | | 409,816 | | |
| Distribution and service plan fees payable | | 5,802 | | |
| Other affiliated payables | | 72,713 | | |
| Other payables and accrued expenses | | 41,654 | | |
| Total Liabilities | | | | 1,593,940 |
| Net Assets | | | $ | 643,924,747 |
| Net Assets consist of: | | | | |
| Paid in capital | | | $ | 545,246,197 |
| Total accumulated earnings (loss) | | | | 98,678,550 |
| Net Assets | | | $ | 643,924,747 |
| | | | | |
| Net Asset Value and Maximum Offering Price | | | | |
| Class A : | | | | |
Net Asset Value and redemption price per share ($14,431,524 ÷ 943,136 shares) (a) | | | $ | 15.30 |
| Maximum offering price per share (100/94.25 of $15.30) | | | $ | 16.23 |
| Class M : | | | | |
Net Asset Value and redemption price per share ($2,545,178 ÷ 167,523 shares) (a) | | | $ | 15.19 |
| Maximum offering price per share (100/96.50 of $15.19) | | | $ | 15.74 |
| Class C : | | | | |
Net Asset Value and offering price per share ($1,973,157 ÷ 132,029 shares) (a) | | | $ | 14.94 |
| Japan : | | | | |
Net Asset Value , offering price and redemption price per share ($142,549,341 ÷ 9,244,397 shares) | | | $ | 15.42 |
| Class I : | | | | |
Net Asset Value , offering price and redemption price per share ($32,907,380 ÷ 2,116,987 shares) | | | $ | 15.54 |
| Class Z : | | | | |
Net Asset Value , offering price and redemption price per share ($449,518,167 ÷ 29,209,281 shares) | | | $ | 15.39 |
(a)Redemption price per share is equal to net asset value less any applicable contingent deferred sales charge. |
| Statement of Operations |
| | | | Six months ended April 30, 2023 (Unaudited) |
| Investment Income | | | | |
| Dividends | | | $ | 6,907,401 |
| Income from Fidelity Central Funds (including $10,838 from security lending) | | | | 31,918 |
| Income before foreign taxes withheld | | | $ | 6,939,319 |
| Less foreign taxes withheld | | | | (690,740) |
| Total Income | | | | 6,248,579 |
| Expenses | | | | |
| Management fee | | | | |
| Basic fee | $ | 2,090,923 | | |
| Performance adjustment | | 387,368 | | |
| Transfer agent fees | | 275,141 | | |
| Distribution and service plan fees | | 35,161 | | |
| Accounting fees | | 147,861 | | |
| Custodian fees and expenses | | 14,884 | | |
| Independent trustees' fees and expenses | | 1,979 | | |
| Registration fees | | 65,349 | | |
| Audit | | 33,112 | | |
| Legal | | 469 | | |
| Interest | | 15,104 | | |
| Miscellaneous | | 1,314 | | |
| Total expenses before reductions | | 3,068,665 | | |
| Expense reductions | | (14,780) | | |
| Total expenses after reductions | | | | 3,053,885 |
| Net Investment income (loss) | | | | 3,194,694 |
| Realized and Unrealized Gain (Loss) | | | | |
| Net realized gain (loss) on: | | | | |
| Investment Securities: | | | | |
| Unaffiliated issuers | | 9,512,117 | | |
| Foreign currency transactions | | 1,339,500 | | |
| Total net realized gain (loss) | | | | 10,851,617 |
| Change in net unrealized appreciation (depreciation) on: | | | | |
| Investment Securities: | | | | |
| Unaffiliated issuers | | 73,081,881 | | |
| Assets and liabilities in foreign currencies | | (163,464) | | |
| Total change in net unrealized appreciation (depreciation) | | | | 72,918,417 |
| Net gain (loss) | | | | 83,770,034 |
| Net increase (decrease) in net assets resulting from operations | | | $ | 86,964,728 |
| Statement of Changes in Net Assets |
| |
| | Six months ended April 30, 2023 (Unaudited) | | Year ended October 31, 2022 |
| Increase (Decrease) in Net Assets | | | | |
| Operations | | | | |
| Net investment income (loss) | $ | 3,194,694 | $ | 4,298,398 |
| Net realized gain (loss) | | 10,851,617 | | (11,275,330) |
| Change in net unrealized appreciation (depreciation) | | 72,918,417 | | (232,721,817) |
| Net increase (decrease) in net assets resulting from operations | | 86,964,728 | | (239,698,749) |
| Distributions to shareholders | | - | | (85,697,627) |
| Share transactions - net increase (decrease) | | (15,273,144) | | 66,247,709 |
| Total increase (decrease) in net assets | | 71,691,584 | | (259,148,667) |
| | | | | |
| Net Assets | | | | |
| Beginning of period | | 572,233,163 | | 831,381,830 |
| End of period | $ | 643,924,747 | $ | 572,233,163 |
| | | | | |
| | | | | |
Financial Highlights
| Fidelity Advisor® Japan Fund Class A |
| |
| | Six months ended (Unaudited) April 30, 2023 | | Years ended October 31, 2022 | | 2021 | | 2020 | | 2019 | | 2018 |
Selected Per-Share Data | | | | | | | | | | | | |
| Net asset value, beginning of period | $ | 13.26 | $ | 20.90 | $ | 17.50 | $ | 15.80 | $ | 14.15 | $ | 15.08 |
| Income from Investment Operations | | | | | | | | | | | | |
Net investment income (loss) A,B | | .05 | | .04 | | .02 | | .05 | | .07 | | .03 |
| Net realized and unrealized gain (loss) | | 1.99 | | (5.58) | | 3.71 | | 1.81 | | 1.58 | | (.85) |
| Total from investment operations | | 2.04 | | (5.54) | | 3.73 | | 1.86 | | 1.65 | | (.82) |
| Distributions from net investment income | | - | | (.55) | | (.07) | | (.07) | | - | | (.08) |
| Distributions from net realized gain | | - | | (1.55) | | (.25) | | (.09) | | - | | (.04) |
| Total distributions | | - | | (2.10) | | (.33) C | | (.16) | | - | | (.11) C |
Redemption fees added to paid in capital A | | - | | - | | - | | - | | - | | - D |
| Net asset value, end of period | $ | 15.30 | $ | 13.26 | $ | 20.90 | $ | 17.50 | $ | 15.80 | $ | 14.15 |
Total Return E,F,G | | 15.38% | | (29.38)% | | 21.42% | | 11.85% | | 11.66% | | (5.48)% |
Ratios to Average Net Assets B,H,I | | | | | | | | | | | | |
| Expenses before reductions | | 1.36% J | | 1.39% | | 1.38% | | 1.37% | | 1.33% | | 1.33% |
| Expenses net of fee waivers, if any | | 1.36% J | | 1.39% | | 1.38% | | 1.37% | | 1.32% | | 1.33% |
| Expenses net of all reductions | | 1.36% J | | 1.39% | | 1.38% | | 1.37% | | 1.32% | | 1.32% |
| Net investment income (loss) | | .66% J | | .26% | | .08% | | .35% | | .51% | | .17% |
| Supplemental Data | | | | | | | | | | | | |
| Net assets, end of period (000 omitted) | $ | 14,432 | $ | 13,004 | $ | 20,357 | $ | 16,181 | $ | 16,069 | $ | 14,587 |
Portfolio turnover rate K | | 19% J | | 26% | | 31% | | 22% | | 27% | | 40% |
A Calculated based on average shares outstanding during the period.
B Net investment income (loss) is affected by the timing of the declaration of dividends by any underlying mutual funds or exchange-traded funds (ETFs). Net investment income (loss) of any mutual funds or ETFs is not included in the Fund's net investment income (loss) ratio.
C Total distributions per share do not sum due to rounding.
D Amount represents less than $.005 per share.
E Total returns for periods of less than one year are not annualized.
F Total returns would have been lower if certain expenses had not been reduced during the applicable periods shown.
G Total returns do not include the effect of the sales charges.
H Fees and expenses of any underlying mutual funds or exchange-traded funds (ETFs) are not included in the Fund's expense ratio. The Fund indirectly bears its proportionate share of these expenses. For additional expense information related to investments in Fidelity Central Funds, please refer to the "Investments in Fidelity Central Funds" note found in the Notes to Financial Statements section of the most recent Annual or Semi-Annual report.
I Expense ratios reflect operating expenses of the class. Expenses before reductions do not reflect amounts reimbursed, waived, or reduced through arrangements with the investment adviser, brokerage services, or other offset arrangements, if applicable, and do not represent the amount paid by the class during periods when reimbursements, waivers or reductions occur.
J Annualized.
K Amount does not include the portfolio activity of any underlying mutual funds or exchange-traded funds (ETFs).
| Fidelity Advisor® Japan Fund Class M |
| |
| | Six months ended (Unaudited) April 30, 2023 | | Years ended October 31, 2022 | | 2021 | | 2020 | | 2019 | | 2018 |
Selected Per-Share Data | | | | | | | | | | | | |
| Net asset value, beginning of period | $ | 13.19 | $ | 20.76 | $ | 17.40 | $ | 15.71 | $ | 14.11 | $ | 15.06 |
| Income from Investment Operations | | | | | | | | | | | | |
Net investment income (loss) A,B | | .03 | | (.01) | | (.05) | | .01 | | .03 | | (.03) |
| Net realized and unrealized gain (loss) | | 1.97 | | (5.55) | | 3.69 | | 1.80 | | 1.57 | | (.84) |
| Total from investment operations | | 2.00 | | (5.56) | | 3.64 | | 1.81 | | 1.60 | | (.87) |
| Distributions from net investment income | | - | | (.46) | | (.02) | | (.03) | | - | | (.05) |
| Distributions from net realized gain | | - | | (1.55) | | (.25) | | (.09) | | - | | (.04) |
| Total distributions | | - | | (2.01) | | (.28) C | | (.12) | | - | | (.08) C |
Redemption fees added to paid in capital A | | - | | - | | - | | - | | - | | - D |
| Net asset value, end of period | $ | 15.19 | $ | 13.19 | $ | 20.76 | $ | 17.40 | $ | 15.71 | $ | 14.11 |
Total Return E,F,G | | 15.16% | | (29.55)% | | 21.00% | | 11.55% | | 11.34% | | (5.81)% |
Ratios to Average Net Assets B,H,I | | | | | | | | | | | | |
| Expenses before reductions | | 1.65% J | | 1.69% | | 1.70% | | 1.67% | | 1.64% | | 1.67% |
| Expenses net of fee waivers, if any | | 1.65% J | | 1.69% | | 1.70% | | 1.67% | | 1.64% | | 1.67% |
| Expenses net of all reductions | | 1.62% J | | 1.69% | | 1.70% | | 1.67% | | 1.63% | | 1.66% |
| Net investment income (loss) | | .40% J | | (.04)% | | (.23)% | | .04% | | .19% | | (.17)% |
| Supplemental Data | | | | | | | | | | | | |
| Net assets, end of period (000 omitted) | $ | 2,545 | $ | 2,282 | $ | 3,919 | $ | 3,728 | $ | 3,945 | $ | 3,993 |
Portfolio turnover rate K | | 19% J | | 26% | | 31% | | 22% | | 27% | | 40% |
A Calculated based on average shares outstanding during the period.
B Net investment income (loss) is affected by the timing of the declaration of dividends by any underlying mutual funds or exchange-traded funds (ETFs). Net investment income (loss) of any mutual funds or ETFs is not included in the Fund's net investment income (loss) ratio.
C Total distributions per share do not sum due to rounding.
D Amount represents less than $.005 per share.
E Total returns for periods of less than one year are not annualized.
F Total returns would have been lower if certain expenses had not been reduced during the applicable periods shown.
G Total returns do not include the effect of the sales charges.
H Fees and expenses of any underlying mutual funds or exchange-traded funds (ETFs) are not included in the Fund's expense ratio. The Fund indirectly bears its proportionate share of these expenses. For additional expense information related to investments in Fidelity Central Funds, please refer to the "Investments in Fidelity Central Funds" note found in the Notes to Financial Statements section of the most recent Annual or Semi-Annual report.
I Expense ratios reflect operating expenses of the class. Expenses before reductions do not reflect amounts reimbursed, waived, or reduced through arrangements with the investment adviser, brokerage services, or other offset arrangements, if applicable, and do not represent the amount paid by the class during periods when reimbursements, waivers or reductions occur.
J Annualized.
K Amount does not include the portfolio activity of any underlying mutual funds or exchange-traded funds (ETFs).
| Fidelity Advisor® Japan Fund Class C |
| |
| | Six months ended (Unaudited) April 30, 2023 | | Years ended October 31, 2022 | | 2021 | | 2020 | | 2019 | | 2018 |
Selected Per-Share Data | | | | | | | | | | | | |
| Net asset value, beginning of period | $ | 13.00 | $ | 20.43 | $ | 17.17 | $ | 15.49 | $ | 13.97 | $ | 14.92 |
| Income from Investment Operations | | | | | | | | | | | | |
Net investment income (loss) A,B | | - C | | (.07) | | (.12) | | (.05) | | (.02) | | (.08) |
| Net realized and unrealized gain (loss) | | 1.94 | | (5.49) | | 3.63 | | 1.77 | | 1.54 | | (.83) |
| Total from investment operations | | 1.94 | | (5.56) | | 3.51 | | 1.72 | | 1.52 | | (.91) |
| Distributions from net investment income | | - | | (.33) | | (.01) | | - | | - | | - C |
| Distributions from net realized gain | | - | | (1.55) | | (.25) | | (.04) | | - | | (.04) |
| Total distributions | | - | | (1.87) D | | (.25) D | | (.04) | | - | | (.04) |
Redemption fees added to paid in capital A | | - | | - | | - | | - | | - | | - C |
| Net asset value, end of period | $ | 14.94 | $ | 13.00 | $ | 20.43 | $ | 17.17 | $ | 15.49 | $ | 13.97 |
Total Return E,F,G | | 14.92% | | (29.85)% | | 20.54% | | 11.09% | | 10.88% | | (6.13)% |
Ratios to Average Net Assets B,H,I | | | | | | | | | | | | |
| Expenses before reductions | | 2.07% J | | 2.11% | | 2.09% | | 2.06% | | 2.01% | | 2.04% |
| Expenses net of fee waivers, if any | | 2.07% J | | 2.10% | | 2.09% | | 2.05% | | 2.00% | | 2.03% |
| Expenses net of all reductions | | 2.07% J | | 2.10% | | 2.09% | | 2.05% | | 2.00% | | 2.03% |
| Net investment income (loss) | | (.04)% J | | (.46)% | | (.63)% | | (.34)% | | (.17)% | | (.53)% |
| Supplemental Data | | | | | | | | | | | | |
| Net assets, end of period (000 omitted) | $ | 1,973 | $ | 2,179 | $ | 4,778 | $ | 6,167 | $ | 8,829 | $ | 12,586 |
Portfolio turnover rate K | | 19% J | | 26% | | 31% | | 22% | | 27% | | 40% |
A Calculated based on average shares outstanding during the period.
B Net investment income (loss) is affected by the timing of the declaration of dividends by any underlying mutual funds or exchange-traded funds (ETFs). Net investment income (loss) of any mutual funds or ETFs is not included in the Fund's net investment income (loss) ratio.
C Amount represents less than $.005 per share.
D Total distributions per share do not sum due to rounding.
E Total returns for periods of less than one year are not annualized.
F Total returns would have been lower if certain expenses had not been reduced during the applicable periods shown.
G Total returns do not include the effect of the contingent deferred sales charge.
H Fees and expenses of any underlying mutual funds or exchange-traded funds (ETFs) are not included in the Fund's expense ratio. The Fund indirectly bears its proportionate share of these expenses. For additional expense information related to investments in Fidelity Central Funds, please refer to the "Investments in Fidelity Central Funds" note found in the Notes to Financial Statements section of the most recent Annual or Semi-Annual report.
I Expense ratios reflect operating expenses of the class. Expenses before reductions do not reflect amounts reimbursed, waived, or reduced through arrangements with the investment adviser, brokerage services, or other offset arrangements, if applicable, and do not represent the amount paid by the class during periods when reimbursements, waivers or reductions occur.
J Annualized.
K Amount does not include the portfolio activity of any underlying mutual funds or exchange-traded funds (ETFs).
| | Six months ended (Unaudited) April 30, 2023 | | Years ended October 31, 2022 | | 2021 | | 2020 | | 2019 | | 2018 |
Selected Per-Share Data | | | | | | | | | | | | |
| Net asset value, beginning of period | $ | 13.35 | $ | 21.01 | $ | 17.58 | $ | 15.86 | $ | 14.20 | $ | 15.13 |
| Income from Investment Operations | | | | | | | | | | | | |
Net investment income (loss) A,B | | .07 | | .08 | | .08 | | .10 | | .12 | | .07 |
| Net realized and unrealized gain (loss) | | 2.00 | | (5.60) | | 3.72 | | 1.81 | | 1.59 | | (.86) |
| Total from investment operations | | 2.07 | | (5.52) | | 3.80 | | 1.91 | | 1.71 | | (.79) |
| Distributions from net investment income | | - | | (.59) | | (.11) | | (.11) | | (.05) | | (.11) |
| Distributions from net realized gain | | - | | (1.55) | | (.25) | | (.09) | | - | | (.04) |
| Total distributions | | - | | (2.14) | | (.37) C | | (.19) C | | (.05) | | (.14) C |
Redemption fees added to paid in capital A | | - | | - | | - | | - | | - | | - D |
| Net asset value, end of period | $ | 15.42 | $ | 13.35 | $ | 21.01 | $ | 17.58 | $ | 15.86 | $ | 14.20 |
Total Return E,F | | 15.51% | | (29.16)% | | 21.75% | | 12.16% | | 12.10% | | (5.28)% |
Ratios to Average Net Assets B,G,H | | | | | | | | | | | | |
| Expenses before reductions | | 1.10% I | | 1.13% | | 1.09% | | 1.06% | | 1.01% | | 1.05% |
| Expenses net of fee waivers, if any | | 1.09% I | | 1.12% | | 1.09% | | 1.06% | | 1.01% | | 1.05% |
| Expenses net of all reductions | | 1.09% I | | 1.12% | | 1.09% | | 1.06% | | 1.00% | | 1.04% |
| Net investment income (loss) | | .93% I | | .52% | | .37% | | .65% | | .82% | | .45% |
| Supplemental Data | | | | | | | | | | | | |
| Net assets, end of period (000 omitted) | $ | 142,549 | $ | 113,015 | $ | 167,954 | $ | 274,433 | $ | 401,344 | $ | 297,644 |
Portfolio turnover rate J | | 19% I | | 26% | | 31% | | 22% | | 27% | | 40% |
A Calculated based on average shares outstanding during the period.
B Net investment income (loss) is affected by the timing of the declaration of dividends by any underlying mutual funds or exchange-traded funds (ETFs). Net investment income (loss) of any mutual funds or ETFs is not included in the Fund's net investment income (loss) ratio.
C Total distributions per share do not sum due to rounding.
D Amount represents less than $.005 per share.
E Total returns for periods of less than one year are not annualized.
F Total returns would have been lower if certain expenses had not been reduced during the applicable periods shown.
G Fees and expenses of any underlying mutual funds or exchange-traded funds (ETFs) are not included in the Fund's expense ratio. The Fund indirectly bears its proportionate share of these expenses. For additional expense information related to investments in Fidelity Central Funds, please refer to the "Investments in Fidelity Central Funds" note found in the Notes to Financial Statements section of the most recent Annual or Semi-Annual report.
H Expense ratios reflect operating expenses of the class. Expenses before reductions do not reflect amounts reimbursed, waived, or reduced through arrangements with the investment adviser, brokerage services, or other offset arrangements, if applicable, and do not represent the amount paid by the class during periods when reimbursements, waivers or reductions occur.
I Annualized.
J Amount does not include the portfolio activity of any underlying mutual funds or exchange-traded funds (ETFs).
| Fidelity Advisor® Japan Fund Class I |
| |
| | Six months ended (Unaudited) April 30, 2023 | | Years ended October 31, 2022 | | 2021 | | 2020 | | 2019 | | 2018 |
Selected Per-Share Data | | | | | | | | | | | | |
| Net asset value, beginning of period | $ | 13.45 | $ | 20.97 | $ | 17.56 | $ | 15.85 | $ | 14.18 | $ | 15.12 |
| Income from Investment Operations | | | | | | | | | | | | |
Net investment income (loss) A,B | | .07 | | .09 | | .09 | | .11 | | .13 | | .08 |
| Net realized and unrealized gain (loss) | | 2.02 | | (5.65) | | 3.71 | | 1.81 | | 1.58 | | (.85) |
| Total from investment operations | | 2.09 | | (5.56) | | 3.80 | | 1.92 | | 1.71 | | (.77) |
| Distributions from net investment income | | - | | (.41) | | (.14) | | (.12) | | (.04) | | (.14) |
| Distributions from net realized gain | | - | | (1.55) | | (.25) | | (.09) | | - | | (.04) |
| Total distributions | | - | | (1.96) | | (.39) | | (.21) | | (.04) | | (.17) C |
Redemption fees added to paid in capital A | | - | | - | | - | | - | | - | | - D |
| Net asset value, end of period | $ | 15.54 | $ | 13.45 | $ | 20.97 | $ | 17.56 | $ | 15.85 | $ | 14.18 |
Total Return E,F | | 15.54% | | (29.15)% | | 21.80% | | 12.20% | | 12.12% | | (5.18)% |
Ratios to Average Net Assets B,G,H | | | | | | | | | | | | |
| Expenses before reductions | | 1.08% I | | 1.09% | | 1.04% | | 1.01% | | .96% | | .98% |
| Expenses net of fee waivers, if any | | 1.07% I | | 1.09% | | 1.04% | | 1.01% | | .96% | | .98% |
| Expenses net of all reductions | | 1.07% I | | 1.09% | | 1.04% | | 1.00% | | .95% | | .97% |
| Net investment income (loss) | | .95% I | | .56% | | .43% | | .71% | | .87% | | .52% |
| Supplemental Data | | | | | | | | | | | | |
| Net assets, end of period (000 omitted) | $ | 32,907 | $ | 33,320 | $ | 48,887 | $ | 473,859 | $ | 319,164 | $ | 192,555 |
Portfolio turnover rate J | | 19% I | | 26% | | 31% | | 22% | | 27% | | 40% |
A Calculated based on average shares outstanding during the period.
B Net investment income (loss) is affected by the timing of the declaration of dividends by any underlying mutual funds or exchange-traded funds (ETFs). Net investment income (loss) of any mutual funds or ETFs is not included in the Fund's net investment income (loss) ratio.
C Total distributions per share do not sum due to rounding.
D Amount represents less than $.005 per share.
E Total returns for periods of less than one year are not annualized.
F Total returns would have been lower if certain expenses had not been reduced during the applicable periods shown.
G Fees and expenses of any underlying mutual funds or exchange-traded funds (ETFs) are not included in the Fund's expense ratio. The Fund indirectly bears its proportionate share of these expenses. For additional expense information related to investments in Fidelity Central Funds, please refer to the "Investments in Fidelity Central Funds" note found in the Notes to Financial Statements section of the most recent Annual or Semi-Annual report.
H Expense ratios reflect operating expenses of the class. Expenses before reductions do not reflect amounts reimbursed, waived, or reduced through arrangements with the investment adviser, brokerage services, or other offset arrangements, if applicable, and do not represent the amount paid by the class during periods when reimbursements, waivers or reductions occur.
I Annualized.
J Amount does not include the portfolio activity of any underlying mutual funds or exchange-traded funds (ETFs).
| Fidelity Advisor® Japan Fund Class Z |
| |
| | Six months ended (Unaudited) April 30, 2023 | | Years ended October 31, 2022 | | 2021 | | 2020 | | 2019 | | 2018 A |
Selected Per-Share Data | | | | | | | | | | | | |
| Net asset value, beginning of period | $ | 13.31 | $ | 20.98 | $ | 17.56 | $ | 15.84 | $ | 14.19 | $ | 15.77 |
| Income from Investment Operations | | | | | | | | | | | | |
Net investment income (loss) B,C | | .08 | | .11 | | .10 | | .13 | | .14 | | (.01) |
| Net realized and unrealized gain (loss) | | 2.00 | | (5.59) | | 3.72 | | 1.81 | | 1.57 | | (1.57) |
| Total from investment operations | | 2.08 | | (5.48) | | 3.82 | | 1.94 | | 1.71 | | (1.58) |
| Distributions from net investment income | | - | | (.64) | | (.15) | | (.13) | | (.06) | | - |
| Distributions from net realized gain | | - | | (1.55) | | (.25) | | (.09) | | - | | - |
| Total distributions | | - | | (2.19) | | (.40) | | (.22) | | (.06) | | - |
| Net asset value, end of period | $ | 15.39 | $ | 13.31 | $ | 20.98 | $ | 17.56 | $ | 15.84 | $ | 14.19 |
Total Return D,E | | 15.63% | | (29.07)% | | 21.93% | | 12.36% | | 12.14% | | (10.02)% |
Ratios to Average Net Assets C,F,G | | | | | | | | | | | | |
| Expenses before reductions | | .93% H | | .96% | | .96% | | .92% | | .87% | | .96% H |
| Expenses net of fee waivers, if any | | .93% H | | .96% | | .96% | | .92% | | .87% | | .96% H |
| Expenses net of all reductions | | .93% H | | .96% | | .96% | | .92% | | .86% | | .95% H |
| Net investment income (loss) | | 1.09% H | | .69% | | .51% | | .79% | | .96% | | (.73)% H |
| Supplemental Data | | | | | | | | | | | | |
| Net assets, end of period (000 omitted) | $ | 449,518 | $ | 408,434 | $ | 585,487 | $ | 8,368 | $ | 8,136 | $ | 90 |
Portfolio turnover rate I | | 19% H | | 26% | | 31% | | 22% | | 27% | | 40% |
A For the period October 2, 2018 (commencement of sale of shares) through October 31, 2018.
B Calculated based on average shares outstanding during the period.
C Net investment income (loss) is affected by the timing of the declaration of dividends by any underlying mutual funds or exchange-traded funds (ETFs). Net investment income (loss) of any mutual funds or ETFs is not included in the Fund's net investment income (loss) ratio.
D Total returns for periods of less than one year are not annualized.
E Total returns would have been lower if certain expenses had not been reduced during the applicable periods shown.
F Fees and expenses of any underlying mutual funds or exchange-traded funds (ETFs) are not included in the Fund's expense ratio. The Fund indirectly bears its proportionate share of these expenses. For additional expense information related to investments in Fidelity Central Funds, please refer to the "Investments in Fidelity Central Funds" note found in the Notes to Financial Statements section of the most recent Annual or Semi-Annual report.
G Expense ratios reflect operating expenses of the class. Expenses before reductions do not reflect amounts reimbursed, waived, or reduced through arrangements with the investment adviser, brokerage services, or other offset arrangements, if applicable, and do not represent the amount paid by the class during periods when reimbursements, waivers or reductions occur.
H Annualized.
I Amount does not include the portfolio activity of any underlying mutual funds or exchange-traded funds (ETFs).
For the period ended April 30, 2023
1. Organization.
Fidelity Japan Fund (the Fund) is a fund of Fidelity Investment Trust (the Trust) and is authorized to issue an unlimited number of shares. The Trust is registered under the Investment Company Act of 1940, as amended (the 1940 Act), as an open-end management investment company organized as a Massachusetts business trust. The Fund offers Class A, Class M, Class C, Japan Class I and Class Z shares, each of which has equal rights as to assets and voting privileges. Class A, Class M, Class C, Class I and Class Z are Fidelity Advisor classes. Each class has exclusive voting rights with respect to matters that affect that class. Class C shares will automatically convert to Class A shares after a holding period of eight years from the initial date of purchase, with certain exceptions.
2. Investments in Fidelity Central Funds.
Funds may invest in Fidelity Central Funds, which are open-end investment companies generally available only to other investment companies and accounts managed by the investment adviser and its affiliates. The Schedule of Investments lists any Fidelity Central Funds held as an investment as of period end, but does not include the underlying holdings of each Fidelity Central Fund. An investing fund indirectly bears its proportionate share of the expenses of the underlying Fidelity Central Funds.
Based on its investment objective, each Fidelity Central Fund may invest or participate in various investment vehicles or strategies that are similar to those of the investing fund. These strategies are consistent with the investment objectives of the investing fund and may involve certain economic risks which may cause a decline in value of each of the Fidelity Central Funds and thus a decline in the value of the investing fund.
| Fidelity Central Fund | Investment Manager | Investment Objective | Investment Practices | Expense Ratio A |
| Fidelity Money Market Central Funds | Fidelity Management & Research Company LLC (FMR) | Each fund seeks to obtain a high level of current income consistent with the preservation of capital and liquidity. | Short-term Investments | Less than .005% |
A Expenses expressed as a percentage of average net assets and are as of each underlying Central Fund's most recent annual or semi-annual shareholder report.
A complete unaudited list of holdings for each Fidelity Central Fund is available upon request or at the Securities and Exchange Commission website at www.sec.gov. In addition, the financial statements of the Fidelity Central Funds which contain the significant accounting policies (including investment valuation policies) of those funds, and are not covered by the Report of Independent Registered Public Accounting Firm, are available on the Securities and Exchange Commission website or upon request.
3. Significant Accounting Policies
The Fund is an investment company and applies the accounting and reporting guidance of the Financial Accounting Standards Board (FASB) Accounting Standards Codification Topic 946 Financial Services - Investment Companies . The financial statements have been prepared in conformity with accounting principles generally accepted in the United States of America (GAAP), which require management to make certain estimates and assumptions at the date of the financial statements. Actual results could differ from those estimates. Subsequent events, if any, through the date that the financial statements were issued have been evaluated in the preparation of the financial statements. The Fund's Schedule of Investments lists any underlying mutual funds or exchange-traded funds (ETFs) but does not include the underlying holdings of these funds. The following summarizes the significant accounting policies of the Fund:
Investment Valuation. Investments are valued as of 4:00 p.m. Eastern time on the last calendar day of the period. The Board of Trustees (the Board) has designated the Fund's investment adviser as the valuation designee responsible for the fair valuation function and performing fair value determinations as needed. The investment adviser has established a Fair Value Committee (the Committee) to carry out the day-to-day fair valuation responsibilities and has adopted policies and procedures to govern the fair valuation process and the activities of the Committee. In accordance with these fair valuation policies and procedures, which have been approved by the Board, the Fund attempts to obtain prices from one or more third party pricing services or brokers to value its investments. When current market prices, quotations or currency exchange rates are not readily available or reliable, investments will be fair valued in good faith by the Committee, in accordance with the policies and procedures. Factors used in determining fair value vary by investment type and may include market or investment specific events, transaction data, estimated cash flows, and market observations of comparable investments. The frequency that the fair valuation procedures are used cannot be predicted and they may be utilized to a significant extent. The Committee manages the Fund's fair valuation practices and maintains the fair valuation policies and procedures. The Fund's investment adviser reports to the Board information regarding the fair valuation process and related material matters.
The Fund categorizes the inputs to valuation techniques used to value its investments into a disclosure hierarchy consisting of three levels as shown below:
Level 1 - unadjusted quoted prices in active markets for identical investments
Level 2 - other significant observable inputs (including quoted prices for similar investments, interest rates, prepayment speeds, etc.)
Level 3 - unobservable inputs (including the Fund's own assumptions based on the best information available)
Valuation techniques used to value the Fund's investments by major category are as follows:
Equity securities, including restricted securities, for which market quotations are readily available, are valued at the last reported sale price or official closing price as reported by a third party pricing service on the primary market or exchange on which they are traded and are categorized as Level 1 in the hierarchy. In the event there were no sales during the day or closing prices are not available, securities are valued at the last quoted bid price or may be valued using the last available price and are generally categorized as Level 2 in the hierarchy. For foreign equity securities, when market or security specific events arise, comparisons to the valuation of American Depositary Receipts (ADRs), futures contracts, ETFs and certain indexes as well as quoted prices for similar securities may be used and would be categorized as Level 2 in the hierarchy. For equity securities, including restricted securities, where observable inputs are limited, assumptions about market activity and risk are used and these securities may be categorized as Level 3 in the hierarchy.
Investments in open-end mutual funds, including the Fidelity Central Funds, are valued at their closing net asset value (NAV) each business day and are categorized as Level 1 in the hierarchy.
Changes in valuation techniques may result in transfers in or out of an assigned level within the disclosure hierarchy. The aggregate value of investments by input level as of April 30, 2023 is included at the end of the Fund's Schedule of Investments.
Foreign Currency. Certain Funds may use foreign currency contracts to facilitate transactions in foreign-denominated securities. Gains and losses from these transactions may arise from changes in the value of the foreign currency or if the counterparties do not perform under the contracts' terms.
Foreign-denominated assets, including investment securities, and liabilities are translated into U.S. dollars at the exchange rates at period end. Purchases and sales of investment securities, income and dividends received, and expenses denominated in foreign currencies are translated into U.S. dollars at the exchange rate in effect on the transaction date.
The effects of exchange rate fluctuations on investments are included with the net realized and unrealized gain (loss) on investment securities. Other foreign currency transactions resulting in realized and unrealized gain (loss) are disclosed separately.
Investment Transactions and Income. For financial reporting purposes, the Fund's investment holdings and NAV include trades executed through the end of the last business day of the period. The NAV per share for processing shareholder transactions is calculated as of the close of business of the New York Stock Exchange (NYSE), normally 4:00 p.m. Eastern time and includes trades executed through the end of the prior business day. Gains and losses on securities sold are determined on the basis of identified cost. Commissions paid to certain brokers with whom the investment adviser, or its affiliates, places trades on behalf of a fund include an amount in addition to trade execution, which may be rebated back to a fund. Any such rebates are included in net realized gain (loss) on investments in the Statement of Operations. Dividend income is recorded on the ex-dividend date, except for certain dividends from foreign securities where the ex-dividend date may have passed, which are recorded as soon as the Fund is informed of the ex-dividend date. Non-cash dividends included in dividend income, if any, are recorded at the fair market value of the securities received. Income and capital gain distributions from Fidelity Central Funds, if any, are recorded on the ex-dividend date. Investment income is recorded net of foreign taxes withheld where recovery of such taxes is uncertain.
Class Allocations and Expenses. Investment income, realized and unrealized capital gains and losses, common expenses of a fund, and certain fund-level expense reductions, if any, are allocated daily on a pro-rata basis to each class based on the relative net assets of each class to the total net assets of a fund. Each class differs with respect to transfer agent and distribution and service plan fees incurred, as applicable. Certain expense reductions may also differ by class, if applicable. For the reporting period, the allocated portion of income and expenses to each class as a percent of its average net assets may vary due to the timing of recording these transactions in relation to fluctuating net assets of the classes. Expenses directly attributable to a fund are charged to that fund. Expenses attributable to more than one fund are allocated among the respective funds on the basis of relative net assets or other appropriate methods. Expenses included in the accompanying financial statements reflect the expenses of that fund and do not include any expenses associated with any underlying mutual funds or exchange-traded funds. Although not included in a fund's expenses, a fund indirectly bears its proportionate share of these expenses through the net asset value of each underlying mutual fund or exchange-traded fund. Expense estimates are accrued in the period to which they relate and adjustments are made when actual amounts are known.
Income Tax Information and Distributions to Shareholders. Each year, the Fund intends to qualify as a regulated investment company under Subchapter M of the Internal Revenue Code, including distributing substantially all of its taxable income and realized gains. As a result, no provision for U.S. Federal income taxes is required. The Fund files a U.S. federal tax return, in addition to state and local tax returns as required. The Fund's federal income tax returns are subject to examination by the Internal Revenue Service (IRS) for a period of three fiscal years after they are filed. State and local tax returns may be subject to examination for an additional fiscal year depending on the jurisdiction. Foreign taxes are provided for based on the Fund's understanding of the tax rules and rates that exist in the foreign markets in which it invests.
Distributions are declared and recorded on the ex-dividend date. Income and capital gain distributions are declared separately for each class. Income and capital gain distributions are determined in accordance with income tax regulations, which may differ from GAAP.
Capital accounts within the financial statements are adjusted for permanent book-tax differences. These adjustments have no impact on net assets or the results of operations. Capital accounts are not adjusted for temporary book-tax differences which will reverse in a subsequent period.
Book-tax differences are primarily due to foreign currency transactions, passive foreign investment companies (PFIC), net operating losses, capital loss carryforwards and losses deferred due to wash sales and excise tax regulations.
As of period end, the cost and unrealized appreciation (depreciation) in securities, and derivatives if applicable, for federal income tax purposes were as follows:
| Gross unrealized appreciation | $147,998,435 |
| Gross unrealized depreciation | (44,124,724) |
| Net unrealized appreciation (depreciation) | $103,873,711 |
| Tax cost | $524,153,336 |
Capital loss carryforwards are only available to offset future capital gains of the Fund to the extent provided by regulations and may be limited. The capital loss carryforward information presented below, including any applicable limitation, is estimated as of prior fiscal period end and is subject to adjustment.
Short-term | $(10,880,483) |
Long-term | - |
| Total capital loss carryforward | $(10,880,483) |
The fund elected to defer to its next fiscal year $6,249,784 of ordinary losses recognized during the period January 1, 2022 to October 31, 2022.
Restricted Securities (including Private Placements). Funds may invest in securities that are subject to legal or contractual restrictions on resale. These securities generally may be resold in transactions exempt from registration or to the public if the securities are registered. Disposal of these securities may involve time-consuming negotiations and expense, and prompt sale at an acceptable price may be difficult. Information regarding restricted securities held at period end is included at the end of the Schedule of Investments, if applicable.
4. Purchases and Sales of Investments.
Purchases and sales of securities, other than short-term securities and in-kind transactions, as applicable, are noted in the table below.
| | Purchases ($) | Sales ($) |
| Fidelity Japan Fund | 7,337,633 | 74,411,275 |
5. Fees and Other Transactions with Affiliates.
Management Fee. Fidelity Management & Research Company LLC (the investment adviser) and its affiliates provide the Fund with investment management related services for which the Fund pays a monthly management fee. The management fee is the sum of an individual fund fee rate that is based on an annual rate of .45% of the Fund's average net assets and an annualized group fee rate that averaged .23% during the period. The group fee rate is based upon the monthly average net assets of a group of registered investment companies with which the investment adviser has management contracts. The group fee rate decreases as assets under management increase and increases as assets under management decrease. In addition, the management fee is subject to a performance adjustment (up to a maximum of +/- .20% of the Fund's average net assets over a 36 month performance period). The upward or downward adjustment to the management fee is based on the relative investment performance of Japan as compared to its benchmark index, the TOPIX, over the same 36 month performance period. For the reporting period, the total annualized management fee rate, including the performance adjustment, was .80% of the Fund's average net assets. The performance adjustment included in the management fee rate may be higher or lower than the maximum performance adjustment rate due to the difference between the average net assets for the reporting and performance periods.
Distribution and Service Plan Fees. In accordance with Rule 12b-1 of the 1940 Act, the Fund has adopted separate Distribution and Service Plans for each class of shares. Certain classes pay Fidelity Distributors Company LLC (FDC), an affiliate of the investment adviser, separate Distribution and Service Fees, each of which is based on an annual percentage of each class' average net assets. In addition, FDC may pay financial intermediaries for selling shares of the Fund and providing shareholder support services. For the period, the Distribution and Service Fee rates, total fees and amounts retained by FDC were as follows:
| | Distribution Fee | Service Fee | Total Fees | Retained by FDC |
| Class A | - % | .25% | $17,731 | $190 |
| Class M | .25% | .25% | 6,246 | 79 |
| Class C | .75% | .25% | 11,184 | 825 |
| | | | $35,161 | $1,094 |
Sales Load. FDC may receive a front-end sales charge of up to 5.75% for selling Class A shares and 3.50% for selling Class M shares, some of which is paid to financial intermediaries for selling shares of the Fund. Depending on the holding period, FDC may receive contingent deferred sales charges levied on Class A, Class M and Class C redemptions. The deferred sales charges are 1.00% for Class C shares, 1.00% for certain purchases of Class A shares and .25% for certain purchases of Class M shares.
For the period, sales charge amounts retained by FDC were as follows:
| | Retained by FDC |
| Class A | $630 |
| Class M | 122 |
Class C A | 14 |
| | $766 |
A When Class C shares are initially sold, FDC pays commissions from its own resources to financial intermediaries through which the sales are made.
Transfer Agent Fees. Fidelity Investments Institutional Operations Company LLC (FIIOC), an affiliate of the investment adviser, is the transfer, dividend disbursing and shareholder servicing agent for each class of the Fund. FIIOC receives account fees and asset-based fees that vary according to the account size and type of account of the shareholders of the respective classes of the Fund, except for Class Z. FIIOC receives an asset-based fee of Class Z's average net assets. FIIOC pays for typesetting, printing and mailing of shareholder reports, except proxy statements.
For the period, transfer agent fees for each class were as follows:
| | Amount | % of Class-Level Average Net Assets A |
| Class A | $15,733 | .22 |
| Class M | 3,213 | .26 |
| Class C | 2,027 | .18 |
| Japan | 134,171 | .21 |
| Class I | 27,773 | .18 |
| Class Z | 92,224 | .04 |
| | $275,141 | |
A Annualized
Accounting Fees. Fidelity Service Company, Inc. (FSC), an affiliate of the investment adviser, maintains the Fund's accounting records. The accounting fee is based on the level of average net assets for each month. For the period, the fees were equivalent to the following annualized rates:
| | % of Average Net Assets |
| Fidelity Japan Fund | .05 |
Interfund Lending Program. Pursuant to an Exemptive Order issued by the Securities and Exchange Commission (the SEC), the Fund, along with other registered investment companies having management contracts with Fidelity Management & Research Company LLC (FMR), or other affiliated entities of FMR, may participate in an interfund lending program. This program provides an alternative credit facility allowing the Fund to borrow from, or lend money to, other participating affiliated funds. At period end, there were no interfund loans outstanding. Activity in this program during the period for which loans were outstanding was as follows:
| | Borrower or Lender | Average Loan Balance | Weighted Average Interest Rate | Interest Expense |
| Fidelity Japan Fund | Borrower | $9,038,500 | 4.30% | $15,104 |
Interfund Trades. Funds may purchase from or sell securities to other Fidelity Funds under procedures adopted by the Board. The procedures have been designed to ensure these interfund trades are executed in accordance with Rule 17a-7 of the 1940 Act. Any interfund trades are included within the respective purchases and sales amounts shown in the Purchases and Sales of Investments note. Interfund trades during the period are noted in the table below.
| | Purchases ($) | Sales ($) | Realized Gain (Loss) ($) |
| Fidelity Japan Fund | 58,343 | 350,123 | 8,902 |
6. Committed Line of Credit.
Certain Funds participate with other funds managed by the investment adviser or an affiliate in a $4.25 billion credit facility (the "line of credit") to be utilized for temporary or emergency purposes to fund shareholder redemptions or for other short-term liquidity purposes. The participating funds have agreed to pay commitment fees on their pro-rata portion of the line of credit, which are reflected in Miscellaneous expenses on the Statement of Operations, and are listed below. During the period, there were no borrowings on this line of credit.
| | Amount |
| Fidelity Japan Fund | $600 |
7. Security Lending.
Funds lend portfolio securities from time to time in order to earn additional income. Lending agents are used, including National Financial Services (NFS), an affiliate of the investment adviser. Pursuant to a securities lending agreement, NFS will receive a fee, which is capped at 9.9% of a fund's daily lending revenue, for its services as lending agent. A fund may lend securities to certain qualified borrowers, including NFS. On the settlement date of the loan, a fund receives collateral (in the form of U.S. Treasury obligations, letters of credit and/or cash) against the loaned securities and maintains collateral in an amount not less than 100% of the market value of the loaned securities during the period of the loan. The market value of the loaned securities is determined at the close of business of a fund and any additional required collateral is delivered to a fund on the next business day. A fund or borrower may terminate the loan at any time, and if the borrower defaults on its obligation to return the securities loaned because of insolvency or other reasons, a fund may apply collateral received from the borrower against the obligation. A fund may experience delays and costs in recovering the securities loaned. Any cash collateral received is invested in the Fidelity Securities Lending Cash Central Fund. Any loaned securities are identified as such in the Schedule of Investments, and the value of loaned securities and cash collateral at period end, as applicable, are presented in the Statement of Assets and Liabilities. Security lending income represents the income earned on investing cash collateral, less rebates paid to borrowers and any lending agent fees associated with the loan, plus any premium payments received for lending certain types of securities. Security lending income is presented in the Statement of Operations as a component of income from Fidelity Central Funds. Affiliated security lending activity, if any, was as follows:
| | Total Security Lending Fees Paid to NFS | Security Lending Income From Securities Loaned to NFS | Value of Securities Loaned to NFS at Period End |
| Fidelity Japan Fund | $1,147 | $- | $- |
8. Expense Reductions.
Through arrangements with each class' transfer agent, credits realized as a result of certain uninvested cash balances were used to reduce the Fund's expenses. During the period, transfer agent credits reduced each class' expenses as noted in the table below.
| | Expense reduction |
| Class A | $186 |
| Class M | 302 |
| Class C | 26 |
| | $514 |
In addition, during the period the investment adviser or an affiliate reimbursed and/or waived a portion of fund-level operating expenses in the amount of $14,266.
9. Distributions to Shareholders.
Distributions to shareholders of each class were as follows:
| | Six months ended April 30, 2023 | Year ended October 31, 2022 |
| Fidelity Japan Fund | | |
| Distributions to shareholders | | |
| Class A | $- | $2,019,337 |
| Class M | - | 368,577 |
| Class C | - | 426,706 |
| Japan | - | 17,143,088 |
| Class I | - | 4,520,940 |
| Class Z | - | 61,218,979 |
Total | $- | $85,697,627 |
10. Share Transactions.
Share transactions for each class were as follows and may contain in-kind transactions, automatic conversions between classes or exchanges between affiliated funds:
| | Shares | Shares | Dollars | Dollars |
| | Six months ended April 30, 2023 | Year ended October 31, 2022 | Six months ended April 30, 2023 | Year ended October 31, 2022 |
| Fidelity Japan Fund | | | | |
| Class A | | | | |
| Shares sold | 38,280 | 117,484 | $572,904 | $1,791,821 |
| Reinvestment of distributions | - | 100,623 | - | 1,865,544 |
| Shares redeemed | (75,588) | (211,780) | (1,119,683) | (3,414,360) |
| Net increase (decrease) | (37,308) | 6,327 | $(546,779) | $243,005 |
| Class M | | | | |
| Shares sold | 2,744 | 13,826 | $40,557 | $202,895 |
| Reinvestment of distributions | - | 19,910 | - | 368,140 |
| Shares redeemed | (8,285) | (49,434) | (120,791) | (787,625) |
| Net increase (decrease) | (5,541) | (15,698) | $(80,234) | $(216,590) |
| Class C | | | | |
| Shares sold | 9,196 | 8,561 | $133,571 | $138,296 |
| Reinvestment of distributions | - | 23,330 | - | 426,706 |
| Shares redeemed | (44,782) | (98,132) | (655,321) | (1,544,500) |
| Net increase (decrease) | (35,586) | (66,241) | $(521,750) | $(979,498) |
| Japan | | | | |
| Shares sold | 1,643,313 | 1,808,139 | $24,695,867 | $29,931,437 |
| Reinvestment of distributions | - | 867,250 | - | 16,148,203 |
| Shares redeemed | (865,667) | (2,201,846) | (12,775,173) | (35,408,192) |
| Net increase (decrease) | 777,646 | 473,543 | $11,920,694 | $10,671,448 |
| Class I | | | | |
| Shares sold | 1,158,328 | 694,437 | $17,365,542 | $11,578,345 |
| Reinvestment of distributions | - | 176,445 | - | 3,310,112 |
| Shares redeemed | (1,517,801) | (725,162) | (22,181,444) | (12,524,199) |
| Net increase (decrease) | (359,473) | 145,720 | $(4,815,902) | $2,364,258 |
| Class Z | | | | |
| Shares sold | 134,257 | 833,537 | $1,955,047 | $13,605,712 |
| Reinvestment of distributions | - | 3,263,046 | - | 60,496,866 |
| Shares redeemed | (1,609,645) | (1,323,692) | (23,184,220) | (19,937,492) |
| Net increase (decrease) | (1,475,388) | 2,772,891 | $(21,229,173) | $54,165,086 |
11. Other.
A fund's organizational documents provide former and current trustees and officers with a limited indemnification against liabilities arising in connection with the performance of their duties to the fund. In the normal course of business, a fund may also enter into contracts that provide general indemnifications. A fund's maximum exposure under these arrangements is unknown as this would be dependent on future claims that may be made against a fund. The risk of material loss from such claims is considered remote.
At the end of the period, the following mutual funds managed by the investment adviser or its affiliates were the owners of record of 10% or more of the total outstanding shares.
| | Strategic Advisers Fidelity International Fund |
| Fidelity Japan Fund | 60% |
Mutual funds managed by the investment adviser or its affiliates, in aggregate, were the owners of record of more than 20% of the total outstanding shares.
| Fund | % of shares held |
| Fidelity Japan Fund | 69% |
12. Risk and Uncertainties.
Many factors affect a fund's performance. Developments that disrupt global economies and financial markets, such as pandemics, epidemics, outbreaks of infectious diseases, war, terrorism, and environmental disasters, may significantly affect a fund's investment performance. The effects of these developments to a fund will be impacted by the types of securities in which a fund invests, the financial condition, industry, economic sector, and geographic location of an issuer, and a fund's level of investment in the securities of that issuer. Significant concentrations in security types, issuers, industries, sectors, and geographic locations may magnify the factors that affect a fund's performance.
Top Holdings (% of Fund's net assets) |
| |
| Renesas Electronics Corp. (Semiconductors & Semiconductor Equipment) | 2.8 | |
| INPEX Corp. (Oil, Gas & Consumable Fuels) | 2.5 | |
| Amano Corp. (Electronic Equipment, Instruments & Components) | 2.3 | |
| Money Forward, Inc. (Software) | 2.3 | |
| Kansai Electric Power Co., Inc. (Electric Utilities) | 2.1 | |
| Central Automotive Products Ltd. (Distributors) | 1.9 | |
| Fast Retailing Co. Ltd. (Specialty Retail) | 1.9 | |
| Funai Soken Holdings, Inc. (Professional Services) | 1.8 | |
| Capcom Co. Ltd. (Entertainment) | 1.8 | |
| Asahi Group Holdings (Beverages) | 1.8 | |
| | 21.2 | |
| |
| Market Sectors (% of Fund's net assets) |
| |
| Industrials | 22.3 | |
| Information Technology | 19.9 | |
| Consumer Discretionary | 19.2 | |
| Materials | 8.3 | |
| Financials | 8.2 | |
| Consumer Staples | 5.2 | |
| Communication Services | 4.3 | |
| Utilities | 3.3 | |
| Energy | 2.5 | |
| Real Estate | 2.0 | |
| Health Care | 1.7 | |
| |
Asset Allocation (% of Fund's net assets) |
|
|
Geographic Diversification (% of Fund's net assets) |
|
* Includes Short-Term investments and Net Other Assets (Liabilities). Percentages are adjusted for the effect of derivatives, if applicable. |
| |
Fidelity® Japan Smaller Companies Fund
Showing Percentage of Net Assets
| Common Stocks - 96.9% |
| | | Shares | Value ($) |
| COMMUNICATION SERVICES - 4.3% | | | |
| Entertainment - 3.0% | | | |
| Capcom Co. Ltd. | | 184,500 | 6,933,069 |
| Daiichikosho Co. Ltd. | | 260,300 | 4,666,715 |
| | | | 11,599,784 |
| Interactive Media & Services - 1.3% | | | |
| Kakaku.com, Inc. | | 355,400 | 4,889,850 |
TOTAL COMMUNICATION SERVICES | | | 16,489,634 |
| CONSUMER DISCRETIONARY - 19.2% | | | |
| Automobile Components - 2.3% | | | |
| DENSO Corp. | | 65,400 | 3,947,780 |
| Shoei Co. Ltd. | | 257,800 | 4,782,472 |
| | | | 8,730,252 |
| Automobiles - 3.2% | | | |
| Isuzu Motors Ltd. | | 526,400 | 6,216,270 |
| Suzuki Motor Corp. | | 181,200 | 6,318,168 |
| | | | 12,534,438 |
| Broadline Retail - 1.5% | | | |
| Pan Pacific International Holdings Ltd. | | 313,000 | 5,849,010 |
| Distributors - 1.9% | | | |
| Central Automotive Products Ltd. | | 355,300 | 7,554,016 |
| Hotels, Restaurants & Leisure - 2.1% | | | |
| Curves Holdings Co. Ltd. | | 464,600 | 2,708,686 |
| Koshidaka Holdings Co. Ltd. | | 654,700 | 5,542,663 |
| | | | 8,251,349 |
| Household Durables - 1.2% | | | |
| Open House Group Co. Ltd. | | 114,200 | 4,564,888 |
| Leisure Products - 1.8% | | | |
| Bandai Namco Holdings, Inc. | | 147,900 | 3,359,611 |
| Roland Corp. | | 123,100 | 3,690,031 |
| | | | 7,049,642 |
| Specialty Retail - 5.2% | | | |
| ABC-MART, Inc. | | 73,000 | 4,148,499 |
| Arcland Sakamoto Co. Ltd. | | 202,500 | 2,293,520 |
| Fast Retailing Co. Ltd. | | 30,900 | 7,317,171 |
| Fuji Corp. | | 663,800 | 6,424,228 |
| | | | 20,183,418 |
TOTAL CONSUMER DISCRETIONARY | | | 74,717,013 |
| CONSUMER STAPLES - 5.2% | | | |
| Beverages - 1.8% | | | |
| Asahi Group Holdings | | 175,200 | 6,768,694 |
| Food Products - 1.8% | | | |
| Ajinomoto Co., Inc. | | 58,600 | 2,107,512 |
| Kotobuki Spirits Co. Ltd. | | 68,100 | 5,028,826 |
| | | | 7,136,338 |
| Personal Care Products - 1.6% | | | |
| Shiseido Co. Ltd. | | 124,300 | 6,230,636 |
TOTAL CONSUMER STAPLES | | | 20,135,668 |
| ENERGY - 2.5% | | | |
| Oil, Gas & Consumable Fuels - 2.5% | | | |
| INPEX Corp. | | 893,600 | 9,778,712 |
| FINANCIALS - 8.2% | | | |
| Banks - 1.3% | | | |
| Bank of Kyoto Ltd. | | 102,300 | 5,033,410 |
| Financial Services - 1.8% | | | |
| ORIX Corp. | | 243,000 | 4,134,043 |
| Zenkoku Hosho Co. Ltd. | | 76,300 | 2,804,340 |
| | | | 6,938,383 |
| Insurance - 5.1% | | | |
| Lifenet Insurance Co. (a) | | 322,000 | 2,806,395 |
| Sompo Holdings, Inc. | | 106,600 | 4,448,375 |
| T&D Holdings, Inc. | | 523,200 | 6,407,290 |
| Tokio Marine Holdings, Inc. | | 299,200 | 6,016,025 |
| | | | 19,678,085 |
TOTAL FINANCIALS | | | 31,649,878 |
| HEALTH CARE - 1.7% | | | |
| Health Care Equipment & Supplies - 0.7% | | | |
| Eiken Chemical Co. Ltd. | | 232,000 | 2,697,423 |
| Health Care Providers & Services - 1.0% | | | |
| As One Corp. | | 93,700 | 3,969,557 |
TOTAL HEALTH CARE | | | 6,666,980 |
| INDUSTRIALS - 22.3% | | | |
| Air Freight & Logistics - 0.7% | | | |
| SG Holdings Co. Ltd. | | 204,500 | 2,942,719 |
| Commercial Services & Supplies - 0.7% | | | |
| Park24 Co. Ltd. (a) | | 168,500 | 2,604,518 |
| Construction & Engineering - 0.9% | | | |
| Raito Kogyo Co. Ltd. | | 226,900 | 3,346,724 |
| Electrical Equipment - 0.7% | | | |
| SWCC Showa Holdings Co. Ltd. | | 200,400 | 2,602,895 |
| Machinery - 4.5% | | | |
| CKD Corp. | | 231,400 | 3,524,823 |
| Minebea Mitsumi, Inc. | | 295,200 | 5,466,702 |
| Misumi Group, Inc. | | 205,637 | 5,187,647 |
| Nabtesco Corp. | | 137,800 | 3,321,465 |
| | | | 17,500,637 |
| Marine Transportation - 1.2% | | | |
| Nippon Concept Corp. | | 400,000 | 4,769,407 |
| Professional Services - 7.1% | | | |
| Funai Soken Holdings, Inc. | | 362,780 | 6,954,340 |
| Open Up Group, Inc. | | 232,500 | 3,444,303 |
| Persol Holdings Co. Ltd. | | 180,000 | 3,711,495 |
| TechnoPro Holdings, Inc. | | 208,000 | 5,675,008 |
| TKC Corp. | | 190,200 | 5,140,605 |
| Visional, Inc. (a) | | 53,600 | 2,810,982 |
| | | | 27,736,733 |
| Trading Companies & Distributors - 4.9% | | | |
| Hanwa Co. Ltd. | | 119,250 | 3,692,587 |
| Inaba Denki Sangyo Co. Ltd. | | 295,700 | 6,604,747 |
| Itochu Corp. | | 155,600 | 5,162,008 |
| Mitani Shoji Co. Ltd. | | 290,300 | 2,858,970 |
| Yuasa Trading Co. Ltd. | | 29,400 | 853,842 |
| | | | 19,172,154 |
| Transportation Infrastructure - 1.6% | | | |
| Kamigumi Co. Ltd. | | 276,100 | 6,050,969 |
TOTAL INDUSTRIALS | | | 86,726,756 |
| INFORMATION TECHNOLOGY - 19.9% | | | |
| Electronic Equipment, Instruments & Components - 7.3% | | | |
| Amano Corp. | | 447,900 | 9,119,672 |
| Azbil Corp. | | 161,100 | 4,505,446 |
| Dexerials Corp. | | 114,600 | 2,180,905 |
| Ibiden Co. Ltd. | | 98,600 | 3,879,539 |
| Kohoku Kogyo Co. Ltd. (b) | | 42,600 | 1,589,343 |
| Maruwa Ceramic Co. Ltd. | | 35,000 | 4,463,374 |
| Shibaura Electronics Co. Ltd. | | 62,100 | 2,611,248 |
| | | | 28,349,527 |
| IT Services - 5.6% | | | |
| Argo Graphics, Inc. | | 216,400 | 6,097,516 |
| GMO Internet, Inc. | | 159,800 | 3,214,644 |
| Net One Systems Co. Ltd. | | 286,100 | 6,745,773 |
| NSD Co. Ltd. | | 295,000 | 5,426,933 |
| | | | 21,484,866 |
| Semiconductors & Semiconductor Equipment - 3.8% | | | |
| Renesas Electronics Corp. (a) | | 851,000 | 11,090,614 |
| Sumco Corp. | | 273,257 | 3,763,201 |
| | | | 14,853,815 |
| Software - 2.3% | | | |
| Money Forward, Inc. (a) | | 217,000 | 9,036,822 |
| Technology Hardware, Storage & Peripherals - 0.9% | | | |
| FUJIFILM Holdings Corp. | | 67,200 | 3,502,462 |
TOTAL INFORMATION TECHNOLOGY | | | 77,227,492 |
| MATERIALS - 8.3% | | | |
| Chemicals - 4.2% | | | |
| C. Uyemura & Co. Ltd. | | 128,700 | 6,210,096 |
| Fujimi, Inc. | | 63,900 | 3,310,260 |
| NOF Corp. | | 87,200 | 3,984,295 |
| Tokyo Ohka Kogyo Co. Ltd. | | 54,500 | 2,845,076 |
| | | | 16,349,727 |
| Construction Materials - 1.0% | | | |
| Maeda Kosen Co. Ltd. | | 152,300 | 3,644,245 |
| Metals & Mining - 3.1% | | | |
| Dowa Holdings Co. Ltd. | | 166,000 | 5,423,299 |
| Yamato Kogyo Co. Ltd. | | 168,100 | 6,604,154 |
| | | | 12,027,453 |
TOTAL MATERIALS | | | 32,021,425 |
| REAL ESTATE - 2.0% | | | |
| Equity Real Estate Investment Trusts (REITs) - 0.6% | | | |
| Invincible Investment Corp. | | 5,200 | 2,245,139 |
| Real Estate Management & Development - 1.4% | | | |
| Relo Group, Inc. | | 366,600 | 5,699,306 |
TOTAL REAL ESTATE | | | 7,944,445 |
| UTILITIES - 3.3% | | | |
| Electric Utilities - 2.1% | | | |
| Kansai Electric Power Co., Inc. | | 753,100 | 8,129,500 |
| Gas Utilities - 1.2% | | | |
| Nippon Gas Co. Ltd. | | 331,700 | 4,664,532 |
TOTAL UTILITIES | | | 12,794,032 |
| TOTAL COMMON STOCKS (Cost $309,353,444) | | | 376,152,035 |
| | | | |
| Money Market Funds - 0.4% |
| | | Shares | Value ($) |
Fidelity Securities Lending Cash Central Fund 4.88% (c)(d) (Cost $1,510,500) | | 1,510,349 | 1,510,500 |
| | | | |
| TOTAL INVESTMENT IN SECURITIES - 97.3% (Cost $310,863,944) | 377,662,535 |
NET OTHER ASSETS (LIABILITIES) - 2.7% | 10,666,832 |
| NET ASSETS - 100.0% | 388,329,367 |
| | |
Legend
| (b) | Security or a portion of the security is on loan at period end. |
| (c) | Affiliated fund that is generally available only to investment companies and other accounts managed by Fidelity Investments. The rate quoted is the annualized seven-day yield of the fund at period end. A complete unaudited listing of the fund's holdings as of its most recent quarter end is available upon request. In addition, each Fidelity Central Fund's financial statements are available on the SEC's website or upon request. |
| (d) | Investment made with cash collateral received from securities on loan. |
Affiliated Central Funds
Fiscal year to date information regarding the Fund's investments in Fidelity Central Funds, including the ownership percentage, is presented below.
| Affiliate | Value, beginning of period ($) | Purchases ($) | Sales Proceeds ($) | Dividend Income ($) | Realized Gain (loss) ($) | Change in Unrealized appreciation (depreciation) ($) | Value, end of period ($) | % ownership, end of period |
| Fidelity Cash Central Fund 4.88% | 14,224,205 | 32,906,452 | 47,130,657 | 199,509 | - | - | - | 0.0% |
| Fidelity Securities Lending Cash Central Fund 4.88% | 2,325,000 | 93,875,205 | 94,689,705 | 74,984 | - | - | 1,510,500 | 0.0% |
| Total | 16,549,205 | 126,781,657 | 141,820,362 | 274,493 | - | - | 1,510,500 | |
| | | | | | | | | |
Amounts in the dividend income column in the above table include any capital gain distributions from underlying funds, which are presented in the corresponding line item in the Statement of Operations, if applicable.
Amounts in the dividend income column for Fidelity Securities Lending Cash Central Fund represents the income earned on investing cash collateral, less rebates paid to borrowers and any lending agent fees associated with the loan, plus any premium payments received for lending certain types of securities.
Amounts included in the purchases and sales proceeds columns may include in-kind transactions, if applicable.
Investment Valuation
The following is a summary of the inputs used, as of April 30, 2023, involving the Fund's assets and liabilities carried at fair value. The inputs or methodology used for valuing securities may not be an indication of the risk associated with investing in those securities. For more information on valuation inputs, and their aggregation into the levels used below, please refer to the Investment Valuation section in the accompanying Notes to Financial Statements.
| Valuation Inputs at Reporting Date: |
| Description | Total ($) | Level 1 ($) | Level 2 ($) | Level 3 ($) |
Investments in Securities: | | | | |
|
| Equities: | | | | |
Communication Services | 16,489,634 | - | 16,489,634 | - |
Consumer Discretionary | 74,717,013 | - | 74,717,013 | - |
Consumer Staples | 20,135,668 | - | 20,135,668 | - |
Energy | 9,778,712 | - | 9,778,712 | - |
Financials | 31,649,878 | - | 31,649,878 | - |
Health Care | 6,666,980 | - | 6,666,980 | - |
Industrials | 86,726,756 | - | 86,726,756 | - |
Information Technology | 77,227,492 | - | 77,227,492 | - |
Materials | 32,021,425 | - | 32,021,425 | - |
Real Estate | 7,944,445 | - | 7,944,445 | - |
Utilities | 12,794,032 | - | 12,794,032 | - |
|
| Money Market Funds | 1,510,500 | 1,510,500 | - | - |
| Total Investments in Securities: | 377,662,535 | 1,510,500 | 376,152,035 | - |
Fidelity® Japan Smaller Companies Fund
| Statement of Assets and Liabilities |
| | | | April 30, 2023 (Unaudited) |
| | | | | |
| Assets | | | | |
| Investment in securities, at value (including securities loaned of $1,430,755) - See accompanying schedule: | | | | |
Unaffiliated issuers (cost $309,353,444) | $ | 376,152,035 | | |
Fidelity Central Funds (cost $1,510,500) | | 1,510,500 | | |
| | | | | |
| | | | | |
| Total Investment in Securities (cost $310,863,944) | | | $ | 377,662,535 |
| Foreign currency held at value (cost $8,575,832) | | | | 8,464,254 |
| Receivable for investments sold | | | | 64,484 |
| Receivable for fund shares sold | | | | 60,511 |
| Dividends receivable | | | | 3,954,350 |
| Distributions receivable from Fidelity Central Funds | | | | 19,832 |
| Prepaid expenses | | | | 151 |
Total assets | | | | 390,226,117 |
| Liabilities | | | | |
| Payable to custodian bank | $ | 19,410 | | |
| Payable for fund shares redeemed | | 39,591 | | |
| Accrued management fee | | 217,522 | | |
| Other affiliated payables | | 68,044 | | |
| Other payables and accrued expenses | | 41,683 | | |
| Collateral on securities loaned | | 1,510,500 | | |
| Total Liabilities | | | | 1,896,750 |
| Net Assets | | | $ | 388,329,367 |
| Net Assets consist of: | | | | |
| Paid in capital | | | $ | 332,084,918 |
| Total accumulated earnings (loss) | | | | 56,244,449 |
| Net Assets | | | $ | 388,329,367 |
Net Asset Value , offering price and redemption price per share ($388,329,367 ÷ 27,121,721 shares) | | | $ | 14.32 |
| Statement of Operations |
| | | | Six months ended April 30, 2023 (Unaudited) |
| Investment Income | | | | |
| Dividends | | | $ | 5,355,411 |
| Income from Fidelity Central Funds (including $74,984 from security lending) | | | | 274,493 |
| Income before foreign taxes withheld | | | $ | 5,629,904 |
| Less foreign taxes withheld | | | | (535,576) |
| Total Income | | | | 5,094,328 |
| Expenses | | | | |
| Management fee | $ | 1,311,830 | | |
| Transfer agent fees | | 311,775 | | |
| Accounting fees | | 96,587 | | |
| Custodian fees and expenses | | 16,107 | | |
| Independent trustees' fees and expenses | | 1,250 | | |
| Registration fees | | 13,616 | | |
| Audit | | 28,313 | | |
| Legal | | 300 | | |
| Miscellaneous | | 834 | | |
| Total expenses before reductions | | 1,780,612 | | |
| Expense reductions | | (8,998) | | |
| Total expenses after reductions | | | | 1,771,614 |
| Net Investment income (loss) | | | | 3,322,714 |
| Realized and Unrealized Gain (Loss) | | | | |
| Net realized gain (loss) on: | | | | |
| Investment Securities: | | | | |
| Unaffiliated issuers | | 9,267,778 | | |
| Foreign currency transactions | | 187,592 | | |
| Total net realized gain (loss) | | | | 9,455,370 |
| Change in net unrealized appreciation (depreciation) on: | | | | |
| Investment Securities: | | | | |
| Unaffiliated issuers | | 40,445,105 | | |
| Assets and liabilities in foreign currencies | | (60,349) | | |
| Total change in net unrealized appreciation (depreciation) | | | | 40,384,756 |
| Net gain (loss) | | | | 49,840,126 |
| Net increase (decrease) in net assets resulting from operations | | | $ | 53,162,840 |
| Statement of Changes in Net Assets |
| |
| | Six months ended April 30, 2023 (Unaudited) | | Year ended October 31, 2022 |
| Increase (Decrease) in Net Assets | | | | |
| Operations | | | | |
| Net investment income (loss) | $ | 3,322,714 | $ | 5,662,274 |
| Net realized gain (loss) | | 9,455,370 | | (1,219,316) |
| Change in net unrealized appreciation (depreciation) | | 40,384,756 | | (112,241,112) |
| Net increase (decrease) in net assets resulting from operations | | 53,162,840 | | (107,798,154) |
| Distributions to shareholders | | (198,124) | | (52,717,138) |
| Share transactions | | | | |
| Proceeds from sales of shares | | 5,764,524 | | 11,321,055 |
| Reinvestment of distributions | | 192,250 | | 51,177,635 |
| Cost of shares redeemed | | (35,016,751) | | (38,772,821) |
Net increase (decrease) in net assets resulting from share transactions | | (29,059,977) | | 23,725,869 |
| Total increase (decrease) in net assets | | 23,904,739 | | (136,789,423) |
| | | | | |
| Net Assets | | | | |
| Beginning of period | | 364,424,628 | | 501,214,051 |
| End of period | $ | 388,329,367 | $ | 364,424,628 |
| | | | | |
| Other Information | | | | |
| Shares | | | | |
| Sold | | 424,880 | | 811,228 |
| Issued in reinvestment of distributions | | 14,575 | | 3,289,051 |
| Redeemed | | (2,547,425) | | (2,841,225) |
| Net increase (decrease) | | (2,107,970) | | 1,259,054 |
| | | | | |
Financial Highlights
| Fidelity® Japan Smaller Companies Fund |
| |
| | Six months ended (Unaudited) April 30, 2023 | | Years ended October 31, 2022 | | 2021 | | 2020 | | 2019 | | 2018 |
Selected Per-Share Data | | | | | | | | | | | | |
| Net asset value, beginning of period | $ | 12.47 | $ | 17.92 | $ | 16.64 | $ | 17.60 | $ | 17.12 | $ | 18.84 |
| Income from Investment Operations | | | | | | | | | | | | |
Net investment income (loss) A,B | | .12 | | .19 | | .20 | | .16 | | .22 | | .18 |
| Net realized and unrealized gain (loss) | | 1.74 | | (3.75) | | 1.36 | | .11 | | 1.10 | | (1.00) |
| Total from investment operations | | 1.86 | | (3.56) | | 1.56 | | .27 | | 1.32 | | (.82) |
| Distributions from net investment income | | (.01) | | (.51) | | (.19) | | (.23) | | (.11) | | (.16) |
| Distributions from net realized gain | | - | | (1.38) | | (.10) | | (1.00) | | (.73) | | (.74) |
| Total distributions | | (.01) | | (1.89) | | (.28) C | | (1.23) | | (.84) | | (.90) |
Redemption fees added to paid in capital A | | - | | - | | - | | - | | - | | - D |
| Net asset value, end of period | $ | 14.32 | $ | 12.47 | $ | 17.92 | $ | 16.64 | $ | 17.60 | $ | 17.12 |
Total Return E,F | | 14.90% | | (21.95)% | | 9.44% | | 1.31% | | 8.22% | | (4.71)% |
Ratios to Average Net Assets B,G,H | | | | | | | | | | | | |
| Expenses before reductions | | .92% I | | .91% | | .91% | | .92% | | .93% | | .94% |
| Expenses net of fee waivers, if any | | .91% I | | .91% | | .91% | | .92% | | .93% | | .93% |
| Expenses net of all reductions | | .91% I | | .91% | | .91% | | .92% | | .93% | | .93% |
| Net investment income (loss) | | 1.71% I | | 1.33% | | 1.13% | | 1.02% | | 1.31% | | .95% |
| Supplemental Data | | | | | | | | | | | | |
| Net assets, end of period (000 omitted) | $ | 388,329 | $ | 364,425 | $ | 501,214 | $ | 523,774 | $ | 685,651 | $ | 715,402 |
Portfolio turnover rate J | | 33% I | | 38% | | 23% | | 20% | | 16% | | 17% |
A Calculated based on average shares outstanding during the period.
B Net investment income (loss) is affected by the timing of the declaration of dividends by any underlying mutual funds or exchange-traded funds (ETFs). Net investment income (loss) of any mutual funds or ETFs is not included in the Fund's net investment income (loss) ratio.
C Total distributions per share do not sum due to rounding.
D Amount represents less than $.005 per share.
E Total returns for periods of less than one year are not annualized.
F Total returns would have been lower if certain expenses had not been reduced during the applicable periods shown.
G Fees and expenses of any underlying mutual funds or exchange-traded funds (ETFs) are not included in the Fund's expense ratio. The Fund indirectly bears its proportionate share of these expenses. For additional expense information related to investments in Fidelity Central Funds, please refer to the "Investments in Fidelity Central Funds" note found in the Notes to Financial Statements section of the most recent Annual or Semi-Annual report.
H Expense ratios reflect operating expenses of the class. Expenses before reductions do not reflect amounts reimbursed, waived, or reduced through arrangements with the investment adviser, brokerage services, or other offset arrangements, if applicable, and do not represent the amount paid by the class during periods when reimbursements, waivers or reductions occur.
I Annualized.
J Amount does not include the portfolio activity of any underlying mutual funds or exchange-traded funds (ETFs).
For the period ended April 30, 2023
1. Organization.
Fidelity Japan Smaller Companies Fund (the Fund) is a fund of Fidelity Investment Trust (the Trust) and is authorized to issue an unlimited number of shares. Share transactions on the Statement of Changes in Net Assets may contain exchanges between affiliated funds. The Trust is registered under the Investment Company Act of 1940, as amended (the 1940 Act), as an open-end management investment company organized as a Massachusetts business trust.
2. Investments in Fidelity Central Funds.
Funds may invest in Fidelity Central Funds, which are open-end investment companies generally available only to other investment companies and accounts managed by the investment adviser and its affiliates. The Schedule of Investments lists any Fidelity Central Funds held as an investment as of period end, but does not include the underlying holdings of each Fidelity Central Fund. An investing fund indirectly bears its proportionate share of the expenses of the underlying Fidelity Central Funds.
Based on its investment objective, each Fidelity Central Fund may invest or participate in various investment vehicles or strategies that are similar to those of the investing fund. These strategies are consistent with the investment objectives of the investing fund and may involve certain economic risks which may cause a decline in value of each of the Fidelity Central Funds and thus a decline in the value of the investing fund.
| Fidelity Central Fund | Investment Manager | Investment Objective | Investment Practices | Expense Ratio A |
| Fidelity Money Market Central Funds | Fidelity Management & Research Company LLC (FMR) | Each fund seeks to obtain a high level of current income consistent with the preservation of capital and liquidity. | Short-term Investments | Less than .005% |
A Expenses expressed as a percentage of average net assets and are as of each underlying Central Fund's most recent annual or semi-annual shareholder report.
A complete unaudited list of holdings for each Fidelity Central Fund is available upon request or at the Securities and Exchange Commission website at www.sec.gov. In addition, the financial statements of the Fidelity Central Funds which contain the significant accounting policies (including investment valuation policies) of those funds, and are not covered by the Report of Independent Registered Public Accounting Firm, are available on the Securities and Exchange Commission website or upon request.
3. Significant Accounting Policies.
The Fund is an investment company and applies the accounting and reporting guidance of the Financial Accounting Standards Board (FASB) Accounting Standards Codification Topic 946 Financial Services - Investment Companies . The financial statements have been prepared in conformity with accounting principles generally accepted in the United States of America (GAAP), which require management to make certain estimates and assumptions at the date of the financial statements. Actual results could differ from those estimates. Subsequent events, if any, through the date that the financial statements were issued have been evaluated in the preparation of the financial statements. The Fund's Schedule of Investments lists any underlying mutual funds or exchange-traded funds (ETFs) but does not include the underlying holdings of these funds. The following summarizes the significant accounting policies of the Fund:
Investment Valuation. Investments are valued as of 4:00 p.m. Eastern time on the last calendar day of the period. The Board of Trustees (the Board) has designated the Fund's investment adviser as the valuation designee responsible for the fair valuation function and performing fair value determinations as needed. The investment adviser has established a Fair Value Committee (the Committee) to carry out the day-to-day fair valuation responsibilities and has adopted policies and procedures to govern the fair valuation process and the activities of the Committee. In accordance with these fair valuation policies and procedures, which have been approved by the Board, the Fund attempts to obtain prices from one or more third party pricing services or brokers to value its investments. When current market prices, quotations or currency exchange rates are not readily available or reliable, investments will be fair valued in good faith by the Committee, in accordance with the policies and procedures. Factors used in determining fair value vary by investment type and may include market or investment specific events, transaction data, estimated cash flows, and market observations of comparable investments. The frequency that the fair valuation procedures are used cannot be predicted and they may be utilized to a significant extent. The Committee manages the Fund's fair valuation practices and maintains the fair valuation policies and procedures. The Fund's investment adviser reports to the Board information regarding the fair valuation process and related material matters.
The Fund categorizes the inputs to valuation techniques used to value its investments into a disclosure hierarchy consisting of three levels as shown below:
Level 1 - unadjusted quoted prices in active markets for identical investments
Level 2 - other significant observable inputs (including quoted prices for similar investments, interest rates, prepayment speeds, etc.)
Level 3 - unobservable inputs (including the Fund's own assumptions based on the best information available)
Valuation techniques used to value the Fund's investments by major category are as follows:
Equity securities, including restricted securities, for which market quotations are readily available, are valued at the last reported sale price or official closing price as reported by a third party pricing service on the primary market or exchange on which they are traded and are categorized as Level 1 in the hierarchy. In the event there were no sales during the day or closing prices are not available, securities are valued at the last quoted bid price or may be valued using the last available price and are generally categorized as Level 2 in the hierarchy. For foreign equity securities, when market or security specific events arise, comparisons to the valuation of American Depositary Receipts (ADRs), futures contracts, ETFs and certain indexes as well as quoted prices for similar securities may be used and would be categorized as Level 2 in the hierarchy. For equity securities, including restricted securities, where observable inputs are limited, assumptions about market activity and risk are used and these securities may be categorized as Level 3 in the hierarchy.
Investments in open-end mutual funds, including the Fidelity Central Funds, are valued at their closing net asset value (NAV) each business day and are categorized as Level 1 in the hierarchy.
Changes in valuation techniques may result in transfers in or out of an assigned level within the disclosure hierarchy. The aggregate value of investments by input level as of April 30, 2023 is included at the end of the Fund's Schedule of Investments.
Foreign Currency. Certain Funds may use foreign currency contracts to facilitate transactions in foreign-denominated securities. Gains and losses from these transactions may arise from changes in the value of the foreign currency or if the counterparties do not perform under the contracts' terms.
Foreign-denominated assets, including investment securities, and liabilities are translated into U.S. dollars at the exchange rates at period end. Purchases and sales of investment securities, income and dividends received, and expenses denominated in foreign currencies are translated into U.S. dollars at the exchange rate in effect on the transaction date.
The effects of exchange rate fluctuations on investments are included with the net realized and unrealized gain (loss) on investment securities. Other foreign currency transactions resulting in realized and unrealized gain (loss) are disclosed separately.
Investment Transactions and Income. For financial reporting purposes, the Fund's investment holdings and NAV include trades executed through the end of the last business day of the period. The NAV per share for processing shareholder transactions is calculated as of the close of business of the New York Stock Exchange (NYSE), normally 4:00 p.m. Eastern time and includes trades executed through the end of the prior business day. Gains and losses on securities sold are determined on the basis of identified cost. Commissions paid to certain brokers with whom the investment adviser, or its affiliates, places trades on behalf of a fund include an amount in addition to trade execution, which may be rebated back to a fund. Any such rebates are included in net realized gain (loss) on investments in the Statement of Operations. Dividend income is recorded on the ex-dividend date, except for certain dividends from foreign securities where the ex-dividend date may have passed, which are recorded as soon as the Fund is informed of the ex-dividend date. Non-cash dividends included in dividend income, if any, are recorded at the fair market value of the securities received. Income and capital gain distributions from Fidelity Central Funds, if any, are recorded on the ex-dividend date. Investment income is recorded net of foreign taxes withheld where recovery of such taxes is uncertain. Funds may file withholding tax reclaims in certain jurisdictions to recover a portion of amounts previously withheld. Any withholding tax reclaims income is included in the Statement of Operations in foreign taxes withheld. Any receivables for withholding tax reclaims are included in the Statement of Assets and Liabilities in dividends receivable.
Expenses. Expenses directly attributable to a fund are charged to that fund. Expenses attributable to more than one fund are allocated among the respective funds on the basis of relative net assets or other appropriate methods. Expenses included in the accompanying financial statements reflect the expenses of that fund and do not include any expenses associated with any underlying mutual funds or exchange-traded funds. Although not included in a fund's expenses, a fund indirectly bears its proportionate share of these expenses through the net asset value of each underlying mutual fund or exchange-traded fund. Expense estimates are accrued in the period to which they relate and adjustments are made when actual amounts are known.
Income Tax Information and Distributions to Shareholders. Each year, the Fund intends to qualify as a regulated investment company under Subchapter M of the Internal Revenue Code, including distributing substantially all of its taxable income and realized gains. As a result, no provision for U.S. Federal income taxes is required. The Fund files a U.S. federal tax return, in addition to state and local tax returns as required. The Fund's federal income tax returns are subject to examination by the Internal Revenue Service (IRS) for a period of three fiscal years after they are filed. State and local tax returns may be subject to examination for an additional fiscal year depending on the jurisdiction. Foreign taxes are provided for based on the Fund's understanding of the tax rules and rates that exist in the foreign markets in which it invests.
Distributions are declared and recorded on the ex-dividend date. Income and capital gain distributions are determined in accordance with income tax regulations, which may differ from GAAP.
Capital accounts within the financial statements are adjusted for permanent book-tax differences. These adjustments have no impact on net assets or the results of operations. Capital accounts are not adjusted for temporary book-tax differences which will reverse in a subsequent period.
Book-tax differences are primarily due to foreign currency transactions, passive foreign investment companies (PFIC), net operating losses, capital loss carryforwards and losses deferred due to wash sales and excise tax regulations.
As of period end, the cost and unrealized appreciation (depreciation) in securities, and derivatives if applicable, for federal income tax purposes were as follows:
| Gross unrealized appreciation | $72,698,600 |
| Gross unrealized depreciation | (16,262,088) |
| Net unrealized appreciation (depreciation) | $56,436,512 |
| Tax cost | $321,226,023 |
Capital loss carryforwards are only available to offset future capital gains of the Fund to the extent provided by regulations and may be limited. The capital loss carryforward information presented below, including any applicable limitation, is estimated as of prior fiscal period end and is subject to adjustment.
Short-term | $(2,461,352) |
Long-term | (9,471,810) |
| Total capital loss carryforward | $(11,933,162) |
The Fund elected to defer to its next fiscal year $168,386 of ordinary losses recognized during the period January 1, 2022 to October 31, 2022.
4. Purchases and Sales of Investments.
Purchases and sales of securities, other than short-term securities and in-kind transactions, as applicable, are noted in the table below.
| | Purchases ($) | Sales ($) |
| Fidelity Japan Smaller Companies Fund | 62,132,635 | 77,467,533 |
5. Fees and Other Transactions with Affiliates.
Management Fee. Fidelity Management & Research Company LLC (the investment adviser) and its affiliates provide the Fund with investment management related services for which the Fund pays a monthly management fee. The management fee is the sum of an individual fund fee rate that is based on an annual rate of .45% of the Fund's average net assets and an annualized group fee rate that averaged .23% during the period. The group fee rate is based upon the monthly average net assets of a group of registered investment companies with which the investment adviser has management contracts. The group fee rate decreases as assets under management increase and increases as assets under management decrease. For the reporting period, the total annualized management fee rate was .68% of the Fund's average net assets.
Transfer Agent Fees. Fidelity Investments Institutional Operations Company LLC (FIIOC), an affiliate of the investment adviser, is the Fund's transfer, dividend disbursing and shareholder servicing agent. FIIOC receives account fees and asset-based fees that vary according to account size and type of account. FIIOC pays for typesetting, printing and mailing of shareholder reports, except proxy statements. For the period, the transfer agent fees were equivalent to an annualized rate of .16% of average net assets.
Accounting Fees. Fidelity Service Company, Inc. (FSC), an affiliate of the investment adviser, maintains the Fund's accounting records. The accounting fee is based on the level of average net assets for each month. For the period, the fees were equivalent to the following annualized rates:
| | % of Average Net Assets |
| Fidelity Japan Smaller Companies Fund | .05 |
Interfund Trades. Funds may purchase from or sell securities to other Fidelity Funds under procedures adopted by the Board. The procedures have been designed to ensure these interfund trades are executed in accordance with Rule 17a-7 of the 1940 Act. Any interfund trades are included within the respective purchases and sales amounts shown in the Purchases and Sales of Investments note. Interfund trades during the period are noted in the table below.
| | Purchases ($) | Sales ($) | Realized Gain (Loss) ($) |
| Fidelity Japan Smaller Companies Fund | 350,332 | 2,844,323 | 621,258 |
6. Committed Line of Credit.
Certain Funds participate with other funds managed by the investment adviser or an affiliate in a $4.25 billion credit facility (the "line of credit") to be utilized for temporary or emergency purposes to fund shareholder redemptions or for other short-term liquidity purposes. The participating funds have agreed to pay commitment fees on their pro-rata portion of the line of credit, which are reflected in Miscellaneous expenses on the Statement of Operations, and are listed below. During the period, there were no borrowings on this line of credit.
| | Amount |
| Fidelity Japan Smaller Companies Fund | $381 |
7. Security Lending.
Funds lend portfolio securities from time to time in order to earn additional income. Lending agents are used, including National Financial Services (NFS), an affiliate of the investment adviser. Pursuant to a securities lending agreement, NFS will receive a fee, which is capped at 9.9% of a fund's daily lending revenue, for its services as lending agent. A fund may lend securities to certain qualified borrowers, including NFS. On the settlement date of the loan, a fund receives collateral (in the form of U.S. Treasury obligations, letters of credit and/or cash) against the loaned securities and maintains collateral in an amount not less than 100% of the market value of the loaned securities during the period of the loan. The market value of the loaned securities is determined at the close of business of a fund and any additional required collateral is delivered to a fund on the next business day. A fund or borrower may terminate the loan at any time, and if the borrower defaults on its obligation to return the securities loaned because of insolvency or other reasons, a fund may apply collateral received from the borrower against the obligation. A fund may experience delays and costs in recovering the securities loaned. Any cash collateral received is invested in the Fidelity Securities Lending Cash Central Fund. Any loaned securities are identified as such in the Schedule of Investments, and the value of loaned securities and cash collateral at period end, as applicable, are presented in the Statement of Assets and Liabilities. Security lending income represents the income earned on investing cash collateral, less rebates paid to borrowers and any lending agent fees associated with the loan, plus any premium payments received for lending certain types of securities. Security lending income is presented in the Statement of Operations as a component of income from Fidelity Central Funds. Affiliated security lending activity, if any, was as follows:
| | Total Security Lending Fees Paid to NFS | Security Lending Income From Securities Loaned to NFS | Value of Securities Loaned to NFS at Period End |
| Fidelity Japan Smaller Companies Fund | $8,105 | $- | $- |
8. Expense Reductions.
Through arrangements with the Fund's custodian, credits realized as a result of certain uninvested cash balances were used to reduce the Fund's expenses by $10.
In addition, during the period the investment adviser or an affiliate reimbursed and/or waived a portion of operating expenses in the amount of $8,988.
9. Other.
A fund's organizational documents provide former and current trustees and officers with a limited indemnification against liabilities arising in connection with the performance of their duties to the fund. In the normal course of business, a fund may also enter into contracts that provide general indemnifications. A fund's maximum exposure under these arrangements is unknown as this would be dependent on future claims that may be made against a fund. The risk of material loss from such claims is considered remote.
At the end of the period, the following mutual funds managed by the investment adviser or its affiliates were the owners of record of 10% or more of the total outstanding shares.
| | Strategic Advisers Fidelity International Fund | Strategic Advisers International Fund | VIP FundsManager 50% Portfolio | VIP FundsManager 60% Portfolio |
| Fidelity Japan Smaller Companies Fund | 11% | 23% | 10% | 11% |
Mutual funds managed by the investment adviser or its affiliates, in aggregate, were the owners of record of more than 20% of the total outstanding shares.
| Fund | % of shares held |
| Fidelity Japan Smaller Companies Fund | 60% |
10. Risk and Uncertainties.
Many factors affect a fund's performance. Developments that disrupt global economies and financial markets, such as pandemics, epidemics, outbreaks of infectious diseases, war, terrorism, and environmental disasters, may significantly affect a fund's investment performance. The effects of these developments to a fund will be impacted by the types of securities in which a fund invests, the financial condition, industry, economic sector, and geographic location of an issuer, and a fund's level of investment in the securities of that issuer. Significant concentrations in security types, issuers, industries, sectors, and geographic locations may magnify the factors that affect a fund's performance.
Top Holdings (% of Fund's net assets) |
| |
| Petroleo Brasileiro SA - Petrobras (PN) (non-vtg.) (Brazil, Oil, Gas & Consumable Fuels) | 9.8 | |
| Genomma Lab Internacional SA de CV (Mexico, Pharmaceuticals) | 9.1 | |
| Itausa-Investimentos Itau SA (PN) (Brazil, Banks) | 4.8 | |
| Intercorp Financial Services, Inc. (Peru, Banks) | 4.0 | |
| Hypera SA (Brazil, Pharmaceuticals) | 3.9 | |
| Afya Ltd. (Brazil, Diversified Consumer Services) | 3.8 | |
| Vamos Locacao de Caminhoes Maquinas e Equipamentos SA (Brazil, Ground Transportation) | 3.8 | |
| Equatorial Energia SA (Brazil, Electric Utilities) | 3.6 | |
| Pet Center Comercio e Participacoes SA (Brazil, Specialty Retail) | 3.6 | |
| Caixa Seguridade Participacoes (Brazil, Insurance) | 3.3 | |
| | 49.7 | |
| |
| Market Sectors (% of Fund's net assets) |
| |
| Financials | 28.3 | |
| Health Care | 19.2 | |
| Consumer Discretionary | 11.8 | |
| Energy | 9.8 | |
| Industrials | 9.6 | |
| Consumer Staples | 9.3 | |
| Materials | 6.7 | |
| Utilities | 3.6 | |
| |
Market Sectors may include more than one industry category.
The Fund may invest up to 35% of its total assets in any industry that represents more than 20% of the Latin American market. As of April 30, 2023, the Fund did not have more than 25% of its total assets invested in any one industry.
Asset Allocation (% of Fund's net assets) |
|
|
Geographic Diversification (% of Fund's net assets) |
|
* Includes Short-Term investments and Net Other Assets (Liabilities). Percentages are adjusted for the effect of derivatives, if applicable. |
| |
Fidelity® Latin America Fund
Showing Percentage of Net Assets
| Common Stocks - 79.4% |
| | | Shares | Value ($) |
| Brazil - 45.2% | | | |
| Afya Ltd. (a)(b) | | 822,361 | 9,465,375 |
| Atacadao SA | | 3,219,093 | 6,937,979 |
| Blau Farmaceutica SA | | 1,509,604 | 6,016,867 |
| Caixa Seguridade Participacoes | | 4,384,392 | 8,315,560 |
| CM Hospitalar SA | | 1,549,891 | 4,934,494 |
| Equatorial Energia SA | | 1,645,536 | 9,019,799 |
| Hapvida Participacoes e Investimentos SA (a)(c) | | 8,030,761 | 4,443,823 |
| Hypera SA | | 1,285,631 | 9,601,378 |
| Localiza Rent a Car SA | | 593,823 | 6,906,386 |
| Localiza Rent a Car SA rights 5/11/23 (a) | | 2,657 | 9,141 |
| Lojas Renner SA | | 1,175,944 | 3,734,503 |
| PagSeguro Digital Ltd. (a) | | 289,111 | 2,844,852 |
| Pet Center Comercio e Participacoes SA | | 7,255,469 | 8,975,148 |
| Sendas Distribuidora SA | | 3,135,680 | 7,726,354 |
| Vamos Locacao de Caminhoes Maquinas e Equipamentos SA | | 3,812,545 | 9,340,651 |
| Vasta Platform Ltd. (a)(b) | | 1,725,714 | 7,196,227 |
| XP, Inc. Class A (a) | | 488,195 | 6,976,307 |
TOTAL BRAZIL | | | 112,444,844 |
| Chile - 0.6% | | | |
| Sociedad Quimica y Minera de Chile SA (PN-B) sponsored ADR | | 20,636 | 1,392,517 |
| Mexico - 22.3% | | | |
| Banco del Bajio SA (c) | | 1,705,072 | 5,609,445 |
| Becle S.A.B. de CV (b) | | 2,456,905 | 5,670,990 |
| Genomma Lab Internacional SA de CV | | 27,398,469 | 22,766,658 |
| Grupo Aeroportuario Norte S.A.B. de CV | | 673,550 | 7,404,011 |
| Qualitas Controladora S.A.B. de CV | | 1,169,915 | 7,733,496 |
| Regional S.A.B. de CV | | 848,377 | 6,212,954 |
TOTAL MEXICO | | | 55,397,554 |
| Peru - 4.0% | | | |
| Intercorp Financial Services, Inc. | | 448,354 | 10,029,679 |
| Sweden - 1.1% | | | |
| VEF AB (a) | | 14,010,796 | 2,866,359 |
| United Kingdom - 1.1% | | | |
| British American Tobacco PLC (United Kingdom) | | 74,693 | 2,759,592 |
| United States of America - 2.1% | | | |
| FirstCash Holdings, Inc. | | 51,321 | 5,287,603 |
| Zambia - 3.0% | | | |
| First Quantum Minerals Ltd. | | 305,762 | 7,429,372 |
| TOTAL COMMON STOCKS (Cost $224,940,716) | | | 197,607,520 |
| | | | |
| Nonconvertible Preferred Stocks - 18.9% |
| | | Shares | Value ($) |
| Brazil - 18.9% | | | |
| Banco Bradesco SA (PN) | | 1,058,640 | 2,939,605 |
| Itausa-Investimentos Itau SA (PN) | | 6,901,775 | 12,010,788 |
| Metalurgica Gerdau SA (PN) | | 3,304,769 | 7,725,572 |
| Petroleo Brasileiro SA - Petrobras (PN) (non-vtg.) | | 5,100,934 | 24,237,565 |
| | | | |
| TOTAL NONCONVERTIBLE PREFERRED STOCKS (Cost $41,343,215) | | | 46,913,530 |
| | | | |
| Money Market Funds - 0.3% |
| | | Shares | Value ($) |
| Fidelity Cash Central Fund 4.88% (d) | | 302,215 | 302,275 |
| Fidelity Securities Lending Cash Central Fund 4.88% (d)(e) | | 372,602 | 372,639 |
| TOTAL MONEY MARKET FUNDS (Cost $674,914) | | | 674,914 |
| | | | |
| TOTAL INVESTMENT IN SECURITIES - 98.6% (Cost $266,958,845) | 245,195,964 |
NET OTHER ASSETS (LIABILITIES) - 1.4% | 3,560,898 |
| NET ASSETS - 100.0% | 248,756,862 |
| | |
Legend
| (b) | Security or a portion of the security is on loan at period end. |
| (c) | Security exempt from registration under Rule 144A of the Securities Act of 1933. These securities may be resold in transactions exempt from registration, normally to qualified institutional buyers. At the end of the period, the value of these securities amounted to $10,053,268 or 4.0% of net assets. |
| (d) | Affiliated fund that is generally available only to investment companies and other accounts managed by Fidelity Investments. The rate quoted is the annualized seven-day yield of the fund at period end. A complete unaudited listing of the fund's holdings as of its most recent quarter end is available upon request. In addition, each Fidelity Central Fund's financial statements are available on the SEC's website or upon request. |
| (e) | Investment made with cash collateral received from securities on loan. |
Affiliated Central Funds
Fiscal year to date information regarding the Fund's investments in Fidelity Central Funds, including the ownership percentage, is presented below.
| Affiliate | Value, beginning of period ($) | Purchases ($) | Sales Proceeds ($) | Dividend Income ($) | Realized Gain (loss) ($) | Change in Unrealized appreciation (depreciation) ($) | Value, end of period ($) | % ownership, end of period |
| Fidelity Cash Central Fund 4.88% | 647,124 | 25,566,491 | 25,911,340 | 17,358 | - | - | 302,275 | 0.0% |
| Fidelity Securities Lending Cash Central Fund 4.88% | 1,102,930 | 29,027,905 | 29,758,196 | 13,307 | - | - | 372,639 | 0.0% |
| Total | 1,750,054 | 54,594,396 | 55,669,536 | 30,665 | - | - | 674,914 | |
| | | | | | | | | |
Amounts in the dividend income column in the above table include any capital gain distributions from underlying funds, which are presented in the corresponding line item in the Statement of Operations, if applicable.
Amounts in the dividend income column for Fidelity Securities Lending Cash Central Fund represents the income earned on investing cash collateral, less rebates paid to borrowers and any lending agent fees associated with the loan, plus any premium payments received for lending certain types of securities.
Amounts included in the purchases and sales proceeds columns may include in-kind transactions, if applicable.
Investment Valuation
The following is a summary of the inputs used, as of April 30, 2023, involving the Fund's assets and liabilities carried at fair value. The inputs or methodology used for valuing securities may not be an indication of the risk associated with investing in those securities. For more information on valuation inputs, and their aggregation into the levels used below, please refer to the Investment Valuation section in the accompanying Notes to Financial Statements.
| Valuation Inputs at Reporting Date: |
| Description | Total ($) | Level 1 ($) | Level 2 ($) | Level 3 ($) |
Investments in Securities: | | | | |
|
| Equities: | | | | |
Consumer Discretionary | 29,371,253 | 29,371,253 | - | - |
Consumer Staples | 23,094,915 | 20,335,323 | 2,759,592 | - |
Energy | 24,237,565 | 24,237,565 | - | - |
Financials | 70,826,648 | 70,826,648 | - | - |
Health Care | 47,763,220 | 47,763,220 | - | - |
Industrials | 23,660,189 | 23,660,189 | - | - |
Materials | 16,547,461 | 16,547,461 | - | - |
Utilities | 9,019,799 | 9,019,799 | - | - |
|
| Money Market Funds | 674,914 | 674,914 | - | - |
| Total Investments in Securities: | 245,195,964 | 242,436,372 | 2,759,592 | - |
Fidelity® Latin America Fund
| Statement of Assets and Liabilities |
| | | | April 30, 2023 (Unaudited) |
| | | | | |
| Assets | | | | |
| Investment in securities, at value (including securities loaned of $330,807) - See accompanying schedule: | | | | |
Unaffiliated issuers (cost $266,283,931) | $ | 244,521,050 | | |
Fidelity Central Funds (cost $674,914) | | 674,914 | | |
| | | | | |
| | | | | |
| Total Investment in Securities (cost $266,958,845) | | | $ | 245,195,964 |
| Receivable for fund shares sold | | | | 83,211 |
| Dividends receivable | | | | 4,533,690 |
| Distributions receivable from Fidelity Central Funds | | | | 5,680 |
| Prepaid expenses | | | | 101 |
Total assets | | | | 249,818,646 |
| Liabilities | | | | |
| Payable for fund shares redeemed | $ | 429,099 | | |
| Accrued management fee | | 139,283 | | |
| Distribution and service plan fees payable | | 4,398 | | |
| Other affiliated payables | | 63,008 | | |
| Other payables and accrued expenses | | 55,937 | | |
| Collateral on securities loaned | | 370,059 | | |
| Total Liabilities | | | | 1,061,784 |
| Net Assets | | | $ | 248,756,862 |
| Net Assets consist of: | | | | |
| Paid in capital | | | $ | 339,111,428 |
| Total accumulated earnings (loss) | | | | (90,354,566) |
| Net Assets | | | $ | 248,756,862 |
| | | | | |
| Net Asset Value and Maximum Offering Price | | | | |
| Class A : | | | | |
Net Asset Value and redemption price per share ($12,027,572 ÷ 666,867 shares) (a) | | | $ | 18.04 |
| Maximum offering price per share (100/94.25 of $18.04) | | | $ | 19.14 |
| Class M : | | | | |
Net Asset Value and redemption price per share ($2,735,556 ÷ 151,280 shares) (a) | | | $ | 18.08 |
| Maximum offering price per share (100/96.50 of $18.08) | | | $ | 18.74 |
| Class C : | | | | |
Net Asset Value and offering price per share ($1,025,631 ÷ 56,166 shares) (a) | | | $ | 18.26 |
| Latin America : | | | | |
Net Asset Value , offering price and redemption price per share ($228,957,561 ÷ 12,722,710 shares) | | | $ | 18.00 |
| Class I : | | | | |
Net Asset Value , offering price and redemption price per share ($3,354,333 ÷ 186,640 shares) | | | $ | 17.97 |
| Class Z : | | | | |
Net Asset Value , offering price and redemption price per share ($656,209 ÷ 36,393 shares) | | | $ | 18.03 |
(a)Redemption price per share is equal to net asset value less any applicable contingent deferred sales charge. |
| Statement of Operations |
| | | | Six months ended April 30, 2023 (Unaudited) |
| Investment Income | | | | |
| Dividends | | | $ | 11,069,085 |
| Income from Fidelity Central Funds (including $13,307 from security lending) | | | | 30,665 |
| Income before foreign taxes withheld | | | $ | 11,099,750 |
| Less foreign taxes withheld | | | | (377,585) |
| Total Income | | | | 10,722,165 |
| Expenses | | | | |
| Management fee | $ | 881,582 | | |
| Transfer agent fees | | 328,692 | | |
| Distribution and service plan fees | | 26,950 | | |
| Accounting fees | | 64,906 | | |
| Custodian fees and expenses | | 47,637 | | |
| Independent trustees' fees and expenses | | 869 | | |
| Registration fees | | 44,701 | | |
| Audit | | 34,297 | | |
| Legal | | 204 | | |
| Miscellaneous | | 570 | | |
| Total expenses before reductions | | 1,430,408 | | |
| Expense reductions | | (6,231) | | |
| Total expenses after reductions | | | | 1,424,177 |
| Net Investment income (loss) | | | | 9,297,988 |
| Realized and Unrealized Gain (Loss) | | | | |
| Net realized gain (loss) on: | | | | |
| Investment Securities: | | | | |
| Unaffiliated issuers | | 9,836,487 | | |
| Foreign currency transactions | | 123,383 | | |
| Total net realized gain (loss) | | | | 9,959,870 |
| Change in net unrealized appreciation (depreciation) on: | | | | |
| Investment Securities: | | | | |
| Unaffiliated issuers | | (40,047,872) | | |
| Assets and liabilities in foreign currencies | | 23,463 | | |
| Total change in net unrealized appreciation (depreciation) | | | | (40,024,409) |
| Net gain (loss) | | | | (30,064,539) |
| Net increase (decrease) in net assets resulting from operations | | | $ | (20,766,551) |
| Statement of Changes in Net Assets |
| |
| | Six months ended April 30, 2023 (Unaudited) | | Year ended October 31, 2022 |
| Increase (Decrease) in Net Assets | | | | |
| Operations | | | | |
| Net investment income (loss) | $ | 9,297,988 | $ | 24,063,331 |
| Net realized gain (loss) | | 9,959,870 | | (14,063,333) |
| Change in net unrealized appreciation (depreciation) | | (40,024,409) | | 19,797,722 |
| Net increase (decrease) in net assets resulting from operations | | (20,766,551) | | 29,797,720 |
| Distributions to shareholders | | (21,810,362) | | (7,964,894) |
| Share transactions - net increase (decrease) | | 6,618,816 | | (30,282,037) |
| Total increase (decrease) in net assets | | (35,958,097) | | (8,449,211) |
| | | | | |
| Net Assets | | | | |
| Beginning of period | | 284,714,959 | | 293,164,170 |
| End of period | $ | 248,756,862 | $ | 284,714,959 |
| | | | | |
| | | | | |
Financial Highlights
| Fidelity Advisor® Latin America Fund Class A |
| |
| | Six months ended (Unaudited) April 30, 2023 | | Years ended October 31, 2022 | | 2021 | | 2020 | | 2019 | | 2018 |
Selected Per-Share Data | | | | | | | | | | | | |
| Net asset value, beginning of period | $ | 21.18 | $ | 19.37 | $ | 17.40 | $ | 28.36 | $ | 21.98 | $ | 24.93 |
| Income from Investment Operations | | | | | | | | | | | | |
Net investment income (loss) A,B | | .64 | | 1.60 | | .15 | | .04 | | .69 | | .50 |
| Net realized and unrealized gain (loss) | | (2.20) | | .68 | | 1.82 | | (10.40) | | 6.11 | | (3.16) |
| Total from investment operations | | (1.56) | | 2.28 | | 1.97 | | (10.36) | | 6.80 | | (2.66) |
| Distributions from net investment income | | (1.58) | | (.47) | | - C | | (.60) | | (.42) | | (.29) |
| Total distributions | | (1.58) | | (.47) | | - C | | (.60) | | (.42) | | (.29) |
Redemption fees added to paid in capital A | | - | | - | | - | | - | | - | | - C |
| Net asset value, end of period | $ | 18.04 | $ | 21.18 | $ | 19.37 | $ | 17.40 | $ | 28.36 | $ | 21.98 |
Total Return D,E,F | | (7.30)% | | 12.17% | | 11.34% | | (37.31)% | | 31.60% | | (10.78)% |
Ratios to Average Net Assets B,G,H | | | | | | | | | | | | |
| Expenses before reductions | | 1.34% I | | 1.32% | | 1.33% | | 1.36% | | 1.36% | | 1.38% |
| Expenses net of fee waivers, if any | | 1.33% I | | 1.32% | | 1.33% | | 1.35% | | 1.36% | | 1.38% |
| Expenses net of all reductions | | 1.33% I | | 1.32% | | 1.33% | | 1.33% | | 1.36% | | 1.36% |
| Net investment income (loss) | | 6.90% I | | 7.98% | | .70% | | .18% | | 2.81% | | 2.08% |
| Supplemental Data | | | | | | | | | | | | |
| Net assets, end of period (000 omitted) | $ | 12,028 | $ | 13,309 | $ | 10,217 | $ | 9,131 | $ | 17,953 | $ | 14,157 |
Portfolio turnover rate J | | 41% I | | 48% | | 33% | | 54% | | 48% | | 53% |
A Calculated based on average shares outstanding during the period.
B Net investment income (loss) is affected by the timing of the declaration of dividends by any underlying mutual funds or exchange-traded funds (ETFs). Net investment income (loss) of any mutual funds or ETFs is not included in the Fund's net investment income (loss) ratio.
C Amount represents less than $.005 per share.
D Total returns for periods of less than one year are not annualized.
E Total returns would have been lower if certain expenses had not been reduced during the applicable periods shown.
F Total returns do not include the effect of the sales charges.
G Fees and expenses of any underlying mutual funds or exchange-traded funds (ETFs) are not included in the Fund's expense ratio. The Fund indirectly bears its proportionate share of these expenses. For additional expense information related to investments in Fidelity Central Funds, please refer to the "Investments in Fidelity Central Funds" note found in the Notes to Financial Statements section of the most recent Annual or Semi-Annual report.
H Expense ratios reflect operating expenses of the class. Expenses before reductions do not reflect amounts reimbursed, waived, or reduced through arrangements with the investment adviser, brokerage services, or other offset arrangements, if applicable, and do not represent the amount paid by the class during periods when reimbursements, waivers or reductions occur.
I Annualized.
J Amount does not include the portfolio activity of any underlying mutual funds or exchange-traded funds (ETFs).
| Fidelity Advisor® Latin America Fund Class M |
| |
| | Six months ended (Unaudited) April 30, 2023 | | Years ended October 31, 2022 | | 2021 | | 2020 | | 2019 | | 2018 |
Selected Per-Share Data | | | | | | | | | | | | |
| Net asset value, beginning of period | $ | 21.19 | $ | 19.35 | $ | 17.44 | $ | 28.41 | $ | 22.00 | $ | 24.96 |
| Income from Investment Operations | | | | | | | | | | | | |
Net investment income (loss) A,B | | .62 | | 1.55 | | .10 | | (.02) | | .63 | | .43 |
| Net realized and unrealized gain (loss) | | (2.20) | | .69 | | 1.81 | | (10.42) | | 6.13 | | (3.16) |
| Total from investment operations | | (1.58) | | 2.24 | | 1.91 | | (10.44) | | 6.76 | | (2.73) |
| Distributions from net investment income | | (1.53) | | (.40) | | - | | (.53) | | (.35) | | (.23) |
| Total distributions | | (1.53) | | (.40) | | - | | (.53) | | (.35) | | (.23) |
Redemption fees added to paid in capital A | | - | | - | | - | | - | | - | | - C |
| Net asset value, end of period | $ | 18.08 | $ | 21.19 | $ | 19.35 | $ | 17.44 | $ | 28.41 | $ | 22.00 |
Total Return D,E,F | | (7.43)% | | 11.92% | | 10.95% | | (37.45)% | | 31.26% | | (11.04)% |
Ratios to Average Net Assets B,G,H | | | | | | | | | | | | |
| Expenses before reductions | | 1.59% I | | 1.58% | | 1.59% | | 1.62% | | 1.64% | | 1.66% |
| Expenses net of fee waivers, if any | | 1.58% I | | 1.58% | | 1.59% | | 1.61% | | 1.63% | | 1.66% |
| Expenses net of all reductions | | 1.55% I | | 1.58% | | 1.59% | | 1.59% | | 1.63% | | 1.63% |
| Net investment income (loss) | | 6.68% I | | 7.72% | | .44% | | (.09)% | | 2.54% | | 1.80% |
| Supplemental Data | | | | | | | | | | | | |
| Net assets, end of period (000 omitted) | $ | 2,736 | $ | 3,024 | $ | 2,701 | $ | 2,912 | $ | 6,032 | $ | 5,098 |
Portfolio turnover rate J | | 41% I | | 48% | | 33% | | 54% | | 48% | | 53% |
A Calculated based on average shares outstanding during the period.
B Net investment income (loss) is affected by the timing of the declaration of dividends by any underlying mutual funds or exchange-traded funds (ETFs). Net investment income (loss) of any mutual funds or ETFs is not included in the Fund's net investment income (loss) ratio.
C Amount represents less than $.005 per share.
D Total returns for periods of less than one year are not annualized.
E Total returns would have been lower if certain expenses had not been reduced during the applicable periods shown.
F Total returns do not include the effect of the sales charges.
G Fees and expenses of any underlying mutual funds or exchange-traded funds (ETFs) are not included in the Fund's expense ratio. The Fund indirectly bears its proportionate share of these expenses. For additional expense information related to investments in Fidelity Central Funds, please refer to the "Investments in Fidelity Central Funds" note found in the Notes to Financial Statements section of the most recent Annual or Semi-Annual report.
H Expense ratios reflect operating expenses of the class. Expenses before reductions do not reflect amounts reimbursed, waived, or reduced through arrangements with the investment adviser, brokerage services, or other offset arrangements, if applicable, and do not represent the amount paid by the class during periods when reimbursements, waivers or reductions occur.
I Annualized.
J Amount does not include the portfolio activity of any underlying mutual funds or exchange-traded funds (ETFs).
| Fidelity Advisor® Latin America Fund Class C |
| |
| | Six months ended (Unaudited) April 30, 2023 | | Years ended October 31, 2022 | | 2021 | | 2020 | | 2019 | | 2018 |
Selected Per-Share Data | | | | | | | | | | | | |
| Net asset value, beginning of period | $ | 21.33 | $ | 19.45 | $ | 17.61 | $ | 28.67 | $ | 22.16 | $ | 25.12 |
| Income from Investment Operations | | | | | | | | | | | | |
Net investment income (loss) A,B | | .58 | | 1.46 | | (.01) | | (.13) | | .51 | | .32 |
| Net realized and unrealized gain (loss) | | (2.22) | | .71 | | 1.85 | | (10.56) | | 6.21 | | (3.18) |
| Total from investment operations | | (1.64) | | 2.17 | | 1.84 | | (10.69) | | 6.72 | | (2.86) |
| Distributions from net investment income | | (1.43) | | (.29) | | - | | (.37) | | (.21) | | (.10) |
| Total distributions | | (1.43) | | (.29) | | - | | (.37) | | (.21) | | (.10) |
Redemption fees added to paid in capital A | | - | | - | | - | | - | | - | | - C |
| Net asset value, end of period | $ | 18.26 | $ | 21.33 | $ | 19.45 | $ | 17.61 | $ | 28.67 | $ | 22.16 |
Total Return D,E,F | | (7.66)% | | 11.36% | | 10.45% | | (37.78)% | | 30.62% | | (11.43)% |
Ratios to Average Net Assets B,G,H | | | | | | | | | | | | |
| Expenses before reductions | | 2.09% I | | 2.08% | | 2.08% | | 2.11% | | 2.12% | | 2.13% |
| Expenses net of fee waivers, if any | | 2.08% I | | 2.07% | | 2.08% | | 2.11% | | 2.12% | | 2.13% |
| Expenses net of all reductions | | 2.08% I | | 2.07% | | 2.08% | | 2.09% | | 2.12% | | 2.11% |
| Net investment income (loss) | | 6.15% I | | 7.22% | | (.05)% | | (.58)% | | 2.06% | | 1.33% |
| Supplemental Data | | | | | | | | | | | | |
| Net assets, end of period (000 omitted) | $ | 1,026 | $ | 946 | $ | 656 | $ | 810 | $ | 3,438 | $ | 3,498 |
Portfolio turnover rate J | | 41% I | | 48% | | 33% | | 54% | | 48% | | 53% |
A Calculated based on average shares outstanding during the period.
B Net investment income (loss) is affected by the timing of the declaration of dividends by any underlying mutual funds or exchange-traded funds (ETFs). Net investment income (loss) of any mutual funds or ETFs is not included in the Fund's net investment income (loss) ratio.
C Amount represents less than $.005 per share.
D Total returns for periods of less than one year are not annualized.
E Total returns would have been lower if certain expenses had not been reduced during the applicable periods shown.
F Total returns do not include the effect of the contingent deferred sales charge.
G Fees and expenses of any underlying mutual funds or exchange-traded funds (ETFs) are not included in the Fund's expense ratio. The Fund indirectly bears its proportionate share of these expenses. For additional expense information related to investments in Fidelity Central Funds, please refer to the "Investments in Fidelity Central Funds" note found in the Notes to Financial Statements section of the most recent Annual or Semi-Annual report.
H Expense ratios reflect operating expenses of the class. Expenses before reductions do not reflect amounts reimbursed, waived, or reduced through arrangements with the investment adviser, brokerage services, or other offset arrangements, if applicable, and do not represent the amount paid by the class during periods when reimbursements, waivers or reductions occur.
I Annualized.
J Amount does not include the portfolio activity of any underlying mutual funds or exchange-traded funds (ETFs).
| Fidelity® Latin America Fund |
| |
| | Six months ended (Unaudited) April 30, 2023 | | Years ended October 31, 2022 | | 2021 | | 2020 | | 2019 | | 2018 |
Selected Per-Share Data | | | | | | | | | | | | |
| Net asset value, beginning of period | $ | 21.17 | $ | 19.36 | $ | 17.36 | $ | 28.30 | $ | 21.94 | $ | 24.89 |
| Income from Investment Operations | | | | | | | | | | | | |
Net investment income (loss) A,B | | .66 | | 1.65 | | .22 | | .10 | | .77 | | .57 |
| Net realized and unrealized gain (loss) | | (2.20) | | .69 | | 1.79 | | (10.36) | | 6.09 | | (3.15) |
| Total from investment operations | | (1.54) | | 2.34 | | 2.01 | | (10.26) | | 6.86 | | (2.58) |
| Distributions from net investment income | | (1.63) | | (.53) | | (.01) | | (.68) | | (.50) | | (.37) |
| Total distributions | | (1.63) | | (.53) | | (.01) | | (.68) | | (.50) | | (.37) |
Redemption fees added to paid in capital A | | - | | - | | - | | - | | - | | - C |
| Net asset value, end of period | $ | 18.00 | $ | 21.17 | $ | 19.36 | $ | 17.36 | $ | 28.30 | $ | 21.94 |
Total Return D,E | | (7.21)% | | 12.55% | | 11.58% | | (37.13)% | | 32.06% | | (10.50)% |
Ratios to Average Net Assets B,F,G | | | | | | | | | | | | |
| Expenses before reductions | | 1.08% H | | 1.06% | | 1.04% | | 1.05% | | 1.05% | | 1.07% |
| Expenses net of fee waivers, if any | | 1.07% H | | 1.05% | | 1.04% | | 1.05% | | 1.04% | | 1.07% |
| Expenses net of all reductions | | 1.07% H | | 1.05% | | 1.04% | | 1.03% | | 1.04% | | 1.05% |
| Net investment income (loss) | | 7.16% H | | 8.24% | | .99% | | .48% | | 3.13% | | 2.39% |
| Supplemental Data | | | | | | | | | | | | |
| Net assets, end of period (000 omitted) | $ | 228,958 | $ | 262,361 | $ | 262,484 | $ | 277,942 | $ | 517,901 | $ | 445,845 |
Portfolio turnover rate I | | 41% H | | 48% | | 33% | | 54% | | 48% | | 53% |
A Calculated based on average shares outstanding during the period.
B Net investment income (loss) is affected by the timing of the declaration of dividends by any underlying mutual funds or exchange-traded funds (ETFs). Net investment income (loss) of any mutual funds or ETFs is not included in the Fund's net investment income (loss) ratio.
C Amount represents less than $.005 per share.
D Total returns for periods of less than one year are not annualized.
E Total returns would have been lower if certain expenses had not been reduced during the applicable periods shown.
F Fees and expenses of any underlying mutual funds or exchange-traded funds (ETFs) are not included in the Fund's expense ratio. The Fund indirectly bears its proportionate share of these expenses. For additional expense information related to investments in Fidelity Central Funds, please refer to the "Investments in Fidelity Central Funds" note found in the Notes to Financial Statements section of the most recent Annual or Semi-Annual report.
G Expense ratios reflect operating expenses of the class. Expenses before reductions do not reflect amounts reimbursed, waived, or reduced through arrangements with the investment adviser, brokerage services, or other offset arrangements, if applicable, and do not represent the amount paid by the class during periods when reimbursements, waivers or reductions occur.
H Annualized.
I Amount does not include the portfolio activity of any underlying mutual funds or exchange-traded funds (ETFs).
| Fidelity Advisor® Latin America Fund Class I |
| |
| | Six months ended (Unaudited) April 30, 2023 | | Years ended October 31, 2022 | | 2021 | | 2020 | | 2019 | | 2018 |
Selected Per-Share Data | | | | | | | | | | | | |
| Net asset value, beginning of period | $ | 21.15 | $ | 19.34 | $ | 17.34 | $ | 28.28 | $ | 21.92 | $ | 24.88 |
| Income from Investment Operations | | | | | | | | | | | | |
Net investment income (loss) A,B | | .66 | | 1.67 | | .23 | | .12 | | .78 | | .59 |
| Net realized and unrealized gain (loss) | | (2.20) | | .67 | | 1.78 | | (10.34) | | 6.08 | | (3.15) |
| Total from investment operations | | (1.54) | | 2.34 | | 2.01 | | (10.22) | | 6.86 | | (2.56) |
| Distributions from net investment income | | (1.64) | | (.53) | | (.01) | | (.72) | | (.50) | | (.40) |
| Total distributions | | (1.64) | | (.53) | | (.01) | | (.72) | | (.50) | | (.40) |
Redemption fees added to paid in capital A | | - | | - | | - | | - | | - | | - C |
| Net asset value, end of period | $ | 17.97 | $ | 21.15 | $ | 19.34 | $ | 17.34 | $ | 28.28 | $ | 21.92 |
Total Return D,E | | (7.21)% | | 12.57% | | 11.60% | | (37.07)% | | 32.09% | | (10.44)% |
Ratios to Average Net Assets B,F,G | | | | | | | | | | | | |
| Expenses before reductions | | 1.05% H | | 1.02% | | 1.00% | | .99% | | 1.01% | | 1.01% |
| Expenses net of fee waivers, if any | | 1.04% H | | 1.02% | | 1.00% | | .99% | | 1.00% | | 1.01% |
| Expenses net of all reductions | | 1.04% H | | 1.02% | | 1.00% | | .97% | | 1.00% | | .98% |
| Net investment income (loss) | | 7.19% H | | 8.28% | | 1.04% | | .54% | | 3.17% | | 2.45% |
| Supplemental Data | | | | | | | | | | | | |
| Net assets, end of period (000 omitted) | $ | 3,354 | $ | 3,960 | $ | 2,768 | $ | 3,508 | $ | 7,124 | $ | 4,546 |
Portfolio turnover rate I | | 41% H | | 48% | | 33% | | 54% | | 48% | | 53% |
A Calculated based on average shares outstanding during the period.
B Net investment income (loss) is affected by the timing of the declaration of dividends by any underlying mutual funds or exchange-traded funds (ETFs). Net investment income (loss) of any mutual funds or ETFs is not included in the Fund's net investment income (loss) ratio.
C Amount represents less than $.005 per share.
D Total returns for periods of less than one year are not annualized.
E Total returns would have been lower if certain expenses had not been reduced during the applicable periods shown.
F Fees and expenses of any underlying mutual funds or exchange-traded funds (ETFs) are not included in the Fund's expense ratio. The Fund indirectly bears its proportionate share of these expenses. For additional expense information related to investments in Fidelity Central Funds, please refer to the "Investments in Fidelity Central Funds" note found in the Notes to Financial Statements section of the most recent Annual or Semi-Annual report.
G Expense ratios reflect operating expenses of the class. Expenses before reductions do not reflect amounts reimbursed, waived, or reduced through arrangements with the investment adviser, brokerage services, or other offset arrangements, if applicable, and do not represent the amount paid by the class during periods when reimbursements, waivers or reductions occur.
H Annualized.
I Amount does not include the portfolio activity of any underlying mutual funds or exchange-traded funds (ETFs).
| Fidelity Advisor® Latin America Fund Class Z |
| |
| | Six months ended (Unaudited) April 30, 2023 | | Years ended October 31, 2022 | | 2021 | | 2020 | | 2019 | | 2018 A |
Selected Per-Share Data | | | | | | | | | | | | |
| Net asset value, beginning of period | $ | 21.14 | $ | 19.35 | $ | 17.32 | $ | 28.24 | $ | 21.92 | $ | 21.51 |
| Income from Investment Operations | | | | | | | | | | | | |
Net investment income (loss) B,C | | .69 | | 1.70 | | .26 | | .14 | | .85 | | (.01) |
| Net realized and unrealized gain (loss) | | (2.20) | | .66 | | 1.79 | | (10.32) | | 6.03 | | .42 |
| Total from investment operations | | (1.51) | | 2.36 | | 2.05 | | (10.18) | | 6.88 | | .41 |
| Distributions from net investment income | | (1.60) | | (.57) | | (.02) | | (.74) | | (.56) | | - |
| Total distributions | | (1.60) | | (.57) | | (.02) | | (.74) | | (.56) | | - |
| Net asset value, end of period | $ | 18.03 | $ | 21.14 | $ | 19.35 | $ | 17.32 | $ | 28.24 | $ | 21.92 |
Total Return D,E | | (7.10)% | | 12.73% | | 11.82% | | (37.00)% | | 32.28% | | 1.91% |
Ratios to Average Net Assets C,F,G | | | | | | | | | | | | |
| Expenses before reductions | | .87% H | | .85% | | .85% | | .86% | | .86% | | .95% H |
| Expenses net of fee waivers, if any | | .86% H | | .85% | | .85% | | .86% | | .86% | | .95% H |
| Expenses net of all reductions | | .86% H | | .85% | | .85% | | .84% | | .86% | | .93% H |
| Net investment income (loss) | | 7.37% H | | 8.45% | | 1.19% | | .67% | | 3.31% | | (.37)% H |
| Supplemental Data | | | | | | | | | | | | |
| Net assets, end of period (000 omitted) | $ | 656 | $ | 1,115 | $ | 14,338 | $ | 13,520 | $ | 26,605 | $ | 145 |
Portfolio turnover rate I | | 41% H | | 48% | | 33% | | 54% | | 48% | | 53% |
A For the period October 2, 2018 (commencement of sale of shares) through October 31, 2018.
B Calculated based on average shares outstanding during the period.
C Net investment income (loss) is affected by the timing of the declaration of dividends by any underlying mutual funds or exchange-traded funds (ETFs). Net investment income (loss) of any mutual funds or ETFs is not included in the Fund's net investment income (loss) ratio.
D Total returns for periods of less than one year are not annualized.
E Total returns would have been lower if certain expenses had not been reduced during the applicable periods shown.
F Fees and expenses of any underlying mutual funds or exchange-traded funds (ETFs) are not included in the Fund's expense ratio. The Fund indirectly bears its proportionate share of these expenses. For additional expense information related to investments in Fidelity Central Funds, please refer to the "Investments in Fidelity Central Funds" note found in the Notes to Financial Statements section of the most recent Annual or Semi-Annual report.
G Expense ratios reflect operating expenses of the class. Expenses before reductions do not reflect amounts reimbursed, waived, or reduced through arrangements with the investment adviser, brokerage services, or other offset arrangements, if applicable, and do not represent the amount paid by the class during periods when reimbursements, waivers or reductions occur.
H Annualized.
I Amount does not include the portfolio activity of any underlying mutual funds or exchange-traded funds (ETFs).
For the period ended April 30, 2023
1. Organization.
Fidelity Latin America Fund (the Fund) is a non-diversified fund of Fidelity Investment Trust (the Trust) and is authorized to issue an unlimited number of shares. The Trust is registered under the Investment Company Act of 1940, as amended (the 1940 Act), as an open-end management investment company organized as a Massachusetts business trust. The Fund offers Class A, Class M, Class C, Latin America, Class I and Class Z shares, each of which has equal rights as to assets and voting privileges. Class A, Class M, Class C, Class I and Class Z are Fidelity Advisor classes. Each class has exclusive voting rights with respect to matters that affect that class. Class C shares will automatically convert to Class A shares after a holding period of eight years from the initial date of purchase, with certain exceptions. The Fund's investments in emerging markets can be subject to social, economic, regulatory, and political uncertainties and can be extremely volatile.
2. Investments in Fidelity Central Funds.
Funds may invest in Fidelity Central Funds, which are open-end investment companies generally available only to other investment companies and accounts managed by the investment adviser and its affiliates. The Schedule of Investments lists any Fidelity Central Funds held as an investment as of period end, but does not include the underlying holdings of each Fidelity Central Fund. An investing fund indirectly bears its proportionate share of the expenses of the underlying Fidelity Central Funds.
Based on its investment objective, each Fidelity Central Fund may invest or participate in various investment vehicles or strategies that are similar to those of the investing fund. These strategies are consistent with the investment objectives of the investing fund and may involve certain economic risks which may cause a decline in value of each of the Fidelity Central Funds and thus a decline in the value of the investing fund.
| Fidelity Central Fund | Investment Manager | Investment Objective | Investment Practices | Expense Ratio A |
| Fidelity Money Market Central Funds | Fidelity Management & Research Company LLC (FMR) | Each fund seeks to obtain a high level of current income consistent with the preservation of capital and liquidity. | Short-term Investments | Less than .005% |
A Expenses expressed as a percentage of average net assets and are as of each underlying Central Fund's most recent annual or semi-annual shareholder report.
A complete unaudited list of holdings for each Fidelity Central Fund is available upon request or at the Securities and Exchange Commission website at www.sec.gov. In addition, the financial statements of the Fidelity Central Funds which contain the significant accounting policies (including investment valuation policies) of those funds, and are not covered by the Report of Independent Registered Public Accounting Firm, are available on the Securities and Exchange Commission website or upon request.
3. Significant Accounting Policies.
The Fund is an investment company and applies the accounting and reporting guidance of the Financial Accounting Standards Board (FASB) Accounting Standards Codification Topic 946 Financial Services - Investment Companies . The financial statements have been prepared in conformity with accounting principles generally accepted in the United States of America (GAAP), which require management to make certain estimates and assumptions at the date of the financial statements. Actual results could differ from those estimates. Subsequent events, if any, through the date that the financial statements were issued have been evaluated in the preparation of the financial statements. The Fund's Schedule of Investments lists any underlying mutual funds or exchange-traded funds (ETFs) but does not include the underlying holdings of these funds. The following summarizes the significant accounting policies of the Fund:
Investment Valuation. Investments are valued as of 4:00 p.m. Eastern time on the last calendar day of the period. The Board of Trustees (the Board) has designated the Fund's investment adviser as the valuation designee responsible for the fair valuation function and performing fair value determinations as needed. The investment adviser has established a Fair Value Committee (the Committee) to carry out the day-to-day fair valuation responsibilities and has adopted policies and procedures to govern the fair valuation process and the activities of the Committee. In accordance with these fair valuation policies and procedures, which have been approved by the Board, the Fund attempts to obtain prices from one or more third party pricing services or brokers to value its investments. When current market prices, quotations or currency exchange rates are not readily available or reliable, investments will be fair valued in good faith by the Committee, in accordance with the policies and procedures. Factors used in determining fair value vary by investment type and may include market or investment specific events, transaction data, estimated cash flows, and market observations of comparable investments. The frequency that the fair valuation procedures are used cannot be predicted and they may be utilized to a significant extent. The Committee manages the Fund's fair valuation practices and maintains the fair valuation policies and procedures. The Fund's investment adviser reports to the Board information regarding the fair valuation process and related material matters.
The Fund categorizes the inputs to valuation techniques used to value its investments into a disclosure hierarchy consisting of three levels as shown below:
Level 1 - unadjusted quoted prices in active markets for identical investments
Level 2 - other significant observable inputs (including quoted prices for similar investments, interest rates, prepayment speeds, etc.)
Level 3 - unobservable inputs (including the Fund's own assumptions based on the best information available)
Valuation techniques used to value the Fund's investments by major category are as follows:
Equity securities, including restricted securities, for which market quotations are readily available, are valued at the last reported sale price or official closing price as reported by a third party pricing service on the primary market or exchange on which they are traded and are categorized as Level 1 in the hierarchy. In the event there were no sales during the day or closing prices are not available, securities are valued at the last quoted bid price or may be valued using the last available price and are generally categorized as Level 2 in the hierarchy. For foreign equity securities, when market or security specific events arise, comparisons to the valuation of American Depositary Receipts (ADRs), futures contracts, ETFs and certain indexes as well as quoted prices for similar securities may be used and would be categorized as Level 2 in the hierarchy. For equity securities, including restricted securities, where observable inputs are limited, assumptions about market activity and risk are used and these securities may be categorized as Level 3 in the hierarchy.
Investments in open-end mutual funds, including the Fidelity Central Funds, are valued at their closing net asset value (NAV) each business day and are categorized as Level 1 in the hierarchy.
Changes in valuation techniques may result in transfers in or out of an assigned level within the disclosure hierarchy. The aggregate value of investments by input level as of April 30, 2023 is included at the end of the Fund's Schedule of Investments.
Foreign Currency. Certain Funds may use foreign currency contracts to facilitate transactions in foreign-denominated securities. Gains and losses from these transactions may arise from changes in the value of the foreign currency or if the counterparties do not perform under the contracts' terms.
Foreign-denominated assets, including investment securities, and liabilities are translated into U.S. dollars at the exchange rates at period end. Purchases and sales of investment securities, income and dividends received, and expenses denominated in foreign currencies are translated into U.S. dollars at the exchange rate in effect on the transaction date.
The effects of exchange rate fluctuations on investments are included with the net realized and unrealized gain (loss) on investment securities. Other foreign currency transactions resulting in realized and unrealized gain (loss) are disclosed separately.
Investment Transactions and Income. For financial reporting purposes, the Fund's investment holdings and NAV include trades executed through the end of the last business day of the period. The NAV per share for processing shareholder transactions is calculated as of the close of business of the New York Stock Exchange (NYSE), normally 4:00 p.m. Eastern time and includes trades executed through the end of the prior business day. Gains and losses on securities sold are determined on the basis of identified cost and include proceeds received from litigation. Commissions paid to certain brokers with whom the investment adviser, or its affiliates, places trades on behalf of a fund include an amount in addition to trade execution, which may be rebated back to a fund. Any such rebates are included in net realized gain (loss) on investments in the Statement of Operations. Dividend income is recorded on the ex-dividend date, except for certain dividends from foreign securities where the ex-dividend date may have passed, which are recorded as soon as the Fund is informed of the ex-dividend date. Non-cash dividends included in dividend income, if any, are recorded at the fair market value of the securities received. Income and capital gain distributions from Fidelity Central Funds, if any, are recorded on the ex-dividend date. Investment income is recorded net of foreign taxes withheld where recovery of such taxes is uncertain.
Class Allocations and Expenses. Investment income, realized and unrealized capital gains and losses, common expenses of a fund, and certain fund-level expense reductions, if any, are allocated daily on a pro-rata basis to each class based on the relative net assets of each class to the total net assets of a fund. Each class differs with respect to transfer agent and distribution and service plan fees incurred, as applicable. Certain expense reductions may also differ by class, if applicable. For the reporting period, the allocated portion of income and expenses to each class as a percent of its average net assets may vary due to the timing of recording these transactions in relation to fluctuating net assets of the classes. Expenses directly attributable to a fund are charged to that fund. Expenses attributable to more than one fund are allocated among the respective funds on the basis of relative net assets or other appropriate methods. Expenses included in the accompanying financial statements reflect the expenses of that fund and do not include any expenses associated with any underlying mutual funds or exchange-traded funds. Although not included in a fund's expenses, a fund indirectly bears its proportionate share of these expenses through the net asset value of each underlying mutual fund or exchange-traded fund. Expense estimates are accrued in the period to which they relate and adjustments are made when actual amounts are known.
Income Tax Information and Distributions to Shareholders. Each year, the Fund intends to qualify as a regulated investment company under Subchapter M of the Internal Revenue Code, including distributing substantially all of its taxable income and realized gains. As a result, no provision for U.S. Federal income taxes is required. The Fund files a U.S. federal tax return, in addition to state and local tax returns as required. The Fund's federal income tax returns are subject to examination by the Internal Revenue Service (IRS) for a period of three fiscal years after they are filed. State and local tax returns may be subject to examination for an additional fiscal year depending on the jurisdiction. Foreign taxes are provided for based on the Fund's understanding of the tax rules and rates that exist in the foreign markets in which it invests.
Distributions are declared and recorded on the ex-dividend date. Income and capital gain distributions are declared separately for each class. Income and capital gain distributions are determined in accordance with income tax regulations, which may differ from GAAP.
Capital accounts within the financial statements are adjusted for permanent book-tax differences. These adjustments have no impact on net assets or the results of operations. Capital accounts are not adjusted for temporary book-tax differences which will reverse in a subsequent period.
Book-tax differences are primarily due to foreign currency transactions, passive foreign investment companies (PFIC), capital loss carryforwards and losses deferred due to wash sales.
As of period end, the cost and unrealized appreciation (depreciation) in securities, and derivatives if applicable, for federal income tax purposes were as follows:
| Gross unrealized appreciation | $37,315,338 |
| Gross unrealized depreciation | (59,997,829) |
| Net unrealized appreciation (depreciation) | $(22,682,491) |
| Tax cost | $267,878,455 |
Capital loss carryforwards are only available to offset future capital gains of the Fund to the extent provided by regulations and may be limited. The capital loss carryforward information presented below, including any applicable limitation, is estimated as of prior fiscal period end and is subject to adjustment.
Short-term | $(50,951,267) |
Long-term | (30,174,753) |
| Total capital loss carryforward | $(81,126,020) |
Restricted Securities (including Private Placements). Funds may invest in securities that are subject to legal or contractual restrictions on resale. These securities generally may be resold in transactions exempt from registration or to the public if the securities are registered. Disposal of these securities may involve time-consuming negotiations and expense, and prompt sale at an acceptable price may be difficult. Information regarding restricted securities held at period end is included at the end of the Schedule of Investments, if applicable.
4. Purchases and Sales of Investments.
Purchases and sales of securities, other than short-term securities and in-kind transactions, as applicable, are noted in the table below.
| | Purchases ($) | Sales ($) |
| Fidelity Latin America Fund | 53,335,101 | 61,593,372 |
5. Fees and Other Transactions with Affiliates.
Management Fee. Fidelity Management & Research Company LLC (the investment adviser) and its affiliates provide the Fund with investment management related services for which the Fund pays a monthly management fee. The management fee is the sum of an individual fund fee rate that is based on an annual rate of .45% of the Fund's average net assets and an annualized group fee rate that averaged .23% during the period. The group fee rate is based upon the monthly average net assets of a group of registered investment companies with which the investment adviser has management contracts. The group fee rate decreases as assets under management increase and increases as assets under management decrease. For the reporting period, the total annualized management fee rate was .68% of the Fund's average net assets.
Distribution and Service Plan Fees. In accordance with Rule 12b-1 of the 1940 Act, the Fund has adopted separate Distribution and Service Plans for each class of shares. Certain classes pay Fidelity Distributors Company LLC (FDC), an affiliate of the investment adviser, separate Distribution and Service Fees, each of which is based on an annual percentage of each class' average net assets. In addition, FDC may pay financial intermediaries for selling shares of the Fund and providing shareholder support services. For the period, the Distribution and Service Fee rates, total fees and amounts retained by FDC were as follows:
| | Distribution Fee | Service Fee | Total Fees | Retained by FDC |
| Class A | - % | .25% | $15,353 | $368 |
| Class M | .25% | .25% | 7,062 | 100 |
| Class C | .75% | .25% | 4,535 | 1,289 |
| | | | $26,950 | $1,757 |
Sales Load. FDC may receive a front-end sales charge of up to 5.75% for selling Class A shares and 3.50% for selling Class M shares, some of which is paid to financial intermediaries for selling shares of the Fund. Depending on the holding period, FDC may receive contingent deferred sales charges levied on Class A, Class M and Class C redemptions. The deferred sales charges are 1.00% for Class C shares, 1.00% for certain purchases of Class A shares and .25% for certain purchases of Class M shares.
For the period, sales charge amounts retained by FDC were as follows:
| | Retained by FDC |
| Class A | $12,497 |
| Class M | 111 |
Class C A | 1,491 |
| | $14,099 |
A When Class C shares are initially sold, FDC pays commissions from its own resources to financial intermediaries through which the sales are made.
Transfer Agent Fees. Fidelity Investments Institutional Operations Company LLC (FIIOC), an affiliate of the investment adviser, is the transfer, dividend disbursing and shareholder servicing agent for each class of the Fund. FIIOC receives account fees and asset-based fees that vary according to the account size and type of account of the shareholders of the respective classes of the Fund, except for Class Z. FIIOC receives an asset-based fee of Class Z's average net assets. FIIOC pays for typesetting, printing and mailing of shareholder reports, except proxy statements.
For the period, transfer agent fees for each class were as follows:
| | Amount | % of Class-Level Average Net Assets A |
| Class A | $16,049 | .26 |
| Class M | 3,680 | .26 |
| Class C | 1,190 | .26 |
| Latin America | 302,841 | .25 |
| Class I | 4,708 | .22 |
| Class Z | 224 | .04 |
| | $328,692 | |
A Annualized
Accounting Fees. Fidelity Service Company, Inc. (FSC), an affiliate of the investment adviser, maintains the Fund's accounting records. The accounting fee is based on the level of average net assets for each month. For the period, the fees were equivalent to the following annualized rates:
| | % of Average Net Assets |
| Fidelity Latin America Fund | .05 |
Brokerage Commissions. A portion of portfolio transactions were placed with brokerage firms which are affiliates of the investment adviser. Brokerage commissions are included in net realized gain (loss) and change in net unrealized appreciation (depreciation) in the Statement of Operations. The commissions paid to these affiliated firms were as follows:
| | Amount |
| Fidelity Latin America Fund | $137 |
Interfund Trades. Funds may purchase from or sell securities to other Fidelity Funds under procedures adopted by the Board. The procedures have been designed to ensure these interfund trades are executed in accordance with Rule 17a-7 of the 1940 Act. Any interfund trades are included within the respective purchases and sales amounts shown in the Purchases and Sales of Investments note. Interfund trades during the period are noted in the table below.
| | Purchases ($) | Sales ($) | Realized Gain (Loss) ($) |
| Fidelity Latin America Fund | 612,547 | - | - |
6. Committed Line of Credit.
Certain Funds participate with other funds managed by the investment adviser or an affiliate in a $4.25 billion credit facility (the "line of credit") to be utilized for temporary or emergency purposes to fund shareholder redemptions or for other short-term liquidity purposes. The participating funds have agreed to pay commitment fees on their pro-rata portion of the line of credit, which are reflected in Miscellaneous expenses on the Statement of Operations, and are listed below. During the period, there were no borrowings on this line of credit.
| | Amount |
| Fidelity Latin America Fund | $265 |
7. Security Lending.
Funds lend portfolio securities from time to time in order to earn additional income. Lending agents are used, including National Financial Services (NFS), an affiliate of the investment adviser. Pursuant to a securities lending agreement, NFS will receive a fee, which is capped at 9.9% of a fund's daily lending revenue, for its services as lending agent. A fund may lend securities to certain qualified borrowers, including NFS. On the settlement date of the loan, a fund receives collateral (in the form of U.S. Treasury obligations, letters of credit and/or cash) against the loaned securities and maintains collateral in an amount not less than 100% of the market value of the loaned securities during the period of the loan. The market value of the loaned securities is determined at the close of business of a fund and any additional required collateral is delivered to a fund on the next business day. A fund or borrower may terminate the loan at any time, and if the borrower defaults on its obligation to return the securities loaned because of insolvency or other reasons, a fund may apply collateral received from the borrower against the obligation. A fund may experience delays and costs in recovering the securities loaned. Any cash collateral received is invested in the Fidelity Securities Lending Cash Central Fund. Any loaned securities are identified as such in the Schedule of Investments, and the value of loaned securities and cash collateral at period end, as applicable, are presented in the Statement of Assets and Liabilities. Security lending income represents the income earned on investing cash collateral, less rebates paid to borrowers and any lending agent fees associated with the loan, plus any premium payments received for lending certain types of securities. Security lending income is presented in the Statement of Operations as a component of income from Fidelity Central Funds. Affiliated security lending activity, if any, was as follows:
| | Total Security Lending Fees Paid to NFS | Security Lending Income From Securities Loaned to NFS | Value of Securities Loaned to NFS at Period End |
| Fidelity Latin America Fund | $1,404 | $ - | $- |
8. Expense Reductions.
Through arrangements with each class' transfer agent, credits realized as a result of certain uninvested cash balances were used to reduce the Fund's expenses. During the period, transfer agent credits reduced each class' expenses as noted in the table below.
| | Expense reduction |
| Class M | $391 |
In addition, during the period the investment adviser or an affiliate reimbursed and/or waived a portion of fund-level operating expenses in the amount of $5,840.
9. Distributions to Shareholders.
Distributions to shareholders of each class were as follows:
| | Six months ended April 30, 2023 | Year ended October 31, 2022 |
| Fidelity Latin America Fund | | |
| Distributions to shareholders | | |
| Class A | $1,004,696 | $246,821 |
| Class M | 219,803 | 55,713 |
| Class C | 62,841 | 9,520 |
| Latin America | 20,106,391 | 7,148,489 |
| Class I | 319,001 | 63,267 |
| Class Z | 97,630 | 441,084 |
Total | $21,810,362 | $7,964,894 |
10. Share Transactions.
Share transactions for each class were as follows and may contain in-kind transactions, automatic conversions between classes or exchanges between affiliated funds:
| | Shares | Shares | Dollars | Dollars |
| | Six months ended April 30, 2023 | Year ended October 31, 2022 | Six months ended April 30, 2023 | Year ended October 31, 2022 |
| Fidelity Latin America Fund | | | | |
| Class A | | | | |
| Shares sold | 70,316 | 193,440 | $1,294,203 | $4,014,725 |
| Reinvestment of distributions | 54,942 | 12,985 | 985,119 | 236,085 |
| Shares redeemed | (86,707) | (105,710) | (1,559,482) | (2,130,953) |
| Net increase (decrease) | 38,551 | 100,715 | $719,840 | $2,119,857 |
| Class M | | | | |
| Shares sold | 4,527 | 20,674 | $87,498 | $437,930 |
| Reinvestment of distributions | 12,131 | 3,036 | 218,228 | 55,381 |
| Shares redeemed | (8,082) | (20,590) | (148,768) | (412,047) |
| Net increase (decrease) | 8,576 | 3,120 | $156,958 | $81,264 |
| Class C | | | | |
| Shares sold | 15,369 | 24,221 | $285,934 | $531,782 |
| Reinvestment of distributions | 3,453 | 515 | 62,841 | 9,515 |
| Shares redeemed | (6,987) | (14,126) | (130,390) | (288,523) |
| Net increase (decrease) | 11,835 | 10,610 | $218,385 | $252,774 |
| Latin America | | | | |
| Shares sold | 874,836 | 2,584,874 | $16,540,077 | $53,328,636 |
| Reinvestment of distributions | 1,050,900 | 354,926 | 18,779,586 | 6,428,926 |
| Shares redeemed | (1,598,928) | (4,099,646) | (29,529,564) | (80,282,944) |
| Net increase (decrease) | 326,808 | (1,159,846) | $5,790,099 | $(20,525,382) |
| Class I | | | | |
| Shares sold | 83,405 | 241,168 | $1,505,378 | $5,278,172 |
| Reinvestment of distributions | 17,723 | 3,427 | 316,179 | 61,999 |
| Shares redeemed | (101,748) | (200,417) | (1,829,705) | (3,856,685) |
| Net increase (decrease) | (620) | 44,178 | $(8,148) | $1,483,486 |
| Class Z | | | | |
| Shares sold | 20,727 | 554,422 | $425,059 | $11,379,289 |
| Reinvestment of distributions | 3,612 | 24,364 | 64,625 | 440,031 |
| Shares redeemed | (40,695) | (1,267,021) | (748,002) | (25,513,356) |
| Net increase (decrease) | (16,356) | (688,235) | $(258,318) | $(13,694,036) |
11. Other.
A fund's organizational documents provide former and current trustees and officers with a limited indemnification against liabilities arising in connection with the performance of their duties to the fund. In the normal course of business, a fund may also enter into contracts that provide general indemnifications. A fund's maximum exposure under these arrangements is unknown as this would be dependent on future claims that may be made against a fund. The risk of material loss from such claims is considered remote.
12. Risk and Uncertainties.
Many factors affect a fund's performance. Developments that disrupt global economies and financial markets, such as pandemics, epidemics, outbreaks of infectious diseases, war, terrorism, and environmental disasters, may significantly affect a fund's investment performance. The effects of these developments to a fund will be impacted by the types of securities in which a fund invests, the financial condition, industry, economic sector, and geographic location of an issuer, and a fund's level of investment in the securities of that issuer. Significant concentrations in security types, issuers, industries, sectors, and geographic locations may magnify the factors that affect a fund's performance.
Top Holdings (% of Fund's net assets) |
| |
| Novo Nordisk A/S Series B (Denmark, Pharmaceuticals) | 21.6 | |
| Investor AB (B Shares) (Sweden, Financial Services) | 4.8 | |
| Nordea Bank ABP (Finland, Banks) | 4.4 | |
| DSV A/S (Denmark, Air Freight & Logistics) | 4.4 | |
| Atlas Copco AB (B Shares) (Sweden, Machinery) | 4.2 | |
| Sandvik AB (Sweden, Machinery) | 3.9 | |
| Carlsberg A/S Series B (Denmark, Beverages) | 3.3 | |
| Vestas Wind Systems A/S (Denmark, Electrical Equipment) | 3.2 | |
| Sampo Oyj (A Shares) (Finland, Insurance) | 3.1 | |
| Elisa Corp. (A Shares) (Finland, Diversified Telecommunication Services) | 2.7 | |
| | 55.6 | |
| |
| Market Sectors (% of Fund's net assets) |
| |
| Industrials | 28.2 | |
| Health Care | 25.7 | |
| Financials | 17.2 | |
| Materials | 5.7 | |
| Energy | 4.9 | |
| Consumer Staples | 4.5 | |
| Consumer Discretionary | 3.4 | |
| Information Technology | 3.4 | |
| Communication Services | 2.7 | |
| Real Estate | 0.3 | |
| |
The Fund may invest up to 35% of its total assets in any industry that represents more than 20% of the Nordic market. As of April 30, 2023, the Fund did not have more than 25% of its total assets invested in any one industry.
Asset Allocation (% of Fund's net assets) |
|
|
Geographic Diversification (% of Fund's net assets) |
|
* Includes Short-Term investments and Net Other Assets (Liabilities). Percentages are adjusted for the effect of derivatives, if applicable. |
| |
Fidelity® Nordic Fund
Showing Percentage of Net Assets
| Common Stocks - 96.0% |
| | | Shares | Value ($) |
| Denmark - 37.3% | | | |
| Carlsberg A/S Series B | | 68,100 | 11,250,166 |
| Demant A/S (a) | | 62,400 | 2,669,608 |
| DSV A/S | | 78,100 | 14,668,645 |
| Genmab A/S (a) | | 21,000 | 8,630,259 |
| Novo Nordisk A/S Series B | | 436,500 | 72,613,737 |
| Tryg A/S | | 194,783 | 4,592,784 |
| Vestas Wind Systems A/S | | 386,300 | 10,689,151 |
TOTAL DENMARK | | | 125,114,350 |
| Finland - 13.8% | | | |
| Elisa Corp. (A Shares) | | 148,100 | 9,190,939 |
| Neste OYJ | | 135,200 | 6,546,044 |
| Nordea Bank ABP | | 1,337,144 | 14,840,857 |
| Sampo Oyj (A Shares) | | 201,400 | 10,199,565 |
| UPM-Kymmene Corp. | | 170,000 | 5,413,635 |
TOTAL FINLAND | | | 46,191,040 |
| Norway - 7.6% | | | |
| Equinor ASA | | 285,900 | 8,231,357 |
| Kongsberg Gruppen ASA | | 86,800 | 3,891,606 |
| Mowi ASA | | 215,500 | 4,106,957 |
| Norsk Hydro ASA | | 913,300 | 6,721,034 |
| Selvaag Bolig ASA | | 321,200 | 1,097,084 |
| TGS ASA | | 100,700 | 1,576,117 |
TOTAL NORWAY | | | 25,624,155 |
| Sweden - 37.3% | | | |
| Alfa Laval AB (b) | | 188,500 | 6,902,136 |
| ASSA ABLOY AB (B Shares) | | 352,800 | 8,390,785 |
| Atlas Copco AB (B Shares) (b) | | 1,094,700 | 14,015,935 |
| Autoliv, Inc. | | 16,300 | 1,398,703 |
| Beijer Alma AB (B Shares) | | 91,700 | 2,083,471 |
| Eltel AB (a)(c) | | 1,706,358 | 1,480,889 |
| Evolution AB (c) | | 65,300 | 8,694,314 |
| Fortnox AB | | 775,200 | 5,330,750 |
| Haypp Group (a) | | 385,600 | 1,368,676 |
| HEXPOL AB (B Shares) | | 295,970 | 3,483,511 |
| Indutrade AB | | 317,000 | 7,594,980 |
| Investor AB (B Shares) | | 753,500 | 16,150,024 |
| Lagercrantz Group AB (B Shares) | | 462,453 | 5,943,541 |
| Nibe Industrier AB (B Shares) | | 293,000 | 3,271,413 |
| Nordnet AB | | 286,900 | 4,498,615 |
| Saab AB (B Shares) | | 89,400 | 5,017,883 |
| Sandvik AB (b) | | 644,500 | 13,103,617 |
| Surgical Science Sweden AB (a) | | 124,000 | 2,262,339 |
| Svenska Cellulosa AB SCA (B Shares) | | 265,300 | 3,633,467 |
| Swedbank AB (A Shares) | | 434,499 | 7,541,730 |
| Trelleborg AB (B Shares) (b) | | 121,600 | 3,052,139 |
TOTAL SWEDEN | | | 125,218,918 |
| TOTAL COMMON STOCKS (Cost $252,781,842) | | | 322,148,463 |
| | | | |
| Money Market Funds - 11.0% |
| | | Shares | Value ($) |
| Fidelity Cash Central Fund 4.88% (d) | | 10,407,543 | 10,409,625 |
| Fidelity Securities Lending Cash Central Fund 4.88% (d)(e) | | 26,709,829 | 26,712,500 |
| TOTAL MONEY MARKET FUNDS (Cost $37,122,125) | | | 37,122,125 |
| | | | |
| TOTAL INVESTMENT IN SECURITIES - 107.0% (Cost $289,903,967) | 359,270,588 |
NET OTHER ASSETS (LIABILITIES) - (7.0)% | (23,629,473) |
| NET ASSETS - 100.0% | 335,641,115 |
| | |
Legend
| (b) | Security or a portion of the security is on loan at period end. |
| (c) | Security exempt from registration under Rule 144A of the Securities Act of 1933. These securities may be resold in transactions exempt from registration, normally to qualified institutional buyers. At the end of the period, the value of these securities amounted to $10,175,203 or 3.0% of net assets. |
| (d) | Affiliated fund that is generally available only to investment companies and other accounts managed by Fidelity Investments. The rate quoted is the annualized seven-day yield of the fund at period end. A complete unaudited listing of the fund's holdings as of its most recent quarter end is available upon request. In addition, each Fidelity Central Fund's financial statements are available on the SEC's website or upon request. |
| (e) | Investment made with cash collateral received from securities on loan. |
Affiliated Central Funds
Fiscal year to date information regarding the Fund's investments in Fidelity Central Funds, including the ownership percentage, is presented below.
| Affiliate | Value, beginning of period ($) | Purchases ($) | Sales Proceeds ($) | Dividend Income ($) | Realized Gain (loss) ($) | Change in Unrealized appreciation (depreciation) ($) | Value, end of period ($) | % ownership, end of period |
| Fidelity Cash Central Fund 4.88% | 2,293,839 | 44,936,741 | 36,820,955 | 165,534 | - | - | 10,409,625 | 0.0% |
| Fidelity Securities Lending Cash Central Fund 4.88% | - | 49,207,502 | 22,495,002 | 30,972 | - | - | 26,712,500 | 0.1% |
| Total | 2,293,839 | 94,144,243 | 59,315,957 | 196,506 | - | - | 37,122,125 | |
| | | | | | | | | |
Amounts in the dividend income column in the above table include any capital gain distributions from underlying funds, which are presented in the corresponding line item in the Statement of Operations, if applicable.
Amounts in the dividend income column for Fidelity Securities Lending Cash Central Fund represents the income earned on investing cash collateral, less rebates paid to borrowers and any lending agent fees associated with the loan, plus any premium payments received for lending certain types of securities.
Amounts included in the purchases and sales proceeds columns may include in-kind transactions, if applicable.
Investment Valuation
The following is a summary of the inputs used, as of April 30, 2023, involving the Fund's assets and liabilities carried at fair value. The inputs or methodology used for valuing securities may not be an indication of the risk associated with investing in those securities. For more information on valuation inputs, and their aggregation into the levels used below, please refer to the Investment Valuation section in the accompanying Notes to Financial Statements.
| Valuation Inputs at Reporting Date: |
| Description | Total ($) | Level 1 ($) | Level 2 ($) | Level 3 ($) |
Investments in Securities: | | | | |
|
| Equities: | | | | |
Communication Services | 9,190,939 | 9,190,939 | - | - |
Consumer Discretionary | 11,461,693 | 11,461,693 | - | - |
Consumer Staples | 15,357,123 | 15,357,123 | - | - |
Energy | 16,353,518 | 8,122,161 | 8,231,357 | - |
Financials | 57,823,575 | 57,823,575 | - | - |
Health Care | 86,175,943 | 4,931,947 | 81,243,996 | - |
Industrials | 94,162,650 | 83,473,499 | 10,689,151 | - |
Information Technology | 11,274,291 | 11,274,291 | - | - |
Materials | 19,251,647 | 12,530,613 | 6,721,034 | - |
Real Estate | 1,097,084 | 1,097,084 | - | - |
|
| Money Market Funds | 37,122,125 | 37,122,125 | - | - |
| Total Investments in Securities: | 359,270,588 | 252,385,050 | 106,885,538 | - |
Fidelity® Nordic Fund
| Statement of Assets and Liabilities |
| | | | April 30, 2023 (Unaudited) |
| | | | | |
| Assets | | | | |
| Investment in securities, at value (including securities loaned of $25,072,753) - See accompanying schedule: | | | | |
Unaffiliated issuers (cost $252,781,842) | $ | 322,148,463 | | |
Fidelity Central Funds (cost $37,122,125) | | 37,122,125 | | |
| | | | | |
| | | | | |
| Total Investment in Securities (cost $289,903,967) | | | $ | 359,270,588 |
| Foreign currency held at value (cost $3,803) | | | | 3,814 |
| Receivable for investments sold | | | | 17,145 |
| Receivable for fund shares sold | | | | 142,235 |
| Dividends receivable | | | | 641,061 |
| Reclaims receivable | | | | 2,816,308 |
| Distributions receivable from Fidelity Central Funds | | | | 57,474 |
| Prepaid expenses | | | | 110 |
Total assets | | | | 362,948,735 |
| Liabilities | | | | |
| Payable for fund shares redeemed | $ | 318,295 | | |
| Accrued management fee | | 184,226 | | |
| Other affiliated payables | | 55,644 | | |
| Other payables and accrued expenses | | 36,955 | | |
| Collateral on securities loaned | | 26,712,500 | | |
| Total Liabilities | | | | 27,307,620 |
| Net Assets | | | $ | 335,641,115 |
| Net Assets consist of: | | | | |
| Paid in capital | | | $ | 269,074,965 |
| Total accumulated earnings (loss) | | | | 66,566,150 |
| Net Assets | | | $ | 335,641,115 |
Net Asset Value , offering price and redemption price per share ($335,641,115 ÷ 5,672,183 shares) | | | $ | 59.17 |
| Statement of Operations |
| | | | Six months ended April 30, 2023 (Unaudited) |
| Investment Income | | | | |
| Dividends | | | $ | 6,134,911 |
| Foreign Tax Reclaims | | | | 1,487,691 |
| Income from Fidelity Central Funds (including $30,972 from security lending) | | | | 196,506 |
| Income before foreign taxes withheld | | | $ | 7,819,108 |
| Less foreign taxes withheld | | | | (2,275,326) |
| Total Income | | | | 5,543,782 |
| Expenses | | | | |
| Management fee | $ | 1,019,178 | | |
| Transfer agent fees | | 245,301 | | |
| Accounting fees | | 75,045 | | |
| Custodian fees and expenses | | 12,047 | | |
| Independent trustees' fees and expenses | | 939 | | |
| Registration fees | | 13,494 | | |
| Audit | | 52,636 | | |
| Legal | | 224 | | |
| Miscellaneous | | 616 | | |
| Total expenses before reductions | | 1,419,480 | | |
| Expense reductions | | (7,029) | | |
| Total expenses after reductions | | | | 1,412,451 |
| Net Investment income (loss) | | | | 4,131,331 |
| Realized and Unrealized Gain (Loss) | | | | |
| Net realized gain (loss) on: | | | | |
| Investment Securities: | | | | |
| Unaffiliated issuers | | 5,091,478 | | |
| Foreign currency transactions | | 474,967 | | |
| Total net realized gain (loss) | | | | 5,566,445 |
| Change in net unrealized appreciation (depreciation) on: | | | | |
| Investment Securities: | | | | |
| Unaffiliated issuers | | 62,956,801 | | |
| Assets and liabilities in foreign currencies | | 162,065 | | |
| Total change in net unrealized appreciation (depreciation) | | | | 63,118,866 |
| Net gain (loss) | | | | 68,685,311 |
| Net increase (decrease) in net assets resulting from operations | | | $ | 72,816,642 |
| Statement of Changes in Net Assets |
| |
| | Six months ended April 30, 2023 (Unaudited) | | Year ended October 31, 2022 |
| Increase (Decrease) in Net Assets | | | | |
| Operations | | | | |
| Net investment income (loss) | $ | 4,131,331 | $ | 4,639,612 |
| Net realized gain (loss) | | 5,566,445 | | (8,220,001) |
| Change in net unrealized appreciation (depreciation) | | 63,118,866 | | (114,229,877) |
| Net increase (decrease) in net assets resulting from operations | | 72,816,642 | | (117,810,266) |
| Distributions to shareholders | | - | | (53,400,933) |
| Share transactions | | | | |
| Proceeds from sales of shares | | 26,248,783 | | 29,607,219 |
| Reinvestment of distributions | | - | | 49,862,949 |
| Cost of shares redeemed | | (20,588,658) | | (73,768,106) |
Net increase (decrease) in net assets resulting from share transactions | | 5,660,125 | | 5,702,062 |
| Total increase (decrease) in net assets | | 78,476,767 | | (165,509,137) |
| | | | | |
| Net Assets | | | | |
| Beginning of period | | 257,164,348 | | 422,673,485 |
| End of period | $ | 335,641,115 | $ | 257,164,348 |
| | | | | |
| Other Information | | | | |
| Shares | | | | |
| Sold | | 478,826 | | 545,297 |
| Issued in reinvestment of distributions | | - | | 819,642 |
| Redeemed | | (381,862) | | (1,383,136) |
| Net increase (decrease) | | 96,964 | | (18,197) |
| | | | | |
Financial Highlights
| | Six months ended (Unaudited) April 30, 2023 | | Years ended October 31, 2022 | | 2021 | | 2020 | | 2019 | | 2018 |
Selected Per-Share Data | | | | | | | | | | | | |
| Net asset value, beginning of period | $ | 46.13 | $ | 75.57 | $ | 56.51 | $ | 46.69 | $ | 49.64 | $ | 54.34 |
| Income from Investment Operations | | | | | | | | | | | | |
Net investment income (loss) A,B | | .74 | | .78 | | 1.06 | | .15 | | 1.50 C | | .47 |
| Net realized and unrealized gain (loss) | | 12.30 | | (20.65) D | | 20.17 | | 11.86 | | .15 | | (3.01) |
| Total from investment operations | | 13.04 | | (19.87) | | 21.23 | | 12.01 | | 1.65 | | (2.54) |
| Distributions from net investment income | | - | | (3.02) | | (.96) | | (1.60) | | (.05) | | (.50) |
| Distributions from net realized gain | | - | | (6.56) | | (1.21) | | (.59) | | (4.55) | | (1.67) |
| Total distributions | | - | | (9.57) E | | (2.17) | | (2.19) | | (4.60) | | (2.17) |
Redemption fees added to paid in capital A | | - | | - | | - | | - | | - | | .01 |
| Net asset value, end of period | $ | 59.17 | $ | 46.13 | $ | 75.57 | $ | 56.51 | $ | 46.69 | $ | 49.64 |
Total Return F,G | | 28.27% | | (29.33)% D | | 38.39% | | 26.73% | | 3.96% | | (4.80)% |
Ratios to Average Net Assets B,H,I | | | | | | | | | | | | |
| Expenses before reductions | | .94% J | | .93% | | .92% | | .96% | | .98% | | .98% |
| Expenses net of fee waivers, if any | | .94% J | | .92% | | .92% | | .96% | | .98% | | .97% |
| Expenses net of all reductions | | .94% J | | .92% | | .92% | | .96% | | .96% | | .97% |
| Net investment income (loss) | | 2.75% J | | 1.45% | | 1.51% | | .31% | | 3.28% C | | .89% |
| Supplemental Data | | | | | | | | | | | | |
| Net assets, end of period (000 omitted) | $ | 335,641 | $ | 257,164 | $ | 422,673 | $ | 301,424 | $ | 261,896 | $ | 290,184 |
Portfolio turnover rate K | | 32% J | | 42% | | 34% | | 29% | | 34% | | 56% |
A Calculated based on average shares outstanding during the period.
B Net investment income (loss) is affected by the timing of the declaration of dividends by any underlying mutual funds or exchange-traded funds (ETFs). Net investment income (loss) of any mutual funds or ETFs is not included in the Fund's net investment income (loss) ratio.
C Net investment income per share reflects one or more large, non-recurring dividend(s) which amounted to $.82 per share. Excluding such non-recurring dividend(s), the ratio of net investment income (loss) to average net assets would have been 1.50%.
D Amount includes a reimbursement from the investment adviser for an operational error which amounted to less than $.01 per share. Excluding this reimbursement, the total return would have been (29.35)%.
E Total distributions per share do not sum due to rounding.
F Total returns for periods of less than one year are not annualized.
G Total returns would have been lower if certain expenses had not been reduced during the applicable periods shown.
H Fees and expenses of any underlying mutual funds or exchange-traded funds (ETFs) are not included in the Fund's expense ratio. The Fund indirectly bears its proportionate share of these expenses. For additional expense information related to investments in Fidelity Central Funds, please refer to the "Investments in Fidelity Central Funds" note found in the Notes to Financial Statements section of the most recent Annual or Semi-Annual report.
I Expense ratios reflect operating expenses of the class. Expenses before reductions do not reflect amounts reimbursed, waived, or reduced through arrangements with the investment adviser, brokerage services, or other offset arrangements, if applicable, and do not represent the amount paid by the class during periods when reimbursements, waivers or reductions occur.
J Annualized.
K Amount does not include the portfolio activity of any underlying mutual funds or exchange-traded funds (ETFs).
For the period ended April 30, 2023
1. Organization.
Fidelity Nordic Fund (the Fund) is a fund of Fidelity Investment Trust (the Trust) and is authorized to issue an unlimited number of shares. Share transactions on the Statement of Changes in Net Assets may contain exchanges between affiliated funds. The Trust is registered under the Investment Company Act of 1940, as amended (the 1940 Act), as an open-end management investment company organized as a Massachusetts business trust.
2. Investments in Fidelity Central Funds.
Funds may invest in Fidelity Central Funds, which are open-end investment companies generally available only to other investment companies and accounts managed by the investment adviser and its affiliates. The Schedule of Investments lists any Fidelity Central Funds held as an investment as of period end, but does not include the underlying holdings of each Fidelity Central Fund. An investing fund indirectly bears its proportionate share of the expenses of the underlying Fidelity Central Funds.
Based on its investment objective, each Fidelity Central Fund may invest or participate in various investment vehicles or strategies that are similar to those of the investing fund. These strategies are consistent with the investment objectives of the investing fund and may involve certain economic risks which may cause a decline in value of each of the Fidelity Central Funds and thus a decline in the value of the investing fund.
| Fidelity Central Fund | Investment Manager | Investment Objective | Investment Practices | Expense Ratio A |
| Fidelity Money Market Central Funds | Fidelity Management & Research Company LLC (FMR) | Each fund seeks to obtain a high level of current income consistent with the preservation of capital and liquidity. | Short-term Investments | Less than .005% |
A Expenses expressed as a percentage of average net assets and are as of each underlying Central Fund's most recent annual or semi-annual shareholder report.
A complete unaudited list of holdings for each Fidelity Central Fund is available upon request or at the Securities and Exchange Commission website at www.sec.gov. In addition, the financial statements of the Fidelity Central Funds which contain the significant accounting policies (including investment valuation policies) of those funds, and are not covered by the Report of Independent Registered Public Accounting Firm, are available on the Securities and Exchange Commission website or upon request.
3. Significant Accounting Policies.
The Fund is an investment company and applies the accounting and reporting guidance of the Financial Accounting Standards Board (FASB) Accounting Standards Codification Topic 946 Financial Services - Investment Companies . The financial statements have been prepared in conformity with accounting principles generally accepted in the United States of America (GAAP), which require management to make certain estimates and assumptions at the date of the financial statements. Actual results could differ from those estimates. Subsequent events, if any, through the date that the financial statements were issued have been evaluated in the preparation of the financial statements. The Fund's Schedule of Investments lists any underlying mutual funds or exchange-traded funds (ETFs) but does not include the underlying holdings of these funds. The following summarizes the significant accounting policies of the Fund:
Investment Valuation. Investments are valued as of 4:00 p.m. Eastern time on the last calendar day of the period. The Board of Trustees (the Board) has designated the Fund's investment adviser as the valuation designee responsible for the fair valuation function and performing fair value determinations as needed. The investment adviser has established a Fair Value Committee (the Committee) to carry out the day-to-day fair valuation responsibilities and has adopted policies and procedures to govern the fair valuation process and the activities of the Committee. In accordance with these fair valuation policies and procedures, which have been approved by the Board, the Fund attempts to obtain prices from one or more third party pricing services or brokers to value its investments. When current market prices, quotations or currency exchange rates are not readily available or reliable, investments will be fair valued in good faith by the Committee, in accordance with the policies and procedures. Factors used in determining fair value vary by investment type and may include market or investment specific events, transaction data, estimated cash flows, and market observations of comparable investments. The frequency that the fair valuation procedures are used cannot be predicted and they may be utilized to a significant extent. The Committee manages the Fund's fair valuation practices and maintains the fair valuation policies and procedures. The Fund's investment adviser reports to the Board information regarding the fair valuation process and related material matters.
The Fund categorizes the inputs to valuation techniques used to value its investments into a disclosure hierarchy consisting of three levels as shown below:
Level 1 - unadjusted quoted prices in active markets for identical investments
Level 2 - other significant observable inputs (including quoted prices for similar investments, interest rates, prepayment speeds, etc.)
Level 3 - unobservable inputs (including the Fund's own assumptions based on the best information available)
Valuation techniques used to value the Fund's investments by major category are as follows:
Equity securities, including restricted securities, for which market quotations are readily available, are valued at the last reported sale price or official closing price as reported by a third party pricing service on the primary market or exchange on which they are traded and are categorized as Level 1 in the hierarchy. In the event there were no sales during the day or closing prices are not available, securities are valued at the last quoted bid price or may be valued using the last available price and are generally categorized as Level 2 in the hierarchy. For foreign equity securities, when market or security specific events arise, comparisons to the valuation of American Depositary Receipts (ADRs), futures contracts, ETFs and certain indexes as well as quoted prices for similar securities may be used and would be categorized as Level 2 in the hierarchy. For equity securities, including restricted securities, where observable inputs are limited, assumptions about market activity and risk are used and these securities may be categorized as Level 3 in the hierarchy.
Investments in open-end mutual funds, including the Fidelity Central Funds, are valued at their closing net asset value (NAV) each business day and are categorized as Level 1 in the hierarchy.
Changes in valuation techniques may result in transfers in or out of an assigned level within the disclosure hierarchy. The aggregate value of investments by input level as of April 30, 2023 is included at the end of the Fund's Schedule of Investments.
Foreign Currency. Certain Funds may use foreign currency contracts to facilitate transactions in foreign-denominated securities. Gains and losses from these transactions may arise from changes in the value of the foreign currency or if the counterparties do not perform under the contracts' terms.
Foreign-denominated assets, including investment securities, and liabilities are translated into U.S. dollars at the exchange rates at period end. Purchases and sales of investment securities, income and dividends received, and expenses denominated in foreign currencies are translated into U.S. dollars at the exchange rate in effect on the transaction date.
The effects of exchange rate fluctuations on investments are included with the net realized and unrealized gain (loss) on investment securities. Other foreign currency transactions resulting in realized and unrealized gain (loss) are disclosed separately.
Investment Transactions and Income. For financial reporting purposes, the Fund's investment holdings and NAV include trades executed through the end of the last business day of the period. The NAV per share for processing shareholder transactions is calculated as of the close of business of the New York Stock Exchange (NYSE), normally 4:00 p.m. Eastern time and includes trades executed through the end of the prior business day. Gains and losses on securities sold are determined on the basis of identified cost. Commissions paid to certain brokers with whom the investment adviser, or its affiliates, places trades on behalf of a fund include an amount in addition to trade execution, which may be rebated back to a fund. Any such rebates are included in net realized gain (loss) on investments in the Statement of Operations. Dividend income is recorded on the ex-dividend date, except for certain dividends from foreign securities where the ex-dividend date may have passed, which are recorded as soon as the Fund is informed of the ex-dividend date. Non-cash dividends included in dividend income, if any, are recorded at the fair market value of the securities received. Income and capital gain distributions from Fidelity Central Funds, if any, are recorded on the ex-dividend date. Investment income is recorded net of foreign taxes withheld where recovery of such taxes is uncertain. Funds may file withholding tax reclaims in certain jurisdictions to recover a portion of amounts previously withheld. Any withholding tax reclaims income is included in the Statement of Operations in foreign tax reclaims. Any receivables for withholding tax reclaims are included in the Statement of Assets and Liabilities in reclaims receivable. The Fund has filed tax reclaims for previously withheld taxes on dividends earned in certain European Union (EU) countries. These additional filings are subject to various administrative proceedings by the local jurisdictions' tax authorities within the EU, as well as a number of related judicial proceedings. Income recognized for EU reclaims is included with other reclaims in the Statement of Operations in foreign tax reclaims. These reclaims are recorded when the amount is known and there are no significant uncertainties on collectability.
Expenses. Expenses directly attributable to a fund are charged to that fund. Expenses attributable to more than one fund are allocated among the respective funds on the basis of relative net assets or other appropriate methods. Expenses included in the accompanying financial statements reflect the expenses of that fund and do not include any expenses associated with any underlying mutual funds or exchange-traded funds. Although not included in a fund's expenses, a fund indirectly bears its proportionate share of these expenses through the net asset value of each underlying mutual fund or exchange-traded fund. Expense estimates are accrued in the period to which they relate and adjustments are made when actual amounts are known.
Income Tax Information and Distributions to Shareholders. Each year, the Fund intends to qualify as a regulated investment company under Subchapter M of the Internal Revenue Code, including distributing substantially all of its taxable income and realized gains. As a result, no provision for U.S. Federal income taxes is required. The Fund files a U.S. federal tax return, in addition to state and local tax returns as required. The Fund's federal income tax returns are subject to examination by the Internal Revenue Service (IRS) for a period of three fiscal years after they are filed. State and local tax returns may be subject to examination for an additional fiscal year depending on the jurisdiction. Foreign taxes are provided for based on the Fund's understanding of the tax rules and rates that exist in the foreign markets in which it invests.
Distributions are declared and recorded on the ex-dividend date. Income and capital gain distributions are determined in accordance with income tax regulations, which may differ from GAAP.
Capital accounts within the financial statements are adjusted for permanent book-tax differences. These adjustments have no impact on net assets or the results of operations. Capital accounts are not adjusted for temporary book-tax differences which will reverse in a subsequent period.
Book-tax differences are primarily due to foreign currency transactions, passive foreign investment companies (PFIC), net operating losses, capital loss carryforwards and losses deferred due to wash sales and excise tax regulations.
As of period end, the cost and unrealized appreciation (depreciation) in securities, and derivatives if applicable, for federal income tax purposes were as follows:
| Gross unrealized appreciation | $79,223,869 |
| Gross unrealized depreciation | (14,202,624) |
| Net unrealized appreciation (depreciation) | $65,021,245 |
| Tax cost | $294,249,343 |
Capital loss carryforwards are only available to offset future capital gains of the Fund to the extent provided by regulations and may be limited. The capital loss carryforward information presented below, including any applicable limitation, is estimated as of prior fiscal period end and is subject to adjustment.
Short-term | $(7,967,620) |
Long-term | (640,299) |
| Total capital loss carryforward | $(8,607,919) |
Restricted Securities (including Private Placements). Funds may invest in securities that are subject to legal or contractual restrictions on resale. These securities generally may be resold in transactions exempt from registration or to the public if the securities are registered. Disposal of these securities may involve time-consuming negotiations and expense, and prompt sale at an acceptable price may be difficult. Information regarding restricted securities held at period end is included at the end of the Schedule of Investments, if applicable.
4. Purchases and Sales of Investments.
Purchases and sales of securities, other than short-term securities and in-kind transactions, as applicable, are noted in the table below.
| | Purchases ($) | Sales ($) |
| Fidelity Nordic Fund | 49,835,961 | 46,718,645 |
5. Fees and Other Transactions with Affiliates.
Management Fee. Fidelity Management & Research Company LLC (the investment adviser) and its affiliates provide the Fund with investment management related services for which the Fund pays a monthly management fee. The management fee is the sum of an individual fund fee rate that is based on an annual rate of .45% of the Fund's average net assets and an annualized group fee rate that averaged .23% during the period. The group fee rate is based upon the monthly average net assets of a group of registered investment companies with which the investment adviser has management contracts. The group fee rate decreases as assets under management increase and increases as assets under management decrease. For the reporting period, the total annualized management fee rate was .68% of the Fund's average net assets.
Transfer Agent Fees. Fidelity Investments Institutional Operations Company LLC (FIIOC), an affiliate of the investment adviser, is the Fund's transfer, dividend disbursing and shareholder servicing agent. FIIOC receives account fees and asset-based fees that vary according to account size and type of account. FIIOC pays for typesetting, printing and mailing of shareholder reports, except proxy statements. For the period, the transfer agent fees were equivalent to an annualized rate of .16% of average net assets.
Accounting Fees. Fidelity Service Company, Inc. (FSC), an affiliate of the investment adviser, maintains the Fund's accounting records. The accounting fee is based on the level of average net assets for each month. For the period, the fees were equivalent to the following annualized rates:
| | % of Average Net Assets |
| Fidelity Nordic Fund | .05 |
Interfund Trades. Funds may purchase from or sell securities to other Fidelity Funds under procedures adopted by the Board. The procedures have been designed to ensure these interfund trades are executed in accordance with Rule 17a-7 of the 1940 Act. Any interfund trades are included within the respective purchases and sales amounts shown in the Purchases and Sales of Investments note. During the period, there were no interfund trades.
6. Committed Line of Credit.
Certain Funds participate with other funds managed by the investment adviser or an affiliate in a $4.25 billion credit facility (the "line of credit") to be utilized for temporary or emergency purposes to fund shareholder redemptions or for other short-term liquidity purposes. The participating funds have agreed to pay commitment fees on their pro-rata portion of the line of credit, which are reflected in Miscellaneous expenses on the Statement of Operations, and are listed below. During the period, there were no borrowings on this line of credit.
| | Amount |
| Fidelity Nordic Fund | $286 |
7. Security Lending.
Funds lend portfolio securities from time to time in order to earn additional income. Lending agents are used, including National Financial Services (NFS), an affiliate of the investment adviser. Pursuant to a securities lending agreement, NFS will receive a fee, which is capped at 9.9% of a fund's daily lending revenue, for its services as lending agent. A fund may lend securities to certain qualified borrowers, including NFS. On the settlement date of the loan, a fund receives collateral (in the form of U.S. Treasury obligations, letters of credit and/or cash) against the loaned securities and maintains collateral in an amount not less than 100% of the market value of the loaned securities during the period of the loan. The market value of the loaned securities is determined at the close of business of a fund and any additional required collateral is delivered to a fund on the next business day. A fund or borrower may terminate the loan at any time, and if the borrower defaults on its obligation to return the securities loaned because of insolvency or other reasons, a fund may apply collateral received from the borrower against the obligation. A fund may experience delays and costs in recovering the securities loaned. Any cash collateral received is invested in the Fidelity Securities Lending Cash Central Fund. Any loaned securities are identified as such in the Schedule of Investments, and the value of loaned securities and cash collateral at period end, as applicable, are presented in the Statement of Assets and Liabilities. Security lending income represents the income earned on investing cash collateral, less rebates paid to borrowers and any lending agent fees associated with the loan, plus any premium payments received for lending certain types of securities. Security lending income is presented in the Statement of Operations as a component of income from Fidelity Central Funds. Affiliated security lending activity, if any, was as follows:
| | Total Security Lending Fees Paid to NFS | Security Lending Income From Securities Loaned to NFS | Value of Securities Loaned to NFS at Period End |
| Fidelity Nordic Fund | $3,613 | $- | $- |
8. Expense Reductions.
Through arrangements with the Fund's custodian, credits realized as a result of certain uninvested cash balances were used to reduce the Fund's expenses by $78.
In addition, during the period the investment adviser or an affiliate reimbursed and/or waived a portion of operating expenses in the amount of $6,951.
9. Other.
A fund's organizational documents provide former and current trustees and officers with a limited indemnification against liabilities arising in connection with the performance of their duties to the fund. In the normal course of business, a fund may also enter into contracts that provide general indemnifications. A fund's maximum exposure under these arrangements is unknown as this would be dependent on future claims that may be made against a fund. The risk of material loss from such claims is considered remote.
10. Risk and Uncertainties.
Many factors affect a fund's performance. Developments that disrupt global economies and financial markets, such as pandemics, epidemics, outbreaks of infectious diseases, war, terrorism, and environmental disasters, may significantly affect a fund's investment performance. The effects of these developments to a fund will be impacted by the types of securities in which a fund invests, the financial condition, industry, economic sector, and geographic location of an issuer, and a fund's level of investment in the securities of that issuer. Significant concentrations in security types, issuers, industries, sectors, and geographic locations may magnify the factors that affect a fund's performance.
Top Holdings (% of Fund's net assets) |
| |
| Taiwan Semiconductor Manufacturing Co. Ltd. (Taiwan, Semiconductors & Semiconductor Equipment) | 6.2 | |
| Samsung Electronics Co. Ltd. (Korea (South), Technology Hardware, Storage & Peripherals) | 4.7 | |
| Tencent Holdings Ltd. (China, Interactive Media & Services) | 4.3 | |
| Alibaba Group Holding Ltd. (China, Broadline Retail) | 3.2 | |
| AIA Group Ltd. (Hong Kong, Insurance) | 3.1 | |
| Sea Ltd. ADR (Singapore, Entertainment) | 2.6 | |
| DENSO Corp. (Japan, Automobile Components) | 2.5 | |
| Sony Group Corp. (Japan, Household Durables) | 2.4 | |
| Shin-Etsu Chemical Co. Ltd. (Japan, Chemicals) | 2.0 | |
| ORIX Corp. (Japan, Financial Services) | 2.0 | |
| | 33.0 | |
| |
| Market Sectors (% of Fund's net assets) |
| |
| Information Technology | 22.5 | |
| Consumer Discretionary | 19.5 | |
| Financials | 15.5 | |
| Communication Services | 10.8 | |
| Health Care | 9.1 | |
| Industrials | 8.3 | |
| Materials | 4.4 | |
| Real Estate | 2.8 | |
| Energy | 2.4 | |
| Consumer Staples | 1.5 | |
| Utilities | 1.4 | |
| |
Asset Allocation (% of Fund's net assets) |
|
|
Geographic Diversification (% of Fund's net assets) |
|
* Includes Short-Term investments and Net Other Assets (Liabilities). Percentages are adjusted for the effect of derivatives, if applicable. |
| |
Fidelity® Pacific Basin Fund
Showing Percentage of Net Assets
| Common Stocks - 93.4% |
| | | Shares | Value ($) |
| Australia - 8.1% | | | |
| Aristocrat Leisure Ltd. | | 196,979 | 4,982,677 |
| carsales.com Ltd. | | 270,148 | 4,284,091 |
| Cogstate Ltd. (a) | | 108,403 | 114,607 |
| Flight Centre Travel Group Ltd. (a) | | 385,663 | 5,064,426 |
| HUB24 Ltd. | | 247,352 | 4,677,026 |
| Macquarie Group Ltd. | | 91,015 | 11,103,086 |
| National Australia Bank Ltd. | | 439,197 | 8,455,052 |
| National Storage REIT unit | | 3,358,160 | 5,593,287 |
| Newcrest Mining Ltd. | | 332,402 | 6,347,173 |
| Santos Ltd. | | 1,050,151 | 4,974,667 |
| Technology One Ltd. | | 603,550 | 6,084,884 |
TOTAL AUSTRALIA | | | 61,680,976 |
| China - 19.4% | | | |
| Alibaba Group Holding Ltd. (a) | | 2,298,300 | 24,301,366 |
| Antengene Corp. (a)(b) | | 4,506,711 | 1,556,508 |
| Centre Testing International Group Co. Ltd. (A Shares) | | 1,916,909 | 5,348,344 |
| Chervon Holdings Ltd. | | 1,681,500 | 8,556,940 |
| KE Holdings, Inc. ADR (a) | | 310,700 | 4,874,883 |
| Kweichow Moutai Co. Ltd. (A Shares) | | 33,200 | 8,471,130 |
| Li Ning Co. Ltd. | | 697,500 | 4,988,254 |
| Meituan Class B (a)(b) | | 361,390 | 6,176,320 |
| PDD Holdings, Inc. ADR (a) | | 70,200 | 4,784,130 |
| Shenzhen Mindray Bio-Medical Electronics Co. Ltd. (A Shares) | | 130,399 | 5,895,302 |
| Shenzhen YUTO Packaging Technology Co. Ltd. (A Shares) | | 708,400 | 2,600,086 |
| Shenzhou International Group Holdings Ltd. | | 632,400 | 6,074,307 |
| Tencent Holdings Ltd. | | 738,900 | 32,819,068 |
| Trip.com Group Ltd. ADR (a) | | 178,900 | 6,352,739 |
| Vnet Group, Inc. ADR (a) | | 1,650,367 | 4,852,079 |
| Wuxi Biologics (Cayman), Inc. (a)(b) | | 1,454,000 | 8,669,968 |
| Zai Lab Ltd. (a) | | 2,452,600 | 8,586,800 |
| Zhejiang Sanhua Intelligent Controls Co. Ltd. (A Shares) | | 1,086,600 | 3,676,668 |
TOTAL CHINA | | | 148,584,892 |
| Hong Kong - 4.6% | | | |
| AIA Group Ltd. | | 2,210,400 | 24,064,792 |
| China High Precision Automation Group Ltd. (a)(c) | | 1,875,000 | 2 |
| China Metal Recycling (Holdings) Ltd. (a)(c) | | 2,572,200 | 3 |
| Hypebeast Ltd. (a) | | 13,059,314 | 491,039 |
| Oriental Watch Holdings Ltd. | | 2,381,424 | 1,364,156 |
| Prudential PLC | | 618,900 | 9,469,814 |
TOTAL HONG KONG | | | 35,389,806 |
| India - 2.1% | | | |
| Housing Development Finance Corp. Ltd. | | 199,784 | 6,814,194 |
| One97 Communications Ltd. (a) | | 506,600 | 4,066,498 |
| Zomato Ltd. (a) | | 6,722,000 | 5,380,934 |
TOTAL INDIA | | | 16,261,626 |
| Japan - 39.5% | | | |
| Advantest Corp. | | 48,600 | 3,787,491 |
| Astellas Pharma, Inc. | | 415,800 | 6,263,846 |
| Daiichikosho Co. Ltd. | | 269,600 | 4,833,447 |
| DENSO Corp. | | 317,200 | 19,147,337 |
| Digital Hearts Holdings Co. Ltd. | | 192,200 | 2,082,332 |
| Fast Retailing Co. Ltd. | | 30,300 | 7,175,090 |
| FUJIFILM Holdings Corp. | | 85,600 | 4,461,470 |
| Fujitsu Ltd. | | 39,200 | 5,224,471 |
| Funai Soken Holdings, Inc. | | 257,200 | 4,930,416 |
| Hitachi Ltd. | | 274,700 | 15,194,931 |
| Hoya Corp. | | 135,100 | 14,165,916 |
| Idemitsu Kosan Co. Ltd. | | 127,200 | 2,708,475 |
| INPEX Corp. | | 942,200 | 10,310,545 |
| Iriso Electronics Co. Ltd. | | 128,900 | 4,412,199 |
| JSR Corp. | | 228,500 | 5,301,988 |
| JTOWER, Inc. (a) | | 126,200 | 5,442,561 |
| Kakaku.com, Inc. | | 161,600 | 2,223,410 |
| Kansai Electric Power Co., Inc. | | 984,600 | 10,628,477 |
| Kansai Paint Co. Ltd. | | 290,900 | 4,101,103 |
| Lifenet Insurance Co. (a) | | 370,100 | 3,225,611 |
| Minebea Mitsumi, Inc. | | 401,500 | 7,435,234 |
| Misumi Group, Inc. | | 262,100 | 6,612,051 |
| Mitsubishi Heavy Industries Ltd. | | 101,300 | 3,841,321 |
| Money Forward, Inc. (a) | | 122,200 | 5,088,939 |
| Net One Systems Co. Ltd. | | 179,800 | 4,239,391 |
| Nintendo Co. Ltd. | | 92,600 | 3,914,886 |
| Nomura Research Institute Ltd. | | 296,700 | 7,464,838 |
| NSD Co. Ltd. | | 228,200 | 4,198,055 |
| Olympus Corp. | | 306,100 | 5,358,714 |
| Open House Group Co. Ltd. | | 177,300 | 7,087,169 |
| ORIX Corp. | | 917,700 | 15,612,393 |
| Outsourcing, Inc. | | 357,900 | 3,645,775 |
| Pan Pacific International Holdings Ltd. | | 299,500 | 5,596,736 |
| Renesas Electronics Corp. (a) | | 975,200 | 12,709,244 |
| Shin-Etsu Chemical Co. Ltd. | | 549,000 | 15,666,166 |
| SMS Co., Ltd. | | 272,600 | 6,406,128 |
| Sony Group Corp. | | 204,100 | 18,465,692 |
| TechnoPro Holdings, Inc. | | 167,100 | 4,559,105 |
| Tokio Marine Holdings, Inc. | | 491,300 | 9,878,586 |
| Tsuruha Holdings, Inc. | | 51,300 | 3,359,931 |
| Z Holdings Corp. | | 3,041,400 | 8,331,129 |
| ZOZO, Inc. | | 376,300 | 7,918,991 |
TOTAL JAPAN | | | 303,011,590 |
| Korea (South) - 1.0% | | | |
| Db Insurance Co. Ltd. | | 76,960 | 4,839,744 |
| Hyundai Fire & Marine Insurance Co. Ltd. | | 105,363 | 2,961,233 |
TOTAL KOREA (SOUTH) | | | 7,800,977 |
| Malaysia - 0.5% | | | |
| MR DIY Group M Sdn Bhd (b) | | 10,785,800 | 3,829,631 |
| New Zealand - 0.6% | | | |
| Ryman Healthcare Ltd. | | 1,276,611 | 4,193,747 |
| Philippines - 1.5% | | | |
| Ayala Land, Inc. | | 12,153,200 | 5,863,599 |
| Robinsons Land Corp. | | 22,673,400 | 5,905,433 |
TOTAL PHILIPPINES | | | 11,769,032 |
| Singapore - 4.9% | | | |
| Genting Singapore Ltd. | | 2,928,200 | 2,491,096 |
| Sea Ltd. ADR (a) | | 261,700 | 19,933,689 |
| United Overseas Bank Ltd. | | 718,300 | 15,255,226 |
TOTAL SINGAPORE | | | 37,680,011 |
| Taiwan - 8.7% | | | |
| eMemory Technology, Inc. | | 134,000 | 8,006,500 |
| MediaTek, Inc. | | 492,000 | 10,690,496 |
| Taiwan Semiconductor Manufacturing Co. Ltd. | | 2,914,000 | 47,685,127 |
TOTAL TAIWAN | | | 66,382,123 |
| United States of America - 2.5% | | | |
| GI Dynamics, Inc. (a)(c) | | 111,225 | 1 |
| Legend Biotech Corp. ADR (a) | | 79,500 | 5,462,445 |
| Parade Technologies Ltd. | | 128,000 | 3,917,585 |
| ResMed, Inc. CDI | | 362,469 | 8,142,613 |
| Space Exploration Technologies Corp. Class A (a)(c)(d) | | 22,539 | 1,735,503 |
TOTAL UNITED STATES OF AMERICA | | | 19,258,147 |
| TOTAL COMMON STOCKS (Cost $618,301,935) | | | 715,842,558 |
| | | | |
| Preferred Stocks - 4.8% |
| | | Shares | Value ($) |
| Convertible Preferred Stocks - 0.1% | | | |
| China - 0.1% | | | |
| dMed Biopharmaceutical Co. Ltd. Series C (a)(c)(d) | | 87,773 | 778,547 |
| Nonconvertible Preferred Stocks - 4.7% | | | |
| Korea (South) - 4.7% | | | |
| Samsung Electronics Co. Ltd. | | 867,100 | 36,263,376 |
| TOTAL PREFERRED STOCKS (Cost $44,455,737) | | | 37,041,923 |
| | | | |
| Money Market Funds - 1.7% |
| | | Shares | Value ($) |
Fidelity Cash Central Fund 4.88% (e) (Cost $12,710,454) | | 12,707,912 | 12,710,454 |
| | | | |
| TOTAL INVESTMENT IN SECURITIES - 99.9% (Cost $675,468,126) | 765,594,935 |
NET OTHER ASSETS (LIABILITIES) - 0.1% | 636,130 |
| NET ASSETS - 100.0% | 766,231,065 |
| | |
Legend
| (b) | Security exempt from registration under Rule 144A of the Securities Act of 1933. These securities may be resold in transactions exempt from registration, normally to qualified institutional buyers. At the end of the period, the value of these securities amounted to $20,232,427 or 2.6% of net assets. |
| (d) | Restricted securities (including private placements) - Investment in securities not registered under the Securities Act of 1933 (excluding 144A issues). At the end of the period, the value of restricted securities (excluding 144A issues) amounted to $2,514,050 or 0.3% of net assets. |
| (e) | Affiliated fund that is generally available only to investment companies and other accounts managed by Fidelity Investments. The rate quoted is the annualized seven-day yield of the fund at period end. A complete unaudited listing of the fund's holdings as of its most recent quarter end is available upon request. In addition, each Fidelity Central Fund's financial statements are available on the SEC's website or upon request. |
| Additional information on each restricted holding is as follows: |
| Security | Acquisition Date | Acquisition Cost ($) |
| dMed Biopharmaceutical Co. Ltd. Series C | 12/01/20 | 1,246,653 |
| | | |
| Space Exploration Technologies Corp. Class A | 2/16/21 - 5/24/22 | 1,437,725 |
| | | |
Affiliated Central Funds
Fiscal year to date information regarding the Fund's investments in Fidelity Central Funds, including the ownership percentage, is presented below.
| Affiliate | Value, beginning of period ($) | Purchases ($) | Sales Proceeds ($) | Dividend Income ($) | Realized Gain (loss) ($) | Change in Unrealized appreciation (depreciation) ($) | Value, end of period ($) | % ownership, end of period |
| Fidelity Cash Central Fund 4.88% | 15,775,672 | 141,158,414 | 144,223,632 | 256,581 | - | - | 12,710,454 | 0.0% |
| Fidelity Securities Lending Cash Central Fund 4.88% | 9,708,475 | 115,535,210 | 125,243,685 | 24,009 | - | - | - | 0.0% |
| Total | 25,484,147 | 256,693,624 | 269,467,317 | 280,590 | - | - | 12,710,454 | |
| | | | | | | | | |
Amounts in the dividend income column in the above table include any capital gain distributions from underlying funds, which are presented in the corresponding line item in the Statement of Operations, if applicable.
Amounts in the dividend income column for Fidelity Securities Lending Cash Central Fund represents the income earned on investing cash collateral, less rebates paid to borrowers and any lending agent fees associated with the loan, plus any premium payments received for lending certain types of securities.
Amounts included in the purchases and sales proceeds columns may include in-kind transactions, if applicable.
Investment Valuation
The following is a summary of the inputs used, as of April 30, 2023, involving the Fund's assets and liabilities carried at fair value. The inputs or methodology used for valuing securities may not be an indication of the risk associated with investing in those securities. For more information on valuation inputs, and their aggregation into the levels used below, please refer to the Investment Valuation section in the accompanying Notes to Financial Statements.
| Valuation Inputs at Reporting Date: |
| Description | Total ($) | Level 1 ($) | Level 2 ($) | Level 3 ($) |
Investments in Securities: | | | | |
|
| Equities: | | | | |
Communication Services | 82,273,320 | 19,933,689 | 62,339,631 | - |
Consumer Discretionary | 149,737,991 | 11,136,869 | 138,601,122 | - |
Consumer Staples | 11,831,061 | - | 11,831,061 | - |
Energy | 17,993,687 | - | 17,993,687 | - |
Financials | 120,423,255 | - | 120,423,255 | - |
Health Care | 69,189,014 | 5,462,445 | 62,948,021 | 778,548 |
Industrials | 63,385,476 | - | 61,649,973 | 1,735,503 |
Information Technology | 171,168,479 | 4,852,079 | 166,316,398 | 2 |
Materials | 34,016,519 | - | 34,016,516 | 3 |
Real Estate | 22,237,202 | 4,874,883 | 17,362,319 | - |
Utilities | 10,628,477 | - | 10,628,477 | - |
|
| Money Market Funds | 12,710,454 | 12,710,454 | - | - |
| Total Investments in Securities: | 765,594,935 | 58,970,419 | 704,110,460 | 2,514,056 |
Fidelity® Pacific Basin Fund
| Statement of Assets and Liabilities |
| | | | April 30, 2023 (Unaudited) |
| | | | | |
| Assets | | | | |
| Investment in securities, at value - See accompanying schedule: | | | | |
Unaffiliated issuers (cost $662,757,672) | $ | 752,884,481 | | |
Fidelity Central Funds (cost $12,710,454) | | 12,710,454 | | |
| | | | | |
| | | | | |
| Total Investment in Securities (cost $675,468,126) | | | $ | 765,594,935 |
| Foreign currency held at value (cost $18) | | | | 18 |
| Receivable for investments sold | | | | 2,745,575 |
| Receivable for fund shares sold | | | | 149,512 |
| Dividends receivable | | | | 3,094,831 |
| Distributions receivable from Fidelity Central Funds | | | | 39,819 |
| Prepaid expenses | | | | 303 |
| Other receivables | | | | 24,116 |
Total assets | | | | 771,649,109 |
| Liabilities | | | | |
| Payable for investments purchased | $ | 3,820,773 | | |
| Payable for fund shares redeemed | | 295,887 | | |
| Accrued management fee | | 606,393 | | |
| Other affiliated payables | | 127,019 | | |
| Deferred taxes | | 518,459 | | |
| Other payables and accrued expenses | | 49,513 | | |
| Total Liabilities | | | | 5,418,044 |
| Net Assets | | | $ | 766,231,065 |
| Net Assets consist of: | | | | |
| Paid in capital | | | $ | 655,357,065 |
| Total accumulated earnings (loss) | | | | 110,874,000 |
| Net Assets | | | $ | 766,231,065 |
Net Asset Value , offering price and redemption price per share ($766,231,065 ÷ 25,904,712 shares) | | | $ | 29.58 |
| Statement of Operations |
| | | | Six months ended April 30, 2023 (Unaudited) |
| Investment Income | | | | |
| Dividends | | | $ | 6,548,049 |
| Non-Cash dividends | | | | 1,785,153 |
| Income from Fidelity Central Funds (including $24,009 from security lending) | | | | 280,590 |
| Income before foreign taxes withheld | | | $ | 8,613,792 |
| Less foreign taxes withheld | | | | (653,258) |
| Total Income | | | | 7,960,534 |
| Expenses | | | | |
| Management fee | | | | |
| Basic fee | $ | 2,561,364 | | |
| Performance adjustment | | 998,228 | | |
| Transfer agent fees | | 573,541 | | |
| Accounting fees | | 175,338 | | |
| Custodian fees and expenses | | 32,164 | | |
| Independent trustees' fees and expenses | | 2,468 | | |
| Registration fees | | 22,361 | | |
| Audit | | 47,232 | | |
| Legal | | 571 | | |
| Interest | | 4,457 | | |
| Miscellaneous | | 1,643 | | |
| Total expenses before reductions | | 4,419,367 | | |
| Expense reductions | | (17,343) | | |
| Total expenses after reductions | | | | 4,402,024 |
| Net Investment income (loss) | | | | 3,558,510 |
| Realized and Unrealized Gain (Loss) | | | | |
| Net realized gain (loss) on: | | | | |
| Investment Securities: | | | | |
| Unaffiliated issuers (net of foreign taxes of $654,598) | | 41,252,053 | | |
| Foreign currency transactions | | (104,268) | | |
| Total net realized gain (loss) | | | | 41,147,785 |
| Change in net unrealized appreciation (depreciation) on: | | | | |
| Investment Securities: | | | | |
| Unaffiliated issuers (net of decrease in deferred foreign taxes of $291,599) | | 106,260,649 | | |
| Assets and liabilities in foreign currencies | | (14,373) | | |
| Total change in net unrealized appreciation (depreciation) | | | | 106,246,276 |
| Net gain (loss) | | | | 147,394,061 |
| Net increase (decrease) in net assets resulting from operations | | | $ | 150,952,571 |
| Statement of Changes in Net Assets |
| |
| | Six months ended April 30, 2023 (Unaudited) | | Year ended October 31, 2022 |
| Increase (Decrease) in Net Assets | | | | |
| Operations | | | | |
| Net investment income (loss) | $ | 3,558,510 | $ | 5,715,472 |
| Net realized gain (loss) | | 41,147,785 | | 71,701,080 |
| Change in net unrealized appreciation (depreciation) | | 106,246,276 | | (457,726,586) |
| Net increase (decrease) in net assets resulting from operations | | 150,952,571 | | (380,310,034) |
| Distributions to shareholders | | (59,141,027) | | (153,392,663) |
| Share transactions | | | | |
| Proceeds from sales of shares | | 57,677,730 | | 97,680,092 |
| Reinvestment of distributions | | 44,008,733 | | 112,623,785 |
| Cost of shares redeemed | | (84,824,646) | | (233,769,363) |
Net increase (decrease) in net assets resulting from share transactions | | 16,861,817 | | (23,465,486) |
| Total increase (decrease) in net assets | | 108,673,361 | | (557,168,183) |
| | | | | |
| Net Assets | | | | |
| Beginning of period | | 657,557,704 | | 1,214,725,887 |
| End of period | $ | 766,231,065 | $ | 657,557,704 |
| | | | | |
| Other Information | | | | |
| Shares | | | | |
| Sold | | 1,954,025 | | 2,944,154 |
| Issued in reinvestment of distributions | | 1,565,033 | | 2,912,433 |
| Redeemed | | (2,911,829) | | (6,908,065) |
| Net increase (decrease) | | 607,229 | | (1,051,478) |
| | | | | |
Financial Highlights
| Fidelity® Pacific Basin Fund |
| |
| | Six months ended (Unaudited) April 30, 2023 | | Years ended October 31, 2022 | | 2021 | | 2020 | | 2019 | | 2018 |
Selected Per-Share Data | | | | | | | | | | | | |
| Net asset value, beginning of period | $ | 25.99 | $ | 46.10 | $ | 40.16 | $ | 32.65 | $ | 29.51 | $ | 35.53 |
| Income from Investment Operations | | | | | | | | | | | | |
Net investment income (loss) A,B | | .14 C | | .22 | | .15 | | .16 | | .26 | | .22 |
| Net realized and unrealized gain (loss) | | 5.85 | | (14.49) | | 7.74 | | 7.61 | | 5.74 | | (4.69) |
| Total from investment operations | | 5.99 | | (14.27) | | 7.89 | | 7.77 | | 6.00 | | (4.47) |
| Distributions from net investment income | | - | | (1.17) D | | (.10) | | (.26) | | (.20) | | (.23) |
| Distributions from net realized gain | | (2.40) | | (4.67) D | | (1.85) | | - | | (2.67) | | (1.32) |
| Total distributions | | (2.40) | | (5.84) | | (1.95) | | (.26) | | (2.86) E | | (1.55) |
Redemption fees added to paid in capital A | | - | | - | | - | | - | | - | | - F |
| Net asset value, end of period | $ | 29.58 | $ | 25.99 | $ | 46.10 | $ | 40.16 | $ | 32.65 | $ | 29.51 |
Total Return G,H | | 23.53% | | (35.11)% | | 20.08% | | 23.95% | | 22.37% | | (13.24)% |
Ratios to Average Net Assets B,I,J | | | | | | | | | | | | |
| Expenses before reductions | | 1.17% K | | 1.12% | | 1.04% | | 1.11% | | .97% | | 1.07% |
| Expenses net of fee waivers, if any | | 1.16% K | | 1.12% | | 1.04% | | 1.11% | | .97% | | 1.07% |
| Expenses net of all reductions | | 1.16% K | | 1.12% | | 1.04% | | 1.10% | | .97% | | 1.06% |
| Net investment income (loss) | | .70% C,K | | .64% | | .32% | | .47% | | .88% | | .62% |
| Supplemental Data | | | | | | | | | | | | |
| Net assets, end of period (000 omitted) | $ | 766,231 | $ | 657,558 | $ | 1,214,726 | $ | 1,084,673 | $ | 891,154 | $ | 807,632 |
Portfolio turnover rate L | | 57% K | | 29% | | 40% | | 27% | | 32% | | 37% |
A Calculated based on average shares outstanding during the period.
B Net investment income (loss) is affected by the timing of the declaration of dividends by any underlying mutual funds or exchange-traded funds (ETFs). Net investment income (loss) of any mutual funds or ETFs is not included in the Fund's net investment income (loss) ratio.
C Net investment income per share reflects one or more large, non-recurring dividend(s) which amounted to $.07 per share. Such dividends are not annualized in the ratio of net investment income (loss) to average net assets. Excluding such non-recurring dividend(s) the ratio of net investment income (loss) to average net assets would have been .47%.
D The amount shown reflects reclassifications related to book to tax differences that were made in the year shown.
E Total distributions per share do not sum due to rounding.
F Amount represents less than $.005 per share.
G Total returns for periods of less than one year are not annualized.
H Total returns would have been lower if certain expenses had not been reduced during the applicable periods shown.
I Fees and expenses of any underlying mutual funds or exchange-traded funds (ETFs) are not included in the Fund's expense ratio. The Fund indirectly bears its proportionate share of these expenses. For additional expense information related to investments in Fidelity Central Funds, please refer to the "Investments in Fidelity Central Funds" note found in the Notes to Financial Statements section of the most recent Annual or Semi-Annual report.
J Expense ratios reflect operating expenses of the class. Expenses before reductions do not reflect amounts reimbursed, waived, or reduced through arrangements with the investment adviser, brokerage services, or other offset arrangements, if applicable, and do not represent the amount paid by the class during periods when reimbursements, waivers or reductions occur.
K Annualized.
L Amount does not include the portfolio activity of any underlying mutual funds or exchange-traded funds (ETFs).
For the period ended April 30, 2023
1. Organization.
Fidelity Pacific Basin Fund (the Fund) is a fund of Fidelity Investment Trust (the Trust) and is authorized to issue an unlimited number of shares. Share transactions on the Statement of Changes in Net Assets may contain exchanges between affiliated funds. The Trust is registered under the Investment Company Act of 1940, as amended (the 1940 Act), as an open-end management investment company organized as a Massachusetts business trust. The Fund's investments in emerging markets can be subject to social, economic, regulatory, and political uncertainties and can be extremely volatile.
2. Investments in Fidelity Central Funds.
Funds may invest in Fidelity Central Funds, which are open-end investment companies generally available only to other investment companies and accounts managed by the investment adviser and its affiliates. The Schedule of Investments lists any Fidelity Central Funds held as an investment as of period end, but does not include the underlying holdings of each Fidelity Central Fund. An investing fund indirectly bears its proportionate share of the expenses of the underlying Fidelity Central Funds.
Based on its investment objective, each Fidelity Central Fund may invest or participate in various investment vehicles or strategies that are similar to those of the investing fund. These strategies are consistent with the investment objectives of the investing fund and may involve certain economic risks which may cause a decline in value of each of the Fidelity Central Funds and thus a decline in the value of the investing fund.
| Fidelity Central Fund | Investment Manager | Investment Objective | Investment Practices | Expense Ratio A |
| Fidelity Money Market Central Funds | Fidelity Management & Research Company LLC (FMR) | Each fund seeks to obtain a high level of current income consistent with the preservation of capital and liquidity. | Short-term Investments | Less than .005% |
A Expenses expressed as a percentage of average net assets and are as of each underlying Central Fund's most recent annual or semi-annual shareholder report.
A complete unaudited list of holdings for each Fidelity Central Fund is available upon request or at the Securities and Exchange Commission website at www.sec.gov. In addition, the financial statements of the Fidelity Central Funds which contain the significant accounting policies (including investment valuation policies) of those funds, and are not covered by the Report of Independent Registered Public Accounting Firm, are available on the Securities and Exchange Commission website or upon request.
3. Significant Accounting Policies.
The Fund is an investment company and applies the accounting and reporting guidance of the Financial Accounting Standards Board (FASB) Accounting Standards Codification Topic 946 Financial Services - Investment Companies . The financial statements have been prepared in conformity with accounting principles generally accepted in the United States of America (GAAP), which require management to make certain estimates and assumptions at the date of the financial statements. Actual results could differ from those estimates. Subsequent events, if any, through the date that the financial statements were issued have been evaluated in the preparation of the financial statements. The Fund's Schedule of Investments lists any underlying mutual funds or exchange-traded funds (ETFs) but does not include the underlying holdings of these funds. The following summarizes the significant accounting policies of the Fund:
Investment Valuation. Investments are valued as of 4:00 p.m. Eastern time on the last calendar day of the period. The Board of Trustees (the Board) has designated the Fund's investment adviser as the valuation designee responsible for the fair valuation function and performing fair value determinations as needed. The investment adviser has established a Fair Value Committee (the Committee) to carry out the day-to-day fair valuation responsibilities and has adopted policies and procedures to govern the fair valuation process and the activities of the Committee. In accordance with these fair valuation policies and procedures, which have been approved by the Board, the Fund attempts to obtain prices from one or more third party pricing services or brokers to value its investments. When current market prices, quotations or currency exchange rates are not readily available or reliable, investments will be fair valued in good faith by the Committee, in accordance with the policies and procedures. Factors used in determining fair value vary by investment type and may include market or investment specific events, transaction data, estimated cash flows, and market observations of comparable investments. The frequency that the fair valuation procedures are used cannot be predicted and they may be utilized to a significant extent. The Committee manages the Fund's fair valuation practices and maintains the fair valuation policies and procedures. The Fund's investment adviser reports to the Board information regarding the fair valuation process and related material matters.
The Fund categorizes the inputs to valuation techniques used to value its investments into a disclosure hierarchy consisting of three levels as shown below:
Level 1 - unadjusted quoted prices in active markets for identical investments
Level 2 - other significant observable inputs (including quoted prices for similar investments, interest rates, prepayment speeds, etc.)
Level 3 - unobservable inputs (including the Fund's own assumptions based on the best information available)
Valuation techniques used to value the Fund's investments by major category are as follows:
Equity securities, including restricted securities, for which market quotations are readily available, are valued at the last reported sale price or official closing price as reported by a third party pricing service on the primary market or exchange on which they are traded and are categorized as Level 1 in the hierarchy. In the event there were no sales during the day or closing prices are not available, securities are valued at the last quoted bid price or may be valued using the last available price and are generally categorized as Level 2 in the hierarchy. For foreign equity securities, when market or security specific events arise, comparisons to the valuation of American Depositary Receipts (ADRs), futures contracts, ETFs and certain indexes as well as quoted prices for similar securities may be used and would be categorized as Level 2 in the hierarchy. For equity securities, including restricted securities, where observable inputs are limited, assumptions about market activity and risk are used and these securities may be categorized as Level 3 in the hierarchy.
Investments in open-end mutual funds, including the Fidelity Central Funds, are valued at their closing net asset value (NAV) each business day and are categorized as Level 1 in the hierarchy.
Changes in valuation techniques may result in transfers in or out of an assigned level within the disclosure hierarchy. The aggregate value of investments by input level as of April 30, 2023 is included at the end of the Fund's Schedule of Investments.
Foreign Currency. Certain Funds may use foreign currency contracts to facilitate transactions in foreign-denominated securities. Gains and losses from these transactions may arise from changes in the value of the foreign currency or if the counterparties do not perform under the contracts' terms.
Foreign-denominated assets, including investment securities, and liabilities are translated into U.S. dollars at the exchange rates at period end. Purchases and sales of investment securities, income and dividends received, and expenses denominated in foreign currencies are translated into U.S. dollars at the exchange rate in effect on the transaction date.
The effects of exchange rate fluctuations on investments are included with the net realized and unrealized gain (loss) on investment securities. Other foreign currency transactions resulting in realized and unrealized gain (loss) are disclosed separately.
Investment Transactions and Income. For financial reporting purposes, the Fund's investment holdings and NAV include trades executed through the end of the last business day of the period. The NAV per share for processing shareholder transactions is calculated as of the close of business of the New York Stock Exchange (NYSE), normally 4:00 p.m. Eastern time and includes trades executed through the end of the prior business day. Gains and losses on securities sold are determined on the basis of identified cost and include proceeds received from litigation. Commissions paid to certain brokers with whom the investment adviser, or its affiliates, places trades on behalf of a fund include an amount in addition to trade execution, which may be rebated back to a fund. Any such rebates are included in net realized gain (loss) on investments in the Statement of Operations. Dividend income is recorded on the ex-dividend date, except for certain dividends from foreign securities where the ex-dividend date may have passed, which are recorded as soon as the Fund is informed of the ex-dividend date. Non-cash dividends included in dividend income, if any, are recorded at the fair market value of the securities received. Income and capital gain distributions from Fidelity Central Funds, if any, are recorded on the ex-dividend date. Large, non-recurring dividends recognized by the Fund are presented separately on the Statement of Operations as "Non-cash dividends" and the impact of these dividends is presented in the Financial Highlights. Investment income is recorded net of foreign taxes withheld where recovery of such taxes is uncertain.
Expenses. Expenses directly attributable to a fund are charged to that fund. Expenses attributable to more than one fund are allocated among the respective funds on the basis of relative net assets or other appropriate methods. Expenses included in the accompanying financial statements reflect the expenses of that fund and do not include any expenses associated with any underlying mutual funds or exchange-traded funds. Although not included in a fund's expenses, a fund indirectly bears its proportionate share of these expenses through the net asset value of each underlying mutual fund or exchange-traded fund. Expense estimates are accrued in the period to which they relate and adjustments are made when actual amounts are known.
Income Tax Information and Distributions to Shareholders. Each year, the Fund intends to qualify as a regulated investment company under Subchapter M of the Internal Revenue Code, including distributing substantially all of its taxable income and realized gains. As a result, no provision for U.S. Federal income taxes is required. The Fund files a U.S. federal tax return, in addition to state and local tax returns as required. The Fund's federal income tax returns are subject to examination by the Internal Revenue Service (IRS) for a period of three fiscal years after they are filed. State and local tax returns may be subject to examination for an additional fiscal year depending on the jurisdiction. Foreign taxes are provided for based on the Fund's understanding of the tax rules and rates that exist in the foreign markets in which it invests. The Fund is subject to a tax imposed on capital gains by certain countries in which it invests. An estimated deferred tax liability for net unrealized appreciation on the applicable securities is included in Deferred taxes on the Statement of Assets & Liabilities.
Distributions are declared and recorded on the ex-dividend date. Income and capital gain distributions are determined in accordance with income tax regulations, which may differ from GAAP.
Capital accounts within the financial statements are adjusted for permanent book-tax differences. These adjustments have no impact on net assets or the results of operations. Capital accounts are not adjusted for temporary book-tax differences which will reverse in a subsequent period.
Book-tax differences are primarily due to foreign currency transactions, certain foreign taxes, passive foreign investment companies (PFIC), net operating losses and losses deferred due to wash sales and excise tax regulations.
As of period end, the cost and unrealized appreciation (depreciation) in securities, and derivatives if applicable, for federal income tax purposes were as follows:
| Gross unrealized appreciation | $152,133,575 |
| Gross unrealized depreciation | (70,250,743) |
| Net unrealized appreciation (depreciation) | $81,882,832 |
| Tax cost | $683,712,103 |
The Fund elected to defer to its next fiscal year $6,393,003 of ordinary losses recognized during the period January 1, 2022 to October 31, 2022.
Restricted Securities (including Private Placements). Funds may invest in securities that are subject to legal or contractual restrictions on resale. These securities generally may be resold in transactions exempt from registration or to the public if the securities are registered. Disposal of these securities may involve time-consuming negotiations and expense, and prompt sale at an acceptable price may be difficult. Information regarding restricted securities held at period end is included at the end of the Schedule of Investments, if applicable.
4. Purchases and Sales of Investments.
Purchases and sales of securities, other than short-term securities and in-kind transactions, as applicable, are noted in the table below.
| | Purchases ($) | Sales ($) |
| Fidelity Pacific Basin Fund | 209,381,372 | 245,210,157 |
5. Fees and Other Transactions with Affiliates.
Management Fee. Fidelity Management & Research Company LLC (the investment adviser) and its affiliates provide the Fund with investment management related services for which the Fund pays a monthly management fee. The management fee is the sum of an individual fund fee rate that is based on an annual rate of .45% of the Fund's average net assets and an annualized group fee rate that averaged .23% during the period. The group fee rate is based upon the monthly average net assets of a group of registered investment companies with which the investment adviser has management contracts. The group fee rate decreases as assets under management increase and increases as assets under management decrease. In addition, the management fee is subject to a performance adjustment (up to a maximum of +/- .20% of the Fund's average net assets over a 36 month performance period). The upward or downward adjustment to the management fee is based on the Fund's relative investment performance as compared to its benchmark index, the MSCI All Country Pacific Index, over the same 36 month performance period. For the reporting period, the total annualized management fee rate, including the performance adjustment, was .94% of the Fund's average net assets. The performance adjustment included in the management fee rate may be higher or lower than the maximum performance adjustment rate due to the difference between the average net assets for the reporting and performance periods.
Transfer Agent Fees. Fidelity Investments Institutional Operations Company LLC (FIIOC), an affiliate of the investment adviser, is the Fund's transfer, dividend disbursing and shareholder servicing agent. FIIOC receives account fees and asset-based fees that vary according to account size and type of account. FIIOC pays for typesetting, printing and mailing of shareholder reports, except proxy statements. For the period, the transfer agent fees were equivalent to an annualized rate of .15% of average net assets.
Accounting Fees. Fidelity Service Company, Inc. (FSC), an affiliate of the investment adviser, maintains the Fund's accounting records. The accounting fee is based on the level of average net assets for each month. For the period, the fees were equivalent to the following annualized rates:
| | % of Average Net Assets |
| Fidelity Pacific Basin Fund | .05 |
Brokerage Commissions. A portion of portfolio transactions were placed with brokerage firms which are affiliates of the investment adviser. Brokerage commissions are included in net realized gain (loss) and change in net unrealized appreciation (depreciation) in the Statement of Operations. The commissions paid to these affiliated firms were as follows:
| | Amount |
| Fidelity Pacific Basin Fund | $2,252 |
Interfund Lending Program. Pursuant to an Exemptive Order issued by the Securities and Exchange Commission (the SEC), the Fund, along with other registered investment companies having management contracts with Fidelity Management & Research Company LLC (FMR), or other affiliated entities of FMR, may participate in an interfund lending program. This program provides an alternative credit facility allowing the Fund to borrow from, or lend money to, other participating affiliated funds. At period end, there were no interfund loans outstanding. Activity in this program during the period for which loans were outstanding was as follows:
| | Borrower or Lender | Average Loan Balance | Weighted Average Interest Rate | Interest Expense |
| Fidelity Pacific Basin Fund | Borrower | $13,156,000 | 4.07% | $4,457 |
Interfund Trades. Funds may purchase from or sell securities to other Fidelity Funds under procedures adopted by the Board. The procedures have been designed to ensure these interfund trades are executed in accordance with Rule 17a-7 of the 1940 Act. Any interfund trades are included within the respective purchases and sales amounts shown in the Purchases and Sales of Investments note. Interfund trades during the period are noted in the table below.
| | Purchases ($) | Sales ($) | Realized Gain (Loss) ($) |
| Fidelity Pacific Basin Fund | - | 793,335 | (16,516) |
6. Committed Line of Credit.
Certain Funds participate with other funds managed by the investment adviser or an affiliate in a $4.25 billion credit facility (the "line of credit") to be utilized for temporary or emergency purposes to fund shareholder redemptions or for other short-term liquidity purposes. The participating funds have agreed to pay commitment fees on their pro-rata portion of the line of credit, which are reflected in Miscellaneous expenses on the Statement of Operations, and are listed below. During the period, there were no borrowings on this line of credit.
| | Amount |
| Fidelity Pacific Basin Fund | $734 |
7. Security Lending.
Funds lend portfolio securities from time to time in order to earn additional income. Lending agents are used, including National Financial Services (NFS), an affiliate of the investment adviser. Pursuant to a securities lending agreement, NFS will receive a fee, which is capped at 9.9% of a fund's daily lending revenue, for its services as lending agent. A fund may lend securities to certain qualified borrowers, including NFS. On the settlement date of the loan, a fund receives collateral (in the form of U.S. Treasury obligations, letters of credit and/or cash) against the loaned securities and maintains collateral in an amount not less than 100% of the market value of the loaned securities during the period of the loan. The market value of the loaned securities is determined at the close of business of a fund and any additional required collateral is delivered to a fund on the next business day. A fund or borrower may terminate the loan at any time, and if the borrower defaults on its obligation to return the securities loaned because of insolvency or other reasons, a fund may apply collateral received from the borrower against the obligation. A fund may experience delays and costs in recovering the securities loaned. Any cash collateral received is invested in the Fidelity Securities Lending Cash Central Fund. Any loaned securities are identified as such in the Schedule of Investments, and the value of loaned securities and cash collateral at period end, as applicable, are presented in the Statement of Assets and Liabilities. Security lending income represents the income earned on investing cash collateral, less rebates paid to borrowers and any lending agent fees associated with the loan, plus any premium payments received for lending certain types of securities. Security lending income is presented in the Statement of Operations as a component of income from Fidelity Central Funds. Affiliated security lending activity, if any, was as follows:
| | Total Security Lending Fees Paid to NFS | Security Lending Income From Securities Loaned to NFS | Value of Securities Loaned to NFS at Period End |
| Fidelity Pacific Basin Fund | $2,532 | $- | $- |
8. Expense Reductions.
During the period the investment adviser or an affiliate reimbursed and/or waived a portion of operating expenses in the amount of $17,343.
9. Other.
A fund's organizational documents provide former and current trustees and officers with a limited indemnification against liabilities arising in connection with the performance of their duties to the fund. In the normal course of business, a fund may also enter into contracts that provide general indemnifications. A fund's maximum exposure under these arrangements is unknown as this would be dependent on future claims that may be made against a fund. The risk of material loss from such claims is considered remote.
At the end of the period, the following mutual funds managed by the investment adviser or its affiliates were the owners of record of 10% or more of the total outstanding shares.
| | Strategic Advisers Fidelity International Fund |
| Fidelity Pacific Basin Fund | 18% |
10. Risk and Uncertainties.
Many factors affect a fund's performance. Developments that disrupt global economies and financial markets, such as pandemics, epidemics, outbreaks of infectious diseases, war, terrorism, and environmental disasters, may significantly affect a fund's investment performance. The effects of these developments to a fund will be impacted by the types of securities in which a fund invests, the financial condition, industry, economic sector, and geographic location of an issuer, and a fund's level of investment in the securities of that issuer. Significant concentrations in security types, issuers, industries, sectors, and geographic locations may magnify the factors that affect a fund's performance.
As a shareholder, you incur two types of costs: (1) transaction costs, which may include sales charges (loads) on purchase payments or redemption proceeds, as applicable and (2) ongoing costs, which generally include management fees, distribution and/or service (12b-1) fees and other Fund expenses. This Example is intended to help you understand your ongoing costs (in dollars) of investing in a fund and to compare these costs with the ongoing costs of investing in other mutual funds.
| The Example is based on an investment of $1,000 invested at the beginning of the period and held for the entire period (November 1, 2022 to April 30, 2023). |
Actual Expenses
The first line of the accompanying table provides information about actual account values and actual expenses. You may use the information in this line, together with the amount you invested, to estimate the expenses that you paid over the period. Simply divide your account value by $1,000.00 (for example, an $8,600 account value divided by $1,000.00 = 8.6), then multiply the result by the number in the first line for a class/Fund under the heading entitled "Expenses Paid During Period" to estimate the expenses you paid on your account during this period. If any fund is a shareholder of any underlying mutual funds or exchange-traded funds (ETFs) (the Underlying Funds), such fund indirectly bears its proportional share of the expenses of the Underlying Funds in addition to the direct expenses incurred presented in the table. These fees and expenses are not included in the annualized expense ratio used to calculate the expense estimate in the table below.
Hypothetical Example for Comparison Purposes
The second line of the accompanying table provides information about hypothetical account values and hypothetical expenses based on the actual expense ratio and an assumed rate of return of 5% per year before expenses, which is not the actual return. The hypothetical account values and expenses may not be used to estimate the actual ending account balance or expenses you paid for the period. You may use this information to compare the ongoing costs of investing in the Fund and other funds. To do so, compare this 5% hypothetical example with the 5% hypothetical examples that appear in the shareholder reports of the other funds. If any fund is a shareholder of any Underlying Funds, such fund indirectly bears its proportional share of the expenses of the Underlying Funds in addition to the direct expenses as presented in the table. These fees and expenses are not included in the annualized expense ratio used to calculate the expense estimate in the table below.
Please note that the expenses shown in the table are meant to highlight your ongoing costs only and do not reflect any transaction costs. Therefore, the second line of the table is useful in comparing ongoing costs only, and will not help you determine the relative total costs of owning different funds. In addition, if these transactional costs were included, your costs would have been higher.
| | | | | Annualized Expense Ratio- A | | Beginning Account Value November 1, 2022 | | Ending Account Value April 30, 2023 | | Expenses Paid During Period- C November 1, 2022 to April 30, 2023 |
| Fidelity® Canada Fund | | | | | | | | | | |
| Class A | | | | 1.32% | | | | | | |
| Actual | | | | | | $ 1,000 | | $ 1,083.80 | | $ 6.82 |
Hypothetical- B | | | | | | $ 1,000 | | $ 1,018.25 | | $ 6.61 |
| Class M | | | | 1.59% | | | | | | |
| Actual | | | | | | $ 1,000 | | $ 1,082.40 | | $ 8.21 |
Hypothetical- B | | | | | | $ 1,000 | | $ 1,016.91 | | $ 7.95 |
| Class C | | | | 2.09% | | | | | | |
| Actual | | | | | | $ 1,000 | | $ 1,079.80 | | $ 10.78 |
Hypothetical- B | | | | | | $ 1,000 | | $ 1,014.43 | | $ 10.44 |
| Fidelity® Canada Fund | | | | 1.01% | | | | | | |
| Actual | | | | | | $ 1,000 | | $ 1,085.50 | | $ 5.22 |
Hypothetical- B | | | | | | $ 1,000 | | $ 1,019.79 | | $ 5.06 |
| Class I | | | | .99% | | | | | | |
| Actual | | | | | | $ 1,000 | | $ 1,085.50 | | $ 5.12 |
Hypothetical- B | | | | | | $ 1,000 | | $ 1,019.89 | | $ 4.96 |
| Class Z | | | | .87% | | | | | | |
| Actual | | | | | | $ 1,000 | | $ 1,086.30 | | $ 4.50 |
Hypothetical- B | | | | | | $ 1,000 | | $ 1,020.48 | | $ 4.36 |
| Fidelity® China Region Fund | | | | | | | | | | |
| Class A | | | | 1.24% | | | | | | |
| Actual | | | | | | $ 1,000 | | $ 1,335.80 | | $ 7.18 |
Hypothetical- B | | | | | | $ 1,000 | | $ 1,018.65 | | $ 6.21 |
| Class M | | | | 1.52% | | | | | | |
| Actual | | | | | | $ 1,000 | | $ 1,333.80 | | $ 8.80 |
Hypothetical- B | | | | | | $ 1,000 | | $ 1,017.26 | | $ 7.60 |
| Class C | | | | 1.96% | | | | | | |
| Actual | | | | | | $ 1,000 | | $ 1,330.60 | | $ 11.33 |
Hypothetical- B | | | | | | $ 1,000 | | $ 1,015.08 | | $ 9.79 |
| Fidelity® China Region Fund | | | | .94% | | | | | | |
| Actual | | | | | | $ 1,000 | | $ 1,337.30 | | $ 5.45 |
Hypothetical- B | | | | | | $ 1,000 | | $ 1,020.13 | | $ 4.71 |
| Class I | | | | .93% | | | | | | |
| Actual | | | | | | $ 1,000 | | $ 1,337.90 | | $ 5.39 |
Hypothetical- B | | | | | | $ 1,000 | | $ 1,020.18 | | $ 4.66 |
| Class Z | | | | .80% | | | | | | |
| Actual | | | | | | $ 1,000 | | $ 1,338.60 | | $ 4.64 |
Hypothetical- B | | | | | | $ 1,000 | | $ 1,020.83 | | $ 4.01 |
| | | | | | | | | | |
| Fidelity® Emerging Asia Fund | | | | 1.10% | | | | | | |
| Actual | | | | | | $ 1,000 | | $ 1,203.80 | | $ 6.01 |
Hypothetical- B | | | | | | $ 1,000 | | $ 1,019.34 | | $ 5.51 |
| Fidelity® Emerging Markets Fund | | | | | | | | | | |
| Class A | | | | 1.20% | | | | | | |
| Actual | | | | | | $ 1,000 | | $ 1,211.60 | | $ 6.58 |
Hypothetical- B | | | | | | $ 1,000 | | $ 1,018.84 | | $ 6.01 |
| Class M | | | | 1.48% | | | | | | |
| Actual | | | | | | $ 1,000 | | $ 1,210.00 | | $ 8.11 |
Hypothetical- B | | | | | | $ 1,000 | | $ 1,017.46 | | $ 7.40 |
| Class C | | | | 1.98% | | | | | | |
| Actual | | | | | | $ 1,000 | | $ 1,207.00 | | $ 10.83 |
Hypothetical- B | | | | | | $ 1,000 | | $ 1,014.98 | | $ 9.89 |
| Fidelity® Emerging Markets Fund | | | | .90% | | | | | | |
| Actual | | | | | | $ 1,000 | | $ 1,213.50 | | $ 4.94 |
Hypothetical- B | | | | | | $ 1,000 | | $ 1,020.33 | | $ 4.51 |
| Class K | | | | .77% | | | | | | |
| Actual | | | | | | $ 1,000 | | $ 1,214.30 | | $ 4.23 |
Hypothetical- B | | | | | | $ 1,000 | | $ 1,020.98 | | $ 3.86 |
| Class I | | | | .89% | | | | | | |
| Actual | | | | | | $ 1,000 | | $ 1,213.30 | | $ 4.88 |
Hypothetical- B | | | | | | $ 1,000 | | $ 1,020.38 | | $ 4.46 |
| Class Z | | | | .77% | | | | | | |
| Actual | | | | | | $ 1,000 | | $ 1,213.90 | | $ 4.23 |
Hypothetical- B | | | | | | $ 1,000 | | $ 1,020.98 | | $ 3.86 |
| Fidelity® Europe Fund | | | | | | | | | | |
| Class A | | | | 1.06% | | | | | | |
| Actual | | | | | | $ 1,000 | | $ 1,245.50 | | $ 5.90 |
Hypothetical- B | | | | | | $ 1,000 | | $ 1,019.54 | | $ 5.31 |
| Class M | | | | 1.33% | | | | | | |
| Actual | | | | | | $ 1,000 | | $ 1,243.80 | | $ 7.40 |
Hypothetical- B | | | | | | $ 1,000 | | $ 1,018.20 | | $ 6.66 |
| Class C | | | | 1.83% | | | | | | |
| Actual | | | | | | $ 1,000 | | $ 1,240.50 | | $ 10.17 |
Hypothetical- B | | | | | | $ 1,000 | | $ 1,015.72 | | $ 9.15 |
| Fidelity® Europe Fund | | | | .74% | | | | | | |
| Actual | | | | | | $ 1,000 | | $ 1,247.00 | | $ 4.12 |
Hypothetical- B | | | | | | $ 1,000 | | $ 1,021.12 | | $ 3.71 |
| Class I | | | | .72% | | | | | | |
| Actual | | | | | | $ 1,000 | | $ 1,247.50 | | $ 4.01 |
Hypothetical- B | | | | | | $ 1,000 | | $ 1,021.22 | | $ 3.61 |
| Class Z | | | | .61% | | | | | | |
| Actual | | | | | | $ 1,000 | | $ 1,248.20 | | $ 3.40 |
Hypothetical- B | | | | | | $ 1,000 | | $ 1,021.77 | | $ 3.06 |
| Fidelity® Japan Fund | | | | | | | | | | |
| Class A | | | | 1.36% | | | | | | |
| Actual | | | | | | $ 1,000 | | $ 1,153.80 | | $ 7.26 |
Hypothetical- B | | | | | | $ 1,000 | | $ 1,018.05 | | $ 6.81 |
| Class M | | | | 1.65% | | | | | | |
| Actual | | | | | | $ 1,000 | | $ 1,151.60 | | $ 8.80 |
Hypothetical- B | | | | | | $ 1,000 | | $ 1,016.61 | | $ 8.25 |
| Class C | | | | 2.07% | | | | | | |
| Actual | | | | | | $ 1,000 | | $ 1,149.20 | | $ 11.03 |
Hypothetical- B | | | | | | $ 1,000 | | $ 1,014.53 | | $ 10.34 |
| Fidelity® Japan Fund | | | | 1.09% | | | | | | |
| Actual | | | | | | $ 1,000 | | $ 1,155.10 | | $ 5.82 |
Hypothetical- B | | | | | | $ 1,000 | | $ 1,019.39 | | $ 5.46 |
| Class I | | | | 1.07% | | | | | | |
| Actual | | | | | | $ 1,000 | | $ 1,155.40 | | $ 5.72 |
Hypothetical- B | | | | | | $ 1,000 | | $ 1,019.49 | | $ 5.36 |
| Class Z | | | | .93% | | | | | | |
| Actual | | | | | | $ 1,000 | | $ 1,156.30 | | $ 4.97 |
Hypothetical- B | | | | | | $ 1,000 | | $ 1,020.18 | | $ 4.66 |
| | | | | | | | | | |
| Fidelity® Japan Smaller Companies Fund | | | | .91% | | | | | | |
| Actual | | | | | | $ 1,000 | | $ 1,149.00 | | $ 4.85 |
Hypothetical- B | | | | | | $ 1,000 | | $ 1,020.28 | | $ 4.56 |
| Fidelity® Latin America Fund | | | | | | | | | | |
| Class A | | | | 1.33% | | | | | | |
| Actual | | | | | | $ 1,000 | | $ 927.00 | | $ 6.35 |
Hypothetical- B | | | | | | $ 1,000 | | $ 1,018.20 | | $ 6.66 |
| Class M | | | | 1.58% | | | | | | |
| Actual | | | | | | $ 1,000 | | $ 925.70 | | $ 7.54 |
Hypothetical- B | | | | | | $ 1,000 | | $ 1,016.96 | | $ 7.90 |
| Class C | | | | 2.08% | | | | | | |
| Actual | | | | | | $ 1,000 | | $ 923.40 | | $ 9.92 |
Hypothetical- B | | | | | | $ 1,000 | | $ 1,014.48 | | $ 10.39 |
| Fidelity® Latin America Fund | | | | 1.07% | | | | | | |
| Actual | | | | | | $ 1,000 | | $ 927.90 | | $ 5.11 |
Hypothetical- B | | | | | | $ 1,000 | | $ 1,019.49 | | $ 5.36 |
| Class I | | | | 1.04% | | | | | | |
| Actual | | | | | | $ 1,000 | | $ 927.90 | | $ 4.97 |
Hypothetical- B | | | | | | $ 1,000 | | $ 1,019.64 | | $ 5.21 |
| Class Z | | | | .86% | | | | | | |
| Actual | | | | | | $ 1,000 | | $ 929.00 | | $ 4.11 |
Hypothetical- B | | | | | | $ 1,000 | | $ 1,020.53 | | $ 4.31 |
| | | | | | | | | | |
| Fidelity® Nordic Fund | | | | .94% | | | | | | |
| Actual | | | | | | $ 1,000 | | $ 1,282.70 | | $ 5.32 |
Hypothetical- B | | | | | | $ 1,000 | | $ 1,020.13 | | $ 4.71 |
| | | | | | | | | | |
| Fidelity® Pacific Basin Fund | | | | 1.16% | | | | | | |
| Actual | | | | | | $ 1,000 | | $ 1,235.30 | | $ 6.43 |
Hypothetical- B | | | | | | $ 1,000 | | $ 1,019.04 | | $ 5.81 |
| |
A Annualized expense ratio reflects expenses net of applicable fee waivers.
B 5% return per year before expenses
C Expenses are equal to the annualized expense ratio, multiplied by the average account value over the period, multiplied by 181/ 365 (to reflect the one-half year period). The fees and expenses of any Underlying Funds are not included in each annualized expense ratio.
The Securities and Exchange Commission adopted Rule 22e-4 under the Investment Company Act of 1940 (the Liquidity Rule) to promote effective liquidity risk management throughout the open-end investment company industry, thereby reducing the risk that funds will be unable to meet their redemption obligations and mitigating dilution of the interests of fund shareholders.
The Funds have adopted and implemented a liquidity risk management program (the Program) reasonably designed to assess and manage each Fund's liquidity risk and to comply with the requirements of the Liquidity Rule. Each Fund's Board of Trustees (the Board) has designated each Fund's investment adviser as administrator of the Program. The Fidelity advisers have established a Liquidity Risk Management Committee (the LRM Committee) to manage the Program for each of the Fidelity Funds. The LRM Committee monitors the adequacy and effectiveness of implementation of the Program and on a periodic basis assesses each Fund's liquidity risk based on a variety of factors including (1) the Fund's investment strategy, (2) portfolio liquidity and cash flow projections during normal and reasonably foreseeable stressed conditions, (3) shareholder redemptions, (4) borrowings and other funding sources and (5) certain factor specific to ETFs including the effect of the Fund's prices and spreads, market participants, and basket compositions on the overall liquidity of the Fund's portfolio, as applicable.
In accordance with the Program, each of the Fund's portfolio investments is classified into one of four defined liquidity categories based on a determination of a reasonable expectation for how long it would take to convert the investment to cash (or sell or dispose of the investment) without significantly changing its market value.
- Highly liquid investments - cash or convertible to cash within three business days or less
- Moderately liquid investments - convertible to cash in three to seven calendar days
- Less liquid investments - can be sold or disposed of, but not settled, within seven calendar days
- Illiquid investments - cannot be sold or disposed of within seven calendar days
Liquidity classification determinations take into account a variety of factors including various market, trading and investment-specific considerations, as well as market depth, and generally utilize analysis from a third-party liquidity metrics service.
The Liquidity Rule places a 15% limit on a fund's illiquid investments and requires funds that do not primarily hold assets that are highly liquid investments to determine and maintain a minimum percentage of the fund's net assets to be invested in highly liquid investments (highly liquid investment minimum or HLIM). The Program includes provisions reasonably designed to comply with the 15% limit on illiquid investments and for determining, periodically reviewing and complying with the HLIM requirement as applicable.
At a recent meeting of the Fund's Board of Trustees, the LRM Committee provided a written report to the Board pertaining to the operation, adequacy, and effectiveness of the Program for the period December 1, 2021 through November 30, 2022. The report concluded that the Program is operating effectively and is reasonably designed to assess and manage the Fund's liquidity risk.
1.703611.125
TIF-SANN-0623
Fidelity® International Small Cap Opportunities Fund
Semi-Annual Report
April 30, 2023
Includes Fidelity and Fidelity Advisor share classes
Contents
To view a fund's proxy voting guidelines and proxy voting record for the 12-month period ended June 30, visit http://www.fidelity.com/proxyvotingresults or visit the Securities and Exchange Commission's (SEC) web site at http://www.sec.gov.
You may also call 1-800-544-8544 if you're an individual investing directly with Fidelity, call 1-800-835-5092 if you're a plan sponsor or participant with Fidelity as your recordkeeper or call 1-877-208-0098 on institutional accounts or if you're an advisor or invest through one to request a free copy of the proxy voting guidelines.
Standard & Poor's, S&P and S&P 500 are registered service marks of The McGraw-Hill Companies, Inc. and have been licensed for use by Fidelity Distributors Corporation.
Other third-party marks appearing herein are the property of their respective owners.
All other marks appearing herein are registered or unregistered trademarks or service marks of FMR LLC or an affiliated company. © 2023 FMR LLC. All rights reserved.
This report and the financial statements contained herein are submitted for the general information of the shareholders of the Fund. This report is not authorized for distribution to prospective investors in the Fund unless preceded or accompanied by an effective prospectus.
A fund files its complete schedule of portfolio holdings with the SEC for the first and third quarters of each fiscal year on Form N-PORT. Forms N-PORT are available on the SEC's web site at http://www.sec.gov. A fund's Forms N-PORT may be reviewed and copied at the SEC's Public Reference Room in Washington, DC. Information regarding the operation of the SEC's Public Reference Room may be obtained by calling 1-800-SEC-0330.
For a complete list of a fund's portfolio holdings, view the most recent holdings listing, semiannual report, or annual report on Fidelity's web site at http://www.fidelity.com, http://www.institutional.fidelity.com, or http://www.401k.com, as applicable.
NOT FDIC INSURED •MAY LOSE VALUE •NO BANK GUARANTEE
Neither the Fund nor Fidelity Distributors Corporation is a bank.
Top Holdings (% of Fund's net assets) |
| |
| AddTech AB (B Shares) (Sweden, Trading Companies & Distributors) | 4.3 | |
| Spectris PLC (United Kingdom, Electronic Equipment, Instruments & Components) | 4.1 | |
| Lagercrantz Group AB (B Shares) (Sweden, Electronic Equipment, Instruments & Components) | 4.2 | |
| Interpump Group SpA (Italy, Machinery) | 3.3 | |
| Aalberts Industries NV (Netherlands, Machinery) | 3.2 | |
| Azbil Corp. (Japan, Electronic Equipment, Instruments & Components) | 3.1 | |
| CTS Eventim AG (Germany, Entertainment) | 2.8 | |
| SHO-BOND Holdings Co. Ltd. (Japan, Construction & Engineering) | 2.0 | |
| OBIC Co. Ltd. (Japan, IT Services) | 1.8 | |
| Spirax-Sarco Engineering PLC (United Kingdom, Machinery) | 1.8 | |
| | 30.6 | |
| |
| Market Sectors (% of Fund's net assets) |
| |
| Industrials | 33.5 | |
| Information Technology | 20.3 | |
| Health Care | 10.0 | |
| Consumer Discretionary | 8.5 | |
| Communication Services | 7.3 | |
| Consumer Staples | 5.4 | |
| Financials | 4.4 | |
| Materials | 3.3 | |
| Real Estate | 1.9 | |
| Energy | 1.6 | |
| |
Asset Allocation (% of Fund's net assets) |
|
|
Geographic Diversification (% of Fund's net assets) |
|
* Includes Short-Term investments and Net Other Assets (Liabilities). Percentages are adjusted for the effect of derivatives, if applicable. |
| |
Showing Percentage of Net Assets
| Common Stocks - 96.2% |
| | | Shares | Value ($) |
| Australia - 1.1% | | | |
| Imdex Ltd. | | 3,947,753 | 5,455,151 |
| Steadfast Group Ltd. | | 1,655,000 | 6,524,686 |
TOTAL AUSTRALIA | | | 11,979,837 |
| Belgium - 1.7% | | | |
| Azelis Group NV | | 305,600 | 7,239,924 |
| KBC Ancora | | 246,989 | 11,882,382 |
TOTAL BELGIUM | | | 19,122,306 |
| Canada - 3.0% | | | |
| CAE, Inc. (a) | | 411,600 | 9,262,785 |
| McCoy Global, Inc. (a) | | 630,215 | 716,338 |
| Osisko Gold Royalties Ltd. | | 335,000 | 5,444,662 |
| Pason Systems, Inc. | | 492,300 | 4,287,663 |
| Richelieu Hardware Ltd. (b) | | 441,363 | 13,271,675 |
TOTAL CANADA | | | 32,983,123 |
| China - 0.5% | | | |
| Chlitina Holding Ltd. | | 829,500 | 5,916,476 |
| Denmark - 0.5% | | | |
| Spar Nord Bank A/S | | 358,229 | 5,809,405 |
| Egypt - 0.3% | | | |
| Integrated Diagnostics Holdings PLC (c) | | 5,996,716 | 2,704,519 |
| Finland - 0.5% | | | |
| Musti Group OYJ | | 289,502 | 5,994,052 |
| France - 3.6% | | | |
| Laurent-Perrier Group SA | | 42,632 | 5,778,073 |
| Lectra | | 426,010 | 13,847,902 |
| LISI (b) | | 323,264 | 9,154,458 |
| Vetoquinol SA | | 112,417 | 11,012,247 |
TOTAL FRANCE | | | 39,792,680 |
| Germany - 6.4% | | | |
| CTS Eventim AG | | 466,054 | 30,607,276 |
| Nexus AG | | 291,358 | 16,694,464 |
| Rheinmetall AG | | 32,000 | 9,361,742 |
| Scout24 AG (c) | | 127,200 | 7,919,135 |
| Stabilus Se | | 93,636 | 6,108,108 |
TOTAL GERMANY | | | 70,690,725 |
| India - 1.0% | | | |
| Embassy Office Parks (REIT) | | 1,491,217 | 6,018,108 |
| Indian Energy Exchange Ltd. (a)(c) | | 2,648,585 | 5,093,156 |
TOTAL INDIA | | | 11,111,264 |
| Ireland - 1.6% | | | |
| AerCap Holdings NV (a) | | 153,000 | 8,623,080 |
| Cairn Homes PLC | | 4,369,500 | 4,975,180 |
| Irish Residential Properties REIT PLC | | 3,425,000 | 3,894,776 |
TOTAL IRELAND | | | 17,493,036 |
| Israel - 1.2% | | | |
| Ituran Location & Control Ltd. (b) | | 355,577 | 7,396,002 |
| Maytronics Ltd. | | 248,385 | 2,594,480 |
| Tel Aviv Stock Exchange Ltd. | | 724,996 | 3,337,976 |
TOTAL ISRAEL | | | 13,328,458 |
| Italy - 3.3% | | | |
| Interpump Group SpA | | 646,943 | 35,985,500 |
| Japan - 31.1% | | | |
| Ai Holdings Corp. | | 157,100 | 2,750,339 |
| Aoki Super Co. Ltd. | | 175,000 | 3,103,556 |
| Artnature, Inc. | | 483,700 | 2,782,199 |
| Aucnet, Inc. (b) | | 306,977 | 3,590,726 |
| Azbil Corp. | | 1,215,592 | 33,996,176 |
| Broadleaf Co. Ltd. | | 2,509,998 | 7,918,173 |
| Central Automotive Products Ltd. | | 151,500 | 3,221,034 |
| Curves Holdings Co. Ltd. | | 2,020,026 | 11,777,046 |
| Daiichikosho Co. Ltd. | | 737,600 | 13,223,853 |
| Daikokutenbussan Co. Ltd. | | 67,500 | 2,702,405 |
| Digital Hearts Holdings Co. Ltd. | | 556,514 | 6,029,381 |
| Fujitec Co. Ltd. | | 203,000 | 5,407,765 |
| Funai Soken Holdings, Inc. | | 290,650 | 5,571,638 |
| Goldcrest Co. Ltd. | | 595,530 | 7,982,912 |
| Iwatsuka Confectionary Co. Ltd. | | 18,900 | 670,244 |
| Kobayashi Pharmaceutical Co. Ltd. | | 160,550 | 10,018,645 |
| Koshidaka Holdings Co. Ltd. | | 1,487,400 | 12,592,267 |
| Kusuri No Aoki Holdings Co. Ltd. | | 93,500 | 4,486,502 |
| Lasertec Corp. | | 71,144 | 9,678,859 |
| Medikit Co. Ltd. | | 294,400 | 5,109,399 |
| Miroku Jyoho Service Co., Ltd. (b) | | 238,400 | 2,977,852 |
| Misumi Group, Inc. | | 650,568 | 16,412,014 |
| Mitsuboshi Belting Ltd. | | 109,780 | 3,145,165 |
| Nagaileben Co. Ltd. | | 671,327 | 10,442,939 |
| Nihon Parkerizing Co. Ltd. | | 1,672,000 | 13,087,024 |
| NS Tool Co. Ltd. | | 594,500 | 4,956,237 |
| NSD Co. Ltd. | | 432,049 | 7,948,139 |
| OBIC Co. Ltd. | | 130,600 | 20,122,223 |
| OSG Corp. | | 809,800 | 11,375,833 |
| Paramount Bed Holdings Co. Ltd. | | 217,220 | 3,851,918 |
| ProNexus, Inc. | | 497,100 | 3,651,617 |
| San-Ai Obbli Co. Ltd. | | 574,300 | 6,050,845 |
| SHO-BOND Holdings Co. Ltd. | | 502,100 | 21,457,721 |
| Shoei Co. Ltd. | | 642,604 | 11,921,007 |
| SK Kaken Co. Ltd. | | 36,900 | 11,733,304 |
| Software Service, Inc. | | 67,600 | 4,332,101 |
| Techno Medica Co. Ltd. | | 80,791 | 1,065,636 |
| The Monogatari Corp. | | 282,600 | 5,940,172 |
| TIS, Inc. | | 296,800 | 8,150,046 |
| Tocalo Co. Ltd. | | 558,336 | 5,243,449 |
| USS Co. Ltd. | | 677,100 | 11,377,983 |
| YAKUODO Holdings Co. Ltd. | | 235,900 | 4,312,070 |
TOTAL JAPAN | | | 342,168,414 |
| Kenya - 0.0% | | | |
| Safaricom Ltd. | | 3,355,217 | 407,067 |
| Korea (South) - 0.6% | | | |
| BGF Retail Co. Ltd. | | 44,596 | 6,224,208 |
| Netherlands - 5.6% | | | |
| Aalberts Industries NV | | 762,480 | 35,102,583 |
| BE Semiconductor Industries NV (b) | | 106,000 | 9,500,626 |
| IMCD NV | | 114,517 | 17,186,572 |
TOTAL NETHERLANDS | | | 61,789,781 |
| Norway - 2.3% | | | |
| Kongsberg Gruppen ASA | | 429,181 | 19,241,974 |
| Medistim ASA | | 175,242 | 4,324,710 |
| Volue A/S (a) | | 963,944 | 1,628,123 |
TOTAL NORWAY | | | 25,194,807 |
| South Africa - 0.5% | | | |
| Clicks Group Ltd. | | 336,429 | 4,916,820 |
| Spain - 0.3% | | | |
| Fluidra SA | | 190,001 | 3,251,393 |
| Sweden - 12.8% | | | |
| Addlife AB | | 676,924 | 8,000,272 |
| AddTech AB (B Shares) | | 2,389,665 | 47,769,763 |
| Autoliv, Inc. (b) | | 161,800 | 13,884,058 |
| Bergman & Beving AB (B Shares) | | 224,870 | 3,157,594 |
| Hemnet Group AB | | 570,600 | 9,347,668 |
| INVISIO AB | | 360,859 | 7,407,162 |
| John Mattson Fastighetsforetag (a) | | 427,564 | 2,951,866 |
| Lagercrantz Group AB (B Shares) | | 3,556,312 | 45,706,449 |
| Teqnion AB | | 122,243 | 2,128,961 |
TOTAL SWEDEN | | | 140,353,793 |
| Switzerland - 1.5% | | | |
| Tecan Group AG | | 37,821 | 16,408,775 |
| Taiwan - 0.5% | | | |
| Addcn Technology Co. Ltd. | | 855,032 | 5,652,604 |
| United Kingdom - 12.2% | | | |
| Bodycote PLC | | 1,851,267 | 16,065,034 |
| Clarkson PLC | | 219,953 | 8,569,204 |
| Dechra Pharmaceuticals PLC | | 206,495 | 9,679,820 |
| DP Poland PLC (a) | | 15,541,591 | 1,845,764 |
| Howden Joinery Group PLC | | 1,461,900 | 12,577,764 |
| InterContinental Hotel Group PLC ADR | | 76,000 | 5,265,280 |
| Rightmove PLC | | 1,999,170 | 14,426,528 |
| Spectris PLC | | 968,878 | 45,770,991 |
| Spirax-Sarco Engineering PLC | | 143,991 | 20,068,541 |
TOTAL UNITED KINGDOM | | | 134,268,926 |
| United States of America - 4.1% | | | |
| Morningstar, Inc. | | 85,400 | 15,227,674 |
| NOV, Inc. | | 390,000 | 6,532,500 |
| PriceSmart, Inc. | | 114,460 | 8,433,413 |
| ResMed, Inc. | | 63,495 | 15,299,755 |
TOTAL UNITED STATES OF AMERICA | | | 45,493,342 |
| TOTAL COMMON STOCKS (Cost $766,166,106) | | | 1,059,041,311 |
| | | | |
| Money Market Funds - 6.2% |
| | | Shares | Value ($) |
| Fidelity Cash Central Fund 4.88% (d) | | 35,897,788 | 35,904,968 |
| Fidelity Securities Lending Cash Central Fund 4.88% (d)(e) | | 31,849,238 | 31,852,423 |
| TOTAL MONEY MARKET FUNDS (Cost $67,757,391) | | | 67,757,391 |
| | | | |
| TOTAL INVESTMENT IN SECURITIES - 102.4% (Cost $833,923,497) | 1,126,798,702 |
NET OTHER ASSETS (LIABILITIES) - (2.4)% | (26,308,662) |
| NET ASSETS - 100.0% | 1,100,490,040 |
| | |
Legend
| (b) | Security or a portion of the security is on loan at period end. |
| (c) | Security exempt from registration under Rule 144A of the Securities Act of 1933. These securities may be resold in transactions exempt from registration, normally to qualified institutional buyers. At the end of the period, the value of these securities amounted to $15,716,810 or 1.4% of net assets. |
| (d) | Affiliated fund that is generally available only to investment companies and other accounts managed by Fidelity Investments. The rate quoted is the annualized seven-day yield of the fund at period end. A complete unaudited listing of the fund's holdings as of its most recent quarter end is available upon request. In addition, each Fidelity Central Fund's financial statements are available on the SEC's website or upon request. |
| (e) | Investment made with cash collateral received from securities on loan. |
Affiliated Central Funds
Fiscal year to date information regarding the Fund's investments in Fidelity Central Funds, including the ownership percentage, is presented below.
| Affiliate | Value, beginning of period ($) | Purchases ($) | Sales Proceeds ($) | Dividend Income ($) | Realized Gain (loss) ($) | Change in Unrealized appreciation (depreciation) ($) | Value, end of period ($) | % ownership, end of period |
| Fidelity Cash Central Fund 4.88% | 26,881,448 | 108,978,443 | 99,954,923 | 392,059 | - | - | 35,904,968 | 0.1% |
| Fidelity Securities Lending Cash Central Fund 4.88% | 13,986,458 | 85,469,217 | 67,603,251 | 20,667 | - | (1) | 31,852,423 | 0.1% |
| Total | 40,867,906 | 194,447,660 | 167,558,174 | 412,726 | - | (1) | 67,757,391 | |
| | | | | | | | | |
Amounts in the dividend income column in the above table include any capital gain distributions from underlying funds, which are presented in the corresponding line item in the Statement of Operations, if applicable.
Amounts in the dividend income column for Fidelity Securities Lending Cash Central Fund represents the income earned on investing cash collateral, less rebates paid to borrowers and any lending agent fees associated with the loan, plus any premium payments received for lending certain types of securities.
Amounts included in the purchases and sales proceeds columns may include in-kind transactions, if applicable.
Investment Valuation
The following is a summary of the inputs used, as of April 30, 2023, involving the Fund's assets and liabilities carried at fair value. The inputs or methodology used for valuing securities may not be an indication of the risk associated with investing in those securities. For more information on valuation inputs, and their aggregation into the levels used below, please refer to the Investment Valuation section in the accompanying Notes to Financial Statements.
| Valuation Inputs at Reporting Date: |
| Description | Total ($) | Level 1 ($) | Level 2 ($) | Level 3 ($) |
Investments in Securities: | | | | |
|
| Equities: | | | | |
Communication Services | 81,584,131 | 62,707,674 | 18,876,457 | - |
Consumer Discretionary | 94,979,049 | 34,558,814 | 60,420,235 | - |
Consumer Staples | 59,344,611 | 19,128,306 | 40,216,305 | - |
Energy | 17,587,346 | 11,536,501 | 6,050,845 | - |
Financials | 47,875,279 | 36,257,437 | 11,617,842 | - |
Health Care | 108,926,555 | 84,124,562 | 24,801,993 | - |
Industrials | 368,755,256 | 291,533,817 | 77,221,439 | - |
Information Technology | 223,421,281 | 123,850,093 | 99,571,188 | - |
Materials | 35,720,141 | 5,444,662 | 30,275,479 | - |
Real Estate | 20,847,662 | 6,846,642 | 14,001,020 | - |
|
| Money Market Funds | 67,757,391 | 67,757,391 | - | - |
| Total Investments in Securities: | 1,126,798,702 | 743,745,899 | 383,052,803 | - |
| Statement of Assets and Liabilities |
| | | | April 30, 2023 (Unaudited) |
| | | | | |
| Assets | | | | |
| Investment in securities, at value (including securities loaned of $30,820,504) - See accompanying schedule: | | | | |
Unaffiliated issuers (cost $766,166,106) | $ | 1,059,041,311 | | |
Fidelity Central Funds (cost $67,757,391) | | 67,757,391 | | |
| | | | | |
| | | | | |
| Total Investment in Securities (cost $833,923,497) | | | $ | 1,126,798,702 |
| Foreign currency held at value (cost $175,473) | | | | 175,278 |
| Receivable for investments sold | | | | 1,435,481 |
| Receivable for fund shares sold | | | | 466,951 |
| Dividends receivable | | | | 4,350,552 |
| Reclaims receivable | | | | 1,662,643 |
| Distributions receivable from Fidelity Central Funds | | | | 120,282 |
| Prepaid expenses | | | | 441 |
| Other receivables | | | | 4,201 |
Total assets | | | | 1,135,014,531 |
| Liabilities | | | | |
| Payable for investments purchased | $ | 643,173 | | |
| Payable for fund shares redeemed | | 678,331 | | |
| Accrued management fee | | 658,087 | | |
| Distribution and service plan fees payable | | 13,747 | | |
| Other affiliated payables | | 160,764 | | |
| Other payables and accrued expenses | | 514,356 | | |
| Collateral on securities loaned | | 31,856,033 | | |
| Total Liabilities | | | | 34,524,491 |
| Net Assets | | | $ | 1,100,490,040 |
| Net Assets consist of: | | | | |
| Paid in capital | | | $ | 791,077,448 |
| Total accumulated earnings (loss) | | | | 309,412,592 |
| Net Assets | | | $ | 1,100,490,040 |
| | | | | |
| Net Asset Value and Maximum Offering Price | | | | |
| Class A : | | | | |
Net Asset Value and redemption price per share ($29,631,524 ÷ 1,563,189 shares) (a) | | | $ | 18.96 |
| Maximum offering price per share (100/94.25 of $18.96) | | | $ | 20.12 |
| Class M : | | | | |
Net Asset Value and redemption price per share ($11,559,734 ÷ 620,692 shares) (a) | | | $ | 18.62 |
| Maximum offering price per share (100/96.50 of $18.62) | | | $ | 19.30 |
| Class C : | | | | |
Net Asset Value and offering price per share ($3,396,539 ÷ 191,157 shares) (a) | | | $ | 17.77 |
| International Small Cap Opportunities : | | | | |
Net Asset Value , offering price and redemption price per share ($744,684,302 ÷ 38,499,324 shares) | | | $ | 19.34 |
| Class I : | | | | |
Net Asset Value , offering price and redemption price per share ($66,102,306 ÷ 3,422,227 shares) | | | $ | 19.32 |
| Class Z : | | | | |
Net Asset Value , offering price and redemption price per share ($245,115,635 ÷ 12,711,963 shares) | | | $ | 19.28 |
(a)Redemption price per share is equal to net asset value less any applicable contingent deferred sales charge. |
| Statement of Operations |
| | | | Six months ended April 30, 2023 (Unaudited) |
| Investment Income | | | | |
| Dividends | | | $ | 7,862,869 |
| Income from Fidelity Central Funds (including $20,667 from security lending) | | | | 412,726 |
| Income before foreign taxes withheld | | | $ | 8,275,595 |
| Less foreign taxes withheld | | | | (736,900) |
| Total Income | | | | 7,538,695 |
| Expenses | | | | |
| Management fee | | | | |
| Basic fee | $ | 4,510,472 | | |
| Performance adjustment | | 106,864 | | |
| Transfer agent fees | | 740,869 | | |
| Distribution and service plan fees | | 81,609 | | |
| Accounting fees | | 241,345 | | |
| Custodian fees and expenses | | 47,658 | | |
| Independent trustees' fees and expenses | | 3,667 | | |
| Registration fees | | 33,926 | | |
| Audit | | 48,068 | | |
| Legal | | 843 | | |
| Interest | | 4,911 | | |
| Miscellaneous | | 2,394 | | |
| Total expenses before reductions | | 5,822,626 | | |
| Expense reductions | | (25,181) | | |
| Total expenses after reductions | | | | 5,797,445 |
| Net Investment income (loss) | | | | 1,741,250 |
| Realized and Unrealized Gain (Loss) | | | | |
| Net realized gain (loss) on: | | | | |
| Investment Securities: | | | | |
| Unaffiliated issuers (net of foreign taxes of $9,685) | | 19,336,052 | | |
| Foreign currency transactions | | 129,271 | | |
| Total net realized gain (loss) | | | | 19,465,323 |
| Change in net unrealized appreciation (depreciation) on: | | | | |
| Investment Securities: | | | | |
| Unaffiliated issuers (net of decrease in deferred foreign taxes of $175,096) | | 155,391,112 | | |
| Fidelity Central Funds | | (1) | | |
| Assets and liabilities in foreign currencies | | 194,012 | | |
| Total change in net unrealized appreciation (depreciation) | | | | 155,585,123 |
| Net gain (loss) | | | | 175,050,446 |
| Net increase (decrease) in net assets resulting from operations | | | $ | 176,791,696 |
| Statement of Changes in Net Assets |
| |
| | Six months ended April 30, 2023 (Unaudited) | | Year ended October 31, 2022 |
| Increase (Decrease) in Net Assets | | | | |
| Operations | | | | |
| Net investment income (loss) | $ | 1,741,250 | $ | 8,172,300 |
| Net realized gain (loss) | | 19,465,323 | | 72,325,342 |
| Change in net unrealized appreciation (depreciation) | | 155,585,123 | | (657,801,200) |
| Net increase (decrease) in net assets resulting from operations | | 176,791,696 | | (577,303,558) |
| Distributions to shareholders | | (64,708,392) | | (145,923,001) |
| Share transactions - net increase (decrease) | | (53,739,053) | | (23,291,061) |
| Total increase (decrease) in net assets | | 58,344,251 | | (746,517,620) |
| | | | | |
| Net Assets | | | | |
| Beginning of period | | 1,042,145,789 | | 1,788,663,409 |
| End of period | $ | 1,100,490,040 | $ | 1,042,145,789 |
| | | | | |
| | | | | |
Financial Highlights
| Fidelity Advisor® International Small Cap Opportunities Fund Class A |
| |
| | Six months ended (Unaudited) April 30, 2023 | | Years ended October 31, 2022 | | 2021 | | 2020 | | 2019 | | 2018 |
Selected Per-Share Data | | | | | | | | | | | | |
| Net asset value, beginning of period | $ | 17.17 | $ | 28.35 | $ | 20.86 | $ | 19.02 | $ | 17.33 | $ | 18.47 |
| Income from Investment Operations | | | | | | | | | | | | |
Net investment income (loss) A,B | | - C | | .06 | | (.06) | | (.04) | | .11 | | .12 |
| Net realized and unrealized gain (loss) | | 2.92 | | (8.93) | | 7.55 | | 2.05 | | 2.01 | | (.92) |
| Total from investment operations | | 2.92 | | (8.87) | | 7.49 | | 2.01 | | 2.12 | | (.80) |
| Distributions from net investment income | | - | | - | | - | | (.11) | | (.11) | | (.09) |
| Distributions from net realized gain | | (1.13) | | (2.31) | | - | | (.05) | | (.31) | | (.24) |
| Total distributions | | (1.13) | | (2.31) | | - | | (.17) D | | (.43) D | | (.34) D |
Redemption fees added to paid in capital A | | - | | - | | - | | - | | - | | - C |
| Net asset value, end of period | $ | 18.96 | $ | 17.17 | $ | 28.35 | $ | 20.86 | $ | 19.02 | $ | 17.33 |
Total Return E,F,G | | 17.43% | | (33.79)% | | 35.91% | | 10.58% | | 12.61% | | (4.48)% |
Ratios to Average Net Assets B,H,I | | | | | | | | | | | | |
| Expenses before reductions | | 1.38% J | | 1.49% | | 1.50% | | 1.57% | | 1.49% | | 1.38% |
| Expenses net of fee waivers, if any | | 1.38% J | | 1.48% | | 1.50% | | 1.57% | | 1.49% | | 1.38% |
| Expenses net of all reductions | | 1.38% J | | 1.48% | | 1.50% | | 1.56% | | 1.48% | | 1.37% |
| Net investment income (loss) | | -% J,K | | .30% | | (.25)% | | (.20)% | | .64% | | .65% |
| Supplemental Data | | | | | | | | | | | | |
| Net assets, end of period (000 omitted) | $ | 29,632 | $ | 26,380 | $ | 45,981 | $ | 37,771 | $ | 41,679 | $ | 41,164 |
Portfolio turnover rate L | | 6% J | | 13% | | 21% | | 20% | | 17% | | 19% |
A Calculated based on average shares outstanding during the period.
B Net investment income (loss) is affected by the timing of the declaration of dividends by any underlying mutual funds or exchange-traded funds (ETFs). Net investment income (loss) of any mutual funds or ETFs is not included in the Fund's net investment income (loss) ratio.
C Amount represents less than $.005 per share.
D Total distributions per share do not sum due to rounding.
E Total returns for periods of less than one year are not annualized.
F Total returns would have been lower if certain expenses had not been reduced during the applicable periods shown.
G Total returns do not include the effect of the sales charges.
H Fees and expenses of any underlying mutual funds or exchange-traded funds (ETFs) are not included in the Fund's expense ratio. The Fund indirectly bears its proportionate share of these expenses. For additional expense information related to investments in Fidelity Central Funds, please refer to the "Investments in Fidelity Central Funds" note found in the Notes to Financial Statements section of the most recent Annual or Semi-Annual report.
I Expense ratios reflect operating expenses of the class. Expenses before reductions do not reflect amounts reimbursed, waived, or reduced through arrangements with the investment adviser, brokerage services, or other offset arrangements, if applicable, and do not represent the amount paid by the class during periods when reimbursements, waivers or reductions occur.
J Annualized.
K Amount represents less than .005%.
L Amount does not include the portfolio activity of any underlying mutual funds or exchange-traded funds (ETFs).
| Fidelity Advisor® International Small Cap Opportunities Fund Class M |
| |
| | Six months ended (Unaudited) April 30, 2023 | | Years ended October 31, 2022 | | 2021 | | 2020 | | 2019 | | 2018 |
Selected Per-Share Data | | | | | | | | | | | | |
| Net asset value, beginning of period | $ | 16.91 | $ | 28.02 | $ | 20.67 | $ | 18.85 | $ | 17.17 | $ | 18.32 |
| Income from Investment Operations | | | | | | | | | | | | |
Net investment income (loss) A,B | | (.02) | | .01 | | (.13) | | (.09) | | .06 | | .07 |
| Net realized and unrealized gain (loss) | | 2.86 | | (8.81) | | 7.48 | | 2.03 | | 1.99 | | (.92) |
| Total from investment operations | | 2.84 | | (8.80) | | 7.35 | | 1.94 | | 2.05 | | (.85) |
| Distributions from net investment income | | - | | - | | - | | (.06) | | (.06) | | (.06) |
| Distributions from net realized gain | | (1.13) | | (2.31) | | - | | (.05) | | (.31) | | (.24) |
| Total distributions | | (1.13) | | (2.31) | | - | | (.12) C | | (.37) | | (.30) |
Redemption fees added to paid in capital A | | - | | - | | - | | - | | - | | - D |
| Net asset value, end of period | $ | 18.62 | $ | 16.91 | $ | 28.02 | $ | 20.67 | $ | 18.85 | $ | 17.17 |
Total Return E,F,G | | 17.22% | | (33.95)% | | 35.56% | | 10.29% | | 12.29% | | (4.74)% |
Ratios to Average Net Assets B,H,I | | | | | | | | | | | | |
| Expenses before reductions | | 1.64% J | | 1.74% | | 1.75% | | 1.84% | | 1.77% | | 1.67% |
| Expenses net of fee waivers, if any | | 1.63% J | | 1.74% | | 1.75% | | 1.84% | | 1.77% | | 1.67% |
| Expenses net of all reductions | | 1.63% J | | 1.74% | | 1.75% | | 1.83% | | 1.77% | | 1.66% |
| Net investment income (loss) | | (.25)% J | | .05% | | (.50)% | | (.47)% | | .36% | | .36% |
| Supplemental Data | | | | | | | | | | | | |
| Net assets, end of period (000 omitted) | $ | 11,560 | $ | 10,115 | $ | 16,378 | $ | 13,141 | $ | 13,875 | $ | 13,245 |
Portfolio turnover rate K | | 6% J | | 13% | | 21% | | 20% | | 17% | | 19% |
A Calculated based on average shares outstanding during the period.
B Net investment income (loss) is affected by the timing of the declaration of dividends by any underlying mutual funds or exchange-traded funds (ETFs). Net investment income (loss) of any mutual funds or ETFs is not included in the Fund's net investment income (loss) ratio.
C Total distributions per share do not sum due to rounding.
D Amount represents less than $.005 per share.
E Total returns for periods of less than one year are not annualized.
F Total returns would have been lower if certain expenses had not been reduced during the applicable periods shown.
G Total returns do not include the effect of the sales charges.
H Fees and expenses of any underlying mutual funds or exchange-traded funds (ETFs) are not included in the Fund's expense ratio. The Fund indirectly bears its proportionate share of these expenses. For additional expense information related to investments in Fidelity Central Funds, please refer to the "Investments in Fidelity Central Funds" note found in the Notes to Financial Statements section of the most recent Annual or Semi-Annual report.
I Expense ratios reflect operating expenses of the class. Expenses before reductions do not reflect amounts reimbursed, waived, or reduced through arrangements with the investment adviser, brokerage services, or other offset arrangements, if applicable, and do not represent the amount paid by the class during periods when reimbursements, waivers or reductions occur.
J Annualized.
K Amount does not include the portfolio activity of any underlying mutual funds or exchange-traded funds (ETFs).
| Fidelity Advisor® International Small Cap Opportunities Fund Class C |
| |
| | Six months ended (Unaudited) April 30, 2023 | | Years ended October 31, 2022 | | 2021 | | 2020 | | 2019 | | 2018 |
Selected Per-Share Data | | | | | | | | | | | | |
| Net asset value, beginning of period | $ | 16.22 | $ | 27.10 | $ | 20.09 | $ | 18.31 | $ | 16.69 | $ | 17.84 |
| Income from Investment Operations | | | | | | | | | | | | |
Net investment income (loss) A,B | | (.07) | | (.09) | | (.25) | | (.18) | | (.02) | | (.02) |
| Net realized and unrealized gain (loss) | | 2.75 | | (8.48) | | 7.26 | | 1.96 | | 1.93 | | (.89) |
| Total from investment operations | | 2.68 | | (8.57) | | 7.01 | | 1.78 | | 1.91 | | (.91) |
| Distributions from net realized gain | | (1.13) | | (2.31) | | - | | - | | (.29) | | (.24) |
| Total distributions | | (1.13) | | (2.31) | | - | | - | | (.29) | | (.24) |
Redemption fees added to paid in capital A | | - | | - | | - | | - | | - | | - C |
| Net asset value, end of period | $ | 17.77 | $ | 16.22 | $ | 27.10 | $ | 20.09 | $ | 18.31 | $ | 16.69 |
Total Return D,E,F | | 16.95% | | (34.28)% | | 34.89% | | 9.72% | | 11.74% | | (5.19)% |
Ratios to Average Net Assets B,G,H | | | | | | | | | | | | |
| Expenses before reductions | | 2.17% I | | 2.26% | | 2.26% | | 2.33% | | 2.27% | | 2.15% |
| Expenses net of fee waivers, if any | | 2.16% I | | 2.25% | | 2.26% | | 2.33% | | 2.26% | | 2.15% |
| Expenses net of all reductions | | 2.16% I | | 2.25% | | 2.26% | | 2.33% | | 2.26% | | 2.14% |
| Net investment income (loss) | | (.78)% I | | (.47)% | | (1.01)% | | (.96)% | | (.13)% | | (.12)% |
| Supplemental Data | | | | | | | | | | | | |
| Net assets, end of period (000 omitted) | $ | 3,397 | $ | 3,314 | $ | 6,770 | $ | 7,253 | $ | 9,424 | $ | 14,461 |
Portfolio turnover rate J | | 6% I | | 13% | | 21% | | 20% | | 17% | | 19% |
A Calculated based on average shares outstanding during the period.
B Net investment income (loss) is affected by the timing of the declaration of dividends by any underlying mutual funds or exchange-traded funds (ETFs). Net investment income (loss) of any mutual funds or ETFs is not included in the Fund's net investment income (loss) ratio.
C Amount represents less than $.005 per share.
D Total returns for periods of less than one year are not annualized.
E Total returns would have been lower if certain expenses had not been reduced during the applicable periods shown.
F Total returns do not include the effect of the contingent deferred sales charge.
G Fees and expenses of any underlying mutual funds or exchange-traded funds (ETFs) are not included in the Fund's expense ratio. The Fund indirectly bears its proportionate share of these expenses. For additional expense information related to investments in Fidelity Central Funds, please refer to the "Investments in Fidelity Central Funds" note found in the Notes to Financial Statements section of the most recent Annual or Semi-Annual report.
H Expense ratios reflect operating expenses of the class. Expenses before reductions do not reflect amounts reimbursed, waived, or reduced through arrangements with the investment adviser, brokerage services, or other offset arrangements, if applicable, and do not represent the amount paid by the class during periods when reimbursements, waivers or reductions occur.
I Annualized.
J Amount does not include the portfolio activity of any underlying mutual funds or exchange-traded funds (ETFs).
| Fidelity® International Small Cap Opportunities Fund |
| |
| | Six months ended (Unaudited) April 30, 2023 | | Years ended October 31, 2022 | | 2021 | | 2020 | | 2019 | | 2018 |
Selected Per-Share Data | | | | | | | | | | | | |
| Net asset value, beginning of period | $ | 17.47 | $ | 28.77 | $ | 21.10 | $ | 19.24 | $ | 17.53 | $ | 18.69 |
| Income from Investment Operations | | | | | | | | | | | | |
Net investment income (loss) A,B | | .03 | | .13 | | .01 | | .02 | | .17 | | .18 |
| Net realized and unrealized gain (loss) | | 2.98 | | (9.09) | | 7.66 | | 2.07 | | 2.02 | | (.95) |
| Total from investment operations | | 3.01 | | (8.96) | | 7.67 | | 2.09 | | 2.19 | | (.77) |
| Distributions from net investment income | | - C | | (.04) | | - | | (.17) | | (.17) | | (.15) |
| Distributions from net realized gain | | (1.13) | | (2.31) | | - | | (.05) | | (.31) | | (.24) |
| Total distributions | | (1.14) D | | (2.34) D | | - | | (.23) D | | (.48) | | (.39) |
Redemption fees added to paid in capital A | | - | | - | | - | | - | | - | | - C |
| Net asset value, end of period | $ | 19.34 | $ | 17.47 | $ | 28.77 | $ | 21.10 | $ | 19.24 | $ | 17.53 |
Total Return E,F | | 17.61% | | (33.62)% | | 36.35% | | 10.90% | | 12.97% | | (4.25)% |
Ratios to Average Net Assets B,G,H | | | | | | | | | | | | |
| Expenses before reductions | | 1.07% I | | 1.19% | | 1.21% | | 1.26% | | 1.19% | | 1.10% |
| Expenses net of fee waivers, if any | | 1.07% I | | 1.19% | | 1.20% | | 1.26% | | 1.19% | | 1.10% |
| Expenses net of all reductions | | 1.07% I | | 1.19% | | 1.20% | | 1.25% | | 1.19% | | 1.09% |
| Net investment income (loss) | | .31% I | | .60% | | .05% | | .11% | | .94% | | .93% |
| Supplemental Data | | | | | | | | | | | | |
| Net assets, end of period (000 omitted) | $ | 744,684 | $ | 700,271 | $ | 1,268,421 | $ | 1,152,472 | $ | 1,040,989 | $ | 965,482 |
Portfolio turnover rate J | | 6% I | | 13% | | 21% | | 20% | | 17% | | 19% |
A Calculated based on average shares outstanding during the period.
B Net investment income (loss) is affected by the timing of the declaration of dividends by any underlying mutual funds or exchange-traded funds (ETFs). Net investment income (loss) of any mutual funds or ETFs is not included in the Fund's net investment income (loss) ratio.
C Amount represents less than $.005 per share.
D Total distributions per share do not sum due to rounding.
E Total returns for periods of less than one year are not annualized.
F Total returns would have been lower if certain expenses had not been reduced during the applicable periods shown.
G Fees and expenses of any underlying mutual funds or exchange-traded funds (ETFs) are not included in the Fund's expense ratio. The Fund indirectly bears its proportionate share of these expenses. For additional expense information related to investments in Fidelity Central Funds, please refer to the "Investments in Fidelity Central Funds" note found in the Notes to Financial Statements section of the most recent Annual or Semi-Annual report.
H Expense ratios reflect operating expenses of the class. Expenses before reductions do not reflect amounts reimbursed, waived, or reduced through arrangements with the investment adviser, brokerage services, or other offset arrangements, if applicable, and do not represent the amount paid by the class during periods when reimbursements, waivers or reductions occur.
I Annualized.
J Amount does not include the portfolio activity of any underlying mutual funds or exchange-traded funds (ETFs).
| Fidelity Advisor® International Small Cap Opportunities Fund Class I |
| |
| | Six months ended (Unaudited) April 30, 2023 | | Years ended October 31, 2022 | | 2021 | | 2020 | | 2019 | | 2018 |
Selected Per-Share Data | | | | | | | | | | | | |
| Net asset value, beginning of period | $ | 17.46 | $ | 28.75 | $ | 21.09 | $ | 19.22 | $ | 17.51 | $ | 18.66 |
| Income from Investment Operations | | | | | | | | | | | | |
Net investment income (loss) A,B | | .03 | | .13 | | .01 | | .02 | | .17 | | .18 |
| Net realized and unrealized gain (loss) | | 2.97 | | (9.07) | | 7.65 | | 2.07 | | 2.02 | | (.94) |
| Total from investment operations | | 3.00 | | (8.94) | | 7.66 | | 2.09 | | 2.19 | | (.76) |
| Distributions from net investment income | | (.01) | | (.04) | | - | | (.16) | | (.16) | | (.15) |
| Distributions from net realized gain | | (1.13) | | (2.31) | | - | | (.05) | | (.31) | | (.24) |
| Total distributions | | (1.14) | | (2.35) | | - | | (.22) C | | (.48) C | | (.39) |
Redemption fees added to paid in capital A | | - | | - | | - | | - | | - | | - D |
| Net asset value, end of period | $ | 19.32 | $ | 17.46 | $ | 28.75 | $ | 21.09 | $ | 19.22 | $ | 17.51 |
Total Return E,F | | 17.59% | | (33.60)% | | 36.32% | | 10.90% | | 12.93% | | (4.21)% |
Ratios to Average Net Assets B,G,H | | | | | | | | | | | | |
| Expenses before reductions | | 1.09% I | | 1.20% | | 1.22% | | 1.28% | | 1.20% | | 1.12% |
| Expenses net of fee waivers, if any | | 1.08% I | | 1.19% | | 1.22% | | 1.27% | | 1.19% | | 1.12% |
| Expenses net of all reductions | | 1.08% I | | 1.19% | | 1.22% | | 1.27% | | 1.19% | | 1.11% |
| Net investment income (loss) | | .30% I | | .59% | | .04% | | .09% | | .93% | | .91% |
| Supplemental Data | | | | | | | | | | | | |
| Net assets, end of period (000 omitted) | $ | 66,102 | $ | 82,705 | $ | 141,310 | $ | 113,041 | $ | 142,854 | $ | 159,968 |
Portfolio turnover rate J | | 6% I | | 13% | | 21% | | 20% | | 17% | | 19% |
A Calculated based on average shares outstanding during the period.
B Net investment income (loss) is affected by the timing of the declaration of dividends by any underlying mutual funds or exchange-traded funds (ETFs). Net investment income (loss) of any mutual funds or ETFs is not included in the Fund's net investment income (loss) ratio.
C Total distributions per share do not sum due to rounding.
D Amount represents less than $.005 per share.
E Total returns for periods of less than one year are not annualized.
F Total returns would have been lower if certain expenses had not been reduced during the applicable periods shown.
G Fees and expenses of any underlying mutual funds or exchange-traded funds (ETFs) are not included in the Fund's expense ratio. The Fund indirectly bears its proportionate share of these expenses. For additional expense information related to investments in Fidelity Central Funds, please refer to the "Investments in Fidelity Central Funds" note found in the Notes to Financial Statements section of the most recent Annual or Semi-Annual report.
H Expense ratios reflect operating expenses of the class. Expenses before reductions do not reflect amounts reimbursed, waived, or reduced through arrangements with the investment adviser, brokerage services, or other offset arrangements, if applicable, and do not represent the amount paid by the class during periods when reimbursements, waivers or reductions occur.
I Annualized.
J Amount does not include the portfolio activity of any underlying mutual funds or exchange-traded funds (ETFs).
| Fidelity Advisor® International Small Cap Opportunities Fund Class Z |
| |
| | Six months ended (Unaudited) April 30, 2023 | | Years ended October 31, 2022 | | 2021 | | 2020 | | 2019 | | 2018 A |
Selected Per-Share Data | | | | | | | | | | | | |
| Net asset value, beginning of period | $ | 17.44 | $ | 28.73 | $ | 21.05 | $ | 19.20 | $ | 17.51 | $ | 19.11 |
| Income from Investment Operations | | | | | | | | | | | | |
Net investment income (loss) B,C | | .04 | | .15 | | .04 | | .05 | | .19 | | - D |
| Net realized and unrealized gain (loss) | | 2.97 | | (9.05) | | 7.64 | | 2.05 | | 2.02 | | (1.60) |
| Total from investment operations | | 3.01 | | (8.90) | | 7.68 | | 2.10 | | 2.21 | | (1.60) |
| Distributions from net investment income | | (.04) | | (.08) | | - | | (.20) | | (.20) | | - |
| Distributions from net realized gain | | (1.13) | | (2.31) | | - | | (.05) | | (.31) | | - |
| Total distributions | | (1.17) | | (2.39) | | - | | (.25) | | (.52) E | | - |
| Net asset value, end of period | $ | 19.28 | $ | 17.44 | $ | 28.73 | $ | 21.05 | $ | 19.20 | $ | 17.51 |
Total Return F,G | | 17.68% | | (33.52)% | | 36.48% | | 11.03% | | 13.10% | | (8.37)% |
Ratios to Average Net Assets C,H,I | | | | | | | | | | | | |
| Expenses before reductions | | .96% J | | 1.07% | | 1.09% | | 1.14% | | 1.05% | | 1.03% J |
| Expenses net of fee waivers, if any | | .95% J | | 1.07% | | 1.09% | | 1.13% | | 1.05% | | 1.03% J |
| Expenses net of all reductions | | .95% J | | 1.07% | | 1.09% | | 1.13% | | 1.05% | | 1.02% J |
| Net investment income (loss) | | .43% J | | .72% | | .16% | | .23% | | 1.08% | | .16% J |
| Supplemental Data | | | | | | | | | | | | |
| Net assets, end of period (000 omitted) | $ | 245,116 | $ | 219,360 | $ | 309,803 | $ | 82,476 | $ | 76,527 | $ | 4,617 |
Portfolio turnover rate K | | 6% J | | 13% | | 21% | | 20% | | 17% | | 19% |
A For the period October 2, 2018 (commencement of sale of shares) through October 31, 2018.
B Calculated based on average shares outstanding during the period.
C Net investment income (loss) is affected by the timing of the declaration of dividends by any underlying mutual funds or exchange-traded funds (ETFs). Net investment income (loss) of any mutual funds or ETFs is not included in the Fund's net investment income (loss) ratio.
D Amount represents less than $.005 per share.
E Total distributions per share do not sum due to rounding.
F Total returns for periods of less than one year are not annualized.
G Total returns would have been lower if certain expenses had not been reduced during the applicable periods shown.
H Fees and expenses of any underlying mutual funds or exchange-traded funds (ETFs) are not included in the Fund's expense ratio. The Fund indirectly bears its proportionate share of these expenses. For additional expense information related to investments in Fidelity Central Funds, please refer to the "Investments in Fidelity Central Funds" note found in the Notes to Financial Statements section of the most recent Annual or Semi-Annual report.
I Expense ratios reflect operating expenses of the class. Expenses before reductions do not reflect amounts reimbursed, waived, or reduced through arrangements with the investment adviser, brokerage services, or other offset arrangements, if applicable, and do not represent the amount paid by the class during periods when reimbursements, waivers or reductions occur.
J Annualized.
K Amount does not include the portfolio activity of any underlying mutual funds or exchange-traded funds (ETFs).
For the period ended April 30, 2023
1. Organization.
Fidelity International Small Cap Opportunities Fund (the Fund) is a fund of Fidelity Investment Trust (the Trust) and is authorized to issue an unlimited number of shares. The Trust is registered under the Investment Company Act of 1940, as amended (the 1940 Act), as an open-end management investment company organized as a Massachusetts business trust. The Fund offers Class A, Class M, Class C, International Small Cap Opportunities, Class I and Class Z shares, each of which has equal rights as to assets and voting privileges. Class A, Class M, Class C, Class I and Class Z are Fidelity Advisor classes. Each class has exclusive voting rights with respect to matters that affect that class. Class C shares will automatically convert to Class A shares after a holding period of eight years from the initial date of purchase, with certain exceptions.
2. Investments in Fidelity Central Funds.
Funds may invest in Fidelity Central Funds, which are open-end investment companies generally available only to other investment companies and accounts managed by the investment adviser and its affiliates. The Schedule of Investments lists any Fidelity Central Funds held as an investment as of period end, but does not include the underlying holdings of each Fidelity Central Fund. An investing fund indirectly bears its proportionate share of the expenses of the underlying Fidelity Central Funds.
Based on its investment objective, each Fidelity Central Fund may invest or participate in various investment vehicles or strategies that are similar to those of the investing fund. These strategies are consistent with the investment objectives of the investing fund and may involve certain economic risks which may cause a decline in value of each of the Fidelity Central Funds and thus a decline in the value of the investing fund.
| Fidelity Central Fund | Investment Manager | Investment Objective | Investment Practices | Expense Ratio A |
| Fidelity Money Market Central Funds | Fidelity Management & Research Company LLC (FMR) | Each fund seeks to obtain a high level of current income consistent with the preservation of capital and liquidity. | Short-term Investments | Less than .005 |
A Expenses expressed as a percentage of average net assets and are as of each underlying Central Fund's most recent annual or semi-annual shareholder report.
A complete unaudited list of holdings for each Fidelity Central Fund is available upon request or at the Securities and Exchange Commission website at www.sec.gov. In addition, the financial statements of the Fidelity Central Funds which contain the significant accounting policies (including investment valuation policies) of those funds, and are not covered by the Report of Independent Registered Public Accounting Firm, are available on the Securities and Exchange Commission website or upon request.
3. Significant Accounting Policies.
The Fund is an investment company and applies the accounting and reporting guidance of the Financial Accounting Standards Board (FASB) Accounting Standards Codification Topic 946 Financial Services - Investment Companies . The financial statements have been prepared in conformity with accounting principles generally accepted in the United States of America (GAAP), which require management to make certain estimates and assumptions at the date of the financial statements. Actual results could differ from those estimates. Subsequent events, if any, through the date that the financial statements were issued have been evaluated in the preparation of the financial statements. The Fund's Schedule of Investments lists any underlying mutual funds or exchange-traded funds (ETFs) but does not include the underlying holdings of these funds. The following summarizes the significant accounting policies of the Fund:
Investment Valuation. Investments are valued as of 4:00 p.m. Eastern time on the last calendar day of the period. The Board of Trustees (the Board) has designated the Fund's investment adviser as the valuation designee responsible for the fair valuation function and performing fair value determinations as needed. The investment adviser has established a Fair Value Committee (the Committee) to carry out the day-to-day fair valuation responsibilities and has adopted policies and procedures to govern the fair valuation process and the activities of the Committee. In accordance with these fair valuation policies and procedures, which have been approved by the Board, the Fund attempts to obtain prices from one or more third party pricing services or brokers to value its investments. When current market prices, quotations or currency exchange rates are not readily available or reliable, investments will be fair valued in good faith by the Committee, in accordance with the policies and procedures. Factors used in determining fair value vary by investment type and may include market or investment specific events, transaction data, estimated cash flows, and market observations of comparable investments. The frequency that the fair valuation procedures are used cannot be predicted and they may be utilized to a significant extent. The Committee manages the Fund's fair valuation practices and maintains the fair valuation policies and procedures. The Fund's investment adviser reports to the Board information regarding the fair valuation process and related material matters.
The Fund categorizes the inputs to valuation techniques used to value its investments into a disclosure hierarchy consisting of three levels as shown below:
Level 1 - unadjusted quoted prices in active markets for identical investments
Level 2 - other significant observable inputs (including quoted prices for similar investments, interest rates, prepayment speeds, etc.)
Level 3 - unobservable inputs (including the Fund's own assumptions based on the best information available)
Valuation techniques used to value the Fund's investments by major category are as follows:
Equity securities, including restricted securities, for which market quotations are readily available, are valued at the last reported sale price or official closing price as reported by a third party pricing service on the primary market or exchange on which they are traded and are categorized as Level 1 in the hierarchy. In the event there were no sales during the day or closing prices are not available, securities are valued at the last quoted bid price or may be valued using the last available price and are generally categorized as Level 2 in the hierarchy. For foreign equity securities, when market or security specific events arise, comparisons to the valuation of American Depositary Receipts (ADRs), futures contracts, ETFs and certain indexes as well as quoted prices for similar securities may be used and would be categorized as Level 2 in the hierarchy. For equity securities, including restricted securities, where observable inputs are limited, assumptions about market activity and risk are used and these securities may be categorized as Level 3 in the hierarchy.
Investments in open-end mutual funds, including the Fidelity Central Funds, are valued at their closing net asset value (NAV) each business day and are categorized as Level 1 in the hierarchy.
Changes in valuation techniques may result in transfers in or out of an assigned level within the disclosure hierarchy. The aggregate value of investments by input level as of April 30, 2023 is included at the end of the Fund's Schedule of Investments.
Foreign Currency. Certain Funds may use foreign currency contracts to facilitate transactions in foreign-denominated securities. Gains and losses from these transactions may arise from changes in the value of the foreign currency or if the counterparties do not perform under the contracts' terms.
Foreign-denominated assets, including investment securities, and liabilities are translated into U.S. dollars at the exchange rates at period end. Purchases and sales of investment securities, income and dividends received, and expenses denominated in foreign currencies are translated into U.S. dollars at the exchange rate in effect on the transaction date.
The effects of exchange rate fluctuations on investments are included with the net realized and unrealized gain (loss) on investment securities. Other foreign currency transactions resulting in realized and unrealized gain (loss) are disclosed separately.
Investment Transactions and Income. For financial reporting purposes, the Fund's investment holdings and NAV include trades executed through the end of the last business day of the period. The NAV per share for processing shareholder transactions is calculated as of the close of business of the New York Stock Exchange (NYSE), normally 4:00 p.m. Eastern time and includes trades executed through the end of the prior business day. Gains and losses on securities sold are determined on the basis of identified cost. Commissions paid to certain brokers with whom the investment adviser, or its affiliates, places trades on behalf of a fund include an amount in addition to trade execution, which may be rebated back to a fund. Any such rebates are included in net realized gain (loss) on investments in the Statement of Operations. Dividend income is recorded on the ex-dividend date, except for certain dividends from foreign securities where the ex-dividend date may have passed, which are recorded as soon as the Fund is informed of the ex-dividend date. Non-cash dividends included in dividend income, if any, are recorded at the fair market value of the securities received. Income and capital gain distributions from Fidelity Central Funds, if any, are recorded on the ex-dividend date. Certain distributions received by the Fund represent a return of capital or capital gain. The Fund determines the components of these distributions subsequent to the ex-dividend date, based upon receipt of tax filings or other correspondence relating to the underlying investment. These distributions are recorded as a reduction of cost of investments and/or as a realized gain. Investment income is recorded net of foreign taxes withheld where recovery of such taxes is uncertain. Funds may file withholding tax reclaims in certain jurisdictions to recover a portion of amounts previously withheld. Any withholding tax reclaims income is included in the Statement of Operations in foreign taxes withheld. Any receivables for withholding tax reclaims are included in the Statement of Assets and Liabilities in reclaims receivable.
Class Allocations and Expenses. Investment income, realized and unrealized capital gains and losses, common expenses of a fund, and certain fund-level expense reductions, if any, are allocated daily on a pro-rata basis to each class based on the relative net assets of each class to the total net assets of a fund. Each class differs with respect to transfer agent and distribution and service plan fees incurred, as applicable. Certain expense reductions may also differ by class, if applicable. For the reporting period, the allocated portion of income and expenses to each class as a percent of its average net assets may vary due to the timing of recording these transactions in relation to fluctuating net assets of the classes. Expenses directly attributable to a fund are charged to that fund. Expenses attributable to more than one fund are allocated among the respective funds on the basis of relative net assets or other appropriate methods. Expenses included in the accompanying financial statements reflect the expenses of that fund and do not include any expenses associated with any underlying mutual funds or exchange-traded funds. Although not included in a fund's expenses, a fund indirectly bears its proportionate share of these expenses through the net asset value of each underlying mutual fund or exchange-traded fund. Expense estimates are accrued in the period to which they relate and adjustments are made when actual amounts are known.
Income Tax Information and Distributions to Shareholders. Each year, the Fund intends to qualify as a regulated investment company under Subchapter M of the Internal Revenue Code, including distributing substantially all of its taxable income and realized gains. As a result, no provision for U.S. Federal income taxes is required. The Fund files a U.S. federal tax return, in addition to state and local tax returns as required. The Fund's federal income tax returns are subject to examination by the Internal Revenue Service (IRS) for a period of three fiscal years after they are filed. State and local tax returns may be subject to examination for an additional fiscal year depending on the jurisdiction. Foreign taxes are provided for based on the Fund's understanding of the tax rules and rates that exist in the foreign markets in which it invests. The Fund is subject to a tax imposed on capital gains by certain countries in which it invests. An estimated deferred tax liability for net unrealized appreciation on the applicable securities is included in Other payables and accrued expenses on the Statement of Assets & Liabilities.
Distributions are declared and recorded on the ex-dividend date. Income and capital gain distributions are declared separately for each class. Income and capital gain distributions are determined in accordance with income tax regulations, which may differ from GAAP.
Capital accounts within the financial statements are adjusted for permanent book-tax differences. These adjustments have no impact on net assets or the results of operations. Capital accounts are not adjusted for temporary book-tax differences which will reverse in a subsequent period.
Book-tax differences are primarily due to foreign currency transactions, certain foreign taxes, passive foreign investment companies (PFIC), and losses deferred due to wash sales.
As of period end, the cost and unrealized appreciation (depreciation) in securities, and derivatives if applicable, for federal income tax purposes were as follows:
| Gross unrealized appreciation | $373,682,183 |
| Gross unrealized depreciation | (84,121,937) |
| Net unrealized appreciation (depreciation) | $289,560,246 |
| Tax cost | $837,238,456 |
Restricted Securities (including Private Placements). Funds may invest in securities that are subject to legal or contractual restrictions on resale. These securities generally may be resold in transactions exempt from registration or to the public if the securities are registered. Disposal of these securities may involve time-consuming negotiations and expense, and prompt sale at an acceptable price may be difficult. Information regarding restricted securities held at period end is included at the end of the Schedule of Investments, if applicable.
4. Purchases and Sales of Investments.
Purchases and sales of securities, other than short-term securities and in-kind transactions, as applicable, are noted in the table below.
| | Purchases ($) | Sales ($) |
| Fidelity International Small Cap Opportunities Fund | 34,437,402 | 162,392,394 |
5. Fees and Other Transactions with Affiliates.
Management Fee. Fidelity Management & Research Company LLC (the investment adviser) and its affiliates provide the Fund with investment management related services for which the Fund pays a monthly management fee. The management fee is the sum of an individual fund fee rate that is based on an annual rate of .60% of the Fund's average net assets and an annualized group fee rate that averaged .23% during the period. The group fee rate is based upon the monthly average net assets of a group of registered investment companies with which the investment adviser has management contracts. The group fee rate decreases as assets under management increase and increases as assets under management decrease. In addition, the management fee is subject to a performance adjustment (up to a maximum of +/- .20% of the Fund's average net assets over a 36 month performance period). The upward or downward adjustment to the management fee is based on the relative investment performance of International Small Cap Opportunities as compared to its benchmark index, the MSCI EAFE Small Cap Index, over the same 36 month performance period. For the reporting period, the total annualized management fee rate, including the performance adjustment, was .85% of the Fund's average net assets. The performance adjustment included in the management fee rate may be higher or lower than the maximum performance adjustment rate due to the difference between the average net assets for the reporting and performance periods.
Distribution and Service Plan Fees. In accordance with Rule 12b-1 of the 1940 Act, the Fund has adopted separate Distribution and Service Plans for each class of shares. Certain classes pay Fidelity Distributors Company LLC (FDC), an affiliate of the investment adviser, separate Distribution and Service Fees, each of which is based on an annual percentage of each class' average net assets. In addition, FDC may pay financial intermediaries for selling shares of the Fund and providing shareholder support services. For the period, the Distribution and Service Fee rates, total fees and amounts retained by FDC were as follows:
| | Distribution Fee | Service Fee | Total Fees | Retained by FDC |
| Class A | - % | .25% | $36,202 | $454 |
| Class M | .25% | .25% | 27,882 | 376 |
| Class C | .75% | .25% | 17,525 | 806 |
| | | | $81,609 | $1,636 |
Sales Load. FDC may receive a front-end sales charge of up to 5.75% for selling Class A shares and 3.50% for selling Class M shares, some of which is paid to financial intermediaries for selling shares of the Fund. Depending on the holding period, FDC may receive contingent deferred sales charges levied on Class A, Class M and Class C redemptions. The deferred sales charges are 1.00% for Class C shares, 1.00% for certain purchases of Class A shares and .25% for certain purchases of Class M shares.
For the period, sales charge amounts retained by FDC were as follows:
| | Retained by FDC |
| Class A | $975 |
| Class M | 713 |
Class C A | 46 |
| | $1,734 |
A When Class C shares are initially sold, FDC pays commissions from its own resources to financial intermediaries through which the sales are made.
Transfer Agent Fees. Fidelity Investments Institutional Operations Company LLC (FIIOC), an affiliate of the investment adviser, is the transfer, dividend disbursing and shareholder servicing agent for each class of the Fund. FIIOC receives account fees and asset-based fees that vary according to the account size and type of account of the shareholders of the respective classes of the Fund, except for Class Z. FIIOC receives an asset-based fee of Class Z's average net assets. FIIOC pays for typesetting, printing and mailing of shareholder reports, except proxy statements.
For the period, transfer agent fees for each class were as follows:
| | Amount | % of Class-Level Average Net Assets A |
| Class A | $31,168 | .22 |
| Class M | 12,355 | .22 |
| Class C | 4,348 | .25 |
| International Small Cap Opportunities | 575,177 | .16 |
| Class I | 67,397 | .17 |
| Class Z | 50,424 | .04 |
| | $740,869 | |
A Annualized
Accounting Fees. Fidelity Service Company, Inc. (FSC), an affiliate of the investment adviser, maintains the Fund's accounting records. The accounting fee is based on the level of average net assets for each month. For the period, the fees were equivalent to the following annualized rates:
| | % of Average Net Assets |
| Fidelity International Small Cap Opportunities Fund | .04 |
Brokerage Commissions. A portion of portfolio transactions were placed with brokerage firms which are affiliates of the investment adviser. Brokerage commissions are included in net realized gain (loss) and change in net unrealized appreciation (depreciation) in the Statement of Operations. The commissions paid to these affiliated firms were as follows:
| | Amount |
| Fidelity International Small Cap Opportunities Fund | $69 |
Interfund Lending Program. Pursuant to an Exemptive Order issued by the Securities and Exchange Commission (the SEC), the Fund, along with other registered investment companies having management contracts with Fidelity Management & Research Company LLC (FMR), or other affiliated entities of FMR, may participate in an interfund lending program. This program provides an alternative credit facility allowing the Fund to borrow from, or lend money to, other participating affiliated funds. At period end, there were no interfund loans outstanding. Activity in this program during the period for which loans were outstanding was as follows:
| | Borrower or Lender | Average Loan Balance | Weighted Average Interest Rate | Interest Expense |
| Fidelity International Small Cap Opportunities Fund | Borrower | $9,180,000 | 4.82% | $4,911 |
Interfund Trades. Funds may purchase from or sell securities to other Fidelity Funds under procedures adopted by the Board. The procedures have been designed to ensure these interfund trades are executed in accordance with Rule 17a-7 of the 1940 Act. Any interfund trades are included within the respective purchases and sales amounts shown in the Purchases and Sales of Investments note. Interfund trades during the period are noted in the table below.
| | Purchases ($) | Sales ($) | Realized Gain (Loss) ($) |
| Fidelity International Small Cap Opportunities Fund | 1,948,199 | 12,385,884 | (558,433) |
6. Committed Line of Credit.
Certain Funds participate with other funds managed by the investment adviser or an affiliate in a $4.25 billion credit facility (the "line of credit") to be utilized for temporary or emergency purposes to fund shareholder redemptions or for other short-term liquidity purposes. The participating funds have agreed to pay commitment fees on their pro-rata portion of the line of credit, which are reflected in Miscellaneous expenses on the Statement of Operations, and are listed below. During the period, there were no borrowings on this line of credit.
| | Amount |
| Fidelity International Small Cap Opportunities Fund | $1,069 |
7. Security Lending.
Funds lend portfolio securities from time to time in order to earn additional income. Lending agents are used, including National Financial Services (NFS), an affiliate of the investment adviser. Pursuant to a securities lending agreement, NFS will receive a fee, which is capped at 9.9% of a fund's daily lending revenue, for its services as lending agent. A fund may lend securities to certain qualified borrowers, including NFS. On the settlement date of the loan, a fund receives collateral (in the form of U.S. Treasury obligations, letters of credit and/or cash) against the loaned securities and maintains collateral in an amount not less than 100% of the market value of the loaned securities during the period of the loan. The market value of the loaned securities is determined at the close of business of a fund and any additional required collateral is delivered to a fund on the next business day. A fund or borrower may terminate the loan at any time, and if the borrower defaults on its obligation to return the securities loaned because of insolvency or other reasons, a fund may apply collateral received from the borrower against the obligation. A fund may experience delays and costs in recovering the securities loaned. Any cash collateral received is invested in the Fidelity Securities Lending Cash Central Fund. Any loaned securities are identified as such in the Schedule of Investments, and the value of loaned securities and cash collateral at period end, as applicable, are presented in the Statement of Assets and Liabilities. Security lending income represents the income earned on investing cash collateral, less rebates paid to borrowers and any lending agent fees associated with the loan, plus any premium payments received for lending certain types of securities. Security lending income is presented in the Statement of Operations as a component of income from Fidelity Central Funds. Affiliated security lending activity, if any, was as follows:
| | Total Security Lending Fees Paid to NFS | Security Lending Income From Securities Loaned to NFS | Value of Securities Loaned to NFS at Period End |
| Fidelity International Small Cap Opportunities Fund | $2,378 | $- | $- |
8. Expense Reductions.
Through arrangements with each class' transfer agent, credits realized as a result of certain uninvested cash balances were used to reduce the Fund's expenses. During the period, transfer agent credits reduced each class' expenses as noted in the table below.
| | Expense reduction |
| Class M | 255 |
In addition, during the period the investment adviser or an affiliate reimbursed and/or waived a portion of fund-level operating expenses in the amount of $24,926.
9. Distributions to Shareholders.
Distributions to shareholders of each class were as follows:
| | Six months ended April 30, 2023 | Year ended October 31, 2022 |
| Fidelity International Small Cap Opportunities Fund | | |
| Distributions to shareholders | | |
| Class A | $1,724,252 | $3,712,302 |
| Class M | 668,890 | 1,347,073 |
| Class C | 228,866 | 565,280 |
| International Small Cap Opportunities | 42,205,549 | 103,110,108 |
| Class I | 5,288,952 | 11,507,400 |
| Class Z | 14,591,883 | 25,680,838 |
| Total | $64,708,392 | $145,923,001 |
10. Share Transactions.
Share transactions for each class were as follows and may contain in-kind transactions, automatic conversions between classes or exchanges between affiliated funds:
| | Shares | Shares | Dollars | Dollars |
| | Six months ended April 30, 2023 | Year ended October 31, 2022 | Six months ended April 30, 2023 | Year ended October 31, 2022 |
| Fidelity International Small Cap Opportunities Fund | | | | |
| Class A | | | | |
| Shares sold | 41,458 | 107,181 | $759,323 | $2,213,121 |
| Reinvestment of distributions | 94,841 | 146,450 | 1,693,860 | 3,629,027 |
| Shares redeemed | (109,696) | (339,023) | (2,004,111) | (7,042,478) |
| Net increase (decrease) | 26,603 | (85,392) | $449,072 | $(1,200,330) |
| Class M | | | | |
| Shares sold | 14,483 | 19,908 | $259,631 | $424,699 |
| Reinvestment of distributions | 37,879 | 54,676 | 665,150 | 1,337,368 |
| Shares redeemed | (30,021) | (60,774) | (539,721) | (1,238,854) |
| Net increase (decrease) | 22,341 | 13,810 | $385,060 | $523,213 |
| Class C | | | | |
| Shares sold | 2,390 | 9,960 | $41,139 | $199,008 |
| Reinvestment of distributions | 13,606 | 23,946 | 228,441 | 564,404 |
| Shares redeemed | (29,221) | (79,310) | (505,808) | (1,567,463) |
| Net increase (decrease) | (13,225) | (45,404) | $(236,228) | $(804,051) |
| International Small Cap Opportunities | | | | |
| Shares sold | 1,229,683 | 2,966,612 | $23,216,765 | $62,249,598 |
| Reinvestment of distributions | 1,900,059 | 3,165,438 | 34,581,075 | 79,642,429 |
| Shares redeemed | (4,704,251) | (10,146,566) | (89,160,209) | (202,796,085) |
| Net increase (decrease) | (1,574,509) | (4,014,516) | $(31,362,369) | $(60,904,058) |
| Class I | | | | |
| Shares sold | 344,473 | 698,127 | $6,482,077 | $14,776,475 |
| Reinvestment of distributions | 193,260 | 335,375 | 3,513,459 | 8,427,973 |
| Shares redeemed | (1,853,302) | (1,211,577) | (35,210,147) | (25,532,337) |
| Net increase (decrease) | (1,315,569) | (178,075) | $(25,214,611) | $(2,327,889) |
| Class Z | | | | |
| Shares sold | 494,386 | 2,588,492 | $9,242,949 | $51,781,304 |
| Reinvestment of distributions | 741,352 | 928,091 | 13,440,712 | 23,276,518 |
| Shares redeemed | (1,099,371) | (1,722,683) | (20,443,638) | (33,635,768) |
| Net increase (decrease) | 136,367 | 1,793,900 | $2,240,023 | $41,422,054 |
11. Other.
A fund's organizational documents provide former and current trustees and officers with a limited indemnification against liabilities arising in connection with the performance of their duties to the fund. In the normal course of business, a fund may also enter into contracts that provide general indemnifications. A fund's maximum exposure under these arrangements is unknown as this would be dependent on future claims that may be made against a fund. The risk of material loss from such claims is considered remote.
Mutual funds managed by the investment adviser or its affiliates, in aggregate, were the owners of record of more than 20% of the total outstanding shares.
| Fund | % of shares held |
| Fidelity International Small Cap Opportunities Fund | 25% |
12. Risk and Uncertainties.
Many factors affect a fund's performance. Developments that disrupt global economies and financial markets, such as pandemics, epidemics, outbreaks of infectious diseases, war, terrorism, and environmental disasters, may significantly affect a fund's investment performance. The effects of these developments to a fund will be impacted by the types of securities in which a fund invests, the financial condition, industry, economic sector, and geographic location of an issuer, and a fund's level of investment in the securities of that issuer. Significant concentrations in security types, issuers, industries, sectors, and geographic locations may magnify the factors that affect a fund's performance.
As a shareholder, you incur two types of costs: (1) transaction costs, which may include sales charges (loads) on purchase payments or redemption proceeds, as applicable and (2) ongoing costs, which generally include management fees, distribution and/or service (12b-1) fees and other Fund expenses. This Example is intended to help you understand your ongoing costs (in dollars) of investing in a fund and to compare these costs with the ongoing costs of investing in other mutual funds.
| The Example is based on an investment of $1,000 invested at the beginning of the period and held for the entire period (November 1, 2022 to April 30, 2023). |
Actual Expenses
The first line of the accompanying table provides information about actual account values and actual expenses. You may use the information in this line, together with the amount you invested, to estimate the expenses that you paid over the period. Simply divide your account value by $1,000.00 (for example, an $8,600 account value divided by $1,000.00 = 8.6), then multiply the result by the number in the first line for a class/Fund under the heading entitled "Expenses Paid During Period" to estimate the expenses you paid on your account during this period. If any fund is a shareholder of any underlying mutual funds or exchange-traded funds (ETFs) (the Underlying Funds), such fund indirectly bears its proportional share of the expenses of the Underlying Funds in addition to the direct expenses incurred presented in the table. These fees and expenses are not included in the annualized expense ratio used to calculate the expense estimate in the table below.
Hypothetical Example for Comparison Purposes
The second line of the accompanying table provides information about hypothetical account values and hypothetical expenses based on the actual expense ratio and an assumed rate of return of 5% per year before expenses, which is not the actual return. The hypothetical account values and expenses may not be used to estimate the actual ending account balance or expenses you paid for the period. You may use this information to compare the ongoing costs of investing in the Fund and other funds. To do so, compare this 5% hypothetical example with the 5% hypothetical examples that appear in the shareholder reports of the other funds. If any fund is a shareholder of any Underlying Funds, such fund indirectly bears its proportional share of the expenses of the Underlying Funds in addition to the direct expenses as presented in the table. These fees and expenses are not included in the annualized expense ratio used to calculate the expense estimate in the table below.
Please note that the expenses shown in the table are meant to highlight your ongoing costs only and do not reflect any transaction costs. Therefore, the second line of the table is useful in comparing ongoing costs only, and will not help you determine the relative total costs of owning different funds. In addition, if these transactional costs were included, your costs would have been higher.
| | | | | Annualized Expense Ratio- A | | Beginning Account Value November 1, 2022 | | Ending Account Value April 30, 2023 | | Expenses Paid During Period- C November 1, 2022 to April 30, 2023 |
| Fidelity® International Small Cap Opportunities Fund | | | | | | | | | | |
| Class A | | | | 1.38% | | | | | | |
| Actual | | | | | | $ 1,000 | | $ 1,174.30 | | $ 7.44 |
Hypothetical- B | | | | | | $ 1,000 | | $ 1,017.95 | | $ 6.90 |
| Class M | | | | 1.63% | | | | | | |
| Actual | | | | | | $ 1,000 | | $ 1,172.20 | | $ 8.78 |
Hypothetical- B | | | | | | $ 1,000 | | $ 1,016.71 | | $ 8.15 |
| Class C | | | | 2.16% | | | | | | |
| Actual | | | | | | $ 1,000 | | $ 1,169.50 | | $ 11.62 |
Hypothetical- B | | | | | | $ 1,000 | | $ 1,014.08 | | $ 10.79 |
| Fidelity® International Small Cap Opportunities Fund | | | | 1.07% | | | | | | |
| Actual | | | | | | $ 1,000 | | $ 1,176.10 | | $ 5.77 |
Hypothetical- B | | | | | | $ 1,000 | | $ 1,019.49 | | $ 5.36 |
| Class I | | | | 1.08% | | | | | | |
| Actual | | | | | | $ 1,000 | | $ 1,175.90 | | $ 5.83 |
Hypothetical- B | | | | | | $ 1,000 | | $ 1,019.44 | | $ 5.41 |
| Class Z | | | | .95% | | | | | | |
| Actual | | | | | | $ 1,000 | | $ 1,176.80 | | $ 5.13 |
Hypothetical- B | | | | | | $ 1,000 | | $ 1,020.08 | | $ 4.76 |
| |
A Annualized expense ratio reflects expenses net of applicable fee waivers.
B 5% return per year before expenses
C Expenses are equal to the annualized expense ratio, multiplied by the average account value over the period, multiplied by 181/ 365 (to reflect the one-half year period). The fees and expenses of any Underlying Funds are not included in each annualized expense ratio.
The Securities and Exchange Commission adopted Rule 22e-4 under the Investment Company Act of 1940 (the Liquidity Rule) to promote effective liquidity risk management throughout the open-end investment company industry, thereby reducing the risk that funds will be unable to meet their redemption obligations and mitigating dilution of the interests of fund shareholders.
The Fund has adopted and implemented a liquidity risk management program (the Program) reasonably designed to assess and manage the Fund's liquidity risk and to comply with the requirements of the Liquidity Rule. The Fund's Board of Trustees (the Board) has designated the Fund's investment adviser as administrator of the Program. The Fidelity advisers have established a Liquidity Risk Management Committee (the LRM Committee) to manage the Program for each of the Fidelity Funds. The LRM Committee monitors the adequacy and effectiveness of implementation of the Program and on a periodic basis assesses each Fund's liquidity risk based on a variety of factors including (1) the Fund's investment strategy, (2) portfolio liquidity and cash flow projections during normal and reasonably foreseeable stressed conditions, (3) shareholder redemptions, (4) borrowings and other funding sources and (5) certain factors specific to ETFs including the effect of the Fund's prices and spreads, market participants, and basket compositions on the overall liquidity of the Fund's portfolio, as applicable.
In accordance with the Program, each of the Fund's portfolio investments is classified into one of four defined liquidity categories based on a determination of a reasonable expectation for how long it would take to convert the investment to cash (or sell or dispose of the investment) without significantly changing its market value.
- Highly liquid investments - cash or convertible to cash within three business days or less
- Moderately liquid investments - convertible to cash in three to seven calendar days
- Less liquid investments - can be sold or disposed of, but not settled, within seven calendar days
- Illiquid investments - cannot be sold or disposed of within seven calendar days
Liquidity classification determinations take into account a variety of factors including various market, trading and investment-specific considerations, as well as market depth, and generally utilize analysis from a third-party liquidity metrics service.
The Liquidity Rule places a 15% limit on a fund's illiquid investments and requires funds that do not primarily hold assets that are highly liquid investments to determine and maintain a minimum percentage of the fund's net assets to be invested in highly liquid investments (highly liquid investment minimum or HLIM). The Program includes provisions reasonably designed to comply with the 15% limit on illiquid investments and for determining, periodically reviewing and complying with the HLIM requirement as applicable.
At a recent meeting of the Fund's Board of Trustees, the LRM Committee provided a written report to the Board pertaining to the operation, adequacy, and effectiveness of the Program for the period December 1, 2021 through November 30, 2022. The report concluded that the Program is operating effectively and is reasonably designed to assess and manage the Fund's liquidity risk.
1.815078.117
ILS-SANN-0623
Fidelity® International Value Fund
Semi-Annual Report
April 30, 2023
Includes Fidelity and Fidelity Advisor share classes
Contents
To view a fund's proxy voting guidelines and proxy voting record for the 12-month period ended June 30, visit http://www.fidelity.com/proxyvotingresults or visit the Securities and Exchange Commission's (SEC) web site at http://www.sec.gov.
You may also call 1-800-544-8544 if you're an individual investing directly with Fidelity, call 1-800-835-5092 if you're a plan sponsor or participant with Fidelity as your recordkeeper or call 1-877-208-0098 on institutional accounts or if you're an advisor or invest through one to request a free copy of the proxy voting guidelines.
Standard & Poor's, S&P and S&P 500 are registered service marks of The McGraw-Hill Companies, Inc. and have been licensed for use by Fidelity Distributors Corporation.
Other third-party marks appearing herein are the property of their respective owners.
All other marks appearing herein are registered or unregistered trademarks or service marks of FMR LLC or an affiliated company. © 2023 FMR LLC. All rights reserved.
This report and the financial statements contained herein are submitted for the general information of the shareholders of the Fund. This report is not authorized for distribution to prospective investors in the Fund unless preceded or accompanied by an effective prospectus.
A fund files its complete schedule of portfolio holdings with the SEC for the first and third quarters of each fiscal year on Form N-PORT. Forms N-PORT are available on the SEC's web site at http://www.sec.gov. A fund's Forms N-PORT may be reviewed and copied at the SEC's Public Reference Room in Washington, DC. Information regarding the operation of the SEC's Public Reference Room may be obtained by calling 1-800-SEC-0330.
For a complete list of a fund's portfolio holdings, view the most recent holdings listing, semiannual report, or annual report on Fidelity's web site at http://www.fidelity.com, http://www.institutional.fidelity.com, or http://www.401k.com, as applicable.
NOT FDIC INSURED •MAY LOSE VALUE •NO BANK GUARANTEE
Neither the Fund nor Fidelity Distributors Corporation is a bank.
Top Holdings (% of Fund's net assets) |
| |
| Shell PLC ADR (Netherlands, Oil, Gas & Consumable Fuels) | 4.0 | |
| BHP Group Ltd. (Australia, Metals & Mining) | 3.6 | |
| TotalEnergies SE (France, Oil, Gas & Consumable Fuels) | 3.6 | |
| Toyota Motor Corp. (Japan, Automobiles) | 2.4 | |
| Siemens AG (Germany, Industrial Conglomerates) | 2.4 | |
| Sanofi SA (United States of America, Pharmaceuticals) | 2.1 | |
| Hitachi Ltd. (Japan, Industrial Conglomerates) | 2.1 | |
| BAE Systems PLC (United Kingdom, Aerospace & Defense) | 2.0 | |
| UBS Group AG (Switzerland, Capital Markets) | 2.0 | |
| AXA SA (France, Insurance) | 1.9 | |
| | 26.1 | |
| |
| Market Sectors (% of Fund's net assets) |
| |
| Financials | 32.1 | |
| Industrials | 15.6 | |
| Materials | 13.4 | |
| Energy | 12.0 | |
| Consumer Discretionary | 7.9 | |
| Health Care | 5.1 | |
| Information Technology | 5.0 | |
| Communication Services | 1.9 | |
| Utilities | 1.5 | |
| Real Estate | 0.9 | |
| Consumer Staples | 0.6 | |
| |
Asset Allocation (% of Fund's net assets) |
|
|
Geographic Diversification (% of Fund's net assets) |
|
* Includes Short-Term investments and Net Other Assets (Liabilities). Percentages are adjusted for the effect of derivatives, if applicable. |
| |
Showing Percentage of Net Assets
| Common Stocks - 95.2% |
| | | Shares | Value ($) |
| Australia - 8.4% | | | |
| BHP Group Ltd. | | 924,190 | 27,427,648 |
| Flutter Entertainment PLC (a) | | 11,600 | 2,320,136 |
| Glencore PLC | | 2,390,400 | 14,109,655 |
| Macquarie Group Ltd. | | 79,601 | 9,710,671 |
| National Australia Bank Ltd. | | 197,222 | 3,796,752 |
| Woodside Energy Group Ltd. | | 301,423 | 6,839,388 |
TOTAL AUSTRALIA | | | 64,204,250 |
| Belgium - 1.4% | | | |
| KBC Group NV | | 104,416 | 7,453,327 |
| UCB SA | | 36,900 | 3,432,526 |
TOTAL BELGIUM | | | 10,885,853 |
| Canada - 0.5% | | | |
| Nutrien Ltd. | | 57,800 | 4,009,759 |
| Denmark - 0.7% | | | |
| DSV A/S | | 26,700 | 5,014,761 |
| Finland - 1.1% | | | |
| Sampo Oyj (A Shares) | | 172,334 | 8,727,567 |
| France - 12.4% | | | |
| Air Liquide SA | | 54,470 | 9,798,621 |
| Airbus Group NV | | 30,200 | 4,229,046 |
| ALTEN | | 25,700 | 4,361,100 |
| AXA SA | | 450,905 | 14,717,616 |
| BNP Paribas SA | | 199,600 | 12,896,833 |
| Capgemini SA | | 31,293 | 5,686,042 |
| Euroapi SASU | | 5,559 | 66,737 |
| Teleperformance | | 14,400 | 2,868,819 |
| TotalEnergies SE | | 424,905 | 27,151,405 |
| VINCI SA (b) | | 59,200 | 7,319,084 |
| Vivendi SA | | 503,892 | 5,526,845 |
TOTAL FRANCE | | | 94,622,148 |
| Germany - 10.8% | | | |
| Bayer AG | | 137,500 | 9,074,487 |
| Covestro AG (c) | | 93,800 | 4,115,048 |
| Deutsche Post AG | | 168,500 | 8,104,782 |
| Hannover Reuck SE | | 44,300 | 9,450,423 |
| Muenchener Rueckversicherungs-Gesellschaft AG in Muenchen | | 24,300 | 9,117,286 |
| Rheinmetall AG | | 39,050 | 11,424,251 |
| RWE AG | | 213,200 | 9,996,062 |
| Siemens AG | | 111,539 | 18,385,223 |
| Vonovia SE | | 135,829 | 2,945,929 |
TOTAL GERMANY | | | 82,613,491 |
| Hong Kong - 2.1% | | | |
| AIA Group Ltd. | | 585,000 | 6,368,939 |
| Prudential PLC | | 625,700 | 9,573,861 |
TOTAL HONG KONG | | | 15,942,800 |
| India - 0.7% | | | |
| Reliance Industries Ltd. GDR (c) | | 83,000 | 4,946,800 |
| Indonesia - 0.6% | | | |
| PT Bank Rakyat Indonesia (Persero) Tbk | | 12,947,194 | 4,511,828 |
| Ireland - 2.9% | | | |
| Bank of Ireland Group PLC | | 640,300 | 6,610,971 |
| CRH PLC | | 206,002 | 9,940,415 |
| Ryanair Holdings PLC sponsored ADR (a) | | 57,800 | 5,525,102 |
TOTAL IRELAND | | | 22,076,488 |
| Italy - 2.4% | | | |
| Enel SpA | | 209,100 | 1,428,595 |
| Eni SpA | | 669,600 | 10,115,923 |
| Mediobanca SpA | | 590,525 | 6,331,306 |
TOTAL ITALY | | | 17,875,824 |
| Japan - 21.7% | | | |
| Daiichi Sankyo Kabushiki Kaisha | | 21,600 | 741,196 |
| DENSO Corp. | | 149,900 | 9,048,505 |
| Fast Retailing Co. Ltd. | | 26,300 | 6,227,883 |
| FUJIFILM Holdings Corp. | | 103,200 | 5,378,781 |
| Fujitsu Ltd. | | 39,700 | 5,291,109 |
| Hitachi Ltd. | | 286,800 | 15,864,238 |
| Hoya Corp. | | 32,000 | 3,355,361 |
| Ibiden Co. Ltd. | | 72,300 | 2,844,733 |
| INPEX Corp. | | 333,700 | 3,651,697 |
| Itochu Corp. | | 298,000 | 9,886,108 |
| Minebea Mitsumi, Inc. | | 258,270 | 4,782,809 |
| Mitsubishi Estate Co. Ltd. | | 293,900 | 3,622,113 |
| Mitsubishi UFJ Financial Group, Inc. | | 1,926,861 | 12,061,253 |
| NOF Corp. | | 17,700 | 808,739 |
| ORIX Corp. | | 457,000 | 7,774,723 |
| Renesas Electronics Corp. (a) | | 494,188 | 6,440,480 |
| Shin-Etsu Chemical Co. Ltd. | | 351,500 | 10,030,341 |
| SoftBank Group Corp. | | 111,300 | 4,174,019 |
| Sony Group Corp. | | 63,100 | 5,708,893 |
| Sumitomo Mitsui Financial Group, Inc. | | 262,400 | 10,725,243 |
| Suzuki Motor Corp. | | 188,630 | 6,577,241 |
| TIS, Inc. | | 108,901 | 2,990,391 |
| Tokio Marine Holdings, Inc. | | 450,544 | 9,059,103 |
| Toyota Motor Corp. | | 1,351,425 | 18,555,114 |
TOTAL JAPAN | | | 165,600,073 |
| Korea (South) - 0.7% | | | |
| Samsung Electronics Co. Ltd. | | 112,100 | 5,517,964 |
| Luxembourg - 0.7% | | | |
| ArcelorMittal SA (Netherlands) | | 185,986 | 5,268,955 |
| Netherlands - 4.3% | | | |
| Shell PLC ADR | | 488,800 | 30,295,828 |
| Universal Music Group NV | | 106,319 | 2,320,799 |
TOTAL NETHERLANDS | | | 32,616,627 |
| Singapore - 1.2% | | | |
| United Overseas Bank Ltd. | | 440,305 | 9,351,180 |
| South Africa - 1.1% | | | |
| Anglo American PLC (United Kingdom) | | 257,640 | 7,938,965 |
| Thungela Resources Ltd. (b) | | 47,881 | 444,689 |
TOTAL SOUTH AFRICA | | | 8,383,654 |
| Spain - 2.3% | | | |
| Banco Santander SA (Spain) (b) | | 3,718,982 | 13,058,106 |
| Cellnex Telecom SA (c) | | 74,500 | 3,136,747 |
| Unicaja Banco SA (c) | | 1,486,600 | 1,506,219 |
TOTAL SPAIN | | | 17,701,072 |
| Sweden - 2.0% | | | |
| Alleima AB | | 29,480 | 151,151 |
| Investor AB (B Shares) | | 519,640 | 11,137,622 |
| Sandvik AB (b) | | 211,500 | 4,300,101 |
TOTAL SWEDEN | | | 15,588,874 |
| Switzerland - 4.5% | | | |
| Swiss Life Holding AG (b) | | 9,003 | 5,910,343 |
| UBS Group AG | | 740,358 | 14,992,250 |
| Zurich Insurance Group Ltd. | | 27,011 | 13,048,442 |
TOTAL SWITZERLAND | | | 33,951,035 |
| United Kingdom - 8.7% | | | |
| AstraZeneca PLC (United Kingdom) | | 46,312 | 6,815,412 |
| BAE Systems PLC | | 1,187,264 | 15,125,724 |
| Barratt Developments PLC | | 865,700 | 5,439,842 |
| Beazley PLC | | 516,800 | 3,867,703 |
| BP PLC | | 971,608 | 6,518,514 |
| Imperial Brands PLC | | 179,830 | 4,451,530 |
| Lloyds Banking Group PLC | | 12,382,064 | 7,522,374 |
| NatWest Group PLC | | 1,402,700 | 4,620,633 |
| Rolls-Royce Holdings PLC (a) | | 604,600 | 1,158,214 |
| Standard Chartered PLC (United Kingdom) | | 1,318,898 | 10,415,888 |
TOTAL UNITED KINGDOM | | | 65,935,834 |
| United States of America - 4.0% | | | |
| Ferguson PLC | | 31,416 | 4,420,016 |
| Linde PLC | | 26,314 | 9,721,707 |
| Sanofi SA | | 148,579 | 16,012,100 |
TOTAL UNITED STATES OF AMERICA | | | 30,153,823 |
| TOTAL COMMON STOCKS (Cost $653,877,956) | | | 725,500,660 |
| | | | |
| Nonconvertible Preferred Stocks - 0.8% |
| | | Shares | Value ($) |
| Germany - 0.8% | | | |
Porsche Automobil Holding SE (Germany) (Cost $7,668,702) | | 109,300 | 6,087,707 |
| | | | |
| Money Market Funds - 7.3% |
| | | Shares | Value ($) |
| Fidelity Cash Central Fund 4.88% (d) | | 25,760,863 | 25,766,015 |
| Fidelity Securities Lending Cash Central Fund 4.88% (d)(e) | | 30,368,706 | 30,371,743 |
| TOTAL MONEY MARKET FUNDS (Cost $56,137,758) | | | 56,137,758 |
| | | | |
| TOTAL INVESTMENT IN SECURITIES - 103.3% (Cost $717,684,416) | 787,726,125 |
NET OTHER ASSETS (LIABILITIES) - (3.3)% | (25,451,952) |
| NET ASSETS - 100.0% | 762,274,173 |
| | |
Legend
| (b) | Security or a portion of the security is on loan at period end. |
| (c) | Security exempt from registration under Rule 144A of the Securities Act of 1933. These securities may be resold in transactions exempt from registration, normally to qualified institutional buyers. At the end of the period, the value of these securities amounted to $13,704,814 or 1.8% of net assets. |
| (d) | Affiliated fund that is generally available only to investment companies and other accounts managed by Fidelity Investments. The rate quoted is the annualized seven-day yield of the fund at period end. A complete unaudited listing of the fund's holdings as of its most recent quarter end is available upon request. In addition, each Fidelity Central Fund's financial statements are available on the SEC's website or upon request. |
| (e) | Investment made with cash collateral received from securities on loan. |
Affiliated Central Funds
Fiscal year to date information regarding the Fund's investments in Fidelity Central Funds, including the ownership percentage, is presented below.
| Affiliate | Value, beginning of period ($) | Purchases ($) | Sales Proceeds ($) | Dividend Income ($) | Realized Gain (loss) ($) | Change in Unrealized appreciation (depreciation) ($) | Value, end of period ($) | % ownership, end of period |
| Fidelity Cash Central Fund 4.88% | 19,026,705 | 87,607,604 | 80,868,294 | 476,525 | - | - | 25,766,015 | 0.1% |
| Fidelity Securities Lending Cash Central Fund 4.88% | 12,898,750 | 114,862,713 | 97,389,720 | 120,038 | - | - | 30,371,743 | 0.1% |
| Total | 31,925,455 | 202,470,317 | 178,258,014 | 596,563 | - | - | 56,137,758 | |
| | | | | | | | | |
Amounts in the dividend income column in the above table include any capital gain distributions from underlying funds, which are presented in the corresponding line item in the Statement of Operations, if applicable.
Amounts in the dividend income column for Fidelity Securities Lending Cash Central Fund represents the income earned on investing cash collateral, less rebates paid to borrowers and any lending agent fees associated with the loan, plus any premium payments received for lending certain types of securities.
Amounts included in the purchases and sales proceeds columns may include in-kind transactions, if applicable.
Investment Valuation
The following is a summary of the inputs used, as of April 30, 2023, involving the Fund's assets and liabilities carried at fair value. The inputs or methodology used for valuing securities may not be an indication of the risk associated with investing in those securities. For more information on valuation inputs, and their aggregation into the levels used below, please refer to the Investment Valuation section in the accompanying Notes to Financial Statements.
| Valuation Inputs at Reporting Date: |
| Description | Total ($) | Level 1 ($) | Level 2 ($) | Level 3 ($) |
Investments in Securities: | | | | |
|
| Equities: | | | | |
Communication Services | 15,158,410 | 7,847,644 | 7,310,766 | - |
Consumer Discretionary | 59,965,321 | 7,759,978 | 52,205,343 | - |
Consumer Staples | 4,451,530 | - | 4,451,530 | - |
Energy | 89,964,244 | 35,687,317 | 54,276,927 | - |
Financials | 244,318,462 | 121,627,453 | 122,691,009 | - |
Health Care | 39,497,819 | 3,499,263 | 35,998,556 | - |
Industrials | 118,408,278 | 40,872,134 | 77,536,144 | - |
Information Technology | 38,510,600 | 10,047,142 | 28,463,458 | - |
Materials | 103,321,004 | 19,151,572 | 84,169,432 | - |
Real Estate | 6,568,042 | - | 6,568,042 | - |
Utilities | 11,424,657 | 9,996,062 | 1,428,595 | - |
|
| Money Market Funds | 56,137,758 | 56,137,758 | - | - |
| Total Investments in Securities: | 787,726,125 | 312,626,323 | 475,099,802 | - |
| Statement of Assets and Liabilities |
| | | | April 30, 2023 (Unaudited) |
| | | | | |
| Assets | | | | |
| Investment in securities, at value (including securities loaned of $27,700,214) - See accompanying schedule: | | | | |
Unaffiliated issuers (cost $661,546,658) | $ | 731,588,367 | | |
Fidelity Central Funds (cost $56,137,758) | | 56,137,758 | | |
| | | | | |
| | | | | |
| Total Investment in Securities (cost $717,684,416) | | | $ | 787,726,125 |
| Foreign currency held at value (cost $135,117) | | | | 135,092 |
| Receivable for investments sold | | | | 910,578 |
| Receivable for fund shares sold | | | | 601,672 |
| Dividends receivable | | | | 3,526,452 |
| Reclaims receivable | | | | 2,227,573 |
| Distributions receivable from Fidelity Central Funds | | | | 155,335 |
| Prepaid expenses | | | | 236 |
| Receivable from investment adviser for expense reductions | | | | 45,697 |
Total assets | | | | 795,328,760 |
| Liabilities | | | | |
| Payable for investments purchased | $ | 1,420,518 | | |
| Payable for fund shares redeemed | | 591,569 | | |
| Accrued management fee | | 489,351 | | |
| Distribution and service plan fees payable | | 7,334 | | |
| Other affiliated payables | | 123,761 | | |
| Other payables and accrued expenses | | 50,311 | | |
| Collateral on securities loaned | | 30,371,743 | | |
| Total Liabilities | | | | 33,054,587 |
| Net Assets | | | $ | 762,274,173 |
| Net Assets consist of: | | | | |
| Paid in capital | | | $ | 772,029,825 |
| Total accumulated earnings (loss) | | | | (9,755,652) |
| Net Assets | | | $ | 762,274,173 |
| | | | | |
| Net Asset Value and Maximum Offering Price | | | | |
| Class A : | | | | |
Net Asset Value and redemption price per share ($15,967,551 ÷ 1,761,969 shares) (a) | | | $ | 9.06 |
| Maximum offering price per share (100/94.25 of $9.06) | | | $ | 9.61 |
| Class M : | | | | |
Net Asset Value and redemption price per share ($4,464,796 ÷ 492,535 shares) (a) | | | $ | 9.06 |
| Maximum offering price per share (100/96.50 of $9.06) | | | $ | 9.39 |
| Class C : | | | | |
Net Asset Value and offering price per share ($2,587,419 ÷ 284,185 shares) (a) | | | $ | 9.10 |
| International Value : | | | | |
Net Asset Value , offering price and redemption price per share ($458,653,592 ÷ 50,611,169 shares) | | | $ | 9.06 |
| Class I : | | | | |
Net Asset Value , offering price and redemption price per share ($110,296,890 ÷ 12,153,594 shares) | | | $ | 9.08 |
| Class Z : | | | | |
Net Asset Value , offering price and redemption price per share ($170,303,925 ÷ 18,770,735 shares) | | | $ | 9.07 |
(a)Redemption price per share is equal to net asset value less any applicable contingent deferred sales charge. |
| Statement of Operations |
| | | | Six months ended April 30, 2023 (Unaudited) |
| Investment Income | | | | |
| Dividends | | | $ | 11,517,857 |
| Income from Fidelity Central Funds (including $120,038 from security lending) | | | | 596,563 |
| Income before foreign taxes withheld | | | $ | 12,114,420 |
| Less foreign taxes withheld | | | | (975,861) |
| Total Income | | | | 11,138,559 |
| Expenses | | | | |
| Management fee | | | | |
| Basic fee | $ | 2,348,533 | | |
| Performance adjustment | | 387,714 | | |
| Transfer agent fees | | 537,374 | | |
| Distribution and service plan fees | | 41,726 | | |
| Accounting fees | | 162,915 | | |
| Custodian fees and expenses | | 29,977 | | |
| Independent trustees' fees and expenses | | 1,950 | | |
| Registration fees | | 100,901 | | |
| Audit | | 34,442 | | |
| Legal | | 500 | | |
| Miscellaneous | | 1,368 | | |
| Total expenses before reductions | | 3,647,400 | | |
| Expense reductions | | (94,163) | | |
| Total expenses after reductions | | | | 3,553,237 |
| Net Investment income (loss) | | | | 7,585,322 |
| Realized and Unrealized Gain (Loss) | | | | |
| Net realized gain (loss) on: | | | | |
| Investment Securities: | | | | |
| Unaffiliated issuers | | (7,738,364) | | |
| Foreign currency transactions | | 168,388 | | |
| Total net realized gain (loss) | | | | (7,569,976) |
| Change in net unrealized appreciation (depreciation) on: | | | | |
| Investment Securities: | | | | |
| Unaffiliated issuers | | 120,867,431 | | |
| Assets and liabilities in foreign currencies | | 228,543 | | |
| Total change in net unrealized appreciation (depreciation) | | | | 121,095,974 |
| Net gain (loss) | | | | 113,525,998 |
| Net increase (decrease) in net assets resulting from operations | | | $ | 121,111,320 |
| Statement of Changes in Net Assets |
| |
| | Six months ended April 30, 2023 (Unaudited) | | Year ended October 31, 2022 |
| Increase (Decrease) in Net Assets | | | | |
| Operations | | | | |
| Net investment income (loss) | $ | 7,585,322 | $ | 16,126,115 |
| Net realized gain (loss) | | (7,569,976) | | (28,616,362) |
| Change in net unrealized appreciation (depreciation) | | 121,095,974 | | (92,203,078) |
| Net increase (decrease) in net assets resulting from operations | | 121,111,320 | | (104,693,325) |
| Distributions to shareholders | | (11,902,522) | | (17,928,873) |
| Share transactions - net increase (decrease) | | 74,893,458 | | 291,627,947 |
| Total increase (decrease) in net assets | | 184,102,256 | | 169,005,749 |
| | | | | |
| Net Assets | | | | |
| Beginning of period | | 578,171,917 | | 409,166,168 |
| End of period | $ | 762,274,173 | $ | 578,171,917 |
| | | | | |
| | | | | |
Financial Highlights
| Fidelity Advisor® International Value Fund Class A |
| |
| | Six months ended (Unaudited) April 30, 2023 | | Years ended October 31, 2022 | | 2021 | | 2020 | | 2019 | | 2018 |
Selected Per-Share Data | | | | | | | | | | | | |
| Net asset value, beginning of period | $ | 7.64 | $ | 9.65 | $ | 6.87 | $ | 8.25 | $ | 8.13 | $ | 9.08 |
| Income from Investment Operations | | | | | | | | | | | | |
Net investment income (loss) A,B | | .08 | | .24 | | .25 C | | .13 | | .25 | | .21 |
| Net realized and unrealized gain (loss) | | 1.48 | | (1.87) | | 2.66 | | (1.24) | | .08 | | (1.04) |
| Total from investment operations | | 1.56 | | (1.63) | | 2.91 | | (1.11) | | .33 | | (.83) |
| Distributions from net investment income | | (.14) | | (.38) | | (.13) | | (.24) | | (.21) | | (.10) |
| Distributions from net realized gain | | - | | - | | - | | (.03) | | - | | (.01) |
| Total distributions | | (.14) | | (.38) | | (.13) | | (.27) | | (.21) | | (.12) D |
Redemption fees added to paid in capital A | | - | | - | | - | | - | | - | | - E |
| Net asset value, end of period | $ | 9.06 | $ | 7.64 | $ | 9.65 | $ | 6.87 | $ | 8.25 | $ | 8.13 |
Total Return F,G,H | | 20.52% | | (17.43)% | | 42.56% | | (14.01)% | | 4.38% | | (9.30)% |
Ratios to Average Net Assets B,I,J | | | | | | | | | | | | |
| Expenses before reductions | | 1.39% K | | 1.46% | | 1.37% | | 1.30% | | 1.14% | | 1.23% |
| Expenses net of fee waivers, if any | | 1.30% K | | 1.30% | | 1.33% | | 1.30% | | 1.13% | | 1.23% |
| Expenses net of all reductions | | 1.30% K | | 1.30% | | 1.33% | | 1.28% | | 1.12% | | 1.21% |
| Net investment income (loss) | | 1.92% K | | 2.85% | | 2.77% C | | 1.71% | | 3.19% | | 2.36% |
| Supplemental Data | | | | | | | | | | | | |
| Net assets, end of period (000 omitted) | $ | 15,968 | $ | 12,080 | $ | 10,566 | $ | 5,947 | $ | 7,806 | $ | 7,887 |
Portfolio turnover rate L | | 24% K | | 25% | | 29% M | | 36% | | 47% | | 55% |
A Calculated based on average shares outstanding during the period.
B Net investment income (loss) is affected by the timing of the declaration of dividends by any underlying mutual funds or exchange-traded funds (ETFs). Net investment income (loss) of any mutual funds or ETFs is not included in the Fund's net investment income (loss) ratio.
C Net investment income per share reflects one or more large, non-recurring dividend(s) which amounted to $.09 per share. Excluding such non-recurring dividend(s), the ratio of net investment income (loss) to average net assets would have been 1.73%.
D Total distributions per share do not sum due to rounding.
E Amount represents less than $.005 per share.
F Total returns for periods of less than one year are not annualized.
G Total returns would have been lower if certain expenses had not been reduced during the applicable periods shown.
H Total returns do not include the effect of the sales charges.
I Fees and expenses of any underlying mutual funds or exchange-traded funds (ETFs) are not included in the Fund's expense ratio. The Fund indirectly bears its proportionate share of these expenses. For additional expense information related to investments in Fidelity Central Funds, please refer to the "Investments in Fidelity Central Funds" note found in the Notes to Financial Statements section of the most recent Annual or Semi-Annual report.
J Expense ratios reflect operating expenses of the class. Expenses before reductions do not reflect amounts reimbursed, waived, or reduced through arrangements with the investment adviser, brokerage services, or other offset arrangements, if applicable, and do not represent the amount paid by the class during periods when reimbursements, waivers or reductions occur.
K Annualized.
L Amount does not include the portfolio activity of any underlying mutual funds or exchange-traded funds (ETFs).
M Portfolio turnover rate excludes securities received or delivered in-kind.
| Fidelity Advisor® International Value Fund Class M |
| |
| | Six months ended (Unaudited) April 30, 2023 | | Years ended October 31, 2022 | | 2021 | | 2020 | | 2019 | | 2018 |
Selected Per-Share Data | | | | | | | | | | | | |
| Net asset value, beginning of period | $ | 7.63 | $ | 9.63 | $ | 6.86 | $ | 8.24 | $ | 8.11 | $ | 9.06 |
| Income from Investment Operations | | | | | | | | | | | | |
Net investment income (loss) A,B | | .07 | | .22 | | .23 C | | .11 | | .23 | | .18 |
| Net realized and unrealized gain (loss) | | 1.48 | | (1.87) | | 2.65 | | (1.25) | | .08 | | (1.04) |
| Total from investment operations | | 1.55 | | (1.65) | | 2.88 | | (1.14) | | .31 | | (.86) |
| Distributions from net investment income | | (.12) | | (.35) | | (.11) | | (.21) | | (.18) | | (.08) |
| Distributions from net realized gain | | - | | - | | - | | (.03) | | - | | (.01) |
| Total distributions | | (.12) | | (.35) | | (.11) | | (.24) | | (.18) | | (.09) |
Redemption fees added to paid in capital A | | - | | - | | - | | - | | - | | - D |
| Net asset value, end of period | $ | 9.06 | $ | 7.63 | $ | 9.63 | $ | 6.86 | $ | 8.24 | $ | 8.11 |
Total Return E,F,G | | 20.38% | | (17.65)% | | 42.20% | | (14.29)% | | 4.11% | | (9.59)% |
Ratios to Average Net Assets B,H,I | | | | | | | | | | | | |
| Expenses before reductions | | 1.64% J | | 1.72% | | 1.62% | | 1.57% | | 1.44% | | 1.56% |
| Expenses net of fee waivers, if any | | 1.55% J | | 1.55% | | 1.58% | | 1.57% | | 1.43% | | 1.55% |
| Expenses net of all reductions | | 1.54% J | | 1.55% | | 1.58% | | 1.55% | | 1.42% | | 1.54% |
| Net investment income (loss) | | 1.67% J | | 2.60% | | 2.51% C | | 1.44% | | 2.89% | | 2.04% |
| Supplemental Data | | | | | | | | | | | | |
| Net assets, end of period (000 omitted) | $ | 4,465 | $ | 3,498 | $ | 4,375 | $ | 2,884 | $ | 3,756 | $ | 3,920 |
Portfolio turnover rate K | | 24% J | | 25% | | 29% L | | 36% | | 47% | | 55% |
A Calculated based on average shares outstanding during the period.
B Net investment income (loss) is affected by the timing of the declaration of dividends by any underlying mutual funds or exchange-traded funds (ETFs). Net investment income (loss) of any mutual funds or ETFs is not included in the Fund's net investment income (loss) ratio.
C Net investment income per share reflects one or more large, non-recurring dividend(s) which amounted to $.09 per share. Excluding such non-recurring dividend(s), the ratio of net investment income (loss) to average net assets would have been 1.48%.
D Amount represents less than $.005 per share.
E Total returns for periods of less than one year are not annualized.
F Total returns would have been lower if certain expenses had not been reduced during the applicable periods shown.
G Total returns do not include the effect of the sales charges.
H Fees and expenses of any underlying mutual funds or exchange-traded funds (ETFs) are not included in the Fund's expense ratio. The Fund indirectly bears its proportionate share of these expenses. For additional expense information related to investments in Fidelity Central Funds, please refer to the "Investments in Fidelity Central Funds" note found in the Notes to Financial Statements section of the most recent Annual or Semi-Annual report.
I Expense ratios reflect operating expenses of the class. Expenses before reductions do not reflect amounts reimbursed, waived, or reduced through arrangements with the investment adviser, brokerage services, or other offset arrangements, if applicable, and do not represent the amount paid by the class during periods when reimbursements, waivers or reductions occur.
J Annualized.
K Amount does not include the portfolio activity of any underlying mutual funds or exchange-traded funds (ETFs).
L Portfolio turnover rate excludes securities received or delivered in-kind.
| Fidelity Advisor® International Value Fund Class C |
| |
| | Six months ended (Unaudited) April 30, 2023 | | Years ended October 31, 2022 | | 2021 | | 2020 | | 2019 | | 2018 |
Selected Per-Share Data | | | | | | | | | | | | |
| Net asset value, beginning of period | $ | 7.64 | $ | 9.60 | $ | 6.85 | $ | 8.22 | $ | 8.08 | $ | 9.04 |
| Income from Investment Operations | | | | | | | | | | | | |
Net investment income (loss) A,B | | .05 | | .18 | | .18 C | | .07 | | .19 | | .14 |
| Net realized and unrealized gain (loss) | | 1.48 | | (1.87) | | 2.65 | | (1.24) | | .08 | | (1.04) |
| Total from investment operations | | 1.53 | | (1.69) | | 2.83 | | (1.17) | | .27 | | (.90) |
| Distributions from net investment income | | (.07) | | (.27) | | (.08) | | (.17) | | (.13) | | (.04) |
| Distributions from net realized gain | | - | | - | | - | | (.03) | | - | | (.01) |
| Total distributions | | (.07) | | (.27) | | (.08) | | (.20) | | (.13) | | (.06) D |
Redemption fees added to paid in capital A | | - | | - | | - | | - | | - | | - E |
| Net asset value, end of period | $ | 9.10 | $ | 7.64 | $ | 9.60 | $ | 6.85 | $ | 8.22 | $ | 8.08 |
Total Return F,G,H | | 20.04% | | (18.01)% | | 41.45% | | (14.67)% | | 3.53% | | (10.06)% |
Ratios to Average Net Assets B,I,J | | | | | | | | | | | | |
| Expenses before reductions | | 2.14% K | | 2.23% | | 2.12% | | 2.07% | | 1.93% | | 2.04% |
| Expenses net of fee waivers, if any | | 2.05% K | | 2.05% | | 2.09% | | 2.07% | | 1.92% | | 2.04% |
| Expenses net of all reductions | | 2.05% K | | 2.05% | | 2.09% | | 2.05% | | 1.91% | | 2.02% |
| Net investment income (loss) | | 1.17% K | | 2.09% | | 2.00% C | | .94% | | 2.40% | | 1.55% |
| Supplemental Data | | | | | | | | | | | | |
| Net assets, end of period (000 omitted) | $ | 2,587 | $ | 2,190 | $ | 3,177 | $ | 2,947 | $ | 3,839 | $ | 5,339 |
Portfolio turnover rate L | | 24% K | | 25% | | 29% M | | 36% | | 47% | | 55% |
A Calculated based on average shares outstanding during the period.
B Net investment income (loss) is affected by the timing of the declaration of dividends by any underlying mutual funds or exchange-traded funds (ETFs). Net investment income (loss) of any mutual funds or ETFs is not included in the Fund's net investment income (loss) ratio.
C Net investment income per share reflects one or more large, non-recurring dividend(s) which amounted to $.09 per share. Excluding such non-recurring dividend(s), the ratio of net investment income (loss) to average net assets would have been .97%.
D Total distributions per share do not sum due to rounding.
E Amount represents less than $.005 per share.
F Total returns for periods of less than one year are not annualized.
G Total returns would have been lower if certain expenses had not been reduced during the applicable periods shown.
H Total returns do not include the effect of the contingent deferred sales charge.
I Fees and expenses of any underlying mutual funds or exchange-traded funds (ETFs) are not included in the Fund's expense ratio. The Fund indirectly bears its proportionate share of these expenses. For additional expense information related to investments in Fidelity Central Funds, please refer to the "Investments in Fidelity Central Funds" note found in the Notes to Financial Statements section of the most recent Annual or Semi-Annual report.
J Expense ratios reflect operating expenses of the class. Expenses before reductions do not reflect amounts reimbursed, waived, or reduced through arrangements with the investment adviser, brokerage services, or other offset arrangements, if applicable, and do not represent the amount paid by the class during periods when reimbursements, waivers or reductions occur.
K Annualized.
L Amount does not include the portfolio activity of any underlying mutual funds or exchange-traded funds (ETFs).
M Portfolio turnover rate excludes securities received or delivered in-kind.
| Fidelity® International Value Fund |
| |
| | Six months ended (Unaudited) April 30, 2023 | | Years ended October 31, 2022 | | 2021 | | 2020 | | 2019 | | 2018 |
Selected Per-Share Data | | | | | | | | | | | | |
| Net asset value, beginning of period | $ | 7.65 | $ | 9.66 | $ | 6.87 | $ | 8.25 | $ | 8.14 | $ | 9.09 |
| Income from Investment Operations | | | | | | | | | | | | |
Net investment income (loss) A,B | | .09 | | .26 | | .28 C | | .15 | | .28 | | .24 |
| Net realized and unrealized gain (loss) | | 1.48 | | (1.86) | | 2.66 | | (1.23) | | .07 | | (1.04) |
| Total from investment operations | | 1.57 | | (1.60) | | 2.94 | | (1.08) | | .35 | | (.80) |
| Distributions from net investment income | | (.16) | | (.41) | | (.15) | | (.27) | | (.24) | | (.14) |
| Distributions from net realized gain | | - | | - | | - | | (.03) | | - | | (.01) |
| Total distributions | | (.16) | | (.41) | | (.15) | | (.30) | | (.24) | | (.15) |
Redemption fees added to paid in capital A | | - | | - | �� | - | | - | | - | | - D |
| Net asset value, end of period | $ | 9.06 | $ | 7.65 | $ | 9.66 | $ | 6.87 | $ | 8.25 | $ | 8.14 |
Total Return E,F | | 20.63% | | (17.20)% | | 43.08% | | (13.70)% | | 4.65% | | (8.95)% |
Ratios to Average Net Assets B,G,H | | | | | | | | | | | | |
| Expenses before reductions | | 1.07% I | | 1.13% | | 1.01% | | .94% | | .79% | | .89% |
| Expenses net of fee waivers, if any | | 1.05% I | | 1.05% | | 1.01% | | .94% | | .78% | | .89% |
| Expenses net of all reductions | | 1.05% I | | 1.05% | | 1.01% | | .92% | | .78% | | .87% |
| Net investment income (loss) | | 2.17% I | | 3.10% | | 3.09% C | | 2.07% | | 3.54% | | 2.70% |
| Supplemental Data | | | | | | | | | | | | |
| Net assets, end of period (000 omitted) | $ | 458,654 | $ | 367,478 | $ | 372,441 | $ | 406,661 | $ | 442,816 | $ | 433,015 |
Portfolio turnover rate J | | 24% I | | 25% | | 29% K | | 36% | | 47% | | 55% |
A Calculated based on average shares outstanding during the period.
B Net investment income (loss) is affected by the timing of the declaration of dividends by any underlying mutual funds or exchange-traded funds (ETFs). Net investment income (loss) of any mutual funds or ETFs is not included in the Fund's net investment income (loss) ratio.
C Net investment income per share reflects one or more large, non-recurring dividend(s) which amounted to $.09 per share. Excluding such non-recurring dividend(s), the ratio of net investment income (loss) to average net assets would have been 2.05%.
D Amount represents less than $.005 per share.
E Total returns for periods of less than one year are not annualized.
F Total returns would have been lower if certain expenses had not been reduced during the applicable periods shown.
G Fees and expenses of any underlying mutual funds or exchange-traded funds (ETFs) are not included in the Fund's expense ratio. The Fund indirectly bears its proportionate share of these expenses. For additional expense information related to investments in Fidelity Central Funds, please refer to the "Investments in Fidelity Central Funds" note found in the Notes to Financial Statements section of the most recent Annual or Semi-Annual report.
H Expense ratios reflect operating expenses of the class. Expenses before reductions do not reflect amounts reimbursed, waived, or reduced through arrangements with the investment adviser, brokerage services, or other offset arrangements, if applicable, and do not represent the amount paid by the class during periods when reimbursements, waivers or reductions occur.
I Annualized.
J Amount does not include the portfolio activity of any underlying mutual funds or exchange-traded funds (ETFs).
K Portfolio turnover rate excludes securities received or delivered in-kind.
| Fidelity Advisor® International Value Fund Class I |
| |
| | Six months ended (Unaudited) April 30, 2023 | | Years ended October 31, 2022 | | 2021 | | 2020 | | 2019 | | 2018 |
Selected Per-Share Data | | | | | | | | | | | | |
| Net asset value, beginning of period | $ | 7.66 | $ | 9.67 | $ | 6.88 | $ | 8.26 | $ | 8.15 | $ | 9.10 |
| Income from Investment Operations | | | | | | | | | | | | |
Net investment income (loss) A,B | | .09 | | .25 | | .28 C | | .15 | | .27 | | .23 |
| Net realized and unrealized gain (loss) | | 1.49 | | (1.86) | | 2.66 | | (1.24) | | .08 | | (1.04) |
| Total from investment operations | | 1.58 | | (1.61) | | 2.94 | | (1.09) | | .35 | | (.81) |
| Distributions from net investment income | | (.16) | | (.40) | | (.15) | | (.26) | | (.24) | | (.13) |
| Distributions from net realized gain | | - | | - | | - | | (.03) | | - | | (.01) |
| Total distributions | | (.16) | | (.40) | | (.15) | | (.29) | | (.24) | | (.14) |
Redemption fees added to paid in capital A | | - | | - | | - | | - | | - | | - D |
| Net asset value, end of period | $ | 9.08 | $ | 7.66 | $ | 9.67 | $ | 6.88 | $ | 8.26 | $ | 8.15 |
Total Return E,F | | 20.76% | | (17.23)% | | 43.05% | | (13.75)% | | 4.57% | | (9.04)% |
Ratios to Average Net Assets B,G,H | | | | | | | | | | | | |
| Expenses before reductions | | 1.07% I | | 1.09% | | 1.07% | | .98% | | .86% | | .97% |
| Expenses net of fee waivers, if any | | 1.04% I | | 1.04% | | 1.05% | | .98% | | .85% | | .97% |
| Expenses net of all reductions | | 1.04% I | | 1.04% | | 1.05% | | .97% | | .85% | | .95% |
| Net investment income (loss) | | 2.17% I | | 3.10% | | 3.05% C | | 2.03% | | 3.47% | | 2.62% |
| Supplemental Data | | | | | | | | | | | | |
| Net assets, end of period (000 omitted) | $ | 110,297 | $ | 74,751 | $ | 6,661 | $ | 10,406 | $ | 8,495 | $ | 6,779 |
Portfolio turnover rate J | | 24% I | | 25% | | 29% K | | 36% | | 47% | | 55% |
A Calculated based on average shares outstanding during the period.
B Net investment income (loss) is affected by the timing of the declaration of dividends by any underlying mutual funds or exchange-traded funds (ETFs). Net investment income (loss) of any mutual funds or ETFs is not included in the Fund's net investment income (loss) ratio.
C Net investment income per share reflects one or more large, non-recurring dividend(s) which amounted to $.10 per share. Excluding such non-recurring dividend(s), the ratio of net investment income (loss) to average net assets would have been 2.01%.
D Amount represents less than $.005 per share.
E Total returns for periods of less than one year are not annualized.
F Total returns would have been lower if certain expenses had not been reduced during the applicable periods shown.
G Fees and expenses of any underlying mutual funds or exchange-traded funds (ETFs) are not included in the Fund's expense ratio. The Fund indirectly bears its proportionate share of these expenses. For additional expense information related to investments in Fidelity Central Funds, please refer to the "Investments in Fidelity Central Funds" note found in the Notes to Financial Statements section of the most recent Annual or Semi-Annual report.
H Expense ratios reflect operating expenses of the class. Expenses before reductions do not reflect amounts reimbursed, waived, or reduced through arrangements with the investment adviser, brokerage services, or other offset arrangements, if applicable, and do not represent the amount paid by the class during periods when reimbursements, waivers or reductions occur.
I Annualized.
J Amount does not include the portfolio activity of any underlying mutual funds or exchange-traded funds (ETFs).
K Portfolio turnover rate excludes securities received or delivered in-kind.
| Fidelity Advisor® International Value Fund Class Z |
| |
| | Six months ended (Unaudited) April 30, 2023 | | Years ended October 31, 2022 | | 2021 | | 2020 | | 2019 | | 2018 A |
Selected Per-Share Data | | | | | | | | | | | | |
| Net asset value, beginning of period | $ | 7.66 | $ | 9.67 | $ | 6.87 | $ | 8.25 | $ | 8.14 | $ | 8.81 |
| Income from Investment Operations | | | | | | | | | | | | |
Net investment income (loss) B,C | | .10 | | .26 | | .30 D | | .16 | | .29 | | .01 |
| Net realized and unrealized gain (loss) | | 1.48 | | (1.86) | | 2.65 | | (1.23) | | .08 | | (.68) |
| Total from investment operations | | 1.58 | | (1.60) | | 2.95 | | (1.07) | | .37 | | (.67) |
| Distributions from net investment income | | (.17) | | (.41) | | (.15) | | (.28) | | (.26) | | - |
| Distributions from net realized gain | | - | | - | | - | | (.03) | | - | | - |
| Total distributions | | (.17) | | (.41) | | (.15) | | (.31) | | (.26) | | - |
Redemption fees added to paid in capital B | | - | | - | | - | | - | | - | | - E |
| Net asset value, end of period | $ | 9.07 | $ | 7.66 | $ | 9.67 | $ | 6.87 | $ | 8.25 | $ | 8.14 |
Total Return F,G | | 20.73% | | (17.13)% | | 43.35% | | (13.58)% | | 4.84% | | (7.60)% |
Ratios to Average Net Assets C,H,I | | | | | | | | | | | | |
| Expenses before reductions | | .93% J | | .94% | | .89% | | .82% | | .67% | | .84% J |
| Expenses net of fee waivers, if any | | .89% J | | .89% | | .89% | | .82% | | .67% | | .84% J |
| Expenses net of all reductions | | .89% J | | .89% | | .89% | | .81% | | .66% | | .82% J |
| Net investment income (loss) | | 2.32% J | | 3.25% | | 3.21% D | | 2.19% | | 3.66% | | 1.58% J |
| Supplemental Data | | | | | | | | | | | | |
| Net assets, end of period (000 omitted) | $ | 170,304 | $ | 118,176 | $ | 11,946 | $ | 2,549 | $ | 2,249 | $ | 92 |
Portfolio turnover rate K | | 24% J | | 25% | | 29% L | | 36% | | 47% | | 55% |
A For the period October 2, 2018 (commencement of sale of shares) through October 31, 2018.
B Calculated based on average shares outstanding during the period.
C Net investment income (loss) is affected by the timing of the declaration of dividends by any underlying mutual funds or exchange-traded funds (ETFs). Net investment income (loss) of any mutual funds or ETFs is not included in the Fund's net investment income (loss) ratio.
D Net investment income per share reflects one or more large, non-recurring dividend(s) which amounted to $.10 per share. Excluding such non-recurring dividend(s), the ratio of net investment income (loss) to average net assets would have been 2.17%.
E Amount represents less than $.005 per share.
F Total returns for periods of less than one year are not annualized.
G Total returns would have been lower if certain expenses had not been reduced during the applicable periods shown.
H Fees and expenses of any underlying mutual funds or exchange-traded funds (ETFs) are not included in the Fund's expense ratio. The Fund indirectly bears its proportionate share of these expenses. For additional expense information related to investments in Fidelity Central Funds, please refer to the "Investments in Fidelity Central Funds" note found in the Notes to Financial Statements section of the most recent Annual or Semi-Annual report.
I Expense ratios reflect operating expenses of the class. Expenses before reductions do not reflect amounts reimbursed, waived, or reduced through arrangements with the investment adviser, brokerage services, or other offset arrangements, if applicable, and do not represent the amount paid by the class during periods when reimbursements, waivers or reductions occur.
J Annualized.
K Amount does not include the portfolio activity of any underlying mutual funds or exchange-traded funds (ETFs).
L Portfolio turnover rate excludes securities received or delivered in-kind.
For the period ended April 30, 2023
1. Organization.
Fidelity International Value Fund (the Fund) is a fund of Fidelity Investment Trust (the Trust) and is authorized to issue an unlimited number of shares. The Trust is registered under the Investment Company Act of 1940, as amended (the 1940 Act), as an open-end management investment company organized as a Massachusetts business trust. The Fund offers Class A, Class M, Class C, International Value, Class I and Class Z shares, each of which has equal rights as to assets and voting privileges. Class A, Class M, Class C, Class I and Class Z are Fidelity Advisor classes. Each class has exclusive voting rights with respect to matters that affect that class. Class C shares will automatically convert to Class A shares after a holding period of eight years from the initial date of purchase, with certain exceptions.
2. Investments in Fidelity Central Funds.
Funds may invest in Fidelity Central Funds, which are open-end investment companies generally available only to other investment companies and accounts managed by the investment adviser and its affiliates. The Schedule of Investments lists any Fidelity Central Funds held as an investment as of period end, but does not include the underlying holdings of each Fidelity Central Fund. An investing fund indirectly bears its proportionate share of the expenses of the underlying Fidelity Central Funds.
Based on its investment objective, each Fidelity Central Fund may invest or participate in various investment vehicles or strategies that are similar to those of the investing fund. These strategies are consistent with the investment objectives of the investing fund and may involve certain economic risks which may cause a decline in value of each of the Fidelity Central Funds and thus a decline in the value of the investing fund.
| Fidelity Central Fund | Investment Manager | Investment Objective | Investment Practices | Expense Ratio A |
| Fidelity Money Market Central Funds | Fidelity Management & Research Company LLC (FMR) | Each fund seeks to obtain a high level of current income consistent with the preservation of capital and liquidity. | Short-term Investments | Less than .005% |
A Expenses expressed as a percentage of average net assets and are as of each underlying Central Fund's most recent annual or semi-annual shareholder report.
3. Significant Accounting Policies.
The Fund is an investment company and applies the accounting and reporting guidance of the Financial Accounting Standards Board (FASB) Accounting Standards Codification Topic 946 Financial Services - Investment Companies . The financial statements have been prepared in conformity with accounting principles generally accepted in the United States of America (GAAP), which require management to make certain estimates and assumptions at the date of the financial statements. Actual results could differ from those estimates. Subsequent events, if any, through the date that the financial statements were issued have been evaluated in the preparation of the financial statements. The Fund's Schedule of Investments lists any underlying mutual funds or exchange-traded funds (ETFs) but does not include the underlying holdings of these funds. The following summarizes the significant accounting policies of the Fund:
Investment Valuation. Investments are valued as of 4:00 p.m. Eastern time on the last calendar day of the period. The Board of Trustees (the Board) has designated the Fund's investment adviser as the valuation designee responsible for the fair valuation function and performing fair value determinations as needed. The investment adviser has established a Fair Value Committee (the Committee) to carry out the day-to-day fair valuation responsibilities and has adopted policies and procedures to govern the fair valuation process and the activities of the Committee. In accordance with these fair valuation policies and procedures, which have been approved by the Board, the Fund attempts to obtain prices from one or more third party pricing services or brokers to value its investments. When current market prices, quotations or currency exchange rates are not readily available or reliable, investments will be fair valued in good faith by the Committee, in accordance with the policies and procedures. Factors used in determining fair value vary by investment type and may include market or investment specific events, transaction data, estimated cash flows, and market observations of comparable investments. The frequency that the fair valuation procedures are used cannot be predicted and they may be utilized to a significant extent. The Committee manages the Fund's fair valuation practices and maintains the fair valuation policies and procedures. The Fund's investment adviser reports to the Board information regarding the fair valuation process and related material matters.
The Fund categorizes the inputs to valuation techniques used to value its investments into a disclosure hierarchy consisting of three levels as shown below:
Level 1 - unadjusted quoted prices in active markets for identical investments
Level 2 - other significant observable inputs (including quoted prices for similar investments, interest rates, prepayment speeds, etc.)
Level 3 - unobservable inputs (including the Fund's own assumptions based on the best information available)
Valuation techniques used to value the Fund's investments by major category are as follows:
Equity securities, including restricted securities, for which market quotations are readily available, are valued at the last reported sale price or official closing price as reported by a third party pricing service on the primary market or exchange on which they are traded and are categorized as Level 1 in the hierarchy. In the event there were no sales during the day or closing prices are not available, securities are valued at the last quoted bid price or may be valued using the last available price and are generally categorized as Level 2 in the hierarchy. For foreign equity securities, when market or security specific events arise, comparisons to the valuation of American Depositary Receipts (ADRs), futures contracts, Exchange-Traded Funds (ETFs) and certain indexes as well as quoted prices for similar securities may be used and would be categorized as Level 2 in the hierarchy. For equity securities, including restricted securities, where observable inputs are limited, assumptions about market activity and risk are used and these securities may be categorized as Level 3 in the hierarchy.
Investments in open-end mutual funds, including the Fidelity Central Funds, are valued at their closing net asset value (NAV) each business day and are categorized as Level 1 in the hierarchy.
Changes in valuation techniques may result in transfers in or out of an assigned level within the disclosure hierarchy. The aggregate value of investments by input level as of April 30, 2023 is included at the end of the Fund's Schedule of Investments.
Foreign Currency. Certain Funds may use foreign currency contracts to facilitate transactions in foreign-denominated securities. Gains and losses from these transactions may arise from changes in the value of the foreign currency or if the counterparties do not perform under the contracts' terms.
Foreign-denominated assets, including investment securities, and liabilities are translated into U.S. dollars at the exchange rates at period end. Purchases and sales of investment securities, income and dividends received, and expenses denominated in foreign currencies are translated into U.S. dollars at the exchange rate in effect on the transaction date.
The effects of exchange rate fluctuations on investments are included with the net realized and unrealized gain (loss) on investment securities. Other foreign currency transactions resulting in realized and unrealized gain (loss) are disclosed separately.
Investment Transactions and Income. For financial reporting purposes, the Fund's investment holdings and NAV include trades executed through the end of the last business day of the period. The NAV per share for processing shareholder transactions is calculated as of the close of business of the New York Stock Exchange (NYSE), normally 4:00 p.m. Eastern time and includes trades executed through the end of the prior business day. Gains and losses on securities sold are determined on the basis of identified cost and include proceeds received from litigation. Commissions paid to certain brokers with whom the investment adviser, or its affiliates, places trades on behalf of a fund include an amount in addition to trade execution, which may be rebated back to a fund. Any such rebates are included in net realized gain (loss) on investments in the Statement of Operations. Dividend income is recorded on the ex-dividend date, except for certain dividends from foreign securities where the ex-dividend date may have passed, which are recorded as soon as the Fund is informed of the ex-dividend date. Non-cash dividends included in dividend income, if any, are recorded at the fair market value of the securities received. Income and capital gain distributions from Fidelity Central Funds, if any, are recorded on the ex-dividend date. Investment income is recorded net of foreign taxes withheld where recovery of such taxes is uncertain. Funds may file withholding tax reclaims in certain jurisdictions to recover a portion of amounts previously withheld. Any withholding tax reclaims income is included in the Statement of Operations in foreign taxes withheld. Any receivables for withholding tax reclaims are included in the Statement of Assets and Liabilities in reclaims receivable.
Class Allocations and Expenses. Investment income, realized and unrealized capital gains and losses, common expenses of a fund, and certain fund-level expense reductions, if any, are allocated daily on a pro-rata basis to each class based on the relative net assets of each class to the total net assets of a fund. Each class differs with respect to transfer agent and distribution and service plan fees incurred, as applicable. Certain expense reductions may also differ by class, if applicable. For the reporting period, the allocated portion of income and expenses to each class as a percent of its average net assets may vary due to the timing of recording these transactions in relation to fluctuating net assets of the classes. Expenses directly attributable to a fund are charged to that fund. Expenses attributable to more than one fund are allocated among the respective funds on the basis of relative net assets or other appropriate methods. Expenses included in the accompanying financial statements reflect the expenses of that fund and do not include any expenses associated with any underlying mutual funds or exchange-traded funds. Although not included in a fund's expenses, a fund indirectly bears its proportionate share of these expenses through the net asset value of each underlying mutual fund or exchange-traded fund. Expense estimates are accrued in the period to which they relate and adjustments are made when actual amounts are known.
Income Tax Information and Distributions to Shareholders. Each year, the Fund intends to qualify as a regulated investment company under Subchapter M of the Internal Revenue Code, including distributing substantially all of its taxable income and realized gains. As a result, no provision for U.S. Federal income taxes is required. The Fund files a U.S. federal tax return, in addition to state and local tax returns as required. The Fund's federal income tax returns are subject to examination by the Internal Revenue Service (IRS) for a period of three fiscal years after they are filed. State and local tax returns may be subject to examination for an additional fiscal year depending on the jurisdiction. Foreign taxes are provided for based on the Fund's understanding of the tax rules and rates that exist in the foreign markets in which it invests.
Distributions are declared and recorded on the ex-dividend date. Income and capital gain distributions are declared separately for each class. Income and capital gain distributions are determined in accordance with income tax regulations, which may differ from GAAP.
Capital accounts within the financial statements are adjusted for permanent book-tax differences. These adjustments have no impact on net assets or the results of operations. Capital accounts are not adjusted for temporary book-tax differences which will reverse in a subsequent period.
Book-tax differences are primarily due to foreign currency transactions, passive foreign investment companies (PFIC), capital loss carryforwards, losses deferred due to wash sales.
As of period end, the cost and unrealized appreciation (depreciation) in securities, and derivatives if applicable, for federal income tax purposes were as follows:
| Gross unrealized appreciation | $96,336,544 |
| Gross unrealized depreciation | (34,117,831) |
| Net unrealized appreciation (depreciation) | $62,218,713 |
| Tax cost | $725,507,412 |
Capital loss carryforwards are only available to offset future capital gains of the Fund to the extent provided by regulations and may be limited. The capital loss carryforward information presented below, including any applicable limitation, is estimated as of prior fiscal period end and is subject to adjustment.
Short-term | $(27,230,182) |
Long-term | (40,066,933) |
| Total capital loss carryforward | $(67,297,115) |
Due to large redemptions in a prior period, $38,643,007 of capital losses that will be available to offset future capital gains of the Fund will be limited to approximately $5,836,972 per year.
Restricted Securities (including Private Placements). Funds may invest in securities that are subject to legal or contractual restrictions on resale. These securities generally may be resold in transactions exempt from registration or to the public if the securities are registered. Disposal of these securities may involve time-consuming negotiations and expense, and prompt sale at an acceptable price may be difficult. Information regarding restricted securities held at period end is included at the end of the Schedule of Investments, if applicable.
4. Purchases and Sales of Investments.
Purchases and sales of securities, other than short-term securities and in-kind transactions, as applicable, are noted in the table below.
| | Purchases ($) | Sales ($) |
| Fidelity International Value Fund | 143,242,677 | 80,526,878 |
5. Fees and Other Transactions with Affiliates.
Management Fee. Fidelity Management & Research Company LLC (the investment adviser) and its affiliates provide the Fund with investment management related services for which the Fund pays a monthly management fee. The management fee is the sum of an individual fund fee rate that is based on an annual rate of .45% of the Fund's average net assets and an annualized group fee rate that averaged 23% during the period. The group fee rate is based upon the monthly average net assets of a group of registered investment companies with which the investment adviser has management contracts. The group fee rate decreases as assets under management increase and increases as assets under management decrease. In addition, the management fee is subject to a performance adjustment (up to a maximum of +/- .20 % of the Fund's average net assets over a 36 month performance period). The upward or downward adjustment to the management fee is based on the relative investment performance of International Value as compared to its benchmark index, the MSCI EAFE Value Index, over the same 36 month performance period. For the reporting period, the total annualized management fee rate, including the performance adjustment, was .79% of the Fund's average net assets. The performance adjustment included in the management fee rate may be higher or lower than the maximum performance adjustment rate due to the difference between the average net assets for the reporting and performance periods.
Distribution and Service Plan Fees. In accordance with Rule 12b-1 of the 1940 Act, the Fund has adopted separate Distribution and Service Plans for each class of shares. Certain classes pay Fidelity Distributors Company LLC (FDC), an affiliate of the investment adviser, separate Distribution and Service Fees, each of which is based on an annual percentage of each class' average net assets. In addition, FDC may pay financial intermediaries for selling shares of the Fund and providing shareholder support services. For the period, the Distribution and Service Fee rates, total fees and amounts retained by FDC were as follows:
| | Distribution Fee | Service Fee | Total Fees | Retained by FDC |
| Class A | - % | .25% | $18,445 | $1,626 |
| Class M | .25% | .25% | 10,492 | 119 |
| Class C | .75% | .25% | 12,789 | 1,612 |
| | | | $41,726 | $3,357 |
Sales Load. FDC may receive a front-end sales charge of up to 5.75% for selling Class A shares and 3.50% for selling Class M shares, some of which is paid to financial intermediaries for selling shares of the Fund. Depending on the holding period, FDC may receive contingent deferred sales charges levied on Class A, Class M and Class C redemptions. The deferred sales charges are 1.00% for Class C shares, 1.00% for certain purchases of Class A shares and .25% for certain purchases of Class M shares.
For the period, sales charge amounts retained by FDC were as follows:
| | Retained by FDC |
| Class A | $ 14,677 |
| Class M | 259 |
Class C A | 261 |
| | $ 15,197 |
A When Class C shares are initially sold, FDC pays commissions from its own resources to financial intermediaries through which the sales are made.
Transfer Agent Fees. Fidelity Investments Institutional Operations Company LLC (FIIOC), an affiliate of the investment adviser, is the transfer, dividend disbursing and shareholder servicing agent for each class of the Fund. FIIOC receives account fees and asset-based fees that vary according to the account size and type of account of the shareholders of the respective classes of the Fund, except for Class Z. FIIOC receives an asset-based fee of Class Z's average net assets. FIIOC pays for typesetting, printing and mailing of shareholder reports, except proxy statements.
For the period, transfer agent fees for each class were as follows:
| | Amount | % of Class-Level Average Net Assets A |
| Class A | $ 18,832 | .26 |
| Class M | 5,398 | .26 |
| Class C | 3,304 | .26 |
| International Value | 395,373 | .18 |
| Class I | 83,210 | .18 |
| Class Z | 31,257 | .04 |
| | $ 537,374 | |
A Annualized
Accounting Fees. Fidelity Service Company, Inc. (FSC), an affiliate of the investment adviser, maintains the Fund's accounting records. The accounting fee is based on the level of average net assets for each month. For the period, the fees were equivalent to the following annualized rates:
| | % of Average Net Assets |
| Fidelity International Value Fund | .05 |
Brokerage Commissions. A portion of portfolio transactions were placed with brokerage firms which are affiliates of the investment adviser. Brokerage commissions are included in net realized gain (loss) and change in net unrealized appreciation (depreciation) in the Statement of Operations. The commissions paid to these affiliated firms were as follows:
| | Amount |
| Fidelity International Value Fund | $ 63 |
Interfund Trades. Funds may purchase from or sell securities to other Fidelity Funds under procedures adopted by the Board. The procedures have been designed to ensure these interfund trades are executed in accordance with Rule 17a-7 of the 1940 Act. Any interfund trades are included within the respective purchases and sales amounts shown in the Purchases and Sales of Investments note. Interfund trades during the period are noted in the table below.
| | Purchases ($) | Sales ($) | Realized Gain (Loss) ($) |
| Fidelity International Value Fund | 7,939,111 | 947,480 | 71,025 |
6. Committed Line of Credit.
Certain Funds participate with other funds managed by the investment adviser or an affiliate in a $4.25 billion credit facility (the "line of credit") to be utilized for temporary or emergency purposes to fund shareholder redemptions or for other short-term liquidity purposes. The participating funds have agreed to pay commitment fees on their pro-rata portion of the line of credit, which are reflected in Miscellaneous expenses on the Statement of Operations, and are listed below. During the period, there were no borrowings on this line of credit.
| | Amount |
| Fidelity International Value Fund | $658 |
7. Security Lending.
Funds lend portfolio securities from time to time in order to earn additional income. Lending agents are used, including National Financial Services (NFS), an affiliate of the investment adviser. Pursuant to a securities lending agreement, NFS will receive a fee, which is capped at 9.9% of a fund's daily lending revenue, for its services as lending agent. A fund may lend securities to certain qualified borrowers, including NFS. On the settlement date of the loan, a fund receives collateral (in the form of U.S. Treasury obligations, letters of credit and/or cash) against the loaned securities and maintains collateral in an amount not less than 100% of the market value of the loaned securities during the period of the loan. The market value of the loaned securities is determined at the close of business of a fund and any additional required collateral is delivered to a fund on the next business day. A fund or borrower may terminate the loan at any time, and if the borrower defaults on its obligation to return the securities loaned because of insolvency or other reasons, a fund may apply collateral received from the borrower against the obligation. A fund may experience delays and costs in recovering the securities loaned. Any cash collateral received is invested in the Fidelity Securities Lending Cash Central Fund. Any loaned securities are identified as such in the Schedule of Investments, and the value of loaned securities and cash collateral at period end, as applicable, are presented in the Statement of Assets and Liabilities. Security lending income represents the income earned on investing cash collateral, less rebates paid to borrowers and any lending agent fees associated with the loan, plus any premium payments received for lending certain types of securities. Security lending income is presented in the Statement of Operations as a component of income from Fidelity Central Funds. Affiliated security lending activity, if any, was as follows:
| | Total Security Lending Fees Paid to NFS | Security Lending Income From Securities Loaned to NFS | Value of Securities Loaned to NFS at Period End |
| Fidelity International Value Fund | $13,396 | $ - | $- |
8. Expense Reductions.
The investment adviser contractually agreed to reimburse expenses of each class to the extent annual operating expenses exceeded certain levels of class-level average net assets as noted in the table below. This reimbursement will remain in place through February 29, 2024. Some expenses, for example the compensation of the independent Trustees, and certain miscellaneous expenses such as proxy and shareholder meeting expenses, are excluded from this reimbursement.
The following classes were in reimbursement during the period:
| | Expense Limitations | Reimbursement |
| Class A | 1.30% | $ 6,765 |
| Class M | 1.55% | 1,962 |
| Class C | 2.05% | 1,202 |
| International Value | 1.05% | 37,336 |
| Class I | 1.05% | 9,617 |
| Class Z | .90% | 21,125 |
| | | $ 78,007 |
Through arrangements with the Fund's custodian and each class' transfer agent, credits realized as a result of certain uninvested cash balances were used to reduce the Fund's expenses. During the period, custodian credits reduced the Fund's expenses by $66 . During the period, transfer agent credits reduced each class' expenses as noted in the table below.
| | Expense reduction |
| Class A | $ 1 |
| Class M | 116 |
| | $ 117 |
In addition, during the period the investment adviser or an affiliate reimbursed and/or waived a portion of fund-level operating expenses in the amount of $15,973.
9. Distributions to Shareholders.
Distributions to shareholders of each class were as follows:
| | Six months ended April 30, 2023 | Year ended October 31, 2022 |
| Fidelity International Value Fund | | |
| Distributions to shareholders | | |
| Class A | $ 221,998 | $431,993 |
| Class M | 54,560 | 159,041 |
| Class C | 19,445 | 89,688 |
| International Value | 7,434,045 | 16,448,559 |
| Class I | 1,572,298 | 270,723 |
| Class Z | 2,600,176 | 528,869 |
Total | $ 11,902,522 | $ 17,928,873 |
10. Share Transactions.
Share transactions for each class were as follows and may contain in-kind transactions, automatic conversions between classes or exchanges between affiliated funds:
| | Shares | Shares | Dollars | Dollars |
| | Six months ended April 30, 2023 | Year ended October 31, 2022 | Six months ended April 30, 2023 | Year ended October 31, 2022 |
| Fidelity International Value Fund | | | | |
| Class A | | | | |
| Shares sold | 304,892 | 816,905 | $2,619,401 | $7,279,150 |
| Reinvestment of distributions | 26,113 | 47,745 | 219,873 | 425,405 |
| Shares redeemed | (150,023) | (378,549) | (1,300,664) | (3,283,758) |
| Net increase (decrease) | 180,982 | 486,101 | $1,538,610 | $4,420,797 |
| Class M | | | | |
| Shares sold | 56,790 | 71,311 | $487,769 | $629,674 |
| Reinvestment of distributions | 6,304 | 17,121 | 53,141 | 152,718 |
| Shares redeemed | (28,774) | (84,453) | (246,279) | (750,679) |
| Net increase (decrease) | 34,320 | 3,979 | $294,631 | $31,713 |
| Class C | | | | |
| Shares sold | 57,840 | 59,969 | $510,858 | $543,223 |
| Reinvestment of distributions | 2,290 | 9,999 | 19,445 | 89,688 |
| Shares redeemed | (62,490) | (114,149) | (550,426) | (968,490) |
| Net increase (decrease) | (2,360) | (44,181) | $(20,123) | $(335,579) |
| International Value | | | | |
| Shares sold | 9,407,284 | 32,895,367 | $82,461,569 | $280,320,847 |
| Reinvestment of distributions | 764,993 | 1,569,596 | 6,441,242 | 13,969,404 |
| Shares redeemed | (7,607,541) | (24,973,804) | (65,959,160) | (203,231,278) |
| Net increase (decrease) | 2,564,736 | 9,491,159 | $22,943,651 | $91,058,973 |
| Class I | | | | |
| Shares sold | 3,570,993 | 11,031,616 | $31,346,113 | $92,417,643 |
| Reinvestment of distributions | 184,152 | 29,506 | 1,552,405 | 263,195 |
| Shares redeemed | (1,359,207) | (1,992,300) | (11,790,240) | (15,704,798) |
| Net increase (decrease) | 2,395,938 | 9,068,822 | $21,108,278 | $76,976,040 |
| Class Z | | | | |
| Shares sold | 5,002,252 | 17,947,816 | $43,497,494 | $150,148,371 |
| Reinvestment of distributions | 273,689 | 56,409 | 2,304,458 | 502,041 |
| Shares redeemed | (1,933,905) | (3,811,522) | (16,773,541) | (31,174,409) |
| Net increase (decrease) | 3,342,036 | 14,192,703 | $29,028,411 | $119,476,003 |
11. Other.
A fund's organizational documents provide former and current trustees and officers with a limited indemnification against liabilities arising in connection with the performance of their duties to the fund. In the normal course of business, a fund may also enter into contracts that provide general indemnifications. A fund's maximum exposure under these arrangements is unknown as this would be dependent on future claims that may be made against a fund. The risk of material loss from such claims is considered remote.
Mutual funds managed by the investment adviser or its affiliates, in aggregate, were the owners of record of more than 20% of the total outstanding shares.
| Fund | % of shares held |
| Fidelity International Value Fund | 21% |
12. Risk and Uncertainties.
Many factors affect a fund's performance. Developments that disrupt global economies and financial markets, such as pandemics, epidemics, outbreaks of infectious diseases, war, terrorism, and environmental disasters, may significantly affect a fund's investment performance. The effects of these developments to a fund will be impacted by the types of securities in which a fund invests, the financial condition, industry, economic sector, and geographic location of an issuer, and a fund's level of investment in the securities of that issuer. Significant concentrations in security types, issuers, industries, sectors, and geographic locations may magnify the factors that affect a fund's performance.
As a shareholder, you incur two types of costs: (1) transaction costs, which may include sales charges (loads) on purchase payments or redemption proceeds, as applicable and (2) ongoing costs, which generally include management fees, distribution and/or service (12b-1) fees and other Fund expenses. This Example is intended to help you understand your ongoing costs (in dollars) of investing in a fund and to compare these costs with the ongoing costs of investing in other mutual funds.
| The Example is based on an investment of $1,000 invested at the beginning of the period and held for the entire period (November 1, 2022 to April 30, 2023). |
Actual Expenses
The first line of the accompanying table provides information about actual account values and actual expenses. You may use the information in this line, together with the amount you invested, to estimate the expenses that you paid over the period. Simply divide your account value by $1,000.00 (for example, an $8,600 account value divided by $1,000.00 = 8.6), then multiply the result by the number in the first line for a class/Fund under the heading entitled "Expenses Paid During Period" to estimate the expenses you paid on your account during this period. If any fund is a shareholder of any underlying mutual funds or exchange-traded funds (ETFs) (the Underlying Funds), such fund indirectly bears its proportional share of the expenses of the Underlying Funds in addition to the direct expenses incurred presented in the table. These fees and expenses are not included in the annualized expense ratio used to calculate the expense estimate in the table below.
Hypothetical Example for Comparison Purposes
The second line of the accompanying table provides information about hypothetical account values and hypothetical expenses based on the actual expense ratio and an assumed rate of return of 5% per year before expenses, which is not the actual return. The hypothetical account values and expenses may not be used to estimate the actual ending account balance or expenses you paid for the period. You may use this information to compare the ongoing costs of investing in the Fund and other funds. To do so, compare this 5% hypothetical example with the 5% hypothetical examples that appear in the shareholder reports of the other funds. If any fund is a shareholder of any Underlying Funds, such fund indirectly bears its proportional share of the expenses of the Underlying Funds in addition to the direct expenses as presented in the table. These fees and expenses are not included in the annualized expense ratio used to calculate the expense estimate in the table below.
Please note that the expenses shown in the table are meant to highlight your ongoing costs only and do not reflect any transaction costs. Therefore, the second line of the table is useful in comparing ongoing costs only, and will not help you determine the relative total costs of owning different funds. In addition, if these transactional costs were included, your costs would have been higher.
| | | | | Annualized Expense Ratio- A | | Beginning Account Value November 1, 2022 | | Ending Account Value April 30, 2023 | | Expenses Paid During Period- C November 1, 2022 to April 30, 2023 |
| Fidelity® International Value Fund | | | | | | | | | | |
| Class A | | | | 1.30% | | | | | | |
| Actual | | | | | | $ 1,000 | | $ 1,205.20 | | $ 7.11 |
Hypothetical- B | | | | | | $ 1,000 | | $ 1,018.35 | | $ 6.51 |
| Class M | | | | 1.55% | | | | | | |
| Actual | | | | | | $ 1,000 | | $ 1,203.80 | | $ 8.47 |
Hypothetical- B | | | | | | $ 1,000 | | $ 1,017.11 | | $ 7.75 |
| Class C | | | | 2.05% | | | | | | |
| Actual | | | | | | $ 1,000 | | $ 1,200.40 | | $ 11.18 |
Hypothetical- B | | | | | | $ 1,000 | | $ 1,014.63 | | $ 10.24 |
| Fidelity® International Value Fund | | | | 1.05% | | | | | | |
| Actual | | | | | | $ 1,000 | | $ 1,206.30 | | $ 5.74 |
Hypothetical- B | | | | | | $ 1,000 | | $ 1,019.59 | | $ 5.26 |
| Class I | | | | 1.04% | | | | | | |
| Actual | | | | | | $ 1,000 | | $ 1,207.60 | | $ 5.69 |
Hypothetical- B | | | | | | $ 1,000 | | $ 1,019.64 | | $ 5.21 |
| Class Z | | | | .89% | | | | | | |
| Actual | | | | | | $ 1,000 | | $ 1,207.30 | | $ 4.87 |
Hypothetical- B | | | | | | $ 1,000 | | $ 1,020.38 | | $ 4.46 |
| |
A Annualized expense ratio reflects expenses net of applicable fee waivers.
B 5% return per year before expenses
C Expenses are equal to the annualized expense ratio, multiplied by the average account value over the period, multiplied by 181/ 365 (to reflect the one-half year period). The fees and expenses of any Underlying Funds are not included in each annualized expense ratio.
The Securities and Exchange Commission adopted Rule 22e-4 under the Investment Company Act of 1940 (the Liquidity Rule) to promote effective liquidity risk management throughout the open-end investment company industry, thereby reducing the risk that funds will be unable to meet their redemption obligations and mitigating dilution of the interests of fund shareholders.
The Fund has adopted and implemented a liquidity risk management program (the Program) reasonably designed to assess and manage the Fund's liquidity risk and to comply with the requirements of the Liquidity Rule. The Fund's Board of Trustees (the Board) has designated the Fund's investment adviser as administrator of the Program. The Fidelity advisers have established a Liquidity Risk Management Committee (the LRM Committee) to manage the Program for each of the Fidelity Funds. The LRM Committee monitors the adequacy and effectiveness of implementation of the Program and on a periodic basis assesses each Fund's liquidity risk based on a variety of factors including (1) the Fund's investment strategy, (2) portfolio liquidity and cash flow projections during normal and reasonably foreseeable stressed conditions, (3) shareholder redemptions, (4) borrowings and other funding sources and (5) certain factors specific to ETFs including the effect of the Fund's prices and spreads, market participants, and basket compositions on the overall liquidity of the Fund's portfolio, as applicable.
In accordance with the Program, each of the Fund's portfolio investments is classified into one of four defined liquidity categories based on a determination of a reasonable expectation for how long it would take to convert the investment to cash (or sell or dispose of the investment) without significantly changing its market value.
- Highly liquid investments - cash or convertible to cash within three business days or less
- Moderately liquid investments - convertible to cash in three to seven calendar days
- Less liquid investments - can be sold or disposed of, but not settled, within seven calendar days
- Illiquid investments - cannot be sold or disposed of within seven calendar days
Liquidity classification determinations take into account a variety of factors including various market, trading and investment-specific considerations, as well as market depth, and generally utilize analysis from a third-party liquidity metrics service.
The Liquidity Rule places a 15% limit on a fund's illiquid investments and requires funds that do not primarily hold assets that are highly liquid investments to determine and maintain a minimum percentage of the fund's net assets to be invested in highly liquid investments (highly liquid investment minimum or HLIM). The Program includes provisions reasonably designed to comply with the 15% limit on illiquid investments and for determining, periodically reviewing and complying with the HLIM requirement as applicable.
At a recent meeting of the Fund's Board of Trustees, the LRM Committee provided a written report to the Board pertaining to the operation, adequacy, and effectiveness of the Program for the period December 1, 2021 through November 30, 2022. The report concluded that the Program is operating effectively and is reasonably designed to assess and manage the Fund's liquidity risk.
1.827485.116
FIV-SANN-0623
Fidelity® Global Equity Income Fund
Semi-Annual Report
April 30, 2023
Contents
To view a fund's proxy voting guidelines and proxy voting record for the 12-month period ended June 30, visit http://www.fidelity.com/proxyvotingresults or visit the Securities and Exchange Commission's (SEC) web site at http://www.sec.gov.
You may also call 1-800-544-8544 to request a free copy of the proxy voting guidelines.
Standard & Poor's, S&P and S&P 500 are registered service marks of The McGraw-Hill Companies, Inc. and have been licensed for use by Fidelity Distributors Corporation.
Other third-party marks appearing herein are the property of their respective owners.
All other marks appearing herein are registered or unregistered trademarks or service marks of FMR LLC or an affiliated company. © 2023 FMR LLC. All rights reserved.
This report and the financial statements contained herein are submitted for the general information of the shareholders of the Fund. This report is not authorized for distribution to prospective investors in the Fund unless preceded or accompanied by an effective prospectus.
A fund files its complete schedule of portfolio holdings with the SEC for the first and third quarters of each fiscal year on Form N-PORT. Forms N-PORT are available on the SEC's web site at http://www.sec.gov. A fund's Forms N-PORT may be reviewed and copied at the SEC's Public Reference Room in Washington, DC. Information regarding the operation of the SEC's Public Reference Room may be obtained by calling 1-800-SEC-0330.
For a complete list of a fund's portfolio holdings, view the most recent holdings listing, semiannual report, or annual report on Fidelity's web site at http://www.fidelity.com, http://www.institutional.fidelity.com, or http://www.401k.com, as applicable.
NOT FDIC INSURED •MAY LOSE VALUE •NO BANK GUARANTEE
Neither the Fund nor Fidelity Distributors Corporation is a bank.
Top Holdings (% of Fund's net assets) |
| |
| Apple, Inc. (United States of America, Technology Hardware, Storage & Peripherals) | 5.1 | |
| Microsoft Corp. (United States of America, Software) | 4.4 | |
| Exxon Mobil Corp. (United States of America, Oil, Gas & Consumable Fuels) | 1.9 | |
| Taiwan Semiconductor Manufacturing Co. Ltd. (Taiwan, Semiconductors & Semiconductor Equipment) | 1.9 | |
| Eli Lilly & Co. (United States of America, Pharmaceuticals) | 1.8 | |
| UnitedHealth Group, Inc. (United States of America, Health Care Providers & Services) | 1.6 | |
| LVMH Moet Hennessy Louis Vuitton SE (France, Textiles, Apparel & Luxury Goods) | 1.6 | |
| Linde PLC (United States of America, Chemicals) | 1.6 | |
| JPMorgan Chase & Co. (United States of America, Banks) | 1.5 | |
| AstraZeneca PLC sponsored ADR (United Kingdom, Pharmaceuticals) | 1.5 | |
| | 22.9 | |
| |
| Market Sectors (% of Fund's net assets) |
| |
| Information Technology | 19.0 | |
| Health Care | 13.9 | |
| Consumer Staples | 12.7 | |
| Financials | 10.3 | |
| Industrials | 8.5 | |
| Consumer Discretionary | 7.6 | |
| Communication Services | 7.3 | |
| Energy | 5.2 | |
| Materials | 5.0 | |
| Utilities | 3.5 | |
| Real Estate | 1.2 | |
| |
Asset Allocation (% of Fund's net assets) |
|
|
Geographic Diversification (% of Fund's net assets) |
|
* Includes Short-Term investments and Net Other Assets (Liabilities). Percentages are adjusted for the effect of derivatives, if applicable. |
| |
Showing Percentage of Net Assets
| Common Stocks - 94.2% |
| | | Shares | Value ($) |
| Belgium - 0.6% | | | |
| KBC Group NV | | 9,400 | 670,982 |
| UCB SA | | 3,631 | 337,764 |
TOTAL BELGIUM | | | 1,008,746 |
| Brazil - 0.7% | | | |
| Equatorial Energia SA | | 225,960 | 1,238,571 |
| Canada - 3.3% | | | |
| Alimentation Couche-Tard, Inc. Class A (multi-vtg.) | | 46,270 | 2,309,316 |
| Canadian Natural Resources Ltd. | | 19,936 | 1,214,833 |
| Constellation Software, Inc. | | 362 | 708,535 |
| Imperial Oil Ltd. | | 19,961 | 1,017,461 |
| Lumine Group, Inc. | | 1,086 | 14,629 |
| Nutrien Ltd. | | 4,129 | 286,441 |
TOTAL CANADA | | | 5,551,215 |
| China - 1.8% | | | |
| Kweichow Moutai Co. Ltd. (A Shares) | | 3,133 | 799,399 |
| NXP Semiconductors NV | | 11,912 | 1,950,471 |
| SITC International Holdings Co. Ltd. | | 183,884 | 340,127 |
TOTAL CHINA | | | 3,089,997 |
| Denmark - 0.7% | | | |
| A.P. Moller - Maersk A/S Series B | | 241 | 435,620 |
| DSV A/S | | 4,147 | 778,884 |
TOTAL DENMARK | | | 1,214,504 |
| Finland - 1.4% | | | |
| Elisa Corp. (A Shares) | | 32,061 | 1,989,674 |
| Neste OYJ | | 7,706 | 373,105 |
TOTAL FINLAND | | | 2,362,779 |
| France - 4.4% | | | |
| Airbus Group NV | | 6,773 | 948,455 |
| Capgemini SA | | 5,388 | 979,017 |
| Edenred SA | | 23,594 | 1,531,816 |
| LVMH Moet Hennessy Louis Vuitton SE | | 2,792 | 2,685,573 |
| Teleperformance | | 1,947 | 387,888 |
| VINCI SA | | 6,328 | 782,351 |
TOTAL FRANCE | | | 7,315,100 |
| Germany - 1.9% | | | |
| Deutsche Telekom AG | | 55,083 | 1,328,148 |
| Rheinmetall AG | | 3,085 | 902,530 |
| Siemens AG | | 6,100 | 1,005,477 |
TOTAL GERMANY | | | 3,236,155 |
| Hong Kong - 1.0% | | | |
| AIA Group Ltd. | | 117,413 | 1,278,284 |
| HKBN Ltd. | | 448,630 | 316,577 |
TOTAL HONG KONG | | | 1,594,861 |
| India - 0.7% | | | |
| HDFC Bank Ltd. sponsored ADR | | 5,839 | 407,562 |
| Redington (India) Ltd. | | 120,572 | 249,544 |
| Reliance Industries Ltd. | | 19,987 | 594,183 |
TOTAL INDIA | | | 1,251,289 |
| Japan - 6.1% | | | |
| Capcom Co. Ltd. | | 19,124 | 718,634 |
| Daiichikosho Co. Ltd. | | 71,972 | 1,290,330 |
| FUJIFILM Holdings Corp. | | 5,938 | 309,488 |
| Hitachi Ltd. | | 13,948 | 771,529 |
| Hoya Corp. | | 11,203 | 1,174,691 |
| Inaba Denki Sangyo Co. Ltd. | | 51,961 | 1,160,599 |
| Minebea Mitsumi, Inc. | | 31,666 | 586,411 |
| Renesas Electronics Corp. (a) | | 47,482 | 618,807 |
| Roland Corp. | | 17,640 | 528,775 |
| Shin-Etsu Chemical Co. Ltd. | | 25,975 | 741,218 |
| Sony Group Corp. | | 18,172 | 1,644,089 |
| Toyota Motor Corp. | | 51,623 | 708,786 |
TOTAL JAPAN | | | 10,253,357 |
| Kenya - 0.3% | | | |
| Safaricom Ltd. | | 3,575,246 | 433,761 |
| Korea (South) - 1.0% | | | |
| Samsung Electronics Co. Ltd. | | 33,185 | 1,633,485 |
| South Africa - 0.4% | | | |
| Anglo American PLC (United Kingdom) | | 22,717 | 700,006 |
| Sweden - 0.3% | | | |
| HEXPOL AB (B Shares) | | 48,826 | 574,673 |
| Switzerland - 0.5% | | | |
| Sika AG | | 3,049 | 842,204 |
| Taiwan - 2.3% | | | |
| MediaTek, Inc. | | 31,796 | 690,884 |
| Taiwan Semiconductor Manufacturing Co. Ltd. | | 188,877 | 3,090,811 |
TOTAL TAIWAN | | | 3,781,695 |
| United Kingdom - 6.3% | | | |
| AstraZeneca PLC sponsored ADR | | 34,793 | 2,547,543 |
| B&M European Value Retail SA | | 170,488 | 1,027,809 |
| BAE Systems PLC | | 56,020 | 713,694 |
| Compass Group PLC | | 43,648 | 1,151,476 |
| Diageo PLC | | 25,579 | 1,166,814 |
| JD Sports Fashion PLC | | 272,197 | 550,926 |
| RELX PLC (London Stock Exchange) | | 35,801 | 1,190,512 |
| RS GROUP PLC | | 51,887 | 600,836 |
| Starling Bank Ltd. Series D (a)(b)(c) | | 62,800 | 238,350 |
| Unilever PLC | | 15,741 | 876,492 |
| WH Smith PLC | | 25,717 | 508,714 |
TOTAL UNITED KINGDOM | | | 10,573,166 |
| United States of America - 60.5% | | | |
| AbbVie, Inc. | | 10,319 | 1,559,407 |
| Accenture PLC Class A | | 7,950 | 2,228,306 |
| Activision Blizzard, Inc. | | 13,312 | 1,034,476 |
| Albertsons Companies, Inc. | | 15,339 | 320,585 |
| Altria Group, Inc. | | 8,200 | 389,582 |
| Amdocs Ltd. | | 17,648 | 1,610,380 |
| Ameren Corp. | | 11,854 | 1,054,650 |
| American Tower Corp. | | 3,623 | 740,505 |
| Amgen, Inc. | | 5,571 | 1,335,592 |
| Apple, Inc. | | 50,465 | 8,562,902 |
| AT&T, Inc. | | 20,483 | 361,935 |
| Ball Corp. | | 6,100 | 324,398 |
| Bank of America Corp. | | 69,186 | 2,025,766 |
| BJ's Wholesale Club Holdings, Inc. (a) | | 16,537 | 1,262,931 |
| Bristol-Myers Squibb Co. | | 18,107 | 1,209,004 |
| Capital One Financial Corp. | | 12,263 | 1,193,190 |
| Chubb Ltd. | | 5,537 | 1,116,038 |
| Cisco Systems, Inc. | | 39,873 | 1,883,999 |
| Comcast Corp. Class A | | 34,197 | 1,414,730 |
| Costco Wholesale Corp. | | 2,140 | 1,076,891 |
| Crane Co. | | 3,993 | 287,776 |
| Crane Nxt Co. | | 3,993 | 189,108 |
| Crown Holdings, Inc. | | 11,112 | 953,187 |
| Danaher Corp. | | 9,337 | 2,212,029 |
| Dollar Tree, Inc. (a) | | 11,985 | 1,842,214 |
| Dominion Energy, Inc. | | 11,001 | 628,597 |
| Eli Lilly & Co. | | 7,600 | 3,008,536 |
| Experian PLC | | 9,442 | 334,293 |
| Exxon Mobil Corp. | | 26,432 | 3,127,963 |
| Freeport-McMoRan, Inc. | | 33,473 | 1,268,961 |
| GE Healthcare Holding LLC | | 4,385 | 356,676 |
| General Electric Co. | | 13,456 | 1,331,740 |
| Gilead Sciences, Inc. | | 15,800 | 1,298,918 |
| H&R Block, Inc. | | 21,814 | 739,713 |
| Hartford Financial Services Group, Inc. | | 7,921 | 562,312 |
| Hess Corp. | | 6,990 | 1,013,969 |
| Johnson Controls International PLC | | 9,742 | 582,961 |
| JPMorgan Chase & Co. | | 18,631 | 2,575,549 |
| Keurig Dr. Pepper, Inc. | | 25,716 | 840,913 |
| Lamar Advertising Co. Class A | | 13,017 | 1,375,637 |
| Linde PLC | | 7,198 | 2,659,301 |
| M&T Bank Corp. | | 6,593 | 829,399 |
| McDonald's Corp. | | 5,236 | 1,548,547 |
| Merck & Co., Inc. | | 15,027 | 1,735,168 |
| Microsoft Corp. | | 24,327 | 7,474,714 |
| Mondelez International, Inc. | | 17,574 | 1,348,277 |
| MSCI, Inc. | | 927 | 447,231 |
| Nestle SA (Reg. S) | | 13,078 | 1,677,771 |
| NextEra Energy, Inc. | | 16,858 | 1,291,829 |
| PG&E Corp. (a) | | 17,858 | 305,550 |
| Philip Morris International, Inc. | | 9,869 | 986,604 |
| Phillips 66 Co. | | 6,985 | 691,515 |
| PNC Financial Services Group, Inc. | | 11,238 | 1,463,750 |
| Procter & Gamble Co. | | 12,014 | 1,878,749 |
| Roche Holding AG (participation certificate) | | 7,760 | 2,429,968 |
| Sanofi SA | | 16,195 | 1,745,307 |
| T-Mobile U.S., Inc. (a) | | 14,098 | 2,028,702 |
| Target Corp. | | 5,301 | 836,233 |
| The Coca-Cola Co. | | 27,564 | 1,768,231 |
| The Travelers Companies, Inc. | | 7,285 | 1,319,605 |
| TJX Companies, Inc. | | 24,006 | 1,892,153 |
| United Parcel Service, Inc. Class B | | 4,501 | 809,325 |
| UnitedHealth Group, Inc. | | 5,620 | 2,765,546 |
| Valero Energy Corp. | | 5,176 | 593,532 |
| Verizon Communications, Inc. | | 36,377 | 1,412,519 |
| Vistra Corp. | | 33,850 | 807,661 |
| Walmart, Inc. | | 12,031 | 1,816,320 |
| WEC Energy Group, Inc. | | 5,550 | 533,744 |
| Wells Fargo & Co. | | 38,754 | 1,540,472 |
TOTAL UNITED STATES OF AMERICA | | | 101,874,042 |
| Zambia - 0.0% | | | |
| First Quantum Minerals Ltd. | | 300 | 7,289 |
| TOTAL COMMON STOCKS (Cost $129,676,344) | | | 158,536,895 |
| | | | |
| Money Market Funds - 5.6% |
| | | Shares | Value ($) |
Fidelity Cash Central Fund 4.88% (d) (Cost $9,411,300) | | 9,409,418 | 9,411,300 |
| | | | |
| TOTAL INVESTMENT IN SECURITIES - 99.8% (Cost $139,087,644) | 167,948,195 |
NET OTHER ASSETS (LIABILITIES) - 0.2% | 375,753 |
| NET ASSETS - 100.0% | 168,323,948 |
| | |
Legend
| (b) | Restricted securities (including private placements) - Investment in securities not registered under the Securities Act of 1933 (excluding 144A issues). At the end of the period, the value of restricted securities (excluding 144A issues) amounted to $238,350 or 0.1% of net assets. |
| (d) | Affiliated fund that is generally available only to investment companies and other accounts managed by Fidelity Investments. The rate quoted is the annualized seven-day yield of the fund at period end. A complete unaudited listing of the fund's holdings as of its most recent quarter end is available upon request. In addition, each Fidelity Central Fund's financial statements are available on the SEC's website or upon request. |
| Additional information on each restricted holding is as follows: |
| Security | Acquisition Date | Acquisition Cost ($) |
| Starling Bank Ltd. Series D | 6/18/21 - 4/05/22 | 130,682 |
| | | |
Affiliated Central Funds
Fiscal year to date information regarding the Fund's investments in Fidelity Central Funds, including the ownership percentage, is presented below.
| Affiliate | Value, beginning of period ($) | Purchases ($) | Sales Proceeds ($) | Dividend Income ($) | Realized Gain (loss) ($) | Change in Unrealized appreciation (depreciation) ($) | Value, end of period ($) | % ownership, end of period |
| Fidelity Cash Central Fund 4.88% | 4,132,184 | 32,902,599 | 27,623,483 | 172,864 | - | - | 9,411,300 | 0.0% |
| Fidelity Securities Lending Cash Central Fund 4.88% | - | 1,589,043 | 1,589,043 | 21 | - | - | - | 0.0% |
| Total | 4,132,184 | 34,491,642 | 29,212,526 | 172,885 | - | - | 9,411,300 | |
| | | | | | | | | |
Amounts in the dividend income column in the above table include any capital gain distributions from underlying funds, which are presented in the corresponding line item in the Statement of Operations, if applicable.
Amounts in the dividend income column for Fidelity Securities Lending Cash Central Fund represents the income earned on investing cash collateral, less rebates paid to borrowers and any lending agent fees associated with the loan, plus any premium payments received for lending certain types of securities.
Amounts included in the purchases and sales proceeds columns may include in-kind transactions, if applicable.
Investment Valuation
The following is a summary of the inputs used, as of April 30, 2023, involving the Fund's assets and liabilities carried at fair value. The inputs or methodology used for valuing securities may not be an indication of the risk associated with investing in those securities. For more information on valuation inputs, and their aggregation into the levels used below, please refer to the Investment Valuation section in the accompanying Notes to Financial Statements.
| Valuation Inputs at Reporting Date: |
| Description | Total ($) | Level 1 ($) | Level 2 ($) | Level 3 ($) |
Investments in Securities: | | | | |
|
| Equities: | | | | |
Communication Services | 12,329,486 | 8,675,797 | 3,653,689 | - |
Consumer Discretionary | 12,986,561 | 6,267,862 | 6,718,699 | - |
Consumer Staples | 21,197,322 | 16,676,846 | 4,520,476 | - |
Energy | 8,626,561 | 8,032,378 | 594,183 | - |
Financials | 17,200,306 | 15,683,672 | 1,278,284 | 238,350 |
Health Care | 23,716,149 | 18,366,183 | 5,349,966 | - |
Industrials | 14,140,116 | 7,843,911 | 6,296,205 | - |
Information Technology | 32,005,972 | 25,412,953 | 6,593,019 | - |
Materials | 8,357,678 | 6,074,250 | 2,283,428 | - |
Real Estate | 2,116,142 | 2,116,142 | - | - |
Utilities | 5,860,602 | 5,860,602 | - | - |
|
| Money Market Funds | 9,411,300 | 9,411,300 | - | - |
| Total Investments in Securities: | 167,948,195 | 130,421,896 | 37,287,949 | 238,350 |
| Statement of Assets and Liabilities |
| | | | April 30, 2023 (Unaudited) |
| | | | | |
| Assets | | | | |
| Investment in securities, at value - See accompanying schedule: | | | | |
Unaffiliated issuers (cost $129,676,344) | $ | 158,536,895 | | |
Fidelity Central Funds (cost $9,411,300) | | 9,411,300 | | |
| | | | | |
| | | | | |
| Total Investment in Securities (cost $139,087,644) | | | $ | 167,948,195 |
| Cash | | | | 55,757 |
| Foreign currency held at value (cost $28,204) | | | | 27,398 |
| Receivable for fund shares sold | | | | 103,082 |
| Dividends receivable | | | | 273,878 |
| Reclaims receivable | | | | 164,784 |
| Distributions receivable from Fidelity Central Funds | | | | 35,564 |
| Prepaid expenses | | | | 80 |
| Other receivables | | | | 444 |
Total assets | | | | 168,609,182 |
| Liabilities | | | | |
| Payable for investments purchased | $ | 7,287 | | |
| Payable for fund shares redeemed | | 94,959 | | |
| Accrued management fee | | 94,147 | | |
| Transfer agent fee payable | | 23,701 | | |
| Other affiliated payables | | 6,940 | | |
| Other payables and accrued expenses | | 58,200 | | |
| Total Liabilities | | | | 285,234 |
| Net Assets | | | $ | 168,323,948 |
| Net Assets consist of: | | | | |
| Paid in capital | | | $ | 149,657,514 |
| Total accumulated earnings (loss) | | | | 18,666,434 |
| Net Assets | | | $ | 168,323,948 |
Net Asset Value , offering price and redemption price per share ($168,323,948 ÷ 9,838,850 shares) | | | $ | 17.11 |
| Statement of Operations |
| | | | Six months ended April 30, 2023 (Unaudited) |
| Investment Income | | | | |
| Dividends | | | $ | 1,977,243 |
| Income from Fidelity Central Funds (including $21 from security lending) | | | | 172,885 |
| Income before foreign taxes withheld | | | $ | 2,150,128 |
| Less foreign taxes withheld | | | | (110,967) |
| Total Income | | | | 2,039,161 |
| Expenses | | | | |
| Management fee | $ | 532,387 | | |
| Transfer agent fees | | 151,581 | | |
| Accounting fees | | 39,200 | | |
| Custodian fees and expenses | | 11,773 | | |
| Independent trustees' fees and expenses | | 505 | | |
| Registration fees | | 21,225 | | |
| Audit | | 44,397 | | |
| Legal | | 317 | | |
| Miscellaneous | | 392 | | |
| Total expenses before reductions | | 801,777 | | |
| Expense reductions | | (3,699) | | |
| Total expenses after reductions | | | | 798,078 |
| Net Investment income (loss) | | | | 1,241,083 |
| Realized and Unrealized Gain (Loss) | | | | |
| Net realized gain (loss) on: | | | | |
| Investment Securities: | | | | |
| Unaffiliated issuers | | (480,932) | | |
| Foreign currency transactions | | (21,326) | | |
| Total net realized gain (loss) | | | | (502,258) |
| Change in net unrealized appreciation (depreciation) on: | | | | |
| Investment Securities: | | | | |
| Unaffiliated issuers (net of decrease in deferred foreign taxes of $7,232) | | 14,213,778 | | |
| Assets and liabilities in foreign currencies | | 10,196 | | |
| Total change in net unrealized appreciation (depreciation) | | | | 14,223,974 |
| Net gain (loss) | | | | 13,721,716 |
| Net increase (decrease) in net assets resulting from operations | | | $ | 14,962,799 |
| Statement of Changes in Net Assets |
| |
| | Six months ended April 30, 2023 (Unaudited) | | Year ended October 31, 2022 |
| Increase (Decrease) in Net Assets | | | | |
| Operations | | | | |
| Net investment income (loss) | $ | 1,241,083 | $ | 2,066,441 |
| Net realized gain (loss) | | (502,258) | | (10,168,014) |
| Change in net unrealized appreciation (depreciation) | | 14,223,974 | | (14,280,757) |
| Net increase (decrease) in net assets resulting from operations | | 14,962,799 | | (22,382,330) |
| Distributions to shareholders | | (881,894) | | (11,336,009) |
| Share transactions | | | | |
| Proceeds from sales of shares | | 44,362,002 | | 189,149,366 |
| Reinvestment of distributions | | 788,346 | | 10,521,484 |
| Cost of shares redeemed | | (30,262,337) | | (119,515,550) |
Net increase (decrease) in net assets resulting from share transactions | | 14,888,011 | | 80,155,300 |
| Total increase (decrease) in net assets | | 28,968,916 | | 46,436,961 |
| | | | | |
| Net Assets | | | | |
| Beginning of period | | 139,355,032 | | 92,918,071 |
| End of period | $ | 168,323,948 | $ | 139,355,032 |
| | | | | |
| Other Information | | | | |
| Shares | | | | |
| Sold | | 2,693,788 | | 10,942,111 |
| Issued in reinvestment of distributions | | 47,780 | | 597,381 |
| Redeemed | | (1,846,999) | | (7,288,853) |
| Net increase (decrease) | | 894,569 | | 4,250,639 |
| | | | | |
Financial Highlights
| Fidelity® Global Equity Income Fund |
| |
| | Six months ended (Unaudited) April 30, 2023 | | Years ended October 31, 2022 | | 2021 | | 2020 | | 2019 | | 2018 |
Selected Per-Share Data | | | | | | | | | | | | |
| Net asset value, beginning of period | $ | 15.58 | $ | 19.80 | $ | 15.12 | $ | 14.64 | $ | 13.53 | $ | 14.21 |
| Income from Investment Operations | | | | | | | | | | | | |
Net investment income (loss) A,B | | .13 | | .20 | | .15 | | .16 | | .23 | | .25 |
| Net realized and unrealized gain (loss) | | 1.49 | | (2.21) | | 5.07 | | .48 | | 1.63 | | (.50) |
| Total from investment operations | | 1.62 | | (2.01) | | 5.22 | | .64 | | 1.86 | | (.25) |
| Distributions from net investment income | | (.09) | | (.17) | | (.16) | | (.15) | | (.24) | | (.25) |
| Distributions from net realized gain | | - | | (2.04) | | (.38) | | (.01) | | (.51) | | (.18) |
| Total distributions | | (.09) | | (2.21) | | (.54) | | (.16) | | (.75) | | (.43) |
Redemption fees added to paid in capital A | | - | | - | | - | | - | | - | | - C |
| Net asset value, end of period | $ | 17.11 | $ | 15.58 | $ | 19.80 | $ | 15.12 | $ | 14.64 | $ | 13.53 |
Total Return D,E | | 10.43% | | (11.45)% | | 35.09% | | 4.44% | | 14.60% | | (1.88)% |
Ratios to Average Net Assets B,F,G | | | | | | | | | | | | |
| Expenses before reductions | | 1.02% H | | .98% | | 1.02% | | 1.09% | | 1.09% | | 1.06% |
| Expenses net of fee waivers, if any | | 1.02% H | | .98% | | 1.02% | | 1.09% | | 1.09% | | 1.06% |
| Expenses net of all reductions | | 1.02% H | | .98% | | 1.02% | | 1.09% | | 1.08% | | 1.05% |
| Net investment income (loss) | | 1.58% H | | 1.22% | | .84% | | 1.08% | | 1.72% | | 1.75% |
| Supplemental Data | | | | | | | | | | | | |
| Net assets, end of period (000 omitted) | $ | 168,324 | $ | 139,355 | $ | 92,918 | $ | 66,715 | $ | 67,764 | $ | 68,532 |
Portfolio turnover rate I | | 32% H | | 61% | | 43% | | 48% | | 20% J | | 34% |
A Calculated based on average shares outstanding during the period.
B Net investment income (loss) is affected by the timing of the declaration of dividends by any underlying mutual funds or exchange-traded funds (ETFs). Net investment income (loss) of any mutual funds or ETFs is not included in the Fund's net investment income (loss) ratio.
C Amount represents less than $.005 per share.
D Total returns for periods of less than one year are not annualized.
E Total returns would have been lower if certain expenses had not been reduced during the applicable periods shown.
F Fees and expenses of any underlying mutual funds or exchange-traded funds (ETFs) are not included in the Fund's expense ratio. The Fund indirectly bears its proportionate share of these expenses. For additional expense information related to investments in Fidelity Central Funds, please refer to the "Investments in Fidelity Central Funds" note found in the Notes to Financial Statements section of the most recent Annual or Semi-Annual report.
G Expense ratios reflect operating expenses of the class. Expenses before reductions do not reflect amounts reimbursed, waived, or reduced through arrangements with the investment adviser, brokerage services, or other offset arrangements, if applicable, and do not represent the amount paid by the class during periods when reimbursements, waivers or reductions occur.
H Annualized.
I Amount does not include the portfolio activity of any underlying mutual funds or exchange-traded funds (ETFs).
J Portfolio turnover rate excludes securities received or delivered in-kind.
For the period ended April 30, 2023
1. Organization.
Fidelity Global Equity Income Fund (the Fund) is a fund of Fidelity Investment Trust (the Trust) and is authorized to issue an unlimited number of shares. Share transactions on the Statement of Changes in Net Assets may contain exchanges between affiliated funds. The Trust is registered under the Investment Company Act of 1940, as amended (the 1940 Act), as an open-end management investment company organized as a Massachusetts business trust.
2. Investments in Fidelity Central Funds.
Funds may invest in Fidelity Central Funds, which are open-end investment companies generally available only to other investment companies and accounts managed by the investment adviser and its affiliates. The Schedule of Investments lists any Fidelity Central Funds held as an investment as of period end, but does not include the underlying holdings of each Fidelity Central Fund. An investing fund indirectly bears its proportionate share of the expenses of the underlying Fidelity Central Funds.
Based on its investment objective, each Fidelity Central Fund may invest or participate in various investment vehicles or strategies that are similar to those of the investing fund. These strategies are consistent with the investment objectives of the investing fund and may involve certain economic risks which may cause a decline in value of each of the Fidelity Central Funds and thus a decline in the value of the investing fund.
| Fidelity Central Fund | Investment Manager | Investment Objective | Investment Practices | Expense Ratio A |
| Fidelity Money Market Central Funds | Fidelity Management & Research Company LLC (FMR) | Each fund seeks to obtain a high level of current income consistent with the preservation of capital and liquidity. | Short-term Investments | Less than .005% |
A Expenses expressed as a percentage of average net assets and are as of each underlying Central Fund's most recent annual or semi-annual shareholder report.
A complete unaudited list of holdings for each Fidelity Central Fund is available upon request or at the Securities and Exchange Commission website at www.sec.gov. In addition, the financial statements of the Fidelity Central Funds which contain the significant accounting policies (including investment valuation policies) of those funds, and are not covered by the Report of Independent Registered Public Accounting Firm, are available on the Securities and Exchange Commission website or upon request.
3. Significant Accounting Policies.
The Fund is an investment company and applies the accounting and reporting guidance of the Financial Accounting Standards Board (FASB) Accounting Standards Codification Topic 946 Financial Services - Investment Companies . The financial statements have been prepared in conformity with accounting principles generally accepted in the United States of America (GAAP), which require management to make certain estimates and assumptions at the date of the financial statements. Actual results could differ from those estimates. Subsequent events, if any, through the date that the financial statements were issued have been evaluated in the preparation of the financial statements. The Fund's Schedule of Investments lists any underlying mutual funds or exchange-traded funds (ETFs) but does not include the underlying holdings of these funds. The following summarizes the significant accounting policies of the Fund:
Investment Valuation. Investments are valued as of 4:00 p.m. Eastern time on the last calendar day of the period. The Board of Trustees (the Board) has designated the Fund's investment adviser as the valuation designee responsible for the fair valuation function and performing fair value determinations as needed. The investment adviser has established a Fair Value Committee (the Committee) to carry out the day-to-day fair valuation responsibilities and has adopted policies and procedures to govern the fair valuation process and the activities of the Committee. In accordance with these fair valuation policies and procedures, which have been approved by the Board, the Fund attempts to obtain prices from one or more third party pricing services or brokers to value its investments. When current market prices, quotations or currency exchange rates are not readily available or reliable, investments will be fair valued in good faith by the Committee, in accordance with the policies and procedures. Factors used in determining fair value vary by investment type and may include market or investment specific events, transaction data, estimated cash flows, and market observations of comparable investments. The frequency that the fair valuation procedures are used cannot be predicted and they may be utilized to a significant extent. The Committee manages the Fund's fair valuation practices and maintains the fair valuation policies and procedures. The Fund's investment adviser reports to the Board information regarding the fair valuation process and related material matters.
The Fund categorizes the inputs to valuation techniques used to value its investments into a disclosure hierarchy consisting of three levels as shown below:
Level 1 - unadjusted quoted prices in active markets for identical investments
Level 2 - other significant observable inputs (including quoted prices for similar investments, interest rates, prepayment speeds, etc.)
Level 3 - unobservable inputs (including the Fund's own assumptions based on the best information available)
Valuation techniques used to value the Fund's investments by major category are as follows:
Equity securities, including restricted securities, for which market quotations are readily available, are valued at the last reported sale price or official closing price as reported by a third party pricing service on the primary market or exchange on which they are traded and are categorized as Level 1 in the hierarchy. In the event there were no sales during the day or closing prices are not available, securities are valued at the last quoted bid price or may be valued using the last available price and are generally categorized as Level 2 in the hierarchy. For foreign equity securities, when market or security specific events arise, comparisons to the valuation of American Depositary Receipts (ADRs), futures contracts, ETFs and certain indexes as well as quoted prices for similar securities may be used and would be categorized as Level 2 in the hierarchy. For equity securities, including restricted securities, where observable inputs are limited, assumptions about market activity and risk are used and these securities may be categorized as Level 3 in the hierarchy.
Investments in open-end mutual funds, including the Fidelity Central Funds, are valued at their closing net asset value (NAV) each business day and are categorized as Level 1 in the hierarchy.
Changes in valuation techniques may result in transfers in or out of an assigned level within the disclosure hierarchy. The aggregate value of investments by input level as of April 30, 2023 is included at the end of the Fund's Schedule of Investments.
Foreign Currency. Certain Funds may use foreign currency contracts to facilitate transactions in foreign-denominated securities. Gains and losses from these transactions may arise from changes in the value of the foreign currency or if the counterparties do not perform under the contracts' terms.
Foreign-denominated assets, including investment securities, and liabilities are translated into U.S. dollars at the exchange rates at period end. Purchases and sales of investment securities, income and dividends received, and expenses denominated in foreign currencies are translated into U.S. dollars at the exchange rate in effect on the transaction date.
The effects of exchange rate fluctuations on investments are included with the net realized and unrealized gain (loss) on investment securities. Other foreign currency transactions resulting in realized and unrealized gain (loss) are disclosed separately.
Investment Transactions and Income. For financial reporting purposes, the Fund's investment holdings and NAV include trades executed through the end of the last business day of the period. The NAV per share for processing shareholder transactions is calculated as of the close of business of the New York Stock Exchange (NYSE), normally 4:00 p.m. Eastern time and includes trades executed through the end of the prior business day. Gains and losses on securities sold are determined on the basis of identified cost. Commissions paid to certain brokers with whom the investment adviser, or its affiliates, places trades on behalf of a fund include an amount in addition to trade execution, which may be rebated back to a fund. Any such rebates are included in net realized gain (loss) on investments in the Statement of Operations. Dividend income is recorded on the ex-dividend date, except for certain dividends from foreign securities where the ex-dividend date may have passed, which are recorded as soon as the Fund is informed of the ex-dividend date. Non-cash dividends included in dividend income, if any, are recorded at the fair market value of the securities received. Income and capital gain distributions from Fidelity Central Funds, if any, are recorded on the ex-dividend date. Certain distributions received by the Fund represent a return of capital or capital gain. The Fund determines the components of these distributions subsequent to the ex-dividend date, based upon receipt of tax filings or other correspondence relating to the underlying investment. These distributions are recorded as a reduction of cost of investments and/or as a realized gain. Investment income is recorded net of foreign taxes withheld where recovery of such taxes is uncertain. Funds may file withholding tax reclaims in certain jurisdictions to recover a portion of amounts previously withheld. Any withholding tax reclaims income is included in the Statement of Operations in foreign taxes withheld. Any receivables for withholding tax reclaims are included in the Statement of Assets and Liabilities in reclaims receivable.
Expenses. Expenses directly attributable to a fund are charged to that fund. Expenses attributable to more than one fund are allocated among the respective funds on the basis of relative net assets or other appropriate methods. Expenses included in the accompanying financial statements reflect the expenses of that fund and do not include any expenses associated with any underlying mutual funds or exchange-traded funds. Although not included in a fund's expenses, a fund indirectly bears its proportionate share of these expenses through the net asset value of each underlying mutual fund or exchange-traded fund. Expense estimates are accrued in the period to which they relate and adjustments are made when actual amounts are known.
Income Tax Information and Distributions to Shareholders. Each year, the Fund intends to qualify as a regulated investment company under Subchapter M of the Internal Revenue Code, including distributing substantially all of its taxable income and realized gains. As a result, no provision for U.S. Federal income taxes is required. The Fund files a U.S. federal tax return, in addition to state and local tax returns as required. The Fund's federal income tax returns are subject to examination by the Internal Revenue Service (IRS) for a period of three fiscal years after they are filed. State and local tax returns may be subject to examination for an additional fiscal year depending on the jurisdiction. Foreign taxes are provided for based on the Fund's understanding of the tax rules and rates that exist in the foreign markets in which it invests. The Fund is subject to a tax imposed on capital gains by certain countries in which it invests. An estimated deferred tax liability for net unrealized appreciation on the applicable securities is included in Other payables and accrued expenses on the Statement of Assets & Liabilities.
Distributions are declared and recorded on the ex-dividend date. Income and capital gain distributions are determined in accordance with income tax regulations, which may differ from GAAP.
Capital accounts within the financial statements are adjusted for permanent book-tax differences. These adjustments have no impact on net assets or the results of operations. Capital accounts are not adjusted for temporary book-tax differences which will reverse in a subsequent period.
Book-tax differences are primarily due to foreign currency transactions, certain foreign taxes, capital loss carryforwards and losses deferred due to wash sales.
As of period end, the cost and unrealized appreciation (depreciation) in securities, and derivatives if applicable, for federal income tax purposes were as follows:
| Gross unrealized appreciation | $35,328,823 |
| Gross unrealized depreciation | (7,367,607) |
| Net unrealized appreciation (depreciation) | $27,961,216 |
| Tax cost | $139,986,979 |
Capital loss carryforwards are only available to offset future capital gains of the Fund to the extent provided by regulations and may be limited. The capital loss carryforward information presented below, including any applicable limitation, is estimated as of prior fiscal period end and is subject to adjustment.
Short-term | $(9,095,365) |
Long-term | (477,434) |
| Total capital loss carryforward | $(9,572,799) |
Restricted Securities (including Private Placements). Funds may invest in securities that are subject to legal or contractual restrictions on resale. These securities generally may be resold in transactions exempt from registration or to the public if the securities are registered. Disposal of these securities may involve time-consuming negotiations and expense, and prompt sale at an acceptable price may be difficult. Information regarding restricted securities held at period end is included at the end of the Schedule of Investments, if applicable.
4. Purchases and Sales of Investments.
Purchases and sales of securities, other than short-term securities and in-kind transactions, as applicable, are noted in the table below.
| | Purchases ($) | Sales ($) |
| Fidelity Global Equity Income Fund | 33,469,670 | 24,070,237 |
5. Fees and Other Transactions with Affiliates.
Management Fee. Fidelity Management & Research Company LLC (the investment adviser) and its affiliates provide the Fund with investment management related services for which the Fund pays a monthly management fee. The management fee is the sum of an individual fund fee rate that is based on an annual rate of .45% of the Fund's average net assets and an annualized group fee rate that averaged .23% during the period. The group fee rate is based upon the monthly average net assets of a group of registered investment companies with which the investment adviser has management contracts. The group fee rate decreases as assets under management increase and increases as assets under management decrease. For the reporting period, the total annualized management fee rate was .68% of the Fund's average net assets.
Transfer Agent Fees. Fidelity Investments Institutional Operations Company LLC (FIIOC), an affiliate of the investment adviser, is the Fund's transfer, dividend disbursing and shareholder servicing agent. FIIOC receives account fees and asset-based fees that vary according to account size and type of account. FIIOC pays for typesetting, printing and mailing of shareholder reports, except proxy statements. For the period, the transfer agent fees were equivalent to an annualized rate of .19% of average net assets.
Accounting Fees. Fidelity Service Company, Inc. (FSC), an affiliate of the investment adviser, maintains the Fund's accounting records. The accounting fee is based on the level of average net assets for each month. For the period, the fees were equivalent to the following annualized rates:
| | % of Average Net Assets |
| Fidelity Global Equity Income Fund | .05 |
Brokerage Commissions. A portion of portfolio transactions were placed with brokerage firms which are affiliates of the investment adviser. Brokerage commissions are included in net realized gain (loss) and change in net unrealized appreciation (depreciation) in the Statement of Operations. The commissions paid to these affiliated firms were as follows:
| | Amount |
| Fidelity Global Equity Income Fund | $215 |
Interfund Trades. Funds may purchase from or sell securities to other Fidelity Funds under procedures adopted by the Board. The procedures have been designed to ensure these interfund trades are executed in accordance with Rule 17a-7 of the 1940 Act. Any interfund trades are included within the respective purchases and sales amounts shown in the Purchases and Sales of Investments note. Interfund trades during the period are noted in the table below.
| | Purchases ($) | Sales ($) | Realized Gain (Loss) ($) |
| Fidelity Global Equity Income Fund | 2,633,613 | 5,505,028 | 14,159 |
6. Committed Line of Credit.
Certain Funds participate with other funds managed by the investment adviser or an affiliate in a $4.25 billion credit facility (the "line of credit") to be utilized for temporary or emergency purposes to fund shareholder redemptions or for other short-term liquidity purposes. The participating funds have agreed to pay commitment fees on their pro-rata portion of the line of credit, which are reflected in Miscellaneous expenses on the Statement of Operations, and are listed below. During the period, there were no borrowings on this line of credit.
| | Amount |
| Fidelity Global Equity Income Fund | $151 |
7. Security Lending.
Funds lend portfolio securities from time to time in order to earn additional income. Lending agents are used, including National Financial Services (NFS), an affiliate of the investment adviser. Pursuant to a securities lending agreement, NFS will receive a fee, which is capped at 9.9% of a fund's daily lending revenue, for its services as lending agent. A fund may lend securities to certain qualified borrowers, including NFS. On the settlement date of the loan, a fund receives collateral (in the form of U.S. Treasury obligations, letters of credit and/or cash) against the loaned securities and maintains collateral in an amount not less than 100% of the market value of the loaned securities during the period of the loan. The market value of the loaned securities is determined at the close of business of a fund and any additional required collateral is delivered to a fund on the next business day. A fund or borrower may terminate the loan at any time, and if the borrower defaults on its obligation to return the securities loaned because of insolvency or other reasons, a fund may apply collateral received from the borrower against the obligation. A fund may experience delays and costs in recovering the securities loaned. Any cash collateral received is invested in the Fidelity Securities Lending Cash Central Fund. Any loaned securities are identified as such in the Schedule of Investments, and the value of loaned securities and cash collateral at period end, as applicable, are presented in the Statement of Assets and Liabilities. Security lending income represents the income earned on investing cash collateral, less rebates paid to borrowers and any lending agent fees associated with the loan, plus any premium payments received for lending certain types of securities. Security lending income is presented in the Statement of Operations as a component of income from Fidelity Central Funds. Affiliated security lending activity, if any, was as follows:
| | Total Security Lending Fees Paid to NFS | Security Lending Income From Securities Loaned to NFS | Value of Securities Loaned to NFS at Period End |
| Fidelity Global Equity Income Fund | $2 | $- | $- |
8. Expense Reductions.
Through arrangements with the Fund's custodian, credits realized as a result of certain uninvested cash balances were used to reduce the Fund's expenses by $58.
In addition, during the period the investment adviser or an affiliate reimbursed and/or waived a portion of operating expenses in the amount of $3,641.
9. Other.
A fund's organizational documents provide former and current trustees and officers with a limited indemnification against liabilities arising in connection with the performance of their duties to the fund. In the normal course of business, a fund may also enter into contracts that provide general indemnifications. A fund's maximum exposure under these arrangements is unknown as this would be dependent on future claims that may be made against a fund. The risk of material loss from such claims is considered remote.
10. Risk and Uncertainties.
Many factors affect a fund's performance. Developments that disrupt global economies and financial markets, such as pandemics, epidemics, outbreaks of infectious diseases, war, terrorism, and environmental disasters, may significantly affect a fund's investment performance. The effects of these developments to a fund will be impacted by the types of securities in which a fund invests, the financial condition, industry, economic sector, and geographic location of an issuer, and a fund's level of investment in the securities of that issuer. Significant concentrations in security types, issuers, industries, sectors, and geographic locations may magnify the factors that affect a fund's performance.
As a shareholder, you incur two types of costs: (1) transaction costs, which may include sales charges (loads) on purchase payments or redemption proceeds, as applicable and (2) ongoing costs, which generally include management fees, distribution and/or service (12b-1) fees and other Fund expenses. This Example is intended to help you understand your ongoing costs (in dollars) of investing in a fund and to compare these costs with the ongoing costs of investing in other mutual funds.
| The Example is based on an investment of $1,000 invested at the beginning of the period and held for the entire period (November 1, 2022 to April 30, 2023). |
Actual Expenses
The first line of the accompanying table provides information about actual account values and actual expenses. You may use the information in this line, together with the amount you invested, to estimate the expenses that you paid over the period. Simply divide your account value by $1,000.00 (for example, an $8,600 account value divided by $1,000.00 = 8.6), then multiply the result by the number in the first line for a class/Fund under the heading entitled "Expenses Paid During Period" to estimate the expenses you paid on your account during this period. If any fund is a shareholder of any underlying mutual funds or exchange-traded funds (ETFs) (the Underlying Funds), such fund indirectly bears its proportional share of the expenses of the Underlying Funds in addition to the direct expenses incurred presented in the table. These fees and expenses are not included in the annualized expense ratio used to calculate the expense estimate in the table below.
Hypothetical Example for Comparison Purposes
The second line of the accompanying table provides information about hypothetical account values and hypothetical expenses based on the actual expense ratio and an assumed rate of return of 5% per year before expenses, which is not the actual return. The hypothetical account values and expenses may not be used to estimate the actual ending account balance or expenses you paid for the period. You may use this information to compare the ongoing costs of investing in the Fund and other funds. To do so, compare this 5% hypothetical example with the 5% hypothetical examples that appear in the shareholder reports of the other funds. If any fund is a shareholder of any Underlying Funds, such fund indirectly bears its proportional share of the expenses of the Underlying Funds in addition to the direct expenses as presented in the table. These fees and expenses are not included in the annualized expense ratio used to calculate the expense estimate in the table below.
Please note that the expenses shown in the table are meant to highlight your ongoing costs only and do not reflect any transaction costs. Therefore, the second line of the table is useful in comparing ongoing costs only, and will not help you determine the relative total costs of owning different funds. In addition, if these transactional costs were included, your costs would have been higher.
| | | | | Annualized Expense Ratio- A | | Beginning Account Value November 1, 2022 | | Ending Account Value April 30, 2023 | | Expenses Paid During Period- C November 1, 2022 to April 30, 2023 |
| | | | | | | | | | |
| Fidelity® Global Equity Income Fund | | | | 1.02% | | | | | | |
| Actual | | | | | | $ 1,000 | | $ 1,104.30 | | $ 5.32 |
Hypothetical- B | | | | | | $ 1,000 | | $ 1,019.74 | | $ 5.11 |
| |
A Annualized expense ratio reflects expenses net of applicable fee waivers.
B 5% return per year before expenses
C Expenses are equal to the annualized expense ratio, multiplied by the average account value over the period, multiplied by 181/ 365 (to reflect the one-half year period). The fees and expenses of any Underlying Funds are not included in each annualized expense ratio.
The Securities and Exchange Commission adopted Rule 22e-4 under the Investment Company Act of 1940 (the Liquidity Rule) to promote effective liquidity risk management throughout the open-end investment company industry, thereby reducing the risk that funds will be unable to meet their redemption obligations and mitigating dilution of the interests of fund shareholders.
The Fund has adopted and implemented a liquidity risk management program (the Program) reasonably designed to assess and manage the Fund's liquidity risk and to comply with the requirements of the Liquidity Rule. The Fund's Board of Trustees (the Board) has designated the Fund's investment adviser as administrator of the Program. The Fidelity advisers have established a Liquidity Risk Management Committee (the LRM Committee) to manage the Program for each of the Fidelity Funds. The LRM Committee monitors the adequacy and effectiveness of implementation of the Program and on a periodic basis assesses each Fund's liquidity risk based on a variety of factors including (1) the Fund's investment strategy, (2) portfolio liquidity and cash flow projections during normal and reasonably foreseeable stressed conditions, (3) shareholder redemptions, (4) borrowings and other funding sources and (5) certain factors specific to ETFs including the effect of the Fund's prices and spreads, market participants, and basket compositions on the overall liquidity of the Fund's portfolio, as applicable.
In accordance with the Program, each of the Fund's portfolio investments is classified into one of four defined liquidity categories based on a determination of a reasonable expectation for how long it would take to convert the investment to cash (or sell or dispose of the investment) without significantly changing its market value.
- Highly liquid investments - cash or convertible to cash within three business days or less
- Moderately liquid investments - convertible to cash in three to seven calendar days
- Less liquid investments - can be sold or disposed of, but not settled, within seven calendar days
- Illiquid investments - cannot be sold or disposed of within seven calendar days
Liquidity classification determinations take into account a variety of factors including various market, trading and investment-specific considerations, as well as market depth, and generally utilize analysis from a third-party liquidity metrics service.
The Liquidity Rule places a 15% limit on a fund's illiquid investments and requires funds that do not primarily hold assets that are highly liquid investments to determine and maintain a minimum percentage of the fund's net assets to be invested in highly liquid investments (highly liquid investment minimum or HLIM). The Program includes provisions reasonably designed to comply with the 15% limit on illiquid investments and for determining, periodically reviewing and complying with the HLIM requirement as applicable.
At a recent meeting of the Fund's Board of Trustees, the LRM Committee provided a written report to the Board pertaining to the operation, adequacy, and effectiveness of the Program for the period December 1, 2021 through November 30, 2022. The report concluded that the Program is operating effectively and is reasonably designed to assess and manage the Fund's liquidity risk.
1.938166.110
GED-SANN-0623
Fidelity® Emerging Markets Discovery Fund
Fidelity® Total Emerging Markets Fund
Semi-Annual Report
April 30, 2023
Includes Fidelity and Fidelity Advisor share classes
Contents
To view a fund's proxy voting guidelines and proxy voting record for the 12-month period ended June 30, visit http://www.fidelity.com/proxyvotingresults or visit the Securities and Exchange Commission's (SEC) web site at http://www.sec.gov.
You may also call 1-800-544-8544 if you're an individual investing directly with Fidelity, call 1-800-835-5092 if you're a plan sponsor or participant with Fidelity as your recordkeeper or call 1-877-208-0098 on institutional accounts or if you're an advisor or invest through one to request a free copy of the proxy voting guidelines.
Standard & Poor's, S&P and S&P 500 are registered service marks of The McGraw-Hill Companies, Inc. and have been licensed for use by Fidelity Distributors Corporation.
Other third-party marks appearing herein are the property of their respective owners.
All other marks appearing herein are registered or unregistered trademarks or service marks of FMR LLC or an affiliated company. © 2023 FMR LLC. All rights reserved.
This report and the financial statements contained herein are submitted for the general information of the shareholders of the Funds. This report is not authorized for distribution to prospective investors in the Funds unless preceded or accompanied by an effective prospectus.
A fund files its complete schedule of portfolio holdings with the SEC for the first and third quarters of each fiscal year on Form N-PORT. Forms N-PORT are available on the SEC's web site at http://www.sec.gov. A fund's Forms N-PORT may be reviewed and copied at the SEC's Public Reference Room in Washington, DC. Information regarding the operation of the SEC's Public Reference Room may be obtained by calling 1-800-SEC-0330.
For a complete list of a fund's portfolio holdings, view the most recent holdings listing, semiannual report, or annual report on Fidelity's web site at http://www.fidelity.com, http://www.institutional.fidelity.com, or http://www.401k.com, as applicable.
NOT FDIC INSURED •MAY LOSE VALUE •NO BANK GUARANTEE
Neither the Funds nor Fidelity Distributors Corporation is a bank.
Top Holdings (% of Fund's net assets) |
| |
| Cyient Ltd. (India, Software) | 1.5 | |
| Grupo Comercial Chedraui S.A.B. de CV (Mexico, Consumer Staples Distribution & Retail) | 1.4 | |
| Db Insurance Co. Ltd. (Korea (South), Insurance) | 1.4 | |
| Aldar Properties PJSC (United Arab Emirates, Real Estate Management & Development) | 1.4 | |
| Saudi Airlines Catering Co. (Saudi Arabia, Commercial Services & Supplies) | 1.4 | |
| Unimicron Technology Corp. (Taiwan, Electronic Equipment, Instruments & Components) | 1.4 | |
| Bupa Arabia for Cooperative Insurance Co. (Saudi Arabia, Insurance) | 1.3 | |
| China Communications Services Corp. Ltd. (H Shares) (China, Construction & Engineering) | 1.3 | |
| Indian Energy Exchange Ltd. (India, Capital Markets) | 1.3 | |
| Chailease Holding Co. Ltd. (Taiwan, Financial Services) | 1.2 | |
| | 13.6 | |
| |
| Market Sectors (% of Fund's net assets) |
| |
| Industrials | 21.0 | |
| Financials | 16.4 | |
| Consumer Discretionary | 12.2 | |
| Health Care | 9.7 | |
| Information Technology | 9.0 | |
| Consumer Staples | 8.4 | |
| Real Estate | 6.3 | |
| Utilities | 4.6 | |
| Energy | 3.4 | |
| Materials | 3.1 | |
| Communication Services | 3.0 | |
| |
Asset Allocation (% of Fund's net assets) |
|
|
Geographic Diversification (% of Fund's net assets) |
|
* Includes Short-Term investments and Net Other Assets (Liabilities). Percentages are adjusted for the effect of derivatives, if applicable. |
| |
Fidelity® Emerging Markets Discovery Fund
| Common Stocks - 97.1% |
| | | Shares | Value ($) |
| Brazil - 10.7% | | | |
| Afya Ltd. (a) | | 493,451 | 5,679,621 |
| Enauta Participacoes SA | | 2,573,107 | 5,958,416 |
| Equatorial Energia SA | | 1,238,982 | 6,791,324 |
| Hypera SA | | 1,091,820 | 8,153,955 |
| Localiza Rent a Car SA | | 621,858 | 7,232,444 |
| Localiza Rent a Car SA rights 5/11/23 (a) | | 2,598 | 8,938 |
| LOG Commercial Properties e Participacoes SA | | 2,132,152 | 7,006,290 |
| Lojas Renner SA | | 2,669,400 | 8,477,344 |
| Orizon Valorizacao de Residuos SA (a) | | 1,041,450 | 7,099,182 |
| Rumo SA | | 1,774,748 | 7,009,611 |
| Suzano Papel e Celulose SA | | 170,679 | 1,361,928 |
| XP, Inc. Class A (a) | | 513,484 | 7,337,686 |
TOTAL BRAZIL | | | 72,116,739 |
| Chile - 0.8% | | | |
| Banco de Chile sponsored ADR | | 264,574 | 5,608,969 |
| China - 20.3% | | | |
| China Communications Services Corp. Ltd. (H Shares) | | 15,779,710 | 8,646,724 |
| China Merchants Holdings International Co. Ltd. | | 2,836,001 | 4,208,122 |
| China Resources Beer Holdings Co. Ltd. | | 756,709 | 5,845,412 |
| Far East Horizon Ltd. | | 7,591,889 | 6,829,832 |
| Far East Horizon Ltd. rights (a) | | 63,797 | 1 |
| Fu Shou Yuan International Group Ltd. | | 8,791,263 | 7,134,471 |
| Guangdong Investment Ltd. | | 6,755,352 | 6,457,959 |
| Haier Smart Home Co. Ltd. (A Shares) | | 2,074,174 | 7,131,823 |
| Haitian International Holdings Ltd. | | 2,612,033 | 6,786,798 |
| Hansoh Pharmaceutical Group Co. Ltd. (b) | | 3,288,241 | 5,998,748 |
| Innovent Biologics, Inc. (a)(b) | | 1,543,542 | 7,421,462 |
| New Horizon Health Ltd. (a)(b) | | 2,178,616 | 7,818,052 |
| Pharmaron Beijing Co. Ltd. (H Shares) (b) | | 1,568,129 | 6,798,494 |
| Shenzhen Expressway Co. Ltd. (H Shares) | | 6,804,247 | 6,344,330 |
| Sinopec Engineering Group Co. Ltd. (H Shares) | | 14,421,878 | 7,478,638 |
| Sinopharm Group Co. Ltd. (H Shares) | | 1,623,402 | 5,750,542 |
| Sinotruk Hong Kong Ltd. | | 4,428,449 | 6,767,740 |
| Tongdao Liepin Group (a)(c) | | 5,259,954 | 6,739,295 |
| TravelSky Technology Ltd. (H Shares) | | 3,103,295 | 6,194,574 |
| Tsingtao Brewery Co. Ltd. (H Shares) | | 563,205 | 6,029,465 |
| Venus MedTech Hangzhou, Inc. (H Shares) (a)(b) | | 3,937,710 | 5,512,725 |
| Zai Lab Ltd. (a) | | 1,612,533 | 5,645,640 |
TOTAL CHINA | | | 137,540,847 |
| Georgia - 1.0% | | | |
| Bank of Georgia Group PLC | | 180,694 | 6,721,781 |
| Hong Kong - 1.6% | | | |
| ASMPT Ltd. | | 713,602 | 5,610,453 |
| WH Group Ltd. (b) | | 9,634,172 | 5,363,717 |
TOTAL HONG KONG | | | 10,974,170 |
| Hungary - 1.1% | | | |
| Richter Gedeon PLC | | 310,452 | 7,491,893 |
| India - 16.6% | | | |
| Bharat Electronics Ltd. | | 5,277,369 | 6,690,674 |
| Computer Age Management Services Private Ltd. | | 251,797 | 6,371,646 |
| Cyient Ltd. | | 717,692 | 10,389,690 |
| Deccan Cements Ltd. | | 588,601 | 3,237,567 |
| Eicher Motors Ltd. | | 185,350 | 7,513,540 |
| Embassy Office Parks (REIT) | | 1,343,343 | 5,421,333 |
| Hindustan Aeronautics Ltd. | | 211,499 | 7,582,030 |
| Indian Energy Exchange Ltd. (a)(b) | | 4,437,652 | 8,533,483 |
| Indraprastha Gas Ltd. | | 931,553 | 5,663,878 |
| Indus Towers Ltd. | | 2,770,855 | 5,270,577 |
| ITC Ltd. | | 1,525,123 | 7,961,544 |
| Mahanagar Gas Ltd. | | 456,130 | 5,640,861 |
| Manappuram General Finance & Leasing Ltd. | | 827,372 | 1,318,657 |
| Oberoi Realty Ltd. | | 507,692 | 5,704,400 |
| Petronet LNG Ltd. | | 2,043,681 | 5,942,061 |
| Power Grid Corp. of India Ltd. | | 2,216,658 | 6,452,416 |
| Shriram Transport Finance Co. Ltd. | | 456,229 | 7,464,098 |
| Torrent Pharmaceuticals Ltd. | | 253,945 | 5,146,513 |
TOTAL INDIA | | | 112,304,968 |
| Indonesia - 1.8% | | | |
| First Resources Ltd. | | 6,046,634 | 6,971,065 |
| PT United Tractors Tbk | | 2,689,975 | 5,310,216 |
TOTAL INDONESIA | | | 12,281,281 |
| Korea (South) - 8.1% | | | |
| Coway Co. Ltd. | | 133,952 | 4,920,190 |
| Db Insurance Co. Ltd. | | 152,022 | 9,560,130 |
| Fila Holdings Corp. | | 175,328 | 4,817,566 |
| Hanon Systems | | 905,245 | 6,225,264 |
| Hansol Chemical Co. Ltd. | | 35,693 | 5,951,732 |
| Hyundai Fire & Marine Insurance Co. Ltd. | | 290,488 | 8,164,182 |
| LG Corp. | | 94,630 | 6,196,136 |
| SaraminHR Co. Ltd. | | 240,505 | 4,107,080 |
| Soulbrain Co. Ltd. | | 29,488 | 4,854,062 |
TOTAL KOREA (SOUTH) | | | 54,796,342 |
| Malaysia - 0.0% | | | |
| Scientex Bhd warrants 1/14/26 (a) | | 130,640 | 17,236 |
| Mexico - 9.4% | | | |
| Becle S.A.B. de CV | | 2,655,233 | 6,128,767 |
| FIBRA Macquarie Mexican (REIT) (b) | | 3,143,453 | 5,168,134 |
| Fibra Uno Administracion SA de CV | | 3,690,642 | 5,098,893 |
| Grupo Aeroportuario del Pacifico S.A.B. de CV Series B | | 392,232 | 6,978,564 |
| Grupo Aeroportuario del Sureste S.A.B. de CV Series B sponsored ADR | | 28,763 | 8,235,422 |
| Grupo Aeroportuario Norte S.A.B. de CV | | 657,135 | 7,223,569 |
| Grupo Comercial Chedraui S.A.B. de CV | | 1,655,771 | 9,787,555 |
| Qualitas Controladora S.A.B. de CV | | 1,206,247 | 7,973,662 |
| Regional S.A.B. de CV | | 916,231 | 6,709,872 |
TOTAL MEXICO | | | 63,304,438 |
| Peru - 0.7% | | | |
| Credicorp Ltd. (United States) | | 33,062 | 4,479,240 |
| Philippines - 0.7% | | | |
| Robinsons Land Corp. | | 18,533,074 | 4,827,059 |
| Poland - 1.2% | | | |
| Dino Polska SA (a)(b) | | 78,480 | 7,983,574 |
| Russia - 0.1% | | | |
| Etalon Group PLC GDR (Reg. S) (a)(d) | | 167,549 | 13,330 |
| LSR Group OJSC (a)(d) | | 67,346 | 78,819 |
| TCS Group Holding PLC GDR (a)(d) | | 59,253 | 87,785 |
| X5 Retail Group NV GDR (Reg. S) (a)(d) | | 101,790 | 773,604 |
TOTAL RUSSIA | | | 953,538 |
| Saudi Arabia - 2.7% | | | |
| Bupa Arabia for Cooperative Insurance Co. | | 194,157 | 9,131,441 |
| Saudi Airlines Catering Co. | | 371,570 | 9,401,443 |
TOTAL SAUDI ARABIA | | | 18,532,884 |
| South Africa - 3.4% | | | |
| Bidvest Group Ltd./The | | 452,811 | 6,202,094 |
| FirstRand Ltd. | | 1,544,724 | 5,434,929 |
| Impala Platinum Holdings Ltd. | | 507,443 | 4,940,365 |
| Mr Price Group Ltd. | | 751,646 | 6,180,817 |
TOTAL SOUTH AFRICA | | | 22,758,205 |
| Taiwan - 11.6% | | | |
| BizLink Holding, Inc. | | 786,180 | 6,747,497 |
| BizLink Holding, Inc. rights 5/8/23 (a) | | 20,086 | 21,546 |
| Chailease Holding Co. Ltd. | | 1,167,798 | 8,499,279 |
| Cleanaway Co. Ltd. | | 869,646 | 5,319,698 |
| International Games Systems Co. Ltd. | | 458,818 | 8,007,400 |
| King Slide Works Co. Ltd. | | 481,199 | 6,476,449 |
| Makalot Industrial Co. Ltd. | | 820,843 | 5,957,416 |
| Poya International Co. Ltd. | | 363,258 | 6,794,368 |
| Realtek Semiconductor Corp. | | 507,617 | 5,948,650 |
| Unimicron Technology Corp. | | 1,941,508 | 9,218,328 |
| Wiwynn Corp. | | 213,768 | 8,129,606 |
| Yageo Corp. | | 471,670 | 7,640,876 |
TOTAL TAIWAN | | | 78,761,113 |
| Thailand - 0.0% | | | |
| Siam Global House PCL (For. Reg.) | | 160,574 | 80,645 |
| Turkey - 0.8% | | | |
| Mavi Jeans Class B (b) | | 1,035,719 | 5,585,529 |
| United Arab Emirates - 2.5% | | | |
| Aldar Properties PJSC | | 6,474,320 | 9,520,281 |
| Emirates NBD Bank PJSC (a) | | 1,860,810 | 7,144,683 |
TOTAL UNITED ARAB EMIRATES | | | 16,664,964 |
| United States of America - 1.9% | | | |
| Parade Technologies Ltd. | | 247,154 | 7,564,428 |
| Tenaris SA sponsored ADR (c) | | 192,836 | 5,536,322 |
TOTAL UNITED STATES OF AMERICA | | | 13,100,750 |
| Vietnam - 0.1% | | | |
| FPT Corp. | | 196,215 | 649,645 |
| TOTAL COMMON STOCKS (Cost $616,805,696) | | | 657,535,810 |
| | | | |
| Money Market Funds - 3.1% |
| | | Shares | Value ($) |
| Fidelity Cash Central Fund 4.88% (e) | | 14,601,636 | 14,604,556 |
| Fidelity Securities Lending Cash Central Fund 4.88% (e)(f) | | 6,164,384 | 6,165,000 |
| TOTAL MONEY MARKET FUNDS (Cost $20,769,556) | | | 20,769,556 |
| | | | |
| TOTAL INVESTMENT IN SECURITIES - 100.2% (Cost $637,575,252) | 678,305,366 |
NET OTHER ASSETS (LIABILITIES) - (0.2)% | (1,501,361) |
| NET ASSETS - 100.0% | 676,804,005 |
| | |
Legend
| (b) | Security exempt from registration under Rule 144A of the Securities Act of 1933. These securities may be resold in transactions exempt from registration, normally to qualified institutional buyers. At the end of the period, the value of these securities amounted to $66,183,918 or 9.8% of net assets. |
| (c) | Security or a portion of the security is on loan at period end. |
| (e) | Affiliated fund that is generally available only to investment companies and other accounts managed by Fidelity Investments. The rate quoted is the annualized seven-day yield of the fund at period end. A complete unaudited listing of the fund's holdings as of its most recent quarter end is available upon request. In addition, each Fidelity Central Fund's financial statements are available on the SEC's website or upon request. |
| (f) | Investment made with cash collateral received from securities on loan. |
Affiliated Central Funds
Fiscal year to date information regarding the Fund's investments in Fidelity Central Funds, including the ownership percentage, is presented below.
| Affiliate | Value, beginning of period ($) | Purchases ($) | Sales Proceeds ($) | Dividend Income ($) | Realized Gain (loss) ($) | Change in Unrealized appreciation (depreciation) ($) | Value, end of period ($) | % ownership, end of period |
| Fidelity Cash Central Fund 4.88% | 16,540,486 | 143,917,417 | 145,853,347 | 669,063 | - | - | 14,604,556 | 0.0% |
| Fidelity Securities Lending Cash Central Fund 4.88% | 1,598,400 | 49,833,702 | 45,267,102 | 62,624 | - | - | 6,165,000 | 0.0% |
| Total | 18,138,886 | 193,751,119 | 191,120,449 | 731,687 | - | - | 20,769,556 | |
| | | | | | | | | |
Amounts in the dividend income column in the above table include any capital gain distributions from underlying funds, which are presented in the corresponding line item in the Statement of Operations, if applicable.
Amounts in the dividend income column for Fidelity Securities Lending Cash Central Fund represents the income earned on investing cash collateral, less rebates paid to borrowers and any lending agent fees associated with the loan, plus any premium payments received for lending certain types of securities.
Amounts included in the purchases and sales proceeds columns may include in-kind transactions, if applicable.
Investment Valuation
The following is a summary of the inputs used, as of April 30, 2023, involving the Fund's assets and liabilities carried at fair value. The inputs or methodology used for valuing securities may not be an indication of the risk associated with investing in those securities. For more information on valuation inputs, and their aggregation into the levels used below, please refer to the Investment Valuation section in the accompanying Notes to Financial Statements.
| Valuation Inputs at Reporting Date: |
| Description | Total ($) | Level 1 ($) | Level 2 ($) | Level 3 ($) |
Investments in Securities: | | | | |
|
| Equities: | | | | |
Communication Services | 20,017,272 | - | 20,017,272 | - |
Consumer Discretionary | 82,693,168 | 25,923,311 | 56,769,857 | - |
Consumer Staples | 56,844,703 | 23,899,896 | 32,171,203 | 773,604 |
Energy | 22,747,015 | 11,494,738 | 11,252,277 | - |
Financials | 110,999,710 | 60,542,263 | 50,369,662 | 87,785 |
Health Care | 65,738,024 | 15,645,848 | 50,092,176 | - |
Industrials | 142,659,926 | 59,391,267 | 83,268,659 | - |
Information Technology | 61,628,125 | - | 61,628,125 | - |
Materials | 20,362,890 | 1,361,928 | 19,000,962 | - |
Real Estate | 42,838,539 | 26,793,598 | 15,952,792 | 92,149 |
Utilities | 31,006,438 | 6,791,324 | 24,215,114 | - |
|
| Money Market Funds | 20,769,556 | 20,769,556 | - | - |
| Total Investments in Securities: | 678,305,366 | 252,613,729 | 424,738,099 | 953,538 |
Fidelity® Emerging Markets Discovery Fund
| Statement of Assets and Liabilities |
| | | | April 30, 2023 (Unaudited) |
| | | | | |
| Assets | | | | |
| Investment in securities, at value (including securities loaned of $6,093,129) - See accompanying schedule: | | | | |
Unaffiliated issuers (cost $616,805,696) | $ | 657,535,810 | | |
Fidelity Central Funds (cost $20,769,556) | | 20,769,556 | | |
| | | | | |
| | | | | |
| Total Investment in Securities (cost $637,575,252) | | | $ | 678,305,366 |
| Foreign currency held at value (cost $7,562,899) | | | | 7,583,108 |
| Receivable for investments sold | | | | 5,666,069 |
| Receivable for fund shares sold | | | | 809,212 |
| Dividends receivable | | | | 1,150,983 |
| Distributions receivable from Fidelity Central Funds | | | | 144,475 |
| Prepaid expenses | | | | 146 |
| Other receivables | | | | 116,366 |
Total assets | | | | 693,775,725 |
| Liabilities | | | | |
| Payable for investments purchased | $ | 7,106,359 | | |
| Payable for fund shares redeemed | | 503,902 | | |
| Accrued management fee | | 447,051 | | |
| Distribution and service plan fees payable | | 9,425 | | |
| Other affiliated payables | | 116,734 | | |
| Deferred taxes | | 2,528,899 | | |
| Other payables and accrued expenses | | 94,350 | | |
| Collateral on securities loaned | | 6,165,000 | | |
| Total Liabilities | | | | 16,971,720 |
| Net Assets | | | $ | 676,804,005 |
| Net Assets consist of: | | | | |
| Paid in capital | | | $ | 649,851,402 |
| Total accumulated earnings (loss) | | | | 26,952,603 |
| Net Assets | | | $ | 676,804,005 |
| | | | | |
| Net Asset Value and Maximum Offering Price | | | | |
| Class A : | | | | |
Net Asset Value and redemption price per share ($20,684,222 ÷ 1,389,651 shares) (a) | | | $ | 14.88 |
| Maximum offering price per share (100/94.25 of $14.88) | | | $ | 15.79 |
| Class M : | | | | |
Net Asset Value and redemption price per share ($5,721,853 ÷ 384,953 shares) (a) | | | $ | 14.86 |
| Maximum offering price per share (100/96.50 of $14.86) | | | $ | 15.40 |
| Class C : | | | | |
Net Asset Value and offering price per share ($3,568,896 ÷ 246,633 shares) (a) | | | $ | 14.47 |
| Emerging Markets Discovery : | | | | |
Net Asset Value , offering price and redemption price per share ($321,830,639 ÷ 21,492,914 shares) | | | $ | 14.97 |
| Class I : | | | | |
Net Asset Value , offering price and redemption price per share ($251,795,559 ÷ 16,766,478 shares) | | | $ | 15.02 |
| Class Z : | | | | |
Net Asset Value , offering price and redemption price per share ($73,202,836 ÷ 4,885,445 shares) | | | $ | 14.98 |
(a)Redemption price per share is equal to net asset value less any applicable contingent deferred sales charge. |
| Statement of Operations |
| | | | Six months ended April 30, 2023 (Unaudited) |
| Investment Income | | | | |
| Dividends | | | $ | 8,578,030 |
| Interest | | | | 155 |
| Income from Fidelity Central Funds (including $62,624 from security lending) | | | | 731,687 |
| Income before foreign taxes withheld | | | $ | 9,309,872 |
| Less foreign taxes withheld | | | | (1,288,962) |
| Total Income | | | | 8,020,910 |
| Expenses | | | | |
| Management fee | $ | 2,364,306 | | |
| Transfer agent fees | | 509,395 | | |
| Distribution and service plan fees | | 53,733 | | |
| Accounting fees | | 138,580 | | |
| Custodian fees and expenses | | 92,086 | | |
| Independent trustees' fees and expenses | | 1,499 | | |
| Registration fees | | 58,641 | | |
| Audit | | 50,432 | | |
| Legal | | 578 | | |
| Miscellaneous | | 967 | | |
| Total expenses before reductions | | 3,270,217 | | |
| Expense reductions | | (13,774) | | |
| Total expenses after reductions | | | | 3,256,443 |
| Net Investment income (loss) | | | | 4,764,467 |
| Realized and Unrealized Gain (Loss) | | | | |
| Net realized gain (loss) on: | | | | |
| Investment Securities: | | | | |
| Unaffiliated issuers (net of foreign taxes of $159,253) | | (3,745,606) | | |
| Foreign currency transactions | | (135,075) | | |
| Total net realized gain (loss) | | | | (3,880,681) |
| Change in net unrealized appreciation (depreciation) on: | | | | |
| Investment Securities: | | | | |
| Unaffiliated issuers(net of increase in deferred foreign taxes of $781,625) | | 79,831,341 | | |
| Assets and liabilities in foreign currencies | | 38,859 | | |
| Total change in net unrealized appreciation (depreciation) | | | | 79,870,200 |
| Net gain (loss) | | | | 75,989,519 |
| Net increase (decrease) in net assets resulting from operations | | | $ | 80,753,986 |
| Statement of Changes in Net Assets |
| |
| | Six months ended April 30, 2023 (Unaudited) | | Year ended October 31, 2022 |
| Increase (Decrease) in Net Assets | | | | |
| Operations | | | | |
| Net investment income (loss) | $ | 4,764,467 | $ | 8,469,843 |
| Net realized gain (loss) | | (3,880,681) | | (5,961,108) |
| Change in net unrealized appreciation (depreciation) | | 79,870,200 | | (86,323,295) |
| Net increase (decrease) in net assets resulting from operations | | 80,753,986 | | (83,814,560) |
| Distributions to shareholders | | (8,639,871) | | (35,200,802) |
| Share transactions - net increase (decrease) | | 173,593,042 | | 193,227,559 |
| Total increase (decrease) in net assets | | 245,707,157 | | 74,212,197 |
| | | | | |
| Net Assets | | | | |
| Beginning of period | | 431,096,848 | | 356,884,651 |
| End of period | $ | 676,804,005 | $ | 431,096,848 |
| | | | | |
| | | | | |
Financial Highlights
| Fidelity Advisor® Emerging Markets Discovery Fund Class A |
| |
| | Six months ended (Unaudited) April 30, 2023 | | Years ended October 31, 2022 | | 2021 | | 2020 | | 2019 | | 2018 |
Selected Per-Share Data | | | | | | | | | | | | |
| Net asset value, beginning of period | $ | 12.89 | $ | 18.36 | $ | 13.93 | $ | 13.66 | $ | 12.01 | $ | 15.03 |
| Income from Investment Operations | | | | | | | | | | | | |
Net investment income (loss) A,B | | .10 | | .31 | | .11 | | .04 | | .13 | | .18 |
| Net realized and unrealized gain (loss) | | 2.09 | | (3.92) | | 4.37 | | .34 | | 1.71 | | (2.89) |
| Total from investment operations | | 2.19 | | (3.61) | | 4.48 | | .38 | | 1.84 | | (2.71) |
| Distributions from net investment income | | (.20) | | (.37) | | (.05) | | (.11) | | (.18) | | (.08) |
| Distributions from net realized gain | | - | | (1.49) | | - | | - | | (.01) | | (.23) |
| Total distributions | | (.20) | | (1.86) | | (.05) | | (.11) | | (.19) | | (.31) |
| Net asset value, end of period | $ | 14.88 | $ | 12.89 | $ | 18.36 | $ | 13.93 | $ | 13.66 | $ | 12.01 |
Total Return C,D,E | | 17.05% | | (21.58)% | | 32.23% | | 2.76% | | 15.50% | | (18.39)% |
Ratios to Average Net Assets B,F,G | | | | | | | | | | | | |
| Expenses before reductions | | 1.44% H | | 1.49% | | 1.49% | | 1.54% | | 1.55% | | 1.52% |
| Expenses net of fee waivers, if any | | 1.43% H | | 1.49% | | 1.49% | | 1.53% | | 1.54% | | 1.52% |
| Expenses net of all reductions | | 1.43% H | | 1.49% | | 1.49% | | 1.51% | | 1.54% | | 1.48% |
| Net investment income (loss) | | 1.38% H | | 2.11% | | .60% | | .33% | | .96% | | 1.22% |
| Supplemental Data | | | | | | | | | | | | |
| Net assets, end of period (000 omitted) | $ | 20,684 | $ | 16,063 | $ | 18,900 | $ | 11,745 | $ | 15,323 | $ | 14,472 |
Portfolio turnover rate I | | 26% H | | 33% | | 64% | | 43% | | 80% | | 98% |
A Calculated based on average shares outstanding during the period.
B Net investment income (loss) is affected by the timing of the declaration of dividends by any underlying mutual funds or exchange-traded funds (ETFs). Net investment income (loss) of any mutual funds or ETFs is not included in the Fund's net investment income (loss) ratio.
C Total returns for periods of less than one year are not annualized.
D Total returns would have been lower if certain expenses had not been reduced during the applicable periods shown.
E Total returns do not include the effect of the sales charges.
F Fees and expenses of any underlying mutual funds or exchange-traded funds (ETFs) are not included in the Fund's expense ratio. The Fund indirectly bears its proportionate share of these expenses. For additional expense information related to investments in Fidelity Central Funds, please refer to the "Investments in Fidelity Central Funds" note found in the Notes to Financial Statements section of the most recent Annual or Semi-Annual report.
G Expense ratios reflect operating expenses of the class. Expenses before reductions do not reflect amounts reimbursed, waived, or reduced through arrangements with the investment adviser, brokerage services, or other offset arrangements, if applicable, and do not represent the amount paid by the class during periods when reimbursements, waivers or reductions occur.
H Annualized.
I Amount does not include the portfolio activity of any underlying mutual funds or exchange-traded funds (ETFs).
| Fidelity Advisor® Emerging Markets Discovery Fund Class M |
| |
| | Six months ended (Unaudited) April 30, 2023 | | Years ended October 31, 2022 | | 2021 | | 2020 | | 2019 | | 2018 |
Selected Per-Share Data | | | | | | | | | | | | |
| Net asset value, beginning of period | $ | 12.85 | $ | 18.30 | $ | 13.89 | $ | 13.62 | $ | 11.94 | $ | 14.94 |
| Income from Investment Operations | | | | | | | | | | | | |
Net investment income (loss) A,B | | .08 | | .27 | | .06 | | - C | | .08 | | .14 |
| Net realized and unrealized gain (loss) | | 2.08 | | (3.91) | | 4.36 | | .34 | | 1.71 | | (2.87) |
| Total from investment operations | | 2.16 | | (3.64) | | 4.42 | | .34 | | 1.79 | | (2.73) |
| Distributions from net investment income | | (.15) | | (.32) | | (.01) | | (.07) | | (.10) | | (.04) |
| Distributions from net realized gain | | - | | (1.49) | | - | | - | | (.01) | | (.23) |
| Total distributions | | (.15) | | (1.81) | | (.01) | | (.07) | | (.11) | | (.27) |
| Net asset value, end of period | $ | 14.86 | $ | 12.85 | $ | 18.30 | $ | 13.89 | $ | 13.62 | $ | 11.94 |
Total Return D,E,F | | 16.90% | | (21.77)% | | 31.82% | | 2.49% | | 15.06% | | (18.58)% |
Ratios to Average Net Assets B,G,H | | | | | | | | | | | | |
| Expenses before reductions | | 1.70% I | | 1.75% | | 1.76% | | 1.83% | | 1.86% | | 1.79% |
| Expenses net of fee waivers, if any | | 1.69% I | | 1.75% | | 1.76% | | 1.83% | | 1.86% | | 1.79% |
| Expenses net of all reductions | | 1.68% I | | 1.75% | | 1.76% | | 1.80% | | 1.86% | | 1.75% |
| Net investment income (loss) | | 1.12% I | | 1.85% | | .33% | | .03% | | .64% | | .94% |
| Supplemental Data | | | | | | | | | | | | |
| Net assets, end of period (000 omitted) | $ | 5,722 | $ | 4,355 | $ | 6,095 | $ | 4,552 | $ | 5,773 | $ | 5,374 |
Portfolio turnover rate J | | 26% I | | 33% | | 64% | | 43% | | 80% | | 98% |
A Calculated based on average shares outstanding during the period.
B Net investment income (loss) is affected by the timing of the declaration of dividends by any underlying mutual funds or exchange-traded funds (ETFs). Net investment income (loss) of any mutual funds or ETFs is not included in the Fund's net investment income (loss) ratio.
C Amount represents less than $.005 per share.
D Total returns for periods of less than one year are not annualized.
E Total returns would have been lower if certain expenses had not been reduced during the applicable periods shown.
F Total returns do not include the effect of the sales charges.
G Fees and expenses of any underlying mutual funds or exchange-traded funds (ETFs) are not included in the Fund's expense ratio. The Fund indirectly bears its proportionate share of these expenses. For additional expense information related to investments in Fidelity Central Funds, please refer to the "Investments in Fidelity Central Funds" note found in the Notes to Financial Statements section of the most recent Annual or Semi-Annual report.
H Expense ratios reflect operating expenses of the class. Expenses before reductions do not reflect amounts reimbursed, waived, or reduced through arrangements with the investment adviser, brokerage services, or other offset arrangements, if applicable, and do not represent the amount paid by the class during periods when reimbursements, waivers or reductions occur.
I Annualized.
J Amount does not include the portfolio activity of any underlying mutual funds or exchange-traded funds (ETFs).
| Fidelity Advisor® Emerging Markets Discovery Fund Class C |
| |
| | Six months ended (Unaudited) April 30, 2023 | | Years ended October 31, 2022 | | 2021 | | 2020 | | 2019 | | 2018 |
Selected Per-Share Data | | | | | | | | | | | | |
| Net asset value, beginning of period | $ | 12.47 | $ | 17.78 | $ | 13.55 | $ | 13.29 | $ | 11.66 | $ | 14.64 |
| Income from Investment Operations | | | | | | | | | | | | |
Net investment income (loss) A,B | | .04 | | .19 | | (.03) | | (.06) | | .02 | | .06 |
| Net realized and unrealized gain (loss) | | 2.04 | | (3.81) | | 4.26 | | .32 | | 1.67 | | (2.79) |
| Total from investment operations | | 2.08 | | (3.62) | | 4.23 | | .26 | | 1.69 | | (2.73) |
| Distributions from net investment income | | (.08) | | (.20) | | - | | - | | (.05) | | (.02) |
| Distributions from net realized gain | | - | | (1.49) | | - | | - | | (.01) | | (.23) |
| Total distributions | | (.08) | | (1.69) | | - | | - | | (.06) | | (.25) |
| Net asset value, end of period | $ | 14.47 | $ | 12.47 | $ | 17.78 | $ | 13.55 | $ | 13.29 | $ | 11.66 |
Total Return C,D,E | | 16.70% | | (22.21)% | | 31.22% | | 1.96% | | 14.54% | | (18.97)% |
Ratios to Average Net Assets B,F,G | | | | | | | | | | | | |
| Expenses before reductions | | 2.21% H | | 2.25% | | 2.25% | | 2.32% | | 2.36% | | 2.28% |
| Expenses net of fee waivers, if any | | 2.20% H | | 2.25% | | 2.25% | | 2.31% | | 2.35% | | 2.28% |
| Expenses net of all reductions | | 2.20% H | | 2.25% | | 2.25% | | 2.29% | | 2.35% | | 2.24% |
| Net investment income (loss) | | .61% H | | 1.35% | | (.16)% | | (.45)% | | .14% | | .45% |
| Supplemental Data | | | | | | | | | | | | |
| Net assets, end of period (000 omitted) | $ | 3,569 | $ | 3,079 | $ | 4,995 | $ | 5,080 | $ | 7,562 | $ | 11,278 |
Portfolio turnover rate I | | 26% H | | 33% | | 64% | | 43% | | 80% | | 98% |
A Calculated based on average shares outstanding during the period.
B Net investment income (loss) is affected by the timing of the declaration of dividends by any underlying mutual funds or exchange-traded funds (ETFs). Net investment income (loss) of any mutual funds or ETFs is not included in the Fund's net investment income (loss) ratio.
C Total returns for periods of less than one year are not annualized.
D Total returns would have been lower if certain expenses had not been reduced during the applicable periods shown.
E Total returns do not include the effect of the contingent deferred sales charge.
F Fees and expenses of any underlying mutual funds or exchange-traded funds (ETFs) are not included in the Fund's expense ratio. The Fund indirectly bears its proportionate share of these expenses. For additional expense information related to investments in Fidelity Central Funds, please refer to the "Investments in Fidelity Central Funds" note found in the Notes to Financial Statements section of the most recent Annual or Semi-Annual report.
G Expense ratios reflect operating expenses of the class. Expenses before reductions do not reflect amounts reimbursed, waived, or reduced through arrangements with the investment adviser, brokerage services, or other offset arrangements, if applicable, and do not represent the amount paid by the class during periods when reimbursements, waivers or reductions occur.
H Annualized.
I Amount does not include the portfolio activity of any underlying mutual funds or exchange-traded funds (ETFs).
| Fidelity® Emerging Markets Discovery Fund |
| |
| | Six months ended (Unaudited) April 30, 2023 | | Years ended October 31, 2022 | | 2021 | | 2020 | | 2019 | | 2018 |
Selected Per-Share Data | | | | | | | | | | | | |
| Net asset value, beginning of period | $ | 12.98 | $ | 18.48 | $ | 14.02 | $ | 13.75 | $ | 12.10 | $ | 15.12 |
| Income from Investment Operations | | | | | | | | | | | | |
Net investment income (loss) A,B | | .12 | | .36 | | .16 | | .08 | | .16 | | .23 |
| Net realized and unrealized gain (loss) | | 2.11 | | (3.95) | | 4.40 | | .34 | | 1.72 | | (2.91) |
| Total from investment operations | | 2.23 | | (3.59) | | 4.56 | | .42 | | 1.88 | | (2.68) |
| Distributions from net investment income | | (.24) | | (.42) | | (.10) | | (.15) | | (.22) | | (.11) |
| Distributions from net realized gain | | - | | (1.49) | | - | | - | | (.01) | | (.23) |
| Total distributions | | (.24) | | (1.91) | | (.10) | | (.15) | | (.23) | | (.34) |
| Net asset value, end of period | $ | 14.97 | $ | 12.98 | $ | 18.48 | $ | 14.02 | $ | 13.75 | $ | 12.10 |
Total Return C,D | | 17.27% | | (21.37)% | | 32.63% | | 3.07% | | 15.78% | | (18.11)% |
Ratios to Average Net Assets B,E,F | | | | | | | | | | | | |
| Expenses before reductions | | 1.15% G | | 1.19% | | 1.19% | | 1.23% | | 1.25% | | 1.22% |
| Expenses net of fee waivers, if any | | 1.15% G | | 1.19% | | 1.18% | | 1.23% | | 1.25% | | 1.22% |
| Expenses net of all reductions | | 1.15% G | | 1.19% | | 1.18% | | 1.20% | | 1.25% | | 1.18% |
| Net investment income (loss) | | 1.66% G | | 2.41% | | .90% | | .63% | | 1.25% | | 1.51% |
| Supplemental Data | | | | | | | | | | | | |
| Net assets, end of period (000 omitted) | $ | 321,831 | $ | 248,805 | $ | 283,133 | $ | 189,784 | $ | 208,657 | $ | 188,690 |
Portfolio turnover rate H | | 26% G | | 33% | | 64% | | 43% | | 80% | | 98% |
A Calculated based on average shares outstanding during the period.
B Net investment income (loss) is affected by the timing of the declaration of dividends by any underlying mutual funds or exchange-traded funds (ETFs). Net investment income (loss) of any mutual funds or ETFs is not included in the Fund's net investment income (loss) ratio.
C Total returns for periods of less than one year are not annualized.
D Total returns would have been lower if certain expenses had not been reduced during the applicable periods shown.
E Fees and expenses of any underlying mutual funds or exchange-traded funds (ETFs) are not included in the Fund's expense ratio. The Fund indirectly bears its proportionate share of these expenses. For additional expense information related to investments in Fidelity Central Funds, please refer to the "Investments in Fidelity Central Funds" note found in the Notes to Financial Statements section of the most recent Annual or Semi-Annual report.
F Expense ratios reflect operating expenses of the class. Expenses before reductions do not reflect amounts reimbursed, waived, or reduced through arrangements with the investment adviser, brokerage services, or other offset arrangements, if applicable, and do not represent the amount paid by the class during periods when reimbursements, waivers or reductions occur.
G Annualized.
H Amount does not include the portfolio activity of any underlying mutual funds or exchange-traded funds (ETFs).
| Fidelity Advisor® Emerging Markets Discovery Fund Class I |
| |
| | Six months ended (Unaudited) April 30, 2023 | | Years ended October 31, 2022 | | 2021 | | 2020 | | 2019 | | 2018 |
Selected Per-Share Data | | | | | | | | | | | | |
| Net asset value, beginning of period | $ | 13.03 | $ | 18.54 | $ | 14.06 | $ | 13.79 | $ | 12.13 | $ | 15.15 |
| Income from Investment Operations | | | | | | | | | | | | |
Net investment income (loss) A,B | | .12 | | .34 | | .16 | | .08 | | .17 | | .23 |
| Net realized and unrealized gain (loss) | | 2.12 | | (3.95) | | 4.41 | | .34 | | 1.72 | | (2.90) |
| Total from investment operations | | 2.24 | | (3.61) | | 4.57 | | .42 | | 1.89 | | (2.67) |
| Distributions from net investment income | | (.25) | | (.41) | | (.09) | | (.15) | | (.22) | | (.12) |
| Distributions from net realized gain | | - | | (1.49) | | - | | - | | (.01) | | (.23) |
| Total distributions | | (.25) | | (1.90) | | (.09) | | (.15) | | (.23) | | (.35) |
| Net asset value, end of period | $ | 15.02 | $ | 13.03 | $ | 18.54 | $ | 14.06 | $ | 13.79 | $ | 12.13 |
Total Return C,D | | 17.32% | | (21.37)% | | 32.62% | | 3.07% | | 15.78% | | (18.06)% |
Ratios to Average Net Assets B,E,F | | | | | | | | | | | | |
| Expenses before reductions | | 1.12% G | | 1.17% | | 1.19% | | 1.24% | | 1.25% | | 1.22% |
| Expenses net of fee waivers, if any | | 1.11% G | | 1.16% | | 1.19% | | 1.23% | | 1.24% | | 1.22% |
| Expenses net of all reductions | | 1.11% G | | 1.16% | | 1.19% | | 1.21% | | 1.24% | | 1.18% |
| Net investment income (loss) | | 1.70% G | | 2.44% | | .90% | | .63% | | 1.26% | | 1.51% |
| Supplemental Data | | | | | | | | | | | | |
| Net assets, end of period (000 omitted) | $ | 251,796 | $ | 129,250 | $ | 27,397 | $ | 28,034 | $ | 51,081 | $ | 57,506 |
Portfolio turnover rate H | | 26% G | | 33% | | 64% | | 43% | | 80% | | 98% |
A Calculated based on average shares outstanding during the period.
B Net investment income (loss) is affected by the timing of the declaration of dividends by any underlying mutual funds or exchange-traded funds (ETFs). Net investment income (loss) of any mutual funds or ETFs is not included in the Fund's net investment income (loss) ratio.
C Total returns for periods of less than one year are not annualized.
D Total returns would have been lower if certain expenses had not been reduced during the applicable periods shown.
E Fees and expenses of any underlying mutual funds or exchange-traded funds (ETFs) are not included in the Fund's expense ratio. The Fund indirectly bears its proportionate share of these expenses. For additional expense information related to investments in Fidelity Central Funds, please refer to the "Investments in Fidelity Central Funds" note found in the Notes to Financial Statements section of the most recent Annual or Semi-Annual report.
F Expense ratios reflect operating expenses of the class. Expenses before reductions do not reflect amounts reimbursed, waived, or reduced through arrangements with the investment adviser, brokerage services, or other offset arrangements, if applicable, and do not represent the amount paid by the class during periods when reimbursements, waivers or reductions occur.
G Annualized.
H Amount does not include the portfolio activity of any underlying mutual funds or exchange-traded funds (ETFs).
| Fidelity Advisor® Emerging Markets Discovery Fund Class Z |
| |
| | Six months ended (Unaudited) April 30, 2023 | | Years ended October 31, 2022 | | 2021 | | 2020 | | 2019 | | 2018 A |
Selected Per-Share Data | | | | | | | | | | | | |
| Net asset value, beginning of period | $ | 13.00 | $ | 18.51 | $ | 14.04 | $ | 13.77 | $ | 12.13 | $ | 13.19 |
| Income from Investment Operations | | | | | | | | | | | | |
Net investment income (loss) B,C | | .13 | | .37 | | .19 | | .10 | | .18 | | - D |
| Net realized and unrealized gain (loss) | | 2.11 | | (3.95) | | 4.40 | | .35 | | 1.72 | | (1.06) |
| Total from investment operations | | 2.24 | | (3.58) | | 4.59 | | .45 | | 1.90 | | (1.06) |
| Distributions from net investment income | | (.26) | | (.44) | | (.12) | | (.18) | | (.26) | | - |
| Distributions from net realized gain | | - | | (1.49) | | - | | - | | (.01) | | - |
| Total distributions | | (.26) | | (1.93) | | (.12) | | (.18) | | (.26) E | | - |
| Net asset value, end of period | $ | 14.98 | $ | 13.00 | $ | 18.51 | $ | 14.04 | $ | 13.77 | $ | 12.13 |
Total Return F,G | | 17.35% | | (21.27)% | | 32.82% | | 3.24% | | 15.97% | | (8.04)% |
Ratios to Average Net Assets C,H,I | | | | | | | | | | | | |
| Expenses before reductions | | .99% J | | 1.03% | | 1.05% | | 1.09% | | 1.10% | | 1.17% J |
| Expenses net of fee waivers, if any | | .99% J | | 1.03% | | 1.05% | | 1.08% | | 1.10% | | 1.02% J |
| Expenses net of all reductions | | .99% J | | 1.03% | | 1.05% | | 1.06% | | 1.10% | | .98% J |
| Net investment income (loss) | | 1.82% J | | 2.57% | | 1.04% | | .78% | | 1.40% | | (.12)% J |
| Supplemental Data | | | | | | | | | | | | |
| Net assets, end of period (000 omitted) | $ | 73,203 | $ | 29,546 | $ | 16,365 | $ | 11,561 | $ | 18,267 | $ | 1,412 |
Portfolio turnover rate K | | 26% J | | 33% | | 64% | | 43% | | 80% | | 98% |
A For the period October 2, 2018 (commencement of sale of shares) through October 31, 2018.
B Calculated based on average shares outstanding during the period.
C Net investment income (loss) is affected by the timing of the declaration of dividends by any underlying mutual funds or exchange-traded funds (ETFs). Net investment income (loss) of any mutual funds or ETFs is not included in the Fund's net investment income (loss) ratio.
D Amount represents less than $.005 per share.
E Total distributions per share do not sum due to rounding.
F Total returns for periods of less than one year are not annualized.
G Total returns would have been lower if certain expenses had not been reduced during the applicable periods shown.
H Fees and expenses of any underlying mutual funds or exchange-traded funds (ETFs) are not included in the Fund's expense ratio. The Fund indirectly bears its proportionate share of these expenses. For additional expense information related to investments in Fidelity Central Funds, please refer to the "Investments in Fidelity Central Funds" note found in the Notes to Financial Statements section of the most recent Annual or Semi-Annual report.
I Expense ratios reflect operating expenses of the class. Expenses before reductions do not reflect amounts reimbursed, waived, or reduced through arrangements with the investment adviser, brokerage services, or other offset arrangements, if applicable, and do not represent the amount paid by the class during periods when reimbursements, waivers or reductions occur.
J Annualized.
K Amount does not include the portfolio activity of any underlying mutual funds or exchange-traded funds (ETFs).
For the period ended April 30, 2023
1. Organization.
Fidelity Emerging Markets Discovery Fund (the Fund) is a fund of Fidelity Investment Trust (the Trust) and is authorized to issue an unlimited number of shares. The Trust is registered under the Investment Company Act of 1940, as amended (the 1940 Act), as an open-end management investment company organized as a Massachusetts business trust. The Fund offers Class A, Class M, Class C, Emerging Markets Discovery, Class I and Class Z shares, each of which has equal rights as to assets and voting privileges. Class A, Class M, Class C, Class I and Class Z are Fidelity Advisor classes. Each class has exclusive voting rights with respect to matters that affect that class. Class C shares will automatically convert to Class A shares after a holding period of eight years from the initial date of purchase, with certain exceptions. The Fund's investments in emerging markets can be subject to social, economic, regulatory, and political uncertainties and can be extremely volatile.
2. Investments in Fidelity Central Funds.
Funds may invest in Fidelity Central Funds, which are open-end investment companies generally available only to other investment companies and accounts managed by the investment adviser and its affiliates. The Schedule of Investments lists any Fidelity Central Funds held as an investment as of period end, but does not include the underlying holdings of each Fidelity Central Fund. An investing fund indirectly bears its proportionate share of the expenses of the underlying Fidelity Central Funds.
Based on its investment objective, each Fidelity Central Fund may invest or participate in various investment vehicles or strategies that are similar to those of the investing fund. These strategies are consistent with the investment objectives of the investing fund and may involve certain economic risks which may cause a decline in value of each of the Fidelity Central Funds and thus a decline in the value of the investing fund.
| Fidelity Central Fund | Investment Manager | Investment Objective | Investment Practices | Expense Ratio A |
| Fidelity Money Market Central Funds | Fidelity Management & Research Company LLC (FMR) | Each fund seeks to obtain a high level of current income consistent with the preservation of capital and liquidity. | Short-term Investments | Less than .005% |
A Expenses expressed as a percentage of average net assets and are as of each underlying Central Fund's most recent annual or semi-annual shareholder report.
A complete unaudited list of holdings for each Fidelity Central Fund is available upon request or at the Securities and Exchange Commission website at www.sec.gov. In addition, the financial statements of the Fidelity Central Funds which contain the significant accounting policies (including investment valuation policies) of those funds, and are not covered by the Report of Independent Registered Public Accounting Firm, are available on the Securities and Exchange Commission website or upon request.
3. Significant Accounting Policies.
The Fund is an investment company and applies the accounting and reporting guidance of the Financial Accounting Standards Board (FASB) Accounting Standards Codification Topic 946 Financial Services - Investment Companies . The financial statements have been prepared in conformity with accounting principles generally accepted in the United States of America (GAAP), which require management to make certain estimates and assumptions at the date of the financial statements. Actual results could differ from those estimates. Subsequent events, if any, through the date that the financial statements were issued have been evaluated in the preparation of the financial statements. The Fund's Schedule of Investments lists any underlying mutual funds or exchange-traded funds (ETFs) but does not include the underlying holdings of these funds. The following summarizes the significant accounting policies of the Fund:
Investment Valuation. Investments are valued as of 4:00 p.m. Eastern time on the last calendar day of the period. The Board of Trustees (the Board) has designated the Fund's investment adviser as the valuation designee responsible for the fair valuation function and performing fair value determinations as needed. The investment adviser has established a Fair Value Committee (the Committee) to carry out the day-to-day fair valuation responsibilities and has adopted policies and procedures to govern the fair valuation process and the activities of the Committee. In accordance with these fair valuation policies and procedures, which have been approved by the Board, the Fund attempts to obtain prices from one or more third party pricing services or brokers to value its investments. When current market prices, quotations or currency exchange rates are not readily available or reliable, investments will be fair valued in good faith by the Committee, in accordance with the policies and procedures. Factors used in determining fair value vary by investment type and may include market or investment specific events, transaction data, estimated cash flows, and market observations of comparable investments. The frequency that the fair valuation procedures are used cannot be predicted and they may be utilized to a significant extent. The Committee manages the Fund's fair valuation practices and maintains the fair valuation policies and procedures. The Fund's investment adviser reports to the Board information regarding the fair valuation process and related material matters.
The Fund categorizes the inputs to valuation techniques used to value its investments into a disclosure hierarchy consisting of three levels as shown below:
Level 1 - unadjusted quoted prices in active markets for identical investments
Level 2 - other significant observable inputs (including quoted prices for similar investments, interest rates, prepayment speeds, etc.)
Level 3 - unobservable inputs (including the Fund's own assumptions based on the best information available)
Valuation techniques used to value the Fund's investments by major category are as follows:
Equity securities, including restricted securities, for which market quotations are readily available, are valued at the last reported sale price or official closing price as reported by a third party pricing service on the primary market or exchange on which they are traded and are categorized as Level 1 in the hierarchy. In the event there were no sales during the day or closing prices are not available, securities are valued at the last quoted bid price or may be valued using the last available price and are generally categorized as Level 2 in the hierarchy. For foreign equity securities, when market or security specific events arise, comparisons to the valuation of American Depositary Receipts (ADRs), futures contracts, ETFs and certain indexes as well as quoted prices for similar securities may be used and would be categorized as Level 2 in the hierarchy. For equity securities, including restricted securities, where observable inputs are limited, assumptions about market activity and risk are used and these securities may be categorized as Level 3 in the hierarchy.
Investments in open-end mutual funds, including the Fidelity Central Funds, are valued at their closing net asset value (NAV) each business day and are categorized as Level 1 in the hierarchy.
Changes in valuation techniques may result in transfers in or out of an assigned level within the disclosure hierarchy. The aggregate value of investments by input level as of April 30, 2023 is included at the end of the Fund's Schedule of Investments.
Foreign Currency. Certain Funds may use foreign currency contracts to facilitate transactions in foreign-denominated securities. Gains and losses from these transactions may arise from changes in the value of the foreign currency or if the counterparties do not perform under the contracts' terms.
Foreign-denominated assets, including investment securities, and liabilities are translated into U.S. dollars at the exchange rates at period end. Purchases and sales of investment securities, income and dividends received, and expenses denominated in foreign currencies are translated into U.S. dollars at the exchange rate in effect on the transaction date.
The effects of exchange rate fluctuations on investments are included with the net realized and unrealized gain (loss) on investment securities. Other foreign currency transactions resulting in realized and unrealized gain (loss) are disclosed separately.
Investment Transactions and Income. For financial reporting purposes, the Fund's investment holdings and NAV include trades executed through the end of the last business day of the period. The NAV per share for processing shareholder transactions is calculated as of the close of business of the New York Stock Exchange (NYSE), normally 4:00 p.m. Eastern time and includes trades executed through the end of the prior business day. Gains and losses on securities sold are determined on the basis of identified cost. Commissions paid to certain brokers with whom the investment adviser, or its affiliates, places trades on behalf of a fund include an amount in addition to trade execution, which may be rebated back to a fund. Any such rebates are included in net realized gain (loss) on investments in the Statement of Operations. Dividend income is recorded on the ex-dividend date, except for certain dividends from foreign securities where the ex-dividend date may have passed, which are recorded as soon as the Fund is informed of the ex-dividend date. Non-cash dividends included in dividend income, if any, are recorded at the fair market value of the securities received. Income and capital gain distributions from Fidelity Central Funds, if any, are recorded on the ex-dividend date. Interest income is accrued as earned and includes coupon interest and amortization of premium and accretion of discount on debt securities as applicable. Investment income is recorded net of foreign taxes withheld where recovery of such taxes is uncertain. Funds may file withholding tax reclaims in certain jurisdictions to recover a portion of amounts previously withheld. Any withholding tax reclaims income is included in the Statement of Operations in foreign taxes withheld. Any receivables for withholding tax reclaims are included in the Statement of Assets and Liabilities in dividends receivable.
Class Allocations and Expenses. Investment income, realized and unrealized capital gains and losses, common expenses of a fund, and certain fund-level expense reductions, if any, are allocated daily on a pro-rata basis to each class based on the relative net assets of each class to the total net assets of a fund. Each class differs with respect to transfer agent and distribution and service plan fees incurred, as applicable. Certain expense reductions may also differ by class, if applicable. For the reporting period, the allocated portion of income and expenses to each class as a percent of its average net assets may vary due to the timing of recording these transactions in relation to fluctuating net assets of the classes. Expenses directly attributable to a fund are charged to that fund. Expenses attributable to more than one fund are allocated among the respective funds on the basis of relative net assets or other appropriate methods. Expenses included in the accompanying financial statements reflect the expenses of that fund and do not include any expenses associated with any underlying mutual funds or exchange-traded funds. Although not included in a fund's expenses, a fund indirectly bears its proportionate share of these expenses through the net asset value of each underlying mutual fund or exchange-traded fund. Expense estimates are accrued in the period to which they relate and adjustments are made when actual amounts are known.
Income Tax Information and Distributions to Shareholders. Each year, the Fund intends to qualify as a regulated investment company under Subchapter M of the Internal Revenue Code, including distributing substantially all of its taxable income and realized gains. As a result, no provision for U.S. Federal income taxes is required. The Fund files a U.S. federal tax return, in addition to state and local tax returns as required. The Fund's federal income tax returns are subject to examination by the Internal Revenue Service (IRS) for a period of three fiscal years after they are filed. State and local tax returns may be subject to examination for an additional fiscal year depending on the jurisdiction. Foreign taxes are provided for based on the Fund's understanding of the tax rules and rates that exist in the foreign markets in which it invests. The Fund is subject to a tax imposed on capital gains by certain countries in which it invests. An estimated deferred tax liability for net unrealized appreciation on the applicable securities is included in deferred taxes on the Statement of Assets & Liabilities.
Distributions are declared and recorded on the ex-dividend date. Income and capital gain distributions are declared separately for each class. Income and capital gain distributions are determined in accordance with income tax regulations, which may differ from GAAP.
Capital accounts within the financial statements are adjusted for permanent book-tax differences. These adjustments have no impact on net assets or the results of operations. Capital accounts are not adjusted for temporary book-tax differences which will reverse in a subsequent period.
Book-tax differences are primarily due to foreign currency transactions, certain foreign taxes, passive foreign investment companies (PFIC), capital loss carryforwards and losses deferred due to wash sales.
As of period end, the cost and unrealized appreciation (depreciation) in securities, and derivatives if applicable, for federal income tax purposes were as follows:
| Gross unrealized appreciation | $95,262,176 |
| Gross unrealized depreciation | (57,174,212) |
| Net unrealized appreciation (depreciation) | $38,087,964 |
| Tax cost | $640,217,402 |
Capital loss carryforwards are only available to offset future capital gains of the Fund to the extent provided by regulations and may be limited. The capital loss carryforward information presented below, including any applicable limitation, is estimated as of prior fiscal period end and is subject to adjustment.
| Short-term | $(5,541,193) |
| Long-term | (1,724,346) |
| Total capital loss carryforward | $(7,265,539) |
Restricted Securities (including Private Placements). Funds may invest in securities that are subject to legal or contractual restrictions on resale. These securities generally may be resold in transactions exempt from registration or to the public if the securities are registered. Disposal of these securities may involve time-consuming negotiations and expense, and prompt sale at an acceptable price may be difficult. Information regarding restricted securities held at period end is included at the end of the Schedule of Investments, if applicable.
4. Purchases and Sales of Investments.
Purchases and sales of securities, other than short-term securities and in-kind transactions, as applicable, are noted in the table below.
| | Purchases ($) | Sales ($) |
| Fidelity Emerging Markets Discovery Fund | 242,782,377 | 71,880,080 |
5. Fees and Other Transactions with Affiliates.
Management Fee. Fidelity Management & Research Company LLC (the investment adviser) and its affiliates provide the Fund with investment management related services for which the Fund pays a monthly management fee. The management fee is the sum of an individual fund fee rate that is based on an annual rate of .60% of the Fund's average net assets and an annualized group fee rate that averaged .23% during the period. The group fee rate is based upon the monthly average net assets of a group of registered investment companies with which the investment adviser has management contracts. The group fee rate decreases as assets under management increase and increases as assets under management decrease. For the reporting period, the total annualized management fee rate was .83% of the Fund's average net assets.
Distribution and Service Plan Fees. In accordance with Rule 12b-1 of the 1940 Act, the Fund has adopted separate Distribution and Service Plans for each class of shares. Certain classes pay Fidelity Distributors Company LLC (FDC), an affiliate of the investment adviser, separate Distribution and Service Fees, each of which is based on an annual percentage of each class' average net assets. In addition, FDC may pay financial intermediaries for selling shares of the Fund and providing shareholder support services. For the period, the Distribution and Service Fee rates, total fees and amounts retained by FDC were as follows:
| | Distribution Fee | Service Fee | Total Fees | Retained by FDC |
| Class A | - % | .25% | $23,306 | $775 |
| Class M | .25% | .25% | 12,846 | 152 |
| Class C | .75% | .25% | 17,581 | 2,324 |
| | | | $53,733 | $3,251 |
Sales Load. FDC may receive a front-end sales charge of up to 5.75% for selling Class A shares and 3.50% for selling Class M shares, some of which is paid to financial intermediaries for selling shares of the Fund. Depending on the holding period, FDC may receive contingent deferred sales charges levied on Class A, Class M and Class C redemptions. The deferred sales charges are 1.00% for Class C shares, 1.00% for certain purchases of Class A shares and .25% for certain purchases of Class M shares.
For the period, sales charge amounts retained by FDC were as follows:
| | Retained by FDC |
| Class A | $13,559 |
| Class M | 1,439 |
Class C A | 733 |
| | $15,731 |
A When Class C shares are initially sold, FDC pays commissions from its own resources to financial intermediaries through which the sales are made.
Transfer Agent Fees. Fidelity Investments Institutional Operations Company LLC (FIIOC), an affiliate of the investment adviser, is the transfer, dividend disbursing and shareholder servicing agent for each class of the Fund. FIIOC receives account fees and asset-based fees that vary according to the account size and type of account of the shareholders of the respective classes of the Fund, except for Class Z. FIIOC receives an asset-based fee of Class Z's average net assets. FIIOC pays for typesetting, printing and mailing of shareholder reports, except proxy statements.
For the period, transfer agent fees for each class were as follows:
| | Amount | % of Class-Level Average Net Assets A |
| Class A | $22,140 | .24 |
| Class M | 6,392 | .25 |
| Class C | 4,524 | .26 |
| Emerging Markets Discovery | 298,554 | .21 |
| Class I | 165,531 | .17 |
| Class Z | 12,254 | .04 |
| | $509,395 | |
A Annualized
Accounting Fees. Fidelity Service Company, Inc. (FSC), an affiliate of the investment adviser, maintains the Fund's accounting records. The accounting fee is based on the level of average net assets for each month. For the period, the fees were equivalent to the following annualized rates:
| | % of Average Net Assets |
| Fidelity Emerging Markets Discovery Fund | .05 |
Brokerage Commissions. A portion of portfolio transactions were placed with brokerage firms which are affiliates of the investment adviser. Brokerage commissions are included in net realized gain (loss) and change in net unrealized appreciation (depreciation) in the Statement of Operations. The commissions paid to these affiliated firms were as follows:
| | Amount |
| Fidelity Emerging Markets Discovery Fund | $354 |
Interfund Trades. Funds may purchase from or sell securities to other Fidelity Funds under procedures adopted by the Board. The procedures have been designed to ensure these interfund trades are executed in accordance with Rule 17a-7 of the 1940 Act. Any interfund trades are included within the respective purchases and sales amounts shown in the Purchases and Sales of Investments note. Interfund trades during the period are noted in the table below.
| | Purchases ($) | Sales ($) | Realized Gain (Loss) ($) |
| Fidelity Emerging Markets Discovery Fund | 3,101,295 | - | - |
6. Committed Line of Credit.
Certain Funds participate with other funds managed by the investment adviser or an affiliate in a $4.25 billion credit facility (the "line of credit") to be utilized for temporary or emergency purposes to fund shareholder redemptions or for other short-term liquidity purposes. The participating funds have agreed to pay commitment fees on their pro-rata portion of the line of credit, which are reflected in Miscellaneous expenses on the Statement of Operations, and are listed below. During the period, there were no borrowings on this line of credit.
| | Amount |
| Fidelity Emerging Markets Discovery Fund | $529 |
7. Security Lending.
Funds lend portfolio securities from time to time in order to earn additional income. Lending agents are used, including National Financial Services (NFS), an affiliate of the investment adviser. Pursuant to a securities lending agreement, NFS will receive a fee, which is capped at 9.9% of a fund's daily lending revenue, for its services as lending agent. A fund may lend securities to certain qualified borrowers, including NFS. On the settlement date of the loan, a fund receives collateral (in the form of U.S. Treasury obligations, letters of credit and/or cash) against the loaned securities and maintains collateral in an amount not less than 100% of the market value of the loaned securities during the period of the loan. The market value of the loaned securities is determined at the close of business of a fund and any additional required collateral is delivered to a fund on the next business day. A fund or borrower may terminate the loan at any time, and if the borrower defaults on its obligation to return the securities loaned because of insolvency or other reasons, a fund may apply collateral received from the borrower against the obligation. A fund may experience delays and costs in recovering the securities loaned. Any cash collateral received is invested in the Fidelity Securities Lending Cash Central Fund. Any loaned securities are identified as such in the Schedule of Investments, and the value of loaned securities and cash collateral at period end, as applicable, are presented in the Statement of Assets and Liabilities. Security lending income represents the income earned on investing cash collateral, less rebates paid to borrowers and any lending agent fees associated with the loan, plus any premium payments received for lending certain types of securities. Security lending income is presented in the Statement of Operations as a component of income from Fidelity Central Funds. Affiliated security lending activity, if any, was as follows:
| | Total Security Lending Fees Paid to NFS | Security Lending Income From Securities Loaned to NFS | Value of Securities Loaned to NFS at Period End |
| Fidelity Emerging Markets Discovery Fund | $6,784 | $- | $- |
8. Expense Reductions.
Through arrangements with the Fund's custodian, credits realized as a result of certain uninvested cash balances were used to reduce the Fund's expenses. During the period, custodian credits reduced the Fund's expenses by $374. During the period, transfer agent credits reduced each class' expenses as noted in the table below.
| | Expense reduction |
| Class A | $56 |
| Class M | 192 |
| | $248 |
In addition, during the period the investment adviser or an affiliate reimbursed and/or waived a portion of fund-level operating expenses in the amount of $13,152.
9. Distributions to Shareholders.
Distributions to shareholders of each class were as follows:
| | Six months ended April 30, 2023 | Year ended October 31, 2022 |
| Fidelity Emerging Markets Discovery Fund | | |
| Distributions to shareholders | | |
| Class A | $ 244,475 | $1,910,190 |
| Class M | 51,851 | 606,383 |
| Class C | 19,009 | 467,124 |
| Emerging Markets Discovery | 4,513,320 | 27,737,464 |
| Class I | 3,021,352 | 2,782,285 |
| Class Z | 789,864 | 1,697,356 |
Total | $8,639,871 | $35,200,802 |
10. Share Transactions.
Share transactions for each class were as follows and may contain in-kind transactions, automatic conversions between classes or exchanges between affiliated funds:
| | Shares | Shares | Dollars | Dollars |
| | Six months ended April 30, 2023 | Year ended October 31, 2022 | Six months ended April 30, 2023 | Year ended October 31, 2022 |
| Fidelity Emerging Markets Discovery Fund | | | | |
| Class A | | | | |
| Shares sold | 220,319 | 314,404 | $3,191,987 | $4,478,487 |
| Reinvestment of distributions | 17,518 | 120,206 | 244,303 | 1,910,075 |
| Shares redeemed | (94,524) | (217,629) | (1,355,853) | (3,180,396) |
| Net increase (decrease) | 143,313 | 216,981 | $2,080,437 | $3,208,166 |
| Class M | | | | |
| Shares sold | 70,715 | 36,386 | $1,025,859 | $551,246 |
| Reinvestment of distributions | 3,721 | 38,167 | 51,851 | 606,098 |
| Shares redeemed | (28,447) | (68,600) | (410,079) | (1,005,289) |
| Net increase (decrease) | 45,989 | 5,953 | $667,631 | $152,055 |
| Class C | | | | |
| Shares sold | 40,506 | 28,436 | $562,779 | $399,577 |
| Reinvestment of distributions | 1,399 | 30,156 | 19,009 | 467,124 |
| Shares redeemed | (42,090) | (92,682) | (591,347) | (1,325,981) |
| Net increase (decrease) | (185) | (34,090) | $(9,559) | $(459,280) |
| Emerging Markets Discovery | | | | |
| Shares sold | 4,221,938 | 10,307,936 | $61,414,296 | $148,982,256 |
| Reinvestment of distributions | 291,173 | 1,414,497 | 4,078,445 | 22,589,516 |
| Shares redeemed | (2,185,733) | (7,875,882) | (31,141,996) | (118,180,120) |
| Net increase (decrease) | 2,327,378 | 3,846,551 | $34,350,745 | $53,391,652 |
| Class I | | | | |
| Shares sold | 8,436,270 | 9,283,493 | $122,447,728 | $129,714,339 |
| Reinvestment of distributions | 205,837 | 170,907 | 2,893,435 | 2,737,935 |
| Shares redeemed | (1,792,797) | (1,015,195) | (25,767,525) | (14,790,592) |
| Net increase (decrease) | 6,849,310 | 8,439,205 | $99,573,638 | $117,661,682 |
| Class Z | | | | |
| Shares sold | 3,557,254 | 1,609,828 | $50,728,501 | $22,578,984 |
| Reinvestment of distributions | 55,484 | 104,684 | 777,160 | 1,671,802 |
| Shares redeemed | (999,718) | (326,408) | (14,575,511) | (4,977,502) |
| Net increase (decrease) | 2,613,020 | 1,388,104 | $36,930,150 | $19,273,284 |
11. Other.
A fund's organizational documents provide former and current trustees and officers with a limited indemnification against liabilities arising in connection with the performance of their duties to the fund. In the normal course of business, a fund may also enter into contracts that provide general indemnifications. A fund's maximum exposure under these arrangements is unknown as this would be dependent on future claims that may be made against a fund. The risk of material loss from such claims is considered remote.
12. Risk and Uncertainties.
Many factors affect a fund's performance. Developments that disrupt global economies and financial markets, such as pandemics, epidemics, outbreaks of infectious diseases, war, terrorism, and environmental disasters, may significantly affect a fund's investment performance. The effects of these developments to a fund will be impacted by the types of securities in which a fund invests, the financial condition, industry, economic sector, and geographic location of an issuer, and a fund's level of investment in the securities of that issuer. Significant concentrations in security types, issuers, industries, sectors, and geographic locations may magnify the factors that affect a fund's performance.
Top Holdings (% of Fund's net assets) |
| |
| Taiwan Semiconductor Manufacturing Co. Ltd. (Taiwan, Semiconductors & Semiconductor Equipment) | 4.5 | |
| Samsung Electronics Co. Ltd. (Korea (South), Technology Hardware, Storage & Peripherals) | 2.8 | |
| Tencent Holdings Ltd. (China, Interactive Media & Services) | 2.7 | |
| HDFC Bank Ltd. (India, Banks) | 1.6 | |
| Alibaba Group Holding Ltd. (China, Broadline Retail) | 1.6 | |
| Meituan Class B (China, Hotels, Restaurants & Leisure) | 1.1 | |
| Reliance Industries Ltd. (India, Oil, Gas & Consumable Fuels) | 1.1 | |
| Sea Ltd. ADR (Singapore, Entertainment) | 0.9 | |
| Ping An Insurance Group Co. of China Ltd. (H Shares) (China, Insurance) | 0.9 | |
| China Construction Bank Corp. (H Shares) (China, Banks) | 0.8 | |
| | 18.0 | |
| |
| Market Sectors (% of Fund's net assets) |
| |
| Financials | 15.6 | |
| Information Technology | 10.8 | |
| Energy | 10.6 | |
| Consumer Discretionary | 9.2 | |
| Materials | 7.5 | |
| Communication Services | 6.5 | |
| Consumer Staples | 4.3 | |
| Industrials | 4.2 | |
| Utilities | 3.5 | |
| Health Care | 2.4 | |
| Real Estate | 0.8 | |
| |
Asset Allocation (% of Fund's net assets) |
|
|
Geographic Diversification (% of Fund's net assets) |
|
* Includes Short-Term investments and Net Other Assets (Liabilities). Percentages are adjusted for the effect of derivatives, if applicable. |
| |
Fidelity® Total Emerging Markets Fund
| Common Stocks - 57.2% |
| | | Shares | Value ($) |
| Brazil - 3.8% | | | |
| Arezzo Industria e Comercio SA | | 15,445 | 205,549 |
| Atacadao SA | | 151,800 | 327,168 |
| Dexco SA | | 216,843 | 256,066 |
| ENGIE Brasil Energia SA | | 34,800 | 287,663 |
| Equatorial Energia SA | | 65,400 | 358,482 |
| Localiza Rent a Car SA | | 52,271 | 607,931 |
| Localiza Rent a Car SA rights 5/11/23 (a) | | 243 | 836 |
| LOG Commercial Properties e Participacoes SA | | 28,100 | 92,337 |
| Lojas Renner SA | | 89,666 | 284,757 |
| MercadoLibre, Inc. (a) | | 535 | 683,457 |
| Multiplan Empreendimentos Imobiliarios SA | | 12,000 | 62,312 |
| PagSeguro Digital Ltd. (a) | | 99,745 | 981,491 |
| Raia Drogasil SA | | 154,100 | 811,931 |
| Rede D'Oregon Sao Luiz SA (b) | | 38,954 | 178,611 |
| Rumo SA | | 143,200 | 565,588 |
| StoneCo Ltd. Class A (a) | | 49,712 | 612,452 |
| Suzano Papel e Celulose SA | | 17,300 | 138,045 |
| Transmissora Alianca de Energia Eletrica SA | | 33,500 | 244,947 |
| Vale SA sponsored ADR | | 95,168 | 1,371,371 |
| XP, Inc. Class A (a) | | 62,135 | 887,909 |
TOTAL BRAZIL | | | 8,958,903 |
| Canada - 0.5% | | | |
| Barrick Gold Corp. | | 64,700 | 1,231,888 |
| Chile - 0.6% | | | |
| Antofagasta PLC | | 41,058 | 753,613 |
| Banco de Chile | | 7,212,100 | 767,891 |
TOTAL CHILE | | | 1,521,504 |
| China - 17.4% | | | |
| Akeso, Inc. (a)(b)(c) | | 29,890 | 164,162 |
| Alibaba Group Holding Ltd. (a) | | 350,073 | 3,701,541 |
| Alibaba Group Holding Ltd. sponsored ADR (a) | | 3,957 | 335,118 |
| Angelalign Technology, Inc. (b) | | 5,264 | 66,030 |
| Ant International Co. Ltd. Class C (a)(d)(e) | | 424,550 | 653,807 |
| Baidu, Inc.: | | | |
| Class A (a) | | 14,150 | 212,985 |
| sponsored ADR (a) | | 2,800 | 337,708 |
| BeiGene Ltd. ADR (a) | | 1,252 | 319,210 |
| Beijing Enlight Media Co. Ltd. (A Shares) | | 106,500 | 157,731 |
| Bilibili, Inc. ADR (a)(c) | | 26,043 | 530,235 |
| BYD Co. Ltd. (H Shares) | | 32,183 | 975,990 |
| C&S Paper Co. Ltd. (A Shares) | | 137,500 | 234,668 |
| China Communications Services Corp. Ltd. (H Shares) | | 466,000 | 255,352 |
| China Construction Bank Corp. (H Shares) | | 2,942,000 | 1,966,805 |
| China Gas Holdings Ltd. | | 218,344 | 280,893 |
| China Life Insurance Co. Ltd. (H Shares) | | 617,000 | 1,185,353 |
| China Merchants Holdings International Co. Ltd. | | 168,101 | 249,432 |
| China Merchants Shekou Industrial Zone Holdings Co. Ltd. (A Shares) | | 27,800 | 54,968 |
| China Overseas Land and Investment Ltd. | | 76,040 | 192,848 |
| China Petroleum & Chemical Corp. (H Shares) | | 1,368,000 | 896,609 |
| China Resources Beer Holdings Co. Ltd. | | 92,666 | 715,825 |
| China Resources Land Ltd. | | 82,510 | 384,229 |
| China Tower Corp. Ltd. (H Shares) (b) | | 840,631 | 107,284 |
| China Vanke Co. Ltd. (H Shares) | | 82,200 | 128,503 |
| Daqin Railway Co. Ltd. (A Shares) | | 499,500 | 556,940 |
| Daqo New Energy Corp. ADR (a) | | 1,204 | 55,288 |
| ENN Energy Holdings Ltd. | | 31,700 | 434,658 |
| ESR Group Ltd. (b) | | 33,200 | 51,896 |
| Greentown China Holdings Ltd. | | 50,500 | 60,693 |
| Guangdong Investment Ltd. | | 306,000 | 292,529 |
| Haier Smart Home Co. Ltd. | | 139,800 | 455,690 |
| Haier Smart Home Co. Ltd. (A Shares) | | 12,560 | 43,186 |
| Haitian International Holdings Ltd. | | 105,000 | 272,820 |
| Hansoh Pharmaceutical Group Co. Ltd. (b) | | 122,113 | 222,771 |
| Innovent Biologics, Inc. (a)(b) | | 49,096 | 236,057 |
| JD Health International, Inc. (a)(b) | | 14,404 | 103,941 |
| JD.com, Inc.: | | | |
| Class A | | 39,886 | 711,879 |
| sponsored ADR | | 2,721 | 97,194 |
| Jiumaojiu International Holdings Ltd. (b) | | 100,733 | 226,338 |
| KE Holdings, Inc. ADR (a) | | 15,567 | 244,246 |
| Kuaishou Technology Class B (a)(b) | | 17,727 | 117,355 |
| Kunlun Energy Co. Ltd. | | 374,040 | 346,738 |
| Kweichow Moutai Co. Ltd. (A Shares) | | 2,600 | 663,402 |
| Lenovo Group Ltd. | | 46,000 | 47,062 |
| Li Auto, Inc.: | | | |
| ADR (a) | | 41,151 | 967,049 |
| Class A (a) | | 3,300 | 39,085 |
| Li Ning Co. Ltd. | | 80,387 | 574,897 |
| Longfor Properties Co. Ltd. (b) | | 34,480 | 94,354 |
| LONGi Green Energy Technology Co. Ltd. | | 8,900 | 45,062 |
| Medlive Technology Co. Ltd. (b) | | 61,955 | 68,610 |
| Meituan Class B (a)(b) | | 156,339 | 2,671,905 |
| NetEase, Inc. ADR | | 5,314 | 473,637 |
| New Oriental Education & Technology Group, Inc. sponsored ADR (a) | | 9,005 | 410,538 |
| OPT Machine Vision Tech Co. Ltd. | | 1,500 | 32,519 |
| PDD Holdings, Inc. ADR (a) | | 17,633 | 1,201,689 |
| Ping An Insurance Group Co. of China Ltd. (H Shares) | | 293,500 | 2,141,235 |
| Proya Cosmetics Co. Ltd. (A Shares) | | 30,540 | 743,022 |
| Shangri-La Asia Ltd. (a) | | 108,000 | 99,632 |
| Shenzhen Mindray Bio-Medical Electronics Co. Ltd. (A Shares) | | 10,443 | 472,125 |
| Shenzhou International Group Holdings Ltd. | | 17,005 | 163,336 |
| Silergy Corp. | | 22,903 | 361,256 |
| Sinopec Engineering Group Co. Ltd. (H Shares) | | 308,000 | 159,717 |
| Sinopharm Group Co. Ltd. (H Shares) | | 65,375 | 231,576 |
| Sinotruk Hong Kong Ltd. | | 101,000 | 154,352 |
| Sunny Optical Technology Group Co. Ltd. | | 39,447 | 416,849 |
| Tencent Holdings Ltd. | | 144,748 | 6,429,144 |
| Tongdao Liepin Group (a) | | 44,559 | 57,091 |
| TravelSky Technology Ltd. (H Shares) | | 140,000 | 279,458 |
| Trip.com Group Ltd. ADR (a) | | 35,598 | 1,264,085 |
| Tsingtao Brewery Co. Ltd. (H Shares) | | 72,000 | 770,805 |
| Uni-President China Holdings Ltd. | | 255,600 | 255,208 |
| Venus MedTech Hangzhou, Inc. (H Shares) (a)(b) | | 35,747 | 50,045 |
| WuXi AppTec Co. Ltd. (H Shares) (b) | | 17,453 | 153,498 |
| Wuxi Biologics (Cayman), Inc. (a)(b) | | 104,998 | 626,086 |
| Xinyi Solar Holdings Ltd. | | 88,000 | 94,609 |
| Zai Lab Ltd. (a) | | 70,111 | 245,466 |
| Zhuzhou CRRC Times Electric Co. Ltd. (H Shares) | | 88,700 | 357,993 |
TOTAL CHINA | | | 41,453,902 |
| Greece - 0.4% | | | |
| Alpha Bank SA (a) | | 556,800 | 696,366 |
| Piraeus Financial Holdings SA (a) | | 126,700 | 298,767 |
TOTAL GREECE | | | 995,133 |
| Hong Kong - 0.5% | | | |
| Huanxi Media Group Ltd. (a) | | 770,309 | 97,309 |
| Kerry Properties Ltd. | | 39,000 | 100,624 |
| Prudential PLC | | 70,335 | 1,076,199 |
TOTAL HONG KONG | | | 1,274,132 |
| Hungary - 0.2% | | | |
| Richter Gedeon PLC | | 17,860 | 431,001 |
| India - 9.5% | | | |
| Apollo Hospitals Enterprise Ltd. | | 7,041 | 390,167 |
| Bajaj Auto Ltd. | | 5,100 | 277,100 |
| Bajaj Finance Ltd. | | 12,364 | 954,681 |
| Bandhan Bank Ltd. (a)(b) | | 192,500 | 542,658 |
| Bharat Electronics Ltd. | | 373,600 | 473,652 |
| Bharti Airtel Ltd. | | 54,719 | 536,228 |
| Campus Activewear Ltd. | | 19,717 | 86,196 |
| Divi's Laboratories Ltd. | | 4,477 | 179,546 |
| Embassy Office Parks (REIT) | | 28,000 | 113,000 |
| HDFC Bank Ltd. | | 185,696 | 3,843,355 |
| HDFC Standard Life Insurance Co. Ltd. (b) | | 123,600 | 803,260 |
| Hindustan Aeronautics Ltd. | | 7,900 | 283,207 |
| Housing Development Finance Corp. Ltd. | | 9,500 | 324,024 |
| Indraprastha Gas Ltd. | | 67,493 | 410,360 |
| Infosys Ltd. | | 15,402 | 237,891 |
| Infosys Ltd. sponsored ADR | | 94,788 | 1,473,006 |
| ITC Ltd. | | 208,213 | 1,086,927 |
| JK Cement Ltd. | | 24,174 | 888,393 |
| Larsen & Toubro Ltd. | | 32,669 | 948,155 |
| Mahanagar Gas Ltd. | | 21,425 | 264,958 |
| Manappuram General Finance & Leasing Ltd. | | 198,751 | 316,767 |
| Maruti Suzuki India Ltd. | | 4,403 | 464,218 |
| NTPC Ltd. | | 228,738 | 482,957 |
| Oberoi Realty Ltd. | | 5,970 | 67,079 |
| Oil & Natural Gas Corp. Ltd. | | 225,800 | 440,831 |
| One97 Communications Ltd. (a) | | 37,700 | 302,619 |
| Petronet LNG Ltd. | | 71,606 | 208,196 |
| Power Grid Corp. of India Ltd. | | 196,387 | 571,658 |
| Reliance Industries Ltd. | | 85,113 | 2,530,281 |
| Shree Cement Ltd. | | 1,951 | 582,331 |
| Sona Blw Precision Forgings Ltd. (b) | | 30,419 | 179,316 |
| SRF Ltd. | | 17,178 | 535,872 |
| Sun Pharmaceutical Industries Ltd. | | 9,454 | 114,478 |
| Tata Motors Ltd. (a) | | 13,094 | 78,207 |
| Tata Steel Ltd. | | 626,700 | 831,736 |
| Torrent Pharmaceuticals Ltd. | | 8,937 | 181,119 |
| Vijaya Diagnostic Centre Pvt Ltd. | | 10,490 | 48,548 |
| Zomato Ltd. (a) | | 753,876 | 603,475 |
TOTAL INDIA | | | 22,656,452 |
| Indonesia - 1.6% | | | |
| First Resources Ltd. | | 356,200 | 410,657 |
| PT Bank Central Asia Tbk | | 2,279,700 | 1,410,796 |
| PT Bank Rakyat Indonesia (Persero) Tbk | | 4,066,879 | 1,417,223 |
| PT Dayamitra Telekomunikasi Tbk | | 325,700 | 15,552 |
| PT Sumber Alfaria Trijaya Tbk | | 2,030,800 | 401,555 |
| PT United Tractors Tbk | | 88,000 | 173,719 |
TOTAL INDONESIA | | | 3,829,502 |
| Japan - 0.1% | | | |
| Z Holdings Corp. | | 91,062 | 249,441 |
| Korea (South) - 6.6% | | | |
| Coway Co. Ltd. | | 6,600 | 242,425 |
| Delivery Hero AG (a)(b) | | 5,647 | 224,816 |
| Hyundai Fire & Marine Insurance Co. Ltd. | | 17,070 | 479,753 |
| Hyundai Motor Co. Ltd. | | 580 | 85,949 |
| Jeisys Medical, Inc. (a) | | 12,635 | 81,847 |
| Kakao Corp. | | 12,327 | 540,008 |
| Kakao Pay Corp. (a) | | 3,261 | 134,062 |
| KB Financial Group, Inc. | | 30,228 | 1,122,394 |
| Kia Corp. | | 15,970 | 1,011,834 |
| L&F Co. Ltd. | | 300 | 59,907 |
| LG Chemical Ltd. | | 663 | 368,431 |
| LG Corp. | | 6,330 | 414,473 |
| NAVER Corp. | | 2,054 | 297,692 |
| NCSOFT Corp. | | 297 | 84,076 |
| POSCO | | 3,652 | 1,033,943 |
| S-Oil Corp. | | 4,960 | 277,909 |
| Samsung Biologics Co. Ltd. (a)(b) | | 905 | 529,506 |
| Samsung Electronics Co. Ltd. | | 137,099 | 6,748,505 |
| Samsung SDI Co. Ltd. | | 1,620 | 841,068 |
| SK Hynix, Inc. | | 16,103 | 1,083,895 |
TOTAL KOREA (SOUTH) | | | 15,662,493 |
| Mauritius - 0.0% | | | |
| Jumo World Ltd. (a)(e) | | 30 | 28,475 |
| Mexico - 2.1% | | | |
| CEMEX S.A.B. de CV sponsored ADR (a) | | 197,400 | 1,184,400 |
| Corporacion Inmobiliaria Vesta S.A.B. de CV | | 83,655 | 264,232 |
| Grupo Aeroportuario del Pacifico S.A.B. de CV Series B | | 28,000 | 498,174 |
| Grupo Aeroportuario del Sureste S.A.B. de CV Series B sponsored ADR | | 1,654 | 473,573 |
| Grupo Aeroportuario Norte S.A.B. de CV | | 28,400 | 312,188 |
| Grupo Financiero Banorte S.A.B. de CV Series O | | 171,221 | 1,480,655 |
| Wal-Mart de Mexico SA de CV Series V | | 184,200 | 742,660 |
TOTAL MEXICO | | | 4,955,882 |
| Netherlands - 0.0% | | | |
| CTP BV (b) | | 5,452 | 71,490 |
| CTP BV rights (a)(f) | | 5,452 | 1,382 |
TOTAL NETHERLANDS | | | 72,872 |
| Panama - 0.1% | | | |
| Copa Holdings SA Class A | | 2,986 | 269,696 |
| Peru - 0.3% | | | |
| Credicorp Ltd. (United States) | | 4,879 | 661,007 |
| Philippines - 0.2% | | | |
| Ayala Land, Inc. | | 334,500 | 161,387 |
| SM Investments Corp. | | 15,000 | 242,650 |
TOTAL PHILIPPINES | | | 404,037 |
| Poland - 0.3% | | | |
| CD Projekt RED SA | | 8,116 | 220,932 |
| Dino Polska SA (a)(b) | | 5,800 | 590,019 |
TOTAL POLAND | | | 810,951 |
| Russia - 1.0% | | | |
| Fix Price Group Ltd. GDR (Reg. S) (a)(e) | | 68,238 | 25,202 |
| Gazprom OAO sponsored ADR (Reg. S) (a)(e) | | 155,600 | 35,545 |
| LSR Group OJSC (a)(e) | | 755 | 884 |
| LUKOIL PJSC sponsored ADR (a)(e) | | 35,200 | 9,958 |
| Novatek PJSC GDR (Reg. S) (a)(e) | | 9,100 | 400,400 |
| Sberbank of Russia (e) | | 30 | 0 |
| Sberbank of Russia sponsored ADR (a)(e) | | 324,104 | 5,769 |
| Severstal PAO GDR (Reg. S) (a)(e) | | 83,700 | 1,976 |
| TCS Group Holding PLC GDR (a)(e) | | 56,395 | 505,299 |
| X5 Retail Group NV GDR (Reg. S) (a)(e) | | 77,500 | 589,000 |
| Yandex NV Series A (a)(e) | | 93,769 | 712,644 |
TOTAL RUSSIA | | | 2,286,677 |
| Saudi Arabia - 1.7% | | | |
| Al Rajhi Bank | | 59,514 | 1,218,619 |
| Alinma Bank | | 89,300 | 753,551 |
| Bupa Arabia for Cooperative Insurance Co. | | 15,675 | 737,214 |
| The Saudi National Bank | | 105,800 | 1,379,375 |
TOTAL SAUDI ARABIA | | | 4,088,759 |
| Singapore - 0.9% | | | |
| Sea Ltd. ADR (a) | | 28,147 | 2,143,957 |
| South Africa - 1.5% | | | |
| Capitec Bank Holdings Ltd. | | 8,250 | 718,392 |
| Discovery Ltd. (a) | | 97,700 | 767,874 |
| Impala Platinum Holdings Ltd. | | 123,200 | 1,199,451 |
| Naspers Ltd. Class N | | 3,386 | 603,659 |
| Pick 'n Pay Stores Ltd. | | 140,500 | 333,498 |
TOTAL SOUTH AFRICA | | | 3,622,874 |
| Switzerland - 0.1% | | | |
| OPT Machine Vision Tech Co. Ltd. ELS (UBS AG London Branch Bank Warrant Programme) Class A warrants 2/21/25 (a)(b) | | 5,200 | 112,925 |
| Taiwan - 6.2% | | | |
| BizLink Holding, Inc. | | 29,000 | 248,896 |
| BizLink Holding, Inc. rights 5/8/23 (a) | | 740 | 794 |
| Chailease Holding Co. Ltd. | | 161,144 | 1,172,812 |
| eMemory Technology, Inc. | | 5,035 | 300,841 |
| Formosa Plastics Corp. | | 41,000 | 125,336 |
| MediaTek, Inc. | | 41,793 | 908,105 |
| Novatek Microelectronics Corp. | | 7,000 | 95,631 |
| Realtek Semiconductor Corp. | | 9,000 | 105,469 |
| Taiwan Semiconductor Manufacturing Co. Ltd. | | 650,787 | 10,649,551 |
| Uni-President Enterprises Corp. | | 243,000 | 582,151 |
| United Microelectronics Corp. | | 18,000 | 28,930 |
| Wistron Corp. | | 108,000 | 163,583 |
| Wiwynn Corp. | | 10,348 | 393,535 |
| Yageo Corp. | | 7,000 | 113,397 |
TOTAL TAIWAN | | | 14,889,031 |
| Tanzania - 0.1% | | | |
| Helios Towers PLC (a) | | 85,700 | 112,335 |
| Thailand - 0.4% | | | |
| Carabao Group PCL (For. Reg.) | | 159,800 | 335,966 |
| Land & House PCL (For. Reg.) | | 324,200 | 93,212 |
| PTT Global Chemical PCL (For. Reg.) | | 382,700 | 467,043 |
| Supalai PCL (For. Reg.) | | 84,400 | 52,464 |
TOTAL THAILAND | | | 948,685 |
| United States of America - 1.1% | | | |
| FirstCash Holdings, Inc. | | 11,401 | 1,174,645 |
| Globant SA (a) | | 1,867 | 292,876 |
| Legend Biotech Corp. ADR (a) | | 2,479 | 170,332 |
| Parade Technologies Ltd. | | 1,000 | 30,606 |
| Tenaris SA sponsored ADR | | 11,300 | 324,423 |
| Titan Cement International Trading SA | | 31,600 | 509,765 |
TOTAL UNITED STATES OF AMERICA | | | 2,502,647 |
| Uruguay - 0.0% | | | |
| Dlocal Ltd. (a) | | 6,110 | 85,540 |
| TOTAL COMMON STOCKS (Cost $125,657,455) | | | 136,260,701 |
| | | | |
| Preferred Stocks - 1.7% |
| | | Shares | Value ($) |
| Convertible Preferred Stocks - 0.4% | | | |
| Brazil - 0.1% | | | |
| Creditas Financial Solutions Ltd. Series F (a)(d)(e) | | 1,073 | 306,277 |
| China - 0.1% | | | |
| dMed Biopharmaceutical Co. Ltd. Series C (a)(d)(e) | | 11,962 | 106,103 |
| India - 0.2% | | | |
| Meesho Series F (a)(d)(e) | | 7,108 | 492,016 |
TOTAL CONVERTIBLE PREFERRED STOCKS | | | 904,396 |
| Nonconvertible Preferred Stocks - 1.3% | | | |
| Brazil - 1.0% | | | |
| Companhia de Transmissao de Energia Eletrica Paulista (PN) | | 42,100 | 194,556 |
| Metalurgica Gerdau SA (PN) | | 316,170 | 739,112 |
| Petroleo Brasileiro SA - Petrobras: | | | |
| (PN) sponsored ADR (non-vtg.) | | 75,906 | 720,348 |
| sponsored ADR | | 64,600 | 686,052 |
| | | | 2,340,068 |
| Korea (South) - 0.3% | | | |
| Hyundai Motor Co. Ltd. Series 2 | | 5,787 | 480,234 |
| Samsung Electronics Co. Ltd. | | 6,660 | 278,531 |
| | | | 758,765 |
| United States of America - 0.0% | | | |
| Gupshup, Inc. (a)(d)(e) | | 8,409 | 131,433 |
TOTAL NONCONVERTIBLE PREFERRED STOCKS | | | 3,230,266 |
| TOTAL PREFERRED STOCKS (Cost $3,454,757) | | | 4,134,662 |
| | | | |
| Nonconvertible Bonds - 15.4% |
| | | Principal Amount (g) | Value ($) |
| Azerbaijan - 0.6% | | | |
| Southern Gas Corridor CJSC 6.875% 3/24/26 (b) | | 695,000 | 712,288 |
| State Oil Co. of Azerbaijan Republic 6.95% 3/18/30 (Reg. S) | | 585,000 | 603,025 |
TOTAL AZERBAIJAN | | | 1,315,313 |
| Bahrain - 0.8% | | | |
| The Oil and Gas Holding Co.: | | | |
| 7.5% 10/25/27 (b) | | 1,410,000 | 1,441,549 |
| 7.625% 11/7/24 (b) | | 400,000 | 405,936 |
TOTAL BAHRAIN | | | 1,847,485 |
| Brazil - 0.4% | | | |
| Adecoagro SA 6% 9/21/27 (b) | | 275,000 | 255,544 |
| Braskem Netherlands BV 7.25% 2/13/33 (b) | | 200,000 | 190,595 |
| MARB BondCo PLC 3.95% 1/29/31 (b) | | 145,000 | 106,078 |
| MC Brazil Downstream Trading SARL 7.25% 6/30/31 (b) | | 372,007 | 285,236 |
| Natura Cosmeticos SA 4.125% 5/3/28 (b) | | 190,000 | 157,439 |
TOTAL BRAZIL | | | 994,892 |
| Burkina Faso - 0.1% | | | |
| Endeavour Mining PLC 5% 10/14/26 (b) | | 285,000 | 247,113 |
| Cambodia - 0.1% | | | |
| NagaCorp Ltd. 7.95% 7/6/24 (Reg. S) | | 200,000 | 185,663 |
| Chile - 0.9% | | | |
| Antofagasta PLC 2.375% 10/14/30 (b) | | 450,000 | 365,428 |
| Corporacion Nacional del Cobre de Chile (Codelco): | | | |
| 3.7% 1/30/50 (b) | | 300,000 | 223,500 |
| 4.5% 8/1/47 (b) | | 250,000 | 213,328 |
| 5.125% 2/2/33 (b) | | 200,000 | 202,100 |
| Empresa Nacional de Petroleo 4.5% 9/14/47 (b) | | 440,000 | 339,295 |
| Sable International Finance Ltd. 5.75% 9/7/27 (b) | | 600,000 | 557,250 |
| VTR Comunicaciones SpA 5.125% 1/15/28 (b) | | 400,000 | 220,450 |
TOTAL CHILE | | | 2,121,351 |
| China - 0.6% | | | |
| ENN Clean Energy International Investment Ltd. 3.375% 5/12/26 (b) | | 395,000 | 352,538 |
| Meituan 2.125% 10/28/25 (b) | | 640,000 | 586,520 |
| Prosus NV: | | | |
| 3.832% 2/8/51 (b) | | 425,000 | 264,775 |
| 4.193% 1/19/32 (b) | | 245,000 | 207,025 |
TOTAL CHINA | | | 1,410,858 |
| Colombia - 0.8% | | | |
| Ecopetrol SA 8.875% 1/13/33 | | 170,000 | 164,369 |
| EnfraGen Energia Sur SA 5.375% 12/30/30 (b) | | 690,000 | 437,115 |
| Gcm Mining Corp. 6.875% 8/9/26 (b) | | 400,000 | 322,712 |
| GeoPark Ltd. 5.5% 1/17/27 (b) | | 500,000 | 413,688 |
| Oleoducto Central SA 4% 7/14/27 (b) | | 350,000 | 307,847 |
| Termocandelaria Power Ltd. 7.875% 1/30/29 (b) | | 414,625 | 366,383 |
TOTAL COLOMBIA | | | 2,012,114 |
| Costa Rica - 0.1% | | | |
| Liberty Costa Rica SR SF 10.875% 1/15/31 (b) | | 205,000 | 194,545 |
| Georgia - 0.1% | | | |
| JSC Georgian Railway 4% 6/17/28 (b) | | 300,000 | 255,806 |
| Ghana - 0.5% | | | |
| Kosmos Energy Ltd. 7.125% 4/4/26 (b) | | 815,000 | 720,409 |
| Tullow Oil PLC: | | | |
| 7% 3/1/25 (b) | | 450,000 | 273,038 |
| 10.25% 5/15/26 (b) | | 411,000 | 318,602 |
TOTAL GHANA | | | 1,312,049 |
| Guatemala - 0.3% | | | |
| CT Trust 5.125% 2/3/32 (b) | | 440,000 | 361,845 |
| Investment Energy Resources Ltd. 6.25% 4/26/29 (b) | | 510,000 | 470,252 |
TOTAL GUATEMALA | | | 832,097 |
| Hungary - 0.1% | | | |
| Magyar Export-Import Bank 6.125% 12/4/27 (b) | | 200,000 | 201,375 |
| India - 0.1% | | | |
| CA Magnum Holdings 5.375% (b)(h) | | 400,000 | 350,700 |
| Indonesia - 1.3% | | | |
| Medco Bell Pte Ltd. 6.375% 1/30/27 (b) | | 560,000 | 510,580 |
| PT Adaro Indonesia 4.25% 10/31/24 (b) | | 250,000 | 240,359 |
| PT Freeport Indonesia: | | | |
| 5.315% 4/14/32 (b) | | 250,000 | 240,359 |
| 6.2% 4/14/52 (b) | | 200,000 | 184,500 |
| PT Hutama Karya Persero 3.75% 5/11/30 (b) | | 600,000 | 556,425 |
| PT Indonesia Asahan Aluminium 5.45% 5/15/30 (b) | | 690,000 | 685,688 |
| PT Pertamina Persero: | | | |
| 4.15% 2/25/60 (b) | | 365,000 | 270,967 |
| 4.175% 1/21/50 (b) | | 450,000 | 353,756 |
TOTAL INDONESIA | | | 3,042,634 |
| Kazakhstan - 0.3% | | | |
| KazMunaiGaz National Co. 3.5% 4/14/33 (b) | | 400,000 | 306,825 |
| Tengizchevroil Finance Co. International Ltd. 3.25% 8/15/30 (b) | | 550,000 | 413,806 |
TOTAL KAZAKHSTAN | | | 720,631 |
| Malaysia - 0.6% | | | |
| MISC Capital Two (Labuan) Ltd. 3.75% 4/6/27 (b) | | 380,000 | 360,834 |
| Petronas Capital Ltd.: | | | |
| 3.404% 4/28/61 (b) | | 500,000 | 365,625 |
| 3.5% 4/21/30 (b) | | 450,000 | 424,350 |
| 4.55% 4/21/50 (b) | | 400,000 | 374,000 |
TOTAL MALAYSIA | | | 1,524,809 |
| Mauritius - 0.1% | | | |
| AXIAN Telecom 7.375% 2/16/27 (b) | | 355,000 | 319,567 |
| Mexico - 1.7% | | | |
| Braskem Idesa SAPI 6.99% 2/20/32 (b) | | 205,000 | 145,396 |
| Comision Federal de Electricid 3.348% 2/9/31 (b) | | 450,000 | 358,538 |
| Petroleos Mexicanos: | | | |
| 5.35% 2/12/28 | | 320,000 | 265,260 |
| 6.49% 1/23/27 | | 315,000 | 281,925 |
| 6.5% 6/2/41 | | 820,000 | 518,650 |
| 6.625% 6/15/35 | | 410,000 | 284,815 |
| 6.7% 2/16/32 | | 415,000 | 318,772 |
| 6.75% 9/21/47 | | 960,000 | 590,880 |
| 6.84% 1/23/30 | | 380,000 | 305,606 |
| 6.95% 1/28/60 | | 1,075,000 | 651,181 |
| 7.69% 1/23/50 | | 589,000 | 392,421 |
TOTAL MEXICO | | | 4,113,444 |
| Morocco - 0.2% | | | |
| OCP SA: | | | |
| 3.75% 6/23/31 (b) | | 535,000 | 448,330 |
| 5.125% 6/23/51 (b) | | 200,000 | 147,100 |
TOTAL MOROCCO | | | 595,430 |
| Panama - 0.4% | | | |
| Aeropuerto Internacional de Tocumen SA: | | | |
| 4% 8/11/41 (b) | | 290,000 | 232,054 |
| 5.125% 8/11/61 (b) | | 200,000 | 153,663 |
| Cable Onda SA 4.5% 1/30/30 (b) | | 580,000 | 475,963 |
TOTAL PANAMA | | | 861,680 |
| Paraguay - 0.1% | | | |
| Telefonica Celular del Paraguay SA 5.875% 4/15/27 (b) | | 250,000 | 230,125 |
| Peru - 0.2% | | | |
| Camposol SA 6% 2/3/27 (b) | | 500,000 | 272,500 |
| Compania de Minas Buenaventura SAA 5.5% 7/23/26 (b) | | 165,000 | 143,323 |
TOTAL PERU | | | 415,823 |
| Qatar - 0.7% | | | |
| Qatar Petroleum: | | | |
| 2.25% 7/12/31 (b) | | 700,000 | 602,569 |
| 3.125% 7/12/41 (b) | | 650,000 | 511,794 |
| 3.3% 7/12/51 (b) | | 580,000 | 437,284 |
TOTAL QATAR | | | 1,551,647 |
| Saudi Arabia - 1.3% | | | |
| EIG Pearl Holdings SARL 3.545% 8/31/36 (b) | | 720,000 | 620,460 |
| Greensaif Pipelines Bidco SARL: | | | |
| 6.129% 2/23/38 (b) | | 200,000 | 209,600 |
| 6.51% 2/23/42 (b) | | 200,000 | 213,225 |
| Saudi Arabian Oil Co.: | | | |
| 3.5% 4/16/29 (b) | | 450,000 | 424,350 |
| 4.25% 4/16/39 (b) | | 1,680,000 | 1,541,190 |
TOTAL SAUDI ARABIA | | | 3,008,825 |
| South Africa - 0.9% | | | |
| Eskom Holdings SOC Ltd.: | | | |
| 6.35% 8/10/28 (b) | | 315,000 | 296,568 |
| 7.125% 2/11/25 (b) | | 815,000 | 793,250 |
| 8.45% 8/10/28 (b) | | 235,000 | 224,616 |
| Liquid Telecommunications Financing PLC 5.5% 9/4/26 (b) | | 400,000 | 248,700 |
| Stillwater Mining Co.: | | | |
| 4% 11/16/26 (b) | | 485,000 | 435,075 |
| 4.5% 11/16/29 (b) | | 220,000 | 181,335 |
TOTAL SOUTH AFRICA | | | 2,179,544 |
| Tanzania - 0.2% | | | |
| HTA Group Ltd. 7% 12/18/25 (b) | | 400,000 | 375,700 |
| Thailand - 0.1% | | | |
| PTT Treasury Center Co. Ltd. 3.7% 7/16/70 (b) | | 350,000 | 237,125 |
| Ukraine - 0.1% | | | |
| NAK Naftogaz Ukraine 7.375% 7/19/24 (Reg. S) (i) | | 400,000 | 135,250 |
| United Arab Emirates - 0.9% | | | |
| Abu Dhabi National Energy Co. PJSC: | | | |
| 4% 10/3/49 (b) | | 390,000 | 338,642 |
| 4.696% 4/24/33 (b) | | 165,000 | 167,681 |
| 4.875% 4/23/30 (b) | | 50,000 | 51,759 |
| Galaxy Pipeline Assets BidCo Ltd.: | | | |
| 2.16% 3/31/34 (b) | | 399,195 | 345,878 |
| 2.625% 3/31/36 (b) | | 570,000 | 469,110 |
| GEMS MENASA Cayman Ltd. 7.125% 7/31/26 (b) | | 690,000 | 673,311 |
| MDGH GMTN RSC Ltd. 5.5% 4/28/33 (b) | | 200,000 | 216,038 |
TOTAL UNITED ARAB EMIRATES | | | 2,262,419 |
| Uzbekistan - 0.3% | | | |
| National Bank of Uzbekistan 4.85% 10/21/25 (Reg. S) | | 350,000 | 323,269 |
| Uzbekneftegaz JSC 4.75% 11/16/28 (b) | | 400,000 | 322,075 |
TOTAL UZBEKISTAN | | | 645,344 |
| Venezuela - 0.2% | | | |
| Petroleos de Venezuela SA: | | | |
| 6% 5/16/24 (b)(i) | | 5,700,000 | 185,250 |
| 6% 11/15/26 (Reg. S) (i) | | 6,800,000 | 193,800 |
TOTAL VENEZUELA | | | 379,050 |
| Vietnam - 0.3% | | | |
| Mong Duong Finance Holdings BV 5.125% 5/7/29 (b) | | 890,000 | 770,598 |
| TOTAL NONCONVERTIBLE BONDS (Cost $45,014,529) | | | 36,651,006 |
| | | | |
| Government Obligations - 23.3% |
| | | Principal Amount (g) | Value ($) |
| Angola - 0.7% | | | |
| Angola Republic: | | | |
| 8.25% 5/9/28 (b) | | 720,000 | 629,235 |
| 8.75% 4/14/32 (b) | | 200,000 | 165,413 |
| 9.125% 11/26/49 (b) | | 225,000 | 167,878 |
| 9.375% 5/8/48 (b) | | 290,000 | 222,267 |
| 9.5% 11/12/25 (b) | | 420,000 | 414,435 |
TOTAL ANGOLA | | | 1,599,228 |
| Argentina - 0.8% | | | |
| Argentine Republic: | | | |
| 0.5% 7/9/30 (j) | | 1,995,365 | 484,874 |
| 1% 7/9/29 | | 498,666 | 118,215 |
| 1.5% 7/9/35 (j) | | 1,537,734 | 341,954 |
| 3.875% 1/9/38 (j) | | 2,011,834 | 555,518 |
| Buenos Aires Province 5.25% 9/1/37 (b)(j) | | 1,030,000 | 315,695 |
TOTAL ARGENTINA | | | 1,816,256 |
| Armenia - 0.1% | | | |
| Republic of Armenia 3.6% 2/2/31 (b) | | 360,000 | 281,318 |
| Bahrain - 0.1% | | | |
| Bahrain Kingdom 5.625% 5/18/34 (b) | | 200,000 | 174,975 |
| Barbados - 0.1% | | | |
| Barbados Government 6.5% 10/1/29 (b) | | 290,000 | 268,304 |
| Benin - 0.0% | | | |
| Republic of Benin 4.875% 1/19/32 (b) | EUR | 140,000 | 114,812 |
| Brazil - 0.6% | | | |
| Brazilian Federative Republic: | | | |
| 3.875% 6/12/30 | | 775,000 | 692,317 |
| 4.75% 1/14/50 | | 505,000 | 371,743 |
| 6% 10/20/33 | | 295,000 | 289,616 |
TOTAL BRAZIL | | | 1,353,676 |
| Cameroon - 0.1% | | | |
| Cameroon Republic 5.95% 7/7/32 (b) | EUR | 360,000 | 275,894 |
| Chile - 0.5% | | | |
| Chilean Republic: | | | |
| 2.45% 1/31/31 | | 535,000 | 469,897 |
| 3.1% 1/22/61 | | 340,000 | 227,758 |
| 3.5% 1/31/34 | | 280,000 | 253,365 |
| 4% 1/31/52 | | 200,000 | 165,913 |
| 4.34% 3/7/42 | | 200,000 | 181,663 |
TOTAL CHILE | | | 1,298,596 |
| Colombia - 1.1% | | | |
| Colombian Republic: | | | |
| 3% 1/30/30 | | 715,000 | 547,109 |
| 3.125% 4/15/31 | | 548,000 | 405,623 |
| 5% 6/15/45 | | 805,000 | 538,746 |
| 5.2% 5/15/49 | | 185,000 | 124,563 |
| 6.125% 1/18/41 | | 200,000 | 157,163 |
| 7.375% 9/18/37 | | 650,000 | 602,997 |
| 7.5% 2/2/34 | | 200,000 | 190,850 |
| 8% 4/20/33 | | 160,000 | 159,330 |
TOTAL COLOMBIA | | | 2,726,381 |
| Costa Rica - 0.4% | | | |
| Costa Rican Republic: | | | |
| 5.625% 4/30/43 (b) | | 425,000 | 369,697 |
| 6.125% 2/19/31 (b) | | 315,000 | 317,028 |
| 6.55% 4/3/34 (b) | | 245,000 | 249,594 |
| 7% 4/4/44 (b) | | 105,000 | 103,248 |
TOTAL COSTA RICA | | | 1,039,567 |
| Dominican Republic - 1.5% | | | |
| Dominican Republic: | | | |
| 4.5% 1/30/30 (b) | | 515,000 | 454,745 |
| 4.875% 9/23/32 (b) | | 870,000 | 747,819 |
| 5.3% 1/21/41 (b) | | 200,000 | 157,850 |
| 5.875% 1/30/60 (b) | | 900,000 | 686,138 |
| 6% 7/19/28 (b) | | 400,000 | 393,825 |
| 6% 2/22/33 (b) | | 425,000 | 396,525 |
| 6.5% 2/15/48 (b) | | 200,000 | 170,350 |
| 6.85% 1/27/45 (b) | | 350,000 | 314,300 |
| 7.05% 2/3/31 (b) | | 150,000 | 152,297 |
TOTAL DOMINICAN REPUBLIC | | | 3,473,849 |
| Ecuador - 0.5% | | | |
| Ecuador Republic: | | | |
| 1.5% 7/31/40 (b)(j) | | 250,000 | 81,297 |
| 2.5% 7/31/35 (b)(j) | | 1,490,256 | 544,223 |
| 5.5% 7/31/30 (b)(j) | | 985,630 | 517,949 |
TOTAL ECUADOR | | | 1,143,469 |
| Egypt - 0.8% | | | |
| Arab Republic of Egypt: | | | |
| 7.0529% 1/15/32 (b) | | 665,000 | 366,083 |
| 7.5% 2/16/61 (b) | | 395,000 | 196,710 |
| 7.903% 2/21/48 (b) | | 865,000 | 433,473 |
| 8.5% 1/31/47 (b) | | 1,160,000 | 610,668 |
| 8.7002% 3/1/49 (b) | | 400,000 | 211,575 |
TOTAL EGYPT | | | 1,818,509 |
| El Salvador - 0.1% | | | |
| El Salvador Republic 7.1246% 1/20/50 (b) | | 560,000 | 271,530 |
| Gabon - 0.2% | | | |
| Gabonese Republic: | | | |
| 6.95% 6/16/25 (b) | | 200,000 | 183,913 |
| 7% 11/24/31 (b) | | 540,000 | 397,508 |
TOTAL GABON | | | 581,421 |
| Georgia - 0.2% | | | |
| Georgia Republic 2.75% 4/22/26 (b) | | 505,000 | 451,754 |
| Ghana - 0.3% | | | |
| Ghana Republic: | | | |
| 8.125% 1/18/26 (b)(i) | | 500,000 | 197,906 |
| 8.627% 6/16/49 (b)(i) | | 615,000 | 209,600 |
| 10.75% 10/14/30 (b) | | 400,000 | 269,575 |
TOTAL GHANA | | | 677,081 |
| Guatemala - 0.1% | | | |
| Guatemalan Republic 6.125% 6/1/50 (b) | | 350,000 | 328,081 |
| Hungary - 0.3% | | | |
| Hungarian Republic: | | | |
| 2.125% 9/22/31 (b) | | 300,000 | 233,494 |
| 3.125% 9/21/51 (b) | | 560,000 | 346,080 |
| 6.25% 9/22/32 (b) | | 200,000 | 207,350 |
TOTAL HUNGARY | | | 786,924 |
| Indonesia - 0.6% | | | |
| Indonesian Republic: | | | |
| 3.35% 3/12/71 | | 470,000 | 321,451 |
| 3.5% 2/14/50 | | 380,000 | 292,671 |
| 4.2% 10/15/50 | | 600,000 | 522,300 |
| 8.5% 10/12/35 (b) | | 300,000 | 394,650 |
TOTAL INDONESIA | | | 1,531,072 |
| Ivory Coast - 0.3% | | | |
| Ivory Coast: | | | |
| 6.125% 6/15/33 (b) | | 200,000 | 168,288 |
| 6.375% 3/3/28 (b) | | 635,000 | 604,560 |
TOTAL IVORY COAST | | | 772,848 |
| Jordan - 0.2% | | | |
| Jordanian Kingdom: | | | |
| 5.85% 7/7/30 (b) | | 200,000 | 179,163 |
| 7.375% 10/10/47 (b) | | 280,000 | 235,603 |
TOTAL JORDAN | | | 414,766 |
| Kenya - 0.4% | | | |
| Republic of Kenya: | | | |
| 6.3% 1/23/34 (b) | | 440,000 | 285,945 |
| 6.875% 6/24/24 (b) | | 385,000 | 331,653 |
| 7% 5/22/27 (b) | | 410,000 | 327,693 |
TOTAL KENYA | | | 945,291 |
| Lebanon - 0.2% | | | |
| Lebanese Republic 6.375% 12/31/49 (i) | | 7,090,000 | 418,310 |
| Mexico - 0.9% | | | |
| United Mexican States: | | | |
| 2.659% 5/24/31 | | 400,000 | 337,950 |
| 3.25% 4/16/30 | | 400,000 | 361,575 |
| 4.35% 1/15/47 | | 850,000 | 686,800 |
| 4.75% 3/8/44 | | 450,000 | 391,303 |
| 6.338% 5/4/53 | | 200,000 | 206,200 |
| 6.35% 2/9/35 | | 220,000 | 235,441 |
TOTAL MEXICO | | | 2,219,269 |
| Mongolia - 0.1% | | | |
| Mongolia Government 5.125% 4/7/26 (b) | | 200,000 | 182,850 |
| Morocco - 0.1% | | | |
| Moroccan Kingdom 6.5% 9/8/33 (b) | | 240,000 | 248,295 |
| Nigeria - 0.8% | | | |
| Republic of Nigeria: | | | |
| 6.125% 9/28/28 (b) | | 325,000 | 246,655 |
| 6.5% 11/28/27 (b) | | 705,000 | 559,946 |
| 7.143% 2/23/30 (b) | | 850,000 | 634,738 |
| 7.625% 11/28/47 (b) | | 300,000 | 186,338 |
| 8.25% 9/28/51 (b) | | 200,000 | 130,100 |
| 8.375% 3/24/29 (b) | | 190,000 | 154,411 |
TOTAL NIGERIA | | | 1,912,188 |
| Oman - 1.4% | | | |
| Sultanate of Oman: | | | |
| 4.75% 6/15/26 (b) | | 450,000 | 440,100 |
| 5.375% 3/8/27 (b) | | 395,000 | 392,852 |
| 5.625% 1/17/28 (b) | | 420,000 | 422,441 |
| 6% 8/1/29 (b) | | 285,000 | 290,753 |
| 6.25% 1/25/31 (b) | | 690,000 | 714,495 |
| 6.5% 3/8/47 (b) | | 1,275,000 | 1,193,161 |
TOTAL OMAN | | | 3,453,802 |
| Pakistan - 0.2% | | | |
| Islamic Republic of Pakistan: | | | |
| 6% 4/8/26 (b) | | 695,000 | 248,376 |
| 6.875% 12/5/27 (b) | | 560,000 | 195,405 |
TOTAL PAKISTAN | | | 443,781 |
| Panama - 1.1% | | | |
| Panamanian Republic: | | | |
| 2.252% 9/29/32 | | 485,000 | 374,299 |
| 3.16% 1/23/30 | | 660,000 | 582,986 |
| 3.298% 1/19/33 | | 540,000 | 456,233 |
| 3.87% 7/23/60 | | 510,000 | 340,999 |
| 4.5% 5/15/47 | | 405,000 | 324,582 |
| 6.4% 2/14/35 | | 250,000 | 264,344 |
| 6.853% 3/28/54 | | 200,000 | 208,500 |
TOTAL PANAMA | | | 2,551,943 |
| Paraguay - 0.3% | | | |
| Republic of Paraguay: | | | |
| 2.739% 1/29/33 (b) | | 415,000 | 334,023 |
| 5.4% 3/30/50 (b) | | 415,000 | 353,606 |
TOTAL PARAGUAY | | | 687,629 |
| Peru - 0.5% | | | |
| Peruvian Republic: | | | |
| 2.783% 1/23/31 | | 435,000 | 376,628 |
| 3% 1/15/34 | | 260,000 | 217,474 |
| 3.3% 3/11/41 | | 635,000 | 488,871 |
TOTAL PERU | | | 1,082,973 |
| Philippines - 0.4% | | | |
| Philippine Republic: | | | |
| 2.65% 12/10/45 | | 430,000 | 298,259 |
| 2.95% 5/5/45 | | 320,000 | 234,860 |
| 5.5% 1/17/48 | | 200,000 | 208,663 |
| 5.95% 10/13/47 | | 225,000 | 246,769 |
TOTAL PHILIPPINES | | | 988,551 |
| Poland - 0.1% | | | |
| Polish Government 5.5% 4/4/53 | | 170,000 | 176,513 |
| Qatar - 1.3% | | | |
| State of Qatar: | | | |
| 4.4% 4/16/50 (b) | | 1,675,000 | 1,570,103 |
| 4.625% 6/2/46 (b) | | 600,000 | 585,863 |
| 4.817% 3/14/49 (b) | | 855,000 | 846,076 |
TOTAL QATAR | | | 3,002,042 |
| Romania - 0.6% | | | |
| Romanian Republic: | | | |
| 3% 2/27/27 (b) | | 334,000 | 304,107 |
| 3% 2/14/31 (b) | | 574,000 | 479,039 |
| 3.625% 3/27/32 (b) | | 334,000 | 285,320 |
| 6.125% 1/22/44 (b) | | 400,000 | 384,950 |
TOTAL ROMANIA | | | 1,453,416 |
| Russia - 0.0% | | | |
| Ministry of Finance of the Russian Federation 5.1% 3/28/35(Reg. S) (e)(i) | | 600,000 | 30,000 |
| Rwanda - 0.2% | | | |
| Rwanda Republic 5.5% 8/9/31 (b) | | 700,000 | 498,225 |
| Saudi Arabia - 0.3% | | | |
| Kingdom of Saudi Arabia: | | | |
| 2.25% 2/2/33 (b) | | 445,000 | 369,990 |
| 3.45% 2/2/61 (b) | | 570,000 | 409,973 |
TOTAL SAUDI ARABIA | | | 779,963 |
| Senegal - 0.1% | | | |
| Republic of Senegal: | | | |
| 6.25% 5/23/33 (b) | | 235,000 | 184,446 |
| 6.75% 3/13/48 (b) | | 200,000 | 133,350 |
TOTAL SENEGAL | | | 317,796 |
| Serbia - 0.2% | | | |
| Republic of Serbia: | | | |
| 2.125% 12/1/30 (b) | | 620,000 | 482,941 |
| 6.25% 5/26/28 (b) | | 105,000 | 107,218 |
TOTAL SERBIA | | | 590,159 |
| South Africa - 0.5% | | | |
| South African Republic: | | | |
| 4.85% 9/27/27 | | 400,000 | 380,075 |
| 5% 10/12/46 | | 155,000 | 105,381 |
| 5.65% 9/27/47 | | 325,000 | 234,772 |
| 5.75% 9/30/49 | | 715,000 | 513,817 |
TOTAL SOUTH AFRICA | | | 1,234,045 |
| Sri Lanka - 0.3% | | | |
| Democratic Socialist Republic of Sri Lanka: | | | |
| 6.2% 5/11/27 (b)(i) | | 935,000 | 306,096 |
| 6.85% 11/3/25 (b)(i) | | 695,000 | 243,598 |
| 7.55% 3/28/30 (b)(i) | | 150,000 | 49,200 |
| 7.85% 3/14/29 (b)(i) | | 210,000 | 68,775 |
TOTAL SRI LANKA | | | 667,669 |
| Turkey - 1.2% | | | |
| Turkish Republic: | | | |
| 4.875% 10/9/26 | | 520,000 | 465,010 |
| 4.875% 4/16/43 | | 1,055,000 | 703,092 |
| 5.125% 2/17/28 | | 245,000 | 213,196 |
| 5.75% 5/11/47 | | 865,000 | 614,042 |
| 6.125% 10/24/28 | | 220,000 | 197,010 |
| 6.625% 2/17/45 | | 130,000 | 102,603 |
| 9.375% 3/14/29 | | 495,000 | 499,269 |
| 9.375% 1/19/33 | | 80,000 | 80,590 |
TOTAL TURKEY | | | 2,874,812 |
| Ukraine - 0.4% | | | |
| Ukraine Government: | | | |
| 0% 8/1/41 (b)(k) | | 775,000 | 198,981 |
| 6.876% 5/21/31 (b) | | 200,000 | 32,288 |
| 7.253% 3/15/35 (b) | | 380,000 | 61,584 |
| 7.375% 9/25/34 (b) | | 200,000 | 32,163 |
| 7.75% 9/1/25 (b) | | 830,000 | 157,856 |
| 7.75% 9/1/26 (b) | | 830,000 | 141,256 |
| 7.75% 9/1/27 (b) | | 345,000 | 59,577 |
| 7.75% 9/1/28 (b) | | 560,000 | 96,530 |
| 7.75% 9/1/29 (b) | | 400,000 | 68,825 |
TOTAL UKRAINE | | | 849,060 |
| United Arab Emirates - 0.4% | | | |
| Emirate of Abu Dhabi 3.125% 9/30/49 (b) | | 410,000 | 310,268 |
| Emirate of Dubai: | | | |
| 3.9% 9/9/50 (Reg. S) | | 650,000 | 477,263 |
| 5.25% 1/30/43 (Reg. S) | | 295,000 | 279,291 |
TOTAL UNITED ARAB EMIRATES | | | 1,066,822 |
| United States of America - 0.8% | | | |
| U.S. Treasury Bills, yield at date of purchase 4.58% to 4.61% 5/4/23 | | 80,000 | 79,973 |
| U.S. Treasury Bonds 2.875% 5/15/52 | | 1,533,000 | 1,311,793 |
| U.S. Treasury Notes: | | | |
| 3.625% 3/31/30 | | 147,000 | 148,355 |
| 4% 2/28/30 | | 252,000 | 259,757 |
TOTAL UNITED STATES OF AMERICA | | | 1,799,878 |
| Uruguay - 0.3% | | | |
| Uruguay Republic 5.1% 6/18/50 | | 730,000 | 747,703 |
| Uzbekistan - 0.2% | | | |
| Republic of Uzbekistan: | | | |
| 3.7% 11/25/30 (b) | | 200,000 | 162,663 |
| 3.9% 10/19/31 (b) | | 240,000 | 194,370 |
TOTAL UZBEKISTAN | | | 357,033 |
| Venezuela - 0.3% | | | |
| Venezuelan Republic 9.25% 9/15/27 (i) | | 6,200,000 | 620,000 |
| Zambia - 0.1% | | | |
| Republic of Zambia: | | | |
| 8.5% 4/14/24 (b)(i) | | 50,000 | 23,369 |
| 8.97% 7/30/27 (b)(i) | | 250,000 | 115,281 |
TOTAL ZAMBIA | | | 138,650 |
| TOTAL GOVERNMENT OBLIGATIONS (Cost $74,126,093) | | | 55,538,979 |
| | | | |
| Preferred Securities - 1.2% |
| | | Principal Amount (g) | Value ($) |
| Georgia - 0.3% | | | |
| Georgia Bank Joint Stock Co. 11.125% (Reg. S) (h)(k) | | 700,000 | 711,566 |
| Kuwait - 0.2% | | | |
| NBK Tier 1 Financing 2 Ltd. 4.5% (b)(h)(k) | | 400,000 | 375,408 |
| Mexico - 0.3% | | | |
| Banco Mercantil del Norte SA: | | | |
| 6.75% (b)(h)(k) | | 400,000 | 385,768 |
| 7.625% (b)(h)(k) | | 105,000 | 96,054 |
| CEMEX S.A.B. de CV 5.125% (b)(h)(k) | | 400,000 | 355,378 |
TOTAL MEXICO | | | 837,200 |
| United Arab Emirates - 0.4% | | | |
| DP World Salaam 6% (Reg. S) (h)(k) | | 600,000 | 610,622 |
| Emirates NBD Bank PJSC 6.125% (Reg. S) (h)(k) | | 400,000 | 398,121 |
TOTAL UNITED ARAB EMIRATES | | | 1,008,743 |
| TOTAL PREFERRED SECURITIES (Cost $3,208,322) | | | 2,932,917 |
| | | | |
| Money Market Funds - 0.8% |
| | | Shares | Value ($) |
| Fidelity Cash Central Fund 4.88% (l) | | 1,253,458 | 1,253,709 |
| Fidelity Securities Lending Cash Central Fund 4.88% (l)(m) | | 642,082 | 642,147 |
| TOTAL MONEY MARKET FUNDS (Cost $1,895,559) | | | 1,895,856 |
| | | | |
| TOTAL INVESTMENT IN SECURITIES - 99.6% (Cost $253,356,715) | 237,414,121 |
NET OTHER ASSETS (LIABILITIES) - 0.4% | 925,659 |
| NET ASSETS - 100.0% | 238,339,780 |
| | |
Currency Abbreviations
| EUR | - | European Monetary Unit |
Security Type Abbreviations
| ELS | - | EQUITY-LINKED SECURITY |
Legend
| (b) | Security exempt from registration under Rule 144A of the Securities Act of 1933. These securities may be resold in transactions exempt from registration, normally to qualified institutional buyers. At the end of the period, the value of these securities amounted to $72,864,453 or 30.6% of net assets. |
| (c) | Security or a portion of the security is on loan at period end. |
| (d) | Restricted securities (including private placements) - Investment in securities not registered under the Securities Act of 1933 (excluding 144A issues). At the end of the period, the value of restricted securities (excluding 144A issues) amounted to $1,689,636 or 0.7% of net assets. |
| (f) | Security or a portion of the security purchased on a delayed delivery or when-issued basis. |
| (g) | Amount is stated in United States dollars unless otherwise noted. |
| (h) | Security is perpetual in nature with no stated maturity date. |
| (i) | Non-income producing - Security is in default. |
| (j) | Security initially issued at one coupon which converts to a higher coupon at a specified date. The rate shown is the rate at period end. |
| (k) | Coupon rates for floating and adjustable rate securities reflect the rates in effect at period end. |
| (l) | Affiliated fund that is generally available only to investment companies and other accounts managed by Fidelity Investments. The rate quoted is the annualized seven-day yield of the fund at period end. A complete unaudited listing of the fund's holdings as of its most recent quarter end is available upon request. In addition, each Fidelity Central Fund's financial statements are available on the SEC's website or upon request. |
| (m) | Investment made with cash collateral received from securities on loan. |
| Additional information on each restricted holding is as follows: |
| Security | Acquisition Date | Acquisition Cost ($) |
| Ant International Co. Ltd. Class C | 5/16/18 | 1,618,120 |
| | | |
| Creditas Financial Solutions Ltd. Series F | 1/28/22 | 337,976 |
| | | |
| dMed Biopharmaceutical Co. Ltd. Series C | 12/01/20 | 169,898 |
| | | |
| Gupshup, Inc. | 6/08/21 | 192,273 |
| | | |
| Meesho Series F | 9/21/21 | 544,986 |
| | | |
Affiliated Central Funds
Fiscal year to date information regarding the Fund's investments in Fidelity Central Funds, including the ownership percentage, is presented below.
| Affiliate | Value, beginning of period ($) | Purchases ($) | Sales Proceeds ($) | Dividend Income ($) | Realized Gain (loss) ($) | Change in Unrealized appreciation (depreciation) ($) | Value, end of period ($) | % ownership, end of period |
| Fidelity Cash Central Fund 4.88% | 8,147,400 | 64,172,265 | 71,065,956 | 136,977 | - | - | 1,253,709 | 0.0% |
| Fidelity Securities Lending Cash Central Fund 4.88% | 421,999 | 5,913,065 | 5,692,917 | 3,154 | - | - | 642,147 | 0.0% |
| Total | 8,569,399 | 70,085,330 | 76,758,873 | 140,131 | - | - | 1,895,856 | |
| | | | | | | | | |
Amounts in the dividend income column in the above table include any capital gain distributions from underlying funds, which are presented in the corresponding line item in the Statement of Operations, if applicable.
Amounts in the dividend income column for Fidelity Securities Lending Cash Central Fund represents the income earned on investing cash collateral, less rebates paid to borrowers and any lending agent fees associated with the loan, plus any premium payments received for lending certain types of securities.
Amounts included in the purchases and sales proceeds columns may include in-kind transactions, if applicable.
Investment Valuation
The following is a summary of the inputs used, as of April 30, 2023, involving the Fund's assets and liabilities carried at fair value. The inputs or methodology used for valuing securities may not be an indication of the risk associated with investing in those securities. For more information on valuation inputs, and their aggregation into the levels used below, please refer to the Investment Valuation section in the accompanying Notes to Financial Statements.
| Valuation Inputs at Reporting Date: |
| Description | Total ($) | Level 1 ($) | Level 2 ($) | Level 3 ($) |
Investments in Securities: | | | | |
|
| Equities: | | | | |
Communication Services | 13,433,344 | 3,818,804 | 8,901,896 | 712,644 |
Consumer Discretionary | 20,221,818 | 6,277,911 | 13,451,891 | 492,016 |
Consumer Staples | 9,723,605 | 2,805,276 | 6,304,127 | 614,202 |
Energy | 6,704,271 | 1,730,823 | 4,527,545 | 445,903 |
Financials | 33,915,371 | 13,221,748 | 19,193,996 | 1,499,627 |
Health Care | 5,266,894 | 1,099,154 | 4,061,637 | 106,103 |
Industrials | 7,346,419 | 2,727,986 | 4,618,433 | - |
Information Technology | 25,102,330 | 1,821,170 | 23,149,727 | 131,433 |
Materials | 12,218,772 | 6,184,260 | 6,032,536 | 1,976 |
Real Estate | 2,292,140 | 734,617 | 1,556,639 | 884 |
Utilities | 4,170,399 | 1,085,648 | 3,084,751 | - |
|
| Corporate Bonds | 36,651,006 | - | 36,651,006 | - |
|
| Government Obligations | 55,538,979 | - | 55,508,979 | 30,000 |
|
| Preferred Securities | 2,932,917 | - | 2,932,917 | - |
|
| Money Market Funds | 1,895,856 | 1,895,856 | - | - |
| Total Investments in Securities: | 237,414,121 | 43,403,253 | 189,976,080 | 4,034,788 |
The following is a reconciliation of Investments in Securities for which Level 3 inputs were used in determining value:
| |
| Investments in Securities: | |
| Beginning Balance | $ | 2,348,844 | |
| Net Realized Gain (Loss) on Investment Securities | | (9,840) | |
| Net Unrealized Gain (Loss) on Investment Securities | | 1,446,334 | |
| Cost of Purchases | | - | |
| Proceeds of Sales | | (2,550) | |
| Amortization/Accretion | | - | |
| Transfers into Level 3 | | 252,000 | |
| Transfers out of Level 3 | | - | |
| Ending Balance | $ | 4,034,788 | |
| The change in unrealized gain (loss) for the period attributable to Level 3 securities held at April 30, 2023 | $ | 1,446,334 | |
| The information used in the above reconciliation represents fiscal year to date activity for any Investments in Securities identified as using Level 3 inputs at either the beginning or the end of the current fiscal period. Cost of purchases and proceeds of sales may include securities received and/or delivered through in-kind transactions, corporate actions or exchanges. Transfers into Level 3 were attributable to a lack of observable market data resulting from decreases in market activity, decreases in liquidity, security restructurings or corporate actions. Transfers out of Level 3 were attributable to observable market data becoming available for those securities. Transfers in or out of Level 3 represent the beginning value of any Security or Instrument where a change in the pricing level occurred from the beginning to the end of the period. Realized and unrealized gains (losses) disclosed in the reconciliation are included in Net Gain (Loss) on the Fund's Statement of Operations. | |
Fidelity® Total Emerging Markets Fund
| Statement of Assets and Liabilities |
| | | | April 30, 2023 (Unaudited) |
| | | | | |
| Assets | | | | |
| Investment in securities, at value (including securities loaned of $632,977) - See accompanying schedule: | | | | |
Unaffiliated issuers (cost $251,461,156) | $ | 235,518,265 | | |
Fidelity Central Funds (cost $1,895,559) | | 1,895,856 | | |
| | | | | |
| | | | | |
| Total Investment in Securities (cost $253,356,715) | | | $ | 237,414,121 |
| Foreign currency held at value (cost $819,777) | | | | 745,221 |
| Receivable for investments sold | | | | 791,225 |
| Receivable for fund shares sold | | | | 88,417 |
| Dividends receivable | | | | 337,597 |
| Interest receivable | | | | 1,676,930 |
| Distributions receivable from Fidelity Central Funds | | | | 12,315 |
| Prepaid expenses | | | | 127 |
| Other receivables | | | | 90,579 |
Total assets | | | | 241,156,532 |
| Liabilities | | | | |
| Payable to custodian bank | $ | 516,240 | | |
| Payable for investments purchased | | | | |
Regular delivery | | 793,355 | | |
Delayed delivery | | 1,382 | | |
| Payable for fund shares redeemed | | 208,174 | | |
| Accrued management fee | | 155,208 | | |
| Distribution and service plan fees payable | | 20,882 | | |
| Other affiliated payables | | 48,173 | | |
| Deferred taxes | | 343,965 | | |
| Other payables and accrued expenses | | 87,226 | | |
| Collateral on securities loaned | | 642,147 | | |
| Total Liabilities | | | | 2,816,752 |
| Net Assets | | | $ | 238,339,780 |
| Net Assets consist of: | | | | |
| Paid in capital | | | $ | 284,642,513 |
| Total accumulated earnings (loss) | | | | (46,302,733) |
| Net Assets | | | $ | 238,339,780 |
| | | | | |
| Net Asset Value and Maximum Offering Price | | | | |
| Class A : | | | | |
Net Asset Value and redemption price per share ($31,227,594 ÷ 2,755,003 shares) (a) | | | $ | 11.33 |
| Maximum offering price per share (100/94.25 of $11.33) | | | $ | 12.02 |
| Class M : | | | | |
Net Asset Value and redemption price per share ($6,936,357 ÷ 612,294 shares) (a) | | | $ | 11.33 |
| Maximum offering price per share (100/96.50 of $11.33) | | | $ | 11.74 |
| Class C : | | | | |
Net Asset Value and offering price per share ($13,717,455 ÷ 1,214,722 shares) (a) | | | $ | 11.29 |
| Total Emerging Markets : | | | | |
Net Asset Value , offering price and redemption price per share ($91,760,542 ÷ 8,079,520 shares) | | | $ | 11.36 |
| Class I : | | | | |
Net Asset Value , offering price and redemption price per share ($82,664,424 ÷ 7,288,854 shares) | | | $ | 11.34 |
| Class Z : | | | | |
Net Asset Value , offering price and redemption price per share ($12,033,408 ÷ 1,064,040 shares) | | | $ | 11.31 |
(a)Redemption price per share is equal to net asset value less any applicable contingent deferred sales charge. |
| Statement of Operations |
| | | | Six months ended April 30, 2023 (Unaudited) |
| Investment Income | | | | |
| Dividends | | | $ | 1,818,434 |
| Non-Cash dividends | | | | 370,971 |
| Interest | | | | 3,390,612 |
| Income from Fidelity Central Funds (including $3,154 from security lending) | | | | 140,131 |
| Income before foreign taxes withheld | | | $ | 5,720,148 |
| Less foreign taxes withheld | | | | (176,478) |
| Total Income | | | | 5,543,670 |
| Expenses | | | | |
| Management fee | $ | 984,456 | | |
| Transfer agent fees | | 240,540 | | |
| Distribution and service plan fees | | 128,297 | | |
| Accounting fees | | 59,848 | | |
| Custodian fees and expenses | | 94,914 | | |
| Independent trustees' fees and expenses | | 1,006 | | |
| Registration fees | | 38,616 | | |
| Audit | | 57,473 | | |
| Legal | | 1,732 | | |
| Miscellaneous | | 639 | | |
| Total expenses before reductions | | 1,607,521 | | |
| Expense reductions | | (6,121) | | |
| Total expenses after reductions | | | | 1,601,400 |
| Net Investment income (loss) | | | | 3,942,270 |
| Realized and Unrealized Gain (Loss) | | | | |
| Net realized gain (loss) on: | | | | |
| Investment Securities: | | | | |
| Unaffiliated issuers (net of foreign taxes of $114,215) | | (1,169,529) | | |
| Foreign currency transactions | | 16,653 | | |
| Futures contracts | | 129,657 | | |
| Total net realized gain (loss) | | | | (1,023,219) |
| Change in net unrealized appreciation (depreciation) on: | | | | |
| Investment Securities: | | | | |
| Unaffiliated issuers(net of increase in deferred foreign taxes of $40,781) | | 34,123,095 | | |
| Assets and liabilities in foreign currencies | | (15,839) | | |
| Total change in net unrealized appreciation (depreciation) | | | | 34,107,256 |
| Net gain (loss) | | | | 33,084,037 |
| Net increase (decrease) in net assets resulting from operations | | | $ | 37,026,307 |
| Statement of Changes in Net Assets |
| |
| | Six months ended April 30, 2023 (Unaudited) | | Year ended October 31, 2022 |
| Increase (Decrease) in Net Assets | | | | |
| Operations | | | | |
| Net investment income (loss) | $ | 3,942,270 | $ | 10,825,203 |
| Net realized gain (loss) | | (1,023,219) | | (12,640,549) |
| Change in net unrealized appreciation (depreciation) | | 34,107,256 | | (173,003,840) |
| Net increase (decrease) in net assets resulting from operations | | 37,026,307 | | (174,819,186) |
| Distributions to shareholders | | (7,044,986) | | (11,768,448) |
| Share transactions - net increase (decrease) | | (43,900,325) | | (182,422,186) |
| Total increase (decrease) in net assets | | (13,919,004) | | (369,009,820) |
| | | | | |
| Net Assets | | | | |
| Beginning of period | | 252,258,784 | | 621,268,604 |
| End of period | $ | 238,339,780 | $ | 252,258,784 |
| | | | | |
| | | | | |
Financial Highlights
| Fidelity Advisor® Total Emerging Markets Fund Class A |
| |
| | Six months ended (Unaudited) April 30, 2023 | | Years ended October 31, 2022 | | 2021 | | 2020 | | 2019 | | 2018 |
Selected Per-Share Data | | | | | | | | | | | | |
| Net asset value, beginning of period | $ | 10.09 | $ | 15.26 | $ | 13.55 | $ | 12.80 | $ | 11.53 | $ | 13.56 |
| Income from Investment Operations | | | | | | | | | | | | |
Net investment income (loss) A,B | | .16 | | .28 | | .20 | | .19 | | .37 C | | .25 |
| Net realized and unrealized gain (loss) | | 1.37 | | (5.19) | | 1.67 | | .89 | | 1.14 | | (1.94) |
| Total from investment operations | | 1.53 | | (4.91) | | 1.87 | | 1.08 | | 1.51 | | (1.69) |
| Distributions from net investment income | | (.29) | | (.26) | | (.16) | | (.33) | | (.24) | | (.16) |
| Distributions from net realized gain | | - | | - | | - | | - | | - | | (.19) |
| Total distributions | | (.29) | | (.26) | | (.16) | | (.33) | | (.24) | | (.34) D |
| Net asset value, end of period | $ | 11.33 | $ | 10.09 | $ | 15.26 | $ | 13.55 | $ | 12.80 | $ | 11.53 |
Total Return E,F,G | | 15.21% | | (32.69)% | | 13.78% | | 8.54% | | 13.38% | | (12.77)% |
Ratios to Average Net Assets B,H,I | | | | | | | | | | | | |
| Expenses before reductions | | 1.44% J | | 1.39% | | 1.36% | | 1.40% | | 1.39% | | 1.40% |
| Expenses net of fee waivers, if any | | 1.44% J | | 1.39% | | 1.36% | | 1.39% | | 1.39% | | 1.40% |
| Expenses net of all reductions | | 1.44% J | | 1.39% | | 1.36% | | 1.37% | | 1.39% | | 1.37% |
| Net investment income (loss) | | 2.94% J | | 2.21% | | 1.26% | | 1.49% | | 3.02% C | | 1.92% |
| Supplemental Data | | | | | | | | | | | | |
| Net assets, end of period (000 omitted) | $ | 31,228 | $ | 28,302 | $ | 46,981 | $ | 37,022 | $ | 39,958 | $ | 34,617 |
Portfolio turnover rate K | | 35% J | | 67% | | 58% | | 58% | | 75% | | 94% |
A Calculated based on average shares outstanding during the period.
B Net investment income (loss) is affected by the timing of the declaration of dividends by any underlying mutual funds or exchange-traded funds (ETFs). Net investment income (loss) of any mutual funds or ETFs is not included in the Fund's net investment income (loss) ratio.
C Net investment income per share reflects one or more large, non-recurring dividend(s) which amounted to $.08 per share. Excluding such non-recurring dividend(s), the ratio of net investment income (loss) to average net assets would have been 2.37%.
D Total distributions per share do not sum due to rounding.
E Total returns for periods of less than one year are not annualized.
F Total returns would have been lower if certain expenses had not been reduced during the applicable periods shown.
G Total returns do not include the effect of the sales charges.
H Fees and expenses of any underlying mutual funds or exchange-traded funds (ETFs) are not included in the Fund's expense ratio. The Fund indirectly bears its proportionate share of these expenses. For additional expense information related to investments in Fidelity Central Funds, please refer to the "Investments in Fidelity Central Funds" note found in the Notes to Financial Statements section of the most recent Annual or Semi-Annual report.
I Expense ratios reflect operating expenses of the class. Expenses before reductions do not reflect amounts reimbursed, waived, or reduced through arrangements with the investment adviser, brokerage services, or other offset arrangements, if applicable, and do not represent the amount paid by the class during periods when reimbursements, waivers or reductions occur.
J Annualized.
K Amount does not include the portfolio activity of any underlying mutual funds or exchange-traded funds (ETFs).
| Fidelity Advisor® Total Emerging Markets Fund Class M |
| |
| | Six months ended (Unaudited) April 30, 2023 | | Years ended October 31, 2022 | | 2021 | | 2020 | | 2019 | | 2018 |
Selected Per-Share Data | | | | | | | | | | | | |
| Net asset value, beginning of period | $ | 10.07 | $ | 15.23 | $ | 13.52 | $ | 12.78 | $ | 11.51 | $ | 13.55 |
| Income from Investment Operations | | | | | | | | | | | | |
Net investment income (loss) A,B | | .15 | | .24 | | .15 | | .15 | | .33 C | | .21 |
| Net realized and unrealized gain (loss) | | 1.37 | | (5.19) | | 1.67 | | .88 | | 1.15 | | (1.93) |
| Total from investment operations | | 1.52 | | (4.95) | | 1.82 | | 1.03 | | 1.48 | | (1.72) |
| Distributions from net investment income | | (.26) | | (.21) | | (.11) | | (.29) | | (.21) | | (.13) |
| Distributions from net realized gain | | - | | - | | - | | - | | - | | (.19) |
| Total distributions | | (.26) | | (.21) | | (.11) | | (.29) | | (.21) | | (.32) |
| Net asset value, end of period | $ | 11.33 | $ | 10.07 | $ | 15.23 | $ | 13.52 | $ | 12.78 | $ | 11.51 |
Total Return D,E,F | | 15.10% | | (32.92)% | | 13.47% | | 8.16% | | 13.05% | | (13.03)% |
Ratios to Average Net Assets B,G,H | | | | | | | | | | | | |
| Expenses before reductions | | 1.73% I | | 1.69% | | 1.66% | | 1.71% | | 1.72% | | 1.74% |
| Expenses net of fee waivers, if any | | 1.73% I | | 1.69% | | 1.66% | | 1.71% | | 1.71% | | 1.74% |
| Expenses net of all reductions | | 1.72% I | | 1.69% | | 1.66% | | 1.69% | | 1.71% | | 1.71% |
| Net investment income (loss) | | 2.65% I | | 1.90% | | .96% | | 1.17% | | 2.69% C | | 1.58% |
| Supplemental Data | | | | | | | | | | | | |
| Net assets, end of period (000 omitted) | $ | 6,936 | $ | 6,237 | $ | 9,530 | $ | 7,885 | $ | 8,841 | $ | 8,519 |
Portfolio turnover rate J | | 35% I | | 67% | | 58% | | 58% | | 75% | | 94% |
A Calculated based on average shares outstanding during the period.
B Net investment income (loss) is affected by the timing of the declaration of dividends by any underlying mutual funds or exchange-traded funds (ETFs). Net investment income (loss) of any mutual funds or ETFs is not included in the Fund's net investment income (loss) ratio.
C Net investment income per share reflects one or more large, non-recurring dividend(s) which amounted to $.08 per share. Excluding such non-recurring dividend(s), the ratio of net investment income (loss) to average net assets would have been 2.04%.
D Total returns for periods of less than one year are not annualized.
E Total returns would have been lower if certain expenses had not been reduced during the applicable periods shown.
F Total returns do not include the effect of the sales charges.
G Fees and expenses of any underlying mutual funds or exchange-traded funds (ETFs) are not included in the Fund's expense ratio. The Fund indirectly bears its proportionate share of these expenses. For additional expense information related to investments in Fidelity Central Funds, please refer to the "Investments in Fidelity Central Funds" note found in the Notes to Financial Statements section of the most recent Annual or Semi-Annual report.
H Expense ratios reflect operating expenses of the class. Expenses before reductions do not reflect amounts reimbursed, waived, or reduced through arrangements with the investment adviser, brokerage services, or other offset arrangements, if applicable, and do not represent the amount paid by the class during periods when reimbursements, waivers or reductions occur.
I Annualized.
J Amount does not include the portfolio activity of any underlying mutual funds or exchange-traded funds (ETFs).
| Fidelity Advisor® Total Emerging Markets Fund Class C |
| |
| | Six months ended (Unaudited) April 30, 2023 | | Years ended October 31, 2022 | | 2021 | | 2020 | | 2019 | | 2018 |
Selected Per-Share Data | | | | | | | | | | | | |
| Net asset value, beginning of period | $ | 10.00 | $ | 15.09 | $ | 13.41 | $ | 12.66 | $ | 11.40 | $ | 13.45 |
| Income from Investment Operations | | | | | | | | | | | | |
Net investment income (loss) A,B | | .12 | | .18 | | .08 | | .09 | | .28 C | | .15 |
| Net realized and unrealized gain (loss) | | 1.35 | | (5.15) | | 1.65 | | .89 | | 1.13 | | (1.92) |
| Total from investment operations | | 1.47 | | (4.97) | | 1.73 | | .98 | | 1.41 | | (1.77) |
| Distributions from net investment income | | (.18) | | (.12) | | (.05) | | (.23) | | (.15) | | (.09) |
| Distributions from net realized gain | | - | | - | | - | | - | | - | | (.19) |
| Total distributions | | (.18) | | (.12) | | (.05) | | (.23) | | (.15) | | (.28) |
| Net asset value, end of period | $ | 11.29 | $ | 10.00 | $ | 15.09 | $ | 13.41 | $ | 12.66 | $ | 11.40 |
Total Return D,E,F | | 14.73% | | (33.17)% | | 12.89% | | 7.83% | | 12.54% | | (13.45)% |
Ratios to Average Net Assets B,G,H | | | | | | | | | | | | |
| Expenses before reductions | | 2.18% I | | 2.14% | | 2.11% | | 2.14% | | 2.14% | | 2.14% |
| Expenses net of fee waivers, if any | | 2.18% I | | 2.13% | | 2.11% | | 2.14% | | 2.14% | | 2.14% |
| Expenses net of all reductions | | 2.18% I | | 2.13% | | 2.11% | | 2.12% | | 2.13% | | 2.12% |
| Net investment income (loss) | | 2.20% I | | 1.46% | | .51% | | .74% | | 2.27% C | | 1.18% |
| Supplemental Data | | | | | | | | | | | | |
| Net assets, end of period (000 omitted) | $ | 13,717 | $ | 13,469 | $ | 27,673 | $ | 28,884 | $ | 35,545 | $ | 37,191 |
Portfolio turnover rate J | | 35% I | | 67% | | 58% | | 58% | | 75% | | 94% |
A Calculated based on average shares outstanding during the period.
B Net investment income (loss) is affected by the timing of the declaration of dividends by any underlying mutual funds or exchange-traded funds (ETFs). Net investment income (loss) of any mutual funds or ETFs is not included in the Fund's net investment income (loss) ratio.
C Net investment income per share reflects one or more large, non-recurring dividend(s) which amounted to $.08 per share. Excluding such non-recurring dividend(s), the ratio of net investment income (loss) to average net assets would have been 1.62%.
D Total returns for periods of less than one year are not annualized.
E Total returns would have been lower if certain expenses had not been reduced during the applicable periods shown.
F Total returns do not include the effect of the contingent deferred sales charge.
G Fees and expenses of any underlying mutual funds or exchange-traded funds (ETFs) are not included in the Fund's expense ratio. The Fund indirectly bears its proportionate share of these expenses. For additional expense information related to investments in Fidelity Central Funds, please refer to the "Investments in Fidelity Central Funds" note found in the Notes to Financial Statements section of the most recent Annual or Semi-Annual report.
H Expense ratios reflect operating expenses of the class. Expenses before reductions do not reflect amounts reimbursed, waived, or reduced through arrangements with the investment adviser, brokerage services, or other offset arrangements, if applicable, and do not represent the amount paid by the class during periods when reimbursements, waivers or reductions occur.
I Annualized.
J Amount does not include the portfolio activity of any underlying mutual funds or exchange-traded funds (ETFs).
| Fidelity® Total Emerging Markets Fund |
| |
| | Six months ended (Unaudited) April 30, 2023 | | Years ended October 31, 2022 | | 2021 | | 2020 | | 2019 | | 2018 |
Selected Per-Share Data | | | | | | | | | | | | |
| Net asset value, beginning of period | $ | 10.12 | $ | 15.31 | $ | 13.59 | $ | 12.84 | $ | 11.56 | $ | 13.58 |
| Income from Investment Operations | | | | | | | | | | | | |
Net investment income (loss) A,B | | .18 | | .32 | | .24 | | .22 | | .40 C | | .29 |
| Net realized and unrealized gain (loss) | | 1.37 | | (5.21) | | 1.67 | | .90 | | 1.16 | | (1.95) |
| Total from investment operations | | 1.55 | | (4.89) | | 1.91 | | 1.12 | | 1.56 | | (1.66) |
| Distributions from net investment income | | (.31) | | (.30) | | (.19) | | (.37) | | (.28) | | (.17) |
| Distributions from net realized gain | | - | | - | | - | | - | | - | | (.19) |
| Total distributions | | (.31) | | (.30) | | (.19) | | (.37) | | (.28) | | (.36) |
| Net asset value, end of period | $ | 11.36 | $ | 10.12 | $ | 15.31 | $ | 13.59 | $ | 12.84 | $ | 11.56 |
Total Return D,E | | 15.40% | | (32.52)% | | 14.06% | | 8.79% | | 13.80% | | (12.56)% |
Ratios to Average Net Assets B,F,G | | | | | | | | | | | | |
| Expenses before reductions | | 1.19% H | | 1.12% | | 1.11% | | 1.16% | | 1.14% | | 1.13% |
| Expenses net of fee waivers, if any | | 1.19% H | | 1.11% | | 1.11% | | 1.15% | | 1.14% | | 1.13% |
| Expenses net of all reductions | | 1.19% H | | 1.11% | | 1.11% | | 1.14% | | 1.14% | | 1.11% |
| Net investment income (loss) | | 3.18% H | | 2.48% | | 1.51% | | 1.73% | | 3.27% C | | 2.19% |
| Supplemental Data | | | | | | | | | | | | |
| Net assets, end of period (000 omitted) | $ | 91,761 | $ | 91,615 | $ | 259,331 | $ | 205,009 | $ | 199,708 | $ | 190,025 |
Portfolio turnover rate I | | 35% H | | 67% | | 58% | | 58% | | 75% | | 94% |
A Calculated based on average shares outstanding during the period.
B Net investment income (loss) is affected by the timing of the declaration of dividends by any underlying mutual funds or exchange-traded funds (ETFs). Net investment income (loss) of any mutual funds or ETFs is not included in the Fund's net investment income (loss) ratio.
C Net investment income per share reflects one or more large, non-recurring dividend(s) which amounted to $.08 per share. Excluding such non-recurring dividend(s), the ratio of net investment income (loss) to average net assets would have been 2.62%.
D Total returns for periods of less than one year are not annualized.
E Total returns would have been lower if certain expenses had not been reduced during the applicable periods shown.
F Fees and expenses of any underlying mutual funds or exchange-traded funds (ETFs) are not included in the Fund's expense ratio. The Fund indirectly bears its proportionate share of these expenses. For additional expense information related to investments in Fidelity Central Funds, please refer to the "Investments in Fidelity Central Funds" note found in the Notes to Financial Statements section of the most recent Annual or Semi-Annual report.
G Expense ratios reflect operating expenses of the class. Expenses before reductions do not reflect amounts reimbursed, waived, or reduced through arrangements with the investment adviser, brokerage services, or other offset arrangements, if applicable, and do not represent the amount paid by the class during periods when reimbursements, waivers or reductions occur.
H Annualized.
I Amount does not include the portfolio activity of any underlying mutual funds or exchange-traded funds (ETFs).
| Fidelity Advisor® Total Emerging Markets Fund Class I |
| |
| | Six months ended (Unaudited) April 30, 2023 | | Years ended October 31, 2022 | | 2021 | | 2020 | | 2019 | | 2018 |
Selected Per-Share Data | | | | | | | | | | | | |
| Net asset value, beginning of period | $ | 10.11 | $ | 15.29 | $ | 13.57 | $ | 12.82 | $ | 11.55 | $ | 13.58 |
| Income from Investment Operations | | | | | | | | | | | | |
Net investment income (loss) A,B | | .18 | | .32 | | .24 | | .22 | | .41 C | | .29 |
| Net realized and unrealized gain (loss) | | 1.37 | | (5.20) | | 1.67 | | .90 | | 1.14 | | (1.95) |
| Total from investment operations | | 1.55 | | (4.88) | | 1.91 | | 1.12 | | 1.55 | | (1.66) |
| Distributions from net investment income | | (.32) | | (.30) | | (.19) | | (.37) | | (.28) | | (.19) |
| Distributions from net realized gain | | - | | - | | - | | - | | - | | (.19) |
| Total distributions | | (.32) | | (.30) | | (.19) | | (.37) | | (.28) | | (.37) D |
| Net asset value, end of period | $ | 11.34 | $ | 10.11 | $ | 15.29 | $ | 13.57 | $ | 12.82 | $ | 11.55 |
Total Return E,F | | 15.40% | | (32.50)% | | 14.10% | | 8.85% | | 13.77% | | (12.56)% |
Ratios to Average Net Assets B,G,H | | | | | | | | | | | | |
| Expenses before reductions | | 1.14% I | | 1.10% | | 1.09% | | 1.11% | | 1.11% | | 1.12% |
| Expenses net of fee waivers, if any | | 1.14% I | | 1.10% | | 1.08% | | 1.10% | | 1.10% | | 1.12% |
| Expenses net of all reductions | | 1.14% I | | 1.10% | | 1.08% | | 1.09% | | 1.10% | | 1.10% |
| Net investment income (loss) | | 3.23% I | | 2.49% | | 1.54% | | 1.78% | | 3.30% C | | 2.20% |
| Supplemental Data | | | | | | | | | | | | |
| Net assets, end of period (000 omitted) | $ | 82,664 | $ | 98,727 | $ | 209,635 | $ | 232,450 | $ | 372,286 | $ | 341,720 |
Portfolio turnover rate J | | 35% I | | 67% | | 58% | | 58% | | 75% | | 94% |
A Calculated based on average shares outstanding during the period.
B Net investment income (loss) is affected by the timing of the declaration of dividends by any underlying mutual funds or exchange-traded funds (ETFs). Net investment income (loss) of any mutual funds or ETFs is not included in the Fund's net investment income (loss) ratio.
C Net investment income per share reflects one or more large, non-recurring dividend(s) which amounted to $.08 per share. Excluding such non-recurring dividend(s), the ratio of net investment income (loss) to average net assets would have been 2.65%.
D Total distributions per share do not sum due to rounding.
E Total returns for periods of less than one year are not annualized.
F Total returns would have been lower if certain expenses had not been reduced during the applicable periods shown.
G Fees and expenses of any underlying mutual funds or exchange-traded funds (ETFs) are not included in the Fund's expense ratio. The Fund indirectly bears its proportionate share of these expenses. For additional expense information related to investments in Fidelity Central Funds, please refer to the "Investments in Fidelity Central Funds" note found in the Notes to Financial Statements section of the most recent Annual or Semi-Annual report.
H Expense ratios reflect operating expenses of the class. Expenses before reductions do not reflect amounts reimbursed, waived, or reduced through arrangements with the investment adviser, brokerage services, or other offset arrangements, if applicable, and do not represent the amount paid by the class during periods when reimbursements, waivers or reductions occur.
I Annualized.
J Amount does not include the portfolio activity of any underlying mutual funds or exchange-traded funds (ETFs).
| Fidelity Advisor® Total Emerging Markets Fund Class Z |
| |
| | Six months ended (Unaudited) April 30, 2023 | | Years ended October 31, 2022 | | 2021 | | 2020 | | 2019 | | 2018 A |
Selected Per-Share Data | | | | | | | | | | | | |
| Net asset value, beginning of period | $ | 10.09 | $ | 15.26 | $ | 13.55 | $ | 12.80 | $ | 11.55 | $ | 12.17 |
| Income from Investment Operations | | | | | | | | | | | | |
Net investment income (loss) B,C | | .19 | | .34 | | .26 | | .24 | | .43 D | | .01 |
| Net realized and unrealized gain (loss) | | 1.37 | | (5.19) | | 1.66 | | .90 | | 1.13 | | (.63) |
| Total from investment operations | | 1.56 | | (4.85) | | 1.92 | | 1.14 | | 1.56 | | (.62) |
| Distributions from net investment income | | (.34) | | (.32) | | (.21) | | (.39) | | (.31) | | - |
| Total distributions | | (.34) | | (.32) | | (.21) | | (.39) | | (.31) | | - |
| Net asset value, end of period | $ | 11.31 | $ | 10.09 | $ | 15.26 | $ | 13.55 | $ | 12.80 | $ | 11.55 |
Total Return E,F | | 15.49% | | (32.40)% | | 14.21% | | 9.03% | | 13.85% | | (5.09)% |
Ratios to Average Net Assets C,G,H | | | | | | | | | | | | |
| Expenses before reductions | | 1.02% I | | .97% | | .96% | | .98% | | .98% | | 1.07% I |
| Expenses net of fee waivers, if any | | 1.01% I | | .97% | | .96% | | .98% | | .97% | | 1.04% I |
| Expenses net of all reductions | | 1.01% I | | .97% | | .96% | | .96% | | .97% | | 1.02% I |
| Net investment income (loss) | | 3.36% I | | 2.62% | | 1.66% | | 1.91% | | 3.43% D | | 1.51% I |
| Supplemental Data | | | | | | | | | | | | |
| Net assets, end of period (000 omitted) | $ | 12,033 | $ | 13,909 | $ | 68,119 | $ | 56,395 | $ | 61,175 | $ | 1,603 |
Portfolio turnover rate J | | 35% I | | 67% | | 58% | | 58% | | 75% | | 94% I |
A For the period October 2, 2018 (commencement of sale of shares) through October 31, 2018.
B Calculated based on average shares outstanding during the period.
C Net investment income (loss) is affected by the timing of the declaration of dividends by any underlying mutual funds or exchange-traded funds (ETFs). Net investment income (loss) of any mutual funds or ETFs is not included in the Fund's net investment income (loss) ratio.
D Net investment income per share reflects one or more large, non-recurring dividend(s) which amounted to $.08 per share. Excluding such non-recurring dividend(s), the ratio of net investment income (loss) to average net assets would have been 2.79%.
E Total returns for periods of less than one year are not annualized.
F Total returns would have been lower if certain expenses had not been reduced during the applicable periods shown.
G Fees and expenses of any underlying mutual funds or exchange-traded funds (ETFs) are not included in the Fund's expense ratio. The Fund indirectly bears its proportionate share of these expenses. For additional expense information related to investments in Fidelity Central Funds, please refer to the "Investments in Fidelity Central Funds" note found in the Notes to Financial Statements section of the most recent Annual or Semi-Annual report.
H Expense ratios reflect operating expenses of the class. Expenses before reductions do not reflect amounts reimbursed, waived, or reduced through arrangements with the investment adviser, brokerage services, or other offset arrangements, if applicable, and do not represent the amount paid by the class during periods when reimbursements, waivers or reductions occur.
I Annualized.
J Amount does not include the portfolio activity of any underlying mutual funds or exchange-traded funds (ETFs).
For the period ended April 30, 2023
1. Organization.
Fidelity Total Emerging Markets Fund (the Fund) is a fund of Fidelity Investment Trust (the Trust) and is authorized to issue an unlimited number of shares. The Trust is registered under the Investment Company Act of 1940, as amended (the 1940 Act), as an open-end management investment company organized as a Massachusetts business trust. The Fund offers Class A, Class M, Class C, Total Emerging Markets, Class I and Class Z shares, each of which has equal rights as to assets and voting privileges. Class A, Class M, Class C, Class I and Class Z are Fidelity Advisor classes. Each class has exclusive voting rights with respect to matters that affect that class. Class C shares will automatically convert to Class A shares after a holding period of eight years from the initial date of purchase, with certain exceptions. The Fund's investments in emerging markets can be subject to social, economic, regulatory, and political uncertainties and can be extremely volatile.
2. Investments in Fidelity Central Funds.
Funds may invest in Fidelity Central Funds, which are open-end investment companies generally available only to other investment companies and accounts managed by the investment adviser and its affiliates. The Schedule of Investments lists any Fidelity Central Funds held as an investment as of period end, but does not include the underlying holdings of each Fidelity Central Fund. An investing fund indirectly bears its proportionate share of the expenses of the underlying Fidelity Central Funds.
Based on its investment objective, each Fidelity Central Fund may invest or participate in various investment vehicles or strategies that are similar to those of the investing fund. These strategies are consistent with the investment objectives of the investing fund and may involve certain economic risks which may cause a decline in value of each of the Fidelity Central Funds and thus a decline in the value of the investing fund.
| Fidelity Central Fund | Investment Manager | Investment Objective | Investment Practices | Expense Ratio A |
| Fidelity Money Market Central Funds | Fidelity Management & Research Company LLC (FMR) | Each fund seeks to obtain a high level of current income consistent with the preservation of capital and liquidity. | Short-term Investments | Less than .005% |
A Expenses expressed as a percentage of average net assets and are as of each underlying Central Fund's most recent annual or semi-annual shareholder report.
A complete unaudited list of holdings for each Fidelity Central Fund is available upon request or at the Securities and Exchange Commission website at www.sec.gov. In addition, the financial statements of the Fidelity Central Funds which contain the significant accounting policies (including investment valuation policies) of those funds, and are not covered by the Report of Independent Registered Public Accounting Firm, are available on the Securities and Exchange Commission website or upon request.
3. Significant Accounting Policies.
The Fund is an investment company and applies the accounting and reporting guidance of the Financial Accounting Standards Board (FASB) Accounting Standards Codification Topic 946 Financial Services - Investment Companies . The financial statements have been prepared in conformity with accounting principles generally accepted in the United States of America (GAAP), which require management to make certain estimates and assumptions at the date of the financial statements. Actual results could differ from those estimates. Subsequent events, if any, through the date that the financial statements were issued have been evaluated in the preparation of the financial statements. The Fund's Schedule of Investments lists any underlying mutual funds or exchange-traded funds (ETFs) but does not include the underlying holdings of these funds. The following summarizes the significant accounting policies of the Fund:
Investment Valuation. Investments are valued as of 4:00 p.m. Eastern time on the last calendar day of the period. The Board of Trustees (the Board) has designated the Fund's investment adviser as the valuation designee responsible for the fair valuation function and performing fair value determinations as needed. The investment adviser has established a Fair Value Committee (the Committee) to carry out the day-to-day fair valuation responsibilities and has adopted policies and procedures to govern the fair valuation process and the activities of the Committee. In accordance with these fair valuation policies and procedures, which have been approved by the Board, the Fund attempts to obtain prices from one or more third party pricing services or brokers to value its investments. When current market prices, quotations or currency exchange rates are not readily available or reliable, investments will be fair valued in good faith by the Committee, in accordance with the policies and procedures. Factors used in determining fair value vary by investment type and may include market or investment specific events, transaction data, estimated cash flows, and market observations of comparable investments. The frequency that the fair valuation procedures are used cannot be predicted and they may be utilized to a significant extent. The Committee manages the Fund's fair valuation practices and maintains the fair valuation policies and procedures. The Fund's investment adviser reports to the Board information regarding the fair valuation process and related material matters.
The Fund categorizes the inputs to valuation techniques used to value its investments into a disclosure hierarchy consisting of three levels as shown below:
Level 1 - unadjusted quoted prices in active markets for identical investments
Level 2 - other significant observable inputs (including quoted prices for similar investments, interest rates, prepayment speeds, etc.)
Level 3 - unobservable inputs (including the Fund's own assumptions based on the best information available)
Valuation techniques used to value the Fund's investments by major category are as follows:
Equity securities, including restricted securities, for which market quotations are readily available, are valued at the last reported sale price or official closing price as reported by a third party pricing service on the primary market or exchange on which they are traded and are categorized as Level 1 in the hierarchy. In the event there were no sales during the day or closing prices are not available, securities are valued at the last quoted bid price or may be valued using the last available price and are generally categorized as Level 2 in the hierarchy. For foreign equity securities, when market or security specific events arise, comparisons to the valuation of American Depositary Receipts (ADRs), futures contracts, ETFs and certain indexes as well as quoted prices for similar securities may be used and would be categorized as Level 2 in the hierarchy. For equity securities, including restricted securities, where observable inputs are limited, assumptions about market activity and risk are used and these securities may be categorized as Level 3 in the hierarchy.
Debt securities, including restricted securities, are valued based on evaluated prices received from third party pricing services or from brokers who make markets in such securities. Corporate bonds, foreign government and government agency obligations, preferred securities and U.S. government and government agency obligations are valued by pricing services who utilize matrix pricing which considers yield or price of bonds of comparable quality, coupon, maturity and type or by broker-supplied prices. When independent prices are unavailable or unreliable, debt securities may be valued utilizing pricing methodologies which consider similar factors that would be used by third party pricing services. Debt securities are generally categorized as Level 2 in the hierarchy but may be Level 3 depending on the circumstances.
Investments in open-end mutual funds, including the Fidelity Central Funds, are valued at their closing net asset value (NAV) each business day and are categorized as Level 1 in the hierarchy.
The following provides information on Level 3 securities held by the Fund that were valued at period end based on unobservable inputs. These amounts exclude valuations provided by a broker.
| Asset Type | Fair Value | Valuation Technique(s) | Unobservable Input | Amount or Range/Weighted Average | Impact to Valuation from an Increase in Input A |
| Equities | $ 4,004,788 | Market comparable | Enterprise value/Revenue multiple (EV/R) | 2.1 - 8.5/5.9 | Increase |
| | | Market approach | Transaction price | $9.50 - $55.00/$20.20 | Increase |
| | | | Discount rate | 20.0% - 50.0%/21.3% | Decrease |
| | | Book value | Book value multiple | 1.4 | Increase |
| | | Indicative market price | Discount rate | 20.0% | Decrease |
| | | | Bid price | $11.20 | Increase |
| | | Black scholes | Discount rate | 4.2% | Increase |
| | | | Volatility | 95.0% | Increase |
| | | | Term | 2.0 | Increase |
| Government Obligations | $30,000 | Indicative market price | Evaluated bid | $5.00 | Increase |
A Represents the directional change in the fair value of the Level 3 investments that could have resulted from an increase in the corresponding input as of period end. A decrease to the unobservable input would have had the opposite effect. Significant changes in these inputs may have resulted in a significantly higher or lower fair value measurement at period end.
Changes in valuation techniques may result in transfers in or out of an assigned level within the disclosure hierarchy. The aggregate value of investments by input level as of April 30, 2023 is included at the end of the Fund's Schedule of Investments.
Foreign Currency. Certain Funds may use foreign currency contracts to facilitate transactions in foreign-denominated securities. Gains and losses from these transactions may arise from changes in the value of the foreign currency or if the counterparties do not perform under the contracts' terms.
Foreign-denominated assets, including investment securities, and liabilities are translated into U.S. dollars at the exchange rates at period end. Purchases and sales of investment securities, income and dividends received, and expenses denominated in foreign currencies are translated into U.S. dollars at the exchange rate in effect on the transaction date.
The effects of exchange rate fluctuations on investments are included with the net realized and unrealized gain (loss) on investment securities. Other foreign currency transactions resulting in realized and unrealized gain (loss) are disclosed separately.
Investment Transactions and Income. For financial reporting purposes, the Fund's investment holdings and NAV include trades executed through the end of the last business day of the period. The NAV per share for processing shareholder transactions is calculated as of the close of business of the New York Stock Exchange (NYSE), normally 4:00 p.m. Eastern time and includes trades executed through the end of the prior business day. Gains and losses on securities sold are determined on the basis of identified cost and include proceeds received from litigation. Commissions paid to certain brokers with whom the investment adviser, or its affiliates, places trades on behalf of a fund include an amount in addition to trade execution, which may be rebated back to a fund. Any such rebates are included in net realized gain (loss) on investments in the Statement of Operations. Dividend income is recorded on the ex-dividend date, except for certain dividends from foreign securities where the ex-dividend date may have passed, which are recorded as soon as the Fund is informed of the ex-dividend date. Non-cash dividends included in dividend income, if any, are recorded at the fair market value of the securities received. Income and capital gain distributions from Fidelity Central Funds, if any, are recorded on the ex-dividend date. Large, non-recurring dividends recognized by the Fund are presented separately on the Statement of Operations in "Non-cash dividends" and the impact of these dividends is presented in the Financial Highlights. Interest income is accrued as earned and includes coupon interest and amortization of premium and accretion of discount on debt securities as applicable. Investment income is recorded net of foreign taxes withheld where recovery of such taxes is uncertain. Debt obligations may be placed on non-accrual status and related interest income may be reduced by ceasing current accruals and writing off interest receivables when the collection of all or a portion of interest has become doubtful based on consistently applied procedures. A debt obligation is removed from non-accrual status when the issuer resumes interest payments or when collectability of interest is reasonably assured. Funds may file withholding tax reclaims in certain jurisdictions to recover a portion of amounts previously withheld. Any withholding tax reclaims income is included in the Statement of Operations in foreign taxes withheld. Any receivables for withholding tax reclaims are included in the Statement of Assets and Liabilities in dividends receivable.
Class Allocations and Expenses. Investment income, realized and unrealized capital gains and losses, common expenses of a fund, and certain fund-level expense reductions, if any, are allocated daily on a pro-rata basis to each class based on the relative net assets of each class to the total net assets of a fund. Each class differs with respect to transfer agent and distribution and service plan fees incurred, as applicable. Certain expense reductions may also differ by class, if applicable. For the reporting period, the allocated portion of income and expenses to each class as a percent of its average net assets may vary due to the timing of recording these transactions in relation to fluctuating net assets of the classes. Expenses directly attributable to a fund are charged to that fund. Expenses attributable to more than one fund are allocated among the respective funds on the basis of relative net assets or other appropriate methods. Expenses included in the accompanying financial statements reflect the expenses of that fund and do not include any expenses associated with any underlying mutual funds or exchange-traded funds. Although not included in a fund's expenses, a fund indirectly bears its proportionate share of these expenses through the net asset value of each underlying mutual fund or exchange-traded fund. Expense estimates are accrued in the period to which they relate and adjustments are made when actual amounts are known.
Income Tax Information and Distributions to Shareholders. Each year, the Fund intends to qualify as a regulated investment company under Subchapter M of the Internal Revenue Code, including distributing substantially all of its taxable income and realized gains. As a result, no provision for U.S. Federal income taxes is required. The Fund files a U.S. federal tax return, in addition to state and local tax returns as required. The Fund's federal income tax returns are subject to examination by the Internal Revenue Service (IRS) for a period of three fiscal years after they are filed. State and local tax returns may be subject to examination for an additional fiscal year depending on the jurisdiction. Foreign taxes are provided for based on the Fund's understanding of the tax rules and rates that exist in the foreign markets in which it invests. The Fund is subject to a tax imposed on capital gains by certain countries in which it invests. An estimated deferred tax liability for net unrealized appreciation on the applicable securities is included in deferred taxes on the Statement of Assets & Liabilities.
Distributions are declared and recorded on the ex-dividend date. Income and capital gain distributions are declared separately for each class. Income and capital gain distributions are determined in accordance with income tax regulations, which may differ from GAAP.
Capital accounts within the financial statements are adjusted for permanent book-tax differences. These adjustments have no impact on net assets or the results of operations. Capital accounts are not adjusted for temporary book-tax differences which will reverse in a subsequent period.
Book-tax differences are primarily due to futures contracts, foreign currency transactions, certain foreign taxes, passive foreign investment companies (PFIC), market discount, capital loss carryforwards and losses deferred due to wash sales.
As of period end, the cost and unrealized appreciation (depreciation) in securities, and derivatives if applicable, for federal income tax purposes were as follows:
| Gross unrealized appreciation | $40,041,688 |
| Gross unrealized depreciation | (58,578,820) |
| Net unrealized appreciation (depreciation) | $(18,537,132) |
| Tax cost | $255,951,253 |
Capital loss carryforwards are only available to offset future capital gains of the Fund to the extent provided by regulations and may be limited. The capital loss carryforward information presented below, including any applicable limitation, is estimated as of prior fiscal period end and is subject to adjustment.
| Short-term | $(29,016,054) |
| Long-term | (-) |
| Total capital loss carryforward | $(29,016,054) |
Delayed Delivery Transactions and When-Issued Securities. During the period, certain Funds transacted in securities on a delayed delivery or when-issued basis. Payment and delivery may take place after the customary settlement period for that security. The price of the underlying securities and the date when the securities will be delivered and paid for are fixed at the time the transaction is negotiated. Securities purchased on a delayed delivery or when-issued basis are identified as such in the Schedule of Investments. Compensation for interest forgone in the purchase of a delayed delivery or when-issued debt security may be received. With respect to purchase commitments, each applicable Fund identifies securities as segregated in its records with a value at least equal to the amount of the commitment. Payables and receivables associated with the purchases and sales of delayed delivery securities having the same coupon, settlement date and broker are offset. Delayed delivery or when-issued securities that have been purchased from and sold to different brokers are reflected as both payables and receivables in the Statement of Assets and Liabilities under the caption "Delayed delivery", as applicable. Losses may arise due to changes in the value of the underlying securities or if the counterparty does not perform under the contract's terms, or if the issuer does not issue the securities due to political, economic, or other factors.
Restricted Securities (including Private Placements). Funds may invest in securities that are subject to legal or contractual restrictions on resale. These securities generally may be resold in transactions exempt from registration or to the public if the securities are registered. Disposal of these securities may involve time-consuming negotiations and expense, and prompt sale at an acceptable price may be difficult. Information regarding restricted securities held at period end is included at the end of the Schedule of Investments, if applicable.
New Accounting Pronouncement. In June 2022, the Financial Accounting Standards Board (FASB) issued Accounting Standards Update (ASU) 2022-03 Fair Value Measurement (Topic 820): Fair Value Measurement of Equity Securities Subject to Contractual Sale Restrictions. The amendments in this ASU clarify that a contractual restriction on the sale of an equity security is not considered part of the unit of account of the equity security and, therefore, is not considered in measuring fair value. They also clarify that an entity cannot, as a separate unit of account, recognize and measure a contractual sale restriction. They also require additional disclosures for equity securities subject to contractual sale restrictions. ASU 2022-03 will be effective for fiscal years, including interim periods within those fiscal years, beginning after December 15, 2023, and allows for early adoption. ASU 2022-03 will only be applicable to an equity security in which the contractual arrangement that restricts its sale is executed or modified on or after the adoption date. Management is currently evaluating the potential impact of ASU 2022-03 to the financial statements.
4. Derivative Instruments.
Risk Exposures and the Use of Derivative Instruments. The Fund's investment objectives allow for various types of derivative instruments, including futures contracts. Derivatives are investments whose value is primarily derived from underlying assets, indices or reference rates and may be transacted on an exchange or over-the-counter (OTC). Derivatives may involve a future commitment to buy or sell a specified asset based on specified terms, to exchange future cash flows at periodic intervals based on a notional principal amount, or for one party to make one or more payments upon the occurrence of specified events in exchange for periodic payments from the other party.
Derivatives were used to increase returns and to manage exposure to certain risks as defined below. The success of any strategy involving derivatives depends on analysis of numerous economic factors, and if the strategies for investment do not work as intended, the objectives may not be achieved.
Derivatives were used to increase or decrease exposure to the following risk(s):
| | |
| Equity Risk | Equity risk relates to the fluctuations in the value of financial instruments as a result of changes in market prices (other than those arising from interest rate risk or foreign exchange risk), whether caused by factors specific to an individual investment, its issuer, or all factors affecting all instruments traded in a market or market segment. |
Funds are also exposed to additional risks from investing in derivatives, such as liquidity risk and counterparty credit risk. Liquidity risk is the risk that a fund will be unable to close out the derivative in the open market in a timely manner. Counterparty credit risk is the risk that the counterparty will not be able to fulfill its obligation to a fund. Counterparty credit risk related to exchange-traded contracts may be mitigated by the protection provided by the exchange on which they trade.
Investing in derivatives may involve greater risks than investing in the underlying assets directly and, to varying degrees, may involve risk of loss in excess of any initial investment and collateral received and amounts recognized in the Statement of Assets and Liabilities. In addition, there may be the risk that the change in value of the derivative contract does not correspond to the change in value of the underlying instrument.
Futures Contracts. A futures contract is an agreement between two parties to buy or sell a specified underlying instrument for a fixed price at a specified future date. Futures contracts were used to manage exposure to the stock market.
Upon entering into a futures contract, a fund is required to deposit either cash or securities (initial margin) with a clearing broker in an amount equal to a certain percentage of the face value of the contract. Futures contracts are marked-to-market daily and subsequent daily payments are made or received by a fund depending on the daily fluctuations in the value of the futures contracts and are recorded as unrealized appreciation or (depreciation). This receivable and/or payable, if any, is included in daily variation margin on futures contracts in the Statement of Assets and Liabilities. Realized gain or (loss) is recorded upon the expiration or closing of a futures contract. The net realized gain (loss) and change in net unrealized appreciation (depreciation) on futures contracts during the period is presented in the Statement of Operations.
Any open futures contracts at period end are presented in the Schedule of Investments under the caption "Futures Contracts". The notional amount at value reflects each contract's exposure to the underlying instrument or index at period end, and is representative of volume of activity during the period unless an average notional amount is presented. Any securities deposited to meet initial margin requirements are identified in the Schedule of Investments. Any cash deposited to meet initial margin requirements is presented as segregated cash with brokers for derivative instruments in the Statement of Assets and Liabilities.
5. Purchases and Sales of Investments.
Purchases and sales of securities, other than short-term securities, U.S. government securities and in-kind transactions, as applicable, are noted in the table below.
| | Purchases ($) | Sales ($) |
| Fidelity Total Emerging Markets Fund | 42,324,885 | 83,225,347 |
6. Fees and Other Transactions with Affiliates.
Management Fee. Fidelity Management & Research Company LLC (the investment adviser) and its affiliates provide the Fund with investment management related services for which the Fund pays a monthly management fee. The management fee is the sum of an individual fund fee rate that is based on an annual rate of .55% of the Fund's average net assets and an annualized group fee rate that averaged .23% during the period. The group fee rate is based upon the monthly average net assets of a group of registered investment companies with which the investment adviser has management contracts. The group fee rate decreases as assets under management increase and increases as assets under management decrease. For the reporting period, the total annualized management fee rate was .78% of the Fund's average net assets.
Distribution and Service Plan Fees. In accordance with Rule 12b-1 of the 1940 Act, the Fund has adopted separate Distribution and Service Plans for each class of shares. Certain classes pay Fidelity Distributors Company LLC (FDC), an affiliate of the investment adviser, separate Distribution and Service Fees, each of which is based on an annual percentage of each class' average net assets. In addition, FDC may pay financial intermediaries for selling shares of the Fund and providing shareholder support services. For the period, the Distribution and Service Fee rates, total fees and amounts retained by FDC were as follows:
| | Distribution Fee | Service Fee | Total Fees | Retained by FDC |
| Class A | - % | .25% | $39,184 | $711 |
| Class M | .25% | .25% | 17,252 | 216 |
| Class C | .75% | .25% | 71,861 | 5,952 |
| | | | $128,297 | $6,879 |
Sales Load. FDC may receive a front-end sales charge of up to 5.75% for selling Class A shares and 3.50% for selling Class M shares, some of which is paid to financial intermediaries for selling shares of the Fund. Depending on the holding period, FDC may receive contingent deferred sales charges levied on Class A, Class M and Class C redemptions. The deferred sales charges are 1.00% for Class C shares, 1.00% for certain purchases of Class A shares and .25% for certain purchases of Class M shares.
For the period, sales charge amounts retained by FDC were as follows:
| | Retained by FDC |
| Class A | $16,515 |
| Class M | 1,279 |
Class C A | 937 |
| | $18,731 |
A When Class C shares are initially sold, FDC pays commissions from its own resources to financial intermediaries through which the sales are made.
Transfer Agent Fees. Fidelity Investments Institutional Operations Company LLC (FIIOC), an affiliate of the investment adviser, is the transfer, dividend disbursing and shareholder servicing agent for each class of the Fund. FIIOC receives account fees and asset-based fees that vary according to the account size and type of account of the shareholders of the respective classes of the Fund, except for Class Z. FIIOC receives an asset-based fee of Class Z's average net assets. FIIOC pays for typesetting, printing and mailing of shareholder reports, except proxy statements.
For the period, transfer agent fees for each class were as follows:
| | Amount | % of Class-Level Average Net Assets A |
| Class A | $33,556 | .21 |
| Class M | 8,865 | .26 |
| Class C | 14,598 | .20 |
| Total Emerging Markets | 103,295 | .22 |
| Class I | 77,592 | .17 |
| Class Z | 2,634 | .04 |
| | $240,540 | |
A Annualized
Accounting Fees. Fidelity Service Company, Inc. (FSC), an affiliate of the investment adviser, maintains the Fund's accounting records. The accounting fee is based on the level of average net assets for each month. For the period, the fees were equivalent to the following annualized rates:
| | % of Average Net Assets |
| Fidelity Total Emerging Markets Fund | .05 |
Brokerage Commissions. A portion of portfolio transactions were placed with brokerage firms which are affiliates of the investment adviser. Brokerage commissions are included in net realized gain (loss) and change in net unrealized appreciation (depreciation) in the Statement of Operations. The commissions paid to these affiliated firms were as follows:
| | Amount |
| Fidelity Total Emerging Markets Fund | $337 |
Interfund Trades. Funds may purchase from or sell securities to other Fidelity Funds under procedures adopted by the Board. The procedures have been designed to ensure these interfund trades are executed in accordance with Rule 17a-7 of the 1940 Act. Any interfund trades are included within the respective purchases and sales amounts shown in the Purchases and Sales of Investments note. Interfund trades during the period are noted in the table below.
| | Purchases ($) | Sales ($) | Realized Gain (Loss) ($) |
| Fidelity Total Emerging Markets Fund | 557,622 | 2,239,235 | (154,692) |
7. Committed Line of Credit.
Certain Funds participate with other funds managed by the investment adviser or an affiliate in a $4.25 billion credit facility (the "line of credit") to be utilized for temporary or emergency purposes to fund shareholder redemptions or for other short-term liquidity purposes. The participating funds have agreed to pay commitment fees on their pro-rata portion of the line of credit, which are reflected in Miscellaneous expenses on the Statement of Operations, and are listed below. During the period, there were no borrowings on this line of credit.
| | Amount |
| Fidelity Total Emerging Markets Fund | $256 |
8. Security Lending.
Funds lend portfolio securities from time to time in order to earn additional income. Lending agents are used, including National Financial Services (NFS), an affiliate of the investment adviser. Pursuant to a securities lending agreement, NFS will receive a fee, which is capped at 9.9% of a fund's daily lending revenue, for its services as lending agent. A fund may lend securities to certain qualified borrowers, including NFS. On the settlement date of the loan, a fund receives collateral (in the form of U.S. Treasury obligations, letters of credit and/or cash) against the loaned securities and maintains collateral in an amount not less than 100% of the market value of the loaned securities during the period of the loan. The market value of the loaned securities is determined at the close of business of a fund and any additional required collateral is delivered to a fund on the next business day. A fund or borrower may terminate the loan at any time, and if the borrower defaults on its obligation to return the securities loaned because of insolvency or other reasons, a fund may apply collateral received from the borrower against the obligation. A fund may experience delays and costs in recovering the securities loaned. Any cash collateral received is invested in the Fidelity Securities Lending Cash Central Fund. Any loaned securities are identified as such in the Schedule of Investments, and the value of loaned securities and cash collateral at period end, as applicable, are presented in the Statement of Assets and Liabilities. Security lending income represents the income earned on investing cash collateral, less rebates paid to borrowers and any lending agent fees associated with the loan, plus any premium payments received for lending certain types of securities. Security lending income is presented in the Statement of Operations as a component of income from Fidelity Central Funds. Affiliated security lending activity, if any, was as follows:
| | Total Security Lending Fees Paid to NFS | Security Lending Income From Securities Loaned to NFS | Value of Securities Loaned to NFS at Period End |
| Fidelity Total Emerging Markets Fund | $332 | $- | $- |
9. Expense Reductions.
Through arrangements with the Fund's custodian, credits realized as a result of certain uninvested cash balances were used to reduce the Fund's expenses. During the period, transfer agent credits reduced each class' expenses as noted in the table below.
| | Expense reduction |
| Class A | $68 |
| Class M | 245 |
| | $313 |
In addition, during the period the investment adviser or an affiliate reimbursed and/or waived a portion of fund-level operating expenses in the amount of $5,808.
10. Distributions to Shareholders.
Distributions to shareholders of each class were as follows:
| | Six months ended April 30, 2023 | Year ended October 31, 2022 |
| Fidelity Total Emerging Markets Fund | | |
| Distributions to shareholders | | |
| Class A | $ 794,178 | $783,324 |
| Class M | 155,913 | 128,984 |
| Class C | 234,768 | 226,893 |
| Total Emerging Markets | 2,687,846 | 5,176,420 |
| Class I | 2,776,747 | 4,027,359 |
| Class Z | 395,534 | 1,425,468 |
Total | $7,044,986 | $11,768,448 |
11. Share Transactions.
Share transactions for each class were as follows and may contain in-kind transactions, automatic conversions between classes or exchanges between affiliated funds:
| | Shares | Shares | Dollars | Dollars |
| | Six months ended April 30, 2023 | Year ended October 31, 2022 | Six months ended April 30, 2023 | Year ended October 31, 2022 |
| Fidelity Total Emerging Markets Fund | | | | |
| Class A | | | | |
| Shares sold | 251,590 | 539,278 | $2,829,948 | $6,972,605 |
| Reinvestment of distributions | 71,386 | 54,325 | 792,381 | 781,197 |
| Shares redeemed | (372,527) | (867,088) | (4,164,888) | (10,923,910) |
| Net increase (decrease) | (49,551) | (273,485) | $(542,559) | $(3,170,108) |
| Class M | | | | |
| Shares sold | 19,936 | 68,332 | $226,225 | $870,856 |
| Reinvestment of distributions | 14,022 | 8,958 | 155,787 | 128,908 |
| Shares redeemed | (41,002) | (83,685) | (459,103) | (1,103,957) |
| Net increase (decrease) | (7,044) | (6,395) | $(77,091) | $(104,193) |
| Class C | | | | |
| Shares sold | 73,366 | 172,996 | $827,554 | $2,372,908 |
| Reinvestment of distributions | 21,155 | 15,806 | 234,608 | 226,656 |
| Shares redeemed | (227,334) | (675,110) | (2,543,373) | (8,531,245) |
| Net increase (decrease) | (132,813) | (486,308) | $(1,481,211) | $(5,931,681) |
| Total Emerging Markets | | | | |
| Shares sold | 353,332 | 20,327,420 | $3,989,672 | $276,182,533 |
| Reinvestment of distributions | 206,717 | 196,824 | 2,296,623 | 2,832,302 |
| Shares redeemed | (1,534,784) | (28,410,344) | (17,145,280) | (367,959,039) |
| Net increase (decrease) | (974,735) | (7,886,100) | $(10,858,985) | $(88,944,204) |
| Class I | | | | |
| Shares sold | 525,087 | 1,916,908 | $5,893,365 | $24,629,924 |
| Reinvestment of distributions | 246,056 | 276,622 | 2,728,758 | 3,975,058 |
| Shares redeemed | (3,247,433) | (6,138,529) | (36,154,246) | (76,056,229) |
| Net increase (decrease) | (2,476,290) | (3,944,999) | $(27,532,123) | $(47,451,247) |
| Class Z | | | | |
| Shares sold | 251,223 | 486,703 | $2,818,191 | $6,448,746 |
| Reinvestment of distributions | 25,674 | 72,407 | 283,693 | 1,036,865 |
| Shares redeemed | (591,461) | (3,644,178) | (6,510,240) | (44,306,364) |
| Net increase (decrease) | (314,564) | (3,085,068) | $(3,408,356) | $(36,820,753) |
12. Other.
A fund's organizational documents provide former and current trustees and officers with a limited indemnification against liabilities arising in connection with the performance of their duties to the fund. In the normal course of business, a fund may also enter into contracts that provide general indemnifications. A fund's maximum exposure under these arrangements is unknown as this would be dependent on future claims that may be made against a fund. The risk of material loss from such claims is considered remote.
13. Risk and Uncertainties.
Many factors affect a fund's performance. Developments that disrupt global economies and financial markets, such as pandemics, epidemics, outbreaks of infectious diseases, war, terrorism, and environmental disasters, may significantly affect a fund's investment performance. The effects of these developments to a fund will be impacted by the types of securities in which a fund invests, the financial condition, industry, economic sector, and geographic location of an issuer, and a fund's level of investment in the securities of that issuer. Significant concentrations in security types, issuers, industries, sectors, and geographic locations may magnify the factors that affect a fund's performance.
As a shareholder, you incur two types of costs: (1) transaction costs, which may include sales charges (loads) on purchase payments or redemption proceeds, as applicable and (2) ongoing costs, which generally include management fees, distribution and/or service (12b-1) fees and other Fund expenses. This Example is intended to help you understand your ongoing costs (in dollars) of investing in a fund and to compare these costs with the ongoing costs of investing in other mutual funds.
| The Example is based on an investment of $1,000 invested at the beginning of the period and held for the entire period (November 1, 2022 to April 30, 2023). |
Actual Expenses
The first line of the accompanying table provides information about actual account values and actual expenses. You may use the information in this line, together with the amount you invested, to estimate the expenses that you paid over the period. Simply divide your account value by $1,000.00 (for example, an $8,600 account value divided by $1,000.00 = 8.6), then multiply the result by the number in the first line for a class/Fund under the heading entitled "Expenses Paid During Period" to estimate the expenses you paid on your account during this period. If any fund is a shareholder of any underlying mutual funds or exchange-traded funds (ETFs) (the Underlying Funds), such fund indirectly bears its proportional share of the expenses of the Underlying Funds in addition to the direct expenses incurred presented in the table. These fees and expenses are not included in the annualized expense ratio used to calculate the expense estimate in the table below.
Hypothetical Example for Comparison Purposes
The second line of the accompanying table provides information about hypothetical account values and hypothetical expenses based on the actual expense ratio and an assumed rate of return of 5% per year before expenses, which is not the actual return. The hypothetical account values and expenses may not be used to estimate the actual ending account balance or expenses you paid for the period. You may use this information to compare the ongoing costs of investing in the Fund and other funds. To do so, compare this 5% hypothetical example with the 5% hypothetical examples that appear in the shareholder reports of the other funds. If any fund is a shareholder of any Underlying Funds, such fund indirectly bears its proportional share of the expenses of the Underlying Funds in addition to the direct expenses as presented in the table. These fees and expenses are not included in the annualized expense ratio used to calculate the expense estimate in the table below.
Please note that the expenses shown in the table are meant to highlight your ongoing costs only and do not reflect any transaction costs. Therefore, the second line of the table is useful in comparing ongoing costs only, and will not help you determine the relative total costs of owning different funds. In addition, if these transactional costs were included, your costs would have been higher.
| | | | | Annualized Expense Ratio- A | | Beginning Account Value November 1, 2022 | | Ending Account Value April 30, 2023 | | Expenses Paid During Period- C November 1, 2022 to April 30, 2023 |
| Fidelity® Emerging Markets Discovery Fund | | | | | | | | | | |
| Class A | | | | 1.43% | | | | | | |
| Actual | | | | | | $ 1,000 | | $ 1,170.50 | | $ 7.70 |
Hypothetical- B | | | | | | $ 1,000 | | $ 1,017.70 | | $ 7.15 |
| Class M | | | | 1.69% | | | | | | |
| Actual | | | | | | $ 1,000 | | $ 1,169.00 | | $ 9.09 |
Hypothetical- B | | | | | | $ 1,000 | | $ 1,016.41 | | $ 8.45 |
| Class C | | | | 2.20% | | | | | | |
| Actual | | | | | | $ 1,000 | | $ 1,167.00 | | $ 11.82 |
Hypothetical- B | | | | | | $ 1,000 | | $ 1,013.88 | | $ 10.99 |
| Fidelity® Emerging Markets Discovery Fund | | | | 1.15% | | | | | | |
| Actual | | | | | | $ 1,000 | | $ 1,172.70 | | $ 6.20 |
Hypothetical- B | | | | | | $ 1,000 | | $ 1,019.09 | | $ 5.76 |
| Class I | | | | 1.11% | | | | | | |
| Actual | | | | | | $ 1,000 | | $ 1,173.20 | | $ 5.98 |
Hypothetical- B | | | | | | $ 1,000 | | $ 1,019.29 | | $ 5.56 |
| Class Z | | | | .99% | | | | | | |
| Actual | | | | | | $ 1,000 | | $ 1,173.50 | | $ 5.34 |
Hypothetical- B | | | | | | $ 1,000 | | $ 1,019.89 | | $ 4.96 |
| Fidelity® Total Emerging Markets Fund | | | | | | | | | | |
| Class A | | | | 1.44% | | | | | | |
| Actual | | | | | | $ 1,000 | | $ 1,152.10 | | $ 7.68 |
Hypothetical- B | | | | | | $ 1,000 | | $ 1,017.65 | | $ 7.20 |
| Class M | | | | 1.73% | | | | | | |
| Actual | | | | | | $ 1,000 | | $ 1,151.00 | | $ 9.23 |
Hypothetical- B | | | | | | $ 1,000 | | $ 1,016.22 | | $ 8.65 |
| Class C | | | | 2.18% | | | | | | |
| Actual | | | | | | $ 1,000 | | $ 1,147.30 | | $ 11.61 |
Hypothetical- B | | | | | | $ 1,000 | | $ 1,013.98 | | $ 10.89 |
| Fidelity® Total Emerging Markets Fund | | | | 1.19% | | | | | | |
| Actual | | | | | | $ 1,000 | | $ 1,154.00 | | $ 6.36 |
Hypothetical- B | | | | | | $ 1,000 | | $ 1,018.89 | | $ 5.96 |
| Class I | | | | 1.14% | | | | | | |
| Actual | | | | | | $ 1,000 | | $ 1,154.00 | | $ 6.09 |
Hypothetical- B | | | | | | $ 1,000 | | $ 1,019.14 | | $ 5.71 |
| Class Z | | | | 1.01% | | | | | | |
| Actual | | | | | | $ 1,000 | | $ 1,154.90 | | $ 5.40 |
Hypothetical- B | | | | | | $ 1,000 | | $ 1,019.79 | | $ 5.06 |
| |
A Annualized expense ratio reflects expenses net of applicable fee waivers.
B 5% return per year before expenses
C Expenses are equal to the annualized expense ratio, multiplied by the average account value over the period, multiplied by 181/ 365 (to reflect the one-half year period). The fees and expenses of any Underlying Funds are not included in each annualized expense ratio.
The Securities and Exchange Commission adopted Rule 22e-4 under the Investment Company Act of 1940 (the Liquidity Rule) to promote effective liquidity risk management throughout the open-end investment company industry, thereby reducing the risk that funds will be unable to meet their redemption obligations and mitigating dilution of the interests of fund shareholders.
The Funds have adopted and implemented a liquidity risk management program (the Program) reasonably designed to assess and manage each Fund's liquidity risk and to comply with the requirements of the Liquidity Rule. Each Fund's Board of Trustees (the Board) has designated each Fund's investment adviser as administrator of the Program. The Fidelity advisers have established a Liquidity Risk Management Committee (the LRM Committee) to manage the Program for each of the Fidelity Funds. The LRM Committee monitors the adequacy and effectiveness of implementation of the Program and on a periodic basis assesses each Fund's liquidity risk based on a variety of factors including (1) the Fund's investment strategy, (2) portfolio liquidity and cash flow projections during normal and reasonably foreseeable stressed conditions, (3) shareholder redemptions, (4) borrowings and other funding sources and (5) certain factor specific to ETFs including the effect of the Fund's prices and spreads, market participants, and basket compositions on the overall liquidity of the Fund's portfolio, as applicable.
In accordance with the Program, each of the Fund's portfolio investments is classified into one of four defined liquidity categories based on a determination of a reasonable expectation for how long it would take to convert the investment to cash (or sell or dispose of the investment) without significantly changing its market value.
- Highly liquid investments - cash or convertible to cash within three business days or less
- Moderately liquid investments - convertible to cash in three to seven calendar days
- Less liquid investments - can be sold or disposed of, but not settled, within seven calendar days
- Illiquid investments - cannot be sold or disposed of within seven calendar days
Liquidity classification determinations take into account a variety of factors including various market, trading and investment-specific considerations, as well as market depth, and generally utilize analysis from a third-party liquidity metrics service.
The Liquidity Rule places a 15% limit on a fund's illiquid investments and requires funds that do not primarily hold assets that are highly liquid investments to determine and maintain a minimum percentage of the fund's net assets to be invested in highly liquid investments (highly liquid investment minimum or HLIM). The Program includes provisions reasonably designed to comply with the 15% limit on illiquid investments and for determining, periodically reviewing and complying with the HLIM requirement as applicable.
At a recent meeting of the Fund's Board of Trustees, the LRM Committee provided a written report to the Board pertaining to the operation, adequacy, and effectiveness of the Program for the period December 1, 2021 through November 30, 2022. The report concluded that the Program is operating effectively and is reasonably designed to assess and manage the Fund's liquidity risk.
1.931240.111
EMD-TEK-SANN-0623
Fidelity® International Discovery Fund
Semi-Annual Report
April 30, 2023
Includes Fidelity and Fidelity Advisor share classes
Contents
To view a fund's proxy voting guidelines and proxy voting record for the 12-month period ended June 30, visit http://www.fidelity.com/proxyvotingresults or visit the Securities and Exchange Commission's (SEC) web site at http://www.sec.gov.
You may also call 1-800-544-8544 if you're an individual investing directly with Fidelity, call 1-800-835-5092 if you're a plan sponsor or participant with Fidelity as your recordkeeper or call 1-877-208-0098 on institutional accounts or if you're an advisor or invest through one to request a free copy of the proxy voting guidelines.
Standard & Poor's, S&P and S&P 500 are registered service marks of The McGraw-Hill Companies, Inc. and have been licensed for use by Fidelity Distributors Corporation.
Other third-party marks appearing herein are the property of their respective owners.
All other marks appearing herein are registered or unregistered trademarks or service marks of FMR LLC or an affiliated company. © 2023 FMR LLC. All rights reserved.
This report and the financial statements contained herein are submitted for the general information of the shareholders of the Fund. This report is not authorized for distribution to prospective investors in the Fund unless preceded or accompanied by an effective prospectus.
A fund files its complete schedule of portfolio holdings with the SEC for the first and third quarters of each fiscal year on Form N-PORT. Forms N-PORT are available on the SEC's web site at http://www.sec.gov. A fund's Forms N-PORT may be reviewed and copied at the SEC's Public Reference Room in Washington, DC. Information regarding the operation of the SEC's Public Reference Room may be obtained by calling 1-800-SEC-0330.
For a complete list of a fund's portfolio holdings, view the most recent holdings listing, semiannual report, or annual report on Fidelity's web site at http://www.fidelity.com, http://www.institutional.fidelity.com, or http://www.401k.com, as applicable.
NOT FDIC INSURED •MAY LOSE VALUE •NO BANK GUARANTEE
Neither the Fund nor Fidelity Distributors Corporation is a bank.
Top Holdings (% of Fund's net assets) |
| |
| LVMH Moet Hennessy Louis Vuitton SE (France, Textiles, Apparel & Luxury Goods) | 3.7 | |
| AstraZeneca PLC (United Kingdom) (United Kingdom, Pharmaceuticals) | 2.9 | |
| Nestle SA (Reg. S) (United States of America, Food Products) | 2.7 | |
| ASML Holding NV (Netherlands) (Netherlands, Semiconductors & Semiconductor Equipment) | 2.3 | |
| HDFC Bank Ltd. (India, Diversified Banks) | 2.1 | |
| Novo Nordisk A/S Series B (Denmark, Pharmaceuticals) | 1.9 | |
| Taiwan Semiconductor Manufacturing Co. Ltd. (Taiwan, Semiconductors & Semiconductor Equipment) | 1.8 | |
| Housing Development Finance Corp. Ltd. (India, Financial Services) | 1.8 | |
| AIA Group Ltd. (Hong Kong, Insurance) | 1.6 | |
| Compass Group PLC (United Kingdom, Hotels, Restaurants & Leisure) | 1.6 | |
| | 22.4 | |
| |
| Market Sectors (% of Fund's net assets) |
| |
| Financials | 22.7 | |
| Consumer Discretionary | 15.9 | |
| Information Technology | 14.8 | |
| Industrials | 13.0 | |
| Health Care | 12.6 | |
| Consumer Staples | 6.5 | |
| Materials | 5.5 | |
| Communication Services | 2.7 | |
| Energy | 1.5 | |
| Real Estate | 1.4 | |
| |
Asset Allocation (% of Fund's net assets) |
|
|
Geographic Diversification (% of Fund's net assets) |
|
* Includes Short-Term investments and Net Other Assets (Liabilities). Percentages are adjusted for the effect of derivatives, if applicable. |
| |
Showing Percentage of Net Assets
| Common Stocks - 95.7% |
| | | Shares | Value ($) (000s) |
| Australia - 3.5% | | | |
| Bapcor Ltd. | | 5,590,328 | 24,394 |
| EBOS Group Ltd. (a) | | 1,677,890 | 46,046 |
| Flight Centre Travel Group Ltd. (a)(b) | | 3,510,019 | 46,093 |
| Flutter Entertainment PLC (b) | | 425,294 | 85,064 |
| Iperionx Ltd. (b)(c) | | 14,731,250 | 10,777 |
| National Storage REIT unit | | 41,776,821 | 69,583 |
TOTAL AUSTRALIA | | | 281,957 |
| Bailiwick of Jersey - 0.4% | | | |
| JTC PLC (d) | | 3,229,330 | 32,184 |
| Belgium - 2.0% | | | |
| Azelis Group NV | | 350,540 | 8,305 |
| KBC Group NV | | 1,010,462 | 72,128 |
| UCB SA | | 825,579 | 76,797 |
TOTAL BELGIUM | | | 157,230 |
| Brazil - 0.6% | | | |
| MercadoLibre, Inc. (b) | | 37,053 | 47,335 |
| Canada - 2.6% | | | |
| Canadian Natural Resources Ltd. | | 1,443,046 | 87,934 |
| Constellation Software, Inc. | | 51,371 | 100,547 |
| Definity Financial Corp. | | 508,266 | 13,787 |
| Lumine Group, Inc. | | 159,372 | 2,147 |
TOTAL CANADA | | | 204,415 |
| China - 3.3% | | | |
| Alibaba Group Holding Ltd. (b) | | 5,233,298 | 55,335 |
| Chervon Holdings Ltd. | | 6,041,691 | 30,745 |
| Glodon Co. Ltd. (A Shares) | | 4,408,300 | 37,045 |
| Li Ning Co. Ltd. | | 3,823,243 | 27,342 |
| Shenzhen Mindray Bio-Medical Electronics Co. Ltd. (A Shares) | | 758,200 | 34,278 |
| Tencent Holdings Ltd. | | 1,596,759 | 70,922 |
| WuXi AppTec Co. Ltd. (H Shares) (d) | | 941,367 | 8,279 |
TOTAL CHINA | | | 263,946 |
| Denmark - 2.8% | | | |
| DSV A/S | | 395,602 | 74,301 |
| Novo Nordisk A/S Series B | | 919,002 | 152,880 |
TOTAL DENMARK | | | 227,181 |
| Finland - 0.4% | | | |
| Neste OYJ | | 591,398 | 28,634 |
| France - 13.8% | | | |
| Air Liquide SA | | 662,949 | 119,258 |
| Airbus Group NV | | 490,670 | 68,711 |
| AXA SA | | 3,631,649 | 118,538 |
| BNP Paribas SA | | 1,386,105 | 89,561 |
| Capgemini SA | | 468,234 | 85,080 |
| Edenred SA | | 1,368,748 | 88,865 |
| EssilorLuxottica SA | | 309,188 | 61,121 |
| Exclusive Networks SA | | 1,446,556 | 31,242 |
| L'Oreal SA | | 174,900 | 83,401 |
| LVMH Moet Hennessy Louis Vuitton SE | | 304,997 | 293,368 |
| Pernod Ricard SA | | 277,254 | 63,973 |
TOTAL FRANCE | | | 1,103,118 |
| Germany - 5.8% | | | |
| Deutsche Borse AG | | 437,556 | 83,446 |
| Deutsche Post AG | | 1,561,846 | 75,124 |
| Merck KGaA | | 360,150 | 64,508 |
| Muenchener Rueckversicherungs-Gesellschaft AG in Muenchen | | 174,858 | 65,606 |
| Nexus AG | | 562,762 | 32,246 |
| Rheinmetall AG | | 136,470 | 39,925 |
| Siemens AG | | 463,052 | 76,326 |
| Siemens Healthineers AG (d) | | 476,526 | 29,625 |
TOTAL GERMANY | | | 466,806 |
| Hong Kong - 2.2% | | | |
| AIA Group Ltd. | | 11,971,620 | 130,336 |
| Prudential PLC | | 2,958,179 | 45,263 |
TOTAL HONG KONG | | | 175,599 |
| Hungary - 0.3% | | | |
| Richter Gedeon PLC | | 853,117 | 20,588 |
| India - 5.7% | | | |
| Avenue Supermarts Ltd. (b)(d) | | 505,358 | 21,789 |
| Campus Activewear Ltd. | | 1,710,700 | 7,479 |
| HDFC Bank Ltd. | | 3,036,182 | 62,840 |
| HDFC Bank Ltd. sponsored ADR | | 1,449,759 | 101,193 |
| Housing Development Finance Corp. Ltd. | | 4,219,315 | 143,912 |
| ITC Ltd. | | 4,656,000 | 24,306 |
| Larsen & Toubro Ltd. | | 579,300 | 16,813 |
| One97 Communications Ltd. (b) | | 4,023,500 | 32,297 |
| Pine Labs Private Ltd. (b)(e)(f) | | 8,672 | 4,774 |
| PVR Ltd. (b) | | 649,600 | 11,668 |
| Sona Blw Precision Forgings Ltd. (d) | | 2,874,000 | 16,942 |
| Star Health & Allied Insurance Co. Ltd. (b) | | 992,200 | 7,197 |
| Sunteck Realty Ltd. | | 1,959,352 | 7,280 |
TOTAL INDIA | | | 458,490 |
| Ireland - 1.8% | | | |
| Cairn Homes PLC | | 28,053,237 | 31,942 |
| CRH PLC | | 1,126,714 | 54,368 |
| Dalata Hotel Group PLC (b)(c) | | 11,207,181 | 56,251 |
TOTAL IRELAND | | | 142,561 |
| Israel - 0.4% | | | |
| NICE Ltd. sponsored ADR (b) | | 151,041 | 30,814 |
| Italy - 2.2% | | | |
| BFF Bank SpA (d) | | 3,164,808 | 30,409 |
| Ferrari NV | | 152,276 | 42,430 |
| FinecoBank SpA | | 1,630,520 | 24,668 |
| UniCredit SpA | | 4,039,361 | 80,042 |
TOTAL ITALY | | | 177,549 |
| Japan - 17.0% | | | |
| Advantest Corp. | | 262,422 | 20,451 |
| Capcom Co. Ltd. | | 1,229,448 | 46,200 |
| Daiichi Sankyo Kabushiki Kaisha | | 1,717,961 | 58,951 |
| Fast Retailing Co. Ltd. | | 229,386 | 54,319 |
| FUJIFILM Holdings Corp. | | 694,698 | 36,208 |
| Hitachi Ltd. | | 2,308,878 | 127,715 |
| Hoya Corp. | | 1,037,602 | 108,798 |
| Itochu Corp. | | 2,623,666 | 87,040 |
| Keyence Corp. | | 125,420 | 56,559 |
| Misumi Group, Inc. | | 940,600 | 23,729 |
| Mitsubishi UFJ Financial Group, Inc. | | 9,129,681 | 57,148 |
| NOF Corp. | | 448,598 | 20,497 |
| Olympus Corp. | | 2,437,592 | 42,674 |
| ORIX Corp. | | 3,773,497 | 64,197 |
| Outsourcing, Inc. | | 1,385,556 | 14,114 |
| Persol Holdings Co. Ltd. | | 2,328,665 | 48,016 |
| Renesas Electronics Corp. (b) | | 6,015,215 | 78,393 |
| Shin-Etsu Chemical Co. Ltd. | | 3,261,039 | 93,056 |
| SMC Corp. | | 85,217 | 42,502 |
| Sony Group Corp. | | 1,215,789 | 109,997 |
| Sumitomo Mitsui Financial Group, Inc. | | 1,233,008 | 50,398 |
| TechnoPro Holdings, Inc. | | 806,143 | 21,995 |
| TIS, Inc. | | 1,360,981 | 37,372 |
| Tokio Marine Holdings, Inc. | | 1,764,345 | 35,476 |
| ZOZO, Inc. | | 1,359,235 | 28,604 |
TOTAL JAPAN | | | 1,364,409 |
| Korea (South) - 1.0% | | | |
| Samsung Electronics Co. Ltd. | | 1,642,790 | 80,864 |
| Netherlands - 5.3% | | | |
| Adyen BV (b)(d) | | 34,062 | 54,733 |
| ASML Holding NV (Netherlands) | | 291,093 | 183,953 |
| BE Semiconductor Industries NV (a) | | 822,899 | 73,755 |
| IMCD NV | | 225,890 | 33,901 |
| ING Groep NV (Certificaten Van Aandelen) | | 3,901,604 | 48,151 |
| Topicus.Com, Inc. (b) | | 101,865 | 6,785 |
| Universal Music Group NV | | 953,977 | 20,824 |
TOTAL NETHERLANDS | | | 422,102 |
| Norway - 0.0% | | | |
| Volue A/S (b) | | 406,227 | 686 |
| Russia - 0.0% | | | |
| Fix Price Group Ltd. GDR (Reg. S) (b)(f) | | 619,390 | 229 |
| Singapore - 1.2% | | | |
| Sea Ltd. ADR (b) | | 568,995 | 43,340 |
| United Overseas Bank Ltd. | | 2,487,000 | 52,819 |
TOTAL SINGAPORE | | | 96,159 |
| South Africa - 0.7% | | | |
| Anglo American PLC (United Kingdom) | | 1,763,100 | 54,328 |
| Spain - 1.2% | | | |
| CaixaBank SA (a) | | 18,054,417 | 66,830 |
| Cie Automotive SA | | 1,054,206 | 31,736 |
TOTAL SPAIN | | | 98,566 |
| Sweden - 3.0% | | | |
| ASSA ABLOY AB (B Shares) | | 1,385,096 | 32,942 |
| HEXPOL AB (B Shares) | | 1,967,147 | 23,153 |
| Indutrade AB | | 1,745,333 | 41,816 |
| Kry International AB (b)(e)(f) | | 4,183 | 327 |
| Lagercrantz Group AB (B Shares) | | 2,948,190 | 37,891 |
| Nibe Industrier AB (B Shares) | | 2,384,463 | 26,623 |
| Nordnet AB (a) | | 1,807,069 | 28,335 |
| Svenska Handelsbanken AB (A Shares) (a) | | 5,294,204 | 46,800 |
TOTAL SWEDEN | | | 237,887 |
| Switzerland - 1.3% | | | |
| Compagnie Financiere Richemont SA Series A | | 472,055 | 78,031 |
| Partners Group Holding AG | | 31,084 | 30,018 |
TOTAL SWITZERLAND | | | 108,049 |
| Taiwan - 2.1% | | | |
| MediaTek, Inc. | | 1,035,000 | 22,489 |
| Taiwan Semiconductor Manufacturing Co. Ltd. | | 8,805,000 | 144,086 |
TOTAL TAIWAN | | | 166,575 |
| United Kingdom - 10.0% | | | |
| AstraZeneca PLC (United Kingdom) | | 1,562,031 | 229,873 |
| BAE Systems PLC | | 6,136,629 | 78,181 |
| Beazley PLC | | 3,928,705 | 29,402 |
| Big Yellow Group PLC | | 2,005,789 | 30,854 |
| Bunzl PLC | | 2,211,479 | 87,936 |
| Compass Group PLC | | 4,854,908 | 128,077 |
| Diageo PLC | | 2,443,252 | 111,452 |
| Dr. Martens Ltd. | | 4,237,960 | 8,847 |
| Endava PLC ADR (b) | | 231,725 | 13,340 |
| JD Sports Fashion PLC | | 15,283,688 | 30,934 |
| Smart Metering Systems PLC | | 2,861,457 | 28,517 |
| Starling Bank Ltd. Series D (b)(e)(f) | | 6,223,100 | 23,619 |
| Zegona Communications PLC (b)(c) | | 323,480 | 209 |
TOTAL UNITED KINGDOM | | | 801,241 |
| United States of America - 5.1% | | | |
| Globant SA (b) | | 101,042 | 15,850 |
| ICON PLC (b) | | 108,075 | 20,825 |
| Linde PLC | | 152,392 | 56,301 |
| Nestle SA (Reg. S) | | 1,670,294 | 214,281 |
| NVIDIA Corp. | | 184,706 | 51,254 |
| RHI Magnesita NV | | 396,115 | 11,251 |
| Samsonite International SA (b)(d) | | 12,781,156 | 40,501 |
TOTAL UNITED STATES OF AMERICA | | | 410,263 |
| TOTAL COMMON STOCKS (Cost $6,059,811) | | | 7,659,765 |
| | | | |
| Preferred Stocks - 0.9% |
| | | Shares | Value ($) (000s) |
| Convertible Preferred Stocks - 0.5% | | | |
| China - 0.4% | | | |
| ByteDance Ltd. Series E1 (b)(e)(f) | | 131,235 | 26,116 |
| dMed Biopharmaceutical Co. Ltd. Series C (b)(e)(f) | | 727,754 | 6,455 |
| | | | 32,571 |
| Estonia - 0.1% | | | |
| Bolt Technology OU Series E (b)(e)(f) | | 87,239 | 11,370 |
TOTAL CONVERTIBLE PREFERRED STOCKS | | | 43,941 |
| Nonconvertible Preferred Stocks - 0.4% | | | |
| India - 0.4% | | | |
| Pine Labs Private Ltd.: | | | |
| Series 1 (b)(e)(f) | | 20,726 | 11,411 |
| Series A (b)(e)(f) | | 5,179 | 2,851 |
| Series B (b)(e)(f) | | 5,635 | 3,102 |
| Series B2 (b)(e)(f) | | 4,558 | 2,509 |
| Series C (b)(e)(f) | | 8,478 | 4,668 |
| Series C1 (b)(e)(f) | | 1,786 | 983 |
| Series D (b)(e)(f) | | 1,910 | 1,052 |
| | | | 26,576 |
| Sweden - 0.0% | | | |
| Kry International AB Series E (b)(e)(f) | | 24,162 | 1,889 |
TOTAL NONCONVERTIBLE PREFERRED STOCKS | | | 28,465 |
| TOTAL PREFERRED STOCKS (Cost $76,424) | | | 72,406 |
| | | | |
| Money Market Funds - 4.1% |
| | | Shares | Value ($) (000s) |
| Fidelity Cash Central Fund 4.88% (g) | | 216,395,740 | 216,439 |
| Fidelity Securities Lending Cash Central Fund 4.88% (g)(h) | | 109,839,113 | 109,850 |
| TOTAL MONEY MARKET FUNDS (Cost $326,289) | | | 326,289 |
| | | | |
| TOTAL INVESTMENT IN SECURITIES - 100.7% (Cost $6,462,524) | 8,058,460 |
NET OTHER ASSETS (LIABILITIES) - (0.7)% | (53,554) |
| NET ASSETS - 100.0% | 8,004,906 |
| | |
Any values shown as $0 in the Schedule of Investments may reflect amounts less than $500.
Legend
| (a) | Security or a portion of the security is on loan at period end. |
| (d) | Security exempt from registration under Rule 144A of the Securities Act of 1933. These securities may be resold in transactions exempt from registration, normally to qualified institutional buyers. At the end of the period, the value of these securities amounted to $234,462,000 or 2.9% of net assets. |
| (e) | Restricted securities (including private placements) - Investment in securities not registered under the Securities Act of 1933 (excluding 144A issues). At the end of the period, the value of restricted securities (excluding 144A issues) amounted to $101,126,000 or 1.3% of net assets. |
| (g) | Affiliated fund that is generally available only to investment companies and other accounts managed by Fidelity Investments. The rate quoted is the annualized seven-day yield of the fund at period end. A complete unaudited listing of the fund's holdings as of its most recent quarter end is available upon request. In addition, each Fidelity Central Fund's financial statements are available on the SEC's website or upon request. |
| (h) | Investment made with cash collateral received from securities on loan. |
| Additional information on each restricted holding is as follows: |
| Security | Acquisition Date | Acquisition Cost ($) (000s) |
| Bolt Technology OU Series E | 1/03/22 | 22,664 |
| | | |
| ByteDance Ltd. Series E1 | 11/18/20 | 14,380 |
| | | |
| dMed Biopharmaceutical Co. Ltd. Series C | 12/01/20 | 10,336 |
| | | |
| Kry International AB | 5/14/21 | 1,817 |
| | | |
| Kry International AB Series E | 5/14/21 | 11,046 |
| | | |
| Pine Labs Private Ltd. | 6/30/21 | 3,233 |
| | | |
| Pine Labs Private Ltd. Series 1 | 6/30/21 | 7,728 |
| | | |
| Pine Labs Private Ltd. Series A | 6/30/21 | 1,931 |
| | | |
| Pine Labs Private Ltd. Series B | 6/30/21 | 2,101 |
| | | |
| Pine Labs Private Ltd. Series B2 | 6/30/21 | 1,699 |
| | | |
| Pine Labs Private Ltd. Series C | 6/30/21 | 3,161 |
| | | |
| Pine Labs Private Ltd. Series C1 | 6/30/21 | 666 |
| | | |
| Pine Labs Private Ltd. Series D | 6/30/21 | 712 |
| | | |
| Starling Bank Ltd. Series D | 6/18/21 | 11,126 |
| | | |
Affiliated Central Funds
Fiscal year to date information regarding the Fund's investments in Fidelity Central Funds, including the ownership percentage, is presented below.
| Affiliate (Amounts in thousands) | Value, beginning of period ($) | Purchases ($) | Sales Proceeds ($) | Dividend Income ($) | Realized Gain (loss) ($) | Change in Unrealized appreciation (depreciation) ($) | Value, end of period ($) | % ownership, end of period |
| Fidelity Cash Central Fund 4.88% | 376,692 | 1,097,018 | 1,257,271 | 4,205 | - | - | 216,439 | 0.5% |
| Fidelity Securities Lending Cash Central Fund 4.88% | 29,429 | 496,969 | 416,548 | 467 | - | - | 109,850 | 0.3% |
| Total | 406,121 | 1,593,987 | 1,673,819 | 4,672 | - | - | 326,289 | |
| | | | | | | | | |
Amounts in the dividend income column in the above table include any capital gain distributions from underlying funds, which are presented in the corresponding line item in the Statement of Operations, if applicable.
Amounts in the dividend income column for Fidelity Securities Lending Cash Central Fund represents the income earned on investing cash collateral, less rebates paid to borrowers and any lending agent fees associated with the loan, plus any premium payments received for lending certain types of securities.
Amounts included in the purchases and sales proceeds columns may include in-kind transactions, if applicable.
Other Affiliated Issuers
An affiliated company is a company in which the Fund has ownership of at least 5% of the voting securities. Fiscal year to date transactions with companies which are or were affiliates are presented in the table below. Certain corporate actions, such as mergers, are excluded from the amounts in this table if applicable. A dash in the Value end of period ($) column means either the issuer is no longer held at period end, or the issuer is held at period end but is no longer an affiliate.
| Affiliate (Amounts in thousands) | Value, beginning of period ($) | Purchases ($) | Sales Proceeds ($) | Dividend Income ($) | Realized Gain (loss) ($) | Change in Unrealized appreciation (depreciation) ($) | Value, end of period ($) |
| Dalata Hotel Group PLC | 36,423 | - | 680 | - | 223 | 20,285 | 56,251 |
| Iperionx Ltd. | 6,780 | - | 113 | - | 6 | 4,104 | 10,777 |
| Zegona Communications PLC | 282 | - | 4 | - | (2) | (67) | 209 |
| Total | 43,485 | - | 797 | - | 227 | 24,322 | 67,237 |
Amounts included in the purchases and sales proceeds columns may include in-kind transactions, if applicable.
Investment Valuation
The following is a summary of the inputs used, as of April 30, 2023, involving the Fund's assets and liabilities carried at fair value. The inputs or methodology used for valuing securities may not be an indication of the risk associated with investing in those securities. For more information on valuation inputs, and their aggregation into the levels used below, please refer to the Investment Valuation section in the accompanying Notes to Financial Statements.
| Valuation Inputs at Reporting Date: |
Description (Amounts in thousands) | Total ($) | Level 1 ($) | Level 2 ($) | Level 3 ($) |
Investments in Securities: | | | | |
|
| Equities: | | | | |
Communication Services | 219,279 | 64,373 | 128,790 | 26,116 |
Consumer Discretionary | 1,275,766 | 334,539 | 941,227 | - |
Consumer Staples | 519,431 | 147,374 | 371,828 | 229 |
Energy | 116,568 | 116,568 | - | - |
Financials | 1,810,198 | 564,746 | 1,221,833 | 23,619 |
Health Care | 993,944 | 305,710 | 681,779 | 6,455 |
Industrials | 1,054,532 | 374,266 | 680,266 | - |
Information Technology | 1,191,747 | 633,344 | 513,467 | 44,936 |
Materials | 442,989 | 90,705 | 352,284 | - |
Real Estate | 107,717 | 30,854 | 76,863 | - |
|
| Money Market Funds | 326,289 | 326,289 | - | - |
| Total Investments in Securities: | 8,058,460 | 2,988,768 | 4,968,337 | 101,355 |
The following is a reconciliation of Investments in Securities for which Level 3 inputs were used in determining value:
| (Amounts in thousands) | |
| Investments in Securities: | |
| Beginning Balance | $ | 91,683 | |
| Net Realized Gain (Loss) on Investment Securities | | - | |
| Net Unrealized Gain (Loss) on Investment Securities | | 9,672 | |
| Cost of Purchases | | - | |
| Proceeds of Sales | | - | |
| Amortization/Accretion | | - | |
| Transfers into Level 3 | | - | |
| Transfers out of Level 3 | | - | |
| Ending Balance | $ | 101,355 | |
| The change in unrealized gain (loss) for the period attributable to Level 3 securities held at April 30, 2023 | $ | 9,672 | |
| The information used in the above reconciliation represents fiscal year to date activity for any Investments in Securities identified as using Level 3 inputs at either the beginning or the end of the current fiscal period. Cost of purchases and proceeds of sales may include securities received and/or delivered through in-kind transactions, corporate actions or exchanges. Transfers into Level 3 were attributable to a lack of observable market data resulting from decreases in market activity, decreases in liquidity, security restructurings or corporate actions. Transfers out of Level 3 were attributable to observable market data becoming available for those securities. Transfers in or out of Level 3 represent the beginning value of any Security or Instrument where a change in the pricing level occurred from the beginning to the end of the period. Realized and unrealized gains (losses) disclosed in the reconciliation are included in Net Gain (Loss) on the Fund's Statement of Operations. | |
| Statement of Assets and Liabilities |
| Amounts in thousands (except per-share amounts) | | | | April 30, 2023 (Unaudited) |
| | | | | |
| Assets | | | | |
| Investment in securities, at value (including securities loaned of $103,448) - See accompanying schedule: | | | | |
Unaffiliated issuers (cost $6,070,696) | $ | 7,664,934 | | |
Fidelity Central Funds (cost $326,289) | | 326,289 | | |
Other affiliated issuers (cost $65,539) | | 67,237 | | |
| | | | | |
| | | | | |
| Total Investment in Securities (cost $6,462,524) | | | $ | 8,058,460 |
| Foreign currency held at value (cost $2,737) | | | | 2,736 |
| Receivable for investments sold | | | | 5,954 |
| Receivable for fund shares sold | | | | 2,980 |
| Dividends receivable | | | | 23,067 |
| Reclaims receivable | | | | 31,394 |
| Distributions receivable from Fidelity Central Funds | | | | 828 |
| Prepaid expenses | | | | 3 |
| Other receivables | | | | 3,448 |
Total assets | | | | 8,128,870 |
| Liabilities | | | | |
| Payable for investments purchased | $ | 1,519 | | |
| Payable for fund shares redeemed | | 2,132 | | |
| Accrued management fee | | 2,760 | | |
| Distribution and service plan fees payable | | 42 | | |
| Other affiliated payables | | 812 | | |
| Deferred taxes | | 6,212 | | |
| Other payables and accrued expenses | | 637 | | |
| Collateral on securities loaned | | 109,850 | | |
| Total Liabilities | | | | 123,964 |
| Net Assets | | | $ | 8,004,906 |
| Net Assets consist of: | | | | |
| Paid in capital | | | $ | 6,800,517 |
| Total accumulated earnings (loss) | | | | 1,204,389 |
| Net Assets | | | $ | 8,004,906 |
| | | | | |
| Net Asset Value and Maximum Offering Price | | | | |
| Class A : | | | | |
Net Asset Value and redemption price per share ($145,495 ÷ 3,399 shares) (a)(b) | | | $ | 42.80 |
| Maximum offering price per share (100/94.25 of $42.80) | | | $ | 45.41 |
| Class M : | | | | |
Net Asset Value and redemption price per share ($17,792 ÷ 420 shares) (a)(b) | | | $ | 42.41 |
| Maximum offering price per share (100/96.50 of $42.41) | | | $ | 43.95 |
| Class C : | | | | |
Net Asset Value and offering price per share ($5,697 ÷ 136 shares) (a)(b) | | | $ | 41.81 |
| International Discovery : | | | | |
Net Asset Value , offering price and redemption price per share ($3,797,500 ÷ 87,998 shares) | | | $ | 43.15 |
| Class K : | | | | |
Net Asset Value , offering price and redemption price per share ($556,022 ÷ 12,930 shares) | | | $ | 43.00 |
| Class I : | | | | |
Net Asset Value , offering price and redemption price per share ($548,223 ÷ 12,752 shares) | | | $ | 42.99 |
| Class Z : | | | | |
Net Asset Value , offering price and redemption price per share ($2,934,177 ÷ 68,325 shares) | | | $ | 42.94 |
(a)Redemption price per share is equal to net asset value less any applicable contingent deferred sales charge. |
(b)Corresponding Net Asset Value does not calculate due to rounding of fractional net assets and/or shares |
| Statement of Operations |
| Amounts in thousands | | | | Six months ended April 30, 2023 (Unaudited) |
| Investment Income | | | | |
| Dividends | | | $ | 90,138 |
| Income from Fidelity Central Funds (including $467 from security lending) | | | | 4,672 |
| Income before foreign taxes withheld | | | $ | 94,810 |
| Less foreign taxes withheld | | | | (11,128) |
| Total Income | | | | 83,682 |
| Expenses | | | | |
| Management fee | | | | |
| Basic fee | $ | 25,591 | | |
| Performance adjustment | | (4,410) | | |
| Transfer agent fees | | 4,061 | | |
| Distribution and service plan fees | | 249 | | |
| Accounting fees | | 807 | | |
| Custodian fees and expenses | | 342 | | |
| Independent trustees' fees and expenses | | 26 | | |
| Registration fees | | 123 | | |
| Audit | | 154 | | |
| Legal | | 6 | | |
| Miscellaneous | | 18 | | |
| Total expenses before reductions | | 26,967 | | |
| Expense reductions | | (181) | | |
| Total expenses after reductions | | | | 26,786 |
| Net Investment income (loss) | | | | 56,896 |
| Realized and Unrealized Gain (Loss) | | | | |
| Net realized gain (loss) on: | | | | |
| Investment Securities: | | | | |
| Unaffiliated issuers | | 2,454 | | |
| Redemptions in-kind | | 23,400 | | |
| Affiliated issuers | | 227 | | |
| Foreign currency transactions | | 1,533 | | |
| Total net realized gain (loss) | | | | 27,614 |
| Change in net unrealized appreciation (depreciation) on: | | | | |
| Investment Securities: | | | | |
| Unaffiliated issuers(net of increase in deferred foreign taxes of $1,016) | | 1,101,123 | | |
| Affiliated issuers | | 24,322 | | |
| Assets and liabilities in foreign currencies | | 3,165 | | |
| Total change in net unrealized appreciation (depreciation) | | | | 1,128,610 |
| Net gain (loss) | | | | 1,156,224 |
| Net increase (decrease) in net assets resulting from operations | | | $ | 1,213,120 |
| Statement of Changes in Net Assets |
| |
| Amount in thousands | | Six months ended April 30, 2023 (Unaudited) | | Year ended October 31, 2022 |
| Increase (Decrease) in Net Assets | | | | |
| Operations | | | | |
| Net investment income (loss) | $ | 56,896 | $ | 150,460 |
| Net realized gain (loss) | | 27,614 | | (304,705) |
| Change in net unrealized appreciation (depreciation) | | 1,128,610 | | (3,205,165) |
| Net increase (decrease) in net assets resulting from operations | | 1,213,120 | | (3,359,410) |
| Distributions to shareholders | | (30,708) | | (1,127,528) |
| Share transactions - net increase (decrease) | | (547,796) | | 588,890 |
| Total increase (decrease) in net assets | | 634,616 | | (3,898,048) |
| | | | | |
| Net Assets | | | | |
| Beginning of period | | 7,370,290 | | 11,268,338 |
| End of period | $ | 8,004,906 | $ | 7,370,290 |
| | | | | |
| | | | | |
Financial Highlights
| Fidelity Advisor® International Discovery Fund Class A |
| |
| | Six months ended (Unaudited) April 30, 2023 | | Years ended October 31, 2022 | | 2021 | | 2020 | | 2019 | | 2018 |
Selected Per-Share Data | | | | | | | | | | | | |
| Net asset value, beginning of period | $ | 36.68 | $ | 58.79 | $ | 45.84 | $ | 43.31 | $ | 39.99 | $ | 46.66 |
| Income from Investment Operations | | | | | | | | | | | | |
Net investment income (loss) A,B | | .22 | | .56 C | | .18 | | .16 | | .63 D | | .37 |
| Net realized and unrealized gain (loss) | | 5.90 | | (16.91) | | 14.60 | | 3.27 | | 3.93 | | (4.87) |
| Total from investment operations | | 6.12 | | (16.35) | | 14.78 | | 3.43 | | 4.56 | | (4.50) |
| Distributions from net investment income | | - | | (1.38) | | (.12) | | (.62) | | (.33) | | (.34) |
| Distributions from net realized gain | | - | | (4.38) | | (1.71) | | (.28) | | (.91) | | (1.83) |
| Total distributions | | - | | (5.76) | | (1.83) | | (.90) | | (1.24) | | (2.17) |
| Net asset value, end of period | $ | 42.80 | $ | 36.68 | $ | 58.79 | $ | 45.84 | $ | 43.31 | $ | 39.99 |
Total Return E,F,G | | 16.68% | | (30.57)% | | 32.86% | | 8.02% | | 11.90% | | (10.11)% |
Ratios to Average Net Assets B,H,I | | | | | | | | | | | | |
| Expenses before reductions | | 1.06% J | | 1.31% | | 1.32% | | 1.36% | | 1.12% | | 1.22% |
| Expenses net of fee waivers, if any | | 1.06% J | | 1.30% | | 1.32% | | 1.36% | | 1.12% | | 1.22% |
| Expenses net of all reductions | | 1.06% J | | 1.30% | | 1.32% | | 1.36% | | 1.11% | | 1.21% |
| Net investment income (loss) | | 1.07% J | | 1.27% C | | .32% | | .38% | | 1.57% D | | .83% |
| Supplemental Data | | | | | | | | | | | | |
| Net assets, end of period (in millions) | $ | 145 | $ | 131 | $ | 206 | $ | 173 | $ | 185 | $ | 191 |
Portfolio turnover rate K | | 60% J,L | | 43% L | | 41% L | | 34% L | | 70% L | | 45% L |
A Calculated based on average shares outstanding during the period.
B Net investment income (loss) is affected by the timing of the declaration of dividends by any underlying mutual funds or exchange-traded funds (ETFs). Net investment income (loss) of any mutual funds or ETFs is not included in the Fund's net investment income (loss) ratio.
C Net investment income per share reflects one or more large, non-recurring dividend(s) which amounted to $.16 per share. Excluding such non-recurring dividend(s), the ratio of net investment income (loss) to average net assets would have been .92%.
D Net investment income per share reflects one or more large, non-recurring dividend(s) which amounted to $.21 per share. Excluding such non-recurring dividend(s), the ratio of net investment income (loss) to average net assets would have been 1.05%.
E Total returns for periods of less than one year are not annualized.
F Total returns would have been lower if certain expenses had not been reduced during the applicable periods shown.
G Total returns do not include the effect of the sales charges.
H Fees and expenses of any underlying mutual funds or exchange-traded funds (ETFs) are not included in the Fund's expense ratio. The Fund indirectly bears its proportionate share of these expenses. For additional expense information related to investments in Fidelity Central Funds, please refer to the "Investments in Fidelity Central Funds" note found in the Notes to Financial Statements section of the most recent Annual or Semi-Annual report.
I Expense ratios reflect operating expenses of the class. Expenses before reductions do not reflect amounts reimbursed, waived, or reduced through arrangements with the investment adviser, brokerage services, or other offset arrangements, if applicable, and do not represent the amount paid by the class during periods when reimbursements, waivers or reductions occur.
J Annualized.
K Amount does not include the portfolio activity of any underlying mutual funds or exchange-traded funds (ETFs).
L Portfolio turnover rate excludes securities received or delivered in-kind.
| Fidelity Advisor® International Discovery Fund Class M |
| |
| | Six months ended (Unaudited) April 30, 2023 | | Years ended October 31, 2022 | | 2021 | | 2020 | | 2019 | | 2018 |
Selected Per-Share Data | | | | | | | | | | | | |
| Net asset value, beginning of period | $ | 36.38 | $ | 58.35 | $ | 45.53 | $ | 43.01 | $ | 39.71 | $ | 46.35 |
| Income from Investment Operations | | | | | | | | | | | | |
Net investment income (loss) A,B | | .17 | | .45 C | | .04 | | .06 | | .53 D | | .27 |
| Net realized and unrealized gain (loss) | | 5.86 | | (16.81) | | 14.51 | | 3.24 | | 3.91 | | (4.84) |
| Total from investment operations | | 6.03 | | (16.36) | | 14.55 | | 3.30 | | 4.44 | | (4.57) |
| Distributions from net investment income | | - | | (1.23) | | (.02) | | (.51) | | (.22) | | (.24) |
| Distributions from net realized gain | | - | | (4.38) | | (1.71) | | (.28) | | (.91) | | (1.83) |
| Total distributions | | - | | (5.61) | | (1.73) | | (.78) E | | (1.14) E | | (2.07) |
| Net asset value, end of period | $ | 42.41 | $ | 36.38 | $ | 58.35 | $ | 45.53 | $ | 43.01 | $ | 39.71 |
Total Return F,G,H | | 16.58% | | (30.76)% | | 32.53% | | 7.77% | | 11.62% | | (10.31)% |
Ratios to Average Net Assets B,I,J | | | | | | | | | | | | |
| Expenses before reductions | | 1.31% K | | 1.55% | | 1.57% | | 1.61% | | 1.37% | | 1.46% |
| Expenses net of fee waivers, if any | | 1.30% K | | 1.55% | | 1.57% | | 1.61% | | 1.37% | | 1.46% |
| Expenses net of all reductions | | 1.30% K | | 1.55% | | 1.57% | | 1.60% | | 1.35% | | 1.45% |
| Net investment income (loss) | | .83% K | | 1.02% C | | .07% | | .13% | | 1.32% D | | .59% |
| Supplemental Data | | | | | | | | | | | | |
| Net assets, end of period (in millions) | $ | 18 | $ | 16 | $ | 25 | $ | 21 | $ | 24 | $ | 28 |
Portfolio turnover rate L | | 60% K,M | | 43% M | | 41% M | | 34% M | | 70% M | | 45% M |
A Calculated based on average shares outstanding during the period.
B Net investment income (loss) is affected by the timing of the declaration of dividends by any underlying mutual funds or exchange-traded funds (ETFs). Net investment income (loss) of any mutual funds or ETFs is not included in the Fund's net investment income (loss) ratio.
C Net investment income per share reflects one or more large, non-recurring dividend(s) which amounted to $.16 per share. Excluding such non-recurring dividend(s), the ratio of net investment income (loss) to average net assets would have been .67%.
D Net investment income per share reflects one or more large, non-recurring dividend(s) which amounted to $.21 per share. Excluding such non-recurring dividend(s), the ratio of net investment income (loss) to average net assets would have been .80%.
E Total distributions per share do not sum due to rounding.
F Total returns for periods of less than one year are not annualized.
G Total returns would have been lower if certain expenses had not been reduced during the applicable periods shown.
H Total returns do not include the effect of the sales charges.
I Fees and expenses of any underlying mutual funds or exchange-traded funds (ETFs) are not included in the Fund's expense ratio. The Fund indirectly bears its proportionate share of these expenses. For additional expense information related to investments in Fidelity Central Funds, please refer to the "Investments in Fidelity Central Funds" note found in the Notes to Financial Statements section of the most recent Annual or Semi-Annual report.
J Expense ratios reflect operating expenses of the class. Expenses before reductions do not reflect amounts reimbursed, waived, or reduced through arrangements with the investment adviser, brokerage services, or other offset arrangements, if applicable, and do not represent the amount paid by the class during periods when reimbursements, waivers or reductions occur.
K Annualized.
L Amount does not include the portfolio activity of any underlying mutual funds or exchange-traded funds (ETFs).
M Portfolio turnover rate excludes securities received or delivered in-kind.
| Fidelity Advisor® International Discovery Fund Class C |
| |
| | Six months ended (Unaudited) April 30, 2023 | | Years ended October 31, 2022 | | 2021 | | 2020 | | 2019 | | 2018 |
Selected Per-Share Data | | | | | | | | | | | | |
| Net asset value, beginning of period | $ | 35.96 | $ | 57.59 | $ | 45.18 | $ | 42.60 | $ | 39.32 | $ | 45.94 |
| Income from Investment Operations | | | | | | | | | | | | |
Net investment income (loss) A,B | | .06 | | .21 C | | (.27) | | (.18) | | .31 D | | .02 |
| Net realized and unrealized gain (loss) | | 5.79 | | (16.66) | | 14.38 | | 3.22 | | 3.88 | | (4.79) |
| Total from investment operations | | 5.85 | | (16.45) | | 14.11 | | 3.04 | | 4.19 | | (4.77) |
| Distributions from net investment income | | - | | (.80) | | - | | (.19) | | - | | (.02) |
| Distributions from net realized gain | | - | | (4.38) | | (1.70) | | (.28) | | (.91) | | (1.83) |
| Total distributions | | - | | (5.18) | | (1.70) | | (.46) E | | (.91) | | (1.85) |
| Net asset value, end of period | $ | 41.81 | $ | 35.96 | $ | 57.59 | $ | 45.18 | $ | 42.60 | $ | 39.32 |
Total Return F,G,H | | 16.27% | | (31.14)% | | 31.79% | | 7.19% | | 11.02% | | (10.80)% |
Ratios to Average Net Assets B,I,J | | | | | | | | | | | | |
| Expenses before reductions | | 1.84% K | | 2.10% | | 2.14% | | 2.16% | | 1.91% | | 2.00% |
| Expenses net of fee waivers, if any | | 1.83% K | | 2.10% | | 2.13% | | 2.15% | | 1.91% | | 2.00% |
| Expenses net of all reductions | | 1.83% K | | 2.10% | | 2.13% | | 2.15% | | 1.90% | | 1.99% |
| Net investment income (loss) | | .30% K | | .48% C | | (.50)% | | (.41)% | | .78% D | | .05% |
| Supplemental Data | | | | | | | | | | | | |
| Net assets, end of period (in millions) | $ | 6 | $ | 5 | $ | 10 | $ | 11 | $ | 12 | $ | 22 |
Portfolio turnover rate L | | 60% K,M | | 43% M | | 41% M | | 34% M | | 70% M | | 45% M |
A Calculated based on average shares outstanding during the period.
B Net investment income (loss) is affected by the timing of the declaration of dividends by any underlying mutual funds or exchange-traded funds (ETFs). Net investment income (loss) of any mutual funds or ETFs is not included in the Fund's net investment income (loss) ratio.
C Net investment income per share reflects one or more large, non-recurring dividend(s) which amounted to $.16 per share. Excluding such non-recurring dividend(s), the ratio of net investment income (loss) to average net assets would have been .12%.
D Net investment income per share reflects one or more large, non-recurring dividend(s) which amounted to $.21 per share. Excluding such non-recurring dividend(s), the ratio of net investment income (loss) to average net assets would have been .26%.
E Total distributions per share do not sum due to rounding.
F Total returns for periods of less than one year are not annualized.
G Total returns would have been lower if certain expenses had not been reduced during the applicable periods shown.
H Total returns do not include the effect of the contingent deferred sales charge.
I Fees and expenses of any underlying mutual funds or exchange-traded funds (ETFs) are not included in the Fund's expense ratio. The Fund indirectly bears its proportionate share of these expenses. For additional expense information related to investments in Fidelity Central Funds, please refer to the "Investments in Fidelity Central Funds" note found in the Notes to Financial Statements section of the most recent Annual or Semi-Annual report.
J Expense ratios reflect operating expenses of the class. Expenses before reductions do not reflect amounts reimbursed, waived, or reduced through arrangements with the investment adviser, brokerage services, or other offset arrangements, if applicable, and do not represent the amount paid by the class during periods when reimbursements, waivers or reductions occur.
K Annualized.
L Amount does not include the portfolio activity of any underlying mutual funds or exchange-traded funds (ETFs).
M Portfolio turnover rate excludes securities received or delivered in-kind.
| Fidelity® International Discovery Fund |
| |
| | Six months ended (Unaudited) April 30, 2023 | | Years ended October 31, 2022 | | 2021 | | 2020 | | 2019 | | 2018 |
Selected Per-Share Data | | | | | | | | | | | | |
| Net asset value, beginning of period | $ | 37.04 | $ | 59.31 | $ | 46.20 | $ | 43.65 | $ | 40.32 | $ | 47.04 |
| Income from Investment Operations | | | | | | | | | | | | |
Net investment income (loss) A,B | | .29 | | .72 C | | .36 | | .32 | | .78 D | | .53 |
| Net realized and unrealized gain (loss) | | 5.96 | | (17.07) | | 14.71 | | 3.29 | | 3.95 | | (4.92) |
| Total from investment operations | | 6.25 | | (16.35) | | 15.07 | | 3.61 | | 4.73 | | (4.39) |
| Distributions from net investment income | | (.14) | | (1.54) | | (.25) | | (.78) | | (.49) | | (.50) |
| Distributions from net realized gain | | - | | (4.38) | | (1.71) | | (.28) | | (.91) | | (1.83) |
| Total distributions | | (.14) | | (5.92) | | (1.96) | | (1.06) | | (1.40) | | (2.33) |
| Net asset value, end of period | $ | 43.15 | $ | 37.04 | $ | 59.31 | $ | 46.20 | $ | 43.65 | $ | 40.32 |
Total Return E,F | | 16.90% | | (30.36)% | | 33.29% | | 8.39% | | 12.31% | | (9.81)% |
Ratios to Average Net Assets B,G,H | | | | | | | | | | | | |
| Expenses before reductions | | .72% I | | .98% | | .99% | | 1.02% | | .78% | | .88% |
| Expenses net of fee waivers, if any | | .72% I | | .97% | | .99% | | 1.02% | | .78% | | .88% |
| Expenses net of all reductions | | .72% I | | .97% | | .99% | | 1.01% | | .76% | | .87% |
| Net investment income (loss) | | 1.41% I | | 1.60% C | | .65% | | .72% | | 1.92% D | | 1.17% |
| Supplemental Data | | | | | | | | | | | | |
| Net assets, end of period (in millions) | $ | 3,797 | $ | 3,386 | $ | 5,117 | $ | 6,784 | $ | 6,726 | $ | 6,515 |
Portfolio turnover rate J | | 60% I,K | | 43% K | | 41% K | | 34% K | | 70% K | | 45% K |
A Calculated based on average shares outstanding during the period.
B Net investment income (loss) is affected by the timing of the declaration of dividends by any underlying mutual funds or exchange-traded funds (ETFs). Net investment income (loss) of any mutual funds or ETFs is not included in the Fund's net investment income (loss) ratio.
C Net investment income per share reflects one or more large, non-recurring dividend(s) which amounted to $.16 per share. Excluding such non-recurring dividend(s), the ratio of net investment income (loss) to average net assets would have been 1.25%.
D Net investment income per share reflects one or more large, non-recurring dividend(s) which amounted to $.21 per share. Excluding such non-recurring dividend(s), the ratio of net investment income (loss) to average net assets would have been 1.40%.
E Total returns for periods of less than one year are not annualized.
F Total returns would have been lower if certain expenses had not been reduced during the applicable periods shown.
G Fees and expenses of any underlying mutual funds or exchange-traded funds (ETFs) are not included in the Fund's expense ratio. The Fund indirectly bears its proportionate share of these expenses. For additional expense information related to investments in Fidelity Central Funds, please refer to the "Investments in Fidelity Central Funds" note found in the Notes to Financial Statements section of the most recent Annual or Semi-Annual report.
H Expense ratios reflect operating expenses of the class. Expenses before reductions do not reflect amounts reimbursed, waived, or reduced through arrangements with the investment adviser, brokerage services, or other offset arrangements, if applicable, and do not represent the amount paid by the class during periods when reimbursements, waivers or reductions occur.
I Annualized.
J Amount does not include the portfolio activity of any underlying mutual funds or exchange-traded funds (ETFs).
K Portfolio turnover rate excludes securities received or delivered in-kind.
| Fidelity® International Discovery Fund Class K |
| |
| | Six months ended (Unaudited) April 30, 2023 | | Years ended October 31, 2022 | | 2021 | | 2020 | | 2019 | | 2018 |
Selected Per-Share Data | | | | | | | | | | | | |
| Net asset value, beginning of period | $ | 36.93 | $ | 59.18 | $ | 46.10 | $ | 43.55 | $ | 40.25 | $ | 46.96 |
| Income from Investment Operations | | | | | | | | | | | | |
Net investment income (loss) A,B | | .31 | | .78 C | | .41 | | .36 | | .82 D | | .58 |
| Net realized and unrealized gain (loss) | | 5.94 | | (17.02) | | 14.67 | | 3.29 | | 3.93 | | (4.90) |
| Total from investment operations | | 6.25 | | (16.24) | | 15.08 | | 3.65 | | 4.75 | | (4.32) |
| Distributions from net investment income | | (.18) | | (1.62) | | (.29) | | (.82) | | (.54) | | (.55) |
| Distributions from net realized gain | | - | | (4.38) | | (1.71) | | (.28) | | (.91) | | (1.83) |
| Total distributions | | (.18) | | (6.01) E | | (2.00) | | (1.10) | | (1.45) | | (2.39) E |
| Net asset value, end of period | $ | 43.00 | $ | 36.93 | $ | 59.18 | $ | 46.10 | $ | 43.55 | $ | 40.25 |
Total Return F,G | | 16.97% | | (30.28)% | | 33.40% | | 8.52% | | 12.41% | | (9.70)% |
Ratios to Average Net Assets B,H,I | | | | | | | | | | | | |
| Expenses before reductions | | .62% J | | .87% | | .90% | | .91% | | .66% | | .77% |
| Expenses net of fee waivers, if any | | .61% J | | .87% | | .90% | | .91% | | .66% | | .77% |
| Expenses net of all reductions | | .61% J | | .87% | | .90% | | .91% | | .65% | | .76% |
| Net investment income (loss) | | 1.51% J | | 1.71% C | | .74% | | .83% | | 2.03% D | | 1.29% |
| Supplemental Data | | | | | | | | | | | | |
| Net assets, end of period (in millions) | $ | 556 | $ | 603 | $ | 1,371 | $ | 1,401 | $ | 1,566 | $ | 2,064 |
Portfolio turnover rate K | | 60% J,L | | 43% L | | 41% L | | 34% L | | 70% L | | 45% L |
A Calculated based on average shares outstanding during the period.
B Net investment income (loss) is affected by the timing of the declaration of dividends by any underlying mutual funds or exchange-traded funds (ETFs). Net investment income (loss) of any mutual funds or ETFs is not included in the Fund's net investment income (loss) ratio.
C Net investment income per share reflects one or more large, non-recurring dividend(s) which amounted to $.16 per share. Excluding such non-recurring dividend(s), the ratio of net investment income (loss) to average net assets would have been 1.35%.
D Net investment income per share reflects one or more large, non-recurring dividend(s) which amounted to $.21 per share. Excluding such non-recurring dividend(s), the ratio of net investment income (loss) to average net assets would have been 1.51%.
E Total distributions per share do not sum due to rounding.
F Total returns for periods of less than one year are not annualized.
G Total returns would have been lower if certain expenses had not been reduced during the applicable periods shown.
H Fees and expenses of any underlying mutual funds or exchange-traded funds (ETFs) are not included in the Fund's expense ratio. The Fund indirectly bears its proportionate share of these expenses. For additional expense information related to investments in Fidelity Central Funds, please refer to the "Investments in Fidelity Central Funds" note found in the Notes to Financial Statements section of the most recent Annual or Semi-Annual report.
I Expense ratios reflect operating expenses of the class. Expenses before reductions do not reflect amounts reimbursed, waived, or reduced through arrangements with the investment adviser, brokerage services, or other offset arrangements, if applicable, and do not represent the amount paid by the class during periods when reimbursements, waivers or reductions occur.
J Annualized.
K Amount does not include the portfolio activity of any underlying mutual funds or exchange-traded funds (ETFs).
L Portfolio turnover rate excludes securities received or delivered in-kind.
| Fidelity Advisor® International Discovery Fund Class I |
| |
| | Six months ended (Unaudited) April 30, 2023 | | Years ended October 31, 2022 | | 2021 | | 2020 | | 2019 | | 2018 |
Selected Per-Share Data | | | | | | | | | | | | |
| Net asset value, beginning of period | $ | 36.90 | $ | 59.15 | $ | 46.08 | $ | 43.53 | $ | 40.22 | $ | 46.92 |
| Income from Investment Operations | | | | | | | | | | | | |
Net investment income (loss) A,B | | .29 | | .69 C | | .35 | | .31 | | .77 D | | .52 |
| Net realized and unrealized gain (loss) | | 5.94 | | (16.99) | | 14.67 | | 3.28 | | 3.93 | | (4.90) |
| Total from investment operations | | 6.23 | | (16.30) | | 15.02 | | 3.59 | | 4.70 | | (4.38) |
| Distributions from net investment income | | (.14) | | (1.57) | | (.24) | | (.76) | | (.48) | | (.49) |
| Distributions from net realized gain | | - | | (4.38) | | (1.71) | | (.28) | | (.91) | | (1.83) |
| Total distributions | | (.14) | | (5.95) | | (1.95) | | (1.04) | | (1.39) | | (2.32) |
| Net asset value, end of period | $ | 42.99 | $ | 36.90 | $ | 59.15 | $ | 46.08 | $ | 43.53 | $ | 40.22 |
Total Return E,F | | 16.91% | | (30.37)% | | 33.26% | | 8.37% | �� | 12.26% | | (9.81)% |
Ratios to Average Net Assets B,G,H | | | | | | | | | | | | |
| Expenses before reductions | | .73% I | | .99% | | 1.02% | | 1.04% | | .80% | | .91% |
| Expenses net of fee waivers, if any | | .73% I | | .99% | | 1.02% | | 1.04% | | .80% | | .91% |
| Expenses net of all reductions | | .73% I | | .99% | | 1.02% | | 1.03% | | .79% | | .90% |
| Net investment income (loss) | | 1.40% I | | 1.59% C | | .62% | | .70% | | 1.89% D | | 1.15% |
| Supplemental Data | | | | | | | | | | | | |
| Net assets, end of period (in millions) | $ | 548 | $ | 509 | $ | 566 | $ | 388 | $ | 463 | $ | 579 |
Portfolio turnover rate J | | 60% I,K | | 43% K | | 41% K | | 34% K | | 70% K | | 45% K |
A Calculated based on average shares outstanding during the period.
B Net investment income (loss) is affected by the timing of the declaration of dividends by any underlying mutual funds or exchange-traded funds (ETFs). Net investment income (loss) of any mutual funds or ETFs is not included in the Fund's net investment income (loss) ratio.
C Net investment income per share reflects one or more large, non-recurring dividend(s) which amounted to $.16 per share. Excluding such non-recurring dividend(s), the ratio of net investment income (loss) to average net assets would have been 1.23%.
D Net investment income per share reflects one or more large, non-recurring dividend(s) which amounted to $.21 per share. Excluding such non-recurring dividend(s), the ratio of net investment income (loss) to average net assets would have been 1.37%.
E Total returns for periods of less than one year are not annualized.
F Total returns would have been lower if certain expenses had not been reduced during the applicable periods shown.
G Fees and expenses of any underlying mutual funds or exchange-traded funds (ETFs) are not included in the Fund's expense ratio. The Fund indirectly bears its proportionate share of these expenses. For additional expense information related to investments in Fidelity Central Funds, please refer to the "Investments in Fidelity Central Funds" note found in the Notes to Financial Statements section of the most recent Annual or Semi-Annual report.
H Expense ratios reflect operating expenses of the class. Expenses before reductions do not reflect amounts reimbursed, waived, or reduced through arrangements with the investment adviser, brokerage services, or other offset arrangements, if applicable, and do not represent the amount paid by the class during periods when reimbursements, waivers or reductions occur.
I Annualized.
J Amount does not include the portfolio activity of any underlying mutual funds or exchange-traded funds (ETFs).
K Portfolio turnover rate excludes securities received or delivered in-kind.
| Fidelity Advisor® International Discovery Fund Class Z |
| |
| | Six months ended (Unaudited) April 30, 2023 | | Years ended October 31, 2022 | | 2021 | | 2020 | | 2019 | | 2018 |
Selected Per-Share Data | | | | | | | | | | | | |
| Net asset value, beginning of period | $ | 36.88 | $ | 59.14 | $ | 46.07 | $ | 43.52 | $ | 40.22 | $ | 46.92 |
| Income from Investment Operations | | | | | | | | | | | | |
Net investment income (loss) A,B | | .31 | | .76 C | | .43 | | .36 | | .82 D | | .58 |
| Net realized and unrealized gain (loss) | | 5.94 | | (16.99) | | 14.64 | | 3.29 | | 3.94 | | (4.89) |
| Total from investment operations | | 6.25 | | (16.23) | | 15.07 | | 3.65 | | 4.76 | | (4.31) |
| Distributions from net investment income | | (.19) | | (1.65) | | (.29) | | (.82) | | (.54) | | (.56) |
| Distributions from net realized gain | | - | | (4.38) | | (1.71) | | (.28) | | (.91) | | (1.83) |
| Total distributions | | (.19) | | (6.03) | | (2.00) | | (1.10) | | (1.46) E | | (2.39) |
| Net asset value, end of period | $ | 42.94 | $ | 36.88 | $ | 59.14 | $ | 46.07 | $ | 43.52 | $ | 40.22 |
Total Return F,G | | 16.97% | | (30.29)% | | 33.40% | | 8.53% | | 12.42% | | (9.68)% |
Ratios to Average Net Assets B,H,I | | | | | | | | | | | | |
| Expenses before reductions | | .62% J | | .87% | | .90% | | .91% | | .66% | | .77% |
| Expenses net of fee waivers, if any | | .61% J | | .87% | | .90% | | .91% | | .66% | | .77% |
| Expenses net of all reductions | | .61% J | | .87% | | .90% | | .91% | | .65% | | .76% |
| Net investment income (loss) | | 1.51% J | | 1.71% C | | .74% | | .83% | | 2.03% D | | 1.29% |
| Supplemental Data | | | | | | | | | | | | |
| Net assets, end of period (in millions) | $ | 2,934 | $ | 2,720 | $ | 3,972 | $ | 54 | $ | 82 | $ | 118 |
Portfolio turnover rate K | | 60% J,L | | 43% L | | 41% L | | 34% L | | 70% L | | 45% L |
A Calculated based on average shares outstanding during the period.
B Net investment income (loss) is affected by the timing of the declaration of dividends by any underlying mutual funds or exchange-traded funds (ETFs). Net investment income (loss) of any mutual funds or ETFs is not included in the Fund's net investment income (loss) ratio.
C Net investment income per share reflects one or more large, non-recurring dividend(s) which amounted to $.16 per share. Excluding such non-recurring dividend(s), the ratio of net investment income (loss) to average net assets would have been 1.35%.
D Net investment income per share reflects one or more large, non-recurring dividend(s) which amounted to $.21 per share. Excluding such non-recurring dividend(s), the ratio of net investment income (loss) to average net assets would have been 1.51%.
E Total distributions per share do not sum due to rounding.
F Total returns for periods of less than one year are not annualized.
G Total returns would have been lower if certain expenses had not been reduced during the applicable periods shown.
H Fees and expenses of any underlying mutual funds or exchange-traded funds (ETFs) are not included in the Fund's expense ratio. The Fund indirectly bears its proportionate share of these expenses. For additional expense information related to investments in Fidelity Central Funds, please refer to the "Investments in Fidelity Central Funds" note found in the Notes to Financial Statements section of the most recent Annual or Semi-Annual report.
I Expense ratios reflect operating expenses of the class. Expenses before reductions do not reflect amounts reimbursed, waived, or reduced through arrangements with the investment adviser, brokerage services, or other offset arrangements, if applicable, and do not represent the amount paid by the class during periods when reimbursements, waivers or reductions occur.
J Annualized.
K Amount does not include the portfolio activity of any underlying mutual funds or exchange-traded funds (ETFs).
L Portfolio turnover rate excludes securities received or delivered in-kind.
For the period ended April 30, 2023
( Amounts in thousands except percentages)
1. Organization.
Fidelity International Discovery Fund (the Fund) is a fund of Fidelity Investment Trust (the Trust) and is authorized to issue an unlimited number of shares. The Trust is registered under the Investment Company Act of 1940, as amended (the 1940 Act), as an open-end management investment company organized as a Massachusetts business trust. The Fund offers Class A, Class M, Class C, International Discovery, Class K, Class I and Class Z shares, each of which has equal rights as to assets and voting privileges. Class A, Class M, Class C, Class I and Class Z are Fidelity Advisor classes. Each class has exclusive voting rights with respect to matters that affect that class. Class C shares will automatically convert to Class A shares after a holding period of eight years from the initial date of purchase, with certain exceptions. The Fund's investments in emerging markets can be subject to social, economic, regulatory, and political uncertainties and can be extremely volatile.
2. Investments in Fidelity Central Funds.
Funds may invest in Fidelity Central Funds, which are open-end investment companies generally available only to other investment companies and accounts managed by the investment adviser and its affiliates. The Schedule of Investments lists any Fidelity Central Funds held as an investment as of period end, but does not include the underlying holdings of each Fidelity Central Fund. An investing fund indirectly bears its proportionate share of the expenses of the underlying Fidelity Central Funds.
Based on its investment objective, each Fidelity Central Fund may invest or participate in various investment vehicles or strategies that are similar to those of the investing fund. These strategies are consistent with the investment objectives of the investing fund and may involve certain economic risks which may cause a decline in value of each of the Fidelity Central Funds and thus a decline in the value of the investing fund.
| Fidelity Central Fund | Investment Manager | Investment Objective | Investment Practices | Expense Ratio A |
| Fidelity Money Market Central Funds | Fidelity Management & Research Company LLC (FMR) | Each fund seeks to obtain a high level of current income consistent with the preservation of capital and liquidity. | Short-term Investments | Less than .005% |
A Expenses expressed as a percentage of average net assets and are as of each underlying Central Fund's most recent annual or semi-annual shareholder report.
A complete unaudited list of holdings for each Fidelity Central Fund is available upon request or at the Securities and Exchange Commission website at www.sec.gov. In addition, the financial statements of the Fidelity Central Funds which contain the significant accounting policies (including investment valuation policies) of those funds, and are not covered by the Report of Independent Registered Public Accounting Firm, are available on the Securities and Exchange Commission website or upon request.
3. Significant Accounting Policies.
The Fund is an investment company and applies the accounting and reporting guidance of the Financial Accounting Standards Board (FASB) Accounting Standards Codification Topic 946 Financial Services - Investment Companies . The financial statements have been prepared in conformity with accounting principles generally accepted in the United States of America (GAAP), which require management to make certain estimates and assumptions at the date of the financial statements. Actual results could differ from those estimates. Subsequent events, if any, through the date that the financial statements were issued have been evaluated in the preparation of the financial statements. The Fund's Schedule of Investments lists any underlying mutual funds or exchange-traded funds (ETFs) but does not include the underlying holdings of these funds. The following summarizes the significant accounting policies of the Fund:
Investment Valuation. Investments are valued as of 4:00 p.m. Eastern time on the last calendar day of the period. The Board of Trustees (the Board) has designated the Fund's investment adviser as the valuation designee responsible for the fair valuation function and performing fair value determinations as needed. The investment adviser has established a Fair Value Committee (the Committee) to carry out the day-to-day fair valuation responsibilities and has adopted policies and procedures to govern the fair valuation process and the activities of the Committee. In accordance with these fair valuation policies and procedures, which have been approved by the Board, the Fund attempts to obtain prices from one or more third party pricing services or brokers to value its investments. When current market prices, quotations or currency exchange rates are not readily available or reliable, investments will be fair valued in good faith by the Committee, in accordance with the policies and procedures. Factors used in determining fair value vary by investment type and may include market or investment specific events, transaction data, estimated cash flows, and market observations of comparable investments. The frequency that the fair valuation procedures are used cannot be predicted and they may be utilized to a significant extent. The Committee manages the Fund's fair valuation practices and maintains the fair valuation policies and procedures. The Fund's investment adviser reports to the Board information regarding the fair valuation process and related material matters.
The Fund categorizes the inputs to valuation techniques used to value its investments into a disclosure hierarchy consisting of three levels as shown below:
Level 1 - unadjusted quoted prices in active markets for identical investments
Level 2 - other significant observable inputs (including quoted prices for similar investments, interest rates, prepayment speeds, etc.)
Level 3 - unobservable inputs (including the Fund's own assumptions based on the best information available)
Valuation techniques used to value the Fund's investments by major category are as follows:
Equity securities, including restricted securities, for which market quotations are readily available, are valued at the last reported sale price or official closing price as reported by a third party pricing service on the primary market or exchange on which they are traded and are categorized as Level 1 in the hierarchy. In the event there were no sales during the day or closing prices are not available, securities are valued at the last quoted bid price or may be valued using the last available price and are generally categorized as Level 2 in the hierarchy. For foreign equity securities, when market or security specific events arise, comparisons to the valuation of American Depositary Receipts (ADRs), futures contracts, ETFs and certain indexes as well as quoted prices for similar securities may be used and would be categorized as Level 2 in the hierarchy. For equity securities, including restricted securities, where observable inputs are limited, assumptions about market activity and risk are used and these securities may be categorized as Level 3 in the hierarchy. Securities, including private placements or other restricted securities, for which observable inputs are not available are valued using alternate valuation approaches, including the market approach, the income approach and cost approach, and are categorized as Level 3 in the hierarchy. The market approach considers factors including the price of recent investments in the same or a similar security or financial metrics of comparable securities. The income approach considers factors including expected future cash flows, security specific risks and corresponding discount rates. The cost approach considers factors including the value of the security's underlying assets and liabilities.
Investments in open-end mutual funds, including the Fidelity Central Funds, are valued at their closing net asset value (NAV) each business day and are categorized as Level 1 in the hierarchy.
The following provides information on Level 3 securities held by the Fund that were valued at period end based on unobservable inputs. These amounts exclude valuations provided by a broker.
| Asset Type | Fair Value | Valuation Technique(s) | Unobservable Input | Amount or Range/Weighted Average | Impact to Valuation from an Increase in Input A |
| Equities | $101,355 | Market comparable | Enterprise value/Revenue multiple (EV/R) | 2.0 - 20.0 / 10.4 | Increase |
| | | | Enterprise value/Net income multiple (EV/NI) | 15.0 | Increase |
| | | Market approach | Discount rate | 50.0% | Decrease |
A Represents the directional change in the fair value of the Level 3 investments that could have resulted from an increase in the corresponding input as of period end. A decrease to the unobservable input would have had the opposite effect. Significant changes in these inputs may have resulted in a significantly higher or lower fair value measurement at period end.
Changes in valuation techniques may result in transfers in or out of an assigned level within the disclosure hierarchy. The aggregate value of investments by input level as of April 30, 2023, as well as a roll forward of Level 3 investments, is included at the end of the Fund's Schedule of Investments.
Foreign Currency. Certain Funds may use foreign currency contracts to facilitate transactions in foreign-denominated securities. Gains and losses from these transactions may arise from changes in the value of the foreign currency or if the counterparties do not perform under the contracts' terms.
Foreign-denominated assets, including investment securities, and liabilities are translated into U.S. dollars at the exchange rates at period end. Purchases and sales of investment securities, income and dividends received, and expenses denominated in foreign currencies are translated into U.S. dollars at the exchange rate in effect on the transaction date.
The effects of exchange rate fluctuations on investments are included with the net realized and unrealized gain (loss) on investment securities. Other foreign currency transactions resulting in realized and unrealized gain (loss) are disclosed separately.
Investment Transactions and Income. For financial reporting purposes, the Fund's investment holdings and NAV include trades executed through the end of the last business day of the period. The NAV per share for processing shareholder transactions is calculated as of the close of business of the New York Stock Exchange (NYSE), normally 4:00 p.m. Eastern time and includes trades executed through the end of the prior business day. Gains and losses on securities sold are determined on the basis of identified cost and include proceeds received from litigation. Commissions paid to certain brokers with whom the investment adviser, or its affiliates, places trades on behalf of a fund include an amount in addition to trade execution, which may be rebated back to a fund. Any such rebates are included in net realized gain (loss) on investments in the Statement of Operations. Dividend income is recorded on the ex-dividend date, except for certain dividends from foreign securities where the ex-dividend date may have passed, which are recorded as soon as the Fund is informed of the ex-dividend date. Non-cash dividends included in dividend income, if any, are recorded at the fair market value of the securities received. Income and capital gain distributions from Fidelity Central Funds, if any, are recorded on the ex-dividend date. Investment income is recorded net of foreign taxes withheld where recovery of such taxes is uncertain. Funds may file withholding tax reclaims in certain jurisdictions to recover a portion of amounts previously withheld. Any withholding tax reclaims income is included in the Statement of Operations in foreign taxes withheld. Any receivables for withholding tax reclaims are included in the Statement of Assets and Liabilities in reclaims receivable.
Class Allocations and Expenses. Investment income, realized and unrealized capital gains and losses, common expenses of a fund, and certain fund-level expense reductions, if any, are allocated daily on a pro-rata basis to each class based on the relative net assets of each class to the total net assets of a fund. Each class differs with respect to transfer agent and distribution and service plan fees incurred, as applicable. Certain expense reductions may also differ by class, if applicable. For the reporting period, the allocated portion of income and expenses to each class as a percent of its average net assets may vary due to the timing of recording these transactions in relation to fluctuating net assets of the classes. Expenses directly attributable to a fund are charged to that fund. Expenses attributable to more than one fund are allocated among the respective funds on the basis of relative net assets or other appropriate methods. Expenses included in the accompanying financial statements reflect the expenses of that fund and do not include any expenses associated with any underlying mutual funds or exchange-traded funds. Although not included in a fund's expenses, a fund indirectly bears its proportionate share of these expenses through the net asset value of each underlying mutual fund or exchange-traded fund. Expense estimates are accrued in the period to which they relate and adjustments are made when actual amounts are known.
Deferred Trustee Compensation. Under a Deferred Compensation Plan (the Plan) for certain Funds, certain independent Trustees have elected to defer receipt of a portion of their annual compensation. Deferred amounts are invested in affiliated mutual funds, are marked-to-market and remain in a fund until distributed in accordance with the Plan. The investment of deferred amounts and the offsetting payable to the Trustees presented below are included in the accompanying Statement of Assets and Liabilities in other receivables and other payables and accrued expenses, as applicable.
| Fidelity International Discovery Fund | $375 |
Income Tax Information and Distributions to Shareholders. Each year, the Fund intends to qualify as a regulated investment company under Subchapter M of the Internal Revenue Code, including distributing substantially all of its taxable income and realized gains. As a result, no provision for U.S. Federal income taxes is required. The Fund files a U.S. federal tax return, in addition to state and local tax returns as required. The Fund's federal income tax returns are subject to examination by the Internal Revenue Service (IRS) for a period of three fiscal years after they are filed. State and local tax returns may be subject to examination for an additional fiscal year depending on the jurisdiction. Foreign taxes are provided for based on the Fund's understanding of the tax rules and rates that exist in the foreign markets in which it invests. The Fund is subject to a tax imposed on capital gains by certain countries in which it invests. An estimated deferred tax liability for net unrealized appreciation on the applicable securities is included in Deferred taxes on the Statement of Assets & Liabilities.
Distributions are declared and recorded on the ex-dividend date. Income and capital gain distributions are declared separately for each class. Income and capital gain distributions are determined in accordance with income tax regulations, which may differ from GAAP.
Capital accounts within the financial statements are adjusted for permanent book-tax differences. These adjustments have no impact on net assets or the results of operations. Capital accounts are not adjusted for temporary book-tax differences which will reverse in a subsequent period.
Book-tax differences are primarily due to foreign currency transactions, certain foreign taxes, passive foreign investment companies (PFIC), redemptions in-kind, deferred Trustee compensation, capital loss carryforwards, and losses deferred due to wash sales.
As of period end, the cost and unrealized appreciation (depreciation) in securities, and derivatives if applicable, for federal income tax purposes were as follows:
| Gross unrealized appreciation | $1,850,202 |
| Gross unrealized depreciation | (322,761) |
| Net unrealized appreciation (depreciation) | $1,527,441 |
| Tax cost | $6,531,019 |
Capital loss carryforwards are only available to offset future capital gains of the Fund to the extent provided by regulations and may be limited. The capital loss carryforward information presented below, including any applicable limitation, is estimated as of prior fiscal period end and is subject to adjustment.
Restricted Securities (including Private Placements). Funds may invest in securities that are subject to legal or contractual restrictions on resale. These securities generally may be resold in transactions exempt from registration or to the public if the securities are registered. Disposal of these securities may involve time-consuming negotiations and expense, and prompt sale at an acceptable price may be difficult. Information regarding restricted securities held at period end is included at the end of the Schedule of Investments, if applicable.
New Accounting Pronouncement. In June 2022, the Financial Accounting Standards Board (FASB) issued Accounting Standards Update (ASU) 2022-03 Fair Value Measurement (Topic 820): Fair Value Measurement of Equity Securities Subject to Contractual Sale Restrictions. The amendments in this ASU clarify that a contractual restriction on the sale of an equity security is not considered part of the unit of account of the equity security and, therefore, is not considered in measuring fair value. They also clarify that an entity cannot, as a separate unit of account, recognize and measure a contractual sale restriction. They also require additional disclosures for equity securities subject to contractual sale restrictions. ASU 2022-03 will be effective for fiscal years, including interim periods within those fiscal years, beginning after December 15, 2023, and allows for early adoption. ASU 2022-03 will only be applicable to an equity security in which the contractual arrangement that restricts its sale is executed or modified on or after the adoption date. Management is currently evaluating the potential impact of ASU 2022-03 to the financial statements.
4. Purchases and Sales of Investments.
Purchases and sales of securities, other than short-term securities in-kind transactions, as applicable, are noted in the table below.
| | Purchases ($) | Sales ($) |
| Fidelity International Discovery Fund | 2,279,971 | 2,581,445 |
Unaffiliated Redemptions In-Kind. Shares that were redeemed in-kind for investments, including accrued interest and cash, if any, are shown in the table below. The net realized gain or loss on investments delivered through in-kind redemptions is included in the "Net realized gain (loss) on: Redemptions in-kind" line in the accompanying Statement of Operations. The amount of the in-kind redemptions is included in share transactions in the accompanying Statement of Changes in Net Assets. There was no gain or loss for federal income tax purposes.
| | Shares | Total net realized gain or loss ($) | Total Proceeds ($) | Participating classes |
| Fidelity International Discovery Fund | 2,234 | 23,400 | 93,437 | Class K |
Prior Fiscal Year Unaffiliated Redemptions In-Kind. Shares that were redeemed in-kind for investments, including accrued interest and cash, if any, are shown in the table below; along with realized gain or loss on investments delivered through in-kind redemptions. The amount of the in-kind redemptions is included in share transactions in the accompanying Statement of Changes in Net Assets. There was no gain or loss for federal income tax purposes.
| | Shares | Total net realized gain or loss ($) | Total Proceeds ($) | Participating classes |
| Fidelity International Discovery Fund | 5,635 | 85,105 | 263,151 | International Discovery and Class K |
5. Fees and Other Transactions with Affiliates.
Management Fee. Fidelity Management & Research Company LLC (the investment adviser) and its affiliates provide the Fund with investment management related services for which the Fund pays a monthly management fee. The management fee is the sum of an individual fund fee rate that is based on an annual rate of .424% of the Fund's average net assets and an annualized group fee rate that averaged .23% during the period. The group fee rate is based upon the monthly average net assets of a group of registered investment companies with which the investment adviser has management contracts. The group fee rate decreases as assets under management increase and increases as assets under management decrease. In addition, the management fee is subject to a performance adjustment (up to a maximum of +/- .20% of the Fund's average net assets over a 36 month performance period). The upward or downward adjustment to the management fee is based on the relative investment performance of International Discovery as compared to its benchmark index, the MSCI EAFE Index, over the same 36 month performance period. For the reporting period, the total annualized management fee rate, including the performance adjustment, was .54% of the Fund's average net assets. The performance adjustment included in the management fee rate may be higher or lower than the maximum performance adjustment rate due to the difference between the average net assets for the reporting and performance periods.
Distribution and Service Plan Fees. In accordance with Rule 12b-1 of the 1940 Act, the Fund has adopted separate Distribution and Service Plans for each class of shares. Certain classes pay Fidelity Distributors Company LLC (FDC), an affiliate of the investment adviser, separate Distribution and Service Fees, each of which is based on an annual percentage of each class' average net assets. In addition, FDC may pay financial intermediaries for selling shares of the Fund and providing shareholder support services. For the period, the Distribution and Service Fee rates, total fees and amounts retained by FDC were as follows:
| | Distribution Fee | Service Fee | Total Fees | Retained by FDC |
| Class A | - % | .25% | $177 | $3 |
| Class M | .25% | .25% | 43 | 1 |
| Class C | .75% | .25% | 29 | 2 |
| | | | $249 | $6 |
Sales Load. FDC may receive a front-end sales charge of up to 5.75% for selling Class A shares and 3.50% for selling Class M shares, some of which is paid to financial intermediaries for selling shares of the Fund. Depending on the holding period, FDC may receive contingent deferred sales charges levied on Class A, Class M and Class C redemptions. The deferred sales charges are 1.00% for Class C shares, 1.00% for certain purchases of Class A shares and .25% for certain purchases of Class M shares.
For the period, sales charge amounts retained by FDC were as follows:
| | Retained by FDC |
| Class A | $9 |
| Class M | - A |
Class C B | 1 |
| | $10 |
A In the amount of less than five hundred dollars.
B When Class C shares are initially sold, FDC pays commissions from its own resources to financial intermediaries through which the sales are made.
Transfer Agent Fees. Fidelity Investments Institutional Operations Company LLC (FIIOC), an affiliate of the investment adviser, is the transfer, dividend disbursing and shareholder servicing agent for each class of the Fund. FIIOC receives account fees and asset-based fees that vary according to the account size and type of account of the shareholders of the respective classes of the Fund, except for Class K and Class Z. FIIOC receives an asset-based fee of Class K's and Class Z's average net assets. FIIOC pays for typesetting, printing and mailing of shareholder reports, except proxy statements.
For the period, transfer agent fees for each class were as follows:
| | Amount | % of Class-Level Average Net Assets A |
| Class A | $169 | .24 |
| Class M | 20 | .23 |
| Class C | 7 | .26 |
| International Discovery | 2,711 | .15 |
| Class K | 130 | .04 |
| Class I | 423 | .16 |
| Class Z | 601 | .04 |
| | $4,061 | |
A Annualized
Accounting Fees. Fidelity Service Company, Inc. (FSC), an affiliate of the investment adviser, maintains the Fund's accounting records. The accounting fee is based on the level of average net assets for each month. For the period, the fees were equivalent to the following annualized rates:
| | % of Average Net Assets |
| Fidelity International Discovery Fund | .02 |
Brokerage Commissions. A portion of portfolio transactions were placed with brokerage firms which are affiliates of the investment adviser. Brokerage commissions are included in net realized gain (loss) and change in net unrealized appreciation (depreciation) in the Statement of Operations. The commissions paid to these affiliated firms were as follows:
| | Amount |
| Fidelity International Discovery Fund | $3 |
Interfund Trades. Funds may purchase from or sell securities to other Fidelity Funds under procedures adopted by the Board. The procedures have been designed to ensure these interfund trades are executed in accordance with Rule 17a-7 of the 1940 Act. Any interfund trades are included within the respective purchases and sales amounts shown in the Purchases and Sales of Investments note. Interfund trades during the period are noted in the table below.
| | Purchases ($) | Sales ($) | Realized Gain (Loss) ($) |
| Fidelity International Discovery Fund | 66,518 | 46,313 | (7,361) |
6. Committed Line of Credit.
Certain Funds participate with other funds managed by the investment adviser or an affiliate in a $4.25 billion credit facility (the "line of credit") to be utilized for temporary or emergency purposes to fund shareholder redemptions or for other short-term liquidity purposes. The participating funds have agreed to pay commitment fees on their pro-rata portion of the line of credit, which are reflected in Miscellaneous expenses on the Statement of Operations, and are listed below. During the period, there were no borrowings on this line of credit.
| | Amount |
| Fidelity International Discovery Fund | $8 |
7. Security Lending.
Funds lend portfolio securities from time to time in order to earn additional income. Lending agents are used, including National Financial Services (NFS), an affiliate of the investment adviser. Pursuant to a securities lending agreement, NFS will receive a fee, which is capped at 9.9% of a fund's daily lending revenue, for its services as lending agent. A fund may lend securities to certain qualified borrowers, including NFS. On the settlement date of the loan, a fund receives collateral (in the form of U.S. Treasury obligations, letters of credit and/or cash) against the loaned securities and maintains collateral in an amount not less than 100% of the market value of the loaned securities during the period of the loan. The market value of the loaned securities is determined at the close of business of a fund and any additional required collateral is delivered to a fund on the next business day. A fund or borrower may terminate the loan at any time, and if the borrower defaults on its obligation to return the securities loaned because of insolvency or other reasons, a fund may apply collateral received from the borrower against the obligation. A fund may experience delays and costs in recovering the securities loaned. Any cash collateral received is invested in the Fidelity Securities Lending Cash Central Fund. Any loaned securities are identified as such in the Schedule of Investments, and the value of loaned securities and cash collateral at period end, as applicable, are presented in the Statement of Assets and Liabilities. Security lending income represents the income earned on investing cash collateral, less rebates paid to borrowers and any lending agent fees associated with the loan, plus any premium payments received for lending certain types of securities. Security lending income is presented in the Statement of Operations as a component of income from Fidelity Central Funds. Affiliated security lending activity, if any, was as follows:
| | Total Security Lending Fees Paid to NFS | Security Lending Income From Securities Loaned to NFS | Value of Securities Loaned to NFS at Period End |
| Fidelity International Discovery Fund | $52 | $- | $- |
8. Expense Reductions.
Through arrangements with the Fund's custodian and each class' transfer agent, credits realized as a result of certain uninvested cash balances were used to reduce the Fund's expenses. During the period, custodian credits reduced the Fund's expenses by an amount of less than five hundred dollars. During the period, transfer agent credits reduced each class' expenses as noted in the table below.
| | Expense reduction |
| Class M | $- A |
| | |
A In the amount of less than five hundred dollars.
In addition, during the period the investment adviser or an affiliate reimbursed and/or waived a portion of fund-level operating expenses in the amount of $181.
9. Distributions to Shareholders.
Distributions to shareholders of each class were as follows:
| | Six months ended April 30, 2023 | Year ended October 31, 2022 |
| Fidelity International Discovery Fund | | |
| Distributions to shareholders | | |
| Class A | $- | $20,037 |
| Class M | - | 2,384 |
| Class C | - | 909 |
| International Discovery | 12,630 | 509,968 |
| Class K | 2,923 | 134,333 |
| Class I | 1,852 | 53,775 |
| Class Z | 13,303 | 406,122 |
Total | $30,708 | $1,127,528 |
10. Share Transactions.
Share transactions for each class were as follows and may contain in-kind transactions, automatic conversions between classes or exchanges between affiliated funds:
| | Shares | Shares | Dollars | Dollars |
| | Six months ended April 30, 2023 | Year ended October 31, 2022 | Six months ended April 30, 2023 | Year ended October 31, 2022 |
| Fidelity International Discovery Fund | | | | |
| Class A | | | | |
| Shares sold | 97 | 268 | $3,943 | $11,889 |
| Reinvestment of distributions | - | 387 | - | 19,790 |
| Shares redeemed | (262) | (597) | (10,658) | (26,398) |
| Net increase (decrease) | (165) | 58 | $(6,715) | $5,281 |
| Class M | | | | |
| Shares sold | 10 | 22 | $404 | $962 |
| Reinvestment of distributions | - | 47 | - | 2,368 |
| Shares redeemed | (33) | (58) | (1,314) | (2,608) |
| Net increase (decrease) | (23) | 11 | $(910) | $722 |
| Class C | | | | |
| Shares sold | 8 | 12 | $332 | $599 |
| Reinvestment of distributions | - | 18 | - | 888 |
| Shares redeemed | (23) | (57) | (917) | (2,536) |
| Net increase (decrease) | (15) | (27) | $(585) | $(1,049) |
| International Discovery | | | | |
| Shares sold | 2,653 | 7,204 | $109,350 | $327,014 |
| Reinvestment of distributions | 286 | 9,116 | 11,602 | 469,882 |
| Shares redeemed | (6,341) | (11,205) | (260,019) | (499,877) |
| Net increase (decrease) | (3,402) | 5,115 | $(139,067) | $297,019 |
| Class K | | | | |
| Shares sold | 776 | 2,511 | $31,813 | $114,979 |
| Reinvestment of distributions | 72 | 2,616 | 2,923 | 134,333 |
| Shares redeemed | (4,233) | (11,983) | (174,333) | (555,470) |
| Net increase (decrease) | (3,385) | (6,856) | $(139,597) | $(306,158) |
| Class I | | | | |
| Shares sold | 1,167 | 34,479 | $47,270 | $1,453,949 |
| Reinvestment of distributions | 9 | 298 | 373 | 15,297 |
| Shares redeemed | (2,227) | (30,537) | (90,433) | (1,266,702) |
| Net increase (decrease) | (1,051) | 4,240 | $(42,790) | $202,544 |
| Class Z | | | | |
| Shares sold | 378 | 3,672 | $15,628 | $187,806 |
| Reinvestment of distributions | 329 | 7,866 | 13,272 | 403,304 |
| Shares redeemed | (6,136) | (4,955) | (247,032) | (200,579) |
| Net increase (decrease) | (5,429) | 6,583 | $(218,132) | $390,531 |
11. Other.
A fund's organizational documents provide former and current trustees and officers with a limited indemnification against liabilities arising in connection with the performance of their duties to the fund. In the normal course of business, a fund may also enter into contracts that provide general indemnifications. A fund's maximum exposure under these arrangements is unknown as this would be dependent on future claims that may be made against a fund. The risk of material loss from such claims is considered remote.
At the end of the period, the following mutual funds managed by the investment adviser or its affiliates were the owners of record of 10% or more of the total outstanding shares.
| | Strategic Advisers Fidelity International Fund | Strategic Advisers International Fund |
| Fidelity International Discovery Fund | 26% | 10% |
Mutual funds managed by the investment adviser or its affiliates, in aggregate, were the owners of record of more than 20% of the total outstanding shares.
| Fund | % of shares held |
| Fidelity International Discovery Fund | 39% |
12. Risk and Uncertainties.
Many factors affect a fund's performance. Developments that disrupt global economies and financial markets, such as pandemics, epidemics, outbreaks of infectious diseases, war, terrorism, and environmental disasters, may significantly affect a fund's investment performance. The effects of these developments to a fund will be impacted by the types of securities in which a fund invests, the financial condition, industry, economic sector, and geographic location of an issuer, and a fund's level of investment in the securities of that issuer. Significant concentrations in security types, issuers, industries, sectors, and geographic locations may magnify the factors that affect a fund's performance.
As a shareholder, you incur two types of costs: (1) transaction costs, which may include sales charges (loads) on purchase payments or redemption proceeds, as applicable and (2) ongoing costs, which generally include management fees, distribution and/or service (12b-1) fees and other Fund expenses. This Example is intended to help you understand your ongoing costs (in dollars) of investing in a fund and to compare these costs with the ongoing costs of investing in other mutual funds.
| The Example is based on an investment of $1,000 invested at the beginning of the period and held for the entire period (November 1, 2022 to April 30, 2023). |
Actual Expenses
The first line of the accompanying table provides information about actual account values and actual expenses. You may use the information in this line, together with the amount you invested, to estimate the expenses that you paid over the period. Simply divide your account value by $1,000.00 (for example, an $8,600 account value divided by $1,000.00 = 8.6), then multiply the result by the number in the first line for a class/Fund under the heading entitled "Expenses Paid During Period" to estimate the expenses you paid on your account during this period. If any fund is a shareholder of any underlying mutual funds or exchange-traded funds (ETFs) (the Underlying Funds), such fund indirectly bears its proportional share of the expenses of the Underlying Funds in addition to the direct expenses incurred presented in the table. These fees and expenses are not included in the annualized expense ratio used to calculate the expense estimate in the table below.
Hypothetical Example for Comparison Purposes
The second line of the accompanying table provides information about hypothetical account values and hypothetical expenses based on the actual expense ratio and an assumed rate of return of 5% per year before expenses, which is not the actual return. The hypothetical account values and expenses may not be used to estimate the actual ending account balance or expenses you paid for the period. You may use this information to compare the ongoing costs of investing in the Fund and other funds. To do so, compare this 5% hypothetical example with the 5% hypothetical examples that appear in the shareholder reports of the other funds. If any fund is a shareholder of any Underlying Funds, such fund indirectly bears its proportional share of the expenses of the Underlying Funds in addition to the direct expenses as presented in the table. These fees and expenses are not included in the annualized expense ratio used to calculate the expense estimate in the table below.
Please note that the expenses shown in the table are meant to highlight your ongoing costs only and do not reflect any transaction costs. Therefore, the second line of the table is useful in comparing ongoing costs only, and will not help you determine the relative total costs of owning different funds. In addition, if these transactional costs were included, your costs would have been higher.
| | | | | Annualized Expense Ratio- A | | Beginning Account Value November 1, 2022 | | Ending Account Value April 30, 2023 | | Expenses Paid During Period- C November 1, 2022 to April 30, 2023 |
| Fidelity® International Discovery Fund | | | | | | | | | | |
| Class A | | | | 1.06% | | | | | | |
| Actual | | | | | | $ 1,000 | | $ 1,166.80 | | $ 5.69 |
Hypothetical- B | | | | | | $ 1,000 | | $ 1,019.54 | | $ 5.31 |
| Class M | | | | 1.30% | | | | | | |
| Actual | | | | | | $ 1,000 | | $ 1,165.80 | | $ 6.98 |
Hypothetical- B | | | | | | $ 1,000 | | $ 1,018.35 | | $ 6.51 |
| Class C | | | | 1.83% | | | | | | |
| Actual | | | | | | $ 1,000 | | $ 1,162.70 | | $ 9.81 |
Hypothetical- B | | | | | | $ 1,000 | | $ 1,015.72 | | $ 9.15 |
| Fidelity® International Discovery Fund | | | | .72% | | | | | | |
| Actual | | | | | | $ 1,000 | | $ 1,169.00 | | $ 3.87 |
Hypothetical- B | | | | | | $ 1,000 | | $ 1,021.22 | | $ 3.61 |
| Class K | | | | .61% | | | | | | |
| Actual | | | | | | $ 1,000 | | $ 1,169.70 | | $ 3.28 |
Hypothetical- B | | | | | | $ 1,000 | | $ 1,021.77 | | $ 3.06 |
| Class I | | | | .73% | | | | | | |
| Actual | | | | | | $ 1,000 | | $ 1,169.10 | | $ 3.93 |
Hypothetical- B | | | | | | $ 1,000 | | $ 1,021.17 | | $ 3.66 |
| Class Z | | | | .61% | | | | | | |
| Actual | | | | | | $ 1,000 | | $ 1,169.70 | | $ 3.28 |
Hypothetical- B | | | | | | $ 1,000 | | $ 1,021.77 | | $ 3.06 |
| |
A Annualized expense ratio reflects expenses net of applicable fee waivers.
B 5% return per year before expenses
C Expenses are equal to the annualized expense ratio, multiplied by the average account value over the period, multiplied by 181/ 365 (to reflect the one-half year period). The fees and expenses of any Underlying Funds are not included in each annualized expense ratio.
The Securities and Exchange Commission adopted Rule 22e-4 under the Investment Company Act of 1940 (the Liquidity Rule) to promote effective liquidity risk management throughout the open-end investment company industry, thereby reducing the risk that funds will be unable to meet their redemption obligations and mitigating dilution of the interests of fund shareholders.
The Fund has adopted and implemented a liquidity risk management program (the Program) reasonably designed to assess and manage the Fund's liquidity risk and to comply with the requirements of the Liquidity Rule. The Fund's Board of Trustees (the Board) has designated the Fund's investment adviser as administrator of the Program. The Fidelity advisers have established a Liquidity Risk Management Committee (the LRM Committee) to manage the Program for each of the Fidelity Funds. The LRM Committee monitors the adequacy and effectiveness of implementation of the Program and on a periodic basis assesses each Fund's liquidity risk based on a variety of factors including (1) the Fund's investment strategy, (2) portfolio liquidity and cash flow projections during normal and reasonably foreseeable stressed conditions, (3) shareholder redemptions, (4) borrowings and other funding sources and (5) certain factors specific to ETFs including the effect of the Fund's prices and spreads, market participants, and basket compositions on the overall liquidity of the Fund's portfolio, as applicable.
In accordance with the Program, each of the Fund's portfolio investments is classified into one of four defined liquidity categories based on a determination of a reasonable expectation for how long it would take to convert the investment to cash (or sell or dispose of the investment) without significantly changing its market value.
- Highly liquid investments - cash or convertible to cash within three business days or less
- Moderately liquid investments - convertible to cash in three to seven calendar days
- Less liquid investments - can be sold or disposed of, but not settled, within seven calendar days
- Illiquid investments - cannot be sold or disposed of within seven calendar days
Liquidity classification determinations take into account a variety of factors including various market, trading and investment-specific considerations, as well as market depth, and generally utilize analysis from a third-party liquidity metrics service.
The Liquidity Rule places a 15% limit on a fund's illiquid investments and requires funds that do not primarily hold assets that are highly liquid investments to determine and maintain a minimum percentage of the fund's net assets to be invested in highly liquid investments (highly liquid investment minimum or HLIM). The Program includes provisions reasonably designed to comply with the 15% limit on illiquid investments and for determining, periodically reviewing and complying with the HLIM requirement as applicable.
At a recent meeting of the Fund's Board of Trustees, the LRM Committee provided a written report to the Board pertaining to the operation, adequacy, and effectiveness of the Program for the period December 1, 2021 through November 30, 2022. The report concluded that the Program is operating effectively and is reasonably designed to assess and manage the Fund's liquidity risk.
1.807261.118
IGI-SANN-0623
Fidelity's Broadly Diversified International Equity Funds
Fidelity® Diversified International Fund
Fidelity® International Capital Appreciation Fund
Fidelity® Overseas Fund
Fidelity® Worldwide Fund
Semi-Annual Report
April 30, 2023
Includes Fidelity and Fidelity Advisor share classes
Contents
To view a fund's proxy voting guidelines and proxy voting record for the 12-month period ended June 30, visit http://www.fidelity.com/proxyvotingresults or visit the Securities and Exchange Commission's (SEC) web site at http://www.sec.gov.
You may also call 1-800-544-8544 if you're an individual investing directly with Fidelity, call 1-800-835-5092 if you're a plan sponsor or participant with Fidelity as your recordkeeper or call 1-877-208-0098 on institutional accounts or if you're an advisor or invest through one to request a free copy of the proxy voting guidelines.
Standard & Poor's, S&P and S&P 500 are registered service marks of The McGraw-Hill Companies, Inc. and have been licensed for use by Fidelity Distributors Corporation.
Other third-party marks appearing herein are the property of their respective owners.
All other marks appearing herein are registered or unregistered trademarks or service marks of FMR LLC or an affiliated company. © 2023 FMR LLC. All rights reserved.
This report and the financial statements contained herein are submitted for the general information of the shareholders of the Funds. This report is not authorized for distribution to prospective investors in the Funds unless preceded or accompanied by an effective prospectus.
A fund files its complete schedule of portfolio holdings with the SEC for the first and third quarters of each fiscal year on Form N-PORT. Forms N-PORT are available on the SEC's web site at http://www.sec.gov. A fund's Forms N-PORT may be reviewed and copied at the SEC's Public Reference Room in Washington, DC. Information regarding the operation of the SEC's Public Reference Room may be obtained by calling 1-800-SEC-0330.
For a complete list of a fund's portfolio holdings, view the most recent holdings listing, semiannual report, or annual report on Fidelity's web site at http://www.fidelity.com, http://www.institutional.fidelity.com, or http://www.401k.com, as applicable.
NOT FDIC INSURED •MAY LOSE VALUE •NO BANK GUARANTEE
Neither the Funds nor Fidelity Distributors Corporation is a bank.
Top Holdings (% of Fund's net assets) |
| |
| LVMH Moet Hennessy Louis Vuitton SE (France, Textiles, Apparel & Luxury Goods) | 3.1 | |
| ASML Holding NV (depository receipt) (Netherlands, Semiconductors & Semiconductor Equipment) | 2.7 | |
| Nestle SA (Reg. S) (United States of America, Food Products) | 2.4 | |
| AIA Group Ltd. (Hong Kong, Insurance) | 2.1 | |
| Novo Nordisk A/S Series B (Denmark, Pharmaceuticals) | 2.0 | |
| AstraZeneca PLC (United Kingdom) (United Kingdom, Pharmaceuticals) | 1.7 | |
| Linde PLC (United States of America, Chemicals) | 1.6 | |
| RELX PLC (Euronext N.V.) (United Kingdom, Professional Services) | 1.6 | |
| Hoya Corp. (Japan, Health Care Equipment & Supplies) | 1.5 | |
| Hitachi Ltd. (Japan, Industrial Conglomerates) | 1.4 | |
| | 20.1 | |
| |
| Market Sectors (% of Fund's net assets) |
| |
| Financials | 22.6 | |
| Industrials | 20.1 | |
| Information Technology | 13.0 | |
| Health Care | 11.4 | |
| Consumer Discretionary | 10.1 | |
| Consumer Staples | 6.6 | |
| Materials | 6.4 | |
| Energy | 3.9 | |
| Communication Services | 0.7 | |
| Real Estate | 0.6 | |
| |
Asset Allocation (% of Fund's net assets) |
|
|
Geographic Diversification (% of Fund's net assets) |
|
* Includes Short-Term investments and Net Other Assets (Liabilities). Percentages are adjusted for the effect of derivatives, if applicable. |
| |
Fidelity® Diversified International Fund
Showing Percentage of Net Assets
| Common Stocks - 95.0% |
| | | Shares | Value ($) |
| Australia - 1.6% | | | |
| Aristocrat Leisure Ltd. | | 930,555 | 23,538,829 |
| Flutter Entertainment PLC (a) | | 207,974 | 41,597,246 |
| Glencore PLC | | 14,357,690 | 84,748,179 |
TOTAL AUSTRALIA | | | 149,884,254 |
| Belgium - 0.9% | | | |
| KBC Group NV | | 1,214,696 | 86,706,315 |
| Canada - 6.3% | | | |
| Alimentation Couche-Tard, Inc. Class A (multi-vtg.) | | 1,176,862 | 58,736,693 |
| Cameco Corp. | | 821,640 | 22,590,021 |
| Canadian Natural Resources Ltd. | | 2,105,494 | 128,301,719 |
| Canadian Pacific Kansas City Ltd. (b) | | 658,930 | 51,950,041 |
| Constellation Software, Inc. | | 51,531 | 100,860,565 |
| Franco-Nevada Corp. | | 382,011 | 57,964,957 |
| GFL Environmental, Inc. (b) | | 1,856,392 | 67,387,030 |
| Imperial Oil Ltd. | | 805,021 | 41,033,878 |
| Lumine Group, Inc. | | 155,431 | 2,093,675 |
| Thomson Reuters Corp. | | 337,124 | 44,331,116 |
| Tourmaline Oil Corp. | | 823,392 | 36,992,930 |
TOTAL CANADA | | | 612,242,625 |
| China - 1.9% | | | |
| Anta Sports Products Ltd. | | 2,678,400 | 33,282,408 |
| Chervon Holdings Ltd. | | 3,061,999 | 15,582,124 |
| Haier Smart Home Co. Ltd. (A Shares) | | 1,259,374 | 4,330,221 |
| Kweichow Moutai Co. Ltd. (A Shares) | | 103,955 | 26,524,588 |
| Li Ning Co. Ltd. | | 4,098,259 | 29,309,184 |
| NXP Semiconductors NV | | 403,455 | 66,061,722 |
| Shenzhen Inovance Technology Co. Ltd. (A Shares) | | 453,800 | 4,064,646 |
| Shenzhen Mindray Bio-Medical Electronics Co. Ltd. (A Shares) | | 98,000 | 4,430,553 |
| Sunny Optical Technology Group Co. Ltd. | | 343,676 | 3,631,731 |
TOTAL CHINA | | | 187,217,177 |
| Denmark - 3.6% | | | |
| Carlsberg A/S Series B | | 223,800 | 36,971,912 |
| DSV A/S | | 620,145 | 116,474,865 |
| Novo Nordisk A/S Series B | | 1,164,171 | 193,665,084 |
TOTAL DENMARK | | | 347,111,861 |
| France - 10.7% | | | |
| Air Liquide SA | | 216,146 | 38,882,554 |
| Airbus Group NV (b) | | 735,629 | 103,013,531 |
| AXA SA | | 2,045,201 | 66,755,710 |
| BNP Paribas SA | | 1,819,469 | 117,562,059 |
| Capgemini SA | | 516,295 | 93,812,510 |
| Edenred SA | | 367,789 | 23,878,314 |
| EssilorLuxottica SA | | 502,968 | 99,427,147 |
| Legrand SA | | 528,360 | 49,894,530 |
| LVMH Moet Hennessy Louis Vuitton SE | | 310,621 | 298,780,541 |
| Pernod Ricard SA | | 541,858 | 125,027,155 |
| Sartorius Stedim Biotech | | 53,552 | 14,309,670 |
| Teleperformance | | 39,679 | 7,904,990 |
TOTAL FRANCE | | | 1,039,248,711 |
| Germany - 5.9% | | | |
| Allianz SE | | 539,228 | 135,403,847 |
| Bayer AG | | 405,647 | 26,771,189 |
| Deutsche Borse AG | | 444,026 | 84,679,598 |
| Deutsche Post AG | | 1,865,086 | 89,709,886 |
| Hannover Reuck SE | | 272,987 | 58,235,727 |
| Infineon Technologies AG | | 244,701 | 8,911,221 |
| Merck KGaA | | 431,050 | 77,207,023 |
| Muenchener Rueckversicherungs-Gesellschaft AG in Muenchen | | 135,130 | 50,700,364 |
| Siemens Healthineers AG (c) | | 544,402 | 33,845,036 |
TOTAL GERMANY | | | 565,463,891 |
| Greece - 0.1% | | | |
| Piraeus Financial Holdings SA (a) | | 4,840,500 | 11,414,218 |
| Hong Kong - 2.5% | | | |
| AIA Group Ltd. | | 18,182,114 | 197,950,052 |
| Prudential PLC | | 1,408,151 | 21,546,175 |
| Techtronic Industries Co. Ltd. | | 2,096,502 | 22,680,985 |
TOTAL HONG KONG | | | 242,177,212 |
| India - 3.4% | | | |
| Axis Bank Ltd. | | 2,650,700 | 28,010,073 |
| Fairfax India Holdings Corp. (a)(c) | | 1,341,170 | 17,435,210 |
| HDFC Bank Ltd. | | 6,527,794 | 135,105,920 |
| Housing Development Finance Corp. Ltd. | | 2,637,447 | 89,957,529 |
| Reliance Industries Ltd. | | 1,959,546 | 58,254,348 |
TOTAL INDIA | | | 328,763,080 |
| Indonesia - 1.1% | | | |
| PT Bank Central Asia Tbk | | 82,277,170 | 50,917,352 |
| PT Bank Rakyat Indonesia (Persero) Tbk | | 144,586,315 | 50,385,330 |
TOTAL INDONESIA | | | 101,302,682 |
| Ireland - 0.9% | | | |
| CRH PLC | | 361,400 | 17,438,987 |
| Kingspan Group PLC (Ireland) | | 706,442 | 48,807,463 |
| Ryanair Holdings PLC sponsored ADR (a) | | 247,424 | 23,651,260 |
TOTAL IRELAND | | | 89,897,710 |
| Israel - 0.7% | | | |
| NICE Ltd. sponsored ADR (a) | | 313,791 | 64,016,502 |
| Italy - 1.3% | | | |
| FinecoBank SpA | | 3,554,341 | 53,773,934 |
| Reply SpA | | 77,713 | 9,034,171 |
| UniCredit SpA | | 3,136,629 | 62,153,809 |
TOTAL ITALY | | | 124,961,914 |
| Japan - 15.7% | | | |
| Bandai Namco Holdings, Inc. | | 424,647 | 9,646,035 |
| Daikin Industries Ltd. | | 257,888 | 46,840,474 |
| FUJIFILM Holdings Corp. | | 1,328,922 | 69,263,378 |
| Fujitsu Ltd. | | 206,048 | 27,461,524 |
| Hitachi Ltd. | | 2,512,632 | 138,985,325 |
| Hoya Corp. | | 1,398,673 | 146,657,916 |
| Itochu Corp. | | 2,945,975 | 97,732,308 |
| Keyence Corp. | | 247,942 | 111,811,006 |
| Minebea Mitsumi, Inc. | | 3,889,872 | 72,035,136 |
| Misumi Group, Inc. | | 1,678,452 | 42,342,657 |
| Nomura Research Institute Ltd. | | 1,048,003 | 26,367,282 |
| Olympus Corp. | | 1,065,292 | 18,649,446 |
| ORIX Corp. | | 3,385,617 | 57,597,888 |
| Persol Holdings Co. Ltd. | | 2,321,306 | 47,863,972 |
| Relo Group, Inc. | | 1,723,780 | 26,798,553 |
| Renesas Electronics Corp. (a) | | 722,367 | 9,414,211 |
| Seven & i Holdings Co. Ltd. | | 1,084,756 | 49,158,376 |
| Shin-Etsu Chemical Co. Ltd. | | 4,437,270 | 126,621,146 |
| SMC Corp. | | 165,307 | 82,446,011 |
| Sony Group Corp. | | 1,364,788 | 123,477,485 |
| Sumitomo Mitsui Financial Group, Inc. | | 1,523,133 | 62,255,987 |
| Suzuki Motor Corp. | | 637,017 | 22,211,813 |
| TIS, Inc. | | 1,411,261 | 38,752,838 |
| Tokyo Electron Ltd. | | 597,504 | 68,417,499 |
TOTAL JAPAN | | | 1,522,808,266 |
| Korea (South) - 0.8% | | | |
| Samsung Electronics Co. Ltd. | | 1,581,670 | 77,855,472 |
| Luxembourg - 0.5% | | | |
| Eurofins Scientific SA | | 681,669 | 47,516,551 |
| Netherlands - 5.7% | | | |
| Adyen BV (a)(c) | | 19,622 | 31,529,645 |
| Argenx SE (a) | | 89,248 | 34,427,256 |
| ASML Holding NV (depository receipt) | | 411,079 | 261,799,772 |
| BE Semiconductor Industries NV | | 169,699 | 15,209,875 |
| IMCD NV | | 500,460 | 75,108,426 |
| Wolters Kluwer NV | | 993,222 | 131,495,923 |
TOTAL NETHERLANDS | | | 549,570,897 |
| Singapore - 0.1% | | | |
| Sea Ltd. ADR (a) | | 111,684 | 8,506,970 |
| Spain - 1.9% | | | |
| Amadeus IT Holding SA Class A (a) | | 344,200 | 24,192,107 |
| Banco Santander SA (Spain) (b) | | 11,113,482 | 39,021,706 |
| CaixaBank SA (b) | | 13,733,556 | 50,836,223 |
| Industria de Diseno Textil SA (b) | | 2,097,933 | 72,032,957 |
TOTAL SPAIN | | | 186,082,993 |
| Sweden - 2.0% | | | |
| Indutrade AB | | 3,585,245 | 85,898,625 |
| Investor AB (B Shares) | | 4,536,799 | 97,238,767 |
| Kry International AB (a)(d)(e) | | 2,651 | 207,225 |
| Nibe Industrier AB (B Shares) | | 576,302 | 6,434,545 |
TOTAL SWEDEN | | | 189,779,162 |
| Switzerland - 1.7% | | | |
| Compagnie Financiere Richemont SA Series A | | 245,338 | 40,554,585 |
| Julius Baer Group Ltd. | | 200,349 | 14,282,305 |
| Sika AG | | 269,103 | 74,332,443 |
| Zurich Insurance Group Ltd. | | 79,428 | 38,369,984 |
TOTAL SWITZERLAND | | | 167,539,317 |
| Taiwan - 1.1% | | | |
| ECLAT Textile Co. Ltd. | | 654,000 | 10,407,694 |
| Taiwan Semiconductor Manufacturing Co. Ltd. sponsored ADR | | 1,187,413 | 100,098,916 |
TOTAL TAIWAN | | | 110,506,610 |
| United Kingdom - 12.4% | | | |
| AstraZeneca PLC (United Kingdom) | | 1,123,703 | 165,367,489 |
| B&M European Value Retail SA | | 11,949,938 | 72,041,752 |
| BAE Systems PLC | | 9,929,973 | 126,507,696 |
| Beazley PLC | | 3,886,655 | 29,087,517 |
| Big Yellow Group PLC | | 1,665,833 | 25,624,876 |
| Compass Group PLC | | 2,632,166 | 69,439,067 |
| Diageo PLC | | 2,279,426 | 103,978,546 |
| Entain PLC | | 1,381,863 | 25,077,317 |
| Games Workshop Group PLC | | 123,644 | 15,414,648 |
| Hiscox Ltd. | | 4,096,094 | 60,846,596 |
| JD Sports Fashion PLC | | 16,751,352 | 33,904,667 |
| Lloyds Banking Group PLC | | 39,363,803 | 23,914,369 |
| NatWest Group PLC | | 6,828,101 | 22,492,442 |
| RELX PLC: | | | |
| (Euronext N.V.) | | 4,540,137 | 150,683,642 |
| rights (a)(f) | | 4,540,137 | 2,195,369 |
| Rentokil Initial PLC | | 10,965,611 | 87,300,020 |
| S4 Capital PLC (a) | | 4,188,485 | 7,695,790 |
| Smith & Nephew PLC | | 3,703,989 | 61,003,827 |
| Standard Chartered PLC (United Kingdom) | | 4,382,426 | 34,609,846 |
| Starling Bank Ltd. Series D (a)(d)(e) | | 8,636,400 | 32,778,463 |
| WPP PLC | | 4,470,664 | 52,102,991 |
TOTAL UNITED KINGDOM | | | 1,202,066,930 |
| United States of America - 11.6% | | | |
| Aon PLC | | 149,883 | 48,738,954 |
| Booking Holdings, Inc. (a) | | 3,705 | 9,952,779 |
| Experian PLC | | 1,252,858 | 44,357,291 |
| Ferguson PLC | | 606,837 | 85,377,817 |
| ICON PLC (a) | | 224,804 | 43,317,483 |
| IQVIA Holdings, Inc. (a) | | 205,817 | 38,740,934 |
| Linde PLC | | 421,050 | 155,556,923 |
| Marsh & McLennan Companies, Inc. | | 466,082 | 83,983,316 |
| Marvell Technology, Inc. | | 1,252,536 | 49,450,121 |
| MasterCard, Inc. Class A | | 160,394 | 60,954,532 |
| Nestle SA (Reg. S) | | 1,793,479 | 230,084,657 |
| Roche Holding AG (participation certificate) | | 328,050 | 102,725,645 |
| S&P Global, Inc. | | 208,579 | 75,626,574 |
| Schlumberger Ltd. | | 1,914,554 | 94,483,240 |
TOTAL UNITED STATES OF AMERICA | | | 1,123,350,266 |
| Zambia - 0.6% | | | |
| First Quantum Minerals Ltd. | | 2,207,645 | 53,641,121 |
| TOTAL COMMON STOCKS (Cost $6,229,104,851) | | | 9,189,632,707 |
| | | | |
| Preferred Stocks - 0.4% |
| | | Shares | Value ($) |
| Convertible Preferred Stocks - 0.4% | | | |
| Estonia - 0.1% | | | |
| Bolt Technology OU Series E (a)(d)(e) | | 79,275 | 10,332,127 |
| United States of America - 0.3% | | | |
| Wasabi Holdings, Inc. Series C (a)(d)(e) | | 2,976,172 | 28,601,013 |
TOTAL CONVERTIBLE PREFERRED STOCKS | | | 38,933,140 |
| Nonconvertible Preferred Stocks - 0.0% | | | |
| Sweden - 0.0% | | | |
| Kry International AB Series E (a)(d)(e) | | 15,316 | 1,197,233 |
| TOTAL PREFERRED STOCKS (Cost $59,932,348) | | | 40,130,373 |
| | | | |
| Money Market Funds - 5.9% |
| | | Shares | Value ($) |
| Fidelity Cash Central Fund 4.88% (g) | | 363,493,113 | 363,565,811 |
| Fidelity Securities Lending Cash Central Fund 4.88% (g)(h) | | 208,813,348 | 208,834,229 |
| TOTAL MONEY MARKET FUNDS (Cost $572,399,084) | | | 572,400,040 |
| | | | |
| TOTAL INVESTMENT IN SECURITIES - 101.3% (Cost $6,861,436,283) | 9,802,163,120 |
NET OTHER ASSETS (LIABILITIES) - (1.3)% | (125,997,001) |
| NET ASSETS - 100.0% | 9,676,166,119 |
| | |
Legend
| (b) | Security or a portion of the security is on loan at period end. |
| (c) | Security exempt from registration under Rule 144A of the Securities Act of 1933. These securities may be resold in transactions exempt from registration, normally to qualified institutional buyers. At the end of the period, the value of these securities amounted to $82,809,891 or 0.9% of net assets. |
| (d) | Restricted securities (including private placements) - Investment in securities not registered under the Securities Act of 1933 (excluding 144A issues). At the end of the period, the value of restricted securities (excluding 144A issues) amounted to $73,116,061 or 0.8% of net assets. |
| (f) | Security or a portion of the security purchased on a delayed delivery or when-issued basis. |
| (g) | Affiliated fund that is generally available only to investment companies and other accounts managed by Fidelity Investments. The rate quoted is the annualized seven-day yield of the fund at period end. A complete unaudited listing of the fund's holdings as of its most recent quarter end is available upon request. In addition, each Fidelity Central Fund's financial statements are available on the SEC's website or upon request. |
| (h) | Investment made with cash collateral received from securities on loan. |
| Additional information on each restricted holding is as follows: |
| Security | Acquisition Date | Acquisition Cost ($) |
| Bolt Technology OU Series E | 1/03/22 | 20,595,368 |
| | | |
| Kry International AB | 5/14/21 | 1,151,345 |
| | | |
| Kry International AB Series E | 5/14/21 | 7,002,062 |
| | | |
| Starling Bank Ltd. Series D | 6/18/21 | 15,440,896 |
| | | |
| Wasabi Holdings, Inc. Series C | 3/31/21 | 32,334,918 |
| | | |
Affiliated Central Funds
Fiscal year to date information regarding the Fund's investments in Fidelity Central Funds, including the ownership percentage, is presented below.
| Affiliate | Value, beginning of period ($) | Purchases ($) | Sales Proceeds ($) | Dividend Income ($) | Realized Gain (loss) ($) | Change in Unrealized appreciation (depreciation) ($) | Value, end of period ($) | % ownership, end of period |
| Fidelity Cash Central Fund 4.88% | 378,167,562 | 514,375,749 | 528,977,499 | 5,262,880 | - | (1) | 363,565,811 | 0.9% |
| Fidelity Securities Lending Cash Central Fund 4.88% | 172,610,171 | 923,002,480 | 886,778,422 | 420,772 | - | - | 208,834,229 | 0.6% |
| Total | 550,777,733 | 1,437,378,229 | 1,415,755,921 | 5,683,652 | - | (1) | 572,400,040 | |
| | | | | | | | | |
Amounts in the dividend income column in the above table include any capital gain distributions from underlying funds, which are presented in the corresponding line item in the Statement of Operations, if applicable.
Amounts in the dividend income column for Fidelity Securities Lending Cash Central Fund represents the income earned on investing cash collateral, less rebates paid to borrowers and any lending agent fees associated with the loan, plus any premium payments received for lending certain types of securities.
Amounts included in the purchases and sales proceeds columns may include in-kind transactions, if applicable.
Investment Valuation
The following is a summary of the inputs used, as of April 30, 2023, involving the Fund's assets and liabilities carried at fair value. The inputs or methodology used for valuing securities may not be an indication of the risk associated with investing in those securities. For more information on valuation inputs, and their aggregation into the levels used below, please refer to the Investment Valuation section in the accompanying Notes to Financial Statements.
| Valuation Inputs at Reporting Date: |
| Description | Total ($) | Level 1 ($) | Level 2 ($) | Level 3 ($) |
Investments in Securities: | | | | |
|
| Equities: | | | | |
Communication Services | 68,305,751 | 16,202,760 | 52,102,991 | - |
Consumer Discretionary | 974,773,459 | 270,021,366 | 704,752,093 | - |
Consumer Staples | 630,481,927 | 220,735,760 | 409,746,167 | - |
Energy | 381,656,136 | 323,401,788 | 58,254,348 | - |
Financials | 2,206,736,650 | 884,904,179 | 1,289,054,008 | 32,778,463 |
Health Care | 1,108,062,249 | 354,363,844 | 753,698,405 | - |
Industrials | 1,953,475,580 | 945,400,273 | 1,008,075,307 | - |
Information Technology | 1,244,661,589 | 762,437,829 | 441,886,162 | 40,337,598 |
Materials | 609,186,310 | 267,163,001 | 342,023,309 | - |
Real Estate | 52,423,429 | 25,624,876 | 26,798,553 | - |
|
| Money Market Funds | 572,400,040 | 572,400,040 | - | - |
| Total Investments in Securities: | 9,802,163,120 | 4,642,655,716 | 5,086,391,343 | 73,116,061 |
Fidelity® Diversified International Fund
| Statement of Assets and Liabilities |
| | | | April 30, 2023 (Unaudited) |
| | | | | |
| Assets | | | | |
| Investment in securities, at value (including securities loaned of $195,697,226) - See accompanying schedule: | | | | |
Unaffiliated issuers (cost $6,289,037,199) | $ | 9,229,763,080 | | |
Fidelity Central Funds (cost $572,399,084) | | 572,400,040 | | |
| | | | | |
| | | | | |
| Total Investment in Securities (cost $6,861,436,283) | | | $ | 9,802,163,120 |
| Foreign currency held at value (cost $14,197,037) | | | | 14,325,283 |
| Receivable for investments sold | | | | 88,275,400 |
| Receivable for fund shares sold | | | | 2,351,924 |
| Dividends receivable | | | | 25,731,774 |
| Reclaims receivable | | | | 31,437,816 |
| Distributions receivable from Fidelity Central Funds | | | | 1,455,951 |
| Prepaid expenses | | | | 3,661 |
| Other receivables | | | | 1,323,466 |
Total assets | | | | 9,967,068,395 |
| Liabilities | | | | |
| Payable for investments purchased | | | | |
Regular delivery | $ | 53,937,888 | | |
Delayed delivery | | 2,195,374 | | |
| Payable for fund shares redeemed | | 4,882,889 | | |
| Accrued management fee | | 3,130,310 | | |
| Other affiliated payables | | 1,200,674 | | |
| Other payables and accrued expenses | | 16,720,912 | | |
| Collateral on securities loaned | | 208,834,229 | | |
| Total Liabilities | | | | 290,902,276 |
| Net Assets | | | $ | 9,676,166,119 |
| Net Assets consist of: | | | | |
| Paid in capital | | | $ | 6,533,809,036 |
| Total accumulated earnings (loss) | | | | 3,142,357,083 |
| Net Assets | | | $ | 9,676,166,119 |
| | | | | |
| Net Asset Value and Maximum Offering Price | | | | |
| Diversified International : | | | | |
Net Asset Value , offering price and redemption price per share ($8,192,295,174 ÷ 202,573,990 shares) | | | $ | 40.44 |
| Class K : | | | | |
Net Asset Value , offering price and redemption price per share ($1,483,870,945 ÷ 36,768,383 shares) | | | $ | 40.36 |
| Statement of Operations |
| | | | Six months ended April 30, 2023 (Unaudited) |
| Investment Income | | | | |
| Dividends | | | $ | 93,173,469 |
| Foreign Tax Reclaims | | | | 5,671,639 |
| Income from Fidelity Central Funds (including $420,772 from security lending) | | | | 5,683,652 |
| Income before foreign taxes withheld | | | $ | 104,528,760 |
| Less foreign taxes withheld | | | | (15,835,491) |
| Total Income | | | | 88,693,269 |
| Expenses | | | | |
| Management fee | | | | |
| Basic fee | $ | 30,482,799 | | |
| Performance adjustment | | (4,936,387) | | |
| Transfer agent fees | | 6,365,304 | | |
| Accounting fees | | 837,418 | | |
| Custodian fees and expenses | | 347,892 | | |
| Independent trustees' fees and expenses | | 31,005 | | |
| Registration fees | | 63,177 | | |
| Audit | | 92,780 | | |
| Legal | | 7,201 | | |
| Miscellaneous | | 20,094 | | |
| Total expenses before reductions | | 33,311,283 | | |
| Expense reductions | | (216,043) | | |
| Total expenses after reductions | | | | 33,095,240 |
| Net Investment income (loss) | | | | 55,598,029 |
| Realized and Unrealized Gain (Loss) | | | | |
| Net realized gain (loss) on: | | | | |
| Investment Securities: | | | | |
| Unaffiliated issuers (net of foreign taxes of $2,472,713) | | 187,590,971 | | |
| Redemptions in-kind | | 52,451,555 | | |
| Foreign currency transactions | | 153,501 | | |
| Total net realized gain (loss) | | | | 240,196,027 |
| Change in net unrealized appreciation (depreciation) on: | | | | |
| Investment Securities: | | | | |
| Unaffiliated issuers (net of decrease in deferred foreign taxes of $525,603) | | 1,417,491,652 | | |
| Fidelity Central Funds | | (1) | | |
| Assets and liabilities in foreign currencies | | 3,628,842 | | |
| Total change in net unrealized appreciation (depreciation) | | | | 1,421,120,493 |
| Net gain (loss) | | | | 1,661,316,520 |
| Net increase (decrease) in net assets resulting from operations | | | $ | 1,716,914,549 |
| Statement of Changes in Net Assets |
| |
| | Six months ended April 30, 2023 (Unaudited) | | Year ended October 31, 2022 |
| Increase (Decrease) in Net Assets | | | | |
| Operations | | | | |
| Net investment income (loss) | $ | 55,598,029 | $ | 92,319,482 |
| Net realized gain (loss) | | 240,196,027 | | 665,262,947 |
| Change in net unrealized appreciation (depreciation) | | 1,421,120,493 | | (4,726,389,174) |
| Net increase (decrease) in net assets resulting from operations | | 1,716,914,549 | | (3,968,806,745) |
| Distributions to shareholders | | (123,021,624) | | (1,395,065,915) |
| Share transactions - net increase (decrease) | | (545,101,274) | | (845,248,874) |
| Total increase (decrease) in net assets | | 1,048,791,651 | | (6,209,121,534) |
| | | | | |
| Net Assets | | | | |
| Beginning of period | | 8,627,374,468 | | 14,836,496,002 |
| End of period | $ | 9,676,166,119 | $ | 8,627,374,468 |
| | | | | |
| | | | | |
Financial Highlights
| Fidelity® Diversified International Fund |
| |
| | Six months ended (Unaudited) April 30, 2023 | | Years ended October 31, 2022 | | 2021 | | 2020 | | 2019 | | 2018 |
Selected Per-Share Data | | | | | | | | | | | | |
| Net asset value, beginning of period | $ | 33.99 | $ | 53.38 | $ | 41.61 | $ | 38.67 | $ | 35.72 | $ | 41.39 |
| Income from Investment Operations | | | | | | | | | | | | |
Net investment income (loss) A,B | | .22 | | .33 | | .16 | | .10 | | .50 | | .50 |
| Net realized and unrealized gain (loss) | | 6.72 | | (14.58) | | 12.07 | | 3.37 | | 4.77 | | (4.05) |
| Total from investment operations | | 6.94 | | (14.25) | | 12.23 | | 3.47 | | 5.27 | | (3.55) |
| Distributions from net investment income | | (.14) | | (.57) | | (.02) | | (.53) | | (.43) | | (.43) |
| Distributions from net realized gain | | (.35) | | (4.57) | | (.45) | | - | | (1.89) | | (1.69) |
| Total distributions | | (.49) | | (5.14) | | (.46) C | | (.53) | | (2.32) | | (2.12) |
| Net asset value, end of period | $ | 40.44 | $ | 33.99 | $ | 53.38 | $ | 41.61 | $ | 38.67 | $ | 35.72 |
Total Return D,E | | 20.53% | | (29.36)% | | 29.58% | | 9.07% | | 16.02% | | (9.05)% |
Ratios to Average Net Assets B,F,G | | | | | | | | | | | | |
| Expenses before reductions | | .73% H | | .99% | | 1.01% | | 1.05% | | .75% | | .81% |
| Expenses net of fee waivers, if any | | .72% H | | .99% | | 1.01% | | 1.05% | | .75% | | .80% |
| Expenses net of all reductions | | .72% H | | .99% | | 1.01% | | 1.04% | | .75% | | .79% |
| Net investment income (loss) | | 1.17% H | | .80% | | .32% | | .26% | | 1.42% | | 1.27% |
| Supplemental Data | | | | | | | | | | | | |
| Net assets, end of period (000 omitted) | $ | 8,192,295 | $ | 7,230,515 | $ | 11,529,722 | $ | 9,419,192 | $ | 8,734,682 | $ | 9,275,299 |
Portfolio turnover rate I,J | | 21% H | | 20% | | 29% | | 29% | | 37% | | 30% |
A Calculated based on average shares outstanding during the period.
B Net investment income (loss) is affected by the timing of the declaration of dividends by any underlying mutual funds or exchange-traded funds (ETFs). Net investment income (loss) of any mutual funds or ETFs is not included in the Fund's net investment income (loss) ratio.
C Total distributions per share do not sum due to rounding.
D Total returns for periods of less than one year are not annualized.
E Total returns would have been lower if certain expenses had not been reduced during the applicable periods shown.
F Fees and expenses of any underlying mutual funds or exchange-traded funds (ETFs) are not included in the Fund's expense ratio. The Fund indirectly bears its proportionate share of these expenses. For additional expense information related to investments in Fidelity Central Funds, please refer to the "Investments in Fidelity Central Funds" note found in the Notes to Financial Statements section of the most recent Annual or Semi-Annual report.
G Expense ratios reflect operating expenses of the class. Expenses before reductions do not reflect amounts reimbursed, waived, or reduced through arrangements with the investment adviser, brokerage services, or other offset arrangements, if applicable, and do not represent the amount paid by the class during periods when reimbursements, waivers or reductions occur.
H Annualized.
I Amount does not include the portfolio activity of any underlying mutual funds or exchange-traded funds (ETFs).
J Portfolio turnover rate excludes securities received or delivered in-kind.
| Fidelity® Diversified International Fund Class K |
| |
| | Six months ended (Unaudited) April 30, 2023 | | Years ended October 31, 2022 | | 2021 | | 2020 | | 2019 | | 2018 |
Selected Per-Share Data | | | | | | | | | | | | |
| Net asset value, beginning of period | $ | 33.94 | $ | 53.32 | $ | 41.56 | $ | 38.61 | $ | 35.68 | $ | 41.35 |
| Income from Investment Operations | | | | | | | | | | | | |
Net investment income (loss) A,B | | .24 | | .38 | | .21 | | .15 | | .55 | | .55 |
| Net realized and unrealized gain (loss) | | 6.72 | | (14.58) | | 12.06 | | 3.37 | | 4.74 | | (4.05) |
| Total from investment operations | | 6.96 | | (14.20) | | 12.27 | | 3.52 | | 5.29 | | (3.50) |
| Distributions from net investment income | | (.19) | | (.62) | | (.06) | | (.57) | | (.47) | | (.48) |
| Distributions from net realized gain | | (.35) | | (4.57) | | (.45) | | - | | (1.89) | | (1.69) |
| Total distributions | | (.54) | | (5.18) C | | (.51) | | (.57) | | (2.36) | | (2.17) |
| Net asset value, end of period | $ | 40.36 | $ | 33.94 | $ | 53.32 | $ | 41.56 | $ | 38.61 | $ | 35.68 |
Total Return D,E | | 20.63% | | (29.31)% | | 29.71% | | 9.22% | | 16.14% | | (8.95)% |
Ratios to Average Net Assets B,F,G | | | | | | | | | | | | |
| Expenses before reductions | | .62% H | | .88% | | .91% | | .94% | | .63% | | .69% |
| Expenses net of fee waivers, if any | | .61% H | | .88% | | .91% | | .94% | | .63% | | .69% |
| Expenses net of all reductions | | .61% H | | .88% | | .91% | | .93% | | .63% | | .67% |
| Net investment income (loss) | | 1.28% H | | .91% | | .42% | | .38% | | 1.54% | | 1.39% |
| Supplemental Data | | | | | | | | | | | | |
| Net assets, end of period (000 omitted) | $ | 1,483,871 | $ | 1,396,859 | $ | 3,306,774 | $ | 3,761,267 | $ | 4,246,651 | $ | 4,998,889 |
Portfolio turnover rate I,J | | 21% H | | 20% | | 29% | | 29% | | 37% | | 30% |
A Calculated based on average shares outstanding during the period.
B Net investment income (loss) is affected by the timing of the declaration of dividends by any underlying mutual funds or exchange-traded funds (ETFs). Net investment income (loss) of any mutual funds or ETFs is not included in the Fund's net investment income (loss) ratio.
C Total distributions per share do not sum due to rounding.
D Total returns for periods of less than one year are not annualized.
E Total returns would have been lower if certain expenses had not been reduced during the applicable periods shown.
F Fees and expenses of any underlying mutual funds or exchange-traded funds (ETFs) are not included in the Fund's expense ratio. The Fund indirectly bears its proportionate share of these expenses. For additional expense information related to investments in Fidelity Central Funds, please refer to the "Investments in Fidelity Central Funds" note found in the Notes to Financial Statements section of the most recent Annual or Semi-Annual report.
G Expense ratios reflect operating expenses of the class. Expenses before reductions do not reflect amounts reimbursed, waived, or reduced through arrangements with the investment adviser, brokerage services, or other offset arrangements, if applicable, and do not represent the amount paid by the class during periods when reimbursements, waivers or reductions occur.
H Annualized.
I Amount does not include the portfolio activity of any underlying mutual funds or exchange-traded funds (ETFs).
J Portfolio turnover rate excludes securities received or delivered in-kind.
For the period ended April 30, 2023
1. Organization.
Fidelity Diversified International Fund (the Fund) is a fund of Fidelity Investment Trust (the Trust) and is authorized to issue an unlimited number of shares. The Trust is registered under the Investment Company Act of 1940, as amended (the 1940 Act), as an open-end management investment company organized as a Massachusetts business trust. The Fund offers Diversified International and Class K shares, each of which has equal rights as to assets and voting privileges. Each class has exclusive voting rights with respect to matters that affect that class. The Fund's investments in emerging markets can be subject to social, economic, regulatory, and political uncertainties and can be extremely volatile.
2. Investments in Fidelity Central Funds.
Funds may invest in Fidelity Central Funds, which are open-end investment companies generally available only to other investment companies and accounts managed by the investment adviser and its affiliates. The Schedule of Investments lists any Fidelity Central Funds held as an investment as of period end, but does not include the underlying holdings of each Fidelity Central Fund. An investing fund indirectly bears its proportionate share of the expenses of the underlying Fidelity Central Funds.
Based on its investment objective, each Fidelity Central Fund may invest or participate in various investment vehicles or strategies that are similar to those of the investing fund. These strategies are consistent with the investment objectives of the investing fund and may involve certain economic risks which may cause a decline in value of each of the Fidelity Central Funds and thus a decline in the value of the investing fund.
| Fidelity Central Fund | Investment Manager | Investment Objective | Investment Practices | Expense Ratio A |
| Fidelity Money Market Central Funds | Fidelity Management & Research Company LLC (FMR) | Each fund seeks to obtain a high level of current income consistent with the preservation of capital and liquidity. | Short-term Investments | Less than .005% |
A Expenses expressed as a percentage of average net assets and are as of each underlying Central Fund's most recent annual or semi-annual shareholder report.
A complete unaudited list of holdings for each Fidelity Central Fund is available upon request or at the Securities and Exchange Commission website at www.sec.gov. In addition, the financial statements of the Fidelity Central Funds which contain the significant accounting policies (including investment valuation policies) of those funds, and are not covered by the Report of Independent Registered Public Accounting Firm, are available on the Securities and Exchange Commission website or upon request.
3. Significant Accounting Policies.
The Fund is an investment company and applies the accounting and reporting guidance of the Financial Accounting Standards Board (FASB) Accounting Standards Codification Topic 946 Financial Services - Investment Companies . The financial statements have been prepared in conformity with accounting principles generally accepted in the United States of America (GAAP), which require management to make certain estimates and assumptions at the date of the financial statements. Actual results could differ from those estimates. Subsequent events, if any, through the date that the financial statements were issued have been evaluated in the preparation of the financial statements. The Fund's Schedule of Investments lists any underlying mutual funds or exchange-traded funds (ETFs) but does not include the underlying holdings of these funds. The following summarizes the significant accounting policies of the Fund:
Investment Valuation. Investments are valued as of 4:00 p.m. Eastern time on the last calendar day of the period. The Board of Trustees (the Board) has designated the Fund's investment adviser as the valuation designee responsible for the fair valuation function and performing fair value determinations as needed. The investment adviser has established a Fair Value Committee (the Committee) to carry out the day-to-day fair valuation responsibilities and has adopted policies and procedures to govern the fair valuation process and the activities of the Committee. In accordance with these fair valuation policies and procedures, which have been approved by the Board, the Fund attempts to obtain prices from one or more third party pricing services or brokers to value its investments. When current market prices, quotations or currency exchange rates are not readily available or reliable, investments will be fair valued in good faith by the Committee, in accordance with the policies and procedures. Factors used in determining fair value vary by investment type and may include market or investment specific events, transaction data, estimated cash flows, and market observations of comparable investments. The frequency that the fair valuation procedures are used cannot be predicted and they may be utilized to a significant extent. The Committee manages the Fund's fair valuation practices and maintains the fair valuation policies and procedures. The Fund's investment adviser reports to the Board information regarding the fair valuation process and related material matters.
The Fund categorizes the inputs to valuation techniques used to value its investments into a disclosure hierarchy consisting of three levels as shown below:
Level 1 - unadjusted quoted prices in active markets for identical investments
Level 2 - other significant observable inputs (including quoted prices for similar investments, interest rates, prepayment speeds, etc.)
Level 3 - unobservable inputs (including the Fund's own assumptions based on the best information available)
Valuation techniques used to value the Fund's investments by major category are as follows:
Equity securities, including restricted securities, for which market quotations are readily available, are valued at the last reported sale price or official closing price as reported by a third party pricing service on the primary market or exchange on which they are traded and are categorized as Level 1 in the hierarchy. In the event there were no sales during the day or closing prices are not available, securities are valued at the last quoted bid price or may be valued using the last available price and are generally categorized as Level 2 in the hierarchy. For foreign equity securities, when market or security specific events arise, comparisons to the valuation of American Depositary Receipts (ADRs), futures contracts, Exchange-Traded Funds (ETFs) and certain indexes as well as quoted prices for similar securities may be used and would be categorized as Level 2 in the hierarchy. For equity securities, including restricted securities, where observable inputs are limited, assumptions about market activity and risk are used and these securities may be categorized as Level 3 in the hierarchy.
Investments in open-end mutual funds, including the Fidelity Central Funds, are valued at their closing net asset value (NAV) each business day and are categorized as Level 1 in the hierarchy.
Changes in valuation techniques may result in transfers in or out of an assigned level within the disclosure hierarchy. The aggregate value of investments by input level as of April 30, 2023 is included at the end of the Fund's Schedule of Investments.
Foreign Currency. Foreign-denominated assets, including investment securities, and liabilities are translated into U.S. dollars at the exchange rates at period end. Purchases and sales of investment securities, income and dividends received, and expenses denominated in foreign currencies are translated into U.S. dollars at the exchange rate in effect on the transaction date.
The effects of exchange rate fluctuations on investments are included with the net realized and unrealized gain (loss) on investment securities. Other foreign currency transactions resulting in realized and unrealized gain (loss) are disclosed separately.
Realized gains and losses on foreign currency transactions arise from the disposition of foreign currency, realized changes in the value of foreign currency between the trade and settlement dates on security transactions, and the difference between the amounts of dividends, interest and foreign withholding taxes recorded on transaction date and the U.S. dollar equivalent of the amounts actually received or paid. Unrealized gains and losses on assets and liabilities in foreign currencies arise from changes in the value of foreign currency, and from assets and liabilities denominated in foreign currencies, other than investments, which are held at period end.
Investment Transactions and Income. For financial reporting purposes, the Fund's investment holdings and NAV include trades executed through the end of the last business day of the period. The NAV per share for processing shareholder transactions is calculated as of the close of business of the New York Stock Exchange (NYSE), normally 4:00 p.m. Eastern time and includes trades executed through the end of the prior business day. Gains and losses on securities sold are determined on the basis of identified cost and include proceeds received from litigation. Commissions paid to certain brokers with whom the investment adviser, or its affiliates, places trades on behalf of a fund include an amount in addition to trade execution, which may be rebated back to a fund. Any such rebates are included in net realized gain (loss) on investments in the Statement of Operations. Dividend income is recorded on the ex-dividend date, except for certain dividends from foreign securities where the ex-dividend date may have passed, which are recorded as soon as the Fund is informed of the ex-dividend date. Non-cash dividends included in dividend income, if any, are recorded at the fair market value of the securities received. Income and capital gain distributions from Fidelity Central Funds, if any, are recorded on the ex-dividend date. Investment income is recorded net of foreign taxes withheld where recovery of such taxes is uncertain. Funds may file withholding tax reclaims in certain jurisdictions to recover a portion of amounts previously withheld. Any withholding tax reclaims income is included in the Statement of Operations in foreign tax reclaims. Any receivables for withholding tax reclaims are included in the Statement of Assets and Liabilities in reclaims receivable.
Class Allocations and Expenses. Investment income, realized and unrealized capital gains and losses, common expenses of a fund, and certain fund-level expense reductions, if any, are allocated daily on a pro-rata basis to each class based on the relative net assets of each class to the total net assets of a fund. Each class differs with respect to transfer agent and distribution and service plan fees incurred, as applicable. Certain expense reductions may also differ by class, if applicable. For the reporting period, the allocated portion of income and expenses to each class as a percent of its average net assets may vary due to the timing of recording these transactions in relation to fluctuating net assets of the classes. Expenses directly attributable to a fund are charged to that fund. Expenses attributable to more than one fund are allocated among the respective funds on the basis of relative net assets or other appropriate methods. Expenses included in the accompanying financial statements reflect the expenses of that fund and do not include any expenses associated with any underlying mutual funds or exchange-traded funds. Although not included in a fund's expenses, a fund indirectly bears its proportionate share of these expenses through the net asset value of each underlying mutual fund or exchange-traded fund. Expense estimates are accrued in the period to which they relate and adjustments are made when actual amounts are known.
Deferred Trustee Compensation. Under a Deferred Compensation Plan (the Plan) for certain Funds, certain independent Trustees have elected to defer receipt of a portion of their annual compensation. Deferred amounts are invested in affiliated mutual funds, are marked-to-market and remain in a fund until distributed in accordance with the Plan. The investment of deferred amounts and the offsetting payable to the Trustees presented below are included in the accompanying Statement of Assets and Liabilities in other receivables and other payables and accrued expenses, as applicable.
| Fidelity Diversified International Fund | $1,154,427 |
Income Tax Information and Distributions to Shareholders. Each year, the Fund intends to qualify as a regulated investment company under Subchapter M of the Internal Revenue Code, including distributing substantially all of its taxable income and realized gains. As a result, no provision for U.S. Federal income taxes is required. The Fund files a U.S. federal tax return, in addition to state and local tax returns as required. The Fund's federal income tax returns are subject to examination by the Internal Revenue Service (IRS) for a period of three fiscal years after they are filed. State and local tax returns may be subject to examination for an additional fiscal year depending on the jurisdiction. Foreign taxes are provided for based on the Fund's understanding of the tax rules and rates that exist in the foreign markets in which it invests. The Fund is subject to a tax imposed on capital gains by certain countries in which it invests. An estimated deferred tax liability for net unrealized appreciation on the applicable securities is included in Other payables and accrued expenses on the Statement of Assets & Liabilities.
Distributions are declared and recorded on the ex-dividend date. Income and capital gain distributions are declared separately for each class. Income and capital gain distributions are determined in accordance with income tax regulations, which may differ from GAAP.
Capital accounts within the financial statements are adjusted for permanent book-tax differences. These adjustments have no impact on net assets or the results of operations. Capital accounts are not adjusted for temporary book-tax differences which will reverse in a subsequent period.
Book-tax differences are primarily due to foreign currency transactions, certain foreign taxes, passive foreign investment companies (PFIC), redemptions in kind, deferred trustees compensation and losses deferred due to wash sales.
As of period end, the cost and unrealized appreciation (depreciation) in securities, and derivatives if applicable, for federal income tax purposes were as follows:
| Gross unrealized appreciation | $3,067,327,170 |
| Gross unrealized depreciation | (196,677,784) | |
| Net unrealized appreciation (depreciation) | $2,870,649,386 | |
| Tax cost | $6,931,513,734 | |
| | | |
Delayed Delivery Transactions and When-Issued Securities. During the period, certain Funds transacted in securities on a delayed delivery or when-issued basis. Payment and delivery may take place after the customary settlement period for that security. The price of the underlying securities and the date when the securities will be delivered and paid for are fixed at the time the transaction is negotiated. Securities purchased on a delayed delivery or when-issued basis are identified as such in the Schedule of Investments. Compensation for interest forgone in the purchase of a delayed delivery or when-issued debt security may be received. With respect to purchase commitments, each applicable Fund identifies securities as segregated in its records with a value at least equal to the amount of the commitment. Payables and receivables associated with the purchases and sales of delayed delivery securities having the same coupon, settlement date and broker are offset. Delayed delivery or when-issued securities that have been purchased from and sold to different brokers are reflected as both payables and receivables in the Statement of Assets and Liabilities under the caption "Delayed delivery", as applicable. Losses may arise due to changes in the value of the underlying securities or if the counterparty does not perform under the contract's terms, or if the issuer does not issue the securities due to political, economic, or other factors.
Restricted Securities (including Private Placements). Funds may invest in securities that are subject to legal or contractual restrictions on resale. These securities generally may be resold in transactions exempt from registration or to the public if the securities are registered. Disposal of these securities may involve time-consuming negotiations and expense, and prompt sale at an acceptable price may be difficult. Information regarding restricted securities held at period end is included at the end of the Schedule of Investments, if applicable.
4. Purchases and Sales of Investments.
Purchases and sales of securities, other than short-term securities and in-kind transactions, as applicable, are noted in the table below.
| | Purchases ($) | Sales ($) |
| Fidelity Diversified International Fund | 969,010,966 | 1,493,166,881 |
Unaffiliated Redemptions In-Kind. Shares that were redeemed in-kind for investments, including accrued interest and cash, if any, are shown in the table below. The net realized gain or loss on investments delivered through in-kind redemptions is included in the "Net realized gain (loss) on: Redemptions in-kind" line in the accompanying Statement of Operations. The amount of the in-kind redemptions is included in share transactions in the accompanying Statement of Changes in Net Assets. There was no gain or loss for federal income tax purposes.
| | Shares | Total net realized gain or loss ($) | Total Proceeds ($) | Participating classes |
| Fidelity Diversified International Fund | 4,099,739 | 52,451,555 | 151,408,332 | Diversified International and Class K |
Prior Fiscal Year Unaffiliated Redemptions In-Kind. Shares that were redeemed in-kind for investments, including accrued interest and cash, if any, are shown in the table below; along with realized gain or loss on investments delivered through in-kind redemptions. The amount of the in-kind redemptions is included in share transactions in the accompanying Statement of Changes in Net Assets. There was no gain or loss for federal income tax purposes.
| | Shares | Total net realized gain or loss ($) | Total Proceeds ($) | Participating classes |
| Fidelity Diversified International Fund | 26,571,800 | 431,418,900 | 1,092,083,654 | Diversified International and Class K |
5.Fees and Other Transactions with Affiliates.
Management Fee. Fidelity Management & Research Company LLC (the investment adviser) and its affiliates provide the Fund with investment management related services for which the Fund pays a monthly management fee. The management fee is the sum of an individual fund fee rate that is based on an annual rate of .424% of the Fund's average net assets and an annualized group fee rate that averaged .23% during the period. The group fee rate is based upon the monthly average net assets of a group of registered investment companies with which the investment adviser has management contracts. The group fee rate decreases as assets under management increase and increases as assets under management decrease. In addition, the management fee is subject to a performance adjustment (up to a maximum of +/- .20% of the Fund's average net assets over a 36 month performance period). The upward or downward adjustment to the management fee is based on the relative investment performance of the Fund as compared to its benchmark index, the MSCI EAFE Index, over the same 36 month performance period. For the reporting period, the total annualized management fee rate, including the performance adjustment, was .55% of the Fund's average net assets. The performance adjustment included in the management fee rate may be higher or lower than the maximum performance adjustment rate due to the difference between the average net assets for the reporting and performance periods.
Transfer Agent Fees. Fidelity Investments Institutional Operations Company LLC (FIIOC), an affiliate of the investment adviser, is the transfer, dividend disbursing and shareholder servicing agent for each class of the Fund. FIIOC receives account fees and asset-based fees that vary according to the account size and type of account of the shareholders of the respective classes of the Fund, except for Class K. FIIOC receives an asset-based fee of Class K's average net assets. FIIOC pays for typesetting, printing and mailing of shareholder reports, except proxy statements.
For the period, transfer agent fees for each class were as follows:
| | Amount | % of Class-Level Average Net Assets A |
| Diversified International | $6,055,849 | .15 |
| Class K | 309,455 | .04 |
| | $6,365,304 | |
A Annualized
Accounting Fees. Fidelity Service Company, Inc. (FSC), an affiliate of the investment adviser, maintains the Fund's accounting records. The accounting fee is based on the level of average net assets for each month. For the period, the fees were equivalent to the following annualized rates:
| | % of Average Net Assets |
| Fidelity Diversified International Fund | .02 |
Brokerage Commissions. A portion of portfolio transactions were placed with brokerage firms which are affiliates of the investment adviser. Brokerage commissions are included in net realized gain (loss) and change in net unrealized appreciation (depreciation) in the Statement of Operations. The commissions paid to these affiliated firms were as follows:
| | Amount |
| Fidelity Diversified International Fund | $1,809 |
Interfund Trades. Funds may purchase from or sell securities to other Fidelity Funds under procedures adopted by the Board. The procedures have been designed to ensure these interfund trades are executed in accordance with Rule 17a-7 of the 1940 Act. Any interfund trades are included within the respective purchases and sales amounts shown in the Purchases and Sales of Investments note. Interfund trades during the period are noted in the table below.
| | Purchases ($) | Sales ($) | Realized Gain (Loss) ($) |
| Fidelity Diversified International Fund | 28,834,796 | 57,684,876 | 8,888,189 |
6. Committed Line of Credit.
Certain Funds participate with other funds managed by the investment adviser or an affiliate in a $4.25 billion credit facility (the "line of credit") to be utilized for temporary or emergency purposes to fund shareholder redemptions or for other short-term liquidity purposes. The participating funds have agreed to pay commitment fees on their pro-rata portion of the line of credit, which are reflected in Miscellaneous expenses on the Statement of Operations, and are listed below. During the period, there were no borrowings on this line of credit.
| | Amount |
| Fidelity Diversified International Fund | $9,094 |
7. Security Lending.
Funds lend portfolio securities from time to time in order to earn additional income. Lending agents are used, including National Financial Services (NFS), an affiliate of the investment adviser. Pursuant to a securities lending agreement, NFS will receive a fee, which is capped at 9.9% of a fund's daily lending revenue, for its services as lending agent. A fund may lend securities to certain qualified borrowers, including NFS. On the settlement date of the loan, a fund receives collateral (in the form of U.S. Treasury obligations, letters of credit and/or cash) against the loaned securities and maintains collateral in an amount not less than 100% of the market value of the loaned securities during the period of the loan. The market value of the loaned securities is determined at the close of business of a fund and any additional required collateral is delivered to a fund on the next business day. A fund or borrower may terminate the loan at any time, and if the borrower defaults on its obligation to return the securities loaned because of insolvency or other reasons, a fund may apply collateral received from the borrower against the obligation. A fund may experience delays and costs in recovering the securities loaned. Any cash collateral received is invested in the Fidelity Securities Lending Cash Central Fund. Any loaned securities are identified as such in the Schedule of Investments, and the value of loaned securities and cash collateral at period end, as applicable, are presented in the Statement of Assets and Liabilities. Security lending income represents the income earned on investing cash collateral, less rebates paid to borrowers and any lending agent fees associated with the loan, plus any premium payments received for lending certain types of securities. Security lending income is presented in the Statement of Operations as a component of income from Fidelity Central Funds. Affiliated security lending activity, if any, was as follows:
| | Total Security Lending Fees Paid to NFS | Security Lending Income From Securities Loaned to NFS | Value of Securities Loaned to NFS at Period End |
| Fidelity Diversified International Fund | $47,052 | $- | $- |
8. Expense Reductions.
Through arrangements with the Fund's custodian, credits realized as a result of certain uninvested cash balances were used to reduce the Fund's expenses. During the period, custodian credits reduced the Fund's expenses by $745.
In addition, during the period the investment adviser or an affiliate reimbursed and/or waived a portion of fund-level operating expenses in the amount of $215,298.
9. Distributions to Shareholders.
Distributions to shareholders of each class were as follows:
| | Six months ended April 30, 2023 | Year ended October 31, 2022 |
| Fidelity Diversified International Fund | | |
| Distributions to shareholders | | |
| Diversified International | $101,421,541 | $1,090,192,506 |
| Class K | 21,600,083 | 304,873,409 |
Total | $123,021,624 | $1,395,065,915 |
10. Share Transactions.
Share transactions for each class were as follows and may contain in-kind transactions, automatic conversions between classes or exchanges between affiliated funds:
| | Shares | Shares | Dollars | Dollars |
| | Six months ended April 30, 2023 | Year ended October 31, 2022 | Six months ended April 30, 2023 | Year ended October 31, 2022 |
| Fidelity Diversified International Fund | | | | |
| Diversified International | | | | |
| Shares sold | 4,578,487 | 48,845,163 | $175,097,619 | $1,865,951,127 |
| Reinvestment of distributions | 2,350,798 | 20,838,853 | 87,708,255 | 979,217,736 |
| Shares redeemed | (17,105,908) | (72,908,948) | (645,503,715) | (2,840,874,254) |
| Net increase (decrease) | (10,176,623) | (3,224,932) | $(382,697,841) | $4,294,609 |
| Class K | | | | |
| Shares sold | 2,605,174 | 7,508,397 | $99,795,993 | $323,341,358 |
| Reinvestment of distributions | 580,051 | 6,500,350 | 21,589,508 | 304,736,401 |
| Shares redeemed | (7,570,395) | (34,873,914) | (283,788,934) | (1,477,621,242) |
| Net increase (decrease) | (4,385,170) | (20,865,167) | $(162,403,433) | $(849,543,483) |
11. Other.
A fund's organizational documents provide former and current trustees and officers with a limited indemnification against liabilities arising in connection with the performance of their duties to the fund. In the normal course of business, a fund may also enter into contracts that provide general indemnifications. A fund's maximum exposure under these arrangements is unknown as this would be dependent on future claims that may be made against a fund. The risk of material loss from such claims is considered remote.
At the end of the period, the following mutual funds managed by the investment adviser or its affiliates were the owners of record of 10% or more of the total outstanding shares.
| | Strategic Advisers Fidelity International Fund |
| Fidelity Diversified International Fund | 18% |
Mutual funds managed by the investment adviser or its affiliates, in aggregate, were the owners of record of more than 20% of the total outstanding shares.
| Fund | % of shares held |
| Fidelity Diversified International Fund | 23% |
12. Risk and Uncertainties.
Many factors affect a fund's performance. Developments that disrupt global economies and financial markets, such as pandemics, epidemics, outbreaks of infectious diseases, war, terrorism, and environmental disasters, may significantly affect a fund's investment performance. The effects of these developments to a fund will be impacted by the types of securities in which a fund invests, the financial condition, industry, economic sector, and geographic location of an issuer, and a fund's level of investment in the securities of that issuer. Significant concentrations in security types, issuers, industries, sectors, and geographic locations may magnify the factors that affect a fund's performance.
Top Holdings (% of Fund's net assets) |
| |
| LVMH Moet Hennessy Louis Vuitton SE (France, Textiles, Apparel & Luxury Goods) | 3.0 | |
| Taiwan Semiconductor Manufacturing Co. Ltd. (Taiwan, Semiconductors & Semiconductor Equipment) | 2.9 | |
| Novo Nordisk A/S Series B (Denmark, Pharmaceuticals) | 2.8 | |
| AstraZeneca PLC (United Kingdom) (United Kingdom, Pharmaceuticals) | 2.5 | |
| ASML Holding NV (Netherlands) (Netherlands, Semiconductors & Semiconductor Equipment) | 2.5 | |
| L'Oreal SA (France, Personal Care Products) | 2.2 | |
| Compagnie Financiere Richemont SA Series A (Switzerland, Textiles, Apparel & Luxury Goods) | 2.2 | |
| Hermes International SCA (France, Textiles, Apparel & Luxury Goods) | 2.0 | |
| Diageo PLC (United Kingdom, Beverages) | 2.0 | |
| Constellation Software, Inc. (Canada, Software) | 1.9 | |
| | 24.0 | |
| |
| Market Sectors (% of Fund's net assets) |
| |
| Information Technology | 24.2 | |
| Industrials | 23.0 | |
| Financials | 12.6 | |
| Consumer Discretionary | 12.4 | |
| Materials | 9.3 | |
| Consumer Staples | 9.1 | |
| Health Care | 8.3 | |
| |
Asset Allocation (% of Fund's net assets) |
|
|
Geographic Diversification (% of Fund's net assets) |
|
* Includes Short-Term investments and Net Other Assets (Liabilities). Percentages are adjusted for the effect of derivatives, if applicable. |
| |
Fidelity® International Capital Appreciation Fund
Showing Percentage of Net Assets
| Common Stocks - 98.9% |
| | | Shares | Value ($) |
| Brazil - 1.6% | | | |
| MercadoLibre, Inc. (a) | | 56,429 | 72,087,483 |
| Canada - 9.8% | | | |
| Alimentation Couche-Tard, Inc. Class A (multi-vtg.) | | 1,437,653 | 71,752,663 |
| Canadian National Railway Co. | | 606,998 | 72,355,004 |
| Canadian Pacific Kansas City Ltd. | | 934,906 | 73,696,690 |
| Constellation Software, Inc. | | 43,614 | 85,364,784 |
| GFL Environmental, Inc. | | 1,547,893 | 56,221,585 |
| Thomson Reuters Corp. | | 572,461 | 75,277,449 |
TOTAL CANADA | | | 434,668,175 |
| China - 1.3% | | | |
| NXP Semiconductors NV | | 349,826 | 57,280,509 |
| Denmark - 4.5% | | | |
| DSV A/S | | 404,182 | 75,912,962 |
| Novo Nordisk A/S Series B | | 739,453 | 123,011,334 |
TOTAL DENMARK | | | 198,924,296 |
| France - 15.5% | | | |
| Air Liquide SA | | 466,992 | 84,007,299 |
| Capgemini SA | | 356,132 | 64,710,363 |
| Dassault Systemes SA | | 1,747,580 | 70,613,894 |
| Hermes International SCA | | 40,850 | 88,530,811 |
| L'Oreal SA | | 207,671 | 99,027,340 |
| LVMH Moet Hennessy Louis Vuitton SE | | 139,569 | 134,248,817 |
| Pernod Ricard SA | | 350,746 | 80,930,381 |
| Safran SA | | 417,958 | 65,000,731 |
TOTAL FRANCE | | | 687,069,636 |
| Germany - 1.7% | | | |
| Infineon Technologies AG | | 2,004,681 | 73,004,017 |
| India - 6.3% | | | |
| HCL Technologies Ltd. | | 4,957,363 | 64,881,169 |
| HDFC Bank Ltd. | | 3,455,317 | 71,514,785 |
| ICICI Bank Ltd. | | 6,970,220 | 78,714,620 |
| ITC Ltd. | | 12,454,605 | 65,016,323 |
TOTAL INDIA | | | 280,126,897 |
| Indonesia - 1.7% | | | |
| PT Bank Central Asia Tbk | | 122,596,418 | 75,868,980 |
| Ireland - 3.0% | | | |
| CRH PLC | | 1,287,675 | 62,135,438 |
| Kingspan Group PLC (Ireland) | | 985,264 | 68,071,032 |
TOTAL IRELAND | | | 130,206,470 |
| Israel - 1.5% | | | |
| NICE Ltd. sponsored ADR (a) | | 314,189 | 64,097,698 |
| Italy - 1.8% | | | |
| Ferrari NV (Italy) | | 292,531 | 81,326,359 |
| Japan - 6.4% | | | |
| Hoya Corp. | | 681,884 | 71,498,975 |
| Keyence Corp. | | 175,864 | 79,306,978 |
| Shin-Etsu Chemical Co. Ltd. | | 2,198,469 | 62,735,120 |
| Tokyo Electron Ltd. | | 597,885 | 68,461,126 |
TOTAL JAPAN | | | 282,002,199 |
| Korea (South) - 2.6% | | | |
| LG Chemical Ltd. | | 108,807 | 60,464,438 |
| Samsung SDI Co. Ltd. | | 108,039 | 56,091,442 |
TOTAL KOREA (SOUTH) | | | 116,555,880 |
| Netherlands - 6.0% | | | |
| ASM International NV (Netherlands) | | 203,966 | 73,729,282 |
| ASML Holding NV (Netherlands) | | 173,342 | 109,541,683 |
| Wolters Kluwer NV | | 607,548 | 80,435,275 |
TOTAL NETHERLANDS | | | 263,706,240 |
| Sweden - 1.8% | | | |
| Atlas Copco AB (A Shares) | | 5,587,653 | 80,695,015 |
| Switzerland - 3.9% | | | |
| Compagnie Financiere Richemont SA Series A | | 585,702 | 96,817,051 |
| Sika AG | | 278,478 | 76,922,034 |
TOTAL SWITZERLAND | | | 173,739,085 |
| Taiwan - 2.9% | | | |
| Taiwan Semiconductor Manufacturing Co. Ltd. | | 7,799,090 | 127,625,472 |
| United Kingdom - 11.2% | | | |
| Ashtead Group PLC | | 986,762 | 56,759,979 |
| AstraZeneca PLC (United Kingdom) | | 755,829 | 111,230,052 |
| Compass Group PLC | | 3,061,038 | 80,753,122 |
| Diageo PLC | | 1,884,746 | 85,974,780 |
| RELX PLC (London Stock Exchange) | | 2,439,010 | 81,105,875 |
| Rentokil Initial PLC | | 10,114,879 | 80,527,126 |
TOTAL UNITED KINGDOM | | | 496,350,934 |
| United States of America - 15.4% | | | |
| Fiserv, Inc. (a) | | 457,100 | 55,821,052 |
| Linde PLC | | 192,777 | 71,221,463 |
| Marsh & McLennan Companies, Inc. | | 398,674 | 71,837,068 |
| MasterCard, Inc. Class A | | 177,176 | 67,332,195 |
| Moody's Corp. | | 219,461 | 68,717,628 |
| S&P Global, Inc. | | 187,205 | 67,876,789 |
| Schneider Electric SA | | 485,613 | 84,686,972 |
| SolarEdge Technologies, Inc. (a) | | 226,472 | 64,687,197 |
| Thermo Fisher Scientific, Inc. | | 113,843 | 63,171,481 |
| Waste Connections, Inc. (Canada) | | 487,640 | 67,830,855 |
TOTAL UNITED STATES OF AMERICA | | | 683,182,700 |
| TOTAL COMMON STOCKS (Cost $3,316,781,494) | | | 4,378,518,045 |
| | | | |
| Money Market Funds - 0.9% |
| | | Shares | Value ($) |
Fidelity Cash Central Fund 4.88% (b) (Cost $39,798,774) | | 39,790,816 | 39,798,774 |
| | | | |
| TOTAL INVESTMENT IN SECURITIES - 99.8% (Cost $3,356,580,268) | 4,418,316,819 |
NET OTHER ASSETS (LIABILITIES) - 0.2% | 10,023,224 |
| NET ASSETS - 100.0% | 4,428,340,043 |
| | |
Legend
| (b) | Affiliated fund that is generally available only to investment companies and other accounts managed by Fidelity Investments. The rate quoted is the annualized seven-day yield of the fund at period end. A complete unaudited listing of the fund's holdings as of its most recent quarter end is available upon request. In addition, each Fidelity Central Fund's financial statements are available on the SEC's website or upon request. |
Affiliated Central Funds
Fiscal year to date information regarding the Fund's investments in Fidelity Central Funds, including the ownership percentage, is presented below.
| Affiliate | Value, beginning of period ($) | Purchases ($) | Sales Proceeds ($) | Dividend Income ($) | Realized Gain (loss) ($) | Change in Unrealized appreciation (depreciation) ($) | Value, end of period ($) | % ownership, end of period |
| Fidelity Cash Central Fund 4.88% | 44,808,754 | 633,980,039 | 638,990,019 | 888,348 | - | - | 39,798,774 | 0.1% |
| Fidelity Securities Lending Cash Central Fund 4.88% | 10,588,050 | 288,879,540 | 299,467,590 | 23,341 | - | - | - | 0.0% |
| Total | 55,396,804 | 922,859,579 | 938,457,609 | 911,689 | - | - | 39,798,774 | |
| | | | | | | | | |
Amounts in the dividend income column in the above table include any capital gain distributions from underlying funds, which are presented in the corresponding line item in the Statement of Operations, if applicable.
Amounts in the dividend income column for Fidelity Securities Lending Cash Central Fund represents the income earned on investing cash collateral, less rebates paid to borrowers and any lending agent fees associated with the loan, plus any premium payments received for lending certain types of securities.
Amounts included in the purchases and sales proceeds columns may include in-kind transactions, if applicable.
Investment Valuation
The following is a summary of the inputs used, as of April 30, 2023, involving the Fund's assets and liabilities carried at fair value. The inputs or methodology used for valuing securities may not be an indication of the risk associated with investing in those securities. For more information on valuation inputs, and their aggregation into the levels used below, please refer to the Investment Valuation section in the accompanying Notes to Financial Statements.
| Valuation Inputs at Reporting Date: |
| Description | Total ($) | Level 1 ($) | Level 2 ($) | Level 3 ($) |
Investments in Securities: | | | | |
|
| Equities: | | | | |
Consumer Discretionary | 553,763,643 | 241,944,653 | 311,818,990 | - |
Consumer Staples | 402,701,487 | 251,710,384 | 150,991,103 | - |
Financials | 557,683,117 | 331,584,732 | 226,098,385 | - |
Health Care | 368,911,842 | 63,171,481 | 305,740,361 | - |
Industrials | 1,018,576,550 | 788,361,721 | 230,214,829 | - |
Information Technology | 1,059,395,614 | 590,025,410 | 469,370,204 | - |
Materials | 417,485,792 | 71,221,463 | 346,264,329 | - |
|
| Money Market Funds | 39,798,774 | 39,798,774 | - | - |
| Total Investments in Securities: | 4,418,316,819 | 2,377,818,618 | 2,040,498,201 | - |
Fidelity® International Capital Appreciation Fund
| Statement of Assets and Liabilities |
| | | | April 30, 2023 (Unaudited) |
| | | | | |
| Assets | | | | |
| Investment in securities, at value - See accompanying schedule: | | | | |
Unaffiliated issuers (cost $3,316,781,494) | $ | 4,378,518,045 | | |
Fidelity Central Funds (cost $39,798,774) | | 39,798,774 | | |
| | | | | |
| | | | | |
| Total Investment in Securities (cost $3,356,580,268) | | | $ | 4,418,316,819 |
| Foreign currency held at value (cost $1,043,485) | | | | 1,044,881 |
| Receivable for investments sold | | | | 16,162,158 |
| Receivable for fund shares sold | | | | 1,254,416 |
| Dividends receivable | | | | 7,267,331 |
| Reclaims receivable | | | | 7,296,590 |
| Distributions receivable from Fidelity Central Funds | | | | 196,246 |
| Prepaid expenses | | | | 1,623 |
| Other receivables | | | | 1,927,234 |
Total assets | | | | 4,453,467,298 |
| Liabilities | | | | |
| Payable to custodian bank | $ | 16,149,303 | | |
| Payable for fund shares redeemed | | 1,812,787 | | |
| Accrued management fee | | 2,268,313 | | |
| Other affiliated payables | | 679,573 | | |
| Other payables and accrued expenses | | 4,217,279 | | |
| Total Liabilities | | | | 25,127,255 |
| Net Assets | | | $ | 4,428,340,043 |
| Net Assets consist of: | | | | |
| Paid in capital | | | $ | 3,755,016,135 |
| Total accumulated earnings (loss) | | | | 673,323,908 |
| Net Assets | | | $ | 4,428,340,043 |
Net Asset Value , offering price and redemption price per share ($4,428,340,043 ÷ 186,034,101 shares) | | | $ | 23.80 |
| Statement of Operations |
| | | | Six months ended April 30, 2023 (Unaudited) |
| Investment Income | | | | |
| Dividends | | | $ | 27,504,241 |
| Non-Cash dividends | | | | 1,397,124 |
| Income from Fidelity Central Funds (including $23,341 from security lending) | | | | 911,689 |
| Income before foreign taxes withheld | | | $ | 29,813,054 |
| Less foreign taxes withheld | | | | (3,317,994) |
| Total Income | | | | 26,495,060 |
| Expenses | | | | |
| Management fee | | | | |
| Basic fee | $ | 14,262,800 | | |
| Performance adjustment | | (403,118) | | |
| Transfer agent fees | | 3,290,358 | | |
| Accounting fees | | 731,710 | | |
| Custodian fees and expenses | | 190,459 | | |
| Independent trustees' fees and expenses | | 13,588 | | |
| Registration fees | | 47,393 | | |
| Audit | | 59,799 | | |
| Legal | | 4,854 | | |
| Interest | | 107,651 | | |
| Miscellaneous | | 8,932 | | |
| Total expenses before reductions | | 18,314,426 | | |
| Expense reductions | | (97,105) | | |
| Total expenses after reductions | | | | 18,217,321 |
| Net Investment income (loss) | | | | 8,277,739 |
| Realized and Unrealized Gain (Loss) | | | | |
| Net realized gain (loss) on: | | | | |
| Investment Securities: | | | | |
| Unaffiliated issuers (net of foreign taxes of $551,343) | | 34,634,433 | | |
| Foreign currency transactions | | 475,389 | | |
| Total net realized gain (loss) | | | | 35,109,822 |
| Change in net unrealized appreciation (depreciation) on: | | | | |
| Investment Securities: | | | | |
| Unaffiliated issuers(net of increase in deferred foreign taxes of $2,494,140) | | 778,138,188 | | |
| Assets and liabilities in foreign currencies | | 731,600 | | |
| Total change in net unrealized appreciation (depreciation) | | | | 778,869,788 |
| Net gain (loss) | | | | 813,979,610 |
| Net increase (decrease) in net assets resulting from operations | | | $ | 822,257,349 |
| Statement of Changes in Net Assets |
| |
| | Six months ended April 30, 2023 (Unaudited) | | Year ended October 31, 2022 |
| Increase (Decrease) in Net Assets | | | | |
| Operations | | | | |
| Net investment income (loss) | $ | 8,277,739 | $ | 4,726,060 |
| Net realized gain (loss) | | 35,109,822 | | (421,962,871) |
| Change in net unrealized appreciation (depreciation) | | 778,869,788 | | (1,404,871,443) |
| Net increase (decrease) in net assets resulting from operations | | 822,257,349 | | (1,822,108,254) |
| Distributions to shareholders | | (1,939,358) | | (482,951,298) |
| Share transactions | | | | |
| Proceeds from sales of shares | | 209,485,691 | | 1,823,528,638 |
| Reinvestment of distributions | | 1,625,726 | | 405,305,190 |
| Cost of shares redeemed | | (426,352,798) | | (1,952,267,374) |
Net increase (decrease) in net assets resulting from share transactions | | (215,241,381) | | 276,566,454 |
| Total increase (decrease) in net assets | | 605,076,610 | | (2,028,493,098) |
| | | | | |
| Net Assets | | | | |
| Beginning of period | | 3,823,263,433 | | 5,851,756,531 |
| End of period | $ | 4,428,340,043 | $ | 3,823,263,433 |
| | | | | |
| Other Information | | | | |
| Shares | | | | |
| Sold | | 9,358,360 | | 78,948,065 |
| Issued in reinvestment of distributions | | 72,968 | | 14,830,047 |
| Redeemed | | (19,379,806) | | (87,008,238) |
| Net increase (decrease) | | (9,948,478) | | 6,769,874 |
| | | | | |
Financial Highlights
| Fidelity® International Capital Appreciation Fund |
| |
| | Six months ended (Unaudited) April 30, 2023 | | Years ended October 31, 2022 | | 2021 | | 2020 | | 2019 | | 2018 |
Selected Per-Share Data | | | | | | | | | | | | |
| Net asset value, beginning of period | $ | 19.51 | $ | 30.93 | $ | 24.57 | $ | 22.41 | $ | 18.84 | $ | 21.06 |
| Income from Investment Operations | | | | | | | | | | | | |
Net investment income (loss) A,B | | .04 | | .02 | | (.02) | | .06 | | .17 C | | .11 |
| Net realized and unrealized gain (loss) | | 4.26 | | (8.86) | | 6.74 | | 2.86 | | 3.93 | | (1.63) |
| Total from investment operations | | 4.30 | | (8.84) | | 6.72 | | 2.92 | | 4.10 | | (1.52) |
| Distributions from net investment income | | (.01) | | - | | (.05) | | (.13) | | (.08) | | (.07) |
| Distributions from net realized gain | | - | | (2.58) | | (.31) | | (.62) | | (.45) | | (.63) |
| Total distributions | | (.01) | | (2.58) | | (.36) | | (.76) D | | (.53) | | (.70) |
| Net asset value, end of period | $ | 23.80 | $ | 19.51 | $ | 30.93 | $ | 24.57 | $ | 22.41 | $ | 18.84 |
Total Return E,F | | 22.04% | | (30.97)% | | 27.56% | | 13.35% | | 22.45% | | (7.51)% |
Ratios to Average Net Assets B,G,H | | | | | | | | | | | | |
| Expenses before reductions | | .87% I | | .99% | | 1.00% | | 1.03% | | 1.01% | | 1.06% |
| Expenses net of fee waivers, if any | | .86% I | | .98% | | 1.00% | | 1.03% | | 1.01% | | 1.06% |
| Expenses net of all reductions | | .86% I | | .98% | | 1.00% | | .99% | | 1.00% | | 1.01% |
| Net investment income (loss) | | .39% I | | .10% | | (.08)% | | .25% | | .81% C | | .54% |
| Supplemental Data | | | | | | | | | | | | |
| Net assets, end of period (000 omitted) | $ | 4,428,340 | $ | 3,823,263 | $ | 5,851,757 | $ | 4,514,343 | $ | 3,480,765 | $ | 2,165,082 |
Portfolio turnover rate J | | 89% I | | 112% K | | 141% | | 135% | | 131% K | | 157% K |
A Calculated based on average shares outstanding during the period.
B Net investment income (loss) is affected by the timing of the declaration of dividends by any underlying mutual funds or exchange-traded funds (ETFs). Net investment income (loss) of any mutual funds or ETFs is not included in the Fund's net investment income (loss) ratio.
C Net investment income per share reflects one or more large, non-recurring dividend(s) which amounted to $.08 per share. Excluding such non-recurring dividend(s), the ratio of net investment income (loss) to average net assets would have been .40%.
D Total distributions per share do not sum due to rounding.
E Total returns for periods of less than one year are not annualized.
F Total returns would have been lower if certain expenses had not been reduced during the applicable periods shown.
G Fees and expenses of any underlying mutual funds or exchange-traded funds (ETFs) are not included in the Fund's expense ratio. The Fund indirectly bears its proportionate share of these expenses. For additional expense information related to investments in Fidelity Central Funds, please refer to the "Investments in Fidelity Central Funds" note found in the Notes to Financial Statements section of the most recent Annual or Semi-Annual report.
H Expense ratios reflect operating expenses of the class. Expenses before reductions do not reflect amounts reimbursed, waived, or reduced through arrangements with the investment adviser, brokerage services, or other offset arrangements, if applicable, and do not represent the amount paid by the class during periods when reimbursements, waivers or reductions occur.
I Annualized.
J Amount does not include the portfolio activity of any underlying mutual funds or exchange-traded funds (ETFs).
K Portfolio turnover rate excludes securities received or delivered in-kind.
For the period ended April 30, 2023
1. Organization.
Fidelity International Capital Appreciation Fund (the Fund) is a fund of Fidelity Investment Trust (the Trust) and is authorized to issue an unlimited number of shares. Share transactions on the Statement of Changes in Net Assets may contain exchanges between affiliated funds. The Trust is registered under the Investment Company Act of 1940, as amended (the 1940 Act), as an open-end management investment company organized as a Massachusetts business trust. The Fund's investments in emerging markets can be subject to social, economic, regulatory, and political uncertainties and can be extremely volatile.
2. Investments in Fidelity Central Funds.
Funds may invest in Fidelity Central Funds, which are open-end investment companies generally available only to other investment companies and accounts managed by the investment adviser and its affiliates. The Schedule of Investments lists any Fidelity Central Funds held as an investment as of period end, but does not include the underlying holdings of each Fidelity Central Fund. An investing fund indirectly bears its proportionate share of the expenses of the underlying Fidelity Central Funds.
Based on its investment objective, each Fidelity Central Fund may invest or participate in various investment vehicles or strategies that are similar to those of the investing fund. These strategies are consistent with the investment objectives of the investing fund and may involve certain economic risks which may cause a decline in value of each of the Fidelity Central Funds and thus a decline in the value of the investing fund.
| Fidelity Central Fund | Investment Manager | Investment Objective | Investment Practices | Expense Ratio A |
| Fidelity Money Market Central Funds | Fidelity Management & Research Company LLC (FMR) | Each fund seeks to obtain a high level of current income consistent with the preservation of capital and liquidity. | Short-term Investments | Less than .005% |
A Expenses expressed as a percentage of average net assets and are as of each underlying Central Fund's most recent annual or semi-annual shareholder report.
A complete unaudited list of holdings for each Fidelity Central Fund is available upon request or at the Securities and Exchange Commission website at www.sec.gov. In addition, the financial statements of the Fidelity Central Funds which contain the significant accounting policies (including investment valuation policies) of those funds, and are not covered by the Report of Independent Registered Public Accounting Firm, are available on the Securities and Exchange Commission website or upon request.
3. Significant Accounting Policies.
The Fund is an investment company and applies the accounting and reporting guidance of the Financial Accounting Standards Board (FASB) Accounting Standards Codification Topic 946 Financial Services - Investment Companies . The financial statements have been prepared in conformity with accounting principles generally accepted in the United States of America (GAAP), which require management to make certain estimates and assumptions at the date of the financial statements. Actual results could differ from those estimates. Subsequent events, if any, through the date that the financial statements were issued have been evaluated in the preparation of the financial statements. The Fund's Schedule of Investments lists any underlying mutual funds or exchange-traded funds (ETFs) but does not include the underlying holdings of these funds. The following summarizes the significant accounting policies of the Fund:
Investment Valuation. Investments are valued as of 4:00 p.m. Eastern time on the last calendar day of the period. The Board of Trustees (the Board) has designated the Fund's investment adviser as the valuation designee responsible for the fair valuation function and performing fair value determinations as needed. The investment adviser has established a Fair Value Committee (the Committee) to carry out the day-to-day fair valuation responsibilities and has adopted policies and procedures to govern the fair valuation process and the activities of the Committee. In accordance with these fair valuation policies and procedures, which have been approved by the Board, the Fund attempts to obtain prices from one or more third party pricing services or brokers to value its investments. When current market prices, quotations or currency exchange rates are not readily available or reliable, investments will be fair valued in good faith by the Committee, in accordance with the policies and procedures. Factors used in determining fair value vary by investment type and may include market or investment specific events, transaction data, estimated cash flows, and market observations of comparable investments. The frequency that the fair valuation procedures are used cannot be predicted and they may be utilized to a significant extent. The Committee manages the Fund's fair valuation practices and maintains the fair valuation policies and procedures. The Fund's investment adviser reports to the Board information regarding the fair valuation process and related material matters.
The Fund categorizes the inputs to valuation techniques used to value its investments into a disclosure hierarchy consisting of three levels as shown below:
Level 1 - unadjusted quoted prices in active markets for identical investments
Level 2 - other significant observable inputs (including quoted prices for similar investments, interest rates, prepayment speeds, etc.)
Level 3 - unobservable inputs (including the Fund's own assumptions based on the best information available)
Valuation techniques used to value the Fund's investments by major category are as follows:
Equity securities, including restricted securities, for which market quotations are readily available, are valued at the last reported sale price or official closing price as reported by a third party pricing service on the primary market or exchange on which they are traded and are categorized as Level 1 in the hierarchy. In the event there were no sales during the day or closing prices are not available, securities are valued at the last quoted bid price or may be valued using the last available price and are generally categorized as Level 2 in the hierarchy. For foreign equity securities, when market or security specific events arise, comparisons to the valuation of American Depositary Receipts (ADRs), futures contracts, Exchange-Traded Funds (ETFs) and certain indexes as well as quoted prices for similar securities may be used and would be categorized as Level 2 in the hierarchy. For equity securities, including restricted securities, where observable inputs are limited, assumptions about market activity and risk are used and these securities may be categorized as Level 3 in the hierarchy.
Investments in open-end mutual funds, including the Fidelity Central Funds, are valued at their closing net asset value (NAV) each business day and are categorized as Level 1 in the hierarchy.
Changes in valuation techniques may result in transfers in or out of an assigned level within the disclosure hierarchy. The aggregate value of investments by input level as of April 30, 2023 is included at the end of the Fund's Schedule of Investments.
Foreign Currency. Certain Funds may use foreign currency contracts to facilitate transactions in foreign-denominated securities. Gains and losses from these transactions may arise from changes in the value of the foreign currency or if the counterparties do not perform under the contracts' terms.
Foreign-denominated assets, including investment securities, and liabilities are translated into U.S. dollars at the exchange rates at period end. Purchases and sales of investment securities, income and dividends received, and expenses denominated in foreign currencies are translated into U.S. dollars at the exchange rate in effect on the transaction date.
The effects of exchange rate fluctuations on investments are included with the net realized and unrealized gain (loss) on investment securities. Other foreign currency transactions resulting in realized and unrealized gain (loss) are disclosed separately.
Investment Transactions and Income. For financial reporting purposes, the Fund's investment holdings and NAV include trades executed through the end of the last business day of the period. The NAV per share for processing shareholder transactions is calculated as of the close of business of the New York Stock Exchange (NYSE), normally 4:00 p.m. Eastern time and includes trades executed through the end of the prior business day. Gains and losses on securities sold are determined on the basis of identified cost and include proceeds received from litigation. Commissions paid to certain brokers with whom the investment adviser, or its affiliates, places trades on behalf of a fund include an amount in addition to trade execution, which may be rebated back to a fund. Any such rebates are included in net realized gain (loss) on investments in the Statement of Operations. Dividend income is recorded on the ex-dividend date, except for certain dividends from foreign securities where the ex-dividend date may have passed, which are recorded as soon as the Fund is informed of the ex-dividend date. Non-cash dividends included in dividend income, if any, are recorded at the fair market value of the securities received. Income and capital gain distributions from Fidelity Central Funds, if any, are recorded on the ex-dividend date. Certain distributions received by the Fund represent a return of capital or capital gain. The Fund determines the components of these distributions subsequent to the ex-dividend date, based upon receipt of tax filings or other correspondence relating to the underlying investment. These distributions are recorded as a reduction of cost of investments and/or as a realized gain. Investment income is recorded net of foreign taxes withheld where recovery of such taxes is uncertain. Funds may file withholding tax reclaims in certain jurisdictions to recover a portion of amounts previously withheld. Any withholding tax reclaims income is included in the Statement of Operations in foreign taxes withheld. Any receivables for withholding tax reclaims are included in the Statement of Assets and Liabilities in reclaims receivable.
Expenses. Expenses directly attributable to a fund are charged to that fund. Expenses attributable to more than one fund are allocated among the respective funds on the basis of relative net assets or other appropriate methods. Expenses included in the accompanying financial statements reflect the expenses of that fund and do not include any expenses associated with any underlying mutual funds or exchange-traded funds. Although not included in a fund's expenses, a fund indirectly bears its proportionate share of these expenses through the net asset value of each underlying mutual fund or exchange-traded fund. Expense estimates are accrued in the period to which they relate and adjustments are made when actual amounts are known.
Income Tax Information and Distributions to Shareholders. Each year, the Fund intends to qualify as a regulated investment company under Subchapter M of the Internal Revenue Code, including distributing substantially all of its taxable income and realized gains. As a result, no provision for U.S. Federal income taxes is required. The Fund files a U.S. federal tax return, in addition to state and local tax returns as required. The Fund's federal income tax returns are subject to examination by the Internal Revenue Service (IRS) for a period of three fiscal years after they are filed. State and local tax returns may be subject to examination for an additional fiscal year depending on the jurisdiction. Foreign taxes are provided for based on the Fund's understanding of the tax rules and rates that exist in the foreign markets in which it invests. The Fund is subject to a tax imposed on capital gains by certain countries in which it invests. An estimated deferred tax liability for net unrealized appreciation on the applicable securities is included in Other payables and accrued expenses on the Statement of Assets & Liabilities.
Distributions are declared and recorded on the ex-dividend date. Income and capital gain distributions are determined in accordance with income tax regulations, which may differ from GAAP.
Capital accounts within the financial statements are adjusted for permanent book-tax differences. These adjustments have no impact on net assets or the results of operations. Capital accounts are not adjusted for temporary book-tax differences which will reverse in a subsequent period.
Book-tax differences are primarily due to foreign currency transactions, certain foreign taxes, redemptions in-kind, capital loss carryforwards and losses deferred due to wash sales.
As of period end, the cost and unrealized appreciation (depreciation) in securities, and derivatives if applicable, for federal income tax purposes were as follows:
| Gross unrealized appreciation | $1,115,218,842 |
| Gross unrealized depreciation | (65,176,966) |
| Net unrealized appreciation (depreciation) | $1,050,041,876 |
| Tax cost | $3,368,274,943 |
Capital loss carryforwards are only available to offset future capital gains of the Fund to the extent provided by regulations and may be limited. The capital loss carryforward information presented below, including any applicable limitation, is estimated as of prior fiscal period end and is subject to adjustment.
Short-term | $(385,881,335) |
| Total capital loss carryforward | $(385,881,335) |
4. Purchases and Sales of Investments.
Purchases and sales of securities, other than short-term securities and in-kind transactions, as applicable, are noted in the table below.
| | Purchases ($) | Sales ($) |
| Fidelity International Capital Appreciation Fund | 1,842,653,670 | 2,055,258,644 |
Prior Fiscal Year Unaffiliated Redemptions In-Kind. Shares that were redeemed in-kind for investments, including accrued interest and cash, if any, are shown in the table below; along with realized gain or loss on investments delivered through in-kind redemptions. The amount of the in-kind redemptions is included in share transactions in the accompanying Statement of Changes in Net Assets. There was no gain or loss for federal income tax purposes.
| | Shares | Total net realized gain or loss ($) | Total Proceeds ($) | |
| Fidelity International Capital Appreciation Fund | 237,890 | 2,446,488 | 6,501,540 | |
| | | | | |
5. Fees and Other Transactions with Affiliates.
Management Fee. Fidelity Management & Research Company LLC (the investment adviser) and its affiliates provide the Fund with investment management related services for which the Fund pays a monthly management fee. The management fee is the sum of an individual fund fee rate that is based on an annual rate of .45% of the Fund's average net assets and an annualized group fee rate that averaged .23% during the period. The group fee rate is based upon the monthly average net assets of a group of registered investment companies with which the investment adviser has management contracts. The group fee rate decreases as assets under management increase and increases as assets under management decrease. In addition, the management fee is subject to a performance adjustment (up to a maximum of +/- .20% of the Fund's average net assets over a 36 month performance period). The upward or downward adjustment to the management fee is based on the Fund's relative investment performance as compared to its benchmark index, the MSCI All Country World ex USA Index, over the same 36 month performance period. For the reporting period, the total annualized management fee rate, including the performance adjustment, was .66% of the Fund's average net assets. The performance adjustment included in the management fee rate may be higher or lower than the maximum performance adjustment rate due to the difference between the average net assets for the reporting and performance periods.
Transfer Agent Fees. Fidelity Investments Institutional Operations Company LLC (FIIOC), an affiliate of the investment adviser, is the Fund's transfer, dividend disbursing and shareholder servicing agent. FIIOC receives account fees and asset-based fees that vary according to account size and type of account. FIIOC pays for typesetting, printing and mailing of shareholder reports, except proxy statements. For the period, the transfer agent fees were equivalent to an annualized rate of .16% of average net assets.
Accounting Fees. Fidelity Service Company, Inc. (FSC), an affiliate of the investment adviser, maintains the Fund's accounting records. The accounting fee is based on the level of average net assets for each month. For the period, the fees were equivalent to the following annualized rates:
| | % of Average Net Assets |
| Fidelity International Capital Appreciation Fund | .03 |
Brokerage Commissions. A portion of portfolio transactions were placed with brokerage firms which are affiliates of the investment adviser. Brokerage commissions are included in net realized gain (loss) and change in net unrealized appreciation (depreciation) in the Statement of Operations. The commissions paid to these affiliated firms were as follows:
| | Amount |
| Fidelity International Capital Appreciation Fund | $2,637 |
Interfund Lending Program. Pursuant to an Exemptive Order issued by the Securities and Exchange Commission (the SEC), the Fund, along with other registered investment companies having management contracts with Fidelity Management & Research Company LLC (FMR), or other affiliated entities of FMR, may participate in an interfund lending program. This program provides an alternative credit facility allowing the Fund to borrow from, or lend money to, other participating affiliated funds. At period end, there were no interfund loans outstanding. Activity in this program during the period for which loans were outstanding was as follows:
| | Borrower or Lender | Average Loan Balance | Weighted Average Interest Rate | Interest Expense |
Fidelity International Capital Appreciation Fund | Borrower | $ 22,972,657 | 4.82% | $107,651 |
Interfund Trades. Funds may purchase from or sell securities to other Fidelity Funds under procedures adopted by the Board. The procedures have been designed to ensure these interfund trades are executed in accordance with Rule 17a-7 of the 1940 Act. Any interfund trades are included within the respective purchases and sales amounts shown in the Purchases and Sales of Investments note. Interfund trades during the period are noted in the table below.
| | Purchases ($) | Sales ($) | Realized Gain (Loss) ($) |
| Fidelity International Capital Appreciation Fund | 34,113,296 | 58,674,582 | 3,282,891 |
6. Committed Line of Credit.
Certain Funds participate with other funds managed by the investment adviser or an affiliate in a $4.25 billion credit facility (the "line of credit") to be utilized for temporary or emergency purposes to fund shareholder redemptions or for other short-term liquidity purposes. The participating funds have agreed to pay commitment fees on their pro-rata portion of the line of credit, which are reflected in Miscellaneous expenses on the Statement of Operations, and are listed below. During the period, there were no borrowings on this line of credit.
| | Amount |
| Fidelity International Capital Appreciation Fund | $4,056 |
7. Security Lending.
Funds lend portfolio securities from time to time in order to earn additional income. Lending agents are used, including National Financial Services (NFS), an affiliate of the investment adviser. Pursuant to a securities lending agreement, NFS will receive a fee, which is capped at 9.9% of a fund's daily lending revenue, for its services as lending agent. A fund may lend securities to certain qualified borrowers, including NFS. On the settlement date of the loan, a fund receives collateral (in the form of U.S. Treasury obligations, letters of credit and/or cash) against the loaned securities and maintains collateral in an amount not less than 100% of the market value of the loaned securities during the period of the loan. The market value of the loaned securities is determined at the close of business of a fund and any additional required collateral is delivered to a fund on the next business day. A fund or borrower may terminate the loan at any time, and if the borrower defaults on its obligation to return the securities loaned because of insolvency or other reasons, a fund may apply collateral received from the borrower against the obligation. A fund may experience delays and costs in recovering the securities loaned. Any cash collateral received is invested in the Fidelity Securities Lending Cash Central Fund. Any loaned securities are identified as such in the Schedule of Investments, and the value of loaned securities and cash collateral at period end, as applicable, are presented in the Statement of Assets and Liabilities. Security lending income represents the income earned on investing cash collateral, less rebates paid to borrowers and any lending agent fees associated with the loan, plus any premium payments received for lending certain types of securities. Security lending income is presented in the Statement of Operations as a component of income from Fidelity Central Funds. Affiliated security lending activity, if any, was as follows:
| | Total Security Lending Fees Paid to NFS | Security Lending Income From Securities Loaned to NFS | Value of Securities Loaned to NFS at Period End |
| Fidelity International Capital Appreciation Fund | $2,527 | $- | $- |
8. Expense Reductions.
Through arrangements with the Fund's custodian, credits realized as a result of certain uninvested cash balances were used to reduce the Fund's expenses by $77.
In addition, during the period the investment adviser or an affiliate reimbursed and/or waived a portion of operating expenses in the amount of $97,028.
9. Other.
A fund's organizational documents provide former and current trustees and officers with a limited indemnification against liabilities arising in connection with the performance of their duties to the fund. In the normal course of business, a fund may also enter into contracts that provide general indemnifications. A fund's maximum exposure under these arrangements is unknown as this would be dependent on future claims that may be made against a fund. The risk of material loss from such claims is considered remote.
At the end of the period, the following mutual funds managed by the investment adviser or its affiliates were the owners of record of 10% or more of the total outstanding shares.
| | Strategic Advisers Fidelity International Fund |
| Fidelity International Capital Appreciation Fund | 36% |
Mutual funds managed by the investment adviser or its affiliates were the owners of record of more than 10% or more of the total outstanding shares.
| Fund | % of shares held |
| Fidelity International Capital Appreciation Fund | 40% |
10. Risk and Uncertainties.
Many factors affect a fund's performance. Developments that disrupt global economies and financial markets, such as pandemics, epidemics, outbreaks of infectious diseases, war, terrorism, and environmental disasters, may significantly affect a fund's investment performance. The effects of these developments to a fund will be impacted by the types of securities in which a fund invests, the financial condition, industry, economic sector, and geographic location of an issuer, and a fund's level of investment in the securities of that issuer. Significant concentrations in security types, issuers, industries, sectors, and geographic locations may magnify the factors that affect a fund's performance.
Top Holdings (% of Fund's net assets) |
| |
| LVMH Moet Hennessy Louis Vuitton SE (France, Textiles, Apparel & Luxury Goods) | 3.3 | |
| ASML Holding NV (Netherlands) (Netherlands, Semiconductors & Semiconductor Equipment) | 2.5 | |
| AstraZeneca PLC (United Kingdom) (United Kingdom, Pharmaceuticals) | 2.5 | |
| Novo Nordisk A/S Series B (Denmark, Pharmaceuticals) | 2.4 | |
| Diageo PLC (United Kingdom, Beverages) | 2.0 | |
| Nestle SA (Reg. S) (United States of America, Food Products) | 2.0 | |
| Compagnie Financiere Richemont SA Series A (Switzerland, Textiles, Apparel & Luxury Goods) | 2.0 | |
| AIA Group Ltd. (Hong Kong, Insurance) | 1.9 | |
| TotalEnergies SE (France, Oil, Gas & Consumable Fuels) | 1.9 | |
| Compass Group PLC (United Kingdom, Hotels, Restaurants & Leisure) | 1.7 | |
| | 22.2 | |
| |
| Market Sectors (% of Fund's net assets) |
| |
| Industrials | 22.0 | |
| Financials | 21.0 | |
| Health Care | 15.1 | |
| Information Technology | 11.8 | |
| Consumer Discretionary | 11.6 | |
| Consumer Staples | 7.6 | |
| Materials | 5.6 | |
| Energy | 1.9 | |
| Real Estate | 1.0 | |
| Communication Services | 0.6 | |
| |
Asset Allocation (% of Fund's net assets) |
|
|
Geographic Diversification (% of Fund's net assets) |
|
* Includes Short-Term investments and Net Other Assets (Liabilities). Percentages are adjusted for the effect of derivatives, if applicable. |
| |
Fidelity® Overseas Fund
Showing Percentage of Net Assets
| Common Stocks - 98.2% |
| | | Shares | Value ($) |
| Australia - 0.7% | | | |
| Flutter Entertainment PLC (a) | | 295,174 | 59,038,272 |
| Bailiwick of Jersey - 0.3% | | | |
| JTC PLC (b) | | 2,649,000 | 26,400,007 |
| Belgium - 1.1% | | | |
| Azelis Group NV | | 812,200 | 19,241,708 |
| KBC Group NV | | 978,390 | 69,838,537 |
TOTAL BELGIUM | | | 89,080,245 |
| Canada - 1.5% | | | |
| Constellation Software, Inc. | | 59,400 | 116,262,397 |
| Lumine Group, Inc. | | 178,222 | 2,400,673 |
TOTAL CANADA | | | 118,663,070 |
| China - 0.1% | | | |
| Chervon Holdings Ltd. | | 699,700 | 3,560,684 |
| Denmark - 4.7% | | | |
| Carlsberg A/S Series B | | 303,600 | 50,154,926 |
| DSV A/S | | 722,300 | 135,661,490 |
| Novo Nordisk A/S Series B | | 1,139,100 | 189,494,410 |
TOTAL DENMARK | | | 375,310,826 |
| Finland - 1.0% | | | |
| Nordea Bank ABP | | 7,207,600 | 79,996,590 |
| France - 17.5% | | | |
| Air Liquide SA | | 647,129 | 116,412,186 |
| ALTEN | | 493,956 | 83,820,678 |
| Antin Infrastructure Partners SA | | 198,900 | 3,353,269 |
| BNP Paribas SA | | 697,700 | 45,080,762 |
| Capgemini SA | | 600,933 | 109,191,515 |
| Edenred SA | | 1,938,379 | 125,847,217 |
| EssilorLuxottica SA | | 598,413 | 118,294,796 |
| L'Oreal SA | | 245,700 | 117,161,363 |
| LVMH Moet Hennessy Louis Vuitton SE | | 275,163 | 264,674,150 |
| Pernod Ricard SA | | 539,800 | 124,552,297 |
| Safran SA | | 783,600 | 121,865,290 |
| Teleperformance (c) | | 137,066 | 27,306,771 |
| TotalEnergies SE (c) | | 2,363,944 | 151,055,887 |
TOTAL FRANCE | | | 1,408,616,181 |
| Germany - 7.4% | | | |
| Allianz SE | | 428,601 | 107,624,649 |
| Deutsche Borse AG | | 537,091 | 102,427,898 |
| Hannover Reuck SE | | 464,900 | 99,176,113 |
| Infineon Technologies AG | | 2,427,900 | 88,416,288 |
| Merck KGaA | | 599,600 | 107,396,661 |
| Siemens Healthineers AG (b) | | 1,475,900 | 91,755,519 |
TOTAL GERMANY | | | 596,797,128 |
| Hong Kong - 1.9% | | | |
| AIA Group Ltd. | | 14,169,800 | 154,267,686 |
| India - 1.6% | | | |
| HCL Technologies Ltd. | | 2,077,700 | 27,192,603 |
| HDFC Bank Ltd. | | 4,972,900 | 102,924,239 |
TOTAL INDIA | | | 130,116,842 |
| Ireland - 1.0% | | | |
| Kingspan Group PLC (Ireland) | | 1,160,000 | 80,143,391 |
| Italy - 2.5% | | | |
| FinecoBank SpA | | 4,669,000 | 70,637,707 |
| GVS SpA (a)(b) | | 528,100 | 3,593,315 |
| Recordati SpA | | 1,698,130 | 78,083,901 |
| UniCredit SpA | | 2,418,700 | 47,927,701 |
TOTAL ITALY | | | 200,242,624 |
| Japan - 11.5% | | | |
| Bandai Namco Holdings, Inc. | | 987,000 | 22,420,120 |
| BayCurrent Consulting, Inc. | | 598,000 | 20,786,486 |
| Capcom Co. Ltd. | | 1,182,700 | 44,443,041 |
| FUJIFILM Holdings Corp. | | 1,063,600 | 55,434,803 |
| Hoya Corp. | | 853,400 | 89,483,293 |
| Iriso Electronics Co. Ltd. | | 501,900 | 17,179,849 |
| Misumi Group, Inc. | | 1,737,300 | 43,827,227 |
| NOF Corp. | | 941,400 | 43,013,940 |
| Olympus Corp. | | 2,296,500 | 40,203,487 |
| Persol Holdings Co. Ltd. | | 2,299,400 | 47,412,283 |
| Relo Group, Inc. | | 1,741,700 | 27,077,144 |
| Shin-Etsu Chemical Co. Ltd. | | 2,179,200 | 62,185,263 |
| SMC Corp. | | 154,000 | 76,806,703 |
| Sony Group Corp. | | 1,419,900 | 128,463,674 |
| Suzuki Motor Corp. | | 1,410,600 | 49,185,474 |
| TIS, Inc. | | 1,338,700 | 36,760,333 |
| Tokio Marine Holdings, Inc. | | 3,636,600 | 73,121,239 |
| Tokyo Electron Ltd. | | 423,300 | 48,470,182 |
TOTAL JAPAN | | | 926,274,541 |
| Kenya - 0.1% | | | |
| Safaricom Ltd. | | 37,952,100 | 4,604,483 |
| Luxembourg - 0.8% | | | |
| Eurofins Scientific SA (c) | | 848,700 | 59,159,647 |
| Netherlands - 7.1% | | | |
| ASM International NV (Netherlands) | | 222,400 | 80,392,773 |
| ASML Holding NV (Netherlands) | | 320,400 | 202,473,464 |
| Euronext NV (b) | | 615,280 | 48,882,144 |
| IMCD NV | | 622,424 | 93,412,634 |
| Topicus.Com, Inc. (a) | | 122,288 | 8,145,914 |
| Wolters Kluwer NV | | 1,051,300 | 139,185,060 |
TOTAL NETHERLANDS | | | 572,491,989 |
| Spain - 1.3% | | | |
| Amadeus IT Holding SA Class A (a) | | 1,500,557 | 105,466,692 |
| Sweden - 4.2% | | | |
| Addlife AB | | 2,778,272 | 32,835,195 |
| AddTech AB (B Shares) | | 3,841,696 | 76,796,084 |
| Atlas Copco AB (A Shares) | | 7,024,444 | 101,444,669 |
| Indutrade AB | | 4,506,101 | 107,961,347 |
| Kry International AB (a)(d)(e) | | 2,787 | 217,856 |
| Nordnet AB | | 1,189,863 | 18,657,147 |
TOTAL SWEDEN | | | 337,912,298 |
| Switzerland - 5.8% | | | |
| Compagnie Financiere Richemont SA Series A | | 950,750 | 157,159,803 |
| Julius Baer Group Ltd. | | 1,286,924 | 91,741,117 |
| Partners Group Holding AG | | 66,700 | 64,412,866 |
| Sika AG | | 420,382 | 116,119,185 |
| Sonova Holding AG | | 115,271 | 36,340,961 |
TOTAL SWITZERLAND | | | 465,773,932 |
| Taiwan - 0.5% | | | |
| Taiwan Semiconductor Manufacturing Co. Ltd. | | 2,565,000 | 41,974,043 |
| United Kingdom - 14.4% | | | |
| Ashtead Group PLC | | 976,700 | 56,181,198 |
| AstraZeneca PLC (United Kingdom) | | 1,357,400 | 199,759,037 |
| BAE Systems PLC | | 6,056,800 | 77,163,535 |
| Beazley PLC | | 4,595,935 | 34,395,731 |
| Compass Group PLC | | 5,341,398 | 140,911,209 |
| Dechra Pharmaceuticals PLC | | 778,595 | 36,498,023 |
| Diageo PLC | | 3,553,000 | 162,074,037 |
| Diploma PLC | | 1,567,295 | 52,906,088 |
| Hiscox Ltd. | | 2,935,313 | 43,603,444 |
| London Stock Exchange Group PLC | | 750,400 | 78,786,946 |
| RELX PLC (London Stock Exchange) | | 4,016,300 | 133,556,454 |
| Rentokil Initial PLC | | 12,425,315 | 98,921,095 |
| Volution Group PLC | | 7,215,267 | 39,299,788 |
TOTAL UNITED KINGDOM | | | 1,154,056,585 |
| United States of America - 11.2% | | | |
| CBRE Group, Inc. (a) | | 769,300 | 58,974,538 |
| CDW Corp. | | 195,530 | 33,159,933 |
| Equifax, Inc. | | 161,400 | 33,632,532 |
| Experian PLC | | 2,444,300 | 86,540,155 |
| Ferguson PLC | | 642,300 | 90,367,219 |
| ICON PLC (a) | | 311,400 | 60,003,666 |
| Linde PLC | | 316,700 | 117,004,815 |
| Marsh & McLennan Companies, Inc. | | 647,200 | 116,618,968 |
| Nestle SA (Reg. S) | | 1,228,240 | 157,570,387 |
| S&P Global, Inc. | | 245,805 | 89,123,977 |
| Thermo Fisher Scientific, Inc. | | 106,300 | 58,985,870 |
TOTAL UNITED STATES OF AMERICA | | | 901,982,060 |
| TOTAL COMMON STOCKS (Cost $5,632,573,559) | | | 7,891,929,816 |
| | | | |
| Nonconvertible Preferred Stocks - 0.0% |
| | | Shares | Value ($) |
| Sweden - 0.0% | | | |
Kry International AB Series E (a)(d)(e) (Cost $7,360,943) | | 16,101 | 1,258,596 |
| | | | |
| Money Market Funds - 1.8% |
| | | Shares | Value ($) |
| Fidelity Cash Central Fund 4.88% (f) | | 97,384,881 | 97,404,358 |
| Fidelity Securities Lending Cash Central Fund 4.88% (f)(g) | | 48,850,532 | 48,855,417 |
| TOTAL MONEY MARKET FUNDS (Cost $146,259,775) | | | 146,259,775 |
| | | | |
| TOTAL INVESTMENT IN SECURITIES - 100.0% (Cost $5,786,194,277) | 8,039,448,187 |
NET OTHER ASSETS (LIABILITIES) - 0.0% | (625,659) |
| NET ASSETS - 100.0% | 8,038,822,528 |
| | |
Legend
| (b) | Security exempt from registration under Rule 144A of the Securities Act of 1933. These securities may be resold in transactions exempt from registration, normally to qualified institutional buyers. At the end of the period, the value of these securities amounted to $170,630,985 or 2.1% of net assets. |
| (c) | Security or a portion of the security is on loan at period end. |
| (d) | Restricted securities (including private placements) - Investment in securities not registered under the Securities Act of 1933 (excluding 144A issues). At the end of the period, the value of restricted securities (excluding 144A issues) amounted to $1,476,452 or 0.0% of net assets. |
| (f) | Affiliated fund that is generally available only to investment companies and other accounts managed by Fidelity Investments. The rate quoted is the annualized seven-day yield of the fund at period end. A complete unaudited listing of the fund's holdings as of its most recent quarter end is available upon request. In addition, each Fidelity Central Fund's financial statements are available on the SEC's website or upon request. |
| (g) | Investment made with cash collateral received from securities on loan. |
| Additional information on each restricted holding is as follows: |
| Security | Acquisition Date | Acquisition Cost ($) |
| Kry International AB | 5/14/21 | 1,210,410 |
| | | |
| Kry International AB Series E | 5/14/21 | 7,360,943 |
| | | |
Affiliated Central Funds
Fiscal year to date information regarding the Fund's investments in Fidelity Central Funds, including the ownership percentage, is presented below.
| Affiliate | Value, beginning of period ($) | Purchases ($) | Sales Proceeds ($) | Dividend Income ($) | Realized Gain (loss) ($) | Change in Unrealized appreciation (depreciation) ($) | Value, end of period ($) | % ownership, end of period |
| Fidelity Cash Central Fund 4.88% | 214,978,741 | 596,671,060 | 714,245,443 | 1,811,913 | - | - | 97,404,358 | 0.2% |
| Fidelity Securities Lending Cash Central Fund 4.88% | 17,314,388 | 669,063,739 | 637,522,710 | 460,752 | - | - | 48,855,417 | 0.1% |
| Total | 232,293,129 | 1,265,734,799 | 1,351,768,153 | 2,272,665 | - | - | 146,259,775 | |
| | | | | | | | | |
Amounts in the dividend income column in the above table include any capital gain distributions from underlying funds, which are presented in the corresponding line item in the Statement of Operations, if applicable.
Amounts in the dividend income column for Fidelity Securities Lending Cash Central Fund represents the income earned on investing cash collateral, less rebates paid to borrowers and any lending agent fees associated with the loan, plus any premium payments received for lending certain types of securities.
Amounts included in the purchases and sales proceeds columns may include in-kind transactions, if applicable.
Investment Valuation
The following is a summary of the inputs used, as of April 30, 2023, involving the Fund's assets and liabilities carried at fair value. The inputs or methodology used for valuing securities may not be an indication of the risk associated with investing in those securities. For more information on valuation inputs, and their aggregation into the levels used below, please refer to the Investment Valuation section in the accompanying Notes to Financial Statements.
| Valuation Inputs at Reporting Date: |
| Description | Total ($) | Level 1 ($) | Level 2 ($) | Level 3 ($) |
Investments in Securities: | | | | |
|
| Equities: | | | | |
Communication Services | 49,047,524 | 4,604,483 | 44,443,041 | - |
Consumer Discretionary | 930,880,078 | 59,038,272 | 871,841,806 | - |
Consumer Staples | 611,513,010 | 291,868,586 | 319,644,424 | - |
Energy | 151,055,887 | - | 151,055,887 | - |
Financials | 1,694,845,954 | 982,684,834 | 712,161,120 | - |
Health Care | 1,198,294,466 | 679,354,239 | 518,940,227 | - |
Industrials | 1,764,012,522 | 1,190,689,748 | 573,322,774 | - |
Information Technology | 952,751,900 | 635,847,347 | 315,428,101 | 1,476,452 |
Materials | 454,735,389 | 117,004,815 | 337,730,574 | - |
Real Estate | 86,051,682 | 58,974,538 | 27,077,144 | - |
|
| Money Market Funds | 146,259,775 | 146,259,775 | - | - |
| Total Investments in Securities: | 8,039,448,187 | 4,166,326,637 | 3,871,645,098 | 1,476,452 |
Fidelity® Overseas Fund
| Statement of Assets and Liabilities |
| | | | April 30, 2023 (Unaudited) |
| | | | | |
| Assets | | | | |
| Investment in securities, at value (including securities loaned of $47,419,033) - See accompanying schedule: | | | | |
Unaffiliated issuers (cost $5,639,934,502) | $ | 7,893,188,412 | | |
Fidelity Central Funds (cost $146,259,775) | | 146,259,775 | | |
| | | | | |
| | | | | |
| Total Investment in Securities (cost $5,786,194,277) | | | $ | 8,039,448,187 |
| Foreign currency held at value (cost $8,329,701) | | | | 8,168,623 |
| Receivable for investments sold | | | | 18,401,609 |
| Receivable for fund shares sold | | | | 2,719,944 |
| Dividends receivable | | | | 16,326,050 |
| Reclaims receivable | | | | 25,295,145 |
| Interest receivable | | | | 6,882 |
| Distributions receivable from Fidelity Central Funds | | | | 273,092 |
| Prepaid expenses | | | | 2,925 |
| Other receivables | | | | 244,885 |
Total assets | | | | 8,110,887,342 |
| Liabilities | | | | |
| Payable for investments purchased | $ | 12,226,630 | | |
| Payable for fund shares redeemed | | 2,859,760 | | |
| Accrued management fee | | 3,721,995 | | |
| Other affiliated payables | | 1,019,275 | | |
| Other payables and accrued expenses | | 3,381,737 | | |
| Collateral on securities loaned | | 48,855,417 | | |
| Total Liabilities | | | | 72,064,814 |
| Net Assets | | | $ | 8,038,822,528 |
| Net Assets consist of: | | | | |
| Paid in capital | | | $ | 5,933,773,271 |
| Total accumulated earnings (loss) | | | | 2,105,049,257 |
| Net Assets | | | $ | 8,038,822,528 |
| | | | | |
| Net Asset Value and Maximum Offering Price | | | | |
| Overseas : | | | | |
Net Asset Value , offering price and redemption price per share ($7,487,724,545 ÷ 130,551,433 shares) | | | $ | 57.35 |
| Class K : | | | | |
Net Asset Value , offering price and redemption price per share ($551,097,983 ÷ 9,628,607 shares) | | | $ | 57.24 |
| Statement of Operations |
| | | | Six months ended April 30, 2023 (Unaudited) |
| Investment Income | | | | |
| Dividends | | | $ | 75,123,141 |
| Foreign Tax Reclaims | | | | 4,311,063 |
| Income from Fidelity Central Funds (including $460,752 from security lending) | | | | 2,272,665 |
| Income before foreign taxes withheld | | | $ | 81,706,869 |
| Less foreign taxes withheld | | | | (12,462,276) |
| Total Income | | | | 69,244,593 |
| Expenses | | | | |
| Management fee | | | | |
| Basic fee | $ | 24,594,399 | | |
| Performance adjustment | | (927,673) | | |
| Transfer agent fees | | 5,245,572 | | |
| Accounting fees | | 800,300 | | |
| Custodian fees and expenses | | 155,424 | | |
| Independent trustees' fees and expenses | | 24,628 | | |
| Registration fees | | 72,538 | | |
| Audit | | 65,408 | | |
| Legal | | 5,715 | | |
| Interest | | 7,793 | | |
| Miscellaneous | | 16,058 | | |
| Total expenses before reductions | | 30,060,162 | | |
| Expense reductions | | (173,920) | | |
| Total expenses after reductions | | | | 29,886,242 |
| Net Investment income (loss) | | | | 39,358,351 |
| Realized and Unrealized Gain (Loss) | | | | |
| Net realized gain (loss) on: | | | | |
| Investment Securities: | | | | |
| Unaffiliated issuers (net of foreign taxes of $39,393) | | 93,709,506 | | |
| Foreign currency transactions | | 54,977 | | |
| Total net realized gain (loss) | | | | 93,764,483 |
| Change in net unrealized appreciation (depreciation) on: | | | | |
| Investment Securities: | | | | |
| Unaffiliated issuers(net of increase in deferred foreign taxes of $1,424,171) | | 1,467,526,739 | | |
| Assets and liabilities in foreign currencies | | 2,400,260 | | |
| Total change in net unrealized appreciation (depreciation) | | | | 1,469,926,999 |
| Net gain (loss) | | | | 1,563,691,482 |
| Net increase (decrease) in net assets resulting from operations | | | $ | 1,603,049,833 |
| Statement of Changes in Net Assets |
| |
| | Six months ended April 30, 2023 (Unaudited) | | Year ended October 31, 2022 |
| Increase (Decrease) in Net Assets | | | | |
| Operations | | | | |
| Net investment income (loss) | $ | 39,358,351 | $ | 74,612,993 |
| Net realized gain (loss) | | 93,764,483 | | (261,677,190) |
| Change in net unrealized appreciation (depreciation) | | 1,469,926,999 | | (3,015,457,116) |
| Net increase (decrease) in net assets resulting from operations | | 1,603,049,833 | | (3,202,521,313) |
| Distributions to shareholders | | (57,098,273) | | (471,071,500) |
| Share transactions - net increase (decrease) | | (302,907,991) | | (103,633,659) �� |
| Total increase (decrease) in net assets | | 1,243,043,569 | | (3,777,226,472) |
| | | | | |
| Net Assets | | | | |
| Beginning of period | | 6,795,778,959 | | 10,573,005,431 |
| End of period | $ | 8,038,822,528 | $ | 6,795,778,959 |
| | | | | |
| | | | | |
Financial Highlights
| | Six months ended (Unaudited) April 30, 2023 | | Years ended October 31, 2022 | | 2021 | | 2020 | | 2019 | | 2018 |
Selected Per-Share Data | | | | | | | | | | | | |
| Net asset value, beginning of period | $ | 46.55 | $ | 69.79 | $ | 50.91 | $ | 49.51 | $ | 46.04 | $ | 50.18 |
| Income from Investment Operations | | | | | | | | | | | | |
Net investment income (loss) A,B | | .28 | | .47 | | .21 | | .13 | | .77 | | .68 |
| Net realized and unrealized gain (loss) | | 10.91 | | (20.64) | | 18.98 | | 1.97 | | 5.12 | | (4.27) |
| Total from investment operations | | 11.19 | | (20.17) | | 19.19 | | 2.10 | | 5.89 | | (3.59) |
| Distributions from net investment income | | (.39) | | (.20) | | (.11) | | (.70) | | (.68) | | (.52) |
| Distributions from net realized gain | | - | | (2.87) | | (.21) | | - | | (1.74) | | (.03) |
| Total distributions | | (.39) | | (3.07) | | (.31) C | | (.70) | | (2.42) | | (.55) |
| Net asset value, end of period | $ | 57.35 | $ | 46.55 | $ | 69.79 | $ | 50.91 | $ | 49.51 | $ | 46.04 |
Total Return D,E | | 24.11% | | (30.12)% | | 37.83% | | 4.25% | | 13.78% | | (7.23)% |
Ratios to Average Net Assets B,F,G | | | | | | | | | | | | |
| Expenses before reductions | | .80% H | | .95% | | .99% | | 1.04% | | .90% | | .97% |
| Expenses net of fee waivers, if any | | .80% H | | .95% | | .98% | | 1.04% | | .90% | | .97% |
| Expenses net of all reductions | | .80% H | | .94% | | .98% | | 1.03% | | .89% | | .96% |
| Net investment income (loss) | | 1.03% H | | .84% | | .33% | | .27% | | 1.68% | | 1.35% |
| Supplemental Data | | | | | | | | | | | | |
| Net assets, end of period (000 omitted) | $ | 7,487,725 | $ | 6,175,776 | $ | 8,981,609 | $ | 6,160,617 | $ | 6,182,831 | $ | 5,825,757 |
Portfolio turnover rate I | | 31% H | | 25% | | 30% J | | 41% | | 46% J | | 33% |
A Calculated based on average shares outstanding during the period.
B Net investment income (loss) is affected by the timing of the declaration of dividends by any underlying mutual funds or exchange-traded funds (ETFs). Net investment income (loss) of any mutual funds or ETFs is not included in the Fund's net investment income (loss) ratio.
C Total distributions per share do not sum due to rounding.
D Total returns for periods of less than one year are not annualized.
E Total returns would have been lower if certain expenses had not been reduced during the applicable periods shown.
F Fees and expenses of any underlying mutual funds or exchange-traded funds (ETFs) are not included in the Fund's expense ratio. The Fund indirectly bears its proportionate share of these expenses. For additional expense information related to investments in Fidelity Central Funds, please refer to the "Investments in Fidelity Central Funds" note found in the Notes to Financial Statements section of the most recent Annual or Semi-Annual report.
G Expense ratios reflect operating expenses of the class. Expenses before reductions do not reflect amounts reimbursed, waived, or reduced through arrangements with the investment adviser, brokerage services, or other offset arrangements, if applicable, and do not represent the amount paid by the class during periods when reimbursements, waivers or reductions occur.
H Annualized.
I Amount does not include the portfolio activity of any underlying mutual funds or exchange-traded funds (ETFs).
J Portfolio turnover rate excludes securities received or delivered in-kind.
| Fidelity® Overseas Fund Class K |
| |
| | Six months ended (Unaudited) April 30, 2023 | | Years ended October 31, 2022 | | 2021 | | 2020 | | 2019 | | 2018 |
Selected Per-Share Data | | | | | | | | | | | | |
| Net asset value, beginning of period | $ | 46.48 | $ | 69.68 | $ | 50.83 | $ | 49.43 | $ | 45.98 | $ | 50.11 |
| Income from Investment Operations | | | | | | | | | | | | |
Net investment income (loss) A,B | | .30 | | .54 | | .27 | | .19 | | .82 | | .73 |
| Net realized and unrealized gain (loss) | | 10.90 | | (20.60) | | 18.95 | | 1.96 | | 5.11 | | (4.26) |
| Total from investment operations | | 11.20 | | (20.06) | | 19.22 | | 2.15 | | 5.93 | | (3.53) |
| Distributions from net investment income | | (.44) | | (.26) | | (.16) | | (.75) | | (.73) | | (.57) |
| Distributions from net realized gain | | - | | (2.87) | | (.21) | | - | | (1.74) | | (.03) |
| Total distributions | | (.44) | | (3.14) C | | (.37) | | (.75) | | (2.48) C | | (.60) |
| Net asset value, end of period | $ | 57.24 | $ | 46.48 | $ | 69.68 | $ | 50.83 | $ | 49.43 | $ | 45.98 |
Total Return D,E | | 24.19% | | (30.04)% | | 37.97% | | 4.36% | | 13.90% | | (7.13)% |
Ratios to Average Net Assets B,F,G | | | | | | | | | | | | |
| Expenses before reductions | | .70% H | | .84% | | .89% | | .94% | | .78% | | .86% |
| Expenses net of fee waivers, if any | | .69% H | | .84% | | .88% | | .93% | | .78% | | .86% |
| Expenses net of all reductions | | .69% H | | .84% | | .88% | | .93% | | .77% | | .85% |
| Net investment income (loss) | | 1.14% H | | .94% | | .43% | | .38% | | 1.79% | | 1.46% |
| Supplemental Data | | | | | | | | | | | | |
| Net assets, end of period (000 omitted) | $ | 551,098 | $ | 620,003 | $ | 1,591,397 | $ | 1,022,402 | $ | 1,040,002 | $ | 1,026,091 |
Portfolio turnover rate I | | 31% H | | 25% | | 30% J | | 41% | | 46% J | | 33% |
A Calculated based on average shares outstanding during the period.
B Net investment income (loss) is affected by the timing of the declaration of dividends by any underlying mutual funds or exchange-traded funds (ETFs). Net investment income (loss) of any mutual funds or ETFs is not included in the Fund's net investment income (loss) ratio.
C Total distributions per share do not sum due to rounding.
D Total returns for periods of less than one year are not annualized.
E Total returns would have been lower if certain expenses had not been reduced during the applicable periods shown.
F Fees and expenses of any underlying mutual funds or exchange-traded funds (ETFs) are not included in the Fund's expense ratio. The Fund indirectly bears its proportionate share of these expenses. For additional expense information related to investments in Fidelity Central Funds, please refer to the "Investments in Fidelity Central Funds" note found in the Notes to Financial Statements section of the most recent Annual or Semi-Annual report.
G Expense ratios reflect operating expenses of the class. Expenses before reductions do not reflect amounts reimbursed, waived, or reduced through arrangements with the investment adviser, brokerage services, or other offset arrangements, if applicable, and do not represent the amount paid by the class during periods when reimbursements, waivers or reductions occur.
H Annualized.
I Amount does not include the portfolio activity of any underlying mutual funds or exchange-traded funds (ETFs).
J Portfolio turnover rate excludes securities received or delivered in-kind.
For the period ended April 30, 2023
1. Organization.
Fidelity Overseas Fund (the Fund) is a fund of Fidelity Investment Trust (the Trust) and is authorized to issue an unlimited number of shares. The Trust is registered under the Investment Company Act of 1940, as amended (the 1940 Act), as an open-end management investment company organized as a Massachusetts business trust. The Fund offers Overseas and Class K shares, each of which has equal rights as to assets and voting privileges. Each class has exclusive voting rights with respect to matters that affect that class.
2. Investments in Fidelity Central Funds.
Funds may invest in Fidelity Central Funds, which are open-end investment companies generally available only to other investment companies and accounts managed by the investment adviser and its affiliates. The Schedule of Investments lists any Fidelity Central Funds held as an investment as of period end, but does not include the underlying holdings of each Fidelity Central Fund. An investing fund indirectly bears its proportionate share of the expenses of the underlying Fidelity Central Funds.
Based on its investment objective, each Fidelity Central Fund may invest or participate in various investment vehicles or strategies that are similar to those of the investing fund. These strategies are consistent with the investment objectives of the investing fund and may involve certain economic risks which may cause a decline in value of each of the Fidelity Central Funds and thus a decline in the value of the investing fund.
| Fidelity Central Fund | Investment Manager | Investment Objective | Investment Practices | Expense Ratio A |
| Fidelity Money Market Central Funds | Fidelity Management & Research Company LLC (FMR) | Each fund seeks to obtain a high level of current income consistent with the preservation of capital and liquidity. | Short-term Investments | Less than .005% |
A Expenses expressed as a percentage of average net assets and are as of each underlying Central Fund's most recent annual or semi-annual shareholder report.
A complete unaudited list of holdings for each Fidelity Central Fund is available upon request or at the Securities and Exchange Commission website at www.sec.gov. In addition, the financial statements of the Fidelity Central Funds which contain the significant accounting policies (including investment valuation policies) of those funds, and are not covered by the Report of Independent Registered Public Accounting Firm, are available on the Securities and Exchange Commission website or upon request.
3. Significant Accounting Policies.
The Fund is an investment company and applies the accounting and reporting guidance of the Financial Accounting Standards Board (FASB) Accounting Standards Codification Topic 946 Financial Services - Investment Companies . The financial statements have been prepared in conformity with accounting principles generally accepted in the United States of America (GAAP), which require management to make certain estimates and assumptions at the date of the financial statements. Actual results could differ from those estimates. Subsequent events, if any, through the date that the financial statements were issued have been evaluated in the preparation of the financial statements. The Fund's Schedule of Investments lists any underlying mutual funds or exchange-traded funds (ETFs) but does not include the underlying holdings of these funds. The following summarizes the significant accounting policies of the Fund:
Investment Valuation. Investments are valued as of 4:00 p.m. Eastern time on the last calendar day of the period. The Board of Trustees (the Board) has designated the Fund's investment adviser as the valuation designee responsible for the fair valuation function and performing fair value determinations as needed. The investment adviser has established a Fair Value Committee (the Committee) to carry out the day-to-day fair valuation responsibilities and has adopted policies and procedures to govern the fair valuation process and the activities of the Committee. In accordance with these fair valuation policies and procedures, which have been approved by the Board, the Fund attempts to obtain prices from one or more third party pricing services or brokers to value its investments. When current market prices, quotations or currency exchange rates are not readily available or reliable, investments will be fair valued in good faith by the Committee, in accordance with the policies and procedures. Factors used in determining fair value vary by investment type and may include market or investment specific events, transaction data, estimated cash flows, and market observations of comparable investments. The frequency that the fair valuation procedures are used cannot be predicted and they may be utilized to a significant extent. The Committee manages the Fund's fair valuation practices and maintains the fair valuation policies and procedures. The Fund's investment adviser reports to the Board information regarding the fair valuation process and related material matters.
The Fund categorizes the inputs to valuation techniques used to value its investments into a disclosure hierarchy consisting of three levels as shown below:
Level 1 - unadjusted quoted prices in active markets for identical investments
Level 2 - other significant observable inputs (including quoted prices for similar investments, interest rates, prepayment speeds, etc.)
Level 3 - unobservable inputs (including the Fund's own assumptions based on the best information available)
Valuation techniques used to value the Fund's investments by major category are as follows:
Equity securities, including restricted securities, for which market quotations are readily available, are valued at the last reported sale price or official closing price as reported by a third party pricing service on the primary market or exchange on which they are traded and are categorized as Level 1 in the hierarchy. In the event there were no sales during the day or closing prices are not available, securities are valued at the last quoted bid price or may be valued using the last available price and are generally categorized as Level 2 in the hierarchy. For foreign equity securities, when market or security specific events arise, comparisons to the valuation of American Depositary Receipts (ADRs), futures contracts, Exchange-Traded Funds (ETFs) and certain indexes as well as quoted prices for similar securities may be used and would be categorized as Level 2 in the hierarchy. For equity securities, including restricted securities, where observable inputs are limited, assumptions about market activity and risk are used and these securities may be categorized as Level 3 in the hierarchy.
Investments in open-end mutual funds, including the Fidelity Central Funds, are valued at their closing net asset value (NAV) each business day and are categorized as Level 1 in the hierarchy.
Changes in valuation techniques may result in transfers in or out of an assigned level within the disclosure hierarchy. The aggregate value of investments by input level as of April 30, 2023 is included at the end of the Fund's Schedule of Investments.
Foreign Currency. Certain Funds may use foreign currency contracts to facilitate transactions in foreign-denominated securities. Gains and losses from these transactions may arise from changes in the value of the foreign currency or if the counterparties do not perform under the contracts' terms.
Foreign-denominated assets, including investment securities, and liabilities are translated into U.S. dollars at the exchange rates at period end. Purchases and sales of investment securities, income and dividends received, and expenses denominated in foreign currencies are translated into U.S. dollars at the exchange rate in effect on the transaction date.
The effects of exchange rate fluctuations on investments are included with the net realized and unrealized gain (loss) on investment securities. Other foreign currency transactions resulting in realized and unrealized gain (loss) are disclosed separately.
Investment Transactions and Income. For financial reporting purposes, the Fund's investment holdings and NAV include trades executed through the end of the last business day of the period. The NAV per share for processing shareholder transactions is calculated as of the close of business of the New York Stock Exchange (NYSE), normally 4:00 p.m. Eastern time and includes trades executed through the end of the prior business day. Gains and losses on securities sold are determined on the basis of identified cost and include proceeds received from litigation. Commissions paid to certain brokers with whom the investment adviser, or its affiliates, places trades on behalf of a fund include an amount in addition to trade execution, which may be rebated back to a fund. Any such rebates are included in net realized gain (loss) on investments in the Statement of Operations. Dividend income is recorded on the ex-dividend date, except for certain dividends from foreign securities where the ex-dividend date may have passed, which are recorded as soon as the Fund is informed of the ex-dividend date. Non-cash dividends included in dividend income, if any, are recorded at the fair market value of the securities received. Income and capital gain distributions from Fidelity Central Funds, if any, are recorded on the ex-dividend date. Certain distributions received by the Fund represent a return of capital or capital gain. The Fund determines the components of these distributions subsequent to the ex-dividend date, based upon receipt of tax filings or other correspondence relating to the underlying investment. These distributions are recorded as a reduction of cost of investments and/or as a realized gain. Investment income is recorded net of foreign taxes withheld where recovery of such taxes is uncertain. Funds may file withholding tax reclaims in certain jurisdictions to recover a portion of amounts previously withheld. Any withholding tax reclaims income is included in the Statement of Operations in foreign tax reclaims. Any receivables for withholding tax reclaims are included in the Statement of Assets and Liabilities in reclaims receivable.
Class Allocations and Expenses. Investment income, realized and unrealized capital gains and losses, common expenses of a fund, and certain fund-level expense reductions, if any, are allocated daily on a pro-rata basis to each class based on the relative net assets of each class to the total net assets of a fund. Each class differs with respect to transfer agent and distribution and service plan fees incurred, as applicable. Certain expense reductions may also differ by class, if applicable. For the reporting period, the allocated portion of income and expenses to each class as a percent of its average net assets may vary due to the timing of recording these transactions in relation to fluctuating net assets of the classes. Expenses directly attributable to a fund are charged to that fund. Expenses attributable to more than one fund are allocated among the respective funds on the basis of relative net assets or other appropriate methods. Expenses included in the accompanying financial statements reflect the expenses of that fund and do not include any expenses associated with any underlying mutual funds or exchange-traded funds. Although not included in a fund's expenses, a fund indirectly bears its proportionate share of these expenses through the net asset value of each underlying mutual fund or exchange-traded fund. Expense estimates are accrued in the period to which they relate and adjustments are made when actual amounts are known.
Deferred Trustee Compensation. Under a Deferred Compensation Plan (the Plan) for certain Funds, certain independent Trustees have elected to defer receipt of a portion of their annual compensation. Deferred amounts are invested in affiliated mutual funds, are marked-to-market and remain in a fund until distributed in accordance with the Plan. The investment of deferred amounts and the offsetting payable to the Trustees presented below are included in the accompanying Statement of Assets and Liabilities in other receivables and other payables and accrued expenses, as applicable.
| Fidelity Overseas Fund | $244,885 |
Income Tax Information and Distributions to Shareholders. Each year, the Fund intends to qualify as a regulated investment company under Subchapter M of the Internal Revenue Code, including distributing substantially all of its taxable income and realized gains. As a result, no provision for U.S. Federal income taxes is required. The Fund files a U.S. federal tax return, in addition to state and local tax returns as required. The Fund's federal income tax returns are subject to examination by the Internal Revenue Service (IRS) for a period of three fiscal years after they are filed. State and local tax returns may be subject to examination for an additional fiscal year depending on the jurisdiction. Foreign taxes are provided for based on the Fund's understanding of the tax rules and rates that exist in the foreign markets in which it invests. The Fund is subject to a tax imposed on capital gains by certain countries in which it invests. An estimated deferred tax liability for net unrealized appreciation on the applicable securities is included in Other payables and accrued expenses on the Statement of Assets & Liabilities.
Distributions are declared and recorded on the ex-dividend date. Income and capital gain distributions are declared separately for each class. Income and capital gain distributions are determined in accordance with income tax regulations, which may differ from GAAP.
Capital accounts within the financial statements are adjusted for permanent book-tax differences. These adjustments have no impact on net assets or the results of operations. Capital accounts are not adjusted for temporary book-tax differences which will reverse in a subsequent period.
Book-tax differences are primarily due to futures contracts, foreign currency transactions, certain foreign taxes, deferred trustees compensation, capital loss carryforwards and losses deferred due to wash sales.
As of period end, the cost and unrealized appreciation (depreciation) in securities, and derivatives if applicable, for federal income tax purposes were as follows:
| Gross unrealized appreciation | $2,437,174,328 |
| Gross unrealized depreciation | (208,425,184) |
| Net unrealized appreciation (depreciation) | $2,228,749,144 |
| Tax cost | $5,810,699,043 |
Capital loss carryforwards are only available to offset future capital gains of the Fund to the extent provided by regulations and may be limited. The capital loss carryforward information presented below, including any applicable limitation, is estimated as of prior fiscal period end and is subject to adjustment.
Short-term | $(248,124,930) |
| Total capital loss carryforward | $(248,124,930) |
Restricted Securities (including Private Placements). Funds may invest in securities that are subject to legal or contractual restrictions on resale. These securities generally may be resold in transactions exempt from registration or to the public if the securities are registered. Disposal of these securities may involve time-consuming negotiations and expense, and prompt sale at an acceptable price may be difficult. Information regarding restricted securities held at period end is included at the end of the Schedule of Investments, if applicable.
4. Purchases and Sales of Investments.
Purchases and sales of securities, other than short-term securities and in-kind transactions, as applicable, are noted in the table below.
| | Purchases ($) | Sales ($) |
| Fidelity Overseas Fund | 1,158,711,621 | 1,364,638,219 |
5. Fees and Other Transactions with Affiliates.
Management Fee. Fidelity Management & Research Company LLC (the investment adviser) and its affiliates provide the Fund with investment management related services for which the Fund pays a monthly management fee. The management fee is the sum of an individual fund fee rate that is based on an annual rate of .424% of the Fund's average net assets and an annualized group fee rate that averaged .23% during the period. The group fee rate is based upon the monthly average net assets of a group of registered investment companies with which the investment adviser has management contracts. The group fee rate decreases as assets under management increase and increases as assets under management decrease. In addition, the management fee is subject to a performance adjustment (up to a maximum of +/- .20% of the Fund's average net assets over a 36 month performance period). The upward or downward adjustment to the management fee is based on the relative investment performance of the Overseas Fund as compared to its benchmark index, the MSCI EAFE Index, over the same 36 month performance period. For the reporting period, the total annualized management fee rate, including the performance adjustment, was .63% of the Fund's average net assets. The performance adjustment included in the management fee rate may be higher or lower than the maximum performance adjustment rate due to the difference between the average net assets for the reporting and performance periods.
Transfer Agent Fees. Fidelity Investments Institutional Operations Company LLC (FIIOC), an affiliate of the investment adviser, is the transfer, dividend disbursing and shareholder servicing agent for each class of the Fund. FIIOC receives account fees and asset-based fees that vary according to the account size and type of account of the shareholders of Overseas, except for Class K. FIIOC receives an asset-based fee of Class K's average net assets. FIIOC pays for typesetting, printing and mailing of shareholder reports, except proxy statements.
For the period, transfer agent fees for each class were as follows:
| | Amount | % of Class-Level Average Net Assets A |
| Overseas | $ 5,119,621 | .15 |
| Class K | 125,951 | .04 |
| | $5,245,572 | |
A Annualized
Accounting Fees. Fidelity Service Company, Inc. (FSC), an affiliate of the investment adviser, maintains the Fund's accounting records. The accounting fee is based on the level of average net assets for each month. For the period, the fees were equivalent to the following annualized rates:
| | % of Average Net Assets |
| Fidelity Overseas Fund | .02 |
Brokerage Commissions. A portion of portfolio transactions were placed with brokerage firms which are affiliates of the investment adviser. Brokerage commissions are included in net realized gain (loss) and change in net unrealized appreciation (depreciation) in the Statement of Operations. The commissions paid to these affiliated firms were as follows:
| | Amount |
| Fidelity Overseas Fund | $568 |
Interfund Lending Program. Pursuant to an Exemptive Order issued by the Securities and Exchange Commission (the SEC), the Fund, along with other registered investment companies having management contracts with Fidelity Management & Research Company LLC (FMR), or other affiliated entities of FMR, may participate in an interfund lending program. This program provides an alternative credit facility allowing the Fund to borrow from, or lend money to, other participating affiliated funds. At period end, there were no interfund loans outstanding. Activity in this program during the period for which loans were outstanding was as follows:
| | Borrower or Lender | Average Loan Balance | Weighted Average Interest Rate | Interest Expense |
Fidelity International Capital Appreciation Fund | Borrower | $ 32,348,500 | 4.34% | $7,793 |
Interfund Trades. Funds may purchase from or sell securities to other Fidelity Funds under procedures adopted by the Board. The procedures have been designed to ensure these interfund trades are executed in accordance with Rule 17a-7 of the 1940 Act. Any interfund trades are included within the respective purchases and sales amounts shown in the Purchases and Sales of Investments note. Interfund trades during the period are noted in the table below.
| | Purchases ($) | Sales ($) | Realized Gain (Loss) ($) |
| Fidelity Overseas Fund | 23,061,367 | 102,759,041 | (9,440,693) |
6. Committed Line of Credit.
Certain Funds participate with other funds managed by the investment adviser or an affiliate in a $4.25 billion credit facility (the "line of credit") to be utilized for temporary or emergency purposes to fund shareholder redemptions or for other short-term liquidity purposes. The participating funds have agreed to pay commitment fees on their pro-rata portion of the line of credit, which are reflected in Miscellaneous expenses on the Statement of Operations, and are listed below. During the period, there were no borrowings on this line of credit.
| | Amount |
| Fidelity Overseas Fund | $7,270 |
7. Security Lending.
Funds lend portfolio securities from time to time in order to earn additional income. Lending agents are used, including National Financial Services (NFS), an affiliate of the investment adviser. Pursuant to a securities lending agreement, NFS will receive a fee, which is capped at 9.9% of a fund's daily lending revenue, for its services as lending agent. A fund may lend securities to certain qualified borrowers, including NFS. On the settlement date of the loan, a fund receives collateral (in the form of U.S. Treasury obligations, letters of credit and/or cash) against the loaned securities and maintains collateral in an amount not less than 100% of the market value of the loaned securities during the period of the loan. The market value of the loaned securities is determined at the close of business of a fund and any additional required collateral is delivered to a fund on the next business day. A fund or borrower may terminate the loan at any time, and if the borrower defaults on its obligation to return the securities loaned because of insolvency or other reasons, a fund may apply collateral received from the borrower against the obligation. A fund may experience delays and costs in recovering the securities loaned. Any cash collateral received is invested in the Fidelity Securities Lending Cash Central Fund. Any loaned securities are identified as such in the Schedule of Investments, and the value of loaned securities and cash collateral at period end, as applicable, are presented in the Statement of Assets and Liabilities. Security lending income represents the income earned on investing cash collateral, less rebates paid to borrowers and any lending agent fees associated with the loan, plus any premium payments received for lending certain types of securities. Security lending income is presented in the Statement of Operations as a component of income from Fidelity Central Funds. Affiliated security lending activity, if any, was as follows:
| | Total Security Lending Fees Paid to NFS | Security Lending Income From Securities Loaned to NFS | Value of Securities Loaned to NFS at Period End |
| Fidelity Overseas Fund | $49,151 | $- | $- |
8. Expense Reductions.
Through arrangements with the Fund's custodian, credits realized as a result of certain uninvested cash balances were used to reduce the Fund's expenses. During the period, custodian credits reduced the Fund's expenses by $214.
In addition, during the period the investment adviser or an affiliate reimbursed and/or waived a portion of fund-level operating expenses in the amount of $173,706.
9. Distributions to Shareholders.
Distributions to shareholders of each class were as follows:
| | Six months ended April 30, 2023 | Year ended October 31, 2022 |
| Fidelity Overseas Fund | | |
| Distributions to shareholders | | |
| Overseas | $ 51,233,808 | $398,074,722 |
| Class K | 5,864,465 | 72,996,778 |
Total | $57,098,273 | $471,071,500 |
10. Share Transactions.
Share transactions for each class were as follows and may contain in-kind transactions, automatic conversions between classes or exchanges between affiliated funds:
| | Shares | Shares | Dollars | Dollars |
| | Six months ended April 30, 2023 | Year ended October 31, 2022 | Six months ended April 30, 2023 | Year ended October 31, 2022 |
| Fidelity Overseas Fund | | | | |
| Overseas | | | | |
| Shares sold | 6,053,153 | 40,345,843 | $323,489,781 | $2,183,494,857 |
| Reinvestment of distributions | 849,241 | 5,519,644 | 44,738,039 | 355,685,872 |
| Shares redeemed | (9,013,140) | (41,890,883) | (472,634,825) | (2,190,097,209) |
| Net increase (decrease) | (2,110,746) | 3,974,604 | $(104,407,005) | $349,083,520 |
| Class K | | | | |
| Shares sold | 1,198,557 | 4,842,077 | $64,463,555 | $287,643,692 |
| Reinvestment of distributions | 111,598 | 1,135,606 | 5,864,465 | 72,996,779 |
| Shares redeemed | (5,021,175) | (15,475,778) | (268,829,006) | (813,357,650) |
| Net increase (decrease) | (3,711,020) | (9,498,095) | $(198,500,986) | $(452,717,179) |
11. Other.
A fund's organizational documents provide former and current trustees and officers with a limited indemnification against liabilities arising in connection with the performance of their duties to the fund. In the normal course of business, a fund may also enter into contracts that provide general indemnifications. A fund's maximum exposure under these arrangements is unknown as this would be dependent on future claims that may be made against a fund. The risk of material loss from such claims is considered remote.
At the end of the period, the following mutual funds managed by the investment adviser or its affiliates were the owners of record of 10% or more of the total outstanding shares.
| | Strategic Advisers Fidelity International Fund |
| Fidelity Overseas Fund | 29% |
Mutual funds managed by the investment adviser or its affiliates, in aggregate, were the owners of record of more than 20% of the total outstanding shares.
| Fund | % of shares held |
| Fidelity Overseas Fund | 49% |
12. Risk and Uncertainties.
Many factors affect a fund's performance. Developments that disrupt global economies and financial markets, such as pandemics, epidemics, outbreaks of infectious diseases, war, terrorism, and environmental disasters, may significantly affect a fund's investment performance. The effects of these developments to a fund will be impacted by the types of securities in which a fund invests, the financial condition, industry, economic sector, and geographic location of an issuer, and a fund's level of investment in the securities of that issuer. Significant concentrations in security types, issuers, industries, sectors, and geographic locations may magnify the factors that affect a fund's performance.
Top Holdings (% of Fund's net assets) |
| |
| Microsoft Corp. (United States of America, Software) | 5.6 | |
| Meta Platforms, Inc. Class A (United States of America, Interactive Media & Services) | 4.2 | |
| S&P Global, Inc. (United States of America, Capital Markets) | 3.4 | |
| Fiserv, Inc. (United States of America, Financial Services) | 3.2 | |
| Eli Lilly & Co. (United States of America, Pharmaceuticals) | 3.2 | |
| Apple, Inc. (United States of America, Technology Hardware, Storage & Peripherals) | 3.1 | |
| NVIDIA Corp. (United States of America, Semiconductors & Semiconductor Equipment) | 2.8 | |
| Alphabet, Inc. Class A (United States of America, Interactive Media & Services) | 2.5 | |
| TJX Companies, Inc. (United States of America, Specialty Retail) | 2.4 | |
| Cummins, Inc. (United States of America, Machinery) | 2.0 | |
| | 32.4 | |
| |
| Market Sectors (% of Fund's net assets) |
| |
| Information Technology | 22.0 | |
| Financials | 17.6 | |
| Consumer Discretionary | 15.1 | |
| Health Care | 12.6 | |
| Industrials | 11.2 | |
| Communication Services | 9.8 | |
| Consumer Staples | 3.7 | |
| Materials | 2.9 | |
| Energy | 1.7 | |
| Real Estate | 0.8 | |
| |
Asset Allocation (% of Fund's net assets) |
|
|
Geographic Diversification (% of Fund's net assets) |
|
* Includes Short-Term investments and Net Other Assets (Liabilities). Percentages are adjusted for the effect of derivatives, if applicable. |
| |
Fidelity® Worldwide Fund
Showing Percentage of Net Assets
| Common Stocks - 97.1% |
| | | Shares | Value ($) |
| Australia - 2.0% | | | |
| Aub Group Ltd. | | 220,000 | 4,032,036 |
| carsales.com Ltd. | | 544,560 | 8,635,801 |
| Flutter Entertainment PLC (a) | | 46,300 | 9,260,545 |
| Glencore PLC | | 1,280,000 | 7,555,371 |
| Lovisa Holdings Ltd. | | 357,317 | 6,339,219 |
| National Storage REIT unit | | 4,853,097 | 8,083,226 |
TOTAL AUSTRALIA | | | 43,906,198 |
| Austria - 0.3% | | | |
| Wienerberger AG | | 203,600 | 6,124,669 |
| Belgium - 0.5% | | | |
| Azelis Group NV | | 68,300 | 1,618,085 |
| Fagron NV | | 185,330 | 3,443,067 |
| UCB SA | | 60,600 | 5,637,157 |
TOTAL BELGIUM | | | 10,698,309 |
| Canada - 1.3% | | | |
| Constellation Software, Inc. | | 3,700 | 7,241,934 |
| Definity Financial Corp. | | 144,900 | 3,930,380 |
| Franco-Nevada Corp. | | 100 | 15,174 |
| Lumine Group, Inc. | | 11,101 | 149,532 |
| PrairieSky Royalty Ltd. | | 836,068 | 13,193,441 |
| Shopify, Inc. Class A (a) | | 46,000 | 2,228,700 |
| Thomson Reuters Corp. | | 18,000 | 2,366,963 |
TOTAL CANADA | | | 29,126,124 |
| China - 1.3% | | | |
| Centre Testing International Group Co. Ltd. (A Shares) | | 959,500 | 2,677,089 |
| Kweichow Moutai Co. Ltd. (A Shares) | | 18,100 | 4,618,297 |
| Meituan Class B (a)(b) | | 12,000 | 205,085 |
| PICC Property & Casualty Co. Ltd. (H Shares) | | 5,706,946 | 6,902,315 |
| Tencent Holdings Ltd. | | 182,800 | 8,119,266 |
| Trip.com Group Ltd. ADR (a) | | 160,600 | 5,702,906 |
TOTAL CHINA | | | 28,224,958 |
| Denmark - 1.4% | | | |
| DSV A/S | | 38,284 | 7,190,453 |
| GN Store Nord A/S (a)(c) | | 246,575 | 6,561,239 |
| Novo Nordisk A/S Series B | | 99,000 | 16,469,095 |
TOTAL DENMARK | | | 30,220,787 |
| Finland - 0.6% | | | |
| Nanoform Finland PLC (a) | | 754,800 | 1,863,040 |
| Olvi Oyj (A Shares) | | 86,661 | 2,826,556 |
| Sampo Oyj (A Shares) | | 159,551 | 8,080,193 |
TOTAL FINLAND | | | 12,769,789 |
| France - 2.4% | | | |
| L'Oreal SA | | 31,000 | 14,782,264 |
| LVMH Moet Hennessy Louis Vuitton SE | | 22,427 | 21,572,113 |
| Pernod Ricard SA | | 26,100 | 6,022,258 |
| TotalEnergies SE | | 101,941 | 6,514,024 |
| Worldline SA (a)(b) | | 113,900 | 4,942,442 |
TOTAL FRANCE | | | 53,833,101 |
| Germany - 1.3% | | | |
| Deutsche Post AG | | 204,311 | 9,827,277 |
| Gerresheimer AG | | 30,000 | 3,262,726 |
| Instone Real Estate Group BV (b)(c) | | 332,488 | 2,656,172 |
| Nexus AG | | 46,000 | 2,635,745 |
| Siemens Healthineers AG (b) | | 63,100 | 3,922,876 |
| Stabilus Se | | 118,586 | 7,735,659 |
TOTAL GERMANY | | | 30,040,455 |
| Hong Kong - 1.6% | | | |
| AIA Group Ltd. | | 761,327 | 8,288,625 |
| Hong Kong Exchanges and Clearing Ltd. | | 170,174 | 7,065,097 |
| Prudential PLC | | 1,366,086 | 20,902,537 |
TOTAL HONG KONG | | | 36,256,259 |
| Hungary - 0.1% | | | |
| Richter Gedeon PLC | | 86,900 | 2,097,089 |
| India - 0.2% | | | |
| HDFC Bank Ltd. | | 212,324 | 4,394,475 |
| Pine Labs Private Ltd. (a)(d)(e) | | 792 | 436,036 |
TOTAL INDIA | | | 4,830,511 |
| Indonesia - 0.9% | | | |
| PT Astra International Tbk | | 13,899,000 | 6,411,176 |
| PT Bank Central Asia Tbk | | 7,470,500 | 4,623,130 |
| PT Bank Rakyat Indonesia (Persero) Tbk | | 20,994,500 | 7,316,148 |
| PT United Tractors Tbk | | 1,194,000 | 2,357,047 |
TOTAL INDONESIA | | | 20,707,501 |
| Ireland - 0.5% | | | |
| Cairn Homes PLC | | 3,300,000 | 3,757,431 |
| Irish Residential Properties REIT PLC | | 2,591,367 | 2,946,801 |
| Kingspan Group PLC (Ireland) | | 61,900 | 4,276,617 |
TOTAL IRELAND | | | 10,980,849 |
| Italy - 0.8% | | | |
| BFF Bank SpA (b) | | 1,389,790 | 13,353,892 |
| MARR SpA | | 205,098 | 3,209,164 |
| Prada SpA | | 305,794 | 2,251,463 |
TOTAL ITALY | | | 18,814,519 |
| Japan - 4.9% | | | |
| FUJIFILM Holdings Corp. | | 87,992 | 4,586,141 |
| GMO Internet, Inc. | | 300,866 | 6,052,423 |
| Hitachi Ltd. | | 219,300 | 12,130,500 |
| Hoya Corp. | | 63,443 | 6,652,318 |
| Iriso Electronics Co. Ltd. | | 204,185 | 6,989,176 |
| Katitas Co. Ltd. | | 257,600 | 5,030,644 |
| Keyence Corp. | | 22,340 | 10,074,364 |
| Minebea Mitsumi, Inc. | | 352,600 | 6,529,672 |
| NOF Corp. | | 130,000 | 5,939,890 |
| PALTAC Corp. | | 130,991 | 5,025,719 |
| Pan Pacific International Holdings Ltd. | | 335,900 | 6,276,940 |
| Renesas Electronics Corp. (a) | | 226,031 | 2,945,737 |
| Shin-Etsu Chemical Co. Ltd. | | 262,015 | 7,476,813 |
| Sony Group Corp. | | 116,703 | 10,558,558 |
| Tsuruha Holdings, Inc. | | 85,000 | 5,567,137 |
| USS Co. Ltd. | | 324,600 | 5,454,576 |
| ZOZO, Inc. | | 129,400 | 2,723,140 |
TOTAL JAPAN | | | 110,013,748 |
| Kenya - 0.0% | | | |
| Safaricom Ltd. | | 5,920,700 | 718,320 |
| Luxembourg - 0.1% | | | |
| Novem Group SA | | 292,876 | 3,175,565 |
| Netherlands - 1.0% | | | |
| Argenx SE ADR (a) | | 16,000 | 6,206,080 |
| ASML Holding NV (Netherlands) | | 4,300 | 2,717,340 |
| Heineken NV (Bearer) | | 78,019 | 8,945,089 |
| IMCD NV | | 32,351 | 4,855,199 |
TOTAL NETHERLANDS | | | 22,723,708 |
| Norway - 1.2% | | | |
| Kongsberg Gruppen ASA | | 140,000 | 6,276,784 |
| Schibsted ASA: | | | |
| (A Shares) | | 71,700 | 1,270,235 |
| (B Shares) | | 502,297 | 8,135,128 |
| TGS ASA | | 696,049 | 10,894,288 |
| Volue A/S (a) | | 825,800 | 1,394,795 |
TOTAL NORWAY | | | 27,971,230 |
| Russia - 0.0% | | | |
| Fix Price Group Ltd. GDR (Reg. S) (a)(e) | | 139,553 | 51,541 |
| Spain - 1.2% | | | |
| Amadeus IT Holding SA Class A (a) | | 106,396 | 7,478,046 |
| CaixaBank SA (c) | | 1,697,900 | 6,284,958 |
| Cellnex Telecom SA (b) | | 89,256 | 3,758,034 |
| Cie Automotive SA | | 275,635 | 8,297,691 |
TOTAL SPAIN | | | 25,818,729 |
| Sweden - 4.0% | | | |
| Addlife AB | | 346,740 | 4,097,970 |
| Alfa Laval AB (c) | | 244,697 | 8,959,851 |
| Autoliv, Inc. (depository receipt) | | 76,777 | 6,552,404 |
| Dustin Group AB (a)(b) | | 2,062,288 | 7,082,733 |
| Evolution AB (b) | | 39,200 | 5,219,251 |
| Haypp Group (a) | | 525,000 | 1,863,472 |
| Hemnet Group AB | | 984,130 | 16,122,188 |
| HEXPOL AB (B Shares) | | 850,359 | 10,008,565 |
| Instalco AB | | 441,771 | 2,317,617 |
| INVISIO AB | | 157,312 | 3,229,060 |
| JM AB (B Shares) | | 95,942 | 1,537,123 |
| Kry International AB (a)(d)(e) | | 489 | 38,225 |
| Sandvik AB (c) | | 373,157 | 7,586,822 |
| Stillfront Group AB (a) | | 604,994 | 1,286,085 |
| Swedbank AB (A Shares) | | 727,850 | 12,633,512 |
TOTAL SWEDEN | | | 88,534,878 |
| Taiwan - 0.1% | | | |
| Taiwan Semiconductor Manufacturing Co. Ltd. | | 159,465 | 2,609,509 |
| United Kingdom - 4.2% | | | |
| AstraZeneca PLC (United Kingdom) | | 104,843 | 15,429,009 |
| Beazley PLC | | 1,175,500 | 8,797,379 |
| Clarkson PLC | | 166,062 | 6,469,651 |
| Diageo PLC | | 295,773 | 13,492,014 |
| Harbour Energy PLC | | 1,486,871 | 4,621,110 |
| Hiscox Ltd. | | 515,647 | 7,659,825 |
| Lancashire Holdings Ltd. | | 1,178,720 | 9,073,308 |
| NatWest Group PLC | | 2,198,900 | 7,243,395 |
| RS GROUP PLC | | 303,095 | 3,509,748 |
| Sabre Insurance Group PLC (b) | | 6,755,301 | 10,731,012 |
| WH Smith PLC | | 329,610 | 6,520,096 |
| Zegona Communications PLC (a) | | 30,559 | 19,779 |
TOTAL UNITED KINGDOM | | | 93,566,326 |
| United States of America - 65.2% | | | |
| Abbott Laboratories | | 65,000 | 7,180,550 |
| Accenture PLC Class A | | 19,000 | 5,325,510 |
| Advanced Micro Devices, Inc. (a) | | 216,000 | 19,303,920 |
| Alphabet, Inc. Class A (a) | | 518,000 | 55,602,120 |
| Amazon.com, Inc. (a) | | 197,000 | 20,773,650 |
| Analog Devices, Inc. | | 111,000 | 19,966,680 |
| Apple, Inc. | | 412,000 | 69,908,160 |
| Arcellx, Inc. (a) | | 64,000 | 2,731,520 |
| Arista Networks, Inc. (a) | | 65,000 | 10,410,400 |
| Arthur J. Gallagher & Co. | | 7,000 | 1,456,420 |
| AutoZone, Inc. (a) | | 9,500 | 25,301,445 |
| Block, Inc. Class A (a) | | 65,000 | 3,951,350 |
| Booking Holdings, Inc. (a) | | 3,500 | 9,402,085 |
| Boston Scientific Corp. (a) | | 126,000 | 6,567,120 |
| Celsius Holdings, Inc. (a) | | 76,000 | 7,263,320 |
| Chart Industries, Inc. (a) | | 50,000 | 6,655,000 |
| Chubb Ltd. | | 114,600 | 23,098,776 |
| Costco Wholesale Corp. | | 7,000 | 3,522,540 |
| Crocs, Inc. (a) | | 12,000 | 1,484,040 |
| Cummins, Inc. (c) | | 187,500 | 44,070,000 |
| Deckers Outdoor Corp. (a) | | 77,855 | 37,319,016 |
| Dick's Sporting Goods, Inc. | | 16,000 | 2,320,160 |
| Eaton Corp. PLC | | 117,000 | 19,553,040 |
| Eli Lilly & Co. | | 180,000 | 71,254,800 |
| Enphase Energy, Inc. (a) | | 9,000 | 1,477,800 |
| Estee Lauder Companies, Inc. Class A | | 51,000 | 12,582,720 |
| First Solar, Inc. (a) | | 35,000 | 6,390,300 |
| Fiserv, Inc. (a) | | 590,201 | 72,075,346 |
| Freeport-McMoRan, Inc. | | 356,000 | 13,495,960 |
| General Electric Co. | | 52,000 | 5,146,440 |
| Gilead Sciences, Inc. | | 343,000 | 28,198,030 |
| Hubbell, Inc. Class B | | 36,000 | 9,695,520 |
| ICON PLC (a) | | 9,900 | 1,907,631 |
| Ingersoll Rand, Inc. | | 107,000 | 6,101,140 |
| Intuitive Surgical, Inc. (a) | | 17,000 | 5,120,740 |
| J.B. Hunt Transport Services, Inc. | | 132,000 | 23,138,280 |
| Knight-Swift Transportation Holdings, Inc. Class A | | 233,100 | 13,128,192 |
| Lattice Semiconductor Corp. (a) | | 255,000 | 20,323,500 |
| Legend Biotech Corp. ADR (a) | | 103,500 | 7,111,485 |
| LGI Homes, Inc. (a) | | 79,000 | 9,385,200 |
| Lowe's Companies, Inc. | | 26,000 | 5,403,580 |
| lululemon athletica, Inc. (a) | | 7,800 | 2,963,454 |
| Marsh & McLennan Companies, Inc. | | 26,000 | 4,684,940 |
| Meta Platforms, Inc. Class A (a) | | 391,000 | 93,965,120 |
| Micron Technology, Inc. | | 231,000 | 14,867,160 |
| Microsoft Corp. | | 406,000 | 124,747,557 |
| Morgan Stanley | | 87,000 | 7,827,390 |
| Netflix, Inc. (a) | | 24,000 | 7,918,320 |
| NVIDIA Corp. | | 227,000 | 62,990,230 |
| Olin Corp. | | 97,000 | 5,373,800 |
| onsemi (a) | | 19,000 | 1,367,240 |
| Oracle Corp. | | 305,000 | 28,889,600 |
| Parker Hannifin Corp. | | 57,000 | 18,518,160 |
| Patrick Industries, Inc. | | 82,891 | 5,688,809 |
| RHI Magnesita NV | | 83,122 | 2,360,877 |
| Roblox Corp. (a) | | 130,000 | 4,628,000 |
| Roche Holding AG (participation certificate) | | 48,651 | 15,234,584 |
| S&P Global, Inc. | | 207,628 | 75,281,760 |
| Salesforce, Inc. (a) | | 173,000 | 34,318,010 |
| Sherwin-Williams Co. | | 28,000 | 6,651,120 |
| Skechers U.S.A., Inc. Class A (sub. vtg.) (a) | | 11,300 | 601,047 |
| Stripe, Inc. Class B (a)(d)(e) | | 10,000 | 201,300 |
| Stryker Corp. | | 24,000 | 7,191,600 |
| Tempur Sealy International, Inc. | | 155,000 | 5,807,850 |
| Teradyne, Inc. | | 164,000 | 14,986,320 |
| Tesla, Inc. (a) | | 145,000 | 23,824,950 |
| The Cooper Companies, Inc. | | 2,000 | 762,900 |
| The Travelers Companies, Inc. | | 123,339 | 22,341,626 |
| TJX Companies, Inc. | | 679,000 | 53,518,780 |
| UiPath, Inc. Class A (a) | | 69,000 | 971,520 |
| United Airlines Holdings, Inc. (a) | | 16,000 | 700,800 |
| United Rentals, Inc. | | 34,000 | 12,277,740 |
| UnitedHealth Group, Inc. | | 89,000 | 43,796,010 |
| Viking Therapeutics, Inc. (a) | | 179,764 | 3,830,771 |
| Visa, Inc. Class A | | 117,000 | 27,229,410 |
| Warner Bros Discovery, Inc. | | 344,000 | 4,681,840 |
| Zimmer Biomet Holdings, Inc. | | 14,000 | 1,938,160 |
TOTAL UNITED STATES OF AMERICA | | | 1,458,042,241 |
| TOTAL COMMON STOCKS (Cost $1,809,477,720) | | | 2,171,856,913 |
| | | | |
| Preferred Stocks - 0.3% |
| | | Shares | Value ($) |
| Convertible Preferred Stocks - 0.2% | | | |
| China - 0.2% | | | |
| ByteDance Ltd. Series E1 (a)(d)(e) | | 14,425 | 2,870,575 |
| dMed Biopharmaceutical Co. Ltd. Series C (a)(d)(e) | | 138,905 | 1,232,087 |
| | | | 4,102,662 |
| Ireland - 0.0% | | | |
| Circle Internet Financial Ltd. Series F (d)(e) | | 23,730 | 612,471 |
| United States of America - 0.0% | | | |
| Instacart, Inc. Series I (a)(d)(e) | | 8,000 | 356,240 |
| Stripe, Inc. Series H (a)(d)(e) | | 4,200 | 84,546 |
| | | | 440,786 |
TOTAL CONVERTIBLE PREFERRED STOCKS | | | 5,155,919 |
| Nonconvertible Preferred Stocks - 0.1% | | | |
| India - 0.1% | | | |
| Pine Labs Private Ltd.: | | | |
| Series 1 (a)(d)(e) | | 1,892 | 1,041,641 |
| Series A (a)(d)(e) | | 473 | 260,410 |
| Series B (a)(d)(e) | | 514 | 282,983 |
| Series B2 (a)(d)(e) | | 416 | 229,029 |
| Series C (a)(d)(e) | | 774 | 426,126 |
| Series C1 (a)(d)(e) | | 163 | 89,740 |
| Series D (a)(d)(e) | | 174 | 95,796 |
| | | | 2,425,725 |
| Sweden - 0.0% | | | |
| Kry International AB Series E (a)(d)(e) | | 2,824 | 220,749 |
TOTAL NONCONVERTIBLE PREFERRED STOCKS | | | 2,646,474 |
| TOTAL PREFERRED STOCKS (Cost $8,655,882) | | | 7,802,393 |
| | | | |
| Money Market Funds - 3.3% |
| | | Shares | Value ($) |
| Fidelity Cash Central Fund 4.88% (f) | | 53,035,038 | 53,045,645 |
| Fidelity Securities Lending Cash Central Fund 4.88% (f)(g) | | 20,252,577 | 20,254,603 |
| TOTAL MONEY MARKET FUNDS (Cost $73,296,784) | | | 73,300,248 |
| | | | |
| TOTAL INVESTMENT IN SECURITIES - 100.7% (Cost $1,891,430,386) | 2,252,959,554 |
NET OTHER ASSETS (LIABILITIES) - (0.7)% | (15,460,205) |
| NET ASSETS - 100.0% | 2,237,499,349 |
| | |
Legend
| (b) | Security exempt from registration under Rule 144A of the Securities Act of 1933. These securities may be resold in transactions exempt from registration, normally to qualified institutional buyers. At the end of the period, the value of these securities amounted to $51,871,497 or 2.3% of net assets. |
| (c) | Security or a portion of the security is on loan at period end. |
| (d) | Restricted securities (including private placements) - Investment in securities not registered under the Securities Act of 1933 (excluding 144A issues). At the end of the period, the value of restricted securities (excluding 144A issues) amounted to $8,477,954 or 0.4% of net assets. |
| (f) | Affiliated fund that is generally available only to investment companies and other accounts managed by Fidelity Investments. The rate quoted is the annualized seven-day yield of the fund at period end. A complete unaudited listing of the fund's holdings as of its most recent quarter end is available upon request. In addition, each Fidelity Central Fund's financial statements are available on the SEC's website or upon request. |
| (g) | Investment made with cash collateral received from securities on loan. |
| Additional information on each restricted holding is as follows: |
| Security | Acquisition Date | Acquisition Cost ($) |
| ByteDance Ltd. Series E1 | 11/18/20 | 1,580,608 |
| | | |
| Circle Internet Financial Ltd. Series F | 5/09/22 | 999,982 |
| | | |
| dMed Biopharmaceutical Co. Ltd. Series C | 12/01/20 | 1,972,888 |
| | | |
| Instacart, Inc. Series I | 2/26/21 | 1,000,000 |
| | | |
| Kry International AB | 5/14/21 | 212,376 |
| | | |
| Kry International AB Series E | 5/14/21 | 1,291,057 |
| | | |
| Pine Labs Private Ltd. | 6/30/21 | 295,305 |
| | | |
| Pine Labs Private Ltd. Series 1 | 6/30/21 | 705,451 |
| | | |
| Pine Labs Private Ltd. Series A | 6/30/21 | 176,363 |
| | | |
| Pine Labs Private Ltd. Series B | 6/30/21 | 191,650 |
| | | |
| Pine Labs Private Ltd. Series B2 | 6/30/21 | 155,110 |
| | | |
| Pine Labs Private Ltd. Series C | 6/30/21 | 288,594 |
| | | |
| Pine Labs Private Ltd. Series C1 | 6/30/21 | 60,776 |
| | | |
| Pine Labs Private Ltd. Series D | 6/30/21 | 64,878 |
| | | |
| Stripe, Inc. Class B | 5/18/21 | 401,284 |
| | | |
| Stripe, Inc. Series H | 3/15/21 | 168,525 |
| | | |
Affiliated Central Funds
Fiscal year to date information regarding the Fund's investments in Fidelity Central Funds, including the ownership percentage, is presented below.
| Affiliate | Value, beginning of period ($) | Purchases ($) | Sales Proceeds ($) | Dividend Income ($) | Realized Gain (loss) ($) | Change in Unrealized appreciation (depreciation) ($) | Value, end of period ($) | % ownership, end of period |
| Fidelity Cash Central Fund 4.88% | 15,584,500 | 561,034,661 | 523,573,517 | 712,650 | 81 | (80) | 53,045,645 | 0.1% |
| Fidelity Securities Lending Cash Central Fund 4.88% | 7,256,240 | 92,391,691 | 79,393,328 | 67,815 | - | - | 20,254,603 | 0.1% |
| Total | 22,840,740 | 653,426,352 | 602,966,845 | 780,465 | 81 | (80) | 73,300,248 | |
| | | | | | | | | |
Amounts in the dividend income column in the above table include any capital gain distributions from underlying funds, which are presented in the corresponding line item in the Statement of Operations, if applicable.
Amounts in the dividend income column for Fidelity Securities Lending Cash Central Fund represents the income earned on investing cash collateral, less rebates paid to borrowers and any lending agent fees associated with the loan, plus any premium payments received for lending certain types of securities.
Amounts included in the purchases and sales proceeds columns may include in-kind transactions, if applicable.
Investment Valuation
The following is a summary of the inputs used, as of April 30, 2023, involving the Fund's assets and liabilities carried at fair value. The inputs or methodology used for valuing securities may not be an indication of the risk associated with investing in those securities. For more information on valuation inputs, and their aggregation into the levels used below, please refer to the Investment Valuation section in the accompanying Notes to Financial Statements.
| Valuation Inputs at Reporting Date: |
| Description | Total ($) | Level 1 ($) | Level 2 ($) | Level 3 ($) |
Investments in Securities: | | | | |
|
| Equities: | | | | |
Communication Services | 217,730,811 | 194,347,135 | 20,513,101 | 2,870,575 |
Consumer Discretionary | 336,537,824 | 262,241,789 | 74,296,035 | - |
Consumer Staples | 83,239,140 | 59,153,911 | 23,677,448 | 407,781 |
Energy | 37,579,910 | 28,708,839 | 8,871,071 | - |
Financials | 394,814,148 | 317,148,961 | 77,052,716 | 612,471 |
Health Care | 275,774,160 | 220,757,067 | 53,785,006 | 1,232,087 |
Industrials | 256,541,359 | 225,376,821 | 31,164,538 | - |
Information Technology | 493,722,872 | 457,058,941 | 33,257,350 | 3,406,581 |
Materials | 65,002,239 | 44,030,165 | 20,972,074 | - |
Real Estate | 18,716,843 | 5,602,973 | 13,113,870 | - |
|
| Money Market Funds | 73,300,248 | 73,300,248 | - | - |
| Total Investments in Securities: | 2,252,959,554 | 1,887,726,850 | 356,703,209 | 8,529,495 |
| | | | | |
|
| Net Unrealized Depreciation on Unfunded Commitments | (498,191) | - | - | (498,191) |
| Total | (498,191) | - | - | (498,191) |
Fidelity® Worldwide Fund
| Statement of Assets and Liabilities |
| | | | April 30, 2023 (Unaudited) |
| | | | | |
| Assets | | | | |
| Investment in securities, at value (including securities loaned of $18,795,011) - See accompanying schedule: | | | | |
Unaffiliated issuers (cost $1,818,133,602) | $ | 2,179,659,306 | | |
Fidelity Central Funds (cost $73,296,784) | | 73,300,248 | | |
| | | | | |
| | | | | |
| Total Investment in Securities (cost $1,891,430,386) | | | $ | 2,252,959,554 |
| Foreign currency held at value (cost $3,280,746) | | | | 3,280,402 |
| Receivable for investments sold | | | | 20,050,980 |
| Receivable for fund shares sold | | | | 586,160 |
| Dividends receivable | | | | 2,879,340 |
| Reclaims receivable | | | | 2,496,599 |
| Distributions receivable from Fidelity Central Funds | | | | 210,988 |
| Prepaid expenses | | | | 886 |
| Other receivables | | | | 79,597 |
Total assets | | | | 2,282,544,506 |
| Liabilities | | | | |
| Payable for investments purchased | $ | 21,541,457 | | |
| Unrealized depreciation on unfunded commitments | | 498,191 | | |
| Payable for fund shares redeemed | | 1,385,823 | | |
| Accrued management fee | | 759,196 | | |
| Distribution and service plan fees payable | | 28,768 | | |
| Other affiliated payables | | 323,803 | | |
| Other payables and accrued expenses | | 253,316 | | |
| Collateral on securities loaned | | 20,254,603 | | |
| Total Liabilities | | | | 45,045,157 |
| Commitments and contingent liabilities (see Commitments note) | | | | |
| Net Assets | | | $ | 2,237,499,349 |
| Net Assets consist of: | | | | |
| Paid in capital | | | $ | 1,872,481,518 |
| Total accumulated earnings (loss) | | | | 365,017,831 |
| Net Assets | | | $ | 2,237,499,349 |
| | | | | |
| Net Asset Value and Maximum Offering Price | | | | |
| Class A : | | | | |
Net Asset Value and redemption price per share ($73,825,545 ÷ 2,751,711 shares) (a) | | | $ | 26.83 |
| Maximum offering price per share (100/94.25 of $26.83) | | | $ | 28.47 |
| Class M : | | | | |
Net Asset Value and redemption price per share ($16,352,601 ÷ 615,710 shares) (a) | | | $ | 26.56 |
| Maximum offering price per share (100/96.50 of $26.56) | | | $ | 27.52 |
| Class C : | | | | |
Net Asset Value and offering price per share ($8,453,585 ÷ 334,402 shares) (a) | | | $ | 25.28 |
| Worldwide : | | | | |
Net Asset Value , offering price and redemption price per share ($2,011,909,914 ÷ 73,620,452 shares) | | | $ | 27.33 |
| Class I : | | | | |
Net Asset Value , offering price and redemption price per share ($41,875,150 ÷ 1,544,189 shares) | | | $ | 27.12 |
| Class Z : | | | | |
Net Asset Value , offering price and redemption price per share ($85,082,554 ÷ 3,143,093 shares) | | | $ | 27.07 |
(a)Redemption price per share is equal to net asset value less any applicable contingent deferred sales charge. |
| Statement of Operations |
| | | | Six months ended April 30, 2023 (Unaudited) |
| Investment Income | | | | |
| Dividends | | | $ | 16,779,595 |
| Income from Fidelity Central Funds (including $67,815 from security lending) | | | | 780,465 |
| Income before foreign taxes withheld | | | $ | 17,560,060 |
| Less foreign taxes withheld | | | | (1,030,491) |
| Total Income | | | | 16,529,569 |
| Expenses | | | | |
| Management fee | | | | |
| Basic fee | $ | 7,038,755 | | |
| Performance adjustment | | (1,397,063) | | |
| Transfer agent fees | | 1,650,286 | | |
| Distribution and service plan fees | | 170,086 | | |
| Accounting fees | | 288,245 | | |
| Custodian fees and expenses | | 38,888 | | |
| Independent trustees' fees and expenses | | 7,169 | | |
| Registration fees | | 81,602 | | |
| Audit | | 48,991 | | |
| Legal | | 3,470 | | |
| Miscellaneous | | 4,889 | | |
| Total expenses before reductions | | 7,935,318 | | |
| Expense reductions | | (50,272) | | |
| Total expenses after reductions | | | | 7,885,046 |
| Net Investment income (loss) | | | | 8,644,523 |
| Realized and Unrealized Gain (Loss) | | | | |
| Net realized gain (loss) on: | | | | |
| Investment Securities: | | | | |
| Unaffiliated issuers | | 3,950,891 | | |
| Fidelity Central Funds | | 81 | | |
| Foreign currency transactions | | 868,572 | | |
| Total net realized gain (loss) | | | | 4,819,544 |
| Change in net unrealized appreciation (depreciation) on: | | | | |
| Investment Securities: | | | | |
| Unaffiliated issuers(net of increase in deferred foreign taxes of $96,861) | | 202,199,555 | | |
| Fidelity Central Funds | | (80) | | |
| Unfunded commitments | | (270,653) | | |
| Assets and liabilities in foreign currencies | | 276,043 | | |
| Total change in net unrealized appreciation (depreciation) | | | | 202,204,865 |
| Net gain (loss) | | | | 207,024,409 |
| Net increase (decrease) in net assets resulting from operations | | | $ | 215,668,932 |
| Statement of Changes in Net Assets |
| |
| | Six months ended April 30, 2023 (Unaudited) | | Year ended October 31, 2022 |
| Increase (Decrease) in Net Assets | | | | |
| Operations | | | | |
| Net investment income (loss) | $ | 8,644,523 | $ | 14,477,798 |
| Net realized gain (loss) | | 4,819,544 | | 145,952,644 |
| Change in net unrealized appreciation (depreciation) | | 202,204,865 | | (1,000,391,802) |
| Net increase (decrease) in net assets resulting from operations | | 215,668,932 | | (839,961,360) |
| Distributions to shareholders | | (124,836,814) | | (362,130,555) |
| Share transactions - net increase (decrease) | | 44,424,784 | | 68,731,196 |
| Total increase (decrease) in net assets | | 135,256,902 | | (1,133,360,719) |
| | | | | |
| Net Assets | | | | |
| Beginning of period | | 2,102,242,447 | | 3,235,603,166 |
| End of period | $ | 2,237,499,349 | $ | 2,102,242,447 |
| | | | | |
| | | | | |
Financial Highlights
| Fidelity Advisor® Worldwide Fund Class A |
| |
| | Six months ended (Unaudited) April 30, 2023 | | Years ended October 31, 2022 | | 2021 | | 2020 | | 2019 | | 2018 |
Selected Per-Share Data | | | | | | | | | | | | |
| Net asset value, beginning of period | $ | 25.75 | $ | 40.06 | $ | 31.49 | $ | 27.36 | $ | 26.57 | $ | 27.28 |
| Income from Investment Operations | | | | | | | | | | | | |
Net investment income (loss) A,B | | .07 | | .09 | | (.13) | | (.05) | | .11 | | .03 |
| Net realized and unrealized gain (loss) | | 2.49 | | (9.90) | | 11.40 | | 5.50 | | 2.84 | | 1.00 |
| Total from investment operations | | 2.56 | | (9.81) | | 11.27 | | 5.45 | | 2.95 | | 1.03 |
| Distributions from net investment income | | (.11) | | (.07) | | - | | (.12) | | (.02) | | (.09) |
| Distributions from net realized gain | | (1.37) | | (4.43) | | (2.70) | | (1.20) | | (2.14) | | (1.65) |
| Total distributions | | (1.48) | | (4.50) | | (2.70) | | (1.32) | | (2.16) | | (1.74) |
| Net asset value, end of period | $ | 26.83 | $ | 25.75 | $ | 40.06 | $ | 31.49 | $ | 27.36 | $ | 26.57 |
Total Return C,D,E | | 10.34% | | (27.31)% | | 37.72% | | 20.72% | | 12.35% | | 3.96% |
Ratios to Average Net Assets B,F,G | | | | | | | | | | | | |
| Expenses before reductions | | 1.01% H | | 1.21% | | 1.29% | | 1.34% | | 1.26% | | 1.23% |
| Expenses net of fee waivers, if any | | 1.01% H | | 1.21% | | 1.28% | | 1.34% | | 1.26% | | 1.23% |
| Expenses net of all reductions | | 1.01% H | | 1.21% | | 1.28% | | 1.33% | | 1.25% | | 1.22% |
| Net investment income (loss) | | .52% H | | .28% | | (.34)% | | (.18)% | | .41% | | .12% |
| Supplemental Data | | | | | | | | | | | | |
| Net assets, end of period (000 omitted) | $ | 73,826 | $ | 68,608 | $ | 99,731 | $ | 63,690 | $ | 52,516 | $ | 42,947 |
Portfolio turnover rate I | | 137% H | | 137% | | 96% | | 112% | | 147% | | 117% |
A Calculated based on average shares outstanding during the period.
B Net investment income (loss) is affected by the timing of the declaration of dividends by any underlying mutual funds or exchange-traded funds (ETFs). Net investment income (loss) of any mutual funds or ETFs is not included in the Fund's net investment income (loss) ratio.
C Total returns for periods of less than one year are not annualized.
D Total returns would have been lower if certain expenses had not been reduced during the applicable periods shown.
E Total returns do not include the effect of the sales charges.
F Fees and expenses of any underlying mutual funds or exchange-traded funds (ETFs) are not included in the Fund's expense ratio. The Fund indirectly bears its proportionate share of these expenses. For additional expense information related to investments in Fidelity Central Funds, please refer to the "Investments in Fidelity Central Funds" note found in the Notes to Financial Statements section of the most recent Annual or Semi-Annual report.
G Expense ratios reflect operating expenses of the class. Expenses before reductions do not reflect amounts reimbursed, waived, or reduced through arrangements with the investment adviser, brokerage services, or other offset arrangements, if applicable, and do not represent the amount paid by the class during periods when reimbursements, waivers or reductions occur.
H Annualized.
I Amount does not include the portfolio activity of any underlying mutual funds or exchange-traded funds (ETFs).
| Fidelity Advisor® Worldwide Fund Class M |
| |
| | Six months ended (Unaudited) April 30, 2023 | | Years ended October 31, 2022 | | 2021 | | 2020 | | 2019 | | 2018 |
Selected Per-Share Data | | | | | | | | | | | | |
| Net asset value, beginning of period | $ | 25.44 | $ | 39.62 | $ | 31.19 | $ | 27.10 | $ | 26.39 | $ | 27.11 |
| Income from Investment Operations | | | | | | | | | | | | |
Net investment income (loss) A,B | | .03 | | .01 | | (.22) | | (.13) | | .03 | | (.05) |
| Net realized and unrealized gain (loss) | | 2.48 | | (9.81) | | 11.29 | | 5.46 | | 2.82 | | 1.00 |
| Total from investment operations | | 2.51 | | (9.80) | | 11.07 | | 5.33 | | 2.85 | | .95 |
| Distributions from net investment income | | (.02) | | - | | - | | (.04) | | - | | (.02) |
| Distributions from net realized gain | | (1.37) | | (4.38) | | (2.64) | | (1.20) | | (2.14) | | (1.65) |
| Total distributions | | (1.39) | | (4.38) | | (2.64) | | (1.24) | | (2.14) | | (1.67) |
| Net asset value, end of period | $ | 26.56 | $ | 25.44 | $ | 39.62 | $ | 31.19 | $ | 27.10 | $ | 26.39 |
Total Return C,D,E | | 10.22% | | (27.53)% | | 37.37% | | 20.40% | | 12.05% | | 3.65% |
Ratios to Average Net Assets B,F,G | | | | | | | | | | | | |
| Expenses before reductions | | 1.27% H | | 1.47% | | 1.55% | | 1.61% | | 1.55% | | 1.52% |
| Expenses net of fee waivers, if any | | 1.27% H | | 1.47% | | 1.55% | | 1.61% | | 1.54% | | 1.52% |
| Expenses net of all reductions | | 1.26% H | | 1.47% | | 1.55% | | 1.61% | | 1.54% | | 1.51% |
| Net investment income (loss) | | .27% H | | .02% | | (.61)% | | (.45)% | | .13% | | (.17)% |
| Supplemental Data | | | | | | | | | | | | |
| Net assets, end of period (000 omitted) | $ | 16,353 | $ | 15,275 | $ | 22,771 | $ | 17,387 | $ | 13,066 | $ | 12,746 |
Portfolio turnover rate I | | 137% H | | 137% | | 96% | | 112% | | 147% | | 117% |
A Calculated based on average shares outstanding during the period.
B Net investment income (loss) is affected by the timing of the declaration of dividends by any underlying mutual funds or exchange-traded funds (ETFs). Net investment income (loss) of any mutual funds or ETFs is not included in the Fund's net investment income (loss) ratio.
C Total returns for periods of less than one year are not annualized.
D Total returns would have been lower if certain expenses had not been reduced during the applicable periods shown.
E Total returns do not include the effect of the sales charges.
F Fees and expenses of any underlying mutual funds or exchange-traded funds (ETFs) are not included in the Fund's expense ratio. The Fund indirectly bears its proportionate share of these expenses. For additional expense information related to investments in Fidelity Central Funds, please refer to the "Investments in Fidelity Central Funds" note found in the Notes to Financial Statements section of the most recent Annual or Semi-Annual report.
G Expense ratios reflect operating expenses of the class. Expenses before reductions do not reflect amounts reimbursed, waived, or reduced through arrangements with the investment adviser, brokerage services, or other offset arrangements, if applicable, and do not represent the amount paid by the class during periods when reimbursements, waivers or reductions occur.
H Annualized.
I Amount does not include the portfolio activity of any underlying mutual funds or exchange-traded funds (ETFs).
| Fidelity Advisor® Worldwide Fund Class C |
| |
| | Six months ended (Unaudited) April 30, 2023 | | Years ended October 31, 2022 | | 2021 | | 2020 | | 2019 | | 2018 |
Selected Per-Share Data | | | | | | | | | | | | |
| Net asset value, beginning of period | $ | 24.33 | $ | 38.05 | $ | 30.14 | $ | 26.33 | $ | 25.82 | $ | 26.67 |
| Income from Investment Operations | | | | | | | | | | | | |
Net investment income (loss) A,B | | (.03) | | (.15) | | (.39) | | (.27) | | (.10) | | (.18) |
| Net realized and unrealized gain (loss) | | 2.35 | | (9.39) | | 10.88 | | 5.28 | | 2.75 | | .98 |
| Total from investment operations | | 2.32 | | (9.54) | | 10.49 | | 5.01 | | 2.65 | | .80 |
| Distributions from net realized gain | | (1.37) | | (4.18) | | (2.58) | | (1.20) | | (2.14) | | (1.65) |
| Total distributions | | (1.37) | | (4.18) | | (2.58) | | (1.20) | | (2.14) | | (1.65) |
| Net asset value, end of period | $ | 25.28 | $ | 24.33 | $ | 38.05 | $ | 30.14 | $ | 26.33 | $ | 25.82 |
Total Return C,D,E | | 9.89% | | (27.89)% | | 36.63% | | 19.76% | | 11.49% | | 3.12% |
Ratios to Average Net Assets B,F,G | | | | | | | | | | | | |
| Expenses before reductions | | 1.81% H | | 2.00% | | 2.08% | | 2.14% | | 2.06% | | 2.01% |
| Expenses net of fee waivers, if any | | 1.81% H | | 2.00% | | 2.08% | | 2.14% | | 2.06% | | 2.01% |
| Expenses net of all reductions | | 1.81% H | | 2.00% | | 2.08% | | 2.13% | | 2.06% | | 2.00% |
| Net investment income (loss) | | (.28)% H | | (.51)% | | (1.14)% | | (.98)% | | (.39)% | | (.66)% |
| Supplemental Data | | | | | | | | | | | | |
| Net assets, end of period (000 omitted) | $ | 8,454 | $ | 8,517 | $ | 13,602 | $ | 11,677 | $ | 10,618 | $ | 12,744 |
Portfolio turnover rate I | | 137% H | | 137% | | 96% | | 112% | | 147% | | 117% |
A Calculated based on average shares outstanding during the period.
B Net investment income (loss) is affected by the timing of the declaration of dividends by any underlying mutual funds or exchange-traded funds (ETFs). Net investment income (loss) of any mutual funds or ETFs is not included in the Fund's net investment income (loss) ratio.
C Total returns for periods of less than one year are not annualized.
D Total returns would have been lower if certain expenses had not been reduced during the applicable periods shown.
E Total returns do not include the effect of the contingent deferred sales charge.
F Fees and expenses of any underlying mutual funds or exchange-traded funds (ETFs) are not included in the Fund's expense ratio. The Fund indirectly bears its proportionate share of these expenses. For additional expense information related to investments in Fidelity Central Funds, please refer to the "Investments in Fidelity Central Funds" note found in the Notes to Financial Statements section of the most recent Annual or Semi-Annual report.
G Expense ratios reflect operating expenses of the class. Expenses before reductions do not reflect amounts reimbursed, waived, or reduced through arrangements with the investment adviser, brokerage services, or other offset arrangements, if applicable, and do not represent the amount paid by the class during periods when reimbursements, waivers or reductions occur.
H Annualized.
I Amount does not include the portfolio activity of any underlying mutual funds or exchange-traded funds (ETFs).
| | Six months ended (Unaudited) April 30, 2023 | | Years ended October 31, 2022 | | 2021 | | 2020 | | 2019 | | 2018 |
Selected Per-Share Data | | | | | | | | | | | | |
| Net asset value, beginning of period | $ | 26.26 | $ | 40.76 | $ | 31.97 | $ | 27.74 | $ | 26.90 | $ | 27.61 |
| Income from Investment Operations | | | | | | | | | | | | |
Net investment income (loss) A,B | | .11 | | .18 | | (.02) | | .03 | | .18 | | .11 |
| Net realized and unrealized gain (loss) | | 2.54 | | (10.09) | | 11.58 | | 5.58 | | 2.89 | | 1.00 |
| Total from investment operations | | 2.65 | | (9.91) | | 11.56 | | 5.61 | | 3.07 | | 1.11 |
| Distributions from net investment income | | (.21) | | (.16) | | (.02) | | (.18) | | (.09) | | (.17) |
| Distributions from net realized gain | | (1.37) | | (4.43) | | (2.75) | | (1.20) | | (2.14) | | (1.65) |
| Total distributions | | (1.58) | | (4.59) | | (2.77) | | (1.38) | | (2.23) | | (1.82) |
| Net asset value, end of period | $ | 27.33 | $ | 26.26 | $ | 40.76 | $ | 31.97 | $ | 27.74 | $ | 26.90 |
Total Return C,D | | 10.51% | | (27.12)% | | 38.11% | | 21.07% | | 12.71% | | 4.23% |
Ratios to Average Net Assets B,E,F | | | | | | | | | | | | |
| Expenses before reductions | | .72% G | | .92% | | 1.00% | | 1.05% | | .99% | | .94% |
| Expenses net of fee waivers, if any | | .72% G | | .92% | | 1.00% | | 1.05% | | .99% | | .94% |
| Expenses net of all reductions | | .72% G | | .92% | | 1.00% | | 1.05% | | .98% | | .93% |
| Net investment income (loss) | | .81% G | | .57% | | (.06)% | | .11% | | .69% | | .41% |
| Supplemental Data | | | | | | | | | | | | |
| Net assets, end of period (000 omitted) | $ | 2,011,910 | $ | 1,899,788 | $ | 2,896,684 | $ | 2,217,129 | $ | 2,020,487 | $ | 2,112,988 |
Portfolio turnover rate H | | 137% G | | 137% | | 96% | | 112% | | 147% | | 117% |
A Calculated based on average shares outstanding during the period.
B Net investment income (loss) is affected by the timing of the declaration of dividends by any underlying mutual funds or exchange-traded funds (ETFs). Net investment income (loss) of any mutual funds or ETFs is not included in the Fund's net investment income (loss) ratio.
C Total returns for periods of less than one year are not annualized.
D Total returns would have been lower if certain expenses had not been reduced during the applicable periods shown.
E Fees and expenses of any underlying mutual funds or exchange-traded funds (ETFs) are not included in the Fund's expense ratio. The Fund indirectly bears its proportionate share of these expenses. For additional expense information related to investments in Fidelity Central Funds, please refer to the "Investments in Fidelity Central Funds" note found in the Notes to Financial Statements section of the most recent Annual or Semi-Annual report.
F Expense ratios reflect operating expenses of the class. Expenses before reductions do not reflect amounts reimbursed, waived, or reduced through arrangements with the investment adviser, brokerage services, or other offset arrangements, if applicable, and do not represent the amount paid by the class during periods when reimbursements, waivers or reductions occur.
G Annualized.
H Amount does not include the portfolio activity of any underlying mutual funds or exchange-traded funds (ETFs).
| Fidelity Advisor® Worldwide Fund Class I |
| |
| | Six months ended (Unaudited) April 30, 2023 | | Years ended October 31, 2022 | | 2021 | | 2020 | | 2019 | | 2018 |
Selected Per-Share Data | | | | | | | | | | | | |
| Net asset value, beginning of period | $ | 26.04 | $ | 40.46 | $ | 31.77 | $ | 27.58 | $ | 26.77 | $ | 27.49 |
| Income from Investment Operations | | | | | | | | | | | | |
Net investment income (loss) A,B | | .11 | | .17 | | (.03) | | .03 | | .18 | | .11 |
| Net realized and unrealized gain (loss) | | 2.53 | | (10.01) | | 11.49 | | 5.55 | | 2.86 | | .99 |
| Total from investment operations | | 2.64 | | (9.84) | | 11.46 | | 5.58 | | 3.04 | | 1.10 |
| Distributions from net investment income | | (.19) | | (.16) | | (.02) | | (.19) | | (.09) | | (.18) |
| Distributions from net realized gain | | (1.37) | | (4.43) | | (2.75) | | (1.20) | | (2.14) | | (1.65) |
| Total distributions | | (1.56) | | (4.58) C | | (2.77) | | (1.39) | | (2.23) | | (1.82) C |
| Net asset value, end of period | $ | 27.12 | $ | 26.04 | $ | 40.46 | $ | 31.77 | $ | 27.58 | $ | 26.77 |
Total Return D,E | | 10.52% | | (27.13)% | | 38.06% | | 21.08% | | 12.70% | | 4.22% |
Ratios to Average Net Assets B,F,G | | | | | | | | | | | | |
| Expenses before reductions | | .72% H | | .94% | | 1.02% | | 1.06% | | .99% | | .96% |
| Expenses net of fee waivers, if any | | .72% H | | .93% | | 1.02% | | 1.06% | | .99% | | .95% |
| Expenses net of all reductions | | .72% H | | .93% | | 1.02% | | 1.05% | | .98% | | .94% |
| Net investment income (loss) | | .81% H | | .56% | | (.08)% | | .10% | | .69% | | .40% |
| Supplemental Data | | | | | | | | | | | | |
| Net assets, end of period (000 omitted) | $ | 41,875 | $ | 33,226 | $ | 86,852 | $ | 64,615 | $ | 44,754 | $ | 50,956 |
Portfolio turnover rate I | | 137% H | | 137% | | 96% | | 112% | | 147% | | 117% |
A Calculated based on average shares outstanding during the period.
B Net investment income (loss) is affected by the timing of the declaration of dividends by any underlying mutual funds or exchange-traded funds (ETFs). Net investment income (loss) of any mutual funds or ETFs is not included in the Fund's net investment income (loss) ratio.
C Total distributions per share do not sum due to rounding.
D Total returns for periods of less than one year are not annualized.
E Total returns would have been lower if certain expenses had not been reduced during the applicable periods shown.
F Fees and expenses of any underlying mutual funds or exchange-traded funds (ETFs) are not included in the Fund's expense ratio. The Fund indirectly bears its proportionate share of these expenses. For additional expense information related to investments in Fidelity Central Funds, please refer to the "Investments in Fidelity Central Funds" note found in the Notes to Financial Statements section of the most recent Annual or Semi-Annual report.
G Expense ratios reflect operating expenses of the class. Expenses before reductions do not reflect amounts reimbursed, waived, or reduced through arrangements with the investment adviser, brokerage services, or other offset arrangements, if applicable, and do not represent the amount paid by the class during periods when reimbursements, waivers or reductions occur.
H Annualized.
I Amount does not include the portfolio activity of any underlying mutual funds or exchange-traded funds (ETFs).
| Fidelity Advisor® Worldwide Fund Class Z |
| |
| | Six months ended (Unaudited) April 30, 2023 | | Years ended October 31, 2022 | | 2021 | | 2020 | | 2019 | | 2018 A |
Selected Per-Share Data | | | | | | | | | | | | |
| Net asset value, beginning of period | $ | 26.05 | $ | 40.48 | $ | 31.76 | $ | 27.59 | $ | 26.78 | $ | 29.54 |
| Income from Investment Operations | | | | | | | | | | | | |
Net investment income (loss) B,C | | .12 | | .21 | | .02 | | .07 | | .22 | | (.01) |
| Net realized and unrealized gain (loss) | | 2.52 | | (10.01) | | 11.50 | | 5.53 | | 2.86 | | (2.75) |
| Total from investment operations | | 2.64 | | (9.80) | | 11.52 | | 5.60 | | 3.08 | | (2.76) |
| Distributions from net investment income | | (.25) | | (.20) | | (.05) | | (.23) | | (.13) | | - |
| Distributions from net realized gain | | (1.37) | | (4.43) | | (2.75) | | (1.20) | | (2.14) | | - |
| Total distributions | | (1.62) | | (4.63) | | (2.80) | | (1.43) | | (2.27) | | - |
| Net asset value, end of period | $ | 27.07 | $ | 26.05 | $ | 40.48 | $ | 31.76 | $ | 27.59 | $ | 26.78 |
Total Return D,E | | 10.56% | | (27.05)% | | 38.27% | | 21.19% | | 12.85% | | (9.34)% |
Ratios to Average Net Assets C,F,G | | | | | | | | | | | | |
| Expenses before reductions | | .61% H | | .81% | | .90% | | .93% | | .85% | | .88% H |
| Expenses net of fee waivers, if any | | .60% H | | .81% | | .90% | | .93% | | .84% | | .88% H |
| Expenses net of all reductions | | .60% H | | .81% | | .90% | | .93% | | .84% | | .87% H |
| Net investment income (loss) | | .93% H | | .68% | | .04% | | .23% | | .83% | | (.27)% H |
| Supplemental Data | | | | | | | | | | | | |
| Net assets, end of period (000 omitted) | $ | 85,083 | $ | 76,829 | $ | 115,963 | $ | 71,278 | $ | 205,197 | $ | 294 |
Portfolio turnover rate I | | 137% H | | 137% | | 96% | | 112% | | 147% | | 117% |
A For the period October 2, 2018 (commencement of sale of shares) through October 31, 2018.
B Calculated based on average shares outstanding during the period.
C Net investment income (loss) is affected by the timing of the declaration of dividends by any underlying mutual funds or exchange-traded funds (ETFs). Net investment income (loss) of any mutual funds or ETFs is not included in the Fund's net investment income (loss) ratio.
D Total returns for periods of less than one year are not annualized.
E Total returns would have been lower if certain expenses had not been reduced during the applicable periods shown.
F Fees and expenses of any underlying mutual funds or exchange-traded funds (ETFs) are not included in the Fund's expense ratio. The Fund indirectly bears its proportionate share of these expenses. For additional expense information related to investments in Fidelity Central Funds, please refer to the "Investments in Fidelity Central Funds" note found in the Notes to Financial Statements section of the most recent Annual or Semi-Annual report.
G Expense ratios reflect operating expenses of the class. Expenses before reductions do not reflect amounts reimbursed, waived, or reduced through arrangements with the investment adviser, brokerage services, or other offset arrangements, if applicable, and do not represent the amount paid by the class during periods when reimbursements, waivers or reductions occur.
H Annualized.
I Amount does not include the portfolio activity of any underlying mutual funds or exchange-traded funds (ETFs).
For the period ended April 30, 2023
1. Organization.
Fidelity Worldwide Fund (the Fund) is a fund of Fidelity Investment Trust (the Trust) and is authorized to issue an unlimited number of shares. The Trust is registered under the Investment Company Act of 1940, as amended (the 1940 Act), as an open-end management investment company organized as a Massachusetts business trust. The Fund offers Class A, Class M, Class C, Worldwide, Class I and Class Z shares, each of which has equal rights as to assets and voting privileges. Class A, Class M, Class C, Class I and Class Z are Fidelity Advisor classes. Each class has exclusive voting rights with respect to matters that affect that class. Class C shares will automatically convert to Class A shares after a holding period of eight years from the initial date of purchase, with certain exceptions.
2. Investments in Fidelity Central Funds.
Funds may invest in Fidelity Central Funds, which are open-end investment companies generally available only to other investment companies and accounts managed by the investment adviser and its affiliates. The Schedule of Investments lists any Fidelity Central Funds held as an investment as of period end, but does not include the underlying holdings of each Fidelity Central Fund. An investing fund indirectly bears its proportionate share of the expenses of the underlying Fidelity Central Funds.
Based on its investment objective, each Fidelity Central Fund may invest or participate in various investment vehicles or strategies that are similar to those of the investing fund. These strategies are consistent with the investment objectives of the investing fund and may involve certain economic risks which may cause a decline in value of each of the Fidelity Central Funds and thus a decline in the value of the investing fund.
| Fidelity Central Fund | Investment Manager | Investment Objective | Investment Practices | Expense Ratio A |
| Fidelity Money Market Central Funds | Fidelity Management & Research Company LLC (FMR) | Each fund seeks to obtain a high level of current income consistent with the preservation of capital and liquidity. | Short-term Investments | Less than .005% |
A Expenses expressed as a percentage of average net assets and are as of each underlying Central Fund's most recent annual or semi-annual shareholder report.
A complete unaudited list of holdings for each Fidelity Central Fund is available upon request or at the Securities and Exchange Commission website at www.sec.gov. In addition, the financial statements of the Fidelity Central Funds which contain the significant accounting policies (including investment valuation policies) of those funds, and are not covered by the Report of Independent Registered Public Accounting Firm, are available on the Securities and Exchange Commission website or upon request.
3. Significant Accounting Policies.
The Fund is an investment company and applies the accounting and reporting guidance of the Financial Accounting Standards Board (FASB) Accounting Standards Codification Topic 946 Financial Services - Investment Companies . The financial statements have been prepared in conformity with accounting principles generally accepted in the United States of America (GAAP), which require management to make certain estimates and assumptions at the date of the financial statements. Actual results could differ from those estimates. Subsequent events, if any, through the date that the financial statements were issued have been evaluated in the preparation of the financial statements. The Fund's Schedule of Investments lists any underlying mutual funds or exchange-traded funds (ETFs) but does not include the underlying holdings of these funds. The following summarizes the significant accounting policies of the Fund:
Investment Valuation. Investments are valued as of 4:00 p.m. Eastern time on the last calendar day of the period. The Board of Trustees (the Board) has designated the Fund's investment adviser as the valuation designee responsible for the fair valuation function and performing fair value determinations as needed. The investment adviser has established a Fair Value Committee (the Committee) to carry out the day-to-day fair valuation responsibilities and has adopted policies and procedures to govern the fair valuation process and the activities of the Committee. In accordance with these fair valuation policies and procedures, which have been approved by the Board, the Fund attempts to obtain prices from one or more third party pricing services or brokers to value its investments. When current market prices, quotations or currency exchange rates are not readily available or reliable, investments will be fair valued in good faith by the Committee, in accordance with the policies and procedures. Factors used in determining fair value vary by investment type and may include market or investment specific events, transaction data, estimated cash flows, and market observations of comparable investments. The frequency that the fair valuation procedures are used cannot be predicted and they may be utilized to a significant extent. The Committee manages the Fund's fair valuation practices and maintains the fair valuation policies and procedures. The Fund's investment adviser reports to the Board information regarding the fair valuation process and related material matters.
The Fund categorizes the inputs to valuation techniques used to value its investments into a disclosure hierarchy consisting of three levels as shown below:
Level 1 - unadjusted quoted prices in active markets for identical investments
Level 2 - other significant observable inputs (including quoted prices for similar investments, interest rates, prepayment speeds, etc.)
Level 3 - unobservable inputs (including the Fund's own assumptions based on the best information available)
Valuation techniques used to value the Fund's investments by major category are as follows:
Equity securities, including restricted securities, for which market quotations are readily available, are valued at the last reported sale price or official closing price as reported by a third party pricing service on the primary market or exchange on which they are traded and are categorized as Level 1 in the hierarchy. In the event there were no sales during the day or closing prices are not available, securities are valued at the last quoted bid price or may be valued using the last available price and are generally categorized as Level 2 in the hierarchy. For foreign equity securities, when market or security specific events arise, comparisons to the valuation of American Depositary Receipts (ADRs), futures contracts, Exchange-Traded Funds (ETFs) and certain indexes as well as quoted prices for similar securities may be used and would be categorized as Level 2 in the hierarchy. For equity securities, including restricted securities, where observable inputs are limited, assumptions about market activity and risk are used and these securities may be categorized as Level 3 in the hierarchy.
Investments in open-end mutual funds, including the Fidelity Central Funds, are valued at their closing net asset value (NAV) each business day and are categorized as Level 1 in the hierarchy.
Changes in valuation techniques may result in transfers in or out of an assigned level within the disclosure hierarchy. The aggregate value of investments by input level as of April 30, 2023 is included at the end of the Fund's Schedule of Investments.
Foreign Currency. Certain Funds may use foreign currency contracts to facilitate transactions in foreign-denominated securities. Gains and losses from these transactions may arise from changes in the value of the foreign currency or if the counterparties do not perform under the contracts' terms.
Foreign-denominated assets, including investment securities, and liabilities are translated into U.S. dollars at the exchange rates at period end. Purchases and sales of investment securities, income and dividends received, and expenses denominated in foreign currencies are translated into U.S. dollars at the exchange rate in effect on the transaction date.
The effects of exchange rate fluctuations on investments are included with the net realized and unrealized gain (loss) on investment securities. Other foreign currency transactions resulting in realized and unrealized gain (loss) are disclosed separately.
Investment Transactions and Income. For financial reporting purposes, the Fund's investment holdings and NAV include trades executed through the end of the last business day of the period. The NAV per share for processing shareholder transactions is calculated as of the close of business of the New York Stock Exchange (NYSE), normally 4:00 p.m. Eastern time and includes trades executed through the end of the prior business day. Gains and losses on securities sold are determined on the basis of identified cost and include proceeds received from litigation. Commissions paid to certain brokers with whom the investment adviser, or its affiliates, places trades on behalf of a fund include an amount in addition to trade execution, which may be rebated back to a fund. Any such rebates are included in net realized gain (loss) on investments in the Statement of Operations. Dividend income is recorded on the ex-dividend date, except for certain dividends from foreign securities where the ex-dividend date may have passed, which are recorded as soon as the Fund is informed of the ex-dividend date. Non-cash dividends included in dividend income, if any, are recorded at the fair market value of the securities received. Income and capital gain distributions from Fidelity Central Funds, if any, are recorded on the ex-dividend date. Investment income is recorded net of foreign taxes withheld where recovery of such taxes is uncertain. Funds may file withholding tax reclaims in certain jurisdictions to recover a portion of amounts previously withheld. Any withholding tax reclaims income is included in the Statement of Operations in foreign taxes withheld. Any receivables for withholding tax reclaims are included in the Statement of Assets and Liabilities in reclaims receivable.
Class Allocations and Expenses. Investment income, realized and unrealized capital gains and losses, common expenses of a fund, and certain fund-level expense reductions, if any, are allocated daily on a pro-rata basis to each class based on the relative net assets of each class to the total net assets of a fund. Each class differs with respect to transfer agent and distribution and service plan fees incurred, as applicable. Certain expense reductions may also differ by class, if applicable. For the reporting period, the allocated portion of income and expenses to each class as a percent of its average net assets may vary due to the timing of recording these transactions in relation to fluctuating net assets of the classes. Expenses directly attributable to a fund are charged to that fund. Expenses attributable to more than one fund are allocated among the respective funds on the basis of relative net assets or other appropriate methods. Expenses included in the accompanying financial statements reflect the expenses of that fund and do not include any expenses associated with any underlying mutual funds or exchange-traded funds. Although not included in a fund's expenses, a fund indirectly bears its proportionate share of these expenses through the net asset value of each underlying mutual fund or exchange-traded fund. Expense estimates are accrued in the period to which they relate and adjustments are made when actual amounts are known.
Income Tax Information and Distributions to Shareholders. Each year, the Fund intends to qualify as a regulated investment company under Subchapter M of the Internal Revenue Code, including distributing substantially all of its taxable income and realized gains. As a result, no provision for U.S. Federal income taxes is required. The Fund files a U.S. federal tax return, in addition to state and local tax returns as required. The Fund's federal income tax returns are subject to examination by the Internal Revenue Service (IRS) for a period of three fiscal years after they are filed. State and local tax returns may be subject to examination for an additional fiscal year depending on the jurisdiction. Foreign taxes are provided for based on the Fund's understanding of the tax rules and rates that exist in the foreign markets in which it invests. The Fund is subject to a tax imposed on capital gains by certain countries in which it invests. An estimated deferred tax liability for net unrealized appreciation on the applicable securities is included in Other payables and accrued expenses on the Statement of Assets & Liabilities.
Distributions are declared and recorded on the ex-dividend date. Income and capital gain distributions are declared separately for each class. Income and capital gain distributions are determined in accordance with income tax regulations, which may differ from GAAP.
Capital accounts within the financial statements are adjusted for permanent book-tax differences. These adjustments have no impact on net assets or the results of operations. Capital accounts are not adjusted for temporary book-tax differences which will reverse in a subsequent period.
Book-tax differences are primarily due to foreign currency transactions, certain foreign taxes, passive foreign investment companies (PFIC) and losses deferred due to wash sales.
As of period end, the cost and unrealized appreciation (depreciation) in securities, and derivatives if applicable, for federal income tax purposes were as follows:
| Gross unrealized appreciation | $443,592,646 |
| Gross unrealized depreciation | (86,283,890) |
| Net unrealized appreciation (depreciation) | $357,308,756 |
| Tax cost | $1,895,650,798 |
Restricted Securities (including Private Placements). Funds may invest in securities that are subject to legal or contractual restrictions on resale. These securities generally may be resold in transactions exempt from registration or to the public if the securities are registered. Disposal of these securities may involve time-consuming negotiations and expense, and prompt sale at an acceptable price may be difficult. Information regarding restricted securities held at period end is included at the end of the Schedule of Investments, if applicable.
Commitments. A commitment is an agreement to acquire an investment at a future date (subject to conditions) in connection with a potential public or non-public offering. Commitments outstanding at period end are presented in the table below. Unrealized appreciation (depreciation) on any commitments outstanding at period end is separately presented in the Statements of Assets and Liabilities as Unrealized appreciation (depreciation) on unfunded commitments, and any change in unrealized appreciation (depreciation) on unfunded commitments during the period is separately presented in the Statement of Operations, as applicable based on contractual conditions of each commitment.
| | Investment to be Acquired | Commitment Amount | Unrealized Appreciation (Depreciation) |
| Fidelity Worldwide Fund | Stripe, Inc. | $999,995 | $(498,191) |
4. Purchases and Sales of Investments.
Purchases and sales of securities, other than short-term securities and in-kind transactions, as applicable, are noted in the table below.
| | Purchases ($) | Sales ($) |
| Fidelity Worldwide Fund | 1,467,234,797 | 1,572,999,793 |
5. Fees and Other Transactions with Affiliates.
Management Fee. Fidelity Management & Research Company LLC (the investment adviser) and its affiliates provide the Fund with investment management related services for which the Fund pays a monthly management fee. The management fee is the sum of an individual fund fee rate that is based on an annual rate of .424% of the Fund's average net assets and an annualized group fee rate that averaged .23% during the period. The group fee rate is based upon the monthly average net assets of a group of registered investment companies with which the investment adviser has management contracts. The group fee rate decreases as assets under management increase and increases as assets under management decrease. In addition, the management fee is subject to a performance adjustment (up to a maximum of +/- .20% of the Fund's average net assets over a 36 month performance period). The upward or downward adjustment to the management fee is based on the relative investment performance of the Fund as compared to its benchmark index, the MSCI World Index, over the same 36 month performance period. For the reporting period, the total annualized management fee rate, including the performance adjustment, was .52% of the Fund's average net assets. The performance adjustment included in the management fee rate may be higher or lower than the maximum performance adjustment rate due to the difference between the average net assets for the reporting and performance periods.
Distribution and Service Plan Fees. In accordance with Rule 12b-1 of the 1940 Act, the Fund has adopted separate Distribution and Service Plans for each class of shares. Certain classes pay Fidelity Distributors Company LLC (FDC), an affiliate of the investment adviser, separate Distribution and Service Fees, each of which is based on an annual percentage of each class' average net assets. In addition, FDC may pay financial intermediaries for selling shares of the Fund and providing shareholder support services. For the period, the Distribution and Service Fee rates, total fees and amounts retained by FDC were as follows:
| | Distribution Fee | Service Fee | Total Fees | Retained by FDC |
| Class A | -% | .25% | $88,443 | $2,246 |
| Class M | .25% | .25% | 39,240 | 502 |
| Class C | .75% | .25% | 42,403 | 4,688 |
| | | | $170,086 | $7,436 |
Sales Load. FDC may receive a front-end sales charge of up to 5.75% for selling Class A shares and 3.50% for selling Class M shares, some of which is paid to financial intermediaries for selling shares of the Fund. Depending on the holding period, FDC may receive contingent deferred sales charges levied on Class A, Class M and Class C redemptions. The deferred sales charges are 1.00% for Class C shares, 1.00% for certain purchases of Class A shares and .25% for certain purchases of Class M shares.
For the period, sales charge amounts retained by FDC were as follows:
| | Retained by FDC |
| Class A | $46,017 |
| Class M | 1,515 |
Class C A | 1,496 |
| | $49,028 |
A When Class C shares are initially sold, FDC pays commissions from its own resources to financial intermediaries through which the sales are made.
Transfer Agent Fees. Fidelity Investments Institutional Operations Company LLC (FIIOC), an affiliate of the investment adviser, is the transfer, dividend disbursing and shareholder servicing agent for each class of the Fund. FIIOC receives account fees and asset-based fees that vary according to the account size and type of account of the shareholders of the respective classes of the Fund, except for Class Z. FIIOC receives an asset-based fee of Class Z's average net assets. FIIOC pays for typesetting, printing and mailing of shareholder reports, except proxy statements.
For the period, transfer agent fees for each class were as follows:
| | Amount | % of Class-Level Average Net Assets A |
| Class A | $68,889 | .19 |
| Class M | 16,168 | .21 |
| Class C | 10,471 | .25 |
| Worldwide | 1,509,241 | .15 |
| Class I | 28,504 | .16 |
| Class Z | 17,013 | .04 |
| | $1,650,286 | |
A Annualized
Accounting Fees. Fidelity Service Company, Inc. (FSC), an affiliate of the investment adviser, maintains the Fund's accounting records. The accounting fee is based on the level of average net assets for each month. For the period, the fees were equivalent to the following annualized rates:
| | % of Average Net Assets |
| Fidelity Worldwide Fund | .03 |
Brokerage Commissions. A portion of portfolio transactions were placed with brokerage firms which are affiliates of the investment adviser. Brokerage commissions are included in net realized gain (loss) and change in net unrealized appreciation (depreciation) in the Statement of Operations. The commissions paid to these affiliated firms were as follows:
| | Amount |
| Fidelity Diversified International Fund | $19,508 |
Interfund Trades. Funds may purchase from or sell securities to other Fidelity Funds under procedures adopted by the Board. The procedures have been designed to ensure these interfund trades are executed in accordance with Rule 17a-7 of the 1940 Act. Any interfund trades are included within the respective purchases and sales amounts shown in the Purchases and Sales of Investments note. Interfund trades during the period are noted in the table below.
| | Purchases ($) | Sales ($) | Realized Gain (Loss) ($) |
| Fidelity Worldwide Fund | 65,589,767 | 98,527,005 | (227,602) |
6. Committed Line of Credit.
Certain Funds participate with other funds managed by the investment adviser or an affiliate in a $4.25 billion credit facility (the "line of credit") to be utilized for temporary or emergency purposes to fund shareholder redemptions or for other short-term liquidity purposes. The participating funds have agreed to pay commitment fees on their pro-rata portion of the line of credit, which are reflected in Miscellaneous expenses on the Statement of Operations, and are listed below. During the period, there were no borrowings on this line of credit.
| | Amount |
| Fidelity Worldwide Fund | $2,117 |
7. Security Lending.
Funds lend portfolio securities from time to time in order to earn additional income. Lending agents are used, including National Financial Services (NFS), an affiliate of the investment adviser. Pursuant to a securities lending agreement, NFS will receive a fee, which is capped at 9.9% of a fund's daily lending revenue, for its services as lending agent. A fund may lend securities to certain qualified borrowers, including NFS. On the settlement date of the loan, a fund receives collateral (in the form of U.S. Treasury obligations, letters of credit and/or cash) against the loaned securities and maintains collateral in an amount not less than 100% of the market value of the loaned securities during the period of the loan. The market value of the loaned securities is determined at the close of business of a fund and any additional required collateral is delivered to a fund on the next business day. A fund or borrower may terminate the loan at any time, and if the borrower defaults on its obligation to return the securities loaned because of insolvency or other reasons, a fund may apply collateral received from the borrower against the obligation. A fund may experience delays and costs in recovering the securities loaned. Any cash collateral received is invested in the Fidelity Securities Lending Cash Central Fund. Any loaned securities are identified as such in the Schedule of Investments, and the value of loaned securities and cash collateral at period end, as applicable, are presented in the Statement of Assets and Liabilities. Security lending income represents the income earned on investing cash collateral, less rebates paid to borrowers and any lending agent fees associated with the loan, plus any premium payments received for lending certain types of securities. Security lending income is presented in the Statement of Operations as a component of income from Fidelity Central Funds. Affiliated security lending activity, if any, was as follows:
| | Total Security Lending Fees Paid to NFS | Security Lending Income From Securities Loaned to NFS | Value of Securities Loaned to NFS at Period End |
| Fidelity Worldwide Fund | $7,834 | $- | $- |
8. Expense Reductions.
Through arrangements with each class' transfer agent, credits realized as a result of certain uninvested cash balances were used to reduce the Fund's expenses. During the period, transfer agent credits reduced each class' expenses as noted in the table below.
| | Expense reduction |
| Class A | $152 |
| Class M | 344 |
| Class C | 42 |
| | $538 |
In addition, during the period the investment adviser or an affiliate reimbursed and/or waived a portion of fund-level operating expenses in the amount of $49,734.
9. Distributions to Shareholders.
Distributions to shareholders of each class were as follows:
| | Six months ended April 30, 2023 | Year ended October 31, 2022 |
| Fidelity Worldwide Fund | | |
| Distributions to shareholders | | |
| Class A | $ 3,905,043 | $11,246,925 |
| Class M | 825,955 | 2,460,774 |
| Class C | 473,638 | 1,484,213 |
| Worldwide | 112,981,740 | 323,847,724 |
| Class I | 1,950,914 | 9,721,033 |
| Class Z | 4,699,524 | 13,369,886 |
Total | $124,836,814 | $362,130,555 |
10. Share Transactions.
Share transactions for each class were as follows and may contain in-kind transactions, automatic conversions between classes or exchanges between affiliated funds:
| | Shares | Shares | Dollars | Dollars |
| | Six months ended April 30, 2023 | Year ended October 31, 2022 | Six months ended April 30, 2023 | Year ended October 31, 2022 |
| Fidelity Worldwide Fund | | | | |
| Class A | | | | |
| Shares sold | 196,082 | 425,346 | $5,069,567 | $13,150,315 |
| Reinvestment of distributions | 153,659 | 323,585 | 3,866,062 | 11,111,902 |
| Shares redeemed | (262,917) | (573,433) | (6,816,824) | (17,987,153) |
| Net increase (decrease) | 86,824 | 175,498 | $2,118,805 | $6,275,064 |
| Class M | | | | |
| Shares sold | 34,699 | 63,154 | $888,583 | $1,827,369 |
| Reinvestment of distributions | 32,920 | 71,924 | 820,689 | 2,446,862 |
| Shares redeemed | (52,287) | (109,465) | (1,327,964) | (3,332,351) |
| Net increase (decrease) | 15,332 | 25,613 | $381,308 | $941,880 |
| Class C | | | | |
| Shares sold | 19,840 | 49,629 | $485,207 | $1,443,792 |
| Reinvestment of distributions | 19,902 | 45,376 | 473,280 | 1,482,892 |
| Shares redeemed | (55,451) | (102,345) | (1,344,668) | (2,936,201) |
| Net increase (decrease) | (15,709) | (7,340) | $(386,181) | $(9,517) |
| Worldwide | | | | |
| Shares sold | 2,815,049 | 5,548,119 | $73,948,827 | $176,262,456 |
| Reinvestment of distributions | 4,190,088 | 8,857,534 | 107,266,234 | 309,393,660 |
| Shares redeemed | (5,738,217) | (13,126,499) | (150,844,308) | (404,042,333) |
| Net increase (decrease) | 1,266,920 | 1,279,154 | $30,370,753 | $81,613,783 |
| Class I | | | | |
| Shares sold | 531,386 | 391,287 | $13,905,511 | $11,850,826 |
| Reinvestment of distributions | 75,801 | 274,142 | 1,925,343 | 9,499,030 |
| Shares redeemed | (338,879) | (1,536,108) | (8,731,352) | (45,074,681) |
| Net increase (decrease) | 268,308 | (870,679) | $7,099,502 | $(23,724,825) |
| Class Z | | | | |
| Shares sold | 338,982 | 785,358 | $8,779,580 | $23,797,734 |
| Reinvestment of distributions | 176,768 | 358,516 | 4,481,057 | 12,415,394 |
| Shares redeemed | (322,310) | (1,058,983) | (8,420,040) | (32,578,317) |
| Net increase (decrease) | 193,440 | 84,891 | $4,840,597 | $3,634,811 |
11. Other.
A fund's organizational documents provide former and current trustees and officers with a limited indemnification against liabilities arising in connection with the performance of their duties to the fund. In the normal course of business, a fund may also enter into contracts that provide general indemnifications. A fund's maximum exposure under these arrangements is unknown as this would be dependent on future claims that may be made against a fund. The risk of material loss from such claims is considered remote.
12. Risk and Uncertainties.
Many factors affect a fund's performance. Developments that disrupt global economies and financial markets, such as pandemics, epidemics, outbreaks of infectious diseases, war, terrorism, and environmental disasters, may significantly affect a fund's investment performance. The effects of these developments to a fund will be impacted by the types of securities in which a fund invests, the financial condition, industry, economic sector, and geographic location of an issuer, and a fund's level of investment in the securities of that issuer. Significant concentrations in security types, issuers, industries, sectors, and geographic locations may magnify the factors that affect a fund's performance.
As a shareholder, you incur two types of costs: (1) transaction costs, which may include sales charges (loads) on purchase payments or redemption proceeds, as applicable and (2) ongoing costs, which generally include management fees, distribution and/or service (12b-1) fees and other Fund expenses. This Example is intended to help you understand your ongoing costs (in dollars) of investing in a fund and to compare these costs with the ongoing costs of investing in other mutual funds.
| The Example is based on an investment of $1,000 invested at the beginning of the period and held for the entire period (November 1, 2022 to April 30, 2023). |
Actual Expenses
The first line of the accompanying table provides information about actual account values and actual expenses. You may use the information in this line, together with the amount you invested, to estimate the expenses that you paid over the period. Simply divide your account value by $1,000.00 (for example, an $8,600 account value divided by $1,000.00 = 8.6), then multiply the result by the number in the first line for a class/Fund under the heading entitled "Expenses Paid During Period" to estimate the expenses you paid on your account during this period. If any fund is a shareholder of any underlying mutual funds or exchange-traded funds (ETFs) (the Underlying Funds), such fund indirectly bears its proportional share of the expenses of the Underlying Funds in addition to the direct expenses incurred presented in the table. These fees and expenses are not included in the annualized expense ratio used to calculate the expense estimate in the table below.
Hypothetical Example for Comparison Purposes
The second line of the accompanying table provides information about hypothetical account values and hypothetical expenses based on the actual expense ratio and an assumed rate of return of 5% per year before expenses, which is not the actual return. The hypothetical account values and expenses may not be used to estimate the actual ending account balance or expenses you paid for the period. You may use this information to compare the ongoing costs of investing in the Fund and other funds. To do so, compare this 5% hypothetical example with the 5% hypothetical examples that appear in the shareholder reports of the other funds. If any fund is a shareholder of any Underlying Funds, such fund indirectly bears its proportional share of the expenses of the Underlying Funds in addition to the direct expenses as presented in the table. These fees and expenses are not included in the annualized expense ratio used to calculate the expense estimate in the table below.
Please note that the expenses shown in the table are meant to highlight your ongoing costs only and do not reflect any transaction costs. Therefore, the second line of the table is useful in comparing ongoing costs only, and will not help you determine the relative total costs of owning different funds. In addition, if these transactional costs were included, your costs would have been higher.
| | | | | Annualized Expense Ratio- A | | Beginning Account Value November 1, 2022 | | Ending Account Value April 30, 2023 | | Expenses Paid During Period- C November 1, 2022 to April 30, 2023 |
| Fidelity® Diversified International Fund | | | | | | | | | | |
| Fidelity® Diversified International Fund | | | | .72% | | | | | | |
| Actual | | | | | | $ 1,000 | | $ 1,205.30 | | $ 3.94 |
Hypothetical- B | | | | | | $ 1,000 | | $ 1,021.22 | | $ 3.61 |
| Class K | | | | .61% | | | | | | |
| Actual | | | | | | $ 1,000 | | $ 1,206.30 | | $ 3.34 |
Hypothetical- B | | | | | | $ 1,000 | | $ 1,021.77 | | $ 3.06 |
| | | | | | | | | | |
| Fidelity® International Capital Appreciation Fund | | | | .86% | | | | | | |
| Actual | | | | | | $ 1,000 | | $ 1,220.40 | | $ 4.73 |
Hypothetical- B | | | | | | $ 1,000 | | $ 1,020.53 | | $ 4.31 |
| Fidelity® Overseas Fund | | | | | | | | | | |
| Fidelity® Overseas Fund | | | | .80% | | | | | | |
| Actual | | | | | | $ 1,000 | | $ 1,241.10 | | $ 4.45 |
Hypothetical- B | | | | | | $ 1,000 | | $ 1,020.83 | | $ 4.01 |
| Class K | | | | .69% | | | | | | |
| Actual | | | | | | $ 1,000 | | $ 1,241.90 | | $ 3.84 |
Hypothetical- B | | | | | | $ 1,000 | | $ 1,021.37 | | $ 3.46 |
| Fidelity® Worldwide Fund | | | | | | | | | | |
| Class A | | | | 1.01% | | | | | | |
| Actual | | | | | | $ 1,000 | | $ 1,103.40 | | $ 5.27 |
Hypothetical- B | | | | | | $ 1,000 | | $ 1,019.79 | | $ 5.06 |
| Class M | | | | 1.27% | | | | | | |
| Actual | | | | | | $ 1,000 | | $ 1,102.20 | | $ 6.62 |
Hypothetical- B | | | | | | $ 1,000 | | $ 1,018.50 | | $ 6.36 |
| Class C | | | | 1.81% | | | | | | |
| Actual | | | | | | $ 1,000 | | $ 1,098.90 | | $ 9.42 |
Hypothetical- B | | | | | | $ 1,000 | | $ 1,015.82 | | $ 9.05 |
| Fidelity® Worldwide Fund | | | | .72% | | | | | | |
| Actual | | | | | | $ 1,000 | | $ 1,105.10 | | $ 3.76 |
Hypothetical- B | | | | | | $ 1,000 | | $ 1,021.22 | | $ 3.61 |
| Class I | | | | .72% | | | | | | |
| Actual | | | | | | $ 1,000 | | $ 1,105.20 | | $ 3.76 |
Hypothetical- B | | | | | | $ 1,000 | | $ 1,021.22 | | $ 3.61 |
| Class Z | | | | .60% | | | | | | |
| Actual | | | | | | $ 1,000 | | $ 1,105.60 | | $ 3.13 |
Hypothetical- B | | | | | | $ 1,000 | | $ 1,021.82 | | $ 3.01 |
| |
A Annualized expense ratio reflects expenses net of applicable fee waivers.
B 5% return per year before expenses
C Expenses are equal to the annualized expense ratio, multiplied by the average account value over the period, multiplied by 181/ 365 (to reflect the one-half year period). The fees and expenses of any Underlying Funds are not included in each annualized expense ratio.
The Securities and Exchange Commission adopted Rule 22e-4 under the Investment Company Act of 1940 (the Liquidity Rule) to promote effective liquidity risk management throughout the open-end investment company industry, thereby reducing the risk that funds will be unable to meet their redemption obligations and mitigating dilution of the interests of fund shareholders.
The Funds have adopted and implemented a liquidity risk management program (the Program) reasonably designed to assess and manage each Fund's liquidity risk and to comply with the requirements of the Liquidity Rule. Each Fund's Board of Trustees (the Board) has designated each Fund's investment adviser as administrator of the Program. The Fidelity advisers have established a Liquidity Risk Management Committee (the LRM Committee) to manage the Program for each of the Fidelity Funds. The LRM Committee monitors the adequacy and effectiveness of implementation of the Program and on a periodic basis assesses each Fund's liquidity risk based on a variety of factors including (1) the Fund's investment strategy, (2) portfolio liquidity and cash flow projections during normal and reasonably foreseeable stressed conditions, (3) shareholder redemptions, (4) borrowings and other funding sources and (5) certain factor specific to ETFs including the effect of the Fund's prices and spreads, market participants, and basket compositions on the overall liquidity of the Fund's portfolio, as applicable.
In accordance with the Program, each of the Fund's portfolio investments is classified into one of four defined liquidity categories based on a determination of a reasonable expectation for how long it would take to convert the investment to cash (or sell or dispose of the investment) without significantly changing its market value.
- Highly liquid investments - cash or convertible to cash within three business days or less
- Moderately liquid investments - convertible to cash in three to seven calendar days
- Less liquid investments - can be sold or disposed of, but not settled, within seven calendar days
- Illiquid investments - cannot be sold or disposed of within seven calendar days
Liquidity classification determinations take into account a variety of factors including various market, trading and investment-specific considerations, as well as market depth, and generally utilize analysis from a third-party liquidity metrics service.
The Liquidity Rule places a 15% limit on a fund's illiquid investments and requires funds that do not primarily hold assets that are highly liquid investments to determine and maintain a minimum percentage of the fund's net assets to be invested in highly liquid investments (highly liquid investment minimum or HLIM). The Program includes provisions reasonably designed to comply with the 15% limit on illiquid investments and for determining, periodically reviewing and complying with the HLIM requirement as applicable.
At a recent meeting of the Fund's Board of Trustees, the LRM Committee provided a written report to the Board pertaining to the operation, adequacy, and effectiveness of the Program for the period December 1, 2021 through November 30, 2022. The report concluded that the Program is operating effectively and is reasonably designed to assess and manage the Fund's liquidity risk.
1.703569.125
IBD-SANN-0623
Fidelity® Global Commodity Stock Fund
Semi-Annual Report
April 30, 2023
Includes Fidelity and Fidelity Advisor share classes
Contents
To view a fund's proxy voting guidelines and proxy voting record for the 12-month period ended June 30, visit http://www.fidelity.com/proxyvotingresults or visit the Securities and Exchange Commission's (SEC) web site at http://www.sec.gov.
You may also call 1-800-544-8544 if you're an individual investing directly with Fidelity, call 1-800-835-5092 if you're a plan sponsor or participant with Fidelity as your recordkeeper or call 1-877-208-0098 on institutional accounts or if you're an advisor or invest through one to request a free copy of the proxy voting guidelines.
Standard & Poor's, S&P and S&P 500 are registered service marks of The McGraw-Hill Companies, Inc. and have been licensed for use by Fidelity Distributors Corporation.
Other third-party marks appearing herein are the property of their respective owners.
All other marks appearing herein are registered or unregistered trademarks or service marks of FMR LLC or an affiliated company. © 2023 FMR LLC. All rights reserved.
This report and the financial statements contained herein are submitted for the general information of the shareholders of the Fund. This report is not authorized for distribution to prospective investors in the Fund unless preceded or accompanied by an effective prospectus.
A fund files its complete schedule of portfolio holdings with the SEC for the first and third quarters of each fiscal year on Form N-PORT. Forms N-PORT are available on the SEC's web site at http://www.sec.gov. A fund's Forms N-PORT may be reviewed and copied at the SEC's Public Reference Room in Washington, DC. Information regarding the operation of the SEC's Public Reference Room may be obtained by calling 1-800-SEC-0330.
For a complete list of a fund's portfolio holdings, view the most recent holdings listing, semiannual report, or annual report on Fidelity's web site at http://www.fidelity.com, http://www.institutional.fidelity.com, or http://www.401k.com, as applicable.
NOT FDIC INSURED •MAY LOSE VALUE •NO BANK GUARANTEE
Neither the Fund nor Fidelity Distributors Corporation is a bank.
Top Holdings (% of Fund's net assets) |
| |
| Exxon Mobil Corp. | 10.6 | |
| Teck Resources Ltd. Class B (sub. vtg.) | 5.0 | |
| Corteva, Inc. | 4.7 | |
| Canadian Natural Resources Ltd. | 4.1 | |
| Cenovus Energy, Inc. (Canada) | 4.0 | |
| Wheaton Precious Metals Corp. | 3.8 | |
| Nutrien Ltd. | 3.7 | |
| TotalEnergies SE | 3.5 | |
| Glencore PLC | 3.2 | |
| Shell PLC (London) | 3.0 | |
| | 45.6 | |
| |
| Industries (% of Fund's net assets) |
| |
| Oil, Gas & Consumable Fuels | 36.3 | |
| Metals & Mining | 33.9 | |
| Chemicals | 12.2 | |
| Food Products | 6.4 | |
| Energy Equipment & Services | 3.6 | |
| Paper & Forest Products | 2.8 | |
| Containers & Packaging | 1.0 | |
| Machinery | 0.7 | |
| Electrical Equipment | 0.5 | |
| Marine Transportation | 0.5 | |
| Pharmaceuticals | 0.5 | |
| |
Geographic Diversification (% of Fund's net assets) |
|
* Includes Short-Term investments and Net Other Assets (Liabilities). Percentages are adjusted for the effect of derivatives, if applicable. |
| |
Showing Percentage of Net Assets
| Common Stocks - 98.4% |
| | | Shares | Value ($) |
| Chemicals - 12.2% | | | |
| Fertilizers & Agricultural Chemicals - 12.2% | | | |
| CF Industries Holdings, Inc. | | 155,360 | 11,120,669 |
| Corteva, Inc. | | 1,273,900 | 77,860,768 |
| FMC Corp. | | 345,300 | 42,672,174 |
| Icl Group Ltd. | | 625,000 | 3,831,609 |
| Nutrien Ltd. | | 868,283 | 60,235,391 |
| OCI NV | | 180,100 | 4,741,023 |
| | | | 200,461,634 |
| Containers & Packaging - 1.0% | | | |
| Metal, Glass & Plastic Containers - 0.6% | | | |
| Crown Holdings, Inc. | | 105,900 | 9,084,102 |
| Paper & Plastic Packaging Products & Materials - 0.4% | | | |
| Smurfit Kappa Group PLC | | 178,200 | 6,585,867 |
TOTAL CONTAINERS & PACKAGING | | | 15,669,969 |
| Electrical Equipment - 0.5% | | | |
| Electrical Components & Equipment - 0.5% | | | |
| GrafTech International Ltd. (a) | | 1,852,981 | 8,727,541 |
| Energy Equipment & Services - 3.6% | | | |
| Oil & Gas Drilling - 2.3% | | | |
| Diamond Offshore Drilling, Inc. (b) | | 869,000 | 9,984,810 |
| Noble Corp. PLC | | 448,000 | 17,225,600 |
| Seadrill Ltd. | | 20,800 | 747,524 |
| Valaris Ltd. (b) | | 161,400 | 9,684,000 |
| | | | 37,641,934 |
| Oil & Gas Equipment & Services - 1.3% | | | |
| NOV, Inc. | | 236,600 | 3,963,050 |
| Weatherford International PLC (b) | | 272,900 | 17,637,527 |
| | | | 21,600,577 |
TOTAL ENERGY EQUIPMENT & SERVICES | | | 59,242,511 |
| Food Products - 6.4% | | | |
| Agricultural Products & Services - 6.4% | | | |
| Archer Daniels Midland Co. | | 510,700 | 39,875,456 |
| Bunge Ltd. | | 329,200 | 30,813,120 |
| Darling Ingredients, Inc. (b) | | 413,800 | 24,650,066 |
| Golden Agri-Resources Ltd. | | 1,637,500 | 338,657 |
| Wilmar International Ltd. | | 3,210,100 | 9,481,729 |
| | | | 105,159,028 |
| Machinery - 0.7% | | | |
| Construction Machinery & Heavy Transportation Equipment - 0.4% | | | |
| Epiroc AB (A Shares) | | 298,900 | 5,987,886 |
| Industrial Machinery & Supplies & Components - 0.3% | | | |
| Sandvik AB (a) | | 278,500 | 5,662,308 |
TOTAL MACHINERY | | | 11,650,194 |
| Marine Transportation - 0.5% | | | |
| Marine Transportation - 0.5% | | | |
| Kirby Corp. (b) | | 114,400 | 8,218,496 |
| Metals & Mining - 33.9% | | | |
| Copper - 6.2% | | | |
| Antofagasta PLC | | 546,700 | 10,034,588 |
| Capstone Copper Corp. (b) | | 195,500 | 919,168 |
| First Quantum Minerals Ltd. | | 1,979,171 | 48,089,685 |
| Freeport-McMoRan, Inc. | | 1,121,800 | 42,527,438 |
| | | | 101,570,879 |
| Diversified Metals & Mining - 13.4% | | | |
| Anglo American PLC (United Kingdom) | | 21,189 | 652,922 |
| BHP Group Ltd. (London) | �� | 1,609,122 | 47,280,534 |
| Glencore PLC | | 8,897,500 | 52,518,680 |
| IGO Ltd. | | 295,625 | 2,722,377 |
| Ivanhoe Mines Ltd. (b) | | 875,600 | 7,593,682 |
| Rio Tinto PLC | | 285,781 | 18,167,783 |
| Sigma Lithium Corp. (a)(b) | | 243,100 | 8,462,311 |
| Sumitomo Metal Mining Co. Ltd. | | 8,700 | 321,106 |
| Teck Resources Ltd. Class B (sub. vtg.) | | 1,759,900 | 81,977,554 |
| | | | 219,696,949 |
| Gold - 8.2% | | | |
| Agnico Eagle Mines Ltd. (Canada) | | 515,217 | 29,228,017 |
| Alamos Gold, Inc. | | 1,237,700 | 15,995,960 |
| Barrick Gold Corp. (Canada) | | 484,247 | 9,207,073 |
| Franco-Nevada Corp. | | 60,871 | 9,236,344 |
| Newcrest Mining Ltd. | | 423,786 | 8,092,139 |
| Wheaton Precious Metals Corp. | | 1,260,900 | 62,214,389 |
| | | | 133,973,922 |
| Precious Metals & Minerals - 0.3% | | | |
| Anglo American Platinum Ltd. ADR (a) | | 146,700 | 1,487,538 |
| Impala Platinum Holdings Ltd. | | 372,900 | 3,630,481 |
| | | | 5,118,019 |
| Silver - 0.2% | | | |
| MAG Silver Corp. (b) | | 312,600 | 4,065,404 |
| Steel - 5.6% | | | |
| Champion Iron Ltd. (a) | | 6,740,300 | 29,003,911 |
| Reliance Steel & Aluminum Co. | | 168,500 | 41,754,300 |
| Vale SA | | 1,415,400 | 20,545,122 |
| | | | 91,303,333 |
TOTAL METALS & MINING | | | 555,728,506 |
| Oil, Gas & Consumable Fuels - 36.3% | | | |
| Integrated Oil & Gas - 23.1% | | | |
| Cenovus Energy, Inc. (Canada) (a) | | 3,932,600 | 66,005,332 |
| Exxon Mobil Corp. | | 1,473,100 | 174,326,650 |
| Occidental Petroleum Corp. | | 400 | 24,612 |
| Petroleo Brasileiro SA - Petrobras (ON) | | 2,391,400 | 12,786,928 |
| Shell PLC (London) | | 1,575,100 | 48,399,945 |
| Suncor Energy, Inc. | | 606,500 | 18,989,357 |
| TotalEnergies SE (a) | | 910,100 | 58,155,338 |
| | | | 378,688,162 |
| Oil & Gas Exploration & Production - 10.1% | | | |
| Antero Resources Corp. (b) | | 1,480,112 | 34,027,775 |
| Canadian Natural Resources Ltd. | | 1,102,500 | 67,182,640 |
| Coterra Energy, Inc. | | 474,100 | 12,136,960 |
| Hess Corp. | | 114,200 | 16,565,852 |
| MEG Energy Corp. (b) | | 51,200 | 852,546 |
| Ovintiv, Inc. | | 515,100 | 18,584,808 |
| Range Resources Corp. | | 622,200 | 16,457,190 |
| | | | 165,807,771 |
| Oil & Gas Storage & Transportation - 3.1% | | | |
| Energy Transfer LP | | 1,332,100 | 17,157,448 |
| Enterprise Products Partners LP | | 629,400 | 16,559,514 |
| Targa Resources Corp. | | 218,600 | 16,510,858 |
| | | | 50,227,820 |
TOTAL OIL, GAS & CONSUMABLE FUELS | | | 594,723,753 |
| Paper & Forest Products - 2.8% | | | |
| Forest Products - 1.4% | | | |
| West Fraser Timber Co. Ltd. | | 316,800 | 22,915,009 |
| Paper Products - 1.4% | | | |
| Stora Enso Oyj (R Shares) | | 206,400 | 2,615,470 |
| UPM-Kymmene Corp. (a) | | 614,300 | 19,562,328 |
| | | | 22,177,798 |
TOTAL PAPER & FOREST PRODUCTS | | | 45,092,807 |
| Pharmaceuticals - 0.5% | | | |
| Pharmaceuticals - 0.5% | | | |
| Bayer AG | | 134,400 | 8,869,899 |
| TOTAL COMMON STOCKS (Cost $1,447,788,330) | | | 1,613,544,338 |
| | | | |
| Money Market Funds - 4.7% |
| | | Shares | Value ($) |
| Fidelity Cash Central Fund 4.88% (c) | | 31,196,074 | 31,202,313 |
| Fidelity Securities Lending Cash Central Fund 4.88% (c)(d) | | 45,653,825 | 45,658,391 |
| TOTAL MONEY MARKET FUNDS (Cost $76,860,704) | | | 76,860,704 |
| | | | |
| TOTAL INVESTMENT IN SECURITIES - 103.1% (Cost $1,524,649,034) | 1,690,405,042 |
NET OTHER ASSETS (LIABILITIES) - (3.1)% | (50,059,825) |
| NET ASSETS - 100.0% | 1,640,345,217 |
| | |
Legend
| (a) | Security or a portion of the security is on loan at period end. |
| (c) | Affiliated fund that is generally available only to investment companies and other accounts managed by Fidelity Investments. The rate quoted is the annualized seven-day yield of the fund at period end. A complete unaudited listing of the fund's holdings as of its most recent quarter end is available upon request. In addition, each Fidelity Central Fund's financial statements are available on the SEC's website or upon request. |
| (d) | Investment made with cash collateral received from securities on loan. |
Affiliated Central Funds
Fiscal year to date information regarding the Fund's investments in Fidelity Central Funds, including the ownership percentage, is presented below.
| Affiliate | Value, beginning of period ($) | Purchases ($) | Sales Proceeds ($) | Dividend Income ($) | Realized Gain (loss) ($) | Change in Unrealized appreciation (depreciation) ($) | Value, end of period ($) | % ownership, end of period |
| Fidelity Cash Central Fund 4.88% | 32,028,909 | 416,851,569 | 417,678,165 | 483,758 | - | - | 31,202,313 | 0.1% |
| Fidelity Securities Lending Cash Central Fund 4.88% | 20,391,450 | 631,740,769 | 606,473,828 | 120,800 | - | - | 45,658,391 | 0.1% |
| Total | 52,420,359 | 1,048,592,338 | 1,024,151,993 | 604,558 | - | - | 76,860,704 | |
| | | | | | | | | |
Amounts in the dividend income column in the above table include any capital gain distributions from underlying funds, which are presented in the corresponding line item in the Statement of Operations, if applicable.
Amounts in the dividend income column for Fidelity Securities Lending Cash Central Fund represents the income earned on investing cash collateral, less rebates paid to borrowers and any lending agent fees associated with the loan, plus any premium payments received for lending certain types of securities.
Amounts included in the purchases and sales proceeds columns may include in-kind transactions, if applicable.
Investment Valuation
The following is a summary of the inputs used, as of April 30, 2023, involving the Fund's assets and liabilities carried at fair value. The inputs or methodology used for valuing securities may not be an indication of the risk associated with investing in those securities. For more information on valuation inputs, and their aggregation into the levels used below, please refer to the Investment Valuation section in the accompanying Notes to Financial Statements.
| Valuation Inputs at Reporting Date: |
| Description | Total ($) | Level 1 ($) | Level 2 ($) | Level 3 ($) |
Investments in Securities: | | | | |
|
| Common Stocks | 1,613,544,338 | 1,396,205,396 | 217,338,942 | - |
|
| Money Market Funds | 76,860,704 | 76,860,704 | - | - |
| Total Investments in Securities: | 1,690,405,042 | 1,473,066,100 | 217,338,942 | - |
| Statement of Assets and Liabilities |
| | | | April 30, 2023 (Unaudited) |
| | | | | |
| Assets | | | | |
| Investment in securities, at value (including securities loaned of $43,200,638) - See accompanying schedule: | | | | |
Unaffiliated issuers (cost $1,447,788,330) | $ | 1,613,544,338 | | |
Fidelity Central Funds (cost $76,860,704) | | 76,860,704 | | |
| | | | | |
| | | | | |
| Total Investment in Securities (cost $1,524,649,034) | | | $ | 1,690,405,042 |
| Foreign currency held at value (cost $242,595) | | | | 242,592 |
| Receivable for investments sold | | | | 24,226,304 |
| Receivable for fund shares sold | | | | 1,199,241 |
| Dividends receivable | | | | 3,537,757 |
| Distributions receivable from Fidelity Central Funds | | | | 69,764 |
| Prepaid expenses | | | | 589 |
| Other receivables | | | | 9,265 |
Total assets | | | | 1,719,690,554 |
| Liabilities | | | | |
| Payable for investments purchased | $ | 28,299,485 | | |
| Payable for fund shares redeemed | | 3,997,933 | | |
| Accrued management fee | | 966,526 | | |
| Distribution and service plan fees payable | | 64,684 | | |
| Other affiliated payables | | 313,596 | | |
| Other payables and accrued expenses | | 44,722 | | |
| Collateral on securities loaned | | 45,658,391 | | |
| Total Liabilities | | | | 79,345,337 |
| Net Assets | | | $ | 1,640,345,217 |
| Net Assets consist of: | | | | |
| Paid in capital | | | $ | 1,669,472,907 |
| Total accumulated earnings (loss) | | | | (29,127,690) |
| Net Assets | | | $ | 1,640,345,217 |
| | | | | |
| Net Asset Value and Maximum Offering Price | | | | |
| Class A : | | | | |
Net Asset Value and redemption price per share ($124,167,449 ÷ 6,717,143 shares) (a) | | | $ | 18.49 |
| Maximum offering price per share (100/94.25 of $18.49) | | | $ | 19.62 |
| Class M : | | | | |
Net Asset Value and redemption price per share ($23,680,650 ÷ 1,282,967 shares) (a) | | | $ | 18.46 |
| Maximum offering price per share (100/96.50 of $18.46) | | | $ | 19.13 |
| Class C : | | | | |
Net Asset Value and offering price per share ($32,736,766 ÷ 1,786,560 shares) (a) | | | $ | 18.32 |
| Global Commodity Stock : | | | | |
Net Asset Value , offering price and redemption price per share ($728,795,853 ÷ 39,355,116 shares) | | | $ | 18.52 |
| Class I : | | | | |
Net Asset Value , offering price and redemption price per share ($495,418,326 ÷ 26,770,850 shares) | | | $ | 18.51 |
| Class Z : | | | | |
Net Asset Value , offering price and redemption price per share ($235,546,173 ÷ 12,737,154 shares) | | | $ | 18.49 |
(a)Redemption price per share is equal to net asset value less any applicable contingent deferred sales charge. |
| Statement of Operations |
| | | | Six months ended April 30, 2023 (Unaudited) |
| Investment Income | | | | |
| Dividends | | | $ | 30,653,131 |
| Income from Fidelity Central Funds (including $120,800 from security lending) | | | | 604,558 |
| Income before foreign taxes withheld | | | $ | 31,257,689 |
| Less foreign taxes withheld | | | | (1,979,245) |
| Total Income | | | | 29,278,444 |
| Expenses | | | | |
| Management fee | $ | 6,291,513 | | |
| Transfer agent fees | | 1,621,556 | | |
| Distribution and service plan fees | | 407,879 | | |
| Accounting fees | | 393,154 | | |
| Custodian fees and expenses | | 45,177 | | |
| Independent trustees' fees and expenses | | 5,422 | | |
| Registration fees | | 174,119 | | |
| Audit | | 25,864 | | |
| Legal | | 1,471 | | |
| Interest | | 12,928 | | |
| Miscellaneous | | 3,623 | | |
| Total expenses before reductions | | 8,982,706 | | |
| Expense reductions | | (68,683) | | |
| Total expenses after reductions | | | | 8,914,023 |
| Net Investment income (loss) | | | | 20,364,421 |
| Realized and Unrealized Gain (Loss) | | | | |
| Net realized gain (loss) on: | | | | |
| Investment Securities: | | | | |
| Unaffiliated issuers | | 299,633 | | |
| Foreign currency transactions | | 32,418 | | |
| Total net realized gain (loss) | | | | 332,051 |
| Change in net unrealized appreciation (depreciation) on: | | | | |
| Investment Securities: | | | | |
| Unaffiliated issuers | | (93,594,641) | | |
| Assets and liabilities in foreign currencies | | 15,553 | | |
| Total change in net unrealized appreciation (depreciation) | | | | (93,579,088) |
| Net gain (loss) | | | | (93,247,037) |
| Net increase (decrease) in net assets resulting from operations | | | $ | (72,882,616) |
| Statement of Changes in Net Assets |
| |
| | Six months ended April 30, 2023 (Unaudited) | | Year ended October 31, 2022 |
| Increase (Decrease) in Net Assets | | | | |
| Operations | | | | |
| Net investment income (loss) | $ | 20,364,421 | $ | 36,916,447 |
| Net realized gain (loss) | | 332,051 | | (11,614,714) |
| Change in net unrealized appreciation (depreciation) | | (93,579,088) | | 103,859,568 |
| Net increase (decrease) in net assets resulting from operations | | (72,882,616) | | 129,161,301 |
| Distributions to shareholders | | (34,691,564) | | (25,407,967) |
| Share transactions - net increase (decrease) | | (67,197,403) | | 953,160,143 |
| Total increase (decrease) in net assets | | (174,771,583) | | 1,056,913,477 |
| | | | | |
| Net Assets | | | | |
| Beginning of period | | 1,815,116,800 | | 758,203,323 |
| End of period | $ | 1,640,345,217 | $ | 1,815,116,800 |
| | | | | |
| | | | | |
Financial Highlights
| Fidelity Advisor® Global Commodity Stock Fund Class A |
| |
| | Six months ended (Unaudited) April 30, 2023 | | Years ended October 31, 2022 | | 2021 | | 2020 | | 2019 | | 2018 |
Selected Per-Share Data | | | | | | | | | | | | |
| Net asset value, beginning of period | $ | 19.50 | $ | 16.35 | $ | 10.80 | $ | 12.14 | $ | 12.42 | $ | 12.56 |
| Income from Investment Operations | | | | | | | | | | | | |
Net investment income (loss) A,B | | .19 | | .47 | | .48 | | .28 | | .35 | | .21 |
| Net realized and unrealized gain (loss) | | (.88) | | 3.19 | | 5.24 | | (1.26) | | (.41) | | (.22) |
| Total from investment operations | | (.69) | | 3.66 | | 5.72 | | (.98) | | (.06) | | (.01) |
| Distributions from net investment income | | (.32) | | (.51) | | (.17) | | (.36) | | (.20) | | (.09) |
| Distributions from net realized gain | | - | | - | | - | | - | | (.02) | | (.05) |
| Total distributions | | (.32) | | (.51) | | (.17) | | (.36) | | (.22) | | (.13) C |
Redemption fees added to paid in capital A | | - | | - | | - | | - | | - | | - D |
| Net asset value, end of period | $ | 18.49 | $ | 19.50 | $ | 16.35 | $ | 10.80 | $ | 12.14 | $ | 12.42 |
Total Return E,F,G | | (3.59)% | | 23.27% | | 53.37% | | (8.39)% | | (.44)% | | (.05)% |
Ratios to Average Net Assets B,H,I | | | | | | | | | | | | |
| Expenses before reductions | | 1.19% J | | 1.19% | | 1.23% | | 1.31% | | 1.29% | | 1.28% |
| Expenses net of fee waivers, if any | | 1.19% J | | 1.19% | | 1.22% | | 1.31% | | 1.28% | | 1.28% |
| Expenses net of all reductions | | 1.19% J | | 1.19% | | 1.22% | | 1.29% | | 1.28% | | 1.27% |
| Net investment income (loss) | | 1.97% J | | 2.53% | | 3.18% | | 2.53% | | 2.86% | | 1.55% |
| Supplemental Data | | | | | | | | | | | | |
| Net assets, end of period (000 omitted) | $ | 124,167 | $ | 128,363 | $ | 45,343 | $ | 20,453 | $ | 25,779 | $ | 27,258 |
Portfolio turnover rate K | | 151% J | | 42% | | 37% | | 40% | | 55% | | 70% |
A Calculated based on average shares outstanding during the period.
B Net investment income (loss) is affected by the timing of the declaration of dividends by any underlying mutual funds or exchange-traded funds (ETFs). Net investment income (loss) of any mutual funds or ETFs is not included in the Fund's net investment income (loss) ratio.
C Total distributions per share do not sum due to rounding.
D Amount represents less than $.005 per share.
E Total returns for periods of less than one year are not annualized.
F Total returns would have been lower if certain expenses had not been reduced during the applicable periods shown.
G Total returns do not include the effect of the sales charges.
H Fees and expenses of any underlying mutual funds or exchange-traded funds (ETFs) are not included in the Fund's expense ratio. The Fund indirectly bears its proportionate share of these expenses. For additional expense information related to investments in Fidelity Central Funds, please refer to the "Investments in Fidelity Central Funds" note found in the Notes to Financial Statements section of the most recent Annual or Semi-Annual report.
I Expense ratios reflect operating expenses of the class. Expenses before reductions do not reflect amounts reimbursed, waived, or reduced through arrangements with the investment adviser, brokerage services, or other offset arrangements, if applicable, and do not represent the amount paid by the class during periods when reimbursements, waivers or reductions occur.
J Annualized.
K Amount does not include the portfolio activity of any underlying mutual funds or exchange-traded funds (ETFs).
| Fidelity Advisor® Global Commodity Stock Fund Class M |
| |
| | Six months ended (Unaudited) April 30, 2023 | | Years ended October 31, 2022 | | 2021 | | 2020 | | 2019 | | 2018 |
Selected Per-Share Data | | | | | | | | | | | | |
| Net asset value, beginning of period | $ | 19.46 | $ | 16.32 | $ | 10.78 | $ | 12.12 | $ | 12.39 | $ | 12.53 |
| Income from Investment Operations | | | | | | | | | | | | |
Net investment income (loss) A,B | | .16 | | .42 | | .44 | | .25 | | .31 | | .16 |
| Net realized and unrealized gain (loss) | | (.88) | | 3.19 | | 5.24 | | (1.27) | | (.40) | | (.20) |
| Total from investment operations | | (.72) | | 3.61 | | 5.68 | | (1.02) | | (.09) | | (.04) |
| Distributions from net investment income | | (.28) | | (.47) | | (.14) | | (.32) | | (.16) | | (.06) |
| Distributions from net realized gain | | - | | - | | - | | - | | (.02) | | (.05) |
| Total distributions | | (.28) | | (.47) | | (.14) | | (.32) | | (.18) | | (.10) C |
Redemption fees added to paid in capital A | | - | | - | | - | | - | | - | | - D |
| Net asset value, end of period | $ | 18.46 | $ | 19.46 | $ | 16.32 | $ | 10.78 | $ | 12.12 | $ | 12.39 |
Total Return E,F,G | | (3.75)% | | 22.93% | | 52.97% | | (8.72)% | | (.70)% | | (.30)% |
Ratios to Average Net Assets B,H,I | | | | | | | | | | | | |
| Expenses before reductions | | 1.46% J | | 1.46% | | 1.52% | | 1.59% | | 1.59% | | 1.59% |
| Expenses net of fee waivers, if any | | 1.45% J | | 1.46% | | 1.52% | | 1.59% | | 1.59% | | 1.59% |
| Expenses net of all reductions | | 1.45% J | | 1.46% | | 1.52% | | 1.58% | | 1.59% | | 1.58% |
| Net investment income (loss) | | 1.71% J | | 2.26% | | 2.88% | | 2.24% | | 2.55% | | 1.24% |
| Supplemental Data | | | | | | | | | | | | |
| Net assets, end of period (000 omitted) | $ | 23,681 | $ | 24,513 | $ | 8,888 | $ | 4,378 | $ | 5,416 | $ | 7,200 |
Portfolio turnover rate K | | 151% J | | 42% | | 37% | | 40% | | 55% | | 70% |
A Calculated based on average shares outstanding during the period.
B Net investment income (loss) is affected by the timing of the declaration of dividends by any underlying mutual funds or exchange-traded funds (ETFs). Net investment income (loss) of any mutual funds or ETFs is not included in the Fund's net investment income (loss) ratio.
C Total distributions per share do not sum due to rounding.
D Amount represents less than $.005 per share.
E Total returns for periods of less than one year are not annualized.
F Total returns would have been lower if certain expenses had not been reduced during the applicable periods shown.
G Total returns do not include the effect of the sales charges.
H Fees and expenses of any underlying mutual funds or exchange-traded funds (ETFs) are not included in the Fund's expense ratio. The Fund indirectly bears its proportionate share of these expenses. For additional expense information related to investments in Fidelity Central Funds, please refer to the "Investments in Fidelity Central Funds" note found in the Notes to Financial Statements section of the most recent Annual or Semi-Annual report.
I Expense ratios reflect operating expenses of the class. Expenses before reductions do not reflect amounts reimbursed, waived, or reduced through arrangements with the investment adviser, brokerage services, or other offset arrangements, if applicable, and do not represent the amount paid by the class during periods when reimbursements, waivers or reductions occur.
J Annualized.
K Amount does not include the portfolio activity of any underlying mutual funds or exchange-traded funds (ETFs).
| Fidelity Advisor® Global Commodity Stock Fund Class C |
| |
| | Six months ended (Unaudited) April 30, 2023 | | Years ended October 31, 2022 | | 2021 | | 2020 | | 2019 | | 2018 |
Selected Per-Share Data | | | | | | | | | | | | |
| Net asset value, beginning of period | $ | 19.29 | $ | 16.17 | $ | 10.68 | $ | 11.99 | $ | 12.26 | $ | 12.39 |
| Income from Investment Operations | | | | | | | | | | | | |
Net investment income (loss) A,B | | .12 | | .33 | | .37 | | .20 | | .26 | | .11 |
| Net realized and unrealized gain (loss) | | (.88) | | 3.18 | | 5.20 | | (1.26) | | (.41) | | (.19) |
| Total from investment operations | | (.76) | | 3.51 | | 5.57 | | (1.06) | | (.15) | | (.08) |
| Distributions from net investment income | | (.21) | | (.39) | | (.08) | | (.25) | | (.11) | | - |
| Distributions from net realized gain | | - | | - | | - | | - | | (.02) | | (.05) |
| Total distributions | | (.21) | | (.39) | | (.08) | | (.25) | | (.12) C | | (.05) |
Redemption fees added to paid in capital A | | - | | - | | - | | - | | - | | - D |
| Net asset value, end of period | $ | 18.32 | $ | 19.29 | $ | 16.17 | $ | 10.68 | $ | 11.99 | $ | 12.26 |
Total Return E,F,G | | (4.00)% | | 22.34% | | 52.30% | | (9.11)% | | (1.16)% | | (.67)% |
Ratios to Average Net Assets B,H,I | | | | | | | | | | | | |
| Expenses before reductions | | 1.94% J | | 1.94% | | 1.97% | | 2.05% | | 2.02% | | 2.00% |
| Expenses net of fee waivers, if any | | 1.94% J | | 1.93% | | 1.96% | | 2.04% | | 2.02% | | 1.99% |
| Expenses net of all reductions | | 1.94% J | | 1.93% | | 1.96% | | 2.03% | | 2.01% | | 1.98% |
| Net investment income (loss) | | 1.22% J | | 1.78% | | 2.44% | | 1.79% | | 2.13% | | .84% |
| Supplemental Data | | | | | | | | | | | | |
| Net assets, end of period (000 omitted) | $ | 32,737 | $ | 34,984 | $ | 11,020 | $ | 7,871 | $ | 11,294 | $ | 20,793 |
Portfolio turnover rate K | | 151% J | | 42% | | 37% | | 40% | | 55% | | 70% |
A Calculated based on average shares outstanding during the period.
B Net investment income (loss) is affected by the timing of the declaration of dividends by any underlying mutual funds or exchange-traded funds (ETFs). Net investment income (loss) of any mutual funds or ETFs is not included in the Fund's net investment income (loss) ratio.
C Total distributions per share do not sum due to rounding.
D Amount represents less than $.005 per share.
E Total returns for periods of less than one year are not annualized.
F Total returns would have been lower if certain expenses had not been reduced during the applicable periods shown.
G Total returns do not include the effect of the contingent deferred sales charge.
H Fees and expenses of any underlying mutual funds or exchange-traded funds (ETFs) are not included in the Fund's expense ratio. The Fund indirectly bears its proportionate share of these expenses. For additional expense information related to investments in Fidelity Central Funds, please refer to the "Investments in Fidelity Central Funds" note found in the Notes to Financial Statements section of the most recent Annual or Semi-Annual report.
I Expense ratios reflect operating expenses of the class. Expenses before reductions do not reflect amounts reimbursed, waived, or reduced through arrangements with the investment adviser, brokerage services, or other offset arrangements, if applicable, and do not represent the amount paid by the class during periods when reimbursements, waivers or reductions occur.
J Annualized.
K Amount does not include the portfolio activity of any underlying mutual funds or exchange-traded funds (ETFs).
| Fidelity® Global Commodity Stock Fund |
| |
| | Six months ended (Unaudited) April 30, 2023 | | Years ended October 31, 2022 | | 2021 | | 2020 | | 2019 | | 2018 |
Selected Per-Share Data | | | | | | | | | | | | |
| Net asset value, beginning of period | $ | 19.55 | $ | 16.39 | $ | 10.82 | $ | 12.15 | $ | 12.44 | $ | 12.59 |
| Income from Investment Operations | | | | | | | | | | | | |
Net investment income (loss) A,B | | .21 | | .52 | | .53 | | .31 | | .37 | | .23 |
| Net realized and unrealized gain (loss) | | (.88) | | 3.19 | | 5.26 | | (1.26) | | (.41) | | (.20) |
| Total from investment operations | | (.67) | | 3.71 | | 5.79 | | (.95) | | (.04) | | .03 |
| Distributions from net investment income | | (.36) | | (.55) | | (.22) | | (.38) | | (.23) | | (.13) |
| Distributions from net realized gain | | - | | - | | - | | - | | (.02) | | (.05) |
| Total distributions | | (.36) | | (.55) | | (.22) | | (.38) | | (.25) | | (.18) |
Redemption fees added to paid in capital A | | - | | - | | - | | - | | - | | - C |
| Net asset value, end of period | $ | 18.52 | $ | 19.55 | $ | 16.39 | $ | 10.82 | $ | 12.15 | $ | 12.44 |
Total Return D,E | | (3.53)% | | 23.57% | | 53.95% | | (8.16)% | | (.23)% | | .23% |
Ratios to Average Net Assets B,F,G | | | | | | | | | | | | |
| Expenses before reductions | | .96% H | | .94% | | .94% | | 1.02% | | 1.06% | | 1.08% |
| Expenses net of fee waivers, if any | | .95% H | | .94% | | .94% | | 1.02% | | 1.06% | | 1.08% |
| Expenses net of all reductions | | .95% H | | .94% | | .94% | | 1.00% | | 1.06% | | 1.06% |
| Net investment income (loss) | | 2.20% H | | 2.78% | | 3.46% | | 2.82% | | 3.08% | | 1.75% |
| Supplemental Data | | | | | | | | | | | | |
| Net assets, end of period (000 omitted) | $ | 728,796 | $ | 893,636 | $ | 546,863 | $ | 176,718 | $ | 257,011 | $ | 369,563 |
Portfolio turnover rate I | | 151% H | | 42% | | 37% | | 40% | | 55% | | 70% |
A Calculated based on average shares outstanding during the period.
B Net investment income (loss) is affected by the timing of the declaration of dividends by any underlying mutual funds or exchange-traded funds (ETFs). Net investment income (loss) of any mutual funds or ETFs is not included in the Fund's net investment income (loss) ratio.
C Amount represents less than $.005 per share.
D Total returns for periods of less than one year are not annualized.
E Total returns would have been lower if certain expenses had not been reduced during the applicable periods shown.
F Fees and expenses of any underlying mutual funds or exchange-traded funds (ETFs) are not included in the Fund's expense ratio. The Fund indirectly bears its proportionate share of these expenses. For additional expense information related to investments in Fidelity Central Funds, please refer to the "Investments in Fidelity Central Funds" note found in the Notes to Financial Statements section of the most recent Annual or Semi-Annual report.
G Expense ratios reflect operating expenses of the class. Expenses before reductions do not reflect amounts reimbursed, waived, or reduced through arrangements with the investment adviser, brokerage services, or other offset arrangements, if applicable, and do not represent the amount paid by the class during periods when reimbursements, waivers or reductions occur.
H Annualized.
I Amount does not include the portfolio activity of any underlying mutual funds or exchange-traded funds (ETFs).
| Fidelity Advisor® Global Commodity Stock Fund Class I |
| |
| | Six months ended (Unaudited) April 30, 2023 | | Years ended October 31, 2022 | | 2021 | | 2020 | | 2019 | | 2018 |
Selected Per-Share Data | | | | | | | | | | | | |
| Net asset value, beginning of period | $ | 19.54 | $ | 16.39 | $ | 10.81 | $ | 12.16 | $ | 12.45 | $ | 12.60 |
| Income from Investment Operations | | | | | | | | | | | | |
Net investment income (loss) A,B | | .21 | | .52 | | .53 | | .32 | | .39 | | .25 |
| Net realized and unrealized gain (loss) | | (.87) | | 3.19 | | 5.25 | | (1.26) | | (.41) | | (.21) |
| Total from investment operations | | (.66) | | 3.71 | | 5.78 | | (.94) | | (.02) | | .04 |
| Distributions from net investment income | | (.37) | | (.56) | | (.20) | | (.41) | | (.25) | | (.14) |
| Distributions from net realized gain | | - | | - | | - | | - | | (.02) | | (.05) |
| Total distributions | | (.37) | | (.56) | | (.20) | | (.41) | | (.27) | | (.19) |
Redemption fees added to paid in capital A | | - | | - | | - | | - | | - | | - C |
| Net asset value, end of period | $ | 18.51 | $ | 19.54 | $ | 16.39 | $ | 10.81 | $ | 12.16 | $ | 12.45 |
Total Return D,E | | (3.48)% | | 23.56% | | 53.97% | | (8.11)% | | (.06)% | | .30% |
Ratios to Average Net Assets B,F,G | | | | | | | | | | | | |
| Expenses before reductions | | .92% H | | .92% | | .93% | | .95% | | .92% | | .93% |
| Expenses net of fee waivers, if any | | .92% H | | .92% | | .93% | | .95% | | .92% | | .93% |
| Expenses net of all reductions | | .92% H | | .92% | | .93% | | .93% | | .91% | | .91% |
| Net investment income (loss) | | 2.23% H | | 2.80% | | 3.48% | | 2.88% | | 3.23% | | 1.90% |
| Supplemental Data | | | | | | | | | | | | |
| Net assets, end of period (000 omitted) | $ | 495,418 | $ | 499,191 | $ | 85,252 | $ | 33,185 | $ | 102,633 | $ | 117,981 |
Portfolio turnover rate I | | 151% H | | 42% | | 37% | | 40% | | 55% | | 70% |
A Calculated based on average shares outstanding during the period.
B Net investment income (loss) is affected by the timing of the declaration of dividends by any underlying mutual funds or exchange-traded funds (ETFs). Net investment income (loss) of any mutual funds or ETFs is not included in the Fund's net investment income (loss) ratio.
C Amount represents less than $.005 per share.
D Total returns for periods of less than one year are not annualized.
E Total returns would have been lower if certain expenses had not been reduced during the applicable periods shown.
F Fees and expenses of any underlying mutual funds or exchange-traded funds (ETFs) are not included in the Fund's expense ratio. The Fund indirectly bears its proportionate share of these expenses. For additional expense information related to investments in Fidelity Central Funds, please refer to the "Investments in Fidelity Central Funds" note found in the Notes to Financial Statements section of the most recent Annual or Semi-Annual report.
G Expense ratios reflect operating expenses of the class. Expenses before reductions do not reflect amounts reimbursed, waived, or reduced through arrangements with the investment adviser, brokerage services, or other offset arrangements, if applicable, and do not represent the amount paid by the class during periods when reimbursements, waivers or reductions occur.
H Annualized.
I Amount does not include the portfolio activity of any underlying mutual funds or exchange-traded funds (ETFs).
| Fidelity Advisor® Global Commodity Stock Fund Class Z |
| |
| | Six months ended (Unaudited) April 30, 2023 | | Years ended October 31, 2022 | | 2021 | | 2020 | | 2019 | | 2018 A |
Selected Per-Share Data | | | | | | | | | | | | |
| Net asset value, beginning of period | $ | 19.53 | $ | 16.38 | $ | 10.81 | $ | 12.16 | $ | 12.46 | $ | 13.84 |
| Income from Investment Operations | | | | | | | | | | | | |
Net investment income (loss) B,C | | .23 | | .54 | | .56 | | .34 | | .39 | | (.01) |
| Net realized and unrealized gain (loss) | | (.89) | | 3.19 | | 5.23 | | (1.26) | | (.40) | | (1.37) |
| Total from investment operations | | (.66) | | 3.73 | | 5.79 | | (.92) | | (.01) | | (1.38) |
| Distributions from net investment income | | (.38) | | (.58) | | (.22) | | (.43) | | (.27) | | - |
| Distributions from net realized gain | | - | | - | | - | | - | | (.02) | | - |
| Total distributions | | (.38) | | (.58) | | (.22) | | (.43) | | (.29) | | - |
| Net asset value, end of period | $ | 18.49 | $ | 19.53 | $ | 16.38 | $ | 10.81 | $ | 12.16 | $ | 12.46 |
Total Return D,E | | (3.45)% | | 23.72% | | 54.07% | | (7.99)% | | .03% | | (9.97)% |
Ratios to Average Net Assets C,F,G | | | | | | | | | | | | |
| Expenses before reductions | | .79% H | | .79% | | .80% | | .85% | | .83% | | .89% H |
| Expenses net of fee waivers, if any | | .79% H | | .79% | | .80% | | .84% | | .83% | | .89% H |
| Expenses net of all reductions | | .79% H | | .79% | | .80% | | .83% | | .82% | | .87% H |
| Net investment income (loss) | | 2.37% H | | 2.93% | | 3.60% | | 2.99% | | 3.32% | | (.70)% H |
| Supplemental Data | | | | | | | | | | | | |
| Net assets, end of period (000 omitted) | $ | 235,546 | $ | 234,430 | $ | 60,837 | $ | 16,505 | $ | 104,489 | $ | 5,118 |
Portfolio turnover rate I | | 151% H | | 42% | | 37% | | 40% | | 55% | | 70% |
A For the period October 2, 2018 (commencement of sale of shares) through October 31, 2018.
B Calculated based on average shares outstanding during the period.
C Net investment income (loss) is affected by the timing of the declaration of dividends by any underlying mutual funds or exchange-traded funds (ETFs). Net investment income (loss) of any mutual funds or ETFs is not included in the Fund's net investment income (loss) ratio.
D Total returns for periods of less than one year are not annualized.
E Total returns would have been lower if certain expenses had not been reduced during the applicable periods shown.
F Fees and expenses of any underlying mutual funds or exchange-traded funds (ETFs) are not included in the Fund's expense ratio. The Fund indirectly bears its proportionate share of these expenses. For additional expense information related to investments in Fidelity Central Funds, please refer to the "Investments in Fidelity Central Funds" note found in the Notes to Financial Statements section of the most recent Annual or Semi-Annual report.
G Expense ratios reflect operating expenses of the class. Expenses before reductions do not reflect amounts reimbursed, waived, or reduced through arrangements with the investment adviser, brokerage services, or other offset arrangements, if applicable, and do not represent the amount paid by the class during periods when reimbursements, waivers or reductions occur.
H Annualized.
I Amount does not include the portfolio activity of any underlying mutual funds or exchange-traded funds (ETFs).
For the period ended April 30, 2023
1. Organization.
Fidelity Global Commodity Stock Fund (the Fund) is a non-diversified fund of Fidelity Investment Trust (the Trust) and is authorized to issue an unlimited number of shares. The Trust is registered under the Investment Company Act of 1940, as amended (the 1940 Act), as an open-end management investment company organized as a Massachusetts business trust. The Fund offers Class A, Class M, Class C, Global Commodity Stock, Class I and Class Z shares, each of which has equal rights as to assets and voting privileges. Class A, Class M, Class C, Class I and Class Z are Fidelity Advisor classes. Each class has exclusive voting rights with respect to matters that affect that class. Class C shares will automatically convert to Class A shares after a holding period of eight years from the initial date of purchase, with certain exceptions.
2. Investments in Fidelity Central Funds.
Funds may invest in Fidelity Central Funds, which are open-end investment companies generally available only to other investment companies and accounts managed by the investment adviser and its affiliates. The Schedule of Investments lists any Fidelity Central Funds held as an investment as of period end, but does not include the underlying holdings of each Fidelity Central Fund. An investing fund indirectly bears its proportionate share of the expenses of the underlying Fidelity Central Funds.
Based on its investment objective, each Fidelity Central Fund may invest or participate in various investment vehicles or strategies that are similar to those of the investing fund. These strategies are consistent with the investment objectives of the investing fund and may involve certain economic risks which may cause a decline in value of each of the Fidelity Central Funds and thus a decline in the value of the investing fund.
| Fidelity Central Fund | Investment Manager | Investment Objective | Investment Practices | Expense Ratio A |
| Fidelity Money Market Central Funds | Fidelity Management & Research Company LLC (FMR) | Each fund seeks to obtain a high level of current income consistent with the preservation of capital and liquidity. | Short-term Investments | Less than .005% |
A Expenses expressed as a percentage of average net assets and are as of each underlying Central Fund's most recent annual or semi-annual shareholder report.
A complete unaudited list of holdings for each Fidelity Central Fund is available upon request or at the Securities and Exchange Commission website at www.sec.gov. In addition, the financial statements of the Fidelity Central Funds which contain the significant accounting policies (including investment valuation policies) of those funds, and are not covered by the Report of Independent Registered Public Accounting Firm, are available on the Securities and Exchange Commission website or upon request.
3. Significant Accounting Policies.
The Fund is an investment company and applies the accounting and reporting guidance of the Financial Accounting Standards Board (FASB) Accounting Standards Codification Topic 946 Financial Services - Investment Companies . The financial statements have been prepared in conformity with accounting principles generally accepted in the United States of America (GAAP), which require management to make certain estimates and assumptions at the date of the financial statements. Actual results could differ from those estimates. Subsequent events, if any, through the date that the financial statements were issued have been evaluated in the preparation of the financial statements. The Fund's Schedule of Investments lists any underlying mutual funds or exchange-traded funds (ETFs) but does not include the underlying holdings of these funds. The following summarizes the significant accounting policies of the Fund:
Investment Valuation. Investments are valued as of 4:00 p.m. Eastern time on the last calendar day of the period. The Board of Trustees (the Board) has designated the Fund's investment adviser as the valuation designee responsible for the fair valuation function and performing fair value determinations as needed. The investment adviser has established a Fair Value Committee (the Committee) to carry out the day-to-day fair valuation responsibilities and has adopted policies and procedures to govern the fair valuation process and the activities of the Committee. In accordance with these fair valuation policies and procedures, which have been approved by the Board, the Fund attempts to obtain prices from one or more third party pricing services or brokers to value its investments. When current market prices, quotations or currency exchange rates are not readily available or reliable, investments will be fair valued in good faith by the Committee, in accordance with the policies and procedures. Factors used in determining fair value vary by investment type and may include market or investment specific events, transaction data, estimated cash flows, and market observations of comparable investments. The frequency that the fair valuation procedures are used cannot be predicted and they may be utilized to a significant extent. The Committee manages the Fund's fair valuation practices and maintains the fair valuation policies and procedures. The Fund's investment adviser reports to the Board information regarding the fair valuation process and related material matters.
The Fund categorizes the inputs to valuation techniques used to value its investments into a disclosure hierarchy consisting of three levels as shown below:
Level 1 - unadjusted quoted prices in active markets for identical investments
Level 2 - other significant observable inputs (including quoted prices for similar investments, interest rates, prepayment speeds, etc.)
Level 3 - unobservable inputs (including the Fund's own assumptions based on the best information available)
Valuation techniques used to value the Fund's investments by major category are as follows:
Equity securities, including restricted securities, for which market quotations are readily available, are valued at the last reported sale price or official closing price as reported by a third party pricing service on the primary market or exchange on which they are traded and are categorized as Level 1 in the hierarchy. In the event there were no sales during the day or closing prices are not available, securities are valued at the last quoted bid price or may be valued using the last available price and are generally categorized as Level 2 in the hierarchy. For foreign equity securities, when market or security specific events arise, comparisons to the valuation of American Depositary Receipts (ADRs), futures contracts, ETFs and certain indexes as well as quoted prices for similar securities may be used and would be categorized as Level 2 in the hierarchy. For equity securities, including restricted securities, where observable inputs are limited, assumptions about market activity and risk are used and these securities may be categorized as Level 3 in the hierarchy.
Investments in open-end mutual funds, including the Fidelity Central Funds, are valued at their closing net asset value (NAV) each business day and are categorized as Level 1 in the hierarchy.
Changes in valuation techniques may result in transfers in or out of an assigned level within the disclosure hierarchy. The aggregate value of investments by input level as of April 30, 2023 is included at the end of the Fund's Schedule of Investments.
Foreign Currency. Certain Funds may use foreign currency contracts to facilitate transactions in foreign-denominated securities. Gains and losses from these transactions may arise from changes in the value of the foreign currency or if the counterparties do not perform under the contracts' terms.
Foreign-denominated assets, including investment securities, and liabilities are translated into U.S. dollars at the exchange rates at period end. Purchases and sales of investment securities, income and dividends received, and expenses denominated in foreign currencies are translated into U.S. dollars at the exchange rate in effect on the transaction date.
The effects of exchange rate fluctuations on investments are included with the net realized and unrealized gain (loss) on investment securities. Other foreign currency transactions resulting in realized and unrealized gain (loss) are disclosed separately.
Investment Transactions and Income. For financial reporting purposes, the Fund's investment holdings and NAV include trades executed through the end of the last business day of the period. The NAV per share for processing shareholder transactions is calculated as of the close of business of the New York Stock Exchange (NYSE), normally 4:00 p.m. Eastern time and includes trades executed through the end of the prior business day. Gains and losses on securities sold are determined on the basis of identified cost and include proceeds received from litigation. Commissions paid to certain brokers with whom the investment adviser, or its affiliates, places trades on behalf of a fund include an amount in addition to trade execution, which may be rebated back to a fund. Any such rebates are included in net realized gain (loss) on investments in the Statement of Operations. Dividend income is recorded on the ex-dividend date, except for certain dividends from foreign securities where the ex-dividend date may have passed, which are recorded as soon as the Fund is informed of the ex-dividend date. Non-cash dividends included in dividend income, if any, are recorded at the fair market value of the securities received. Income and capital gain distributions from Fidelity Central Funds, if any, are recorded on the ex-dividend date. Certain distributions received by the Fund represent a return of capital or capital gain. The Fund determines the components of these distributions subsequent to the ex-dividend date, based upon receipt of tax filings or other correspondence relating to the underlying investment. These distributions are recorded as a reduction of cost of investments and/or as a realized gain. Investment income is recorded net of foreign taxes withheld where recovery of such taxes is uncertain. Funds may file withholding tax reclaims in certain jurisdictions to recover a portion of amounts previously withheld. Any withholding tax reclaims income is included in the Statement of Operations in foreign taxes withheld. Any receivables for withholding tax reclaims are included in the Statement of Assets and Liabilities in dividends receivable.
Class Allocations and Expenses. Investment income, realized and unrealized capital gains and losses, common expenses of a fund, and certain fund-level expense reductions, if any, are allocated daily on a pro-rata basis to each class based on the relative net assets of each class to the total net assets of a fund. Each class differs with respect to transfer agent and distribution and service plan fees incurred, as applicable. Certain expense reductions may also differ by class, if applicable. For the reporting period, the allocated portion of income and expenses to each class as a percent of its average net assets may vary due to the timing of recording these transactions in relation to fluctuating net assets of the classes. Expenses directly attributable to a fund are charged to that fund. Expenses attributable to more than one fund are allocated among the respective funds on the basis of relative net assets or other appropriate methods. Expenses included in the accompanying financial statements reflect the expenses of that fund and do not include any expenses associated with any underlying mutual funds or exchange-traded funds. Although not included in a fund's expenses, a fund indirectly bears its proportionate share of these expenses through the net asset value of each underlying mutual fund or exchange-traded fund. Expense estimates are accrued in the period to which they relate and adjustments are made when actual amounts are known.
Income Tax Information and Distributions to Shareholders. Each year, the Fund intends to qualify as a regulated investment company under Subchapter M of the Internal Revenue Code, including distributing substantially all of its taxable income and realized gains. As a result, no provision for U.S. Federal income taxes is required. The Fund files a U.S. federal tax return, in addition to state and local tax returns as required. The Fund's federal income tax returns are subject to examination by the Internal Revenue Service (IRS) for a period of three fiscal years after they are filed. State and local tax returns may be subject to examination for an additional fiscal year depending on the jurisdiction. Foreign taxes are provided for based on the Fund's understanding of the tax rules and rates that exist in the foreign markets in which it invests.
Distributions are declared and recorded on the ex-dividend date. Income and capital gain distributions are declared separately for each class. Income and capital gain distributions are determined in accordance with income tax regulations, which may differ from GAAP.
Capital accounts within the financial statements are adjusted for permanent book-tax differences. These adjustments have no impact on net assets or the results of operations. Capital accounts are not adjusted for temporary book-tax differences which will reverse in a subsequent period.
Book-tax differences are primarily due to foreign currency transactions, passive foreign investment companies (PFIC), capital loss carryforwards and losses deferred due to wash sales.
As of period end, the cost and unrealized appreciation (depreciation) in securities, and derivatives if applicable, for federal income tax purposes were as follows:
| Gross unrealized appreciation | $222,932,386 |
| Gross unrealized depreciation | (65,503,660) |
| Net unrealized appreciation (depreciation) | $157,428,726 |
| Tax cost | $1,532,976,316 |
Capital loss carryforwards are only available to offset future capital gains of the Fund to the extent provided by regulations and may be limited. The capital loss carryforward information presented below, including any applicable limitation, is estimated as of prior fiscal period end and is subject to adjustment.
| Short-term | $(61,986,325) |
| Long-term | (122,480,238) |
| Total capital loss carryforward | $(184,466,563) |
4. Purchases and Sales of Investments.
Purchases and sales of securities, other than short-term securities and in-kind transactions, as applicable, are noted in the table below.
| | Purchases ($) | Sales ($) |
| Fidelity Global Commodity Stock Fund | 1,372,871,593 | 1,460,464,120 |
5. Fees and Other Transactions with Affiliates.
Management Fee. Fidelity Management & Research Company LLC (the investment adviser) and its affiliates provide the Fund with investment management related services for which the Fund pays a monthly management fee. The management fee is the sum of an individual fund fee rate that is based on an annual rate of .45% of the Fund's average net assets and an annualized group fee rate that averaged .23% during the period. The group fee rate is based upon the monthly average net assets of a group of registered investment companies with which the investment adviser has management contracts. The group fee rate decreases as assets under management increase and increases as assets under management decrease. For the reporting period, the total annualized management fee rate was .68% of the Fund's average net assets.
Distribution and Service Plan Fees. In accordance with Rule 12b-1 of the 1940 Act, the Fund has adopted separate Distribution and Service Plans for each class of shares. Certain classes pay Fidelity Distributors Company LLC (FDC), an affiliate of the investment adviser, separate Distribution and Service Fees, each of which is based on an annual percentage of each class' average net assets. In addition, FDC may pay financial intermediaries for selling shares of the Fund and providing shareholder support services. For the period, the Distribution and Service Fee rates, total fees and amounts retained by FDC were as follows:
| | Distribution Fee | Service Fee | Total Fees | Retained by FDC |
| Class A | - % | .25% | $168,190 | $12,622 |
| Class M | .25% | .25% | 62,904 | 791 |
| Class C | .75% | .25% | 176,785 | 75,773 |
| | | | $407,879 | $89,186 |
Sales Load. FDC may receive a front-end sales charge of up to 5.75% for selling Class A shares and 3.50% for selling Class M shares, some of which is paid to financial intermediaries for selling shares of the Fund. Depending on the holding period, FDC may receive contingent deferred sales charges levied on Class A, Class M and Class C redemptions. The deferred sales charges are 1.00% for Class C shares, 1.00% for certain purchases of Class A shares and .25% for certain purchases of Class M shares.
For the period, sales charge amounts retained by FDC were as follows:
| | Retained by FDC |
| Class A | $131,680 |
| Class M | 3,526 |
Class C A | 4,697 |
| | $139,903 |
A When Class C shares are initially sold, FDC pays commissions from its own resources to financial intermediaries through which the sales are made.
Transfer Agent Fees. Fidelity Investments Institutional Operations Company LLC (FIIOC), an affiliate of the investment adviser, is the transfer, dividend disbursing and shareholder servicing agent for each class of the Fund. FIIOC receives account fees and asset-based fees that vary according to the account size and type of account of the shareholders of the respective classes of the Fund, except for Class Z. FIIOC receives an asset-based fee of Class Z's average net assets. FIIOC pays for typesetting, printing and mailing of shareholder reports, except proxy statements.
For the period, transfer agent fees for each class were as follows:
| | Amount | % of Class-Level Average Net Assets A |
| Class A | $128,198 | .19 |
| Class M | 27,025 | .22 |
| Class C | 33,496 | .19 |
| Global Commodity Stock | 892,662 | .21 |
| Class I | 486,315 | .17 |
| Class Z | 53,860 | .04 |
| | $1,621,556 | |
A Annualized
Accounting Fees. Fidelity Service Company, Inc. (FSC), an affiliate of the investment adviser, maintains the Fund's accounting records. The accounting fee is based on the level of average net assets for each month. For the period, the fees were equivalent to the following annualized rates:
| | % of Average Net Assets |
| Fidelity Global Commodity Stock Fund | .04 |
Brokerage Commissions. A portion of portfolio transactions were placed with brokerage firms which are affiliates of the investment adviser. Brokerage commissions are included in net realized gain (loss) and change in net unrealized appreciation (depreciation) in the Statement of Operations. The commissions paid to these affiliated firms were as follows:
| | Amount |
| Fidelity Global Commodity Stock Fund | $21,233 |
Interfund Lending Program. Pursuant to an Exemptive Order issued by the Securities and Exchange Commission (the SEC), the Fund, along with other registered investment companies having management contracts with Fidelity Management & Research Company LLC (FMR), or other affiliated entities of FMR, may participate in an interfund lending program. This program provides an alternative credit facility allowing the Fund to borrow from, or lend money to, other participating affiliated funds. At period end, there were no interfund loans outstanding. Activity in this program during the period for which loans were outstanding was as follows:
| | Borrower or Lender | Average Loan Balance | Weighted Average Interest Rate | Interest Expense |
| Fidelity Global Commodity Stock Fund | Borrower | $9,585,300 | 4.86% | $12,928 |
Interfund Trades. Funds may purchase from or sell securities to other Fidelity Funds under procedures adopted by the Board. The procedures have been designed to ensure these interfund trades are executed in accordance with Rule 17a-7 of the 1940 Act. Any interfund trades are included within the respective purchases and sales amounts shown in the Purchases and Sales of Investments note. Interfund trades during the period are noted in the table below.
| | Purchases ($) | Sales ($) | Realized Gain (Loss) ($) |
| Fidelity Global Commodity Stock Fund | 57,337,688 | 46,867,482 | (3,824,073) |
6. Committed Line of Credit.
Certain Funds participate with other funds managed by the investment adviser or an affiliate in a $4.25 billion credit facility (the "line of credit") to be utilized for temporary or emergency purposes to fund shareholder redemptions or for other short-term liquidity purposes. The participating funds have agreed to pay commitment fees on their pro-rata portion of the line of credit, which are reflected in Miscellaneous expenses on the Statement of Operations, and are listed below. During the period, there were no borrowings on this line of credit.
| | Amount |
| Fidelity Global Commodity Stock Fund | $1,853 |
7. Security Lending.
Funds lend portfolio securities from time to time in order to earn additional income. Lending agents are used, including National Financial Services (NFS), an affiliate of the investment adviser. Pursuant to a securities lending agreement, NFS will receive a fee, which is capped at 9.9% of a fund's daily lending revenue, for its services as lending agent. A fund may lend securities to certain qualified borrowers, including NFS. On the settlement date of the loan, a fund receives collateral (in the form of U.S. Treasury obligations, letters of credit and/or cash) against the loaned securities and maintains collateral in an amount not less than 100% of the market value of the loaned securities during the period of the loan. The market value of the loaned securities is determined at the close of business of a fund and any additional required collateral is delivered to a fund on the next business day. A fund or borrower may terminate the loan at any time, and if the borrower defaults on its obligation to return the securities loaned because of insolvency or other reasons, a fund may apply collateral received from the borrower against the obligation. A fund may experience delays and costs in recovering the securities loaned. Any cash collateral received is invested in the Fidelity Securities Lending Cash Central Fund. Any loaned securities are identified as such in the Schedule of Investments, and the value of loaned securities and cash collateral at period end, as applicable, are presented in the Statement of Assets and Liabilities. Security lending income represents the income earned on investing cash collateral, less rebates paid to borrowers and any lending agent fees associated with the loan, plus any premium payments received for lending certain types of securities. Security lending income is presented in the Statement of Operations as a component of income from Fidelity Central Funds. Affiliated security lending activity, if any, was as follows:
| | Total Security Lending Fees Paid to NFS | Security Lending Income From Securities Loaned to NFS | Value of Securities Loaned to NFS at Period End |
| Fidelity Global Commodity Stock Fund | $13,515 | $- | $- |
8. Expense Reductions.
The investment adviser contractually agreed to reimburse expenses of each class to the extent annual operating expenses exceeded certain levels of class-level average net assets as noted in the table below. This reimbursement will remain in place through February 29, 2024. Some expenses, for example the compensation of the independent Trustees, are excluded from this reimbursement.
The following classes were in reimbursement during the period:
| | Expense Limitations | Reimbursement |
| Class M | 1.45% | $1,504 |
| Global Commodity Stock | .95% | 24,651 |
| | | $26,155 |
Through arrangements with the Fund's custodian and each class' transfer agent, credits realized as a result of certain uninvested cash balances were used to reduce the Fund's expenses. During the period, custodian credits reduced the Fund's expenses by $166. During the period, transfer agent credits reduced each class' expenses as noted in the table below.
| | Expense reduction |
| Class M | 121 |
| Class C | 7 |
| | $128 |
In addition, during the period the investment adviser or an affiliate reimbursed and/or waived a portion of fund-level operating expenses in the amount of $42,234.
9. Distributions to Shareholders.
Distributions to shareholders of each class were as follows:
| | Six months ended April 30, 2023 | Year ended October 31, 2022 |
| Fidelity Global Commodity Stock Fund | | |
| Distributions to shareholders | | |
| Class A | $2,247,696 | $1,448,690 |
| Class M | 366,393 | 259,454 |
| Class C | 382,649 | 264,183 |
| Global Commodity Stock | 16,441,380 | 18,171,488 |
| Class I | 10,386,346 | 3,064,346 |
| Class Z | 4,867,100 | 2,199,806 |
| Total | $34,691,564 | $25,407,967 |
10. Share Transactions.
Share transactions for each class were as follows and may contain in-kind transactions, automatic conversions between classes or exchanges between affiliated funds:
| | Shares | Shares | Dollars | Dollars |
| | Six months ended April 30, 2023 | Year ended October 31, 2022 | Six months ended April 30, 2023 | Year ended October 31, 2022 |
| Fidelity Global Commodity Stock Fund | | | | |
| Class A | | | | |
| Shares sold | 1,307,233 | 5,245,104 | $25,440,094 | $102,330,553 |
| Reinvestment of distributions | 115,956 | 93,881 | 2,236,781 | 1,435,437 |
| Shares redeemed | (1,287,539) | (1,530,075) | (24,366,674) | (28,265,460) |
| Net increase (decrease) | 135,650 | 3,808,910 | $3,310,201 | $75,500,530 |
| Class M | | | | |
| Shares sold | 173,322 | 994,128 | $3,371,035 | $18,969,401 |
| Reinvestment of distributions | 18,802 | 16,878 | 362,695 | 258,240 |
| Shares redeemed | (168,825) | (295,956) | (3,190,134) | (5,535,121) |
| Net increase (decrease) | 23,299 | 715,050 | $543,596 | $13,692,520 |
| Class C | | | | |
| Shares sold | 267,044 | 1,526,059 | $5,192,991 | $29,910,914 |
| Reinvestment of distributions | 19,865 | 17,324 | 381,017 | 263,849 |
| Shares redeemed | (313,589) | (411,550) | (5,919,218) | (7,532,050) |
| Net increase (decrease) | (26,680) | 1,131,833 | $(345,210) | $22,642,713 |
| Global Commodity Stock | | | | |
| Shares sold | 10,826,615 | 37,700,647 | $212,425,121 | $735,708,594 |
| Reinvestment of distributions | 741,996 | 1,053,837 | 14,327,947 | 16,113,170 |
| Shares redeemed | (17,930,384) | (26,409,632) | (344,612,797) | (482,758,151) |
| Net increase (decrease) | (6,361,773) | 12,344,852 | $(117,859,729) | $269,063,613 |
| Class I | | | | |
| Shares sold | 12,226,292 | 29,119,851 | $238,837,159 | $566,732,834 |
| Reinvestment of distributions | 528,030 | 198,222 | 10,190,979 | 3,028,836 |
| Shares redeemed | (11,529,104) | (8,975,269) | (218,278,054) | (163,585,245) |
| Net increase (decrease) | 1,225,218 | 20,342,804 | $30,750,084 | $406,176,425 |
| Class Z | | | | |
| Shares sold | 3,925,536 | 12,915,308 | $76,320,194 | $249,174,298 |
| Reinvestment of distributions | 213,545 | 129,470 | 4,115,012 | 1,975,709 |
| Shares redeemed | (3,404,407) | (4,757,037) | (64,031,551) | (85,065,665) |
| Net increase (decrease) | 734,674 | 8,287,741 | $16,403,655 | $166,084,342 |
11. Other.
A fund's organizational documents provide former and current trustees and officers with a limited indemnification against liabilities arising in connection with the performance of their duties to the fund. In the normal course of business, a fund may also enter into contracts that provide general indemnifications. A fund's maximum exposure under these arrangements is unknown as this would be dependent on future claims that may be made against a fund. The risk of material loss from such claims is considered remote.
12. Risk and Uncertainties.
Many factors affect a fund's performance. Developments that disrupt global economies and financial markets, such as pandemics, epidemics, outbreaks of infectious diseases, war, terrorism, and environmental disasters, may significantly affect a fund's investment performance. The effects of these developments to a fund will be impacted by the types of securities in which a fund invests, the financial condition, industry, economic sector, and geographic location of an issuer, and a fund's level of investment in the securities of that issuer. Significant concentrations in security types, issuers, industries, sectors, and geographic locations may magnify the factors that affect a fund's performance.
As a shareholder, you incur two types of costs: (1) transaction costs, which may include sales charges (loads) on purchase payments or redemption proceeds, as applicable and (2) ongoing costs, which generally include management fees, distribution and/or service (12b-1) fees and other Fund expenses. This Example is intended to help you understand your ongoing costs (in dollars) of investing in a fund and to compare these costs with the ongoing costs of investing in other mutual funds.
| The Example is based on an investment of $1,000 invested at the beginning of the period and held for the entire period (November 1, 2022 to April 30, 2023). |
Actual Expenses
The first line of the accompanying table provides information about actual account values and actual expenses. You may use the information in this line, together with the amount you invested, to estimate the expenses that you paid over the period. Simply divide your account value by $1,000.00 (for example, an $8,600 account value divided by $1,000.00 = 8.6), then multiply the result by the number in the first line for a class/Fund under the heading entitled "Expenses Paid During Period" to estimate the expenses you paid on your account during this period. If any fund is a shareholder of any underlying mutual funds or exchange-traded funds (ETFs) (the Underlying Funds), such fund indirectly bears its proportional share of the expenses of the Underlying Funds in addition to the direct expenses incurred presented in the table. These fees and expenses are not included in the annualized expense ratio used to calculate the expense estimate in the table below.
Hypothetical Example for Comparison Purposes
The second line of the accompanying table provides information about hypothetical account values and hypothetical expenses based on the actual expense ratio and an assumed rate of return of 5% per year before expenses, which is not the actual return. The hypothetical account values and expenses may not be used to estimate the actual ending account balance or expenses you paid for the period. You may use this information to compare the ongoing costs of investing in the Fund and other funds. To do so, compare this 5% hypothetical example with the 5% hypothetical examples that appear in the shareholder reports of the other funds. If any fund is a shareholder of any Underlying Funds, such fund indirectly bears its proportional share of the expenses of the Underlying Funds in addition to the direct expenses as presented in the table. These fees and expenses are not included in the annualized expense ratio used to calculate the expense estimate in the table below.
Please note that the expenses shown in the table are meant to highlight your ongoing costs only and do not reflect any transaction costs. Therefore, the second line of the table is useful in comparing ongoing costs only, and will not help you determine the relative total costs of owning different funds. In addition, if these transactional costs were included, your costs would have been higher.
| | | | | Annualized Expense Ratio- A | | Beginning Account Value November 1, 2022 | | Ending Account Value April 30, 2023 | | Expenses Paid During Period- C November 1, 2022 to April 30, 2023 |
| Fidelity® Global Commodity Stock Fund | | | | | | | | | | |
| Class A | | | | 1.19% | | | | | | |
| Actual | | | | | | $ 1,000 | | $ 964.10 | | $ 5.80 |
Hypothetical- B | | | | | | $ 1,000 | | $ 1,018.89 | | $ 5.96 |
| Class M | | | | 1.45% | | | | | | |
| Actual | | | | | | $ 1,000 | | $ 962.50 | | $ 7.06 |
Hypothetical- B | | | | | | $ 1,000 | | $ 1,017.60 | | $ 7.25 |
| Class C | | | | 1.94% | | | | | | |
| Actual | | | | | | $ 1,000 | | $ 960.00 | | $ 9.43 |
Hypothetical- B | | | | | | $ 1,000 | | $ 1,015.17 | | $ 9.69 |
| Fidelity® Global Commodity Stock Fund | | | | .95% | | | | | | |
| Actual | | | | | | $ 1,000 | | $ 964.70 | | $ 4.63 |
Hypothetical- B | | | | | | $ 1,000 | | $ 1,020.08 | | $ 4.76 |
| Class I | | | | .92% | | | | | | |
| Actual | | | | | | $ 1,000 | | $ 965.20 | | $ 4.48 |
Hypothetical- B | | | | | | $ 1,000 | | $ 1,020.23 | | $ 4.61 |
| Class Z | | | | .79% | | | | | | |
| Actual | | | | | | $ 1,000 | | $ 965.50 | | $ 3.85 |
Hypothetical- B | | | | | | $ 1,000 | | $ 1,020.88 | | $ 3.96 |
| |
A Annualized expense ratio reflects expenses net of applicable fee waivers.
B 5% return per year before expenses
C Expenses are equal to the annualized expense ratio, multiplied by the average account value over the period, multiplied by 181/ 365 (to reflect the one-half year period). The fees and expenses of any Underlying Funds are not included in each annualized expense ratio.
The Securities and Exchange Commission adopted Rule 22e-4 under the Investment Company Act of 1940 (the Liquidity Rule) to promote effective liquidity risk management throughout the open-end investment company industry, thereby reducing the risk that funds will be unable to meet their redemption obligations and mitigating dilution of the interests of fund shareholders.
The Fund has adopted and implemented a liquidity risk management program (the Program) reasonably designed to assess and manage the Fund's liquidity risk and to comply with the requirements of the Liquidity Rule. The Fund's Board of Trustees (the Board) has designated the Fund's investment adviser as administrator of the Program. The Fidelity advisers have established a Liquidity Risk Management Committee (the LRM Committee) to manage the Program for each of the Fidelity Funds. The LRM Committee monitors the adequacy and effectiveness of implementation of the Program and on a periodic basis assesses each Fund's liquidity risk based on a variety of factors including (1) the Fund's investment strategy, (2) portfolio liquidity and cash flow projections during normal and reasonably foreseeable stressed conditions, (3) shareholder redemptions, (4) borrowings and other funding sources and (5) certain factors specific to ETFs including the effect of the Fund's prices and spreads, market participants, and basket compositions on the overall liquidity of the Fund's portfolio, as applicable.
In accordance with the Program, each of the Fund's portfolio investments is classified into one of four defined liquidity categories based on a determination of a reasonable expectation for how long it would take to convert the investment to cash (or sell or dispose of the investment) without significantly changing its market value.
- Highly liquid investments - cash or convertible to cash within three business days or less
- Moderately liquid investments - convertible to cash in three to seven calendar days
- Less liquid investments - can be sold or disposed of, but not settled, within seven calendar days
- Illiquid investments - cannot be sold or disposed of within seven calendar days
Liquidity classification determinations take into account a variety of factors including various market, trading and investment-specific considerations, as well as market depth, and generally utilize analysis from a third-party liquidity metrics service.
The Liquidity Rule places a 15% limit on a fund's illiquid investments and requires funds that do not primarily hold assets that are highly liquid investments to determine and maintain a minimum percentage of the fund's net assets to be invested in highly liquid investments (highly liquid investment minimum or HLIM). The Program includes provisions reasonably designed to comply with the 15% limit on illiquid investments and for determining, periodically reviewing and complying with the HLIM requirement as applicable.
At a recent meeting of the Fund's Board of Trustees, the LRM Committee provided a written report to the Board pertaining to the operation, adequacy, and effectiveness of the Program for the period December 1, 2021 through November 30, 2022. The report concluded that the Program is operating effectively and is reasonably designed to assess and manage the Fund's liquidity risk.
1.879383.114
GCS-SANN-0623
Fidelity® Total International Equity Fund
Semi-Annual Report
April 30, 2023
Includes Fidelity and Fidelity Advisor share classes
Contents
To view a fund's proxy voting guidelines and proxy voting record for the 12-month period ended June 30, visit http://www.fidelity.com/proxyvotingresults or visit the Securities and Exchange Commission's (SEC) web site at http://www.sec.gov.
You may also call 1-800-544-8544 if you're an individual investing directly with Fidelity, call 1-800-835-5092 if you're a plan sponsor or participant with Fidelity as your recordkeeper or call 1-877-208-0098 on institutional accounts or if you're an advisor or invest through one to request a free copy of the proxy voting guidelines.
Standard & Poor's, S&P and S&P 500 are registered service marks of The McGraw-Hill Companies, Inc. and have been licensed for use by Fidelity Distributors Corporation.
Other third-party marks appearing herein are the property of their respective owners.
All other marks appearing herein are registered or unregistered trademarks or service marks of FMR LLC or an affiliated company. © 2023 FMR LLC. All rights reserved.
This report and the financial statements contained herein are submitted for the general information of the shareholders of the Fund. This report is not authorized for distribution to prospective investors in the Fund unless preceded or accompanied by an effective prospectus.
A fund files its complete schedule of portfolio holdings with the SEC for the first and third quarters of each fiscal year on Form N-PORT. Forms N-PORT are available on the SEC's web site at http://www.sec.gov. A fund's Forms N-PORT may be reviewed and copied at the SEC's Public Reference Room in Washington, DC. Information regarding the operation of the SEC's Public Reference Room may be obtained by calling 1-800-SEC-0330.
For a complete list of a fund's portfolio holdings, view the most recent holdings listing, semiannual report, or annual report on Fidelity's web site at http://www.fidelity.com, http://www.institutional.fidelity.com, or http://www.401k.com, as applicable.
NOT FDIC INSURED •MAY LOSE VALUE •NO BANK GUARANTEE
Neither the Fund nor Fidelity Distributors Corporation is a bank.
Top Holdings (% of Fund's net assets) |
| |
| Taiwan Semiconductor Manufacturing Co. Ltd. (Taiwan, Semiconductors & Semiconductor Equipment) | 2.7 | |
| Tencent Holdings Ltd. (China, Interactive Media & Services) | 2.4 | |
| Samsung Electronics Co. Ltd. (Korea (South), Technology Hardware, Storage & Peripherals) | 2.4 | |
| LVMH Moet Hennessy Louis Vuitton SE (France, Textiles, Apparel & Luxury Goods) | 1.9 | |
| ASML Holding NV (Netherlands) (Netherlands, Semiconductors & Semiconductor Equipment) | 1.7 | |
| Canadian Pacific Kansas City Ltd. (Canada, Ground Transportation) | 1.6 | |
| Linde PLC (United States of America, Chemicals) | 1.5 | |
| Nestle SA (Reg. S) (United States of America, Food Products) | 1.5 | |
| Housing Development Finance Corp. Ltd. (India, Financial Services) | 1.3 | |
| China Life Insurance Co. Ltd. (H Shares) (China, Insurance) | 1.3 | |
| | 18.3 | |
| |
| Market Sectors (% of Fund's net assets) |
| |
| Financials | 22.6 | |
| Industrials | 19.3 | |
| Information Technology | 13.0 | |
| Consumer Discretionary | 11.7 | |
| Materials | 10.2 | |
| Health Care | 5.9 | |
| Energy | 5.7 | |
| Communication Services | 4.2 | |
| Consumer Staples | 2.5 | |
| Utilities | 0.5 | |
| Real Estate | 0.4 | |
| |
Asset Allocation (% of Fund's net assets) |
|
|
Geographic Diversification (% of Fund's net assets) |
|
* Includes Short-Term investments and Net Other Assets (Liabilities). Percentages are adjusted for the effect of derivatives, if applicable. |
| |
Showing Percentage of Net Assets
| Common Stocks - 95.0% |
| | | Shares | Value ($) |
| Australia - 2.7% | | | |
| BHP Group Ltd. | | 90,530 | 2,686,704 |
| Flutter Entertainment PLC (a) | | 1,126 | 225,213 |
| Glencore PLC | | 235,491 | 1,390,017 |
| Imdex Ltd. | | 43,461 | 60,056 |
| Macquarie Group Ltd. | | 7,862 | 959,100 |
| National Australia Bank Ltd. | | 19,539 | 376,148 |
| Steadfast Group Ltd. | | 17,941 | 70,731 |
| Woodside Energy Group Ltd. | | 29,331 | 665,530 |
TOTAL AUSTRALIA | | | 6,433,499 |
| Belgium - 0.6% | | | |
| Azelis Group NV | | 14,444 | 342,191 |
| KBC Ancora | | 2,719 | 130,808 |
| KBC Group NV | | 10,243 | 731,156 |
| UCB SA | | 3,542 | 329,485 |
TOTAL BELGIUM | | | 1,533,640 |
| Brazil - 0.4% | | | |
| Localiza Rent a Car SA | | 72,403 | 842,074 |
| Localiza Rent a Car SA rights 5/11/23 (a) | | 323 | 1,111 |
TOTAL BRAZIL | | | 843,185 |
| Canada - 7.2% | | | |
| Barrick Gold Corp. | | 79,265 | 1,509,206 |
| CAE, Inc. (a) | | 57,079 | 1,284,525 |
| Cameco Corp. | | 30,670 | 843,235 |
| Canadian Natural Resources Ltd. | | 15,965 | 972,853 |
| Canadian Pacific Kansas City Ltd. | | 47,229 | 3,722,964 |
| Constellation Software, Inc. | | 921 | 1,802,654 |
| Franco-Nevada Corp. | | 8,761 | 1,329,362 |
| McCoy Global, Inc. (a) | | 7,000 | 7,957 |
| Nutrien Ltd. | | 22,314 | 1,547,989 |
| Osisko Gold Royalties Ltd. | | 3,688 | 59,940 |
| Pason Systems, Inc. | | 5,003 | 43,573 |
| Richelieu Hardware Ltd. | | 22,967 | 690,612 |
| Suncor Energy, Inc. | | 41,159 | 1,288,678 |
| The Toronto-Dominion Bank (b) | | 35,467 | 2,148,413 |
TOTAL CANADA | | | 17,251,961 |
| Chile - 0.4% | | | |
| Antofagasta PLC | | 51,476 | 944,833 |
| China - 9.8% | | | |
| Alibaba Group Holding Ltd. (a) | | 185,082 | 1,956,988 |
| BeiGene Ltd. ADR (a) | | 3,253 | 829,385 |
| China Life Insurance Co. Ltd. (H Shares) | | 1,600,125 | 3,074,089 |
| Chlitina Holding Ltd. | | 9,200 | 65,620 |
| Guangzhou Automobile Group Co. Ltd. (H Shares) | | 923,356 | 576,282 |
| Haier Smart Home Co. Ltd. (A Shares) | | 595,300 | 2,046,875 |
| Hansoh Pharmaceutical Group Co. Ltd. (c) | | 517,285 | 943,685 |
| Industrial & Commercial Bank of China Ltd. (H Shares) | | 2,267,664 | 1,220,013 |
| JD.com, Inc. Class A | | 58,953 | 1,052,184 |
| Li Ning Co. Ltd. | | 75,182 | 537,673 |
| Meituan Class B (a)(c) | | 113,512 | 1,939,972 |
| Shangri-La Asia Ltd. (a) | | 807,298 | 744,745 |
| Shenzhen Inovance Technology Co. Ltd. (A Shares) | | 140,100 | 1,254,863 |
| Sunny Optical Technology Group Co. Ltd. | | 83,074 | 877,869 |
| Tencent Holdings Ltd. | | 128,221 | 5,695,079 |
| Tsingtao Brewery Co. Ltd. (H Shares) | | 64,767 | 693,372 |
TOTAL CHINA | | | 23,508,694 |
| Denmark - 1.4% | | | |
| DSV A/S | | 2,603 | 488,892 |
| Novo Nordisk A/S Series B | | 13,289 | 2,210,685 |
| Spar Nord Bank A/S | | 3,579 | 58,041 |
| Vestas Wind Systems A/S | | 20,041 | 554,546 |
TOTAL DENMARK | | | 3,312,164 |
| Egypt - 0.0% | | | |
| Integrated Diagnostics Holdings PLC (c) | | 60,949 | 27,488 |
| Finland - 0.6% | | | |
| Kone OYJ (B Shares) | | 7,297 | 415,697 |
| Musti Group OYJ | | 3,187 | 65,986 |
| Sampo Oyj (A Shares) | | 16,951 | 858,455 |
TOTAL FINLAND | | | 1,340,138 |
| France - 8.7% | | | |
| Adevinta ASA Class B (a) | | 22,150 | 170,432 |
| Air Liquide SA | | 5,362 | 964,571 |
| Airbus Group NV (b) | | 15,781 | 2,209,886 |
| ALTEN | | 2,502 | 424,571 |
| AXA SA | | 44,456 | 1,451,051 |
| BNP Paribas SA | | 19,679 | 1,271,527 |
| Capgemini SA | | 3,047 | 553,650 |
| Edenred SA | | 15,716 | 1,020,345 |
| Euroapi SASU | | 459 | 5,510 |
| Laurent-Perrier Group SA | | 469 | 63,565 |
| Lectra | | 8,553 | 278,024 |
| Legrand SA | | 12,547 | 1,184,849 |
| LISI | | 3,559 | 100,787 |
| LVMH Moet Hennessy Louis Vuitton SE | | 4,706 | 4,526,614 |
| Safran SA | | 13,496 | 2,098,895 |
| Teleperformance | | 1,400 | 278,913 |
| TotalEnergies SE (b) | | 41,675 | 2,663,030 |
| Vetoquinol SA | | 1,238 | 121,273 |
| VINCI SA (b) | | 5,797 | 716,702 |
| Vivendi SA (b) | | 49,329 | 541,056 |
TOTAL FRANCE | | | 20,645,251 |
| Germany - 4.2% | | | |
| Bayer AG | | 13,509 | 891,544 |
| Covestro AG (c) | | 9,215 | 404,266 |
| CTS Eventim AG | | 5,036 | 330,730 |
| Deutsche Borse AG | | 6,046 | 1,153,024 |
| Deutsche Post AG | | 16,255 | 781,859 |
| Hannover Reuck SE | | 4,336 | 924,990 |
| Muenchener Rueckversicherungs-Gesellschaft AG in Muenchen | | 2,396 | 898,972 |
| Nexus AG | | 1,420 | 81,364 |
| Rheinmetall AG | | 4,226 | 1,236,335 |
| RWE AG | | 20,805 | 975,460 |
| Scout24 AG (c) | | 1,401 | 87,223 |
| Siemens AG | | 10,970 | 1,808,210 |
| Stabilus Se | | 1,031 | 67,255 |
| Vonovia SE | | 20,751 | 450,058 |
TOTAL GERMANY | | | 10,091,290 |
| Greece - 0.7% | | | |
| National Bank of Greece SA (a) | | 300,374 | 1,568,855 |
| Hong Kong - 1.7% | | | |
| AIA Group Ltd. | | 230,018 | 2,504,223 |
| Pacific Basin Shipping Ltd. | | 1,658,000 | 576,912 |
| Prudential PLC | | 60,966 | 932,843 |
TOTAL HONG KONG | | | 4,013,978 |
| Hungary - 0.5% | | | |
| Richter Gedeon PLC | | 53,390 | 1,288,419 |
| India - 4.0% | | | |
| Axis Bank Ltd. | | 113,658 | 1,201,030 |
| Bharat Heavy Electricals Ltd. | | 786,593 | 757,692 |
| Embassy Office Parks (REIT) | | 13,300 | 53,675 |
| Housing Development Finance Corp. Ltd. | | 90,554 | 3,088,598 |
| Indian Energy Exchange Ltd. (a)(c) | | 29,319 | 56,380 |
| Kotak Mahindra Bank Ltd. | | 13,798 | 328,740 |
| Larsen & Toubro Ltd. | | 46,599 | 1,352,446 |
| Reliance Industries Ltd. | | 2,800 | 83,240 |
| Reliance Industries Ltd. GDR (c) | | 12,081 | 720,028 |
| Shree Cement Ltd. | | 2,976 | 888,271 |
| Solar Industries India Ltd. | | 22,724 | 1,065,760 |
TOTAL INDIA | | | 9,595,860 |
| Indonesia - 0.4% | | | |
| PT Bank Rakyat Indonesia (Persero) Tbk | | 1,256,307 | 437,797 |
| PT United Tractors Tbk | | 255,716 | 504,803 |
TOTAL INDONESIA | | | 942,600 |
| Ireland - 1.5% | | | |
| AerCap Holdings NV (a) | | 1,652 | 93,107 |
| Bank of Ireland Group PLC | | 62,371 | 643,968 |
| Cairn Homes PLC | | 48,104 | 54,772 |
| CRH PLC | | 20,373 | 983,078 |
| CRH PLC sponsored ADR | | 27,486 | 1,333,071 |
| Irish Residential Properties REIT PLC | | 34,729 | 39,492 |
| Ryanair Holdings PLC sponsored ADR (a) | | 5,613 | 536,547 |
TOTAL IRELAND | | | 3,684,035 |
| Israel - 0.4% | | | |
| Ituran Location & Control Ltd. | | 3,915 | 81,432 |
| Maytronics Ltd. | | 2,524 | 26,364 |
| NICE Ltd. sponsored ADR (a) | | 4,486 | 915,189 |
| Tel Aviv Stock Exchange Ltd. | | 7,900 | 36,373 |
TOTAL ISRAEL | | | 1,059,358 |
| Italy - 1.3% | | | |
| Enel SpA | | 20,300 | 138,692 |
| Eni SpA | | 66,346 | 1,002,316 |
| Interpump Group SpA | | 14,603 | 812,276 |
| Mediobanca SpA | | 57,318 | 614,534 |
| Prada SpA | | 80,900 | 595,641 |
TOTAL ITALY | | | 3,163,459 |
| Japan - 11.7% | | | |
| Ai Holdings Corp. | | 1,450 | 25,385 |
| Aoki Super Co. Ltd. | | 1,900 | 33,696 |
| Artnature, Inc. | | 5,300 | 30,485 |
| Aucnet, Inc. | | 3,400 | 39,770 |
| Azbil Corp. | | 38,665 | 1,081,335 |
| Broadleaf Co. Ltd. | | 27,600 | 87,068 |
| Central Automotive Products Ltd. | | 1,100 | 23,387 |
| Curves Holdings Co. Ltd. | | 22,300 | 130,012 |
| Daiichi Sankyo Kabushiki Kaisha | | 2,077 | 71,271 |
| Daiichikosho Co. Ltd. | | 8,200 | 147,011 |
| Daikokutenbussan Co. Ltd. | | 700 | 28,025 |
| DENSO Corp. | | 14,642 | 883,844 |
| Digital Hearts Holdings Co. Ltd. | | 3,600 | 39,003 |
| FANUC Corp. | | 14,500 | 489,683 |
| Fast Retailing Co. Ltd. | | 2,573 | 609,291 |
| FUJIFILM Holdings Corp. | | 10,094 | 526,099 |
| Fujitec Co. Ltd. | | 2,200 | 58,606 |
| Fujitsu Ltd. | | 3,866 | 515,250 |
| Funai Soken Holdings, Inc. | | 3,250 | 62,301 |
| Goldcrest Co. Ltd. | | 6,560 | 87,935 |
| Hitachi Ltd. | | 28,263 | 1,563,358 |
| Hoya Corp. | | 13,429 | 1,408,098 |
| Ibiden Co. Ltd. | | 6,912 | 271,961 |
| INPEX Corp. | | 32,213 | 352,509 |
| Itochu Corp. | | 28,948 | 960,346 |
| Keyence Corp. | | 4,984 | 2,247,566 |
| Kobayashi Pharmaceutical Co. Ltd. | | 1,600 | 99,843 |
| Koshidaka Holdings Co. Ltd. | | 16,300 | 137,995 |
| Kusuri No Aoki Holdings Co. Ltd. | | 1,000 | 47,984 |
| Lasertec Corp. | | 4,950 | 673,428 |
| Medikit Co. Ltd. | | 3,300 | 57,272 |
| Minebea Mitsumi, Inc. | | 25,202 | 466,707 |
| Miroku Jyoho Service Co., Ltd. | | 2,400 | 29,978 |
| Misumi Group, Inc. | | 38,724 | 976,898 |
| Mitsubishi Estate Co. Ltd. | | 28,594 | 352,401 |
| Mitsubishi UFJ Financial Group, Inc. | | 190,172 | 1,190,388 |
| Mitsuboshi Belting Ltd. | | 1,200 | 34,380 |
| Nagaileben Co. Ltd. | | 7,400 | 115,112 |
| Nihon Parkerizing Co. Ltd. | | 18,500 | 144,803 |
| NOF Corp. | | 1,890 | 86,357 |
| NS Tool Co. Ltd. | | 6,600 | 55,023 |
| NSD Co. Ltd. | | 4,800 | 88,303 |
| OBIC Co. Ltd. | | 1,450 | 223,409 |
| ORIX Corp. | | 44,841 | 762,859 |
| OSG Corp. | | 20,480 | 287,697 |
| Paramount Bed Holdings Co. Ltd. | | 2,400 | 42,559 |
| ProNexus, Inc. | | 5,100 | 37,464 |
| Recruit Holdings Co. Ltd. | | 40,100 | 1,124,950 |
| Renesas Electronics Corp. (a) | | 48,220 | 628,425 |
| San-Ai Obbli Co. Ltd. | | 6,300 | 66,377 |
| Shin-Etsu Chemical Co. Ltd. | | 34,990 | 998,468 |
| SHO-BOND Holdings Co. Ltd. | | 16,680 | 712,836 |
| Shoei Co. Ltd. | | 6,800 | 126,147 |
| SK Kaken Co. Ltd. | | 420 | 133,550 |
| SoftBank Group Corp. | | 10,864 | 407,426 |
| Software Service, Inc. | | 800 | 51,267 |
| Sony Group Corp. | | 6,174 | 558,585 |
| Sumitomo Mitsui Financial Group, Inc. | | 25,934 | 1,060,017 |
| Suzuki Motor Corp. | | 18,396 | 641,441 |
| Techno Medica Co. Ltd. | | 500 | 6,595 |
| The Monogatari Corp. | | 3,160 | 66,422 |
| TIS, Inc. | | 13,774 | 378,230 |
| Tocalo Co. Ltd. | | 4,800 | 45,078 |
| Tokio Marine Holdings, Inc. | | 44,339 | 891,526 |
| Toyota Motor Corp. | | 132,923 | 1,825,038 |
| USS Co. Ltd. | | 27,100 | 455,388 |
| YAKUODO Holdings Co. Ltd. | | 2,600 | 47,526 |
TOTAL JAPAN | | | 27,909,447 |
| Kenya - 0.1% | | | |
| Safaricom Ltd. | | 1,488,945 | 180,644 |
| Korea (South) - 4.2% | | | |
| BGF Retail Co. Ltd. | | 491 | 68,528 |
| Hyundai Mipo Dockyard Co. Ltd. (a) | | 10,552 | 581,071 |
| Hyundai Motor Co. Ltd. | | 7,995 | 1,184,763 |
| Korea Aerospace Industries Ltd. | | 35,636 | 1,464,360 |
| POSCO | | 3,283 | 929,472 |
| Samsung Electronics Co. Ltd. | | 115,662 | 5,693,299 |
TOTAL KOREA (SOUTH) | | | 9,921,493 |
| Luxembourg - 0.2% | | | |
| ArcelorMittal SA (Netherlands) | | 17,958 | 508,747 |
| Mexico - 0.5% | | | |
| Grupo Financiero Banorte S.A.B. de CV Series O | | 62,027 | 536,386 |
| Wal-Mart de Mexico SA de CV Series V | | 184,772 | 744,966 |
TOTAL MEXICO | | | 1,281,352 |
| Netherlands - 3.5% | | | |
| Aalberts Industries NV | | 12,075 | 555,901 |
| ASML Holding NV (Netherlands) | | 6,400 | 4,044,414 |
| BE Semiconductor Industries NV | | 1,134 | 101,639 |
| IMCD NV | | 3,740 | 561,295 |
| Shell PLC ADR | | 47,948 | 2,971,817 |
| Universal Music Group NV | | 10,273 | 224,246 |
TOTAL NETHERLANDS | | | 8,459,312 |
| Norway - 0.2% | | | |
| Kongsberg Gruppen ASA | | 4,725 | 211,841 |
| Medistim ASA | | 1,929 | 47,605 |
| Schibsted ASA (B Shares) | | 12,781 | 206,999 |
| Volue A/S (a) | | 10,613 | 17,926 |
TOTAL NORWAY | | | 484,371 |
| Peru - 0.4% | | | |
| Credicorp Ltd. (United States) | | 7,815 | 1,058,776 |
| Russia - 0.1% | | | |
| LUKOIL PJSC sponsored ADR (a)(d) | | 15,040 | 4,255 |
| Sberbank of Russia sponsored ADR (a)(d) | | 62,556 | 1,114 |
| Yandex NV Series A (a)(d) | | 15,421 | 117,200 |
TOTAL RUSSIA | | | 122,569 |
| Singapore - 0.4% | | | |
| United Overseas Bank Ltd. | | 43,682 | 927,717 |
| South Africa - 1.7% | | | |
| Absa Group Ltd. | | 100,354 | 974,546 |
| Anglo American PLC (United Kingdom) | | 25,108 | 773,682 |
| Clicks Group Ltd. | | 13,000 | 189,992 |
| Impala Platinum Holdings Ltd. | | 104,324 | 1,015,678 |
| MTN Group Ltd. | | 137,013 | 961,132 |
| Thungela Resources Ltd. (b) | | 4,647 | 43,158 |
TOTAL SOUTH AFRICA | | | 3,958,188 |
| Spain - 1.4% | | | |
| Amadeus IT Holding SA Class A (a) | | 23,421 | 1,646,146 |
| Banco Santander SA (Spain) (b) | | 366,673 | 1,287,464 |
| Cellnex Telecom SA (c) | | 7,098 | 298,854 |
| Fluidra SA | | 2,001 | 34,242 |
| Unicaja Banco SA (c) | | 147,836 | 149,787 |
TOTAL SPAIN | | | 3,416,493 |
| Sweden - 3.4% | | | |
| Addlife AB | | 7,452 | 88,072 |
| AddTech AB (B Shares) | | 25,409 | 507,930 |
| Alleima AB | | 2,191 | 11,234 |
| ASSA ABLOY AB (B Shares) | | 44,792 | 1,065,306 |
| Atlas Copco AB (A Shares) | | 144,742 | 2,090,316 |
| Autoliv, Inc. | | 8,407 | 721,405 |
| Bergman & Beving AB (B Shares) | | 5,000 | 70,209 |
| Epiroc AB (A Shares) | | 53,359 | 1,068,945 |
| Hemnet Group AB | | 6,282 | 102,913 |
| Investor AB (B Shares) | | 51,133 | 1,095,951 |
| INVISIO AB | | 3,973 | 81,552 |
| John Mattson Fastighetsforetag (a) | | 3,623 | 25,013 |
| Lagercrantz Group AB (B Shares) | | 53,594 | 688,801 |
| Sandvik AB (b) | | 20,613 | 419,092 |
| Teqnion AB | | 2,800 | 48,764 |
TOTAL SWEDEN | | | 8,085,503 |
| Switzerland - 1.8% | | | |
| Schindler Holding AG: | | | |
| (participation certificate) | | 1,789 | 397,689 |
| (Reg.) | | 107 | 22,732 |
| Swiss Life Holding AG | | 879 | 577,051 |
| Tecan Group AG | | 416 | 180,483 |
| UBS Group AG | | 14,000 | 282,945 |
| UBS Group AG | | 72,902 | 1,476,266 |
| Zurich Insurance Group Ltd. | | 2,665 | 1,287,405 |
TOTAL SWITZERLAND | | | 4,224,571 |
| Taiwan - 3.9% | | | |
| Addcn Technology Co. Ltd. | | 9,413 | 62,229 |
| ECLAT Textile Co. Ltd. | | 65,854 | 1,047,994 |
| HIWIN Technologies Corp. | | 117,415 | 901,257 |
| Taiwan Semiconductor Manufacturing Co. Ltd. | | 391,708 | 6,409,967 |
| Yageo Corp. | | 48,420 | 784,386 |
TOTAL TAIWAN | | | 9,205,833 |
| Thailand - 0.4% | | | |
| Kasikornbank PCL (For. Reg.) | | 239,571 | 879,684 |
| United Kingdom - 5.0% | | | |
| AstraZeneca PLC (United Kingdom) | | 4,532 | 666,943 |
| BAE Systems PLC | | 173,655 | 2,212,362 |
| Barratt Developments PLC | | 84,381 | 530,229 |
| Beazley PLC | | 50,461 | 377,647 |
| Bodycote PLC | | 20,381 | 176,863 |
| BP PLC | | 94,472 | 633,812 |
| Clarkson PLC | | 2,103 | 81,931 |
| Compass Group PLC | | 55,816 | 1,472,480 |
| Dechra Pharmaceuticals PLC | | 5,657 | 265,182 |
| Howden Joinery Group PLC | | 16,094 | 138,468 |
| Imperial Brands PLC | | 17,530 | 433,939 |
| InterContinental Hotel Group PLC ADR | | 10,855 | 752,034 |
| Lloyds Banking Group PLC | | 1,207,298 | 733,460 |
| NatWest Group PLC | | 135,554 | 446,528 |
| Rightmove PLC | | 66,834 | 482,291 |
| Rolls-Royce Holdings PLC (a) | | 58,080 | 111,262 |
| Spectris PLC | | 26,148 | 1,235,264 |
| Spirax-Sarco Engineering PLC | | 1,585 | 220,907 |
| Standard Chartered PLC (United Kingdom) | | 130,192 | 1,028,181 |
TOTAL UNITED KINGDOM | | | 11,999,783 |
| United States of America - 9.6% | | | |
| Experian PLC | | 31,336 | 1,109,447 |
| Ferguson PLC | | 3,065 | 431,225 |
| Lam Research Corp. | | 775 | 406,162 |
| Linde PLC | | 9,932 | 3,669,377 |
| Marsh & McLennan Companies, Inc. | | 10,930 | 1,969,477 |
| MasterCard, Inc. Class A | | 3,300 | 1,254,099 |
| Moody's Corp. | | 3,174 | 993,843 |
| Morningstar, Inc. | | 958 | 170,821 |
| MSCI, Inc. | | 2,494 | 1,203,230 |
| Nestle SA (Reg. S) | | 27,412 | 3,516,674 |
| NOV, Inc. | | 20,142 | 337,379 |
| Otis Worldwide Corp. | | 4,874 | 415,752 |
| PriceSmart, Inc. | | 3,222 | 237,397 |
| ResMed, Inc. | | 7,217 | 1,739,008 |
| Roche Holding AG (participation certificate) | | 4,190 | 1,312,057 |
| S&P Global, Inc. | | 2,607 | 945,246 |
| Sanofi SA | | 14,650 | 1,578,805 |
| Sherwin-Williams Co. | | 3,350 | 795,759 |
| Visa, Inc. Class A | | 3,617 | 841,784 |
TOTAL UNITED STATES OF AMERICA | | | 22,927,542 |
| TOTAL COMMON STOCKS (Cost $200,010,165) | | | 226,800,732 |
| | | | |
| Preferred Stocks - 1.0% |
| | | Shares | Value ($) |
| Convertible Preferred Stocks - 0.0% | | | |
| China - 0.0% | | | |
| ByteDance Ltd. Series E1 (a)(d)(e) | | 577 | 114,823 |
| Nonconvertible Preferred Stocks - 1.0% | | | |
| Brazil - 0.7% | | | |
| Itau Unibanco Holding SA | | 218,862 | 1,137,356 |
| Petroleo Brasileiro SA - Petrobras sponsored ADR | | 55,737 | 591,927 |
| | | | 1,729,283 |
| Germany - 0.3% | | | |
| Porsche Automobil Holding SE (Germany) | | 10,574 | 588,942 |
TOTAL NONCONVERTIBLE PREFERRED STOCKS | | | 2,318,225 |
| TOTAL PREFERRED STOCKS (Cost $2,297,963) | | | 2,433,048 |
| | | | |
| Money Market Funds - 5.3% |
| | | Shares | Value ($) |
| Fidelity Cash Central Fund 4.88% (f) | | 7,682,024 | 7,683,560 |
| Fidelity Securities Lending Cash Central Fund 4.88% (f)(g) | | 4,901,528 | 4,902,018 |
| TOTAL MONEY MARKET FUNDS (Cost $12,585,575) | | | 12,585,578 |
| | | | |
| TOTAL INVESTMENT IN SECURITIES - 101.3% (Cost $214,893,703) | 241,819,358 |
NET OTHER ASSETS (LIABILITIES) - (1.3)% | (3,118,533) |
| NET ASSETS - 100.0% | 238,700,825 |
| | |
Legend
| (b) | Security or a portion of the security is on loan at period end. |
| (c) | Security exempt from registration under Rule 144A of the Securities Act of 1933. These securities may be resold in transactions exempt from registration, normally to qualified institutional buyers. At the end of the period, the value of these securities amounted to $4,627,683 or 1.9% of net assets. |
| (e) | Restricted securities (including private placements) - Investment in securities not registered under the Securities Act of 1933 (excluding 144A issues). At the end of the period, the value of restricted securities (excluding 144A issues) amounted to $114,823 or 0.0% of net assets. |
| (f) | Affiliated fund that is generally available only to investment companies and other accounts managed by Fidelity Investments. The rate quoted is the annualized seven-day yield of the fund at period end. A complete unaudited listing of the fund's holdings as of its most recent quarter end is available upon request. In addition, each Fidelity Central Fund's financial statements are available on the SEC's website or upon request. |
| (g) | Investment made with cash collateral received from securities on loan. |
| Additional information on each restricted holding is as follows: |
| Security | Acquisition Date | Acquisition Cost ($) |
| ByteDance Ltd. Series E1 | 11/18/20 | 63,224 |
| | | |
Affiliated Central Funds
Fiscal year to date information regarding the Fund's investments in Fidelity Central Funds, including the ownership percentage, is presented below.
| Affiliate | Value, beginning of period ($) | Purchases ($) | Sales Proceeds ($) | Dividend Income ($) | Realized Gain (loss) ($) | Change in Unrealized appreciation (depreciation) ($) | Value, end of period ($) | % ownership, end of period |
| Fidelity Cash Central Fund 4.88% | 5,394,098 | 88,151,680 | 85,862,217 | 154,857 | - | (1) | 7,683,560 | 0.0% |
| Fidelity Securities Lending Cash Central Fund 4.88% | 2,836,886 | 21,149,844 | 19,084,712 | 8,427 | - | - | 4,902,018 | 0.0% |
| Total | 8,230,984 | 109,301,524 | 104,946,929 | 163,284 | - | (1) | 12,585,578 | |
| | | | | | | | | |
Amounts in the dividend income column in the above table include any capital gain distributions from underlying funds, which are presented in the corresponding line item in the Statement of Operations, if applicable.
Amounts in the dividend income column for Fidelity Securities Lending Cash Central Fund represents the income earned on investing cash collateral, less rebates paid to borrowers and any lending agent fees associated with the loan, plus any premium payments received for lending certain types of securities.
Amounts included in the purchases and sales proceeds columns may include in-kind transactions, if applicable.
Investment Valuation
The following is a summary of the inputs used, as of April 30, 2023, involving the Fund's assets and liabilities carried at fair value. The inputs or methodology used for valuing securities may not be an indication of the risk associated with investing in those securities. For more information on valuation inputs, and their aggregation into the levels used below, please refer to the Investment Valuation section in the accompanying Notes to Financial Statements.
| Valuation Inputs at Reporting Date: |
| Description | Total ($) | Level 1 ($) | Level 2 ($) | Level 3 ($) |
Investments in Securities: | | | | |
|
| Equities: | | | | |
Communication Services | 10,130,288 | 3,287,666 | 6,610,599 | 232,023 |
Consumer Discretionary | 27,790,622 | 2,376,003 | 25,414,619 | - |
Consumer Staples | 6,301,612 | 1,235,920 | 5,065,692 | - |
Energy | 13,796,477 | 7,820,605 | 5,971,617 | 4,255 |
Financials | 53,301,758 | 28,283,171 | 25,017,473 | 1,114 |
Health Care | 14,359,167 | 5,003,274 | 9,355,893 | - |
Industrials | 46,066,192 | 20,346,852 | 25,719,340 | - |
Information Technology | 31,130,687 | 10,549,726 | 20,580,961 | - |
Materials | 24,234,251 | 11,709,518 | 12,524,733 | - |
Real Estate | 1,008,574 | 64,505 | 944,069 | - |
Utilities | 1,114,152 | 975,460 | 138,692 | - |
|
| Money Market Funds | 12,585,578 | 12,585,578 | - | - |
| Total Investments in Securities: | 241,819,358 | 104,238,278 | 137,343,688 | 237,392 |
| Statement of Assets and Liabilities |
| | | | April 30, 2023 (Unaudited) |
| | | | | |
| Assets | | | | |
| Investment in securities, at value (including securities loaned of $4,513,569) - See accompanying schedule: | | | | |
Unaffiliated issuers (cost $202,308,128) | $ | 229,233,780 | | |
Fidelity Central Funds (cost $12,585,575) | | 12,585,578 | | |
| | | | | |
| | | | | |
| Total Investment in Securities (cost $214,893,703) | | | $ | 241,819,358 |
| Cash | | | | 44,200 |
| Foreign currency held at value (cost $66,679) | | | | 68,856 |
| Receivable for investments sold | | | | 212,288 |
| Receivable for fund shares sold | | | | 1,409,064 |
| Dividends receivable | | | | 927,353 |
| Reclaims receivable | | | | 241,253 |
| Interest receivable | | | | 5 |
| Distributions receivable from Fidelity Central Funds | | | | 25,066 |
| Prepaid expenses | | | | 58 |
| Receivable from investment adviser for expense reductions | | | | 14,979 |
| Other receivables | | | | 19,387 |
Total assets | | | | 244,781,867 |
| Liabilities | | | | |
| Payable for investments purchased | $ | 631,540 | | |
| Payable for fund shares redeemed | | 78,580 | | |
| Accrued management fee | | 147,277 | | |
| Distribution and service plan fees payable | | 10,837 | | |
| Other affiliated payables | | 43,920 | | |
| Other payables and accrued expenses | | 266,870 | | |
| Collateral on securities loaned | | 4,902,018 | | |
| Total Liabilities | | | | 6,081,042 |
| Net Assets | | | $ | 238,700,825 |
| Net Assets consist of: | | | | |
| Paid in capital | | | $ | 218,986,430 |
| Total accumulated earnings (loss) | | | | 19,714,395 |
| Net Assets | | | $ | 238,700,825 |
| | | | | |
| Net Asset Value and Maximum Offering Price | | | | |
| Class A : | | | | |
Net Asset Value and redemption price per share ($20,148,012 ÷ 1,982,767 shares) (a) | | | $ | 10.16 |
| Maximum offering price per share (100/94.25 of $10.16) | | | $ | 10.78 |
| Class M : | | | | |
Net Asset Value and redemption price per share ($11,304,611 ÷ 1,104,345 shares) (a) | | | $ | 10.24 |
| Maximum offering price per share (100/96.50 of $10.24) | | | $ | 10.61 |
| Class C : | | | | |
Net Asset Value and offering price per share ($2,502,632 ÷ 246,091 shares) (a) | | | $ | 10.17 |
| Total International Equity : | | | | |
Net Asset Value , offering price and redemption price per share ($118,823,537 ÷ 11,651,031 shares) | | | $ | 10.20 |
| Class I : | | | | |
Net Asset Value , offering price and redemption price per share ($62,797,965 ÷ 6,183,136 shares) | | | $ | 10.16 |
| Class Z : | | | | |
Net Asset Value , offering price and redemption price per share ($23,124,068 ÷ 2,263,633 shares) | | | $ | 10.22 |
(a)Redemption price per share is equal to net asset value less any applicable contingent deferred sales charge. |
| Statement of Operations |
| | | | Six months ended April 30, 2023 (Unaudited) |
| Investment Income | | | | |
| Dividends | | | $ | 2,520,529 |
| Non-Cash dividends | | | | 290,960 |
| Interest | | | | 110 |
| Income from Fidelity Central Funds (including $8,427 from security lending) | | | | 163,284 |
| Income before foreign taxes withheld | | | $ | 2,974,883 |
| Less foreign taxes withheld | | | | (253,054) |
| Total Income | | | | 2,721,829 |
| Expenses | | | | |
| Management fee | | | | |
| Basic fee | $ | 691,067 | | |
| Performance adjustment | | 100,123 | | |
| Transfer agent fees | | 176,095 | | |
| Distribution and service plan fees | | 61,224 | | |
| Accounting fees | | 50,889 | | |
| Custodian fees and expenses | | 61,504 | | |
| Independent trustees' fees and expenses | | 552 | | |
| Registration fees | | 44,470 | | |
| Audit | | 48,256 | | |
| Legal | | 335 | | |
| Miscellaneous | | 361 | | |
| Total expenses before reductions | | 1,234,876 | | |
| Expense reductions | | (120,320) | | |
| Total expenses after reductions | | | | 1,114,556 |
| Net Investment income (loss) | | | | 1,607,273 |
| Realized and Unrealized Gain (Loss) | | | | |
| Net realized gain (loss) on: | | | | |
| Investment Securities: | | | | |
| Unaffiliated issuers (net of foreign taxes of $30,126) | | (2,446,328) | | |
| Foreign currency transactions | | (11,284) | | |
| Total net realized gain (loss) | | | | (2,457,612) |
| Change in net unrealized appreciation (depreciation) on: | | | | |
| Investment Securities: | | | | |
| Unaffiliated issuers(net of increase in deferred foreign taxes of $47,126) | | 32,970,246 | | |
| Fidelity Central Funds | | (1) | | |
| Assets and liabilities in foreign currencies | | 22,388 | | |
| Total change in net unrealized appreciation (depreciation) | | | | 32,992,633 |
| Net gain (loss) | | | | 30,535,021 |
| Net increase (decrease) in net assets resulting from operations | | | $ | 32,142,294 |
| Statement of Changes in Net Assets |
| |
| | Six months ended April 30, 2023 (Unaudited) | | Year ended October 31, 2022 |
| Increase (Decrease) in Net Assets | | | | |
| Operations | | | | |
| Net investment income (loss) | $ | 1,607,273 | $ | 2,446,814 |
| Net realized gain (loss) | | (2,457,612) | | (5,086,496) |
| Change in net unrealized appreciation (depreciation) | | 32,992,633 | | (39,932,764) |
| Net increase (decrease) in net assets resulting from operations | | 32,142,294 | | (42,572,446) |
| Distributions to shareholders | | (1,806,040) | | (9,629,532) |
| Share transactions - net increase (decrease) | | 54,246,943 | | 88,690,287 |
| Total increase (decrease) in net assets | | 84,583,197 | | 36,488,309 |
| | | | | |
| Net Assets | | | | |
| Beginning of period | | 154,117,628 | | 117,629,319 |
| End of period | $ | 238,700,825 | $ | 154,117,628 |
| | | | | |
| | | | | |
Financial Highlights
| Fidelity Advisor® Total International Equity Fund Class A |
| |
| | Six months ended (Unaudited) April 30, 2023 | | Years ended October 31, 2022 | | 2021 | | 2020 | | 2019 | | 2018 |
Selected Per-Share Data | | | | | | | | | | | | |
| Net asset value, beginning of period | $ | 8.56 | $ | 12.48 | $ | 9.60 | $ | 9.34 | $ | 8.20 | $ | 9.39 |
| Income from Investment Operations | | | | | | | | | | | | |
Net investment income (loss) A,B | | .07 | | .15 | | .11 C | | .05 | | .14 | | .08 |
| Net realized and unrealized gain (loss) | | 1.61 | | (3.10) | | 3.03 | | .35 | | 1.05 | | (.89) |
| Total from investment operations | | 1.68 | | (2.95) | | 3.14 | | .40 | | 1.19 | | (.81) |
| Distributions from net investment income | | (.08) | | (.19) | | (.06) | | (.14) | | (.05) | | (.15) |
| Distributions from net realized gain | | - | | (.77) | | (.20) | | - | | - | | (.23) |
| Total distributions | | (.08) | | (.97) D | | (.26) | | (.14) | | (.05) | | (.38) |
Redemption fees added to paid in capital A | | - | | - | | - | | - | | - | | - E |
| Net asset value, end of period | $ | 10.16 | $ | 8.56 | $ | 12.48 | $ | 9.60 | $ | 9.34 | $ | 8.20 |
Total Return F,G,H | | 19.73% | | (25.44)% | | 33.04% | | 4.31% | | 14.63% | | (9.04)% |
Ratios to Average Net Assets B,I,J | | | | | | | | | | | | |
| Expenses before reductions | | 1.45% K | | 1.56% | | 1.60% | | 1.66% | | 1.51% | | 1.60% |
| Expenses net of fee waivers, if any | | 1.29% K | | 1.30% | | 1.34% | | 1.39% | | 1.45% | | 1.45% |
| Expenses net of all reductions | | 1.29% K | | 1.30% | | 1.34% | | 1.37% | | 1.44% | | 1.44% |
| Net investment income (loss) | | 1.38% K | | 1.55% | | .91% C | | .58% | | 1.55% | | .90% |
| Supplemental Data | | | | | | | | | | | | |
| Net assets, end of period (000 omitted) | $ | 20,148 | $ | 12,786 | $ | 8,642 | $ | 6,091 | $ | 7,249 | $ | 7,526 |
Portfolio turnover rate L | | 26% K | | 31% | | 39% | | 37% | | 69% | | 52% |
A Calculated based on average shares outstanding during the period.
B Net investment income (loss) is affected by the timing of the declaration of dividends by any underlying mutual funds or exchange-traded funds (ETFs). Net investment income (loss) of any mutual funds or ETFs is not included in the Fund's net investment income (loss) ratio.
C Net investment income per share reflects one or more large, non-recurring dividend(s) which amounted to $.03 per share. Excluding such non-recurring dividend(s), the ratio of net investment income (loss) to average net assets would have been .64%.
D Total distributions per share do not sum due to rounding.
E Amount represents less than $.005 per share.
F Total returns for periods of less than one year are not annualized.
G Total returns would have been lower if certain expenses had not been reduced during the applicable periods shown.
H Total returns do not include the effect of the sales charges.
I Fees and expenses of any underlying mutual funds or exchange-traded funds (ETFs) are not included in the Fund's expense ratio. The Fund indirectly bears its proportionate share of these expenses. For additional expense information related to investments in Fidelity Central Funds, please refer to the "Investments in Fidelity Central Funds" note found in the Notes to Financial Statements section of the most recent Annual or Semi-Annual report.
J Expense ratios reflect operating expenses of the class. Expenses before reductions do not reflect amounts reimbursed, waived, or reduced through arrangements with the investment adviser, brokerage services, or other offset arrangements, if applicable, and do not represent the amount paid by the class during periods when reimbursements, waivers or reductions occur.
K Annualized.
L Amount does not include the portfolio activity of any underlying mutual funds or exchange-traded funds (ETFs).
| Fidelity Advisor® Total International Equity Fund Class M |
| |
| | Six months ended (Unaudited) April 30, 2023 | | Years ended October 31, 2022 | | 2021 | | 2020 | | 2019 | | 2018 |
Selected Per-Share Data | | | | | | | | | | | | |
| Net asset value, beginning of period | $ | 8.61 | $ | 12.53 | $ | 9.65 | $ | 9.38 | $ | 8.22 | $ | 9.42 |
| Income from Investment Operations | | | | | | | | | | | | |
Net investment income (loss) A,B | | .06 | | .13 | | .08 C | | .03 | | .11 | | .06 |
| Net realized and unrealized gain (loss) | | 1.62 | | (3.12) | | 3.04 | | .36 | | 1.07 | | (.90) |
| Total from investment operations | | 1.68 | | (2.99) | | 3.12 | | .39 | | 1.18 | | (.84) |
| Distributions from net investment income | | (.05) | | (.15) | | (.04) | | (.12) | | (.02) | | (.13) |
| Distributions from net realized gain | | - | | (.77) | | (.20) | | - | | - | | (.23) |
| Total distributions | | (.05) | | (.93) D | | (.24) | | (.12) | | (.02) | | (.36) |
Redemption fees added to paid in capital A | | - | | - | | - | | - | | - | | - E |
| Net asset value, end of period | $ | 10.24 | $ | 8.61 | $ | 12.53 | $ | 9.65 | $ | 9.38 | $ | 8.22 |
Total Return F,G,H | | 19.59% | | (25.59)% | | 32.63% | | 4.13% | | 14.38% | | (9.30)% |
Ratios to Average Net Assets B,I,J | | | | | | | | | | | | |
| Expenses before reductions | | 1.71% K | | 1.80% | | 1.83% | | 1.90% | | 1.76% | | 1.85% |
| Expenses net of fee waivers, if any | | 1.55% K | | 1.55% | | 1.59% | | 1.64% | | 1.70% | | 1.70% |
| Expenses net of all reductions | | 1.54% K | | 1.55% | | 1.59% | | 1.62% | | 1.69% | | 1.69% |
| Net investment income (loss) | | 1.13% K | | 1.29% | | .65% C | | .33% | | 1.30% | | .65% |
| Supplemental Data | | | | | | | | | | | | |
| Net assets, end of period (000 omitted) | $ | 11,305 | $ | 9,876 | $ | 12,936 | $ | 10,620 | $ | 11,733 | $ | 11,882 |
Portfolio turnover rate L | | 26% K | | 31% | | 39% | | 37% | | 69% | | 52% |
A Calculated based on average shares outstanding during the period.
B Net investment income (loss) is affected by the timing of the declaration of dividends by any underlying mutual funds or exchange-traded funds (ETFs). Net investment income (loss) of any mutual funds or ETFs is not included in the Fund's net investment income (loss) ratio.
C Net investment income per share reflects one or more large, non-recurring dividend(s) which amounted to $.03 per share. Excluding such non-recurring dividend(s), the ratio of net investment income (loss) to average net assets would have been .38%.
D Total distributions per share do not sum due to rounding.
E Amount represents less than $.005 per share.
F Total returns for periods of less than one year are not annualized.
G Total returns would have been lower if certain expenses had not been reduced during the applicable periods shown.
H Total returns do not include the effect of the sales charges.
I Fees and expenses of any underlying mutual funds or exchange-traded funds (ETFs) are not included in the Fund's expense ratio. The Fund indirectly bears its proportionate share of these expenses. For additional expense information related to investments in Fidelity Central Funds, please refer to the "Investments in Fidelity Central Funds" note found in the Notes to Financial Statements section of the most recent Annual or Semi-Annual report.
J Expense ratios reflect operating expenses of the class. Expenses before reductions do not reflect amounts reimbursed, waived, or reduced through arrangements with the investment adviser, brokerage services, or other offset arrangements, if applicable, and do not represent the amount paid by the class during periods when reimbursements, waivers or reductions occur.
K Annualized.
L Amount does not include the portfolio activity of any underlying mutual funds or exchange-traded funds (ETFs).
| Fidelity Advisor® Total International Equity Fund Class C |
| |
| | Six months ended (Unaudited) April 30, 2023 | | Years ended October 31, 2022 | | 2021 | | 2020 | | 2019 | | 2018 |
Selected Per-Share Data | | | | | | | | | | | | |
| Net asset value, beginning of period | $ | 8.53 | $ | 12.41 | $ | 9.57 | $ | 9.30 | $ | 8.17 | $ | 9.37 |
| Income from Investment Operations | | | | | | | | | | | | |
Net investment income (loss) A,B | | .03 | | .08 | | .02 C | | (.02) | | .07 | | .01 |
| Net realized and unrealized gain (loss) | | 1.62 | | (3.11) | | 3.02 | | .36 | | 1.06 | | (.89) |
| Total from investment operations | | 1.65 | | (3.03) | | 3.04 | | .34 | | 1.13 | | (.88) |
| Distributions from net investment income | | (.01) | | (.07) | | - | | (.07) | | - | | (.10) |
| Distributions from net realized gain | | - | | (.77) | | (.20) | | - | | - | | (.23) |
| Total distributions | | (.01) | | (.85) D | | (.20) | | (.07) | | - | | (.32) D |
Redemption fees added to paid in capital A | | - | | - | | - | | - | | - | | - E |
| Net asset value, end of period | $ | 10.17 | $ | 8.53 | $ | 12.41 | $ | 9.57 | $ | 9.30 | $ | 8.17 |
Total Return F,G,H | | 19.33% | | (26.04)% | | 32.00% | | 3.62% | | 13.83% | | (9.72)% |
Ratios to Average Net Assets B,I,J | | | | | | | | | | | | |
| Expenses before reductions | | 2.24% K | | 2.34% | | 2.40% | | 2.46% | | 2.33% | | 2.43% |
| Expenses net of fee waivers, if any | | 2.04% K | | 2.05% | | 2.10% | | 2.14% | | 2.20% | | 2.20% |
| Expenses net of all reductions | | 2.04% K | | 2.05% | | 2.10% | | 2.12% | | 2.19% | | 2.19% |
| Net investment income (loss) | | .62% K | | .79% | | .15% C | | (.17)% | | .80% | | .14% |
| Supplemental Data | | | | | | | | | | | | |
| Net assets, end of period (000 omitted) | $ | 2,503 | $ | 1,893 | $ | 1,982 | $ | 1,827 | $ | 2,203 | $ | 2,705 |
Portfolio turnover rate L | | 26% K | | 31% | | 39% | | 37% | | 69% | | 52% |
A Calculated based on average shares outstanding during the period.
B Net investment income (loss) is affected by the timing of the declaration of dividends by any underlying mutual funds or exchange-traded funds (ETFs). Net investment income (loss) of any mutual funds or ETFs is not included in the Fund's net investment income (loss) ratio.
C Net investment income per share reflects one or more large, non-recurring dividend(s) which amounted to $.03 per share. Excluding such non-recurring dividend(s), the ratio of net investment income (loss) to average net assets would have been (.12)%.
D Total distributions per share do not sum due to rounding.
E Amount represents less than $.005 per share.
F Total returns for periods of less than one year are not annualized.
G Total returns would have been lower if certain expenses had not been reduced during the applicable periods shown.
H Total returns do not include the effect of the contingent deferred sales charge.
I Fees and expenses of any underlying mutual funds or exchange-traded funds (ETFs) are not included in the Fund's expense ratio. The Fund indirectly bears its proportionate share of these expenses. For additional expense information related to investments in Fidelity Central Funds, please refer to the "Investments in Fidelity Central Funds" note found in the Notes to Financial Statements section of the most recent Annual or Semi-Annual report.
J Expense ratios reflect operating expenses of the class. Expenses before reductions do not reflect amounts reimbursed, waived, or reduced through arrangements with the investment adviser, brokerage services, or other offset arrangements, if applicable, and do not represent the amount paid by the class during periods when reimbursements, waivers or reductions occur.
K Annualized.
L Amount does not include the portfolio activity of any underlying mutual funds or exchange-traded funds (ETFs).
| Fidelity® Total International Equity Fund |
| |
| | Six months ended (Unaudited) April 30, 2023 | | Years ended October 31, 2022 | | 2021 | | 2020 | | 2019 | | 2018 |
Selected Per-Share Data | | | | | | | | | | | | |
| Net asset value, beginning of period | $ | 8.60 | $ | 12.54 | $ | 9.64 | $ | 9.37 | $ | 8.23 | $ | 9.40 |
| Income from Investment Operations | | | | | | | | | | | | |
Net investment income (loss) A,B | | .08 | | .18 | | .14 C | | .08 | | .16 | | .11 |
| Net realized and unrealized gain (loss) | | 1.62 | | (3.12) | | 3.04 | | .35 | | 1.06 | | (.90) |
| Total from investment operations | | 1.70 | | (2.94) | | 3.18 | | .43 | | 1.22 | | (.79) |
| Distributions from net investment income | | (.10) | | (.23) | | (.08) | | (.16) | | (.08) | | (.15) |
| Distributions from net realized gain | | - | | (.77) | | (.20) | | - | | - | | (.23) |
| Total distributions | | (.10) | | (1.00) | | (.28) | | (.16) | | (.08) | | (.38) |
Redemption fees added to paid in capital A | | - | | - | | - | | - | | - | | - D |
| Net asset value, end of period | $ | 10.20 | $ | 8.60 | $ | 12.54 | $ | 9.64 | $ | 9.37 | $ | 8.23 |
Total Return E,F | | 19.85% | | (25.25)% | | 33.37% | | 4.65% | | 14.97% | | (8.84)% |
Ratios to Average Net Assets B,G,H | | | | | | | | | | | | |
| Expenses before reductions | | 1.16% I | | 1.23% | | 1.27% | | 1.34% | | 1.20% | | 1.29% |
| Expenses net of fee waivers, if any | | 1.04% I | | 1.05% | | 1.09% | | 1.14% | | 1.20% | | 1.20% |
| Expenses net of all reductions | | 1.04% I | | 1.05% | | 1.09% | | 1.12% | | 1.19% | | 1.19% |
| Net investment income (loss) | | 1.62% I | | 1.79% | | 1.16% C | | .83% | | 1.81% | | 1.15% |
| Supplemental Data | | | | | | | | | | | | |
| Net assets, end of period (000 omitted) | $ | 118,824 | $ | 86,458 | $ | 82,604 | $ | 61,362 | $ | 70,251 | $ | 71,170 |
Portfolio turnover rate J | | 26% I | | 31% | | 39% | | 37% | | 69% | | 52% |
A Calculated based on average shares outstanding during the period.
B Net investment income (loss) is affected by the timing of the declaration of dividends by any underlying mutual funds or exchange-traded funds (ETFs). Net investment income (loss) of any mutual funds or ETFs is not included in the Fund's net investment income (loss) ratio.
C Net investment income per share reflects one or more large, non-recurring dividend(s) which amounted to $.03 per share. Excluding such non-recurring dividend(s), the ratio of net investment income (loss) to average net assets would have been .89%.
D Amount represents less than $.005 per share.
E Total returns for periods of less than one year are not annualized.
F Total returns would have been lower if certain expenses had not been reduced during the applicable periods shown.
G Fees and expenses of any underlying mutual funds or exchange-traded funds (ETFs) are not included in the Fund's expense ratio. The Fund indirectly bears its proportionate share of these expenses. For additional expense information related to investments in Fidelity Central Funds, please refer to the "Investments in Fidelity Central Funds" note found in the Notes to Financial Statements section of the most recent Annual or Semi-Annual report.
H Expense ratios reflect operating expenses of the class. Expenses before reductions do not reflect amounts reimbursed, waived, or reduced through arrangements with the investment adviser, brokerage services, or other offset arrangements, if applicable, and do not represent the amount paid by the class during periods when reimbursements, waivers or reductions occur.
I Annualized.
J Amount does not include the portfolio activity of any underlying mutual funds or exchange-traded funds (ETFs).
| Fidelity Advisor® Total International Equity Fund Class I |
| |
| | Six months ended (Unaudited) April 30, 2023 | | Years ended October 31, 2022 | | 2021 | | 2020 | | 2019 | | 2018 |
Selected Per-Share Data | | | | | | | | | | | | |
| Net asset value, beginning of period | $ | 8.56 | $ | 12.49 | $ | 9.60 | $ | 9.35 | $ | 8.19 | $ | 9.38 |
| Income from Investment Operations | | | | | | | | | | | | |
Net investment income (loss) A,B | | .08 | | .17 | | .14 C | | .08 | | .16 | | .10 |
| Net realized and unrealized gain (loss) | | 1.62 | | (3.10) | | 3.03 | | .34 | | 1.07 | | (.89) |
| Total from investment operations | | 1.70 | | (2.93) | | 3.17 | | .42 | | 1.23 | | (.79) |
| Distributions from net investment income | | (.10) | | (.23) | | (.08) | | (.17) | | (.07) | | (.17) |
| Distributions from net realized gain | | - | | (.77) | | (.20) | | - | | - | | (.23) |
| Total distributions | | (.10) | | (1.00) | | (.28) | | (.17) | | (.07) | | (.40) |
Redemption fees added to paid in capital A | | - | | - | | - | | - | | - | | - D |
| Net asset value, end of period | $ | 10.16 | $ | 8.56 | $ | 12.49 | $ | 9.60 | $ | 9.35 | $ | 8.19 |
Total Return E,F | | 19.95% | | (25.28)% | | 33.40% | | 4.50% | | 15.11% | | (8.86)% |
Ratios to Average Net Assets B,G,H | | | | | | | | | | | | |
| Expenses before reductions | | 1.14% I | | 1.22% | | 1.26% | | 1.33% | | 1.18% | | 1.29% |
| Expenses net of fee waivers, if any | | 1.04% I | | 1.04% | | 1.06% | | 1.14% | | 1.18% | | 1.20% |
| Expenses net of all reductions | | 1.04% I | | 1.04% | | 1.06% | | 1.13% | | 1.17% | | 1.19% |
| Net investment income (loss) | | 1.62% I | | 1.80% | | 1.18% C | | .82% | | 1.82% | | 1.15% |
| Supplemental Data | | | | | | | | | | | | |
| Net assets, end of period (000 omitted) | $ | 62,798 | $ | 35,423 | $ | 5,714 | $ | 2,073 | $ | 3,086 | $ | 9,405 |
Portfolio turnover rate J | | 26% I | | 31% | | 39% | | 37% | | 69% | | 52% |
A Calculated based on average shares outstanding during the period.
B Net investment income (loss) is affected by the timing of the declaration of dividends by any underlying mutual funds or exchange-traded funds (ETFs). Net investment income (loss) of any mutual funds or ETFs is not included in the Fund's net investment income (loss) ratio.
C Net investment income per share reflects one or more large, non-recurring dividend(s) which amounted to $.03 per share. Excluding such non-recurring dividend(s), the ratio of net investment income (loss) to average net assets would have been .91%.
D Amount represents less than $.005 per share.
E Total returns for periods of less than one year are not annualized.
F Total returns would have been lower if certain expenses had not been reduced during the applicable periods shown.
G Fees and expenses of any underlying mutual funds or exchange-traded funds (ETFs) are not included in the Fund's expense ratio. The Fund indirectly bears its proportionate share of these expenses. For additional expense information related to investments in Fidelity Central Funds, please refer to the "Investments in Fidelity Central Funds" note found in the Notes to Financial Statements section of the most recent Annual or Semi-Annual report.
H Expense ratios reflect operating expenses of the class. Expenses before reductions do not reflect amounts reimbursed, waived, or reduced through arrangements with the investment adviser, brokerage services, or other offset arrangements, if applicable, and do not represent the amount paid by the class during periods when reimbursements, waivers or reductions occur.
I Annualized.
J Amount does not include the portfolio activity of any underlying mutual funds or exchange-traded funds (ETFs).
| Fidelity Advisor® Total International Equity Fund Class Z |
| |
| | Six months ended (Unaudited) April 30, 2023 | | Years ended October 31, 2022 | | 2021 | | 2020 | | 2019 | | 2018 |
Selected Per-Share Data | | | | | | | | | | | | |
| Net asset value, beginning of period | $ | 8.61 | $ | 12.53 | $ | 9.62 | $ | 9.36 | $ | 8.22 | $ | 9.39 |
| Income from Investment Operations | | | | | | | | | | | | |
Net investment income (loss) A,B | | .09 | | .19 | | .16 C | | .09 | | .18 | | .12 |
| Net realized and unrealized gain (loss) | | 1.62 | | (3.11) | | 3.03 | | .35 | | 1.05 | | (.89) |
| Total from investment operations | | 1.71 | | (2.92) | | 3.19 | | .44 | | 1.23 | | (.77) |
| Distributions from net investment income | | (.10) | | (.23) | | (.08) | | (.18) | | (.09) | | (.17) |
| Distributions from net realized gain | | - | | (.77) | | (.20) | | - | | - | | (.23) |
| Total distributions | | (.10) | | (1.00) | | (.28) | | (.18) | | (.09) | | (.40) |
Redemption fees added to paid in capital A | | - | | - | | - | | - | | - | | - D |
| Net asset value, end of period | $ | 10.22 | $ | 8.61 | $ | 12.53 | $ | 9.62 | $ | 9.36 | $ | 8.22 |
Total Return E,F | | 19.96% | | (25.09)% | | 33.54% | | 4.74% | | 15.13% | | (8.63)% |
Ratios to Average Net Assets B,G,H | | | | | | | | | | | | |
| Expenses before reductions | | 1.01% I | | 1.10% | | 1.16% | | 1.22% | | 1.09% | | 1.16% |
| Expenses net of fee waivers, if any | | .89% I | | .90% | | .94% | | .98% | | 1.04% | | 1.05% |
| Expenses net of all reductions | | .89% I | | .90% | | .94% | | .97% | | 1.03% | | 1.04% |
| Net investment income (loss) | | 1.78% I | | 1.94% | | 1.31% C | | .99% | | 1.97% | | 1.30% |
| Supplemental Data | | | | | | | | | | | | |
| Net assets, end of period (000 omitted) | $ | 23,124 | $ | 7,681 | $ | 5,752 | $ | 3,422 | $ | 3,815 | $ | 216 |
Portfolio turnover rate J | | 26% I | | 31% | | 39% | | 37% | | 69% | | 52% |
A Calculated based on average shares outstanding during the period.
B Net investment income (loss) is affected by the timing of the declaration of dividends by any underlying mutual funds or exchange-traded funds (ETFs). Net investment income (loss) of any mutual funds or ETFs is not included in the Fund's net investment income (loss) ratio.
C Net investment income per share reflects one or more large, non-recurring dividend(s) which amounted to $.03 per share. Excluding such non-recurring dividend(s), the ratio of net investment income (loss) to average net assets would have been 1.04%.
D Amount represents less than $.005 per share.
E Total returns for periods of less than one year are not annualized.
F Total returns would have been lower if certain expenses had not been reduced during the applicable periods shown.
G Fees and expenses of any underlying mutual funds or exchange-traded funds (ETFs) are not included in the Fund's expense ratio. The Fund indirectly bears its proportionate share of these expenses. For additional expense information related to investments in Fidelity Central Funds, please refer to the "Investments in Fidelity Central Funds" note found in the Notes to Financial Statements section of the most recent Annual or Semi-Annual report.
H Expense ratios reflect operating expenses of the class. Expenses before reductions do not reflect amounts reimbursed, waived, or reduced through arrangements with the investment adviser, brokerage services, or other offset arrangements, if applicable, and do not represent the amount paid by the class during periods when reimbursements, waivers or reductions occur.
I Annualized.
J Amount does not include the portfolio activity of any underlying mutual funds or exchange-traded funds (ETFs).
For the period ended April 30, 2023
1. Organization.
Fidelity Total International Equity Fund (the Fund) is a fund of Fidelity Investment Trust (the Trust) and is authorized to issue an unlimited number of shares. The Trust is registered under the Investment Company Act of 1940, as amended (the 1940 Act), as an open-end management investment company organized as a Massachusetts business trust. The Fund offers Class A, Class M, Class C, Total International Equity, Class I and Class Z shares, each of which has equal rights as to assets and voting privileges. Class A, Class M, Class C, Class I and Class Z are Fidelity Advisor classes. Each class has exclusive voting rights with respect to matters that affect that class. Class C shares will automatically convert to Class A shares after a holding period of eight years from the initial date of purchase, with certain exceptions.
2. Investments in Fidelity Central Funds.
Funds may invest in Fidelity Central Funds, which are open-end investment companies generally available only to other investment companies and accounts managed by the investment adviser and its affiliates. The Schedule of Investments lists any Fidelity Central Funds held as an investment as of period end, but does not include the underlying holdings of each Fidelity Central Fund. An investing fund indirectly bears its proportionate share of the expenses of the underlying Fidelity Central Funds.
Based on its investment objective, each Fidelity Central Fund may invest or participate in various investment vehicles or strategies that are similar to those of the investing fund. These strategies are consistent with the investment objectives of the investing fund and may involve certain economic risks which may cause a decline in value of each of the Fidelity Central Funds and thus a decline in the value of the investing fund.
| Fidelity Central Fund | Investment Manager | Investment Objective | Investment Practices | Expense Ratio A |
| Fidelity Money Market Central Funds | Fidelity Management & Research Company LLC (FMR) | Each fund seeks to obtain a high level of current income consistent with the preservation of capital and liquidity. | Short-term Investments | Less than .005% |
A Expenses expressed as a percentage of average net assets and are as of each underlying Central Fund's most recent annual or semi-annual shareholder report.
A complete unaudited list of holdings for each Fidelity Central Fund is available upon request or at the Securities and Exchange Commission website at www.sec.gov. In addition, the financial statements of the Fidelity Central Funds which contain the significant accounting policies (including investment valuation policies) of those funds, and are not covered by the Report of Independent Registered Public Accounting Firm, are available on the Securities and Exchange Commission website or upon request.
3. Significant Accounting Policies.
The Fund is an investment company and applies the accounting and reporting guidance of the Financial Accounting Standards Board (FASB) Accounting Standards Codification Topic 946 Financial Services - Investment Companies . The financial statements have been prepared in conformity with accounting principles generally accepted in the United States of America (GAAP), which require management to make certain estimates and assumptions at the date of the financial statements. Actual results could differ from those estimates. Subsequent events, if any, through the date that the financial statements were issued have been evaluated in the preparation of the financial statements. The Fund's Schedule of Investments lists any underlying mutual funds or exchange-traded funds (ETFs) but does not include the underlying holdings of these funds. The following summarizes the significant accounting policies of the Fund:
Investment Valuation. Investments are valued as of 4:00 p.m. Eastern time on the last calendar day of the period. The Board of Trustees (the Board) has designated the Fund's investment adviser as the valuation designee responsible for the fair valuation function and performing fair value determinations as needed. The investment adviser has established a Fair Value Committee (the Committee) to carry out the day-to-day fair valuation responsibilities and has adopted policies and procedures to govern the fair valuation process and the activities of the Committee. In accordance with these fair valuation policies and procedures, which have been approved by the Board, the Fund attempts to obtain prices from one or more third party pricing services or brokers to value its investments. When current market prices, quotations or currency exchange rates are not readily available or reliable, investments will be fair valued in good faith by the Committee, in accordance with the policies and procedures. Factors used in determining fair value vary by investment type and may include market or investment specific events, transaction data, estimated cash flows, and market observations of comparable investments. The frequency that the fair valuation procedures are used cannot be predicted and they may be utilized to a significant extent. The Committee manages the Fund's fair valuation practices and maintains the fair valuation policies and procedures. The Fund's investment adviser reports to the Board information regarding the fair valuation process and related material matters.
The Fund categorizes the inputs to valuation techniques used to value its investments into a disclosure hierarchy consisting of three levels as shown below:
Level 1 - unadjusted quoted prices in active markets for identical investments
Level 2 - other significant observable inputs (including quoted prices for similar investments, interest rates, prepayment speeds, etc.)
Level 3 - unobservable inputs (including the Fund's own assumptions based on the best information available)
Valuation techniques used to value the Fund's investments by major category are as follows:
Equity securities, including restricted securities, for which market quotations are readily available, are valued at the last reported sale price or official closing price as reported by a third party pricing service on the primary market or exchange on which they are traded and are categorized as Level 1 in the hierarchy. In the event there were no sales during the day or closing prices are not available, securities are valued at the last quoted bid price or may be valued using the last available price and are generally categorized as Level 2 in the hierarchy. For foreign equity securities, when market or security specific events arise, comparisons to the valuation of American Depositary Receipts (ADRs), futures contracts, ETFs and certain indexes as well as quoted prices for similar securities may be used and would be categorized as Level 2 in the hierarchy. For equity securities, including restricted securities, where observable inputs are limited, assumptions about market activity and risk are used and these securities may be categorized as Level 3 in the hierarchy.
Investments in open-end mutual funds, including the Fidelity Central Funds, are valued at their closing net asset value (NAV) each business day and are categorized as Level 1 in the hierarchy.
Changes in valuation techniques may result in transfers in or out of an assigned level within the disclosure hierarchy. The aggregate value of investments by input level as of April 30, 2023 is included at the end of the Fund's Schedule of Investments.
Foreign Currency. Certain Funds may use foreign currency contracts to facilitate transactions in foreign-denominated securities. Gains and losses from these transactions may arise from changes in the value of the foreign currency or if the counterparties do not perform under the contracts' terms.
Foreign-denominated assets, including investment securities, and liabilities are translated into U.S. dollars at the exchange rates at period end. Purchases and sales of investment securities, income and dividends received, and expenses denominated in foreign currencies are translated into U.S. dollars at the exchange rate in effect on the transaction date.
The effects of exchange rate fluctuations on investments are included with the net realized and unrealized gain (loss) on investment securities. Other foreign currency transactions resulting in realized and unrealized gain (loss) are disclosed separately.
Investment Transactions and Income. For financial reporting purposes, the Fund's investment holdings and NAV include trades executed through the end of the last business day of the period. The NAV per share for processing shareholder transactions is calculated as of the close of business of the New York Stock Exchange (NYSE), normally 4:00 p.m. Eastern time and includes trades executed through the end of the prior business day. Gains and losses on securities sold are determined on the basis of identified cost and include proceeds received from litigation. Commissions paid to certain brokers with whom the investment adviser, or its affiliates, places trades on behalf of a fund include an amount in addition to trade execution, which may be rebated back to a fund. Any such rebates are included in net realized gain (loss) on investments in the Statement of Operations. Dividend income is recorded on the ex-dividend date, except for certain dividends from foreign securities where the ex-dividend date may have passed, which are recorded as soon as the Fund is informed of the ex-dividend date. Non-cash dividends included in dividend income, if any, are recorded at the fair market value of the securities received. Income and capital gain distributions from Fidelity Central Funds, if any, are recorded on the ex-dividend date. Certain distributions received by the Fund represent a return of capital or capital gain. The Fund determines the components of these distributions subsequent to the ex-dividend date, based upon receipt of tax filings or other correspondence relating to the underlying investment. These distributions are recorded as a reduction of cost of investments and/or as a realized gain. Interest income is accrued as earned and includes coupon interest and amortization of premium and accretion of discount on debt securities as applicable. Investment income is recorded net of foreign taxes withheld where recovery of such taxes is uncertain. Funds may file withholding tax reclaims in certain jurisdictions to recover a portion of amounts previously withheld. Any withholding tax reclaims income is included in the Statement of Operations in foreign taxes withheld. Any receivables for withholding tax reclaims are included in the Statement of Assets and Liabilities in reclaims receivable.
Class Allocations and Expenses. Investment income, realized and unrealized capital gains and losses, common expenses of a fund, and certain fund-level expense reductions, if any, are allocated daily on a pro-rata basis to each class based on the relative net assets of each class to the total net assets of a fund. Each class differs with respect to transfer agent and distribution and service plan fees incurred, as applicable. Certain expense reductions may also differ by class, if applicable. For the reporting period, the allocated portion of income and expenses to each class as a percent of its average net assets may vary due to the timing of recording these transactions in relation to fluctuating net assets of the classes. Expenses directly attributable to a fund are charged to that fund. Expenses attributable to more than one fund are allocated among the respective funds on the basis of relative net assets or other appropriate methods. Expenses included in the accompanying financial statements reflect the expenses of that fund and do not include any expenses associated with any underlying mutual funds or exchange-traded funds. Although not included in a fund's expenses, a fund indirectly bears its proportionate share of these expenses through the net asset value of each underlying mutual fund or exchange-traded fund. Expense estimates are accrued in the period to which they relate and adjustments are made when actual amounts are known.
Income Tax Information and Distributions to Shareholders. Each year, the Fund intends to qualify as a regulated investment company under Subchapter M of the Internal Revenue Code, including distributing substantially all of its taxable income and realized gains. As a result, no provision for U.S. Federal income taxes is required. The Fund files a U.S. federal tax return, in addition to state and local tax returns as required. The Fund's federal income tax returns are subject to examination by the Internal Revenue Service (IRS) for a period of three fiscal years after they are filed. State and local tax returns may be subject to examination for an additional fiscal year depending on the jurisdiction. Foreign taxes are provided for based on the Fund's understanding of the tax rules and rates that exist in the foreign markets in which it invests. The Fund is subject to a tax imposed on capital gains by certain countries in which it invests. An estimated deferred tax liability for net unrealized appreciation on the applicable securities is included in Other payables and accrued expenses on the Statement of Assets & Liabilities.
Distributions are declared and recorded on the ex-dividend date. Income and capital gain distributions are declared separately for each class. Income and capital gain distributions are determined in accordance with income tax regulations, which may differ from GAAP.
Capital accounts within the financial statements are adjusted for permanent book-tax differences. These adjustments have no impact on net assets or the results of operations. Capital accounts are not adjusted for temporary book-tax differences which will reverse in a subsequent period.
Book-tax differences are primarily due to foreign currency transactions, certain foreign taxes, passive foreign investment companies (PFIC), capital loss carryforwards and losses deferred due to wash sales.
As of period end, the cost and unrealized appreciation (depreciation) in securities, and derivatives if applicable, for federal income tax purposes were as follows:
| Gross unrealized appreciation | $39,034,694 |
| Gross unrealized depreciation | (15,256,848) |
| Net unrealized appreciation (depreciation) | $23,777,846 |
| Tax cost | $218,041,512 |
Capital loss carryforwards are only available to offset future capital gains of the Fund to the extent provided by regulations and may be limited. The capital loss carryforward information presented below, including any applicable limitation, is estimated as of prior fiscal period end and is subject to adjustment.
Short-term | $(2,940,975) |
| Total capital loss carryforward | $(2,940,975) |
Restricted Securities (including Private Placements). Funds may invest in securities that are subject to legal or contractual restrictions on resale. These securities generally may be resold in transactions exempt from registration or to the public if the securities are registered. Disposal of these securities may involve time-consuming negotiations and expense, and prompt sale at an acceptable price may be difficult. Information regarding restricted securities held at period end is included at the end of the Schedule of Investments, if applicable.
4. Purchases and Sales of Investments.
Purchases and sales of securities, other than short-term securities and in-kind transactions, as applicable, are noted in the table below.
| | Purchases ($) | Sales ($) |
| Fidelity Total International Equity Fund | 75,436,492 | 24,959,723 |
5. Fees and Other Transactions with Affiliates.
Management Fee. Fidelity Management & Research Company LLC (the investment adviser) and its affiliates provide the Fund with investment management related services for which the Fund pays a monthly management fee. The management fee is the sum of an individual fund fee rate that is based on an annual rate of .45% of the Fund's average net assets and an annualized group fee rate that averaged .23% during the period. The group fee rate is based upon the monthly average net assets of a group of registered investment companies with which the investment adviser has management contracts. The group fee rate decreases as assets under management increase and increases as assets under management decrease. In addition, the management fee is subject to a performance adjustment (up to a maximum of +/- .20% of the Fund's average net assets over a 36 month performance period). The upward or downward adjustment to the management fee is based on the relative investment performance of Total International Equity as compared to its benchmark index, the MSCI All Country World ex USA Index, over the same 36 month performance period. For the reporting period, the total annualized management fee rate, including the performance adjustment, was .78% of the Fund's average net assets. The performance adjustment included in the management fee rate may be higher or lower than the maximum performance adjustment rate due to the difference between the average net assets for the reporting and performance periods.
Distribution and Service Plan Fees. In accordance with Rule 12b-1 of the 1940 Act, the Fund has adopted separate Distribution and Service Plans for each class of shares. Certain classes pay Fidelity Distributors Company LLC (FDC), an affiliate of the investment adviser, separate Distribution and Service Fees, each of which is based on an annual percentage of each class' average net assets. In addition, FDC may pay financial intermediaries for selling shares of the Fund and providing shareholder support services. For the period, the Distribution and Service Fee rates, total fees and amounts retained by FDC were as follows:
| | Distribution Fee | Service Fee | Total Fees | Retained by FDC |
| Class A | - % | .25% | $21,815 | $1,308 |
| Class M | .25% | .25% | 27,880 | 385 |
| Class C | .75% | .25% | 11,529 | 3,538 |
| | | | $61,224 | $5,231 |
Sales Load. FDC may receive a front-end sales charge of up to 5.75% for selling Class A shares and 3.50% for selling Class M shares, some of which is paid to financial intermediaries for selling shares of the Fund. Depending on the holding period, FDC may receive contingent deferred sales charges levied on Class A, Class M and Class C redemptions. The deferred sales charges are 1.00% for Class C shares, 1.00% for certain purchases of Class A shares and .25% for certain purchases of Class M shares.
For the period, sales charge amounts retained by FDC were as follows:
| | Retained by FDC |
| Class A | $5,469 |
| Class M | 312 |
Class C A | 515 |
| | $6,296 |
A When Class C shares are initially sold, FDC pays commissions from its own resources to financial intermediaries through which the sales are made.
Transfer Agent Fees. Fidelity Investments Institutional Operations Company LLC (FIIOC), an affiliate of the investment adviser, is the transfer, dividend disbursing and shareholder servicing agent for each class of the Fund. FIIOC receives account fees and asset-based fees that vary according to the account size and type of account of the shareholders of the respective classes of the Fund, except for Class Z. FIIOC receives an asset-based fee of Class Z's average net assets. FIIOC pays for typesetting, printing and mailing of shareholder reports, except proxy statements.
For the period, transfer agent fees for each class were as follows:
| | Amount | % of Class-Level Average Net Assets A |
| Class A | $18,990 | .22 |
| Class M | 12,800 | .23 |
| Class C | 2,966 | .26 |
| Total International Equity | 95,530 | .18 |
| Class I | 42,572 | .17 |
| Class Z | 3,237 | .04 |
| | $176,095 | |
A Annualized
Accounting Fees. Fidelity Service Company, Inc. (FSC), an affiliate of the investment adviser, maintains the Fund's accounting records. The accounting fee is based on the level of average net assets for each month. For the period, the fees were equivalent to the following annualized rates:
| | % of Average Net Assets |
| Fidelity Total International Equity Fund | .05 |
Brokerage Commissions. A portion of portfolio transactions were placed with brokerage firms which are affiliates of the investment adviser. Brokerage commissions are included in net realized gain (loss) and change in net unrealized appreciation (depreciation) in the Statement of Operations. The commissions paid to these affiliated firms were as follows:
| | Amount |
| Fidelity Total International Equity Fund | $73 |
Interfund Trades. Funds may purchase from or sell securities to other Fidelity Funds under procedures adopted by the Board. The procedures have been designed to ensure these interfund trades are executed in accordance with Rule 17a-7 of the 1940 Act. Any interfund trades are included within the respective purchases and sales amounts shown in the Purchases and Sales of Investments note. Interfund trades during the period are noted in the table below.
| | Purchases ($) | Sales ($) | Realized Gain (Loss) ($) |
| Fidelity Total International Equity Fund | 6,848,879 | 853,647 | (203,412) |
6. Committed Line of Credit.
Certain Funds participate with other funds managed by the investment adviser or an affiliate in a $4.25 billion credit facility (the "line of credit") to be utilized for temporary or emergency purposes to fund shareholder redemptions or for other short-term liquidity purposes. The participating funds have agreed to pay commitment fees on their pro-rata portion of the line of credit, which are reflected in Miscellaneous expenses on the Statement of Operations, and are listed below. During the period, there were no borrowings on this line of credit.
| | Amount |
| Fidelity Total International Equity Fund | $188 |
7. Security Lending.
Funds lend portfolio securities from time to time in order to earn additional income. Lending agents are used, including National Financial Services (NFS), an affiliate of the investment adviser. Pursuant to a securities lending agreement, NFS will receive a fee, which is capped at 9.9% of a fund's daily lending revenue, for its services as lending agent. A fund may lend securities to certain qualified borrowers, including NFS. On the settlement date of the loan, a fund receives collateral (in the form of U.S. Treasury obligations, letters of credit and/or cash) against the loaned securities and maintains collateral in an amount not less than 100% of the market value of the loaned securities during the period of the loan. The market value of the loaned securities is determined at the close of business of a fund and any additional required collateral is delivered to a fund on the next business day. A fund or borrower may terminate the loan at any time, and if the borrower defaults on its obligation to return the securities loaned because of insolvency or other reasons, a fund may apply collateral received from the borrower against the obligation. A fund may experience delays and costs in recovering the securities loaned. Any cash collateral received is invested in the Fidelity Securities Lending Cash Central Fund. Any loaned securities are identified as such in the Schedule of Investments, and the value of loaned securities and cash collateral at period end, as applicable, are presented in the Statement of Assets and Liabilities. Security lending income represents the income earned on investing cash collateral, less rebates paid to borrowers and any lending agent fees associated with the loan, plus any premium payments received for lending certain types of securities. Security lending income is presented in the Statement of Operations as a component of income from Fidelity Central Funds. Affiliated security lending activity, if any, was as follows:
| | Total Security Lending Fees Paid to NFS | Security Lending Income From Securities Loaned to NFS | Value of Securities Loaned to NFS at Period End |
| Fidelity Total International Equity Fund | $1,170 | $- | $- |
8. Expense Reductions.
The investment adviser contractually agreed to reimburse expenses of each class to the extent annual operating expenses exceeded certain levels of class-level average net assets as noted in the table below. This reimbursement will remain in place through February 29, 2024. Some expenses, for example the compensation of the independent Trustees, and certain miscellaneous expenses such as proxy and shareholder meeting expenses, are excluded from this reimbursement.
The following classes were in reimbursement during the period:
| | Expense Limitations | Reimbursement |
| Class A | 1.30% | $13,032 |
| Class M | 1.55% | 9,133 |
| Class C | 2.05% | 2,195 |
| Total International Equity | 1.05% | 58,291 |
| Class I | 1.05% | 23,780 |
| Class Z | .90% | 8,856 |
| | | $115,287 |
Through arrangements with the Fund's custodian, credits realized as a result of certain uninvested cash balances were used to reduce the Fund's expenses. During the period, transfer agent credits reduced each class' expenses as noted in the table below.
| | Expense reduction |
| Class A | $117 |
| Class M | 191 |
| | $308 |
In addition, during the period the investment adviser or an affiliate reimbursed and/or waived a portion of fund-level operating expenses in the amount of $4,725.
9. Distributions to Shareholders.
Distributions to shareholders of each class were as follows:
| | Six months ended April 30, 2023 | Year ended October 31, 2022 |
| Fidelity Total International Equity Fund | | |
| Distributions to shareholders | | |
| Class A | $136,043 | $682,772 |
| Class M | 60,649 | 954,432 |
| Class C | 1,760 | 136,202 |
| Total International Equity | 1,034,854 | 6,786,798 |
| Class I | 451,131 | 530,168 |
| Class Z | 121,603 | 539,160 |
Total | $1,806,040 | $9,629,532 |
10. Share Transactions.
Share transactions for each class were as follows and may contain in-kind transactions, automatic conversions between classes or exchanges between affiliated funds:
| | Shares | Shares | Dollars | Dollars |
| | Six months ended April 30, 2023 | Year ended October 31, 2022 | Six months ended April 30, 2023 | Year ended October 31, 2022 |
| Fidelity Total International Equity Fund | | | | |
| Class A | | | | |
| Shares sold | 596,975 | 888,736 | $5,798,261 | $8,539,920 |
| Reinvestment of distributions | 14,206 | 60,242 | 135,808 | 667,482 |
| Shares redeemed | (121,486) | (148,110) | (1,182,774) | (1,522,197) |
| Net increase (decrease) | 489,695 | 800,868 | $4,751,295 | $7,685,205 |
| Class M | | | | |
| Shares sold | 63,997 | 208,686 | $630,246 | $2,095,684 |
| Reinvestment of distributions | 6,291 | 85,446 | 60,649 | 954,432 |
| Shares redeemed | (113,122) | (179,080) | (1,099,968) | (1,802,328) |
| Net increase (decrease) | (42,834) | 115,052 | $(409,073) | $1,247,788 |
| Class C | | | | |
| Shares sold | 46,593 | 104,691 | $464,565 | $1,089,289 |
| Reinvestment of distributions | 183 | 12,220 | 1,760 | 135,883 |
| Shares redeemed | (22,530) | (54,762) | (219,385) | (553,236) |
| Net increase (decrease) | 24,246 | 62,149 | $246,940 | $671,936 |
| Total International Equity | | | | |
| Shares sold | 3,232,414 | 4,897,322 | $31,889,002 | $50,896,948 |
| Reinvestment of distributions | 97,973 | 561,002 | 939,562 | 6,227,120 |
| Shares redeemed | (1,733,997) | (1,992,599) | (16,929,689) | (19,350,338) |
| Net increase (decrease) | 1,596,390 | 3,465,725 | $15,898,875 | $37,773,730 |
| Class I | | | | |
| Shares sold | 2,559,544 | 4,463,099 | $25,288,799 | $43,483,713 |
| Reinvestment of distributions | 46,910 | 47,315 | 447,992 | 523,303 |
| Shares redeemed | (559,771) | (831,499) | (5,482,783) | (8,050,707) |
| Net increase (decrease) | 2,046,683 | 3,678,915 | $20,254,008 | $35,956,309 |
| Class Z | | | | |
| Shares sold | 1,587,729 | 1,300,267 | $15,645,153 | $12,980,304 |
| Reinvestment of distributions | 10,898 | 45,956 | 104,625 | 510,116 |
| Shares redeemed | (227,421) | (912,726) | (2,244,880) | (8,135,101) |
| Net increase (decrease) | 1,371,206 | 433,497 | $13,504,898 | $5,355,319 |
11. Other.
A fund's organizational documents provide former and current trustees and officers with a limited indemnification against liabilities arising in connection with the performance of their duties to the fund. In the normal course of business, a fund may also enter into contracts that provide general indemnifications. A fund's maximum exposure under these arrangements is unknown as this would be dependent on future claims that may be made against a fund. The risk of material loss from such claims is considered remote.
12. Risk and Uncertainties.
Many factors affect a fund's performance. Developments that disrupt global economies and financial markets, such as pandemics, epidemics, outbreaks of infectious diseases, war, terrorism, and environmental disasters, may significantly affect a fund's investment performance. The effects of these developments to a fund will be impacted by the types of securities in which a fund invests, the financial condition, industry, economic sector, and geographic location of an issuer, and a fund's level of investment in the securities of that issuer. Significant concentrations in security types, issuers, industries, sectors, and geographic locations may magnify the factors that affect a fund's performance.
As a shareholder, you incur two types of costs: (1) transaction costs, which may include sales charges (loads) on purchase payments or redemption proceeds, as applicable and (2) ongoing costs, which generally include management fees, distribution and/or service (12b-1) fees and other Fund expenses. This Example is intended to help you understand your ongoing costs (in dollars) of investing in a fund and to compare these costs with the ongoing costs of investing in other mutual funds.
| The Example is based on an investment of $1,000 invested at the beginning of the period and held for the entire period (November 1, 2022 to April 30, 2023). |
Actual Expenses
The first line of the accompanying table provides information about actual account values and actual expenses. You may use the information in this line, together with the amount you invested, to estimate the expenses that you paid over the period. Simply divide your account value by $1,000.00 (for example, an $8,600 account value divided by $1,000.00 = 8.6), then multiply the result by the number in the first line for a class/Fund under the heading entitled "Expenses Paid During Period" to estimate the expenses you paid on your account during this period. If any fund is a shareholder of any underlying mutual funds or exchange-traded funds (ETFs) (the Underlying Funds), such fund indirectly bears its proportional share of the expenses of the Underlying Funds in addition to the direct expenses incurred presented in the table. These fees and expenses are not included in the annualized expense ratio used to calculate the expense estimate in the table below.
Hypothetical Example for Comparison Purposes
The second line of the accompanying table provides information about hypothetical account values and hypothetical expenses based on the actual expense ratio and an assumed rate of return of 5% per year before expenses, which is not the actual return. The hypothetical account values and expenses may not be used to estimate the actual ending account balance or expenses you paid for the period. You may use this information to compare the ongoing costs of investing in the Fund and other funds. To do so, compare this 5% hypothetical example with the 5% hypothetical examples that appear in the shareholder reports of the other funds. If any fund is a shareholder of any Underlying Funds, such fund indirectly bears its proportional share of the expenses of the Underlying Funds in addition to the direct expenses as presented in the table. These fees and expenses are not included in the annualized expense ratio used to calculate the expense estimate in the table below.
Please note that the expenses shown in the table are meant to highlight your ongoing costs only and do not reflect any transaction costs. Therefore, the second line of the table is useful in comparing ongoing costs only, and will not help you determine the relative total costs of owning different funds. In addition, if these transactional costs were included, your costs would have been higher.
| | | | | Annualized Expense Ratio- A | | Beginning Account Value November 1, 2022 | | Ending Account Value April 30, 2023 | | Expenses Paid During Period- C November 1, 2022 to April 30, 2023 |
| Fidelity® Total International Equity Fund | | | | | | | | | | |
| Class A | | | | 1.29% | | | | | | |
| Actual | | | | | | $ 1,000 | | $ 1,197.30 | | $ 7.03 |
Hypothetical- B | | | | | | $ 1,000 | | $ 1,018.40 | | $ 6.46 |
| Class M | | | | 1.55% | | | | | | |
| Actual | | | | | | $ 1,000 | | $ 1,195.90 | | $ 8.44 |
Hypothetical- B | | | | | | $ 1,000 | | $ 1,017.11 | | $ 7.75 |
| Class C | | | | 2.04% | | | | | | |
| Actual | | | | | | $ 1,000 | | $ 1,193.30 | | $ 11.09 |
Hypothetical- B | | | | | | $ 1,000 | | $ 1,014.68 | | $ 10.19 |
| Fidelity® Total International Equity Fund | | | | 1.04% | | | | | | |
| Actual | | | | | | $ 1,000 | | $ 1,198.50 | | $ 5.67 |
Hypothetical- B | | | | | | $ 1,000 | | $ 1,019.64 | | $ 5.21 |
| Class I | | | | 1.04% | | | | | | |
| Actual | | | | | | $ 1,000 | | $ 1,199.50 | | $ 5.67 |
Hypothetical- B | | | | | | $ 1,000 | | $ 1,019.64 | | $ 5.21 |
| Class Z | | | | .89% | | | | | | |
| Actual | | | | | | $ 1,000 | | $ 1,199.60 | | $ 4.85 |
Hypothetical- B | | | | | | $ 1,000 | | $ 1,020.38 | | $ 4.46 |
| |
A Annualized expense ratio reflects expenses net of applicable fee waivers.
B 5% return per year before expenses
C Expenses are equal to the annualized expense ratio, multiplied by the average account value over the period, multiplied by 181/ 365 (to reflect the one-half year period). The fees and expenses of any Underlying Funds are not included in each annualized expense ratio.
The Securities and Exchange Commission adopted Rule 22e-4 under the Investment Company Act of 1940 (the Liquidity Rule) to promote effective liquidity risk management throughout the open-end investment company industry, thereby reducing the risk that funds will be unable to meet their redemption obligations and mitigating dilution of the interests of fund shareholders.
The Fund has adopted and implemented a liquidity risk management program (the Program) reasonably designed to assess and manage the Fund's liquidity risk and to comply with the requirements of the Liquidity Rule. The Fund's Board of Trustees (the Board) has designated the Fund's investment adviser as administrator of the Program. The Fidelity advisers have established a Liquidity Risk Management Committee (the LRM Committee) to manage the Program for each of the Fidelity Funds. The LRM Committee monitors the adequacy and effectiveness of implementation of the Program and on a periodic basis assesses each Fund's liquidity risk based on a variety of factors including (1) the Fund's investment strategy, (2) portfolio liquidity and cash flow projections during normal and reasonably foreseeable stressed conditions, (3) shareholder redemptions, (4) borrowings and other funding sources and (5) certain factors specific to ETFs including the effect of the Fund's prices and spreads, market participants, and basket compositions on the overall liquidity of the Fund's portfolio, as applicable.
In accordance with the Program, each of the Fund's portfolio investments is classified into one of four defined liquidity categories based on a determination of a reasonable expectation for how long it would take to convert the investment to cash (or sell or dispose of the investment) without significantly changing its market value.
- Highly liquid investments - cash or convertible to cash within three business days or less
- Moderately liquid investments - convertible to cash in three to seven calendar days
- Less liquid investments - can be sold or disposed of, but not settled, within seven calendar days
- Illiquid investments - cannot be sold or disposed of within seven calendar days
Liquidity classification determinations take into account a variety of factors including various market, trading and investment-specific considerations, as well as market depth, and generally utilize analysis from a third-party liquidity metrics service.
The Liquidity Rule places a 15% limit on a fund's illiquid investments and requires funds that do not primarily hold assets that are highly liquid investments to determine and maintain a minimum percentage of the fund's net assets to be invested in highly liquid investments (highly liquid investment minimum or HLIM). The Program includes provisions reasonably designed to comply with the 15% limit on illiquid investments and for determining, periodically reviewing and complying with the HLIM requirement as applicable.
At a recent meeting of the Fund's Board of Trustees, the LRM Committee provided a written report to the Board pertaining to the operation, adequacy, and effectiveness of the Program for the period December 1, 2021 through November 30, 2022. The report concluded that the Program is operating effectively and is reasonably designed to assess and manage the Fund's liquidity risk.
1.912361.113
TIE-SANN-0623
Fidelity® Infrastructure Fund
Semi-Annual Report
April 30, 2023
Contents
To view a fund's proxy voting guidelines and proxy voting record for the 12-month period ended June 30, visit http://www.fidelity.com/proxyvotingresults or visit the Securities and Exchange Commission's (SEC) web site at http://www.sec.gov.
You may also call 1-800-544-8544 to request a free copy of the proxy voting guidelines.
Standard & Poor's, S&P and S&P 500 are registered service marks of The McGraw-Hill Companies, Inc. and have been licensed for use by Fidelity Distributors Corporation.
Other third-party marks appearing herein are the property of their respective owners.
All other marks appearing herein are registered or unregistered trademarks or service marks of FMR LLC or an affiliated company. © 2023 FMR LLC. All rights reserved.
This report and the financial statements contained herein are submitted for the general information of the shareholders of the Fund. This report is not authorized for distribution to prospective investors in the Fund unless preceded or accompanied by an effective prospectus.
A fund files its complete schedule of portfolio holdings with the SEC for the first and third quarters of each fiscal year on Form N-PORT. Forms N-PORT are available on the SEC's web site at http://www.sec.gov. A fund's Forms N-PORT may be reviewed and copied at the SEC's Public Reference Room in Washington, DC. Information regarding the operation of the SEC's Public Reference Room may be obtained by calling 1-800-SEC-0330.
For a complete list of a fund's portfolio holdings, view the most recent holdings listing, semiannual report, or annual report on Fidelity's web site at http://www.fidelity.com, http://www.institutional.fidelity.com, or http://www.401k.com, as applicable.
NOT FDIC INSURED •MAY LOSE VALUE •NO BANK GUARANTEE
Neither the Fund nor Fidelity Distributors Corporation is a bank.
Top Holdings (% of Fund's net assets) |
| |
| Aena SME SA | 7.5 | |
| NextEra Energy, Inc. | 7.4 | |
| Southern Co. | 5.0 | |
| Iberdrola SA | 4.7 | |
| Cellnex Telecom SA | 4.4 | |
| Grupo Aeroportuario del Pacifico S.A.B. de CV sponsored ADR | 4.2 | |
| GFL Environmental, Inc. | 4.2 | |
| National Grid PLC | 4.1 | |
| Cheniere Energy, Inc. | 3.9 | |
| The Williams Companies, Inc. | 3.3 | |
| | 48.7 | |
| |
| Market Sectors (% of Fund's net assets) |
| |
| Utilities | 38.1 | |
| Industrials | 29.3 | |
| Energy | 12.5 | |
| Real Estate | 10.7 | |
| Communication Services | 5.4 | |
| |
Asset Allocation (% of Fund's net assets) |
|
|
Geographic Diversification (% of Fund's net assets) |
|
* Includes Short-Term investments and Net Other Assets (Liabilities). Percentages are adjusted for the effect of derivatives, if applicable. |
| |
Showing Percentage of Net Assets
| Common Stocks - 96.0% |
| | | Shares | Value ($) |
| COMMUNICATION SERVICES - 5.4% | | | |
| Diversified Telecommunication Services - 5.4% | | | |
| Cellnex Telecom SA (a) | | 54,638 | 2,300,478 |
| Helios Towers PLC (b) | | 409,362 | 536,588 |
| | | | 2,837,066 |
| ENERGY - 12.5% | | | |
| Oil, Gas & Consumable Fuels - 12.5% | | | |
| Cheniere Energy, Inc. | | 13,502 | 2,065,806 |
| Enterprise Products Partners LP | | 12,796 | 336,663 |
| ONEOK, Inc. | | 15,531 | 1,015,883 |
| Targa Resources Corp. | | 18,609 | 1,405,538 |
| The Williams Companies, Inc. | | 57,237 | 1,731,992 |
| | | | 6,555,882 |
| INDUSTRIALS - 29.3% | | | |
| Commercial Services & Supplies - 9.1% | | | |
| GFL Environmental, Inc. | | 60,225 | 2,186,168 |
| Republic Services, Inc. | | 8,880 | 1,284,226 |
| Waste Connections, Inc. (United States) | | 9,458 | 1,316,081 |
| | | | 4,786,475 |
| Construction & Engineering - 3.2% | | | |
| Ferrovial SA | | 30,164 | 944,948 |
| VINCI SA | | 6,070 | 750,453 |
| | | | 1,695,401 |
| Ground Transportation - 2.1% | | | |
| Canadian Pacific Kansas City Ltd. | | 2,794 | 220,279 |
| CSX Corp. | | 14,079 | 431,381 |
| Union Pacific Corp. | | 2,360 | 461,852 |
| | | | 1,113,512 |
| Transportation Infrastructure - 14.9% | | | |
| Aena SME SA (a)(c) | | 23,499 | 3,959,121 |
| Grupo Aeroportuario del Pacifico S.A.B. de CV sponsored ADR | | 12,343 | 2,191,747 |
| Grupo Aeroportuario Norte S.A.B. de CV ADR | | 18,858 | 1,649,698 |
| | | | 7,800,566 |
TOTAL INDUSTRIALS | | | 15,395,954 |
| REAL ESTATE - 10.7% | | | |
| Equity Real Estate Investment Trusts (REITs) - 10.5% | | | |
| American Tower Corp. | | 6,277 | 1,282,956 |
| Crown Castle International Corp. | | 6,368 | 783,837 |
| Equinix, Inc. | | 1,577 | 1,141,874 |
| Londonmetric Properity PLC | | 124,328 | 300,936 |
| Prologis (REIT), Inc. | | 6,505 | 814,751 |
| SBA Communications Corp. Class A | | 2,580 | 673,096 |
| Segro PLC | | 49,251 | 516,709 |
| | | | 5,514,159 |
| Real Estate Management & Development - 0.2% | | | |
| Catena AB | | 2,989 | 114,430 |
TOTAL REAL ESTATE | | | 5,628,589 |
| UTILITIES - 38.1% | | | |
| Electric Utilities - 25.7% | | | |
| Constellation Energy Corp. | | 7,270 | 562,698 |
| Exelon Corp. | | 38,406 | 1,629,951 |
| Iberdrola SA | | 190,390 | 2,467,093 |
| Kansai Electric Power Co., Inc. | | 86,761 | 936,560 |
| NextEra Energy, Inc. | | 50,745 | 3,888,589 |
| ORSTED A/S (a) | | 9,065 | 812,895 |
| Southern Co. | | 35,700 | 2,625,735 |
| Xcel Energy, Inc. | | 8,042 | 562,216 |
| | | | 13,485,737 |
| Independent Power and Renewable Electricity Producers - 5.7% | | | |
| Brookfield Renewable Partners LP | | 19,390 | 601,090 |
| EDP Renovaveis SA | | 39,023 | 866,869 |
| RWE AG | | 32,916 | 1,543,294 |
| | | | 3,011,253 |
| Multi-Utilities - 6.7% | | | |
| National Grid PLC | | 148,700 | 2,132,050 |
| WEC Energy Group, Inc. | | 14,259 | 1,371,288 |
| | | | 3,503,338 |
TOTAL UTILITIES | | | 20,000,328 |
| TOTAL COMMON STOCKS (Cost $44,806,699) | | | 50,417,819 |
| | | | |
| Money Market Funds - 10.2% |
| | | Shares | Value ($) |
| Fidelity Cash Central Fund 4.88% (d) | | 1,984,285 | 1,984,682 |
| Fidelity Securities Lending Cash Central Fund 4.88% (d)(e) | | 3,349,919 | 3,350,254 |
| TOTAL MONEY MARKET FUNDS (Cost $5,334,936) | | | 5,334,936 |
| | | | |
| TOTAL INVESTMENT IN SECURITIES - 106.2% (Cost $50,141,635) | 55,752,755 |
NET OTHER ASSETS (LIABILITIES) - (6.2)% | (3,242,422) |
| NET ASSETS - 100.0% | 52,510,333 |
| | |
Legend
| (a) | Security exempt from registration under Rule 144A of the Securities Act of 1933. These securities may be resold in transactions exempt from registration, normally to qualified institutional buyers. At the end of the period, the value of these securities amounted to $7,072,494 or 13.5% of net assets. |
| (c) | Security or a portion of the security is on loan at period end. |
| (d) | Affiliated fund that is generally available only to investment companies and other accounts managed by Fidelity Investments. The rate quoted is the annualized seven-day yield of the fund at period end. A complete unaudited listing of the fund's holdings as of its most recent quarter end is available upon request. In addition, each Fidelity Central Fund's financial statements are available on the SEC's website or upon request. |
| (e) | Investment made with cash collateral received from securities on loan. |
Affiliated Central Funds
Fiscal year to date information regarding the Fund's investments in Fidelity Central Funds, including the ownership percentage, is presented below.
| Affiliate | Value, beginning of period ($) | Purchases ($) | Sales Proceeds ($) | Dividend Income ($) | Realized Gain (loss) ($) | Change in Unrealized appreciation (depreciation) ($) | Value, end of period ($) | % ownership, end of period |
| Fidelity Cash Central Fund 4.88% | 1,292,455 | 10,184,615 | 9,492,388 | 45,344 | - | - | 1,984,682 | 0.0% |
| Fidelity Securities Lending Cash Central Fund 4.88% | 377,175 | 8,233,253 | 5,260,174 | 550 | - | - | 3,350,254 | 0.0% |
| Total | 1,669,630 | 18,417,868 | 14,752,562 | 45,894 | - | - | 5,334,936 | |
| | | | | | | | | |
Amounts in the dividend income column in the above table include any capital gain distributions from underlying funds, which are presented in the corresponding line item in the Statement of Operations, if applicable.
Amounts in the dividend income column for Fidelity Securities Lending Cash Central Fund represents the income earned on investing cash collateral, less rebates paid to borrowers and any lending agent fees associated with the loan, plus any premium payments received for lending certain types of securities.
Amounts included in the purchases and sales proceeds columns may include in-kind transactions, if applicable.
Investment Valuation
The following is a summary of the inputs used, as of April 30, 2023, involving the Fund's assets and liabilities carried at fair value. The inputs or methodology used for valuing securities may not be an indication of the risk associated with investing in those securities. For more information on valuation inputs, and their aggregation into the levels used below, please refer to the Investment Valuation section in the accompanying Notes to Financial Statements.
| Valuation Inputs at Reporting Date: |
| Description | Total ($) | Level 1 ($) | Level 2 ($) | Level 3 ($) |
Investments in Securities: | | | | |
|
| Equities: | | | | |
Communication Services | 2,837,066 | 536,588 | 2,300,478 | - |
Energy | 6,555,882 | 6,555,882 | - | - |
Industrials | 15,395,954 | 15,395,954 | - | - |
Real Estate | 5,628,589 | 5,628,589 | - | - |
Utilities | 20,000,328 | 14,464,625 | 5,535,703 | - |
|
| Money Market Funds | 5,334,936 | 5,334,936 | - | - |
| Total Investments in Securities: | 55,752,755 | 47,916,574 | 7,836,181 | - |
| Statement of Assets and Liabilities |
| | | | April 30, 2023 (Unaudited) |
| | | | | |
| Assets | | | | |
| Investment in securities, at value (including securities loaned of $3,226,981) - See accompanying schedule: | | | | |
Unaffiliated issuers (cost $44,806,699) | $ | 50,417,819 | | |
Fidelity Central Funds (cost $5,334,936) | | 5,334,936 | | |
| | | | | |
| | | | | |
| Total Investment in Securities (cost $50,141,635) | | | $ | 55,752,755 |
| Cash | | | | 16,931 |
| Foreign currency held at value (cost $26,511) | | | | 26,511 |
| Receivable for investments sold | | | | 293,366 |
| Receivable for fund shares sold | | | | 7,733 |
| Dividends receivable | | | | 77,086 |
| Distributions receivable from Fidelity Central Funds | | | | 8,526 |
| Prepaid expenses | | | | 19 |
| Receivable from investment adviser for expense reductions | | | | 9,432 |
Total assets | | | | 56,192,359 |
| Liabilities | | | | |
| Payable for investments purchased | $ | 252,643 | | |
| Payable for fund shares redeemed | | 8,520 | | |
| Accrued management fee | | 29,423 | | |
| Other affiliated payables | | 12,540 | | |
| Other payables and accrued expenses | | 28,646 | | |
| Collateral on securities loaned | | 3,350,254 | | |
| Total Liabilities | | | | 3,682,026 |
| Net Assets | | | $ | 52,510,333 |
| Net Assets consist of: | | | | |
| Paid in capital | | | $ | 51,445,728 |
| Total accumulated earnings (loss) | | | | 1,064,605 |
| Net Assets | | | $ | 52,510,333 |
Net Asset Value , offering price and redemption price per share ($52,510,333 ÷ 4,294,575 shares) | | | $ | 12.23 |
| Statement of Operations |
| | | | Six months ended April 30, 2023 (Unaudited) |
| Investment Income | | | | |
| Dividends | | | $ | 476,212 |
| Non-Cash dividends | | | | 39,747 |
| Interest | | | | 73 |
| Income from Fidelity Central Funds (including $550 from security lending) | | | | 45,894 |
| Income before foreign taxes withheld | | | $ | 561,926 |
| Less foreign taxes withheld | | | | (25,073) |
| Total Income | | | | 536,853 |
| Expenses | | | | |
| Management fee | $ | 157,531 | | |
| Transfer agent fees | | 58,707 | | |
| Accounting fees | | 8,246 | | |
| Custodian fees and expenses | | 6,418 | | |
| Independent trustees' fees and expenses | | 147 | | |
| Registration fees | | 7,375 | | |
| Audit | | 25,862 | | |
| Legal | | 31 | | |
| Miscellaneous | | 101 | | |
| Total expenses before reductions | | 264,418 | | |
| Expense reductions | | (44,796) | | |
| Total expenses after reductions | | | | 219,622 |
| Net Investment income (loss) | | | | 317,231 |
| Realized and Unrealized Gain (Loss) | | | | |
| Net realized gain (loss) on: | | | | |
| Investment Securities: | | | | |
| Unaffiliated issuers | | (886,542) | | |
| Foreign currency transactions | | 9,664 | | |
| Total net realized gain (loss) | | | | (876,878) |
| Change in net unrealized appreciation (depreciation) on: | | | | |
| Investment Securities: | | | | |
| Unaffiliated issuers | | 4,472,536 | | |
| Assets and liabilities in foreign currencies | | 1,327 | | |
| Total change in net unrealized appreciation (depreciation) | | | | 4,473,863 |
| Net gain (loss) | | | | 3,596,985 |
| Net increase (decrease) in net assets resulting from operations | | | $ | 3,914,216 |
| Statement of Changes in Net Assets |
| |
| | Six months ended April 30, 2023 (Unaudited) | | Year ended October 31, 2022 |
| Increase (Decrease) in Net Assets | | | | |
| Operations | | | | |
| Net investment income (loss) | $ | 317,231 | $ | 548,089 |
| Net realized gain (loss) | | (876,878) | | (2,117,443) |
| Change in net unrealized appreciation (depreciation) | | 4,473,863 | | (4,462,414) |
| Net increase (decrease) in net assets resulting from operations | | 3,914,216 | | (6,031,768) |
| Distributions to shareholders | | (403,456) | | (639,029) |
| Share transactions | | | | |
| Proceeds from sales of shares | | 17,567,555 | | 27,766,378 |
| Reinvestment of distributions | | 373,580 | | 598,670 |
| Cost of shares redeemed | | (6,297,592) | | (30,384,461) |
Net increase (decrease) in net assets resulting from share transactions | | 11,643,543 | | (2,019,413) |
| Total increase (decrease) in net assets | | 15,154,303 | | (8,690,210) |
| | | | | |
| Net Assets | | | | |
| Beginning of period | | 37,356,030 | | 46,046,240 |
| End of period | $ | 52,510,333 | $ | 37,356,030 |
| | | | | |
| Other Information | | | | |
| Shares | | | | |
| Sold | | 1,466,825 | | 2,232,445 |
| Issued in reinvestment of distributions | | 31,505 | | 51,607 |
| Redeemed | | (533,527) | | (2,600,860) |
| Net increase (decrease) | | 964,803 | | (316,808) |
| | | | | |
Financial Highlights
| Fidelity® Infrastructure Fund |
| |
| | Six months ended (Unaudited) April 30, 2023 | | Years ended October 31, 2022 | | 2021 | | 2020 A |
Selected Per-Share Data | | | | | | | | |
| Net asset value, beginning of period | $ | 11.22 | $ | 12.63 | $ | 10.44 | $ | 10.00 |
| Income from Investment Operations | | | | | | | | |
Net investment income (loss) B,C | | .08 | | .13 D | | .07 | | .17 |
| Net realized and unrealized gain (loss) | | 1.04 | | (1.38) | | 2.21 | | .31 |
| Total from investment operations | | 1.12 | | (1.25) | | 2.28 | | .48 |
| Distributions from net investment income | | (.11) | | (.16) | | (.09) | | (.04) |
| Total distributions | | (.11) | | (.16) | | (.09) | | (.04) |
| Net asset value, end of period | $ | 12.23 | $ | 11.22 | $ | 12.63 | $ | 10.44 |
Total Return E,F | | 10.03% | | (9.95)% | | 21.96% | | 4.79% |
Ratios to Average Net Assets C,G,H | | | | | | | | |
| Expenses before reductions | | 1.14% I | | 1.13% | | 1.24% | | 2.24% I |
| Expenses net of fee waivers, if any | | .95% I | | .98% | | 1.00% | | 1.00% I |
| Expenses net of all reductions | | .94% I | | .98% | | 1.00% | | .98% I |
| Net investment income (loss) | | 1.36% I | | 1.08% D | | .61% | | 1.67% I |
| Supplemental Data | | | | | | | | |
| Net assets, end of period (000 omitted) | $ | 52,510 | $ | 37,356 | $ | 46,046 | $ | 12,762 |
Portfolio turnover rate J | | 67% I | | 91% | | 46% | | 50% I |
A For the period November 5, 2019 (commencement of operations) through October 31, 2020.
B Calculated based on average shares outstanding during the period.
C Net investment income (loss) is affected by the timing of the declaration of dividends by any underlying mutual funds or exchange-traded funds (ETFs). Net investment income (loss) of any mutual funds or ETFs is not included in the Fund's net investment income (loss) ratio.
D Net investment income per share reflects one or more large, non-recurring dividend(s) which amounted to $.03 per share. Excluding such non-recurring dividend(s), the ratio of net investment income (loss) to average net assets would have been .86%.
E Total returns for periods of less than one year are not annualized.
F Total returns would have been lower if certain expenses had not been reduced during the applicable periods shown.
G Fees and expenses of any underlying mutual funds or exchange-traded funds (ETFs) are not included in the Fund's expense ratio. The Fund indirectly bears its proportionate share of these expenses. For additional expense information related to investments in Fidelity Central Funds, please refer to the "Investments in Fidelity Central Funds" note found in the Notes to Financial Statements section of the most recent Annual or Semi-Annual report.
H Expense ratios reflect operating expenses of the class. Expenses before reductions do not reflect amounts reimbursed, waived, or reduced through arrangements with the investment adviser, brokerage services, or other offset arrangements, if applicable, and do not represent the amount paid by the class during periods when reimbursements, waivers or reductions occur.
I Annualized.
J Amount does not include the portfolio activity of any underlying mutual funds or exchange-traded funds (ETFs).
For the period ended April 30, 2023
1. Organization.
Fidelity Infrastructure Fund (the Fund) is a non-diversified fund of Fidelity Investment Trust (the Trust) and is authorized to issue an unlimited number of shares. Share transactions on the Statement of Changes in Net Assets may contain exchanges between affiliated funds. The Trust is registered under the Investment Company Act of 1940, as amended (the 1940 Act), as an open-end management investment company organized as a Massachusetts business trust.
2. Investments in Fidelity Central Funds.
Funds may invest in Fidelity Central Funds, which are open-end investment companies generally available only to other investment companies and accounts managed by the investment adviser and its affiliates. The Schedule of Investments lists any Fidelity Central Funds held as an investment as of period end, but does not include the underlying holdings of each Fidelity Central Fund. An investing fund indirectly bears its proportionate share of the expenses of the underlying Fidelity Central Funds.
Based on its investment objective, each Fidelity Central Fund may invest or participate in various investment vehicles or strategies that are similar to those of the investing fund. These strategies are consistent with the investment objectives of the investing fund and may involve certain economic risks which may cause a decline in value of each of the Fidelity Central Funds and thus a decline in the value of the investing fund.
| Fidelity Central Fund | Investment Manager | Investment Objective | Investment Practices | Expense Ratio A |
| Fidelity Money Market Central Funds | Fidelity Management & Research Company LLC (FMR) | Each fund seeks to obtain a high level of current income consistent with the preservation of capital and liquidity. | Short-term Investments | Less than .005% |
A Expenses expressed as a percentage of average net assets and are as of each underlying Central Fund's most recent annual or semi-annual shareholder report.
A complete unaudited list of holdings for each Fidelity Central Fund is available upon request or at the Securities and Exchange Commission website at www.sec.gov. In addition, the financial statements of the Fidelity Central Funds which contain the significant accounting policies (including investment valuation policies) of those funds, and are not covered by the Report of Independent Registered Public Accounting Firm, are available on the Securities and Exchange Commission website or upon request.
3. Significant Accounting Policies.
The Fund is an investment company and applies the accounting and reporting guidance of the Financial Accounting Standards Board (FASB) Accounting Standards Codification Topic 946 Financial Services - Investment Companies . The financial statements have been prepared in conformity with accounting principles generally accepted in the United States of America (GAAP), which require management to make certain estimates and assumptions at the date of the financial statements. Actual results could differ from those estimates. Subsequent events, if any, through the date that the financial statements were issued have been evaluated in the preparation of the financial statements. The Fund's Schedule of Investments lists any underlying mutual funds or exchange-traded funds (ETFs) but does not include the underlying holdings of these funds. The following summarizes the significant accounting policies of the Fund:
Investment Valuation. Investments are valued as of 4:00 p.m. Eastern time on the last calendar day of the period. The Board of Trustees (the Board) has designated the Fund's investment adviser as the valuation designee responsible for the fair valuation function and performing fair value determinations as needed. The investment adviser has established a Fair Value Committee (the Committee) to carry out the day-to-day fair valuation responsibilities and has adopted policies and procedures to govern the fair valuation process and the activities of the Committee. In accordance with these fair valuation policies and procedures, which have been approved by the Board, the Fund attempts to obtain prices from one or more third party pricing services or brokers to value its investments. When current market prices, quotations or currency exchange rates are not readily available or reliable, investments will be fair valued in good faith by the Committee, in accordance with the policies and procedures. Factors used in determining fair value vary by investment type and may include market or investment specific events, transaction data, estimated cash flows, and market observations of comparable investments. The frequency that the fair valuation procedures are used cannot be predicted and they may be utilized to a significant extent. The Committee manages the Fund's fair valuation practices and maintains the fair valuation policies and procedures. The Fund's investment adviser reports to the Board information regarding the fair valuation process and related material matters.
The Fund categorizes the inputs to valuation techniques used to value its investments into a disclosure hierarchy consisting of three levels as shown below:
Level 1 - unadjusted quoted prices in active markets for identical investments
Level 2 - other significant observable inputs (including quoted prices for similar investments, interest rates, prepayment speeds, etc.)
Level 3 - unobservable inputs (including the Fund's own assumptions based on the best information available)
Valuation techniques used to value the Fund's investments by major category are as follows:
Equity securities, including restricted securities, for which market quotations are readily available, are valued at the last reported sale price or official closing price as reported by a third party pricing service on the primary market or exchange on which they are traded and are categorized as Level 1 in the hierarchy. In the event there were no sales during the day or closing prices are not available, securities are valued at the last quoted bid price or may be valued using the last available price and are generally categorized as Level 2 in the hierarchy. For foreign equity securities, when market or security specific events arise, comparisons to the valuation of American Depositary Receipts (ADRs), futures contracts, ETFs and certain indexes as well as quoted prices for similar securities may be used and would be categorized as Level 2 in the hierarchy. For equity securities, including restricted securities, where observable inputs are limited, assumptions about market activity and risk are used and these securities may be categorized as Level 3 in the hierarchy.
Investments in open-end mutual funds, including the Fidelity Central Funds, are valued at their closing net asset value (NAV) each business day and are categorized as Level 1 in the hierarchy.
Changes in valuation techniques may result in transfers in or out of an assigned level within the disclosure hierarchy. The aggregate value of investments by input level as of April 30, 2023 is included at the end of the Fund's Schedule of Investments.
Foreign Currency. Certain Funds may use foreign currency contracts to facilitate transactions in foreign-denominated securities. Gains and losses from these transactions may arise from changes in the value of the foreign currency or if the counterparties do not perform under the contracts' terms.
Foreign-denominated assets, including investment securities, and liabilities are translated into U.S. dollars at the exchange rates at period end. Purchases and sales of investment securities, income and dividends received, and expenses denominated in foreign currencies are translated into U.S. dollars at the exchange rate in effect on the transaction date.
The effects of exchange rate fluctuations on investments are included with the net realized and unrealized gain (loss) on investment securities. Other foreign currency transactions resulting in realized and unrealized gain (loss) are disclosed separately.
Investment Transactions and Income. For financial reporting purposes, the Fund's investment holdings and NAV include trades executed through the end of the last business day of the period. The NAV per share for processing shareholder transactions is calculated as of the close of business of the New York Stock Exchange (NYSE), normally 4:00 p.m. Eastern time and includes trades executed through the end of the prior business day. Gains and losses on securities sold are determined on the basis of identified cost. Commissions paid to certain brokers with whom the investment adviser, or its affiliates, places trades on behalf of a fund include an amount in addition to trade execution, which may be rebated back to a fund. Any such rebates are included in net realized gain (loss) on investments in the Statement of Operations. Dividend income is recorded on the ex-dividend date, except for certain dividends from foreign securities where the ex-dividend date may have passed, which are recorded as soon as the Fund is informed of the ex-dividend date. Non-cash dividends included in dividend income, if any, are recorded at the fair market value of the securities received. Income and capital gain distributions from Fidelity Central Funds, if any, are recorded on the ex-dividend date. Certain distributions received by the Fund represent a return of capital or capital gain. The Fund determines the components of these distributions subsequent to the ex-dividend date, based upon receipt of tax filings or other correspondence relating to the underlying investment. These distributions are recorded as a reduction of cost of investments and/or as a realized gain. Interest income is accrued as earned and includes coupon interest and amortization of premium and accretion of discount on debt securities as applicable. Investment income is recorded net of foreign taxes withheld where recovery of such taxes is uncertain. Funds may file withholding tax reclaims in certain jurisdictions to recover a portion of amounts previously withheld. Any withholding tax reclaims income is included in the Statement of Operations in foreign taxes withheld. Any receivables for withholding tax reclaims are included in the Statement of Assets and Liabilities in dividends receivable.
Expenses. Expenses directly attributable to a fund are charged to that fund. Expenses attributable to more than one fund are allocated among the respective funds on the basis of relative net assets or other appropriate methods. Expenses included in the accompanying financial statements reflect the expenses of that fund and do not include any expenses associated with any underlying mutual funds or exchange-traded funds. Although not included in a fund's expenses, a fund indirectly bears its proportionate share of these expenses through the net asset value of each underlying mutual fund or exchange-traded fund. Expense estimates are accrued in the period to which they relate and adjustments are made when actual amounts are known.
Income Tax Information and Distributions to Shareholders. Each year, the Fund intends to qualify as a regulated investment company under Subchapter M of the Internal Revenue Code, including distributing substantially all of its taxable income and realized gains. As a result, no provision for U.S. Federal income taxes is required. The Fund files a U.S. federal tax return, in addition to state and local tax returns as required. The Fund's federal income tax returns are subject to examination by the Internal Revenue Service (IRS) for a period of three fiscal years after they are filed. State and local tax returns may be subject to examination for an additional fiscal year depending on the jurisdiction. Foreign taxes are provided for based on the Fund's understanding of the tax rules and rates that exist in the foreign markets in which it invests.
Distributions are declared and recorded on the ex-dividend date. Income and capital gain distributions are determined in accordance with income tax regulations, which may differ from GAAP.
Capital accounts within the financial statements are adjusted for permanent book-tax differences. These adjustments have no impact on net assets or the results of operations. Capital accounts are not adjusted for temporary book-tax differences which will reverse in a subsequent period.
Book-tax differences are primarily due to foreign currency transactions, partnerships, capital loss carryforwards and losses deferred due to wash sales.
As of period end, the cost and unrealized appreciation (depreciation) in securities, and derivatives if applicable, for federal income tax purposes were as follows:
| Gross unrealized appreciation | $6,669,034 |
| Gross unrealized depreciation | (1,399,162) |
| Net unrealized appreciation (depreciation) | $5,269,872 |
| Tax cost | $50,482,883 |
Capital loss carryforwards are only available to offset future capital gains of the Fund to the extent provided by regulations and may be limited. The capital loss carryforward information presented below, including any applicable limitation, is estimated as of prior fiscal period end and is subject to adjustment.
Restricted Securities (including Private Placements). Funds may invest in securities that are subject to legal or contractual restrictions on resale. These securities generally may be resold in transactions exempt from registration or to the public if the securities are registered. Disposal of these securities may involve time-consuming negotiations and expense, and prompt sale at an acceptable price may be difficult. Information regarding restricted securities held at period end is included at the end of the Schedule of Investments, if applicable.
4. Purchases and Sales of Investments.
Purchases and sales of securities, other than short-term securities and in-kind transactions, as applicable, are noted in the table below.
| | Purchases ($) | Sales ($) |
| Fidelity Infrastructure Fund | 25,558,616 | 14,874,047 |
5. Fees and Other Transactions with Affiliates.
Management Fee. Fidelity Management & Research Company LLC (the investment adviser) and its affiliates provide the Fund with investment management related services for which the Fund pays a monthly management fee. The management fee is the sum of an individual fund fee rate that is based on an annual rate of .45% of the Fund's average net assets and an annualized group fee rate that averaged .23% during the period. The group fee rate is based upon the monthly average net assets of a group of registered investment companies with which the investment adviser has management contracts. The group fee rate decreases as assets under management increase and increases as assets under management decrease. For the reporting period, the total annualized management fee rate was .68% of the Fund's average net assets.
Transfer Agent Fees. Fidelity Investments Institutional Operations Company LLC (FIIOC), an affiliate of the investment adviser, is the Fund's transfer, dividend disbursing and shareholder servicing agent. FIIOC receives account fees and asset-based fees that vary according to account size and type of account. FIIOC pays for typesetting, printing and mailing of shareholder reports, except proxy statements. For the period, the transfer agent fees were equivalent to an annualized rate of .25% of average net assets.
Accounting Fees. Fidelity Service Company, Inc. (FSC), an affiliate of the investment adviser, maintains the Fund's accounting records. The accounting fee is based on the level of average net assets for each month. For the period, the fees were equivalent to the following annualized rates:
| | % of Average Net Assets |
| Fidelity Infrastructure Fund | .04 |
Brokerage Commissions. A portion of portfolio transactions were placed with brokerage firms which are affiliates of the investment adviser. Brokerage commissions are included in net realized gain (loss) and change in net unrealized appreciation (depreciation) in the Statement of Operations. The commissions paid to these affiliated firms were as follows:
| | Amount |
| Fidelity Infrastructure Fund | $91 |
Interfund Trades. Funds may purchase from or sell securities to other Fidelity Funds under procedures adopted by the Board. The procedures have been designed to ensure these interfund trades are executed in accordance with Rule 17a-7 of the 1940 Act. Any interfund trades are included within the respective purchases and sales amounts shown in the Purchases and Sales of Investments note. Interfund trades during the period are noted in the table below.
| | Purchases ($) | Sales ($) | Realized Gain (Loss) ($) |
| Fidelity Infrastructure Fund | 586,206 | 168,238 | (77,455) |
6. Committed Line of Credit.
Certain Funds participate with other funds managed by the investment adviser or an affiliate in a $4.25 billion credit facility (the "line of credit") to be utilized for temporary or emergency purposes to fund shareholder redemptions or for other short-term liquidity purposes. The participating funds have agreed to pay commitment fees on their pro-rata portion of the line of credit, which are reflected in Miscellaneous expenses on the Statement of Operations, and are listed below. During the period, there were no borrowings on this line of credit.
| | Amount |
| Fidelity Infrastructure Fund | $44 |
7. Security Lending.
Funds lend portfolio securities from time to time in order to earn additional income. Lending agents are used, including National Financial Services (NFS), an affiliate of the investment adviser. Pursuant to a securities lending agreement, NFS will receive a fee, which is capped at 9.9% of a fund's daily lending revenue, for its services as lending agent. A fund may lend securities to certain qualified borrowers, including NFS. On the settlement date of the loan, a fund receives collateral (in the form of U.S. Treasury obligations, letters of credit and/or cash) against the loaned securities and maintains collateral in an amount not less than 100% of the market value of the loaned securities during the period of the loan. The market value of the loaned securities is determined at the close of business of a fund and any additional required collateral is delivered to a fund on the next business day. A fund or borrower may terminate the loan at any time, and if the borrower defaults on its obligation to return the securities loaned because of insolvency or other reasons, a fund may apply collateral received from the borrower against the obligation. A fund may experience delays and costs in recovering the securities loaned. Any cash collateral received is invested in the Fidelity Securities Lending Cash Central Fund. Any loaned securities are identified as such in the Schedule of Investments, and the value of loaned securities and cash collateral at period end, as applicable, are presented in the Statement of Assets and Liabilities. Security lending income represents the income earned on investing cash collateral, less rebates paid to borrowers and any lending agent fees associated with the loan, plus any premium payments received for lending certain types of securities. Security lending income is presented in the Statement of Operations as a component of income from Fidelity Central Funds. Affiliated security lending activity, if any, was as follows:
| | Total Security Lending Fees Paid to NFS | Security Lending Income From Securities Loaned to NFS | Value of Securities Loaned to NFS at Period End |
| Fidelity Infrastructure Fund | $97 | $- | $- |
8. Expense Reductions.
The investment adviser contractually agreed to reimburse the Fund to the extent annual operating expenses exceeded .95% of average net assets. This reimbursement will remain in place through February 29, 2024. Some expenses, for example the compensation of the independent Trustees, and certain miscellaneous expenses such as proxy and shareholder meeting expenses, are excluded from this reimbursement. During the period this reimbursement reduced the Fund's expenses by $43,714.
Through arrangements with the Fund's custodian, credits realized as a result of certain uninvested cash balances were used to reduce the Fund's expenses by $31.
In addition, during the period the investment adviser or an affiliate reimbursed and/or waived a portion of operating expenses in the amount of $1,051.
9. Other.
A fund's organizational documents provide former and current trustees and officers with a limited indemnification against liabilities arising in connection with the performance of their duties to the fund. In the normal course of business, a fund may also enter into contracts that provide general indemnifications. A fund's maximum exposure under these arrangements is unknown as this would be dependent on future claims that may be made against a fund. The risk of material loss from such claims is considered remote.
At the end of the period, the following mutual funds managed by the investment adviser or its affiliates were the owners of record of 10% or more of the total outstanding shares.
| | VIP FundsManager 60% Portfolio |
| Fidelity Infrastructure Fund | 11% |
Mutual funds managed by the investment adviser or its affiliates, in aggregate, were the owners of record of more than 20% of the total outstanding shares.
| Fund | % of shares held |
| Fidelity Infrastructure Fund | 26% |
10. Risk and Uncertainties.
Many factors affect a fund's performance. Developments that disrupt global economies and financial markets, such as pandemics, epidemics, outbreaks of infectious diseases, war, terrorism, and environmental disasters, may significantly affect a fund's investment performance. The effects of these developments to a fund will be impacted by the types of securities in which a fund invests, the financial condition, industry, economic sector, and geographic location of an issuer, and a fund's level of investment in the securities of that issuer. Significant concentrations in security types, issuers, industries, sectors, and geographic locations may magnify the factors that affect a fund's performance.
As a shareholder, you incur two types of costs: (1) transaction costs, which may include sales charges (loads) on purchase payments or redemption proceeds, as applicable and (2) ongoing costs, which generally include management fees, distribution and/or service (12b-1) fees and other Fund expenses. This Example is intended to help you understand your ongoing costs (in dollars) of investing in a fund and to compare these costs with the ongoing costs of investing in other mutual funds.
| The Example is based on an investment of $1,000 invested at the beginning of the period and held for the entire period (November 1, 2022 to April 30, 2023). |
Actual Expenses
The first line of the accompanying table provides information about actual account values and actual expenses. You may use the information in this line, together with the amount you invested, to estimate the expenses that you paid over the period. Simply divide your account value by $1,000.00 (for example, an $8,600 account value divided by $1,000.00 = 8.6), then multiply the result by the number in the first line for a class/Fund under the heading entitled "Expenses Paid During Period" to estimate the expenses you paid on your account during this period. If any fund is a shareholder of any underlying mutual funds or exchange-traded funds (ETFs) (the Underlying Funds), such fund indirectly bears its proportional share of the expenses of the Underlying Funds in addition to the direct expenses incurred presented in the table. These fees and expenses are not included in the annualized expense ratio used to calculate the expense estimate in the table below.
Hypothetical Example for Comparison Purposes
The second line of the accompanying table provides information about hypothetical account values and hypothetical expenses based on the actual expense ratio and an assumed rate of return of 5% per year before expenses, which is not the actual return. The hypothetical account values and expenses may not be used to estimate the actual ending account balance or expenses you paid for the period. You may use this information to compare the ongoing costs of investing in the Fund and other funds. To do so, compare this 5% hypothetical example with the 5% hypothetical examples that appear in the shareholder reports of the other funds. If any fund is a shareholder of any Underlying Funds, such fund indirectly bears its proportional share of the expenses of the Underlying Funds in addition to the direct expenses as presented in the table. These fees and expenses are not included in the annualized expense ratio used to calculate the expense estimate in the table below.
Please note that the expenses shown in the table are meant to highlight your ongoing costs only and do not reflect any transaction costs. Therefore, the second line of the table is useful in comparing ongoing costs only, and will not help you determine the relative total costs of owning different funds. In addition, if these transactional costs were included, your costs would have been higher.
| | | | | Annualized Expense Ratio- A | | Beginning Account Value November 1, 2022 | | Ending Account Value April 30, 2023 | | Expenses Paid During Period- C November 1, 2022 to April 30, 2023 |
| | | | | | | | | | |
| Fidelity® Infrastructure Fund | | | | .95% | | | | | | |
| Actual | | | | | | $ 1,000 | | $ 1,100.30 | | $ 4.95 |
Hypothetical- B | | | | | | $ 1,000 | | $ 1,020.08 | | $ 4.76 |
| |
A Annualized expense ratio reflects expenses net of applicable fee waivers.
B 5% return per year before expenses
C Expenses are equal to the annualized expense ratio, multiplied by the average account value over the period, multiplied by 181/ 365 (to reflect the one-half year period). The fees and expenses of any Underlying Funds are not included in each annualized expense ratio.
The Securities and Exchange Commission adopted Rule 22e-4 under the Investment Company Act of 1940 (the Liquidity Rule) to promote effective liquidity risk management throughout the open-end investment company industry, thereby reducing the risk that funds will be unable to meet their redemption obligations and mitigating dilution of the interests of fund shareholders.
The Fund has adopted and implemented a liquidity risk management program (the Program) reasonably designed to assess and manage the Fund's liquidity risk and to comply with the requirements of the Liquidity Rule. The Fund's Board of Trustees (the Board) has designated the Fund's investment adviser as administrator of the Program. The Fidelity advisers have established a Liquidity Risk Management Committee (the LRM Committee) to manage the Program for each of the Fidelity Funds. The LRM Committee monitors the adequacy and effectiveness of implementation of the Program and on a periodic basis assesses each Fund's liquidity risk based on a variety of factors including (1) the Fund's investment strategy, (2) portfolio liquidity and cash flow projections during normal and reasonably foreseeable stressed conditions, (3) shareholder redemptions, (4) borrowings and other funding sources and (5) certain factors specific to ETFs including the effect of the Fund's prices and spreads, market participants, and basket compositions on the overall liquidity of the Fund's portfolio, as applicable.
In accordance with the Program, each of the Fund's portfolio investments is classified into one of four defined liquidity categories based on a determination of a reasonable expectation for how long it would take to convert the investment to cash (or sell or dispose of the investment) without significantly changing its market value.
- Highly liquid investments - cash or convertible to cash within three business days or less
- Moderately liquid investments - convertible to cash in three to seven calendar days
- Less liquid investments - can be sold or disposed of, but not settled, within seven calendar days
- Illiquid investments - cannot be sold or disposed of within seven calendar days
Liquidity classification determinations take into account a variety of factors including various market, trading and investment-specific considerations, as well as market depth, and generally utilize analysis from a third-party liquidity metrics service.
The Liquidity Rule places a 15% limit on a fund's illiquid investments and requires funds that do not primarily hold assets that are highly liquid investments to determine and maintain a minimum percentage of the fund's net assets to be invested in highly liquid investments (highly liquid investment minimum or HLIM). The Program includes provisions reasonably designed to comply with the 15% limit on illiquid investments and for determining, periodically reviewing and complying with the HLIM requirement as applicable.
At a recent meeting of the Fund's Board of Trustees, the LRM Committee provided a written report to the Board pertaining to the operation, adequacy, and effectiveness of the Program for the period December 1, 2021 through November 30, 2022. The report concluded that the Program is operating effectively and is reasonably designed to assess and manage the Fund's liquidity risk.
1.9896236.103
ISF-SANN-0623
Fidelity® International Small Cap Fund
Semi-Annual Report
April 30, 2023
Includes Fidelity and Fidelity Advisor share classes
Contents
To view a fund's proxy voting guidelines and proxy voting record for the 12-month period ended June 30, visit http://www.fidelity.com/proxyvotingresults or visit the Securities and Exchange Commission's (SEC) web site at http://www.sec.gov.
You may also call 1-800-544-8544 if you're an individual investing directly with Fidelity, call 1-800-835-5092 if you're a plan sponsor or participant with Fidelity as your recordkeeper or call 1-877-208-0098 on institutional accounts or if you're an advisor or invest through one to request a free copy of the proxy voting guidelines.
Standard & Poor's, S&P and S&P 500 are registered service marks of The McGraw-Hill Companies, Inc. and have been licensed for use by Fidelity Distributors Corporation.
Other third-party marks appearing herein are the property of their respective owners.
All other marks appearing herein are registered or unregistered trademarks or service marks of FMR LLC or an affiliated company. © 2023 FMR LLC. All rights reserved.
This report and the financial statements contained herein are submitted for the general information of the shareholders of the Fund. This report is not authorized for distribution to prospective investors in the Fund unless preceded or accompanied by an effective prospectus.
A fund files its complete schedule of portfolio holdings with the SEC for the first and third quarters of each fiscal year on Form N-PORT. Forms N-PORT are available on the SEC's web site at http://www.sec.gov. A fund's Forms N-PORT may be reviewed and copied at the SEC's Public Reference Room in Washington, DC. Information regarding the operation of the SEC's Public Reference Room may be obtained by calling 1-800-SEC-0330.
For a complete list of a fund's portfolio holdings, view the most recent holdings listing, semiannual report, or annual report on Fidelity's web site at http://www.fidelity.com, http://www.institutional.fidelity.com, or http://www.401k.com, as applicable.
NOT FDIC INSURED •MAY LOSE VALUE •NO BANK GUARANTEE
Neither the Fund nor Fidelity Distributors Corporation is a bank.
Top Holdings (% of Fund's net assets) |
| |
| Rheinmetall AG (Germany, Aerospace & Defense) | 1.4 | |
| Renesas Electronics Corp. (Japan, Semiconductors & Semiconductor Equipment) | 1.2 | |
| Compania de Distribucion Integral Logista Holdings SA (Spain, Air Freight & Logistics) | 1.0 | |
| Talanx AG (Germany, Insurance) | 1.0 | |
| International Games Systems Co. Ltd. (Taiwan, Entertainment) | 1.0 | |
| Hiscox Ltd. (United Kingdom, Insurance) | 1.0 | |
| Gruma S.A.B. de CV Series B (Mexico, Food Products) | 1.0 | |
| Mytilineos SA (Greece, Industrial Conglomerates) | 1.0 | |
| John Wood Group PLC (United Kingdom, Energy Equipment & Services) | 0.9 | |
| Tate & Lyle PLC (United Kingdom, Food Products) | 0.9 | |
| | 10.4 | |
| |
| Market Sectors (% of Fund's net assets) |
| |
| Industrials | 21.6 | |
| Consumer Discretionary | 15.3 | |
| Financials | 11.2 | |
| Information Technology | 9.2 | |
| Consumer Staples | 9.1 | |
| Materials | 8.1 | |
| Real Estate | 6.5 | |
| Health Care | 6.4 | |
| Energy | 3.8 | |
| Communication Services | 3.6 | |
| Utilities | 0.6 | |
| |
Asset Allocation (% of Fund's net assets) |
|
|
Geographic Diversification (% of Fund's net assets) |
|
* Includes Short-Term investments and Net Other Assets (Liabilities). Percentages are adjusted for the effect of derivatives, if applicable. |
| |
Showing Percentage of Net Assets
| Common Stocks - 95.4% |
| | | Shares | Value ($) |
| Australia - 4.0% | | | |
| EBOS Group Ltd. | | 588,895 | 16,161,051 |
| Flight Centre Travel Group Ltd. (a)(b) | | 1,241,931 | 16,308,715 |
| GUD Holdings Ltd. | | 2,712,365 | 17,302,035 |
| Imdex Ltd. | | 12,363,179 | 17,083,897 |
| Inghams Group Ltd. | | 13,276,299 | 24,782,756 |
| Nanosonics Ltd. (a) | | 4,720,837 | 17,984,675 |
| National Storage REIT unit | | 8,318,658 | 13,855,398 |
| Servcorp Ltd. (c) | | 7,066,585 | 14,911,728 |
| SomnoMed Ltd. (a)(c) | | 4,189,521 | 2,541,251 |
TOTAL AUSTRALIA | | | 140,931,506 |
| Austria - 1.8% | | | |
| Mayr-Melnhof Karton AG (b) | | 203,100 | 32,360,886 |
| Strabag SE | | 224,397 | 9,779,254 |
| Wienerberger AG | | 700,100 | 21,060,317 |
TOTAL AUSTRIA | | | 63,200,457 |
| Belgium - 1.2% | | | |
| Econocom Group SA | | 4,361,695 | 14,971,163 |
| Fagron NV | | 1,510,500 | 28,062,120 |
TOTAL BELGIUM | | | 43,033,283 |
| Brazil - 1.4% | | | |
| Atacadao SA | | 5,200,000 | 11,207,346 |
| Hypera SA | | 3,944,700 | 29,459,897 |
| YDUQS Participacoes SA | | 5,099,500 | 8,301,845 |
TOTAL BRAZIL | | | 48,969,088 |
| Canada - 3.6% | | | |
| CCL Industries, Inc. Class B (b) | | 322,300 | 15,155,724 |
| Computer Modelling Group Ltd. | | 2,193,536 | 11,478,887 |
| ECN Capital Corp. | | 2,147,200 | 5,008,047 |
| Genesis Land Development Corp. (c) | | 4,033,799 | 5,984,379 |
| Lassonde Industries, Inc. Class A (sub. vtg.) | | 160,099 | 11,463,412 |
| McCoy Global, Inc. (a)(b) | | 1,327,470 | 1,508,878 |
| North West Co., Inc. | | 696,261 | 20,422,491 |
| Open Text Corp. | | 635,996 | 24,086,028 |
| Parkland Corp. | | 417,500 | 9,845,463 |
| Richelieu Hardware Ltd. | | 288,800 | 8,684,144 |
| Total Energy Services, Inc. | | 560,300 | 3,312,546 |
| VerticalScope Holdings, Inc. (a) | | 677,619 | 1,735,497 |
| Western Forest Products, Inc. | | 12,341,175 | 9,473,242 |
TOTAL CANADA | | | 128,158,738 |
| China - 4.4% | | | |
| Best Pacific International Holdings Ltd. | | 22,158,900 | 3,152,237 |
| Chervon Holdings Ltd. | | 2,520,800 | 12,828,031 |
| Far East Horizon Ltd. | | 24,099,000 | 21,679,995 |
| Far East Horizon Ltd. rights (a) | | 202,512 | 0 |
| Impro Precision Industries Ltd. (d) | | 20,906,300 | 7,753,816 |
| Precision Tsugami China Corp. Ltd. | | 9,358,453 | 9,080,377 |
| Qingdao Port International Co. Ltd. (H Shares) (d) | | 32,819,000 | 19,215,491 |
| Shenzhen YUTO Packaging Technology Co. Ltd. (A Shares) | | 4,544,166 | 16,678,741 |
| Sinopharm Group Co. Ltd. (H Shares) | | 6,564,000 | 23,251,514 |
| TravelSky Technology Ltd. (H Shares) | | 10,575,000 | 21,109,054 |
| Weifu High-Technology Group Co. Ltd. (B Shares) | | 6,863,386 | 9,291,210 |
| Xingda International Holdings Ltd. | | 63,233,353 | 12,986,168 |
TOTAL CHINA | | | 157,026,634 |
| Denmark - 0.5% | | | |
| Spar Nord Bank A/S | | 1,137,175 | 18,441,584 |
| Finland - 1.4% | | | |
| Huhtamaki Oyj | | 603,500 | 21,705,491 |
| Nanoform Finland PLC (a) | | 797,822 | 1,969,229 |
| Rovio Entertainment OYJ (d) | | 2,534,169 | 26,011,214 |
TOTAL FINLAND | | | 49,685,934 |
| France - 3.0% | | | |
| Altarea SCA | | 126,957 | 16,619,397 |
| Antin Infrastructure Partners SA | | 352,855 | 5,948,807 |
| ARGAN SA | | 230,400 | 17,974,545 |
| Elior SA (a)(d) | | 2,889,200 | 10,028,370 |
| Lectra | | 361,754 | 11,759,194 |
| Maisons du Monde SA (d) | | 1,033,507 | 10,875,744 |
| Thermador Groupe SA | | 308,166 | 31,919,403 |
TOTAL FRANCE | | | 105,125,460 |
| Germany - 4.9% | | | |
| DWS Group GmbH & Co. KGaA (d) | | 226,600 | 7,515,685 |
| JOST Werke AG (d) | | 416,020 | 22,966,463 |
| NORMA Group AG | | 623,692 | 14,789,539 |
| Rheinmetall AG | | 172,725 | 50,531,460 |
| Stabilus Se | | 301,700 | 19,680,639 |
| Takkt AG | | 1,279,912 | 20,478,065 |
| Talanx AG | | 712,867 | 35,787,751 |
TOTAL GERMANY | | | 171,749,602 |
| Greece - 1.0% | | | |
| Mytilineos SA | | 1,178,216 | 34,144,664 |
| Hong Kong - 1.8% | | | |
| ASMPT Ltd. | | 2,561,900 | 20,142,066 |
| China Metal Recycling (Holdings) Ltd. (a)(e) | | 436,800 | 1 |
| HKT Trust/HKT Ltd. unit | | 6,000,000 | 7,885,636 |
| Magnificent Hotel Investment Ltd. (a) | | 316,412,000 | 4,581,305 |
| Pico Far East Holdings Ltd. | | 61,300,071 | 10,336,599 |
| Sino Land Ltd. | | 11,082,375 | 14,934,296 |
| WH Group Ltd. (d) | | 13,480,500 | 7,505,117 |
TOTAL HONG KONG | | | 65,385,020 |
| Hungary - 0.9% | | | |
| Richter Gedeon PLC | | 1,330,000 | 32,095,841 |
| India - 1.5% | | | |
| Embassy Office Parks (REIT) | | 4,826,000 | 19,476,300 |
| IndusInd Bank Ltd. | | 1,181,800 | 16,752,908 |
| Shriram Transport Finance Co. Ltd. | | 1,040,252 | 17,018,959 |
TOTAL INDIA | | | 53,248,167 |
| Indonesia - 0.6% | | | |
| PT Avia Avian Tbk | | 194,018,300 | 7,938,376 |
| PT Selamat Sempurna Tbk | | 140,279,700 | 14,875,304 |
TOTAL INDONESIA | | | 22,813,680 |
| Ireland - 2.0% | | | |
| AerCap Holdings NV (a) | | 272,672 | 15,367,794 |
| Dalata Hotel Group PLC (a) | | 4,560,609 | 22,890,401 |
| Irish Residential Properties REIT PLC | | 14,359,200 | 16,328,719 |
| Mincon Group PLC (c) | | 13,529,844 | 14,461,279 |
TOTAL IRELAND | | | 69,048,193 |
| Italy - 2.3% | | | |
| Banca Generali SpA | | 538,500 | 17,854,598 |
| BFF Bank SpA (d) | | 2,405,056 | 23,109,144 |
| MARR SpA (a) | | 985,827 | 15,425,215 |
| Recordati SpA | | 552,011 | 25,382,728 |
TOTAL ITALY | | | 81,771,685 |
| Japan - 19.0% | | | |
| Amano Corp. | | 933,050 | 18,997,790 |
| Arcland Sakamoto Co. Ltd. | | 1,858,234 | 21,046,404 |
| ASKUL Corp. | | 1,486,200 | 19,806,316 |
| Capcom Co. Ltd. | | 595,900 | 22,392,498 |
| Central Automotive Products Ltd. | | 425,700 | 9,050,787 |
| DaikyoNishikawa Corp. | | 2,441,100 | 12,221,276 |
| Dexerials Corp. | | 745,600 | 14,189,202 |
| Dip Corp. | | 559,700 | 13,808,967 |
| Funai Soken Holdings, Inc. | | 1,074,600 | 20,599,630 |
| GMO Internet, Inc. | | 1,087,400 | 21,874,871 |
| Inaba Denki Sangyo Co. Ltd. | | 1,066,600 | 23,823,548 |
| Isuzu Motors Ltd. | | 1,545,900 | 18,255,569 |
| Justsystems Corp. | | 388,300 | 10,260,829 |
| Kamigumi Co. Ltd. | | 1,276,900 | 27,984,364 |
| Kansai Electric Power Co., Inc. | | 1,900,000 | 20,509,960 |
| LIXIL Group Corp. (b) | | 878,600 | 13,830,078 |
| Maruwa Ceramic Co. Ltd. | | 157,000 | 20,021,421 |
| Meitec Corp. | | 912,100 | 15,412,634 |
| Minebea Mitsumi, Inc. | | 1,035,000 | 19,166,792 |
| Mitani Shoji Co. Ltd. | | 862,200 | 8,491,229 |
| Nishimoto Co. Ltd. | | 348,500 | 9,927,652 |
| NOF Corp. | | 440,800 | 20,140,795 |
| NSD Co. Ltd. | | 1,198,000 | 22,038,868 |
| PALTAC Corp. | | 664,200 | 25,483,296 |
| Park24 Co. Ltd. (a) | | 730,800 | 11,296,035 |
| Persol Holdings Co. Ltd. | | 1,070,500 | 22,073,084 |
| Relo Group, Inc. | | 700,000 | 10,882,472 |
| Renesas Electronics Corp. (a) | | 3,289,700 | 42,872,848 |
| Roland Corp. | | 691,600 | 20,731,322 |
| S Foods, Inc. | | 1,137,623 | 25,310,172 |
| San-Ai Obbli Co. Ltd. | | 2,212,800 | 23,314,138 |
| Ship Healthcare Holdings, Inc. | | 1,384,400 | 24,420,574 |
| Sumco Corp. | | 1,188,900 | 16,373,122 |
| TIS, Inc. | | 646,700 | 17,758,204 |
| TKC Corp. | | 286,800 | 7,751,449 |
| Tsuruha Holdings, Inc. | | 299,100 | 19,589,774 |
TOTAL JAPAN | | | 671,707,970 |
| Korea (South) - 1.7% | | | |
| Hyundai Fire & Marine Insurance Co. Ltd. | | 519,796 | 14,608,897 |
| Soulbrain Co. Ltd. | | 150,700 | 24,806,946 |
| Vitzrocell Co. Ltd. (c) | | 1,472,541 | 19,587,443 |
TOTAL KOREA (SOUTH) | | | 59,003,286 |
| Mexico - 4.2% | | | |
| Bolsa Mexicana de Valores S.A.B. de CV | | 10,462,482 | 23,130,991 |
| GCC S.A.B. de CV | | 2,790,200 | 22,181,000 |
| Genomma Lab Internacional SA de CV | | 17,396,561 | 14,455,609 |
| Gruma S.A.B. de CV Series B | | 2,206,400 | 34,536,397 |
| Grupo Comercial Chedraui S.A.B. de CV | | 4,884,400 | 28,872,551 |
| Qualitas Controladora S.A.B. de CV | | 3,581,235 | 23,673,060 |
TOTAL MEXICO | | | 146,849,608 |
| Netherlands - 1.3% | | | |
| Acomo NV | | 832,199 | 20,449,102 |
| Arcadis NV | | 387,250 | 15,984,586 |
| Van Lanschot Kempen NV (Bearer) | | 283,041 | 8,592,373 |
TOTAL NETHERLANDS | | | 45,026,061 |
| Norway - 1.4% | | | |
| Europris ASA (d) | | 3,112,200 | 22,267,443 |
| Selvaag Bolig ASA | | 2,186,000 | 7,466,456 |
| Sparebanken Midt-Norge | | 1,494,876 | 19,329,356 |
TOTAL NORWAY | | | 49,063,255 |
| Peru - 0.4% | | | |
| Intercorp Financial Services, Inc. | | 683,100 | 15,280,947 |
| Philippines - 1.3% | | | |
| Century Pacific Food, Inc. | | 56,692,400 | 26,440,433 |
| Robinsons Land Corp. | | 71,319,100 | 18,575,519 |
TOTAL PHILIPPINES | | | 45,015,952 |
| Romania - 0.5% | | | |
| Banca Transilvania SA | | 4,015,712 | 17,193,969 |
| Singapore - 1.9% | | | |
| Boustead Singapore Ltd. | | 13,008,812 | 7,854,295 |
| HRnetgroup Ltd. | | 29,161,800 | 16,403,998 |
| Mapletree Industrial (REIT) | | 13,547,731 | 24,218,161 |
| The Hour Glass Ltd. | | 12,996,880 | 20,315,715 |
TOTAL SINGAPORE | | | 68,792,169 |
| Spain - 3.7% | | | |
| Cie Automotive SA | | 811,100 | 24,417,280 |
| Compania de Distribucion Integral Logista Holdings SA | | 1,321,900 | 35,919,796 |
| Grupo Catalana Occidente SA | | 697,922 | 22,532,879 |
| Indra Sistemas SA | | 1,848,677 | 24,444,686 |
| Prosegur Compania de Seguridad SA (Reg.) | | 6,646,781 | 12,758,561 |
| Viscofan Envolturas Celulosicas SA | | 170,300 | 11,672,052 |
TOTAL SPAIN | | | 131,745,254 |
| Sweden - 1.4% | | | |
| Granges AB | | 1,892,076 | 18,782,291 |
| Haypp Group (a) | | 1,154,900 | 4,099,284 |
| HEXPOL AB (B Shares) | | 1,785,500 | 21,014,997 |
| Nordnet AB | | 376,000 | 5,895,710 |
TOTAL SWEDEN | | | 49,792,282 |
| Switzerland - 0.6% | | | |
| Anhui Heli Co. Ltd. ELS (UBS AG London Branch Bank Warrant Programme) Class A warrants 1/5/24 (a)(d) | | 8,014,256 | 23,013,228 |
| Taiwan - 3.2% | | | |
| International Games Systems Co. Ltd. | | 2,037,000 | 35,550,205 |
| Lumax International Corp. Ltd. | | 4,537,292 | 10,585,328 |
| Sporton International, Inc. | | 1,873,312 | 16,145,713 |
| Test Research, Inc. | | 7,513,000 | 15,740,730 |
| Tripod Technology Corp. | | 4,318,000 | 16,175,353 |
| Yageo Corp. | | 804,578 | 13,033,860 |
| Yung Chi Paint & Varnish Manufacturing Co. Ltd. | | 2,538,000 | 6,132,601 |
TOTAL TAIWAN | | | 113,363,790 |
| Thailand - 0.5% | | | |
| Star Petroleum Refining PCL (For. Reg.) | | 66,737,300 | 19,053,637 |
| United Kingdom - 15.4% | | | |
| Alliance Pharma PLC | | 17,288,027 | 13,839,926 |
| Ashtead Technology Holdings PLC (c) | | 7,272,000 | 31,164,283 |
| B&M European Value Retail SA | | 4,416,300 | 26,624,238 |
| Bodycote PLC | | 1,873,371 | 16,256,849 |
| DCC PLC (United Kingdom) | | 300,000 | 18,640,116 |
| Direct Line Insurance Group PLC | | 6,000,000 | 12,943,268 |
| Grainger Trust PLC | | 6,417,566 | 20,856,804 |
| Harbour Energy PLC | | 4,257,094 | 13,230,804 |
| Hiscox Ltd. | | 2,334,148 | 34,673,267 |
| Informa PLC | | 2,750,933 | 24,981,981 |
| J.D. Wetherspoon PLC (a) | | 1,919,100 | 17,196,340 |
| Jet2 PLC | | 1,677,500 | 25,846,509 |
| John Wood Group PLC (a) | | 11,802,800 | 33,433,963 |
| LSL Property Services PLC | | 4,204,235 | 14,318,752 |
| Luxfer Holdings PLC sponsored | | 1,027,759 | 15,673,325 |
| Mears Group PLC (c) | | 7,921,714 | 22,051,685 |
| On The Beach Group PLC (a)(d) | | 6,731,236 | 11,166,515 |
| Pets At Home Group PLC | | 2,610,700 | 12,651,525 |
| Premier Foods PLC | | 12,699,400 | 20,013,804 |
| Rathbone Brothers PLC | | 487,700 | 11,976,398 |
| RS GROUP PLC | | 2,171,153 | 25,141,289 |
| Sabre Insurance Group PLC (d) | | 9,562,200 | 15,189,861 |
| Savills PLC | | 1,177,500 | 14,228,499 |
| Tate & Lyle PLC | | 3,183,043 | 32,602,358 |
| Ten Entertainment Group PLC (c) | | 5,931,311 | 20,051,731 |
| Vistry Group PLC | | 1,657,298 | 16,297,983 |
| WH Smith PLC | | 1,103,900 | 21,836,516 |
TOTAL UNITED KINGDOM | | | 542,888,589 |
| United States of America - 2.6% | | | |
| Adient PLC (a) | | 490,800 | 18,130,152 |
| Adtalem Global Education, Inc. (a) | | 527,500 | 21,400,675 |
| Antero Resources Corp. (a) | | 920,100 | 21,153,099 |
| RHI Magnesita NV | | 1,054,291 | 29,944,553 |
TOTAL UNITED STATES OF AMERICA | | | 90,628,479 |
| TOTAL COMMON STOCKS (Cost $3,161,563,832) | | | 3,373,248,012 |
| | | | |
| Money Market Funds - 2.1% |
| | | Shares | Value ($) |
| Fidelity Cash Central Fund 4.88% (f) | | 67,561,136 | 67,574,648 |
| Fidelity Securities Lending Cash Central Fund 4.88% (f)(g) | | 7,397,719 | 7,398,459 |
| TOTAL MONEY MARKET FUNDS (Cost $74,973,106) | | | 74,973,107 |
| | | | |
| TOTAL INVESTMENT IN SECURITIES - 97.5% (Cost $3,236,536,938) | 3,448,221,119 |
NET OTHER ASSETS (LIABILITIES) - 2.5% | 87,687,470 |
| NET ASSETS - 100.0% | 3,535,908,589 |
| | |
Security Type Abbreviations
| ELS | - | EQUITY-LINKED SECURITY |
Legend
| (b) | Security or a portion of the security is on loan at period end. |
| (d) | Security exempt from registration under Rule 144A of the Securities Act of 1933. These securities may be resold in transactions exempt from registration, normally to qualified institutional buyers. At the end of the period, the value of these securities amounted to $206,618,091 or 5.8% of net assets. |
| (f) | Affiliated fund that is generally available only to investment companies and other accounts managed by Fidelity Investments. The rate quoted is the annualized seven-day yield of the fund at period end. A complete unaudited listing of the fund's holdings as of its most recent quarter end is available upon request. In addition, each Fidelity Central Fund's financial statements are available on the SEC's website or upon request. |
| (g) | Investment made with cash collateral received from securities on loan. |
Affiliated Central Funds
Fiscal year to date information regarding the Fund's investments in Fidelity Central Funds, including the ownership percentage, is presented below.
| Affiliate | Value, beginning of period ($) | Purchases ($) | Sales Proceeds ($) | Dividend Income ($) | Realized Gain (loss) ($) | Change in Unrealized appreciation (depreciation) ($) | Value, end of period ($) | % ownership, end of period |
| Fidelity Cash Central Fund 4.88% | - | 191,911,753 | 124,337,106 | 706,541 | - | 1 | 67,574,648 | 0.2% |
| Fidelity Securities Lending Cash Central Fund 4.88% | 28,602,852 | 107,993,297 | 129,197,690 | 82,162 | - | - | 7,398,459 | 0.0% |
| Total | 28,602,852 | 299,905,050 | 253,534,796 | 788,703 | - | 1 | 74,973,107 | |
| | | | | | | | | |
Amounts in the dividend income column in the above table include any capital gain distributions from underlying funds, which are presented in the corresponding line item in the Statement of Operations, if applicable.
Amounts in the dividend income column for Fidelity Securities Lending Cash Central Fund represents the income earned on investing cash collateral, less rebates paid to borrowers and any lending agent fees associated with the loan, plus any premium payments received for lending certain types of securities.
Amounts included in the purchases and sales proceeds columns may include in-kind transactions, if applicable.
Other Affiliated Issuers
An affiliated company is a company in which the Fund has ownership of at least 5% of the voting securities. Fiscal year to date transactions with companies which are or were affiliates are presented in the table below. Certain corporate actions, such as mergers, are excluded from the amounts in this table if applicable. A dash in the Value end of period ($) column means either the issuer is no longer held at period end, or the issuer is held at period end but is no longer an affiliate.
| Affiliate | Value, beginning of period ($) | Purchases ($) | Sales Proceeds ($) | Dividend Income ($) | Realized Gain (loss) ($) | Change in Unrealized appreciation (depreciation) ($) | Value, end of period ($) |
| Ashtead Technology Holdings PLC | 19,751,365 | 1,332,382 | - | - | - | 10,080,536 | 31,164,283 |
| Genesis Land Development Corp. | 5,655,343 | - | - | 192,186 | - | 329,036 | 5,984,379 |
| Mears Group PLC | 17,260,781 | - | - | - | - | 4,790,904 | 22,051,685 |
| Mincon Group PLC | 13,237,160 | - | - | 31,849 | - | 1,224,119 | 14,461,279 |
| Servcorp Ltd. | 15,413,681 | - | - | 477,383 | - | (501,953) | 14,911,728 |
| SomnoMed Ltd. | 3,698,161 | - | - | - | - | (1,156,910) | 2,541,251 |
| Ten Entertainment Group PLC | 14,590,349 | - | - | - | - | 5,461,382 | 20,051,731 |
| Vitzrocell Co. Ltd. | 12,328,605 | - | - | 191,205 | - | 7,258,838 | 19,587,443 |
| Total | 101,935,445 | 1,332,382 | - | 892,623 | - | 27,485,952 | 130,753,779 |
Amounts included in the purchases and sales proceeds columns may include in-kind transactions, if applicable.
Investment Valuation
The following is a summary of the inputs used, as of April 30, 2023, involving the Fund's assets and liabilities carried at fair value. The inputs or methodology used for valuing securities may not be an indication of the risk associated with investing in those securities. For more information on valuation inputs, and their aggregation into the levels used below, please refer to the Investment Valuation section in the accompanying Notes to Financial Statements.
| Valuation Inputs at Reporting Date: |
| Description | Total ($) | Level 1 ($) | Level 2 ($) | Level 3 ($) |
Investments in Securities: | | | | |
|
| Equities: | | | | |
Communication Services | 128,893,630 | 52,728,692 | 76,164,938 | - |
Consumer Discretionary | 527,580,786 | 268,236,042 | 259,344,744 | - |
Consumer Staples | 320,220,632 | 206,664,728 | 113,555,904 | - |
Energy | 136,331,415 | 93,963,640 | 42,367,775 | - |
Financials | 394,138,454 | 324,077,695 | 70,060,759 | - |
Health Care | 229,624,415 | 145,265,350 | 84,359,065 | - |
Industrials | 776,117,202 | 462,239,703 | 313,877,499 | - |
Information Technology | 324,740,235 | 75,261,071 | 249,479,164 | - |
Materials | 284,459,858 | 191,678,501 | 92,781,356 | 1 |
Real Estate | 230,631,425 | 113,777,551 | 116,853,874 | - |
Utilities | 20,509,960 | - | 20,509,960 | - |
|
| Money Market Funds | 74,973,107 | 74,973,107 | - | - |
| Total Investments in Securities: | 3,448,221,119 | 2,008,866,080 | 1,439,355,038 | 1 |
| Statement of Assets and Liabilities |
| | | | April 30, 2023 (Unaudited) |
| | | | | |
| Assets | | | | |
| Investment in securities, at value (including securities loaned of $6,357,538) - See accompanying schedule: | | | | |
Unaffiliated issuers (cost $3,030,263,303) | $ | 3,242,494,233 | | |
Fidelity Central Funds (cost $74,973,106) | | 74,973,107 | | |
Other affiliated issuers (cost $131,300,529) | | 130,753,779 | | |
| | | | | |
| | | | | |
| Total Investment in Securities (cost $3,236,536,938) | | | $ | 3,448,221,119 |
| Foreign currency held at value (cost $84,431,301) | | | | 84,432,541 |
| Receivable for investments sold | | | | 386 |
| Receivable for fund shares sold | | | | 3,344,408 |
| Dividends receivable | | | | 13,789,061 |
| Reclaims receivable | | | | 2,439,687 |
| Distributions receivable from Fidelity Central Funds | | | | 291,037 |
| Prepaid expenses | | | | 1,252 |
| Other receivables | | | | 14,936 |
Total assets | | | | 3,552,534,427 |
| Liabilities | | | | |
| Payable for investments purchased | $ | 2,374,360 | | |
| Payable for fund shares redeemed | | 2,084,087 | | |
| Accrued management fee | | 2,756,167 | | |
| Distribution and service plan fees payable | | 43,836 | | |
| Other affiliated payables | | 504,224 | | |
| Other payables and accrued expenses | | 1,468,800 | | |
| Collateral on securities loaned | | 7,394,364 | | |
| Total Liabilities | | | | 16,625,838 |
| Net Assets | | | $ | 3,535,908,589 |
| Net Assets consist of: | | | | |
| Paid in capital | | | $ | 3,415,963,907 |
| Total accumulated earnings (loss) | | | | 119,944,682 |
| Net Assets | | | $ | 3,535,908,589 |
| | | | | |
| Net Asset Value and Maximum Offering Price | | | | |
| Class A : | | | | |
Net Asset Value and redemption price per share ($118,245,777 ÷ 4,122,499 shares) (a) | | | $ | 28.68 |
| Maximum offering price per share (100/94.25 of $28.68) | | | $ | 30.43 |
| Class M : | | | | |
Net Asset Value and redemption price per share ($17,265,357 ÷ 604,611 shares) (a) | | | $ | 28.56 |
| Maximum offering price per share (100/96.50 of $28.56) | | | $ | 29.60 |
| Class C : | | | | |
Net Asset Value and offering price per share ($14,887,531 ÷ 541,359 shares) (a) | | | $ | 27.50 |
| International Small Cap : | | | | |
Net Asset Value , offering price and redemption price per share ($1,475,189,645 ÷ 50,333,294 shares) | | | $ | 29.31 |
| Class I : | | | | |
Net Asset Value , offering price and redemption price per share ($843,091,408 ÷ 28,563,772 shares) | | | $ | 29.52 |
| Class Z : | | | | |
Net Asset Value , offering price and redemption price per share ($1,067,228,871 ÷ 36,200,928 shares) | | | $ | 29.48 |
(a)Redemption price per share is equal to net asset value less any applicable contingent deferred sales charge. |
| Statement of Operations |
| | | | Six months ended April 30, 2023 (Unaudited) |
| Investment Income | | | | |
| Dividends (including $892,623 earned from affiliated issuers) | | | $ | 40,226,643 |
| Income from Fidelity Central Funds (including $82,162 from security lending) | | | | 788,703 |
| Income before foreign taxes withheld | | | $ | 41,015,346 |
| Less foreign taxes withheld | | | | (4,073,904) |
| Total Income | | | | 36,941,442 |
| Expenses | | | | |
| Management fee | | | | |
| Basic fee | $ | 13,588,257 | | |
| Performance adjustment | | 759,518 | | |
| Transfer agent fees | | 2,213,519 | | |
| Distribution and service plan fees | | 249,678 | | |
| Accounting fees | | 675,286 | | |
| Custodian fees and expenses | | 215,050 | | |
| Independent trustees' fees and expenses | | 10,227 | | |
| Registration fees | | 112,429 | | |
| Audit | | 56,283 | | |
| Legal | | 2,426 | | |
| Interest | | 29,538 | | |
| Miscellaneous | | 6,919 | | |
| Total expenses before reductions | | 17,919,130 | | |
| Expense reductions | | (76,188) | | |
| Total expenses after reductions | | | | 17,842,942 |
| Net Investment income (loss) | | | | 19,098,500 |
| Realized and Unrealized Gain (Loss) | | | | |
| Net realized gain (loss) on: | | | | |
| Investment Securities: | | | | |
| Unaffiliated issuers (net of foreign taxes of $50,382) | | (38,045,782) | | |
| Foreign currency transactions | | 4,055,809 | | |
| Total net realized gain (loss) | | | | (33,989,973) |
| Change in net unrealized appreciation (depreciation) on: | | | | |
| Investment Securities: | | | | |
| Unaffiliated issuers(net of increase in deferred foreign taxes of $33,190) | | 585,034,120 | | |
| Fidelity Central Funds | | 1 | | |
| Other affiliated issuers | | 27,485,952 | | |
| Assets and liabilities in foreign currencies | | 477,800 | | |
| Total change in net unrealized appreciation (depreciation) | | | | 612,997,873 |
| Net gain (loss) | | | | 579,007,900 |
| Net increase (decrease) in net assets resulting from operations | | | $ | 598,106,400 |
| Statement of Changes in Net Assets |
| |
| | Six months ended April 30, 2023 (Unaudited) | | Year ended October 31, 2022 |
| Increase (Decrease) in Net Assets | | | | |
| Operations | | | | |
| Net investment income (loss) | $ | 19,098,500 | $ | 78,961,606 |
| Net realized gain (loss) | | (33,989,973) | | (56,580,886) |
| Change in net unrealized appreciation (depreciation) | | 612,997,873 | | (993,174,796) |
| Net increase (decrease) in net assets resulting from operations | | 598,106,400 | | (970,794,076) |
| Distributions to shareholders | | (22,796,062) | | (242,362,167) |
| Share transactions - net increase (decrease) | | 29,385,298 | | 612,399,770 |
| Total increase (decrease) in net assets | | 604,695,636 | | (600,756,473) |
| | | | | |
| Net Assets | | | | |
| Beginning of period | | 2,931,212,953 | | 3,531,969,426 |
| End of period | $ | 3,535,908,589 | $ | 2,931,212,953 |
| | | | | |
| | | | | |
Financial Highlights
| Fidelity Advisor® International Small Cap Fund Class A |
| |
| | Six months ended (Unaudited) April 30, 2023 | | Years ended October 31, 2022 | | 2021 | | 2020 | | 2019 | | 2018 |
Selected Per-Share Data | | | | | | | | | | | | |
| Net asset value, beginning of period | $ | 23.88 | $ | 34.31 | $ | 24.75 | $ | 26.32 | $ | 25.78 | $ | 29.24 |
| Income from Investment Operations | | | | | | | | | | | | |
Net investment income (loss) A,B | | .12 | | .58 | | .31 | | .27 | | .49 | | .38 |
| Net realized and unrealized gain (loss) | | 4.79 | | (8.74) | | 9.42 | | (1.26) | | 1.43 | | (2.87) |
| Total from investment operations | | 4.91 | | (8.16) | | 9.73 | | (.99) | | 1.92 | | (2.49) |
| Distributions from net investment income | | (.11) | | (.75) | | (.17) | | (.44) | | (.38) | | (.23) |
| Distributions from net realized gain | | - | | (1.52) | | - | | (.14) | | (1.00) | | (.74) |
| Total distributions | | (.11) | | (2.27) | | (.17) | | (.58) | | (1.38) | | (.97) |
Redemption fees added to paid in capital A | | - | | - | | - | | - | | - | | - C |
| Net asset value, end of period | $ | 28.68 | $ | 23.88 | $ | 34.31 | $ | 24.75 | $ | 26.32 | $ | 25.78 |
Total Return D,E,F | | 20.61% | | (25.19)% | | 39.43% | | (3.91)% | | 8.00% | | (8.83)% |
Ratios to Average Net Assets B,G,H | | | | | | | | | | | | |
| Expenses before reductions | | 1.38% I | | 1.29% | | 1.29% | | 1.36% | | 1.47% | | 1.49% |
| Expenses net of fee waivers, if any | | 1.38% I | | 1.29% | | 1.29% | | 1.36% | | 1.47% | | 1.49% |
| Expenses net of all reductions | | 1.38% I | | 1.29% | | 1.29% | | 1.35% | | 1.46% | | 1.48% |
| Net investment income (loss) | | .87% I | | 2.06% | | .95% | | 1.09% | | 1.94% | | 1.33% |
| Supplemental Data | | | | | | | | | | | | |
| Net assets, end of period (000 omitted) | $ | 118,246 | $ | 95,906 | $ | 136,131 | $ | 92,044 | $ | 105,786 | $ | 80,395 |
Portfolio turnover rate J | | 11% I | | 17% | | 28% | | 43% | | 28% | | 25% |
A Calculated based on average shares outstanding during the period.
B Net investment income (loss) is affected by the timing of the declaration of dividends by any underlying mutual funds or exchange-traded funds (ETFs). Net investment income (loss) of any mutual funds or ETFs is not included in the Fund's net investment income (loss) ratio.
C Amount represents less than $.005 per share.
D Total returns for periods of less than one year are not annualized.
E Total returns would have been lower if certain expenses had not been reduced during the applicable periods shown.
F Total returns do not include the effect of the sales charges.
G Fees and expenses of any underlying mutual funds or exchange-traded funds (ETFs) are not included in the Fund's expense ratio. The Fund indirectly bears its proportionate share of these expenses. For additional expense information related to investments in Fidelity Central Funds, please refer to the "Investments in Fidelity Central Funds" note found in the Notes to Financial Statements section of the most recent Annual or Semi-Annual report.
H Expense ratios reflect operating expenses of the class. Expenses before reductions do not reflect amounts reimbursed, waived, or reduced through arrangements with the investment adviser, brokerage services, or other offset arrangements, if applicable, and do not represent the amount paid by the class during periods when reimbursements, waivers or reductions occur.
I Annualized.
J Amount does not include the portfolio activity of any underlying mutual funds or exchange-traded funds (ETFs).
| Fidelity Advisor® International Small Cap Fund Class M |
| |
| | Six months ended (Unaudited) April 30, 2023 | | Years ended October 31, 2022 | | 2021 | | 2020 | | 2019 | | 2018 |
Selected Per-Share Data | | | | | | | | | | | | |
| Net asset value, beginning of period | $ | 23.73 | $ | 34.12 | $ | 24.62 | $ | 26.18 | $ | 25.62 | $ | 29.07 |
| Income from Investment Operations | | | | | | | | | | | | |
Net investment income (loss) A,B | | .08 | | .50 | | .22 | | .19 | | .41 | | .30 |
| Net realized and unrealized gain (loss) | | 4.79 | | (8.70) | | 9.38 | | (1.25) | | 1.43 | | (2.86) |
| Total from investment operations | | 4.87 | | (8.20) | | 9.60 | | (1.06) | | 1.84 | | (2.56) |
| Distributions from net investment income | | (.04) | | (.66) | | (.10) | | (.36) | | (.27) | | (.15) |
| Distributions from net realized gain | | - | | (1.52) | | - | | (.14) | | (1.00) | | (.74) |
| Total distributions | | (.04) | | (2.19) C | | (.10) | | (.50) | | (1.28) C | | (.89) |
Redemption fees added to paid in capital A | | - | | - | | - | | - | | - | | - D |
| Net asset value, end of period | $ | 28.56 | $ | 23.73 | $ | 34.12 | $ | 24.62 | $ | 26.18 | $ | 25.62 |
Total Return E,F,G | | 20.52% | | (25.43)% | | 39.07% | | (4.19)% | | 7.65% | | (9.10)% |
Ratios to Average Net Assets B,H,I | | | | | | | | | | | | |
| Expenses before reductions | | 1.66% J | | 1.57% | | 1.57% | | 1.67% | | 1.78% | | 1.77% |
| Expenses net of fee waivers, if any | | 1.65% J | | 1.56% | | 1.57% | | 1.67% | | 1.78% | | 1.77% |
| Expenses net of all reductions | | 1.65% J | | 1.56% | | 1.57% | | 1.65% | | 1.77% | | 1.76% |
| Net investment income (loss) | | .60% J | | 1.79% | | .68% | | .78% | | 1.62% | | 1.05% |
| Supplemental Data | | | | | | | | | | | | |
| Net assets, end of period (000 omitted) | $ | 17,265 | $ | 13,761 | $ | 19,926 | $ | 12,492 | $ | 16,013 | $ | 16,362 |
Portfolio turnover rate K | | 11% J | | 17% | | 28% | | 43% | | 28% | | 25% |
A Calculated based on average shares outstanding during the period.
B Net investment income (loss) is affected by the timing of the declaration of dividends by any underlying mutual funds or exchange-traded funds (ETFs). Net investment income (loss) of any mutual funds or ETFs is not included in the Fund's net investment income (loss) ratio.
C Total distributions per share do not sum due to rounding.
D Amount represents less than $.005 per share.
E Total returns for periods of less than one year are not annualized.
F Total returns would have been lower if certain expenses had not been reduced during the applicable periods shown.
G Total returns do not include the effect of the sales charges.
H Fees and expenses of any underlying mutual funds or exchange-traded funds (ETFs) are not included in the Fund's expense ratio. The Fund indirectly bears its proportionate share of these expenses. For additional expense information related to investments in Fidelity Central Funds, please refer to the "Investments in Fidelity Central Funds" note found in the Notes to Financial Statements section of the most recent Annual or Semi-Annual report.
I Expense ratios reflect operating expenses of the class. Expenses before reductions do not reflect amounts reimbursed, waived, or reduced through arrangements with the investment adviser, brokerage services, or other offset arrangements, if applicable, and do not represent the amount paid by the class during periods when reimbursements, waivers or reductions occur.
J Annualized.
K Amount does not include the portfolio activity of any underlying mutual funds or exchange-traded funds (ETFs).
| Fidelity Advisor® International Small Cap Fund Class C |
| |
| | Six months ended (Unaudited) April 30, 2023 | | Years ended October 31, 2022 | | 2021 | | 2020 | | 2019 | | 2018 |
Selected Per-Share Data | | | | | | | | | | | | |
| Net asset value, beginning of period | $ | 22.88 | $ | 32.93 | $ | 23.80 | $ | 25.27 | $ | 24.77 | $ | 28.21 |
| Income from Investment Operations | | | | | | | | | | | | |
Net investment income (loss) A,B | | .01 | | .35 | | .06 | | .08 | | .28 | | .16 |
| Net realized and unrealized gain (loss) | | 4.61 | | (8.40) | | 9.07 | | (1.23) | | 1.39 | | (2.76) |
| Total from investment operations | | 4.62 | | (8.05) | | 9.13 | | (1.15) | | 1.67 | | (2.60) |
| Distributions from net investment income | | - | | (.48) | | - | | (.18) | | (.17) | | (.10) |
| Distributions from net realized gain | | - | | (1.52) | | - | | (.14) | | (1.00) | | (.74) |
| Total distributions | | - | | (2.00) | | - | | (.32) | | (1.17) | | (.84) |
Redemption fees added to paid in capital A | | - | | - | | - | | - | | - | | - C |
| Net asset value, end of period | $ | 27.50 | $ | 22.88 | $ | 32.93 | $ | 23.80 | $ | 25.27 | $ | 24.77 |
Total Return D,E,F | | 20.19% | | (25.77)% | | 38.36% | | (4.65)% | | 7.17% | | (9.51)% |
Ratios to Average Net Assets B,G,H | | | | | | | | | | | | |
| Expenses before reductions | | 2.15% I | | 2.06% | | 2.05% | | 2.13% | | 2.24% | | 2.24% |
| Expenses net of fee waivers, if any | | 2.15% I | | 2.05% | | 2.05% | | 2.13% | | 2.24% | | 2.24% |
| Expenses net of all reductions | | 2.15% I | | 2.05% | | 2.05% | | 2.11% | | 2.23% | | 2.23% |
| Net investment income (loss) | | .10% I | | 1.30% | | .19% | | .32% | | 1.16% | | .58% |
| Supplemental Data | | | | | | | | | | | | |
| Net assets, end of period (000 omitted) | $ | 14,888 | $ | 13,556 | $ | 21,683 | $ | 17,659 | $ | 23,937 | $ | 41,918 |
Portfolio turnover rate J | | 11% I | | 17% | | 28% | | 43% | | 28% | | 25% |
A Calculated based on average shares outstanding during the period.
B Net investment income (loss) is affected by the timing of the declaration of dividends by any underlying mutual funds or exchange-traded funds (ETFs). Net investment income (loss) of any mutual funds or ETFs is not included in the Fund's net investment income (loss) ratio.
C Amount represents less than $.005 per share.
D Total returns for periods of less than one year are not annualized.
E Total returns would have been lower if certain expenses had not been reduced during the applicable periods shown.
F Total returns do not include the effect of the contingent deferred sales charge.
G Fees and expenses of any underlying mutual funds or exchange-traded funds (ETFs) are not included in the Fund's expense ratio. The Fund indirectly bears its proportionate share of these expenses. For additional expense information related to investments in Fidelity Central Funds, please refer to the "Investments in Fidelity Central Funds" note found in the Notes to Financial Statements section of the most recent Annual or Semi-Annual report.
H Expense ratios reflect operating expenses of the class. Expenses before reductions do not reflect amounts reimbursed, waived, or reduced through arrangements with the investment adviser, brokerage services, or other offset arrangements, if applicable, and do not represent the amount paid by the class during periods when reimbursements, waivers or reductions occur.
I Annualized.
J Amount does not include the portfolio activity of any underlying mutual funds or exchange-traded funds (ETFs).
| Fidelity® International Small Cap Fund |
| |
| | Six months ended (Unaudited) April 30, 2023 | | Years ended October 31, 2022 | | 2021 | | 2020 | | 2019 | | 2018 |
Selected Per-Share Data | | | | | | | | | | | | |
| Net asset value, beginning of period | $ | 24.43 | $ | 35.05 | $ | 25.28 | $ | 26.86 | $ | 26.29 | $ | 29.77 |
| Income from Investment Operations | | �� | | | | | | | | | | |
Net investment income (loss) A,B | | .16 | | .67 | | .41 | | .34 | | .57 | | .48 |
| Net realized and unrealized gain (loss) | | 4.91 | | (8.94) | | 9.61 | | (1.27) | | 1.45 | | (2.93) |
| Total from investment operations | | 5.07 | | (8.27) | | 10.02 | | (.93) | | 2.02 | | (2.45) |
| Distributions from net investment income | | (.19) | | (.83) | | (.25) | | (.51) | | (.45) | | (.29) |
| Distributions from net realized gain | | - | | (1.52) | | - | | (.14) | | (1.00) | | (.74) |
| Total distributions | | (.19) | | (2.35) | | (.25) | | (.65) | | (1.45) | | (1.03) |
Redemption fees added to paid in capital A | | - | | - | | - | | - | | - | | - C |
| Net asset value, end of period | $ | 29.31 | $ | 24.43 | $ | 35.05 | $ | 25.28 | $ | 26.86 | $ | 26.29 |
Total Return D,E | | 20.81% | | (25.01)% | | 39.83% | | (3.61)% | | 8.27% | | (8.54)% |
Ratios to Average Net Assets B,F,G | | | | | | | | | | | | |
| Expenses before reductions | | 1.12% H | | 1.02% | | 1.01% | | 1.08% | | 1.19% | | 1.20% |
| Expenses net of fee waivers, if any | | 1.11% H | | 1.02% | | 1.01% | | 1.08% | | 1.19% | | 1.20% |
| Expenses net of all reductions | | 1.11% H | | 1.02% | | 1.01% | | 1.07% | | 1.18% | | 1.19% |
| Net investment income (loss) | | 1.14% H | | 2.33% | | 1.23% | | 1.37% | | 2.22% | | 1.62% |
| Supplemental Data | | | | | | | | | | | | |
| Net assets, end of period (000 omitted) | $ | 1,475,189 | $ | 1,145,773 | $ | 1,534,214 | $ | 1,122,746 | $ | 1,282,412 | $ | 1,256,193 |
Portfolio turnover rate I | | 11% H | | 17% | | 28% | | 43% | | 28% | | 25% |
A Calculated based on average shares outstanding during the period.
B Net investment income (loss) is affected by the timing of the declaration of dividends by any underlying mutual funds or exchange-traded funds (ETFs). Net investment income (loss) of any mutual funds or ETFs is not included in the Fund's net investment income (loss) ratio.
C Amount represents less than $.005 per share.
D Total returns for periods of less than one year are not annualized.
E Total returns would have been lower if certain expenses had not been reduced during the applicable periods shown.
F Fees and expenses of any underlying mutual funds or exchange-traded funds (ETFs) are not included in the Fund's expense ratio. The Fund indirectly bears its proportionate share of these expenses. For additional expense information related to investments in Fidelity Central Funds, please refer to the "Investments in Fidelity Central Funds" note found in the Notes to Financial Statements section of the most recent Annual or Semi-Annual report.
G Expense ratios reflect operating expenses of the class. Expenses before reductions do not reflect amounts reimbursed, waived, or reduced through arrangements with the investment adviser, brokerage services, or other offset arrangements, if applicable, and do not represent the amount paid by the class during periods when reimbursements, waivers or reductions occur.
H Annualized.
I Amount does not include the portfolio activity of any underlying mutual funds or exchange-traded funds (ETFs).
| Fidelity Advisor® International Small Cap Fund Class I |
| |
| | Six months ended (Unaudited) April 30, 2023 | | Years ended October 31, 2022 | | 2021 | | 2020 | | 2019 | | 2018 |
Selected Per-Share Data | | | | | | | | | | | | |
| Net asset value, beginning of period | $ | 24.60 | $ | 35.27 | $ | 25.44 | $ | 27.03 | $ | 26.45 | $ | 29.97 |
| Income from Investment Operations | | | | | | | | | | | | |
Net investment income (loss) A,B | | .16 | | .68 | | .41 | | .35 | | .58 | | .47 |
| Net realized and unrealized gain (loss) | | 4.94 | | (8.99) | | 9.67 | | (1.28) | | 1.46 | | (2.95) |
| Total from investment operations | | 5.10 | | (8.31) | | 10.08 | | (.93) | | 2.04 | | (2.48) |
| Distributions from net investment income | | (.18) | | (.84) | | (.25) | | (.52) | | (.46) | | (.30) |
| Distributions from net realized gain | | - | | (1.52) | | - | | (.14) | | (1.00) | | (.74) |
| Total distributions | | (.18) | | (2.36) | | (.25) | | (.66) | | (1.46) | | (1.04) |
Redemption fees added to paid in capital A | | - | | - | | - | | - | | - | | - C |
| Net asset value, end of period | $ | 29.52 | $ | 24.60 | $ | 35.27 | $ | 25.44 | $ | 27.03 | $ | 26.45 |
Total Return D,E | | 20.81% | | (24.98)% | | 39.80% | | (3.62)% | | 8.28% | | (8.58)% |
Ratios to Average Net Assets B,F,G | | | | | | | | | | | | |
| Expenses before reductions | | 1.11% H | | 1.02% | | 1.02% | | 1.08% | | 1.19% | | 1.21% |
| Expenses net of fee waivers, if any | | 1.11% H | | 1.01% | | 1.02% | | 1.08% | | 1.18% | | 1.21% |
| Expenses net of all reductions | | 1.11% H | | 1.01% | | 1.02% | | 1.06% | | 1.18% | | 1.20% |
| Net investment income (loss) | | 1.14% H | | 2.34% | | 1.22% | | 1.38% | | 2.22% | | 1.61% |
| Supplemental Data | | | | | | | | | | | | |
| Net assets, end of period (000 omitted) | $ | 843,091 | $ | 696,515 | $ | 1,080,258 | $ | 605,100 | $ | 777,771 | $ | 564,988 |
Portfolio turnover rate I | | 11% H | | 17% | | 28% | | 43% | | 28% | | 25% |
A Calculated based on average shares outstanding during the period.
B Net investment income (loss) is affected by the timing of the declaration of dividends by any underlying mutual funds or exchange-traded funds (ETFs). Net investment income (loss) of any mutual funds or ETFs is not included in the Fund's net investment income (loss) ratio.
C Amount represents less than $.005 per share.
D Total returns for periods of less than one year are not annualized.
E Total returns would have been lower if certain expenses had not been reduced during the applicable periods shown.
F Fees and expenses of any underlying mutual funds or exchange-traded funds (ETFs) are not included in the Fund's expense ratio. The Fund indirectly bears its proportionate share of these expenses. For additional expense information related to investments in Fidelity Central Funds, please refer to the "Investments in Fidelity Central Funds" note found in the Notes to Financial Statements section of the most recent Annual or Semi-Annual report.
G Expense ratios reflect operating expenses of the class. Expenses before reductions do not reflect amounts reimbursed, waived, or reduced through arrangements with the investment adviser, brokerage services, or other offset arrangements, if applicable, and do not represent the amount paid by the class during periods when reimbursements, waivers or reductions occur.
H Annualized.
I Amount does not include the portfolio activity of any underlying mutual funds or exchange-traded funds (ETFs).
| Fidelity Advisor® International Small Cap Fund Class Z |
| |
| | Six months ended (Unaudited) April 30, 2023 | | Years ended October 31, 2022 | | 2021 | | 2020 | | 2019 | | 2018 A |
Selected Per-Share Data | | | | | | | | | | | | |
| Net asset value, beginning of period | $ | 24.59 | $ | 35.26 | $ | 25.43 | $ | 27.03 | $ | 26.46 | $ | 28.78 |
| Income from Investment Operations | | | | | | | | | | | | |
Net investment income (loss) B,C | | .18 | | .70 | | .45 | | .38 | | .61 | | .03 |
| Net realized and unrealized gain (loss) | | 4.93 | | (8.97) | | 9.67 | | (1.28) | | 1.47 | | (2.35) |
| Total from investment operations | | 5.11 | | (8.27) | | 10.12 | | (.90) | | 2.08 | | (2.32) |
| Distributions from net investment income | | (.22) | | (.88) | | (.29) | | (.56) | | (.50) | | - |
| Distributions from net realized gain | | - | | (1.52) | | - | | (.14) | | (1.00) | | - |
| Total distributions | | (.22) | | (2.40) | | (.29) | | (.70) | | (1.51) D | | - |
| Net asset value, end of period | $ | 29.48 | $ | 24.59 | $ | 35.26 | $ | 25.43 | $ | 27.03 | $ | 26.46 |
Total Return E,F | | 20.88% | | (24.89)% | | 39.99% | | (3.51)% | | 8.44% | | (8.06)% |
Ratios to Average Net Assets C,G,H | | | | | | | | | | | | |
| Expenses before reductions | | .98% I | | .89% | | .89% | | .94% | | 1.05% | | 1.15% I |
| Expenses net of fee waivers, if any | | .98% I | | .89% | | .89% | | .94% | | 1.05% | | 1.15% I |
| Expenses net of all reductions | | .98% I | | .89% | | .89% | | .93% | | 1.04% | | 1.14% I |
| Net investment income (loss) | | 1.27% I | | 2.47% | | 1.35% | | 1.51% | | 2.35% | | 2.01% I |
| Supplemental Data | | | | | | | | | | | | |
| Net assets, end of period (000 omitted) | $ | 1,067,229 | $ | 965,701 | $ | 739,757 | $ | 275,127 | $ | 245,252 | $ | 7,421 |
Portfolio turnover rate J | | 11% I | | 17% | | 28% | | 43% | | 28% | | 25% |
A For the period October 2, 2018 (commencement of sale of shares) through October 31, 2018.
B Calculated based on average shares outstanding during the period.
C Net investment income (loss) is affected by the timing of the declaration of dividends by any underlying mutual funds or exchange-traded funds (ETFs). Net investment income (loss) of any mutual funds or ETFs is not included in the Fund's net investment income (loss) ratio.
D Total distributions per share do not sum due to rounding.
E Total returns for periods of less than one year are not annualized.
F Total returns would have been lower if certain expenses had not been reduced during the applicable periods shown.
G Fees and expenses of any underlying mutual funds or exchange-traded funds (ETFs) are not included in the Fund's expense ratio. The Fund indirectly bears its proportionate share of these expenses. For additional expense information related to investments in Fidelity Central Funds, please refer to the "Investments in Fidelity Central Funds" note found in the Notes to Financial Statements section of the most recent Annual or Semi-Annual report.
H Expense ratios reflect operating expenses of the class. Expenses before reductions do not reflect amounts reimbursed, waived, or reduced through arrangements with the investment adviser, brokerage services, or other offset arrangements, if applicable, and do not represent the amount paid by the class during periods when reimbursements, waivers or reductions occur.
I Annualized.
J Amount does not include the portfolio activity of any underlying mutual funds or exchange-traded funds (ETFs).
For the period ended April 30, 2023
1. Organization.
Fidelity International Small Cap Fund (the Fund) is a fund of Fidelity Investment Trust (the Trust) and is authorized to issue an unlimited number of shares. The Trust is registered under the Investment Company Act of 1940, as amended (the 1940 Act), as an open-end management investment company organized as a Massachusetts business trust. The Fund offers Class A, Class M, Class C, International Small Cap, Class I and Class Z shares, each of which has equal rights as to assets and voting privileges. Class A, Class M, Class C, Class I and Class Z are Fidelity Advisor classes. Each class has exclusive voting rights with respect to matters that affect that class. Class C shares will automatically convert to Class A shares after a holding period of eight years from the initial date of purchase, with certain exceptions. The Fund's investments in emerging markets can be subject to social, economic, regulatory, and political uncertainties and can be extremely volatile.
2. Investments in Fidelity Central Funds.
Funds may invest in Fidelity Central Funds, which are open-end investment companies generally available only to other investment companies and accounts managed by the investment adviser and its affiliates. The Schedule of Investments lists any Fidelity Central Funds held as an investment as of period end, but does not include the underlying holdings of each Fidelity Central Fund. An investing fund indirectly bears its proportionate share of the expenses of the underlying Fidelity Central Funds.
Based on its investment objective, each Fidelity Central Fund may invest or participate in various investment vehicles or strategies that are similar to those of the investing fund. These strategies are consistent with the investment objectives of the investing fund and may involve certain economic risks which may cause a decline in value of each of the Fidelity Central Funds and thus a decline in the value of the investing fund.
| Fidelity Central Fund | Investment Manager | Investment Objective | Investment Practices | Expense Ratio A |
| Fidelity Money Market Central Funds | Fidelity Management & Research Company LLC (FMR) | Each fund seeks to obtain a high level of current income consistent with the preservation of capital and liquidity. | Short-term Investments | Less than .005% |
A Expenses expressed as a percentage of average net assets and are as of each underlying Central Fund's most recent annual or semi-annual shareholder report.
A complete unaudited list of holdings for each Fidelity Central Fund is available upon request or at the Securities and Exchange Commission website at www.sec.gov. In addition, the financial statements of the Fidelity Central Funds which contain the significant accounting policies (including investment valuation policies) of those funds, and are not covered by the Report of Independent Registered Public Accounting Firm, are available on the Securities and Exchange Commission website or upon request.
3. Significant Accounting Policies.
The Fund is an investment company and applies the accounting and reporting guidance of the Financial Accounting Standards Board (FASB) Accounting Standards Codification Topic 946 Financial Services - Investment Companies . The financial statements have been prepared in conformity with accounting principles generally accepted in the United States of America (GAAP), which require management to make certain estimates and assumptions at the date of the financial statements. Actual results could differ from those estimates. Subsequent events, if any, through the date that the financial statements were issued have been evaluated in the preparation of the financial statements. The Fund's Schedule of Investments lists any underlying mutual funds or exchange-traded funds (ETFs) but does not include the underlying holdings of these funds. The following summarizes the significant accounting policies of the Fund:
Investment Valuation. Investments are valued as of 4:00 p.m. Eastern time on the last calendar day of the period. The Board of Trustees (the Board) has designated the Fund's investment adviser as the valuation designee responsible for the fair valuation function and performing fair value determinations as needed. The investment adviser has established a Fair Value Committee (the Committee) to carry out the day-to-day fair valuation responsibilities and has adopted policies and procedures to govern the fair valuation process and the activities of the Committee. In accordance with these fair valuation policies and procedures, which have been approved by the Board, the Fund attempts to obtain prices from one or more third party pricing services or brokers to value its investments. When current market prices, quotations or currency exchange rates are not readily available or reliable, investments will be fair valued in good faith by the Committee, in accordance with the policies and procedures. Factors used in determining fair value vary by investment type and may include market or investment specific events, transaction data, estimated cash flows, and market observations of comparable investments. The frequency that the fair valuation procedures are used cannot be predicted and they may be utilized to a significant extent. The Committee manages the Fund's fair valuation practices and maintains the fair valuation policies and procedures. The Fund's investment adviser reports to the Board information regarding the fair valuation process and related material matters.
The Fund categorizes the inputs to valuation techniques used to value its investments into a disclosure hierarchy consisting of three levels as shown below:
Level 1 - unadjusted quoted prices in active markets for identical investments
Level 2 - other significant observable inputs (including quoted prices for similar investments, interest rates, prepayment speeds, etc.)
Level 3 - unobservable inputs (including the Fund's own assumptions based on the best information available)
Valuation techniques used to value the Fund's investments by major category are as follows:
Equity securities, including restricted securities, for which market quotations are readily available, are valued at the last reported sale price or official closing price as reported by a third party pricing service on the primary market or exchange on which they are traded and are categorized as Level 1 in the hierarchy. In the event there were no sales during the day or closing prices are not available, securities are valued at the last quoted bid price or may be valued using the last available price and are generally categorized as Level 2 in the hierarchy. For foreign equity securities, when market or security specific events arise, comparisons to the valuation of American Depositary Receipts (ADRs), futures contracts, Exchange-Traded Funds (ETFs) and certain indexes as well as quoted prices for similar securities may be used and would be categorized as Level 2 in the hierarchy. For equity securities, including restricted securities, where observable inputs are limited, assumptions about market activity and risk are used and these securities may be categorized as Level 3 in the hierarchy.
Investments in open-end mutual funds, including the Fidelity Central Funds, are valued at their closing net asset value (NAV) each business day and are categorized as Level 1 in the hierarchy.
Changes in valuation techniques may result in transfers in or out of an assigned level within the disclosure hierarchy. The aggregate value of investments by input level as of April 30, 2023, is included at the end of the Fund's Schedule of Investments.
Foreign Currency. Certain Funds may use foreign currency contracts to facilitate transactions in foreign-denominated securities. Gains and losses from these transactions may arise from changes in the value of the foreign currency or if the counterparties do not perform under the contracts' terms.
Foreign-denominated assets, including investment securities, and liabilities are translated into U.S. dollars at the exchange rates at period end. Purchases and sales of investment securities, income and dividends received, and expenses denominated in foreign currencies are translated into U.S. dollars at the exchange rate in effect on the transaction date.
The effects of exchange rate fluctuations on investments are included with the net realized and unrealized gain (loss) on investment securities. Other foreign currency transactions resulting in realized and unrealized gain (loss) are disclosed separately.
Investment Transactions and Income. For financial reporting purposes, the Fund's investment holdings and NAV include trades executed through the end of the last business day of the period. The NAV per share for processing shareholder transactions is calculated as of the close of business of the New York Stock Exchange (NYSE), normally 4:00 p.m. Eastern time and includes trades executed through the end of the prior business day. Gains and losses on securities sold are determined on the basis of identified cost and include proceeds received from litigation. Commissions paid to certain brokers with whom the investment adviser, or its affiliates, places trades on behalf of a fund include an amount in addition to trade execution, which may be rebated back to a fund. Any such rebates are included in net realized gain (loss) on investments in the Statement of Operations. Dividend income is recorded on the ex-dividend date, except for certain dividends from foreign securities where the ex-dividend date may have passed, which are recorded as soon as the Fund is informed of the ex-dividend date. Non-cash dividends included in dividend income, if any, are recorded at the fair market value of the securities received. Income and capital gain distributions from Fidelity Central Funds, if any, are recorded on the ex-dividend date. Investment income is recorded net of foreign taxes withheld where recovery of such taxes is uncertain. Funds may file withholding tax reclaims in certain jurisdictions to recover a portion of amounts previously withheld. Any withholding tax reclaims income is included in the Statement of Operations in foreign taxes withheld. Any receivables for withholding tax reclaims are included in the Statement of Assets and Liabilities in reclaims receivable.
Class Allocations and Expenses. Investment income, realized and unrealized capital gains and losses, common expenses of a fund, and certain fund-level expense reductions, if any, are allocated daily on a pro-rata basis to each class based on the relative net assets of each class to the total net assets of a fund. Each class differs with respect to transfer agent and distribution and service plan fees incurred, as applicable. Certain expense reductions may also differ by class, if applicable. For the reporting period, the allocated portion of income and expenses to each class as a percent of its average net assets may vary due to the timing of recording these transactions in relation to fluctuating net assets of the classes. Expenses directly attributable to a fund are charged to that fund. Expenses attributable to more than one fund are allocated among the respective funds on the basis of relative net assets or other appropriate methods. Expenses included in the accompanying financial statements reflect the expenses of that fund and do not include any expenses associated with any underlying mutual funds or exchange-traded funds. Although not included in a fund's expenses, a fund indirectly bears its proportionate share of these expenses through the net asset value of each underlying mutual fund or exchange-traded fund. Expense estimates are accrued in the period to which they relate and adjustments are made when actual amounts are known.
Income Tax Information and Distributions to Shareholders. Each year, the Fund intends to qualify as a regulated investment company under Subchapter M of the Internal Revenue Code, including distributing substantially all of its taxable income and realized gains. As a result, no provision for U.S. Federal income taxes is required. The Fund files a U.S. federal tax return, in addition to state and local tax returns as required. The Fund's federal income tax returns are subject to examination by the Internal Revenue Service (IRS) for a period of three fiscal years after they are filed. State and local tax returns may be subject to examination for an additional fiscal year depending on the jurisdiction. Foreign taxes are provided for based on the Fund's understanding of the tax rules and rates that exist in the foreign markets in which it invests. The Fund is subject to a tax imposed on capital gains by certain countries in which it invests. An estimated deferred tax liability for net unrealized appreciation on the applicable securities is included in Other payables and accrued expenses on the Statement of Assets & Liabilities.
Distributions are declared and recorded on the ex-dividend date. Income and capital gain distributions are declared separately for each class. Income and capital gain distributions are determined in accordance with income tax regulations, which may differ from GAAP.
Capital accounts within the financial statements are adjusted for permanent book-tax differences. These adjustments have no impact on net assets or the results of operations. Capital accounts are not adjusted for temporary book-tax differences which will reverse in a subsequent period.
Book-tax differences are primarily due to foreign currency transactions, passive foreign investment companies (PFIC), capital loss carryforwards, certain foreign taxes and losses deferred due to wash sales.
As of period end, the cost and unrealized appreciation (depreciation) in securities, and derivatives if applicable, for federal income tax purposes were as follows:
| Gross unrealized appreciation | $625,078,945 |
| Gross unrealized depreciation | (440,930,953) |
| Net unrealized appreciation (depreciation) | $184,147,992 |
| Tax cost | $3,264,073,127 |
Capital loss carryforwards are only available to offset future capital gains of the Fund to the extent provided by regulations and may be limited. The capital loss carryforward information presented below, including any applicable limitation, is estimated as of prior fiscal period end and is subject to adjustment.
Short-term | $(27,055,387) |
Long-term | (15,013,621) |
| Total capital loss carryforward | $(42,069,008) |
Restricted Securities (including Private Placements). Funds may invest in securities that are subject to legal or contractual restrictions on resale. These securities generally may be resold in transactions exempt from registration or to the public if the securities are registered. Disposal of these securities may involve time-consuming negotiations and expense, and prompt sale at an acceptable price may be difficult. Information regarding restricted securities held at period end is included at the end of the Schedule of Investments, if applicable.
New Accounting Pronouncement. In June 2022, the Financial Accounting Standards Board (FASB) issued Accounting Standards Update (ASU) 2022-03 Fair Value Measurement (Topic 820): Fair Value Measurement of Equity Securities Subject to Contractual Sale Restrictions. The amendments in this ASU clarify that a contractual restriction on the sale of an equity security is not considered part of the unit of account of the equity security and, therefore, is not considered in measuring fair value. They also clarify that an entity cannot, as a separate unit of account, recognize and measure a contractual sale restriction. They also require additional disclosures for equity securities subject to contractual sale restrictions. ASU 2022-03 will be effective for fiscal years, including interim periods within those fiscal years, beginning after December 15, 2023, and allows for early adoption. ASU 2022-03 will only be applicable to an equity security in which the contractual arrangement that restricts its sale is executed or modified on or after the adoption date. Management is currently evaluating the potential impact of ASU 2022-03 to the financial statements.
4. Purchases and Sales of Investments.
Purchases and sales of securities, other than short-term securities, in-kind transactions, as applicable, are noted in the table below.
| | Purchases ($) | Sales ($) |
| Fidelity International Small Cap Fund | 174,130,769 | 242,689,527 |
5. Fees and Other Transactions with Affiliates.
Management Fee. Fidelity Management & Research Company LLC (the investment adviser) and its affiliates provide the Fund with investment management related services for which the Fund pays a monthly management fee. The management fee is the sum of an individual fund fee rate that is based on an annual rate of .60% of the Fund's average net assets and an annualized group fee rate that averaged .23% during the period. The group fee rate is based upon the monthly average net assets of a group of registered investment companies with which the investment adviser has management contracts. The group fee rate decreases as assets under management increase and increases as assets under management decrease. In addition, the management fee is subject to a performance adjustment (up to a maximum of +/- .20% of the Fund's average net assets over a 36 month performance period). The upward or downward adjustment to the management fee is based on the relative investment performance of International Small Cap as compared to its benchmark index, the MSCI ACWI (All Country World Index) ex USA Small Cap Index, over the same 36 month performance period. For the reporting period, the total annualized management fee rate, including the performance adjustment, was .87% of the Fund's average net assets. The performance adjustment included in the management fee rate may be higher or lower than the maximum performance adjustment rate due to the difference between the average net assets for the reporting and performance periods.
Distribution and Service Plan Fees. In accordance with Rule 12b-1 of the 1940 Act, the Fund has adopted separate Distribution and Service Plans for each class of shares. Certain classes pay Fidelity Distributors Company LLC (FDC), an affiliate of the investment adviser, separate Distribution and Service Fees, each of which is based on an annual percentage of each class' average net assets. In addition, FDC may pay financial intermediaries for selling shares of the Fund and providing shareholder support services. For the period, the Distribution and Service Fee rates, total fees and amounts retained by FDC were as follows:
| | Distribution Fee | Service Fee | Total Fees | Retained by FDC |
| Class A | - % | .25% | $136,564 | $2,570 |
| Class M | .25% | .25% | 39,446 | 506 |
| Class C | .75% | .25% | 73,668 | 5,968 |
| | | | $249,678 | $9,044 |
Sales Load. FDC may receive a front-end sales charge of up to 5.75% for selling Class A shares and 3.50% for selling Class M shares, some of which is paid to financial intermediaries for selling shares of the Fund. Depending on the holding period, FDC may receive contingent deferred sales charges levied on Class A, Class M and Class C redemptions. The deferred sales charges are 1.00% for Class C shares, 1.00% for certain purchases of Class A shares and .25% for certain purchases of Class M shares.
For the period, sales charge amounts retained by FDC were as follows:
| | Retained by FDC |
| Class A | $17,567 |
| Class M | 748 |
Class C A | 2,039 |
| | $20,354 |
A When Class C shares are initially sold, FDC pays commissions from its own resources to financial intermediaries through which the sales are made.
Transfer Agent Fees. Fidelity Investments Institutional Operations Company LLC (FIIOC), an affiliate of the investment adviser, is the transfer, dividend disbursing and shareholder servicing agent for each class of the Fund. FIIOC receives account fees and asset-based fees that vary according to the account size and type of account of the shareholders of the respective classes of the Fund, except for Class Z. FIIOC receives an asset-based fee of Class Z's average net assets. FIIOC pays for typesetting, printing and mailing of shareholder reports, except proxy statements.
For the period, transfer agent fees for each class were as follows:
| | Amount | % of Class-Level Average Net Assets A |
| Class A | $105,675 | .19 |
| Class M | 17,171 | .22 |
| Class C | 15,339 | .21 |
| International Small Cap | 1,196,490 | .18 |
| Class I | 668,035 | .17 |
| Class Z | 210,809 | .04 |
| | $2,213,519 | |
A Annualized
Accounting Fees. Fidelity Service Company, Inc. (FSC), an affiliate of the investment adviser, maintains the Fund's accounting records. The accounting fee is based on the level of average net assets for each month. For the period, the fees were equivalent to the following annualized rates:
| | % of Average Net Assets |
| Fidelity International Small Cap Fund | .04 |
Brokerage Commissions. A portion of portfolio transactions were placed with brokerage firms which are affiliates of the investment adviser. Brokerage commissions are included in net realized gain (loss) and change in net unrealized appreciation (depreciation) in the Statement of Operations. The commissions paid to these affiliated firms were as follows:
| | Amount |
| Fidelity International Small Cap Fund | $898 |
Interfund Lending Program. Pursuant to an Exemptive Order issued by the Securities and Exchange Commission (the SEC), the Fund, along with other registered investment companies having management contracts with Fidelity Management & Research Company LLC (FMR), or other affiliated entities of FMR, may participate in an interfund lending program. This program provides an alternative credit facility allowing the Fund to borrow from, or lend money to, other participating affiliated funds. At period end, there were no interfund loans outstanding. Activity in this program during the period for which loans were outstanding was as follows:
| | Borrower or Lender | Average Loan Balance | Weighted Average Interest Rate | Interest Expense |
Fidelity International Small Cap Fund . | Borrower | $ 10,391,750 | 4.13% | $28,591 |
Interfund Trades. Funds may purchase from or sell securities to other Fidelity Funds under procedures adopted by the Board. The procedures have been designed to ensure these interfund trades are executed in accordance with Rule 17a-7 of the 1940 Act. Any interfund trades are included within the respective purchases and sales amounts shown in the Purchases and Sales of Investments note. Interfund trades during the period are noted in the table below.
| | Purchases ($) | Sales ($) | Realized Gain (Loss) ($) |
| Fidelity International Small Cap Fund | 5,952,377 | 24,401,098 | (2,928,407) |
6. Committed Line of Credit.
Certain Funds participate with other funds managed by the investment adviser or an affiliate in a $4.25 billion credit facility (the "line of credit") to be utilized for temporary or emergency purposes to fund shareholder redemptions or for other short-term liquidity purposes. The participating funds have agreed to pay commitment fees on their pro-rata portion of the line of credit, which are reflected in Miscellaneous expenses on the Statement of Operations, and are listed below. During the period, there were no borrowings on this line of credit.
| | Amount |
| Fidelity International Small Cap Fund | $3,157 |
7. Security Lending.
Funds lend portfolio securities from time to time in order to earn additional income. Lending agents are used, including National Financial Services (NFS), an affiliate of the investment adviser. Pursuant to a securities lending agreement, NFS will receive a fee, which is capped at 9.9% of a fund's daily lending revenue, for its services as lending agent. A fund may lend securities to certain qualified borrowers, including NFS. On the settlement date of the loan, a fund receives collateral (in the form of U.S. Treasury obligations, letters of credit and/or cash) against the loaned securities and maintains collateral in an amount not less than 100% of the market value of the loaned securities during the period of the loan. The market value of the loaned securities is determined at the close of business of a fund and any additional required collateral is delivered to a fund on the next business day. A fund or borrower may terminate the loan at any time, and if the borrower defaults on its obligation to return the securities loaned because of insolvency or other reasons, a fund may apply collateral received from the borrower against the obligation. A fund may experience delays and costs in recovering the securities loaned. Any cash collateral received is invested in the Fidelity Securities Lending Cash Central Fund. Any loaned securities are identified as such in the Schedule of Investments, and the value of loaned securities and cash collateral at period end, as applicable, are presented in the Statement of Assets and Liabilities. Security lending income represents the income earned on investing cash collateral, less rebates paid to borrowers and any lending agent fees associated with the loan, plus any premium payments received for lending certain types of securities. Security lending income is presented in the Statement of Operations as a component of income from Fidelity Central Funds. Affiliated security lending activity, if any, was as follows:
| | Total Security Lending Fees Paid to NFS | Security Lending Income From Securities Loaned to NFS | Value of Securities Loaned to NFS at Period End |
| Fidelity International Small Cap Fund | $10,284 | $- | $- |
8. Bank Borrowings. The Fund is permitted to have bank borrowings for temporary or emergency purposes to fund shareholder redemptions or for other short-term liquidity requirements. The Fund has established borrowing arrangements with certain banks. The interest rate on the borrowings is the bank's base rate, as revised from time to time. Any open loans, including accrued interest, at period end are presented under the caption "Notes payable" in the Statement of Assets and Liabilities, if applicable. Activity in this program during the period for which loans were outstanding was as follows:
| | Average Loan Balance | Weighted Average Interest Rate | Interest Expense |
| Fidelity International Small Cap Fund | $9,529,000 | 3.58% | $947 |
9. Expense Reductions. Through arrangements with each class' transfer agent, credits realized as a result of certain uninvested cash balances were used to reduce the Fund's expenses. During the period, transfer agent credits reduced each class' expenses as noted in the table below.
| | Expense reduction |
| Class A | $80 |
| Class M | 313 |
| Class C | 34 |
| | $427 |
In addition, during the period the investment adviser or an affiliate reimbursed and/or waived a portion of fund-level operating expenses in the amount of $75,761.
10. Distributions to Shareholders.
Distributions to shareholders of each class were as follows:
| | Six months ended April 30, 2023 | Year ended October 31, 2022 |
| Fidelity International Small Cap Fund | | |
| Distributions to shareholders | | |
| Class A | $440,641 | $9,065,367 |
| Class M | 19,955 | 1,272,726 |
| Class C | - | 1,312,589 |
| International Small Cap | 8,831,165 | 100,730,178 |
| Class I | 5,018,235 | 74,208,475 |
| Class Z | 8,486,066 | 55,772,832 |
| Total | $22,796,062 | $242,362,167 |
11. Share Transactions.
Share transactions for each class were as follows and may contain in-kind transactions, automatic conversions between classes or exchanges between affiliated funds:
| | Shares | Shares | Dollars | Dollars |
| | Six months ended April 30, 2023 | Year ended October 31, 2022 | Six months ended April 30, 2023 | Year ended October 31, 2022 |
| Fidelity International Small Cap Fund | | | | |
| Class A | | | | |
| Shares sold | 491,797 | 830,534 | $13,553,560 | $23,685,249 |
| Reinvestment of distributions | 16,707 | 295,136 | 437,544 | 8,995,592 |
| Shares redeemed | (402,874) | (1,076,634) | (10,842,206) | (30,435,716) |
| Net increase (decrease) | 105,630 | 49,036 | $3,148,898 | $2,245,125 |
| Class M | | | | |
| Shares sold | 59,784 | 86,516 | $1,654,959 | $2,471,290 |
| Reinvestment of distributions | 763 | 41,863 | 19,926 | 1,271,367 |
| Shares redeemed | (35,752) | (132,638) | (953,159) | (3,771,297) |
| Net increase (decrease) | 24,795 | (4,259) | $721,726 | $(28,640) |
| Class C | | | | |
| Shares sold | 34,410 | 60,983 | $895,099 | $1,691,801 |
| Reinvestment of distributions | - | 44,584 | - | 1,311,796 |
| Shares redeemed | (85,478) | (171,531) | (2,220,831) | (4,624,227) |
| Net increase (decrease) | (51,068) | (65,964) | $(1,325,732) | $(1,620,630) |
| International Small Cap | | | | |
| Shares sold | 7,455,033 | 13,356,832 | $207,663,914 | $375,220,830 |
| Reinvestment of distributions | 303,022 | 2,945,011 | 8,099,784 | 91,615,712 |
| Shares redeemed | (4,322,793) | (13,181,058) | (119,265,729) | (380,933,549) |
| Net increase (decrease) | 3,435,262 | 3,120,785 | $96,497,969 | $85,902,993 |
| Class I | | | | |
| Shares sold | 5,870,142 | 13,697,966 | $164,154,464 | $404,258,743 |
| Reinvestment of distributions | 178,126 | 2,305,754 | 4,795,157 | 72,208,170 |
| Shares redeemed | (5,801,469) | (18,313,122) | (159,576,212) | (518,387,511) |
| Net increase (decrease) | 246,799 | (2,309,402) | $9,373,409 | $(41,920,598) |
| Class Z | | | | |
| Shares sold | 6,438,289 | 35,845,899 | $179,749,751 | $1,046,158,928 |
| Reinvestment of distributions | 206,606 | 1,517,664 | 5,553,574 | 47,460,406 |
| Shares redeemed | (9,716,433) | (19,068,812) | (264,334,297) | (525,797,814) |
| Net increase (decrease) | (3,071,538) | 18,294,751 | $(79,030,972) | $567,821,520 |
12. Other.
A fund's organizational documents provide former and current trustees and officers with a limited indemnification against liabilities arising in connection with the performance of their duties to the fund. In the normal course of business, a fund may also enter into contracts that provide general indemnifications. A fund's maximum exposure under these arrangements is unknown as this would be dependent on future claims that may be made against a fund. The risk of material loss from such claims is considered remote.
13. Risk and Uncertainties.
Many factors affect a fund's performance. Developments that disrupt global economies and financial markets, such as pandemics, epidemics, outbreaks of infectious diseases, war, terrorism, and environmental disasters, may significantly affect a fund's investment performance. The effects of these developments to a fund will be impacted by the types of securities in which a fund invests, the financial condition, industry, economic sector, and geographic location of an issuer, and a fund's level of investment in the securities of that issuer. Significant concentrations in security types, issuers, industries, sectors, and geographic locations may magnify the factors that affect a fund's performance.
As a shareholder, you incur two types of costs: (1) transaction costs, which may include sales charges (loads) on purchase payments or redemption proceeds, as applicable and (2) ongoing costs, which generally include management fees, distribution and/or service (12b-1) fees and other Fund expenses. This Example is intended to help you understand your ongoing costs (in dollars) of investing in a fund and to compare these costs with the ongoing costs of investing in other mutual funds.
| The Example is based on an investment of $1,000 invested at the beginning of the period and held for the entire period (November 1, 2022 to April 30, 2023). |
Actual Expenses
The first line of the accompanying table provides information about actual account values and actual expenses. You may use the information in this line, together with the amount you invested, to estimate the expenses that you paid over the period. Simply divide your account value by $1,000.00 (for example, an $8,600 account value divided by $1,000.00 = 8.6), then multiply the result by the number in the first line for a class/Fund under the heading entitled "Expenses Paid During Period" to estimate the expenses you paid on your account during this period. If any fund is a shareholder of any underlying mutual funds or exchange-traded funds (ETFs) (the Underlying Funds), such fund indirectly bears its proportional share of the expenses of the Underlying Funds in addition to the direct expenses incurred presented in the table. These fees and expenses are not included in the annualized expense ratio used to calculate the expense estimate in the table below.
Hypothetical Example for Comparison Purposes
The second line of the accompanying table provides information about hypothetical account values and hypothetical expenses based on the actual expense ratio and an assumed rate of return of 5% per year before expenses, which is not the actual return. The hypothetical account values and expenses may not be used to estimate the actual ending account balance or expenses you paid for the period. You may use this information to compare the ongoing costs of investing in the Fund and other funds. To do so, compare this 5% hypothetical example with the 5% hypothetical examples that appear in the shareholder reports of the other funds. If any fund is a shareholder of any Underlying Funds, such fund indirectly bears its proportional share of the expenses of the Underlying Funds in addition to the direct expenses as presented in the table. These fees and expenses are not included in the annualized expense ratio used to calculate the expense estimate in the table below.
Please note that the expenses shown in the table are meant to highlight your ongoing costs only and do not reflect any transaction costs. Therefore, the second line of the table is useful in comparing ongoing costs only, and will not help you determine the relative total costs of owning different funds. In addition, if these transactional costs were included, your costs would have been higher.
| | | | | Annualized Expense Ratio- A | | Beginning Account Value November 1, 2022 | | Ending Account Value April 30, 2023 | | Expenses Paid During Period- C November 1, 2022 to April 30, 2023 |
| Fidelity® International Small Cap Fund | | | | | | | | | | |
| Class A | | | | 1.38% | | | | | | |
| Actual | | | | | | $ 1,000 | | $ 1,206.10 | | $ 7.55 |
Hypothetical- B | | | | | | $ 1,000 | | $ 1,017.95 | | $ 6.90 |
| Class M | | | | 1.65% | | | | | | |
| Actual | | | | | | $ 1,000 | | $ 1,205.20 | | $ 9.02 |
Hypothetical- B | | | | | | $ 1,000 | | $ 1,016.61 | | $ 8.25 |
| Class C | | | | 2.15% | | | | | | |
| Actual | | | | | | $ 1,000 | | $ 1,201.90 | | $ 11.74 |
Hypothetical- B | | | | | | $ 1,000 | | $ 1,014.13 | | $ 10.74 |
| Fidelity® International Small Cap Fund | | | | 1.11% | | | | | | |
| Actual | | | | | | $ 1,000 | | $ 1,208.10 | | $ 6.08 |
Hypothetical- B | | | | | | $ 1,000 | | $ 1,019.29 | | $ 5.56 |
| Class I | | | | 1.11% | | | | | | |
| Actual | | | | | | $ 1,000 | | $ 1,208.10 | | $ 6.08 |
Hypothetical- B | | | | | | $ 1,000 | | $ 1,019.29 | | $ 5.56 |
| Class Z | | | | .98% | | | | | | |
| Actual | | | | | | $ 1,000 | | $ 1,208.80 | | $ 5.37 |
Hypothetical- B | | | | | | $ 1,000 | | $ 1,019.93 | | $ 4.91 |
| |
A Annualized expense ratio reflects expenses net of applicable fee waivers.
B 5% return per year before expenses
C Expenses are equal to the annualized expense ratio, multiplied by the average account value over the period, multiplied by 181/ 365 (to reflect the one-half year period). The fees and expenses of any Underlying Funds are not included in each annualized expense ratio.
The Securities and Exchange Commission adopted Rule 22e-4 under the Investment Company Act of 1940 (the Liquidity Rule) to promote effective liquidity risk management throughout the open-end investment company industry, thereby reducing the risk that funds will be unable to meet their redemption obligations and mitigating dilution of the interests of fund shareholders.
The Fund has adopted and implemented a liquidity risk management program (the Program) reasonably designed to assess and manage the Fund's liquidity risk and to comply with the requirements of the Liquidity Rule. The Fund's Board of Trustees (the Board) has designated the Fund's investment adviser as administrator of the Program. The Fidelity advisers have established a Liquidity Risk Management Committee (the LRM Committee) to manage the Program for each of the Fidelity Funds. The LRM Committee monitors the adequacy and effectiveness of implementation of the Program and on a periodic basis assesses each Fund's liquidity risk based on a variety of factors including (1) the Fund's investment strategy, (2) portfolio liquidity and cash flow projections during normal and reasonably foreseeable stressed conditions, (3) shareholder redemptions, (4) borrowings and other funding sources and (5) certain factors specific to ETFs including the effect of the Fund's prices and spreads, market participants, and basket compositions on the overall liquidity of the Fund's portfolio, as applicable.
In accordance with the Program, each of the Fund's portfolio investments is classified into one of four defined liquidity categories based on a determination of a reasonable expectation for how long it would take to convert the investment to cash (or sell or dispose of the investment) without significantly changing its market value.
- Highly liquid investments - cash or convertible to cash within three business days or less
- Moderately liquid investments - convertible to cash in three to seven calendar days
- Less liquid investments - can be sold or disposed of, but not settled, within seven calendar days
- Illiquid investments - cannot be sold or disposed of within seven calendar days
Liquidity classification determinations take into account a variety of factors including various market, trading and investment-specific considerations, as well as market depth, and generally utilize analysis from a third-party liquidity metrics service.
The Liquidity Rule places a 15% limit on a fund's illiquid investments and requires funds that do not primarily hold assets that are highly liquid investments to determine and maintain a minimum percentage of the fund's net assets to be invested in highly liquid investments (highly liquid investment minimum or HLIM). The Program includes provisions reasonably designed to comply with the 15% limit on illiquid investments and for determining, periodically reviewing and complying with the HLIM requirement as applicable.
At a recent meeting of the Fund's Board of Trustees, the LRM Committee provided a written report to the Board pertaining to the operation, adequacy, and effectiveness of the Program for the period December 1, 2021 through November 30, 2022. The report concluded that the Program is operating effectively and is reasonably designed to assess and manage the Fund's liquidity risk.
1.800662.119
ISC-SANN-0623
Fidelity® Sustainable Emerging Markets Equity Fund
Semi-Annual Report
April 30, 2023
Includes Fidelity and Fidelity Advisor share classes
Contents
To view a fund's proxy voting guidelines and proxy voting record for the 12-month period ended June 30, visit http://www.fidelity.com/proxyvotingresults or visit the Securities and Exchange Commission's (SEC) web site at http://www.sec.gov.
You may also call 1-800-544-8544 if you're an individual investing directly with Fidelity, call 1-800-835-5092 if you're a plan sponsor or participant with Fidelity as your recordkeeper or call 1-877-208-0098 on institutional accounts or if you're an advisor or invest through one to request a free copy of the proxy voting guidelines.
Standard & Poor's, S&P and S&P 500 are registered service marks of The McGraw-Hill Companies, Inc. and have been licensed for use by Fidelity Distributors Corporation.
Other third-party marks appearing herein are the property of their respective owners.
All other marks appearing herein are registered or unregistered trademarks or service marks of FMR LLC or an affiliated company. © 2023 FMR LLC. All rights reserved.
This report and the financial statements contained herein are submitted for the general information of the shareholders of the Fund. This report is not authorized for distribution to prospective investors in the Fund unless preceded or accompanied by an effective prospectus.
A fund files its complete schedule of portfolio holdings with the SEC for the first and third quarters of each fiscal year on Form N-PORT. Forms N-PORT are available on the SEC's web site at http://www.sec.gov. A fund's Forms N-PORT may be reviewed and copied at the SEC's Public Reference Room in Washington, DC. Information regarding the operation of the SEC's Public Reference Room may be obtained by calling 1-800-SEC-0330.
For a complete list of a fund's portfolio holdings, view the most recent holdings listing, semiannual report, or annual report on Fidelity's web site at http://www.fidelity.com, http://www.institutional.fidelity.com, or http://www.401k.com, as applicable.
NOT FDIC INSURED •MAY LOSE VALUE •NO BANK GUARANTEE
Neither the Fund nor Fidelity Distributors Corporation is a bank.
Top Holdings (% of Fund's net assets) |
| |
| Taiwan Semiconductor Manufacturing Co. Ltd. sponsored ADR (Taiwan, Semiconductors & Semiconductor Equipment) | 9.2 | |
| Tencent Holdings Ltd. (China, Interactive Media & Services) | 6.0 | |
| Samsung Electronics Co. Ltd. (Korea (South), Technology Hardware, Storage & Peripherals) | 5.6 | |
| Alibaba Group Holding Ltd. (China, Broadline Retail) | 3.0 | |
| Wal-Mart de Mexico SA de CV Series V (Mexico, Consumer Staples Distribution & Retail) | 2.5 | |
| China Construction Bank Corp. (H Shares) (China, Banks) | 2.4 | |
| LG Chemical Ltd. (Korea (South), Chemicals) | 2.0 | |
| Ping An Insurance Group Co. of China Ltd. (H Shares) (China, Insurance) | 1.9 | |
| NetEase, Inc. ADR (China, Entertainment) | 1.9 | |
| HDFC Bank Ltd. sponsored ADR (India, Banks) | 1.9 | |
| | 36.4 | |
| |
| Market Sectors (% of Fund's net assets) |
| |
| Financials | 21.7 | |
| Information Technology | 20.5 | |
| Consumer Discretionary | 13.8 | |
| Communication Services | 12.9 | |
| Consumer Staples | 7.9 | |
| Industrials | 6.0 | |
| Health Care | 5.4 | |
| Materials | 5.0 | |
| Energy | 2.7 | |
| Utilities | 1.7 | |
| |
Asset Allocation (% of Fund's net assets) |
|
|
Geographic Diversification (% of Fund's net assets) |
|
* Includes Short-Term investments and Net Other Assets (Liabilities). Percentages are adjusted for the effect of derivatives, if applicable. |
| |
Showing Percentage of Net Assets
| Common Stocks - 95.8% |
| | | Shares | Value ($) |
| Brazil - 4.1% | | | |
| Azul SA sponsored ADR (a) | | 2,254 | 14,674 |
| Hapvida Participacoes e Investimentos SA (a)(b) | | 54,148 | 29,963 |
| Localiza Rent a Car SA | | 3,230 | 37,566 |
| Localiza Rent a Car SA rights 5/11/23 (a) | | 8 | 28 |
| Lojas Renner SA | | 6,999 | 22,227 |
| Natura & Co. Holding SA | | 5,521 | 12,242 |
| Pet Center Comercio e Participacoes SA | | 19,682 | 24,347 |
| Raia Drogasil SA | | 6,333 | 33,368 |
TOTAL BRAZIL | | | 174,415 |
| China - 31.9% | | | |
| Alibaba Group Holding Ltd. (a) | | 12,289 | 129,939 |
| Alibaba Group Holding Ltd. sponsored ADR (a) | | 196 | 16,599 |
| Baidu, Inc. sponsored ADR (a) | | 136 | 16,403 |
| BeiGene Ltd. ADR (a) | | 34 | 8,669 |
| Bilibili, Inc. ADR (a) | | 842 | 17,143 |
| BYD Co. Ltd. (H Shares) | | 884 | 26,808 |
| China Construction Bank Corp. (H Shares) | | 152,958 | 102,256 |
| China Life Insurance Co. Ltd. (H Shares) | | 9,684 | 18,604 |
| China Merchants Bank Co. Ltd. (H Shares) | | 1,966 | 9,490 |
| China Resources Beer Holdings Co. Ltd. | | 4,067 | 31,417 |
| Contemporary Amperex Technology Co. Ltd. | | 326 | 10,934 |
| ENN Energy Holdings Ltd. | | 2,810 | 38,530 |
| Haier Smart Home Co. Ltd. | | 9,232 | 30,092 |
| Hansoh Pharmaceutical Group Co. Ltd. (b) | | 3,297 | 6,015 |
| JD.com, Inc. sponsored ADR | | 768 | 27,433 |
| Kunlun Energy Co. Ltd. | | 22,092 | 20,479 |
| Kweichow Moutai Co. Ltd. (A Shares) | | 94 | 23,985 |
| Li Auto, Inc. ADR (a) | | 815 | 19,153 |
| Li Ning Co. Ltd. | | 1,479 | 10,577 |
| Meituan Class B (a)(b) | | 4,376 | 74,788 |
| NetEase, Inc. ADR | | 897 | 79,950 |
| New Horizon Health Ltd. (a)(b) | | 4,515 | 16,202 |
| PDD Holdings, Inc. ADR (a) | | 622 | 42,389 |
| Ping An Insurance Group Co. of China Ltd. (H Shares) | | 11,067 | 80,740 |
| Shenzhen Mindray Bio-Medical Electronics Co. Ltd. (A Shares) | | 993 | 44,893 |
| Shenzhou International Group Holdings Ltd. | | 2,885 | 27,711 |
| Silergy Corp. | | 428 | 6,751 |
| Sinopharm Group Co. Ltd. (H Shares) | | 2,000 | 7,085 |
| Sinotruk Hong Kong Ltd. | | 18,120 | 27,692 |
| Sunny Optical Technology Group Co. Ltd. | | 1,436 | 15,175 |
| Tencent Holdings Ltd. | | 5,769 | 256,237 |
| Trip.com Group Ltd. ADR (a) | | 1,340 | 47,583 |
| Wuliangye Yibin Co. Ltd. (A Shares) | | 679 | 16,628 |
| Wuxi Biologics (Cayman), Inc. (a)(b) | | 4,089 | 24,382 |
| Zai Lab Ltd. (a) | | 3,530 | 12,359 |
| Zai Lab Ltd. ADR (a) | | 121 | 4,233 |
| Zijin Mining Group Co. Ltd. (H Shares) | | 6,448 | 10,917 |
TOTAL CHINA | | | 1,360,241 |
| Hungary - 0.8% | | | |
| OTP Bank PLC | | 316 | 9,614 |
| Richter Gedeon PLC | | 951 | 22,950 |
TOTAL HUNGARY | | | 32,564 |
| India - 14.2% | | | |
| Axis Bank Ltd. | | 2,512 | 26,544 |
| Axis Bank Ltd. sponsored GDR (Reg. S) | | 90 | 4,752 |
| Bharti Airtel Ltd. | | 3,921 | 38,425 |
| HDFC Bank Ltd. sponsored ADR | | 1,131 | 78,944 |
| HDFC Standard Life Insurance Co. Ltd. (b) | | 3,889 | 25,274 |
| Hindustan Unilever Ltd. | | 1,332 | 40,135 |
| Housing Development Finance Corp. Ltd. | | 1,526 | 52,049 |
| ICICI Bank Ltd. | | 3,975 | 44,890 |
| Infosys Ltd. sponsored ADR | | 3,305 | 51,360 |
| Larsen & Toubro Ltd. | | 1,985 | 57,611 |
| NTPC Ltd. | | 5,868 | 12,390 |
| Reliance Industries Ltd. | | 1,757 | 52,233 |
| Reliance Industries Ltd. GDR (b) | | 1,079 | 64,308 |
| SRF Ltd. | | 309 | 9,639 |
| Tata Consultancy Services Ltd. | | 286 | 11,319 |
| Tata Steel Ltd. | | 10,090 | 13,391 |
| Ultratech Cement Ltd. | | 224 | 20,758 |
TOTAL INDIA | | | 604,022 |
| Indonesia - 3.6% | | | |
| PT Bank Central Asia Tbk | | 108,726 | 67,285 |
| PT Bank Mandiri (Persero) Tbk | | 106,196 | 37,540 |
| PT Bank Rakyat Indonesia (Persero) Tbk | | 97,701 | 34,047 |
| PT Telkom Indonesia Persero Tbk | | 56,845 | 16,465 |
TOTAL INDONESIA | | | 155,337 |
| Korea (South) - 13.7% | | | |
| Db Insurance Co. Ltd. | | 409 | 25,721 |
| Hansol Chemical Co. Ltd. | | 103 | 17,175 |
| Hyundai Fire & Marine Insurance Co. Ltd. | | 1,242 | 34,906 |
| Hyundai Motor Co. Ltd. | | 401 | 59,423 |
| JYP Entertainment Corp. | | 147 | 9,948 |
| KB Financial Group, Inc. | | 468 | 17,377 |
| LG Chemical Ltd. | | 154 | 85,578 |
| LG Energy Solution (a) | | 40 | 17,440 |
| LG H & H Co. Ltd. | | 27 | 12,613 |
| LG Innotek Co. Ltd. | | 34 | 6,770 |
| NAVER Corp. | | 110 | 15,943 |
| Samsung Electronics Co. Ltd. | | 4,863 | 239,374 |
| SK Hynix, Inc. | | 615 | 41,396 |
TOTAL KOREA (SOUTH) | | | 583,664 |
| Malaysia - 0.2% | | | |
| Press Metal Aluminium Holdings | | 7,366 | 8,536 |
| Mexico - 5.7% | | | |
| CEMEX S.A.B. de CV sponsored ADR (a) | | 1,508 | 9,048 |
| Grupo Aeroportuario Norte S.A.B. de CV | | 4,996 | 54,919 |
| Grupo Financiero Banorte S.A.B. de CV Series O | | 8,409 | 72,718 |
| Wal-Mart de Mexico SA de CV Series V | | 26,145 | 105,412 |
TOTAL MEXICO | | | 242,097 |
| Peru - 0.3% | | | |
| Credicorp Ltd. (United States) | | 98 | 13,277 |
| Saudi Arabia - 1.2% | | | |
| Al Rajhi Bank | | 642 | 13,146 |
| Dr Sulaiman Al Habib Medical Services Group Co. | | 490 | 37,494 |
TOTAL SAUDI ARABIA | | | 50,640 |
| Singapore - 1.4% | | | |
| Sea Ltd. ADR (a) | | 802 | 61,088 |
| South Africa - 4.5% | | | |
| Absa Group Ltd. | | 4,610 | 44,768 |
| Bid Corp. Ltd. | | 1,421 | 32,339 |
| Gold Fields Ltd. sponsored ADR | | 1,066 | 16,587 |
| Impala Platinum Holdings Ltd. | | 2,120 | 20,640 |
| MTN Group Ltd. | | 5,393 | 37,831 |
| Naspers Ltd. Class N | | 216 | 38,509 |
TOTAL SOUTH AFRICA | | | 190,674 |
| Switzerland - 0.2% | | | |
| Shenzhen Mindray Bio-Medical Electronics Co. Ltd. ELS (UBS AG London Branch Bank Warrant Programme) Class A warrants 11/16/24 (a)(b) | | 172 | 7,808 |
| Taiwan - 13.4% | | | |
| Chailease Holding Co. Ltd. | | 4,779 | 34,782 |
| E.SUN Financial Holdings Co. Ltd. | | 11,851 | 9,631 |
| eMemory Technology, Inc. | | 484 | 28,919 |
| HIWIN Technologies Corp. | | 4,084 | 31,348 |
| Hon Hai Precision Industry Co. Ltd. (Foxconn) | | 8,921 | 30,378 |
| MediaTek, Inc. | | 2,024 | 43,979 |
| Taiwan Semiconductor Manufacturing Co. Ltd. sponsored ADR | | 4,666 | 393,342 |
TOTAL TAIWAN | | | 572,379 |
| Thailand - 0.6% | | | |
| CP ALL PCL (For. Reg.) | | 10,881 | 20,680 |
| Thai Beverage PCL | | 11,450 | 5,502 |
TOTAL THAILAND | | | 26,182 |
| TOTAL COMMON STOCKS (Cost $4,082,062) | | | 4,082,924 |
| | | | |
| Nonconvertible Preferred Stocks - 1.8% |
| | | Shares | Value ($) |
| Brazil - 1.8% | | | |
| Banco Bradesco SA (PN) | | 3,234 | 8,980 |
| Itau Unibanco Holding SA | | 8,996 | 46,749 |
| Itau Unibanco Holding SA sponsored ADR | | 3,960 | 20,394 |
| | | | |
| TOTAL NONCONVERTIBLE PREFERRED STOCKS (Cost $72,366) | | | 76,123 |
| | | | |
| Money Market Funds - 3.8% |
| | | Shares | Value ($) |
Fidelity Cash Central Fund 4.88% (c) (Cost $159,981) | | 159,949 | 159,981 |
| | | | |
| TOTAL INVESTMENT IN SECURITIES - 101.4% (Cost $4,314,409) | 4,319,028 |
NET OTHER ASSETS (LIABILITIES) - (1.4)% | (58,683) |
| NET ASSETS - 100.0% | 4,260,345 |
| | |
Security Type Abbreviations
| ELS | - | EQUITY-LINKED SECURITY |
Legend
| (b) | Security exempt from registration under Rule 144A of the Securities Act of 1933. These securities may be resold in transactions exempt from registration, normally to qualified institutional buyers. At the end of the period, the value of these securities amounted to $248,740 or 5.8% of net assets. |
| (c) | Affiliated fund that is generally available only to investment companies and other accounts managed by Fidelity Investments. The rate quoted is the annualized seven-day yield of the fund at period end. A complete unaudited listing of the fund's holdings as of its most recent quarter end is available upon request. In addition, each Fidelity Central Fund's financial statements are available on the SEC's website or upon request. |
Affiliated Central Funds
Fiscal year to date information regarding the Fund's investments in Fidelity Central Funds, including the ownership percentage, is presented below.
| Affiliate | Value, beginning of period ($) | Purchases ($) | Sales Proceeds ($) | Dividend Income ($) | Realized Gain (loss) ($) | Change in Unrealized appreciation (depreciation) ($) | Value, end of period ($) | % ownership, end of period |
| Fidelity Cash Central Fund 4.88% | 102,935 | 2,315,186 | 2,258,140 | 5,986 | - | - | 159,981 | 0.0% |
| Total | 102,935 | 2,315,186 | 2,258,140 | 5,986 | - | - | 159,981 | |
| | | | | | | | | |
Amounts in the dividend income column in the above table include any capital gain distributions from underlying funds, which are presented in the corresponding line item in the Statement of Operations, if applicable.
Amounts included in the purchases and sales proceeds columns may include in-kind transactions, if applicable.
Investment Valuation
The following is a summary of the inputs used, as of April 30, 2023, involving the Fund's assets and liabilities carried at fair value. The inputs or methodology used for valuing securities may not be an indication of the risk associated with investing in those securities. For more information on valuation inputs, and their aggregation into the levels used below, please refer to the Investment Valuation section in the accompanying Notes to Financial Statements.
| Valuation Inputs at Reporting Date: |
| Description | Total ($) | Level 1 ($) | Level 2 ($) | Level 3 ($) |
Investments in Securities: | | | | |
|
| Equities: | | | | |
Communication Services | 549,433 | 212,415 | 337,018 | - |
Consumer Discretionary | 597,578 | 238,240 | 359,338 | - |
Consumer Staples | 334,321 | 183,361 | 150,960 | - |
Energy | 116,541 | 64,308 | 52,233 | - |
Financials | 934,478 | 313,342 | 621,136 | - |
Health Care | 222,053 | 103,309 | 118,744 | - |
Industrials | 252,212 | 107,187 | 145,025 | - |
Information Technology | 868,763 | 444,702 | 424,061 | - |
Materials | 212,269 | 25,635 | 186,634 | - |
Utilities | 71,399 | - | 71,399 | - |
|
| Money Market Funds | 159,981 | 159,981 | - | - |
| Total Investments in Securities: | 4,319,028 | 1,852,480 | 2,466,548 | - |
| Statement of Assets and Liabilities |
| | | | April 30, 2023 (Unaudited) |
| | | | | |
| Assets | | | | |
| Investment in securities, at value - See accompanying schedule: | | | | |
Unaffiliated issuers (cost $4,154,428) | $ | 4,159,047 | | |
Fidelity Central Funds (cost $159,981) | | 159,981 | | |
| | | | | |
| | | | | |
| Total Investment in Securities (cost $4,314,409) | | | $ | 4,319,028 |
| Cash | | | | 4,683 |
| Foreign currency held at value (cost $13,391) | | | | 13,392 |
| Receivable for fund shares sold | | | | 800 |
| Dividends receivable | | | | 3,914 |
| Distributions receivable from Fidelity Central Funds | | | | 1,067 |
| Receivable from investment adviser for expense reductions | | | | 15,779 |
| Other receivables | | | | 140 |
Total assets | | | | 4,358,803 |
| Liabilities | | | | |
| Payable for investments purchased | $ | 45,730 | | |
| Payable for fund shares redeemed | | 1,012 | | |
| Accrued management fee | | 2,840 | | |
| Distribution and service plan fees payable | | 299 | | |
| Other affiliated payables | | 957 | | |
| Audit fee payable | | 32,190 | | |
| Custody fee payable | | 14,862 | | |
| Other payables and accrued expenses | | 568 | | |
| Total Liabilities | | | | 98,458 |
| Net Assets | | | $ | 4,260,345 |
| Net Assets consist of: | | | | |
| Paid in capital | | | $ | 4,910,374 |
| Total accumulated earnings (loss) | | | | (650,029) |
| Net Assets | | | $ | 4,260,345 |
| | | | | |
| Net Asset Value and Maximum Offering Price | | | | |
| Class A : | | | | |
Net Asset Value and redemption price per share ($239,488 ÷ 30,792 shares) (a) | | | $ | 7.78 |
| Maximum offering price per share (100/94.25 of $7.78) | | | $ | 8.25 |
| Class M : | | | | |
Net Asset Value and redemption price per share ($194,896 ÷ 25,065 shares) (a) | | | $ | 7.78 |
| Maximum offering price per share (100/96.50 of $7.78) | | | $ | 8.06 |
| Class C : | | | | |
Net Asset Value and offering price per share ($198,750 ÷ 25,658 shares) (a) | | | $ | 7.75 |
| Fidelity Sustainable Emerging Markets Equity Fund : | | | | |
Net Asset Value , offering price and redemption price per share ($3,087,295 ÷ 396,492 shares) | | | $ | 7.79 |
| Class I : | | | | |
Net Asset Value , offering price and redemption price per share ($211,321 ÷ 27,136 shares) | | | $ | 7.79 |
| Class Z : | | | | |
Net Asset Value , offering price and redemption price per share ($328,595 ÷ 42,130 shares) | | | $ | 7.80 |
(a)Redemption price per share is equal to net asset value less any applicable contingent deferred sales charge. |
| Statement of Operations |
| | | | Six months ended April 30, 2023 (Unaudited) |
| Investment Income | | | | |
| Dividends | | | $ | 37,242 |
| Non-Cash dividends | | | | 11,645 |
| Income from Fidelity Central Funds | | | | 5,986 |
| Income before foreign taxes withheld | | | $ | 54,873 |
| Less foreign taxes withheld | | | | (5,112) |
| Total Income | | | | 49,761 |
| Expenses | | | | |
| Management fee | | | | |
| Basic fee | $ | 17,182 | | |
| Performance adjustment | | (24) | | |
| Transfer agent fees | | 4,391 | | |
| Distribution and service plan fees | | 1,756 | | |
| Accounting fees and expenses | | 1,102 | | |
| Custodian fees and expenses | | 25,369 | | |
| Independent trustees' fees and expenses | | 11 | | |
| Registration fees | | 100,314 | | |
| Audit | | 33,759 | | |
| Legal | | 3 | | |
| Miscellaneous | | 8 | | |
| Total expenses before reductions | | 183,871 | | |
| Expense reductions | | (155,042) | | |
| Total expenses after reductions | | | | 28,829 |
| Net Investment income (loss) | | | | 20,932 |
| Realized and Unrealized Gain (Loss) | | | | |
| Net realized gain (loss) on: | | | | |
| Investment Securities: | | | | |
| Unaffiliated issuers | | (259,875) | | |
| Foreign currency transactions | | (2,637) | | |
| Futures contracts | | 5,437 | | |
| Total net realized gain (loss) | | | | (257,075) |
| Change in net unrealized appreciation (depreciation) on: | | | | |
| Investment Securities: | | | | |
| Unaffiliated issuers(net of increase in deferred foreign taxes of $565) | | 765,330 | | |
| Assets and liabilities in foreign currencies | | (26) | | |
| Total change in net unrealized appreciation (depreciation) | | | | 765,304 |
| Net gain (loss) | | | | 508,229 |
| Net increase (decrease) in net assets resulting from operations | | | $ | 529,161 |
| Statement of Changes in Net Assets |
| |
| | Six months ended April 30, 2023 (Unaudited) | | For the period February 10, 2022 (commencement of operations) through October 31, 2022 |
| Increase (Decrease) in Net Assets | | | | |
| Operations | | | | |
| Net investment income (loss) | $ | 20,932 | $ | 14,880 |
| Net realized gain (loss) | | (257,075) | | (409,178) |
| Change in net unrealized appreciation (depreciation) | | 765,304 | | (761,262) |
| Net increase (decrease) in net assets resulting from operations | | 529,161 | | (1,155,560) |
| Distributions to shareholders | | (23,630) | | - |
| Share transactions - net increase (decrease) | | 742,489 | | 4,167,885 |
| Total increase (decrease) in net assets | | 1,248,020 | | 3,012,325 |
| | | | | |
| Net Assets | | | | |
| Beginning of period | | 3,012,325 | | - |
| End of period | $ | 4,260,345 | $ | 3,012,325 |
| | | | | |
| | | | | |
Financial Highlights
| Fidelity Advisor® Sustainable Emerging Markets Equity Fund Class A |
| |
| | Six months ended (Unaudited) April 30, 2023 | | Years ended October 31, 2022 A |
Selected Per-Share Data | | | | |
| Net asset value, beginning of period | $ | 6.55 | $ | 10.00 |
| Income from Investment Operations | | | | |
Net investment income (loss) B,C | | .03 | | .03 |
| Net realized and unrealized gain (loss) | | 1.24 | | (3.48) |
| Total from investment operations | | 1.27 | | (3.45) |
| Distributions from net investment income | | (.04) | | - |
| Total distributions | | (.04) | | - |
| Net asset value, end of period | $ | 7.78 | $ | 6.55 |
Total Return D,E,F | | 19.37% | | (34.50)% |
Ratios to Average Net Assets C,G,H | | | | |
| Expenses before reductions | | 8.67% I | | 8.77% I,J |
| Expenses net of fee waivers, if any | | 1.50% I | | 1.57% I |
| Expenses net of all reductions | | 1.49% I | | 1.56% I |
| Net investment income (loss) | | .76% I | | .51% I |
| Supplemental Data | | | | |
| Net assets, end of period (000 omitted) | $ | 239 | $ | 164 |
Portfolio turnover rate K | | 139% I | | 84% I |
A For the period February 10, 2022 (commencement of operations) through October 31, 2022
B Calculated based on average shares outstanding during the period.
C Net investment income (loss) is affected by the timing of the declaration of dividends by any underlying mutual funds or exchange-traded funds (ETFs). Net investment income (loss) of any mutual funds or ETFs is not included in the Fund's net investment income (loss) ratio.
D Total returns for periods of less than one year are not annualized.
E Total returns would have been lower if certain expenses had not been reduced during the applicable periods shown.
F Total returns do not include the effect of the sales charges.
G Fees and expenses of any underlying mutual funds or exchange-traded funds (ETFs) are not included in the Fund's expense ratio. The Fund indirectly bears its proportionate share of these expenses. For additional expense information related to investments in Fidelity Central Funds, please refer to the "Investments in Fidelity Central Funds" note found in the Notes to Financial Statements section of the most recent Annual or Semi-Annual report.
H Expense ratios reflect operating expenses of the class. Expenses before reductions do not reflect amounts reimbursed, waived, or reduced through arrangements with the investment adviser, brokerage services, or other offset arrangements, if applicable, and do not represent the amount paid by the class during periods when reimbursements, waivers or reductions occur.
I Annualized.
J Audit fees are not annualized.
K Amount does not include the portfolio activity of any underlying mutual funds or exchange-traded funds (ETFs).
| Fidelity Advisor® Sustainable Emerging Markets Equity Fund Class M |
| |
| | Six months ended (Unaudited) April 30, 2023 | | Years ended October 31, 2022 A |
Selected Per-Share Data | | | | |
| Net asset value, beginning of period | $ | 6.54 | $ | 10.00 |
| Income from Investment Operations | | | | |
Net investment income (loss) B,C | | .02 | | .01 |
| Net realized and unrealized gain (loss) | | 1.24 | | (3.47) |
| Total from investment operations | | 1.26 | | (3.46) |
| Distributions from net investment income | | (.02) | | - |
| Total distributions | | (.02) | | - |
| Net asset value, end of period | $ | 7.78 | $ | 6.54 |
Total Return D,E,F | | 19.24% | | (34.60)% |
Ratios to Average Net Assets C,G,H | | | | |
| Expenses before reductions | | 8.77% I | | 9.01% I,J |
| Expenses net of fee waivers, if any | | 1.75% I | | 1.82% I |
| Expenses net of all reductions | | 1.74% I | | 1.82% I |
| Net investment income (loss) | | .51% I | | .26% I |
| Supplemental Data | | | | |
| Net assets, end of period (000 omitted) | $ | 195 | $ | 164 |
Portfolio turnover rate K | | 139% I | | 84% I |
A For the period February 10, 2022 (commencement of operations) through October 31, 2022
B Calculated based on average shares outstanding during the period.
C Net investment income (loss) is affected by the timing of the declaration of dividends by any underlying mutual funds or exchange-traded funds (ETFs). Net investment income (loss) of any mutual funds or ETFs is not included in the Fund's net investment income (loss) ratio.
D Total returns for periods of less than one year are not annualized.
E Total returns would have been lower if certain expenses had not been reduced during the applicable periods shown.
F Total returns do not include the effect of the sales charges.
G Fees and expenses of any underlying mutual funds or exchange-traded funds (ETFs) are not included in the Fund's expense ratio. The Fund indirectly bears its proportionate share of these expenses. For additional expense information related to investments in Fidelity Central Funds, please refer to the "Investments in Fidelity Central Funds" note found in the Notes to Financial Statements section of the most recent Annual or Semi-Annual report.
H Expense ratios reflect operating expenses of the class. Expenses before reductions do not reflect amounts reimbursed, waived, or reduced through arrangements with the investment adviser, brokerage services, or other offset arrangements, if applicable, and do not represent the amount paid by the class during periods when reimbursements, waivers or reductions occur.
I Annualized.
J Audit fees are not annualized.
K Amount does not include the portfolio activity of any underlying mutual funds or exchange-traded funds (ETFs).
| Fidelity Advisor® Sustainable Emerging Markets Equity Fund Class C |
| |
| | Six months ended (Unaudited) April 30, 2023 | | Years ended October 31, 2022 A |
Selected Per-Share Data | | | | |
| Net asset value, beginning of period | $ | 6.52 | $ | 10.00 |
| Income from Investment Operations | | | | |
Net investment income (loss) B,C | | - D | | (.01) |
| Net realized and unrealized gain (loss) | | 1.23 | | (3.47) |
| Total from investment operations | | 1.23 | | (3.48) |
| Net asset value, end of period | $ | 7.75 | $ | 6.52 |
Total Return E,F,G | | 18.87% | | (34.80)% |
Ratios to Average Net Assets C,H,I | | | | |
| Expenses before reductions | | 9.26% J | | 9.51% J,K |
| Expenses net of fee waivers, if any | | 2.25% J | | 2.32% J |
| Expenses net of all reductions | | 2.24% J | | 2.32% J |
| Net investment income (loss) | | .01% J | | (.24)% J |
| Supplemental Data | | | | |
| Net assets, end of period (000 omitted) | $ | 199 | $ | 163 |
Portfolio turnover rate L | | 139% J | | 84% J |
A For the period February 10, 2022 (commencement of operations) through October 31, 2022
B Calculated based on average shares outstanding during the period.
C Net investment income (loss) is affected by the timing of the declaration of dividends by any underlying mutual funds or exchange-traded funds (ETFs). Net investment income (loss) of any mutual funds or ETFs is not included in the Fund's net investment income (loss) ratio.
D Amount represents less than $.005 per share.
E Total returns for periods of less than one year are not annualized.
F Total returns would have been lower if certain expenses had not been reduced during the applicable periods shown.
G Total returns do not include the effect of the contingent deferred sales charge.
H Fees and expenses of any underlying mutual funds or exchange-traded funds (ETFs) are not included in the Fund's expense ratio. The Fund indirectly bears its proportionate share of these expenses. For additional expense information related to investments in Fidelity Central Funds, please refer to the "Investments in Fidelity Central Funds" note found in the Notes to Financial Statements section of the most recent Annual or Semi-Annual report.
I Expense ratios reflect operating expenses of the class. Expenses before reductions do not reflect amounts reimbursed, waived, or reduced through arrangements with the investment adviser, brokerage services, or other offset arrangements, if applicable, and do not represent the amount paid by the class during periods when reimbursements, waivers or reductions occur.
J Annualized.
K Audit fees are not annualized.
L Amount does not include the portfolio activity of any underlying mutual funds or exchange-traded funds (ETFs).
| Fidelity® Sustainable Emerging Markets Equity Fund |
| |
| | Six months ended (Unaudited) April 30, 2023 | | Years ended October 31, 2022 A |
Selected Per-Share Data | | | | |
| Net asset value, beginning of period | $ | 6.57 | $ | 10.00 |
| Income from Investment Operations | | | | |
Net investment income (loss) B,C | | .04 | | .05 |
| Net realized and unrealized gain (loss) | | 1.23 | | (3.48) |
| Total from investment operations | | 1.27 | | (3.43) |
| Distributions from net investment income | | (.05) | | - |
| Total distributions | | (.05) | | - |
| Net asset value, end of period | $ | 7.79 | $ | 6.57 |
Total Return D,E | | 19.40% | | (34.30)% |
Ratios to Average Net Assets C,F,G | | | | |
| Expenses before reductions | | 8.25% H | | 8.07% H,I |
| Expenses net of fee waivers, if any | | 1.25% H | | 1.25% H |
| Expenses net of all reductions | | 1.24% H | | 1.25% H |
| Net investment income (loss) | | 1.02% H | | .83% H |
| Supplemental Data | | | | |
| Net assets, end of period (000 omitted) | $ | 3,087 | $ | 2,082 |
Portfolio turnover rate J | | 139% H | | 84% H |
A For the period February 10, 2022 (commencement of operations) through October 31, 2022
B Calculated based on average shares outstanding during the period.
C Net investment income (loss) is affected by the timing of the declaration of dividends by any underlying mutual funds or exchange-traded funds (ETFs). Net investment income (loss) of any mutual funds or ETFs is not included in the Fund's net investment income (loss) ratio.
D Total returns for periods of less than one year are not annualized.
E Total returns would have been lower if certain expenses had not been reduced during the applicable periods shown.
F Fees and expenses of any underlying mutual funds or exchange-traded funds (ETFs) are not included in the Fund's expense ratio. The Fund indirectly bears its proportionate share of these expenses. For additional expense information related to investments in Fidelity Central Funds, please refer to the "Investments in Fidelity Central Funds" note found in the Notes to Financial Statements section of the most recent Annual or Semi-Annual report.
G Expense ratios reflect operating expenses of the class. Expenses before reductions do not reflect amounts reimbursed, waived, or reduced through arrangements with the investment adviser, brokerage services, or other offset arrangements, if applicable, and do not represent the amount paid by the class during periods when reimbursements, waivers or reductions occur.
H Annualized.
I Audit fees are not annualized.
J Amount does not include the portfolio activity of any underlying mutual funds or exchange-traded funds (ETFs).
| Fidelity Advisor® Sustainable Emerging Markets Equity Fund Class I |
| |
| | Six months ended (Unaudited) April 30, 2023 | | Years ended October 31, 2022 A |
Selected Per-Share Data | | | | |
| Net asset value, beginning of period | $ | 6.57 | $ | 10.00 |
| Income from Investment Operations | | | | |
Net investment income (loss) B,C | | .04 | | .04 |
| Net realized and unrealized gain (loss) | | 1.23 | | (3.47) |
| Total from investment operations | | 1.27 | | (3.43) |
| Distributions from net investment income | | (.05) | | - |
| Total distributions | | (.05) | | - |
| Net asset value, end of period | $ | 7.79 | $ | 6.57 |
Total Return D,E | | 19.40% | | (34.30)% |
Ratios to Average Net Assets C,F,G | | | | |
| Expenses before reductions | | 8.20% H | | 8.50% H,I |
| Expenses net of fee waivers, if any | | 1.25% H | | 1.31% H |
| Expenses net of all reductions | | 1.24% H | | 1.31% H |
| Net investment income (loss) | | 1.01% H | | .76% H |
| Supplemental Data | | | | |
| Net assets, end of period (000 omitted) | $ | 211 | $ | 164 |
Portfolio turnover rate J | | 139% H | | 84% H |
A For the period February 10, 2022 (commencement of operations) through October 31, 2022
B Calculated based on average shares outstanding during the period.
C Net investment income (loss) is affected by the timing of the declaration of dividends by any underlying mutual funds or exchange-traded funds (ETFs). Net investment income (loss) of any mutual funds or ETFs is not included in the Fund's net investment income (loss) ratio.
D Total returns for periods of less than one year are not annualized.
E Total returns would have been lower if certain expenses had not been reduced during the applicable periods shown.
F Fees and expenses of any underlying mutual funds or exchange-traded funds (ETFs) are not included in the Fund's expense ratio. The Fund indirectly bears its proportionate share of these expenses. For additional expense information related to investments in Fidelity Central Funds, please refer to the "Investments in Fidelity Central Funds" note found in the Notes to Financial Statements section of the most recent Annual or Semi-Annual report.
G Expense ratios reflect operating expenses of the class. Expenses before reductions do not reflect amounts reimbursed, waived, or reduced through arrangements with the investment adviser, brokerage services, or other offset arrangements, if applicable, and do not represent the amount paid by the class during periods when reimbursements, waivers or reductions occur.
H Annualized.
I Audit fees are not annualized.
J Amount does not include the portfolio activity of any underlying mutual funds or exchange-traded funds (ETFs).
| Fidelity Advisor® Sustainable Emerging Markets Equity Fund Class Z |
| |
| | Six months ended (Unaudited) April 30, 2023 | | Years ended October 31, 2022 A |
Selected Per-Share Data | | | | |
| Net asset value, beginning of period | $ | 6.57 | $ | 10.00 |
| Income from Investment Operations | | | | |
Net investment income (loss) B,C | | .05 | | .05 |
| Net realized and unrealized gain (loss) | | 1.23 | | (3.48) |
| Total from investment operations | | 1.28 | | (3.43) |
| Distributions from net investment income | | (.05) | | - |
| Total distributions | | (.05) | | - |
| Net asset value, end of period | $ | 7.80 | $ | 6.57 |
Total Return D,E | | 19.55% | | (34.30)% |
Ratios to Average Net Assets C,F,G | | | | |
| Expenses before reductions | | 8.23% H | | 8.23% H,I |
| Expenses net of fee waivers, if any | | 1.10% H | | 1.15% H |
| Expenses net of all reductions | | 1.09% H | | 1.15% H |
| Net investment income (loss) | | 1.17% H | | .93% H |
| Supplemental Data | | | | |
| Net assets, end of period (000 omitted) | $ | 329 | $ | 276 |
Portfolio turnover rate J | | 139% H | | 84% H |
A For the period February 10, 2022 (commencement of operations) through October 31, 2022
B Calculated based on average shares outstanding during the period.
C Net investment income (loss) is affected by the timing of the declaration of dividends by any underlying mutual funds or exchange-traded funds (ETFs). Net investment income (loss) of any mutual funds or ETFs is not included in the Fund's net investment income (loss) ratio.
D Total returns for periods of less than one year are not annualized.
E Total returns would have been lower if certain expenses had not been reduced during the applicable periods shown.
F Fees and expenses of any underlying mutual funds or exchange-traded funds (ETFs) are not included in the Fund's expense ratio. The Fund indirectly bears its proportionate share of these expenses. For additional expense information related to investments in Fidelity Central Funds, please refer to the "Investments in Fidelity Central Funds" note found in the Notes to Financial Statements section of the most recent Annual or Semi-Annual report.
G Expense ratios reflect operating expenses of the class. Expenses before reductions do not reflect amounts reimbursed, waived, or reduced through arrangements with the investment adviser, brokerage services, or other offset arrangements, if applicable, and do not represent the amount paid by the class during periods when reimbursements, waivers or reductions occur.
H Annualized.
I Audit fees are not annualized.
J Amount does not include the portfolio activity of any underlying mutual funds or exchange-traded funds (ETFs).
For the period ended April 30, 2023
1. Organization.
Fidelity Sustainable Emerging Markets Equity Fund (the Fund) is a fund of Fidelity Investment Trust (the Trust) and is authorized to issue an unlimited number of shares. The Trust is registered under the Investment Company Act of 1940, as amended (the 1940 Act), as an open-end management investment company organized as a Massachusetts business trust. The Fund offers Class A, Class M, Class C, Fidelity Sustainable Emerging Markets Equity Fund, Class I and Class Z shares, each of which has equal rights as to assets and voting privileges. Class A, Class M, Class C, Class I and Class Z are Fidelity Advisor classes. Class C shares will automatically convert to Class A shares after a holding period of eight years from the initial date of purchase, with certain exceptions. The Fund's investments in emerging markets can be subject to social, economic, regulatory, and political uncertainties and can be extremely volatile.
2. Investments in Fidelity Central Funds.
Funds may invest in Fidelity Central Funds, which are open-end investment companies generally available only to other investment companies and accounts managed by the investment adviser and its affiliates. The Schedule of Investments lists any Fidelity Central Funds held as an investment as of period end, but does not include the underlying holdings of each Fidelity Central Fund. An investing fund indirectly bears its proportionate share of the expenses of the underlying Fidelity Central Funds.
Based on its investment objective, each Fidelity Central Fund may invest or participate in various investment vehicles or strategies that are similar to those of the investing fund. These strategies are consistent with the investment objectives of the investing fund and may involve certain economic risks which may cause a decline in value of each of the Fidelity Central Funds and thus a decline in the value of the investing fund.
| Fidelity Central Fund | Investment Manager | Investment Objective | Investment Practices | Expense Ratio A |
| Fidelity Money Market Central Funds | Fidelity Management & Research Company LLC (FMR) | Each fund seeks to obtain a high level of current income consistent with the preservation of capital and liquidity. | Short-term Investments | Less than .005% |
A Expenses expressed as a percentage of average net assets and are as of each underlying Central Fund's most recent annual or semi-annual shareholder report.
A complete unaudited list of holdings for each Fidelity Central Fund is available upon request or at the Securities and Exchange Commission website at www.sec.gov. In addition, the financial statements of the Fidelity Central Funds which contain the significant accounting policies (including investment valuation policies) of those funds, and are not covered by the Report of Independent Registered Public Accounting Firm, are available on the Securities and Exchange Commission website or upon request.
3. Significant Accounting Policies.
The Fund is an investment company and applies the accounting and reporting guidance of the Financial Accounting Standards Board (FASB) Accounting Standards Codification Topic 946 Financial Services - Investment Companies . The financial statements have been prepared in conformity with accounting principles generally accepted in the United States of America (GAAP), which require management to make certain estimates and assumptions at the date of the financial statements. Actual results could differ from those estimates. Subsequent events, if any, through the date that the financial statements were issued have been evaluated in the preparation of the financial statements. The Fund's Schedule of Investments lists any underlying mutual funds or exchange-traded funds (ETFs) but does not include the underlying holdings of these funds. The following summarizes the significant accounting policies of the Fund:
Investment Valuation. Investments are valued as of 4:00 p.m. Eastern time on the last calendar day of the period. The Board of Trustees (the Board) has designated the Fund's investment adviser as the valuation designee responsible for the fair valuation function and performing fair value determinations as needed. The investment adviser has established a Fair Value Committee (the Committee) to carry out the day-to-day fair valuation responsibilities and has adopted policies and procedures to govern the fair valuation process and the activities of the Committee. In accordance with these fair valuation policies and procedures, which have been approved by the Board, the Fund attempts to obtain prices from one or more third party pricing services or brokers to value its investments. When current market prices, quotations or currency exchange rates are not readily available or reliable, investments will be fair valued in good faith by the Committee, in accordance with the policies and procedures. Factors used in determining fair value vary by investment type and may include market or investment specific events, transaction data, estimated cash flows, and market observations of comparable investments. The frequency that the fair valuation procedures are used cannot be predicted and they may be utilized to a significant extent. The Committee manages the Fund's fair valuation practices and maintains the fair valuation policies and procedures. The Fund's investment adviser reports to the Board information regarding the fair valuation process and related material matters.
The Fund categorizes the inputs to valuation techniques used to value its investments into a disclosure hierarchy consisting of three levels as shown below:
Level 1 - unadjusted quoted prices in active markets for identical investments
Level 2 - other significant observable inputs (including quoted prices for similar investments, interest rates, prepayment speeds, etc.)
Level 3 - unobservable inputs (including the Fund's own assumptions based on the best information available)
Valuation techniques used to value the Fund's investments by major category are as follows:
Equity securities, including restricted securities, for which market quotations are readily available, are valued at the last reported sale price or official closing price as reported by a third party pricing service on the primary market or exchange on which they are traded and are categorized as Level 1 in the hierarchy. In the event there were no sales during the day or closing prices are not available, securities are valued at the last quoted bid price or may be valued using the last available price and are generally categorized as Level 2 in the hierarchy. For foreign equity securities, when market or security specific events arise, comparisons to the valuation of American Depositary Receipts (ADRs), futures contracts, ETFs and certain indexes as well as quoted prices for similar securities may be used and would be categorized as Level 2 in the hierarchy. For equity securities, including restricted securities, where observable inputs are limited, assumptions about market activity and risk are used and these securities may be categorized as Level 3 in the hierarchy.
Investments in open-end mutual funds, including the Fidelity Central Funds, are valued at their closing net asset value (NAV) each business day and are categorized as Level 1 in the hierarchy.
Changes in valuation techniques may result in transfers in or out of an assigned level within the disclosure hierarchy. The aggregate value of investments by input level as of April 30, 2023, is included at the end of the Fund's Schedule of Investments.
Foreign Currency. Certain Funds may use foreign currency contracts to facilitate transactions in foreign-denominated securities. Gains and losses from these transactions may arise from changes in the value of the foreign currency or if the counterparties do not perform under the contracts' terms.
Foreign-denominated assets, including investment securities, and liabilities are translated into U.S. dollars at the exchange rates at period end. Purchases and sales of investment securities, income and dividends received, and expenses denominated in foreign currencies are translated into U.S. dollars at the exchange rate in effect on the transaction date.
The effects of exchange rate fluctuations on investments are included with the net realized and unrealized gain (loss) on investment securities. Other foreign currency transactions resulting in realized and unrealized gain (loss) are disclosed separately.
Investment Transactions and Income. For financial reporting purposes, the Fund's investment holdings and NAV include trades executed through the end of the last business day of the period. The NAV per share for processing shareholder transactions is calculated as of the close of business of the New York Stock Exchange (NYSE), normally 4:00 p.m. Eastern time and includes trades executed through the end of the prior business day. Gains and losses on securities sold are determined on the basis of identified cost. Commissions paid to certain brokers with whom the investment adviser, or its affiliates, places trades on behalf of a fund include an amount in addition to trade execution, which may be rebated back to a fund. Any such rebates are included in net realized gain (loss) on investments in the Statement of Operations. Dividend income is recorded on the ex-dividend date, except for certain dividends from foreign securities where the ex-dividend date may have passed, which are recorded as soon as the Fund is informed of the ex-dividend date. Non-cash dividends included in dividend income, if any, are recorded at the fair market value of the securities received. Income and capital gain distributions from Fidelity Central Funds, if any, are recorded on the ex-dividend date. Investment income is recorded net of foreign taxes withheld where recovery of such taxes is uncertain.
Class Allocations and Expenses. Investment income, realized and unrealized capital gains and losses, common expenses of a fund, and certain fund-level expense reductions, if any, are allocated daily on a pro-rata basis to each class based on the relative net assets of each class to the total net assets of a fund. Each class differs with respect to transfer agent and distribution and service plan fees incurred, as applicable. Certain expense reductions may also differ by class, if applicable. For the reporting period, the allocated portion of income and expenses to each class as a percent of its average net assets may vary due to the timing of recording these transactions in relation to fluctuating net assets of the classes. Expenses directly attributable to a fund are charged to that fund. Expenses attributable to more than one fund are allocated among the respective funds on the basis of relative net assets or other appropriate methods. Expenses included in the accompanying financial statements reflect the expenses of that fund and do not include any expenses associated with any underlying mutual funds or exchange-traded funds. Although not included in a fund's expenses, a fund indirectly bears its proportionate share of these expenses through the net asset value of each underlying mutual fund or exchange-traded fund. Expense estimates are accrued in the period to which they relate and adjustments are made when actual amounts are known.
Income Tax Information and Distributions to Shareholders. Each year, the Fund intends to qualify as a regulated investment company under Subchapter M of the Internal Revenue Code, including distributing substantially all of its taxable income and realized gains. As a result, no provision for U.S. Federal income taxes is required. The Fund files a U.S. federal tax return, in addition to state and local tax returns as required. The Fund's federal income tax returns are subject to examination by the Internal Revenue Service (IRS) for a period of three fiscal years after they are filed. State and local tax returns may be subject to examination for an additional fiscal year depending on the jurisdiction. Foreign taxes are provided for based on the Fund's understanding of the tax rules and rates that exist in the foreign markets in which it invests. The Fund is subject to a tax imposed on capital gains by certain countries in which it invests. An estimated deferred tax liability for net unrealized appreciation on the applicable securities is included in Other payables and accrued expenses on the Statement of Assets & Liabilities.
Distributions are declared and recorded on the ex-dividend date. Income and capital gain distributions are declared separately for each class. Income and capital gain distributions are determined in accordance with income tax regulations, which may differ from GAAP.
Capital accounts within the financial statements are adjusted for permanent book-tax differences. These adjustments have no impact on net assets or the results of operations. Capital accounts are not adjusted for temporary book-tax differences which will reverse in a subsequent period.
Book-tax differences are primarily due to futures contracts, foreign currency transactions, passive foreign investment companies (PFIC), capital loss carryforwards and losses deferred due to wash sales.
As of period end, the cost and unrealized appreciation (depreciation) in securities, and derivatives if applicable, for federal income tax purposes were as follows:
| Gross unrealized appreciation | $285,028 |
| Gross unrealized depreciation | (330,952) |
| Net unrealized appreciation (depreciation) | $(45,924) |
| Tax cost | $4,364,952 |
Capital loss carryforwards are only available to offset future capital gains of the Fund to the extent provided by regulations and may be limited. The capital loss carryforward information presented below, including any applicable limitation, is estimated as of prior fiscal period end and is subject to adjustment.
Short-term | $(285,926) |
Long-term | (16,652) |
| Total capital loss carryforward | $(302,578) |
Due to large subscriptions in a prior period, $89,764 of capital losses that will be available to offset future capital gains of the Fund will be limited to approximately $57,333 per year.
Restricted Securities (including Private Placements). Funds may invest in securities that are subject to legal or contractual restrictions on resale. These securities generally may be resold in transactions exempt from registration or to the public if the securities are registered. Disposal of these securities may involve time-consuming negotiations and expense, and prompt sale at an acceptable price may be difficult. Information regarding restricted securities held at period end is included at the end of the Schedule of Investments, if applicable.
4. Derivative Instruments.
Risk Exposures and the Use of Derivative Instruments. The Fund's investment objectives allow for various types of derivative instruments, including futures contracts. Derivatives are investments whose value is primarily derived from underlying assets, indices or reference rates and may be transacted on an exchange or over-the-counter (OTC). Derivatives may involve a future commitment to buy or sell a specified asset based on specified terms, to exchange future cash flows at periodic intervals based on a notional principal amount, or for one party to make one or more payments upon the occurrence of specified events in exchange for periodic payments from the other party.
Derivatives were used to increase returns and to manage exposure to certain risks as defined below. The success of any strategy involving derivatives depends on analysis of numerous economic factors, and if the strategies for investment do not work as intended, the objectives may not be achieved.
Derivatives were used to increase or decrease exposure to the following risk(s):
| Equity Risk | Equity risk relates to the fluctuations in the value of financial instruments as a result of changes in market prices (other than those arising from interest rate risk or foreign exchange risk), whether caused by factors specific to an individual investment, its issuer, or all factors affecting all instruments traded in a market or market segment. |
Funds are also exposed to additional risks from investing in derivatives, such as liquidity risk and counterparty credit risk. Liquidity risk is the risk that a fund will be unable to close out the derivative in the open market in a timely manner. Counterparty credit risk is the risk that the counterparty will not be able to fulfill its obligation to a fund. Counterparty credit risk related to exchange-traded contracts may be mitigated by the protection provided by the exchange on which they trade.
Investing in derivatives may involve greater risks than investing in the underlying assets directly and, to varying degrees, may involve risk of loss in excess of any initial investment and collateral received and amounts recognized in the Statement of Assets and Liabilities. In addition, there may be the risk that the change in value of the derivative contract does not correspond to the change in value of the underlying instrument.
Futures Contracts. A futures contract is an agreement between two parties to buy or sell a specified underlying instrument for a fixed price at a specified future date. Futures contracts were used to manage exposure to the stock market.
Upon entering into a futures contract, a fund is required to deposit either cash or securities (initial margin) with a clearing broker in an amount equal to a certain percentage of the face value of the contract. Futures contracts are marked-to-market daily and subsequent daily payments are made or received by a fund depending on the daily fluctuations in the value of the futures contracts and are recorded as unrealized appreciation or (depreciation). This receivable and/or payable, if any, is included in daily variation margin on futures contracts in the Statement of Assets and Liabilities. Realized gain or (loss) is recorded upon the expiration or closing of a futures contract. The net realized gain (loss) and change in net unrealized appreciation (depreciation) on futures contracts during the period is presented in the Statement of Operations.
Any open futures contracts at period end are presented in the Schedule of Investments under the caption "Futures Contracts". The notional amount at value reflects each contract's exposure to the underlying instrument or index at period end, and is representative of volume of activity during the period unless an average notional amount is presented. Any securities deposited to meet initial margin requirements are identified in the Schedule of Investments. Any cash deposited to meet initial margin requirements is presented as segregated cash with brokers for derivative instruments in the Statement of Assets and Liabilities.
5. Purchases and Sales of Investments.
Purchases and sales of securities, other than short-term securities and in-kind transactions, as applicable, are noted in the table below.
| | Purchases ($) | Sales ($) |
| Fidelity Sustainable Emerging Markets Equity Fund | 3,617,324 | 2,853,590 |
6. Fees and Other Transactions with Affiliates.
Management Fee. Fidelity Management & Research Company LLC (the investment adviser) and its affiliates provide the Fund with investment management related services for which the Fund pays a monthly management fee. The management fee is the sum of an individual fund fee rate that is based on an annual rate of .55% of the Fund's average net assets and an annualized group fee rate that averaged .23% during the period. The group fee rate is based upon the monthly average net assets of a group of registered investment companies with which the investment adviser has management contracts. The group fee rate decreases as assets under management increase and increases as assets under management decrease. In addition, the management fee is subject to a performance adjustment (up to a maximum of +/- .10% of the Fund's average net assets over a 36 month performance period). The upward or downward adjustment to the management fee is based on the relative investment performance of the Fund as compared to its benchmark index, the MSCI Emerging Markets Index, over the same 36 month performance period. The Fund's performance adjustment took effect in February 28, 2023. Subsequent months will be added until the performance period includes 36 months. For the reporting period, the total annualized management fee rate, including the performance adjustment, was .78% of the Fund's average net assets. The performance adjustment included in the management fee rate may be higher or lower than the maximum performance adjustment rate due to the difference between the average net assets for the reporting and performance periods.
Distribution and Service Plan Fees. In accordance with Rule 12b-1 of the 1940 Act, the Fund has adopted separate Distribution and Service Plans for each class of shares. Certain classes pay Fidelity Distributors Company LLC (FDC), an affiliate of the investment adviser, separate Distribution and Service Fees, each of which is based on an annual percentage of each class' average net assets. In addition, FDC may pay financial intermediaries for selling shares of the Fund and providing shareholder support services. For the period, the Distribution and Service Fee rates, total fees and amounts retained by FDC were as follows:
| | Distribution Fee | Service Fee | Total Fees | Retained by FDC |
| Class A | -% | .25% | $289 | $244 |
| Class M | .25% | .25% | 486 | 486 |
| Class C | .75% | .25% | 981 | 968 |
| | | | $1,756 | $1,698 |
Sales Load. FDC may receive a front-end sales charge of up to 5.75% for selling Class A shares and 3.50% for selling Class M shares, some of which is paid to financial intermediaries for selling shares of the Fund. Depending on the holding period, FDC may receive contingent deferred sales charges levied on Class A, Class M and Class C redemptions. The deferred sales charges are 1.00% for Class C shares, 1.00% for certain purchases of Class A shares and .25% for certain purchases of Class M shares.
Transfer Agent Fees. Fidelity Investments Institutional Operations Company LLC (FIIOC), an affiliate of the investment adviser, is the transfer, dividend disbursing and shareholder servicing agent for each class of the Fund. FIIOC receives account fees and asset-based fees that vary according to the account size and type of account of the shareholders of the respective classes of the Fund, except for Class Z. FIIOC receives an asset-based fee of Class Z's average net assets. FIIOC pays for typesetting, printing and mailing of shareholder reports, except proxy statements.
For the period, transfer agent fees for each class were as follows:
| | Amount | % of Class-Level Average Net Assets A |
| Class A | $217 | .19 |
| Class M | 109 | .11 |
| Class C | 116 | .12 |
| Fidelity Sustainable Emerging Markets Equity Fund | 3,763 | .23 |
| Class I | 117 | .12 |
| Class Z | 69 | .04 |
| | $4,391 | |
A Annualized
Accounting Fees. Fidelity Service Company, Inc. (FSC), an affiliate of the investment adviser, maintains the Fund's accounting records. The accounting fee is based on the level of average net assets for each month. For the period, the fees were equivalent to the following annualized rates:
| | % of Average Net Assets |
| Fidelity Sustainable Emerging Markets Equity Fund | .05 |
Brokerage Commissions. A portion of portfolio transactions were placed with brokerage firms which are affiliates of the investment adviser. Brokerage commissions are included in net realized gain (loss) and change in net unrealized appreciation (depreciation) in the Statement of Operations. The commissions paid to these affiliated firms were as follows:
| | Amount |
| Fidelity Sustainable Emerging Markets Equity Fund | $16 |
Interfund Trades. Funds may purchase from or sell securities to other Fidelity Funds under procedures adopted by the Board. The procedures have been designed to ensure these interfund trades are executed in accordance with Rule 17a-7 of the 1940 Act. Any interfund trades are included within the respective purchases and sales amounts shown in the Purchases and Sales of Investments note. Interfund trades during the period are noted in the table below.
| | Purchases ($) | Sales ($) | Realized Gain (Loss) ($) |
| Fidelity Sustainable Emerging Markets Equity Fund | 30,788 | 54,954 | (7,880) |
7. Committed Line of Credit.
Certain Funds participate with other funds managed by the investment adviser or an affiliate in a $4.25 billion credit facility (the "line of credit") to be utilized for temporary or emergency purposes to fund shareholder redemptions or for other short-term liquidity purposes. The participating funds have agreed to pay commitment fees on their pro-rata portion of the line of credit, which are reflected in Miscellaneous expenses on the Statement of Operations, and are listed below. During the period, there were no borrowings on this line of credit.
| | Amount |
| Fidelity Sustainable Emerging Markets Equity Fund | $4 |
8. Expense Reductions.
The investment adviser contractually agreed to reimburse expenses of each class to the extent annual operating expenses exceeded certain levels of class-level average net assets as noted in the table below. This reimbursement will remain in place through February 29, 2024. Some expenses, for example the compensation of the independent Trustees, and certain miscellaneous expenses such as proxy and shareholder meeting expenses, are excluded from this reimbursement.
The following classes were in reimbursement during the period:
| | Expense Limitations | Reimbursement |
| Class A | 1.50% | $8,267 |
| Class M | 1.75% | 6,810 |
| Class C | 2.25% | 6,865 |
| Fidelity Sustainable Emerging Markets Equity Fund | 1.25% | 114,115 |
| Class I | 1.25% | 7,061 |
| Class Z | 1.10% | 11,661 |
| | | $154,779 |
Through arrangements with the Fund's custodian, credits realized as a result of certain uninvested cash balances were used to reduce the Fund's expenses. During the period, custodian credits reduced the Fund's expenses by $164.
In addition, during the period the investment adviser or an affiliate reimbursed and/or waived a portion of fund-level operating expenses in the amount of $99.
9. Distributions to Shareholders.
Distributions to shareholders of each class were as follows:
| | Six months ended April 30, 2023 | Year ended October 31, 2022 A |
| Fidelity Sustainable Emerging Markets Equity Fund | | |
| Distributions to shareholders | | |
| Class A | $1,114 | $- |
| Class M | 450 | - |
| Fidelity Sustainable Emerging Markets Equity Fund | 18,515 | - |
| Class I | 1,326 | - |
| Class Z | 2,225 | - |
| Total | $23,630 | $- |
A For the period February 10, 2022 (commencement of operations) through October 31, 2022.
10. Share Transactions.
Share transactions for each class were as follows and may contain in-kind transactions, automatic conversions between classes or exchanges between affiliated funds:
| | Shares | Shares | Dollars | Dollars |
| | Six months ended April 30, 2023 | Year ended October 31, 2022 A | Six months ended April 30, 2023 | Year ended October 31, 2022 A |
| Fidelity Sustainable Emerging Markets Equity Fund | | | | |
| Class A | | | | |
| Shares sold | 8,116 | 25,041 | $62,655 | $250,393 |
| Reinvestment of distributions | 147 | - | 1,114 | - |
| Shares redeemed | (2,471) | (41) | (20,694) | (320) |
| Net increase (decrease) | 5,792 | 25,000 | $43,075 | $250,073 |
| Class M | | | | |
| Shares sold | 6 | 25,000 | $48 | $250,003 |
| Reinvestment of distributions | 59 | - | 450 | - |
| Net increase (decrease) | 65 | 25,000 | $498 | $250,003 |
| Class C | | | | |
| Shares sold | 658 | 25,000 | $5,392 | $250,000 |
| Net increase (decrease) | 658 | 25,000 | $5,392 | $250,000 |
| Fidelity Sustainable Emerging Markets Equity Fund | | | | |
| Shares sold | 274,168 | 382,605 | $2,208,394 | $3,306,578 |
| Reinvestment of distributions | 2,252 | - | 17,120 | - |
| Shares redeemed | (196,993) | (65,540) | (1,550,517) | (507,726) |
| Net increase (decrease) | 79,427 | 317,065 | $674,997 | $2,798,852 |
| Class I | | | | |
| Shares sold | 1,962 | 25,000 | $15,875 | $250,000 |
| Reinvestment of distributions | 174 | - | 1,326 | - |
| Net increase (decrease) | 2,136 | 25,000 | $17,201 | $250,000 |
| Class Z | | | | |
| Shares sold | - | 42,008 | $ - | $369,361 |
| Reinvestment of distributions | 174 | - | 1,326 | - |
| Shares redeemed | - | (52) | - | (404) |
| Net increase (decrease) | 174 | 41,956 | $1,326 | $368,957 |
A For the period February 10, 2022 (commencement of operations) through October 31, 2022.
11. Other.
A fund's organizational documents provide former and current trustees and officers with a limited indemnification against liabilities arising in connection with the performance of their duties to the fund. In the normal course of business, a fund may also enter into contracts that provide general indemnifications. A fund's maximum exposure under these arrangements is unknown as this would be dependent on future claims that may be made against a fund. The risk of material loss from such claims is considered remote.
At the end of the period, the investment adviser or its affiliates were owners of record of more than 10% of the outstanding shares as follows:
| | Affiliated % |
| Fund | |
| Fidelity Sustainable Emerging Markets Equity Fund | 33% |
In addition, at the end of the period, the following mutual funds managed by the investment adviser or its affiliates were the owners of record of 10% or more of the total outstanding shares.
| | Fidelity Sustainable Multi-Asset Fund |
| Fidelity Sustainable Emerging Markets Equity Fund | 14% |
12. Risk and Uncertainties.
Many factors affect a fund's performance. Developments that disrupt global economies and financial markets, such as pandemics, epidemics, outbreaks of infectious diseases, war, terrorism, and environmental disasters, may significantly affect a fund's investment performance. The effects of these developments to a fund will be impacted by the types of securities in which a fund invests, the financial condition, industry, economic sector, and geographic location of an issuer, and a fund's level of investment in the securities of that issuer. Significant concentrations in security types, issuers, industries, sectors, and geographic locations may magnify the factors that affect a fund's performance.
As a shareholder, you incur two types of costs: (1) transaction costs, which may include sales charges (loads) on purchase payments or redemption proceeds, as applicable and (2) ongoing costs, which generally include management fees, distribution and/or service (12b-1) fees and other Fund expenses. This Example is intended to help you understand your ongoing costs (in dollars) of investing in a fund and to compare these costs with the ongoing costs of investing in other mutual funds.
| The Example is based on an investment of $1,000 invested at the beginning of the period and held for the entire period (November 1, 2022 to April 30, 2023). |
Actual Expenses
The first line of the accompanying table provides information about actual account values and actual expenses. You may use the information in this line, together with the amount you invested, to estimate the expenses that you paid over the period. Simply divide your account value by $1,000.00 (for example, an $8,600 account value divided by $1,000.00 = 8.6), then multiply the result by the number in the first line for a class/Fund under the heading entitled "Expenses Paid During Period" to estimate the expenses you paid on your account during this period. If any fund is a shareholder of any underlying mutual funds or exchange-traded funds (ETFs) (the Underlying Funds), such fund indirectly bears its proportional share of the expenses of the Underlying Funds in addition to the direct expenses incurred presented in the table. These fees and expenses are not included in the annualized expense ratio used to calculate the expense estimate in the table below.
Hypothetical Example for Comparison Purposes
The second line of the accompanying table provides information about hypothetical account values and hypothetical expenses based on the actual expense ratio and an assumed rate of return of 5% per year before expenses, which is not the actual return. The hypothetical account values and expenses may not be used to estimate the actual ending account balance or expenses you paid for the period. You may use this information to compare the ongoing costs of investing in the Fund and other funds. To do so, compare this 5% hypothetical example with the 5% hypothetical examples that appear in the shareholder reports of the other funds. If any fund is a shareholder of any Underlying Funds, such fund indirectly bears its proportional share of the expenses of the Underlying Funds in addition to the direct expenses as presented in the table. These fees and expenses are not included in the annualized expense ratio used to calculate the expense estimate in the table below.
Please note that the expenses shown in the table are meant to highlight your ongoing costs only and do not reflect any transaction costs. Therefore, the second line of the table is useful in comparing ongoing costs only, and will not help you determine the relative total costs of owning different funds. In addition, if these transactional costs were included, your costs would have been higher.
| | | | | Annualized Expense Ratio- A | | Beginning Account Value November 1, 2022 | | Ending Account Value April 30, 2023 | | Expenses Paid During Period- C November 1, 2022 to April 30, 2023 |
| Fidelity® Sustainable Emerging Markets Equity Fund | | | | | | | | | | |
| Class A | | | | 1.50% | | | | | | |
| Actual | | | | | | $ 1,000 | | $ 1,193.70 | | $ 8.16 |
Hypothetical- B | | | | | | $ 1,000 | | $ 1,017.36 | | $ 7.50 |
| Class M | | | | 1.75% | | | | | | |
| Actual | | | | | | $ 1,000 | | $ 1,192.40 | | $ 9.51 |
Hypothetical- B | | | | | | $ 1,000 | | $ 1,016.12 | | $ 8.75 |
| Class C | | | | 2.25% | | | | | | |
| Actual | | | | | | $ 1,000 | | $ 1,188.70 | | $ 12.21 |
Hypothetical- B | | | | | | $ 1,000 | | $ 1,013.64 | | $ 11.23 |
| Fidelity® Sustainable Emerging Markets Equity Fund | | | | 1.25% | | | | | | |
| Actual | | | | | | $ 1,000 | | $ 1,194.00 | | $ 6.80 |
Hypothetical- B | | | | | | $ 1,000 | | $ 1,018.60 | | $ 6.26 |
| Class I | | | | 1.25% | | | | | | |
| Actual | | | | | | $ 1,000 | | $ 1,194.00 | | $ 6.80 |
Hypothetical- B | | | | | | $ 1,000 | | $ 1,018.60 | | $ 6.26 |
| Class Z | | | | 1.10% | | | | | | |
| Actual | | | | | | $ 1,000 | | $ 1,195.50 | | $ 5.99 |
Hypothetical- B | | | | | | $ 1,000 | | $ 1,019.34 | | $ 5.51 |
| |
A Annualized expense ratio reflects expenses net of applicable fee waivers.
B 5% return per year before expenses
C Expenses are equal to the annualized expense ratio, multiplied by the average account value over the period, multiplied by 181/ 365 (to reflect the one-half year period). The fees and expenses of any Underlying Funds are not included in each annualized expense ratio.
The Securities and Exchange Commission adopted Rule 22e-4 under the Investment Company Act of 1940 (the Liquidity Rule) to promote effective liquidity risk management throughout the open-end investment company industry, thereby reducing the risk that funds will be unable to meet their redemption obligations and mitigating dilution of the interests of fund shareholders.
The Fund has adopted and implemented a liquidity risk management program (the Program) reasonably designed to assess and manage the Fund's liquidity risk and to comply with the requirements of the Liquidity Rule. The Fund's Board of Trustees (the Board) has designated the Fund's investment adviser as administrator of the Program. The Fidelity advisers have established a Liquidity Risk Management Committee (the LRM Committee) to manage the Program for each of the Fidelity Funds. The LRM Committee monitors the adequacy and effectiveness of implementation of the Program and on a periodic basis assesses each Fund's liquidity risk based on a variety of factors including (1) the Fund's investment strategy, (2) portfolio liquidity and cash flow projections during normal and reasonably foreseeable stressed conditions, (3) shareholder redemptions, (4) borrowings and other funding sources and (5) certain factors specific to ETFs including the effect of the Fund's prices and spreads, market participants, and basket compositions on the overall liquidity of the Fund's portfolio, as applicable.
In accordance with the Program, each of the Fund's portfolio investments is classified into one of four defined liquidity categories based on a determination of a reasonable expectation for how long it would take to convert the investment to cash (or sell or dispose of the investment) without significantly changing its market value.
- Highly liquid investments - cash or convertible to cash within three business days or less
- Moderately liquid investments - convertible to cash in three to seven calendar days
- Less liquid investments - can be sold or disposed of, but not settled, within seven calendar days
- Illiquid investments - cannot be sold or disposed of within seven calendar days
Liquidity classification determinations take into account a variety of factors including various market, trading and investment-specific considerations, as well as market depth, and generally utilize analysis from a third-party liquidity metrics service.
The Liquidity Rule places a 15% limit on a fund's illiquid investments and requires funds that do not primarily hold assets that are highly liquid investments to determine and maintain a minimum percentage of the fund's net assets to be invested in highly liquid investments (highly liquid investment minimum or HLIM). The Program includes provisions reasonably designed to comply with the 15% limit on illiquid investments and for determining, periodically reviewing and complying with the HLIM requirement as applicable.
At a recent meeting of the Fund's Board of Trustees, the LRM Committee provided a written report to the Board pertaining to the operation, adequacy, and effectiveness of the Program for the period December 1, 2021 through November 30, 2022. The report concluded that the Program is operating effectively and is reasonably designed to assess and manage the Fund's liquidity risk.
1.9905244.101
MAR-SANN-0623
Fidelity® International Growth Fund
Semi-Annual Report
April 30, 2023
Includes Fidelity and Fidelity Advisor share classes
Contents
To view a fund's proxy voting guidelines and proxy voting record for the 12-month period ended June 30, visit http://www.fidelity.com/proxyvotingresults or visit the Securities and Exchange Commission's (SEC) web site at http://www.sec.gov.
You may also call 1-800-544-8544 if you're an individual investing directly with Fidelity, call 1-800-835-5092 if you're a plan sponsor or participant with Fidelity as your recordkeeper or call 1-877-208-0098 on institutional accounts or if you're an advisor or invest through one to request a free copy of the proxy voting guidelines.
Standard & Poor's, S&P and S&P 500 are registered service marks of The McGraw-Hill Companies, Inc. and have been licensed for use by Fidelity Distributors Corporation.
Other third-party marks appearing herein are the property of their respective owners.
All other marks appearing herein are registered or unregistered trademarks or service marks of FMR LLC or an affiliated company. © 2023 FMR LLC. All rights reserved.
This report and the financial statements contained herein are submitted for the general information of the shareholders of the Fund. This report is not authorized for distribution to prospective investors in the Fund unless preceded or accompanied by an effective prospectus.
A fund files its complete schedule of portfolio holdings with the SEC for the first and third quarters of each fiscal year on Form N-PORT. Forms N-PORT are available on the SEC's web site at http://www.sec.gov. A fund's Forms N-PORT may be reviewed and copied at the SEC's Public Reference Room in Washington, DC. Information regarding the operation of the SEC's Public Reference Room may be obtained by calling 1-800-SEC-0330.
For a complete list of a fund's portfolio holdings, view the most recent holdings listing, semiannual report, or annual report on Fidelity's web site at http://www.fidelity.com, http://www.institutional.fidelity.com, or http://www.401k.com, as applicable.
NOT FDIC INSURED •MAY LOSE VALUE •NO BANK GUARANTEE
Neither the Fund nor Fidelity Distributors Corporation is a bank.
Top Holdings (% of Fund's net assets) |
| |
| LVMH Moet Hennessy Louis Vuitton SE (France, Textiles, Apparel & Luxury Goods) | 6.2 | |
| ASML Holding NV (Netherlands) (Netherlands, Semiconductors & Semiconductor Equipment) | 5.6 | |
| Nestle SA (Reg. S) (United States of America, Food Products) | 4.9 | |
| Linde PLC (United States of America, Chemicals) | 3.7 | |
| Keyence Corp. (Japan, Electronic Equipment, Instruments & Components) | 3.1 | |
| Novo Nordisk A/S Series B (Denmark, Pharmaceuticals) | 3.0 | |
| Safran SA (France, Aerospace & Defense) | 2.9 | |
| Atlas Copco AB (A Shares) (Sweden, Machinery) | 2.8 | |
| Marsh & McLennan Companies, Inc. (United States of America, Insurance) | 2.7 | |
| AIA Group Ltd. (Hong Kong, Insurance) | 2.6 | |
| | 37.5 | |
| |
| Market Sectors (% of Fund's net assets) |
| |
| Industrials | 27.0 | |
| Financials | 17.2 | |
| Information Technology | 15.2 | |
| Consumer Discretionary | 13.5 | |
| Health Care | 8.7 | |
| Materials | 7.6 | |
| Consumer Staples | 5.4 | |
| Communication Services | 1.5 | |
| Energy | 0.9 | |
| Real Estate | 0.2 | |
| |
Asset Allocation (% of Fund's net assets) |
|
|
Geographic Diversification (% of Fund's net assets) |
|
* Includes Short-Term investments and Net Other Assets (Liabilities). Percentages are adjusted for the effect of derivatives, if applicable. |
| |
Showing Percentage of Net Assets
| Common Stocks - 96.9% |
| | | Shares | Value ($) |
| Belgium - 0.4% | | | |
| Azelis Group NV | | 697,917 | 16,534,247 |
| Canada - 3.3% | | | |
| CAE, Inc. (a) | | 1,250,200 | 28,134,921 |
| Canadian Pacific Kansas City Ltd. | | 1,064,100 | 83,880,784 |
| Franco-Nevada Corp. | | 263,780 | 40,025,016 |
TOTAL CANADA | | | 152,040,721 |
| Denmark - 3.8% | | | |
| Novo Nordisk A/S Series B | | 858,300 | 142,782,067 |
| Vestas Wind Systems A/S | | 1,297,900 | 35,913,665 |
TOTAL DENMARK | | | 178,695,732 |
| Finland - 0.6% | | | |
| Kone OYJ (B Shares) | | 472,700 | 26,928,882 |
| France - 15.1% | | | |
| Adevinta ASA Class B (a) | | 1,400,258 | 10,774,197 |
| Airbus Group NV (b) | | 832,300 | 116,550,818 |
| Edenred SA | | 989,539 | 64,244,778 |
| Lectra | | 336,961 | 10,953,271 |
| Legrand SA | | 812,600 | 76,736,118 |
| LVMH Moet Hennessy Louis Vuitton SE (b) | | 299,200 | 287,794,887 |
| Safran SA | | 874,100 | 135,939,829 |
TOTAL FRANCE | | | 702,993,898 |
| Germany - 1.8% | | | |
| Deutsche Borse AG | | 378,600 | 72,202,294 |
| Vonovia SE | | 442,210 | 9,590,879 |
TOTAL GERMANY | | | 81,793,173 |
| Hong Kong - 2.6% | | | |
| AIA Group Ltd. | | 11,230,000 | 122,261,860 |
| India - 1.7% | | | |
| Housing Development Finance Corp. Ltd. | | 1,126,178 | 38,411,460 |
| Kotak Mahindra Bank Ltd. | | 893,600 | 21,290,177 |
| Reliance Industries Ltd. | | 410,000 | 12,188,682 |
| Reliance Industries Ltd. GDR (c) | | 153,600 | 9,154,560 |
TOTAL INDIA | | | 81,044,879 |
| Ireland - 1.9% | | | |
| CRH PLC sponsored ADR | | 1,780,166 | 86,338,051 |
| Israel - 1.3% | | | |
| NICE Ltd. sponsored ADR (a) | | 290,600 | 59,285,306 |
| Italy - 1.6% | | | |
| Interpump Group SpA | | 625,126 | 34,771,954 |
| Prada SpA | | 5,171,000 | 38,072,416 |
TOTAL ITALY | | | 72,844,370 |
| Japan - 11.1% | | | |
| Azbil Corp. | | 1,526,470 | 42,690,427 |
| FANUC Corp. | | 928,200 | 31,346,441 |
| Hoya Corp. | | 657,800 | 68,973,647 |
| Keyence Corp. | | 321,048 | 144,778,618 |
| Lasertec Corp. | | 263,800 | 35,888,943 |
| Misumi Group, Inc. | | 2,323,985 | 58,627,651 |
| OSG Corp. | | 723,100 | 10,157,897 |
| Recruit Holdings Co. Ltd. | | 2,595,400 | 72,810,332 |
| SHO-BOND Holdings Co. Ltd. | | 695,400 | 29,718,581 |
| USS Co. Ltd. | | 1,273,700 | 21,403,245 |
TOTAL JAPAN | | | 516,395,782 |
| Kenya - 0.2% | | | |
| Safaricom Ltd. | | 85,504,800 | 10,373,744 |
| Netherlands - 6.6% | | | |
| Aalberts Industries NV | | 225,000 | 10,358,411 |
| ASML Holding NV (Netherlands) | | 414,500 | 261,938,985 |
| IMCD NV | | 228,900 | 34,353,033 |
TOTAL NETHERLANDS | | | 306,650,429 |
| Norway - 0.3% | | | |
| Schibsted ASA (B Shares) | | 804,500 | 13,029,563 |
| South Africa - 0.2% | | | |
| Clicks Group Ltd. | | 610,138 | 8,917,004 |
| Spain - 2.3% | | | |
| Amadeus IT Holding SA Class A (a) | | 1,532,700 | 107,725,864 |
| Sweden - 6.7% | | | |
| ASSA ABLOY AB (B Shares) (b) | | 2,884,676 | 68,607,416 |
| Atlas Copco AB (A Shares) | | 9,241,500 | 133,462,650 |
| Autoliv, Inc. | | 417,269 | 35,805,853 |
| Epiroc AB (A Shares) | | 3,440,300 | 68,919,785 |
| Lagercrantz Group AB (B Shares) | | 548,100 | 7,044,293 |
TOTAL SWEDEN | | | 313,839,997 |
| Switzerland - 1.0% | | | |
| Schindler Holding AG: | | | |
| (participation certificate) | | 103,858 | 23,087,302 |
| (Reg.) | | 18,350 | 3,898,490 |
| UBS Group AG | | 911,240 | 18,416,458 |
TOTAL SWITZERLAND | | | 45,402,250 |
| Taiwan - 1.7% | | | |
| Taiwan Semiconductor Manufacturing Co. Ltd. | | 4,887,000 | 79,971,597 |
| United Kingdom - 5.7% | | | |
| BAE Systems PLC | | 3,621,500 | 46,137,852 |
| Compass Group PLC | | 3,614,800 | 95,361,895 |
| Dechra Pharmaceuticals PLC | | 237,400 | 11,128,546 |
| InterContinental Hotel Group PLC ADR (b) | | 648,770 | 44,946,786 |
| Rightmove PLC | | 2,907,600 | 20,981,993 |
| Spectris PLC | | 1,028,557 | 48,590,301 |
TOTAL UNITED KINGDOM | | | 267,147,373 |
| United States of America - 27.0% | | | |
| Experian PLC | | 2,029,500 | 71,854,210 |
| Lam Research Corp. | | 48,766 | 25,557,285 |
| Linde PLC | | 470,379 | 173,781,522 |
| Marsh & McLennan Companies, Inc. | | 703,951 | 126,844,931 |
| MasterCard, Inc. Class A | | 213,800 | 81,250,414 |
| Moody's Corp. | | 205,600 | 64,377,472 |
| MSCI, Inc. | | 161,500 | 77,915,675 |
| Nestle SA (Reg. S) | | 1,776,179 | 227,865,248 |
| NOV, Inc. | | 1,024,000 | 17,152,000 |
| Otis Worldwide Corp. | | 315,700 | 26,929,210 |
| PriceSmart, Inc. | | 189,998 | 13,999,053 |
| ResMed, Inc. | | 422,200 | 101,733,312 |
| Roche Holding AG (participation certificate) | | 263,873 | 82,629,246 |
| S&P Global, Inc. | | 168,100 | 60,949,698 |
| Sherwin-Williams Co. | | 214,600 | 50,976,084 |
| Visa, Inc. Class A | | 234,260 | 54,519,330 |
TOTAL UNITED STATES OF AMERICA | | | 1,258,334,690 |
| TOTAL COMMON STOCKS (Cost $3,055,578,438) | | | 4,508,549,412 |
| | | | |
| Convertible Preferred Stocks - 0.3% |
| | | Shares | Value ($) |
| China - 0.3% | | | |
ByteDance Ltd. Series E1 (a)(d)(e) (Cost $6,992,915) | | 63,819 | 12,699,981 |
| | | | |
| Money Market Funds - 10.6% |
| | | Shares | Value ($) |
| Fidelity Cash Central Fund 4.88% (f) | | 106,552,071 | 106,573,382 |
| Fidelity Securities Lending Cash Central Fund 4.88% (f)(g) | | 387,263,127 | 387,301,853 |
| TOTAL MONEY MARKET FUNDS (Cost $493,875,235) | | | 493,875,235 |
| | | | |
| TOTAL INVESTMENT IN SECURITIES - 107.8% (Cost $3,556,446,588) | 5,015,124,628 |
NET OTHER ASSETS (LIABILITIES) - (7.8)% | (362,574,608) |
| NET ASSETS - 100.0% | 4,652,550,020 |
| | |
Legend
| (b) | Security or a portion of the security is on loan at period end. |
| (c) | Security exempt from registration under Rule 144A of the Securities Act of 1933. These securities may be resold in transactions exempt from registration, normally to qualified institutional buyers. At the end of the period, the value of these securities amounted to $9,154,560 or 0.2% of net assets. |
| (d) | Restricted securities (including private placements) - Investment in securities not registered under the Securities Act of 1933 (excluding 144A issues). At the end of the period, the value of restricted securities (excluding 144A issues) amounted to $12,699,981 or 0.3% of net assets. |
| (f) | Affiliated fund that is generally available only to investment companies and other accounts managed by Fidelity Investments. The rate quoted is the annualized seven-day yield of the fund at period end. A complete unaudited listing of the fund's holdings as of its most recent quarter end is available upon request. In addition, each Fidelity Central Fund's financial statements are available on the SEC's website or upon request. |
| (g) | Investment made with cash collateral received from securities on loan. |
| Additional information on each restricted holding is as follows: |
| Security | Acquisition Date | Acquisition Cost ($) |
| ByteDance Ltd. Series E1 | 11/18/20 | 6,992,915 |
| | | |
Affiliated Central Funds
Fiscal year to date information regarding the Fund's investments in Fidelity Central Funds, including the ownership percentage, is presented below.
| Affiliate | Value, beginning of period ($) | Purchases ($) | Sales Proceeds ($) | Dividend Income ($) | Realized Gain (loss) ($) | Change in Unrealized appreciation (depreciation) ($) | Value, end of period ($) | % ownership, end of period |
| Fidelity Cash Central Fund 4.88% | 21,706,800 | 647,260,843 | 562,394,261 | 1,956,379 | 713 | (713) | 106,573,382 | 0.3% |
| Fidelity Securities Lending Cash Central Fund 4.88% | 34,813,698 | 717,988,388 | 365,500,233 | 241,312 | - | - | 387,301,853 | 1.2% |
| Total | 56,520,498 | 1,365,249,231 | 927,894,494 | 2,197,691 | 713 | (713) | 493,875,235 | |
| | | | | | | | | |
Amounts in the dividend income column in the above table include any capital gain distributions from underlying funds, which are presented in the corresponding line item in the Statement of Operations, if applicable.
Amounts in the dividend income column for Fidelity Securities Lending Cash Central Fund represents the income earned on investing cash collateral, less rebates paid to borrowers and any lending agent fees associated with the loan, plus any premium payments received for lending certain types of securities.
Amounts included in the purchases and sales proceeds columns may include in-kind transactions, if applicable.
Investment Valuation
The following is a summary of the inputs used, as of April 30, 2023, involving the Fund's assets and liabilities carried at fair value. The inputs or methodology used for valuing securities may not be an indication of the risk associated with investing in those securities. For more information on valuation inputs, and their aggregation into the levels used below, please refer to the Investment Valuation section in the accompanying Notes to Financial Statements.
| Valuation Inputs at Reporting Date: |
| Description | Total ($) | Level 1 ($) | Level 2 ($) | Level 3 ($) |
Investments in Securities: | | | | |
|
| Equities: | | | | |
Communication Services | 67,859,478 | 55,159,497 | - | 12,699,981 |
Consumer Discretionary | 631,110,946 | 80,752,639 | 550,358,307 | - |
Consumer Staples | 250,781,305 | 22,916,057 | 227,865,248 | - |
Energy | 38,495,242 | 26,306,560 | 12,188,682 | - |
Financials | 802,684,547 | 548,518,756 | 254,165,791 | - |
Health Care | 407,246,818 | 112,861,858 | 294,384,960 | - |
Industrials | 1,245,660,479 | 567,683,418 | 677,977,061 | - |
Information Technology | 716,699,026 | 413,369,441 | 303,329,585 | - |
Materials | 351,120,673 | 351,120,673 | - | - |
Real Estate | 9,590,879 | - | 9,590,879 | - |
|
| Money Market Funds | 493,875,235 | 493,875,235 | - | - |
| Total Investments in Securities: | 5,015,124,628 | 2,672,564,134 | 2,329,860,513 | 12,699,981 |
| Statement of Assets and Liabilities |
| | | | April 30, 2023 (Unaudited) |
| | | | | |
| Assets | | | | |
| Investment in securities, at value (including securities loaned of $370,034,009) - See accompanying schedule: | | | | |
Unaffiliated issuers (cost $3,062,571,353) | $ | 4,521,249,393 | | |
Fidelity Central Funds (cost $493,875,235) | | 493,875,235 | | |
| | | | | |
| | | | | |
| Total Investment in Securities (cost $3,556,446,588) | | | $ | 5,015,124,628 |
| Foreign currency held at value (cost $321,392) | | | | 313,192 |
| Receivable for investments sold | | | | 8,056,378 |
| Receivable for fund shares sold | | | | 3,014,726 |
| Dividends receivable | | | | 11,322,073 |
| Reclaims receivable | | | | 9,794,956 |
| Distributions receivable from Fidelity Central Funds | | | | 486,682 |
| Prepaid expenses | | | | 1,598 |
| Other receivables | | | | 1,183 |
Total assets | | | | 5,048,115,416 |
| Liabilities | | | | |
| Payable for investments purchased | $ | 422,499 | | |
| Payable for fund shares redeemed | | 3,224,752 | | |
| Accrued management fee | | 2,587,441 | | |
| Distribution and service plan fees payable | | 79,937 | | |
| Other affiliated payables | | 625,340 | | |
| Other payables and accrued expenses | | 1,324,277 | | |
| Collateral on securities loaned | | 387,301,150 | | |
| Total Liabilities | | | | 395,565,396 |
| Net Assets | | | $ | 4,652,550,020 |
| Net Assets consist of: | | | | |
| Paid in capital | | | $ | 3,244,333,059 |
| Total accumulated earnings (loss) | | | | 1,408,216,961 |
| Net Assets | | | $ | 4,652,550,020 |
| | | | | |
| Net Asset Value and Maximum Offering Price | | | | |
| Class A : | | | | |
Net Asset Value and redemption price per share ($185,039,732 ÷ 10,464,397 shares) (a) | | | $ | 17.68 |
| Maximum offering price per share (100/94.25 of $17.68) | | | $ | 18.76 |
| Class M : | | | | |
Net Asset Value and redemption price per share ($30,371,778 ÷ 1,731,889 shares) (a) | | | $ | 17.54 |
| Maximum offering price per share (100/96.50 of $17.54) | | | $ | 18.18 |
| Class C : | | | | |
Net Asset Value and offering price per share ($34,817,971 ÷ 2,054,174 shares) (a) | | | $ | 16.95 |
| International Growth : | | | | |
Net Asset Value , offering price and redemption price per share ($1,427,860,358 ÷ 79,933,638 shares) | | | $ | 17.86 |
| Class I : | | | | |
Net Asset Value , offering price and redemption price per share ($1,571,966,749 ÷ 88,227,654 shares) | | | $ | 17.82 |
| Class Z : | | | | |
Net Asset Value , offering price and redemption price per share ($1,402,493,432 ÷ 78,563,983 shares) | | | $ | 17.85 |
(a)Redemption price per share is equal to net asset value less any applicable contingent deferred sales charge. |
| Statement of Operations |
| | | | Six months ended April 30, 2023 (Unaudited) |
| Investment Income | | | | |
| Dividends | | | $ | 36,267,054 |
| Foreign Tax Reclaims | | | | 2,163,903 |
| Interest | | | | 697 |
| Income from Fidelity Central Funds (including $241,312 from security lending) | | | | 2,197,691 |
| Income before foreign taxes withheld | | | $ | 40,629,345 |
| Less foreign taxes withheld | | | | (6,068,517) |
| Total Income | | | | 34,560,828 |
| Expenses | | | | |
| Management fee | | | | |
| Basic fee | $ | 14,213,023 | | |
| Performance adjustment | | 860,021 | | |
| Transfer agent fees | | 2,930,301 | | |
| Distribution and service plan fees | | 470,433 | | |
| Accounting fees | | 731,410 | | |
| Custodian fees and expenses | | 180,982 | | |
| Independent trustees' fees and expenses | | 13,333 | | |
| Registration fees | | 110,525 | | |
| Audit | | 44,303 | | |
| Legal | | 3,096 | | |
| Interest | | 23,665 | | |
| Miscellaneous | | 8,817 | | |
| Total expenses before reductions | | 19,589,909 | | |
| Expense reductions | | (95,863) | | |
| Total expenses after reductions | | | | 19,494,046 |
| Net Investment income (loss) | | | | 15,066,782 |
| Realized and Unrealized Gain (Loss) | | | | |
| Net realized gain (loss) on: | | | | |
| Investment Securities: | | | | |
| Unaffiliated issuers | | (50,850,807) | | |
| Fidelity Central Funds | | 713 | | |
| Foreign currency transactions | | 70,556 | | |
| Total net realized gain (loss) | | | | (50,779,538) |
| Change in net unrealized appreciation (depreciation) on: | | | | |
| Investment Securities: | | | | |
| Unaffiliated issuers(net of increase in deferred foreign taxes of $547,372) | | 801,195,070 | | |
| Fidelity Central Funds | | (713) | | |
| Assets and liabilities in foreign currencies | | 865,255 | | |
| Total change in net unrealized appreciation (depreciation) | | | | 802,059,612 |
| Net gain (loss) | | | | 751,280,074 |
| Net increase (decrease) in net assets resulting from operations | | | $ | 766,346,856 |
| Statement of Changes in Net Assets |
| |
| | Six months ended April 30, 2023 (Unaudited) | | Year ended October 31, 2022 |
| Increase (Decrease) in Net Assets | | | | |
| Operations | | | | |
| Net investment income (loss) | $ | 15,066,782 | $ | 14,250,128 |
| Net realized gain (loss) | | (50,779,538) | | 85,832,715 |
| Change in net unrealized appreciation (depreciation) | | 802,059,612 | | (1,635,676,492) |
| Net increase (decrease) in net assets resulting from operations | | 766,346,856 | | (1,535,593,649) |
| Distributions to shareholders | | (63,050,595) | | (105,083,685) |
| Share transactions - net increase (decrease) | | 174,388,056 | | (1,611,089) |
| Total increase (decrease) in net assets | | 877,684,317 | | (1,642,288,423) |
| | | | | |
| Net Assets | | | | |
| Beginning of period | | 3,774,865,703 | | 5,417,154,126 |
| End of period | $ | 4,652,550,020 | $ | 3,774,865,703 |
| | | | | |
| | | | | |
Financial Highlights
| Fidelity Advisor® International Growth Fund Class A |
| |
| | Six months ended (Unaudited) April 30, 2023 | | Years ended October 31, 2022 | | 2021 | | 2020 | | 2019 | | 2018 |
Selected Per-Share Data | | | | | | | | | | | | |
| Net asset value, beginning of period | $ | 14.89 | $ | 21.04 | $ | 16.06 | $ | 15.03 | $ | 12.47 | $ | 13.34 |
| Income from Investment Operations | | | | | | | | | | | | |
Net investment income (loss) A,B | | .04 | | - C | | (.04) | | (.01) | | .15 D | | .09 |
| Net realized and unrealized gain (loss) | | 2.98 | | (5.80) | | 5.02 | | 1.16 | | 2.48 | | (.90) |
| Total from investment operations | | 3.02 | | (5.80) | | 4.98 | | 1.15 | | 2.63 | | (.81) |
| Distributions from net investment income | | - | | (.03) | | - | | (.12) | | (.07) | | (.04) |
| Distributions from net realized gain | | (.23) | | (.32) | | - | | - | | - | | (.02) |
| Total distributions | | (.23) | | (.35) | | - | | (.12) | | (.07) | | (.06) |
| Net asset value, end of period | $ | 17.68 | $ | 14.89 | $ | 21.04 | $ | 16.06 | $ | 15.03 | $ | 12.47 |
Total Return E,F,G | | 20.41% | | (28.00)% | | 31.01% | | 7.66% | | 21.25% | | (6.12)% |
Ratios to Average Net Assets B,H,I | | | | | | | | | | | | |
| Expenses before reductions | | 1.23% J | | 1.30% | | 1.28% | | 1.30% | | 1.28% | | 1.24% |
| Expenses net of fee waivers, if any | | 1.22% J | | 1.30% | | 1.28% | | 1.30% | | 1.28% | | 1.23% |
| Expenses net of all reductions | | 1.22% J | | 1.30% | | 1.28% | | 1.29% | | 1.27% | | 1.22% |
| Net investment income (loss) | | .42% J | | .02% | | (.20)% | | (.08)% | | 1.14% D | | .64% |
| Supplemental Data | | | | | | | | | | | | |
| Net assets, end of period (000 omitted) | $ | 185,040 | $ | 157,490 | $ | 232,527 | $ | 174,561 | $ | 164,247 | $ | 138,802 |
Portfolio turnover rate K | | 25% J | | 22% | | 21% | | 23% | | 21% | | 34% |
A Calculated based on average shares outstanding during the period.
B Net investment income (loss) is affected by the timing of the declaration of dividends by any underlying mutual funds or exchange-traded funds (ETFs). Net investment income (loss) of any mutual funds or ETFs is not included in the Fund's net investment income (loss) ratio.
C Amount represents less than $.005 per share.
D Net investment income per share reflects one or more large, non-recurring dividend(s) which amounted to $.07 per share. Excluding such non-recurring dividend(s), the ratio of net investment income (loss) to average net assets would have been .65%.
E Total returns for periods of less than one year are not annualized.
F Total returns would have been lower if certain expenses had not been reduced during the applicable periods shown.
G Total returns do not include the effect of the sales charges.
H Fees and expenses of any underlying mutual funds or exchange-traded funds (ETFs) are not included in the Fund's expense ratio. The Fund indirectly bears its proportionate share of these expenses. For additional expense information related to investments in Fidelity Central Funds, please refer to the "Investments in Fidelity Central Funds" note found in the Notes to Financial Statements section of the most recent Annual or Semi-Annual report.
I Expense ratios reflect operating expenses of the class. Expenses before reductions do not reflect amounts reimbursed, waived, or reduced through arrangements with the investment adviser, brokerage services, or other offset arrangements, if applicable, and do not represent the amount paid by the class during periods when reimbursements, waivers or reductions occur.
J Annualized.
K Amount does not include the portfolio activity of any underlying mutual funds or exchange-traded funds (ETFs).
| Fidelity Advisor® International Growth Fund Class M |
| |
| | Six months ended (Unaudited) April 30, 2023 | | Years ended October 31, 2022 | | 2021 | | 2020 | | 2019 | | 2018 |
Selected Per-Share Data | | | | | | | | | | | | |
| Net asset value, beginning of period | $ | 14.79 | $ | 20.92 | $ | 16.01 | $ | 14.99 | $ | 12.43 | $ | 13.30 |
| Income from Investment Operations | | | | | | | | | | | | |
Net investment income (loss) A,B | | .01 | | (.04) | | (.09) | | (.06) | | .11 C | | .05 |
| Net realized and unrealized gain (loss) | | 2.97 | | (5.77) | | 5.00 | | 1.15 | | 2.48 | | (.90) |
| Total from investment operations | | 2.98 | | (5.81) | | 4.91 | | 1.09 | | 2.59 | | (.85) |
| Distributions from net investment income | | - | | - | | - | | (.07) | | (.03) | | (.01) |
| Distributions from net realized gain | | (.23) | | (.32) | | - | | - | | - | | (.02) |
| Total distributions | | (.23) | | (.32) | | - | | (.07) | | (.03) | | (.02) D |
| Net asset value, end of period | $ | 17.54 | $ | 14.79 | $ | 20.92 | $ | 16.01 | $ | 14.99 | $ | 12.43 |
Total Return E,F,G | | 20.27% | | (28.18)% | | 30.67% | | 7.27% | | 20.92% | | (6.40)% |
Ratios to Average Net Assets B,H,I | | | | | | | | | | | | |
| Expenses before reductions | | 1.50% J | | 1.57% | | 1.55% | | 1.59% | | 1.58% | | 1.54% |
| Expenses net of fee waivers, if any | | 1.50% J | | 1.57% | | 1.55% | | 1.59% | | 1.58% | | 1.53% |
| Expenses net of all reductions | | 1.49% J | | 1.57% | | 1.55% | | 1.58% | | 1.58% | | 1.52% |
| Net investment income (loss) | | .16% J | | (.25)% | | (.48)% | | (.37)% | | .83% C | | .34% |
| Supplemental Data | | | | | | | | | | | | |
| Net assets, end of period (000 omitted) | $ | 30,372 | $ | 26,250 | $ | 38,761 | $ | 30,353 | $ | 28,534 | $ | 26,479 |
Portfolio turnover rate K | | 25% J | | 22% | | 21% | | 23% | | 21% | | 34% |
A Calculated based on average shares outstanding during the period.
B Net investment income (loss) is affected by the timing of the declaration of dividends by any underlying mutual funds or exchange-traded funds (ETFs). Net investment income (loss) of any mutual funds or ETFs is not included in the Fund's net investment income (loss) ratio.
C Net investment income per share reflects one or more large, non-recurring dividend(s) which amounted to $.07 per share. Excluding such non-recurring dividend(s), the ratio of net investment income (loss) to average net assets would have been .34%.
D Total distributions per share do not sum due to rounding.
E Total returns for periods of less than one year are not annualized.
F Total returns would have been lower if certain expenses had not been reduced during the applicable periods shown.
G Total returns do not include the effect of the sales charges.
H Fees and expenses of any underlying mutual funds or exchange-traded funds (ETFs) are not included in the Fund's expense ratio. The Fund indirectly bears its proportionate share of these expenses. For additional expense information related to investments in Fidelity Central Funds, please refer to the "Investments in Fidelity Central Funds" note found in the Notes to Financial Statements section of the most recent Annual or Semi-Annual report.
I Expense ratios reflect operating expenses of the class. Expenses before reductions do not reflect amounts reimbursed, waived, or reduced through arrangements with the investment adviser, brokerage services, or other offset arrangements, if applicable, and do not represent the amount paid by the class during periods when reimbursements, waivers or reductions occur.
J Annualized.
K Amount does not include the portfolio activity of any underlying mutual funds or exchange-traded funds (ETFs).
| Fidelity Advisor® International Growth Fund Class C |
| |
| | Six months ended (Unaudited) April 30, 2023 | | Years ended October 31, 2022 | | 2021 | | 2020 | | 2019 | | 2018 |
Selected Per-Share Data | | | | | | | | | | | | |
| Net asset value, beginning of period | $ | 14.33 | $ | 20.39 | $ | 15.68 | $ | 14.68 | $ | 12.20 | $ | 13.10 |
| Income from Investment Operations | | | | | | | | | | | | |
Net investment income (loss) A,B | | (.03) | | (.13) | | (.18) | | (.13) | | .05 C | | (.01) |
| Net realized and unrealized gain (loss) | | 2.88 | | (5.61) | | 4.89 | | 1.13 | | 2.43 | | (.89) |
| Total from investment operations | | 2.85 | | (5.74) | | 4.71 | | 1.00 | | 2.48 | | (.90) |
| Distributions from net realized gain | | (.23) | | (.32) | | - | | - | | - | | - |
| Total distributions | | (.23) | | (.32) | | - | | - | | - | | - |
| Net asset value, end of period | $ | 16.95 | $ | 14.33 | $ | 20.39 | $ | 15.68 | $ | 14.68 | $ | 12.20 |
Total Return D,E,F | | 20.02% | | (28.58)% | | 30.04% | | 6.81% | | 20.33% | | (6.87)% |
Ratios to Average Net Assets B,G,H | | | | | | | | | | | | |
| Expenses before reductions | | 1.99% I | | 2.07% | | 2.05% | | 2.07% | | 2.04% | | 1.99% |
| Expenses net of fee waivers, if any | | 1.99% I | | 2.06% | | 2.05% | | 2.07% | | 2.04% | | 1.99% |
| Expenses net of all reductions | | 1.99% I | | 2.06% | | 2.05% | | 2.06% | | 2.03% | | 1.98% |
| Net investment income (loss) | | (.34)% I | | (.74)% | | (.97)% | | (.85)% | | .38% C | | (.11)% |
| Supplemental Data | | | | | | | | | | | | |
| Net assets, end of period (000 omitted) | $ | 34,818 | $ | 33,575 | $ | 58,867 | $ | 55,013 | $ | 57,291 | $ | 60,489 |
Portfolio turnover rate J | | 25% I | | 22% | | 21% | | 23% | | 21% | | 34% |
A Calculated based on average shares outstanding during the period.
B Net investment income (loss) is affected by the timing of the declaration of dividends by any underlying mutual funds or exchange-traded funds (ETFs). Net investment income (loss) of any mutual funds or ETFs is not included in the Fund's net investment income (loss) ratio.
C Net investment income per share reflects one or more large, non-recurring dividend(s) which amounted to $.06 per share. Excluding such non-recurring dividend(s), the ratio of net investment income (loss) to average net assets would have been (.11)%.
D Total returns for periods of less than one year are not annualized.
E Total returns would have been lower if certain expenses had not been reduced during the applicable periods shown.
F Total returns do not include the effect of the contingent deferred sales charge.
G Fees and expenses of any underlying mutual funds or exchange-traded funds (ETFs) are not included in the Fund's expense ratio. The Fund indirectly bears its proportionate share of these expenses. For additional expense information related to investments in Fidelity Central Funds, please refer to the "Investments in Fidelity Central Funds" note found in the Notes to Financial Statements section of the most recent Annual or Semi-Annual report.
H Expense ratios reflect operating expenses of the class. Expenses before reductions do not reflect amounts reimbursed, waived, or reduced through arrangements with the investment adviser, brokerage services, or other offset arrangements, if applicable, and do not represent the amount paid by the class during periods when reimbursements, waivers or reductions occur.
I Annualized.
J Amount does not include the portfolio activity of any underlying mutual funds or exchange-traded funds (ETFs).
| Fidelity® International Growth Fund |
| |
| | Six months ended (Unaudited) April 30, 2023 | | Years ended October 31, 2022 | | 2021 | | 2020 | | 2019 | | 2018 |
Selected Per-Share Data | | | | | | | | | | | | |
| Net asset value, beginning of period | $ | 15.05 | $ | 21.26 | $ | 16.20 | $ | 15.16 | $ | 12.57 | $ | 13.45 |
| Income from Investment Operations | | | | | | | | | | | | |
Net investment income (loss) A,B | | .06 | | .05 | | .02 | | .03 | | .19 C | | .13 |
| Net realized and unrealized gain (loss) | | 3.02 | | (5.85) | | 5.06 | | 1.17 | | 2.51 | | (.92) |
| Total from investment operations | | 3.08 | | (5.80) | | 5.08 | | 1.20 | | 2.70 | | (.79) |
| Distributions from net investment income | | (.04) | | (.09) | | (.02) | | (.16) | | (.11) | | (.08) |
| Distributions from net realized gain | | (.23) | | (.32) | | - | | - | | - | | (.02) |
| Total distributions | | (.27) | | (.41) | | (.02) | | (.16) | | (.11) | | (.09) D |
| Net asset value, end of period | $ | 17.86 | $ | 15.05 | $ | 21.26 | $ | 16.20 | $ | 15.16 | $ | 12.57 |
Total Return E,F | | 20.58% | | (27.79)% | | 31.38% | | 7.93% | | 21.66% | | (5.89)% |
Ratios to Average Net Assets B,G,H | | | | | | | | | | | | |
| Expenses before reductions | | .94% I | | 1.01% | | .99% | | 1.01% | | .99% | | .95% |
| Expenses net of fee waivers, if any | | .94% I | | 1.01% | | .99% | | 1.01% | | .99% | | .95% |
| Expenses net of all reductions | | .94% I | | 1.01% | | .99% | | 1.00% | | .99% | | .94% |
| Net investment income (loss) | | .71% I | | .31% | | .09% | | .21% | | 1.42% C | | .93% |
| Supplemental Data | | | | | | | | | | | | |
| Net assets, end of period (000 omitted) | $ | 1,427,860 | $ | 1,194,442 | $ | 1,773,433 | $ | 1,292,392 | $ | 1,040,532 | $ | 811,101 |
Portfolio turnover rate J | | 25% I | | 22% | | 21% | | 23% | | 21% | | 34% |
A Calculated based on average shares outstanding during the period.
B Net investment income (loss) is affected by the timing of the declaration of dividends by any underlying mutual funds or exchange-traded funds (ETFs). Net investment income (loss) of any mutual funds or ETFs is not included in the Fund's net investment income (loss) ratio.
C Net investment income per share reflects one or more large, non-recurring dividend(s) which amounted to $.07 per share. Excluding such non-recurring dividend(s), the ratio of net investment income (loss) to average net assets would have been .93%.
D Total distributions per share do not sum due to rounding.
E Total returns for periods of less than one year are not annualized.
F Total returns would have been lower if certain expenses had not been reduced during the applicable periods shown.
G Fees and expenses of any underlying mutual funds or exchange-traded funds (ETFs) are not included in the Fund's expense ratio. The Fund indirectly bears its proportionate share of these expenses. For additional expense information related to investments in Fidelity Central Funds, please refer to the "Investments in Fidelity Central Funds" note found in the Notes to Financial Statements section of the most recent Annual or Semi-Annual report.
H Expense ratios reflect operating expenses of the class. Expenses before reductions do not reflect amounts reimbursed, waived, or reduced through arrangements with the investment adviser, brokerage services, or other offset arrangements, if applicable, and do not represent the amount paid by the class during periods when reimbursements, waivers or reductions occur.
I Annualized.
J Amount does not include the portfolio activity of any underlying mutual funds or exchange-traded funds (ETFs).
| Fidelity Advisor® International Growth Fund Class I |
| |
| | Six months ended (Unaudited) April 30, 2023 | | Years ended October 31, 2022 | | 2021 | | 2020 | | 2019 | | 2018 |
Selected Per-Share Data | | | | | | | | | | | | |
| Net asset value, beginning of period | $ | 15.01 | $ | 21.20 | $ | 16.16 | $ | 15.13 | $ | 12.55 | $ | 13.43 |
| Income from Investment Operations | | | | | | | | | | | | |
Net investment income (loss) A,B | | .06 | | .05 | | .01 | | .03 | | .20 C | | .13 |
| Net realized and unrealized gain (loss) | | 3.01 | | (5.83) | | 5.05 | | 1.16 | | 2.49 | | (.91) |
| Total from investment operations | | 3.07 | | (5.78) | | 5.06 | | 1.19 | | 2.69 | | (.78) |
| Distributions from net investment income | | (.03) | | (.09) | | (.02) | | (.16) | | (.11) | | (.09) |
| Distributions from net realized gain | | (.23) | | (.32) | | - | | - | | - | | (.02) |
| Total distributions | | (.26) | | (.41) | | (.02) | | (.16) | | (.11) | | (.10) D |
| Net asset value, end of period | $ | 17.82 | $ | 15.01 | $ | 21.20 | $ | 16.16 | $ | 15.13 | $ | 12.55 |
Total Return E,F | | 20.61% | | (27.78)% | | 31.36% | | 7.90% | | 21.64% | | (5.83)% |
Ratios to Average Net Assets B,G,H | | | | | | | | | | | | |
| Expenses before reductions | | .95% I | | 1.02% | | 1.00% | | 1.01% | | .97% | | .93% |
| Expenses net of fee waivers, if any | | .94% I | | 1.02% | | 1.00% | | 1.01% | | .97% | | .93% |
| Expenses net of all reductions | | .94% I | | 1.02% | | 1.00% | | 1.00% | | .97% | | .92% |
| Net investment income (loss) | | .70% I | | .30% | | .07% | | .21% | | 1.44% C | | .94% |
| Supplemental Data | | | | | | | | | | | | |
| Net assets, end of period (000 omitted) | $ | 1,571,967 | $ | 1,373,850 | $ | 2,035,690 | $ | 1,382,837 | $ | 953,360 | $ | 660,961 |
Portfolio turnover rate J | | 25% I | | 22% | | 21% | | 23% | | 21% | | 34% |
A Calculated based on average shares outstanding during the period.
B Net investment income (loss) is affected by the timing of the declaration of dividends by any underlying mutual funds or exchange-traded funds (ETFs). Net investment income (loss) of any mutual funds or ETFs is not included in the Fund's net investment income (loss) ratio.
C Net investment income per share reflects one or more large, non-recurring dividend(s) which amounted to $.07 per share. Excluding such non-recurring dividend(s), the ratio of net investment income (loss) to average net assets would have been .96%.
D Total distributions per share do not sum due to rounding.
E Total returns for periods of less than one year are not annualized.
F Total returns would have been lower if certain expenses had not been reduced during the applicable periods shown.
G Fees and expenses of any underlying mutual funds or exchange-traded funds (ETFs) are not included in the Fund's expense ratio. The Fund indirectly bears its proportionate share of these expenses. For additional expense information related to investments in Fidelity Central Funds, please refer to the "Investments in Fidelity Central Funds" note found in the Notes to Financial Statements section of the most recent Annual or Semi-Annual report.
H Expense ratios reflect operating expenses of the class. Expenses before reductions do not reflect amounts reimbursed, waived, or reduced through arrangements with the investment adviser, brokerage services, or other offset arrangements, if applicable, and do not represent the amount paid by the class during periods when reimbursements, waivers or reductions occur.
I Annualized.
J Amount does not include the portfolio activity of any underlying mutual funds or exchange-traded funds (ETFs).
| Fidelity Advisor® International Growth Fund Class Z |
| |
| | Six months ended (Unaudited) April 30, 2023 | | Years ended October 31, 2022 | | 2021 | | 2020 | | 2019 | | 2018 |
Selected Per-Share Data | | | | | | | | | | | | |
| Net asset value, beginning of period | $ | 15.05 | $ | 21.25 | $ | 16.19 | $ | 15.16 | $ | 12.57 | $ | 13.45 |
| Income from Investment Operations | | | | | | | | | | | | |
Net investment income (loss) A,B | | .07 | | .08 | | .04 | | .05 | | .22 C | | .15 |
| Net realized and unrealized gain (loss) | | 3.02 | | (5.85) | | 5.06 | | 1.16 | | 2.50 | | (.91) |
| Total from investment operations | | 3.09 | | (5.77) | | 5.10 | | 1.21 | | 2.72 | | (.76) |
| Distributions from net investment income | | (.06) | | (.11) | | (.04) | | (.18) | | (.13) | | (.10) |
| Distributions from net realized gain | | (.23) | | (.32) | | - | | - | | - | | (.02) |
| Total distributions | | (.29) | | (.43) | | (.04) | | (.18) | | (.13) | | (.12) |
| Net asset value, end of period | $ | 17.85 | $ | 15.05 | $ | 21.25 | $ | 16.19 | $ | 15.16 | $ | 12.57 |
Total Return D,E | | 20.68% | | (27.68)% | | 31.55% | | 8.01% | | 21.85% | | (5.71)% |
Ratios to Average Net Assets B,F,G | | | | | | | | | | | | |
| Expenses before reductions | | .81% H | | .89% | | .87% | | .88% | | .84% | | .80% |
| Expenses net of fee waivers, if any | | .81% H | | .89% | | .87% | | .88% | | .84% | | .80% |
| Expenses net of all reductions | | .81% H | | .89% | | .87% | | .87% | | .84% | | .79% |
| Net investment income (loss) | | .84% H | | .43% | | .20% | | .34% | | 1.57% C | | 1.08% |
| Supplemental Data | | | | | | | | | | | | |
| Net assets, end of period (000 omitted) | $ | 1,402,493 | $ | 989,259 | $ | 1,277,877 | $ | 1,350,267 | $ | 1,082,899 | $ | 556,558 |
Portfolio turnover rate I | | 25% H | | 22% | | 21% | | 23% | | 21% | | 34% |
A Calculated based on average shares outstanding during the period.
B Net investment income (loss) is affected by the timing of the declaration of dividends by any underlying mutual funds or exchange-traded funds (ETFs). Net investment income (loss) of any mutual funds or ETFs is not included in the Fund's net investment income (loss) ratio.
C Net investment income per share reflects one or more large, non-recurring dividend(s) which amounted to $.07 per share. Excluding such non-recurring dividend(s), the ratio of net investment income (loss) to average net assets would have been 1.08%.
D Total returns for periods of less than one year are not annualized.
E Total returns would have been lower if certain expenses had not been reduced during the applicable periods shown.
F Fees and expenses of any underlying mutual funds or exchange-traded funds (ETFs) are not included in the Fund's expense ratio. The Fund indirectly bears its proportionate share of these expenses. For additional expense information related to investments in Fidelity Central Funds, please refer to the "Investments in Fidelity Central Funds" note found in the Notes to Financial Statements section of the most recent Annual or Semi-Annual report.
G Expense ratios reflect operating expenses of the class. Expenses before reductions do not reflect amounts reimbursed, waived, or reduced through arrangements with the investment adviser, brokerage services, or other offset arrangements, if applicable, and do not represent the amount paid by the class during periods when reimbursements, waivers or reductions occur.
H Annualized.
I Amount does not include the portfolio activity of any underlying mutual funds or exchange-traded funds (ETFs).
For the period ended April 30, 2023
1. Organization.
Fidelity International Growth Fund (the Fund) is a fund of Fidelity Investment Trust (the Trust) and is authorized to issue an unlimited number of shares. The Trust is registered under the Investment Company Act of 1940, as amended (the 1940 Act), as an open-end management investment company organized as a Massachusetts business trust. The Fund offers Class A, Class M, Class C, International Growth, Class I and Class Z shares, each of which has equal rights as to assets and voting privileges. Class A, Class M, Class C, Class I and Class Z are Fidelity Advisor classes. Each class has exclusive voting rights with respect to matters that affect that class. Class C shares will automatically convert to Class A shares after a holding period of eight years from the initial date of purchase, with certain exceptions.
2. Investments in Fidelity Central Funds.
Funds may invest in Fidelity Central Funds, which are open-end investment companies generally available only to other investment companies and accounts managed by the investment adviser and its affiliates. The Schedule of Investments lists any Fidelity Central Funds held as an investment as of period end, but does not include the underlying holdings of each Fidelity Central Fund. An investing fund indirectly bears its proportionate share of the expenses of the underlying Fidelity Central Funds.
Based on its investment objective, each Fidelity Central Fund may invest or participate in various investment vehicles or strategies that are similar to those of the investing fund. These strategies are consistent with the investment objectives of the investing fund and may involve certain economic risks which may cause a decline in value of each of the Fidelity Central Funds and thus a decline in the value of the investing fund.
| Fidelity Central Fund | Investment Manager | Investment Objective | Investment Practices | Expense Ratio A |
| Fidelity Money Market Central Funds | Fidelity Management & Research Company LLC (FMR) | Each fund seeks to obtain a high level of current income consistent with the preservation of capital and liquidity. | Short-term Investments | Less than .005% |
A Expenses expressed as a percentage of average net assets and are as of each underlying Central Fund's most recent annual or semi-annual shareholder report.
A complete unaudited list of holdings for each Fidelity Central Fund is available upon request or at the Securities and Exchange Commission website at www.sec.gov. In addition, the financial statements of the Fidelity Central Funds which contain the significant accounting policies (including investment valuation policies) of those funds, and are not covered by the Report of Independent Registered Public Accounting Firm, are available on the Securities and Exchange Commission website or upon request.
3. Significant Accounting Policies.
The Fund is an investment company and applies the accounting and reporting guidance of the Financial Accounting Standards Board (FASB) Accounting Standards Codification Topic 946 Financial Services - Investment Companies . The financial statements have been prepared in conformity with accounting principles generally accepted in the United States of America (GAAP), which require management to make certain estimates and assumptions at the date of the financial statements. Actual results could differ from those estimates. Subsequent events, if any, through the date that the financial statements were issued have been evaluated in the preparation of the financial statements. The Fund's Schedule of Investments lists any underlying mutual funds or exchange-traded funds (ETFs) but does not include the underlying holdings of these funds. The following summarizes the significant accounting policies of the Fund:
Investment Valuation. Investments are valued as of 4:00 p.m. Eastern time on the last calendar day of the period. The Board of Trustees (the Board) has designated the Fund's investment adviser as the valuation designee responsible for the fair valuation function and performing fair value determinations as needed. The investment adviser has established a Fair Value Committee (the Committee) to carry out the day-to-day fair valuation responsibilities and has adopted policies and procedures to govern the fair valuation process and the activities of the Committee. In accordance with these fair valuation policies and procedures, which have been approved by the Board, the Fund attempts to obtain prices from one or more third party pricing services or brokers to value its investments. When current market prices, quotations or currency exchange rates are not readily available or reliable, investments will be fair valued in good faith by the Committee, in accordance with the policies and procedures. Factors used in determining fair value vary by investment type and may include market or investment specific events, transaction data, estimated cash flows, and market observations of comparable investments. The frequency that the fair valuation procedures are used cannot be predicted and they may be utilized to a significant extent. The Committee manages the Fund's fair valuation practices and maintains the fair valuation policies and procedures. The Fund's investment adviser reports to the Board information regarding the fair valuation process and related material matters.
The Fund categorizes the inputs to valuation techniques used to value its investments into a disclosure hierarchy consisting of three levels as shown below:
Level 1 - unadjusted quoted prices in active markets for identical investments
Level 2 - other significant observable inputs (including quoted prices for similar investments, interest rates, prepayment speeds, etc.)
Level 3 - unobservable inputs (including the Fund's own assumptions based on the best information available)
Valuation techniques used to value the Fund's investments by major category are as follows:
Equity securities, including restricted securities, for which market quotations are readily available, are valued at the last reported sale price or official closing price as reported by a third party pricing service on the primary market or exchange on which they are traded and are categorized as Level 1 in the hierarchy. In the event there were no sales during the day or closing prices are not available, securities are valued at the last quoted bid price or may be valued using the last available price and are generally categorized as Level 2 in the hierarchy. For foreign equity securities, when market or security specific events arise, comparisons to the valuation of American Depositary Receipts (ADRs), futures contracts, Exchange-Traded Funds (ETFs) and certain indexes as well as quoted prices for similar securities may be used and would be categorized as Level 2 in the hierarchy. For equity securities, including restricted securities, where observable inputs are limited, assumptions about market activity and risk are used and these securities may be categorized as Level 3 in the hierarchy.
Investments in open-end mutual funds, including the Fidelity Central Funds, are valued at their closing net asset value (NAV) each business day and are categorized as Level 1 in the hierarchy.
Changes in valuation techniques may result in transfers in or out of an assigned level within the disclosure hierarchy. The aggregate value of investments by input level as of April 30, 2023 is included at the end of the Fund's Schedule of Investments.
Foreign Currency. Certain Funds may use foreign currency contracts to facilitate transactions in foreign-denominated securities. Gains and losses from these transactions may arise from changes in the value of the foreign currency or if the counterparties do not perform under the contracts' terms.
Foreign-denominated assets, including investment securities, and liabilities are translated into U.S. dollars at the exchange rates at period end. Purchases and sales of investment securities, income and dividends received, and expenses denominated in foreign currencies are translated into U.S. dollars at the exchange rate in effect on the transaction date.
The effects of exchange rate fluctuations on investments are included with the net realized and unrealized gain (loss) on investment securities. Other foreign currency transactions resulting in realized and unrealized gain (loss) are disclosed separately.
Investment Transactions and Income. For financial reporting purposes, the Fund's investment holdings and NAV include trades executed through the end of the last business day of the period. The NAV per share for processing shareholder transactions is calculated as of the close of business of the New York Stock Exchange (NYSE), normally 4:00 p.m. Eastern time and includes trades executed through the end of the prior business day. Gains and losses on securities sold are determined on the basis of identified cost and include proceeds received from litigation. Commissions paid to certain brokers with whom the investment adviser, or its affiliates, places trades on behalf of a fund include an amount in addition to trade execution, which may be rebated back to a fund. Any such rebates are included in net realized gain (loss) on investments in the Statement of Operations. Dividend income is recorded on the ex-dividend date, except for certain dividends from foreign securities where the ex-dividend date may have passed, which are recorded as soon as the Fund is informed of the ex-dividend date. Non-cash dividends included in dividend income, if any, are recorded at the fair market value of the securities received. Income and capital gain distributions from Fidelity Central Funds, if any, are recorded on the ex-dividend date. Certain distributions received by the Fund represent a return of capital or capital gain. The Fund determines the components of these distributions subsequent to the ex-dividend date, based upon receipt of tax filings or other correspondence relating to the underlying investment. These distributions are recorded as a reduction of cost of investments and/or as a realized gain. Interest income is accrued as earned and includes coupon interest and amortization of premium and accretion of discount on debt securities as applicable. Investment income is recorded net of foreign taxes withheld where recovery of such taxes is uncertain. Funds may file withholding tax reclaims in certain jurisdictions to recover a portion of amounts previously withheld. Any withholding tax reclaims income is included in the Statement of Operations in foreign tax reclaims. Any receivables for withholding tax reclaims are included in the Statement of Assets and Liabilities in reclaims receivable.
Class Allocations and Expenses. Investment income, realized and unrealized capital gains and losses, common expenses of a fund, and certain fund-level expense reductions, if any, are allocated daily on a pro-rata basis to each class based on the relative net assets of each class to the total net assets of a fund. Each class differs with respect to transfer agent and distribution and service plan fees incurred, as applicable. Certain expense reductions may also differ by class, if applicable. For the reporting period, the allocated portion of income and expenses to each class as a percent of its average net assets may vary due to the timing of recording these transactions in relation to fluctuating net assets of the classes. Expenses directly attributable to a fund are charged to that fund. Expenses attributable to more than one fund are allocated among the respective funds on the basis of relative net assets or other appropriate methods. Expenses included in the accompanying financial statements reflect the expenses of that fund and do not include any expenses associated with any underlying mutual funds or exchange-traded funds. Although not included in a fund's expenses, a fund indirectly bears its proportionate share of these expenses through the net asset value of each underlying mutual fund or exchange-traded fund. Expense estimates are accrued in the period to which they relate and adjustments are made when actual amounts are known.
Income Tax Information and Distributions to Shareholders. Each year, the Fund intends to qualify as a regulated investment company under Subchapter M of the Internal Revenue Code, including distributing substantially all of its taxable income and realized gains. As a result, no provision for U.S. Federal income taxes is required. The Fund files a U.S. federal tax return, in addition to state and local tax returns as required. The Fund's federal income tax returns are subject to examination by the Internal Revenue Service (IRS) for a period of three fiscal years after they are filed. State and local tax returns may be subject to examination for an additional fiscal year depending on the jurisdiction. Foreign taxes are provided for based on the Fund's understanding of the tax rules and rates that exist in the foreign markets in which it invests. The Fund is subject to a tax imposed on capital gains by certain countries in which it invests. An estimated deferred tax liability for net unrealized appreciation on the applicable securities is included in Other payables and accrued expenses on the Statement of Assets & Liabilities.
Distributions are declared and recorded on the ex-dividend date. Income and capital gain distributions are declared separately for each class. Income and capital gain distributions are determined in accordance with income tax regulations, which may differ from GAAP.
Capital accounts within the financial statements are adjusted for permanent book-tax differences. These adjustments have no impact on net assets or the results of operations. Capital accounts are not adjusted for temporary book-tax differences which will reverse in a subsequent period.
Book-tax differences are primarily due to foreign currency transactions, certain foreign taxes, passive foreign investment companies (PFIC) and losses deferred due to wash sales.
As of period end, the cost and unrealized appreciation (depreciation) in securities, and derivatives if applicable, for federal income tax purposes were as follows:
| Gross unrealized appreciation | $1,566,281,927 |
| Gross unrealized depreciation | (115,505,408) |
| Net unrealized appreciation (depreciation) | $1,450,776,519 |
| Tax cost | $3,564,348,109 |
Restricted Securities (including Private Placements). Funds may invest in securities that are subject to legal or contractual restrictions on resale. These securities generally may be resold in transactions exempt from registration or to the public if the securities are registered. Disposal of these securities may involve time-consuming negotiations and expense, and prompt sale at an acceptable price may be difficult. Information regarding restricted securities held at period end is included at the end of the Schedule of Investments, if applicable.
4. Purchases and Sales of Investments.
Purchases and sales of securities, other than short-term securities and in-kind transactions, as applicable, are noted in the table below.
| | Purchases ($) | Sales ($) |
| Fidelity International Growth Fund | 565,081,819 | 513,929,060 |
5. Fees and Other Transactions with Affiliates.
Management Fee. Fidelity Management & Research Company LLC (the investment adviser) and its affiliates provide the Fund with investment management related services for which the Fund pays a monthly management fee. The management fee is the sum of an individual fund fee rate that is based on an annual rate of .45% of the Fund's average net assets and an annualized group fee rate that averaged .23% during the period. The group fee rate is based upon the monthly average net assets of a group of registered investment companies with which the investment adviser has management contracts. The group fee rate decreases as assets under management increase and increases as assets under management decrease. In addition, the management fee is subject to a performance adjustment (up to a maximum of +/- .20% of the Fund's average net assets over a 36 month performance period). The upward or downward adjustment to the management fee is based on the relative investment performance of International Growth as compared to its benchmark index, the MSCI EAFE Growth Index, over the same 36 month performance period. For the reporting period, the total annualized management fee rate, including the performance adjustment, was .72% of the Fund's average net assets. The performance adjustment included in the management fee rate may be higher or lower than the maximum performance adjustment rate due to the difference between the average net assets for the reporting and performance periods.
Distribution and Service Plan Fees. In accordance with Rule 12b-1 of the 1940 Act, the Fund has adopted separate Distribution and Service Plans for each class of shares. Certain classes pay Fidelity Distributors Company LLC (FDC), an affiliate of the investment adviser, separate Distribution and Service Fees, each of which is based on an annual percentage of each class' average net assets. In addition, FDC may pay financial intermediaries for selling shares of the Fund and providing shareholder support services. For the period, the Distribution and Service Fee rates, total fees and amounts retained by FDC were as follows:
| | Distribution Fee | Service Fee | Total Fees | Retained by FDC |
| Class A | - % | .25% | $220,712 | $4,458 |
| Class M | .25% | .25% | 73,110 | 1,071 |
| Class C | .75% | .25% | 176,611 | 12,840 |
| | | | $470,433 | $18,369 |
Sales Load. FDC may receive a front-end sales charge of up to 5.75% for selling Class A shares and 3.50% for selling Class M shares, some of which is paid to financial intermediaries for selling shares of the Fund. Depending on the holding period, FDC may receive contingent deferred sales charges levied on Class A, Class M and Class C redemptions. The deferred sales charges are 1.00% for Class C shares, 1.00% for certain purchases of Class A shares and .25% for certain purchases of Class M shares.
For the period, sales charge amounts retained by FDC were as follows:
| | Retained by FDC |
| Class A | $51,929 |
| Class M | 1,292 |
Class C A | 2,055 |
| | $55,276 |
A When Class C shares are initially sold, FDC pays commissions from its own resources to financial intermediaries through which the sales are made.
Transfer Agent Fees. Fidelity Investments Institutional Operations Company LLC (FIIOC), an affiliate of the investment adviser, is the transfer, dividend disbursing and shareholder servicing agent for each class of the Fund. FIIOC receives account fees and asset-based fees that vary according to the account size and type of account of the shareholders of the respective classes of the Fund, except for Class Z. FIIOC receives an asset-based fee of Class Z's average net assets. FIIOC pays for typesetting, printing and mailing of shareholder reports, except proxy statements.
For the period, transfer agent fees for each class were as follows:
| | Amount | % of Class-Level Average Net Assets A |
| Class A | $182,619 | .21 |
| Class M | 33,219 | .23 |
| Class C | 38,809 | .22 |
| International Growth | 1,126,650 | .17 |
| Class I | 1,309,746 | .18 |
| Class Z | 239,258 | .04 |
| | $2,930,301 | |
A Annualized
Accounting Fees. Fidelity Service Company, Inc. (FSC), an affiliate of the investment adviser, maintains the Fund's accounting records. The accounting fee is based on the level of average net assets for each month. For the period, the fees were equivalent to the following annualized rates:
| | % of Average Net Assets |
| Fidelity International Growth Fund | .03 |
Brokerage Commissions. A portion of portfolio transactions were placed with brokerage firms which are affiliates of the investment adviser. Brokerage commissions are included in net realized gain (loss) and change in net unrealized appreciation (depreciation) in the Statement of Operations. The commissions paid to these affiliated firms were as follows:
| | Amount |
| Fidelity International Growth Fund | $793 |
Interfund Trades. Funds may purchase from or sell securities to other Fidelity Funds under procedures adopted by the Board. The procedures have been designed to ensure these interfund trades are executed in accordance with Rule 17a-7 of the 1940 Act. Any interfund trades are included within the respective purchases and sales amounts shown in the Purchases and Sales of Investments note. Interfund trades during the period are noted in the table below.
| | Purchases ($) | Sales ($) | Realized Gain (Loss) ($) |
| Fidelity International Growth Fund | 47,283,204 | 16,398,422 | (5,583,265) |
6. Committed Line of Credit.
Certain Funds participate with other funds managed by the investment adviser or an affiliate in a $4.25 billion credit facility (the "line of credit") to be utilized for temporary or emergency purposes to fund shareholder redemptions or for other short-term liquidity purposes. The participating funds have agreed to pay commitment fees on their pro-rata portion of the line of credit, which are reflected in Miscellaneous expenses on the Statement of Operations, and are listed below. During the period, there were no borrowings on this line of credit.
| | Amount |
| Fidelity International Growth Fund | $4,014 |
7. Security Lending.
Funds lend portfolio securities from time to time in order to earn additional income. Lending agents are used, including National Financial Services (NFS), an affiliate of the investment adviser. Pursuant to a securities lending agreement, NFS will receive a fee, which is capped at 9.9% of a fund's daily lending revenue, for its services as lending agent. A fund may lend securities to certain qualified borrowers, including NFS. On the settlement date of the loan, a fund receives collateral (in the form of U.S. Treasury obligations, letters of credit and/or cash) against the loaned securities and maintains collateral in an amount not less than 100% of the market value of the loaned securities during the period of the loan. The market value of the loaned securities is determined at the close of business of a fund and any additional required collateral is delivered to a fund on the next business day. A fund or borrower may terminate the loan at any time, and if the borrower defaults on its obligation to return the securities loaned because of insolvency or other reasons, a fund may apply collateral received from the borrower against the obligation. A fund may experience delays and costs in recovering the securities loaned. Any cash collateral received is invested in the Fidelity Securities Lending Cash Central Fund. Any loaned securities are identified as such in the Schedule of Investments, and the value of loaned securities and cash collateral at period end, as applicable, are presented in the Statement of Assets and Liabilities. Security lending income represents the income earned on investing cash collateral, less rebates paid to borrowers and any lending agent fees associated with the loan, plus any premium payments received for lending certain types of securities. Security lending income is presented in the Statement of Operations as a component of income from Fidelity Central Funds. Affiliated security lending activity, if any, was as follows:
| | Total Security Lending Fees Paid to NFS | Security Lending Income From Securities Loaned to NFS | Value of Securities Loaned to NFS at Period End |
| Fidelity International Growth Fund | $27,231 | $- | $- |
8. Expense Reductions.
Through arrangements with each class' transfer agent, credits realized as a result of certain uninvested cash balances were used to reduce the Fund's expenses. During the period, transfer agent credits reduced each class' expenses as noted in the table below.
| | Expense reduction |
| | |
| Class M | $692 |
In addition, during the period the investment adviser or an affiliate reimbursed and/or waived a portion of fund-level operating expenses in the amount of $95,171.
9. Distributions to Shareholders.
Distributions to shareholders of each class were as follows:
| | Six months ended April 30, 2023 | Year ended October 31, 2022 |
| Fidelity International Growth Fund | | |
| Distributions to shareholders | | |
| Class A | $ 2,422,202 | $3,874,293 |
| Class M | 405,995 | 584,059 |
| Class C | 523,121 | 921,429 |
| International Growth | 20,712,364 | 34,022,956 |
| Class I | 22,283,776 | 39,437,200 |
| Class Z | 16,703,137 | 26,243,748 |
Total | $63,050,595 | $105,083,685 |
10. Share Transactions.
Share transactions for each class were as follows and may contain in-kind transactions, automatic conversions between classes or exchanges between affiliated funds:
| | Shares | Shares | Dollars | Dollars |
| | Six months ended April 30, 2023 | Year ended October 31, 2022 | Six months ended April 30, 2023 | Year ended October 31, 2022 |
| Fidelity International Growth Fund | | | | |
| Class A | | | | |
| Shares sold | 838,555 | 1,571,011 | $14,015,021 | $27,633,662 |
| Reinvestment of distributions | 147,890 | 192,594 | 2,418,006 | 3,867,288 |
| Shares redeemed | (1,099,324) | (2,239,322) | (18,330,146) | (38,758,166) |
| Net increase (decrease) | (112,879) | (475,717) | $(1,897,119) | $(7,257,216) |
| Class M | | | | |
| Shares sold | 60,526 | 182,229 | $996,965 | $3,218,457 |
| Reinvestment of distributions | 25,006 | 29,196 | 405,854 | 583,619 |
| Shares redeemed | (128,799) | (289,342) | (2,130,366) | (4,956,089) |
| Net increase (decrease) | (43,267) | (77,917) | $(727,547) | $(1,154,013) |
| Class C | | | | |
| Shares sold | 99,348 | 235,265 | $1,597,615 | $4,302,683 |
| Reinvestment of distributions | 33,238 | 47,271 | 522,168 | 919,894 |
| Shares redeemed | (420,577) | (828,106) | (6,733,681) | (13,580,412) |
| Net increase (decrease) | (287,991) | (545,570) | $(4,613,898) | $(8,357,835) |
| International Growth | | | | |
| Shares sold | 7,417,383 | 16,241,408 | $125,720,692 | $290,344,779 |
| Reinvestment of distributions | 1,147,426 | 1,547,748 | 18,921,062 | 31,326,431 |
| Shares redeemed | (8,000,808) | (21,846,639) | (134,098,247) | (372,519,642) |
| Net increase (decrease) | 564,001 | (4,057,483) | $10,543,507 | $(50,848,432) |
| Class I | | | | |
| Shares sold | 13,303,685 | 27,427,945 | $223,519,843 | $483,250,347 |
| Reinvestment of distributions | 1,326,495 | 1,891,163 | 21,820,838 | 38,182,588 |
| Shares redeemed | (17,937,326) | (33,802,275) | (300,628,460) | (571,344,966) |
| Net increase (decrease) | (3,307,146) | (4,483,167) | $(55,287,779) | $(49,912,031) |
| Class Z | | | | |
| Shares sold | 29,232,117 | 45,989,188 | $494,964,735 | $767,374,148 |
| Reinvestment of distributions | 410,878 | 542,351 | 6,767,160 | 10,966,334 |
| Shares redeemed | (16,806,873) | (40,926,928) | (275,361,003) | (662,422,044) |
| Net increase (decrease) | 12,836,122 | 5,604,611 | $226,370,892 | $115,918,438 |
11. Other.
A fund's organizational documents provide former and current trustees and officers with a limited indemnification against liabilities arising in connection with the performance of their duties to the fund. In the normal course of business, a fund may also enter into contracts that provide general indemnifications. A fund's maximum exposure under these arrangements is unknown as this would be dependent on future claims that may be made against a fund. The risk of material loss from such claims is considered remote.
12. Risk and Uncertainties.
Many factors affect a fund's performance. Developments that disrupt global economies and financial markets, such as pandemics, epidemics, outbreaks of infectious diseases, war, terrorism, and environmental disasters, may significantly affect a fund's investment performance. The effects of these developments to a fund will be impacted by the types of securities in which a fund invests, the financial condition, industry, economic sector, and geographic location of an issuer, and a fund's level of investment in the securities of that issuer. Significant concentrations in security types, issuers, industries, sectors, and geographic locations may magnify the factors that affect a fund's performance.
As a shareholder, you incur two types of costs: (1) transaction costs, which may include sales charges (loads) on purchase payments or redemption proceeds, as applicable and (2) ongoing costs, which generally include management fees, distribution and/or service (12b-1) fees and other Fund expenses. This Example is intended to help you understand your ongoing costs (in dollars) of investing in a fund and to compare these costs with the ongoing costs of investing in other mutual funds.
| The Example is based on an investment of $1,000 invested at the beginning of the period and held for the entire period (November 1, 2022 to April 30, 2023). |
Actual Expenses
The first line of the accompanying table provides information about actual account values and actual expenses. You may use the information in this line, together with the amount you invested, to estimate the expenses that you paid over the period. Simply divide your account value by $1,000.00 (for example, an $8,600 account value divided by $1,000.00 = 8.6), then multiply the result by the number in the first line for a class/Fund under the heading entitled "Expenses Paid During Period" to estimate the expenses you paid on your account during this period. If any fund is a shareholder of any underlying mutual funds or exchange-traded funds (ETFs) (the Underlying Funds), such fund indirectly bears its proportional share of the expenses of the Underlying Funds in addition to the direct expenses incurred presented in the table. These fees and expenses are not included in the annualized expense ratio used to calculate the expense estimate in the table below.
Hypothetical Example for Comparison Purposes
The second line of the accompanying table provides information about hypothetical account values and hypothetical expenses based on the actual expense ratio and an assumed rate of return of 5% per year before expenses, which is not the actual return. The hypothetical account values and expenses may not be used to estimate the actual ending account balance or expenses you paid for the period. You may use this information to compare the ongoing costs of investing in the Fund and other funds. To do so, compare this 5% hypothetical example with the 5% hypothetical examples that appear in the shareholder reports of the other funds. If any fund is a shareholder of any Underlying Funds, such fund indirectly bears its proportional share of the expenses of the Underlying Funds in addition to the direct expenses as presented in the table. These fees and expenses are not included in the annualized expense ratio used to calculate the expense estimate in the table below.
Please note that the expenses shown in the table are meant to highlight your ongoing costs only and do not reflect any transaction costs. Therefore, the second line of the table is useful in comparing ongoing costs only, and will not help you determine the relative total costs of owning different funds. In addition, if these transactional costs were included, your costs would have been higher.
| | | | | Annualized Expense Ratio- A | | Beginning Account Value November 1, 2022 | | Ending Account Value April 30, 2023 | | Expenses Paid During Period- C November 1, 2022 to April 30, 2023 |
| Fidelity® International Growth Fund | | | | | | | | | | |
| Class A | | | | 1.22% | | | | | | |
| Actual | | | | | | $ 1,000 | | $ 1,204.10 | | $ 6.67 |
Hypothetical- B | | | | | | $ 1,000 | | $ 1,018.74 | | $ 6.11 |
| Class M | | | | 1.50% | | | | | | |
| Actual | | | | | | $ 1,000 | | $ 1,202.70 | | $ 8.19 |
Hypothetical- B | | | | | | $ 1,000 | | $ 1,017.36 | | $ 7.50 |
| Class C | | | | 1.99% | | | | | | |
| Actual | | | | | | $ 1,000 | | $ 1,200.20 | | $ 10.86 |
Hypothetical- B | | | | | | $ 1,000 | | $ 1,014.93 | | $ 9.94 |
| Fidelity® International Growth Fund | | | | .94% | | | | | | |
| Actual | | | | | | $ 1,000 | | $ 1,205.80 | | $ 5.14 |
Hypothetical- B | | | | | | $ 1,000 | | $ 1,020.13 | | $ 4.71 |
| Class I | | | | .94% | | | | | | |
| Actual | | | | | | $ 1,000 | | $ 1,206.10 | | $ 5.14 |
Hypothetical- B | | | | | | $ 1,000 | | $ 1,020.13 | | $ 4.71 |
| Class Z | | | | .81% | | | | | | |
| Actual | | | | | | $ 1,000 | | $ 1,206.80 | | $ 4.43 |
Hypothetical- B | | | | | | $ 1,000 | | $ 1,020.78 | | $ 4.06 |
| |
A Annualized expense ratio reflects expenses net of applicable fee waivers.
B 5% return per year before expenses
C Expenses are equal to the annualized expense ratio, multiplied by the average account value over the period, multiplied by 181/ 365 (to reflect the one-half year period). The fees and expenses of any Underlying Funds are not included in each annualized expense ratio.
The Securities and Exchange Commission adopted Rule 22e-4 under the Investment Company Act of 1940 (the Liquidity Rule) to promote effective liquidity risk management throughout the open-end investment company industry, thereby reducing the risk that funds will be unable to meet their redemption obligations and mitigating dilution of the interests of fund shareholders.
The Fund has adopted and implemented a liquidity risk management program (the Program) reasonably designed to assess and manage the Fund's liquidity risk and to comply with the requirements of the Liquidity Rule. The Fund's Board of Trustees (the Board) has designated the Fund's investment adviser as administrator of the Program. The Fidelity advisers have established a Liquidity Risk Management Committee (the LRM Committee) to manage the Program for each of the Fidelity Funds. The LRM Committee monitors the adequacy and effectiveness of implementation of the Program and on a periodic basis assesses each Fund's liquidity risk based on a variety of factors including (1) the Fund's investment strategy, (2) portfolio liquidity and cash flow projections during normal and reasonably foreseeable stressed conditions, (3) shareholder redemptions, (4) borrowings and other funding sources and (5) certain factors specific to ETFs including the effect of the Fund's prices and spreads, market participants, and basket compositions on the overall liquidity of the Fund's portfolio, as applicable.
In accordance with the Program, each of the Fund's portfolio investments is classified into one of four defined liquidity categories based on a determination of a reasonable expectation for how long it would take to convert the investment to cash (or sell or dispose of the investment) without significantly changing its market value.
- Highly liquid investments - cash or convertible to cash within three business days or less
- Moderately liquid investments - convertible to cash in three to seven calendar days
- Less liquid investments - can be sold or disposed of, but not settled, within seven calendar days
- Illiquid investments - cannot be sold or disposed of within seven calendar days
Liquidity classification determinations take into account a variety of factors including various market, trading and investment-specific considerations, as well as market depth, and generally utilize analysis from a third-party liquidity metrics service.
The Liquidity Rule places a 15% limit on a fund's illiquid investments and requires funds that do not primarily hold assets that are highly liquid investments to determine and maintain a minimum percentage of the fund's net assets to be invested in highly liquid investments (highly liquid investment minimum or HLIM). The Program includes provisions reasonably designed to comply with the 15% limit on illiquid investments and for determining, periodically reviewing and complying with the HLIM requirement as applicable.
At a recent meeting of the Fund's Board of Trustees, the LRM Committee provided a written report to the Board pertaining to the operation, adequacy, and effectiveness of the Program for the period December 1, 2021 through November 30, 2022. The report concluded that the Program is operating effectively and is reasonably designed to assess and manage the Fund's liquidity risk.
1.912353.113
IGF-SANN-0623
Fidelity® Series Canada Fund
Semi-Annual Report
April 30, 2023
Contents
To view a fund's proxy voting guidelines and proxy voting record for the 12-month period ended June 30, visit http://www.fidelity.com/proxyvotingresults or visit the Securities and Exchange Commission's (SEC) web site at http://www.sec.gov.
You may also call 1-800-544-8544 to request a free copy of the proxy voting guidelines.
Standard & Poor's, S&P and S&P 500 are registered service marks of The McGraw-Hill Companies, Inc. and have been licensed for use by Fidelity Distributors Corporation.
Other third-party marks appearing herein are the property of their respective owners.
All other marks appearing herein are registered or unregistered trademarks or service marks of FMR LLC or an affiliated company. © 2023 FMR LLC. All rights reserved.
This report and the financial statements contained herein are submitted for the general information of the shareholders of the Fund. This report is not authorized for distribution to prospective investors in the Fund unless preceded or accompanied by an effective prospectus.
A fund files its complete schedule of portfolio holdings with the SEC for the first and third quarters of each fiscal year on Form N-PORT. Forms N-PORT are available on the SEC's web site at http://www.sec.gov. A fund's Forms N-PORT may be reviewed and copied at the SEC's Public Reference Room in Washington, DC. Information regarding the operation of the SEC's Public Reference Room may be obtained by calling 1-800-SEC-0330.
For a complete list of a fund's portfolio holdings, view the most recent holdings listing, semiannual report, or annual report on Fidelity's web site at http://www.fidelity.com, http://www.institutional.fidelity.com, or http://www.401k.com, as applicable.
NOT FDIC INSURED •MAY LOSE VALUE •NO BANK GUARANTEE
Neither the Fund nor Fidelity Distributors Corporation is a bank.
Top Holdings (% of Fund's net assets) |
| |
| The Toronto-Dominion Bank (Banks) | 7.5 | |
| Canadian Pacific Kansas City Ltd. (Ground Transportation) | 6.9 | |
| Canadian Natural Resources Ltd. (Oil, Gas & Consumable Fuels) | 5.7 | |
| Alimentation Couche-Tard, Inc. Class A (multi-vtg.) (Consumer Staples Distribution & Retail) | 5.1 | |
| Royal Bank of Canada (Banks) | 4.8 | |
| Bank of Montreal (Banks) | 4.3 | |
| Suncor Energy, Inc. (Oil, Gas & Consumable Fuels) | 4.0 | |
| Franco-Nevada Corp. (Metals & Mining) | 3.9 | |
| Constellation Software, Inc. (Software) | 3.9 | |
| PrairieSky Royalty Ltd. (Oil, Gas & Consumable Fuels) | 3.1 | |
| | 49.2 | |
| |
| Market Sectors (% of Fund's net assets) |
| |
| Financials | 29.8 | |
| Energy | 18.3 | |
| Industrials | 14.9 | |
| Materials | 12.5 | |
| Information Technology | 7.4 | |
| Consumer Staples | 6.9 | |
| Consumer Discretionary | 5.7 | |
| Communication Services | 3.0 | |
| Health Care | 0.8 | |
| |
Market Sectors may include more than one industry category.
The Fund may invest up to 35% of its total assets in any industry that represents more than 20% of the Canadian market. As of April 30, 2023, the Fund did not have more than 25% of its total assets invested in any one industry.
Asset Allocation (% of Fund's net assets) |
|
|
Geographic Diversification (% of Fund's net assets) |
|
* Includes Short-Term investments and Net Other Assets (Liabilities). Percentages are adjusted for the effect of derivatives, if applicable. |
| |
Showing Percentage of Net Assets
| Common Stocks - 99.1% |
| | | Shares | Value ($) |
| COMMUNICATION SERVICES - 2.8% | | | |
| Interactive Media & Services - 0.0% | | | |
| VerticalScope Holdings, Inc. (a) | | 335,500 | 859,272 |
| Media - 1.3% | | | |
| Quebecor, Inc.: | | | |
| Class A | | 2,128,200 | 54,836,670 |
| Class B (sub. vtg.) | | 453,500 | 11,705,277 |
| | | | 66,541,947 |
| Wireless Telecommunication Services - 1.5% | | | |
| Rogers Communications, Inc. Class B (non-vtg.) | | 1,630,200 | 80,544,406 |
TOTAL COMMUNICATION SERVICES | | | 147,945,625 |
| CONSUMER DISCRETIONARY - 5.7% | | | |
| Automobile Components - 0.8% | | | |
| Magna International, Inc. Class A (sub. vtg.) | | 799,600 | 41,690,035 |
| Broadline Retail - 2.5% | | | |
| Dollarama, Inc. (b) | | 2,136,700 | 132,348,130 |
| Hotels, Restaurants & Leisure - 2.1% | | | |
| Restaurant Brands International, Inc. | | 1,552,400 | 108,828,986 |
| Specialty Retail - 0.1% | | | |
| Diversified Royalty Corp. (b) | | 3,280,500 | 7,215,478 |
| Textiles, Apparel & Luxury Goods - 0.2% | | | |
| Canada Goose Holdings, Inc. (a)(b) | | 398,383 | 7,809,759 |
TOTAL CONSUMER DISCRETIONARY | | | 297,892,388 |
| CONSUMER STAPLES - 6.9% | | | |
| Beverages - 0.1% | | | |
| GURU Organic Energy Corp. (a)(c) | | 1,843,396 | 3,741,624 |
| Consumer Staples Distribution & Retail - 6.6% | | | |
| Alimentation Couche-Tard, Inc. Class A (multi-vtg.) (b) | | 5,300,000 | 264,520,796 |
| Metro, Inc. | | 584,000 | 33,285,220 |
| Neighbourly Pharmacy, Inc. (b) | | 840,375 | 13,180,772 |
| North West Co., Inc. (b) | | 1,242,000 | 36,429,922 |
| | | | 347,416,710 |
| Personal Care Products - 0.2% | | | |
| Jamieson Wellness, Inc. (d) | | 422,900 | 10,444,133 |
TOTAL CONSUMER STAPLES | | | 361,602,467 |
| ENERGY - 18.3% | | | |
| Energy Equipment & Services - 0.8% | | | |
| Computer Modelling Group Ltd. | | 2,590,600 | 13,556,744 |
| Pason Systems, Inc. | | 3,017,200 | 26,278,156 |
| | | | 39,834,900 |
| Oil, Gas & Consumable Fuels - 17.5% | | | |
| Cameco Corp. (b) | | 1,471,800 | 40,465,402 |
| Canadian Natural Resources Ltd. | | 4,905,000 | 298,894,195 |
| Enbridge, Inc. | | 3,526,600 | 140,220,646 |
| Parkland Corp. (b) | | 2,848,600 | 67,175,532 |
| PrairieSky Royalty Ltd. (b) | | 10,382,180 | 163,834,379 |
| Suncor Energy, Inc. | | 6,642,400 | 207,971,811 |
| | | | 918,561,965 |
TOTAL ENERGY | | | 958,396,865 |
| FINANCIALS - 29.8% | | | |
| Banks - 18.1% | | | |
| Bank of Montreal (b) | | 2,491,000 | 224,545,765 |
| Bank of Nova Scotia (b) | | 1,578,700 | 78,803,913 |
| Royal Bank of Canada (b) | | 2,500,300 | 248,230,692 |
| The Toronto-Dominion Bank (b) | | 6,471,830 | 392,030,914 |
| | | | 943,611,284 |
| Capital Markets - 5.3% | | | |
| Brookfield Asset Management Ltd. Class A | | 2,728,272 | 91,462,608 |
| Brookfield Corp. (Canada) Class A | | 3,412,188 | 110,713,204 |
| TMX Group Ltd. | | 745,900 | 75,545,188 |
| | | | 277,721,000 |
| Insurance - 6.4% | | | |
| Definity Financial Corp. | | 2,551,524 | 69,209,512 |
| Intact Financial Corp. | | 711,800 | 107,669,699 |
| Sun Life Financial, Inc. (b) | | 3,246,200 | 159,237,150 |
| | | | 336,116,361 |
TOTAL FINANCIALS | | | 1,557,448,645 |
| HEALTH CARE - 0.8% | | | |
| Health Care Providers & Services - 0.8% | | | |
| Andlauer Healthcare Group, Inc. | | 814,170 | 30,953,904 |
| dentalcorp Holdings Ltd. (a)(b) | | 1,424,571 | 9,326,453 |
| | | | 40,280,357 |
| INDUSTRIALS - 14.9% | | | |
| Commercial Services & Supplies - 2.7% | | | |
| GFL Environmental, Inc. (b) | | 3,917,614 | 142,293,084 |
| Ground Transportation - 9.9% | | | |
| Canadian National Railway Co. | | 1,325,700 | 158,025,280 |
| Canadian Pacific Kansas City Ltd. | | 4,578,221 | 360,891,614 |
| | | | 518,916,894 |
| Professional Services - 2.3% | | | |
| Thomson Reuters Corp. | | 917,000 | 120,583,622 |
TOTAL INDUSTRIALS | | | 781,793,600 |
| INFORMATION TECHNOLOGY - 7.4% | | | |
| IT Services - 2.8% | | | |
| Shopify, Inc. Class A (a) | | 2,982,100 | 144,477,281 |
| Software - 4.6% | | | |
| ApplyBoard, Inc. (a)(e)(f) | | 10,248 | 593,872 |
| ApplyBoard, Inc. (non-vtg.) (a)(e)(f) | | 2,527 | 146,440 |
| Constellation Software, Inc. | | 103,200 | 201,991,234 |
| Dye & Durham Ltd. | | 2,495,400 | 26,559,153 |
| Enghouse Systems Ltd. | | 206,100 | 5,672,561 |
| Lumine Group, Inc. | | 485,740 | 6,542,979 |
| | | | 241,506,239 |
TOTAL INFORMATION TECHNOLOGY | | | 385,983,520 |
| MATERIALS - 12.5% | | | |
| Chemicals - 2.8% | | | |
| Nutrien Ltd. | | 2,130,678 | 147,811,511 |
| Containers & Packaging - 1.2% | | | |
| CCL Industries, Inc.: | | | |
| Class A | | 157,800 | 7,395,874 |
| Class B (b) | | 1,123,200 | 52,816,970 |
| | | | 60,212,844 |
| Metals & Mining - 8.0% | | | |
| Franco-Nevada Corp. | | 1,352,381 | 205,205,363 |
| Lundin Mining Corp. | | 5,608,500 | 42,844,577 |
| Triple Flag Precious Metals Corp. | | 1,025,800 | 16,588,757 |
| Wheaton Precious Metals Corp. | | 3,168,800 | 156,352,570 |
| | | | 420,991,267 |
| Paper & Forest Products - 0.5% | | | |
| Stella-Jones, Inc. | | 569,900 | 22,302,172 |
| Western Forest Products, Inc. | | 5,724,300 | 4,394,045 |
| | | | 26,696,217 |
TOTAL MATERIALS | | | 655,711,839 |
| TOTAL COMMON STOCKS (Cost $3,784,315,105) | | | 5,187,055,306 |
| | | | |
| Nonconvertible Preferred Stocks - 0.0% |
| | | Shares | Value ($) |
| INFORMATION TECHNOLOGY - 0.0% | | | |
| Software - 0.0% | | | |
| ApplyBoard, Inc.: | | | |
| Series A1 (a)(e)(f) | | 12,606 | 730,518 |
| Series A2 (a)(e)(f) | | 9,868 | 571,851 |
| Series A3 (a)(e)(f) | | 563 | 32,626 |
| Series D (a)(e)(f) | | 27,521 | 1,594,842 |
| Series Seed (a)(e)(f) | | 3,768 | 218,356 |
| (Cost $4,705,692) | | | 3,148,193 |
| | | | |
| Convertible Bonds - 0.2% |
| | | Principal Amount (g) | Value ($) |
| COMMUNICATION SERVICES - 0.2% | | | |
| Entertainment - 0.2% | | | |
Cineplex, Inc. 5.75% 9/30/25 (d) (Cost $8,491,643) | CAD | 12,287,000 | 9,158,683 |
| | | | |
| Money Market Funds - 15.4% |
| | | Shares | Value ($) |
| Fidelity Cash Central Fund 4.88% (h) | | 12,139,355 | 12,141,783 |
| Fidelity Securities Lending Cash Central Fund 4.88% (h)(i) | | 793,343,645 | 793,422,979 |
| TOTAL MONEY MARKET FUNDS (Cost $805,564,762) | | | 805,564,762 |
| | | | |
| TOTAL INVESTMENT IN SECURITIES - 114.7% (Cost $4,603,077,202) | 6,004,926,944 |
NET OTHER ASSETS (LIABILITIES) - (14.7)% | (770,988,210) |
| NET ASSETS - 100.0% | 5,233,938,734 |
| | |
Currency Abbreviations
Legend
| (b) | Security or a portion of the security is on loan at period end. |
| (d) | Security exempt from registration under Rule 144A of the Securities Act of 1933. These securities may be resold in transactions exempt from registration, normally to qualified institutional buyers. At the end of the period, the value of these securities amounted to $19,602,816 or 0.4% of net assets. |
| (e) | Restricted securities (including private placements) - Investment in securities not registered under the Securities Act of 1933 (excluding 144A issues). At the end of the period, the value of restricted securities (excluding 144A issues) amounted to $3,888,505 or 0.1% of net assets. |
| (g) | Amount is stated in United States dollars unless otherwise noted. |
| (h) | Affiliated fund that is generally available only to investment companies and other accounts managed by Fidelity Investments. The rate quoted is the annualized seven-day yield of the fund at period end. A complete unaudited listing of the fund's holdings as of its most recent quarter end is available upon request. In addition, each Fidelity Central Fund's financial statements are available on the SEC's website or upon request. |
| (i) | Investment made with cash collateral received from securities on loan. |
| Additional information on each restricted holding is as follows: |
| Security | Acquisition Date | Acquisition Cost ($) |
| ApplyBoard, Inc. | 6/04/21 - 6/30/21 | 524,312 |
| | | |
| ApplyBoard, Inc. (non-vtg.) | 6/30/21 | 269,861 |
| | | |
| ApplyBoard, Inc. Series A1 | 6/04/21 | 816,255 |
| | | |
| ApplyBoard, Inc. Series A2 | 6/04/21 | 638,966 |
| | | |
| ApplyBoard, Inc. Series A3 | 6/04/21 | 36,455 |
| | | |
| ApplyBoard, Inc. Series D | 6/04/21 | 2,970,033 |
| | | |
| ApplyBoard, Inc. Series Seed | 6/04/21 | 243,983 |
| | | |
Affiliated Central Funds
Fiscal year to date information regarding the Fund's investments in Fidelity Central Funds, including the ownership percentage, is presented below.
| Affiliate | Value, beginning of period ($) | Purchases ($) | Sales Proceeds ($) | Dividend Income ($) | Realized Gain (loss) ($) | Change in Unrealized appreciation (depreciation) ($) | Value, end of period ($) | % ownership, end of period |
| Fidelity Cash Central Fund 4.88% | 4,119,421 | 107,352,585 | 99,330,223 | 135,472 | - | - | 12,141,783 | 0.0% |
| Fidelity Securities Lending Cash Central Fund 4.88% | 772,969,944 | 3,446,884,082 | 3,426,431,047 | 1,030,246 | - | - | 793,422,979 | 2.4% |
| Total | 777,089,365 | 3,554,236,667 | 3,525,761,270 | 1,165,718 | - | - | 805,564,762 | |
| | | | | | | | | |
Amounts in the dividend income column in the above table include any capital gain distributions from underlying funds, which are presented in the corresponding line item in the Statement of Operations, if applicable.
Amounts in the dividend income column for Fidelity Securities Lending Cash Central Fund represents the income earned on investing cash collateral, less rebates paid to borrowers and any lending agent fees associated with the loan, plus any premium payments received for lending certain types of securities.
Amounts included in the purchases and sales proceeds columns may include in-kind transactions, if applicable.
Other Affiliated Issuers
An affiliated company is a company in which the Fund has ownership of at least 5% of the voting securities. Fiscal year to date transactions with companies which are or were affiliates are presented in the table below. Certain corporate actions, such as mergers, are excluded from the amounts in this table if applicable. A dash in the Value end of period ($) column means either the issuer is no longer held at period end, or the issuer is held at period end but is no longer an affiliate.
| Affiliate | Value, beginning of period ($) | Purchases ($) | Sales Proceeds ($) | Dividend Income ($) | Realized Gain (loss) ($) | Change in Unrealized appreciation (depreciation) ($) | Value, end of period ($) |
| GURU Organic Energy Corp. | 5,007,698 | - | 86,726 | - | (183,896) | (995,452) | 3,741,624 |
| Total | 5,007,698 | - | 86,726 | - | (183,896) | (995,452) | 3,741,624 |
Amounts included in the purchases and sales proceeds columns may include in-kind transactions, if applicable.
Investment Valuation
The following is a summary of the inputs used, as of April 30, 2023, involving the Fund's assets and liabilities carried at fair value. The inputs or methodology used for valuing securities may not be an indication of the risk associated with investing in those securities. For more information on valuation inputs, and their aggregation into the levels used below, please refer to the Investment Valuation section in the accompanying Notes to Financial Statements.
| Valuation Inputs at Reporting Date: |
| Description | Total ($) | Level 1 ($) | Level 2 ($) | Level 3 ($) |
Investments in Securities: | | | | |
|
| Equities: | | | | |
Communication Services | 147,945,625 | 147,945,625 | - | - |
Consumer Discretionary | 297,892,388 | 297,892,388 | - | - |
Consumer Staples | 361,602,467 | 361,602,467 | - | - |
Energy | 958,396,865 | 958,396,865 | - | - |
Financials | 1,557,448,645 | 1,557,448,645 | - | - |
Health Care | 40,280,357 | 40,280,357 | - | - |
Industrials | 781,793,600 | 781,793,600 | - | - |
Information Technology | 389,131,713 | 385,243,208 | - | 3,888,505 |
Materials | 655,711,839 | 655,711,839 | - | - |
|
| Corporate Bonds | 9,158,683 | - | 9,158,683 | - |
|
| Money Market Funds | 805,564,762 | 805,564,762 | - | - |
| Total Investments in Securities: | 6,004,926,944 | 5,991,879,756 | 9,158,683 | 3,888,505 |
| Statement of Assets and Liabilities |
| | | | April 30, 2023 (Unaudited) |
| | | | | |
| Assets | | | | |
| Investment in securities, at value (including securities loaned of $757,223,836) - See accompanying schedule: | | | | |
Unaffiliated issuers (cost $3,784,086,733) | $ | 5,195,620,558 | | |
Fidelity Central Funds (cost $805,564,762) | | 805,564,762 | | |
Other affiliated issuers (cost $13,425,707) | | 3,741,624 | | |
| | | | | |
| | | | | |
| Total Investment in Securities (cost $4,603,077,202) | | | $ | 6,004,926,944 |
| Cash | | | | 139,799 |
| Foreign currency held at value (cost $39,242,828) | | | | 39,145,432 |
| Receivable for investments sold | | | | 11,841 |
| Receivable for fund shares sold | | | | 654,534 |
| Dividends receivable | | | | 7,998,292 |
| Interest receivable | | | | 44,289 |
| Distributions receivable from Fidelity Central Funds | | | | 239,235 |
Total assets | | | | 6,053,160,366 |
| Liabilities | | | | |
| Payable for investments purchased | $ | 1,495,683 | | |
| Payable for fund shares redeemed | | 24,293,378 | | |
| Other payables and accrued expenses | | 11,363 | | |
| Collateral on securities loaned | | 793,421,208 | | |
| Total Liabilities | | | | 819,221,632 |
| Net Assets | | | $ | 5,233,938,734 |
| Net Assets consist of: | | | | |
| Paid in capital | | | $ | 3,793,862,766 |
| Total accumulated earnings (loss) | | | | 1,440,075,968 |
| Net Assets | | | $ | 5,233,938,734 |
Net Asset Value , offering price and redemption price per share ($5,233,938,734 ÷ 372,257,614 shares) | | | $ | 14.06 |
| Statement of Operations |
| | | | Six months ended April 30, 2023 (Unaudited) |
| Investment Income | | | | |
| Dividends | | | $ | 71,738,395 |
| Non-Cash dividends | | | | 3,272,703 |
| Interest | | | | 479,148 |
| Income from Fidelity Central Funds (including $1,030,246 from security lending) | | | | 1,165,718 |
| Income before foreign taxes withheld | | | $ | 76,655,964 |
| Less foreign taxes withheld | | | | (11,449,020) |
| Total Income | | | | 65,206,944 |
| Expenses | | | | |
| Custodian fees and expenses | $ | 23,747 | | |
| Independent trustees' fees and expenses | | 17,292 | | |
| Interest | | 109,028 | | |
| Total Expenses | | | | 150,067 |
| Net Investment income (loss) | | | | 65,056,877 |
| Realized and Unrealized Gain (Loss) | | | | |
| Net realized gain (loss) on: | | | | |
| Investment Securities: | | | | |
| Unaffiliated issuers | | 17,394,864 | | |
| Redemptions in-kind | | 40,743,911 | | |
| Affiliated issuers | | (183,896) | | |
| Foreign currency transactions | | (1,765,050) | | |
| Total net realized gain (loss) | | | | 56,189,829 |
| Change in net unrealized appreciation (depreciation) on: | | | | |
| Investment Securities: | | | | |
| Unaffiliated issuers | | 305,988,848 | | |
| Affiliated issuers | | (995,452) | | |
| Assets and liabilities in foreign currencies | | (67,708) | | |
| Total change in net unrealized appreciation (depreciation) | | | | 304,925,688 |
| Net gain (loss) | | | | 361,115,517 |
| Net increase (decrease) in net assets resulting from operations | | | $ | 426,172,394 |
| Statement of Changes in Net Assets |
| |
| | Six months ended April 30, 2023 (Unaudited) | | Year ended October 31, 2022 |
| Increase (Decrease) in Net Assets | | | | |
| Operations | | | | |
| Net investment income (loss) | $ | 65,056,877 | $ | 133,720,673 |
| Net realized gain (loss) | | 56,189,829 | | 50,400,505 |
| Change in net unrealized appreciation (depreciation) | | 304,925,688 | | (624,986,211) |
| Net increase (decrease) in net assets resulting from operations | | 426,172,394 | | (440,865,033) |
| Distributions to shareholders | | (160,606,918) | | (132,881,856) |
| Share transactions | | | | |
| Proceeds from sales of shares | | 291,396,791 | | 958,291,641 |
| Reinvestment of distributions | | 160,606,918 | | 132,881,856 |
| Cost of shares redeemed | | (890,827,461) | | (1,175,374,764) |
Net increase (decrease) in net assets resulting from share transactions | | (438,823,752) | | (84,201,267) |
| Total increase (decrease) in net assets | | (173,258,276) | | (657,948,156) |
| | | | | |
| Net Assets | | | | |
| Beginning of period | | 5,407,197,010 | | 6,065,145,166 |
| End of period | $ | 5,233,938,734 | $ | 5,407,197,010 |
| | | | | |
| Other Information | | | | |
| Shares | | | | |
| Sold | | 21,259,270 | | 67,737,438 |
| Issued in reinvestment of distributions | | 12,084,794 | | 9,351,292 |
| Redeemed | | (65,491,321) | | (83,298,959) |
| Net increase (decrease) | | (32,147,257) | | (6,210,229) |
| | | | | |
Financial Highlights
| Fidelity® Series Canada Fund |
| |
| | Six months ended (Unaudited) April 30, 2023 | | Years ended October 31, 2022 | | 2021 | | 2020 | | 2019 | | 2018 |
Selected Per-Share Data | | | | | | | | | | | | |
| Net asset value, beginning of period | $ | 13.37 | $ | 14.77 | $ | 9.77 | $ | 10.89 | $ | 9.99 | $ | 10.66 |
| Income from Investment Operations | | | | | | | | | | | | |
Net investment income (loss) A,B | | .17 | | .32 | | .28 | | .27 | | .27 | | .26 |
| Net realized and unrealized gain (loss) | | .93 | | (1.40) | | 4.97 | | (1.14) | | .86 | | (.81) |
| Total from investment operations | | 1.10 | | (1.08) | | 5.25 | | (.87) | | 1.13 | | (.55) |
| Distributions from net investment income | | (.40) | | (.32) | | (.25) | | (.25) | | (.23) | | (.10) |
| Distributions from net realized gain | | (.01) | | - | | - | | - | | - | | (.02) |
| Total distributions | | (.41) | | (.32) | | (.25) | | (.25) | | (.23) | | (.12) |
| Net asset value, end of period | $ | 14.06 | $ | 13.37 | $ | 14.77 | $ | 9.77 | $ | 10.89 | $ | 9.99 |
Total Return C,D | | 8.40% | | (7.45)% | | 54.40% | | (8.22)% | | 11.62% | | (5.26)% |
Ratios to Average Net Assets A,E,F | | | | | | | | | | | | |
| Expenses before reductions | | .01% G | | -% H | | -% H | | -% H | | -% H | | -% H |
| Expenses net of fee waivers, if any | | .01% G | | -% H | | -% H | | -% H | | -% H | | -% H |
| Expenses net of all reductions | | .01% G | | -% H | | -% H | | -% H | | -% H | | -% H |
| Net investment income (loss) | | 2.46% G | | 2.29% | | 2.13% | | 2.70% | | 2.63% | | 2.42% |
| Supplemental Data | | | | | | | | | | | | |
| Net assets, end of period (000 omitted) | $ | 5,233,939 | $ | 5,407,197 | $ | 6,065,145 | $ | 3,914,417 | $ | 1,916,409 | $ | 1,385,499 |
Portfolio turnover rate I | | 13% G,J | | 19% J | | 19% | | 14% | | 12% J | | 36% |
A Net investment income (loss) is affected by the timing of the declaration of dividends by any underlying mutual funds or exchange-traded funds (ETFs). Net investment income (loss) of any mutual funds or ETFs is not included in the Fund's net investment income (loss) ratio.
B Calculated based on average shares outstanding during the period.
C Total returns for periods of less than one year are not annualized.
D Total returns would have been lower if certain expenses had not been reduced during the applicable periods shown.
E Fees and expenses of any underlying mutual funds or exchange-traded funds (ETFs) are not included in the Fund's expense ratio. The Fund indirectly bears its proportionate share of these expenses. For additional expense information related to investments in Fidelity Central Funds, please refer to the "Investments in Fidelity Central Funds" note found in the Notes to Financial Statements section of the most recent Annual or Semi-Annual report.
F Expense ratios reflect operating expenses of the class. Expenses before reductions do not reflect amounts reimbursed, waived, or reduced through arrangements with the investment adviser, brokerage services, or other offset arrangements, if applicable, and do not represent the amount paid by the class during periods when reimbursements, waivers or reductions occur.
G Annualized.
H Amount represents less than .005%.
I Amount does not include the portfolio activity of any underlying mutual funds or exchange-traded funds (ETFs).
J Portfolio turnover rate excludes securities received or delivered in-kind.
For the period ended April 30, 2023
1. Organization.
Fidelity Series Canada Fund (the Fund) is a fund of Fidelity Investment Trust (the Trust) and is authorized to issue an unlimited number of shares. Shares are offered only to certain other Fidelity funds, Fidelity managed 529 plans, and Fidelity managed collective investment trusts. The Trust is registered under the Investment Company Act of 1940, as amended (the 1940 Act), as an open-end management investment company organized as a Massachusetts business trust.
2. Investments in Fidelity Central Funds.
Funds may invest in Fidelity Central Funds, which are open-end investment companies generally available only to other investment companies and accounts managed by the investment adviser and its affiliates. The Schedule of Investments lists any Fidelity Central Funds held as an investment as of period end, but does not include the underlying holdings of each Fidelity Central Fund. An investing fund indirectly bears its proportionate share of the expenses of the underlying Fidelity Central Funds.
Based on its investment objective, each Fidelity Central Fund may invest or participate in various investment vehicles or strategies that are similar to those of the investing fund. These strategies are consistent with the investment objectives of the investing fund and may involve certain economic risks which may cause a decline in value of each of the Fidelity Central Funds and thus a decline in the value of the investing fund.
| Fidelity Central Fund | Investment Manager | Investment Objective | Investment Practices | Expense Ratio A |
| Fidelity Money Market Central Funds | Fidelity Management & Research Company LLC (FMR) | Each fund seeks to obtain a high level of current income consistent with the preservation of capital and liquidity. | Short-term Investments | Less than .005% |
A Expenses expressed as a percentage of average net assets and are as of each underlying Central Fund's most recent annual or semi-annual shareholder report.
A complete unaudited list of holdings for each Fidelity Central Fund is available upon request or at the Securities and Exchange Commission website at www.sec.gov. In addition, the financial statements of the Fidelity Central Funds which contain the significant accounting policies (including investment valuation policies) of those funds, and are not covered by the Report of Independent Registered Public Accounting Firm, are available on the Securities and Exchange Commission website or upon request.
3. Significant Accounting Policies.
The Fund is an investment company and applies the accounting and reporting guidance of the Financial Accounting Standards Board (FASB) Accounting Standards Codification Topic 946 Financial Services - Investment Companies . The financial statements have been prepared in conformity with accounting principles generally accepted in the United States of America (GAAP), which require management to make certain estimates and assumptions at the date of the financial statements. Actual results could differ from those estimates. Subsequent events, if any, through the date that the financial statements were issued have been evaluated in the preparation of the financial statements. The Fund's Schedule of Investments lists any underlying mutual funds or exchange-traded funds (ETFs) but does not include the underlying holdings of these funds. The following summarizes the significant accounting policies of the Fund:
Investment Valuation. Investments are valued as of 4:00 p.m. Eastern time on the last calendar day of the period. The Board of Trustees (the Board) has designated the Fund's investment adviser as the valuation designee responsible for the fair valuation function and performing fair value determinations as needed. The investment adviser has established a Fair Value Committee (the Committee) to carry out the day-to-day fair valuation responsibilities and has adopted policies and procedures to govern the fair valuation process and the activities of the Committee. In accordance with these fair valuation policies and procedures, which have been approved by the Board, the Fund attempts to obtain prices from one or more third party pricing services or brokers to value its investments. When current market prices, quotations or currency exchange rates are not readily available or reliable, investments will be fair valued in good faith by the Committee, in accordance with the policies and procedures. Factors used in determining fair value vary by investment type and may include market or investment specific events, transaction data, estimated cash flows, and market observations of comparable investments. The frequency that the fair valuation procedures are used cannot be predicted and they may be utilized to a significant extent. The Committee manages the Fund's fair valuation practices and maintains the fair valuation policies and procedures. The Fund's investment adviser reports to the Board information regarding the fair valuation process and related material matters.
The Fund categorizes the inputs to valuation techniques used to value its investments into a disclosure hierarchy consisting of three levels as shown below:
Level 1 - unadjusted quoted prices in active markets for identical investments
Level 2 - other significant observable inputs (including quoted prices for similar investments, interest rates, prepayment speeds, etc.)
Level 3 - unobservable inputs (including the Fund's own assumptions based on the best information available)
Valuation techniques used to value the Fund's investments by major category are as follows:
Equity securities, including restricted securities, for which market quotations are readily available, are valued at the last reported sale price or official closing price as reported by a third party pricing service on the primary market or exchange on which they are traded and are categorized as Level 1 in the hierarchy. In the event there were no sales during the day or closing prices are not available, securities are valued at the last quoted bid price or may be valued using the last available price and are generally categorized as Level 2 in the hierarchy. For foreign equity securities, when market or security specific events arise, comparisons to the valuation of American Depositary Receipts (ADRs), futures contracts, ETFs and certain indexes as well as quoted prices for similar securities may be used and would be categorized as Level 2 in the hierarchy. For equity securities, including restricted securities, where observable inputs are limited, assumptions about market activity and risk are used and these securities may be categorized as Level 3 in the hierarchy.
Debt securities, including restricted securities, are valued based on evaluated prices received from third party pricing services or from brokers who make markets in such securities. Corporate bonds are valued by pricing services who utilize matrix pricing which considers yield or price of bonds of comparable quality, coupon, maturity and type or by broker-supplied prices. When independent prices are unavailable or unreliable, debt securities may be valued utilizing pricing methodologies which consider similar factors that would be used by third party pricing services. Debt securities are generally categorized as Level 2 in the hierarchy but may be Level 3 depending on the circumstances.
Investments in open-end mutual funds, including the Fidelity Central Funds, are valued at their closing net asset value (NAV) each business day and are categorized as Level 1 in the hierarchy.
Changes in valuation techniques may result in transfers in or out of an assigned level within the disclosure hierarchy. The aggregate value of investments by input level as of April 30, 2023 is included at the end of the Fund's Schedule of Investments.
Foreign Currency. Certain Funds may use foreign currency contracts to facilitate transactions in foreign-denominated securities. Gains and losses from these transactions may arise from changes in the value of the foreign currency or if the counterparties do not perform under the contracts' terms.
Foreign-denominated assets, including investment securities, and liabilities are translated into U.S. dollars at the exchange rates at period end. Purchases and sales of investment securities, income and dividends received, and expenses denominated in foreign currencies are translated into U.S. dollars at the exchange rate in effect on the transaction date.
The effects of exchange rate fluctuations on investments are included with the net realized and unrealized gain (loss) on investment securities. Other foreign currency transactions resulting in realized and unrealized gain (loss) are disclosed separately.
Investment Transactions and Income. For financial reporting purposes, the Fund's investment holdings and NAV include trades executed through the end of the last business day of the period. The NAV per share for processing shareholder transactions is calculated as of the close of business of the New York Stock Exchange (NYSE), normally 4:00 p.m. Eastern time and includes trades executed through the end of the prior business day. Gains and losses on securities sold are determined on the basis of identified cost. Commissions paid to certain brokers with whom the investment adviser, or its affiliates, places trades on behalf of a fund include an amount in addition to trade execution, which may be rebated back to a fund. Any such rebates are included in net realized gain (loss) on investments in the Statement of Operations. Dividend income is recorded on the ex-dividend date, except for certain dividends from foreign securities where the ex-dividend date may have passed, which are recorded as soon as the Fund is informed of the ex-dividend date. Non-cash dividends included in dividend income, if any, are recorded at the fair market value of the securities received. Income and capital gain distributions from Fidelity Central Funds, if any, are recorded on the ex-dividend date. Certain distributions received by the Fund represent a return of capital or capital gain. The Fund determines the components of these distributions subsequent to the ex-dividend date, based upon receipt of tax filings or other correspondence relating to the underlying investment. These distributions are recorded as a reduction of cost of investments and/or as a realized gain. Interest income is accrued as earned and includes coupon interest and amortization of premium and accretion of discount on debt securities as applicable. Investment income is recorded net of foreign taxes withheld where recovery of such taxes is uncertain.
Expenses. Expenses directly attributable to a fund are charged to that fund. Expenses attributable to more than one fund are allocated among the respective funds on the basis of relative net assets or other appropriate methods. Expenses included in the accompanying financial statements reflect the expenses of that fund and do not include any expenses associated with any underlying mutual funds or exchange-traded funds. Although not included in a fund's expenses, a fund indirectly bears its proportionate share of these expenses through the net asset value of each underlying mutual fund or exchange-traded fund. Expense estimates are accrued in the period to which they relate and adjustments are made when actual amounts are known.
Income Tax Information and Distributions to Shareholders. Each year, the Fund intends to qualify as a regulated investment company under Subchapter M of the Internal Revenue Code, including distributing substantially all of its taxable income and realized gains. As a result, no provision for U.S. Federal income taxes is required. The Fund files a U.S. federal tax return, in addition to state and local tax returns as required. The Fund's federal income tax returns are subject to examination by the Internal Revenue Service (IRS) for a period of three fiscal years after they are filed. State and local tax returns may be subject to examination for an additional fiscal year depending on the jurisdiction. Foreign taxes are provided for based on the Fund's understanding of the tax rules and rates that exist in the foreign markets in which it invests.
Distributions are declared and recorded on the ex-dividend date. Income and capital gain distributions are determined in accordance with income tax regulations, which may differ from GAAP.
Capital accounts within the financial statements are adjusted for permanent book-tax differences. These adjustments have no impact on net assets or the results of operations. Capital accounts are not adjusted for temporary book-tax differences which will reverse in a subsequent period.
Book-tax differences are primarily due to foreign currency transactions, passive foreign investment companies (PFIC), redemptions in-kind, capital loss carryforwards and losses deferred due to wash sales.
As of period end, the cost and unrealized appreciation (depreciation) in securities, and derivatives if applicable, for federal income tax purposes were as follows:
| Gross unrealized appreciation | $1,503,494,430 |
| Gross unrealized depreciation | (159,068,690) |
| Net unrealized appreciation (depreciation) | $1,344,425,740 |
| Tax cost | $4,660,501,204 |
Restricted Securities (including Private Placements). Funds may invest in securities that are subject to legal or contractual restrictions on resale. These securities generally may be resold in transactions exempt from registration or to the public if the securities are registered. Disposal of these securities may involve time-consuming negotiations and expense, and prompt sale at an acceptable price may be difficult. Information regarding restricted securities held at period end is included at the end of the Schedule of Investments, if applicable.
4. Purchases and Sales of Investments.
Purchases and sales of securities, other than short-term securities and in-kind transactions, as applicable, are noted in the table below.
| | Purchases ($) | Sales ($) |
| Fidelity Series Canada Fund | 328,270,984 | 779,433,480 |
Unaffiliated Redemptions In-Kind. Shares that were redeemed in-kind for investments, including accrued interest and cash, if any, are shown in the table below. The net realized gain or loss on investments delivered through in-kind redemptions is included in the "Net realized gain (loss) on: Redemptions in-kind" line in the accompanying Statement of Operations. The amount of the in-kind redemptions is included in share transactions in the accompanying Statement of Changes in Net Assets. There was no gain or loss for federal income tax purposes.
| | Shares | Total net realized gain or loss ($) | Total Proceeds ($) |
| Fidelity Series Canada Fund | 6,298,392 | 40,743,911 | 85,154,321 |
5. Fees and Other Transactions with Affiliates.
Management Fee. Fidelity Management & Research Company LLC (the investment adviser) and its affiliates provide the Fund with investment management related services for which the Fund does not pay a management fee. Under the management contract, the investment adviser or an affiliate pays all ordinary operating expenses of the Fund, except custody fees, fees and expenses of the independent Trustees, and certain miscellaneous expenses such as proxy and shareholder meeting expenses.
Interfund Lending Program. Pursuant to an Exemptive Order issued by the Securities and Exchange Commission (the SEC), the Fund, along with other registered investment companies having management contracts with Fidelity Management & Research Company LLC (FMR), or other affiliated entities of FMR, may participate in an interfund lending program. This program provides an alternative credit facility allowing the Fund to borrow from, or lend money to, other participating affiliated funds. At period end, there were no interfund loans outstanding. Activity in this program during the period for which loans were outstanding was as follows:
| | Borrower or Lender | Average Loan Balance | Weighted Average Interest Rate | Interest Expense |
| Fidelity Series Canada Fund | Borrower | $ 114,444,000 | 4.29% | $109,028 |
Interfund Trades. Funds may purchase from or sell securities to other Fidelity Funds under procedures adopted by the Board. The procedures have been designed to ensure these interfund trades are executed in accordance with Rule 17a-7 of the 1940 Act. Any interfund trades are included within the respective purchases and sales amounts shown in the Purchases and Sales of Investments note. Interfund trades during the period are noted in the table below.
| | Purchases ($) | Sales ($) | Realized Gain (Loss) ($) |
| Fidelity Series Canada Fund | 28,087,225 | 18,885,418 | 2,623,097 |
Prior Fiscal Year Affiliated Redemptions In-Kind. Shares that were redeemed in-kind for investments, including accrued interest and cash, if any, are shown in the table below; along with realized gain or loss on investments delivered through in-kind redemptions. The amount of the in-kind redemptions is included in share transactions in the accompanying Statement of Changes in Net Assets. There was no gain or loss for federal income tax purposes.
| | Shares | Total net realized gain or loss ($) | Total Proceeds ($) |
| Fidelity Series Canada Fund | 1,619,205 | 9,969,579 | 21,259,781 |
6. Committed Line of Credit.
Certain Funds participate with other funds managed by the investment adviser or an affiliate in a $4.25 billion credit facility (the "line of credit") to be utilized for temporary or emergency purposes to fund shareholder redemptions or for other short-term liquidity purposes. The commitment fees on the pro-rata portion of the line of credit are borne by the investment adviser. During the period, there were no borrowings on this line of credit.
7. Security Lending.
Funds lend portfolio securities from time to time in order to earn additional income. Lending agents are used, including National Financial Services (NFS), an affiliate of the investment adviser. Pursuant to a securities lending agreement, NFS will receive a fee, which is capped at 9.9% of a fund's daily lending revenue, for its services as lending agent. A fund may lend securities to certain qualified borrowers, including NFS. On the settlement date of the loan, a fund receives collateral (in the form of U.S. Treasury obligations, letters of credit and/or cash) against the loaned securities and maintains collateral in an amount not less than 100% of the market value of the loaned securities during the period of the loan. The market value of the loaned securities is determined at the close of business of a fund and any additional required collateral is delivered to a fund on the next business day. A fund or borrower may terminate the loan at any time, and if the borrower defaults on its obligation to return the securities loaned because of insolvency or other reasons, a fund may apply collateral received from the borrower against the obligation. A fund may experience delays and costs in recovering the securities loaned. Any cash collateral received is invested in the Fidelity Securities Lending Cash Central Fund. Any loaned securities are identified as such in the Schedule of Investments, and the value of loaned securities and cash collateral at period end, as applicable, are presented in the Statement of Assets and Liabilities. Security lending income represents the income earned on investing cash collateral, less rebates paid to borrowers and any lending agent fees associated with the loan, plus any premium payments received for lending certain types of securities. Security lending income is presented in the Statement of Operations as a component of income from Fidelity Central Funds. Affiliated security lending activity, if any, was as follows:
| | Total Security Lending Fees Paid to NFS | Security Lending Income From Securities Loaned to NFS | Value of Securities Loaned to NFS at Period End |
| Fidelity Series Canada Fund | $114,023 | $ - | $- |
8. Other.
A fund's organizational documents provide former and current trustees and officers with a limited indemnification against liabilities arising in connection with the performance of their duties to the fund. In the normal course of business, a fund may also enter into contracts that provide general indemnifications. A fund's maximum exposure under these arrangements is unknown as this would be dependent on future claims that may be made against a fund. The risk of material loss from such claims is considered remote.
At the end of the period, mutual funds and accounts managed by the investment adviser or its affiliates were the owners of record of all of the outstanding shares of the Fund.
9. Risk and Uncertainties.
Many factors affect a fund's performance. Developments that disrupt global economies and financial markets, such as pandemics, epidemics, outbreaks of infectious diseases, war, terrorism, and environmental disasters, may significantly affect a fund's investment performance. The effects of these developments to a fund will be impacted by the types of securities in which a fund invests, the financial condition, industry, economic sector, and geographic location of an issuer, and a fund's level of investment in the securities of that issuer. Significant concentrations in security types, issuers, industries, sectors, and geographic locations may magnify the factors that affect a fund's performance.
As a shareholder, you incur two types of costs: (1) transaction costs, which may include sales charges (loads) on purchase payments or redemption proceeds, as applicable and (2) ongoing costs, which generally include management fees, distribution and/or service (12b-1) fees and other Fund expenses. This Example is intended to help you understand your ongoing costs (in dollars) of investing in a fund and to compare these costs with the ongoing costs of investing in other mutual funds.
| The Example is based on an investment of $1,000 invested at the beginning of the period and held for the entire period (November 1, 2022 to April 30, 2023). |
Actual Expenses
The first line of the accompanying table provides information about actual account values and actual expenses. You may use the information in this line, together with the amount you invested, to estimate the expenses that you paid over the period. Simply divide your account value by $1,000.00 (for example, an $8,600 account value divided by $1,000.00 = 8.6), then multiply the result by the number in the first line for a class/Fund under the heading entitled "Expenses Paid During Period" to estimate the expenses you paid on your account during this period. If any fund is a shareholder of any underlying mutual funds or exchange-traded funds (ETFs) (the Underlying Funds), such fund indirectly bears its proportional share of the expenses of the Underlying Funds in addition to the direct expenses incurred presented in the table. These fees and expenses are not included in the annualized expense ratio used to calculate the expense estimate in the table below.
Hypothetical Example for Comparison Purposes
The second line of the accompanying table provides information about hypothetical account values and hypothetical expenses based on the actual expense ratio and an assumed rate of return of 5% per year before expenses, which is not the actual return. The hypothetical account values and expenses may not be used to estimate the actual ending account balance or expenses you paid for the period. You may use this information to compare the ongoing costs of investing in the Fund and other funds. To do so, compare this 5% hypothetical example with the 5% hypothetical examples that appear in the shareholder reports of the other funds. If any fund is a shareholder of any Underlying Funds, such fund indirectly bears its proportional share of the expenses of the Underlying Funds in addition to the direct expenses as presented in the table. These fees and expenses are not included in the annualized expense ratio used to calculate the expense estimate in the table below.
Please note that the expenses shown in the table are meant to highlight your ongoing costs only and do not reflect any transaction costs. Therefore, the second line of the table is useful in comparing ongoing costs only, and will not help you determine the relative total costs of owning different funds. In addition, if these transactional costs were included, your costs would have been higher.
| | | | | Annualized Expense Ratio- A | | Beginning Account Value November 1, 2022 | | Ending Account Value April 30, 2023 | | Expenses Paid During Period- C November 1, 2022 to April 30, 2023 |
| | | | | | | | | | |
| Fidelity® Series Canada Fund | | | | .01% | | | | | | |
| Actual | | | | | | $ 1,000 | | $ 1,084.00 | | $ .05 |
Hypothetical- B | | | | | | $ 1,000 | | $ 1,024.74 | | $ .05 |
| |
A Annualized expense ratio reflects expenses net of applicable fee waivers.
B 5% return per year before expenses
C Expenses are equal to the annualized expense ratio, multiplied by the average account value over the period, multiplied by 181/ 365 (to reflect the one-half year period). The fees and expenses of any Underlying Funds are not included in each annualized expense ratio.
The Securities and Exchange Commission adopted Rule 22e-4 under the Investment Company Act of 1940 (the Liquidity Rule) to promote effective liquidity risk management throughout the open-end investment company industry, thereby reducing the risk that funds will be unable to meet their redemption obligations and mitigating dilution of the interests of fund shareholders.
The Fund has adopted and implemented a liquidity risk management program (the Program) reasonably designed to assess and manage the Fund's liquidity risk and to comply with the requirements of the Liquidity Rule. The Fund's Board of Trustees (the Board) has designated the Fund's investment adviser as administrator of the Program. The Fidelity advisers have established a Liquidity Risk Management Committee (the LRM Committee) to manage the Program for each of the Fidelity Funds. The LRM Committee monitors the adequacy and effectiveness of implementation of the Program and on a periodic basis assesses each Fund's liquidity risk based on a variety of factors including (1) the Fund's investment strategy, (2) portfolio liquidity and cash flow projections during normal and reasonably foreseeable stressed conditions, (3) shareholder redemptions, (4) borrowings and other funding sources and (5) certain factors specific to ETFs including the effect of the Fund's prices and spreads, market participants, and basket compositions on the overall liquidity of the Fund's portfolio, as applicable.
In accordance with the Program, each of the Fund's portfolio investments is classified into one of four defined liquidity categories based on a determination of a reasonable expectation for how long it would take to convert the investment to cash (or sell or dispose of the investment) without significantly changing its market value.
- Highly liquid investments - cash or convertible to cash within three business days or less
- Moderately liquid investments - convertible to cash in three to seven calendar days
- Less liquid investments - can be sold or disposed of, but not settled, within seven calendar days
- Illiquid investments - cannot be sold or disposed of within seven calendar days
Liquidity classification determinations take into account a variety of factors including various market, trading and investment-specific considerations, as well as market depth, and generally utilize analysis from a third-party liquidity metrics service.
The Liquidity Rule places a 15% limit on a fund's illiquid investments and requires funds that do not primarily hold assets that are highly liquid investments to determine and maintain a minimum percentage of the fund's net assets to be invested in highly liquid investments (highly liquid investment minimum or HLIM). The Program includes provisions reasonably designed to comply with the 15% limit on illiquid investments and for determining, periodically reviewing and complying with the HLIM requirement as applicable.
At a recent meeting of the Fund's Board of Trustees, the LRM Committee provided a written report to the Board pertaining to the operation, adequacy, and effectiveness of the Program for the period December 1, 2021 through November 30, 2022. The report concluded that the Program is operating effectively and is reasonably designed to assess and manage the Fund's liquidity risk.
1.9883883.105
SAD-SANN-0623
Fidelity® SAI Sustainable International Equity Fund
Semi-Annual Report
April 30, 2023
Offered exclusively to certain clients of the Adviser, or its affiliates, including Strategic Advisers LLC (Strategic Advisers) - not available for sale to the general public. Fidelity ® SAI is a product name of Fidelity ® funds dedicated to certain programs affiliated with Strategic Advisers.
Contents
To view a fund's proxy voting guidelines and proxy voting record for the 12-month period ended June 30, visit http://www.fidelity.com/proxyvotingresults or visit the Securities and Exchange Commission's (SEC) web site at http://www.sec.gov.
You may also call 1-800-544-3455 to request a free copy of the proxy voting guidelines.
Standard & Poor's, S&P and S&P 500 are registered service marks of The McGraw-Hill Companies, Inc. and have been licensed for use by Fidelity Distributors Corporation.
Other third-party marks appearing herein are the property of their respective owners.
All other marks appearing herein are registered or unregistered trademarks or service marks of FMR LLC or an affiliated company. © 2023 FMR LLC. All rights reserved.
This report and the financial statements contained herein are submitted for the general information of the shareholders of the Fund. This report is not authorized for distribution to prospective investors in the Fund unless preceded or accompanied by an effective prospectus.
A fund files its complete schedule of portfolio holdings with the SEC for the first and third quarters of each fiscal year on Form N-PORT. Forms N-PORT are available on the SEC's web site at http://www.sec.gov. A fund's Forms N-PORT may be reviewed and copied at the SEC's Public Reference Room in Washington, DC. Information regarding the operation of the SEC's Public Reference Room may be obtained by calling 1-800-SEC-0330.
For a complete list of a fund's portfolio holdings, view the most recent holdings listing, semiannual report, or annual report on Fidelity's web site at http://www.fidelity.com, http://www.institutional.fidelity.com, or http://www.401k.com, as applicable.
NOT FDIC INSURED •MAY LOSE VALUE •NO BANK GUARANTEE
Neither the Fund nor Fidelity Distributors Corporation is a bank.
Top Holdings (% of Fund's net assets) |
| |
| Novo Nordisk A/S Series B (Denmark, Pharmaceuticals) | 4.4 | |
| AstraZeneca PLC (United Kingdom) (United Kingdom, Pharmaceuticals) | 3.9 | |
| Sony Group Corp. (Japan, Household Durables) | 3.6 | |
| Nestle SA (Reg. S) (United States of America, Food Products) | 3.1 | |
| ASML Holding NV (Netherlands) (Netherlands, Semiconductors & Semiconductor Equipment) | 3.0 | |
| LVMH Moet Hennessy Louis Vuitton SE (France, Textiles, Apparel & Luxury Goods) | 2.8 | |
| AIA Group Ltd. (Hong Kong, Insurance) | 2.5 | |
| Itochu Corp. (Japan, Trading Companies & Distributors) | 2.4 | |
| ORIX Corp. (Japan, Financial Services) | 2.4 | |
| Koninklijke KPN NV (Netherlands, Diversified Telecommunication Services) | 2.1 | |
| | 30.2 | |
| |
| Market Sectors (% of Fund's net assets) |
| |
| Financials | 22.9 | |
| Health Care | 14.5 | |
| Industrials | 11.8 | |
| Consumer Discretionary | 11.2 | |
| Information Technology | 10.6 | |
| Consumer Staples | 10.5 | |
| Materials | 6.3 | |
| Utilities | 4.7 | |
| Communication Services | 2.4 | |
| Energy | 1.4 | |
| Real Estate | 0.7 | |
| |
Asset Allocation (% of Fund's net assets) |
|
|
Geographic Diversification (% of Fund's net assets) |
|
* Includes Short-Term investments and Net Other Assets (Liabilities). Percentages are adjusted for the effect of derivatives, if applicable. |
| |
Showing Percentage of Net Assets
| Common Stocks - 97.0% |
| | | Shares | Value ($) |
| Australia - 1.7% | | | |
| Bapcor Ltd. | | 8,011 | 34,957 |
| EBOS Group Ltd. | | 1,403 | 38,503 |
TOTAL AUSTRALIA | | | 73,460 |
| Austria - 2.0% | | | |
| Verbund AG | | 607 | 54,110 |
| Wienerberger AG | | 1,195 | 35,948 |
TOTAL AUSTRIA | | | 90,058 |
| Belgium - 2.2% | | | |
| KBC Group NV | | 557 | 39,759 |
| UCB SA | | 608 | 56,558 |
TOTAL BELGIUM | | | 96,317 |
| China - 0.9% | | | |
| Chervon Holdings Ltd. | | 7,483 | 38,080 |
| Denmark - 5.8% | | | |
| Novo Nordisk A/S Series B | | 1,164 | 193,637 |
| ORSTED A/S (a) | | 458 | 41,071 |
| Vestas Wind Systems A/S | | 797 | 22,053 |
TOTAL DENMARK | | | 256,761 |
| Finland - 1.4% | | | |
| Neste OYJ | | 1,305 | 63,185 |
| France - 12.8% | | | |
| Air Liquide SA | | 253 | 45,512 |
| AXA SA | | 2,405 | 78,500 |
| BNP Paribas SA | | 1,256 | 81,154 |
| Capgemini SA | | 159 | 28,891 |
| Edenred SA | | 400 | 25,970 |
| L'Oreal SA | | 161 | 76,772 |
| LVMH Moet Hennessy Louis Vuitton SE | | 128 | 123,121 |
| Pernod Ricard SA | | 393 | 90,680 |
| Worldline SA (a)(b) | | 356 | 15,448 |
TOTAL FRANCE | | | 566,048 |
| Germany - 9.0% | | | |
| Deutsche Borse AG | | 339 | 64,650 |
| Deutsche Post AG | | 990 | 47,619 |
| Gerresheimer AG | | 139 | 15,117 |
| Merck KGaA | | 455 | 81,497 |
| Muenchener Rueckversicherungs-Gesellschaft AG in Muenchen | | 175 | 65,659 |
| SAP SE | | 236 | 31,935 |
| Siemens AG | | 544 | 89,669 |
TOTAL GERMANY | | | 396,146 |
| Hong Kong - 4.3% | | | |
| AIA Group Ltd. | | 10,003 | 108,903 |
| Hang Seng Bank Ltd. | | 3,154 | 46,751 |
| Prudential PLC | | 2,285 | 34,963 |
TOTAL HONG KONG | | | 190,617 |
| India - 1.4% | | | |
| HDFC Bank Ltd. sponsored ADR | | 865 | 60,377 |
| Ireland - 2.6% | | | |
| CRH PLC | | 1,436 | 69,691 |
| Dalata Hotel Group PLC (b) | | 8,928 | 44,811 |
TOTAL IRELAND | | | 114,502 |
| Italy - 0.5% | | | |
| Carel Industries SpA (a) | | 841 | 22,055 |
| Japan - 16.0% | | | |
| FUJIFILM Holdings Corp. | | 1,427 | 74,375 |
| Fujitsu Ltd. | | 334 | 44,515 |
| Hitachi Ltd. | | 1,671 | 92,431 |
| Hoya Corp. | | 734 | 76,964 |
| Itochu Corp. | | 3,214 | 106,624 |
| ORIX Corp. | | 6,150 | 104,627 |
| Persol Holdings Co. Ltd. | | 1,196 | 24,661 |
| Sony Group Corp. | | 1,775 | 160,591 |
| TIS, Inc. | | 671 | 18,425 |
TOTAL JAPAN | | | 703,213 |
| Kenya - 0.2% | | | |
| Safaricom Ltd. | | 84,934 | 10,304 |
| Korea (South) - 0.5% | | | |
| SK Hynix, Inc. | | 316 | 21,270 |
| Netherlands - 7.4% | | | |
| ASML Holding NV (Netherlands) | | 206 | 130,180 |
| BE Semiconductor Industries NV | | 124 | 11,114 |
| Heineken NV (Bearer) | | 334 | 38,294 |
| ING Groep NV (Certificaten Van Aandelen) | | 4,326 | 53,388 |
| Koninklijke KPN NV | | 25,909 | 94,487 |
TOTAL NETHERLANDS | | | 327,463 |
| New Zealand - 0.8% | | | |
| Contact Energy Ltd. | | 7,135 | 34,605 |
| Norway - 2.1% | | | |
| DNB Bank ASA | | 5,029 | 88,339 |
| Schibsted ASA (A Shares) | | 193 | 3,419 |
TOTAL NORWAY | | | 91,758 |
| Singapore - 0.9% | | | |
| United Overseas Bank Ltd. | | 1,760 | 37,379 |
| Spain - 1.4% | | | |
| CaixaBank SA | | 3,467 | 12,833 |
| EDP Renovaveis SA | | 404 | 8,975 |
| Iberdrola SA | | 3,141 | 40,701 |
TOTAL SPAIN | | | 62,509 |
| Sweden - 3.4% | | | |
| Boliden AB | | 2,059 | 73,525 |
| Instalco AB | | 1,015 | 5,325 |
| Investor AB (B Shares) | | 925 | 19,826 |
| Lagercrantz Group AB (B Shares) | | 1,022 | 13,135 |
| Nibe Industrier AB (B Shares) | | 3,408 | 38,051 |
TOTAL SWEDEN | | | 149,862 |
| Taiwan - 1.9% | | | |
| Taiwan Semiconductor Manufacturing Co. Ltd. | | 5,033 | 82,361 |
| United Kingdom - 13.0% | | | |
| AstraZeneca PLC (United Kingdom) | | 1,177 | 173,211 |
| Barratt Developments PLC | | 3,328 | 20,912 |
| Beazley PLC | | 1,929 | 14,437 |
| Big Yellow Group PLC | | 451 | 6,938 |
| Bunzl PLC | | 362 | 14,394 |
| Compass Group PLC | | 2,660 | 70,173 |
| Diageo PLC | | 1,752 | 79,919 |
| Endava PLC ADR (b) | | 163 | 9,384 |
| Grainger Trust PLC | | 6,531 | 21,225 |
| Impax Asset Management Group PLC | | 492 | 4,848 |
| National Grid PLC | | 2,102 | 30,138 |
| NatWest Group PLC | | 15,726 | 51,803 |
| Reckitt Benckiser Group PLC | | 492 | 39,758 |
| Renewi PLC (b) | | 682 | 5,143 |
| Smart Metering Systems PLC | | 3,116 | 31,054 |
TOTAL UNITED KINGDOM | | | 573,337 |
| United States of America - 4.8% | | | |
| Ferguson PLC | | 147 | 20,682 |
| Linde PLC | | 140 | 51,723 |
| Nestle SA (Reg. S) | | 1,079 | 138,424 |
TOTAL UNITED STATES OF AMERICA | | | 210,829 |
| TOTAL COMMON STOCKS (Cost $3,995,346) | | | 4,272,496 |
| | | | |
| Money Market Funds - 3.7% |
| | | Shares | Value ($) |
Fidelity Cash Central Fund 4.88% (c) (Cost $163,209) | | 163,176 | 163,209 |
| | | | |
| TOTAL INVESTMENT IN SECURITIES - 100.7% (Cost $4,158,555) | 4,435,705 |
NET OTHER ASSETS (LIABILITIES) - (0.7)% | (29,030) |
| NET ASSETS - 100.0% | 4,406,675 |
| | |
Legend
| (a) | Security exempt from registration under Rule 144A of the Securities Act of 1933. These securities may be resold in transactions exempt from registration, normally to qualified institutional buyers. At the end of the period, the value of these securities amounted to $78,574 or 1.8% of net assets. |
| (c) | Affiliated fund that is generally available only to investment companies and other accounts managed by Fidelity Investments. The rate quoted is the annualized seven-day yield of the fund at period end. A complete unaudited listing of the fund's holdings as of its most recent quarter end is available upon request. In addition, each Fidelity Central Fund's financial statements are available on the SEC's website or upon request. |
Affiliated Central Funds
Fiscal year to date information regarding the Fund's investments in Fidelity Central Funds, including the ownership percentage, is presented below.
| Affiliate | Value, beginning of period ($) | Purchases ($) | Sales Proceeds ($) | Dividend Income ($) | Realized Gain (loss) ($) | Change in Unrealized appreciation (depreciation) ($) | Value, end of period ($) | % ownership, end of period |
| Fidelity Cash Central Fund 4.88% | 102,083 | 1,278,339 | 1,217,213 | 3,053 | - | - | 163,209 | 0.0% |
| Total | 102,083 | 1,278,339 | 1,217,213 | 3,053 | - | - | 163,209 | |
| | | | | | | | | |
Amounts in the dividend income column in the above table include any capital gain distributions from underlying funds, which are presented in the corresponding line item in the Statement of Operations, if applicable.
Amounts included in the purchases and sales proceeds columns may include in-kind transactions, if applicable.
Investment Valuation
The following is a summary of the inputs used, as of April 30, 2023, involving the Fund's assets and liabilities carried at fair value. The inputs or methodology used for valuing securities may not be an indication of the risk associated with investing in those securities. For more information on valuation inputs, and their aggregation into the levels used below, please refer to the Investment Valuation section in the accompanying Notes to Financial Statements.
| Valuation Inputs at Reporting Date: |
| Description | Total ($) | Level 1 ($) | Level 2 ($) | Level 3 ($) |
Investments in Securities: | | | | |
|
| Equities: | | | | |
Communication Services | 108,210 | 13,723 | 94,487 | - |
Consumer Discretionary | 492,645 | 65,723 | 426,922 | - |
Consumer Staples | 463,847 | 205,746 | 258,101 | - |
Energy | 63,185 | 63,185 | - | - |
Financials | 1,009,614 | 388,051 | 621,563 | - |
Health Care | 635,487 | 153,172 | 482,315 | - |
Industrials | 519,761 | 136,704 | 383,057 | - |
Information Technology | 465,585 | 192,704 | 272,881 | - |
Materials | 276,399 | 161,196 | 115,203 | - |
Real Estate | 28,163 | 28,163 | - | - |
Utilities | 209,600 | 104,156 | 105,444 | - |
|
| Money Market Funds | 163,209 | 163,209 | - | - |
| Total Investments in Securities: | 4,435,705 | 1,675,732 | 2,759,973 | - |
| Statement of Assets and Liabilities |
| | | | April 30, 2023 (Unaudited) |
| | | | | |
| Assets | | | | |
| Investment in securities, at value - See accompanying schedule: | | | | |
Unaffiliated issuers (cost $3,995,346) | $ | 4,272,496 | | |
Fidelity Central Funds (cost $163,209) | | 163,209 | | |
| | | | | |
| | | | | |
| Total Investment in Securities (cost $4,158,555) | | | $ | 4,435,705 |
| Cash | | | | 39,062 |
| Foreign currency held at value (cost $1,360) | | | | 1,355 |
| Receivable for investments sold | | | | 6 |
| Dividends receivable | | | | 21,221 |
| Reclaims receivable | | | | 3,120 |
| Distributions receivable from Fidelity Central Funds | | | | 668 |
| Prepaid expenses | | | | 1 |
| Receivable from investment adviser for expense reductions | | | | 9,457 |
Total assets | | | | 4,510,595 |
| Liabilities | | | | |
| Payable for investments purchased | $ | 66,690 | | |
| Accrued management fee | | 2,398 | | |
| Audit fee payable | | 24,624 | | |
| Custody fee payable | | 10,208 | | |
| Total Liabilities | | | | 103,920 |
| Net Assets | | | $ | 4,406,675 |
| Net Assets consist of: | | | | |
| Paid in capital | | | $ | 4,239,772 |
| Total accumulated earnings (loss) | | | | 166,903 |
| Net Assets | | | $ | 4,406,675 |
Net Asset Value , offering price and redemption price per share ($4,406,675 ÷ 452,001 shares) | | | $ | 9.75 |
| Statement of Operations |
| | | | Six months ended April 30, 2023 (Unaudited) |
| Investment Income | | | | |
| Dividends | | | $ | 51,263 |
| Income from Fidelity Central Funds | | | | 3,053 |
| Income before foreign taxes withheld | | | $ | 54,316 |
| Less foreign taxes withheld | | | | (6,481) |
| Total Income | | | | 47,835 |
| Expenses | | | | |
| Management fee | $ | 11,337 | | |
| Custodian fees and expenses | | 14,321 | | |
| Independent trustees' fees and expenses | | 7 | | |
| Registration fees | | 28,007 | | |
| Audit | | 22,408 | | |
| Legal | | 2 | | |
| Miscellaneous | | 480 | | |
| Total expenses before reductions | | 76,562 | | |
| Expense reductions | | (64,240) | | |
| Total expenses after reductions | | | | 12,322 |
| Net Investment income (loss) | | | | 35,513 |
| Realized and Unrealized Gain (Loss) | | | | |
| Net realized gain (loss) on: | | | | |
| Investment Securities: | | | | |
| Unaffiliated issuers | | (57,263) | | |
| Foreign currency transactions | | 1,765 | | |
| Total net realized gain (loss) | | | | (55,498) |
| Change in net unrealized appreciation (depreciation) on: | | | | |
| Investment Securities: | | | | |
| Unaffiliated issuers | | 597,900 | | |
| Assets and liabilities in foreign currencies | | 113 | | |
| Total change in net unrealized appreciation (depreciation) | | | | 598,013 |
| Net gain (loss) | | | | 542,515 |
| Net increase (decrease) in net assets resulting from operations | | | $ | 578,028 |
| Statement of Changes in Net Assets |
| |
| | Six months ended April 30, 2023 (Unaudited) | | For the period April 14, 2022 (commencement of operations) through October 31, 2022 |
| Increase (Decrease) in Net Assets | | | | |
| Operations | | | | |
| Net investment income (loss) | $ | 35,513 | $ | 18,247 |
| Net realized gain (loss) | | (55,498) | | (91,225) |
| Change in net unrealized appreciation (depreciation) | | 598,013 | | (320,866) |
| Net increase (decrease) in net assets resulting from operations | | 578,028 | | (393,844) |
| Distributions to shareholders | | (17,379) | | - |
| Share transactions | | | | |
| Proceeds from sales of shares | | 1,801,367 | | 2,599,216 |
| Reinvestment of distributions | | 16,766 | | - |
| Cost of shares redeemed | | (157,789) | | (19,690) |
Net increase (decrease) in net assets resulting from share transactions | | 1,660,344 | | 2,579,526 |
| Total increase (decrease) in net assets | | 2,220,993 | | 2,185,682 |
| | | | | |
| Net Assets | | | | |
| Beginning of period | | 2,185,682 | | - |
| End of period | $ | 4,406,675 | $ | 2,185,682 |
| | | | | |
| Other Information | | | | |
| Shares | | | | |
| Sold | | 196,167 | | 273,624 |
| Issued in reinvestment of distributions | | 1,851 | | - |
| Redeemed | | (17,271) | | (2,370) |
| Net increase (decrease) | | 180,747 | | 271,254 |
| | | | | |
Financial Highlights
| Fidelity SAI Sustainable International Equity Fund |
| |
| | Six months ended (Unaudited) April 30, 2023 | | Years ended October 31, 2022 A |
Selected Per-Share Data | | | | |
| Net asset value, beginning of period | $ | 8.06 | $ | 10.00 |
| Income from Investment Operations | | | | |
Net investment income (loss) B,C | | .10 | | .08 |
| Net realized and unrealized gain (loss) | | 1.65 | | (2.02) |
| Total from investment operations | | 1.75 | | (1.94) |
| Distributions from net investment income | | (.06) | | - |
| Total distributions | | (.06) | | - |
| Net asset value, end of period | $ | 9.75 | $ | 8.06 |
Total Return D,E | | 21.73% | | (19.40)% |
Ratios to Average Net Assets C,F,G | | | | |
| Expenses before reductions | | 4.58% H | | 5.78% H,I |
| Expenses net of fee waivers, if any | | .74% H | | .75% H |
| Expenses net of all reductions | | .74% H | | .68% H |
| Net investment income (loss) | | 2.12% H | | 1.79% H |
| Supplemental Data | | | | |
| Net assets, end of period (000 omitted) | $ | 4,407 | $ | 2,186 |
Portfolio turnover rate J | | 50% H | | 51% H |
A For the period April 14, 2022 (commencement of operations) through October 31, 2022.
B Calculated based on average shares outstanding during the period.
C Net investment income (loss) is affected by the timing of the declaration of dividends by any underlying mutual funds or exchange-traded funds (ETFs). Net investment income (loss) of any mutual funds or ETFs is not included in the Fund's net investment income (loss) ratio.
D Total returns for periods of less than one year are not annualized.
E Total returns would have been lower if certain expenses had not been reduced during the applicable periods shown.
F Fees and expenses of any underlying mutual funds or exchange-traded funds (ETFs) are not included in the Fund's expense ratio. The Fund indirectly bears its proportionate share of these expenses. For additional expense information related to investments in Fidelity Central Funds, please refer to the "Investments in Fidelity Central Funds" note found in the Notes to Financial Statements section of the most recent Annual or Semi-Annual report.
G Expense ratios reflect operating expenses of the class. Expenses before reductions do not reflect amounts reimbursed, waived, or reduced through arrangements with the investment adviser, brokerage services, or other offset arrangements, if applicable, and do not represent the amount paid by the class during periods when reimbursements, waivers or reductions occur.
H Annualized.
I Audit fees are not annualized.
J Amount does not include the portfolio activity of any underlying mutual funds or exchange-traded funds (ETFs).
For the period ended April 30, 2023
1. Organization.
Fidelity SAI Sustainable International Equity Fund (the Fund) is a fund of Fidelity Investment Trust (the Trust) and is authorized to issue an unlimited number of shares. Shares are offered exclusively to certain clients of Fidelity Management & Research Company LLC (FMR) or its affiliates. The Trust is registered under the Investment Company Act of 1940, as amended (the 1940 Act), as an open-end management investment company organized as a Massachusetts business trust.
2. Investments in Fidelity Central Funds.
Funds may invest in Fidelity Central Funds, which are open-end investment companies generally available only to other investment companies and accounts managed by the investment adviser and its affiliates. The Schedule of Investments lists any Fidelity Central Funds held as an investment as of period end, but does not include the underlying holdings of each Fidelity Central Fund. An investing fund indirectly bears its proportionate share of the expenses of the underlying Fidelity Central Funds.
Based on its investment objective, each Fidelity Central Fund may invest or participate in various investment vehicles or strategies that are similar to those of the investing fund. These strategies are consistent with the investment objectives of the investing fund and may involve certain economic risks which may cause a decline in value of each of the Fidelity Central Funds and thus a decline in the value of the investing fund.
| Fidelity Central Fund | Investment Manager | Investment Objective | Investment Practices | Expense Ratio A |
| Fidelity Money Market Central Funds | Fidelity Management & Research Company LLC (FMR) | Each fund seeks to obtain a high level of current income consistent with the preservation of capital and liquidity. | Short-term Investments | Less than .005% |
A Expenses expressed as a percentage of average net assets and are as of each underlying Central Fund's most recent annual or semi-annual shareholder report.
A complete unaudited list of holdings for each Fidelity Central Fund is available upon request or at the Securities and Exchange Commission website at www.sec.gov. In addition, the financial statements of the Fidelity Central Funds which contain the significant accounting policies (including investment valuation policies) of those funds, and are not covered by the Report of Independent Registered Public Accounting Firm, are available on the Securities and Exchange Commission website or upon request.
3. Significant Accounting Policies.
The Fund is an investment company and applies the accounting and reporting guidance of the Financial Accounting Standards Board (FASB) Accounting Standards Codification Topic 946 Financial Services - Investment Companies . The financial statements have been prepared in conformity with accounting principles generally accepted in the United States of America (GAAP), which require management to make certain estimates and assumptions at the date of the financial statements. Actual results could differ from those estimates. Subsequent events, if any, through the date that the financial statements were issued have been evaluated in the preparation of the financial statements. The Fund's Schedule of Investments lists any underlying mutual funds or exchange-traded funds (ETFs) but does not include the underlying holdings of these funds. The following summarizes the significant accounting policies of the Fund:
Investment Valuation. Investments are valued as of 4:00 p.m. Eastern time on the last calendar day of the period. The Board of Trustees (the Board) has designated the Fund's investment adviser as the valuation designee responsible for the fair valuation function and performing fair value determinations as needed. The investment adviser has established a Fair Value Committee (the Committee) to carry out the day-to-day fair valuation responsibilities and has adopted policies and procedures to govern the fair valuation process and the activities of the Committee. In accordance with these fair valuation policies and procedures, which have been approved by the Board, the Fund attempts to obtain prices from one or more third party pricing services or brokers to value its investments. When current market prices, quotations or currency exchange rates are not readily available or reliable, investments will be fair valued in good faith by the Committee, in accordance with the policies and procedures. Factors used in determining fair value vary by investment type and may include market or investment specific events, transaction data, estimated cash flows, and market observations of comparable investments. The frequency that the fair valuation procedures are used cannot be predicted and they may be utilized to a significant extent. The Committee manages the Fund's fair valuation practices and maintains the fair valuation policies and procedures. The Fund's investment adviser reports to the Board information regarding the fair valuation process and related material matters.
The Fund categorizes the inputs to valuation techniques used to value its investments into a disclosure hierarchy consisting of three levels as shown below:
Level 1 - unadjusted quoted prices in active markets for identical investments
Level 2 - other significant observable inputs (including quoted prices for similar investments, interest rates, prepayment speeds, etc.)
Level 3 - unobservable inputs (including the Fund's own assumptions based on the best information available)
Valuation techniques used to value the Fund's investments by major category are as follows:
Equity securities, including restricted securities, for which market quotations are readily available, are valued at the last reported sale price or official closing price as reported by a third party pricing service on the primary market or exchange on which they are traded and are categorized as Level 1 in the hierarchy. In the event there were no sales during the day or closing prices are not available, securities are valued at the last quoted bid price or may be valued using the last available price and are generally categorized as Level 2 in the hierarchy. For foreign equity securities, when market or security specific events arise, comparisons to the valuation of American Depositary Receipts (ADRs), futures contracts, Exchange-Traded Funds (ETFs) and certain indexes as well as quoted prices for similar securities may be used and would be categorized as Level 2 in the hierarchy. For equity securities, including restricted securities, where observable inputs are limited, assumptions about market activity and risk are used and these securities may be categorized as Level 3 in the hierarchy.
Investments in open-end mutual funds, including the Fidelity Central Funds, are valued at their closing net asset value (NAV) each business day and are categorized as Level 1 in the hierarchy.
Changes in valuation techniques may result in transfers in or out of an assigned level within the disclosure hierarchy. The aggregate value of investments by input level as of April 30, 2023 is included at the end of the Fund's Schedule of Investments.
Foreign Currency. Certain Funds may use foreign currency contracts to facilitate transactions in foreign-denominated securities. Gains and losses from these transactions may arise from changes in the value of the foreign currency or if the counterparties do not perform under the contracts' terms.
Foreign-denominated assets, including investment securities, and liabilities are translated into U.S. dollars at the exchange rates at period end. Purchases and sales of investment securities, income and dividends received, and expenses denominated in foreign currencies are translated into U.S. dollars at the exchange rate in effect on the transaction date.
The effects of exchange rate fluctuations on investments are included with the net realized and unrealized gain (loss) on investment securities. Other foreign currency transactions resulting in realized and unrealized gain (loss) are disclosed separately.
Investment Transactions and Income. For financial reporting purposes, the Fund's investment holdings and NAV include trades executed through the end of the last business day of the period. The NAV per share for processing shareholder transactions is calculated as of the close of business of the New York Stock Exchange (NYSE), normally 4:00 p.m. Eastern time and includes trades executed through the end of the prior business day. Gains and losses on securities sold are determined on the basis of identified cost. Commissions paid to certain brokers with whom the investment adviser, or its affiliates, places trades on behalf of a fund include an amount in addition to trade execution, which may be rebated back to a fund. Any such rebates are included in net realized gain (loss) on investments in the Statement of Operations. Dividend income is recorded on the ex-dividend date, except for certain dividends from foreign securities where the ex-dividend date may have passed, which are recorded as soon as the Fund is informed of the ex-dividend date. Non-cash dividends included in dividend income, if any, are recorded at the fair market value of the securities received. Income and capital gain distributions from Fidelity Central Funds, if any, are recorded on the ex-dividend date. Investment income is recorded net of foreign taxes withheld where recovery of such taxes is uncertain. Funds may file withholding tax reclaims in certain jurisdictions to recover a portion of amounts previously withheld. Any withholding tax reclaims income is included in the Statement of Operations in foreign taxes withheld. Any receivables for withholding tax reclaims are included in the Statement of Assets and Liabilities in reclaims receivable.
Expenses. Expenses directly attributable to a fund are charged to that fund. Expenses attributable to more than one fund are allocated among the respective funds on the basis of relative net assets or other appropriate methods. Expenses included in the accompanying financial statements reflect the expenses of that fund and do not include any expenses associated with any underlying mutual funds or exchange-traded funds. Although not included in a fund's expenses, a fund indirectly bears its proportionate share of these expenses through the net asset value of each underlying mutual fund or exchange-traded fund. Expense estimates are accrued in the period to which they relate and adjustments are made when actual amounts are known.
Income Tax Information and Distributions to Shareholders. Each year, the Fund intends to qualify as a regulated investment company under Subchapter M of the Internal Revenue Code, including distributing substantially all of its taxable income and realized gains. As a result, no provision for U.S. Federal income taxes is required. The Fund files a U.S. federal tax return, in addition to state and local tax returns as required. The Fund's federal income tax returns are subject to examination by the Internal Revenue Service (IRS) for a period of three fiscal years after they are filed. State and local tax returns may be subject to examination for an additional fiscal year depending on the jurisdiction. Foreign taxes are provided for based on the Fund's understanding of the tax rules and rates that exist in the foreign markets in which it invests.
Distributions are declared and recorded on the ex-dividend date. Income and capital gain distributions are determined in accordance with income tax regulations, which may differ from GAAP.
Capital accounts within the financial statements are adjusted for permanent book-tax differences. These adjustments have no impact on net assets or the results of operations. Capital accounts are not adjusted for temporary book-tax differences which will reverse in a subsequent period.
Book-tax differences are primarily due to foreign currency transactions, passive foreign investment companies (PFIC), capital loss carryforwards and losses deferred due to wash sales.
As of period end, the cost and unrealized appreciation (depreciation) in securities, and derivatives if applicable, for federal income tax purposes were as follows:
| Gross unrealized appreciation | $381,729 |
| Gross unrealized depreciation | (120,095) |
| Net unrealized appreciation (depreciation) | $261,634 |
| Tax cost | $4,174,071 |
Capital loss carryforwards are only available to offset future capital gains of the Fund to the extent provided by regulations and may be limited. The capital loss carryforward information presented below, including any applicable limitation, is estimated as of prior fiscal period end and is subject to adjustment.
Short-term | $(82,536) |
| Total capital loss carryforward | $(82,536) |
Restricted Securities (including Private Placements). Funds may invest in securities that are subject to legal or contractual restrictions on resale. These securities generally may be resold in transactions exempt from registration or to the public if the securities are registered. Disposal of these securities may involve time-consuming negotiations and expense, and prompt sale at an acceptable price may be difficult. Information regarding restricted securities held at period end is included at the end of the Schedule of Investments, if applicable.
4. Purchases and Sales of Investments.
Purchases and sales of securities, other than short-term securities and in-kind transactions, as applicable, are noted in the table below.
| | Purchases ($) | Sales ($) |
| Fidelity SAI Sustainable International Equity Fund | 2,410,187 | 803,960 |
5. Fees and Other Transactions with Affiliates.
Management Fee. Fidelity Management & Research Company LLC (the investment adviser) and its affiliates provide the Fund with investment management related services for which the Fund pays a monthly management fee. The management fee is the sum of an individual fund fee rate that is based on an annual rate of .45% of the Fund's average net assets and an annualized group fee rate that averaged .23% during the period. The group fee rate is based upon the monthly average net assets of a group of registered investment companies with which the investment adviser has management contracts. The group fee rate decreases as assets under management increase and increases as assets under management decrease. For the reporting period, the total annualized management fee rate was .68% of the Fund's average net assets.
Interfund Trades. Funds may purchase from or sell securities to other Fidelity Funds under procedures adopted by the Board. The procedures have been designed to ensure these interfund trades are executed in accordance with Rule 17a-7 of the 1940 Act. Any interfund trades are included within the respective purchases and sales amounts shown in the Purchases and Sales of Investments note. Interfund trades during the period are noted in the table below.
| | Purchases ($) | Sales ($) | Realized Gain (Loss) ($) |
| Fidelity SAI Sustainable International Equity Fund | 131,907 | 31,660 | 497 |
6. Committed Line of Credit.
Certain Funds participate with other funds managed by the investment adviser or an affiliate in a $4.25 billion credit facility (the "line of credit") to be utilized for temporary or emergency purposes to fund shareholder redemptions or for other short-term liquidity purposes. The participating funds have agreed to pay commitment fees on their pro-rata portion of the line of credit, which are reflected in Miscellaneous expenses on the Statement of Operations, and are listed below. During the period, there were no borrowings on this line of credit.
7. Expense Reductions.
The investment adviser contractually agreed to reimburse the Fund to the extent annual operating expenses exceeded .75% of average net assets. This reimbursement will remain in place through February 29, 2024. Some expenses, for example the compensation of the independent Trustees, and certain miscellaneous expenses such as proxy and shareholder meeting expenses, are excluded from this reimbursement. During the period this reimbursement reduced the Fund's expenses by $64,041.
Through arrangements with the Fund's custodian and transfer agent, credits realized as a result of certain uninvested cash balances were used to reduce the Fund's expenses by $121.
In addition, during the period the investment adviser or an affiliate reimbursed and/or waived a portion of operating expenses in the amount of $78.
8. Other.
A fund's organizational documents provide former and current trustees and officers with a limited indemnification against liabilities arising in connection with the performance of their duties to the fund. In the normal course of business, a fund may also enter into contracts that provide general indemnifications. A fund's maximum exposure under these arrangements is unknown as this would be dependent on future claims that may be made against a fund. The risk of material loss from such claims is considered remote.
At the end of the period, the investment adviser or its affiliates were owners of record of more than 10% of the outstanding shares as follows:
| Fund | Affiliated % |
Fidelity SAI Sustainable International Equity Fund | 45% |
9. Risk and Uncertainties.
Many factors affect a fund's performance. Developments that disrupt global economies and financial markets, such as pandemics, epidemics, outbreaks of infectious diseases, war, terrorism, and environmental disasters, may significantly affect a fund's investment performance. The effects of these developments to a fund will be impacted by the types of securities in which a fund invests, the financial condition, industry, economic sector, and geographic location of an issuer, and a fund's level of investment in the securities of that issuer. Significant concentrations in security types, issuers, industries, sectors, and geographic locations may magnify the factors that affect a fund's performance.
As a shareholder, you incur two types of costs: (1) transaction costs, which may include sales charges (loads) on purchase payments or redemption proceeds, as applicable and (2) ongoing costs, which generally include management fees, distribution and/or service (12b-1) fees and other Fund expenses. This Example is intended to help you understand your ongoing costs (in dollars) of investing in a fund and to compare these costs with the ongoing costs of investing in other mutual funds.
| The Example is based on an investment of $1,000 invested at the beginning of the period and held for the entire period (November 1, 2022 to April 30, 2023). |
Actual Expenses
The first line of the accompanying table provides information about actual account values and actual expenses. You may use the information in this line, together with the amount you invested, to estimate the expenses that you paid over the period. Simply divide your account value by $1,000.00 (for example, an $8,600 account value divided by $1,000.00 = 8.6), then multiply the result by the number in the first line for a class/Fund under the heading entitled "Expenses Paid During Period" to estimate the expenses you paid on your account during this period. If any fund is a shareholder of any underlying mutual funds or exchange-traded funds (ETFs) (the Underlying Funds), such fund indirectly bears its proportional share of the expenses of the Underlying Funds in addition to the direct expenses incurred presented in the table. These fees and expenses are not included in the annualized expense ratio used to calculate the expense estimate in the table below.
Hypothetical Example for Comparison Purposes
The second line of the accompanying table provides information about hypothetical account values and hypothetical expenses based on the actual expense ratio and an assumed rate of return of 5% per year before expenses, which is not the actual return. The hypothetical account values and expenses may not be used to estimate the actual ending account balance or expenses you paid for the period. You may use this information to compare the ongoing costs of investing in the Fund and other funds. To do so, compare this 5% hypothetical example with the 5% hypothetical examples that appear in the shareholder reports of the other funds. If any fund is a shareholder of any Underlying Funds, such fund indirectly bears its proportional share of the expenses of the Underlying Funds in addition to the direct expenses as presented in the table. These fees and expenses are not included in the annualized expense ratio used to calculate the expense estimate in the table below.
Please note that the expenses shown in the table are meant to highlight your ongoing costs only and do not reflect any transaction costs. Therefore, the second line of the table is useful in comparing ongoing costs only, and will not help you determine the relative total costs of owning different funds. In addition, if these transactional costs were included, your costs would have been higher.
| | | | | Annualized Expense Ratio- A | | Beginning Account Value November 1, 2022 | | Ending Account Value April 30, 2023 | | Expenses Paid During Period- C November 1, 2022 to April 30, 2023 |
| | | | | | | | | | |
| Fidelity® SAI Sustainable International Equity Fund | | | | .74% | | | | | | |
| Actual | | | | | | $ 1,000 | | $ 1,217.30 | | $ 4.07 |
Hypothetical- B | | | | | | $ 1,000 | | $ 1,021.12 | | $ 3.71 |
| |
A Annualized expense ratio reflects expenses net of applicable fee waivers.
B 5% return per year before expenses
C Expenses are equal to the annualized expense ratio, multiplied by the average account value over the period, multiplied by 181/ 365 (to reflect the one-half year period). The fees and expenses of any Underlying Funds are not included in each annualized expense ratio.
The Securities and Exchange Commission adopted Rule 22e-4 under the Investment Company Act of 1940 (the Liquidity Rule) to promote effective liquidity risk management throughout the open-end investment company industry, thereby reducing the risk that funds will be unable to meet their redemption obligations and mitigating dilution of the interests of fund shareholders.
The Fund has adopted and implemented a liquidity risk management program (the Program) reasonably designed to assess and manage the Fund's liquidity risk and to comply with the requirements of the Liquidity Rule. The Fund's Board of Trustees (the Board) has designated the Fund's investment adviser as administrator of the Program. The Fidelity advisers have established a Liquidity Risk Management Committee (the LRM Committee) to manage the Program for each of the Fidelity Funds. The LRM Committee monitors the adequacy and effectiveness of implementation of the Program and on a periodic basis assesses each Fund's liquidity risk based on a variety of factors including (1) the Fund's investment strategy, (2) portfolio liquidity and cash flow projections during normal and reasonably foreseeable stressed conditions, (3) shareholder redemptions, (4) borrowings and other funding sources and (5) certain factors specific to ETFs including the effect of the Fund's prices and spreads, market participants, and basket compositions on the overall liquidity of the Fund's portfolio, as applicable.
In accordance with the Program, each of the Fund's portfolio investments is classified into one of four defined liquidity categories based on a determination of a reasonable expectation for how long it would take to convert the investment to cash (or sell or dispose of the investment) without significantly changing its market value.
- Highly liquid investments - cash or convertible to cash within three business days or less
- Moderately liquid investments - convertible to cash in three to seven calendar days
- Less liquid investments - can be sold or disposed of, but not settled, within seven calendar days
- Illiquid investments - cannot be sold or disposed of within seven calendar days
Liquidity classification determinations take into account a variety of factors including various market, trading and investment-specific considerations, as well as market depth, and generally utilize analysis from a third-party liquidity metrics service.
The Liquidity Rule places a 15% limit on a fund's illiquid investments and requires funds that do not primarily hold assets that are highly liquid investments to determine and maintain a minimum percentage of the fund's net assets to be invested in highly liquid investments (highly liquid investment minimum or HLIM). The Program includes provisions reasonably designed to comply with the 15% limit on illiquid investments and for determining, periodically reviewing and complying with the HLIM requirement as applicable.
At a recent meeting of the Fund's Board of Trustees, the LRM Committee provided a written report to the Board pertaining to the operation, adequacy, and effectiveness of the Program for the period December 1, 2021 through November 30, 2022. The report concluded that the Program is operating effectively and is reasonably designed to assess and manage the Fund's liquidity risk.
1.9904872.101
IEE-SANN-0623
Fidelity® SAI Sustainable Emerging Markets Equity Fund
Semi-Annual Report
April 30, 2023
Offered exclusively to certain clients of the Adviser, or its affiliates, including Strategic Advisers LLC (Strategic Advisers) - not available for sale to the general public. Fidelity ® SAI is a product name of Fidelity ® funds dedicated to certain programs affiliated with Strategic Advisers.
Contents
To view a fund's proxy voting guidelines and proxy voting record for the 12-month period ended June 30, visit http://www.fidelity.com/proxyvotingresults or visit the Securities and Exchange Commission's (SEC) web site at http://www.sec.gov.
You may also call 1-800-544-3455 to request a free copy of the proxy voting guidelines.
Standard & Poor's, S&P and S&P 500 are registered service marks of The McGraw-Hill Companies, Inc. and have been licensed for use by Fidelity Distributors Corporation.
Other third-party marks appearing herein are the property of their respective owners.
All other marks appearing herein are registered or unregistered trademarks or service marks of FMR LLC or an affiliated company. © 2023 FMR LLC. All rights reserved.
This report and the financial statements contained herein are submitted for the general information of the shareholders of the Fund. This report is not authorized for distribution to prospective investors in the Fund unless preceded or accompanied by an effective prospectus.
A fund files its complete schedule of portfolio holdings with the SEC for the first and third quarters of each fiscal year on Form N-PORT. Forms N-PORT are available on the SEC's web site at http://www.sec.gov. A fund's Forms N-PORT may be reviewed and copied at the SEC's Public Reference Room in Washington, DC. Information regarding the operation of the SEC's Public Reference Room may be obtained by calling 1-800-SEC-0330.
For a complete list of a fund's portfolio holdings, view the most recent holdings listing, semiannual report, or annual report on Fidelity's web site at http://www.fidelity.com, http://www.institutional.fidelity.com, or http://www.401k.com, as applicable.
NOT FDIC INSURED •MAY LOSE VALUE •NO BANK GUARANTEE
Neither the Fund nor Fidelity Distributors Corporation is a bank.
Top Holdings (% of Fund's net assets) |
| |
| Taiwan Semiconductor Manufacturing Co. Ltd. sponsored ADR (Taiwan, Semiconductors & Semiconductor Equipment) | 8.9 | |
| Tencent Holdings Ltd. (China, Interactive Media & Services) | 5.8 | |
| Samsung Electronics Co. Ltd. (Korea (South), Technology Hardware, Storage & Peripherals) | 5.4 | |
| Alibaba Group Holding Ltd. (China, Broadline Retail) | 3.3 | |
| Reliance Industries Ltd. GDR (India, Oil, Gas & Consumable Fuels) | 2.6 | |
| Wal-Mart de Mexico SA de CV Series V (Mexico, Consumer Staples Distribution & Retail) | 2.4 | |
| China Construction Bank Corp. (H Shares) (China, Banks) | 2.3 | |
| LG Chemical Ltd. (Korea (South), Chemicals) | 1.9 | |
| Ping An Insurance Group Co. of China Ltd. (H Shares) (China, Insurance) | 1.8 | |
| NetEase, Inc. ADR (China, Entertainment) | 1.8 | |
| | 36.2 | |
| |
| Market Sectors (% of Fund's net assets) |
| |
| Financials | 21.0 | |
| Information Technology | 19.7 | |
| Consumer Discretionary | 13.4 | |
| Communication Services | 12.5 | |
| Consumer Staples | 7.5 | |
| Industrials | 5.4 | |
| Health Care | 5.1 | |
| Materials | 4.9 | |
| Energy | 2.6 | |
| Utilities | 1.7 | |
| |
Asset Allocation (% of Fund's net assets) |
|
Futures - 3.3% |
|
Geographic Diversification (% of Fund's net assets) |
|
* Includes Short-Term investments and Net Other Assets (Liabilities). Percentages are adjusted for the effect of derivatives, if applicable. |
| |
Showing Percentage of Net Assets
| Common Stocks - 92.1% |
| | | Shares | Value ($) |
| Brazil - 3.9% | | | |
| Azul SA sponsored ADR (a) | | 1,565 | 10,188 |
| Hapvida Participacoes e Investimentos SA (a)(b) | | 35,999 | 19,920 |
| Localiza Rent a Car SA | | 2,171 | 25,250 |
| Localiza Rent a Car SA rights 5/11/23 (a) | | 5 | 17 |
| Lojas Renner SA | | 4,715 | 14,974 |
| Natura & Co. Holding SA | | 3,753 | 8,322 |
| Pet Center Comercio e Participacoes SA | | 11,337 | 14,024 |
| Raia Drogasil SA | | 4,279 | 22,545 |
TOTAL BRAZIL | | | 115,240 |
| China - 31.1% | | | |
| Alibaba Group Holding Ltd. (a) | | 8,488 | 89,749 |
| Alibaba Group Holding Ltd. sponsored ADR (a) | | 109 | 9,231 |
| Baidu, Inc. sponsored ADR (a) | | 92 | 11,096 |
| BeiGene Ltd. ADR (a) | | 23 | 5,864 |
| Bilibili, Inc. ADR (a) | | 566 | 11,524 |
| BYD Co. Ltd. (H Shares) | | 596 | 18,074 |
| China Construction Bank Corp. (H Shares) | | 103,359 | 69,098 |
| China Life Insurance Co. Ltd. (H Shares) | | 6,492 | 12,472 |
| China Merchants Bank Co. Ltd. (H Shares) | | 1,328 | 6,410 |
| China Resources Beer Holdings Co. Ltd. | | 2,748 | 21,228 |
| Contemporary Amperex Technology Co. Ltd. | | 219 | 7,345 |
| ENN Energy Holdings Ltd. | | 1,892 | 25,942 |
| Haier Smart Home Co. Ltd. | | 6,221 | 20,278 |
| Hansoh Pharmaceutical Group Co. Ltd. (b) | | 2,228 | 4,065 |
| JD.com, Inc. sponsored ADR | | 522 | 18,646 |
| Kunlun Energy Co. Ltd. | | 14,928 | 13,838 |
| Kweichow Moutai Co. Ltd. (A Shares) | | 63 | 16,075 |
| Li Auto, Inc. ADR (a) | | 556 | 13,066 |
| Li Ning Co. Ltd. | | 999 | 7,144 |
| Meituan Class B (a)(b) | | 2,946 | 50,348 |
| NetEase, Inc. ADR | | 606 | 54,013 |
| New Horizon Health Ltd. (a)(b) | | 3,071 | 11,020 |
| PDD Holdings, Inc. ADR (a) | | 422 | 28,759 |
| Ping An Insurance Group Co. of China Ltd. (H Shares) | | 7,478 | 54,556 |
| Shenzhen Mindray Bio-Medical Electronics Co. Ltd. (A Shares) | | 824 | 37,253 |
| Shenzhou International Group Holdings Ltd. | | 1,949 | 18,720 |
| Silergy Corp. | | 287 | 4,527 |
| Sinopharm Group Co. Ltd. (H Shares) | | 2,000 | 7,085 |
| Sinotruk Hong Kong Ltd. | | 12,215 | 18,667 |
| Sunny Optical Technology Group Co. Ltd. | | 970 | 10,250 |
| Tencent Holdings Ltd. | | 3,898 | 173,134 |
| Trip.com Group Ltd. ADR (a) | | 904 | 32,101 |
| Wuliangye Yibin Co. Ltd. (A Shares) | | 456 | 11,167 |
| Wuxi Biologics (Cayman), Inc. (a)(b) | | 2,763 | 16,475 |
| Zai Lab Ltd. ADR (a) | | 329 | 11,508 |
| Zijin Mining Group Co. Ltd. (H Shares) | | 4,357 | 7,377 |
TOTAL CHINA | | | 928,105 |
| Hungary - 0.6% | | | |
| OTP Bank PLC | | 215 | 6,541 |
| Richter Gedeon PLC | | 498 | 12,018 |
TOTAL HUNGARY | | | 18,559 |
| India - 13.7% | | | |
| Axis Bank Ltd. | | 1,741 | 18,397 |
| Axis Bank Ltd. sponsored GDR (Reg. S) | | 52 | 2,746 |
| Bharti Airtel Ltd. | | 2,649 | 25,959 |
| HDFC Bank Ltd. sponsored ADR | | 764 | 53,327 |
| HDFC Standard Life Insurance Co. Ltd. (b) | | 2,621 | 17,034 |
| Hindustan Unilever Ltd. | | 900 | 27,118 |
| Housing Development Finance Corp. Ltd. | | 1,031 | 35,165 |
| ICICI Bank Ltd. | | 2,686 | 30,333 |
| Infosys Ltd. sponsored ADR | | 2,233 | 34,701 |
| Larsen & Toubro Ltd. | | 1,341 | 38,920 |
| NTPC Ltd. | | 3,965 | 8,372 |
| Reliance Industries Ltd. | | 851 | 25,299 |
| Reliance Industries Ltd. GDR (b) | | 899 | 53,580 |
| SRF Ltd. | | 205 | 6,395 |
| Tata Consultancy Services Ltd. | | 193 | 7,639 |
| Tata Steel Ltd. | | 6,818 | 9,049 |
| Ultratech Cement Ltd. | | 151 | 13,993 |
TOTAL INDIA | | | 408,027 |
| Indonesia - 3.5% | | | |
| PT Bank Central Asia Tbk | | 73,470 | 45,467 |
| PT Bank Mandiri (Persero) Tbk | | 71,760 | 25,367 |
| PT Bank Rakyat Indonesia (Persero) Tbk | | 65,839 | 22,944 |
| PT Telkom Indonesia Persero Tbk | | 38,409 | 11,125 |
TOTAL INDONESIA | | | 104,903 |
| Korea (South) - 13.1% | | | |
| Db Insurance Co. Ltd. | | 276 | 17,357 |
| Hansol Chemical Co. Ltd. | | 70 | 11,672 |
| Hyundai Fire & Marine Insurance Co. Ltd. | | 839 | 23,580 |
| Hyundai Motor Co. Ltd. | | 271 | 40,159 |
| JYP Entertainment Corp. | | 98 | 6,632 |
| KB Financial Group, Inc. | | 313 | 11,622 |
| LG Chemical Ltd. | | 104 | 57,793 |
| LG Energy Solution (a) | | 27 | 11,772 |
| LG H & H Co. Ltd. | | 13 | 6,073 |
| LG Innotek Co. Ltd. | | 22 | 4,380 |
| NAVER Corp. | | 74 | 10,725 |
| Samsung Electronics Co. Ltd. | | 3,290 | 161,946 |
| SK Hynix, Inc. | | 428 | 28,809 |
TOTAL KOREA (SOUTH) | | | 392,520 |
| Malaysia - 0.2% | | | |
| Press Metal Aluminium Holdings | | 4,977 | 5,767 |
| Mexico - 5.3% | | | |
| CEMEX S.A.B. de CV sponsored ADR (a) | | 1,019 | 6,114 |
| Grupo Aeroportuario Norte S.A.B. de CV | | 2,944 | 32,362 |
| Grupo Financiero Banorte S.A.B. de CV Series O | | 5,682 | 49,136 |
| Wal-Mart de Mexico SA de CV Series V | | 17,667 | 71,230 |
TOTAL MEXICO | | | 158,842 |
| Peru - 0.3% | | | |
| Credicorp Ltd. (United States) | | 66 | 8,942 |
| Saudi Arabia - 1.1% | | | |
| Al Rajhi Bank | | 430 | 8,805 |
| Dr Sulaiman Al Habib Medical Services Group Co. | | 332 | 25,404 |
TOTAL SAUDI ARABIA | | | 34,209 |
| Singapore - 1.4% | | | |
| Sea Ltd. ADR (a) | | 541 | 41,208 |
| South Africa - 4.3% | | | |
| Absa Group Ltd. | | 3,115 | 30,250 |
| Bid Corp. Ltd. | | 960 | 21,848 |
| Gold Fields Ltd. sponsored ADR | | 712 | 11,079 |
| Impala Platinum Holdings Ltd. | | 1,432 | 13,942 |
| MTN Group Ltd. | | 3,643 | 25,555 |
| Naspers Ltd. Class N | | 146 | 26,029 |
TOTAL SOUTH AFRICA | | | 128,703 |
| Taiwan - 13.0% | | | |
| Chailease Holding Co. Ltd. | | 3,229 | 23,501 |
| E.SUN Financial Holdings Co. Ltd. | | 8,006 | 6,506 |
| eMemory Technology, Inc. | | 328 | 19,598 |
| HIWIN Technologies Corp. | | 2,754 | 21,139 |
| Hon Hai Precision Industry Co. Ltd. (Foxconn) GDR (Reg. S) | | 3,092 | 21,180 |
| MediaTek, Inc. | | 1,378 | 29,942 |
| Taiwan Semiconductor Manufacturing Co. Ltd. sponsored ADR | | 3,153 | 265,802 |
TOTAL TAIWAN | | | 387,668 |
| Thailand - 0.6% | | | |
| CP ALL PCL (For. Reg.) | | 7,394 | 14,053 |
| Thai Beverage PCL | | 7,749 | 3,724 |
TOTAL THAILAND | | | 17,777 |
| TOTAL COMMON STOCKS (Cost $2,719,500) | | | 2,750,470 |
| | | | |
| Nonconvertible Preferred Stocks - 1.7% |
| | | Shares | Value ($) |
| Brazil - 1.7% | | | |
| Banco Bradesco SA (PN) | | 2,162 | 6,003 |
| Itau Unibanco Holding SA | | 8,736 | 45,398 |
| | | | |
| TOTAL NONCONVERTIBLE PREFERRED STOCKS (Cost $52,651) | | | 51,401 |
| | | | |
| Government Obligations - 0.3% |
| | | Principal Amount (c) | Value ($) |
| United States of America - 0.3% | | | |
U.S. Treasury Bills, yield at date of purchase 4.74% 5/18/23 (d) (Cost $9,978) | | 10,000 | 9,979 |
| | | | |
| Money Market Funds - 7.5% |
| | | Shares | Value ($) |
Fidelity Cash Central Fund 4.88% (e) (Cost $223,332) | | 223,287 | 223,332 |
| | | | |
| TOTAL INVESTMENT IN SECURITIES - 101.6% (Cost $3,005,461) | 3,035,182 |
NET OTHER ASSETS (LIABILITIES) - (1.6)% | (47,031) |
| NET ASSETS - 100.0% | 2,988,151 |
| | |
| Futures Contracts |
| | Number of contracts | Expiration Date | Notional Amount ($) | Value ($) | Unrealized Appreciation/ (Depreciation) ($) |
| Purchased | | | | | |
| | | | | | |
| Equity Index Contracts | | | | | |
| ICE E-mini MSCI Emerging Markets Index Contracts (United States) | 2 | Jun 2023 | 98,420 | (1,346) | (1,346) |
| | | | | | |
| The notional amount of futures purchased as a percentage of Net Assets is 3.3% |
Legend
| (b) | Security exempt from registration under Rule 144A of the Securities Act of 1933. These securities may be resold in transactions exempt from registration, normally to qualified institutional buyers. At the end of the period, the value of these securities amounted to $172,442 or 5.8% of net assets. |
| (c) | Amount is stated in United States dollars unless otherwise noted. |
| (d) | Security or a portion of the security was pledged to cover margin requirements for futures contracts. At period end, the value of securities pledged amounted to $9,979. |
| (e) | Affiliated fund that is generally available only to investment companies and other accounts managed by Fidelity Investments. The rate quoted is the annualized seven-day yield of the fund at period end. A complete unaudited listing of the fund's holdings as of its most recent quarter end is available upon request. In addition, each Fidelity Central Fund's financial statements are available on the SEC's website or upon request. |
Affiliated Central Funds
Fiscal year to date information regarding the Fund's investments in Fidelity Central Funds, including the ownership percentage, is presented below.
| Affiliate | Value, beginning of period ($) | Purchases ($) | Sales Proceeds ($) | Dividend Income ($) | Realized Gain (loss) ($) | Change in Unrealized appreciation (depreciation) ($) | Value, end of period ($) | % ownership, end of period |
| Fidelity Cash Central Fund 4.88% | 56,344 | 972,712 | 805,724 | 3,519 | - | - | 223,332 | 0.0% |
| Total | 56,344 | 972,712 | 805,724 | 3,519 | - | - | 223,332 | |
| | | | | | | | | |
Amounts in the dividend income column in the above table include any capital gain distributions from underlying funds, which are presented in the corresponding line item in the Statement of Operations, if applicable.
Amounts included in the purchases and sales proceeds columns may include in-kind transactions, if applicable.
Investment Valuation
The following is a summary of the inputs used, as of April 30, 2023, involving the Fund's assets and liabilities carried at fair value. The inputs or methodology used for valuing securities may not be an indication of the risk associated with investing in those securities. For more information on valuation inputs, and their aggregation into the levels used below, please refer to the Investment Valuation section in the accompanying Notes to Financial Statements.
| Valuation Inputs at Reporting Date: |
| Description | Total ($) | Level 1 ($) | Level 2 ($) | Level 3 ($) |
Investments in Securities: | | | | |
|
| Equities: | | | | |
Communication Services | 370,971 | 143,396 | 227,575 | - |
Consumer Discretionary | 401,302 | 156,830 | 244,472 | - |
Consumer Staples | 223,383 | 123,945 | 99,438 | - |
Energy | 78,879 | 53,580 | 25,299 | - |
Financials | 630,957 | 211,148 | 419,809 | - |
Health Care | 150,612 | 74,714 | 75,898 | - |
Industrials | 165,660 | 67,817 | 97,843 | - |
Information Technology | 588,774 | 321,683 | 267,091 | - |
Materials | 143,181 | 17,193 | 125,988 | - |
Utilities | 48,152 | - | 48,152 | - |
|
| Government Obligations | 9,979 | - | 9,979 | - |
|
| Money Market Funds | 223,332 | 223,332 | - | - |
| Total Investments in Securities: | 3,035,182 | 1,393,638 | 1,641,544 | - |
Derivative Instruments: | | | | |
|
| Liabilities | | | | |
Futures Contracts | (1,346) | (1,346) | - | - |
| Total Liabilities | (1,346) | (1,346) | - | - |
| Total Derivative Instruments: | (1,346) | (1,346) | - | - |
Value of Derivative Instruments
The following table is a summary of the Fund's value of derivative instruments by primary risk exposure as of April 30, 2023. For additional information on derivative instruments, please refer to the Derivative Instruments section in the accompanying Notes to Financial Statements.
Primary Risk Exposure / Derivative Type | Value |
| Asset ($) | Liability ($) |
| Equity Risk | | |
Futures Contracts (a) | 0 | (1,346) |
| Total Equity Risk | 0 | (1,346) |
| Total Value of Derivatives | 0 | (1,346) |
(a)Reflects gross cumulative appreciation (depreciation) on futures contracts as presented in the Schedule of Investments. In the Statement of Assets and Liabilities, the period end daily variation margin is included in receivable or payable for daily variation margin on futures contracts, and the net cumulative appreciation (depreciation) is included in Total accumulated earnings (loss).
| Statement of Assets and Liabilities |
| | | | April 30, 2023 (Unaudited) |
| | | | | |
| Assets | | | | |
| Investment in securities, at value - See accompanying schedule: | | | | |
Unaffiliated issuers (cost $2,782,129) | $ | 2,811,850 | | |
Fidelity Central Funds (cost $223,332) | | 223,332 | | |
| | | | | |
| | | | | |
| Total Investment in Securities (cost $3,005,461) | | | $ | 3,035,182 |
| Cash | | | | 2,862 |
| Foreign currency held at value (cost $8,962) | | | | 8,963 |
| Dividends receivable | | | | 2,510 |
| Distributions receivable from Fidelity Central Funds | | | | 766 |
| Receivable for daily variation margin on futures contracts | | | | 500 |
| Prepaid expenses | | | | 1 |
| Receivable from investment adviser for expense reductions | | | | 11,495 |
| Other receivables | | | | 18 |
Total assets | | | | 3,062,297 |
| Liabilities | | | | |
| Payable for investments purchased | $ | 31,088 | | |
| Accrued management fee | | 1,914 | | |
| Audit fee payable | | 27,088 | | |
| Deferred independent trustees' fees payable | | 13,826 | | |
| Other payables and accrued expenses | | 230 | | |
| Total Liabilities | | | | 74,146 |
| Net Assets | | | $ | 2,988,151 |
| Net Assets consist of: | | | | |
| Paid in capital | | | $ | 3,153,611 |
| Total accumulated earnings (loss) | | | | (165,460) |
| Net Assets | | | $ | 2,988,151 |
Net Asset Value , offering price and redemption price per share ($2,988,151 ÷ 331,213 shares) | | | $ | 9.02 |
| Statement of Operations |
| | | | Six months ended April 30, 2023 (Unaudited) |
| Investment Income | | | | |
| Dividends | | | $ | 22,070 |
| Non-Cash dividends | | | | 6,765 |
| Interest | | | | 194 |
| Income from Fidelity Central Funds | | | | 3,519 |
| Income before foreign taxes withheld | | | $ | 32,548 |
| Less foreign taxes withheld | | | | (3,160) |
| Total Income | | | | 29,388 |
| Expenses | | | | |
| Management fee | $ | 9,870 | | |
| Custodian fees and expenses | | 21,390 | | |
| Independent trustees' fees and expenses | | 6 | | |
| Registration fees | | 30,109 | | |
| Audit | | 25,259 | | |
| Legal | | 2 | | |
| Miscellaneous | | 2 | | |
| Total expenses before reductions | | 86,638 | | |
| Expense reductions | | (74,821) | | |
| Total expenses after reductions | | | | 11,817 |
| Net Investment income (loss) | | | | 17,571 |
| Realized and Unrealized Gain (Loss) | | | | |
| Net realized gain (loss) on: | | | | |
| Investment Securities: | | | | |
| Unaffiliated issuers | | (78,681) | | |
| Foreign currency transactions | | (3,200) | | |
| Futures contracts | | 8,939 | | |
| Total net realized gain (loss) | | | | (72,942) |
| Change in net unrealized appreciation (depreciation) on: | | | | |
| Investment Securities: | | | | |
| Unaffiliated issuers(net of increase in deferred foreign taxes of $233) | | 410,835 | | |
| Assets and liabilities in foreign currencies | | (16) | | |
| Futures contracts | | (1,346) | | |
| Total change in net unrealized appreciation (depreciation) | | | | 409,473 |
| Net gain (loss) | | | | 336,531 |
| Net increase (decrease) in net assets resulting from operations | | | $ | 354,102 |
| Statement of Changes in Net Assets |
| |
| | Six months ended April 30, 2023 (Unaudited) | | For the period April 14, 2022 (commencement of operations) through October 31, 2022 |
| Increase (Decrease) in Net Assets | | | | |
| Operations | | | | |
| Net investment income (loss) | $ | 17,571 | $ | 12,746 |
| Net realized gain (loss) | | (72,942) | | (131,753) |
| Change in net unrealized appreciation (depreciation) | | 409,473 | | (381,337) |
| Net increase (decrease) in net assets resulting from operations | | 354,102 | | (500,344) |
| Distributions to shareholders | | (19,218) | | - |
| Share transactions | | | | |
| Proceeds from sales of shares | | 961,168 | | 2,279,784 |
| Reinvestment of distributions | | 18,756 | | - |
| Cost of shares redeemed | | (98,928) | | (7,169) |
Net increase (decrease) in net assets resulting from share transactions | | 880,996 | | 2,272,615 |
| Total increase (decrease) in net assets | | 1,215,880 | | 1,772,271 |
| | | | | |
| Net Assets | | | | |
| Beginning of period | | 1,772,271 | | - |
| End of period | $ | 2,988,151 | $ | 1,772,271 |
| | | | | |
| Other Information | | | | |
| Shares | | | | |
| Sold | | 106,977 | | 233,926 |
| Issued in reinvestment of distributions | | 2,130 | | - |
| Redeemed | | (10,942) | | (878) |
| Net increase (decrease) | | 98,165 | | 233,048 |
| | | | | |
Financial Highlights
| Fidelity SAI Sustainable Emerging Markets Equity Fund |
| |
| | Six months ended (Unaudited) April 30, 2023 | | Years ended October 31, 2022 A |
Selected Per-Share Data | | | | |
| Net asset value, beginning of period | $ | 7.60 | $ | 10.00 |
| Income from Investment Operations | | | | |
Net investment income (loss) B,C | | .06 | | .06 |
| Net realized and unrealized gain (loss) | | 1.44 | | (2.46) |
| Total from investment operations | | 1.50 | | (2.40) |
| Distributions from net investment income | | (.08) | | - |
| Total distributions | | (.08) | | - |
| Net asset value, end of period | $ | 9.02 | $ | 7.60 |
Total Return D,E | | 19.71% | | (24.00)% |
Ratios to Average Net Assets C,F,G | | | | |
| Expenses before reductions | | 6.83% H | | 6.38% H,I |
| Expenses net of fee waivers, if any | | .94% H | | .96% H |
| Expenses net of all reductions | | .93% H | | .96% H |
| Net investment income (loss) | | 1.38% H | | 1.27% H |
| Supplemental Data | | | | |
| Net assets, end of period (000 omitted) | $ | 2,988 | $ | 1,772 |
Portfolio turnover rate J | | 103% H | | 74% H |
A For the period April 14, 2022 (commencement of operations) through October 31, 2022.
B Calculated based on average shares outstanding during the period.
C Net investment income (loss) is affected by the timing of the declaration of dividends by any underlying mutual funds or exchange-traded funds (ETFs). Net investment income (loss) of any mutual funds or ETFs is not included in the Fund's net investment income (loss) ratio.
D Total returns for periods of less than one year are not annualized.
E Total returns would have been lower if certain expenses had not been reduced during the applicable periods shown.
F Fees and expenses of any underlying mutual funds or exchange-traded funds (ETFs) are not included in the Fund's expense ratio. The Fund indirectly bears its proportionate share of these expenses. For additional expense information related to investments in Fidelity Central Funds, please refer to the "Investments in Fidelity Central Funds" note found in the Notes to Financial Statements section of the most recent Annual or Semi-Annual report.
G Expense ratios reflect operating expenses of the class. Expenses before reductions do not reflect amounts reimbursed, waived, or reduced through arrangements with the investment adviser, brokerage services, or other offset arrangements, if applicable, and do not represent the amount paid by the class during periods when reimbursements, waivers or reductions occur.
H Annualized.
I Audit fees are not annualized.
J Amount does not include the portfolio activity of any underlying mutual funds or exchange-traded funds (ETFs).
For the period ended April 30, 2023
1. Organization.
Fidelity SAI Sustainable Emerging Markets Equity Fund (the Fund) is a fund of Fidelity Investment Trust (the Trust) and is authorized to issue an unlimited number of shares. Shares are offered exclusively to certain clients of Fidelity Management & Research Company LLC (FMR) or its affiliates. The Trust is registered under the Investment Company Act of 1940, as amended (the 1940 Act), as an open-end management investment company organized as a Massachusetts business trust. The Fund's investments in emerging markets can be subject to social, economic, regulatory, and political uncertainties and can be extremely volatile.
2. Investments in Fidelity Central Funds.
Funds may invest in Fidelity Central Funds, which are open-end investment companies generally available only to other investment companies and accounts managed by the investment adviser and its affiliates. The Schedule of Investments lists any Fidelity Central Funds held as an investment as of period end, but does not include the underlying holdings of each Fidelity Central Fund. An investing fund indirectly bears its proportionate share of the expenses of the underlying Fidelity Central Funds.
Based on its investment objective, each Fidelity Central Fund may invest or participate in various investment vehicles or strategies that are similar to those of the investing fund. These strategies are consistent with the investment objectives of the investing fund and may involve certain economic risks which may cause a decline in value of each of the Fidelity Central Funds and thus a decline in the value of the investing fund.
| Fidelity Central Fund | Investment Manager | Investment Objective | Investment Practices | Expense Ratio A |
| Fidelity Money Market Central Funds | Fidelity Management & Research Company LLC (FMR) | Each fund seeks to obtain a high level of current income consistent with the preservation of capital and liquidity. | Short-term Investments | Less than .005% |
A Expenses expressed as a percentage of average net assets and are as of each underlying Central Fund's most recent annual or semi-annual shareholder report.
A complete unaudited list of holdings for each Fidelity Central Fund is available upon request or at the Securities and Exchange Commission website at www.sec.gov. In addition, the financial statements of the Fidelity Central Funds which contain the significant accounting policies (including investment valuation policies) of those funds, and are not covered by the Report of Independent Registered Public Accounting Firm, are available on the Securities and Exchange Commission website or upon request.
3. Significant Accounting Policies.
The Fund is an investment company and applies the accounting and reporting guidance of the Financial Accounting Standards Board (FASB) Accounting Standards Codification Topic 946 Financial Services - Investment Companies . The financial statements have been prepared in conformity with accounting principles generally accepted in the United States of America (GAAP), which require management to make certain estimates and assumptions at the date of the financial statements. Actual results could differ from those estimates. Subsequent events, if any, through the date that the financial statements were issued have been evaluated in the preparation of the financial statements. The Fund's Schedule of Investments lists any underlying mutual funds or exchange-traded funds (ETFs) but does not include the underlying holdings of these funds. The following summarizes the significant accounting policies of the Fund:
Investment Valuation. Investments are valued as of 4:00 p.m. Eastern time on the last calendar day of the period. The Board of Trustees (the Board) has designated the Fund's investment adviser as the valuation designee responsible for the fair valuation function and performing fair value determinations as needed. The investment adviser has established a Fair Value Committee (the Committee) to carry out the day-to-day fair valuation responsibilities and has adopted policies and procedures to govern the fair valuation process and the activities of the Committee. In accordance with these fair valuation policies and procedures, which have been approved by the Board, the Fund attempts to obtain prices from one or more third party pricing services or brokers to value its investments. When current market prices, quotations or currency exchange rates are not readily available or reliable, investments will be fair valued in good faith by the Committee, in accordance with the policies and procedures. Factors used in determining fair value vary by investment type and may include market or investment specific events, transaction data, estimated cash flows, and market observations of comparable investments. The frequency that the fair valuation procedures are used cannot be predicted and they may be utilized to a significant extent. The Committee manages the Fund's fair valuation practices and maintains the fair valuation policies and procedures. The Fund's investment adviser reports to the Board information regarding the fair valuation process and related material matters.
The Fund categorizes the inputs to valuation techniques used to value its investments into a disclosure hierarchy consisting of three levels as shown below:
Level 1 - unadjusted quoted prices in active markets for identical investments
Level 2 - other significant observable inputs (including quoted prices for similar investments, interest rates, prepayment speeds, etc.)
Level 3 - unobservable inputs (including the Fund's own assumptions based on the best information available)
Valuation techniques used to value the Fund's investments by major category are as follows:
Equity securities, including restricted securities, for which market quotations are readily available, are valued at the last reported sale price or official closing price as reported by a third party pricing service on the primary market or exchange on which they are traded and are categorized as Level 1 in the hierarchy. In the event there were no sales during the day or closing prices are not available, securities are valued at the last quoted bid price or may be valued using the last available price and are generally categorized as Level 2 in the hierarchy. For foreign equity securities, when market or security specific events arise, comparisons to the valuation of American Depositary Receipts (ADRs), futures contracts, ETFs and certain indexes as well as quoted prices for similar securities may be used and would be categorized as Level 2 in the hierarchy. For equity securities, including restricted securities, where observable inputs are limited, assumptions about market activity and risk are used and these securities may be categorized as Level 3 in the hierarchy.
Debt securities, including restricted securities, are valued based on evaluated prices received from third party pricing services or from brokers who make markets in such securities. U.S. government and government agency obligations are valued by pricing services who utilize matrix pricing which considers yield or price of bonds of comparable quality, coupon, maturity and type or by broker-supplied prices.
Futures contracts are valued at the settlement price established each day by the board of trade or exchange on which they are traded and are categorized as Level 1 in the hierarchy. Investments in open-end mutual funds, including the Fidelity Central Funds, are valued at their closing net asset value (NAV) each business day and are categorized as Level 1 in the hierarchy.
Changes in valuation techniques may result in transfers in or out of an assigned level within the disclosure hierarchy. The aggregate value of investments by input level as of April 30, 2023 is included at the end of the Fund's Schedule of Investments.
Foreign Currency. Certain Funds may use foreign currency contracts to facilitate transactions in foreign-denominated securities. Gains and losses from these transactions may arise from changes in the value of the foreign currency or if the counterparties do not perform under the contracts' terms.
Foreign-denominated assets, including investment securities, and liabilities are translated into U.S. dollars at the exchange rates at period end. Purchases and sales of investment securities, income and dividends received, and expenses denominated in foreign currencies are translated into U.S. dollars at the exchange rate in effect on the transaction date.
The effects of exchange rate fluctuations on investments are included with the net realized and unrealized gain (loss) on investment securities. Other foreign currency transactions resulting in realized and unrealized gain (loss) are disclosed separately.
Investment Transactions and Income. For financial reporting purposes, the Fund's investment holdings and NAV include trades executed through the end of the last business day of the period. The NAV per share for processing shareholder transactions is calculated as of the close of business of the New York Stock Exchange (NYSE), normally 4:00 p.m. Eastern time and includes trades executed through the end of the prior business day. Gains and losses on securities sold are determined on the basis of identified cost. Commissions paid to certain brokers with whom the investment adviser, or its affiliates, places trades on behalf of a fund include an amount in addition to trade execution, which may be rebated back to a fund. Any such rebates are included in net realized gain (loss) on investments in the Statement of Operations. Dividend income is recorded on the ex-dividend date, except for certain dividends from foreign securities where the ex-dividend date may have passed, which are recorded as soon as the Fund is informed of the ex-dividend date. Non-cash dividends included in dividend income, if any, are recorded at the fair market value of the securities received. Income and capital gain distributions from Fidelity Central Funds, if any, are recorded on the ex-dividend date. Interest income is accrued as earned and includes coupon interest and amortization of premium and accretion of discount on debt securities as applicable. Investment income is recorded net of foreign taxes withheld where recovery of such taxes is uncertain.
Expenses. Expenses directly attributable to a fund are charged to that fund. Expenses attributable to more than one fund are allocated among the respective funds on the basis of relative net assets or other appropriate methods. Expenses included in the accompanying financial statements reflect the expenses of that fund and do not include any expenses associated with any underlying mutual funds or exchange-traded funds. Although not included in a fund's expenses, a fund indirectly bears its proportionate share of these expenses through the net asset value of each underlying mutual fund or exchange-traded fund. Expense estimates are accrued in the period to which they relate and adjustments are made when actual amounts are known.
Income Tax Information and Distributions to Shareholders. Each year, the Fund intends to qualify as a regulated investment company under Subchapter M of the Internal Revenue Code, including distributing substantially all of its taxable income and realized gains. As a result, no provision for U.S. Federal income taxes is required. The Fund files a U.S. federal tax return, in addition to state and local tax returns as required. The Fund's federal income tax returns are subject to examination by the Internal Revenue Service (IRS) for a period of three fiscal years after they are filed. State and local tax returns may be subject to examination for an additional fiscal year depending on the jurisdiction. Foreign taxes are provided for based on the Fund's understanding of the tax rules and rates that exist in the foreign markets in which it invests. The Fund is subject to a tax imposed on capital gains by certain countries in which it invests. An estimated deferred tax liability for net unrealized appreciation on the applicable securities is included in Other payables and accrued expenses on the Statement of Assets & Liabilities.
Distributions are declared and recorded on the ex-dividend date. Income and capital gain distributions are determined in accordance with income tax regulations, which may differ from GAAP.
Capital accounts within the financial statements are adjusted for permanent book-tax differences. These adjustments have no impact on net assets or the results of operations. Capital accounts are not adjusted for temporary book-tax differences which will reverse in a subsequent period.
Book-tax differences are primarily due to foreign currency transactions, futures contacts, passive foreign investment companies (PFIC),capital loss carryforwards and losses deferred due to wash sale.
As of period end, the cost and unrealized appreciation (depreciation) in securities, and derivatives if applicable, for federal income tax purposes were as follows:
| Gross unrealized appreciation | $175,698 |
| Gross unrealized depreciation | (174,134) |
| Net unrealized appreciation (depreciation) | $1,564 |
| Tax cost | $3,032,272 |
Capital loss carryforwards are only available to offset future capital gains of the Fund to the extent provided by regulations and may be limited. The capital loss carryforward information presented below, including any applicable limitation, is estimated as of prior fiscal period end and is subject to adjustment.
| Short-term | $(85,372) |
| Long-term | (7,516) |
| Total capital loss carryforward | $(92,888) |
Restricted Securities (including Private Placements). Funds may invest in securities that are subject to legal or contractual restrictions on resale. These securities generally may be resold in transactions exempt from registration or to the public if the securities are registered. Disposal of these securities may involve time-consuming negotiations and expense, and prompt sale at an acceptable price may be difficult. Information regarding restricted securities held at period end is included at the end of the Schedule of Investments, if applicable.
4. Derivative Instruments.
Risk Exposures and the Use of Derivative Instruments. The Fund's investment objectives allow for various types of derivative instruments, including futures contracts. Derivatives are investments whose value is primarily derived from underlying assets, indices or reference rates and may be transacted on an exchange or over-the-counter (OTC). Derivatives may involve a future commitment to buy or sell a specified asset based on specified terms, to exchange future cash flows at periodic intervals based on a notional principal amount, or for one party to make one or more payments upon the occurrence of specified events in exchange for periodic payments from the other party.
Derivatives were used to increase returns and to manage exposure to certain risks as defined below. The success of any strategy involving derivatives depends on analysis of numerous economic factors, and if the strategies for investment do not work as intended, the objectives may not be achieved.
Derivatives were used to increase or decrease exposure to the following risk(s):
| | |
| Equity Risk | Equity risk relates to the fluctuations in the value of financial instruments as a result of changes in market prices (other than those arising from interest rate risk or foreign exchange risk), whether caused by factors specific to an individual investment, its issuer, or all factors affecting all instruments traded in a market or market segment. |
Funds are also exposed to additional risks from investing in derivatives, such as liquidity risk and counterparty credit risk. Liquidity risk is the risk that a fund will be unable to close out the derivative in the open market in a timely manner. Counterparty credit risk is the risk that the counterparty will not be able to fulfill its obligation to a fund. Counterparty credit risk related to exchange-traded contracts may be mitigated by the protection provided by the exchange on which they trade.
Investing in derivatives may involve greater risks than investing in the underlying assets directly and, to varying degrees, may involve risk of loss in excess of any initial investment and collateral received and amounts recognized in the Statement of Assets and Liabilities. In addition, there may be the risk that the change in value of the derivative contract does not correspond to the change in value of the underlying instrument.
Futures Contracts. A futures contract is an agreement between two parties to buy or sell a specified underlying instrument for a fixed price at a specified future date. Futures contracts were used to manage exposure to the stock market.
Upon entering into a futures contract, a fund is required to deposit either cash or securities (initial margin) with a clearing broker in an amount equal to a certain percentage of the face value of the contract. Futures contracts are marked-to-market daily and subsequent daily payments are made or received by a fund depending on the daily fluctuations in the value of the futures contracts and are recorded as unrealized appreciation or (depreciation). This receivable and/or payable, if any, is included in daily variation margin on futures contracts in the Statement of Assets and Liabilities. Realized gain or (loss) is recorded upon the expiration or closing of a futures contract. The net realized gain (loss) and change in net unrealized appreciation (depreciation) on futures contracts during the period is presented in the Statement of Operations.
Any open futures contracts at period end are presented in the Schedule of Investments under the caption "Futures Contracts". The notional amount at value reflects each contract's exposure to the underlying instrument or index at period end, and is representative of volume of activity during the period unless an average notional amount is presented. Any securities deposited to meet initial margin requirements are identified in the Schedule of Investments. Any cash deposited to meet initial margin requirements is presented as segregated cash with brokers for derivative instruments in the Statement of Assets and Liabilities.
5. Purchases and Sales of Investments.
Purchases and sales of securities, other than short-term securities, U.S. government securities and in-kind transactions, as applicable, are noted in the table below.
| | Purchases ($) | Sales ($) |
| Fidelity SAI Sustainable Emerging Markets Equity Fund | 1,958,197 | 1,215,176 |
6. Fees and Other Transactions with Affiliates.
Management Fee. Fidelity Management & Research Company LLC (the investment adviser) and its affiliates provide the Fund with investment management related services for which the Fund pays a monthly management fee. The management fee is the sum of an individual fund fee rate that is based on an annual rate of .55% of the Fund's average net assets and an annualized group fee rate that averaged .23% during the period. The group fee rate is based upon the monthly average net assets of a group of registered investment companies with which the investment adviser has management contracts. The group fee rate decreases as assets under management increase and increases as assets under management decrease. For the reporting period, the total annualized management fee rate was .78% of the Fund's average net assets.
Brokerage Commissions. A portion of portfolio transactions were placed with brokerage firms which are affiliates of the investment adviser. Brokerage commissions are included in net realized gain (loss) and change in net unrealized appreciation (depreciation) in the Statement of Operations. The commissions paid to these affiliated firms were as follows:
| | Amount |
| Fidelity SAI Sustainable Emerging Markets Equity Fund | $5 |
Interfund Trades. Funds may purchase from or sell securities to other Fidelity Funds under procedures adopted by the Board. The procedures have been designed to ensure these interfund trades are executed in accordance with Rule 17a-7 of the 1940 Act. Any interfund trades are included within the respective purchases and sales amounts shown in the Purchases and Sales of Investments note. Interfund trades during the period are noted in the table below.
| | Purchases ($) | Sales ($) | Realized Gain (Loss) ($) |
| Fidelity SAI Sustainable Emerging Markets Equity Fund | 21,139 | 36,627 | (4,919) |
7. Committed Line of Credit.
Certain Funds participate with other funds managed by the investment adviser or an affiliate in a $4.25 billion credit facility (the "line of credit") to be utilized for temporary or emergency purposes to fund shareholder redemptions or for other short-term liquidity purposes. The participating funds have agreed to pay commitment fees on their pro-rata portion of the line of credit, which are reflected in Miscellaneous expenses on the Statement of Operations, and are listed below. During the period, there were no borrowings on this line of credit.
8. Expense Reductions.
The investment adviser contractually agreed to reimburse the Fund to the extent annual operating expenses exceeded .95% of average net assets. This reimbursement will remain in place through February 29, 2024. Some expenses, for example the compensation of the independent Trustees, and certain miscellaneous expenses such as proxy and shareholder meeting expenses, are excluded from this reimbursement. During the period this reimbursement reduced the Fund's expenses by $74,593.
Through arrangements with the Fund's custodian , credits realized as a result of certain uninvested cash balances were used to reduce the Fund's expenses by $169.
In addition, during the period the investment adviser or an affiliate reimbursed and/or waived a portion of operating expenses in the amount of $59.
9. Other.
A fund's organizational documents provide former and current trustees and officers with a limited indemnification against liabilities arising in connection with the performance of their duties to the fund. In the normal course of business, a fund may also enter into contracts that provide general indemnifications. A fund's maximum exposure under these arrangements is unknown as this would be dependent on future claims that may be made against a fund. The risk of material loss from such claims is considered remote.
At the end of the period, the investment adviser or its affiliates were owners of record of more than 10% of the outstanding shares as follows:
| Fund | Affiliated % |
Fidelity SAI Sustainable Emerging Markets Equity Fund | 61% |
10. Risk and Uncertainties.
Many factors affect a fund's performance. Developments that disrupt global economies and financial markets, such as pandemics, epidemics, outbreaks of infectious diseases, war, terrorism, and environmental disasters, may significantly affect a fund's investment performance. The effects of these developments to a fund will be impacted by the types of securities in which a fund invests, the financial condition, industry, economic sector, and geographic location of an issuer, and a fund's level of investment in the securities of that issuer. Significant concentrations in security types, issuers, industries, sectors, and geographic locations may magnify the factors that affect a fund's performance.
As a shareholder, you incur two types of costs: (1) transaction costs, which may include sales charges (loads) on purchase payments or redemption proceeds, as applicable and (2) ongoing costs, which generally include management fees, distribution and/or service (12b-1) fees and other Fund expenses. This Example is intended to help you understand your ongoing costs (in dollars) of investing in a fund and to compare these costs with the ongoing costs of investing in other mutual funds.
| The Example is based on an investment of $1,000 invested at the beginning of the period and held for the entire period (November 1, 2022 to April 30, 2023). |
Actual Expenses
The first line of the accompanying table provides information about actual account values and actual expenses. You may use the information in this line, together with the amount you invested, to estimate the expenses that you paid over the period. Simply divide your account value by $1,000.00 (for example, an $8,600 account value divided by $1,000.00 = 8.6), then multiply the result by the number in the first line for a class/Fund under the heading entitled "Expenses Paid During Period" to estimate the expenses you paid on your account during this period. If any fund is a shareholder of any underlying mutual funds or exchange-traded funds (ETFs) (the Underlying Funds), such fund indirectly bears its proportional share of the expenses of the Underlying Funds in addition to the direct expenses incurred presented in the table. These fees and expenses are not included in the annualized expense ratio used to calculate the expense estimate in the table below.
Hypothetical Example for Comparison Purposes
The second line of the accompanying table provides information about hypothetical account values and hypothetical expenses based on the actual expense ratio and an assumed rate of return of 5% per year before expenses, which is not the actual return. The hypothetical account values and expenses may not be used to estimate the actual ending account balance or expenses you paid for the period. You may use this information to compare the ongoing costs of investing in the Fund and other funds. To do so, compare this 5% hypothetical example with the 5% hypothetical examples that appear in the shareholder reports of the other funds. If any fund is a shareholder of any Underlying Funds, such fund indirectly bears its proportional share of the expenses of the Underlying Funds in addition to the direct expenses as presented in the table. These fees and expenses are not included in the annualized expense ratio used to calculate the expense estimate in the table below.
Please note that the expenses shown in the table are meant to highlight your ongoing costs only and do not reflect any transaction costs. Therefore, the second line of the table is useful in comparing ongoing costs only, and will not help you determine the relative total costs of owning different funds. In addition, if these transactional costs were included, your costs would have been higher.
| | | | | Annualized Expense Ratio- A | | Beginning Account Value November 1, 2022 | | Ending Account Value April 30, 2023 | | Expenses Paid During Period- C November 1, 2022 to April 30, 2023 |
| | | | | | | | | | |
| Fidelity® SAI Sustainable Emerging Markets Equity Fund | | | | .94% | | | | | | |
| Actual | | | | | | $ 1,000 | | $ 1,197.10 | | $ 5.12 |
Hypothetical- B | | | | | | $ 1,000 | | $ 1,020.13 | | $ 4.71 |
| |
A Annualized expense ratio reflects expenses net of applicable fee waivers.
B 5% return per year before expenses
C Expenses are equal to the annualized expense ratio, multiplied by the average account value over the period, multiplied by 181/ 365 (to reflect the one-half year period). The fees and expenses of any Underlying Funds are not included in each annualized expense ratio.
The Securities and Exchange Commission adopted Rule 22e-4 under the Investment Company Act of 1940 (the Liquidity Rule) to promote effective liquidity risk management throughout the open-end investment company industry, thereby reducing the risk that funds will be unable to meet their redemption obligations and mitigating dilution of the interests of fund shareholders.
The Fund has adopted and implemented a liquidity risk management program (the Program) reasonably designed to assess and manage the Fund's liquidity risk and to comply with the requirements of the Liquidity Rule. The Fund's Board of Trustees (the Board) has designated the Fund's investment adviser as administrator of the Program. The Fidelity advisers have established a Liquidity Risk Management Committee (the LRM Committee) to manage the Program for each of the Fidelity Funds. The LRM Committee monitors the adequacy and effectiveness of implementation of the Program and on a periodic basis assesses each Fund's liquidity risk based on a variety of factors including (1) the Fund's investment strategy, (2) portfolio liquidity and cash flow projections during normal and reasonably foreseeable stressed conditions, (3) shareholder redemptions, (4) borrowings and other funding sources and (5) certain factors specific to ETFs including the effect of the Fund's prices and spreads, market participants, and basket compositions on the overall liquidity of the Fund's portfolio, as applicable.
In accordance with the Program, each of the Fund's portfolio investments is classified into one of four defined liquidity categories based on a determination of a reasonable expectation for how long it would take to convert the investment to cash (or sell or dispose of the investment) without significantly changing its market value.
- Highly liquid investments - cash or convertible to cash within three business days or less
- Moderately liquid investments - convertible to cash in three to seven calendar days
- Less liquid investments - can be sold or disposed of, but not settled, within seven calendar days
- Illiquid investments - cannot be sold or disposed of within seven calendar days
Liquidity classification determinations take into account a variety of factors including various market, trading and investment-specific considerations, as well as market depth, and generally utilize analysis from a third-party liquidity metrics service.
The Liquidity Rule places a 15% limit on a fund's illiquid investments and requires funds that do not primarily hold assets that are highly liquid investments to determine and maintain a minimum percentage of the fund's net assets to be invested in highly liquid investments (highly liquid investment minimum or HLIM). The Program includes provisions reasonably designed to comply with the 15% limit on illiquid investments and for determining, periodically reviewing and complying with the HLIM requirement as applicable.
At a recent meeting of the Fund's Board of Trustees, the LRM Committee provided a written report to the Board pertaining to the operation, adequacy, and effectiveness of the Program for the period December 1, 2021 through November 30, 2022. The report concluded that the Program is operating effectively and is reasonably designed to assess and manage the Fund's liquidity risk.
1.9905648.101
ESP-SANN-0623
Fidelity® SAI International SMA Completion Fund
Semi-Annual Report
April 30, 2023
Offered exclusively to certain clients of the Adviser, or its affiliates, including Strategic Advisers LLC (Strategic Advisers) - not available for sale to the general public. Fidelity ® SAI is a product name of Fidelity ® funds dedicated to certain programs affiliated with Strategic Advisers.
Contents
To view a fund's proxy voting guidelines and proxy voting record for the 12-month period ended June 30, visit http://www.fidelity.com/proxyvotingresults or visit the Securities and Exchange Commission's (SEC) web site at http://www.sec.gov.
You may also call 1-800-544-3455 to request a free copy of the proxy voting guidelines.
Standard & Poor's, S&P and S&P 500 are registered service marks of The McGraw-Hill Companies, Inc. and have been licensed for use by Fidelity Distributors Corporation.
Other third-party marks appearing herein are the property of their respective owners.
All other marks appearing herein are registered or unregistered trademarks or service marks of FMR LLC or an affiliated company. © 2023 FMR LLC. All rights reserved.
This report and the financial statements contained herein are submitted for the general information of the shareholders of the Fund. This report is not authorized for distribution to prospective investors in the Fund unless preceded or accompanied by an effective prospectus.
A fund files its complete schedule of portfolio holdings with the SEC for the first and third quarters of each fiscal year on Form N-PORT. Forms N-PORT are available on the SEC's web site at http://www.sec.gov. A fund's Forms N-PORT may be reviewed and copied at the SEC's Public Reference Room in Washington, DC. Information regarding the operation of the SEC's Public Reference Room may be obtained by calling 1-800-SEC-0330.
For a complete list of a fund's portfolio holdings, view the most recent holdings listing, semiannual report, or annual report on Fidelity's web site at http://www.fidelity.com, http://www.institutional.fidelity.com, or http://www.401k.com, as applicable.
NOT FDIC INSURED •MAY LOSE VALUE •NO BANK GUARANTEE
Neither the Fund nor Fidelity Distributors Corporation is a bank.
Top Holdings (% of Fund's net assets) |
| |
| Keyence Corp. (Japan, Electronic Equipment, Instruments & Components) | 5.3 | |
| Itochu Corp. (Japan, Trading Companies & Distributors) | 4.9 | |
| Minebea Mitsumi, Inc. (Japan, Machinery) | 4.5 | |
| Constellation Software, Inc. (Canada, Software) | 4.1 | |
| Hannover Reuck SE (Germany, Insurance) | 3.9 | |
| Investor AB (B Shares) (Sweden, Financial Services) | 3.8 | |
| Indutrade AB (Sweden, Machinery) | 3.8 | |
| Housing Development Finance Corp. Ltd. (India, Financial Services) | 3.5 | |
| Reliance Industries Ltd. (India, Oil, Gas & Consumable Fuels) | 3.4 | |
| B&M European Value Retail SA (United Kingdom, Broadline Retail) | 3.3 | |
| | 40.5 | |
| |
| Market Sectors (% of Fund's net assets) |
| |
| Financials | 22.8 | |
| Industrials | 21.3 | |
| Information Technology | 19.1 | |
| Consumer Discretionary | 10.1 | |
| Energy | 6.0 | |
| Health Care | 3.9 | |
| Materials | 3.7 | |
| Communication Services | 2.7 | |
| Real Estate | 1.4 | |
| Consumer Staples | 0.6 | |
| |
Asset Allocation (% of Fund's net assets) |
|
|
Geographic Diversification (% of Fund's net assets) |
|
* Includes Short-Term investments and Net Other Assets (Liabilities). Percentages are adjusted for the effect of derivatives, if applicable. |
| |
Showing Percentage of Net Assets
| Common Stocks - 91.6% |
| | | Shares | Value ($) |
| Australia - 1.8% | | | |
| Aristocrat Leisure Ltd. | | 359,137 | 9,084,540 |
| Canada - 6.8% | | | |
| Constellation Software, Inc. | | 10,836 | 21,209,080 |
| Lumine Group, Inc. | | 32,512 | 437,941 |
| Tourmaline Oil Corp. | | 302,879 | 13,607,591 |
TOTAL CANADA | | | 35,254,612 |
| China - 2.9% | | | |
| Anta Sports Products Ltd. | | 398,089 | 4,946,744 |
| Chervon Holdings Ltd. | | 526,600 | 2,679,800 |
| Kweichow Moutai Co. Ltd. (A Shares) | | 11,800 | 3,010,823 |
| Li Ning Co. Ltd. | | 635,337 | 4,543,688 |
TOTAL CHINA | | | 15,181,055 |
| France - 5.9% | | | |
| Capgemini SA | | 51,685 | 9,391,336 |
| Edenred SA | | 36,806 | 2,389,591 |
| Sartorius Stedim Biotech | | 22,279 | 5,953,188 |
| Teleperformance | | 63,574 | 12,665,436 |
TOTAL FRANCE | | | 30,399,551 |
| Germany - 3.9% | | | |
| Hannover Reuck SE | | 93,982 | 20,048,977 |
| India - 8.0% | | | |
| Axis Bank Ltd. | | 518,478 | 5,478,782 |
| Housing Development Finance Corp. Ltd. | | 534,392 | 18,226,938 |
| Reliance Industries Ltd. | | 584,671 | 17,381,387 |
TOTAL INDIA | | | 41,087,107 |
| Indonesia - 4.7% | | | |
| PT Bank Central Asia Tbk | | 21,605,187 | 13,370,403 |
| PT Bank Rakyat Indonesia (Persero) Tbk | | 31,170,438 | 10,862,251 |
TOTAL INDONESIA | | | 24,232,654 |
| Ireland - 2.2% | | | |
| Kingspan Group PLC (Ireland) | | 166,007 | 11,469,279 |
| Italy - 1.7% | | | |
| FinecoBank SpA | | 438,676 | 6,636,767 |
| Reply SpA | | 15,900 | 1,848,382 |
TOTAL ITALY | | | 8,485,149 |
| Japan - 21.3% | | | |
| Itochu Corp. | | 763,666 | 25,334,513 |
| Keyence Corp. | | 60,824 | 27,428,963 |
| Minebea Mitsumi, Inc. | | 1,267,536 | 23,473,042 |
| Misumi Group, Inc. | | 117,474 | 2,963,541 |
| Nomura Research Institute Ltd. | | 249,371 | 6,274,062 |
| Olympus Corp. | | 476,400 | 8,340,057 |
| Relo Group, Inc. | | 152,001 | 2,363,067 |
| TIS, Inc. | | 513,891 | 14,111,305 |
TOTAL JAPAN | | | 110,288,550 |
| Korea (South) - 2.8% | | | |
| Samsung Electronics Co. Ltd. | | 295,104 | 14,526,078 |
| Luxembourg - 1.1% | | | |
| Eurofins Scientific SA | | 83,693 | 5,833,920 |
| Netherlands - 3.2% | | | |
| BE Semiconductor Industries NV | | 41,400 | 3,710,622 |
| IMCD NV | | 86,510 | 12,983,315 |
TOTAL NETHERLANDS | | | 16,693,937 |
| Spain - 4.3% | | | |
| CaixaBank SA | | 2,783,505 | 10,303,441 |
| Cellnex Telecom SA (a) | | 287,432 | 12,102,034 |
TOTAL SPAIN | | | 22,405,475 |
| Sweden - 8.0% | | | |
| Indutrade AB | | 815,006 | 19,526,670 |
| Investor AB (B Shares) | | 915,204 | 19,615,881 |
| Nibe Industrier AB (B Shares) | | 189,000 | 2,110,229 |
TOTAL SWEDEN | | | 41,252,780 |
| Switzerland - 2.3% | | | |
| Sika AG | | 43,604 | 12,044,429 |
| United Kingdom - 9.3% | | | |
| B&M European Value Retail SA | | 2,796,687 | 16,860,191 |
| Beazley PLC | | 717,596 | 5,370,450 |
| Big Yellow Group PLC | | 290,900 | 4,474,804 |
| Games Workshop Group PLC | | 32,300 | 4,026,828 |
| JD Sports Fashion PLC | | 4,935,057 | 9,988,535 |
| S4 Capital PLC (b) | | 1,110,703 | 2,040,771 |
| Standard Chartered PLC (United Kingdom) | | 679,100 | 5,363,136 |
TOTAL UNITED KINGDOM | | | 48,124,715 |
| Zambia - 1.4% | | | |
| First Quantum Minerals Ltd. | | 294,268 | 7,150,092 |
| TOTAL COMMON STOCKS (Cost $452,926,235) | | | 473,562,900 |
| | | | |
| Money Market Funds - 7.9% |
| | | Shares | Value ($) |
Fidelity Cash Central Fund 4.88% (c) (Cost $40,734,424) | | 40,726,279 | 40,734,424 |
| | | | |
| TOTAL INVESTMENT IN SECURITIES - 99.5% (Cost $493,660,659) | 514,297,324 |
NET OTHER ASSETS (LIABILITIES) - 0.5% | 2,787,722 |
| NET ASSETS - 100.0% | 517,085,046 |
| | |
Legend
| (a) | Security exempt from registration under Rule 144A of the Securities Act of 1933. These securities may be resold in transactions exempt from registration, normally to qualified institutional buyers. At the end of the period, the value of these securities amounted to $12,102,034 or 2.3% of net assets. |
| (c) | Affiliated fund that is generally available only to investment companies and other accounts managed by Fidelity Investments. The rate quoted is the annualized seven-day yield of the fund at period end. A complete unaudited listing of the fund's holdings as of its most recent quarter end is available upon request. In addition, each Fidelity Central Fund's financial statements are available on the SEC's website or upon request. |
Affiliated Central Funds
Fiscal year to date information regarding the Fund's investments in Fidelity Central Funds, including the ownership percentage, is presented below.
| Affiliate | Value, beginning of period ($) | Purchases ($) | Sales Proceeds ($) | Dividend Income ($) | Realized Gain (loss) ($) | Change in Unrealized appreciation (depreciation) ($) | Value, end of period ($) | % ownership, end of period |
| Fidelity Cash Central Fund 4.88% | 43,600,978 | 82,200,147 | 85,066,701 | 704,834 | - | - | 40,734,424 | 0.1% |
| Total | 43,600,978 | 82,200,147 | 85,066,701 | 704,834 | - | - | 40,734,424 | |
| | | | | | | | | |
Amounts in the dividend income column in the above table include any capital gain distributions from underlying funds, which are presented in the corresponding line item in the Statement of Operations, if applicable.
Amounts included in the purchases and sales proceeds columns may include in-kind transactions, if applicable.
Investment Valuation
The following is a summary of the inputs used, as of April 30, 2023, involving the Fund's assets and liabilities carried at fair value. The inputs or methodology used for valuing securities may not be an indication of the risk associated with investing in those securities. For more information on valuation inputs, and their aggregation into the levels used below, please refer to the Investment Valuation section in the accompanying Notes to Financial Statements.
| Valuation Inputs at Reporting Date: |
| Description | Total ($) | Level 1 ($) | Level 2 ($) | Level 3 ($) |
Investments in Securities: | | | | |
|
| Equities: | | | | |
Communication Services | 14,142,805 | 2,040,771 | 12,102,034 | - |
Consumer Discretionary | 52,130,326 | 30,875,554 | 21,254,772 | - |
Consumer Staples | 3,010,823 | - | 3,010,823 | - |
Energy | 30,988,978 | 13,607,591 | 17,381,387 | - |
Financials | 117,666,617 | 59,424,802 | 58,241,815 | - |
Health Care | 20,127,165 | 11,787,108 | 8,340,057 | - |
Industrials | 110,526,025 | 58,754,929 | 51,771,096 | - |
Information Technology | 98,937,769 | 36,597,361 | 62,340,408 | - |
Materials | 19,194,521 | 7,150,092 | 12,044,429 | - |
Real Estate | 6,837,871 | 4,474,804 | 2,363,067 | - |
|
| Money Market Funds | 40,734,424 | 40,734,424 | - | - |
| Total Investments in Securities: | 514,297,324 | 265,447,436 | 248,849,888 | - |
| Statement of Assets and Liabilities |
| | | | April 30, 2023 (Unaudited) |
| | | | | |
| Assets | | | | |
| Investment in securities, at value - See accompanying schedule: | | | | |
Unaffiliated issuers (cost $452,926,235) | $ | 473,562,900 | | |
Fidelity Central Funds (cost $40,734,424) | | 40,734,424 | | |
| | | | | |
| | | | | |
| Total Investment in Securities (cost $493,660,659) | | | $ | 514,297,324 |
| Foreign currency held at value (cost $122,672) | | | | 122,674 |
| Receivable for fund shares sold | | | | 619,641 |
| Dividends receivable | | | | 1,551,442 |
| Reclaims receivable | | | | 743,132 |
| Distributions receivable from Fidelity Central Funds | | | | 146,257 |
| Other receivables | | | | 37,107 |
Total assets | | | | 517,517,577 |
| Liabilities | | | | |
| Payable for fund shares redeemed | $ | 214,786 | | |
| Distributions payable | | 66 | | |
| Deferred taxes | | 217,509 | | |
| Other payables and accrued expenses | | 170 | | |
| Total Liabilities | | | | 432,531 |
| Net Assets | | | $ | 517,085,046 |
| Net Assets consist of: | | | | |
| Paid in capital | | | $ | 552,382,286 |
| Total accumulated earnings (loss) | | | | (35,297,240) |
| Net Assets | | | $ | 517,085,046 |
Net Asset Value , offering price and redemption price per share ($517,085,046 ÷ 47,063,015 shares) | | | $ | 10.99 |
| Statement of Operations |
| | | | Six months ended April 30, 2023 (Unaudited) |
| Investment Income | | | | |
| Dividends | | | $ | 6,047,973 |
| Non-Cash dividends | | | | 339,033 |
| Income from Fidelity Central Funds | | | | 704,834 |
| Income before foreign taxes withheld | | | $ | 7,091,840 |
| Less foreign taxes withheld | | | | (852,271) |
| Total Income | | | | 6,239,569 |
| Expenses | | | | |
| Independent trustees' fees and expenses | $ | 1,513 | | |
| Total expenses before reductions | | 1,513 | | |
| Expense reductions | | (108) | | |
| Total expenses after reductions | | | | 1,405 |
| Net Investment income (loss) | | | | 6,238,164 |
| Realized and Unrealized Gain (Loss) | | | | |
| Net realized gain (loss) on: | | | | |
| Investment Securities: | | | | |
| Unaffiliated issuers | | (17,392,210) | | |
| Foreign currency transactions | | 46,097 | | |
| Total net realized gain (loss) | | | | (17,346,113) |
| Change in net unrealized appreciation (depreciation) on: | | | | |
| Investment Securities: | | | | |
| Unaffiliated issuers(net of increase in deferred foreign taxes of $21,245) | | 80,527,763 | | |
| Assets and liabilities in foreign currencies | | 41,684 | | |
| Total change in net unrealized appreciation (depreciation) | | | | 80,569,447 |
| Net gain (loss) | | | | 63,223,334 |
| Net increase (decrease) in net assets resulting from operations | | | $ | 69,461,498 |
| Statement of Changes in Net Assets |
| |
| | Six months ended April 30, 2023 (Unaudited) | | Year ended October 31, 2022 |
| Increase (Decrease) in Net Assets | | | | |
| Operations | | | | |
| Net investment income (loss) | $ | 6,238,164 | $ | 7,825,590 |
| Net realized gain (loss) | | (17,346,113) | | (43,209,211) |
| Change in net unrealized appreciation (depreciation) | | 80,569,447 | | (176,966,374) |
| Net increase (decrease) in net assets resulting from operations | | 69,461,498 | | (212,349,995) |
| Distributions to shareholders | | (6,168,884) | | (34,086,499) |
| Share transactions | | | | |
| Proceeds from sales of shares | | 77,260,440 | | 318,466,891 |
| Reinvestment of distributions | | 1,847,861 | | 10,192,289 |
| Cost of shares redeemed | | (64,022,911) | | (227,226,081) |
Net increase (decrease) in net assets resulting from share transactions | | 15,085,390 | | 101,433,099 |
| Total increase (decrease) in net assets | | 78,378,004 | | (145,003,395) |
| | | | | |
| Net Assets | | | | |
| Beginning of period | | 438,707,042 | | 583,710,437 |
| End of period | $ | 517,085,046 | $ | 438,707,042 |
| | | | | |
| Other Information | | | | |
| Shares | | | | |
| Sold | | 7,320,533 | | 28,001,783 |
| Issued in reinvestment of distributions | | 177,850 | | 704,861 |
| Redeemed | | (6,104,776) | | (20,788,845) |
| Net increase (decrease) | | 1,393,607 | | 7,917,799 |
| | | | | |
Financial Highlights
| Fidelity® SAI International SMA Completion Fund |
| |
| | Six months ended (Unaudited) April 30, 2023 | | Years ended October 31, 2022 | | 2021 | | 2020 | | 2019 A |
Selected Per-Share Data | | | | | | | | | | |
| Net asset value, beginning of period | $ | 9.61 | $ | 15.46 | $ | 12.38 | $ | 10.47 | $ | 10.00 |
| Income from Investment Operations | | | | | | | | | | |
Net investment income (loss) B,C | | .14 | | .18 | | .19 | | .17 D | | .08 |
| Net realized and unrealized gain (loss) | | 1.38 | | (5.16) | | 3.01 | | 1.77 | | .39 |
| Total from investment operations | | 1.52 | | (4.98) | | 3.20 | | 1.94 | | .47 |
| Distributions from net investment income | | (.14) | | (.16) | | (.12) | | (.03) | | - |
| Distributions from net realized gain | | - | | (.71) | | - | | - | | - |
| Total distributions | | (.14) | | (.87) | | (.12) | | (.03) | | - |
| Net asset value, end of period | $ | 10.99 | $ | 9.61 | $ | 15.46 | $ | 12.38 | $ | 10.47 |
Total Return E,F | | 15.89% | | (34.09)% | | 26.03% | | 18.57% | | 4.70% |
Ratios to Average Net Assets C,G,H | | | | | | | | | | |
Expenses before reductions I | | -% J | | -% | | -% | | -% | | -% J |
Expenses net of fee waivers, if any I | | -% J | | -% | | -% | | -% | | -% J |
Expenses net of all reductions I | | -% J | | -% | | -% | | -% | | -% J |
| Net investment income (loss) | | 2.59% J | | 1.56% | | 1.30% | | 1.45% D | | 1.41% J |
| Supplemental Data | | | | | | | | | | |
| Net assets, end of period (000 omitted) | $ | 517,085 | $ | 438,707 | $ | 583,710 | $ | 318,362 | $ | 46,836 |
Portfolio turnover rate K | | 37% J | | 40% | | 37% | | 17% | | 24% J |
A For the period April 11, 2019 (commencement of operations) through October 31, 2019.
B Calculated based on average shares outstanding during the period.
C Net investment income (loss) is affected by the timing of the declaration of dividends by any underlying mutual funds or exchange-traded funds (ETFs). Net investment income (loss) of any mutual funds or ETFs is not included in the Fund's net investment income (loss) ratio.
D Net investment income per share reflects one or more large, non-recurring dividend(s) which amounted to $.02 per share. Excluding such non-recurring dividend(s), the ratio of net investment income (loss) to average net assets would have been 1.28%.
E Total returns for periods of less than one year are not annualized.
F Total returns would have been lower if certain expenses had not been reduced during the applicable periods shown.
G Fees and expenses of any underlying mutual funds or exchange-traded funds (ETFs) are not included in the Fund's expense ratio. The Fund indirectly bears its proportionate share of these expenses. For additional expense information related to investments in Fidelity Central Funds, please refer to the "Investments in Fidelity Central Funds" note found in the Notes to Financial Statements section of the most recent Annual or Semi-Annual report.
H Expense ratios reflect operating expenses of the class. Expenses before reductions do not reflect amounts reimbursed, waived, or reduced through arrangements with the investment adviser, brokerage services, or other offset arrangements, if applicable, and do not represent the amount paid by the class during periods when reimbursements, waivers or reductions occur.
I Amount represents less than .005%.
J Annualized.
K Amount does not include the portfolio activity of any underlying mutual funds or exchange-traded funds (ETFs).
For the period ended April 30, 2023
1 . Organization.
Fidelity SAI International SMA Completion Fund (the Fund) is a non-diversified fund of Fidelity Investment Trust (the Trust) and is authorized to issue an unlimited number of shares. Shares are offered exclusively to certain clients of Fidelity Management & Research Company LLC (FMR) or its affiliates. The Trust is registered under the Investment Company Act of 1940, as amended (the 1940 Act), as an open-end management investment company organized as a Massachusetts business trust. The Fund's investments in emerging markets can be subject to social, economic, regulatory, and political uncertainties and can be extremely volatile.
2. Investments in Fidelity Central Funds.
Funds may invest in Fidelity Central Funds, which are open-end investment companies generally available only to other investment companies and accounts managed by the investment adviser and its affiliates. The Schedule of Investments lists any Fidelity Central Funds held as an investment as of period end, but does not include the underlying holdings of each Fidelity Central Fund. An investing fund indirectly bears its proportionate share of the expenses of the underlying Fidelity Central Funds.
Based on its investment objective, each Fidelity Central Fund may invest or participate in various investment vehicles or strategies that are similar to those of the investing fund. These strategies are consistent with the investment objectives of the investing fund and may involve certain economic risks which may cause a decline in value of each of the Fidelity Central Funds and thus a decline in the value of the investing fund.
| Fidelity Central Fund | Investment Manager | Investment Objective | Investment Practices | Expense Ratio A |
| Fidelity Money Market Central Funds | Fidelity Management & Research Company LLC (FMR) | Each fund seeks to obtain a high level of current income consistent with the preservation of capital and liquidity. | Short-term Investments | Less than .005% |
A Expenses expressed as a percentage of average net assets and are as of each underlying Central Fund's most recent annual or semi-annual shareholder report.
A complete unaudited list of holdings for each Fidelity Central Fund is available upon request or at the Securities and Exchange Commission website at www.sec.gov. In addition, the financial statements of the Fidelity Central Funds which contain the significant accounting policies (including investment valuation policies) of those funds, and are not covered by the Report of Independent Registered Public Accounting Firm, are available on the Securities and Exchange Commission website or upon request.
3. Significant Accounting Policies.
The Fund is an investment company and applies the accounting and reporting guidance of the Financial Accounting Standards Board (FASB) Accounting Standards Codification Topic 946 Financial Services - Investment Companies . The financial statements have been prepared in conformity with accounting principles generally accepted in the United States of America (GAAP), which require management to make certain estimates and assumptions at the date of the financial statements. Actual results could differ from those estimates. Subsequent events, if any, through the date that the financial statements were issued have been evaluated in the preparation of the financial statements. The Fund's Schedule of Investments lists any underlying mutual funds or exchange-traded funds (ETFs) but does not include the underlying holdings of these funds. The following summarizes the significant accounting policies of the Fund:
Investment Valuation. Investments are valued as of 4:00 p.m. Eastern time on the last calendar day of the period. The Board of Trustees (the Board) has designated the Fund's investment adviser as the valuation designee responsible for the fair valuation function and performing fair value determinations as needed. The investment adviser has established a Fair Value Committee (the Committee) to carry out the day-to-day fair valuation responsibilities and has adopted policies and procedures to govern the fair valuation process and the activities of the Committee. In accordance with these fair valuation policies and procedures, which have been approved by the Board, the Fund attempts to obtain prices from one or more third party pricing services or brokers to value its investments. When current market prices, quotations or currency exchange rates are not readily available or reliable, investments will be fair valued in good faith by the Committee, in accordance with the policies and procedures. Factors used in determining fair value vary by investment type and may include market or investment specific events, transaction data, estimated cash flows, and market observations of comparable investments. The frequency that the fair valuation procedures are used cannot be predicted and they may be utilized to a significant extent. The Committee manages the Fund's fair valuation practices and maintains the fair valuation policies and procedures. The Fund's investment adviser reports to the Board information regarding the fair valuation process and related material matters.
The Fund categorizes the inputs to valuation techniques used to value its investments into a disclosure hierarchy consisting of three levels as shown below:
Level 1 - unadjusted quoted prices in active markets for identical investments
Level 2 - other significant observable inputs (including quoted prices for similar investments, interest rates, prepayment speeds, etc.)
Level 3 - unobservable inputs (including the Fund's own assumptions based on the best information available)
Valuation techniques used to value the Fund's investments by major category are as follows:
Equity securities, including restricted securities, for which market quotations are readily available, are valued at the last reported sale price or official closing price as reported by a third party pricing service on the primary market or exchange on which they are traded and are categorized as Level 1 in the hierarchy. In the event there were no sales during the day or closing prices are not available, securities are valued at the last quoted bid price or may be valued using the last available price and are generally categorized as Level 2 in the hierarchy. For foreign equity securities, when market or security specific events arise, comparisons to the valuation of American Depositary Receipts (ADRs), futures contracts, ETFs and certain indexes as well as quoted prices for similar securities may be used and would be categorized as Level 2 in the hierarchy. For equity securities, including restricted securities, where observable inputs are limited, assumptions about market activity and risk are used and these securities may be categorized as Level 3 in the hierarchy.
Investments in open-end mutual funds, including the Fidelity Central Funds, are valued at their closing net asset value (NAV) each business day and are categorized as Level 1 in the hierarchy.
Changes in valuation techniques may result in transfers in or out of an assigned level within the disclosure hierarchy. The aggregate value of investments by input level as of April 30, 2023 is included at the end of the Fund's Schedule of Investments.
Foreign Currency. Certain Funds may use foreign currency contracts to facilitate transactions in foreign-denominated securities. Gains and losses from these transactions may arise from changes in the value of the foreign currency or if the counterparties do not perform under the contracts' terms.
Foreign-denominated assets, including investment securities, and liabilities are translated into U.S. dollars at the exchange rates at period end. Purchases and sales of investment securities, income and dividends received, and expenses denominated in foreign currencies are translated into U.S. dollars at the exchange rate in effect on the transaction date.
The effects of exchange rate fluctuations on investments are included with the net realized and unrealized gain (loss) on investment securities. Other foreign currency transactions resulting in realized and unrealized gain (loss) are disclosed separately.
Investment Transactions and Income. For financial reporting purposes, the Fund's investment holdings and NAV include trades executed through the end of the last business day of the period. The NAV per share for processing shareholder transactions is calculated as of the close of business of the New York Stock Exchange (NYSE), normally 4:00 p.m. Eastern time and includes trades executed through the end of the prior business day. Gains and losses on securities sold are determined on the basis of identified cost. Commissions paid to certain brokers with whom the investment adviser, or its affiliates, places trades on behalf of a fund include an amount in addition to trade execution, which may be rebated back to a fund. Any such rebates are included in net realized gain (loss) on investments in the Statement of Operations. Dividend income is recorded on the ex-dividend date, except for certain dividends from foreign securities where the ex-dividend date may have passed, which are recorded as soon as the Fund is informed of the ex-dividend date. Non-cash dividends included in dividend income, if any, are recorded at the fair market value of the securities received. Income and capital gain distributions from Fidelity Central Funds, if any, are recorded on the ex-dividend date. Investment income is recorded net of foreign taxes withheld where recovery of such taxes is uncertain. Funds may file withholding tax reclaims in certain jurisdictions to recover a portion of amounts previously withheld. Any withholding tax reclaims income is included in the Statement of Operations in foreign taxes withheld. Any receivables for withholding tax reclaims are included in the Statement of Assets and Liabilities in reclaims receivable.
Expenses. Expenses directly attributable to a fund are charged to that fund. Expenses attributable to more than one fund are allocated among the respective funds on the basis of relative net assets or other appropriate methods. Expenses included in the accompanying financial statements reflect the expenses of that fund and do not include any expenses associated with any underlying mutual funds or exchange-traded funds. Although not included in a fund's expenses, a fund indirectly bears its proportionate share of these expenses through the net asset value of each underlying mutual fund or exchange-traded fund. Expense estimates are accrued in the period to which they relate and adjustments are made when actual amounts are known.
Income Tax Information and Distributions to Shareholders. Each year, the Fund intends to qualify as a regulated investment company under Subchapter M of the Internal Revenue Code, including distributing substantially all of its taxable income and realized gains. As a result, no provision for U.S. Federal income taxes is required. The Fund files a U.S. federal tax return, in addition to state and local tax returns as required. The Fund's federal income tax returns are subject to examination by the Internal Revenue Service (IRS) for a period of three fiscal years after they are filed. State and local tax returns may be subject to examination for an additional fiscal year depending on the jurisdiction. Foreign taxes are provided for based on the Fund's understanding of the tax rules and rates that exist in the foreign markets in which it invests. The Fund is subject to a tax imposed on capital gains by certain countries in which it invests. An estimated deferred tax liability for net unrealized appreciation on the applicable securities is included in Deferred taxes on the Statement of Assets & Liabilities.
Distributions are declared and recorded on the ex-dividend date. Income and capital gain distributions are determined in accordance with income tax regulations, which may differ from GAAP.
Capital accounts within the financial statements are adjusted for permanent book-tax differences. These adjustments have no impact on net assets or the results of operations. Capital accounts are not adjusted for temporary book-tax differences which will reverse in a subsequent period.
Book-tax differences are primarily due to futures contracts, foreign currency transactions, passive foreign investment companies (PFIC), capital loss carryforwards and losses deferred due to wash sales.
As of period end, the cost and unrealized appreciation (depreciation) in securities, and derivatives if applicable, for federal income tax purposes were as follows:
| Gross unrealized appreciation | $61,407,090 |
| Gross unrealized depreciation | (44,310,335) |
| Net unrealized appreciation (depreciation) | $17,096,755 |
| Tax cost | $497,200,569 |
Capital loss carryforwards are only available to offset future capital gains of the Fund to the extent provided by regulations and may be limited. The capital loss carryforward information presented below, including any applicable limitation, is estimated as of prior fiscal period end and is subject to adjustment.
Short-term | $(14,508,749) |
Long-term | (23,763,343) |
| Total capital loss carryforward | $(38,272,092) |
| | |
Restricted Securities (including Private Placements). Funds may invest in securities that are subject to legal or contractual restrictions on resale. These securities generally may be resold in transactions exempt from registration or to the public if the securities are registered. Disposal of these securities may involve time-consuming negotiations and expense, and prompt sale at an acceptable price may be difficult. Information regarding restricted securities held at period end is included at the end of the Schedule of Investments, if applicable.
5. Purchases and Sales of Investments.
Purchases and sales of securities, other than short-term securities and in-kind transactions, as applicable, are noted in the table below.
| | Purchases ($) | Sales ($) |
| Fidelity SAI International SMA Completion Fund | 85,484,786 | 82,873,028 |
6. Fees and Other Transactions with Affiliates.
Management Fee. Fidelity Management & Research Company LLC (the investment adviser) and its affiliates provide the Fund with investment management related services and the Fund does not pay any fees for these services. Under the management contract, the investment adviser or an affiliate pays all other expenses of the Fund, excluding fees and expenses of the independent Trustees, and certain miscellaneous expenses such as proxy and shareholder meeting expenses.
Interfund Trades. Funds may purchase from or sell securities to other Fidelity Funds under procedures adopted by the Board. The procedures have been designed to ensure these interfund trades are executed in accordance with Rule 17a-7 of the 1940 Act. Any interfund trades are included within the respective purchases and sales amounts shown in the Purchases and Sales of Investments note. Interfund trades during the period are noted in the table below.
| | Purchases ($) | Sales ($) | Realized Gain (Loss) ($) |
| Fidelity SAI International SMA Completion Fund | 5,407,937 | 7,806,027 | (1,673,200) |
7. Committed Line of Credit.
Certain Funds participate with other funds managed by the investment adviser or an affiliate in a $4.25 billion credit facility (the "line of credit") to be utilized for temporary or emergency purposes to fund shareholder redemptions or for other short-term liquidity purposes. The commitment fees on the pro-rata portion of the line of credit are borne by the investment adviser. During the period, there were no borrowings on this line of credit.
8. Expense Reductions.
Through arrangements with the Fund's custodian, credits realized as a result of certain uninvested cash balances were used to reduce the Fund's expenses by $108.
9. Other.
A fund's organizational documents provide former and current trustees and officers with a limited indemnification against liabilities arising in connection with the performance of their duties to the fund. In the normal course of business, a fund may also enter into contracts that provide general indemnifications. A fund's maximum exposure under these arrangements is unknown as this would be dependent on future claims that may be made against a fund. The risk of material loss from such claims is considered remote.
10. Risk and Uncertainties.
Many factors affect a fund's performance. Developments that disrupt global economies and financial markets, such as pandemics, epidemics, outbreaks of infectious diseases, war, terrorism, and environmental disasters, may significantly affect a fund's investment performance. The effects of these developments to a fund will be impacted by the types of securities in which a fund invests, the financial condition, industry, economic sector, and geographic location of an issuer, and a fund's level of investment in the securities of that issuer. Significant concentrations in security types, issuers, industries, sectors, and geographic locations may magnify the factors that affect a fund's performance.
As a shareholder, you incur two types of costs: (1) transaction costs, which may include sales charges (loads) on purchase payments or redemption proceeds, as applicable and (2) ongoing costs, which generally include management fees, distribution and/or service (12b-1) fees and other Fund expenses. This Example is intended to help you understand your ongoing costs (in dollars) of investing in a fund and to compare these costs with the ongoing costs of investing in other mutual funds.
| The Example is based on an investment of $1,000 invested at the beginning of the period and held for the entire period (November 1, 2022 to April 30, 2023). |
Actual Expenses
The first line of the accompanying table provides information about actual account values and actual expenses. You may use the information in this line, together with the amount you invested, to estimate the expenses that you paid over the period. Simply divide your account value by $1,000.00 (for example, an $8,600 account value divided by $1,000.00 = 8.6), then multiply the result by the number in the first line for a class/Fund under the heading entitled "Expenses Paid During Period" to estimate the expenses you paid on your account during this period. If any fund is a shareholder of any underlying mutual funds or exchange-traded funds (ETFs) (the Underlying Funds), such fund indirectly bears its proportional share of the expenses of the Underlying Funds in addition to the direct expenses incurred presented in the table. These fees and expenses are not included in the annualized expense ratio used to calculate the expense estimate in the table below.
Hypothetical Example for Comparison Purposes
The second line of the accompanying table provides information about hypothetical account values and hypothetical expenses based on the actual expense ratio and an assumed rate of return of 5% per year before expenses, which is not the actual return. The hypothetical account values and expenses may not be used to estimate the actual ending account balance or expenses you paid for the period. You may use this information to compare the ongoing costs of investing in the Fund and other funds. To do so, compare this 5% hypothetical example with the 5% hypothetical examples that appear in the shareholder reports of the other funds. If any fund is a shareholder of any Underlying Funds, such fund indirectly bears its proportional share of the expenses of the Underlying Funds in addition to the direct expenses as presented in the table. These fees and expenses are not included in the annualized expense ratio used to calculate the expense estimate in the table below.
Please note that the expenses shown in the table are meant to highlight your ongoing costs only and do not reflect any transaction costs. Therefore, the second line of the table is useful in comparing ongoing costs only, and will not help you determine the relative total costs of owning different funds. In addition, if these transactional costs were included, your costs would have been higher.
| | | | | Annualized Expense Ratio- A | | Beginning Account Value November 1, 2022 | | Ending Account Value April 30, 2023 | | Expenses Paid During Period- C November 1, 2022 to April 30, 2023 |
| | | | | | | | | | |
| Fidelity® SAI International SMA Completion Fund | | | | -%- D | | | | | | |
| Actual | | | | | | $ 1,000 | | $ 1,158.90 | | $- E |
Hypothetical- B | | | | | | $ 1,000 | | $ 1,024.79 | | $- E |
| |
A Annualized expense ratio reflects expenses net of applicable fee waivers.
B 5% return per year before expenses
C Expenses are equal to the annualized expense ratio, multiplied by the average account value over the period, multiplied by 181/ 365 (to reflect the one-half year period). The fees and expenses of any Underlying Funds are not included in each annualized expense ratio.
D Amount represents less than .005%.
E Amount represents less than $.005.
The Securities and Exchange Commission adopted Rule 22e-4 under the Investment Company Act of 1940 (the Liquidity Rule) to promote effective liquidity risk management throughout the open-end investment company industry, thereby reducing the risk that funds will be unable to meet their redemption obligations and mitigating dilution of the interests of fund shareholders.
The Fund has adopted and implemented a liquidity risk management program (the Program) reasonably designed to assess and manage the Fund's liquidity risk and to comply with the requirements of the Liquidity Rule. The Fund's Board of Trustees (the Board) has designated the Fund's investment adviser as administrator of the Program. The Fidelity advisers have established a Liquidity Risk Management Committee (the LRM Committee) to manage the Program for each of the Fidelity Funds. The LRM Committee monitors the adequacy and effectiveness of implementation of the Program and on a periodic basis assesses each Fund's liquidity risk based on a variety of factors including (1) the Fund's investment strategy, (2) portfolio liquidity and cash flow projections during normal and reasonably foreseeable stressed conditions, (3) shareholder redemptions, (4) borrowings and other funding sources and (5) certain factors specific to ETFs including the effect of the Fund's prices and spreads, market participants, and basket compositions on the overall liquidity of the Fund's portfolio, as applicable.
In accordance with the Program, each of the Fund's portfolio investments is classified into one of four defined liquidity categories based on a determination of a reasonable expectation for how long it would take to convert the investment to cash (or sell or dispose of the investment) without significantly changing its market value.
- Highly liquid investments - cash or convertible to cash within three business days or less
- Moderately liquid investments - convertible to cash in three to seven calendar days
- Less liquid investments - can be sold or disposed of, but not settled, within seven calendar days
- Illiquid investments - cannot be sold or disposed of within seven calendar days
Liquidity classification determinations take into account a variety of factors including various market, trading and investment-specific considerations, as well as market depth, and generally utilize analysis from a third-party liquidity metrics service.
The Liquidity Rule places a 15% limit on a fund's illiquid investments and requires funds that do not primarily hold assets that are highly liquid investments to determine and maintain a minimum percentage of the fund's net assets to be invested in highly liquid investments (highly liquid investment minimum or HLIM). The Program includes provisions reasonably designed to comply with the 15% limit on illiquid investments and for determining, periodically reviewing and complying with the HLIM requirement as applicable.
At a recent meeting of the Fund's Board of Trustees, the LRM Committee provided a written report to the Board pertaining to the operation, adequacy, and effectiveness of the Program for the period December 1, 2021 through November 30, 2022. The report concluded that the Program is operating effectively and is reasonably designed to assess and manage the Fund's liquidity risk.
1.9893099.104
ISM-SANN-0623
Fidelity® Diversified International K6 Fund
Semi-Annual Report
April 30, 2023
Contents
To view a fund's proxy voting guidelines and proxy voting record for the 12-month period ended June 30, visit http://www.fidelity.com/proxyvotingresults or visit the Securities and Exchange Commission's (SEC) web site at http://www.sec.gov.
You may also call 1-800-835-5092 to request a free copy of the proxy voting guidelines.
Standard & Poor's, S&P and S&P 500 are registered service marks of The McGraw-Hill Companies, Inc. and have been licensed for use by Fidelity Distributors Corporation.
Other third-party marks appearing herein are the property of their respective owners.
All other marks appearing herein are registered or unregistered trademarks or service marks of FMR LLC or an affiliated company. © 2023 FMR LLC. All rights reserved.
This report and the financial statements contained herein are submitted for the general information of the shareholders of the Fund. This report is not authorized for distribution to prospective investors in the Fund unless preceded or accompanied by an effective prospectus.
A fund files its complete schedule of portfolio holdings with the SEC for the first and third quarters of each fiscal year on Form N-PORT. Forms N-PORT are available on the SEC's web site at http://www.sec.gov. A fund's Forms N-PORT may be reviewed and copied at the SEC's Public Reference Room in Washington, DC. Information regarding the operation of the SEC's Public Reference Room may be obtained by calling 1-800-SEC-0330.
For a complete list of a fund's portfolio holdings, view the most recent holdings listing, semiannual report, or annual report on Fidelity's web site at http://www.fidelity.com, http://www.institutional.fidelity.com, or http://www.401k.com, as applicable.
NOT FDIC INSURED •MAY LOSE VALUE •NO BANK GUARANTEE
Neither the Fund nor Fidelity Distributors Corporation is a bank.
Top Holdings (% of Fund's net assets) |
| |
| LVMH Moet Hennessy Louis Vuitton SE (France, Textiles, Apparel & Luxury Goods) | 3.1 | |
| ASML Holding NV (depository receipt) (Netherlands, Semiconductors & Semiconductor Equipment) | 2.7 | |
| Nestle SA (Reg. S) (United States of America, Food Products) | 2.4 | |
| AIA Group Ltd. (Hong Kong, Insurance) | 2.0 | |
| Novo Nordisk A/S Series B (Denmark, Pharmaceuticals) | 2.0 | |
| AstraZeneca PLC (United Kingdom) (United Kingdom, Pharmaceuticals) | 1.7 | |
| Linde PLC (United States of America, Chemicals) | 1.6 | |
| RELX PLC (Euronext N.V.) (United Kingdom, Professional Services) | 1.5 | |
| Hoya Corp. (Japan, Health Care Equipment & Supplies) | 1.5 | |
| Hitachi Ltd. (Japan, Industrial Conglomerates) | 1.4 | |
| | 19.9 | |
| |
| Market Sectors (% of Fund's net assets) |
| |
| Financials | 22.3 | |
| Industrials | 19.9 | |
| Information Technology | 12.9 | |
| Health Care | 11.2 | |
| Consumer Discretionary | 10.0 | |
| Consumer Staples | 6.6 | |
| Materials | 6.3 | |
| Energy | 3.9 | |
| Communication Services | 0.7 | |
| Real Estate | 0.6 | |
| |
Asset Allocation (% of Fund's net assets) |
|
|
Geographic Diversification (% of Fund's net assets) |
|
* Includes Short-Term investments and Net Other Assets (Liabilities). Percentages are adjusted for the effect of derivatives, if applicable. |
| |
Showing Percentage of Net Assets
| Common Stocks - 94.1% |
| | | Shares | Value ($) |
| Australia - 1.5% | | | |
| Aristocrat Leisure Ltd. | | 416,842 | 10,544,216 |
| Flutter Entertainment PLC (a) | | 93,543 | 18,709,700 |
| Glencore PLC | | 6,431,464 | 37,962,574 |
TOTAL AUSTRALIA | | | 67,216,490 |
| Belgium - 0.9% | | | |
| KBC Group NV | | 544,135 | 38,840,945 |
| Canada - 6.3% | | | |
| Alimentation Couche-Tard, Inc. Class A (multi-vtg.) | | 530,800 | 26,492,007 |
| Cameco Corp. | | 367,129 | 10,093,778 |
| Canadian Natural Resources Ltd. | | 949,025 | 57,830,390 |
| Canadian Pacific Kansas City Ltd. (b) | | 293,431 | 23,134,100 |
| Constellation Software, Inc. | | 23,095 | 45,203,368 |
| Franco-Nevada Corp. | | 167,775 | 25,457,567 |
| GFL Environmental, Inc. (b) | | 837,257 | 30,392,429 |
| Imperial Oil Ltd. | | 364,609 | 18,585,008 |
| Lumine Group, Inc. | | 65,474 | 881,943 |
| Thomson Reuters Corp. | | 151,071 | 19,865,527 |
| Tourmaline Oil Corp. | | 365,426 | 16,417,670 |
TOTAL CANADA | | | 274,353,787 |
| China - 1.9% | | | |
| Anta Sports Products Ltd. | | 1,205,164 | 14,975,642 |
| Chervon Holdings Ltd. | | 1,336,744 | 6,802,520 |
| Haier Smart Home Co. Ltd. (A Shares) | | 548,502 | 1,885,965 |
| Kweichow Moutai Co. Ltd. (A Shares) | | 46,851 | 11,954,244 |
| Li Ning Co. Ltd. | | 1,836,085 | 13,130,979 |
| NXP Semiconductors NV | | 181,287 | 29,683,933 |
| Shenzhen Inovance Technology Co. Ltd. (A Shares) | | 197,600 | 1,769,885 |
| Shenzhen Mindray Bio-Medical Electronics Co. Ltd. (A Shares) | | 42,688 | 1,929,913 |
| Sunny Optical Technology Group Co. Ltd. | | 152,275 | 1,609,137 |
TOTAL CHINA | | | 83,742,218 |
| Denmark - 3.6% | | | |
| Carlsberg A/S Series B | | 99,761 | 16,480,585 |
| DSV A/S | | 277,784 | 52,173,046 |
| Novo Nordisk A/S Series B | | 521,475 | 86,749,713 |
TOTAL DENMARK | | | 155,403,344 |
| France - 10.7% | | | |
| Air Liquide SA | | 97,491 | 17,537,679 |
| Airbus Group NV (b) | | 329,541 | 46,147,150 |
| AXA SA | | 915,734 | 29,889,714 |
| BNP Paribas SA | | 814,637 | 52,636,458 |
| Capgemini SA | | 231,162 | 42,002,900 |
| Edenred SA | | 156,667 | 10,171,440 |
| EssilorLuxottica SA | | 225,280 | 44,533,544 |
| Legrand SA | | 238,846 | 22,554,904 |
| LVMH Moet Hennessy Louis Vuitton SE | | 139,189 | 133,883,304 |
| Pernod Ricard SA | | 242,719 | 56,004,463 |
| Sartorius Stedim Biotech | | 23,652 | 6,320,069 |
| Teleperformance | | 17,879 | 3,561,917 |
TOTAL FRANCE | | | 465,243,542 |
| Germany - 5.8% | | | |
| Allianz SE | | 241,443 | 60,627,992 |
| Bayer AG | | 181,178 | 11,957,072 |
| Deutsche Borse AG | | 198,961 | 37,943,583 |
| Deutsche Post AG | | 835,451 | 40,184,857 |
| Hannover Reuck SE | | 123,152 | 26,271,750 |
| Infineon Technologies AG | | 108,964 | 3,968,117 |
| Merck KGaA | | 194,396 | 34,819,015 |
| Muenchener Rueckversicherungs-Gesellschaft AG in Muenchen | | 60,500 | 22,699,415 |
| Siemens Healthineers AG (c) | | 247,333 | 15,376,494 |
TOTAL GERMANY | | | 253,848,295 |
| Greece - 0.1% | | | |
| Piraeus Financial Holdings SA (a) | | 2,022,138 | 4,768,335 |
| Hong Kong - 2.5% | | | |
| AIA Group Ltd. | | 8,144,676 | 88,671,704 |
| Prudential PLC | | 630,021 | 9,639,977 |
| Techtronic Industries Co. Ltd. | | 938,086 | 10,148,673 |
TOTAL HONG KONG | | | 108,460,354 |
| India - 3.4% | | | |
| Axis Bank Ltd. | | 1,195,509 | 12,633,001 |
| Fairfax India Holdings Corp. (a)(c) | | 600,679 | 7,808,827 |
| HDFC Bank Ltd. | | 2,924,094 | 60,520,049 |
| Housing Development Finance Corp. Ltd. | | 1,181,463 | 40,297,110 |
| Reliance Industries Ltd. | | 877,811 | 26,095,997 |
TOTAL INDIA | | | 147,354,984 |
| Indonesia - 1.0% | | | |
| PT Bank Central Asia Tbk | | 36,811,721 | 22,780,990 |
| PT Bank Rakyat Indonesia (Persero) Tbk | | 64,767,442 | 22,570,109 |
TOTAL INDONESIA | | | 45,351,099 |
| Ireland - 0.9% | | | |
| CRH PLC | | 161,695 | 7,802,427 |
| Kingspan Group PLC (Ireland) | | 318,550 | 22,008,342 |
| Ryanair Holdings PLC sponsored ADR (a) | | 109,577 | 10,474,465 |
TOTAL IRELAND | | | 40,285,234 |
| Israel - 0.7% | | | |
| NICE Ltd. sponsored ADR (a) | | 140,578 | 28,679,318 |
| Italy - 1.3% | | | |
| FinecoBank SpA | | 1,527,140 | 23,104,234 |
| Reply SpA | | 33,926 | 3,943,913 |
| UniCredit SpA | | 1,414,682 | 28,032,603 |
TOTAL ITALY | | | 55,080,750 |
| Japan - 15.6% | | | |
| Bandai Namco Holdings, Inc. | | 188,238 | 4,275,905 |
| Daikin Industries Ltd. | | 115,533 | 20,984,382 |
| FUJIFILM Holdings Corp. | | 595,346 | 31,029,417 |
| Fujitsu Ltd. | | 92,064 | 12,270,042 |
| Hitachi Ltd. | | 1,132,561 | 62,647,200 |
| Hoya Corp. | | 630,834 | 66,146,126 |
| Itochu Corp. | | 1,319,661 | 43,779,569 |
| Keyence Corp. | | 111,086 | 50,094,931 |
| Minebea Mitsumi, Inc. | | 1,742,438 | 32,267,581 |
| Misumi Group, Inc. | | 741,820 | 18,714,047 |
| Nomura Research Institute Ltd. | | 466,723 | 11,742,540 |
| Olympus Corp. | | 480,775 | 8,416,648 |
| ORIX Corp. | | 1,521,748 | 25,888,773 |
| Persol Holdings Co. Ltd. | | 996,068 | 20,538,340 |
| Relo Group, Inc. | | 761,752 | 11,842,492 |
| Renesas Electronics Corp. (a) | | 321,706 | 4,192,617 |
| Seven & i Holdings Co. Ltd. | | 485,933 | 22,021,245 |
| Shin-Etsu Chemical Co. Ltd. | | 1,987,585 | 56,717,371 |
| SMC Corp. | | 74,082 | 36,948,014 |
| Sony Group Corp. | | 611,330 | 55,309,316 |
| Sumitomo Mitsui Financial Group, Inc. | | 680,190 | 27,801,840 |
| Suzuki Motor Corp. | | 282,292 | 9,843,092 |
| TIS, Inc. | | 631,539 | 17,341,887 |
| Tokyo Electron Ltd. | | 269,070 | 30,809,997 |
TOTAL JAPAN | | | 681,623,372 |
| Korea (South) - 0.8% | | | |
| Samsung Electronics Co. Ltd. | | 708,509 | 34,875,355 |
| Luxembourg - 0.5% | | | |
| Eurofins Scientific SA | | 308,399 | 21,497,320 |
| Netherlands - 5.6% | | | |
| Adyen BV (a)(c) | | 8,821 | 14,174,039 |
| Argenx SE (a) | | 39,214 | 15,126,730 |
| ASML Holding NV (depository receipt) (b) | | 184,075 | 117,230,005 |
| BE Semiconductor Industries NV | | 75,868 | 6,799,939 |
| IMCD NV | | 219,450 | 32,934,788 |
| Wolters Kluwer NV | | 444,916 | 58,903,891 |
TOTAL NETHERLANDS | | | 245,169,392 |
| Singapore - 0.1% | | | |
| Sea Ltd. ADR (a) | | 50,004 | 3,808,805 |
| Spain - 1.9% | | | |
| Amadeus IT Holding SA Class A (a) | | 155,220 | 10,909,642 |
| Banco Santander SA (Spain) (b) | | 5,038,383 | 17,690,792 |
| CaixaBank SA | | 6,178,956 | 22,872,065 |
| Industria de Diseno Textil SA (b) | | 939,826 | 32,269,117 |
TOTAL SPAIN | | | 83,741,616 |
| Sweden - 2.0% | | | |
| Indutrade AB | | 1,608,931 | 38,548,261 |
| Investor AB (B Shares) | | 2,046,188 | 43,856,648 |
| Kry International AB (a)(d)(e) | | 663 | 51,826 |
| Nibe Industrier AB (B Shares) | | 275,620 | 3,077,361 |
TOTAL SWEDEN | | | 85,534,096 |
| Switzerland - 1.7% | | | |
| Compagnie Financiere Richemont SA Series A | | 110,580 | 18,278,970 |
| Julius Baer Group Ltd. | | 87,275 | 6,221,584 |
| Sika AG | | 120,787 | 33,364,150 |
| Zurich Insurance Group Ltd. | | 35,934 | 17,358,954 |
TOTAL SWITZERLAND | | | 75,223,658 |
| Taiwan - 1.1% | | | |
| ECLAT Textile Co. Ltd. | | 293,000 | 4,662,774 |
| Taiwan Semiconductor Manufacturing Co. Ltd. sponsored ADR | | 531,882 | 44,837,653 |
TOTAL TAIWAN | | | 49,500,427 |
| United Kingdom - 12.2% | | | |
| AstraZeneca PLC (United Kingdom) | | 506,824 | 74,585,733 |
| B&M European Value Retail SA | | 5,368,397 | 32,364,078 |
| BAE Systems PLC | | 4,448,185 | 56,669,805 |
| Beazley PLC | | 1,741,093 | 13,030,246 |
| Big Yellow Group PLC | | 736,587 | 11,330,638 |
| Compass Group PLC | | 1,186,394 | 31,298,213 |
| Diageo PLC | | 1,021,123 | 46,579,658 |
| Entain PLC | | 606,997 | 11,015,460 |
| Games Workshop Group PLC | | 54,792 | 6,830,897 |
| Hiscox Ltd. | | 1,737,971 | 25,817,186 |
| JD Sports Fashion PLC | | 7,550,541 | 15,282,264 |
| Lloyds Banking Group PLC | | 17,611,787 | 10,699,545 |
| NatWest Group PLC | | 3,054,961 | 10,063,345 |
| RELX PLC: | | | |
| (Euronext N.V.) | | 2,036,979 | 67,605,760 |
| rights (a)(f) | | 2,036,979 | 984,975 |
| Rentokil Initial PLC | | 4,912,010 | 39,105,762 |
| S4 Capital PLC (a) | | 1,840,680 | 3,382,007 |
| Smith & Nephew PLC | | 1,669,503 | 27,496,322 |
| Standard Chartered PLC (United Kingdom) | | 1,957,852 | 15,461,974 |
| Starling Bank Ltd. Series D (a)(d)(e) | | 2,406,800 | 9,134,733 |
| WPP PLC | | 2,002,673 | 23,339,990 |
TOTAL UNITED KINGDOM | | | 532,078,591 |
| United States of America - 11.5% | | | |
| Aon PLC | | 67,102 | 21,820,228 |
| Booking Holdings, Inc. (a) | | 1,669 | 4,483,451 |
| Experian PLC | | 561,190 | 19,868,866 |
| Ferguson PLC | | 272,129 | 38,286,690 |
| ICON PLC (a) | | 100,730 | 19,409,664 |
| IQVIA Holdings, Inc. (a) | | 92,167 | 17,348,594 |
| Linde PLC | | 189,887 | 70,153,752 |
| Marsh & McLennan Companies, Inc. | | 208,784 | 37,620,789 |
| Marvell Technology, Inc. | | 536,171 | 21,168,031 |
| MasterCard, Inc. Class A | | 71,842 | 27,302,115 |
| Nestle SA (Reg. S) | | 803,387 | 103,066,176 |
| Roche Holding AG (participation certificate) | | 146,468 | 45,865,020 |
| S&P Global, Inc. | | 93,493 | 33,898,692 |
| Schlumberger Ltd. | | 856,423 | 42,264,475 |
TOTAL UNITED STATES OF AMERICA | | | 502,556,543 |
| Zambia - 0.5% | | | |
| First Quantum Minerals Ltd. | | 960,877 | 23,347,286 |
| TOTAL COMMON STOCKS (Cost $3,269,304,105) | | | 4,107,585,156 |
| | | | |
| Preferred Stocks - 0.3% |
| | | Shares | Value ($) |
| Convertible Preferred Stocks - 0.3% | | | |
| Estonia - 0.1% | | | |
| Bolt Technology OU Series E (a)(d)(e) | | 21,668 | 2,824,050 |
| United States of America - 0.2% | | | |
| Wasabi Holdings, Inc.: | | | |
| Series C (a)(d)(e) | | 743,562 | 7,145,631 |
| Series D (d)(e) | | 304,085 | 4,278,476 |
| | | | 11,424,107 |
TOTAL CONVERTIBLE PREFERRED STOCKS | | | 14,248,157 |
| Nonconvertible Preferred Stocks - 0.0% | | | |
| Sweden - 0.0% | | | |
| Kry International AB Series E (a)(d)(e) | | 3,828 | 299,230 |
| TOTAL PREFERRED STOCKS (Cost $19,777,817) | | | 14,547,387 |
| | | | |
| Money Market Funds - 8.9% |
| | | Shares | Value ($) |
| Fidelity Cash Central Fund 4.88% (g) | | 206,929,732 | 206,971,118 |
| Fidelity Securities Lending Cash Central Fund 4.88% (g)(h) | | 179,019,353 | 179,037,255 |
| TOTAL MONEY MARKET FUNDS (Cost $386,007,751) | | | 386,008,373 |
| | | | |
| TOTAL INVESTMENT IN SECURITIES - 103.3% (Cost $3,675,089,673) | 4,508,140,916 |
NET OTHER ASSETS (LIABILITIES) - (3.3)% | (143,944,291) |
| NET ASSETS - 100.0% | 4,364,196,625 |
| | |
Legend
| (b) | Security or a portion of the security is on loan at period end. |
| (c) | Security exempt from registration under Rule 144A of the Securities Act of 1933. These securities may be resold in transactions exempt from registration, normally to qualified institutional buyers. At the end of the period, the value of these securities amounted to $37,359,360 or 0.9% of net assets. |
| (d) | Restricted securities (including private placements) - Investment in securities not registered under the Securities Act of 1933 (excluding 144A issues). At the end of the period, the value of restricted securities (excluding 144A issues) amounted to $23,733,946 or 0.5% of net assets. |
| (f) | Security or a portion of the security purchased on a delayed delivery or when-issued basis. |
| (g) | Affiliated fund that is generally available only to investment companies and other accounts managed by Fidelity Investments. The rate quoted is the annualized seven-day yield of the fund at period end. A complete unaudited listing of the fund's holdings as of its most recent quarter end is available upon request. In addition, each Fidelity Central Fund's financial statements are available on the SEC's website or upon request. |
| (h) | Investment made with cash collateral received from securities on loan. |
| Additional information on each restricted holding is as follows: |
| Security | Acquisition Date | Acquisition Cost ($) |
| Bolt Technology OU Series E | 1/03/22 | 5,629,271 |
| | | |
| Kry International AB | 5/14/21 | 287,945 |
| | | |
| Kry International AB Series E | 5/14/21 | 1,750,058 |
| | | |
| Starling Bank Ltd. Series D | 6/18/21 - 4/05/22 | 4,642,638 |
| | | |
| Wasabi Holdings, Inc. Series C | 3/31/21 | 8,078,504 |
| | | |
| Wasabi Holdings, Inc. Series D | 9/09/22 | 4,319,984 |
| | | |
Affiliated Central Funds
Fiscal year to date information regarding the Fund's investments in Fidelity Central Funds, including the ownership percentage, is presented below.
| Affiliate | Value, beginning of period ($) | Purchases ($) | Sales Proceeds ($) | Dividend Income ($) | Realized Gain (loss) ($) | Change in Unrealized appreciation (depreciation) ($) | Value, end of period ($) | % ownership, end of period |
| Fidelity Cash Central Fund 4.88% | 165,418,854 | 281,890,502 | 240,338,237 | 4,000,777 | - | (1) | 206,971,118 | 0.5% |
| Fidelity Securities Lending Cash Central Fund 4.88% | 39,190,867 | 614,436,806 | 474,590,418 | 146,164 | - | - | 179,037,255 | 0.5% |
| Total | 204,609,721 | 896,327,308 | 714,928,655 | 4,146,941 | - | (1) | 386,008,373 | |
| | | | | | | | | |
Amounts in the dividend income column in the above table include any capital gain distributions from underlying funds, which are presented in the corresponding line item in the Statement of Operations, if applicable.
Amounts in the dividend income column for Fidelity Securities Lending Cash Central Fund represents the income earned on investing cash collateral, less rebates paid to borrowers and any lending agent fees associated with the loan, plus any premium payments received for lending certain types of securities.
Amounts included in the purchases and sales proceeds columns may include in-kind transactions, if applicable.
Investment Valuation
The following is a summary of the inputs used, as of April 30, 2023, involving the Fund's assets and liabilities carried at fair value. The inputs or methodology used for valuing securities may not be an indication of the risk associated with investing in those securities. For more information on valuation inputs, and their aggregation into the levels used below, please refer to the Investment Valuation section in the accompanying Notes to Financial Statements.
| Valuation Inputs at Reporting Date: |
| Description | Total ($) | Level 1 ($) | Level 2 ($) | Level 3 ($) |
Investments in Securities: | | | | |
|
| Equities: | | | | |
Communication Services | 30,530,802 | 7,190,812 | 23,339,990 | - |
Consumer Discretionary | 436,755,505 | 120,954,967 | 315,800,538 | - |
Consumer Staples | 282,598,378 | 98,977,055 | 183,621,323 | - |
Energy | 171,287,318 | 145,191,321 | 26,095,997 | - |
Financials | 980,621,784 | 393,744,154 | 577,742,897 | 9,134,733 |
Health Care | 497,577,977 | 159,304,700 | 338,273,277 | - |
Industrials | 874,280,587 | 423,521,481 | 450,759,106 | - |
Information Technology | 552,964,256 | 340,431,003 | 197,934,040 | 14,599,213 |
Materials | 272,342,806 | 118,958,605 | 153,384,201 | - |
Real Estate | 23,173,130 | 11,330,638 | 11,842,492 | - |
|
| Money Market Funds | 386,008,373 | 386,008,373 | - | - |
| Total Investments in Securities: | 4,508,140,916 | 2,205,613,109 | 2,278,793,861 | 23,733,946 |
| Statement of Assets and Liabilities |
| | | | April 30, 2023 (Unaudited) |
| | | | | |
| Assets | | | | |
| Investment in securities, at value (including securities loaned of $173,198,996) - See accompanying schedule: | | | | |
Unaffiliated issuers (cost $3,289,081,922) | $ | 4,122,132,543 | | |
Fidelity Central Funds (cost $386,007,751) | | 386,008,373 | | |
| | | | | |
| | | | | |
| Total Investment in Securities (cost $3,675,089,673) | | | $ | 4,508,140,916 |
| Foreign currency held at value (cost $4,561,114) | | | | 4,561,158 |
| Receivable for investments sold | | | | 38,602,311 |
| Receivable for fund shares sold | | | | 3,219,208 |
| Dividends receivable | | | | 11,453,134 |
| Reclaims receivable | | | | 10,771,532 |
| Distributions receivable from Fidelity Central Funds | | | | 807,260 |
| Other receivables | | | | 37,611 |
Total assets | | | | 4,577,593,130 |
| Liabilities | | | | |
| Payable for investments purchased | | | | |
Regular delivery | $ | 26,000,495 | | |
Delayed delivery | | 984,977 | | |
| Payable for fund shares redeemed | | 1,748,519 | | |
| Accrued management fee | | 2,164,987 | | |
| Other payables and accrued expenses | | 3,460,272 | | |
| Collateral on securities loaned | | 179,037,255 | | |
| Total Liabilities | | | | 213,396,505 |
| Net Assets | | | $ | 4,364,196,625 |
| Net Assets consist of: | | | | |
| Paid in capital | | | $ | 3,819,769,378 |
| Total accumulated earnings (loss) | | | | 544,427,247 |
| Net Assets | | | $ | 4,364,196,625 |
Net Asset Value , offering price and redemption price per share ($4,364,196,625 ÷ 335,727,126 shares) | | | $ | 13.00 |
| Statement of Operations |
| | | | Six months ended April 30, 2023 (Unaudited) |
| Investment Income | | | | |
| Dividends | | | $ | 40,549,333 |
| Income from Fidelity Central Funds (including $146,164 from security lending) | | | | 4,146,941 |
| Income before foreign taxes withheld | | | $ | 44,696,274 |
| Less foreign taxes withheld | | | | (4,474,420) |
| Total Income | | | | 40,221,854 |
| Expenses | | | | |
| Management fee | $ | 12,150,553 | | |
| Independent trustees' fees and expenses | | 12,234 | | |
| Total expenses before reductions | | 12,162,787 | | |
| Expense reductions | | (259) | | |
| Total expenses after reductions | | | | 12,162,528 |
| Net Investment income (loss) | | | | 28,059,326 |
| Realized and Unrealized Gain (Loss) | | | | |
| Net realized gain (loss) on: | | | | |
| Investment Securities: | | | | |
| Unaffiliated issuers (net of foreign taxes of $527,612) | | (27,695,921) | | |
| Foreign currency transactions | | 85,191 | | |
| Total net realized gain (loss) | | | | (27,610,730) |
| Change in net unrealized appreciation (depreciation) on: | | | | |
| Investment Securities: | | | | |
| Unaffiliated issuers(net of increase in deferred foreign taxes of $396,102) | | 723,718,747 | | |
| Fidelity Central Funds | | (1) | | |
| Assets and liabilities in foreign currencies | | 978,504 | | |
| Total change in net unrealized appreciation (depreciation) | | | | 724,697,250 |
| Net gain (loss) | | | | 697,086,520 |
| Net increase (decrease) in net assets resulting from operations | | | $ | 725,145,846 |
| Statement of Changes in Net Assets |
| |
| | Six months ended April 30, 2023 (Unaudited) | | Year ended October 31, 2022 |
| Increase (Decrease) in Net Assets | | | | |
| Operations | | | | |
| Net investment income (loss) | $ | 28,059,326 | $ | 46,223,928 |
| Net realized gain (loss) | | (27,610,730) | | (175,880,317) |
| Change in net unrealized appreciation (depreciation) | | 724,697,250 | | (1,165,207,771) |
| Net increase (decrease) in net assets resulting from operations | | 725,145,846 | | (1,294,864,160) |
| Distributions to shareholders | | (31,800,731) | | (40,087,762) |
| Share transactions | | | | |
| Proceeds from sales of shares | | 515,021,512 | | 1,845,177,962 |
| Reinvestment of distributions | | 31,800,731 | | 40,087,762 |
| Cost of shares redeemed | | (359,387,981) | | (1,028,832,082) |
Net increase (decrease) in net assets resulting from share transactions | | 187,434,262 | | 856,433,642 |
| Total increase (decrease) in net assets | | 880,779,377 | | (478,518,280) |
| | | | | |
| Net Assets | | | | |
| Beginning of period | | 3,483,417,248 | | 3,961,935,528 |
| End of period | $ | 4,364,196,625 | $ | 3,483,417,248 |
| | | | | |
| Other Information | | | | |
| Shares | | | | |
| Sold | | 42,558,601 | | 141,560,986 |
| Issued in reinvestment of distributions | | 2,652,271 | | 2,683,250 |
| Redeemed | | (29,434,085) | | (80,800,526) |
| Net increase (decrease) | | 15,776,787 | | 63,443,710 |
| | | | | |
Financial Highlights
| Fidelity® Diversified International K6 Fund |
| |
| | Six months ended (Unaudited) April 30, 2023 | | Years ended October 31, 2022 | | 2021 | | 2020 | | 2019 | | 2018 |
Selected Per-Share Data | | | | | | | | | | | | |
| Net asset value, beginning of period | $ | 10.89 | $ | 15.45 | $ | 11.96 | $ | 11.08 | $ | 9.69 | $ | 10.65 |
| Income from Investment Operations | | | | | | | | | | | | |
Net investment income (loss) A,B | | .09 | | .15 | | .10 | | .08 | | .16 | | .18 |
| Net realized and unrealized gain (loss) | | 2.12 | | (4.56) | | 3.47 | | .98 | | 1.36 | | (1.12) |
| Total from investment operations | | 2.21 | | (4.41) | | 3.57 | | 1.06 | | 1.52 | | (.94) |
| Distributions from net investment income | | (.10) | | (.15) | | (.08) | | (.15) | | (.13) | | (.02) |
| Distributions from net realized gain | | - | | - | | - | | (.03) | | - | | (.01) |
| Total distributions | | (.10) | | (.15) | | (.08) | | (.18) | | (.13) | | (.02) C |
| Net asset value, end of period | $ | 13.00 | $ | 10.89 | $ | 15.45 | $ | 11.96 | $ | 11.08 | $ | 9.69 |
Total Return D,E | | 20.36% | | (28.81)% | | 30.00% | | 9.70% | | 15.89% | | (8.83)% |
Ratios to Average Net Assets B,F,G | | | | | | | | | | | | |
| Expenses before reductions | | .60% H | | .60% | | .60% | | .60% | | .60% | | .60% |
| Expenses net of fee waivers, if any | | .60% H | | .60% | | .60% | | .60% | | .60% | | .60% |
| Expenses net of all reductions | | .60% H | | .60% | | .60% | | .59% | | .59% | | .58% |
| Net investment income (loss) | | 1.39% H | | 1.21% | | .73% | | .73% | | 1.59% | | 1.67% |
| Supplemental Data | | | | | | | | | | | | |
| Net assets, end of period (000 omitted) | $ | 4,364,197 | $ | 3,483,417 | $ | 3,961,936 | $ | 3,102,294 | $ | 2,977,388 | $ | 2,207,355 |
Portfolio turnover rate I | | 28% H,J | | 31% J | | 30% J | | 34% | | 48% J | | 48% J |
A Calculated based on average shares outstanding during the period.
B Net investment income (loss) is affected by the timing of the declaration of dividends by any underlying mutual funds or exchange-traded funds (ETFs). Net investment income (loss) of any mutual funds or ETFs is not included in the Fund's net investment income (loss) ratio.
C Total distributions per share do not sum due to rounding.
D Total returns for periods of less than one year are not annualized.
E Total returns would have been lower if certain expenses had not been reduced during the applicable periods shown.
F Fees and expenses of any underlying mutual funds or exchange-traded funds (ETFs) are not included in the Fund's expense ratio. The Fund indirectly bears its proportionate share of these expenses. For additional expense information related to investments in Fidelity Central Funds, please refer to the "Investments in Fidelity Central Funds" note found in the Notes to Financial Statements section of the most recent Annual or Semi-Annual report.
G Expense ratios reflect operating expenses of the class. Expenses before reductions do not reflect amounts reimbursed, waived, or reduced through arrangements with the investment adviser, brokerage services, or other offset arrangements, if applicable, and do not represent the amount paid by the class during periods when reimbursements, waivers or reductions occur.
H Annualized.
I Amount does not include the portfolio activity of any underlying mutual funds or exchange-traded funds (ETFs).
J Portfolio turnover rate excludes securities received or delivered in-kind.
For the period ended April 30, 2023
1. Organization.
Fidelity Diversified International K6 Fund (the Fund) is a fund of Fidelity Investment Trust (the Trust) and is authorized to issue an unlimited number of shares. Share transactions on the Statement of Changes in Net Assets may contain exchanges between affiliated funds. The Trust is registered under the Investment Company Act of 1940, as amended (the 1940 Act), as an open-end management investment company organized as a Massachusetts business trust. Shares generally are available only to employer-sponsored retirement plans that are recordkept by Fidelity, or to certain employer-sponsored retirement plans that are not recordkept by Fidelity. The Fund's investments in emerging markets can be subject to social, economic, regulatory, and political uncertainties and can be extremely volatile.
2. Investments in Fidelity Central Funds.
Funds may invest in Fidelity Central Funds, which are open-end investment companies generally available only to other investment companies and accounts managed by the investment adviser and its affiliates. The Schedule of Investments lists any Fidelity Central Funds held as an investment as of period end, but does not include the underlying holdings of each Fidelity Central Fund. An investing fund indirectly bears its proportionate share of the expenses of the underlying Fidelity Central Funds.
Based on its investment objective, each Fidelity Central Fund may invest or participate in various investment vehicles or strategies that are similar to those of the investing fund. These strategies are consistent with the investment objectives of the investing fund and may involve certain economic risks which may cause a decline in value of each of the Fidelity Central Funds and thus a decline in the value of the investing fund.
| Fidelity Central Fund | Investment Manager | Investment Objective | Investment Practices | Expense Ratio A |
| Fidelity Money Market Central Funds | Fidelity Management & Research Company LLC (FMR) | Each fund seeks to obtain a high level of current income consistent with the preservation of capital and liquidity. | Short-term Investments | Less than .005% |
A Expenses expressed as a percentage of average net assets and are as of each underlying Central Fund's most recent annual or semi-annual shareholder report.
A complete unaudited list of holdings for each Fidelity Central Fund is available upon request or at the Securities and Exchange Commission website at www.sec.gov. In addition, the financial statements of the Fidelity Central Funds which contain the significant accounting policies (including investment valuation policies) of those funds, and are not covered by the Report of Independent Registered Public Accounting Firm, are available on the Securities and Exchange Commission website or upon request.
3. Significant Accounting Policies.
The Fund is an investment company and applies the accounting and reporting guidance of the Financial Accounting Standards Board (FASB) Accounting Standards Codification Topic 946 Financial Services - Investment Companies . The financial statements have been prepared in conformity with accounting principles generally accepted in the United States of America (GAAP), which require management to make certain estimates and assumptions at the date of the financial statements. Actual results could differ from those estimates. Subsequent events, if any, through the date that the financial statements were issued have been evaluated in the preparation of the financial statements. The Fund's Schedule of Investments lists any underlying mutual funds or exchange-traded funds (ETFs) but does not include the underlying holdings of these funds. The following summarizes the significant accounting policies of the Fund:
Investment Valuation. Investments are valued as of 4:00 p.m. Eastern time on the last calendar day of the period. The Board of Trustees (the Board) has designated the Fund's investment adviser as the valuation designee responsible for the fair valuation function and performing fair value determinations as needed. The investment adviser has established a Fair Value Committee (the Committee) to carry out the day-to-day fair valuation responsibilities and has adopted policies and procedures to govern the fair valuation process and the activities of the Committee. In accordance with these fair valuation policies and procedures, which have been approved by the Board, the Fund attempts to obtain prices from one or more third party pricing services or brokers to value its investments. When current market prices, quotations or currency exchange rates are not readily available or reliable, investments will be fair valued in good faith by the Committee, in accordance with the policies and procedures. Factors used in determining fair value vary by investment type and may include market or investment specific events, transaction data, estimated cash flows, and market observations of comparable investments. The frequency that the fair valuation procedures are used cannot be predicted and they may be utilized to a significant extent. The Committee manages the Fund's fair valuation practices and maintains the fair valuation policies and procedures. The Fund's investment adviser reports to the Board information regarding the fair valuation process and related material matters.
The Fund categorizes the inputs to valuation techniques used to value its investments into a disclosure hierarchy consisting of three levels as shown below:
Level 1 - unadjusted quoted prices in active markets for identical investments
Level 2 - other significant observable inputs (including quoted prices for similar investments, interest rates, prepayment speeds, etc.)
Level 3 - unobservable inputs (including the Fund's own assumptions based on the best information available)
Valuation techniques used to value the Fund's investments by major category are as follows:
Equity securities, including restricted securities, for which market quotations are readily available, are valued at the last reported sale price or official closing price as reported by a third party pricing service on the primary market or exchange on which they are traded and are categorized as Level 1 in the hierarchy. In the event there were no sales during the day or closing prices are not available, securities are valued at the last quoted bid price or may be valued using the last available price and are generally categorized as Level 2 in the hierarchy. For foreign equity securities, when market or security specific events arise, comparisons to the valuation of American Depositary Receipts (ADRs), futures contracts, ETFs and certain indexes as well as quoted prices for similar securities may be used and would be categorized as Level 2 in the hierarchy. For equity securities, including restricted securities, where observable inputs are limited, assumptions about market activity and risk are used and these securities may be categorized as Level 3 in the hierarchy.
Investments in open-end mutual funds, including the Fidelity Central Funds, are valued at their closing net asset value (NAV) each business day and are categorized as Level 1 in the hierarchy.
Changes in valuation techniques may result in transfers in or out of an assigned level within the disclosure hierarchy. The aggregate value of investments by input level as of April 30, 2023 is included at the end of the Fund's Schedule of Investments.
Foreign Currency. Certain Funds may use foreign currency contracts to facilitate transactions in foreign-denominated securities. Gains and losses from these transactions may arise from changes in the value of the foreign currency or if the counterparties do not perform under the contracts' terms.
Foreign-denominated assets, including investment securities, and liabilities are translated into U.S. dollars at the exchange rates at period end. Purchases and sales of investment securities, income and dividends received, and expenses denominated in foreign currencies are translated into U.S. dollars at the exchange rate in effect on the transaction date.
The effects of exchange rate fluctuations on investments are included with the net realized and unrealized gain (loss) on investment securities. Other foreign currency transactions resulting in realized and unrealized gain (loss) are disclosed separately.
Investment Transactions and Income. For financial reporting purposes, the Fund's investment holdings and NAV include trades executed through the end of the last business day of the period. The NAV per share for processing shareholder transactions is calculated as of the close of business of the New York Stock Exchange (NYSE), normally 4:00 p.m. Eastern time and includes trades executed through the end of the prior business day. Gains and losses on securities sold are determined on the basis of identified cost and include proceeds received from litigation. Commissions paid to certain brokers with whom the investment adviser, or its affiliates, places trades on behalf of a fund include an amount in addition to trade execution, which may be rebated back to a fund. Any such rebates are included in net realized gain (loss) on investments in the Statement of Operations. Dividend income is recorded on the ex-dividend date, except for certain dividends from foreign securities where the ex-dividend date may have passed, which are recorded as soon as the Fund is informed of the ex-dividend date. Non-cash dividends included in dividend income, if any, are recorded at the fair market value of the securities received. Income and capital gain distributions from Fidelity Central Funds, if any, are recorded on the ex-dividend date. Investment income is recorded net of foreign taxes withheld where recovery of such taxes is uncertain. Funds may file withholding tax reclaims in certain jurisdictions to recover a portion of amounts previously withheld. Any withholding tax reclaims income is included in the Statement of Operations in foreign taxes withheld. Any receivables for withholding tax reclaims are included in the Statement of Assets and Liabilities in reclaims receivable.
Expenses. Expenses directly attributable to a fund are charged to that fund. Expenses attributable to more than one fund are allocated among the respective funds on the basis of relative net assets or other appropriate methods. Expenses included in the accompanying financial statements reflect the expenses of that fund and do not include any expenses associated with any underlying mutual funds or exchange-traded funds. Although not included in a fund's expenses, a fund indirectly bears its proportionate share of these expenses through the net asset value of each underlying mutual fund or exchange-traded fund. Expense estimates are accrued in the period to which they relate and adjustments are made when actual amounts are known.
Income Tax Information and Distributions to Shareholders. Each year, the Fund intends to qualify as a regulated investment company under Subchapter M of the Internal Revenue Code, including distributing substantially all of its taxable income and realized gains. As a result, no provision for U.S. Federal income taxes is required. The Fund files a U.S. federal tax return, in addition to state and local tax returns as required. The Fund's federal income tax returns are subject to examination by the Internal Revenue Service (IRS) for a period of three fiscal years after they are filed. State and local tax returns may be subject to examination for an additional fiscal year depending on the jurisdiction. Foreign taxes are provided for based on the Fund's understanding of the tax rules and rates that exist in the foreign markets in which it invests. The Fund is subject to a tax imposed on capital gains by certain countries in which it invests. An estimated deferred tax liability for net unrealized appreciation on the applicable securities is included in Other payables and accrued expenses on the Statement of Assets & Liabilities.
Distributions are declared and recorded on the ex-dividend date. Income and capital gain distributions are determined in accordance with income tax regulations, which may differ from GAAP.
Capital accounts within the financial statements are adjusted for permanent book-tax differences. These adjustments have no impact on net assets or the results of operations. Capital accounts are not adjusted for temporary book-tax differences which will reverse in a subsequent period.
Book-tax differences are primarily due to foreign currency transactions, certain foreign taxes, passive foreign investment companies (PFIC), redemptions in-kind, capital loss carryforwards, and losses deferred due to wash sales.
As of period end, the cost and unrealized appreciation (depreciation) in securities, and derivatives if applicable, for federal income tax purposes were as follows:
| Gross unrealized appreciation | $932,612,298 |
| Gross unrealized depreciation | (103,024,100) |
| Net unrealized appreciation (depreciation) | $829,588,198 |
| Tax cost | $3,678,552,718 |
Capital loss carryforwards are only available to offset future capital gains of the Fund to the extent provided by regulations and may be limited. The capital loss carryforward information presented below, including any applicable limitation, is estimated as of prior fiscal period end and is subject to adjustment.
Short-term | $(264,515,026) |
Long-term | (12,124,417) |
| Total capital loss carryforward | $(276,639,443) |
Delayed Delivery Transactions and When-Issued Securities. During the period, certain Funds transacted in securities on a delayed delivery or when-issued basis. Payment and delivery may take place after the customary settlement period for that security. The price of the underlying securities and the date when the securities will be delivered and paid for are fixed at the time the transaction is negotiated. Securities purchased on a delayed delivery or when-issued basis are identified as such in the Schedule of Investments. Compensation for interest forgone in the purchase of a delayed delivery or when-issued debt security may be received. With respect to purchase commitments, each applicable Fund identifies securities as segregated in its records with a value at least equal to the amount of the commitment. Payables and receivables associated with the purchases and sales of delayed delivery securities having the same coupon, settlement date and broker are offset. Delayed delivery or when-issued securities that have been purchased from and sold to different brokers are reflected as both payables and receivables in the Statement of Assets and Liabilities under the caption "Delayed delivery", as applicable. Losses may arise due to changes in the value of the underlying securities or if the counterparty does not perform under the contract's terms, or if the issuer does not issue the securities due to political, economic, or other factors.
Restricted Securities (including Private Placements). Funds may invest in securities that are subject to legal or contractual restrictions on resale. These securities generally may be resold in transactions exempt from registration or to the public if the securities are registered. Disposal of these securities may involve time-consuming negotiations and expense, and prompt sale at an acceptable price may be difficult. Information regarding restricted securities held at period end is included at the end of the Schedule of Investments, if applicable.
4. Purchases and Sales of Investments.
Purchases and sales of securities, other than short-term securities and in-kind transactions, as applicable, are noted in the table below.
| | Purchases ($) | Sales ($) |
| Fidelity Diversified International K6 Fund | 535,447,334 | 582,674,817 |
Unaffiliated Exchanges In-Kind. Shares that were exchanged for investments, including accrued interest and cash, if any, are shown in the table below. The amount of in-kind exchanges is included in share transactions in the accompanying Statement of Changes in Net Assets.
| | Shares | Total Proceeds ($) |
| Fidelity Diversified International K6 Fund | 13,582,263 | 161,449,478 |
Prior Fiscal Year Unaffiliated Redemptions In-Kind. Shares that were redeemed in-kind for investments, including accrued interest and cash, if any, are shown in the table below; along with realized gain or loss on investments delivered through in-kind redemptions. The amount of the in-kind redemptions is included in share transactions in the accompanying Statement of Changes in Net Assets. There was no gain or loss for federal income tax purposes.
| | Shares | Total net realized gain or loss ($) | Total Proceeds ($) |
| Fidelity Diversified International K6 Fund | 4,786,586 | 30,753,342 | 72,038,115 |
Prior Year Unaffiliated Exchanges In-Kind. Shares that were exchanged for investments, including accrued interest and cash, if any, are shown in the table below. The amount of in-kind exchanges is included in share transactions in the accompanying Statement of Changes in Net Assets.
| | Shares | Total Proceeds ($) |
| Fidelity Diversified International K6 Fund | 75,623,497 | 961,127,384 |
5. Fees and Other Transactions with Affiliates.
Management Fee. Fidelity Management & Research Company LLC (the investment adviser) and its affiliates provide the Fund with investment management related services for which the Fund pays a monthly management fee that is based on an annual rate of .60% of average net assets. Under the management contract, the investment adviser or an affiliate pays all other expenses of the Fund, excluding fees and expenses of the independent Trustees, and certain miscellaneous expenses such as proxy and shareholder meeting expenses.
Brokerage Commissions. A portion of portfolio transactions were placed with brokerage firms which are affiliates of the investment adviser. Brokerage commissions are included in net realized gain (loss) and change in net unrealized appreciation (depreciation) in the Statement of Operations. The commissions paid to these affiliated firms were as follows:
| | Amount |
| Fidelity Diversified International K6 Fund | $ 877 |
Interfund Trades. Funds may purchase from or sell securities to other Fidelity Funds under procedures adopted by the Board. The procedures have been designed to ensure these interfund trades are executed in accordance with Rule 17a-7 of the 1940 Act. Any interfund trades are included within the respective purchases and sales amounts shown in the Purchases and Sales of Investments note. Interfund trades during the period are noted in the table below.
| | Purchases ($) | Sales ($) | Realized Gain (Loss) ($) |
| Fidelity Diversified International K6 Fund | 22,270,884 | 18,464,101 | (671,221) |
6. Committed Line of Credit.
Certain Funds participate with other funds managed by the investment adviser or an affiliate in a $4.25 billion credit facility (the "line of credit") to be utilized for temporary or emergency purposes to fund shareholder redemptions or for other short-term liquidity purposes. The commitment fees on the pro-rata portion of the line of credit are borne by the investment adviser. During the period, there were no borrowings on this line of credit.
7. Security Lending.
Funds lend portfolio securities from time to time in order to earn additional income. Lending agents are used, including National Financial Services (NFS), an affiliate of the investment adviser. Pursuant to a securities lending agreement, NFS will receive a fee, which is capped at 9.9% of a fund's daily lending revenue, for its services as lending agent. A fund may lend securities to certain qualified borrowers, including NFS. On the settlement date of the loan, a fund receives collateral (in the form of U.S. Treasury obligations, letters of credit and/or cash) against the loaned securities and maintains collateral in an amount not less than 100% of the market value of the loaned securities during the period of the loan. The market value of the loaned securities is determined at the close of business of a fund and any additional required collateral is delivered to a fund on the next business day. A fund or borrower may terminate the loan at any time, and if the borrower defaults on its obligation to return the securities loaned because of insolvency or other reasons, a fund may apply collateral received from the borrower against the obligation. A fund may experience delays and costs in recovering the securities loaned. Any cash collateral received is invested in the Fidelity Securities Lending Cash Central Fund. Any loaned securities are identified as such in the Schedule of Investments, and the value of loaned securities and cash collateral at period end, as applicable, are presented in the Statement of Assets and Liabilities. Security lending income represents the income earned on investing cash collateral, less rebates paid to borrowers and any lending agent fees associated with the loan, plus any premium payments received for lending certain types of securities. Security lending income is presented in the Statement of Operations as a component of income from Fidelity Central Funds. Affiliated security lending activity, if any, was as follows:
| | Total Security Lending Fees Paid to NFS | Security Lending Income From Securities Loaned to NFS | Value of Securities Loaned to NFS at Period End |
| Fidelity Diversified International K6 Fund | $16,175 | $ - | $- |
8. Expense Reductions.
Through arrangements with the Fund's custodian, credits realized as a result of certain uninvested cash balances were used to reduce the Fund's expenses by $259.
9. Other.
A fund's organizational documents provide former and current trustees and officers with a limited indemnification against liabilities arising in connection with the performance of their duties to the fund. In the normal course of business, a fund may also enter into contracts that provide general indemnifications. A fund's maximum exposure under these arrangements is unknown as this would be dependent on future claims that may be made against a fund. The risk of material loss from such claims is considered remote.
10. Risk and Uncertainties.
Many factors affect a fund's performance. Developments that disrupt global economies and financial markets, such as pandemics, epidemics, outbreaks of infectious diseases, war, terrorism, and environmental disasters, may significantly affect a fund's investment performance. The effects of these developments to a fund will be impacted by the types of securities in which a fund invests, the financial condition, industry, economic sector, and geographic location of an issuer, and a fund's level of investment in the securities of that issuer. Significant concentrations in security types, issuers, industries, sectors, and geographic locations may magnify the factors that affect a fund's performance.
As a shareholder, you incur two types of costs: (1) transaction costs, which may include sales charges (loads) on purchase payments or redemption proceeds, as applicable and (2) ongoing costs, which generally include management fees, distribution and/or service (12b-1) fees and other Fund expenses. This Example is intended to help you understand your ongoing costs (in dollars) of investing in a fund and to compare these costs with the ongoing costs of investing in other mutual funds.
| The Example is based on an investment of $1,000 invested at the beginning of the period and held for the entire period (November 1, 2022 to April 30, 2023). |
Actual Expenses
The first line of the accompanying table provides information about actual account values and actual expenses. You may use the information in this line, together with the amount you invested, to estimate the expenses that you paid over the period. Simply divide your account value by $1,000.00 (for example, an $8,600 account value divided by $1,000.00 = 8.6), then multiply the result by the number in the first line for a class/Fund under the heading entitled "Expenses Paid During Period" to estimate the expenses you paid on your account during this period. If any fund is a shareholder of any underlying mutual funds or exchange-traded funds (ETFs) (the Underlying Funds), such fund indirectly bears its proportional share of the expenses of the Underlying Funds in addition to the direct expenses incurred presented in the table. These fees and expenses are not included in the annualized expense ratio used to calculate the expense estimate in the table below.
Hypothetical Example for Comparison Purposes
The second line of the accompanying table provides information about hypothetical account values and hypothetical expenses based on the actual expense ratio and an assumed rate of return of 5% per year before expenses, which is not the actual return. The hypothetical account values and expenses may not be used to estimate the actual ending account balance or expenses you paid for the period. You may use this information to compare the ongoing costs of investing in the Fund and other funds. To do so, compare this 5% hypothetical example with the 5% hypothetical examples that appear in the shareholder reports of the other funds. If any fund is a shareholder of any Underlying Funds, such fund indirectly bears its proportional share of the expenses of the Underlying Funds in addition to the direct expenses as presented in the table. These fees and expenses are not included in the annualized expense ratio used to calculate the expense estimate in the table below.
Please note that the expenses shown in the table are meant to highlight your ongoing costs only and do not reflect any transaction costs. Therefore, the second line of the table is useful in comparing ongoing costs only, and will not help you determine the relative total costs of owning different funds. In addition, if these transactional costs were included, your costs would have been higher.
| | | | | Annualized Expense Ratio- A | | Beginning Account Value November 1, 2022 | | Ending Account Value April 30, 2023 | | Expenses Paid During Period- C November 1, 2022 to April 30, 2023 |
| | | | | | | | | | |
| Fidelity® Diversified International K6 Fund | | | | .60% | | | | | | |
| Actual | | | | | | $ 1,000 | | $ 1,203.60 | | $ 3.28 |
Hypothetical- B | | | | | | $ 1,000 | | $ 1,021.82 | | $ 3.01 |
| |
A Annualized expense ratio reflects expenses net of applicable fee waivers.
B 5% return per year before expenses
C Expenses are equal to the annualized expense ratio, multiplied by the average account value over the period, multiplied by 181/ 365 (to reflect the one-half year period). The fees and expenses of any Underlying Funds are not included in each annualized expense ratio.
The Securities and Exchange Commission adopted Rule 22e-4 under the Investment Company Act of 1940 (the Liquidity Rule) to promote effective liquidity risk management throughout the open-end investment company industry, thereby reducing the risk that funds will be unable to meet their redemption obligations and mitigating dilution of the interests of fund shareholders.
The Fund has adopted and implemented a liquidity risk management program (the Program) reasonably designed to assess and manage the Fund's liquidity risk and to comply with the requirements of the Liquidity Rule. The Fund's Board of Trustees (the Board) has designated the Fund's investment adviser as administrator of the Program. The Fidelity advisers have established a Liquidity Risk Management Committee (the LRM Committee) to manage the Program for each of the Fidelity Funds. The LRM Committee monitors the adequacy and effectiveness of implementation of the Program and on a periodic basis assesses each Fund's liquidity risk based on a variety of factors including (1) the Fund's investment strategy, (2) portfolio liquidity and cash flow projections during normal and reasonably foreseeable stressed conditions, (3) shareholder redemptions, (4) borrowings and other funding sources and (5) certain factors specific to ETFs including the effect of the Fund's prices and spreads, market participants, and basket compositions on the overall liquidity of the Fund's portfolio, as applicable.
In accordance with the Program, each of the Fund's portfolio investments is classified into one of four defined liquidity categories based on a determination of a reasonable expectation for how long it would take to convert the investment to cash (or sell or dispose of the investment) without significantly changing its market value.
- Highly liquid investments - cash or convertible to cash within three business days or less
- Moderately liquid investments - convertible to cash in three to seven calendar days
- Less liquid investments - can be sold or disposed of, but not settled, within seven calendar days
- Illiquid investments - cannot be sold or disposed of within seven calendar days
Liquidity classification determinations take into account a variety of factors including various market, trading and investment-specific considerations, as well as market depth, and generally utilize analysis from a third-party liquidity metrics service.
The Liquidity Rule places a 15% limit on a fund's illiquid investments and requires funds that do not primarily hold assets that are highly liquid investments to determine and maintain a minimum percentage of the fund's net assets to be invested in highly liquid investments (highly liquid investment minimum or HLIM). The Program includes provisions reasonably designed to comply with the 15% limit on illiquid investments and for determining, periodically reviewing and complying with the HLIM requirement as applicable.
At a recent meeting of the Fund's Board of Trustees, the LRM Committee provided a written report to the Board pertaining to the operation, adequacy, and effectiveness of the Program for the period December 1, 2021 through November 30, 2022. The report concluded that the Program is operating effectively and is reasonably designed to assess and manage the Fund's liquidity risk.
1.9883986.105
DIFK6-SANN-0623
Fidelity Series Select International Small Cap Fund
Semi-Annual Report
April 30, 2023
Contents
To view a fund's proxy voting guidelines and proxy voting record for the 12-month period ended June 30, visit http://www.fidelity.com/proxyvotingresults or visit the Securities and Exchange Commission's (SEC) web site at http://www.sec.gov.
You may also call 1-800-544-8544 to request a free copy of the proxy voting guidelines.
Standard & Poor's, S&P and S&P 500 are registered service marks of The McGraw-Hill Companies, Inc. and have been licensed for use by Fidelity Distributors Corporation.
Other third-party marks appearing herein are the property of their respective owners.
All other marks appearing herein are registered or unregistered trademarks or service marks of FMR LLC or an affiliated company. © 2023 FMR LLC. All rights reserved.
This report and the financial statements contained herein are submitted for the general information of the shareholders of the Fund. This report is not authorized for distribution to prospective investors in the Fund unless preceded or accompanied by an effective prospectus.
A fund files its complete schedule of portfolio holdings with the SEC for the first and third quarters of each fiscal year on Form N-PORT. Forms N-PORT are available on the SEC's web site at http://www.sec.gov. A fund's Forms N-PORT may be reviewed and copied at the SEC's Public Reference Room in Washington, DC. Information regarding the operation of the SEC's Public Reference Room may be obtained by calling 1-800-SEC-0330.
For a complete list of a fund's portfolio holdings, view the most recent holdings listing, semiannual report, or annual report on Fidelity's web site at http://www.fidelity.com, http://www.institutional.fidelity.com, or http://www.401k.com, as applicable.
NOT FDIC INSURED •MAY LOSE VALUE •NO BANK GUARANTEE
Neither the Fund nor Fidelity Distributors Corporation is a bank.
Top Holdings (% of Fund's net assets) |
| |
| Lancashire Holdings Ltd. (United Kingdom, Insurance) | 1.0 | |
| Daiichikosho Co. Ltd. (Japan, Entertainment) | 0.9 | |
| AAK AB (Sweden, Food Products) | 0.9 | |
| Steadfast Group Ltd. (Australia, Insurance) | 0.9 | |
| VZ Holding AG (Switzerland, Capital Markets) | 0.8 | |
| Sembcorp Industries Ltd. (Singapore, Multi-Utilities) | 0.8 | |
| Munters Group AB (Sweden, Building Products) | 0.8 | |
| Mitie Group PLC (United Kingdom, Commercial Services & Supplies) | 0.8 | |
| Rexel SA (France, Trading Companies & Distributors) | 0.8 | |
| Rovio Entertainment OYJ (Finland, Entertainment) | 0.8 | |
| | 8.5 | |
| |
| Market Sectors (% of Fund's net assets) |
| |
| Industrials | 23.5 | |
| Consumer Discretionary | 14.4 | |
| Financials | 10.5 | |
| Information Technology | 9.8 | |
| Real Estate | 8.8 | |
| Materials | 8.1 | |
| Consumer Staples | 6.6 | |
| Communication Services | 6.4 | |
| Health Care | 6.1 | |
| Energy | 2.3 | |
| Utilities | 1.9 | |
| |
Asset Allocation (% of Fund's net assets) |
|
|
Geographic Diversification (% of Fund's net assets) |
|
* Includes Short-Term investments and Net Other Assets (Liabilities). Percentages are adjusted for the effect of derivatives, if applicable. |
| |
Showing Percentage of Net Assets
| Common Stocks - 97.8% |
| | | Shares | Value ($) |
| Australia - 8.0% | | | |
| 29Metals Ltd. | | 3,273 | 2,589 |
| ALS Ltd. | | 890 | 7,768 |
| Ansell Ltd. | | 270 | 4,805 |
| Aurizon Holdings Ltd. | | 2,153 | 4,895 |
| Beach Energy Ltd. | | 4,620 | 4,547 |
| Challenger Ltd. | | 953 | 3,835 |
| Flight Centre Travel Group Ltd. (a) | | 592 | 7,774 |
| GUD Holdings Ltd. | | 1,090 | 6,953 |
| IGO Ltd. | | 534 | 4,918 |
| Incitec Pivot Ltd. | | 2,753 | 5,866 |
| Iress Ltd. | | 669 | 4,597 |
| McMillan Shakespeare Ltd. | | 754 | 7,702 |
| National Storage REIT unit | | 4,732 | 7,882 |
| Red 5 Ltd. (a) | | 30,304 | 3,413 |
| Steadfast Group Ltd. | | 2,580 | 10,171 |
| Treasury Wine Estates Ltd. | | 809 | 7,494 |
TOTAL AUSTRALIA | | | 95,209 |
| Austria - 1.7% | | | |
| AT&S Austria Technologie & Systemtechnik AG | | 97 | 2,961 |
| Schoeller-Bleckmann Oilfield Equipment AG | | 97 | 6,092 |
| Wienerberger AG | | 268 | 8,062 |
| Zumtobel AG | | 440 | 3,452 |
TOTAL AUSTRIA | | | 20,567 |
| Bailiwick of Jersey - 0.6% | | | |
| JTC PLC (b) | | 725 | 7,225 |
| Belgium - 1.7% | | | |
| Azelis Group NV | | 277 | 6,562 |
| Econocom Group SA | | 1,921 | 6,594 |
| Fagron NV | | 406 | 7,543 |
TOTAL BELGIUM | | | 20,699 |
| Finland - 1.6% | | | |
| Huhtamaki Oyj | | 173 | 6,222 |
| Musti Group OYJ | | 156 | 3,230 |
| Rovio Entertainment OYJ (b) | | 885 | 9,084 |
TOTAL FINLAND | | | 18,536 |
| France - 6.3% | | | |
| Altarea SCA | | 43 | 5,629 |
| ALTEN | | 48 | 8,145 |
| Euroapi SASU | | 303 | 3,638 |
| Exclusive Networks SA | | 344 | 7,429 |
| Ipsos SA | | 157 | 8,505 |
| Nexans SA | | 55 | 4,718 |
| Rexel SA | | 413 | 9,557 |
| SEB SA | | 50 | 5,719 |
| Ubisoft Entertainment SA (a) | | 150 | 4,393 |
| Vallourec SA (a) | | 514 | 5,854 |
| Vicat SA | | 127 | 3,701 |
| Virbac SA | | 23 | 7,844 |
TOTAL FRANCE | | | 75,132 |
| Germany - 5.3% | | | |
| Bilfinger Berger AG | | 151 | 6,522 |
| CTS Eventim AG | | 118 | 7,749 |
| DIC Asset AG rights (a)(c) | | 310 | 256 |
| Gerresheimer AG | | 60 | 6,525 |
| Lanxess AG | | 140 | 5,686 |
| Mensch und Maschine Software SE | | 82 | 4,662 |
| Patrizia Immobilien AG | | 474 | 5,087 |
| PVA TePla AG (a) | | 189 | 4,040 |
| SAF-Holland SA | | 623 | 8,602 |
| Stabilus Se | | 116 | 7,567 |
| Takkt AG | | 400 | 6,400 |
TOTAL GERMANY | | | 63,096 |
| Hong Kong - 2.3% | | | |
| ASMPT Ltd. | | 469 | 3,687 |
| Dah Sing Financial Holdings Ltd. | | 1,207 | 3,092 |
| Fortune (REIT) | | 4,496 | 3,761 |
| Hysan Development Co. Ltd. | | 2,024 | 5,720 |
| Luk Fook Holdings International Ltd. | | 2,386 | 7,646 |
| Melco International Development Ltd. (a) | | 3,000 | 3,491 |
TOTAL HONG KONG | | | 27,397 |
| Ireland - 2.3% | | | |
| Bank of Ireland Group PLC | | 775 | 8,002 |
| C&C Group PLC (United Kingdom) (a) | | 3,268 | 6,423 |
| Dalata Hotel Group PLC (a) | | 1,560 | 7,830 |
| Uniphar PLC | | 1,750 | 5,843 |
TOTAL IRELAND | | | 28,098 |
| Israel - 1.3% | | | |
| Bezeq The Israel Telecommunication Corp. Ltd. | | 3,530 | 4,782 |
| Nova Ltd. (a) | | 80 | 7,323 |
| Rami Levi Chain Stores Hashikma Marketing 2006 Ltd. | | 63 | 3,585 |
TOTAL ISRAEL | | | 15,690 |
| Italy - 2.7% | | | |
| Banca Generali SpA | | 257 | 8,521 |
| Banco BPM SpA | | 1,100 | 4,467 |
| Brembo SpA | | 574 | 8,418 |
| Carel Industries SpA (b) | | 244 | 6,399 |
| GVS SpA (a)(b) | | 739 | 5,028 |
TOTAL ITALY | | | 32,833 |
| Japan - 32.6% | | | |
| Aeon Delight Co. Ltd. | | 200 | 4,432 |
| Anritsu Corp. | | 441 | 4,038 |
| As One Corp. | | 120 | 5,084 |
| ASKUL Corp. | | 481 | 6,410 |
| Azbil Corp. | | 196 | 5,481 |
| Bank of Kyoto Ltd. | | 169 | 8,315 |
| Capcom Co. Ltd. | | 203 | 7,628 |
| Cosmos Pharmaceutical Corp. | | 61 | 6,000 |
| Daido Steel Co. Ltd. | | 150 | 5,777 |
| Daiichikosho Co. Ltd. | | 626 | 11,223 |
| Daiwa Securities Living Invest | | 8 | 6,802 |
| Dowa Holdings Co. Ltd. | | 162 | 5,293 |
| Food & Life Companies Ltd. | | 251 | 6,046 |
| FP Corp. | | 241 | 5,995 |
| Fujitec Co. Ltd. | | 262 | 6,979 |
| Fukushima Industries Corp. | | 180 | 6,788 |
| Fuyo General Lease Co. Ltd. | | 110 | 8,050 |
| GMO Internet, Inc. | | 180 | 3,621 |
| Haseko Corp. | | 518 | 6,324 |
| Inaba Denki Sangyo Co. Ltd. | | 400 | 8,934 |
| J. Front Retailing Co. Ltd. | | 642 | 6,752 |
| JEOL Ltd. | | 110 | 3,209 |
| JTOWER, Inc. (a) | | 135 | 5,822 |
| Kamigumi Co. Ltd. | | 398 | 8,723 |
| Kaneka Corp. | | 298 | 7,928 |
| Kawasaki Heavy Industries Ltd. | | 290 | 6,309 |
| Kissei Pharmaceutical Co. Ltd. | | 365 | 7,395 |
| Koshidaka Holdings Co. Ltd. | | 900 | 7,619 |
| Kyoritsu Maintenance Co. Ltd. | | 148 | 5,974 |
| Kyushu Railway Co. | | 260 | 5,904 |
| Maruwa Ceramic Co. Ltd. | | 52 | 6,631 |
| Milbon Co. Ltd. | | 162 | 6,830 |
| Mitsubishi Logisnext Co. Ltd. | | 900 | 6,554 |
| Miura Co. Ltd. | | 200 | 5,327 |
| Money Forward, Inc. (a) | | 100 | 4,164 |
| Morinaga & Co. Ltd. | | 222 | 6,579 |
| Nabtesco Corp. | | 291 | 7,014 |
| Nagaileben Co. Ltd. | | 290 | 4,511 |
| Net One Systems Co. Ltd. | | 238 | 5,612 |
| Nikkiso Co. Ltd. | | 978 | 6,869 |
| Nippon Gas Co. Ltd. | | 343 | 4,823 |
| Okinawa Cellular Telephone Co. | | 299 | 6,680 |
| PALTAC Corp. | | 182 | 6,983 |
| Park24 Co. Ltd. (a) | | 416 | 6,430 |
| Penta-Ocean Construction Co. Ltd. | | 908 | 4,414 |
| Relo Group, Inc. | | 388 | 6,032 |
| Resonac Holdings Corp. | | 325 | 5,146 |
| Roland Corp. | | 186 | 5,576 |
| Sanwa Holdings Corp. | | 568 | 6,221 |
| SHIFT, Inc. (a) | | 29 | 5,399 |
| SOSiLA Logistics REIT, Inc. | | 5 | 4,972 |
| Stanley Electric Co. Ltd. | | 358 | 8,076 |
| Sumco Corp. | | 459 | 6,321 |
| Suruga Bank Ltd. | | 1,988 | 7,541 |
| Tokyo Tatemono Co. Ltd. | | 433 | 5,484 |
| Toyo Suisan Kaisha Ltd. | | 170 | 7,590 |
| Tsumura & Co. | | 219 | 4,444 |
| Tsuruha Holdings, Inc. | | 69 | 4,519 |
| Valqua Ltd. | | 348 | 8,755 |
| Workman Co. Ltd. | | 183 | 7,455 |
| Yokogawa Electric Corp. | | 348 | 5,652 |
| Zuken, Inc. | | 290 | 7,363 |
TOTAL JAPAN | | | 390,822 |
| Netherlands - 1.1% | | | |
| Eurocommercial Properties NV | | 342 | 8,193 |
| TKH Group NV (bearer) (depositary receipt) | | 100 | 4,829 |
TOTAL NETHERLANDS | | | 13,022 |
| New Zealand - 0.7% | | | |
| Contact Energy Ltd. | | 1,780 | 8,633 |
| Norway - 1.4% | | | |
| Schibsted ASA (A Shares) | | 200 | 3,543 |
| Sparebanken Midt-Norge | | 500 | 6,465 |
| TGS ASA | | 439 | 6,871 |
TOTAL NORWAY | | | 16,879 |
| Singapore - 2.4% | | | |
| CDL Hospitality Trusts unit | | 7,932 | 7,524 |
| Mapletree Industrial (REIT) | | 3,585 | 6,409 |
| Sembcorp Industries Ltd. | | 3,093 | 9,952 |
| Wing Tai Holdings Ltd. | | 4,256 | 4,727 |
TOTAL SINGAPORE | | | 28,612 |
| Spain - 2.9% | | | |
| Applus Services SA | | 892 | 7,475 |
| Bankinter SA | | 1,287 | 7,604 |
| Cie Automotive SA | | 179 | 5,389 |
| Compania de Distribucion Integral Logista Holdings SA | | 317 | 8,614 |
| Fluidra SA | | 320 | 5,476 |
TOTAL SPAIN | | | 34,558 |
| Sweden - 5.4% | | | |
| AAK AB | | 510 | 10,265 |
| AddTech AB (B Shares) | | 391 | 7,816 |
| Arjo AB | | 990 | 4,379 |
| Avanza Bank Holding AB | | 310 | 6,581 |
| Cloetta AB | | 2,481 | 5,250 |
| Hemnet Group AB | | 338 | 5,537 |
| HEXPOL AB (B Shares) | | 715 | 8,415 |
| Loomis AB (B Shares) | | 210 | 6,717 |
| Munters Group AB (b) | | 1,005 | 9,839 |
TOTAL SWEDEN | | | 64,799 |
| Switzerland - 3.8% | | | |
| Bucher Industries AG | | 16 | 7,174 |
| Lastminute.com NV (a) | | 155 | 4,335 |
| OC Oerlikon Corp. AG (Reg.) | | 793 | 4,416 |
| PSP Swiss Property AG | | 57 | 6,702 |
| Sensirion Holding AG (a)(b) | | 45 | 4,863 |
| Tecan Group AG | | 18 | 7,809 |
| VZ Holding AG | | 109 | 10,121 |
TOTAL SWITZERLAND | | | 45,420 |
| United Kingdom - 13.7% | | | |
| B&M European Value Retail SA | | 1,466 | 8,838 |
| Britvic PLC | | 699 | 8,025 |
| Close Brothers Group PLC | | 531 | 6,059 |
| DCC PLC (United Kingdom) | | 100 | 6,213 |
| Grainger Trust PLC | | 2,272 | 7,384 |
| Harbour Energy PLC | | 1,109 | 3,447 |
| Hill & Smith Holdings PLC | | 338 | 5,845 |
| J.D. Wetherspoon PLC (a) | | 707 | 6,335 |
| Jet2 PLC | | 516 | 7,950 |
| Lancashire Holdings Ltd. | | 1,514 | 11,657 |
| Mitie Group PLC | | 8,396 | 9,708 |
| Pets At Home Group PLC | | 1,177 | 5,704 |
| Renewi PLC (a) | | 1,032 | 7,782 |
| Sabre Insurance Group PLC (b) | | 5,571 | 8,850 |
| Savills PLC | | 400 | 4,833 |
| Senior Engineering Group PLC | | 3,931 | 8,122 |
| Spectris PLC | | 189 | 8,929 |
| Synthomer PLC | | 2,500 | 3,758 |
| Tate & Lyle PLC | | 651 | 6,668 |
| Unite Group PLC | | 523 | 6,303 |
| Vistry Group PLC | | 664 | 6,530 |
| Volution Group PLC | | 1,204 | 6,558 |
| WH Smith PLC | | 401 | 7,932 |
TOTAL UNITED KINGDOM | | | 163,430 |
| TOTAL COMMON STOCKS (Cost $1,001,622) | | | 1,170,657 |
| | | | |
| Nonconvertible Preferred Stocks - 0.6% |
| | | Shares | Value ($) |
| Germany - 0.6% | | | |
Jungheinrich AG (Cost $5,082) | | 201 | 7,761 |
| | | | |
| TOTAL INVESTMENT IN SECURITIES - 98.4% (Cost $1,006,704) | 1,178,418 |
NET OTHER ASSETS (LIABILITIES) - 1.6% | 19,063 |
| NET ASSETS - 100.0% | 1,197,481 |
| | |
Legend
| (b) | Security exempt from registration under Rule 144A of the Securities Act of 1933. These securities may be resold in transactions exempt from registration, normally to qualified institutional buyers. At the end of the period, the value of these securities amounted to $51,288 or 4.3% of net assets. |
| (c) | Security or a portion of the security purchased on a delayed delivery or when-issued basis. |
Affiliated Central Funds
Fiscal year to date information regarding the Fund's investments in Fidelity Central Funds, including the ownership percentage, is presented below.
| Affiliate | Value, beginning of period ($) | Purchases ($) | Sales Proceeds ($) | Dividend Income ($) | Realized Gain (loss) ($) | Change in Unrealized appreciation (depreciation) ($) | Value, end of period ($) | % ownership, end of period |
| Fidelity Cash Central Fund 4.88% | - | 1,000,000 | 1,000,000 | 423 | - | - | - | 0.0% |
| Total | - | 1,000,000 | 1,000,000 | 423 | - | - | - | |
| | | | | | | | | |
Amounts in the dividend income column in the above table include any capital gain distributions from underlying funds, which are presented in the corresponding line item in the Statement of Operations, if applicable.
Amounts included in the purchases and sales proceeds columns may include in-kind transactions, if applicable.
Investment Valuation
The following is a summary of the inputs used, as of April 30, 2023, involving the Fund's assets and liabilities carried at fair value. The inputs or methodology used for valuing securities may not be an indication of the risk associated with investing in those securities. For more information on valuation inputs, and their aggregation into the levels used below, please refer to the Investment Valuation section in the accompanying Notes to Financial Statements.
| Valuation Inputs at Reporting Date: |
| Description | Total ($) | Level 1 ($) | Level 2 ($) | Level 3 ($) |
Investments in Securities: | | | | |
|
| Equities: | | | | |
Communication Services | 74,946 | 39,200 | 35,746 | - |
Consumer Discretionary | 171,941 | 78,862 | 93,079 | - |
Consumer Staples | 79,228 | 40,216 | 39,012 | - |
Energy | 26,811 | 22,264 | 4,547 | - |
Financials | 126,556 | 85,552 | 41,004 | - |
Health Care | 73,029 | 43,581 | 29,448 | - |
Industrials | 283,918 | 172,655 | 111,263 | - |
Information Technology | 117,512 | 54,946 | 62,566 | - |
Materials | 97,369 | 41,689 | 55,680 | - |
Real Estate | 103,700 | 44,131 | 59,569 | - |
Utilities | 23,408 | - | 23,408 | - |
| | | | | |
| Total Investments in Securities: | 1,178,418 | 623,096 | 555,322 | - |
| Statement of Assets and Liabilities |
| | | | April 30, 2023 (Unaudited) |
| | | | | |
| Assets | | | | |
Investment in securities, at value - See accompanying schedule Unaffiliated issuers (cost $1,006,704): | | | $ | 1,178,418 |
| Cash | | | | 16,578 |
| Foreign currency held at value (cost $504) | | | | 503 |
| Dividends receivable | | | | 5,193 |
| Receivable from investment adviser for expense reductions | | | | 52 |
Total assets | | | | 1,200,744 |
| Liabilities | | | | |
| Payable for investments purchased | | | | |
Regular delivery | $ | 2,164 | | |
Delayed delivery | | 256 | | |
| Other payables and accrued expenses | | 843 | | |
| Total Liabilities | | | | 3,263 |
| Net Assets | | | $ | 1,197,481 |
| Net Assets consist of: | | | | |
| Paid in capital | | | $ | 1,003,400 |
| Total accumulated earnings (loss) | | | | 194,081 |
| Net Assets | | | $ | 1,197,481 |
Net Asset Value , offering price and redemption price per share ($1,197,481 ÷ 100,311 shares) | | | $ | 11.94 |
| Statement of Operations |
| | | | For the period November 4, 2022 (commencement of operations) through April 30, 2023 (Unaudited) |
| Investment Income | | | | |
| Dividends | | | $ | 15,491 |
| Income from Fidelity Central Funds | | | | 423 |
| Income before foreign taxes withheld | | | $ | 15,914 |
| Less foreign taxes withheld | | | | (1,537) |
| Total Income | | | | 14,377 |
| Expenses | | | | |
| Custodian fees and expenses | $ | 2,034 | | |
| Independent trustees' fees and expenses | | 2 | | |
| Total expenses before reductions | | 2,036 | | |
| Expense reductions | | (2,012) | | |
| Total expenses after reductions | | | | 24 |
| Net Investment income (loss) | | | | 14,353 |
| Realized and Unrealized Gain (Loss) | | | | |
| Net realized gain (loss) on: | | | | |
| Investment Securities: | | | | |
| Unaffiliated issuers | | 7,027 | | |
| Foreign currency transactions | | 4,465 | | |
| Total net realized gain (loss) | | | | 11,492 |
| Change in net unrealized appreciation (depreciation) on: | | | | |
| Investment Securities: | | | | |
| Unaffiliated issuers | | 171,714 | | |
| Assets and liabilities in foreign currencies | | (78) | | |
| Total change in net unrealized appreciation (depreciation) | | | | 171,636 |
| Net gain (loss) | | | | 183,128 |
| Net increase (decrease) in net assets resulting from operations | | | $ | 197,481 |
| Statement of Changes in Net Assets |
| |
| | For the period November 4, 2022 (commencement of operations) through April 30, 2023 (Unaudited) |
| Increase (Decrease) in Net Assets | | |
| Operations | | |
| Net investment income (loss) | $ | 14,353 |
| Net realized gain (loss) | | 11,492 |
| Change in net unrealized appreciation (depreciation) | | 171,636 |
| Net increase (decrease) in net assets resulting from operations | | 197,481 |
| Distributions to shareholders | | (3,400) |
| Share transactions | | |
| Proceeds from sales of shares | | 1,000,000 |
| Reinvestment of distributions | | 3,400 |
Net increase (decrease) in net assets resulting from share transactions | | 1,003,400 |
| Total increase (decrease) in net assets | | 1,197,481 |
| | | |
| Net Assets | | |
| Beginning of period | | - |
| End of period | $ | 1,197,481 |
| | | |
| Other Information | | |
| Shares | | |
| Sold | | 100,000 |
| Issued in reinvestment of distributions | | 311 |
| Redeemed | | - |
| Net increase (decrease) | | 100,311 |
| | | |
Financial Highlights
| Fidelity Series Select International Small Cap Fund |
| |
| | Six months ended (Unaudited) April 30, 2023 A |
Selected Per-Share Data | | |
| Net asset value, beginning of period | $ | 10.00 |
| Income from Investment Operations | | |
Net investment income (loss) B,C | | .14 |
| Net realized and unrealized gain (loss) | | 1.83 |
| Total from investment operations | | 1.97 |
| Distributions from net investment income | | (.03) |
| Total distributions | | (.03) |
| Net asset value, end of period | $ | 11.94 |
Total Return D,E | | 19.77% |
Ratios to Average Net Assets C,F,G | | |
| Expenses before reductions | | .37% H |
| Expenses net of fee waivers, if any | | .01% H |
| Expenses net of all reductions | | -% H,I |
| Net investment income (loss) | | 2.59% H |
| Supplemental Data | | |
| Net assets, end of period (000 omitted) | $ | 1,197 |
Portfolio turnover rate J | | 13% K |
A For the period November 4, 2022 (commencement of operations) through April 30, 2023.
B Calculated based on average shares outstanding during the period.
C Net investment income (loss) is affected by the timing of the declaration of dividends by any underlying mutual funds or exchange-traded funds (ETFs). Net investment income (loss) of any mutual funds or ETFs is not included in the Fund's net investment income (loss) ratio.
D Total returns for periods of less than one year are not annualized.
E Total returns would have been lower if certain expenses had not been reduced during the applicable periods shown.
F Fees and expenses of any underlying mutual funds or exchange-traded funds (ETFs) are not included in the Fund's expense ratio. The Fund indirectly bears its proportionate share of these expenses. For additional expense information related to investments in Fidelity Central Funds, please refer to the "Investments in Fidelity Central Funds" note found in the Notes to Financial Statements section of the most recent Annual or Semi-Annual report.
G Expense ratios reflect operating expenses of the class. Expenses before reductions do not reflect amounts reimbursed, waived, or reduced through arrangements with the investment adviser, brokerage services, or other offset arrangements, if applicable, and do not represent the amount paid by the class during periods when reimbursements, waivers or reductions occur.
H Annualized.
I Amount represents less than .005%.
J Amount does not include the portfolio activity of any underlying mutual funds or exchange-traded funds (ETFs).
K Amount not annualized.
For the period ended April 30, 2023
1. Organization.
Fidelity Series Select International Small Cap Fund (the Fund) is a fund of Fidelity Investment Trust (the Trust) and is authorized to issue an unlimited number of shares. Shares are offered only to certain other Fidelity funds, Fidelity managed 529 plans, and Fidelity managed collective investment trusts. The Trust is registered under the Investment Company Act of 1940, as amended (the 1940 Act), as an open-end management investment company organized as a Massachusetts business trust.
2. Investments in Fidelity Central Funds.
Funds may invest in Fidelity Central Funds, which are open-end investment companies generally available only to other investment companies and accounts managed by the investment adviser and its affiliates. The Schedule of Investments lists any Fidelity Central Funds held as an investment as of period end, but does not include the underlying holdings of each Fidelity Central Fund. An investing fund indirectly bears its proportionate share of the expenses of the underlying Fidelity Central Funds.
Based on its investment objective, each Fidelity Central Fund may invest or participate in various investment vehicles or strategies that are similar to those of the investing fund. These strategies are consistent with the investment objectives of the investing fund and may involve certain economic risks which may cause a decline in value of each of the Fidelity Central Funds and thus a decline in the value of the investing fund.
| Fidelity Central Fund+ | Investment Manager | Investment Objective | Investment Practices | Expense Ratio A |
| Fidelity Money Market Central Funds | Fidelity Management & Research Company LLC (FMR) | Each fund seeks to obtain a high level of current income consistent with the preservation of capital and liquidity. | Short-term Investments | Less than .005% |
A Expenses expressed as a percentage of average net assets and are as of each underlying Central Fund's most recent annual or semi-annual shareholder report.
A complete unaudited list of holdings for each Fidelity Central Fund is available upon request or at the Securities and Exchange Commission website at www.sec.gov. In addition, the financial statements of the Fidelity Central Funds which contain the significant accounting policies (including investment valuation policies) of those funds, and are not covered by the Report of Independent Registered Public Accounting Firm, are available on the Securities and Exchange Commission website or upon request.
3. Significant Accounting Policies.
The Fund is an investment company and applies the accounting and reporting guidance of the Financial Accounting Standards Board (FASB) Accounting Standards Codification Topic 946 Financial Services - Investment Companies . The financial statements have been prepared in conformity with accounting principles generally accepted in the United States of America (GAAP), which require management to make certain estimates and assumptions at the date of the financial statements. Actual results could differ from those estimates. Subsequent events, if any, through the date that the financial statements were issued have been evaluated in the preparation of the financial statements. The Fund's Schedule of Investments lists any underlying mutual funds or exchange-traded funds (ETFs) but does not include the underlying holdings of these funds. The following summarizes the significant accounting policies of the Fund:
Investment Valuation. Investments are valued as of 4:00 p.m. Eastern time on the last calendar day of the period. The Board of Trustees (the Board) has designated the Fund's investment adviser as the valuation designee responsible for the fair valuation function and performing fair value determinations as needed. The investment adviser has established a Fair Value Committee (the Committee) to carry out the day-to-day fair valuation responsibilities and has adopted policies and procedures to govern the fair valuation process and the activities of the Committee. In accordance with these fair valuation policies and procedures, which have been approved by the Board, the Fund attempts to obtain prices from one or more third party pricing services or brokers to value its investments. When current market prices, quotations or currency exchange rates are not readily available or reliable, investments will be fair valued in good faith by the Committee, in accordance with the policies and procedures. Factors used in determining fair value vary by investment type and may include market or investment specific events, transaction data, estimated cash flows, and market observations of comparable investments. The frequency that the fair valuation procedures are used cannot be predicted and they may be utilized to a significant extent. The Committee manages the Fund's fair valuation practices and maintains the fair valuation policies and procedures. The Fund's investment adviser reports to the Board information regarding the fair valuation process and related material matters.
The Fund categorizes the inputs to valuation techniques used to value its investments into a disclosure hierarchy consisting of three levels as shown below:
Level 1 - unadjusted quoted prices in active markets for identical investments
Level 2 - other significant observable inputs (including quoted prices for similar investments, interest rates, prepayment speeds, etc.)
Level 3 - unobservable inputs (including the Fund's own assumptions based on the best information available)
Valuation techniques used to value the Fund's investments by major category are as follows:
Equity securities, including restricted securities, for which market quotations are readily available, are valued at the last reported sale price or official closing price as reported by a third party pricing service on the primary market or exchange on which they are traded and are categorized as Level 1 in the hierarchy. In the event there were no sales during the day or closing prices are not available, securities are valued at the last quoted bid price or may be valued using the last available price and are generally categorized as Level 2 in the hierarchy. For foreign equity securities, when market or security specific events arise, comparisons to the valuation of American Depositary Receipts (ADRs), futures contracts, Exchange-Traded Funds (ETFs) and certain indexes as well as quoted prices for similar securities may be used and would be categorized as Level 2 in the hierarchy. For equity securities, including restricted securities, where observable inputs are limited, assumptions about market activity and risk are used and these securities may be categorized as Level 3 in the hierarchy.
Changes in valuation techniques may result in transfers in or out of an assigned level within the disclosure hierarchy. The aggregate value of investments by input level as of April 30, 2023 is included at the end of the Fund's Schedule of Investments.
Foreign Currency. Certain Funds may use foreign currency contracts to facilitate transactions in foreign-denominated securities. Gains and losses from these transactions may arise from changes in the value of the foreign currency or if the counterparties do not perform under the contracts' terms.
Foreign-denominated assets, including investment securities, and liabilities are translated into U.S. dollars at the exchange rates at period end. Purchases and sales of investment securities, income and dividends received, and expenses denominated in foreign currencies are translated into U.S. dollars at the exchange rate in effect on the transaction date.
The effects of exchange rate fluctuations on investments are included with the net realized and unrealized gain (loss) on investment securities. Other foreign currency transactions resulting in realized and unrealized gain (loss) are disclosed separately.
Investment Transactions and Income. For financial reporting purposes, the Fund's investment holdings and NAV include trades executed through the end of the last business day of the period. The NAV per share for processing shareholder transactions is calculated as of the close of business of the New York Stock Exchange (NYSE), normally 4:00 p.m. Eastern time. Gains and losses on securities sold are determined on the basis of identified cost. Commissions paid to certain brokers with whom the investment adviser, or its affiliates, places trades on behalf of a fund include an amount in addition to trade execution, which may be rebated back to a fund. Any such rebates are included in net realized gain (loss) on investments in the Statement of Operations. Dividend income is recorded on the ex-dividend date, except for certain dividends from foreign securities where the ex-dividend date may have passed, which are recorded as soon as the Fund is informed of the ex-dividend date. Non-cash dividends included in dividend income, if any, are recorded at the fair market value of the securities received. Income and capital gain distributions from Fidelity Central Funds, if any, are recorded on the ex-dividend date. Certain distributions received by the Fund represent a return of capital or capital gain. The Fund determines the components of these distributions subsequent to the ex-dividend date, based upon receipt of tax filings or other correspondence relating to the underlying investment. These distributions are recorded as a reduction of cost of investments and/or as a realized gain. Investment income is recorded net of foreign taxes withheld where recovery of such taxes is uncertain. Funds may file withholding tax reclaims in certain jurisdictions to recover a portion of amounts previously withheld. Any withholding tax reclaims income is included in the Statement of Operations in foreign taxes withheld. Any receivables for withholding tax reclaims are included in the Statement of Assets and Liabilities in dividends receivable.
Expenses. Expenses directly attributable to a fund are charged to that fund. Expenses attributable to more than one fund are allocated among the respective funds on the basis of relative net assets or other appropriate methods. Expenses included in the accompanying financial statements reflect the expenses of that fund and do not include any expenses associated with any underlying mutual funds or exchange-traded funds. Although not included in a fund's expenses, a fund indirectly bears its proportionate share of these expenses through the net asset value of each underlying mutual fund or exchange-traded fund. Expense estimates are accrued in the period to which they relate and adjustments are made when actual amounts are known.
Income Tax Information and Distributions to Shareholders. Each year, the Fund intends to qualify as a regulated investment company under Subchapter M of the Internal Revenue Code, including distributing substantially all of its taxable income and realized gains. As a result, no provision for U.S. Federal income taxes is required. The Fund files a U.S. federal tax return, in addition to state and local tax returns as required. The Fund's federal income tax returns are subject to examination by the Internal Revenue Service (IRS) for a period of three fiscal years after they are filed. State and local tax returns may be subject to examination for an additional fiscal year depending on the jurisdiction. Foreign taxes are provided for based on the Fund's understanding of the tax rules and rates that exist in the foreign markets in which it invests.
Distributions are declared and recorded on the ex-dividend date. Income and capital gain distributions are determined in accordance with income tax regulations, which may differ from GAAP.
Capital accounts within the financial statements are adjusted for permanent book-tax differences. These adjustments have no impact on net assets or the results of operations. Capital accounts are not adjusted for temporary book-tax differences which will reverse in a subsequent period.
As of period end, the cost and unrealized appreciation (depreciation) in securities, and derivatives if applicable, for federal income tax purposes were as follows:
| Gross unrealized appreciation | $188,244 |
| Gross unrealized depreciation | (16,530) |
| Net unrealized appreciation (depreciation) | $171,714 |
| Tax cost | $1,006,704 |
Delayed Delivery Transactions and When-Issued Securities. During the period, certain Funds transacted in securities on a delayed delivery or when-issued basis. Payment and delivery may take place after the customary settlement period for that security. The price of the underlying securities and the date when the securities will be delivered and paid for are fixed at the time the transaction is negotiated. Securities purchased on a delayed delivery or when-issued basis are identified as such in the Schedule of Investments. Compensation for interest forgone in the purchase of a delayed delivery or when-issued debt security may be received. With respect to purchase commitments, each applicable Fund identifies securities as segregated in its records with a value at least equal to the amount of the commitment. Payables and receivables associated with the purchases and sales of delayed delivery securities having the same coupon, settlement date and broker are offset. Delayed delivery or when-issued securities that have been purchased from and sold to different brokers are reflected as both payables and receivables in the Statement of Assets and Liabilities under the caption "Delayed delivery", as applicable. Losses may arise due to changes in the value of the underlying securities or if the counterparty does not perform under the contract's terms, or if the issuer does not issue the securities due to political, economic, or other factors.
Restricted Securities (including Private Placements). Funds may invest in securities that are subject to legal or contractual restrictions on resale. These securities generally may be resold in transactions exempt from registration or to the public if the securities are registered. Disposal of these securities may involve time-consuming negotiations and expense, and prompt sale at an acceptable price may be difficult. Information regarding restricted securities held at period end is included at the end of the Schedule of Investments, if applicable.
4. Purchases and Sales of Investments.
Purchases and sales of securities, other than short-term securities, and in-kind transactions, as applicable, are noted in the table below.
| | Purchases ($) | Sales ($) |
| Fidelity Series Select International Small Cap Fund | 1,152,159 | 152,410 |
5. Fees and Other Transactions with Affiliates.
Management Fee. Fidelity Management & Research Company LLC (the investment adviser) and its affiliates provide the Fund with investment management related services for which the Fund does not pay a management fee. Under the management contract, the investment adviser or an affiliate pays all ordinary operating expenses of the Fund, except custody fees, fees and expenses of the independent Trustees, and certain miscellaneous expenses such as proxy and shareholder meeting expenses.
Interfund Trades. Funds may purchase from or sell securities to other Fidelity Funds under procedures adopted by the Board. The procedures have been designed to ensure these interfund trades are executed in accordance with Rule 17a-7 of the 1940 Act. Any interfund trades are included within the respective purchases and sales amounts shown in the Purchases and Sales of Investments note. During the period, there were no interfund trades.
6. Committed Line of Credit.
Certain Funds participate with other funds managed by the investment adviser or an affiliate in a $4.25 billion credit facility (the "line of credit") to be utilized for temporary or emergency purposes to fund shareholder redemptions or for other short-term liquidity purposes. The commitment fees on the pro-rata portion of the line of credit are borne by the investment adviser. During the period, there were no borrowings on this line of credit.
7. Expense Reductions.
The investment adviser contractually agreed to reimburse the Fund to the extent annual operating expenses exceeded .013% of average net assets. This reimbursement will remain in place through February 28, 2026. Some expenses, for example the compensation of the independent Trustees, and certain other expenses such as interest expense, are excluded from this reimbursement. During the period this reimbursement reduced the Fund's expenses by $1,962.
Through arrangements with the Fund's custodian, credits realized as a result of certain uninvested cash balances were used to reduce the Fund's expenses by $50.
8. Other.
A fund's organizational documents provide former and current trustees and officers with a limited indemnification against liabilities arising in connection with the performance of their duties to the fund. In the normal course of business, a fund may also enter into contracts that provide general indemnifications. A fund's maximum exposure under these arrangements is unknown as this would be dependent on future claims that may be made against a fund. The risk of material loss from such claims is considered remote.
At the end of the period, mutual funds and accounts managed by the investment adviser or its affiliates were the owners of record of all of the outstanding shares of the Fund.
9. Risk and Uncertainties.
Many factors affect a fund's performance. Developments that disrupt global economies and financial markets, such as pandemics, epidemics, outbreaks of infectious diseases, war, terrorism, and environmental disasters, may significantly affect a fund's investment performance. The effects of these developments to a fund will be impacted by the types of securities in which a fund invests, the financial condition, industry, economic sector, and geographic location of an issuer, and a fund's level of investment in the securities of that issuer. Significant concentrations in security types, issuers, industries, sectors, and geographic locations may magnify the factors that affect a fund's performance.
As a shareholder, you incur two types of costs: (1) transaction costs, which may include sales charges (loads) on purchase payments or redemption proceeds, as applicable and (2) ongoing costs, which generally include management fees, distribution and/or service (12b-1) fees and other Fund expenses. This Example is intended to help you understand your ongoing costs (in dollars) of investing in a fund and to compare these costs with the ongoing costs of investing in other mutual funds.
| The actual expense Example is based on an investment of $1,000 invested at the beginning of the period and held for the entire period (November 4, 2022 to April 30, 2023). The hypothetical expense Example is based on an investment of $1,000 invested for the one-half year period (November 1, 2022 to April 30, 2023). |
Actual Expenses
The first line of the accompanying table provides information about actual account values and actual expenses. You may use the information in this line, together with the amount you invested, to estimate the expenses that you paid over the period. Simply divide your account value by $1,000.00 (for example, an $8,600 account value divided by $1,000.00 = 8.6), then multiply the result by the number in the first line for a class/Fund under the heading entitled "Expenses Paid During Period" to estimate the expenses you paid on your account during this period. If any fund is a shareholder of any underlying mutual funds or exchange-traded funds (ETFs) (the Underlying Funds), such fund indirectly bears its proportional share of the expenses of the Underlying Funds in addition to the direct expenses incurred presented in the table. These fees and expenses are not included in the annualized expense ratio used to calculate the expense estimate in the table below.
Hypothetical Example for Comparison Purposes
The second line of the accompanying table provides information about hypothetical account values and hypothetical expenses based on the actual expense ratio and an assumed rate of return of 5% per year before expenses, which is not the actual return. The hypothetical account values and expenses may not be used to estimate the actual ending account balance or expenses you paid for the period. You may use this information to compare the ongoing costs of investing in the Fund and other funds. To do so, compare this 5% hypothetical example with the 5% hypothetical examples that appear in the shareholder reports of the other funds. If any fund is a shareholder of any Underlying Funds, such fund indirectly bears its proportional share of the expenses of the Underlying Funds in addition to the direct expenses as presented in the table. These fees and expenses are not included in the annualized expense ratio used to calculate the expense estimate in the table below.
Please note that the expenses shown in the table are meant to highlight your ongoing costs only and do not reflect any transaction costs. Therefore, the second line of the table is useful in comparing ongoing costs only, and will not help you determine the relative total costs of owning different funds. In addition, if these transactional costs were included, your costs would have been higher.
| | | | | Annualized Expense Ratio- A | | Beginning Account Value | | Ending Account Value April 30, 2023 | | Expenses Paid During Period |
| | | | | | | | | | |
| Fidelity Series Select International Small Cap Fund | | | | .01% | | | | | | |
| Actual | | | | | | $ 1,000 | | $ 1,197.70 | | $ .05 C |
Hypothetical- B | | | | | | $ 1,000 | | $ 1,024.74 | | $ .05 D |
| |
A Annualized expense ratio reflects expenses net of applicable fee waivers.
B 5% return per year before expenses
C Actual expenses are equal to the annualized expense ratio, multiplied by the average account value over the period, multiplied by 178 / 365 (to reflect the period November 4, 2022 to April 30, 2023).
D Hypothetical expenses are equal to the annualized expense ratio, multiplied by the average account value over the period, multiplied by 181/365 (to reflect the one-half year period).
Board Approval of Investment Advisory Contracts and Management Fees
Fidelity Series Select International Small Cap Fund
At its July 2022 meeting, the Board of Trustees, including the Independent Trustees (together, the Board), voted to approve the management contract with Fidelity Management & Research Company LLC (FMR) and the sub-advisory agreements with affiliates of FMR (together, the Advisory Contracts) for the fund. FMR and the sub-advisers are collectively referred to herein as the Investment Advisers. The Board, assisted by the advice of fund counsel and Independent Trustees' counsel, considered a broad range of information.
Nature, Extent, and Quality of Services Provided . The Board considered staffing as it relates to the fund, including the backgrounds of investment personnel of Fidelity, and also considered the fund's investment objective, strategies, and related investment philosophy, and the purpose of Series funds generally. The Board considered the structure of the investment personnel compensation program, and whether this structure provides appropriate incentives to act in the best interests of the fund.
Resources Dedicated to Investment Management and Support Services . The Board and the Fund Oversight and Research Committees reviewed the general qualifications and capabilities of Fidelity's investment staff, including its size, education, experience, and resources, as well as Fidelity's approach to recruiting, training, managing, and compensating investment personnel. The Board noted the resources devoted to Fidelity's global investment organization and that Fidelity's analysts have extensive resources, tools and capabilities that allow them to conduct sophisticated quantitative and fundamental analysis, as well as credit analysis of issuers, counterparties and guarantors. Further, the Board considered that Fidelity's investment professionals have sufficient access to global information and data so as to provide competitive investment results over time, and that those professionals also have access to sophisticated tools that permit them to assess portfolio construction and risk and performance attribution characteristics continuously, as well as to transmit new information and research conclusions rapidly around the world. Additionally, in its deliberations, the Board considered Fidelity's trading, risk management, compliance, cybersecurity, and technology and operations capabilities and resources, which are integral parts of the investment management process.
Administrative Services . The Board considered the nature, extent, quality, and cost of advisory and administrative services to be performed by the Investment Advisers and their affiliates under the Advisory Contracts and under separate agreements covering transfer agency, pricing and bookkeeping, and securities lending services for the fund. The Board also considered the nature and extent of the supervision of third party service providers, principally custodians, subcustodians, and pricing vendors.
Investment Performance . The fund is a new fund and therefore had no historical performance for the Board to review at the time it approved the fund's Advisory Contracts. The Board considered the Investment Advisers' strength in fundamental, research-driven security selection, which the Board is familiar with through its supervision of other Fidelity funds. The Board also took into consideration the fact that it oversees funds managed by Fidelity that have similar or identical investment objectives and policies as the fund.
Based on its review, the Board concluded that the nature, extent, and quality of services to be provided to the fund under the Advisory Contracts should benefit the shareholders of the fund.
Competitiveness of Management Fee and Total Expense Ratio . The Board considered that the fund will not pay FMR a management fee for investment advisory services, but that FMR receives fees for providing services to funds that invest in the fund. In reviewing the Advisory Contracts, the Board also considered the projected total expense ratio of the fund. The Board noted that FMR or an affiliate undertakes to pay all operating expenses of the fund, with certain exceptions. The Board also noted that the fund pays its non-operating expenses, including brokerage commissions and fees and expenses associated with the fund's securities lending program, if applicable.
The Board also noted that FMR has contractually agreed to reimburse the fund to the extent that total operating expenses, with certain exceptions, as a percentage of its average net assets, exceed 0.013% through February 28, 2026.
Based on its review, the Board considered that the fund will not pay a management fee and concluded that the fund's projected total expense ratio was reasonable in light of the services that the fund and its shareholders will receive and the other factors considered.
Costs of the Services and Profitability . The fund is a new fund and therefore no revenue, cost, or profitability data was available for the Board to review in respect of the fund at the time it approved the Advisory Contracts. The Board also noted that the costs of the services provided by and the profits realized by Fidelity in connection with the operation of the fund are not relevant to approval of the Advisory Contracts because the fund pays no advisory fees and FMR bears all expenses of the fund, with certain exceptions. In connection with its future renewal of the fund's Advisory Contracts, the Board will consider Fidelity's profits in respect of all the Fidelity funds.
Economies of Scale . The Board concluded that because the fund will pay no advisory fees and FMR will bear all expenses of the fund, with certain limited exceptions, the realization of economies of scale was not a material factor in the Board's decision to approve the fund's Advisory Contracts.
Additional Information Requested by the Board . In order to develop fully the factual basis for consideration of the Advisory Contracts, the Board received information explaining that the fund is offered exclusively to other Fidelity funds and Fidelity managed 529 plans and collective investment trusts, which use the fund to gain exposure to a specific type of investment. The Board also noted that those Fidelity funds investing in the fund will benefit from investing in one centralized fund as the fund may deliver more uniform asset class performance and offer additional opportunities to generate returns and diversify the investing funds' small cap equity allocations.
Based on its evaluation of all of the conclusions noted above, and after considering all factors it believed relevant, the Board concluded that the advisory fee arrangements are fair and reasonable, and that the fund's Advisory Contracts should be approved.
The Securities and Exchange Commission adopted Rule 22e-4 under the Investment Company Act of 1940 (the Liquidity Rule) to promote effective liquidity risk management throughout the open-end investment company industry, thereby reducing the risk that funds will be unable to meet their redemption obligations and mitigating dilution of the interests of fund shareholders.
The Fund has adopted and implemented a liquidity risk management program (the Program) reasonably designed to assess and manage the Fund's liquidity risk and to comply with the requirements of the Liquidity Rule. The Fund's Board of Trustees (the Board) has designated the Fund's investment adviser as administrator of the Program. The Fidelity advisers have established a Liquidity Risk Management Committee (the LRM Committee) to manage the Program for each of the Fidelity Funds. The LRM Committee monitors the adequacy and effectiveness of implementation of the Program and on a periodic basis assesses each Fund's liquidity risk based on a variety of factors including (1) the Fund's investment strategy, (2) portfolio liquidity and cash flow projections during normal and reasonably foreseeable stressed conditions, (3) shareholder redemptions, (4) borrowings and other funding sources and (5) certain factors specific to ETFs including the effect of the Fund's prices and spreads, market participants, and basket compositions on the overall liquidity of the Fund's portfolio, as applicable.
In accordance with the Program, each of the Fund's portfolio investments is classified into one of four defined liquidity categories based on a determination of a reasonable expectation for how long it would take to convert the investment to cash (or sell or dispose of the investment) without significantly changing its market value.
- Highly liquid investments - cash or convertible to cash within three business days or less
- Moderately liquid investments - convertible to cash in three to seven calendar days
- Less liquid investments - can be sold or disposed of, but not settled, within seven calendar days
- Illiquid investments - cannot be sold or disposed of within seven calendar days
Liquidity classification determinations take into account a variety of factors including various market, trading and investment-specific considerations, as well as market depth, and generally utilize analysis from a third-party liquidity metrics service.
The Liquidity Rule places a 15% limit on a fund's illiquid investments and requires funds that do not primarily hold assets that are highly liquid investments to determine and maintain a minimum percentage of the fund's net assets to be invested in highly liquid investments (highly liquid investment minimum or HLIM). The Program includes provisions reasonably designed to comply with the 15% limit on illiquid investments and for determining, periodically reviewing and complying with the HLIM requirement as applicable.
At a recent meeting of the Fund's Board of Trustees, the LRM Committee provided a written report to the Board pertaining to the operation, adequacy, and effectiveness of the Program for the period December 1, 2021 through November 30, 2022. The report concluded that the Program is operating effectively and is reasonably designed to assess and manage the Fund's liquidity risk.
1.9906199.100
SSI-SANN-0623
Fidelity® Enduring Opportunities Fund
Semi-Annual Report
April 30, 2023
Contents
To view a fund's proxy voting guidelines and proxy voting record for the 12-month period ended June 30, visit http://www.fidelity.com/proxyvotingresults or visit the Securities and Exchange Commission's (SEC) web site at http://www.sec.gov.
You may also call 1-800-544-8544 to request a free copy of the proxy voting guidelines.
Standard & Poor's, S&P and S&P 500 are registered service marks of The McGraw-Hill Companies, Inc. and have been licensed for use by Fidelity Distributors Corporation.
Other third-party marks appearing herein are the property of their respective owners.
All other marks appearing herein are registered or unregistered trademarks or service marks of FMR LLC or an affiliated company. © 2023 FMR LLC. All rights reserved.
This report and the financial statements contained herein are submitted for the general information of the shareholders of the Fund. This report is not authorized for distribution to prospective investors in the Fund unless preceded or accompanied by an effective prospectus.
A fund files its complete schedule of portfolio holdings with the SEC for the first and third quarters of each fiscal year on Form N-PORT. Forms N-PORT are available on the SEC's web site at http://www.sec.gov. A fund's Forms N-PORT may be reviewed and copied at the SEC's Public Reference Room in Washington, DC. Information regarding the operation of the SEC's Public Reference Room may be obtained by calling 1-800-SEC-0330.
For a complete list of a fund's portfolio holdings, view the most recent holdings listing, semiannual report, or annual report on Fidelity's web site at http://www.fidelity.com, http://www.institutional.fidelity.com, or http://www.401k.com, as applicable.
NOT FDIC INSURED •MAY LOSE VALUE •NO BANK GUARANTEE
Neither the Fund nor Fidelity Distributors Corporation is a bank.
Top Holdings (% of Fund's net assets) |
| |
| Microsoft Corp. | 4.1 | |
| Amazon.com, Inc. | 1.9 | |
| Alphabet, Inc. Class A | 1.4 | |
| Alphabet, Inc. Class C | 1.4 | |
| Meta Platforms, Inc. Class A | 1.2 | |
| JPMorgan Chase & Co. | 1.1 | |
| UnitedHealth Group, Inc. | 1.0 | |
| Tesla, Inc. | 1.0 | |
| Taiwan Semiconductor Manufacturing Co. Ltd. | 0.9 | |
| The Home Depot, Inc. | 0.9 | |
| | 14.9 | |
| |
| Market Sectors (% of Fund's net assets) |
| |
| Information Technology | 19.9 | |
| Consumer Discretionary | 18.7 | |
| Industrials | 14.7 | |
| Financials | 11.5 | |
| Health Care | 9.1 | |
| Communication Services | 7.9 | |
| Consumer Staples | 6.7 | |
| Real Estate | 4.5 | |
| Materials | 4.1 | |
| Energy | 1.8 | |
| Utilities | 1.0 | |
| |
Asset Allocation (% of Fund's net assets) |
|
|
Geographic Diversification (% of Fund's net assets) |
|
* Includes Short-Term investments and Net Other Assets (Liabilities). Percentages are adjusted for the effect of derivatives, if applicable. |
| |
Showing Percentage of Net Assets
| Common Stocks - 99.7% |
| | | Shares | Value ($) |
| COMMUNICATION SERVICES - 7.9% | | | |
| Entertainment - 1.7% | | | |
| Netflix, Inc. (a) | | 234 | 77,204 |
| Sea Ltd. ADR (a) | | 288 | 21,937 |
| The Walt Disney Co. (a) | | 713 | 73,083 |
| Universal Music Group NV | | 1,045 | 22,811 |
| | | | 195,035 |
| Interactive Media & Services - 5.9% | | | |
| Adevinta ASA Class B (a) | | 2,741 | 21,090 |
| Alphabet, Inc.: | | | |
| Class A (a) | | 1,533 | 164,552 |
| Class C (a) | | 1,501 | 162,438 |
| Hemnet Group AB | | 1,213 | 19,872 |
| Kakao Corp. | | 398 | 17,435 |
| Match Group, Inc. (a) | | 954 | 35,203 |
| Meta Platforms, Inc. Class A (a) | | 621 | 149,239 |
| NAVER Corp. | | 163 | 23,624 |
| Rightmove PLC | | 2,316 | 16,713 |
| Tencent Holdings Ltd. | | 1,540 | 68,401 |
| Z Holdings Corp. | | 7,791 | 21,341 |
| | | | 699,908 |
| Media - 0.3% | | | |
| S4 Capital PLC (a) | | 11,328 | 20,814 |
| Schibsted ASA (A Shares) | | 957 | 16,954 |
| | | | 37,768 |
TOTAL COMMUNICATION SERVICES | | | 932,711 |
| CONSUMER DISCRETIONARY - 18.7% | | | |
| Automobile Components - 0.6% | | | |
| Aptiv PLC (a) | | 330 | 33,944 |
| DENSO Corp. | | 514 | 31,027 |
| | | | 64,971 |
| Automobiles - 2.0% | | | |
| Ferrari NV (Italy) | | 140 | 38,921 |
| Maruti Suzuki India Ltd. | | 287 | 30,259 |
| Tesla, Inc. (a) | | 715 | 117,482 |
| Toyota Motor Corp. | | 3,473 | 47,684 |
| | | | 234,346 |
| Broadline Retail - 2.8% | | | |
| Amazon.com, Inc. (a) | | 2,101 | 221,550 |
| B&M European Value Retail SA | | 4,042 | 24,368 |
| Dollarama, Inc. | | 393 | 24,343 |
| MercadoLibre, Inc. (a) | | 28 | 35,770 |
| Prosus NV | | 295 | 22,100 |
| | | | 328,131 |
| Hotels, Restaurants & Leisure - 4.4% | | | |
| Amadeus IT Holding SA Class A (a) | | 495 | 34,791 |
| Chipotle Mexican Grill, Inc. (a) | | 29 | 59,961 |
| Churchill Downs, Inc. | | 200 | 58,506 |
| Compass Group PLC | | 1,201 | 31,684 |
| Domino's Pizza, Inc. | | 99 | 31,430 |
| Doordash, Inc. (a) | | 544 | 33,287 |
| Hilton Worldwide Holdings, Inc. | | 352 | 50,695 |
| Jubilant Foodworks Ltd. | | 4,048 | 22,224 |
| Oriental Land Co. Ltd. | | 970 | 34,328 |
| Restaurant Brands Asia Ltd. (a) | | 12,252 | 15,373 |
| Vail Resorts, Inc. | | 136 | 32,711 |
| Wingstop, Inc. | | 238 | 47,626 |
| Yum! Brands, Inc. | | 320 | 44,986 |
| Zomato Ltd. (a) | | 32,462 | 25,986 |
| | | | 523,588 |
| Household Durables - 0.8% | | | |
| Berkeley Group Holdings PLC | | 397 | 22,187 |
| Maytronics Ltd. | | 1,154 | 12,054 |
| NVR, Inc. (a) | | 10 | 58,400 |
| | | | 92,641 |
| Leisure Products - 0.3% | | | |
| Roland Corp. | | 647 | 19,394 |
| SHIMANO, Inc. | | 129 | 19,950 |
| | | | 39,344 |
| Specialty Retail - 4.6% | | | |
| Carvana Co. Class A (a) | | 893 | 6,197 |
| Fast Retailing Co. Ltd. | | 141 | 33,389 |
| Five Below, Inc. (a) | | 217 | 42,827 |
| Floor & Decor Holdings, Inc. Class A (a) | | 418 | 41,524 |
| Lowe's Companies, Inc. | | 323 | 67,129 |
| National Vision Holdings, Inc. (a) | | 744 | 15,654 |
| Nitori Holdings Co. Ltd. | | 184 | 23,430 |
| The Home Depot, Inc. | | 354 | 106,391 |
| TJX Companies, Inc. | | 625 | 49,263 |
| Ulta Beauty, Inc. (a) | | 102 | 56,246 |
| Warby Parker, Inc. (a) | | 2,569 | 27,052 |
| Wayfair LLC Class A (a) | | 635 | 22,117 |
| WH Smith PLC | | 1,154 | 22,828 |
| Workman Co. Ltd. | | 350 | 14,258 |
| ZOZO, Inc. | | 833 | 17,530 |
| | | | 545,835 |
| Textiles, Apparel & Luxury Goods - 3.2% | | | |
| adidas AG | | 108 | 19,019 |
| Hermes International SCA | | 24 | 52,013 |
| lululemon athletica, Inc. (a) | | 192 | 72,947 |
| LVMH Moet Hennessy Louis Vuitton SE | | 84 | 80,798 |
| Moncler SpA | | 534 | 39,518 |
| NIKE, Inc. Class B | | 504 | 63,867 |
| PVH Corp. | | 349 | 29,948 |
| Shenzhou International Group Holdings Ltd. | | 1,715 | 16,473 |
| | | | 374,583 |
TOTAL CONSUMER DISCRETIONARY | | | 2,203,439 |
| CONSUMER STAPLES - 6.7% | | | |
| Beverages - 1.5% | | | |
| Ambev SA | | 9,683 | 27,489 |
| Davide Campari Milano NV | | 2,576 | 33,154 |
| Kweichow Moutai Co. Ltd. (A Shares) | | 115 | 29,343 |
| Monster Beverage Corp. | | 824 | 46,144 |
| Pernod Ricard SA | | 166 | 38,302 |
| | | | 174,432 |
| Consumer Staples Distribution & Retail - 3.6% | | | |
| Alimentation Couche-Tard, Inc. Class A (multi-vtg.) | | 709 | 35,386 |
| Avenue Supermarts Ltd. (a)(b) | | 498 | 21,472 |
| Casey's General Stores, Inc. | | 168 | 38,442 |
| Clicks Group Ltd. | | 1,582 | 23,121 |
| Cosmos Pharmaceutical Corp. | | 150 | 14,753 |
| Costco Wholesale Corp. | | 174 | 87,560 |
| Ocado Group PLC (a) | | 3,534 | 22,438 |
| Target Corp. | | 237 | 37,387 |
| Wal-Mart de Mexico SA de CV Series V | | 8,515 | 34,331 |
| Walmart, Inc. | | 619 | 93,450 |
| Welcia Holdings Co. Ltd. | | 782 | 16,373 |
| | | | 424,713 |
| Food Products - 0.6% | | | |
| Freshpet, Inc. (a) | | 481 | 33,175 |
| McCormick & Co., Inc. (non-vtg.) | | 398 | 34,964 |
| | | | 68,139 |
| Household Products - 0.2% | | | |
| Unicharm Corp. | | 664 | 26,806 |
| Personal Care Products - 0.8% | | | |
| Hindustan Unilever Ltd. | | 887 | 26,727 |
| L'Oreal SA | | 100 | 47,685 |
| Shiseido Co. Ltd. | | 471 | 23,609 |
| | | | 98,021 |
TOTAL CONSUMER STAPLES | | | 792,111 |
| ENERGY - 1.8% | | | |
| Oil, Gas & Consumable Fuels - 1.8% | | | |
| Cheniere Energy, Inc. | | 268 | 41,004 |
| Hess Corp. | | 465 | 67,453 |
| Parkland Corp. | | 761 | 17,946 |
| PrairieSky Royalty Ltd. | | 3,064 | 48,351 |
| Reliance Industries Ltd. | | 1,258 | 37,398 |
| | | | 212,152 |
| FINANCIALS - 11.5% | | | |
| Banks - 3.0% | | | |
| Bank of America Corp. | | 2,519 | 73,756 |
| Credicorp Ltd. (United States) | | 253 | 34,276 |
| FinecoBank SpA | | 1,536 | 23,238 |
| JPMorgan Chase & Co. | | 948 | 131,052 |
| KBC Group NV | | 413 | 29,480 |
| PNC Financial Services Group, Inc. | | 278 | 36,210 |
| PT Bank Central Asia Tbk | | 53,101 | 32,862 |
| SVB Financial Group (a) | | 145 | 71 |
| | | | 360,945 |
| Capital Markets - 3.9% | | | |
| Avanza Bank Holding AB | | 742 | 15,752 |
| Banca Generali SpA | | 585 | 19,396 |
| Bolsa Mexicana de Valores S.A.B. de CV | | 13,232 | 29,254 |
| Brookfield Corp. (Canada) Class A | | 823 | 26,703 |
| Charles Schwab Corp. | | 822 | 42,941 |
| CME Group, Inc. | | 215 | 39,941 |
| HUB24 Ltd. | | 1,140 | 21,556 |
| Moody's Corp. | | 124 | 38,827 |
| Morningstar, Inc. | | 153 | 27,281 |
| MSCI, Inc. | | 88 | 42,456 |
| Netwealth Group Ltd. | | 1,886 | 17,138 |
| Nordnet AB | | 1,221 | 19,145 |
| Partners Group Holding AG | | 19 | 18,348 |
| S&P Global, Inc. | | 155 | 56,200 |
| St. James's Place PLC | | 1,319 | 20,000 |
| VZ Holding AG | | 239 | 22,193 |
| | | | 457,131 |
| Consumer Finance - 0.2% | | | |
| Bajaj Finance Ltd. | | 341 | 26,330 |
| Financial Services - 1.7% | | | |
| Adyen BV (a)(b) | | 18 | 28,923 |
| Block, Inc. Class A (a) | | 531 | 32,279 |
| Edenred SA | | 403 | 26,164 |
| Fiserv, Inc. (a) | | 431 | 52,634 |
| Toast, Inc. (a) | | 1,925 | 35,035 |
| Zenkoku Hosho Co. Ltd. | | 657 | 24,147 |
| | | | 199,182 |
| Insurance - 2.7% | | | |
| Arthur J. Gallagher & Co. | | 291 | 60,545 |
| Assurant, Inc. | | 240 | 29,551 |
| Chubb Ltd. | | 384 | 77,399 |
| Globe Life, Inc. | | 312 | 33,858 |
| Hannover Reuck SE | | 142 | 30,293 |
| Lifenet Insurance Co. (a) | | 2,965 | 25,841 |
| Qualitas Controladora S.A.B. de CV | | 5,435 | 35,927 |
| Steadfast Group Ltd. | | 5,820 | 22,945 |
| | | | 316,359 |
TOTAL FINANCIALS | | | 1,359,947 |
| HEALTH CARE - 8.9% | | | |
| Biotechnology - 0.4% | | | |
| Repligen Corp. (a) | | 159 | 24,109 |
| Zai Lab Ltd. (a) | | 4,853 | 16,991 |
| | | | 41,100 |
| Health Care Equipment & Supplies - 4.2% | | | |
| Align Technology, Inc. (a) | | 132 | 42,940 |
| Boston Scientific Corp. (a) | | 1,090 | 56,811 |
| Coloplast A/S Series B | | 165 | 23,733 |
| Fisher & Paykel Healthcare Corp. | | 1,258 | 21,578 |
| Hoya Corp. | | 275 | 28,835 |
| IDEXX Laboratories, Inc. (a) | | 83 | 40,849 |
| Inspire Medical Systems, Inc. (a) | | 162 | 43,356 |
| Intuitive Surgical, Inc. (a) | | 172 | 51,810 |
| Masimo Corp. (a) | | 255 | 48,231 |
| ResMed, Inc. | | 177 | 42,650 |
| Shenzhen Mindray Bio-Medical Electronics Co. Ltd. (A Shares) | | 486 | 21,972 |
| Straumann Holding AG | | 192 | 28,887 |
| The Cooper Companies, Inc. | | 113 | 43,104 |
| | | | 494,756 |
| Health Care Providers & Services - 2.1% | | | |
| Apollo Hospitals Enterprise Ltd. | | 437 | 24,216 |
| Chemed Corp. | | 82 | 45,203 |
| Humana, Inc. | | 106 | 56,232 |
| UnitedHealth Group, Inc. | | 253 | 124,499 |
| | | | 250,150 |
| Health Care Technology - 0.3% | | | |
| Veeva Systems, Inc. Class A (a) | | 159 | 28,474 |
| Life Sciences Tools & Services - 1.7% | | | |
| 10X Genomics, Inc. (a) | | 568 | 29,780 |
| Danaher Corp. | | 243 | 57,569 |
| Lonza Group AG | | 47 | 29,311 |
| Sartorius Stedim Biotech | | 66 | 17,636 |
| West Pharmaceutical Services, Inc. | | 135 | 48,767 |
| Wuxi Biologics (Cayman), Inc. (a)(b) | | 3,155 | 18,813 |
| | | | 201,876 |
| Pharmaceuticals - 0.2% | | | |
| Jiangsu Hengrui Medicine Co. Ltd. (A Shares) | | 3,959 | 27,917 |
TOTAL HEALTH CARE | | | 1,044,273 |
| INDUSTRIALS - 14.7% | | | |
| Aerospace & Defense - 1.0% | | | |
| HEICO Corp. | | 225 | 37,944 |
| INVISIO AB | | 1,159 | 23,790 |
| Northrop Grumman Corp. | | 115 | 53,046 |
| | | | 114,780 |
| Air Freight & Logistics - 1.5% | | | |
| C.H. Robinson Worldwide, Inc. | | 441 | 44,484 |
| Deutsche Post AG | | 723 | 34,776 |
| DSV A/S | | 145 | 27,234 |
| Expeditors International of Washington, Inc. | | 336 | 38,250 |
| ZTO Express, Inc. sponsored ADR | | 919 | 25,438 |
| | | | 170,182 |
| Building Products - 0.8% | | | |
| ASSA ABLOY AB (B Shares) | | 1,245 | 29,610 |
| Belimo Holding AG (Reg.) | | 49 | 23,561 |
| Carel Industries SpA (b) | | 722 | 18,935 |
| Kingspan Group PLC (Ireland) | | 315 | 21,763 |
| | | | 93,869 |
| Commercial Services & Supplies - 1.6% | | | |
| Casella Waste Systems, Inc. Class A (a) | | 452 | 40,228 |
| Cintas Corp. | | 84 | 38,285 |
| Copart, Inc. (a) | | 620 | 49,011 |
| GFL Environmental, Inc. | | 625 | 22,701 |
| Sunny Friend Environmental Technology Co. Ltd. | | 3,528 | 18,216 |
| Waste Connections, Inc. (Canada) | | 135 | 18,779 |
| | | | 187,220 |
| Construction & Engineering - 0.2% | | | |
| Sweco AB (B Shares) | | 1,610 | 21,540 |
| Electrical Equipment - 1.1% | | | |
| AMETEK, Inc. | | 291 | 40,138 |
| Eaton Corp. PLC | | 272 | 45,457 |
| Generac Holdings, Inc. (a) | | 308 | 31,484 |
| Nidec Corp. | | 346 | 17,121 |
| | | | 134,200 |
| Ground Transportation - 0.8% | | | |
| Localiza Rent a Car SA | | 2,219 | 25,808 |
| Localiza Rent a Car SA rights 5/11/23 (a) | | 9 | 31 |
| Old Dominion Freight Lines, Inc. | | 157 | 50,301 |
| Vamos Locacao de Caminhoes Maquinas e Equipamentos SA | | 7,033 | 17,231 |
| | | | 93,371 |
| Industrial Conglomerates - 0.5% | | | |
| Honeywell International, Inc. | | 296 | 59,153 |
| Machinery - 3.1% | | | |
| Atlas Copco AB (A Shares) | | 2,289 | 33,057 |
| Fortive Corp. | | 572 | 36,087 |
| Haitian International Holdings Ltd. | | 8,136 | 21,140 |
| IDEX Corp. | | 173 | 35,693 |
| Indutrade AB | | 942 | 22,569 |
| Kone OYJ (B Shares) | | 371 | 21,135 |
| Minebea Mitsumi, Inc. | | 935 | 17,315 |
| Misumi Group, Inc. | | 855 | 21,569 |
| Miura Co. Ltd. | | 820 | 21,843 |
| Rational AG | | 22 | 15,878 |
| Schindler Holding AG (participation certificate) | | 87 | 19,340 |
| Shenzhen Inovance Technology Co. Ltd. (A Shares) | | 3,302 | 29,576 |
| SMC Corp. | | 48 | 23,940 |
| Spirax-Sarco Engineering PLC | | 136 | 18,955 |
| Tocalo Co. Ltd. | | 1,606 | 15,082 |
| Zhejiang Sanhua Intelligent Controls Co. Ltd. (A Shares) | | 4,467 | 15,115 |
| | | | 368,294 |
| Marine Transportation - 0.1% | | | |
| SITC International Holdings Co. Ltd. | | 8,782 | 16,244 |
| Passenger Airlines - 0.2% | | | |
| Ryanair Holdings PLC sponsored ADR (a) | | 221 | 21,125 |
| Professional Services - 3.1% | | | |
| BayCurrent Consulting, Inc. | | 540 | 18,770 |
| Centre Testing International Group Co. Ltd. (A Shares) | | 4,438 | 12,382 |
| CoStar Group, Inc. (a) | | 519 | 39,937 |
| Equifax, Inc. | | 197 | 41,051 |
| Experian PLC | | 870 | 30,802 |
| Funai Soken Holdings, Inc. | | 852 | 16,332 |
| Headhunter Group PLC ADR (a)(c) | | 622 | 1,693 |
| Recruit Holdings Co. Ltd. | | 866 | 24,294 |
| RELX PLC (London Stock Exchange) | | 1,230 | 40,902 |
| Sporton International, Inc. | | 3,374 | 29,080 |
| Thomson Reuters Corp. | | 242 | 31,823 |
| TriNet Group, Inc. (a) | | 427 | 39,617 |
| Verisk Analytics, Inc. | | 201 | 39,016 |
| | | | 365,699 |
| Trading Companies & Distributors - 0.7% | | | |
| AddTech AB (B Shares) | | 1,555 | 31,085 |
| Ashtead Group PLC | | 481 | 27,668 |
| IMCD NV | | 158 | 23,712 |
| | | | 82,465 |
TOTAL INDUSTRIALS | | | 1,728,142 |
| INFORMATION TECHNOLOGY - 19.9% | | | |
| Electronic Equipment, Instruments & Components - 2.4% | | | |
| Amphenol Corp. Class A | | 556 | 41,961 |
| Azbil Corp. | | 666 | 18,626 |
| CDW Corp. | | 229 | 38,836 |
| Cognex Corp. | | 604 | 28,805 |
| Keyence Corp. | | 84 | 37,880 |
| Lagercrantz Group AB (B Shares) | | 2,284 | 29,354 |
| Murata Manufacturing Co. Ltd. | | 476 | 27,006 |
| Sunny Optical Technology Group Co. Ltd. | | 2,000 | 21,135 |
| Teledyne Technologies, Inc. (a) | | 90 | 37,296 |
| | | | 280,899 |
| IT Services - 1.8% | | | |
| Cloudflare, Inc. (a) | | 615 | 28,936 |
| FDM Group Holdings PLC | | 1,642 | 13,888 |
| Kainos Group PLC | | 981 | 15,288 |
| Nagarro SE (a) | | 139 | 14,903 |
| Reply SpA | | 122 | 14,183 |
| SHIFT, Inc. (a) | | 109 | 20,292 |
| Shopify, Inc. Class A (a) | | 364 | 17,636 |
| Softcat PLC | | 1,075 | 18,063 |
| Twilio, Inc. Class A (a) | | 520 | 27,357 |
| VeriSign, Inc. (a) | | 196 | 43,473 |
| | | | 214,019 |
| Semiconductors & Semiconductor Equipment - 4.2% | | | |
| ASM International NV (Netherlands) | | 85 | 30,726 |
| ASML Holding NV (Netherlands) | | 112 | 70,777 |
| BE Semiconductor Industries NV | | 276 | 24,737 |
| Disco Corp. | | 303 | 34,498 |
| eMemory Technology, Inc. | | 518 | 30,951 |
| Monolithic Power Systems, Inc. | | 91 | 42,039 |
| Silergy Corp. | | 930 | 14,669 |
| Silicon Laboratories, Inc. (a) | | 339 | 47,223 |
| Taiwan Semiconductor Manufacturing Co. Ltd. | | 6,524 | 106,760 |
| Teradyne, Inc. | | 357 | 32,623 |
| Tokyo Electron Ltd. | | 279 | 31,947 |
| Universal Display Corp. | | 193 | 25,758 |
| | | | 492,708 |
| Software - 11.2% | | | |
| Adobe, Inc. (a) | | 189 | 71,359 |
| ANSYS, Inc. (a) | | 124 | 38,926 |
| Atlassian Corp. PLC (a) | | 143 | 21,115 |
| ATOSS Software AG | | 139 | 27,815 |
| Bill Holdings, Inc. (a) | | 435 | 33,412 |
| Black Knight, Inc. (a) | | 545 | 29,779 |
| Ceridian HCM Holding, Inc. (a) | | 601 | 38,151 |
| Confluent, Inc. (a) | | 1,110 | 24,420 |
| Constellation Software, Inc. | | 17 | 33,274 |
| Dassault Systemes SA | | 756 | 30,547 |
| Fortnox AB | | 3,520 | 24,206 |
| HubSpot, Inc. (a) | | 101 | 42,516 |
| Microsoft Corp. | | 1,577 | 484,539 |
| Money Forward, Inc. (a) | | 614 | 25,570 |
| Paycom Software, Inc. (a) | | 116 | 33,683 |
| Procore Technologies, Inc. (a) | | 611 | 32,634 |
| Roper Technologies, Inc. | | 89 | 40,475 |
| Salesforce, Inc. (a) | | 382 | 75,777 |
| SAP SE | | 349 | 47,225 |
| ServiceNow, Inc. (a) | | 91 | 41,807 |
| Synopsys, Inc. (a) | | 149 | 55,327 |
| Topicus.Com, Inc. (a) | | 266 | 17,719 |
| Workday, Inc. Class A (a) | | 187 | 34,808 |
| Xero Ltd. (a) | | 304 | 18,977 |
| | | | 1,324,061 |
| Technology Hardware, Storage & Peripherals - 0.3% | | | |
| Seagate Technology Holdings PLC | | 616 | 36,202 |
TOTAL INFORMATION TECHNOLOGY | | | 2,347,889 |
| MATERIALS - 4.1% | | | |
| Chemicals - 2.6% | | | |
| Air Products & Chemicals, Inc. | | 155 | 45,626 |
| Asian Paints Ltd. | | 663 | 23,620 |
| Ecolab, Inc. | | 229 | 38,435 |
| Givaudan SA | | 8 | 27,942 |
| Linde PLC | | 167 | 61,698 |
| NOF Corp. | | 431 | 19,693 |
| Shin-Etsu Chemical Co. Ltd. | | 1,125 | 32,103 |
| Sika AG | | 124 | 34,252 |
| Symrise AG | | 185 | 22,352 |
| | | | 305,721 |
| Construction Materials - 0.7% | | | |
| Martin Marietta Materials, Inc. | | 120 | 43,584 |
| Vulcan Materials Co. | | 247 | 43,255 |
| | | | 86,839 |
| Metals & Mining - 0.8% | | | |
| First Quantum Minerals Ltd. | | 931 | 22,621 |
| Freeport-McMoRan, Inc. | | 1,162 | 44,051 |
| Press Metal Aluminium Holdings | | 19,537 | 22,639 |
| | | | 89,311 |
TOTAL MATERIALS | | | 481,871 |
| REAL ESTATE - 4.5% | | | |
| Equity Real Estate Investment Trusts (REITs) - 3.3% | | | |
| American Tower Corp. | | 268 | 54,777 |
| ARGAN SA | | 181 | 14,121 |
| Big Yellow Group PLC | | 1,115 | 17,152 |
| Embassy Office Parks (REIT) | | 6,240 | 25,183 |
| Equinix, Inc. | | 65 | 47,065 |
| Equity Lifestyle Properties, Inc. | | 535 | 36,862 |
| Extra Space Storage, Inc. | | 218 | 33,145 |
| National Storage REIT unit | | 16,314 | 27,172 |
| Prologis (REIT), Inc. | | 406 | 50,852 |
| Safestore Holdings PLC | | 1,505 | 18,734 |
| Segro PLC | | 1,591 | 16,692 |
| Sun Communities, Inc. | | 247 | 34,316 |
| Warehouses de Pauw | | 525 | 15,689 |
| Warehouses de Pauw rights 5/12/23 (a)(d) | | 525 | 579 |
| | | | 392,339 |
| Real Estate Management & Development - 1.2% | | | |
| Ayala Land, Inc. | | 36,338 | 17,532 |
| CBRE Group, Inc. (a) | | 454 | 34,804 |
| Colliers International Group, Inc. | | 176 | 18,717 |
| Grainger Trust PLC | | 6,552 | 21,294 |
| Katitas Co. Ltd. | | 926 | 18,084 |
| Oberoi Realty Ltd. | | 2,683 | 30,146 |
| | | | 140,577 |
TOTAL REAL ESTATE | | | 532,916 |
| UTILITIES - 1.0% | | | |
| Electric Utilities - 0.9% | | | |
| Constellation Energy Corp. | | 439 | 33,979 |
| NextEra Energy, Inc. | | 875 | 67,051 |
| | | | 101,030 |
| Gas Utilities - 0.1% | | | |
| Nippon Gas Co. Ltd. | | 1,244 | 17,494 |
TOTAL UTILITIES | | | 118,524 |
| TOTAL COMMON STOCKS (Cost $10,446,363) | | | 11,753,975 |
| | | | |
| Nonconvertible Preferred Stocks - 0.2% |
| | | Shares | Value ($) |
| HEALTH CARE - 0.2% | | | |
| Life Sciences Tools & Services - 0.2% | | | |
Sartorius AG (non-vtg.) (Cost $13,707) | | 63 | 24,408 |
| | | | |
| Money Market Funds - 0.2% |
| | | Shares | Value ($) |
Fidelity Cash Central Fund 4.88% (e) (Cost $20,542) | | 20,538 | 20,542 |
| | | | |
| TOTAL INVESTMENT IN SECURITIES - 100.1% (Cost $10,480,612) | 11,798,925 |
NET OTHER ASSETS (LIABILITIES) - (0.1)% | (11,524) |
| NET ASSETS - 100.0% | 11,787,401 |
| | |
Legend
| (b) | Security exempt from registration under Rule 144A of the Securities Act of 1933. These securities may be resold in transactions exempt from registration, normally to qualified institutional buyers. At the end of the period, the value of these securities amounted to $88,143 or 0.7% of net assets. |
| (d) | Security or a portion of the security purchased on a delayed delivery or when-issued basis. |
| (e) | Affiliated fund that is generally available only to investment companies and other accounts managed by Fidelity Investments. The rate quoted is the annualized seven-day yield of the fund at period end. A complete unaudited listing of the fund's holdings as of its most recent quarter end is available upon request. In addition, each Fidelity Central Fund's financial statements are available on the SEC's website or upon request. |
Affiliated Central Funds
Fiscal year to date information regarding the Fund's investments in Fidelity Central Funds, including the ownership percentage, is presented below.
| Affiliate | Value, beginning of period ($) | Purchases ($) | Sales Proceeds ($) | Dividend Income ($) | Realized Gain (loss) ($) | Change in Unrealized appreciation (depreciation) ($) | Value, end of period ($) | % ownership, end of period |
| Fidelity Cash Central Fund 4.88% | - | 919,038 | 898,496 | 2,315 | - | - | 20,542 | 0.0% |
| Total | - | 919,038 | 898,496 | 2,315 | - | - | 20,542 | |
| | | | | | | | | |
Amounts in the dividend income column in the above table include any capital gain distributions from underlying funds, which are presented in the corresponding line item in the Statement of Operations, if applicable.
Amounts included in the purchases and sales proceeds columns may include in-kind transactions, if applicable.
Investment Valuation
The following is a summary of the inputs used, as of April 30, 2023, involving the Fund's assets and liabilities carried at fair value. The inputs or methodology used for valuing securities may not be an indication of the risk associated with investing in those securities. For more information on valuation inputs, and their aggregation into the levels used below, please refer to the Investment Valuation section in the accompanying Notes to Financial Statements.
| Valuation Inputs at Reporting Date: |
| Description | Total ($) | Level 1 ($) | Level 2 ($) | Level 3 ($) |
Investments in Securities: | | | | |
|
| Equities: | | | | |
Communication Services | 932,711 | 801,910 | 130,801 | - |
Consumer Discretionary | 2,203,439 | 1,685,842 | 517,597 | - |
Consumer Staples | 792,111 | 633,028 | 159,083 | - |
Energy | 212,152 | 174,754 | 37,398 | - |
Financials | 1,359,947 | 1,160,205 | 199,742 | - |
Health Care | 1,068,681 | 850,161 | 218,520 | - |
Industrials | 1,728,142 | 1,342,852 | 383,597 | 1,693 |
Information Technology | 2,347,889 | 1,912,353 | 435,536 | - |
Materials | 481,871 | 327,212 | 154,659 | - |
Real Estate | 532,916 | 414,220 | 118,696 | - |
Utilities | 118,524 | 101,030 | 17,494 | - |
|
| Money Market Funds | 20,542 | 20,542 | - | - |
| Total Investments in Securities: | 11,798,925 | 9,424,109 | 2,373,123 | 1,693 |
| Statement of Assets and Liabilities |
| | | | April 30, 2023 (Unaudited) |
| | | | | |
| Assets | | | | |
| Investment in securities, at value - See accompanying schedule: | | | | |
Unaffiliated issuers (cost $10,460,070) | $ | 11,778,383 | | |
Fidelity Central Funds (cost $20,542) | | 20,542 | | |
| | | | | |
| | | | | |
| Total Investment in Securities (cost $10,480,612) | | | $ | 11,798,925 |
| Cash | | | | 981 |
| Foreign currency held at value (cost $1,193) | | | | 1,195 |
| Receivable for fund shares sold | | | | 1,899 |
| Dividends receivable | | | | 17,278 |
| Distributions receivable from Fidelity Central Funds | | | | 202 |
| Prepaid expenses | | | | 5 |
| Receivable from investment adviser for expense reductions | | | | 1,629 |
Total assets | | | | 11,822,114 |
| Liabilities | | | | |
| Payable for investments purchased on a delayed delivery basis | $ | 579 | | |
| Payable for fund shares redeemed | | 3,794 | | |
| Accrued management fee | | 3,252 | | |
| Transfer agent fee payable | | 2,539 | | |
| Other affiliated payables | | 349 | | |
| Audit fee payable | | 18,744 | | |
| Custody fee payable | | 3,798 | | |
| Other payables and accrued expenses | | 1,658 | | |
| Total Liabilities | | | | 34,713 |
| Net Assets | | | $ | 11,787,401 |
| Net Assets consist of: | | | | |
| Paid in capital | | | $ | 11,558,809 |
| Total accumulated earnings (loss) | | | | 228,592 |
| Net Assets | | | $ | 11,787,401 |
Net Asset Value , offering price and redemption price per share ($11,787,401 ÷ 948,073 shares) | | | $ | 12.43 |
| Statement of Operations |
| | | | Six months ended April 30, 2023 (Unaudited) |
| Investment Income | | | | |
| Dividends | | | $ | 72,586 |
| Non-Cash dividends | | | | 4,422 |
| Income from Fidelity Central Funds | | | | 2,315 |
| Income before foreign taxes withheld | | | $ | 79,323 |
| Less foreign taxes withheld | | | | (7,203) |
| Total Income | | | | 72,120 |
| Expenses | | | | |
| Management fee | | | | |
| Basic fee | $ | 33,973 | | |
| Performance adjustment | | (7,136) | | |
| Transfer agent fees | | 15,202 | | |
| Accounting fees and expenses | | 2,087 | | |
| Custodian fees and expenses | | 7,962 | | |
| Independent trustees' fees and expenses | | 42 | | |
| Registration fees | | 5,619 | | |
| Audit | | 33,683 | | |
| Legal | | 9 | | |
| Miscellaneous | | 28 | | |
| Total expenses before reductions | | 91,469 | | |
| Expense reductions | | (35,829) | | |
| Total expenses after reductions | | | | 55,640 |
| Net Investment income (loss) | | | | 16,480 |
| Realized and Unrealized Gain (Loss) | | | | |
| Net realized gain (loss) on: | | | | |
| Investment Securities: | | | | |
| Unaffiliated issuers (net of foreign taxes of $331) | | (69,902) | | |
| Foreign currency transactions | | 1,021 | | |
| Total net realized gain (loss) | | | | (68,881) |
| Change in net unrealized appreciation (depreciation) on: | | | | |
| Investment Securities: | | | | |
| Unaffiliated issuers (net of decrease in deferred foreign taxes of $3,718) | | 1,521,122 | | |
| Assets and liabilities in foreign currencies | | 342 | | |
| Total change in net unrealized appreciation (depreciation) | | | | 1,521,464 |
| Net gain (loss) | | | | 1,452,583 |
| Net increase (decrease) in net assets resulting from operations | | | $ | 1,469,063 |
| Statement of Changes in Net Assets |
| |
| | Six months ended April 30, 2023 (Unaudited) | | Year ended October 31, 2022 |
| Increase (Decrease) in Net Assets | | | | |
| Operations | | | | |
| Net investment income (loss) | $ | 16,480 | $ | 8,806 |
| Net realized gain (loss) | | (68,881) | | (933,940) |
| Change in net unrealized appreciation (depreciation) | | 1,521,464 | | (6,033,124) |
| Net increase (decrease) in net assets resulting from operations | | 1,469,063 | | (6,958,258) |
| Distributions to shareholders | | - | | (572,700) |
| Share transactions | | | | |
| Proceeds from sales of shares | | 730,074 | | 3,817,785 |
| Reinvestment of distributions | | - | | 537,633 |
| Cost of shares redeemed | | (1,619,918) | | (7,108,348) |
Net increase (decrease) in net assets resulting from share transactions | | (889,844) | | (2,752,930) |
| Total increase (decrease) in net assets | | 579,219 | | (10,283,888) |
| | | | | |
| Net Assets | | | | |
| Beginning of period | | 11,208,182 | | 21,492,070 |
| End of period | $ | 11,787,401 | $ | 11,208,182 |
| | | | | |
| Other Information | | | | |
| Shares | | | | |
| Sold | | 60,940 | | 278,587 |
| Issued in reinvestment of distributions | | - | | 33,571 |
| Redeemed | | (137,348) | | (575,644) |
| Net increase (decrease) | | (76,408) | | (263,486) |
| | | | | |
Financial Highlights
| Fidelity® Enduring Opportunities Fund |
| |
| | Six months ended (Unaudited) April 30, 2023 | | Years ended October 31, 2022 | | 2021 | | 2020 A |
Selected Per-Share Data | | | | | | | | |
| Net asset value, beginning of period | $ | 10.94 | $ | 16.69 | $ | 11.91 | $ | 10.00 |
| Income from Investment Operations | | | | | | | | |
Net investment income (loss) B,C | | .02 | | .01 | | (.04) | | (.01) |
| Net realized and unrealized gain (loss) | | 1.47 | | (5.32) | | 4.82 | | 1.93 |
| Total from investment operations | | 1.49 | | (5.31) | | 4.78 | | 1.92 |
| Distributions from net investment income | | - | | (.03) | | - | | - D |
| Distributions from net realized gain | | - | | (.41) | | - | | - |
| Tax return of capital | | - | | - | | - | | (.01) |
| Total distributions | | - | | (.44) | | - | | (.01) |
| Net asset value, end of period | $ | 12.43 | $ | 10.94 | $ | 16.69 | $ | 11.91 |
Total Return E,F | | 13.62% | | (32.65)% | | 40.13% | | 19.22% |
Ratios to Average Net Assets C,G,H | | | | | | | | |
| Expenses before reductions | | 1.55% I | | 1.41% | | 1.70% | | 2.63% I |
| Expenses net of fee waivers, if any | | .95% I | | .98% | | 1.08% | | 1.10% I |
| Expenses net of all reductions | | .94% I | | .98% | | 1.08% | | 1.09% I |
| Net investment income (loss) | | .28% I | | .05% | | (.25)% | | (.10)% I |
| Supplemental Data | | | | | | | | |
| Net assets, end of period (000 omitted) | $ | 11,787 | $ | 11,208 | $ | 21,492 | $ | 10,055 |
Portfolio turnover rate J | | 12% I | | 15% | | 23% | | 17% I |
A For the period November 5, 2019 (commencement of operations) through October 31, 2020.
B Calculated based on average shares outstanding during the period.
C Net investment income (loss) is affected by the timing of the declaration of dividends by any underlying mutual funds or exchange-traded funds (ETFs). Net investment income (loss) of any mutual funds or ETFs is not included in the Fund's net investment income (loss) ratio.
D Amount represents less than $.005 per share.
E Total returns for periods of less than one year are not annualized.
F Total returns would have been lower if certain expenses had not been reduced during the applicable periods shown.
G Fees and expenses of any underlying mutual funds or exchange-traded funds (ETFs) are not included in the Fund's expense ratio. The Fund indirectly bears its proportionate share of these expenses. For additional expense information related to investments in Fidelity Central Funds, please refer to the "Investments in Fidelity Central Funds" note found in the Notes to Financial Statements section of the most recent Annual or Semi-Annual report.
H Expense ratios reflect operating expenses of the class. Expenses before reductions do not reflect amounts reimbursed, waived, or reduced through arrangements with the investment adviser, brokerage services, or other offset arrangements, if applicable, and do not represent the amount paid by the class during periods when reimbursements, waivers or reductions occur.
I Annualized.
J Amount does not include the portfolio activity of any underlying mutual funds or exchange-traded funds (ETFs).
For the period ended April 30, 2023
1. Organization.
Fidelity Enduring Opportunities Fund (the Fund) is a fund of Fidelity Investment Trust (the Trust) and is authorized to issue an unlimited number of shares. Share transactions on the Statement of Changes in Net Assets may contain exchanges between affiliated funds. The Trust is registered under the Investment Company Act of 1940, as amended (the 1940 Act), as an open-end management investment company organized as a Massachusetts business trust. The Fund's investments in emerging markets can be subject to social, economic, regulatory, and political uncertainties and can be extremely volatile.
2. Investments in Fidelity Central Funds.
Funds may invest in Fidelity Central Funds, which are open-end investment companies generally available only to other investment companies and accounts managed by the investment adviser and its affiliates. The Schedule of Investments lists any Fidelity Central Funds held as an investment as of period end, but does not include the underlying holdings of each Fidelity Central Fund. An investing fund indirectly bears its proportionate share of the expenses of the underlying Fidelity Central Funds.
Based on its investment objective, each Fidelity Central Fund may invest or participate in various investment vehicles or strategies that are similar to those of the investing fund. These strategies are consistent with the investment objectives of the investing fund and may involve certain economic risks which may cause a decline in value of each of the Fidelity Central Funds and thus a decline in the value of the investing fund.
| Fidelity Central Fund | Investment Manager | Investment Objective | Investment Practices | Expense Ratio A |
| Fidelity Money Market Central Funds | Fidelity Management & Research Company LLC (FMR) | Each fund seeks to obtain a high level of current income consistent with the preservation of capital and liquidity. | Short-term Investments | Less than .005% |
A Expenses expressed as a percentage of average net assets and are as of each underlying Central Fund's most recent annual or semi-annual shareholder report.
A complete unaudited list of holdings for each Fidelity Central Fund is available upon request or at the Securities and Exchange Commission website at www.sec.gov. In addition, the financial statements of the Fidelity Central Funds which contain the significant accounting policies (including investment valuation policies) of those funds, and are not covered by the Report of Independent Registered Public Accounting Firm, are available on the Securities and Exchange Commission website or upon request.
3. Significant Accounting Policies.
The Fund is an investment company and applies the accounting and reporting guidance of the Financial Accounting Standards Board (FASB) Accounting Standards Codification Topic 946 Financial Services - Investment Companies. The financial statements have been prepared in conformity with accounting principles generally accepted in the United States of America (GAAP), which require management to make certain estimates and assumptions at the date of the financial statements. Actual results could differ from those estimates. Subsequent events, if any, through the date that the financial statements were issued have been evaluated in the preparation of the financial statements. The Fund's Schedule of Investments lists any underlying mutual funds or exchange-traded funds (ETFs) but does not include the underlying holdings of these funds. The following summarizes the significant accounting policies of the Fund:
Investment Valuation. Investments are valued as of 4:00 p.m. Eastern time on the last calendar day of the period. The Board of Trustees (the Board) has designated the Fund's investment adviser as the valuation designee responsible for the fair valuation function and performing fair value determinations as needed. The investment adviser has established a Fair Value Committee (the Committee) to carry out the day-to-day fair valuation responsibilities and has adopted policies and procedures to govern the fair valuation process and the activities of the Committee. In accordance with these fair valuation policies and procedures, which have been approved by the Board, the Fund attempts to obtain prices from one or more third party pricing services or brokers to value its investments. When current market prices, quotations or currency exchange rates are not readily available or reliable, investments will be fair valued in good faith by the Committee, in accordance with the policies and procedures. Factors used in determining fair value vary by investment type and may include market or investment specific events, transaction data, estimated cash flows, and market observations of comparable investments. The frequency that the fair valuation procedures are used cannot be predicted and they may be utilized to a significant extent. The Committee manages the Fund's fair valuation practices and maintains the fair valuation policies and procedures. The Fund's investment adviser reports to the Board information regarding the fair valuation process and related material matters.
The Fund categorizes the inputs to valuation techniques used to value its investments into a disclosure hierarchy consisting of three levels as shown below:
Level 1 - unadjusted quoted prices in active markets for identical investments
Level 2 - other significant observable inputs (including quoted prices for similar investments, interest rates, prepayment speeds, etc.)
Level 3 - unobservable inputs (including the Fund's own assumptions based on the best information available)
Valuation techniques used to value the Fund's investments by major category are as follows:
Equity securities, including restricted securities, for which market quotations are readily available, are valued at the last reported sale price or official closing price as reported by a third party pricing service on the primary market or exchange on which they are traded and are categorized as Level 1 in the hierarchy. In the event there were no sales during the day or closing prices are not available, securities are valued at the last quoted bid price or may be valued using the last available price and are generally categorized as Level 2 in the hierarchy. For foreign equity securities, when market or security specific events arise, comparisons to the valuation of American Depositary Receipts (ADRs), futures contracts, ETFs and certain indexes as well as quoted prices for similar securities may be used and would be categorized as Level 2 in the hierarchy. For equity securities, including restricted securities, where observable inputs are limited, assumptions about market activity and risk are used and these securities may be categorized as Level 3 in the hierarchy.
Investments in open-end mutual funds, including the Fidelity Central Funds, are valued at their closing net asset value (NAV) each business day and are categorized as Level 1 in the hierarchy.
Changes in valuation techniques may result in transfers in or out of an assigned level within the disclosure hierarchy. The aggregate value of investments by input level as of April 30, 2023 is included at the end of the Fund's Schedule of Investments.
Foreign Currency. Certain Funds may use foreign currency contracts to facilitate transactions in foreign-denominated securities. Gains and losses from these transactions may arise from changes in the value of the foreign currency or if the counterparties do not perform under the contracts' terms.
Foreign-denominated assets, including investment securities, and liabilities are translated into U.S. dollars at the exchange rates at period end. Purchases and sales of investment securities, income and dividends received, and expenses denominated in foreign currencies are translated into U.S. dollars at the exchange rate in effect on the transaction date.
The effects of exchange rate fluctuations on investments are included with the net realized and unrealized gain (loss) on investment securities. Other foreign currency transactions resulting in realized and unrealized gain (loss) are disclosed separately.
Investment Transactions and Income. For financial reporting purposes, the Fund's investment holdings and NAV include trades executed through the end of the last business day of the period. The NAV per share for processing shareholder transactions is calculated as of the close of business of the New York Stock Exchange (NYSE), normally 4:00 p.m. Eastern time and includes trades executed through the end of the prior business day. Gains and losses on securities sold are determined on the basis of identified cost. Commissions paid to certain brokers with whom the investment adviser, or its affiliates, places trades on behalf of a fund include an amount in addition to trade execution, which may be rebated back to a fund. Any such rebates are included in net realized gain (loss) on investments in the Statement of Operations. Dividend income is recorded on the ex-dividend date, except for certain dividends from foreign securities where the ex-dividend date may have passed, which are recorded as soon as the Fund is informed of the ex-dividend date. Non-cash dividends included in dividend income, if any, are recorded at the fair market value of the securities received. Income and capital gain distributions from Fidelity Central Funds, if any, are recorded on the ex-dividend date. Certain distributions received by the Fund represent a return of capital or capital gain. The Fund determines the components of these distributions subsequent to the ex-dividend date, based upon receipt of tax filings or other correspondence relating to the underlying investment. These distributions are recorded as a reduction of cost of investments and/or as a realized gain. Investment income is recorded net of foreign taxes withheld where recovery of such taxes is uncertain. Funds may file withholding tax reclaims in certain jurisdictions to recover a portion of amounts previously withheld. Any withholding tax reclaims income is included in the Statement of Operations in foreign taxes withheld. Any receivables for withholding tax reclaims are included in the Statement of Assets and Liabilities in dividends receivable.
Expenses. Expenses directly attributable to a fund are charged to that fund. Expenses attributable to more than one fund are allocated among the respective funds on the basis of relative net assets or other appropriate methods. Expenses included in the accompanying financial statements reflect the expenses of that fund and do not include any expenses associated with any underlying mutual funds or exchange-traded funds. Although not included in a fund's expenses, a fund indirectly bears its proportionate share of these expenses through the net asset value of each underlying mutual fund or exchange-traded fund. Expense estimates are accrued in the period to which they relate and adjustments are made when actual amounts are known.
Income Tax Information and Distributions to Shareholders. Each year, the Fund intends to qualify as a regulated investment company under Subchapter M of the Internal Revenue Code, including distributing substantially all of its taxable income and realized gains. As a result, no provision for U.S. Federal income taxes is required. The Fund files a U.S. federal tax return, in addition to state and local tax returns as required. The Fund's federal income tax returns are subject to examination by the Internal Revenue Service (IRS) for a period of three fiscal years after they are filed. State and local tax returns may be subject to examination for an additional fiscal year depending on the jurisdiction. Foreign taxes are provided for based on the Fund's understanding of the tax rules and rates that exist in the foreign markets in which it invests. The Fund is subject to a tax imposed on capital gains by certain countries in which it invests. An estimated deferred tax liability for net unrealized appreciation on the applicable securities is included in Other payables and accrued expenses on the Statement of Assets & Liabilities.
Distributions are declared and recorded on the ex-dividend date. Income and capital gain distributions are determined in accordance with income tax regulations, which may differ from GAAP.
Capital accounts within the financial statements are adjusted for permanent book-tax differences. These adjustments have no impact on net assets or the results of operations. Capital accounts are not adjusted for temporary book-tax differences which will reverse in a subsequent period.
Book-tax differences are primarily due to foreign currency transactions, certain foreign taxes, passive foreign investment companies (PFIC), net operating losses, capital loss carryforwards and losses deferred due to wash sales and excise tax regulations.
As of period end, the cost and unrealized appreciation (depreciation) in securities, and derivatives if applicable, for federal income tax purposes were as follows:
| Gross unrealized appreciation | $2,534,718 |
| Gross unrealized depreciation | (1,266,438) |
| Net unrealized appreciation (depreciation) | $1,268,280 |
| Tax cost | $10,530,645 |
Capital loss carryforwards are only available to offset future capital gains of the Fund to the extent provided by regulations and may be limited. The capital loss carryforward information presented below, including any applicable limitation, is estimated as of prior fiscal period end and is subject to adjustment.
| Short-term | $(440,776) |
| Long-term | (540,264) |
| Total capital loss carryforward | $(981,040) |
Delayed Delivery Transactions and When-Issued Securities. During the period, certain Funds transacted in securities on a delayed delivery or when-issued basis. Payment and delivery may take place after the customary settlement period for that security. The price of the underlying securities and the date when the securities will be delivered and paid for are fixed at the time the transaction is negotiated. Securities purchased on a delayed delivery or when-issued basis are identified as such in the Schedule of Investments. Compensation for interest forgone in the purchase of a delayed delivery or when-issued debt security may be received. With respect to purchase commitments, each applicable Fund identifies securities as segregated in its records with a value at least equal to the amount of the commitment. Payables and receivables associated with the purchases and sales of delayed delivery securities having the same coupon, settlement date and broker are offset. Delayed delivery or when-issued securities that have been purchased from and sold to different brokers are reflected as both payables and receivables in the Statement of Assets and Liabilities under the caption "Delayed delivery", as applicable. Losses may arise due to changes in the value of the underlying securities or if the counterparty does not perform under the contract's terms, or if the issuer does not issue the securities due to political, economic, or other factors.
Restricted Securities (including Private Placements). Funds may invest in securities that are subject to legal or contractual restrictions on resale. These securities generally may be resold in transactions exempt from registration or to the public if the securities are registered. Disposal of these securities may involve time-consuming negotiations and expense, and prompt sale at an acceptable price may be difficult. Information regarding restricted securities held at period end is included at the end of the Schedule of Investments, if applicable.
4. Purchases and Sales of Investments.
Purchases and sales of securities, other than short-term securities and in-kind transactions, as applicable, are noted in the table below.
| | Purchases ($) | Sales ($) |
| Fidelity Enduring Opportunities Fund | 676,023 | 1,510,601 |
5. Fees and Other Transactions with Affiliates.
Management Fee. Fidelity Management & Research Company LLC (the investment adviser) and its affiliates provide the Fund with investment management related services for which the Fund pays a monthly management fee. The management fee is the sum of an individual fund fee rate that is based on an annual rate of .35% of the Fund's average net assets and an annualized group fee rate that averaged .23% during the period. The group fee rate is based upon the monthly average net assets of a group of registered investment companies with which the investment adviser has management contracts. The group fee rate decreases as assets under management increase and increases as assets under management decrease. In addition, the management fee is subject to a performance adjustment (up to a maximum of +/- .20% of the Fund's average net assets over a 36 month performance period). The upward or downward adjustment to the management fee is based on the Fund's relative investment performance as compared to its benchmark index, the MSCI ACWI (All Country World Index) Index, over the same 36 month performance period. For the reporting period, the total annualized management fee rate, including the performance adjustment, was .46% of the Fund's average net assets. The performance adjustment included in the management fee rate may be higher or lower than the maximum performance adjustment rate due to the difference between the average net assets for the reporting and performance periods.
Transfer Agent Fees. Fidelity Investments Institutional Operations Company LLC (FIIOC), an affiliate of the investment adviser, is the Fund's transfer, dividend disbursing and shareholder servicing agent. FIIOC receives account fees and asset-based fees that vary according to account size and type of account. FIIOC pays for typesetting, printing and mailing of shareholder reports, except proxy statements. For the period, the transfer agent fees were equivalent to an annualized rate of .26% of average net assets.
Accounting Fees. Fidelity Service Company, Inc. (FSC), an affiliate of the investment adviser, maintains the Fund's accounting records. The accounting fee is based on the level of average net assets for each month. For the period, the fees were equivalent to the following annualized rates:
| | % of Average Net Assets |
| Fidelity Enduring Opportunities Fund | .04 |
Brokerage Commissions. A portion of portfolio transactions were placed with brokerage firms which are affiliates of the investment adviser. Brokerage commissions are included in net realized gain (loss) and change in net unrealized appreciation (depreciation) in the Statement of Operations. The commissions paid to these affiliated firms were as follows:
| | Amount |
| Fidelity Enduring Opportunities Fund | $ 3 |
Interfund Trades. Funds may purchase from or sell securities to other Fidelity Funds under procedures adopted by the Board. The procedures have been designed to ensure these interfund trades are executed in accordance with Rule 17a-7 of the 1940 Act. Any interfund trades are included within the respective purchases and sales amounts shown in the Purchases and Sales of Investments note. Interfund trades during the period are noted in the table below.
| | Purchases ($) | Sales ($) | Realized Gain (Loss) ($) |
| Fidelity Enduring Opportunities Fund | - | 81,875 | 16,423 |
6. Committed Line of Credit.
Certain Funds participate with other funds managed by the investment adviser or an affiliate in a $4.25 billion credit facility (the "line of credit") to be utilized for temporary or emergency purposes to fund shareholder redemptions or for other short-term liquidity purposes. The participating funds have agreed to pay commitment fees on their pro-rata portion of the line of credit, which are reflected in Miscellaneous expenses on the Statement of Operations, and are listed below. During the period, there were no borrowings on this line of credit.
| | Amount |
| Fidelity Enduring Opportunities Fund | $12 |
7. Expense Reductions.
The investment adviser contractually agreed to reimburse the Fund to the extent annual operating expenses exceeded .95% of average net assets. This reimbursement will remain in place through February 29, 2024. Some expenses, for example the compensation of the independent Trustees, and certain miscellaneous expenses such as proxy and shareholder meeting expenses, are excluded from this reimbursement. During the period this reimbursement reduced the Fund's expenses by $35,425.
Through arrangements with the Fund's custodian, credits realized as a result of certain uninvested cash balances were used to reduce the Fund's expenses by $131.
In addition, during the period the investment adviser or an affiliate reimbursed and/or waived a portion of operating expenses in the amount of $273.
8. Other.
A fund's organizational documents provide former and current trustees and officers with a limited indemnification against liabilities arising in connection with the performance of their duties to the fund. In the normal course of business, a fund may also enter into contracts that provide general indemnifications. A fund's maximum exposure under these arrangements is unknown as this would be dependent on future claims that may be made against a fund. The risk of material loss from such claims is considered remote.
At the end of the period, the investment adviser or its affiliates were owners of record of more than 10% of the outstanding shares as follows:
| Fund | Affiliated % |
| Fidelity Enduring Opportunities Fund. | 20% |
9. Risk and Uncertainties.
Many factors affect a fund's performance. Developments that disrupt global economies and financial markets, such as pandemics, epidemics, outbreaks of infectious diseases, war, terrorism, and environmental disasters, may significantly affect a fund's investment performance. The effects of these developments to a fund will be impacted by the types of securities in which a fund invests, the financial condition, industry, economic sector, and geographic location of an issuer, and a fund's level of investment in the securities of that issuer. Significant concentrations in security types, issuers, industries, sectors, and geographic locations may magnify the factors that affect a fund's performance.
As a shareholder, you incur two types of costs: (1) transaction costs, which may include sales charges (loads) on purchase payments or redemption proceeds, as applicable and (2) ongoing costs, which generally include management fees, distribution and/or service (12b-1) fees and other Fund expenses. This Example is intended to help you understand your ongoing costs (in dollars) of investing in a fund and to compare these costs with the ongoing costs of investing in other mutual funds.
| The Example is based on an investment of $1,000 invested at the beginning of the period and held for the entire period (November 1, 2022 to April 30, 2023). |
Actual Expenses
The first line of the accompanying table provides information about actual account values and actual expenses. You may use the information in this line, together with the amount you invested, to estimate the expenses that you paid over the period. Simply divide your account value by $1,000.00 (for example, an $8,600 account value divided by $1,000.00 = 8.6), then multiply the result by the number in the first line for a class/Fund under the heading entitled "Expenses Paid During Period" to estimate the expenses you paid on your account during this period. If any fund is a shareholder of any underlying mutual funds or exchange-traded funds (ETFs) (the Underlying Funds), such fund indirectly bears its proportional share of the expenses of the Underlying Funds in addition to the direct expenses incurred presented in the table. These fees and expenses are not included in the annualized expense ratio used to calculate the expense estimate in the table below.
Hypothetical Example for Comparison Purposes
The second line of the accompanying table provides information about hypothetical account values and hypothetical expenses based on the actual expense ratio and an assumed rate of return of 5% per year before expenses, which is not the actual return. The hypothetical account values and expenses may not be used to estimate the actual ending account balance or expenses you paid for the period. You may use this information to compare the ongoing costs of investing in the Fund and other funds. To do so, compare this 5% hypothetical example with the 5% hypothetical examples that appear in the shareholder reports of the other funds. If any fund is a shareholder of any Underlying Funds, such fund indirectly bears its proportional share of the expenses of the Underlying Funds in addition to the direct expenses as presented in the table. These fees and expenses are not included in the annualized expense ratio used to calculate the expense estimate in the table below.
Please note that the expenses shown in the table are meant to highlight your ongoing costs only and do not reflect any transaction costs. Therefore, the second line of the table is useful in comparing ongoing costs only, and will not help you determine the relative total costs of owning different funds. In addition, if these transactional costs were included, your costs would have been higher.
| | | | | Annualized Expense Ratio- A | | Beginning Account Value November 1, 2022 | | Ending Account Value April 30, 2023 | | Expenses Paid During Period- C November 1, 2022 to April 30, 2023 |
| | | | | | | | | | |
| Fidelity® Enduring Opportunities Fund | | | | .95% | | | | | | |
| Actual | | | | | | $ 1,000 | | $ 1,136.20 | | $ 5.03 |
Hypothetical- B | | | | | | $ 1,000 | | $ 1,020.08 | | $ 4.76 |
| |
A Annualized expense ratio reflects expenses net of applicable fee waivers.
B 5% return per year before expenses
C Expenses are equal to the annualized expense ratio, multiplied by the average account value over the period, multiplied by 181/ 365 (to reflect the one-half year period). The fees and expenses of any Underlying Funds are not included in each annualized expense ratio.
The Securities and Exchange Commission adopted Rule 22e-4 under the Investment Company Act of 1940 (the Liquidity Rule) to promote effective liquidity risk management throughout the open-end investment company industry, thereby reducing the risk that funds will be unable to meet their redemption obligations and mitigating dilution of the interests of fund shareholders.
The Fund has adopted and implemented a liquidity risk management program (the Program) reasonably designed to assess and manage the Fund's liquidity risk and to comply with the requirements of the Liquidity Rule. The Fund's Board of Trustees (the Board) has designated the Fund's investment adviser as administrator of the Program. The Fidelity advisers have established a Liquidity Risk Management Committee (the LRM Committee) to manage the Program for each of the Fidelity Funds. The LRM Committee monitors the adequacy and effectiveness of implementation of the Program and on a periodic basis assesses each Fund's liquidity risk based on a variety of factors including (1) the Fund's investment strategy, (2) portfolio liquidity and cash flow projections during normal and reasonably foreseeable stressed conditions, (3) shareholder redemptions, (4) borrowings and other funding sources and (5) certain factors specific to ETFs including the effect of the Fund's prices and spreads, market participants, and basket compositions on the overall liquidity of the Fund's portfolio, as applicable.
In accordance with the Program, each of the Fund's portfolio investments is classified into one of four defined liquidity categories based on a determination of a reasonable expectation for how long it would take to convert the investment to cash (or sell or dispose of the investment) without significantly changing its market value.
- Highly liquid investments - cash or convertible to cash within three business days or less
- Moderately liquid investments - convertible to cash in three to seven calendar days
- Less liquid investments - can be sold or disposed of, but not settled, within seven calendar days
- Illiquid investments - cannot be sold or disposed of within seven calendar days
Liquidity classification determinations take into account a variety of factors including various market, trading and investment-specific considerations, as well as market depth, and generally utilize analysis from a third-party liquidity metrics service.
The Liquidity Rule places a 15% limit on a fund's illiquid investments and requires funds that do not primarily hold assets that are highly liquid investments to determine and maintain a minimum percentage of the fund's net assets to be invested in highly liquid investments (highly liquid investment minimum or HLIM). The Program includes provisions reasonably designed to comply with the 15% limit on illiquid investments and for determining, periodically reviewing and complying with the HLIM requirement as applicable.
At a recent meeting of the Fund's Board of Trustees, the LRM Committee provided a written report to the Board pertaining to the operation, adequacy, and effectiveness of the Program for the period December 1, 2021 through November 30, 2022. The report concluded that the Program is operating effectively and is reasonably designed to assess and manage the Fund's liquidity risk.
1.9896222.103
IDF-SANN-0623
Fidelity® International Capital Appreciation K6 Fund
Semi-Annual Report
April 30, 2023
Contents
To view a fund's proxy voting guidelines and proxy voting record for the 12-month period ended June 30, visit http://www.fidelity.com/proxyvotingresults or visit the Securities and Exchange Commission's (SEC) web site at http://www.sec.gov.
You may also call 1-800-835-5092 to request a free copy of the proxy voting guidelines.
Standard & Poor's, S&P and S&P 500 are registered service marks of The McGraw-Hill Companies, Inc. and have been licensed for use by Fidelity Distributors Corporation.
Other third-party marks appearing herein are the property of their respective owners.
All other marks appearing herein are registered or unregistered trademarks or service marks of FMR LLC or an affiliated company. © 2023 FMR LLC. All rights reserved.
This report and the financial statements contained herein are submitted for the general information of the shareholders of the Fund. This report is not authorized for distribution to prospective investors in the Fund unless preceded or accompanied by an effective prospectus.
A fund files its complete schedule of portfolio holdings with the SEC for the first and third quarters of each fiscal year on Form N-PORT. Forms N-PORT are available on the SEC's web site at http://www.sec.gov. A fund's Forms N-PORT may be reviewed and copied at the SEC's Public Reference Room in Washington, DC. Information regarding the operation of the SEC's Public Reference Room may be obtained by calling 1-800-SEC-0330.
For a complete list of a fund's portfolio holdings, view the most recent holdings listing, semiannual report, or annual report on Fidelity's web site at http://www.fidelity.com, http://www.institutional.fidelity.com, or http://www.401k.com, as applicable.
NOT FDIC INSURED •MAY LOSE VALUE •NO BANK GUARANTEE
Neither the Fund nor Fidelity Distributors Corporation is a bank.
Top Holdings (% of Fund's net assets) |
| |
| LVMH Moet Hennessy Louis Vuitton SE (France, Textiles, Apparel & Luxury Goods) | 3.0 | |
| Taiwan Semiconductor Manufacturing Co. Ltd. (Taiwan, Semiconductors & Semiconductor Equipment) | 2.9 | |
| Novo Nordisk A/S Series B (Denmark, Pharmaceuticals) | 2.8 | |
| AstraZeneca PLC (United Kingdom) (United Kingdom, Pharmaceuticals) | 2.5 | |
| ASML Holding NV (Netherlands) (Netherlands, Semiconductors & Semiconductor Equipment) | 2.5 | |
| L'Oreal SA (France, Personal Care Products) | 2.2 | |
| Compagnie Financiere Richemont SA Series A (Switzerland, Textiles, Apparel & Luxury Goods) | 2.2 | |
| Hermes International SCA (France, Textiles, Apparel & Luxury Goods) | 2.0 | |
| Diageo PLC (United Kingdom, Beverages) | 2.0 | |
| Constellation Software, Inc. (Canada, Software) | 1.9 | |
| | 24.0 | |
| |
| Market Sectors (% of Fund's net assets) |
| |
| Information Technology | 24.1 | |
| Industrials | 22.9 | |
| Financials | 12.6 | |
| Consumer Discretionary | 12.4 | |
| Materials | 9.3 | |
| Consumer Staples | 9.1 | |
| Health Care | 8.3 | |
| |
Asset Allocation (% of Fund's net assets) |
|
|
Geographic Diversification (% of Fund's net assets) |
|
* Includes Short-Term investments and Net Other Assets (Liabilities). Percentages are adjusted for the effect of derivatives, if applicable. |
| |
Showing Percentage of Net Assets
| Common Stocks - 98.7% |
| | | Shares | Value ($) |
| Brazil - 1.6% | | | |
| MercadoLibre, Inc. (a) | | 12,622 | 16,124,479 |
| Canada - 9.8% | | | |
| Alimentation Couche-Tard, Inc. Class A (multi-vtg.) | | 321,623 | 16,052,070 |
| Canadian National Railway Co. | | 135,794 | 16,186,833 |
| Canadian Pacific Kansas City Ltd. | | 209,151 | 16,486,937 |
| Constellation Software, Inc. | | 9,757 | 19,097,175 |
| GFL Environmental, Inc. | | 352,133 | 12,789,951 |
| Thomson Reuters Corp. | | 128,067 | 16,840,548 |
TOTAL CANADA | | | 97,453,514 |
| China - 1.3% | | | |
| NXP Semiconductors NV | | 78,261 | 12,814,456 |
| Denmark - 4.5% | | | |
| DSV A/S | | 90,421 | 16,982,760 |
| Novo Nordisk A/S Series B | | 165,396 | 27,514,369 |
TOTAL DENMARK | | | 44,497,129 |
| France - 15.5% | | | |
| Air Liquide SA | | 104,472 | 18,793,492 |
| Capgemini SA | | 79,671 | 14,476,484 |
| Dassault Systemes SA | | 390,958 | 15,797,312 |
| Hermes International SCA | | 9,138 | 19,804,028 |
| L'Oreal SA | | 46,439 | 22,144,308 |
| LVMH Moet Hennessy Louis Vuitton SE | | 31,267 | 30,075,144 |
| Pernod Ricard SA | | 78,466 | 18,105,077 |
| Safran SA | | 93,503 | 14,541,565 |
TOTAL FRANCE | | | 153,737,410 |
| Germany - 1.7% | | | |
| Infineon Technologies AG | | 448,476 | 16,332,050 |
| India - 6.3% | | | |
| HCL Technologies Ltd. | | 1,109,033 | 14,514,845 |
| HDFC Bank Ltd. | | 773,004 | 15,998,884 |
| ICICI Bank Ltd. | | 1,559,339 | 17,609,599 |
| ITC Ltd. | | 2,786,275 | 14,545,090 |
TOTAL INDIA | | | 62,668,418 |
| Indonesia - 1.7% | | | |
| PT Bank Central Asia Tbk | | 27,426,588 | 16,972,986 |
| Ireland - 2.9% | | | |
| CRH PLC | | 288,071 | 13,900,571 |
| Kingspan Group PLC (Ireland) | | 220,417 | 15,228,419 |
TOTAL IRELAND | | | 29,128,990 |
| Israel - 1.5% | | | |
| NICE Ltd. sponsored ADR (a)(b) | | 70,288 | 14,339,455 |
| Italy - 1.8% | | | |
| Ferrari NV (Italy) | | 65,443 | 18,193,767 |
| Japan - 6.4% | | | |
| Hoya Corp. | | 152,547 | 15,995,322 |
| Keyence Corp. | | 39,343 | 17,741,974 |
| Shin-Etsu Chemical Co. Ltd. | | 491,829 | 14,034,745 |
| Tokyo Electron Ltd. | | 133,755 | 15,315,684 |
TOTAL JAPAN | | | 63,087,725 |
| Korea (South) - 2.6% | | | |
| LG Chemical Ltd. | | 24,341 | 13,526,381 |
| Samsung SDI Co. Ltd. | | 24,169 | 12,548,006 |
TOTAL KOREA (SOUTH) | | | 26,074,387 |
| Netherlands - 5.9% | | | |
| ASM International NV (Netherlands) | | 45,630 | 16,494,255 |
| ASML Holding NV (Netherlands) | | 38,779 | 24,505,988 |
| Wolters Kluwer NV | | 135,917 | 17,994,498 |
TOTAL NETHERLANDS | | | 58,994,741 |
| Sweden - 1.8% | | | |
| Atlas Copco AB (A Shares) | | 1,250,038 | 18,052,630 |
| Switzerland - 3.9% | | | |
| Compagnie Financiere Richemont SA Series A | | 131,030 | 21,659,373 |
| Sika AG | | 62,299 | 17,208,418 |
TOTAL SWITZERLAND | | | 38,867,791 |
| Taiwan - 2.9% | | | |
| Taiwan Semiconductor Manufacturing Co. Ltd. | | 1,743,262 | 28,526,999 |
| United Kingdom - 11.2% | | | |
| Ashtead Group PLC | | 220,752 | 12,697,975 |
| AstraZeneca PLC (United Kingdom) | | 169,089 | 24,883,642 |
| Compass Group PLC | | 684,798 | 18,065,629 |
| Diageo PLC | | 421,644 | 19,233,759 |
| RELX PLC (London Stock Exchange) | | 545,641 | 18,144,530 |
| Rentokil Initial PLC | | 2,262,844 | 18,015,077 |
TOTAL UNITED KINGDOM | | | 111,040,612 |
| United States of America - 15.4% | | | |
| Fiserv, Inc. (a) | | 102,259 | 12,487,869 |
| Linde PLC | | 43,127 | 15,933,270 |
| Marsh & McLennan Companies, Inc. | | 89,189 | 16,070,966 |
| MasterCard, Inc. Class A | | 39,636 | 15,062,869 |
| Moody's Corp. | | 49,096 | 15,372,940 |
| S&P Global, Inc. | | 41,880 | 15,184,850 |
| Schneider Electric SA | | 108,638 | 18,945,587 |
| SolarEdge Technologies, Inc. (a) | | 50,665 | 14,471,444 |
| Thermo Fisher Scientific, Inc. | | 25,468 | 14,132,193 |
| Waste Connections, Inc. (Canada) | | 109,092 | 15,174,727 |
TOTAL UNITED STATES OF AMERICA | | | 152,836,715 |
| TOTAL COMMON STOCKS (Cost $778,779,463) | | | 979,744,254 |
| | | | |
| Money Market Funds - 1.4% |
| | | Shares | Value ($) |
| Fidelity Cash Central Fund 4.88% (c) | | 11,019,005 | 11,021,209 |
| Fidelity Securities Lending Cash Central Fund 4.88% (c)(d) | | 3,091,443 | 3,091,752 |
| TOTAL MONEY MARKET FUNDS (Cost $14,112,961) | | | 14,112,961 |
| | | | |
| TOTAL INVESTMENT IN SECURITIES - 100.1% (Cost $792,892,424) | 993,857,215 |
NET OTHER ASSETS (LIABILITIES) - (0.1)% | (517,705) |
| NET ASSETS - 100.0% | 993,339,510 |
| | |
Legend
| (b) | Security or a portion of the security is on loan at period end. |
| (c) | Affiliated fund that is generally available only to investment companies and other accounts managed by Fidelity Investments. The rate quoted is the annualized seven-day yield of the fund at period end. A complete unaudited listing of the fund's holdings as of its most recent quarter end is available upon request. In addition, each Fidelity Central Fund's financial statements are available on the SEC's website or upon request. |
| (d) | Investment made with cash collateral received from securities on loan. |
Affiliated Central Funds
Fiscal year to date information regarding the Fund's investments in Fidelity Central Funds, including the ownership percentage, is presented below.
| Affiliate | Value, beginning of period ($) | Purchases ($) | Sales Proceeds ($) | Dividend Income ($) | Realized Gain (loss) ($) | Change in Unrealized appreciation (depreciation) ($) | Value, end of period ($) | % ownership, end of period |
| Fidelity Cash Central Fund 4.88% | 9,866,092 | 200,036,310 | 198,881,193 | 264,858 | - | - | 11,021,209 | 0.0% |
| Fidelity Securities Lending Cash Central Fund 4.88% | 13,243,268 | 60,572,168 | 70,723,684 | 7,948 | - | - | 3,091,752 | 0.0% |
| Total | 23,109,360 | 260,608,478 | 269,604,877 | 272,806 | - | - | 14,112,961 | |
| | | | | | | | | |
Amounts in the dividend income column in the above table include any capital gain distributions from underlying funds, which are presented in the corresponding line item in the Statement of Operations, if applicable.
Amounts in the dividend income column for Fidelity Securities Lending Cash Central Fund represents the income earned on investing cash collateral, less rebates paid to borrowers and any lending agent fees associated with the loan, plus any premium payments received for lending certain types of securities.
Amounts included in the purchases and sales proceeds columns may include in-kind transactions, if applicable.
Investment Valuation
The following is a summary of the inputs used, as of April 30, 2023, involving the Fund's assets and liabilities carried at fair value. The inputs or methodology used for valuing securities may not be an indication of the risk associated with investing in those securities. For more information on valuation inputs, and their aggregation into the levels used below, please refer to the Investment Valuation section in the accompanying Notes to Financial Statements.
| Valuation Inputs at Reporting Date: |
| Description | Total ($) | Level 1 ($) | Level 2 ($) | Level 3 ($) |
Investments in Securities: | | | | |
|
| Equities: | | | | |
Consumer Discretionary | 123,922,420 | 54,122,274 | 69,800,146 | - |
Consumer Staples | 90,080,304 | 56,301,455 | 33,778,849 | - |
Financials | 124,760,963 | 74,179,494 | 50,581,469 | - |
Health Care | 82,525,526 | 14,132,193 | 68,393,333 | - |
Industrials | 228,082,037 | 176,579,808 | 51,502,229 | - |
Information Technology | 236,976,127 | 131,996,569 | 104,979,558 | - |
Materials | 93,396,877 | 15,933,270 | 77,463,607 | - |
|
| Money Market Funds | 14,112,961 | 14,112,961 | - | - |
| Total Investments in Securities: | 993,857,215 | 537,358,024 | 456,499,191 | - |
| Statement of Assets and Liabilities |
| | | | April 30, 2023 (Unaudited) |
| | | | | |
| Assets | | | | |
| Investment in securities, at value (including securities loaned of $3,047,093) - See accompanying schedule: | | | | |
Unaffiliated issuers (cost $778,779,463) | $ | 979,744,254 | | |
Fidelity Central Funds (cost $14,112,961) | | 14,112,961 | | |
| | | | | |
| | | | | |
| Total Investment in Securities (cost $792,892,424) | | | $ | 993,857,215 |
| Cash | | | | 2,857 |
| Foreign currency held at value (cost $261,420) | | | | 261,350 |
| Receivable for fund shares sold | | | | 1,370,878 |
| Dividends receivable | | | | 1,631,569 |
| Reclaims receivable | | | | 960,912 |
| Interest receivable | | | | 116 |
| Distributions receivable from Fidelity Central Funds | | | | 61,061 |
| Other receivables | | | | 162,756 |
Total assets | | | | 998,308,714 |
| Liabilities | | | | |
| Payable for fund shares redeemed | $ | 544,066 | | |
| Accrued management fee | | 535,576 | | |
| Deferred taxes | | 795,719 | | |
| Other payables and accrued expenses | | 2,091 | | |
| Collateral on securities loaned | | 3,091,752 | | |
| Total Liabilities | | | | 4,969,204 |
| Net Assets | | | $ | 993,339,510 |
| Net Assets consist of: | | | | |
| Paid in capital | | | $ | 856,293,022 |
| Total accumulated earnings (loss) | | | | 137,046,488 |
| Net Assets | | | $ | 993,339,510 |
Net Asset Value , offering price and redemption price per share ($993,339,510 ÷ 72,282,633 shares) | | | $ | 13.74 |
| Statement of Operations |
| | | | Six months ended April 30, 2023 (Unaudited) |
| Investment Income | | | | |
| Dividends | | | $ | 6,060,476 |
| Non-Cash dividends | | | | 313,088 |
| Interest | | | | 534 |
| Income from Fidelity Central Funds (including $7,948 from security lending) | | | | 272,806 |
| Income before foreign taxes withheld | | | $ | 6,646,904 |
| Less foreign taxes withheld | | | | (731,456) |
| Total Income | | | | 5,915,448 |
| Expenses | | | | |
| Management fee | $ | 2,978,851 | | |
| Independent trustees' fees and expenses | | 2,715 | | |
| Interest | | 22,775 | | |
| Total expenses before reductions | | 3,004,341 | | |
| Expense reductions | | (14) | | |
| Total expenses after reductions | | | | 3,004,327 |
| Net Investment income (loss) | | | | 2,911,121 |
| Realized and Unrealized Gain (Loss) | | | | |
| Net realized gain (loss) on: | | | | |
| Investment Securities: | | | | |
| Unaffiliated issuers (net of foreign taxes of $85,105) | | 7,825,109 | | |
| Foreign currency transactions | | 74,963 | | |
| Total net realized gain (loss) | | | | 7,900,072 |
| Change in net unrealized appreciation (depreciation) on: | | | | |
| Investment Securities: | | | | |
| Unaffiliated issuers(net of increase in deferred foreign taxes of $592,329) | | 163,414,388 | | |
| Assets and liabilities in foreign currencies | | 99,804 | | |
| Total change in net unrealized appreciation (depreciation) | | | | 163,514,192 |
| Net gain (loss) | | | | 171,414,264 |
| Net increase (decrease) in net assets resulting from operations | | | $ | 174,325,385 |
| Statement of Changes in Net Assets |
| |
| | Six months ended April 30, 2023 (Unaudited) | | Year ended October 31, 2022 |
| Increase (Decrease) in Net Assets | | | | |
| Operations | | | | |
| Net investment income (loss) | $ | 2,911,121 | $ | 3,648,889 |
| Net realized gain (loss) | | 7,900,072 | | (72,374,973) |
| Change in net unrealized appreciation (depreciation) | | 163,514,192 | | (233,838,244) |
| Net increase (decrease) in net assets resulting from operations | | 174,325,385 | | (302,564,328) |
| Distributions to shareholders | | (3,323,601) | | (75,709,685) |
| Share transactions | | | | |
| Proceeds from sales of shares | | 156,437,704 | | 376,598,093 |
| Reinvestment of distributions | | 3,323,601 | | 75,709,685 |
| Cost of shares redeemed | | (100,541,311) | | (234,149,001) |
Net increase (decrease) in net assets resulting from share transactions | | 59,219,994 | | 218,158,777 |
| Total increase (decrease) in net assets | | 230,221,778 | | (160,115,236) |
| | | | | |
| Net Assets | | | | |
| Beginning of period | | 763,117,732 | | 923,232,968 |
| End of period | $ | 993,339,510 | $ | 763,117,732 |
| | | | | |
| Other Information | | | | |
| Shares | | | | |
| Sold | | 12,171,287 | | 28,863,775 |
| Issued in reinvestment of distributions | | 258,445 | | 4,794,787 |
| Redeemed | | (7,727,894) | | (17,893,097) |
| Net increase (decrease) | | 4,701,838 | | 15,765,465 |
| | | | | |
Financial Highlights
| Fidelity® International Capital Appreciation K6 Fund |
| |
| | Six months ended (Unaudited) April 30, 2023 | | Years ended October 31, 2022 | | 2021 | | 2020 | | 2019 | | 2018 |
Selected Per-Share Data | | | | | | | | | | | | |
| Net asset value, beginning of period | $ | 11.29 | $ | 17.82 | $ | 13.99 | $ | 12.40 | $ | 10.17 | $ | 11.01 |
| Income from Investment Operations | | | | | | | | | | | | |
Net investment income (loss) A,B | | .04 | | .06 | | .05 | | .08 | | .13 C | | .11 |
| Net realized and unrealized gain (loss) | | 2.46 | | (5.14) | | 3.85 | | 1.62 | | 2.18 | | (.92) |
| Total from investment operations | | 2.50 | | (5.08) | | 3.90 | | 1.70 | | 2.31 | | (.81) |
| Distributions from net investment income | | (.05) | | (.04) | | (.07) | | (.11) | | (.08) | | (.02) |
| Distributions from net realized gain | | - | | (1.41) | | - | | - | | - | | (.01) |
| Total distributions | | (.05) | | (1.45) | | (.07) | | (.11) | | (.08) | | (.03) |
| Net asset value, end of period | $ | 13.74 | $ | 11.29 | $ | 17.82 | $ | 13.99 | $ | 12.40 | $ | 10.17 |
Total Return D,E | | 22.15% | | (30.83)% | | 27.93% | | 13.82% | | 22.90% | | (7.36)% |
Ratios to Average Net Assets B,F,G | | | | | | | | | | | | |
| Expenses before reductions | | .66% H | | .65% | | .65% | | .65% | | .65% | | .65% |
| Expenses net of fee waivers, if any | | .66% H | | .65% | | .65% | | .65% | | .65% | | .65% |
| Expenses net of all reductions | | .66% H | | .65% | | .65% | | .61% | | .63% | | .58% |
| Net investment income (loss) | | .64% H | | .44% | | .29% | | .62% | | 1.16% C | | .99% |
| Supplemental Data | | | | | | | | | | | | |
| Net assets, end of period (000 omitted) | $ | 993,340 | $ | 763,118 | $ | 923,233 | $ | 760,960 | $ | 524,353 | $ | 360,963 |
Portfolio turnover rate I | | 93% H | | 119% J | | 149% | | 138% | | 144% J | | 158% J |
A Calculated based on average shares outstanding during the period.
B Net investment income (loss) is affected by the timing of the declaration of dividends by any underlying mutual funds or exchange-traded funds (ETFs). Net investment income (loss) of any mutual funds or ETFs is not included in the Fund's net investment income (loss) ratio.
C Net investment income per share reflects one or more large, non-recurring dividend(s) which amounted to $.05 per share. Excluding such non-recurring dividend(s), the ratio of net investment income (loss) to average net assets would have been .75%.
D Total returns for periods of less than one year are not annualized.
E Total returns would have been lower if certain expenses had not been reduced during the applicable periods shown.
F Fees and expenses of any underlying mutual funds or exchange-traded funds (ETFs) are not included in the Fund's expense ratio. The Fund indirectly bears its proportionate share of these expenses. For additional expense information related to investments in Fidelity Central Funds, please refer to the "Investments in Fidelity Central Funds" note found in the Notes to Financial Statements section of the most recent Annual or Semi-Annual report.
G Expense ratios reflect operating expenses of the class. Expenses before reductions do not reflect amounts reimbursed, waived, or reduced through arrangements with the investment adviser, brokerage services, or other offset arrangements, if applicable, and do not represent the amount paid by the class during periods when reimbursements, waivers or reductions occur.
H Annualized.
I Amount does not include the portfolio activity of any underlying mutual funds or exchange-traded funds (ETFs).
J Portfolio turnover rate excludes securities received or delivered in-kind.
For the period ended April 30, 2023
1. Organization.
Fidelity International Capital Appreciation K6 Fund (the Fund) is a fund of Fidelity Investment Trust (the Trust) and is authorized to issue an unlimited number of shares. Share transactions on the Statement of Changes in Net Assets may contain exchanges between affiliated funds. The Trust is registered under the Investment Company Act of 1940, as amended (the 1940 Act), as an open-end management investment company organized as a Massachusetts business trust. Shares generally are available only to employer-sponsored retirement plans that are recordkept by Fidelity, or to certain employer-sponsored retirement plans that are not recordkept by Fidelity. The Fund's investments in emerging markets can be subject to social, economic, regulatory, and political uncertainties and can be extremely volatile.
2. Investments in Fidelity Central Funds.
Funds may invest in Fidelity Central Funds, which are open-end investment companies generally available only to other investment companies and accounts managed by the investment adviser and its affiliates. The Schedule of Investments lists any Fidelity Central Funds held as an investment as of period end, but does not include the underlying holdings of each Fidelity Central Fund. An investing fund indirectly bears its proportionate share of the expenses of the underlying Fidelity Central Funds.
Based on its investment objective, each Fidelity Central Fund may invest or participate in various investment vehicles or strategies that are similar to those of the investing fund. These strategies are consistent with the investment objectives of the investing fund and may involve certain economic risks which may cause a decline in value of each of the Fidelity Central Funds and thus a decline in the value of the investing fund.
| Fidelity Central Fund | Investment Manager | Investment Objective | Investment Practices | Expense Ratio A |
| Fidelity Money Market Central Funds | Fidelity Management & Research Company LLC (FMR) | Each fund seeks to obtain a high level of current income consistent with the preservation of capital and liquidity. | Short-term Investments | Less than .005% |
A Expenses expressed as a percentage of average net assets and are as of each underlying Central Fund's most recent annual or semi-annual shareholder report.
A complete unaudited list of holdings for each Fidelity Central Fund is available upon request or at the Securities and Exchange Commission website at www.sec.gov. In addition, the financial statements of the Fidelity Central Funds which contain the significant accounting policies (including investment valuation policies) of those funds, and are not covered by the Report of Independent Registered Public Accounting Firm, are available on the Securities and Exchange Commission website or upon request.
3. Significant Accounting Policies.
The Fund is an investment company and applies the accounting and reporting guidance of the Financial Accounting Standards Board (FASB) Accounting Standards Codification Topic 946 Financial Services - Investment Companies . The financial statements have been prepared in conformity with accounting principles generally accepted in the United States of America (GAAP), which require management to make certain estimates and assumptions at the date of the financial statements. Actual results could differ from those estimates. Subsequent events, if any, through the date that the financial statements were issued have been evaluated in the preparation of the financial statements. The Fund's Schedule of Investments lists any underlying mutual funds or exchange-traded funds (ETFs) but does not include the underlying holdings of these funds. The following summarizes the significant accounting policies of the Fund:
Investment Valuation. Investments are valued as of 4:00 p.m. Eastern time on the last calendar day of the period. The Board of Trustees (the Board) has designated the Fund's investment adviser as the valuation designee responsible for the fair valuation function and performing fair value determinations as needed. The investment adviser has established a Fair Value Committee (the Committee) to carry out the day-to-day fair valuation responsibilities and has adopted policies and procedures to govern the fair valuation process and the activities of the Committee. In accordance with these fair valuation policies and procedures, which have been approved by the Board, the Fund attempts to obtain prices from one or more third party pricing services or brokers to value its investments. When current market prices, quotations or currency exchange rates are not readily available or reliable, investments will be fair valued in good faith by the Committee, in accordance with the policies and procedures. Factors used in determining fair value vary by investment type and may include market or investment specific events, transaction data, estimated cash flows, and market observations of comparable investments. The frequency that the fair valuation procedures are used cannot be predicted and they may be utilized to a significant extent. The Committee manages the Fund's fair valuation practices and maintains the fair valuation policies and procedures. The Fund's investment adviser reports to the Board information regarding the fair valuation process and related material matters.
The Fund categorizes the inputs to valuation techniques used to value its investments into a disclosure hierarchy consisting of three levels as shown below:
Level 1 - unadjusted quoted prices in active markets for identical investments
Level 2 - other significant observable inputs (including quoted prices for similar investments, interest rates, prepayment speeds, etc.)
Level 3 - unobservable inputs (including the Fund's own assumptions based on the best information available)
Valuation techniques used to value the Fund's investments by major category are as follows:
Equity securities, including restricted securities, for which market quotations are readily available, are valued at the last reported sale price or official closing price as reported by a third party pricing service on the primary market or exchange on which they are traded and are categorized as Level 1 in the hierarchy. In the event there were no sales during the day or closing prices are not available, securities are valued at the last quoted bid price or may be valued using the last available price and are generally categorized as Level 2 in the hierarchy. For foreign equity securities, when market or security specific events arise, comparisons to the valuation of American Depositary Receipts (ADRs), futures contracts, ETFs and certain indexes as well as quoted prices for similar securities may be used and would be categorized as Level 2 in the hierarchy. For equity securities, including restricted securities, where observable inputs are limited, assumptions about market activity and risk are used and these securities may be categorized as Level 3 in the hierarchy.
Investments in open-end mutual funds, including the Fidelity Central Funds, are valued at their closing net asset value (NAV) each business day and are categorized as Level 1 in the hierarchy.
Changes in valuation techniques may result in transfers in or out of an assigned level within the disclosure hierarchy. The aggregate value of investments by input level as of April 30, 2023 is included at the end of the Fund's Schedule of Investments.
Foreign Currency. Certain Funds may use foreign currency contracts to facilitate transactions in foreign-denominated securities. Gains and losses from these transactions may arise from changes in the value of the foreign currency or if the counterparties do not perform under the contracts' terms.
Foreign-denominated assets, including investment securities, and liabilities are translated into U.S. dollars at the exchange rates at period end. Purchases and sales of investment securities, income and dividends received, and expenses denominated in foreign currencies are translated into U.S. dollars at the exchange rate in effect on the transaction date.
The effects of exchange rate fluctuations on investments are included with the net realized and unrealized gain (loss) on investment securities. Other foreign currency transactions resulting in realized and unrealized gain (loss) are disclosed separately.
Investment Transactions and Income. For financial reporting purposes, the Fund's investment holdings and NAV include trades executed through the end of the last business day of the period. The NAV per share for processing shareholder transactions is calculated as of the close of business of the New York Stock Exchange (NYSE), normally 4:00 p.m. Eastern time and includes trades executed through the end of the prior business day. Gains and losses on securities sold are determined on the basis of identified cost. Commissions paid to certain brokers with whom the investment adviser, or its affiliates, places trades on behalf of a fund include an amount in addition to trade execution, which may be rebated back to a fund. Any such rebates are included in net realized gain (loss) on investments in the Statement of Operations. Dividend income is recorded on the ex-dividend date, except for certain dividends from foreign securities where the ex-dividend date may have passed, which are recorded as soon as the Fund is informed of the ex-dividend date. Non-cash dividends included in dividend income, if any, are recorded at the fair market value of the securities received. Income and capital gain distributions from Fidelity Central Funds, if any, are recorded on the ex-dividend date. Certain distributions received by the Fund represent a return of capital or capital gain. The Fund determines the components of these distributions subsequent to the ex-dividend date, based upon receipt of tax filings or other correspondence relating to the underlying investment. These distributions are recorded as a reduction of cost of investments and/or as a realized gain. Interest income is accrued as earned and includes coupon interest and amortization of premium and accretion of discount on debt securities as applicable. Investment income is recorded net of foreign taxes withheld where recovery of such taxes is uncertain. Funds may file withholding tax reclaims in certain jurisdictions to recover a portion of amounts previously withheld. Any withholding tax reclaims income is included in the Statement of Operations in foreign taxes withheld. Any receivables for withholding tax reclaims are included in the Statement of Assets and Liabilities in reclaims receivable.
Expenses. Expenses directly attributable to a fund are charged to that fund. Expenses attributable to more than one fund are allocated among the respective funds on the basis of relative net assets or other appropriate methods. Expenses included in the accompanying financial statements reflect the expenses of that fund and do not include any expenses associated with any underlying mutual funds or exchange-traded funds. Although not included in a fund's expenses, a fund indirectly bears its proportionate share of these expenses through the net asset value of each underlying mutual fund or exchange-traded fund. Expense estimates are accrued in the period to which they relate and adjustments are made when actual amounts are known.
Income Tax Information and Distributions to Shareholders. Each year, the Fund intends to qualify as a regulated investment company under Subchapter M of the Internal Revenue Code, including distributing substantially all of its taxable income and realized gains. As a result, no provision for U.S. Federal income taxes is required. The Fund files a U.S. federal tax return, in addition to state and local tax returns as required. The Fund's federal income tax returns are subject to examination by the Internal Revenue Service (IRS) for a period of three fiscal years after they are filed. State and local tax returns may be subject to examination for an additional fiscal year depending on the jurisdiction. Foreign taxes are provided for based on the Fund's understanding of the tax rules and rates that exist in the foreign markets in which it invests. The Fund is subject to a tax imposed on capital gains by certain countries in which it invests. An estimated deferred tax liability for net unrealized appreciation on the applicable securities is included in Deferred taxes on the Statement of Assets & Liabilities.
Distributions are declared and recorded on the ex-dividend date. Income and capital gain distributions are determined in accordance with income tax regulations, which may differ from GAAP.
Capital accounts within the financial statements are adjusted for permanent book-tax differences. These adjustments have no impact on net assets or the results of operations. Capital accounts are not adjusted for temporary book-tax differences which will reverse in a subsequent period.
Book-tax differences are primarily due to foreign currency transactions, certain foreign taxes, capital loss carryforwards and losses deferred due to wash sales.
As of period end, the cost and unrealized appreciation (depreciation) in securities, and derivatives if applicable, for federal income tax purposes were as follows:
| Gross unrealized appreciation | $213,773,128 |
| Gross unrealized depreciation | (16,594,703) |
| Net unrealized appreciation (depreciation) | $197,178,425 |
| Tax cost | $796,678,790 |
Capital loss carryforwards are only available to offset future capital gains of the Fund to the extent provided by regulations and may be limited. The capital loss carryforward information presented below, including any applicable limitation, is estimated as of prior fiscal period end and is subject to adjustment.
4. Purchases and Sales of Investments.
Purchases and sales of securities, other than short-term securities and in-kind transactions, as applicable, are noted in the table below.
| | Purchases ($) | Sales ($) |
| Fidelity International Capital Appreciation K6 Fund | 471,475,702 | 416,779,669 |
Prior Year Unaffiliated Exchanges In-Kind. Shares that were exchanged for investments, including accrued interest and cash, if any, are shown in the table below. The amount of in-kind exchanges is included in share transactions in the accompanying Statement of Changes in Net Assets.
| | Shares | Total Proceeds ($) |
| Fidelity International Capital Appreciation K6 Fund | 6,790,346 | 84,381,011 |
5. Fees and Other Transactions with Affiliates.
Management Fee. Fidelity Management & Research Company LLC (the investment adviser) and its affiliates provide the Fund with investment management related services for which the Fund pays a monthly management fee that is based on an annual rate of .65% of average net assets. Under the management contract, the investment adviser or an affiliate pays all other expenses of the Fund, excluding fees and expenses of the independent Trustees, and certain miscellaneous expenses such as proxy and shareholder meeting expenses.
Brokerage Commissions. A portion of portfolio transactions were placed with brokerage firms which are affiliates of the investment adviser. Brokerage commissions are included in net realized gain (loss) and change in net unrealized appreciation (depreciation) in the Statement of Operations. The commissions paid to these affiliated firms were as follows:
| | Amount |
| Fidelity International Capital Appreciation K6 Fund | $565 |
Interfund Lending Program. Pursuant to an Exemptive Order issued by the Securities and Exchange Commission (the SEC), the Fund, along with other registered investment companies having management contracts with Fidelity Management & Research Company LLC (FMR), or other affiliated entities of FMR, may participate in an interfund lending program. This program provides an alternative credit facility allowing the Fund to borrow from, or lend money to, other participating affiliated funds. At period end, there were no interfund loans outstanding. Activity in this program during the period for which loans were outstanding was as follows:
| | Borrower or Lender | Average Loan Balance | Weighted Average Interest Rate | Interest Expense |
Fidelity International Capital Appreciation K6 Fund | Borrower | $ 7,746,636 | 4.81% | $22,775 |
Interfund Trades. Funds may purchase from or sell securities to other Fidelity Funds under procedures adopted by the Board. The procedures have been designed to ensure these interfund trades are executed in accordance with Rule 17a-7 of the 1940 Act. Any interfund trades are included within the respective purchases and sales amounts shown in the Purchases and Sales of Investments note. Interfund trades during the period are noted in the table below.
| | Purchases ($) | Sales ($) | Realized Gain (Loss) ($) |
| Fidelity International Capital Appreciation K6 Fund | 38,452,213 | 9,714,067 | 556,599 |
6. Committed Line of Credit.
Certain Funds participate with other funds managed by the investment adviser or an affiliate in a $4.25 billion credit facility (the "line of credit") to be utilized for temporary or emergency purposes to fund shareholder redemptions or for other short-term liquidity purposes. The commitment fees on the pro-rata portion of the line of credit are borne by the investment adviser. During the period, there were no borrowings on this line of credit.
7. Security Lending.
Funds lend portfolio securities from time to time in order to earn additional income. Lending agents are used, including National Financial Services (NFS), an affiliate of the investment adviser. Pursuant to a securities lending agreement, NFS will receive a fee, which is capped at 9.9% of a fund's daily lending revenue, for its services as lending agent. A fund may lend securities to certain qualified borrowers, including NFS. On the settlement date of the loan, a fund receives collateral (in the form of U.S. Treasury obligations, letters of credit and/or cash) against the loaned securities and maintains collateral in an amount not less than 100% of the market value of the loaned securities during the period of the loan. The market value of the loaned securities is determined at the close of business of a fund and any additional required collateral is delivered to a fund on the next business day. A fund or borrower may terminate the loan at any time, and if the borrower defaults on its obligation to return the securities loaned because of insolvency or other reasons, a fund may apply collateral received from the borrower against the obligation. A fund may experience delays and costs in recovering the securities loaned. Any cash collateral received is invested in the Fidelity Securities Lending Cash Central Fund. Any loaned securities are identified as such in the Schedule of Investments, and the value of loaned securities and cash collateral at period end, as applicable, are presented in the Statement of Assets and Liabilities. Security lending income represents the income earned on investing cash collateral, less rebates paid to borrowers and any lending agent fees associated with the loan, plus any premium payments received for lending certain types of securities. Security lending income is presented in the Statement of Operations as a component of income from Fidelity Central Funds. Affiliated security lending activity, if any, was as follows:
| | Total Security Lending Fees Paid to NFS | Security Lending Income From Securities Loaned to NFS | Value of Securities Loaned to NFS at Period End |
| Fidelity International Capital Appreciation K6 Fund | $864 | $- | $- |
8. Expense Reductions.
Through arrangements with the Fund's custodian, credits realized as a result of certain uninvested cash balances were used to reduce the Fund's expenses by $14.
9. Other.
A fund's organizational documents provide former and current trustees and officers with a limited indemnification against liabilities arising in connection with the performance of their duties to the fund. In the normal course of business, a fund may also enter into contracts that provide general indemnifications. A fund's maximum exposure under these arrangements is unknown as this would be dependent on future claims that may be made against a fund. The risk of material loss from such claims is considered remote.
10. Risk and Uncertainties.
Many factors affect a fund's performance. Developments that disrupt global economies and financial markets, such as pandemics, epidemics, outbreaks of infectious diseases, war, terrorism, and environmental disasters, may significantly affect a fund's investment performance. The effects of these developments to a fund will be impacted by the types of securities in which a fund invests, the financial condition, industry, economic sector, and geographic location of an issuer, and a fund's level of investment in the securities of that issuer. Significant concentrations in security types, issuers, industries, sectors, and geographic locations may magnify the factors that affect a fund's performance.
As a shareholder, you incur two types of costs: (1) transaction costs, which may include sales charges (loads) on purchase payments or redemption proceeds, as applicable and (2) ongoing costs, which generally include management fees, distribution and/or service (12b-1) fees and other Fund expenses. This Example is intended to help you understand your ongoing costs (in dollars) of investing in a fund and to compare these costs with the ongoing costs of investing in other mutual funds.
| The Example is based on an investment of $1,000 invested at the beginning of the period and held for the entire period (November 1, 2022 to April 30, 2023). |
Actual Expenses
The first line of the accompanying table provides information about actual account values and actual expenses. You may use the information in this line, together with the amount you invested, to estimate the expenses that you paid over the period. Simply divide your account value by $1,000.00 (for example, an $8,600 account value divided by $1,000.00 = 8.6), then multiply the result by the number in the first line for a class/Fund under the heading entitled "Expenses Paid During Period" to estimate the expenses you paid on your account during this period. If any fund is a shareholder of any underlying mutual funds or exchange-traded funds (ETFs) (the Underlying Funds), such fund indirectly bears its proportional share of the expenses of the Underlying Funds in addition to the direct expenses incurred presented in the table. These fees and expenses are not included in the annualized expense ratio used to calculate the expense estimate in the table below.
Hypothetical Example for Comparison Purposes
The second line of the accompanying table provides information about hypothetical account values and hypothetical expenses based on the actual expense ratio and an assumed rate of return of 5% per year before expenses, which is not the actual return. The hypothetical account values and expenses may not be used to estimate the actual ending account balance or expenses you paid for the period. You may use this information to compare the ongoing costs of investing in the Fund and other funds. To do so, compare this 5% hypothetical example with the 5% hypothetical examples that appear in the shareholder reports of the other funds. If any fund is a shareholder of any Underlying Funds, such fund indirectly bears its proportional share of the expenses of the Underlying Funds in addition to the direct expenses as presented in the table. These fees and expenses are not included in the annualized expense ratio used to calculate the expense estimate in the table below.
Please note that the expenses shown in the table are meant to highlight your ongoing costs only and do not reflect any transaction costs. Therefore, the second line of the table is useful in comparing ongoing costs only, and will not help you determine the relative total costs of owning different funds. In addition, if these transactional costs were included, your costs would have been higher.
| | | | | Annualized Expense Ratio- A | | Beginning Account Value November 1, 2022 | | Ending Account Value April 30, 2023 | | Expenses Paid During Period- C November 1, 2022 to April 30, 2023 |
| | | | | | | | | | |
| Fidelity® International Capital Appreciation K6 Fund | | | | .66% | | | | | | |
| Actual | | | | | | $ 1,000 | | $ 1,221.50 | | $ 3.64 |
Hypothetical- B | | | | | | $ 1,000 | | $ 1,021.52 | | $ 3.31 |
| |
A Annualized expense ratio reflects expenses net of applicable fee waivers.
B 5% return per year before expenses
C Expenses are equal to the annualized expense ratio, multiplied by the average account value over the period, multiplied by 181/ 365 (to reflect the one-half year period). The fees and expenses of any Underlying Funds are not included in each annualized expense ratio.
The Securities and Exchange Commission adopted Rule 22e-4 under the Investment Company Act of 1940 (the Liquidity Rule) to promote effective liquidity risk management throughout the open-end investment company industry, thereby reducing the risk that funds will be unable to meet their redemption obligations and mitigating dilution of the interests of fund shareholders.
The Fund has adopted and implemented a liquidity risk management program (the Program) reasonably designed to assess and manage the Fund's liquidity risk and to comply with the requirements of the Liquidity Rule. The Fund's Board of Trustees (the Board) has designated the Fund's investment adviser as administrator of the Program. The Fidelity advisers have established a Liquidity Risk Management Committee (the LRM Committee) to manage the Program for each of the Fidelity Funds. The LRM Committee monitors the adequacy and effectiveness of implementation of the Program and on a periodic basis assesses each Fund's liquidity risk based on a variety of factors including (1) the Fund's investment strategy, (2) portfolio liquidity and cash flow projections during normal and reasonably foreseeable stressed conditions, (3) shareholder redemptions, (4) borrowings and other funding sources and (5) certain factors specific to ETFs including the effect of the Fund's prices and spreads, market participants, and basket compositions on the overall liquidity of the Fund's portfolio, as applicable.
In accordance with the Program, each of the Fund's portfolio investments is classified into one of four defined liquidity categories based on a determination of a reasonable expectation for how long it would take to convert the investment to cash (or sell or dispose of the investment) without significantly changing its market value.
- Highly liquid investments - cash or convertible to cash within three business days or less
- Moderately liquid investments - convertible to cash in three to seven calendar days
- Less liquid investments - can be sold or disposed of, but not settled, within seven calendar days
- Illiquid investments - cannot be sold or disposed of within seven calendar days
Liquidity classification determinations take into account a variety of factors including various market, trading and investment-specific considerations, as well as market depth, and generally utilize analysis from a third-party liquidity metrics service.
The Liquidity Rule places a 15% limit on a fund's illiquid investments and requires funds that do not primarily hold assets that are highly liquid investments to determine and maintain a minimum percentage of the fund's net assets to be invested in highly liquid investments (highly liquid investment minimum or HLIM). The Program includes provisions reasonably designed to comply with the 15% limit on illiquid investments and for determining, periodically reviewing and complying with the HLIM requirement as applicable.
At a recent meeting of the Fund's Board of Trustees, the LRM Committee provided a written report to the Board pertaining to the operation, adequacy, and effectiveness of the Program for the period December 1, 2021 through November 30, 2022. The report concluded that the Program is operating effectively and is reasonably designed to assess and manage the Fund's liquidity risk.
1.9883990.105
IVFK6-SANN-0623
Fidelity® Series Overseas Fund
Semi-Annual Report
April 30, 2023
Contents
To view a fund's proxy voting guidelines and proxy voting record for the 12-month period ended June 30, visit http://www.fidelity.com/proxyvotingresults or visit the Securities and Exchange Commission's (SEC) web site at http://www.sec.gov.
You may also call 1-800-544-8544 to request a free copy of the proxy voting guidelines.
Standard & Poor's, S&P and S&P 500 are registered service marks of The McGraw-Hill Companies, Inc. and have been licensed for use by Fidelity Distributors Corporation.
Other third-party marks appearing herein are the property of their respective owners.
All other marks appearing herein are registered or unregistered trademarks or service marks of FMR LLC or an affiliated company. © 2023 FMR LLC. All rights reserved.
This report and the financial statements contained herein are submitted for the general information of the shareholders of the Fund. This report is not authorized for distribution to prospective investors in the Fund unless preceded or accompanied by an effective prospectus.
A fund files its complete schedule of portfolio holdings with the SEC for the first and third quarters of each fiscal year on Form N-PORT. Forms N-PORT are available on the SEC's web site at http://www.sec.gov. A fund's Forms N-PORT may be reviewed and copied at the SEC's Public Reference Room in Washington, DC. Information regarding the operation of the SEC's Public Reference Room may be obtained by calling 1-800-SEC-0330.
For a complete list of a fund's portfolio holdings, view the most recent holdings listing, semiannual report, or annual report on Fidelity's web site at http://www.fidelity.com, http://www.institutional.fidelity.com, or http://www.401k.com, as applicable.
NOT FDIC INSURED •MAY LOSE VALUE •NO BANK GUARANTEE
Neither the Fund nor Fidelity Distributors Corporation is a bank.
Top Holdings (% of Fund's net assets) |
| |
| LVMH Moet Hennessy Louis Vuitton SE (France, Textiles, Apparel & Luxury Goods) | 3.4 | |
| ASML Holding NV (Netherlands) (Netherlands, Semiconductors & Semiconductor Equipment) | 2.6 | |
| AstraZeneca PLC (United Kingdom) (United Kingdom, Pharmaceuticals) | 2.6 | |
| Novo Nordisk A/S Series B (Denmark, Pharmaceuticals) | 2.5 | |
| Diageo PLC (United Kingdom, Beverages) | 2.1 | |
| Nestle SA (Reg. S) (United States of America, Food Products) | 2.0 | |
| Compagnie Financiere Richemont SA Series A (Switzerland, Textiles, Apparel & Luxury Goods) | 2.0 | |
| AIA Group Ltd. (Hong Kong, Insurance) | 2.0 | |
| TotalEnergies SE (France, Oil, Gas & Consumable Fuels) | 2.0 | |
| Compass Group PLC (United Kingdom, Hotels, Restaurants & Leisure) | 1.8 | |
| | 23.0 | |
| |
| Market Sectors (% of Fund's net assets) |
| |
| Financials | 21.5 | |
| Industrials | 21.5 | |
| Health Care | 15.3 | |
| Information Technology | 12.1 | |
| Consumer Discretionary | 12.0 | |
| Consumer Staples | 7.8 | |
| Materials | 5.3 | |
| Energy | 2.0 | |
| Real Estate | 1.1 | |
| Communication Services | 0.6 | |
| |
Asset Allocation (% of Fund's net assets) |
|
|
Geographic Diversification (% of Fund's net assets) |
|
* Includes Short-Term investments and Net Other Assets (Liabilities). Percentages are adjusted for the effect of derivatives, if applicable. |
| |
Showing Percentage of Net Assets
| Common Stocks - 99.2% |
| | | Shares | Value ($) |
| Australia - 0.8% | | | |
| Flutter Entertainment PLC (a) | | 525,002 | 105,006,576 |
| Belgium - 1.2% | | | |
| Azelis Group NV | | 1,450,843 | 34,371,704 |
| KBC Group NV | | 1,738,365 | 124,086,374 |
TOTAL BELGIUM | | | 158,458,078 |
| Canada - 1.5% | | | |
| Constellation Software, Inc. | | 105,670 | 206,825,715 |
| Lumine Group, Inc. | | 320,650 | 4,319,196 |
TOTAL CANADA | | | 211,144,911 |
| China - 0.0% | | | |
| Chervon Holdings Ltd. | | 1,013,200 | 5,156,046 |
| Denmark - 4.9% | | | |
| Carlsberg A/S Series B | | 540,100 | 89,224,887 |
| DSV A/S | | 1,284,831 | 241,315,365 |
| Novo Nordisk A/S Series B | | 2,025,900 | 337,017,581 |
TOTAL DENMARK | | | 667,557,833 |
| Finland - 1.1% | | | |
| Nordea Bank ABP | | 13,224,000 | 146,772,144 |
| France - 18.2% | | | |
| Air Liquide SA | | 1,151,060 | 207,064,450 |
| ALTEN | | 878,601 | 149,092,088 |
| Antin Infrastructure Partners SA | | 348,800 | 5,880,444 |
| BNP Paribas SA | | 1,233,500 | 79,700,616 |
| Capgemini SA | | 1,070,062 | 194,433,807 |
| Edenred SA | | 3,459,127 | 224,580,181 |
| EssilorLuxottica SA | | 1,064,416 | 210,414,670 |
| L'Oreal SA | | 424,500 | 202,421,647 |
| LVMH Moet Hennessy Louis Vuitton SE | | 489,439 | 470,782,237 |
| Pernod Ricard SA | | 960,200 | 221,554,493 |
| Safran SA | | 1,393,800 | 216,763,452 |
| Teleperformance (b) | | 244,728 | 48,755,574 |
| TotalEnergies SE | | 4,204,779 | 268,685,139 |
TOTAL FRANCE | | | 2,500,128,798 |
| Germany - 7.7% | | | |
| Allianz SE | | 762,433 | 191,452,153 |
| Deutsche Borse AG | | 955,360 | 182,195,413 |
| Hannover Reuck SE | | 826,916 | 176,404,204 |
| Infineon Technologies AG | | 4,318,500 | 157,265,844 |
| Merck KGaA | | 1,066,500 | 191,024,915 |
| Siemens Healthineers AG (c) | | 2,625,200 | 163,206,578 |
TOTAL GERMANY | | | 1,061,549,107 |
| Hong Kong - 2.0% | | | |
| AIA Group Ltd. | | 25,203,588 | 274,393,371 |
| India - 1.7% | | | |
| HCL Technologies Ltd. | | 3,668,200 | 48,008,811 |
| HDFC Bank Ltd. | | 8,845,200 | 183,069,332 |
TOTAL INDIA | | | 231,078,143 |
| Ireland - 1.0% | | | |
| Kingspan Group PLC (Ireland) | | 2,063,300 | 142,551,602 |
| Italy - 2.6% | | | |
| FinecoBank SpA | | 8,663,385 | 131,069,105 |
| GVS SpA (a)(c) | | 869,538 | 5,916,539 |
| Recordati SpA | | 3,020,439 | 138,886,693 |
| UniCredit SpA | | 4,186,000 | 82,947,599 |
TOTAL ITALY | | | 358,819,936 |
| Japan - 11.1% | | | |
| Bandai Namco Holdings, Inc. | | 1,743,000 | 39,592,979 |
| BayCurrent Consulting, Inc. | | 1,053,900 | 36,633,574 |
| Capcom Co. Ltd. | | 2,110,000 | 79,288,760 |
| FUJIFILM Holdings Corp. | | 1,890,800 | 98,548,444 |
| Hoya Corp. | | 1,526,207 | 160,030,499 |
| Misumi Group, Inc. | | 2,667,661 | 67,297,637 |
| Olympus Corp. | | 4,132,992 | 72,353,881 |
| Persol Holdings Co. Ltd. | | 4,066,353 | 83,845,821 |
| Relo Group, Inc. | | 3,070,328 | 47,732,510 |
| Shin-Etsu Chemical Co. Ltd. | | 3,762,500 | 107,366,030 |
| SMC Corp. | | 273,921 | 136,616,681 |
| Sony Group Corp. | | 2,525,600 | 228,500,496 |
| Suzuki Motor Corp. | | 2,508,445 | 87,465,657 |
| TIS, Inc. | | 2,370,676 | 65,098,109 |
| Tokio Marine Holdings, Inc. | | 6,461,600 | 129,923,609 |
| Tokyo Electron Ltd. | | 752,400 | 86,153,944 |
TOTAL JAPAN | | | 1,526,448,631 |
| Luxembourg - 0.8% | | | |
| Eurofins Scientific SA (b) | | 1,509,600 | 105,228,470 |
| Netherlands - 7.4% | | | |
| ASM International NV (Netherlands) | | 395,600 | 143,000,813 |
| ASML Holding NV (Netherlands) | | 569,928 | 360,160,100 |
| Euronext NV (c) | | 1,093,360 | 86,864,161 |
| IMCD NV | | 1,100,451 | 165,154,343 |
| Topicus.Com, Inc. (a) | | 190,677 | 12,701,479 |
| Wolters Kluwer NV | | 1,869,951 | 247,568,955 |
TOTAL NETHERLANDS | | | 1,015,449,851 |
| Spain - 1.4% | | | |
| Amadeus IT Holding SA Class A (a) | | 2,669,070 | 187,595,662 |
| Sweden - 3.4% | | | |
| AddTech AB (B Shares) | | 4,651,119 | 92,976,572 |
| Atlas Copco AB (A Shares) | | 12,494,200 | 180,437,055 |
| Indutrade AB (b) | | 7,103,275 | 170,186,851 |
| Kry International AB (a)(d)(e) | | 4,451 | 347,929 |
| Nordnet AB | | 1,701,309 | 26,676,660 |
TOTAL SWEDEN | | | 470,625,067 |
| Switzerland - 6.0% | | | |
| Compagnie Financiere Richemont SA Series A | | 1,691,080 | 279,536,998 |
| Julius Baer Group Ltd. | | 2,289,018 | 163,177,521 |
| Partners Group Holding AG | | 118,630 | 114,562,193 |
| Sika AG | | 747,731 | 206,540,515 |
| Sonova Holding AG | | 204,833 | 64,576,763 |
TOTAL SWITZERLAND | | | 828,393,990 |
| Taiwan - 0.6% | | | |
| Taiwan Semiconductor Manufacturing Co. Ltd. | | 4,550,684 | 74,468,072 |
| United Kingdom - 14.1% | | | |
| Ashtead Group PLC | | 1,690,400 | 97,234,255 |
| AstraZeneca PLC (United Kingdom) | | 2,414,400 | 355,310,313 |
| BAE Systems PLC | | 10,773,100 | 137,249,121 |
| Beazley PLC | | 8,175,351 | 61,183,888 |
| Compass Group PLC | | 9,500,687 | 250,637,247 |
| Dechra Pharmaceuticals PLC | | 1,383,363 | 64,847,596 |
| Diageo PLC | | 6,319,647 | 288,277,709 |
| Diploma PLC | | 1,508,431 | 50,919,057 |
| Hiscox Ltd. | | 4,691,272 | 69,687,837 |
| London Stock Exchange Group PLC | | 1,334,900 | 140,155,509 |
| RELX PLC (London Stock Exchange) | | 7,143,755 | 237,555,608 |
| Rentokil Initial PLC | | 22,100,622 | 175,948,677 |
TOTAL UNITED KINGDOM | | | 1,929,006,817 |
| United States of America - 11.7% | | | |
| CBRE Group, Inc. (a) | | 1,365,700 | 104,694,562 |
| CDW Corp. | | 338,314 | 57,374,671 |
| Equifax, Inc. | | 287,000 | 59,805,060 |
| Experian PLC | | 4,360,200 | 154,372,371 |
| Ferguson PLC | | 1,142,400 | 160,727,869 |
| ICON PLC (a) | | 553,300 | 106,615,377 |
| Linde PLC | | 563,400 | 208,148,130 |
| Marsh & McLennan Companies, Inc. | | 1,151,228 | 207,439,773 |
| Nestle SA (Reg. S) | | 2,187,951 | 280,691,302 |
| S&P Global, Inc. | | 437,251 | 158,538,468 |
| Thermo Fisher Scientific, Inc. | | 189,000 | 104,876,100 |
TOTAL UNITED STATES OF AMERICA | | | 1,603,283,683 |
| TOTAL COMMON STOCKS (Cost $10,671,260,348) | | | 13,603,116,788 |
| | | | |
| Nonconvertible Preferred Stocks - 0.0% |
| | | Shares | Value ($) |
| Sweden - 0.0% | | | |
Kry International AB Series E (a)(d)(e) (Cost $11,754,376) | | 25,711 | 2,009,798 |
| | | | |
| Money Market Funds - 1.9% |
| | | Shares | Value ($) |
| Fidelity Cash Central Fund 4.88% (f) | | 164,962,317 | 164,995,310 |
| Fidelity Securities Lending Cash Central Fund 4.88% (f)(g) | | 90,826,934 | 90,836,016 |
| TOTAL MONEY MARKET FUNDS (Cost $255,831,326) | | | 255,831,326 |
| | | | |
| TOTAL INVESTMENT IN SECURITIES - 101.1% (Cost $10,938,846,050) | 13,860,957,912 |
NET OTHER ASSETS (LIABILITIES) - (1.1)% | (144,195,367) |
| NET ASSETS - 100.0% | 13,716,762,545 |
| | |
Legend
| (b) | Security or a portion of the security is on loan at period end. |
| (c) | Security exempt from registration under Rule 144A of the Securities Act of 1933. These securities may be resold in transactions exempt from registration, normally to qualified institutional buyers. At the end of the period, the value of these securities amounted to $255,987,278 or 1.9% of net assets. |
| (d) | Restricted securities (including private placements) - Investment in securities not registered under the Securities Act of 1933 (excluding 144A issues). At the end of the period, the value of restricted securities (excluding 144A issues) amounted to $2,357,727 or 0.0% of net assets. |
| (f) | Affiliated fund that is generally available only to investment companies and other accounts managed by Fidelity Investments. The rate quoted is the annualized seven-day yield of the fund at period end. A complete unaudited listing of the fund's holdings as of its most recent quarter end is available upon request. In addition, each Fidelity Central Fund's financial statements are available on the SEC's website or upon request. |
| (g) | Investment made with cash collateral received from securities on loan. |
| Additional information on each restricted holding is as follows: |
| Security | Acquisition Date | Acquisition Cost ($) |
| Kry International AB | 5/14/21 | 1,933,095 |
| | | |
| Kry International AB Series E | 5/14/21 | 11,754,376 |
| | | |
Affiliated Central Funds
Fiscal year to date information regarding the Fund's investments in Fidelity Central Funds, including the ownership percentage, is presented below.
| Affiliate | Value, beginning of period ($) | Purchases ($) | Sales Proceeds ($) | Dividend Income ($) | Realized Gain (loss) ($) | Change in Unrealized appreciation (depreciation) ($) | Value, end of period ($) | % ownership, end of period |
| Fidelity Cash Central Fund 4.88% | 433,222,869 | 1,525,793,862 | 1,794,021,421 | 2,828,150 | - | - | 164,995,310 | 0.4% |
| Fidelity Securities Lending Cash Central Fund 4.88% | 246,472,375 | 968,703,013 | 1,124,339,372 | 546,966 | - | - | 90,836,016 | 0.3% |
| Total | 679,695,244 | 2,494,496,875 | 2,918,360,793 | 3,375,116 | - | - | 255,831,326 | |
| | | | | | | | | |
Amounts in the dividend income column in the above table include any capital gain distributions from underlying funds, which are presented in the corresponding line item in the Statement of Operations, if applicable.
Amounts in the dividend income column for Fidelity Securities Lending Cash Central Fund represents the income earned on investing cash collateral, less rebates paid to borrowers and any lending agent fees associated with the loan, plus any premium payments received for lending certain types of securities.
Amounts included in the purchases and sales proceeds columns may include in-kind transactions, if applicable.
Investment Valuation
The following is a summary of the inputs used, as of April 30, 2023, involving the Fund's assets and liabilities carried at fair value. The inputs or methodology used for valuing securities may not be an indication of the risk associated with investing in those securities. For more information on valuation inputs, and their aggregation into the levels used below, please refer to the Investment Valuation section in the accompanying Notes to Financial Statements.
| Valuation Inputs at Reporting Date: |
| Description | Total ($) | Level 1 ($) | Level 2 ($) | Level 3 ($) |
Investments in Securities: | | | | |
|
| Equities: | | | | |
Communication Services | 79,288,760 | - | 79,288,760 | - |
Consumer Discretionary | 1,654,273,898 | 105,006,576 | 1,549,267,322 | - |
Consumer Staples | 1,082,170,038 | 513,201,027 | 568,969,011 | - |
Energy | 268,685,139 | - | 268,685,139 | - |
Financials | 2,960,760,555 | 1,696,922,953 | 1,263,837,602 | - |
Health Care | 2,074,389,436 | 1,149,677,162 | 924,712,274 | - |
Industrials | 2,944,203,743 | 1,935,476,409 | 1,008,727,334 | - |
Information Technology | 1,659,808,820 | 1,127,907,869 | 529,543,224 | 2,357,727 |
Materials | 729,119,125 | 208,148,130 | 520,970,995 | - |
Real Estate | 152,427,072 | 104,694,562 | 47,732,510 | - |
|
| Money Market Funds | 255,831,326 | 255,831,326 | - | - |
| Total Investments in Securities: | 13,860,957,912 | 7,096,866,014 | 6,761,734,171 | 2,357,727 |
| Statement of Assets and Liabilities |
| | | | April 30, 2023 (Unaudited) |
| | | | | |
| Assets | | | | |
| Investment in securities, at value (including securities loaned of $86,995,514) - See accompanying schedule: | | | | |
Unaffiliated issuers (cost $10,683,014,724) | $ | 13,605,126,586 | | |
Fidelity Central Funds (cost $255,831,326) | | 255,831,326 | | |
| | | | | |
| | | | | |
| Total Investment in Securities (cost $10,938,846,050) | | | $ | 13,860,957,912 |
| Foreign currency held at value (cost $6,465,726) | | | | 6,465,532 |
| Receivable for investments sold | | | | 36,110,716 |
| Receivable for fund shares sold | | | | 38,515 |
| Dividends receivable | | | | 28,650,722 |
| Reclaims receivable | | | | 42,789,861 |
| Interest receivable | | | | 761 |
| Distributions receivable from Fidelity Central Funds | | | | 346,732 |
Total assets | | | | 13,975,360,751 |
| Liabilities | | | | |
| Payable for investments purchased | $ | 21,121,705 | | |
| Payable for fund shares redeemed | | 140,721,012 | | |
| Other payables and accrued expenses | | 5,919,473 | | |
| Collateral on securities loaned | | 90,836,016 | | |
| Total Liabilities | | | | 258,598,206 |
| Net Assets | | | $ | 13,716,762,545 |
| Net Assets consist of: | | | | |
| Paid in capital | | | $ | 11,257,584,545 |
| Total accumulated earnings (loss) | | | | 2,459,178,000 |
| Net Assets | | | $ | 13,716,762,545 |
Net Asset Value , offering price and redemption price per share ($13,716,762,545 ÷ 1,109,779,223 shares) | | | $ | 12.36 |
| Statement of Operations |
| | | | Six months ended April 30, 2023 (Unaudited) |
| Investment Income | | | | |
| Dividends | | | $ | 131,036,295 |
| Interest | | | | 32,259 |
| Income from Fidelity Central Funds (including $546,966 from security lending) | | | | 3,375,116 |
| Income before foreign taxes withheld | | | $ | 134,443,670 |
| Less foreign taxes withheld | | | | (16,127,864) |
| Total Income | | | | 118,315,806 |
| Expenses | | | | |
| Custodian fees and expenses | $ | 451,452 | | |
| Independent trustees' fees and expenses | | 41,994 | | |
| Interest | | 34,750 | | |
| Total Expenses | | | | 528,196 |
| Net Investment income (loss) | | | | 117,787,610 |
| Realized and Unrealized Gain (Loss) | | | | |
| Net realized gain (loss) on: | | | | |
| Investment Securities: | | | | |
| Unaffiliated issuers (net of foreign taxes of $623,075) | | (23,486,167) | | |
| Redemptions in-kind | | 68,149,699 | | |
| Foreign currency transactions | | (406,345) | | |
| Total net realized gain (loss) | | | | 44,257,187 |
| Change in net unrealized appreciation (depreciation) on: | | | | |
| Investment Securities: | | | | |
| Unaffiliated issuers(net of increase in deferred foreign taxes of $2,186,449) | | 2,712,469,297 | | |
| Assets and liabilities in foreign currencies | | 4,615,962 | | |
| Total change in net unrealized appreciation (depreciation) | | | | 2,717,085,259 |
| Net gain (loss) | | | | 2,761,342,446 |
| Net increase (decrease) in net assets resulting from operations | | | $ | 2,879,130,056 |
| Statement of Changes in Net Assets |
| |
| | Six months ended April 30, 2023 (Unaudited) | | Year ended October 31, 2022 |
| Increase (Decrease) in Net Assets | | | | |
| Operations | | | | |
| Net investment income (loss) | $ | 117,787,610 | $ | 248,884,392 |
| Net realized gain (loss) | | 44,257,187 | | (580,283,592) |
| Change in net unrealized appreciation (depreciation) | | 2,717,085,259 | | (4,371,425,395) |
| Net increase (decrease) in net assets resulting from operations | | 2,879,130,056 | | (4,702,824,595) |
| Distributions to shareholders | | (228,975,390) | | (454,822,647) |
| Share transactions | | | | |
| Proceeds from sales of shares | | 796,896,465 | | 3,241,589,484 |
| Reinvestment of distributions | | 228,975,390 | | 454,822,647 |
| Cost of shares redeemed | | (2,276,508,363) | | (1,640,720,377) |
Net increase (decrease) in net assets resulting from share transactions | | (1,250,636,508) | | 2,055,691,754 |
| Total increase (decrease) in net assets | | 1,399,518,158 | | (3,101,955,488) |
| | | | | |
| Net Assets | | | | |
| Beginning of period | | 12,317,244,387 | | 15,419,199,875 |
| End of period | $ | 13,716,762,545 | $ | 12,317,244,387 |
| | | | | |
| Other Information | | | | |
| Shares | | | | |
| Sold | | 69,469,841 | | 267,011,806 |
| Issued in reinvestment of distributions | | 20,554,344 | | 32,302,745 |
| Redeemed | | (199,246,361) | | (137,519,813) |
| Net increase (decrease) | | (109,222,176) | | 161,794,738 |
| | | | | |
Financial Highlights
| Fidelity® Series Overseas Fund |
| |
| | Six months ended (Unaudited) April 30, 2023 | | Years ended October 31, 2022 | | 2021 | | 2020 | | 2019 A |
Selected Per-Share Data | | | | | | | | | | |
| Net asset value, beginning of period | $ | 10.10 | $ | 14.58 | $ | 10.62 | $ | 10.20 | $ | 10.00 |
| Income from Investment Operations | | | | | | | | | | |
Net investment income (loss) B,C | | .10 | | .21 | | .17 | | .14 | | .06 D |
| Net realized and unrealized gain (loss) | | 2.36 | | (4.27) | | 3.93 | | .32 | | .14 |
| Total from investment operations | | 2.46 | | (4.06) | | 4.10 | | .46 | | .20 |
| Distributions from net investment income | | (.20) | | (.17) | | (.14) | | (.04) | | - |
| Distributions from net realized gain | | - | | (.25) | | - | | - | | - |
| Total distributions | | (.20) | | (.42) | | (.14) | | (.04) | | - |
| Net asset value, end of period | $ | 12.36 | $ | 10.10 | $ | 14.58 | $ | 10.62 | $ | 10.20 |
Total Return E | | 24.53% | | (28.66)% | | 38.89% | | 4.51% | | 2.00% |
Ratios to Average Net Assets C,F,G | | | | | | | | | | |
| Expenses before reductions | | .01% H | | .01% | | .01% | | .01% | | .01% H |
| Expenses net of fee waivers, if any | | .01% H | | .01% | | .01% | | .01% | | .01% H |
| Expenses net of all reductions | | .01% H | | .01% | | .01% | | .01% | | .01% H |
| Net investment income (loss) | | 1.77% H | | 1.79% | | 1.29% | | 1.35% | | 1.69% D,H |
| Supplemental Data | | | | | | | | | | |
| Net assets, end of period (000 omitted) | $ | 13,716,763 | $ | 12,317,244 | $ | 15,419,200 | $ | 11,508,376 | $ | 6,226,806 |
Portfolio turnover rate I | | 37% H,J | | 28% J | | 33% | | 50% | | 12% J,K |
A For the period June 21, 2019 (commencement of operations) through October 31, 2019.
B Calculated based on average shares outstanding during the period.
C Net investment income (loss) is affected by the timing of the declaration of dividends by any underlying mutual funds or exchange-traded funds (ETFs). Net investment income (loss) of any mutual funds or ETFs is not included in the Fund's net investment income (loss) ratio.
D Net investment income per share reflects one or more large, non-recurring dividend(s) which amounted to $.03 per share. Such dividends are not annualized in the ratio of net investment income (loss) to average net assets. Excluding such non-recurring dividend(s), the ratio of net investment income (loss) to average net assets would have been .98%.
E Total returns for periods of less than one year are not annualized.
F Fees and expenses of any underlying mutual funds or exchange-traded funds (ETFs) are not included in the Fund's expense ratio. The Fund indirectly bears its proportionate share of these expenses. For additional expense information related to investments in Fidelity Central Funds, please refer to the "Investments in Fidelity Central Funds" note found in the Notes to Financial Statements section of the most recent Annual or Semi-Annual report.
G Expense ratios reflect operating expenses of the class. Expenses before reductions do not reflect amounts reimbursed, waived, or reduced through arrangements with the investment adviser, brokerage services, or other offset arrangements, if applicable, and do not represent the amount paid by the class during periods when reimbursements, waivers or reductions occur.
H Annualized.
I Amount does not include the portfolio activity of any underlying mutual funds or exchange-traded funds (ETFs).
J Portfolio turnover rate excludes securities received or delivered in-kind.
K Amount not annualized.
For the period ended April 30, 2023
1. Organization.
Fidelity Series Overseas Fund (the Fund) is a fund of Fidelity Investment Trust (the Trust) and is authorized to issue an unlimited number of shares. Shares are offered only to certain other Fidelity funds, Fidelity managed 529 plans, and Fidelity managed collective investment trusts. The Trust is registered under the Investment Company Act of 1940, as amended (the 1940 Act), as an open-end management investment company organized as a Massachusetts business trust.
2. Investments in Fidelity Central Funds.
Funds may invest in Fidelity Central Funds, which are open-end investment companies generally available only to other investment companies and accounts managed by the investment adviser and its affiliates. The Schedule of Investments lists any Fidelity Central Funds held as an investment as of period end, but does not include the underlying holdings of each Fidelity Central Fund. An investing fund indirectly bears its proportionate share of the expenses of the underlying Fidelity Central Funds.
Based on its investment objective, each Fidelity Central Fund may invest or participate in various investment vehicles or strategies that are similar to those of the investing fund. These strategies are consistent with the investment objectives of the investing fund and may involve certain economic risks which may cause a decline in value of each of the Fidelity Central Funds and thus a decline in the value of the investing fund.
| Fidelity Central Fund | Investment Manager | Investment Objective | Investment Practices | Expense Ratio A |
| Fidelity Money Market Central Funds | Fidelity Management & Research Company LLC (FMR) | Each fund seeks to obtain a high level of current income consistent with the preservation of capital and liquidity. | Short-term Investments | Less than .005% |
A Expenses expressed as a percentage of average net assets and are as of each underlying Central Fund's most recent annual or semi-annual shareholder report.
A complete unaudited list of holdings for each Fidelity Central Fund is available upon request or at the Securities and Exchange Commission website at www.sec.gov. In addition, the financial statements of the Fidelity Central Funds which contain the significant accounting policies (including investment valuation policies) of those funds, and are not covered by the Report of Independent Registered Public Accounting Firm, are available on the Securities and Exchange Commission website or upon request.
3. Significant Accounting Policies.
The Fund is an investment company and applies the accounting and reporting guidance of the Financial Accounting Standards Board (FASB) Accounting Standards Codification Topic 946 Financial Services - Investment Companies . The financial statements have been prepared in conformity with accounting principles generally accepted in the United States of America (GAAP), which require management to make certain estimates and assumptions at the date of the financial statements. Actual results could differ from those estimates. Subsequent events, if any, through the date that the financial statements were issued have been evaluated in the preparation of the financial statements. The Fund's Schedule of Investments lists any underlying mutual funds or exchange-traded funds (ETFs) but does not include the underlying holdings of these funds. The following summarizes the significant accounting policies of the Fund:
Investment Valuation. Investments are valued as of 4:00 p.m. Eastern time on the last calendar day of the period. The Board of Trustees (the Board) has designated the Fund's investment adviser as the valuation designee responsible for the fair valuation function and performing fair value determinations as needed. The investment adviser has established a Fair Value Committee (the Committee) to carry out the day-to-day fair valuation responsibilities and has adopted policies and procedures to govern the fair valuation process and the activities of the Committee. In accordance with these fair valuation policies and procedures, which have been approved by the Board, the Fund attempts to obtain prices from one or more third party pricing services or brokers to value its investments. When current market prices, quotations or currency exchange rates are not readily available or reliable, investments will be fair valued in good faith by the Committee, in accordance with the policies and procedures. Factors used in determining fair value vary by investment type and may include market or investment specific events, transaction data, estimated cash flows, and market observations of comparable investments. The frequency that the fair valuation procedures are used cannot be predicted and they may be utilized to a significant extent. The Committee manages the Fund's fair valuation practices and maintains the fair valuation policies and procedures. The Fund's investment adviser reports to the Board information regarding the fair valuation process and related material matters.
The Fund categorizes the inputs to valuation techniques used to value its investments into a disclosure hierarchy consisting of three levels as shown below:
Level 1 - unadjusted quoted prices in active markets for identical investments
Level 2 - other significant observable inputs (including quoted prices for similar investments, interest rates, prepayment speeds, etc.)
Level 3 - unobservable inputs (including the Fund's own assumptions based on the best information available)
Valuation techniques used to value the Fund's investments by major category are as follows:
Equity securities, including restricted securities, for which market quotations are readily available, are valued at the last reported sale price or official closing price as reported by a third party pricing service on the primary market or exchange on which they are traded and are categorized as Level 1 in the hierarchy. In the event there were no sales during the day or closing prices are not available, securities are valued at the last quoted bid price or may be valued using the last available price and are generally categorized as Level 2 in the hierarchy. For foreign equity securities, when market or security specific events arise, comparisons to the valuation of American Depositary Receipts (ADRs), futures contracts, Exchange-Traded Funds (ETFs) and certain indexes as well as quoted prices for similar securities may be used and would be categorized as Level 2 in the hierarchy. For equity securities, including restricted securities, where observable inputs are limited, assumptions about market activity and risk are used and these securities may be categorized as Level 3 in the hierarchy.
Investments in open-end mutual funds, including the Fidelity Central Funds, are valued at their closing net asset value (NAV) each business day and are categorized as Level 1 in the hierarchy.
Changes in valuation techniques may result in transfers in or out of an assigned level within the disclosure hierarchy. The aggregate value of investments by input level as of April 30, 2023 is included at the end of the Fund's Schedule of Investments.
Foreign Currency. Certain Funds may use foreign currency contracts to facilitate transactions in foreign-denominated securities. Gains and losses from these transactions may arise from changes in the value of the foreign currency or if the counterparties do not perform under the contracts' terms.
Foreign-denominated assets, including investment securities, and liabilities are translated into U.S. dollars at the exchange rates at period end. Purchases and sales of investment securities, income and dividends received, and expenses denominated in foreign currencies are translated into U.S. dollars at the exchange rate in effect on the transaction date.
The effects of exchange rate fluctuations on investments are included with the net realized and unrealized gain (loss) on investment securities. Other foreign currency transactions resulting in realized and unrealized gain (loss) are disclosed separately.
Investment Transactions and Income. For financial reporting purposes, the Fund's investment holdings and NAV include trades executed through the end of the last business day of the period. The NAV per share for processing shareholder transactions is calculated as of the close of business of the New York Stock Exchange (NYSE), normally 4:00 p.m. Eastern time and includes trades executed through the end of the prior business day. Gains and losses on securities sold are determined on the basis of identified cost. Commissions paid to certain brokers with whom the investment adviser, or its affiliates, places trades on behalf of a fund include an amount in addition to trade execution, which may be rebated back to a fund. Any such rebates are included in net realized gain (loss) on investments in the Statement of Operations. Dividend income is recorded on the ex-dividend date, except for certain dividends from foreign securities where the ex-dividend date may have passed, which are recorded as soon as the Fund is informed of the ex-dividend date. Non-cash dividends included in dividend income, if any, are recorded at the fair market value of the securities received. Income and capital gain distributions from Fidelity Central Funds, if any, are recorded on the ex-dividend date. Certain distributions received by the Fund represent a return of capital or capital gain. The Fund determines the components of these distributions subsequent to the ex-dividend date, based upon receipt of tax filings or other correspondence relating to the underlying investment. These distributions are recorded as a reduction of cost of investments and/or as a realized gain. Interest income is accrued as earned and includes coupon interest and amortization of premium and accretion of discount on debt securities as applicable. Investment income is recorded net of foreign taxes withheld where recovery of such taxes is uncertain. Funds may file withholding tax reclaims in certain jurisdictions to recover a portion of amounts previously withheld. Any withholding tax reclaims income is included in the Statement of Operations in foreign taxes withheld. Any receivables for withholding tax reclaims are included in the Statement of Assets and Liabilities in reclaims receivable.
Expenses. Expenses directly attributable to a fund are charged to that fund. Expenses attributable to more than one fund are allocated among the respective funds on the basis of relative net assets or other appropriate methods. Expenses included in the accompanying financial statements reflect the expenses of that fund and do not include any expenses associated with any underlying mutual funds or exchange-traded funds. Although not included in a fund's expenses, a fund indirectly bears its proportionate share of these expenses through the net asset value of each underlying mutual fund or exchange-traded fund. Expense estimates are accrued in the period to which they relate and adjustments are made when actual amounts are known.
Income Tax Information and Distributions to Shareholders. Each year, the Fund intends to qualify as a regulated investment company under Subchapter M of the Internal Revenue Code, including distributing substantially all of its taxable income and realized gains. As a result, no provision for U.S. Federal income taxes is required. The Fund files a U.S. federal tax return, in addition to state and local tax returns as required. The Fund's federal income tax returns are subject to examination by the Internal Revenue Service (IRS) for a period of three fiscal years after they are filed. State and local tax returns may be subject to examination for an additional fiscal year depending on the jurisdiction. Foreign taxes are provided for based on the Fund's understanding of the tax rules and rates that exist in the foreign markets in which it invests. The Fund is subject to a tax imposed on capital gains by certain countries in which it invests. An estimated deferred tax liability for net unrealized appreciation on the applicable securities is included in Other payables and accrued expenses on the Statement of Assets & Liabilities.
Distributions are declared and recorded on the ex-dividend date. Income and capital gain distributions are determined in accordance with income tax regulations, which may differ from GAAP.
Capital accounts within the financial statements are adjusted for permanent book-tax differences. These adjustments have no impact on net assets or the results of operations. Capital accounts are not adjusted for temporary book-tax differences which will reverse in a subsequent period.
Book-tax differences are primarily due to foreign currency transactions, certain foreign taxes, redemptions in-kind, capital loss carryforwards and losses deferred due to wash sales.
As of period end, the cost and unrealized appreciation (depreciation) in securities, and derivatives if applicable, for federal income tax purposes were as follows:
| Gross unrealized appreciation | $3,188,133,941 |
| Gross unrealized depreciation | (296,238,956) |
| Net unrealized appreciation (depreciation) | $2,891,894,985 |
| Tax cost | $10,969,062,927 |
Capital loss carryforwards are only available to offset future capital gains of the Fund to the extent provided by regulations and may be limited. The capital loss carryforward information presented below, including any applicable limitation, is estimated as of prior fiscal period end and is subject to adjustment.
Short-term | $(373,833,934) |
Long-term | (190,697,873) |
| Total capital loss carryforward | $(564,531,807) |
Restricted Securities (including Private Placements). Funds may invest in securities that are subject to legal or contractual restrictions on resale. These securities generally may be resold in transactions exempt from registration or to the public if the securities are registered. Disposal of these securities may involve time-consuming negotiations and expense, and prompt sale at an acceptable price may be difficult. Information regarding restricted securities held at period end is included at the end of the Schedule of Investments, if applicable.
4. Purchases and Sales of Investments.
Purchases and sales of securities, other than short-term securities and in-kind transactions, as applicable, are noted in the table below.
| | Purchases ($) | Sales ($) |
| Fidelity Series Overseas Fund | 2,358,724,943 | 3,217,474,118 |
Unaffiliated Redemptions In-Kind. Shares that were redeemed in-kind for investments, including accrued interest and cash, if any, are shown in the table below. The net realized gain or loss on investments delivered through in-kind redemptions is included in the "Net realized gain (loss) on: Redemptions in-kind" line in the accompanying Statement of Operations. The amount of the in-kind redemptions is included in share transactions in the accompanying Statement of Changes in Net Assets. There was no gain or loss for federal income tax purposes.
| | Shares | Total net realized gain or loss ($) | Total Proceeds($) |
| Fidelity Series Overseas Fund | 18,984,944 | 68,149,699 | 213,753,206 |
5. Fees and Other Transactions with Affiliates.
Management Fee. Fidelity Management & Research Company LLC (the investment adviser) and its affiliates provide the Fund with investment management related services for which the Fund does not pay a management fee. Under the management contract, the investment adviser or an affiliate pays all ordinary operating expenses of the Fund, except custody fees, fees and expenses of the independent Trustees, and certain miscellaneous expenses such as proxy and shareholder meeting expenses.
Brokerage Commissions. A portion of portfolio transactions were placed with brokerage firms which are affiliates of the investment adviser. Brokerage commissions are included in net realized gain (loss) and change in net unrealized appreciation (depreciation) in the Statement of Operations. The commissions paid to these affiliated firms were as follows:
| | Amount |
| Fidelity Series Overseas Fund | $ 1,243 |
Interfund Lending Program. Pursuant to an Exemptive Order issued by the Securities and Exchange Commission (the SEC), the Fund, along with other registered investment companies having management contracts with Fidelity Management & Research Company LLC (FMR), or other affiliated entities of FMR, may participate in an interfund lending program. This program provides an alternative credit facility allowing the Fund to borrow from, or lend money to, other participating affiliated funds. At period end, there were no interfund loans outstanding. Activity in this program during the period for which loans were outstanding was as follows:
| | Borrower or Lender | Average Loan Balance | Weighted Average Interest Rate | Interest Expense |
| Fidelity Series Overseas Fund | Borrower | $ 33,953,375 | 4.61% | $34,750 |
Interfund Trades. Funds may purchase from or sell securities to other Fidelity Funds under procedures adopted by the Board. The procedures have been designed to ensure these interfund trades are executed in accordance with Rule 17a-7 of the 1940 Act. Any interfund trades are included within the respective purchases and sales amounts shown in the Purchases and Sales of Investments note. Interfund trades during the period are noted in the table below.
| | Purchases ($) | Sales ($) | Realized Gain (Loss) ($) |
| Fidelity Series Overseas Fund | 134,753,305 | 31,952,120 | (1,129,232) |
Prior Fiscal Year Affiliated Redemptions In-Kind. Shares that were redeemed in-kind for investments, including accrued interest and cash, if any, are shown in the table below; along with realized gain or loss on investments delivered through in-kind redemptions. The amount of the in-kind redemptions is included in share transactions in the accompanying Statement of Changes in Net Assets. There was no gain or loss for federal income tax purposes.
��
| | Shares | Total net realized gain or loss ($) | Total Proceeds ($) |
| Fidelity Series Overseas Fund | 4,714,174 | 10,846,765 | 47,182,852 |
Other. During the period, the investment adviser reimbursed the Fund for certain losses as follows:
| | Amount ($) |
| Fidelity Series Overseas Fund | 3,323 |
6. Committed Line of Credit.
Certain Funds participate with other funds managed by the investment adviser or an affiliate in a $4.25 billion credit facility (the "line of credit") to be utilized for temporary or emergency purposes to fund shareholder redemptions or for other short-term liquidity purposes. The commitment fees on the pro-rata portion of the line of credit are borne by the investment adviser. During the period, there were no borrowings on this line of credit.
7. Security Lending.
Funds lend portfolio securities from time to time in order to earn additional income. Lending agents are used, including National Financial Services (NFS), an affiliate of the investment adviser. Pursuant to a securities lending agreement, NFS will receive a fee, which is capped at 9.9% of a fund's daily lending revenue, for its services as lending agent. A fund may lend securities to certain qualified borrowers, including NFS. On the settlement date of the loan, a fund receives collateral (in the form of U.S. Treasury obligations, letters of credit and/or cash) against the loaned securities and maintains collateral in an amount not less than 100% of the market value of the loaned securities during the period of the loan. The market value of the loaned securities is determined at the close of business of a fund and any additional required collateral is delivered to a fund on the next business day. A fund or borrower may terminate the loan at any time, and if the borrower defaults on its obligation to return the securities loaned because of insolvency or other reasons, a fund may apply collateral received from the borrower against the obligation. A fund may experience delays and costs in recovering the securities loaned. Any cash collateral received is invested in the Fidelity Securities Lending Cash Central Fund. Any loaned securities are identified as such in the Schedule of Investments, and the value of loaned securities and cash collateral at period end, as applicable, are presented in the Statement of Assets and Liabilities. Security lending income represents the income earned on investing cash collateral, less rebates paid to borrowers and any lending agent fees associated with the loan, plus any premium payments received for lending certain types of securities. Security lending income is presented in the Statement of Operations as a component of income from Fidelity Central Funds. Affiliated security lending activity, if any, was as follows:
| | Total Security Lending Fees Paid to NFS | Security Lending Income From Securities Loaned to NFS | Value of Securities Loaned to NFS at Period End |
| Fidelity Series Overseas Fund | $60,342 | $- | $- |
8. Other.
A fund's organizational documents provide former and current trustees and officers with a limited indemnification against liabilities arising in connection with the performance of their duties to the fund. In the normal course of business, a fund may also enter into contracts that provide general indemnifications. A fund's maximum exposure under these arrangements is unknown as this would be dependent on future claims that may be made against a fund. The risk of material loss from such claims is considered remote.
At the end of the period, mutual funds and accounts managed by the investment adviser or its affiliates were the owners of record of all of the outstanding shares of the Fund.
9. Risk and Uncertainties.
Many factors affect a fund's performance. Developments that disrupt global economies and financial markets, such as pandemics, epidemics, outbreaks of infectious diseases, war, terrorism, and environmental disasters, may significantly affect a fund's investment performance. The effects of these developments to a fund will be impacted by the types of securities in which a fund invests, the financial condition, industry, economic sector, and geographic location of an issuer, and a fund's level of investment in the securities of that issuer. Significant concentrations in security types, issuers, industries, sectors, and geographic locations may magnify the factors that affect a fund's performance.
As a shareholder, you incur two types of costs: (1) transaction costs, which may include sales charges (loads) on purchase payments or redemption proceeds, as applicable and (2) ongoing costs, which generally include management fees, distribution and/or service (12b-1) fees and other Fund expenses. This Example is intended to help you understand your ongoing costs (in dollars) of investing in a fund and to compare these costs with the ongoing costs of investing in other mutual funds.
| The Example is based on an investment of $1,000 invested at the beginning of the period and held for the entire period (November 1, 2022 to April 30, 2023). |
Actual Expenses
The first line of the accompanying table provides information about actual account values and actual expenses. You may use the information in this line, together with the amount you invested, to estimate the expenses that you paid over the period. Simply divide your account value by $1,000.00 (for example, an $8,600 account value divided by $1,000.00 = 8.6), then multiply the result by the number in the first line for a class/Fund under the heading entitled "Expenses Paid During Period" to estimate the expenses you paid on your account during this period. If any fund is a shareholder of any underlying mutual funds or exchange-traded funds (ETFs) (the Underlying Funds), such fund indirectly bears its proportional share of the expenses of the Underlying Funds in addition to the direct expenses incurred presented in the table. These fees and expenses are not included in the annualized expense ratio used to calculate the expense estimate in the table below.
Hypothetical Example for Comparison Purposes
The second line of the accompanying table provides information about hypothetical account values and hypothetical expenses based on the actual expense ratio and an assumed rate of return of 5% per year before expenses, which is not the actual return. The hypothetical account values and expenses may not be used to estimate the actual ending account balance or expenses you paid for the period. You may use this information to compare the ongoing costs of investing in the Fund and other funds. To do so, compare this 5% hypothetical example with the 5% hypothetical examples that appear in the shareholder reports of the other funds. If any fund is a shareholder of any Underlying Funds, such fund indirectly bears its proportional share of the expenses of the Underlying Funds in addition to the direct expenses as presented in the table. These fees and expenses are not included in the annualized expense ratio used to calculate the expense estimate in the table below.
Please note that the expenses shown in the table are meant to highlight your ongoing costs only and do not reflect any transaction costs. Therefore, the second line of the table is useful in comparing ongoing costs only, and will not help you determine the relative total costs of owning different funds. In addition, if these transactional costs were included, your costs would have been higher.
| | | | | Annualized Expense Ratio- A | | Beginning Account Value November 1, 2022 | | Ending Account Value April 30, 2023 | | Expenses Paid During Period- C November 1, 2022 to April 30, 2023 |
| | | | | | | | | | |
| Fidelity® Series Overseas Fund | | | | .01% | | | | | | |
| Actual | | | | | | $ 1,000 | | $ 1,245.30 | | $ .06 |
Hypothetical- B | | | | | | $ 1,000 | | $ 1,024.74 | | $ .05 |
| |
A Annualized expense ratio reflects expenses net of applicable fee waivers.
B 5% return per year before expenses
C Expenses are equal to the annualized expense ratio, multiplied by the average account value over the period, multiplied by 181/ 365 (to reflect the one-half year period). The fees and expenses of any Underlying Funds are not included in each annualized expense ratio.
The Securities and Exchange Commission adopted Rule 22e-4 under the Investment Company Act of 1940 (the Liquidity Rule) to promote effective liquidity risk management throughout the open-end investment company industry, thereby reducing the risk that funds will be unable to meet their redemption obligations and mitigating dilution of the interests of fund shareholders.
The Fund has adopted and implemented a liquidity risk management program (the Program) reasonably designed to assess and manage the Fund's liquidity risk and to comply with the requirements of the Liquidity Rule. The Fund's Board of Trustees (the Board) has designated the Fund's investment adviser as administrator of the Program. The Fidelity advisers have established a Liquidity Risk Management Committee (the LRM Committee) to manage the Program for each of the Fidelity Funds. The LRM Committee monitors the adequacy and effectiveness of implementation of the Program and on a periodic basis assesses each Fund's liquidity risk based on a variety of factors including (1) the Fund's investment strategy, (2) portfolio liquidity and cash flow projections during normal and reasonably foreseeable stressed conditions, (3) shareholder redemptions, (4) borrowings and other funding sources and (5) certain factors specific to ETFs including the effect of the Fund's prices and spreads, market participants, and basket compositions on the overall liquidity of the Fund's portfolio, as applicable.
In accordance with the Program, each of the Fund's portfolio investments is classified into one of four defined liquidity categories based on a determination of a reasonable expectation for how long it would take to convert the investment to cash (or sell or dispose of the investment) without significantly changing its market value.
- Highly liquid investments - cash or convertible to cash within three business days or less
- Moderately liquid investments - convertible to cash in three to seven calendar days
- Less liquid investments - can be sold or disposed of, but not settled, within seven calendar days
- Illiquid investments - cannot be sold or disposed of within seven calendar days
Liquidity classification determinations take into account a variety of factors including various market, trading and investment-specific considerations, as well as market depth, and generally utilize analysis from a third-party liquidity metrics service.
The Liquidity Rule places a 15% limit on a fund's illiquid investments and requires funds that do not primarily hold assets that are highly liquid investments to determine and maintain a minimum percentage of the fund's net assets to be invested in highly liquid investments (highly liquid investment minimum or HLIM). The Program includes provisions reasonably designed to comply with the 15% limit on illiquid investments and for determining, periodically reviewing and complying with the HLIM requirement as applicable.
At a recent meeting of the Fund's Board of Trustees, the LRM Committee provided a written report to the Board pertaining to the operation, adequacy, and effectiveness of the Program for the period December 1, 2021 through November 30, 2022. The report concluded that the Program is operating effectively and is reasonably designed to assess and manage the Fund's liquidity risk.
1.9894004.103
SOV-SANN-0623
Fidelity® International Discovery K6 Fund
Semi-Annual Report
April 30, 2023
Contents
To view a fund's proxy voting guidelines and proxy voting record for the 12-month period ended June 30, visit http://www.fidelity.com/proxyvotingresults or visit the Securities and Exchange Commission's (SEC) web site at http://www.sec.gov.
You may also call 1-800-835-5092 to request a free copy of the proxy voting guidelines.
Standard & Poor's, S&P and S&P 500 are registered service marks of The McGraw-Hill Companies, Inc. and have been licensed for use by Fidelity Distributors Corporation.
Other third-party marks appearing herein are the property of their respective owners.
All other marks appearing herein are registered or unregistered trademarks or service marks of FMR LLC or an affiliated company. © 2023 FMR LLC. All rights reserved.
This report and the financial statements contained herein are submitted for the general information of the shareholders of the Fund. This report is not authorized for distribution to prospective investors in the Fund unless preceded or accompanied by an effective prospectus.
A fund files its complete schedule of portfolio holdings with the SEC for the first and third quarters of each fiscal year on Form N-PORT. Forms N-PORT are available on the SEC's web site at http://www.sec.gov. A fund's Forms N-PORT may be reviewed and copied at the SEC's Public Reference Room in Washington, DC. Information regarding the operation of the SEC's Public Reference Room may be obtained by calling 1-800-SEC-0330.
For a complete list of a fund's portfolio holdings, view the most recent holdings listing, semiannual report, or annual report on Fidelity's web site at http://www.fidelity.com, http://www.institutional.fidelity.com, or http://www.401k.com, as applicable.
NOT FDIC INSURED •MAY LOSE VALUE •NO BANK GUARANTEE
Neither the Fund nor Fidelity Distributors Corporation is a bank.
Top Holdings (% of Fund's net assets) |
| |
| LVMH Moet Hennessy Louis Vuitton SE (France, Textiles, Apparel & Luxury Goods) | 3.7 | |
| AstraZeneca PLC (United Kingdom) (United Kingdom, Pharmaceuticals) | 2.9 | |
| Nestle SA (Reg. S) (United States of America, Food Products) | 2.7 | |
| ASML Holding NV (Netherlands) (Netherlands, Semiconductors & Semiconductor Equipment) | 2.3 | |
| HDFC Bank Ltd. sponsored ADR (India, Banks) | 2.0 | |
| Novo Nordisk A/S Series B (Denmark, Pharmaceuticals) | 2.0 | |
| Taiwan Semiconductor Manufacturing Co. Ltd. (Taiwan, Semiconductors & Semiconductor Equipment) | 1.8 | |
| Housing Development Finance Corp. Ltd. (India, Financial Services) | 1.8 | |
| AIA Group Ltd. (Hong Kong, Insurance) | 1.6 | |
| Compass Group PLC (United Kingdom, Hotels, Restaurants & Leisure) | 1.6 | |
| | 22.4 | |
| |
| Market Sectors (% of Fund's net assets) |
| |
| Financials | 22.5 | |
| Consumer Discretionary | 16.2 | |
| Information Technology | 14.4 | |
| Industrials | 13.2 | |
| Health Care | 12.5 | |
| Consumer Staples | 6.5 | |
| Materials | 5.5 | |
| Communication Services | 2.4 | |
| Energy | 1.5 | |
| Real Estate | 1.4 | |
| |
Asset Allocation (% of Fund's net assets) |
|
|
Geographic Diversification (% of Fund's net assets) |
|
* Includes Short-Term investments and Net Other Assets (Liabilities). Percentages are adjusted for the effect of derivatives, if applicable. |
| |
Showing Percentage of Net Assets
| Common Stocks - 96.0% |
| | | Shares | Value ($) |
| Australia - 3.6% | | | |
| Bapcor Ltd. | | 460,232 | 2,008,266 |
| EBOS Group Ltd. | | 134,967 | 3,703,901 |
| Flight Centre Travel Group Ltd. (a)(b) | | 282,317 | 3,707,313 |
| Flutter Entertainment PLC (a) | | 34,130 | 6,826,401 |
| Iperionx Ltd. (a) | | 1,282,205 | 938,014 |
| National Storage REIT unit | | 3,380,004 | 5,629,670 |
TOTAL AUSTRALIA | | | 22,813,565 |
| Bailiwick of Jersey - 0.4% | | | |
| JTC PLC (c) | | 259,839 | 2,589,563 |
| Belgium - 2.0% | | | |
| Azelis Group NV | | 27,724 | 656,805 |
| KBC Group NV | | 82,490 | 5,888,225 |
| UCB SA | | 66,846 | 6,218,175 |
TOTAL BELGIUM | | | 12,763,205 |
| Brazil - 0.6% | | | |
| MercadoLibre, Inc. (a) | | 2,943 | 3,759,653 |
| Canada - 2.6% | | | |
| Canadian Natural Resources Ltd. | | 121,447 | 7,400,572 |
| Constellation Software, Inc. | | 4,171 | 8,163,812 |
| Definity Financial Corp. | | 37,539 | 1,018,237 |
| Lumine Group, Inc. | | 11,739 | 158,126 |
TOTAL CANADA | | | 16,740,747 |
| China - 3.3% | | | |
| Alibaba Group Holding Ltd. (a) | | 424,866 | 4,492,375 |
| Chervon Holdings Ltd. | | 490,510 | 2,496,143 |
| Glodon Co. Ltd. (A Shares) | | 324,371 | 2,725,845 |
| Li Ning Co. Ltd. | | 307,725 | 2,200,732 |
| Shenzhen Mindray Bio-Medical Electronics Co. Ltd. (A Shares) | | 60,190 | 2,721,173 |
| Tencent Holdings Ltd. | | 129,632 | 5,757,750 |
| WuXi AppTec Co. Ltd. (H Shares) (c) | | 78,904 | 693,955 |
TOTAL CHINA | | | 21,087,973 |
| Denmark - 2.9% | | | |
| DSV A/S | | 31,999 | 6,010,012 |
| Novo Nordisk A/S Series B | | 74,609 | 12,411,543 |
TOTAL DENMARK | | | 18,421,555 |
| Finland - 0.4% | | | |
| Neste OYJ | | 47,585 | 2,303,946 |
| France - 13.9% | | | |
| Air Liquide SA | | 53,821 | 9,681,872 |
| Airbus Group NV | | 39,604 | 5,545,931 |
| AXA SA | | 294,835 | 9,623,465 |
| BNP Paribas SA | | 113,038 | 7,303,768 |
| Capgemini SA | | 38,013 | 6,907,088 |
| Edenred SA | | 108,614 | 7,051,650 |
| EssilorLuxottica SA | | 25,002 | 4,942,417 |
| Exclusive Networks SA | | 117,619 | 2,540,246 |
| L'Oreal SA | | 13,617 | 6,493,229 |
| LVMH Moet Hennessy Louis Vuitton SE | | 24,761 | 23,817,138 |
| Pernod Ricard SA | | 22,076 | 5,093,769 |
TOTAL FRANCE | | | 89,000,573 |
| Germany - 5.7% | | | |
| Deutsche Borse AG | | 35,522 | 6,774,353 |
| Deutsche Post AG | | 126,142 | 6,067,379 |
| Merck KGaA | | 29,111 | 5,214,183 |
| Muenchener Rueckversicherungs-Gesellschaft AG in Muenchen | | 14,095 | 5,288,401 |
| Nexus AG | | 22,732 | 1,302,516 |
| Rheinmetall AG | | 10,988 | 3,214,588 |
| Siemens AG | | 37,559 | 6,190,934 |
| Siemens Healthineers AG (c) | | 39,100 | 2,430,816 |
| Talanx AG | | 82 | 4,117 |
TOTAL GERMANY | | | 36,487,287 |
| Hong Kong - 2.2% | | | |
| AIA Group Ltd. | | 971,914 | 10,581,301 |
| Prudential PLC | | 246,692 | 3,774,644 |
TOTAL HONG KONG | | | 14,355,945 |
| Hungary - 0.3% | | | |
| Richter Gedeon PLC | | 69,095 | 1,667,415 |
| India - 5.6% | | | |
| Avenue Supermarts Ltd. (a)(c) | | 40,097 | 1,728,809 |
| Campus Activewear Ltd. | | 132,285 | 578,308 |
| HDFC Bank Ltd. sponsored ADR | | 184,495 | 12,877,751 |
| Housing Development Finance Corp. Ltd. | | 334,775 | 11,418,441 |
| ITC Ltd. | | 369,423 | 1,928,486 |
| Larsen & Toubro Ltd. | | 46,408 | 1,346,903 |
| One97 Communications Ltd. (a) | | 312,487 | 2,508,345 |
| PVR Ltd. (a) | | 58,238 | 1,046,050 |
| Sona Blw Precision Forgings Ltd. (c) | | 234,001 | 1,379,403 |
| Star Health & Allied Insurance Co. Ltd. (a) | | 81,235 | 589,254 |
| Sunteck Realty Ltd. | | 132,330 | 491,687 |
TOTAL INDIA | | | 35,893,437 |
| Ireland - 1.8% | | | |
| Cairn Homes PLC | | 2,257,220 | 2,570,106 |
| CRH PLC | | 90,680 | 4,375,671 |
| Dalata Hotel Group PLC (a) | | 867,172 | 4,352,470 |
| Ryanair Holdings PLC (a) | | 3,200 | 52,475 |
TOTAL IRELAND | | | 11,350,722 |
| Israel - 0.4% | | | |
| NICE Ltd. sponsored ADR (a) | | 12,153 | 2,479,334 |
| Italy - 2.2% | | | |
| BFF Bank SpA (c) | | 242,339 | 2,328,531 |
| Ferrari NV | | 12,363 | 3,444,826 |
| FinecoBank SpA | | 127,798 | 1,933,467 |
| UniCredit SpA | | 321,767 | 6,375,968 |
TOTAL ITALY | | | 14,082,792 |
| Japan - 17.2% | | | |
| Advantest Corp. | | 20,894 | 1,628,309 |
| Capcom Co. Ltd. | | 97,965 | 3,681,291 |
| Daiichi Sankyo Kabushiki Kaisha | | 141,766 | 4,864,646 |
| Fast Retailing Co. Ltd. | | 18,559 | 4,394,802 |
| FUJIFILM Holdings Corp. | | 56,400 | 2,939,566 |
| Hitachi Ltd. | | 187,446 | 10,368,507 |
| Hoya Corp. | | 84,238 | 8,832,779 |
| Itochu Corp. | | 213,001 | 7,066,278 |
| Keyence Corp. | | 10,100 | 4,554,659 |
| Misumi Group, Inc. | | 69,513 | 1,753,619 |
| Mitsubishi UFJ Financial Group, Inc. | | 736,749 | 4,611,706 |
| NOF Corp. | | 34,696 | 1,585,311 |
| Olympus Corp. | | 197,702 | 3,461,054 |
| ORIX Corp. | | 306,330 | 5,211,446 |
| Outsourcing, Inc. | | 110,355 | 1,124,140 |
| Persol Holdings Co. Ltd. | | 181,618 | 3,744,857 |
| Renesas Electronics Corp. (a) | | 489,805 | 6,383,359 |
| Shin-Etsu Chemical Co. Ltd. | | 264,750 | 7,554,859 |
| SMC Corp. | | 6,859 | 3,420,891 |
| Sony Group Corp. | | 98,704 | 8,930,121 |
| Sumitomo Mitsui Financial Group, Inc. | | 98,220 | 4,014,609 |
| TechnoPro Holdings, Inc. | | 64,574 | 1,761,817 |
| TIS, Inc. | | 109,542 | 3,007,993 |
| Tokio Marine Holdings, Inc. | | 142,971 | 2,874,723 |
| ZOZO, Inc. | | 109,366 | 2,301,537 |
TOTAL JAPAN | | | 110,072,879 |
| Korea (South) - 1.0% | | | |
| Samsung Electronics Co. Ltd. | | 130,345 | 6,416,049 |
| Netherlands - 5.3% | | | |
| Adyen BV (a)(c) | | 2,765 | 4,442,945 |
| ASML Holding NV (Netherlands) | | 23,715 | 14,986,449 |
| BE Semiconductor Industries NV (b) | | 67,661 | 6,064,357 |
| IMCD NV | | 16,695 | 2,505,565 |
| ING Groep NV (Certificaten Van Aandelen) | | 316,452 | 3,905,423 |
| Topicus.Com, Inc. (a) | | 7,711 | 513,649 |
| Universal Music Group NV | | 77,214 | 1,685,477 |
TOTAL NETHERLANDS | | | 34,103,865 |
| Norway - 0.0% | | | |
| Volue A/S (a) | | 25,910 | 43,763 |
| Russia - 0.0% | | | |
| Fix Price Group Ltd. GDR (Reg. S) (a)(d) | | 38,476 | 14,210 |
| Singapore - 1.2% | | | |
| Sea Ltd. ADR (a) | | 45,179 | 3,441,284 |
| United Overseas Bank Ltd. | | 205,120 | 4,356,330 |
TOTAL SINGAPORE | | | 7,797,614 |
| South Africa - 0.7% | | | |
| Anglo American PLC (United Kingdom) | | 142,463 | 4,389,881 |
| Spain - 1.2% | | | |
| CaixaBank SA | | 1,437,653 | 5,321,626 |
| Cie Automotive SA | | 85,587 | 2,576,503 |
TOTAL SPAIN | | | 7,898,129 |
| Sweden - 3.0% | | | |
| ASSA ABLOY AB (B Shares) | | 112,450 | 2,674,444 |
| HEXPOL AB (B Shares) | | 158,282 | 1,862,949 |
| Indutrade AB | | 140,476 | 3,365,654 |
| Kry International AB (a)(d)(e) | | 71 | 5,550 |
| Lagercrantz Group AB (B Shares) | | 237,475 | 3,052,077 |
| Nibe Industrier AB (B Shares) | | 190,867 | 2,131,074 |
| Nordnet AB | | 145,702 | 2,284,619 |
| Svenska Handelsbanken AB (A Shares) | | 436,301 | 3,856,808 |
TOTAL SWEDEN | | | 19,233,175 |
| Switzerland - 1.4% | | | |
| Compagnie Financiere Richemont SA Series A | | 37,516 | 6,201,427 |
| Partners Group Holding AG | | 2,594 | 2,505,052 |
TOTAL SWITZERLAND | | | 8,706,479 |
| Taiwan - 2.0% | | | |
| MediaTek, Inc. | | 71,426 | 1,551,991 |
| Taiwan Semiconductor Manufacturing Co. Ltd. | | 698,618 | 11,432,289 |
TOTAL TAIWAN | | | 12,984,280 |
| United Kingdom - 9.9% | | | |
| AstraZeneca PLC (United Kingdom) | | 126,813 | 18,662,180 |
| BAE Systems PLC | | 495,622 | 6,314,216 |
| Beazley PLC | | 319,126 | 2,388,322 |
| Big Yellow Group PLC | | 162,840 | 2,504,906 |
| Bunzl PLC | | 179,539 | 7,139,112 |
| Compass Group PLC | | 393,806 | 10,388,980 |
| DCC PLC (United Kingdom) | | 253 | 15,720 |
| Diageo PLC | | 198,461 | 9,053,019 |
| Dr. Martens Ltd. | | 359,759 | 750,983 |
| Endava PLC ADR (a) | | 18,436 | 1,061,361 |
| JD Sports Fashion PLC | | 1,240,804 | 2,511,382 |
| Smart Metering Systems PLC | | 235,307 | 2,345,076 |
| Starling Bank Ltd. Series D (a)(d)(e) | | 137,500 | 521,865 |
| Zegona Communications PLC (a) | | 22,676 | 14,677 |
TOTAL UNITED KINGDOM | | | 63,671,799 |
| United States of America - 5.2% | | | |
| Globant SA (a) | | 8,107 | 1,271,745 |
| ICON PLC (a) | | 8,739 | 1,683,918 |
| Linde PLC | | 12,128 | 4,480,690 |
| Nestle SA (Reg. S) | | 135,932 | 17,438,658 |
| NVIDIA Corp. | | 15,226 | 4,225,063 |
| RHI Magnesita NV | | 30,147 | 856,252 |
| Samsonite International SA (a)(c) | | 1,020,755 | 3,234,614 |
TOTAL UNITED STATES OF AMERICA | | | 33,190,940 |
| TOTAL COMMON STOCKS (Cost $573,611,231) | | | 614,320,775 |
| | | | |
| Preferred Stocks - 0.1% |
| | | Shares | Value ($) |
| Convertible Preferred Stocks - 0.1% | | | |
| China - 0.0% | | | |
| ByteDance Ltd. Series E1 (a)(d)(e) | | 1,533 | 305,067 |
| dMed Biopharmaceutical Co. Ltd. Series C (a)(d)(e) | | 8,434 | 74,810 |
| | | | 379,877 |
| Estonia - 0.1% | | | |
| Bolt Technology OU Series E (a)(d)(e) | | 3,347 | 436,224 |
TOTAL CONVERTIBLE PREFERRED STOCKS | | | 816,101 |
| Nonconvertible Preferred Stocks - 0.0% | | | |
| Sweden - 0.0% | | | |
| Kry International AB Series E (a)(d)(e) | | 413 | 32,284 |
| TOTAL PREFERRED STOCKS (Cost $1,346,117) | | | 848,385 |
| | | | |
| Money Market Funds - 4.2% |
| | | Shares | Value ($) |
| Fidelity Cash Central Fund 4.88% (f) | | 21,847,743 | 21,852,113 |
| Fidelity Securities Lending Cash Central Fund 4.88% (f)(g) | | 5,016,681 | 5,017,183 |
| TOTAL MONEY MARKET FUNDS (Cost $26,869,296) | | | 26,869,296 |
| | | | |
| TOTAL INVESTMENT IN SECURITIES - 100.3% (Cost $601,826,644) | 642,038,456 |
NET OTHER ASSETS (LIABILITIES) - (0.3)% | (1,966,727) |
| NET ASSETS - 100.0% | 640,071,729 |
| | |
Legend
| (b) | Security or a portion of the security is on loan at period end. |
| (c) | Security exempt from registration under Rule 144A of the Securities Act of 1933. These securities may be resold in transactions exempt from registration, normally to qualified institutional buyers. At the end of the period, the value of these securities amounted to $18,828,636 or 2.9% of net assets. |
| (e) | Restricted securities (including private placements) - Investment in securities not registered under the Securities Act of 1933 (excluding 144A issues). At the end of the period, the value of restricted securities (excluding 144A issues) amounted to $1,375,800 or 0.2% of net assets. |
| (f) | Affiliated fund that is generally available only to investment companies and other accounts managed by Fidelity Investments. The rate quoted is the annualized seven-day yield of the fund at period end. A complete unaudited listing of the fund's holdings as of its most recent quarter end is available upon request. In addition, each Fidelity Central Fund's financial statements are available on the SEC's website or upon request. |
| (g) | Investment made with cash collateral received from securities on loan. |
| Additional information on each restricted holding is as follows: |
| Security | Acquisition Date | Acquisition Cost ($) |
| Bolt Technology OU Series E | 1/03/22 | 869,539 |
| | | |
| ByteDance Ltd. Series E1 | 11/18/20 | 167,977 |
| | | |
| dMed Biopharmaceutical Co. Ltd. Series C | 12/01/20 | 119,789 |
| | | |
| Kry International AB | 5/14/21 | 30,836 |
| | | |
| Kry International AB Series E | 5/14/21 | 188,812 |
| | | |
| Starling Bank Ltd. Series D | 6/18/21 - 4/05/22 | 286,270 |
| | | |
Affiliated Central Funds
Fiscal year to date information regarding the Fund's investments in Fidelity Central Funds, including the ownership percentage, is presented below.
| Affiliate | Value, beginning of period ($) | Purchases ($) | Sales Proceeds ($) | Dividend Income ($) | Realized Gain (loss) ($) | Change in Unrealized appreciation (depreciation) ($) | Value, end of period ($) | % ownership, end of period |
| Fidelity Cash Central Fund 4.88% | 27,106,527 | 93,596,770 | 98,851,184 | 376,922 | - | - | 21,852,113 | 0.1% |
| Fidelity Securities Lending Cash Central Fund 4.88% | 1,938,791 | 40,700,555 | 37,622,163 | 32,959 | - | - | 5,017,183 | 0.0% |
| Total | 29,045,318 | 134,297,325 | 136,473,347 | 409,881 | - | - | 26,869,296 | |
| | | | | | | | | |
Amounts in the dividend income column in the above table include any capital gain distributions from underlying funds, which are presented in the corresponding line item in the Statement of Operations, if applicable.
Amounts in the dividend income column for Fidelity Securities Lending Cash Central Fund represents the income earned on investing cash collateral, less rebates paid to borrowers and any lending agent fees associated with the loan, plus any premium payments received for lending certain types of securities.
Amounts included in the purchases and sales proceeds columns may include in-kind transactions, if applicable.
Investment Valuation
The following is a summary of the inputs used, as of April 30, 2023, involving the Fund's assets and liabilities carried at fair value. The inputs or methodology used for valuing securities may not be an indication of the risk associated with investing in those securities. For more information on valuation inputs, and their aggregation into the levels used below, please refer to the Investment Valuation section in the accompanying Notes to Financial Statements.
| Valuation Inputs at Reporting Date: |
| Description | Total ($) | Level 1 ($) | Level 2 ($) | Level 3 ($) |
Investments in Securities: | | | | |
|
| Equities: | | | | |
Communication Services | 15,931,596 | 5,141,438 | 10,485,091 | 305,067 |
Consumer Discretionary | 102,923,483 | 26,792,324 | 76,131,159 | - |
Consumer Staples | 41,750,180 | 11,586,998 | 30,148,972 | 14,210 |
Energy | 9,704,518 | 9,704,518 | - | - |
Financials | 144,224,955 | 50,063,358 | 93,639,732 | 521,865 |
Health Care | 78,885,481 | 23,459,440 | 55,351,231 | 74,810 |
Industrials | 84,815,997 | 30,058,050 | 54,757,947 | - |
Information Technology | 92,581,188 | 51,467,070 | 40,640,060 | 474,058 |
Materials | 35,725,499 | 7,199,891 | 28,525,608 | - |
Real Estate | 8,626,263 | 2,504,906 | 6,121,357 | - |
|
| Money Market Funds | 26,869,296 | 26,869,296 | - | - |
| Total Investments in Securities: | 642,038,456 | 244,847,289 | 395,801,157 | 1,390,010 |
| Statement of Assets and Liabilities |
| | | | April 30, 2023 (Unaudited) |
| | | | | |
| Assets | | | | |
| Investment in securities, at value (including securities loaned of $4,739,025) - See accompanying schedule: | | | | |
Unaffiliated issuers (cost $574,957,348) | $ | 615,169,160 | | |
Fidelity Central Funds (cost $26,869,296) | | 26,869,296 | | |
| | | | | |
| | | | | |
| Total Investment in Securities (cost $601,826,644) | | | $ | 642,038,456 |
| Foreign currency held at value (cost $204,465) | | | | 204,361 |
| Receivable for investments sold | | | | 485,228 |
| Receivable for fund shares sold | | | | 427,055 |
| Dividends receivable | | | | 1,831,101 |
| Reclaims receivable | | | | 945,063 |
| Distributions receivable from Fidelity Central Funds | | | | 84,201 |
Total assets | | | | 646,015,465 |
| Liabilities | | | | |
| Payable for investments purchased | $ | 121,589 | | |
| Payable for fund shares redeemed | | 288,921 | | |
| Accrued management fee | | 315,519 | | |
| Other payables and accrued expenses | | 200,524 | | |
| Collateral on securities loaned | | 5,017,183 | | |
| Total Liabilities | | | | 5,943,736 |
| Net Assets | | | $ | 640,071,729 |
| Net Assets consist of: | | | | |
| Paid in capital | | | $ | 687,466,651 |
| Total accumulated earnings (loss) | | | | (47,394,922) |
| Net Assets | | | $ | 640,071,729 |
Net Asset Value , offering price and redemption price per share ($640,071,729 ÷ 53,999,077 shares) | | | $ | 11.85 |
| Statement of Operations |
| | | | Six months ended April 30, 2023 (Unaudited) |
| Investment Income | | | | |
| Dividends | | | $ | 6,785,524 |
| Income from Fidelity Central Funds (including $32,959 from security lending) | | | | 409,881 |
| Income before foreign taxes withheld | | | $ | 7,195,405 |
| Less foreign taxes withheld | | | | (827,663) |
| Total Income | | | | 6,367,742 |
| Expenses | | | | |
| Management fee | $ | 1,662,334 | | |
| Independent trustees' fees and expenses | | 1,599 | | |
| Total expenses before reductions | | 1,663,933 | | |
| Expense reductions | | (78) | | |
| Total expenses after reductions | | | | 1,663,855 |
| Net Investment income (loss) | | | | 4,703,887 |
| Realized and Unrealized Gain (Loss) | | | | |
| Net realized gain (loss) on: | | | | |
| Investment Securities: | | | | |
| Unaffiliated issuers (net of foreign taxes of $1,939) | | (27,580,892) | | |
| Foreign currency transactions | | 113,380 | | |
| Total net realized gain (loss) | | | | (27,467,512) |
| Change in net unrealized appreciation (depreciation) on: | | | | |
| Investment Securities: | | | | |
| Unaffiliated issuers(net of increase in deferred foreign taxes of $39,655) | | 106,221,525 | | |
| Assets and liabilities in foreign currencies | | 80,187 | | |
| Total change in net unrealized appreciation (depreciation) | | | | 106,301,712 |
| Net gain (loss) | | | | 78,834,200 |
| Net increase (decrease) in net assets resulting from operations | | | $ | 83,538,087 |
| Statement of Changes in Net Assets |
| |
| | Six months ended April 30, 2023 (Unaudited) | | Year ended October 31, 2022 |
| Increase (Decrease) in Net Assets | | | | |
| Operations | | | | |
| Net investment income (loss) | $ | 4,703,887 | $ | 9,318,000 |
| Net realized gain (loss) | | (27,467,512) | | (61,862,335) |
| Change in net unrealized appreciation (depreciation) | | 106,301,712 | | (118,418,158) |
| Net increase (decrease) in net assets resulting from operations | | 83,538,087 | | (170,962,493) |
| Distributions to shareholders | | (4,996,303) | | (8,038,015) |
| Share transactions | | | | |
| Proceeds from sales of shares | | 128,892,145 | | 304,547,005 |
| Reinvestment of distributions | | 4,996,303 | | 8,038,015 |
| Cost of shares redeemed | | (40,410,909) | | (96,424,320) |
Net increase (decrease) in net assets resulting from share transactions | | 93,477,539 | | 216,160,700 |
| Total increase (decrease) in net assets | | 172,019,323 | | 37,160,192 |
| | | | | |
| Net Assets | | | | |
| Beginning of period | | 468,052,406 | | 430,892,214 |
| End of period | $ | 640,071,729 | $ | 468,052,406 |
| | | | | |
| Other Information | | | | |
| Shares | | | | |
| Sold | | 11,373,065 | | 24,327,055 |
| Issued in reinvestment of distributions | | 448,904 | | 555,879 |
| Redeemed | | (3,559,073) | | (7,923,935) |
| Net increase (decrease) | | 8,262,896 | | 16,958,999 |
| | | | | |
Financial Highlights
| Fidelity® International Discovery K6 Fund |
| |
| | Six months ended (Unaudited) April 30, 2023 | | Years ended October 31, 2022 | | 2021 | | 2020 | | 2019 A |
Selected Per-Share Data | | | | | | | | | | |
| Net asset value, beginning of period | $ | 10.23 | $ | 14.97 | $ | 11.29 | $ | 10.49 | $ | 10.00 |
| Income from Investment Operations | | | | | | | | | | |
Net investment income (loss) B,C | | .10 | | .24 | | .16 | | .12 | | .06 D |
| Net realized and unrealized gain (loss) | | 1.63 | | (4.70) | | 3.60 | | .77 | | .43 |
| Total from investment operations | | 1.73 | | (4.46) | | 3.76 | | .89 | | .49 |
| Distributions from net investment income | | (.11) | | (.28) | | (.08) | | (.04) | | - |
| Distributions from net realized gain | | - | | - | | - | | (.05) | | - |
| Total distributions | | (.11) | | (.28) | | (.08) | | (.09) | | - |
| Net asset value, end of period | $ | 11.85 | $ | 10.23 | $ | 14.97 | $ | 11.29 | $ | 10.49 |
Total Return E,F | | 16.96% | | (30.35)% | | 33.43% | | 8.51% | | 4.90% |
Ratios to Average Net Assets C,G,H | | | | | | | | | | |
| Expenses before reductions | | .60% I | | .60% | | .60% | | .60% | | .60% I |
| Expenses net of fee waivers, if any | | .60% I | | .60% | | .60% | | .60% | | .60% I |
| Expenses net of all reductions | | .60% I | | .60% | | .60% | | .60% | | .60% I |
| Net investment income (loss) | | 1.70% I | | 1.98% | | 1.11% | | 1.16% | | 1.67% D,I |
| Supplemental Data | | | | | | | | | | |
| Net assets, end of period (000 omitted) | $ | 640,072 | $ | 468,052 | $ | 430,892 | $ | 103,173 | $ | 61,421 |
Portfolio turnover rate J | | 64% I,K | | 50% K | | 58% K | | 42% K | | 59% K,L |
A For the period June 13, 2019 (commencement of operations) through October 31, 2019.
B Calculated based on average shares outstanding during the period.
C Net investment income (loss) is affected by the timing of the declaration of dividends by any underlying mutual funds or exchange-traded funds (ETFs). Net investment income (loss) of any mutual funds or ETFs is not included in the Fund's net investment income (loss) ratio.
D Net investment income per share reflects one or more large, non-recurring dividend(s) which amounted to $.05 per share. Such dividends are not annualized in the ratio of net investment income (loss) to average net assets. Excluding such non-recurring dividend(s), the ratio of net investment income (loss) to average net assets would have been .43%.
E Total returns for periods of less than one year are not annualized.
F Total returns would have been lower if certain expenses had not been reduced during the applicable periods shown.
G Fees and expenses of any underlying mutual funds or exchange-traded funds (ETFs) are not included in the Fund's expense ratio. The Fund indirectly bears its proportionate share of these expenses. For additional expense information related to investments in Fidelity Central Funds, please refer to the "Investments in Fidelity Central Funds" note found in the Notes to Financial Statements section of the most recent Annual or Semi-Annual report.
H Expense ratios reflect operating expenses of the class. Expenses before reductions do not reflect amounts reimbursed, waived, or reduced through arrangements with the investment adviser, brokerage services, or other offset arrangements, if applicable, and do not represent the amount paid by the class during periods when reimbursements, waivers or reductions occur.
I Annualized.
J Amount does not include the portfolio activity of any underlying mutual funds or exchange-traded funds (ETFs).
K Portfolio turnover rate excludes securities received or delivered in-kind.
L Amount not annualized.
For the period ended April 30, 2023
1. Organization.
Fidelity International Discovery K6 Fund (the Fund) is a fund of Fidelity Investment Trust (the Trust) and is authorized to issue an unlimited number of shares. Share transactions on the Statement of Changes in Net Assets may contain exchanges between affiliated funds. The Trust is registered under the Investment Company Act of 1940, as amended (the 1940 Act), as an open-end management investment company organized as a Massachusetts business trust. Shares generally are available only to employer-sponsored retirement plans that are recordkept by Fidelity, or to certain employer-sponsored retirement plans that are not recordkept by Fidelity. The Fund's investments in emerging markets can be subject to social, economic, regulatory, and political uncertainties and can be extremely volatile.
2. Investments in Fidelity Central Funds.
Funds may invest in Fidelity Central Funds, which are open-end investment companies generally available only to other investment companies and accounts managed by the investment adviser and its affiliates. The Schedule of Investments lists any Fidelity Central Funds held as an investment as of period end, but does not include the underlying holdings of each Fidelity Central Fund. An investing fund indirectly bears its proportionate share of the expenses of the underlying Fidelity Central Funds.
Based on its investment objective, each Fidelity Central Fund may invest or participate in various investment vehicles or strategies that are similar to those of the investing fund. These strategies are consistent with the investment objectives of the investing fund and may involve certain economic risks which may cause a decline in value of each of the Fidelity Central Funds and thus a decline in the value of the investing fund.
| Fidelity Central Fund | Investment Manager | Investment Objective | Investment Practices | Expense Ratio A |
| Fidelity Money Market Central Funds | Fidelity Management & Research Company LLC (FMR) | Each fund seeks to obtain a high level of current income consistent with the preservation of capital and liquidity. | Short-term Investments | Less than .005% |
A Expenses expressed as a percentage of average net assets and are as of each underlying Central Fund's most recent annual or semi-annual shareholder report.
A complete unaudited list of holdings for each Fidelity Central Fund is available upon request or at the Securities and Exchange Commission website at www.sec.gov. In addition, the financial statements of the Fidelity Central Funds which contain the significant accounting policies (including investment valuation policies) of those funds, and are not covered by the Report of Independent Registered Public Accounting Firm, are available on the Securities and Exchange Commission website or upon request.
3. Significant Accounting Policies.
The Fund is an investment company and applies the accounting and reporting guidance of the Financial Accounting Standards Board (FASB) Accounting Standards Codification Topic 946 Financial Services - Investment Companies . The financial statements have been prepared in conformity with accounting principles generally accepted in the United States of America (GAAP), which require management to make certain estimates and assumptions at the date of the financial statements. Actual results could differ from those estimates. Subsequent events, if any, through the date that the financial statements were issued have been evaluated in the preparation of the financial statements. The Fund's Schedule of Investments lists any underlying mutual funds or exchange-traded funds (ETFs) but does not include the underlying holdings of these funds. The following summarizes the significant accounting policies of the Fund:
Investment Valuation. Investments are valued as of 4:00 p.m. Eastern time on the last calendar day of the period. The Board of Trustees (the Board) has designated the Fund's investment adviser as the valuation designee responsible for the fair valuation function and performing fair value determinations as needed. The investment adviser has established a Fair Value Committee (the Committee) to carry out the day-to-day fair valuation responsibilities and has adopted policies and procedures to govern the fair valuation process and the activities of the Committee. In accordance with these fair valuation policies and procedures, which have been approved by the Board, the Fund attempts to obtain prices from one or more third party pricing services or brokers to value its investments. When current market prices, quotations or currency exchange rates are not readily available or reliable, investments will be fair valued in good faith by the Committee, in accordance with the policies and procedures. Factors used in determining fair value vary by investment type and may include market or investment specific events, transaction data, estimated cash flows, and market observations of comparable investments. The frequency that the fair valuation procedures are used cannot be predicted and they may be utilized to a significant extent. The Committee manages the Fund's fair valuation practices and maintains the fair valuation policies and procedures. The Fund's investment adviser reports to the Board information regarding the fair valuation process and related material matters.
The Fund categorizes the inputs to valuation techniques used to value its investments into a disclosure hierarchy consisting of three levels as shown below:
Level 1 - unadjusted quoted prices in active markets for identical investments
Level 2 - other significant observable inputs (including quoted prices for similar investments, interest rates, prepayment speeds, etc.)
Level 3 - unobservable inputs (including the Fund's own assumptions based on the best information available)
Valuation techniques used to value the Fund's investments by major category are as follows:
Equity securities, including restricted securities, for which market quotations are readily available, are valued at the last reported sale price or official closing price as reported by a third party pricing service on the primary market or exchange on which they are traded and are categorized as Level 1 in the hierarchy. In the event there were no sales during the day or closing prices are not available, securities are valued at the last quoted bid price or may be valued using the last available price and are generally categorized as Level 2 in the hierarchy. For foreign equity securities, when market or security specific events arise, comparisons to the valuation of American Depositary Receipts (ADRs), futures contracts, ETFs and certain indexes as well as quoted prices for similar securities may be used and would be categorized as Level 2 in the hierarchy. For equity securities, including restricted securities, where observable inputs are limited, assumptions about market activity and risk are used and these securities may be categorized as Level 3 in the hierarchy.
Investments in open-end mutual funds, including the Fidelity Central Funds, are valued at their closing net asset value (NAV) each business day and are categorized as Level 1 in the hierarchy.
Changes in valuation techniques may result in transfers in or out of an assigned level within the disclosure hierarchy. The aggregate value of investments by input level as of April 30, 2023 is included at the end of the Fund's Schedule of Investments.
Foreign Currency. Certain Funds may use foreign currency contracts to facilitate transactions in foreign-denominated securities. Gains and losses from these transactions may arise from changes in the value of the foreign currency or if the counterparties do not perform under the contracts' terms.
Foreign-denominated assets, including investment securities, and liabilities are translated into U.S. dollars at the exchange rates at period end. Purchases and sales of investment securities, income and dividends received, and expenses denominated in foreign currencies are translated into U.S. dollars at the exchange rate in effect on the transaction date.
The effects of exchange rate fluctuations on investments are included with the net realized and unrealized gain (loss) on investment securities. Other foreign currency transactions resulting in realized and unrealized gain (loss) are disclosed separately.
Investment Transactions and Income. For financial reporting purposes, the Fund's investment holdings and NAV include trades executed through the end of the last business day of the period. The NAV per share for processing shareholder transactions is calculated as of the close of business of the New York Stock Exchange (NYSE), normally 4:00 p.m. Eastern time and includes trades executed through the end of the prior business day. Gains and losses on securities sold are determined on the basis of identified cost. Commissions paid to certain brokers with whom the investment adviser, or its affiliates, places trades on behalf of a fund include an amount in addition to trade execution, which may be rebated back to a fund. Any such rebates are included in net realized gain (loss) on investments in the Statement of Operations. Dividend income is recorded on the ex-dividend date, except for certain dividends from foreign securities where the ex-dividend date may have passed, which are recorded as soon as the Fund is informed of the ex-dividend date. Non-cash dividends included in dividend income, if any, are recorded at the fair market value of the securities received. Income and capital gain distributions from Fidelity Central Funds, if any, are recorded on the ex-dividend date. Investment income is recorded net of foreign taxes withheld where recovery of such taxes is uncertain. Funds may file withholding tax reclaims in certain jurisdictions to recover a portion of amounts previously withheld. Any withholding tax reclaims income is included in the Statement of Operations in foreign taxes withheld. Any receivables for withholding tax reclaims are included in the Statement of Assets and Liabilities in reclaims receivable.
Expenses. Expenses directly attributable to a fund are charged to that fund. Expenses attributable to more than one fund are allocated among the respective funds on the basis of relative net assets or other appropriate methods. Expenses included in the accompanying financial statements reflect the expenses of that fund and do not include any expenses associated with any underlying mutual funds or exchange-traded funds. Although not included in a fund's expenses, a fund indirectly bears its proportionate share of these expenses through the net asset value of each underlying mutual fund or exchange-traded fund. Expense estimates are accrued in the period to which they relate and adjustments are made when actual amounts are known.
Income Tax Information and Distributions to Shareholders. Each year, the Fund intends to qualify as a regulated investment company under Subchapter M of the Internal Revenue Code, including distributing substantially all of its taxable income and realized gains. As a result, no provision for U.S. Federal income taxes is required. The Fund files a U.S. federal tax return, in addition to state and local tax returns as required. The Fund's federal income tax returns are subject to examination by the Internal Revenue Service (IRS) for a period of three fiscal years after they are filed. State and local tax returns may be subject to examination for an additional fiscal year depending on the jurisdiction. Foreign taxes are provided for based on the Fund's understanding of the tax rules and rates that exist in the foreign markets in which it invests. The Fund is subject to a tax imposed on capital gains by certain countries in which it invests. An estimated deferred tax liability for net unrealized appreciation on the applicable securities is included in Other payables and accrued expenses on the Statement of Assets & Liabilities.
Distributions are declared and recorded on the ex-dividend date. Income and capital gain distributions are determined in accordance with income tax regulations, which may differ from GAAP.
Capital accounts within the financial statements are adjusted for permanent book-tax differences. These adjustments have no impact on net assets or the results of operations. Capital accounts are not adjusted for temporary book-tax differences which will reverse in a subsequent period.
Book-tax differences are primarily due to foreign currency transactions, certain foreign taxes, passive foreign investment companies (PFIC), capital loss carryforwards and losses deferred due to wash sales.
As of period end, the cost and unrealized appreciation (depreciation) in securities, and derivatives if applicable, for federal income tax purposes were as follows:
| Gross unrealized appreciation | $67,853,518 |
| Gross unrealized depreciation | (28,197,425) |
| Net unrealized appreciation (depreciation) | $39,656,093 |
| Tax cost | $602,382,363 |
Capital loss carryforwards are only available to offset future capital gains of the Fund to the extent provided by regulations and may be limited. The capital loss carryforward information presented below, including any applicable limitation, is estimated as of prior fiscal period end and is subject to adjustment.
| Short-term | $(55,440,972) |
| Long-term | (7,345,542) |
| Total capital loss carryforward | $(62,786,514) |
Due to large subscriptions in a prior period, $52,335,987 of capital losses that will be available to offset future capital gains of the Fund will be limited to approximately $11,985,573 per year.
Restricted Securities (including Private Placements). Funds may invest in securities that are subject to legal or contractual restrictions on resale. These securities generally may be resold in transactions exempt from registration or to the public if the securities are registered. Disposal of these securities may involve time-consuming negotiations and expense, and prompt sale at an acceptable price may be difficult. Information regarding restricted securities held at period end is included at the end of the Schedule of Investments, if applicable.
4. Purchases and Sales of Investments.
Purchases and sales of securities, other than short-term securities and in-kind transactions, as applicable, are noted in the table below.
| | Purchases ($) | Sales ($) |
| Fidelity International Discovery K6 Fund | 190,337,235 | 166,495,447 |
Unaffiliated Exchanges In-Kind. Shares that were exchanged for investments, including accrued interest and cash, if any, are shown in the table below. The amount of in-kind exchanges is included in share transactions in the accompanying Statement of Changes in Net Assets.
| | Shares | Total Proceeds ($) |
| Fidelity International Discovery K6 Fund | 6,335,816 | 72,271,270 |
Prior Year Unaffiliated Exchanges In-Kind. Shares that were exchanged for investments, including accrued interest and cash, if any, are shown in the table below. The amount of in-kind exchanges is included in share transactions in the accompanying Statement of Changes in Net Assets.
| | Shares | Total Proceeds ($) |
| Fidelity International Discovery K6 Fund | 15,540,854 | 197,763,447 |
5. Fees and Other Transactions with Affiliates.
Management Fee. Fidelity Management & Research Company LLC (the investment adviser) and its affiliates provide the Fund with investment management related services for which the Fund pays a monthly management fee that is based on an annual rate of .60% of average net assets. Under the management contract, the investment adviser or an affiliate pays all other expenses of the Fund, excluding fees and expenses of the independent Trustees, and certain miscellaneous expenses such as proxy and shareholder meeting expenses.
Brokerage Commissions. A portion of portfolio transactions were placed with brokerage firms which are affiliates of the investment adviser. Brokerage commissions are included in net realized gain (loss) and change in net unrealized appreciation (depreciation) in the Statement of Operations. The commissions paid to these affiliated firms were as follows:
| | Amount |
| Fidelity International Discovery K6 Fund | $203 |
Interfund Trades. Funds may purchase from or sell securities to other Fidelity Funds under procedures adopted by the Board. The procedures have been designed to ensure these interfund trades are executed in accordance with Rule 17a-7 of the 1940 Act. Any interfund trades are included within the respective purchases and sales amounts shown in the Purchases and Sales of Investments note. Interfund trades during the period are noted in the table below.
| | Purchases ($) | Sales ($) | Realized Gain (Loss) ($) |
| Fidelity International Discovery K6 Fund | 5,515,563 | 2,414,367 | (568,117) |
6. Committed Line of Credit.
Certain Funds participate with other funds managed by the investment adviser or an affiliate in a $4.25 billion credit facility (the "line of credit") to be utilized for temporary or emergency purposes to fund shareholder redemptions or for other short-term liquidity purposes. The commitment fees on the pro-rata portion of the line of credit are borne by the investment adviser. During the period, there were no borrowings on this line of credit.
7. Security Lending.
Funds lend portfolio securities from time to time in order to earn additional income. Lending agents are used, including National Financial Services (NFS), an affiliate of the investment adviser. Pursuant to a securities lending agreement, NFS will receive a fee, which is capped at 9.9% of a fund's daily lending revenue, for its services as lending agent. A fund may lend securities to certain qualified borrowers, including NFS. On the settlement date of the loan, a fund receives collateral (in the form of U.S. Treasury obligations, letters of credit and/or cash) against the loaned securities and maintains collateral in an amount not less than 100% of the market value of the loaned securities during the period of the loan. The market value of the loaned securities is determined at the close of business of a fund and any additional required collateral is delivered to a fund on the next business day. A fund or borrower may terminate the loan at any time, and if the borrower defaults on its obligation to return the securities loaned because of insolvency or other reasons, a fund may apply collateral received from the borrower against the obligation. A fund may experience delays and costs in recovering the securities loaned. Any cash collateral received is invested in the Fidelity Securities Lending Cash Central Fund. Any loaned securities are identified as such in the Schedule of Investments, and the value of loaned securities and cash collateral at period end, as applicable, are presented in the Statement of Assets and Liabilities. Security lending income represents the income earned on investing cash collateral, less rebates paid to borrowers and any lending agent fees associated with the loan, plus any premium payments received for lending certain types of securities. Security lending income is presented in the Statement of Operations as a component of income from Fidelity Central Funds. Affiliated security lending activity, if any, was as follows:
| | Total Security Lending Fees Paid to NFS | Security Lending Income From Securities Loaned to NFS | Value of Securities Loaned to NFS at Period End |
| Fidelity International Discovery K6 Fund | $3,747 | $- | $- |
8. Expense Reductions.
Through arrangements with the Fund's custodian, credits realized as a result of certain uninvested cash balances were used to reduce the Fund's expenses by $78.
9. Other.
A fund's organizational documents provide former and current trustees and officers with a limited indemnification against liabilities arising in connection with the performance of their duties to the fund. In the normal course of business, a fund may also enter into contracts that provide general indemnifications. A fund's maximum exposure under these arrangements is unknown as this would be dependent on future claims that may be made against a fund. The risk of material loss from such claims is considered remote.
10. Risk and Uncertainties.
Many factors affect a fund's performance. Developments that disrupt global economies and financial markets, such as pandemics, epidemics, outbreaks of infectious diseases, war, terrorism, and environmental disasters, may significantly affect a fund's investment performance. The effects of these developments to a fund will be impacted by the types of securities in which a fund invests, the financial condition, industry, economic sector, and geographic location of an issuer, and a fund's level of investment in the securities of that issuer. Significant concentrations in security types, issuers, industries, sectors, and geographic locations may magnify the factors that affect a fund's performance.
As a shareholder, you incur two types of costs: (1) transaction costs, which may include sales charges (loads) on purchase payments or redemption proceeds, as applicable and (2) ongoing costs, which generally include management fees, distribution and/or service (12b-1) fees and other Fund expenses. This Example is intended to help you understand your ongoing costs (in dollars) of investing in a fund and to compare these costs with the ongoing costs of investing in other mutual funds.
| The Example is based on an investment of $1,000 invested at the beginning of the period and held for the entire period (November 1, 2022 to April 30, 2023). |
Actual Expenses
The first line of the accompanying table provides information about actual account values and actual expenses. You may use the information in this line, together with the amount you invested, to estimate the expenses that you paid over the period. Simply divide your account value by $1,000.00 (for example, an $8,600 account value divided by $1,000.00 = 8.6), then multiply the result by the number in the first line for a class/Fund under the heading entitled "Expenses Paid During Period" to estimate the expenses you paid on your account during this period. If any fund is a shareholder of any underlying mutual funds or exchange-traded funds (ETFs) (the Underlying Funds), such fund indirectly bears its proportional share of the expenses of the Underlying Funds in addition to the direct expenses incurred presented in the table. These fees and expenses are not included in the annualized expense ratio used to calculate the expense estimate in the table below.
Hypothetical Example for Comparison Purposes
The second line of the accompanying table provides information about hypothetical account values and hypothetical expenses based on the actual expense ratio and an assumed rate of return of 5% per year before expenses, which is not the actual return. The hypothetical account values and expenses may not be used to estimate the actual ending account balance or expenses you paid for the period. You may use this information to compare the ongoing costs of investing in the Fund and other funds. To do so, compare this 5% hypothetical example with the 5% hypothetical examples that appear in the shareholder reports of the other funds. If any fund is a shareholder of any Underlying Funds, such fund indirectly bears its proportional share of the expenses of the Underlying Funds in addition to the direct expenses as presented in the table. These fees and expenses are not included in the annualized expense ratio used to calculate the expense estimate in the table below.
Please note that the expenses shown in the table are meant to highlight your ongoing costs only and do not reflect any transaction costs. Therefore, the second line of the table is useful in comparing ongoing costs only, and will not help you determine the relative total costs of owning different funds. In addition, if these transactional costs were included, your costs would have been higher.
| | | | | Annualized Expense Ratio- A | | Beginning Account Value November 1, 2022 | | Ending Account Value April 30, 2023 | | Expenses Paid During Period- C November 1, 2022 to April 30, 2023 |
| | | | | | | | | | |
| Fidelity® International Discovery K6 Fund | | | | .60% | | | | | | |
| Actual | | | | | | $ 1,000 | | $ 1,169.60 | | $ 3.23 |
Hypothetical- B | | | | | | $ 1,000 | | $ 1,021.82 | | $ 3.01 |
| |
A Annualized expense ratio reflects expenses net of applicable fee waivers.
B 5% return per year before expenses
C Expenses are equal to the annualized expense ratio, multiplied by the average account value over the period, multiplied by 181/ 365 (to reflect the one-half year period). The fees and expenses of any Underlying Funds are not included in each annualized expense ratio.
The Securities and Exchange Commission adopted Rule 22e-4 under the Investment Company Act of 1940 (the Liquidity Rule) to promote effective liquidity risk management throughout the open-end investment company industry, thereby reducing the risk that funds will be unable to meet their redemption obligations and mitigating dilution of the interests of fund shareholders.
The Fund has adopted and implemented a liquidity risk management program (the Program) reasonably designed to assess and manage the Fund's liquidity risk and to comply with the requirements of the Liquidity Rule. The Fund's Board of Trustees (the Board) has designated the Fund's investment adviser as administrator of the Program. The Fidelity advisers have established a Liquidity Risk Management Committee (the LRM Committee) to manage the Program for each of the Fidelity Funds. The LRM Committee monitors the adequacy and effectiveness of implementation of the Program and on a periodic basis assesses each Fund's liquidity risk based on a variety of factors including (1) the Fund's investment strategy, (2) portfolio liquidity and cash flow projections during normal and reasonably foreseeable stressed conditions, (3) shareholder redemptions, (4) borrowings and other funding sources and (5) certain factors specific to ETFs including the effect of the Fund's prices and spreads, market participants, and basket compositions on the overall liquidity of the Fund's portfolio, as applicable.
In accordance with the Program, each of the Fund's portfolio investments is classified into one of four defined liquidity categories based on a determination of a reasonable expectation for how long it would take to convert the investment to cash (or sell or dispose of the investment) without significantly changing its market value.
- Highly liquid investments - cash or convertible to cash within three business days or less
- Moderately liquid investments - convertible to cash in three to seven calendar days
- Less liquid investments - can be sold or disposed of, but not settled, within seven calendar days
- Illiquid investments - cannot be sold or disposed of within seven calendar days
Liquidity classification determinations take into account a variety of factors including various market, trading and investment-specific considerations, as well as market depth, and generally utilize analysis from a third-party liquidity metrics service.
The Liquidity Rule places a 15% limit on a fund's illiquid investments and requires funds that do not primarily hold assets that are highly liquid investments to determine and maintain a minimum percentage of the fund's net assets to be invested in highly liquid investments (highly liquid investment minimum or HLIM). The Program includes provisions reasonably designed to comply with the 15% limit on illiquid investments and for determining, periodically reviewing and complying with the HLIM requirement as applicable.
At a recent meeting of the Fund's Board of Trustees, the LRM Committee provided a written report to the Board pertaining to the operation, adequacy, and effectiveness of the Program for the period December 1, 2021 through November 30, 2022. The report concluded that the Program is operating effectively and is reasonably designed to assess and manage the Fund's liquidity risk.
1.9893916.103
IGI-K6-SANN-0623
Item 2.
Code of Ethics
Not applicable.
Item 3.
Audit Committee Financial Expert
Not applicable.
Item 4.
Principal Accountant Fees and Services
Not applicable.
Item 5.
Audit Committee of Listed Registrants
Not applicable.
Item 6.
Investments
(a)
Not applicable.
(b)
Not applicable
Item 7.
Disclosure of Proxy Voting Policies and Procedures for Closed-End Management Investment Companies
Not applicable.
Item 8.
Portfolio Managers of Closed-End Management Investment Companies
Not applicable.
Item 9.
Purchase of Equity Securities by Closed-End Management Investment Company and Affiliated Purchasers
Not applicable.
Item 10.
Submission of Matters to a Vote of Security Holders
There were no material changes to the procedures by which shareholders may recommend nominees to the Fidelity Investment Trust’s Board of Trustees.
Item 11.
Controls and Procedures
(a)(i) The President and Treasurer and the Chief Financial Officer have concluded that the Fidelity Investment Trust’s (the “Trust”) disclosure controls and procedures (as defined in Rule 30a-3(c) under the Investment Company Act) provide reasonable assurances that material information relating to the Trust is made known to them by the appropriate persons, based on their evaluation of these controls and procedures as of a date within 90 days of the filing date of this report.
(a)(ii) There was no change in the Trust’s internal control over financial reporting (as defined in Rule 30a-3(d) under the Investment Company Act) that occurred during the period covered by this report that has materially affected, or is reasonably likely to materially affect, the Trust’s internal control over financial reporting.
Item 12.
Disclosure of Securities Lending Activities for Closed-End Management
Investment Companies
Not applicable.
Item 13.
Exhibits
SIGNATURES
Pursuant to the requirements of the Securities Exchange Act of 1934 and the Investment Company Act of 1940, the registrant has duly caused this report to be signed on its behalf by the undersigned, thereunto duly authorized.
Fidelity Investment Trust
| |
By: | /s/Stacie M. Smith |
| Stacie M. Smith |
| President and Treasurer |
|
|
Date: | June 22, 2023 |
Pursuant to the requirements of the Securities Exchange Act of 1934 and the Investment Company Act of 1940, this report has been signed below by the following persons on behalf of the registrant and in the capacities and on the dates indicated.
| |
By: | /s/Stacie M. Smith |
| Stacie M. Smith |
| President and Treasurer |
|
|
Date: | June 22, 2023 |
| |
By: | /s/John J. Burke III |
| John J. Burke III |
| Chief Financial Officer |
|
|
Date: | June 22, 2023 |